
UNITED STATES
SECURITIES AND EXCHANGE COMMISSION
Washington, D.C. 20549
FORM N-CSR
CERTIFIED SHAREHOLDER REPORT OF REGISTERED
MANAGEMENT INVESTMENT COMPANIES
Investment Company Act file number: 811-09253
Wells Fargo Funds Trust
(Exact name of registrant as specified in charter)
525 Market St., San Francisco, CA 94105
(Address of principal executive offices) (Zip code)
C. David Messman
Wells Fargo Funds Management, LLC
525 Market St., San Francisco, CA 94105
(Name and address of agent for service)
Registrant’s telephone number, including area code: 800-222-8222
Date of fiscal year end: June 30
Registrant is making a filing for 16 of its series:
Wells Fargo California Limited Tax-Free Fund, Wells Fargo California Tax-Free Fund, Wells Fargo Colorado Tax-Free Fund, Wells Fargo High Yield Municipal Bond Fund, Wells Fargo Intermediate Tax/AMT-Free Fund, Wells Fargo Minnesota Tax-Free Fund, Wells Fargo Municipal Bond Fund, Wells Fargo North Carolina Tax-Free Fund, Wells Fargo Pennsylvania Tax-Free Fund, Wells Fargo Short-Term Municipal Bond Fund, Wells Fargo Small Cap Core Fund, Wells Fargo Strategic Municipal Bond Fund, Wells Fargo Ultra Short-Term Municipal Income Fund, Wells Fargo Wisconsin Tax-Free Fund, Wells Fargo Alternative Strategies Fund, and Wells Fargo Global Long/Short Fund.
Date of reporting period: June 30, 2016
| ITEM 1. | REPORT TO STOCKHOLDERS |
Annual Report
June 30, 2016

Wells Fargo
California Limited-Term Tax-Free Fund


Reduce clutter. Save trees.
Sign up for electronic delivery of prospectuses and shareholder reports at wellsfargo.com/advantagedelivery
Contents
The views expressed and any forward-looking statements are as of June 30, 2016, unless otherwise noted, and are those of the Fund managers and/or Wells Fargo Funds Management, LLC. Discussions of individual securities, or the markets generally, or any Wells Fargo Fund are not intended as individual recommendations. Future events or results may vary significantly from those expressed in any forward-looking statements. The views expressed are subject to change at any time in response to changing circumstances in the market. Wells Fargo Funds Management, LLC and the Fund disclaim any obligation to publicly update or revise any views expressed or forward-looking statements.
NOT FDIC INSURED ¡ NO BANK GUARANTEE ¡ MAY LOSE VALUE
| | | | |
| 2 | | Wells Fargo California Limited-Term Tax-Free Fund | | Letter to shareholders (unaudited) |

Karla M. Rabusch
President
Wells Fargo Funds
In fact, yields on municipal bonds that matured in 10 years or more experienced yield declines of more than 100 basis points (100 basis points equals 1.00%) during the reporting period.
Dear Valued Shareholder:
We are pleased to offer you this annual report for the Wells Fargo California Limited-Term Tax-Free Fund for the 12-month period that ended June 30, 2016. The U.S. Federal Reserve (Fed) began normalizing monetary policy, raising the federal funds rate to between 0.25% and 0.50% in December 2015. Short-term municipal bond yields rose, but yields on longer-term bonds declined. In fact, yields on municipal bonds that matured in 10 years or more experienced yield declines of more than 100 basis points (100 basis points equals 1.00%) during the reporting period. The Barclays Municipal Bond Index1, a broad measure tracking investment-grade municipal bonds, returned 7.65% during the 12-month reporting period.
Monetary policy was accommodative.
The Fed continued an easy monetary policy in order to support the economy and the financial system. However, it raised the federal funds target rate in December because it believed the U.S. economy was strong enough to begin normalizing monetary policy. The European Central Bank cut all three of its short-term rates during the reporting period, increased its asset-purchase program from 60 billion euros per month to 80 billion, expanded the list of eligible securities to include investment-grade nonbank debt, and created a fund-to-lend program where banks could be paid to lend money. In Japan, the Bank of Japan maintained an aggressive monetary program aimed at combating deflation.
Despite accommodative central-bank policies that helped keep interest rates at ultra-low levels, there were periods of volatility. Early in 2016, weakness in certain emerging markets economies and commodities hurt riskier assets and a vote in June 2016 by the U.K. to exit the European Union set off another round of global uncertainty. Municipal bonds benefited because they are perceived as a safe-haven asset. In addition, investor demand for yield helped lower-rated debt outperform. The Barclays High Yield Municipal Bond Index2 returned 12.09% during the 12-month period that ended June 30, 2016.
Strong demand, modest supply, and solid credit fundamentals supported municipals.
Market technicals remained favorable. According to the Investment Company Institute, more than $33 billion was allocated to municipal mutual funds during the first half of 2016, which was more than double the inflows during all of 2015. Further, inflows during the second quarter of 2016 were the largest in nearly seven years. In contrast, less new supply helped make 2015 the fifth calendar year of negative net supply and supply in the first half of 2016 was about 4% less than the same period last year.
Municipal credit quality remained on an uptrend despite a number of high-profile negative credit situations. Idiosyncratic credit risks remain, however. With regard to Puerto Rico, the U.S. enacted legislation that prohibits bondholder lawsuits temporarily and instills a fiscal oversight board for Puerto Rico; Puerto Rico then declared a moratorium on paying its general obligation (GO) bonds and defaulted on $911 million in payments due (most of which were GOs) on July 1, 2016. The
| 1 | The Barclays Municipal Bond Index is an unmanaged index composed of long-term tax-exempt bonds with a minimum credit rating of Baa. You cannot invest directly in an index |
| 2 | The Barclays High Yield Municipal Bond Index measures the non-investment-grade and nonrated U.S. dollar–denominated, fixed-rate, tax-exempt bond market within the 50 United States and four other qualifying regions (Washington, D.C.; Puerto Rico; Guam; and the Virgin Islands). The index allows state and local general obligation, revenue, insured, and prerefunded bonds; however, historically the index has been composed of mostly revenue bonds. You cannot invest directly in an index. |
| | | | | | |
| Letter to shareholders (unaudited) | | Wells Fargo California Limited-Term Tax-Free Fund | | | 3 | |
state of Illinois approved a six-month stopgap budget, a temporary but meaningful step. Under this stopgap budget for the state, the city of Chicago receives authority to raise property taxes for teacher pensions and low-income school districts would receive greater state funding. City of Chicago and school district debt rallied on the news.
Since the end of the financial crisis, structural changes in the fixed-income markets have reduced trading liquidity (the degree to which assets can be bought or sold without affecting the price). New regulations and capital requirements have caused traditional liquidity suppliers (banks and broker/dealers) to be more risk-averse and hold less inventory. Meanwhile, corporate-debt issuance has spiked as companies finance themselves at record-low yields, bond mutual funds hold larger amounts of this new debt supply, trading volumes are lower, and large trades are more difficult to execute. However, fixed-income markets appear to have functioned well over the past year with sufficient liquidity.
Don’t let short-term uncertainty derail long-term investment goals.
Periods of uncertainty can present challenges, but experience has taught us that maintaining long-term investment goals can be an effective way to plan for the future. To help you create a sound strategy based on your personal goals and risk tolerance, Wells Fargo Funds offers more than 100 mutual funds spanning a wide range of asset classes and investment styles. Although diversification cannot guarantee an investment profit or prevent losses, we believe it can be an effective way to manage investment risk and potentially smooth out overall portfolio performance. We encourage investors to know their investments and to understand that appropriate levels of risk-taking may unlock opportunities.
Thank you for choosing to invest in Wells Fargo Funds. We appreciate your confidence in us and remain committed to helping you meet your financial needs.
Sincerely,

Karla M. Rabusch
President
Wells Fargo Funds
Periods of uncertainty can present challenges, but experience has taught us that maintaining long-term investment goals can be an effective way to plan for the future.
For further information about your Fund, contact your investment professional, visit our website at wellsfargofunds.com, or call us directly at 1-800-222-8222. We are available 24 hours a day, 7 days a week.
| | | | |
| 4 | | Wells Fargo California Limited-Term Tax-Free Fund | | Performance highlights (unaudited) |
Investment objective
The Fund seeks current income exempt from federal income tax and California individual income tax, consistent with capital preservation.
Manager
Wells Fargo Funds Management, LLC
Subadviser
Wells Capital Management Incorporated
Portfolio managers
Terry J. Goode
Adrian Van Poppel
Average annual total returns (%) as of June 30, 20161
| | | | | | | | | | | | | | | | | | | | | | | | | | | | | | | | | | |
| | | | | Including sales charge | | | Excluding sales charge | | | Expense ratios2 (%) | |
| | | Inception date | | 1 year | | | 5 year | | | 10 year | | | 1 year | | | 5 year | | | 10 year | | | Gross | | | Net3 | |
| Class A (SFCIX) | | 11-18-1992 | | | 1.48 | | | | 2.46 | | | | 3.05 | | | | 3.54 | | | | 2.87 | | | | 3.26 | | | | 0.83 | | | | 0.80 | |
| Class C (SFCCX) | | 8-30-2002 | | | 1.76 | | | | 2.10 | | | | 2.48 | | | | 2.76 | | | | 2.10 | | | | 2.48 | | | | 1.58 | | | | 1.55 | |
| Administrator Class (SCTIX) | | 9-6-1996 | | | – | | | | – | | | | – | | | | 3.78 | | | | 3.09 | | | | 3.48 | | | | 0.77 | | | | 0.60 | |
| Institutional Class (SFNCX) | | 10-31-2014 | | | – | | | | – | | | | – | | | | 3.79 | | | | 3.10 | | | | 3.49 | | | | 0.50 | | | | 0.50 | |
| Barclays Municipal Bond 1-5 Year Blend Index4 | | – | | | – | | | | – | | | | – | | | | 2.60 | | | | 1.93 | | | | 3.30 | | | | – | | | | – | |
| Barclays California Municipal Bond 1-5 Year Blend Index5 | | – | | | – | | | | – | | | | – | | | | 2.46 | | | | 1.99 | | | | 3.35 | | | | – | | | | – | |
Figures quoted represent past performance, which is no guarantee of future results, and do not reflect taxes that a shareholder may pay on fund distributions or the redemption of fund shares. Investment return and principal value of an investment will fluctuate so that an investor’s shares, when redeemed, may be worth more or less than their original cost. Performance shown without sales charges would be lower if sales charges were reflected. Current performance may be lower or higher than the performance data quoted, which assumes the reinvestment of dividends and capital gains. Current month-end performance is available on the Fund’s website, wellsfargofunds.com.
Index returns do not include transaction costs associated with buying and selling securities, any mutual fund fees or expenses, or any taxes. It is not possible to invest directly in an index.
For Class A shares, the maximum front-end sales charge is 2.00%. For Class C shares, the maximum contingent deferred sales charge is 1.00%. Performance including a contingent deferred sales charge assumes the sales charge for the corresponding time period. Administrator Class and Institutional Class shares are sold without a front-end sales charge or contingent deferred sales charge.
Bond values fluctuate in response to the financial condition of individual issuers, general market and economic conditions, and changes in interest rates. Changes in market conditions and government policies may lead to periods of heightened volatility in the bond market and reduced liquidity for certain bonds held by the Fund. In general, when interest rates rise, bond values fall and investors may lose principal value. Interest-rate changes and their impact on the Fund and its share price can be sudden and unpredictable. The use of derivatives may reduce returns and/or increase volatility. Certain investment strategies tend to increase the total risk of an investment (relative to the broader market). The Fund is exposed to California municipal securities risk and high-yield securities risk. Consult the Fund’s prospectus for additional information on these and other risks. A portion of the Fund’s income may be subject to federal, state, and/or local income taxes or the Alternative Minimum Tax (AMT). Any capital gains distributions may be taxable.
Please see footnotes on page 5.
| | | | | | |
| Performance highlights (unaudited) | | Wells Fargo California Limited-Term Tax-Free Fund | | | 5 | |
|
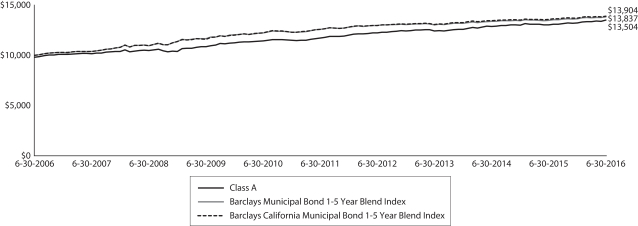
| Growth of $10,000 investment as of June 30, 20166 |
|
 |
| 1 | Historical performance shown for the Institutional Class shares prior to their inception reflects the performance of the Administrator Class shares, and is not adjusted to reflect the Institutional Class expenses. If these expenses had been included, returns for the Institutional Class would be higher. |
| 2 | Reflects the expense ratios as stated in the most recent prospectuses. The expense ratios shown are subject to change and may differ from the annualized expense ratios shown in the financial highlights of this report. |
| 3 | The manager has contractually committed through October 31, 2016, to waive fees and/or reimburse expenses to the extent necessary to cap the Fund’s Total Annual Fund Operating Expenses After Fee Waiver at the amounts shown. After this time, the cap may be increased or the commitment to maintain the cap may be terminated only with the approval of the Board of Trustees. Brokerage commissions, stamp duty fees, interest, taxes, acquired fund fees and expenses, and extraordinary expenses are excluded from the expense cap. Without this cap, the Fund’s returns would have been lower. |
| 4 | The Barclays Municipal Bond 1–5 Year Blend Index is the 1–5 Year Blend component of the Barclays Municipal Bond Index. The Barclays Municipal Bond Index is an unmanaged index composed of long-term tax-exempt bonds with a minimum credit rating of Baa. You cannot invest directly in an index. |
| 5 | The Barclays California Municipal Bond 1-5 Year Blend Index is the 1-5 Year Blend Component of the Barclays California Municipal Bond Index. You cannot invest directly in an index. |
| 6 | The chart compares the performance of Class A shares for the most recent ten years with the Barclays Municipal Bond 1-5 Year Blend Index and the Barclays California Municipal Bond 1-5 Year Blend Index. The chart assumes a hypothetical $10,000 investment in Class A shares and reflects all operating expenses and assumes the maximum initial sales charge of 2.00%. |
| 7 | Amounts are calculated based on the total investments of the Fund. These amounts are subject to change and may have changed since the date specified. |
| 8 | The credit quality distribution of portfolio holdings reflected in the chart is based on ratings from Standard & Poor’s, Moody’s Investors Service, and/ or Fitch Ratings Ltd. Credit quality ratings apply to the underlying holdings of the Fund and not to the Fund itself. The percentages of the Fund’s portfolio with the ratings depicted in the chart are calculated based on the total market value of fixed income securities held by the Fund. If a security was rated by all three rating agencies, the middle rating was utilized. If rated by two of three rating agencies, the lower rating was utilized, and if rated by one of the rating agencies, that rating was utilized. Standard & Poor’s rates the creditworthiness of bonds, ranging from AAA (highest) to D (lowest). Ratings from A to CCC may be modified by the addition of a plus (+) or minus (-) sign to show relative standing within the rating categories. Standard & Poor’s rates the creditworthiness of short-term notes from SP-1 (highest) to SP-3 (lowest). Moody’s rates the creditworthiness of bonds, ranging from Aaa (highest) to C (lowest). Ratings Aa to B may be modified by the addition of a number 1 (highest) to 3 (lowest) to show relative standing within the ratings categories. Moody’s rates the creditworthiness of short-term U.S. tax-exempt municipal securities from MIG 1/VMIG 1 (highest) to SG (lowest). Fitch rates the creditworthiness of bonds, ranging from AAA (highest) to D (lowest). Credit quality distribution is subject to change and may have changed since the date specified. |
| | | | |
| 6 | | Wells Fargo California Limited-Term Tax-Free Fund | | Performance highlights (unaudited) |
MANAGER’S DISCUSSION
Fund highlights
| n | | The Fund outperformed its benchmarks, the Barclays Municipal Bond 1–5 Year Blend Index and the Barclays California Municipal Bond 1–5 Year Blend Index, during the 12-month period that ended June 30, 2016. |
| n | | The main contributors to results were the Fund’s longer duration and its yield-curve positioning because interest rates fell and municipal bonds rallied. |
| n | | The Fund’s sector and credit allocation also helped. It was overweight A-rated and BBB-rated credit categories, which outperformed because medium-quality credits outperformed higher-quality ones. |
| n | | Security selection in the housing and transportation sectors detracted from results because the Fund’s holdings underperformed those in the index. |
|
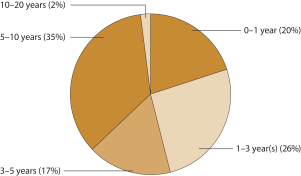
| Effective maturity distribution as of June 30, 20167 |
|
 |
Ultralow yields continued throughout the period.
With the U.S. Federal Reserve (Fed) poised to normalize its interest-rate policy, shorter-term maturities appeared less attractive at the beginning of the reporting period due to a potential backup in short-term yields. However, subdued inflation expectations, due in part to low oil prices, combined with a fragile European economy and softening Chinese economy, implied that longer maturities would outperform. As a result, we positioned the Fund to benefit from a flattening yield curve, which benefited results. The Fund was underweight the front end of the curve in maturities less than 3 years and overweight the 10-year segment. Longer-term maturities
outperformed shorter-term maturities by a wide margin as the municipal curve flattened more than 110 basis points (bps; 100 bps equals 1.00%) between 2- and 10-year maturities. The Fed raised the federal funds target rate in December 2015 but signaled that the pace of further increases would be gradual and data dependent. With the Fed likely on hold for an extended period, we kept the Fund’s duration longer than the index, and this contributed to results.
|
| Credit quality as of June 30, 20168 |
|
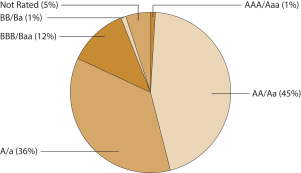 |
We kept the Fund overweight A-rated and BBB-rated bonds, which was beneficial as lower-rated bonds outperformed higher-quality bonds amid strong demand from investors for yield. The Fund’s overweight allocations to the special tax, local general obligation (GO), and appropriation-debt sectors contributed to results. Issue selection detracted from results, however, because the Fund’s holdings in housing and transportation underperformed those in the index.
California benefited from economic growth and strong legal protections for bondholders.
California’s economy continues to improve, becoming the sixth-largest economy in the world in 2015 and
moving ahead of Brazil and France in ranking. The California 2016–2017 state budget was enacted, with $2 billion added to the rainy day fund, leaving the fund just over half its goal of being 10% of revenues. This was the second year in a row that California did not need to issue revenue anticipation notes for cash-flow purposes. California has a strong legal framework for municipal bonds, which we believe may benefit investors by increasing bondholder security. One example of this is legislation that California passed in July 2015 that requires voter-approved local GO bonds to be secured by a statutory lien on all revenues received for the purposes of repaying the principal and interest on the bonds. An important aspect of this legislation is that it clarifies that bondholders are secured by law and can expect to be first in line for repayment should a municipality enter bankruptcy. In addition to improving bondholder protection in the event of a bankruptcy, it contributed to a tightening in credit spreads in the local GO sector.
Please see footnotes on page 5.
| | | | | | |
| Performance highlights (unaudited) | | Wells Fargo California Limited-Term Tax-Free Fund | | | 7 | |
Rates may be lower for longer, making issue selection even more important.
Near the end of the reporting period, the U.K. voted to withdraw from the European Union, prompting considerable uncertainty about future political situations, financial markets, and economic growth. U.S. Treasuries and municipal bonds rallied significantly on the news, and both 10-year and 30-year municipal yields reached record-low levels. We expect volatility in rates but don’t see any catalyst for materially higher rates or a steeper yield curve in the near term. In terms of Fund positioning, we expect to remain long duration relative to the index and to focus purchases on the steeper part of the yield curve to benefit from the roll down, the natural decline in yields as maturities shorten. We also expect to maintain an overweight to the A-rated and BBB-rated credit tiers. Although we think rates may stay lower for longer, we recognize that an improvement in overseas economies, outflows in mutual funds, or a more hawkish tone from the Fed could lead to a spike in rates. In this record-low interest-rate environment, security selection is even more important as breakeven yields (the sell-off that a bond can endure before the total return drops to zero) decrease.
Please see footnotes on page 5.
| | | | |
| 8 | | Wells Fargo California Limited-Term Tax-Free Fund | | Fund expenses (unaudited) |
As a shareholder of the Fund, you incur two types of costs: (1) transaction costs, including sales charges (loads) on purchase payments and contingent deferred sales charges (if any) on redemptions and (2) ongoing costs, including management fees, distribution (12b-1) and/or shareholder servicing fees, and other Fund expenses. This example is intended to help you understand your ongoing costs (in dollars) of investing in the Fund and to compare these costs with the ongoing costs of investing in other mutual funds.
The example is based on an investment of $1,000 invested at the beginning of the six-month period and held for the entire period from January 1, 2016 to June 30, 2016.
Actual expenses
The “Actual” line of the table below provides information about actual account values and actual expenses. You may use the information in this line, together with the amount you invested, to estimate the expenses that you paid over the period. Simply divide your account value by $1,000 (for example, an $8,600 account value divided by $1,000 = 8.6), then multiply the result by the number in the “Actual” line under the heading entitled “Expenses paid during period” for your applicable class of shares to estimate the expenses you paid on your account during this period.
Hypothetical example for comparison purposes
The “Hypothetical” line of the table below provides information about hypothetical account values and hypothetical expenses based on the Fund’s actual expense ratio and an assumed rate of return of 5% per year before expenses, which is not the Fund’s actual return. The hypothetical account values and expenses may not be used to estimate the actual ending account balance or expenses you paid for the period. You may use this information to compare the ongoing costs of investing in the Fund and other funds. To do so, compare this 5% hypothetical example with the 5% hypothetical examples that appear in the shareholder reports of the other funds.
Please note that the expenses shown in the table are meant to highlight your ongoing costs only and do not reflect any transactional costs, such as sales charges (loads) and contingent deferred sales charges. Therefore, the “Hypothetical” line of the table is useful in comparing ongoing costs only and will not help you determine the relative total costs of owning different funds. In addition, if these transactional costs were included, your costs would have been higher.
| | | | | | | | | | | | | | | | |
| | | Beginning
account value
1-1-2016 | | | Ending
account value
6-30-2016 | | | Expenses
paid during
the period¹ | | | Net annualized
expense ratio | |
Class A | | | | | | | | | | | | | | | | |
Actual | | $ | 1,000.00 | | | $ | 1,020.72 | | | $ | 4.02 | | | | 0.80 | % |
Hypothetical (5% return before expenses) | | $ | 1,000.00 | | | $ | 1,020.89 | | | $ | 4.02 | | | | 0.80 | % |
Class C | | | | | | | | | | | | | | | | |
Actual | | $ | 1,000.00 | | | $ | 1,016.92 | | | $ | 7.77 | | | | 1.55 | % |
Hypothetical (5% return before expenses) | | $ | 1,000.00 | | | $ | 1,017.16 | | | $ | 7.77 | | | | 1.55 | % |
Administrator Class | | | | | | | | | | | | | | | | |
Actual | | $ | 1,000.00 | | | $ | 1,021.94 | | | $ | 3.02 | | | | 0.60 | % |
Hypothetical (5% return before expenses) | | $ | 1,000.00 | | | $ | 1,021.88 | | | $ | 3.02 | | | | 0.60 | % |
Institutional Class | | | | | | | | | | | | | | | | |
Actual | | $ | 1,000.00 | | | $ | 1,021.53 | | | $ | 2.50 | | | | 0.50 | % |
Hypothetical (5% return before expenses) | | $ | 1,000.00 | | | $ | 1,022.39 | | | $ | 2.50 | | | | 0.50 | % |
| 1 | Expenses paid is equal to the annualized expense ratio of each class multiplied by the average account value over the period, multiplied by the number of days in the most recent fiscal half-year divided by the number of days in the fiscal year (to reflect the one-half-year period). |
| | | | | | |
| Portfolio of investments—June 30, 2016 | | Wells Fargo California Limited-Term Tax-Free Fund | | | 9 | |
| | | | | | | | | | | | | | | | |
| Security name | | Interest rate | | | Maturity date | | | Principal | | | Value | |
| | | | |
Municipal Obligations: 98.65% | | | | | | | | | | | | | | | | |
| | | | |
| California: 95.65% | | | | | | | | | | | | | | | | |
Acalanes CA Union High School Refunding (GO Revenue) | | | 5.00 | % | | | 8-1-2022 | | | $ | 2,685,000 | | | $ | 3,311,780 | |
Adelanto CA School District CAB Series B (GO Revenue, National Insured) ¤ | | | 0.00 | | | | 9-1-2018 | | | | 1,800,000 | | | | 1,644,678 | |
Alameda CA Corridor Transportation Authority CAB Sub Lien Series A (Transportation Revenue, Ambac Insured) ¤ | | | 0.00 | | | | 10-1-2019 | | | | 3,000,000 | | | | 2,906,487 | |
Alameda CA Corridor Transportation Authority (Airport Revenue) | | | 5.00 | | | | 10-1-2025 | | | | 750,000 | | | | 956,453 | |
Alameda County CA Joint Powers Authority Multiple Capital Projects Series A (Miscellaneous Revenue) | | | 4.00 | | | | 12-1-2019 | | | | 1,000,000 | | | | 1,108,310 | |
Alameda County CA Joint Powers Authority Multiple Capital Projects Series A (Miscellaneous Revenue) | | | 5.00 | | | | 12-1-2021 | | | | 1,000,000 | | | | 1,205,200 | |
Albany CA Limited Obligation Improvement Bond Act of 1915 (Miscellaneous Revenue, Ambac Insured) | | | 4.75 | | | | 9-2-2019 | | | | 1,305,000 | | | | 1,314,735 | |
Alvord CA Unified School District Election of 2007 Series B (GO Revenue, AGM Insured) | | | 6.50 | | | | 8-1-2017 | | | | 155,000 | | | | 162,728 | |
Alvord CA Unified School District Election of 2007 Series B (GO Revenue, AGM Insured) | | | 6.50 | | | | 8-1-2018 | | | | 475,000 | | | | 522,244 | |
Alvord CA Unified School District Election of 2007 Series B (GO Revenue, AGM Insured) | | | 6.50 | | | | 8-1-2020 | | | | 1,605,000 | | | | 1,916,482 | |
Alvord CA Unified School District Election of 2007 Series B (GO Revenue, AGM Insured) ¤ | | | 0.00 | | | | 8-1-2016 | | | | 305,000 | | | | 304,823 | |
Anaheim CA PFA CAB Sub Lien Public Improvements Project Series C (Miscellaneous Revenue, AGM Insured) ¤ | | | 0.00 | | | | 9-1-2018 | | | | 3,245,000 | | | | 3,171,176 | |
Anaheim CA PFA Refunding Bond Series A (Miscellaneous Revenue) | | | 5.00 | | | | 5-1-2017 | | | | 1,250,000 | | | | 1,295,763 | |
Anaheim CA Redevelopment Agency Merged Project Area Series A (Tax Revenue, AGM Insured) | | | 4.50 | | | | 2-1-2018 | | | | 875,000 | | | | 923,965 | |
Association of Bay Area Governments Finance Authority For Nonprofit Corporations Children’s Hospital (Health Revenue) | | | 4.25 | | | | 12-1-2016 | | | | 1,305,000 | | | | 1,325,906 | |
Association of Bay Area Governments Finance Authority For Nonprofit Corporations Episcopal Senior Community (Housing Revenue) | | | 5.00 | | | | 7-1-2016 | | | | 1,045,000 | | | | 1,045,115 | |
Association of Bay Area Governments Finance Authority For Nonprofit Corporations Jackson Laboratory (Miscellaneous Revenue) | | | 5.00 | | | | 7-1-2019 | | | | 730,000 | | | | 815,242 | |
Association of Bay Area Governments Finance Authority For Nonprofit Corporations O’Connor Woods (Health Revenue) | | | 4.00 | | | | 1-1-2019 | | | | 955,000 | | | | 1,031,314 | |
Association of Bay Area Governments Finance Authority For Nonprofit Corporations Sharp Healthcare Series A (Health Revenue) | | | 5.00 | | | | 8-1-2019 | | | | 500,000 | | | | 564,595 | |
Banning CA Unified School District Refunding (GO Revenue, AGM Insured) | | | 5.00 | | | | 8-1-2027 | | | | 510,000 | | | | 656,380 | |
Bassett CA Unified School District Refunding Bond Series B (GO Revenue, Build America Mutual Assurance Company Insured) | | | 5.00 | | | | 8-1-2019 | | | | 420,000 | | | | 474,810 | |
Bassett CA Unified School District Refunding Bond Series B (GO Revenue, Build America Mutual Assurance Company Insured) | | | 5.00 | | | | 8-1-2021 | | | | 550,000 | | | | 657,916 | |
Bassett CA Unified School District Refunding Bond Series B (GO Revenue, Build America Mutual Assurance Company Insured) | | | 5.00 | | | | 8-1-2023 | | | | 725,000 | | | | 907,881 | |
Bay Area Toll Authority California San Francisco Bay Area Toll Bridge Series B (Transportation Revenue) ± | | | 1.50 | | | | 4-1-2047 | | | | 14,000,000 | | | | 14,141,120 | |
Bay Area Toll Authority California San Francisco Bay Area Toll Bridge Series C (Transportation Revenue) ± | | | 1.22 | | | | 4-1-2045 | | | | 5,000,000 | | | | 5,002,400 | |
Bay Area Toll Authority California San Francisco Bay Area Toll Bridge Series C (Transportation Revenue) ± | | | 1.88 | | | | 4-1-2047 | | | | 10,500,000 | | | | 10,741,920 | |
Bay Area Toll Authority California San Francisco Bay Area Toll Bridge Series E (Transportation Revenue) ± | | | 2.00 | | | | 4-1-2034 | | | | 5,000,000 | | | | 5,202,350 | |
The accompanying notes are an integral part of these financial statements.
| | | | |
| 10 | | Wells Fargo California Limited-Term Tax-Free Fund | | Portfolio of investments—June 30, 2016 |
| | | | | | | | | | | | | | | | |
| Security name | | Interest rate | | | Maturity date | | | Principal | | | Value | |
| | | | |
| California (continued) | | | | | | | | | | | | | | | | |
Brentwood CA Infrastructure Financing Authority Sub Series A (Miscellaneous Revenue, AGM Insured) | | | 4.00 | % | | | 9-2-2017 | | | $ | 3,825,000 | | | $ | 3,951,378 | |
Brentwood CA Infrastructure Financing Authority Sub Series B (Miscellaneous Revenue) | | | 3.00 | | | | 9-2-2017 | | | | 995,000 | | | | 1,020,472 | |
Brentwood CA Infrastructure Financing Authority Sub Series B (Miscellaneous Revenue) | | | 3.00 | | | | 9-2-2018 | | | | 1,030,000 | | | | 1,077,905 | |
Brentwood CA Infrastructure Financing Authority Sub Series B (Miscellaneous Revenue) | | | 4.00 | | | | 9-2-2021 | | | | 1,135,000 | | | | 1,291,006 | |
California (GO Revenue) ± | | | 4.00 | | | | 12-1-2027 | | | | 9,015,000 | | | | 9,297,710 | |
California (GO Revenue, Ambac Insured) | | | 5.00 | | | | 10-1-2016 | | | | 10,000 | | | | 10,041 | |
California (GO Revenue) | | | 5.00 | | | | 10-1-2021 | | | | 6,795,000 | | | | 8,180,365 | |
California (GO Revenue) | | | 5.00 | | | | 9-1-2022 | | | | 2,240,000 | | | | 2,756,656 | |
California (GO Revenue) | | | 5.00 | | | | 11-1-2022 | | | | 2,500,000 | | | | 3,090,800 | |
California (GO Revenue) | | | 5.00 | | | | 9-1-2023 | | | | 10,730,000 | | | | 13,520,015 | |
California (GO Revenue) | | | 5.00 | | | | 10-1-2023 | | | | 8,400,000 | | | | 10,605,672 | |
California (GO Revenue) | | | 5.00 | | | | 9-1-2025 | | | | 9,000,000 | | | | 11,700,810 | |
California (GO Revenue) | | | 5.25 | | | | 10-1-2022 | | | | 2,750,000 | | | | 3,433,485 | |
California Community College Financing Authority Shasta-Tehama-Trinity Joint District Series A (Miscellaneous Revenue) | | | 2.25 | | | | 5-1-2017 | | | | 435,000 | | | | 439,672 | |
California Communities Transportation Total Road Improvement Certificate of Participation Series B (Tax Revenue) | | | 3.00 | | | | 6-1-2017 | | | | 380,000 | | | | 386,433 | |
California Communities Transportation Total Road Improvement Certificate of Participation Series B (Tax Revenue) | | | 4.00 | | | | 6-1-2018 | | | | 390,000 | | | | 410,771 | |
California Department of Veterans Affairs Home Purchase Series A (Housing Revenue) | | | 3.50 | | | | 12-1-2021 | | | | 1,795,000 | | | | 1,997,081 | |
California Department of Water Resources Central Valley Project Water System Series AM (Water & Sewer Revenue) | | | 5.00 | | | | 12-1-2017 | | | | 6,595,000 | | | | 7,019,256 | |
California Economic Recovery Refunding Series A (Tax Revenue) | | | 5.00 | | | | 7-1-2018 | | | | 3,800,000 | | | | 4,133,944 | |
California Health Facilities Financing Refunding (Health Revenue) | | | 5.00 | | | | 8-15-2027 | | | | 450,000 | | | | 590,535 | |
California HFA AMT Home Mortgage Series E (Housing Revenue) | | | 5.00 | | | | 2-1-2042 | | | | 15,000 | | | | 15,053 | |
California HFA AMT Home Mortgage Series G (Housing Revenue) | | | 5.50 | | | | 8-1-2042 | | | | 60,000 | | | | 61,500 | |
California HFA Home Mortgage Series A (Housing Revenue, GNMA/FNMA/FHLMC Insured) | | | 3.75 | | | | 8-1-2020 | | | | 745,000 | | | | 813,354 | |
California HFFA Catholic Healthcare West Series A (Health Revenue) | | | 5.00 | | | | 3-1-2019 | | | | 700,000 | | | | 779,268 | |
California HFFA Catholic Healthcare West Series A (Health Revenue) | | | 5.25 | | | | 3-1-2023 | | | | 4,000,000 | | | | 4,763,200 | |
California HFFA Chinese Hospital Associates (Health Revenue) | | | 5.00 | | | | 6-1-2019 | | | | 200,000 | | | | 222,746 | |
California HFFA Fellowship Homes Incorporated (Health Revenue) | | | 5.00 | | | | 9-1-2019 | | | | 1,135,000 | | | | 1,225,289 | |
California HFFA Memorial Health Services Series A (Health Revenue) | | | 5.00 | | | | 10-1-2023 | | | | 2,475,000 | | | | 3,034,870 | |
California HFFA St. Joseph Health System Series B (Health Revenue) ± | | | 5.00 | | | | 7-1-2043 | | | | 2,000,000 | | | | 2,108,880 | |
California Municipal Finance Authority Charter School Albert Einstein Academies Project Series A (Miscellaneous Revenue) | | | 6.00 | | | | 8-1-2023 | | | | 805,000 | | | | 891,425 | |
California Municipal Finance Authority Community Medical Centers Series A (Health Revenue) | | | 5.00 | | | | 2-1-2023 | | | | 735,000 | | | | 886,138 | |
California Municipal Finance Authority Community Medical Centers Series A (Health Revenue) | | | 5.00 | | | | 2-1-2024 | | | | 500,000 | | | | 614,295 | |
California Municipal Finance Authority Mobile Senior Caritas Affordable Housing Incorporated Projects Series A (Housing Revenue) | | | 5.00 | | | | 8-15-2019 | | | | 515,000 | | | | 571,284 | |
California Municipal Finance Authority Northbay Healthcare Series A (Health Revenue) ± | | | 2.49 | | | | 11-1-2027 | | | | 5,000,000 | | | | 5,001,850 | |
California Municipal Finance Authority Palmdale Aerospace Academy Project (Education Revenue) 144A | | | 4.00 | | | | 7-1-2026 | | | | 2,000,000 | | | | 2,144,900 | |
California Municipal Finance Authority Peppertree Senior Apartments Series A (Housing Revenue, FHLMC Insured, FHLMC LIQ) | | | 2.80 | | | | 6-1-2023 | | | | 2,500,000 | | | | 2,678,250 | |
California Municipal Finance Authority Village Grove Apartments Series A (Housing Revenue, FHLMC Insured, FHLMC LIQ) | | | 3.10 | | | | 12-1-2021 | | | | 1,000,000 | | | | 1,084,590 | |
The accompanying notes are an integral part of these financial statements.
| | | | | | |
| Portfolio of investments—June 30, 2016 | | Wells Fargo California Limited-Term Tax-Free Fund | | | 11 | |
| | | | | | | | | | | | | | | | |
| Security name | | Interest rate | | | Maturity date | | | Principal | | | Value | |
| | | | |
| California (continued) | | | | | | | | | | | | | | | | |
California PCFA Republic Services Incorporated Project Series C (Resource Recovery Revenue) ± | | | 5.25 | % | | | 6-1-2023 | | | $ | 3,245,000 | | | $ | 3,433,632 | |
California Public Works Board Capital Project Series G (Miscellaneous Revenue) | | | 5.00 | | | | 11-1-2020 | | | | 3,000,000 | | | | 3,517,680 | |
California Public Works Board Department of Corrections & Rehabilitation Series A (Miscellaneous Revenue) | | | 6.50 | | | | 9-1-2017 | | | | 835,000 | | | | 866,563 | |
California Public Works Board Department of Corrections & Rehabilitation Series C (Miscellaneous Revenue) | | | 4.00 | | | | 6-1-2018 | | | | 1,625,000 | | | | 1,726,465 | |
California Public Works Board Department of Corrections & Rehabilitation Series C (Miscellaneous Revenue) | | | 5.00 | | | | 10-1-2022 | | | | 1,500,000 | | | | 1,841,340 | |
California Public Works Board Judicial Council Projects Series B (Miscellaneous Revenue) | | | 5.00 | | | | 10-1-2022 | | | | 500,000 | | | | 613,780 | |
California Public Works Board Judicial Council Projects Series D (Miscellaneous Revenue) | | | 5.00 | | | | 12-1-2019 | | | | 1,000,000 | | | | 1,139,680 | |
California Public Works Board Refunding Department General Service Series F (Miscellaneous Revenue) | | | 5.00 | | | | 5-1-2023 | | | | 1,595,000 | | | | 1,981,405 | |
California Public Works Board Various Capital Projects Series I (Miscellaneous Revenue) | | | 5.00 | | | | 11-1-2020 | | | | 1,250,000 | | | | 1,465,700 | |
California Refunding Bond (GO Revenue) | | | 5.25 | | | | 9-1-2022 | | | | 4,000,000 | | | | 4,982,040 | |
California School Finance Authority Coastal Academy Project Series A (Education Revenue) | | | 5.00 | | | | 10-1-2022 | | | | 375,000 | | | | 413,629 | |
California School Finance Authority Refunding Aspire Public School (Education Revenue) 144A | | | 5.00 | | | | 8-1-2022 | | | | 1,545,000 | | | | 1,816,101 | |
California School Finance Authority Refunding Aspire Public School (Education Revenue) 144A | | | 5.00 | | | | 8-1-2023 | | | | 800,000 | | | | 955,488 | |
California School Finance Authority Refunding Aspire Public School (Education Revenue) 144A | | | 5.00 | | | | 8-1-2024 | | | | 350,000 | | | | 423,668 | |
California School Finance Authority Rocketship Education Series A (Education Revenue) 144A | | | 5.00 | | | | 6-1-2021 | | | | 400,000 | | | | 440,172 | |
California School Finance Authority Rocketship Education Series A (Education Revenue) 144A | | | 5.00 | | | | 6-1-2026 | | | | 500,000 | | | | 563,965 | |
California State Index Series E (GO Revenue) ± | | | 1.16 | | | | 12-1-2029 | | | | 5,000,000 | | | | 5,002,000 | |
California Statewide CDA Adventist Health Systems West Series A (Health Revenue) | | | 5.00 | | | | 3-1-2024 | | | | 800,000 | | | | 997,976 | |
California Statewide CDA American Baptist Homes West Series B-3 (Health Revenue) | | | 2.10 | | | | 10-1-2019 | | | | 2,930,000 | | | | 2,931,875 | |
California Statewide CDA California Baptist University Series A (Education Revenue) | | | 5.13 | | | | 11-1-2023 | | | | 715,000 | | | | 791,276 | |
California Statewide CDA California Baptist University Series B (Education Revenue) | | | 3.50 | | | | 11-1-2018 | | | | 705,000 | | | | 718,148 | |
California Statewide CDA Episcopal Communities and Services (Health Revenue) | | | 4.00 | | | | 5-15-2017 | | | | 450,000 | | | | 462,200 | |
California Statewide CDA Eskaton Properties Incorporated Obligated Group (Health Revenue) | | | 4.00 | | | | 11-15-2016 | | | | 1,000,000 | | | | 1,010,370 | |
California Statewide CDA Health Facilities Catholic Series F (Health Revenue, AGM Insured) ±(m) | | | 0.52 | | | | 7-1-2040 | | | | 1,000,000 | | | | 1,000,000 | |
California Statewide CDA Henry Mayo Newhall Memorial Hospital Series A (Health Revenue, AGM Insured) | | | 5.00 | | | | 10-1-2021 | | | | 500,000 | | | | 589,725 | |
California Statewide CDA Henry Mayo Newhall Memorial Hospital Series A (Health Revenue, AGM Insured) | | | 5.00 | | | | 10-1-2022 | | | | 395,000 | | | | 474,861 | |
California Statewide CDA Henry Mayo Newhall Memorial Hospital Series A (Health Revenue, AGM Insured) | | | 5.00 | | | | 10-1-2023 | | | | 500,000 | | | | 610,315 | |
California Statewide CDA Kaiser Permanente Series E (Health Revenue) ± | | | 5.00 | | | | 4-1-2044 | | | | 4,000,000 | | | | 4,142,320 | |
California Statewide CDA Redwoods Project (Health Revenue) | | | 3.00 | | | | 11-15-2018 | | | | 400,000 | | | | 421,896 | |
California Statewide CDA Refunding Bond (Miscellaneous Revenue, AGM Insured) | | | 5.00 | | | | 11-15-2019 | | | | 250,000 | | | | 283,908 | |
California Statewide CDA Refunding Bond (Miscellaneous Revenue, AGM Insured) | | | 5.00 | | | | 11-15-2020 | | | | 210,000 | | | | 245,072 | |
California Statewide CDA Refunding Bond (Miscellaneous Revenue, AGM Insured) | | | 5.00 | | | | 11-15-2021 | | | | 200,000 | | | | 238,610 | |
California Statewide CDA Refunding Bond (Miscellaneous Revenue, AGM Insured) | | | 5.00 | | | | 11-15-2022 | | | | 200,000 | | | | 243,542 | |
California Statewide CDA School Facilities (Education Revenue) | | | 5.88 | | | | 7-1-2022 | | | | 1,735,000 | | | | 1,952,257 | |
The accompanying notes are an integral part of these financial statements.
| | | | |
| 12 | | Wells Fargo California Limited-Term Tax-Free Fund | | Portfolio of investments—June 30, 2016 |
| | | | | | | | | | | | | | | | |
| Security name | | Interest rate | | | Maturity date | | | Principal | | | Value | |
| | | | |
| California (continued) | | | | | | | | | | | | | | | | |
California Statewide CDA Senior Living Health Facilities Los Angeles Jewish Home for the Aging Series B (Health Revenue) | | | 3.00 | % | | | 8-1-2021 | | | $ | 5,200,000 | | | $ | 5,234,944 | |
California Statewide CDA Senior Living Health Facilities Los Angeles Jewish Home for the Aging Series D (Health Revenue) | | | 4.75 | | | | 8-1-2020 | | | | 2,000,000 | | | | 2,009,340 | |
California Statewide CDA St. Joseph Hospital (Health Revenue, AGM Insured) | | | 4.50 | | | | 7-1-2018 | | | | 400,000 | | | | 412,896 | |
California Statewide CDA University of California Irvine East Campus Apartments Phase I (Housing Revenue) | | | 5.00 | | | | 5-15-2017 | | | | 1,000,000 | | | | 1,037,280 | |
California Statewide Community Loma Linda University Medical Series A (Health Revenue) 144A | | | 5.00 | | | | 12-1-2025 | | | | 2,465,000 | | | | 3,007,054 | |
California Statewide Community Refunding University California Irvine East (Housing Revenue) | | | 5.00 | | | | 5-15-2025 | | | | 1,000,000 | | | | 1,265,520 | |
California Statewide Community Refunding University California Irvine East (Housing Revenue) | | | 5.00 | | | | 5-15-2026 | | | | 1,000,000 | | | | 1,284,570 | |
California Statewide Community Refunding University California Irvine East (Housing Revenue) | | | 5.00 | | | | 5-15-2027 | | | | 1,000,000 | | | | 1,277,960 | |
California Statewide HFFA Casa Colina Obligated Group (Health Revenue) | | | 4.00 | | | | 4-1-2017 | | | | 400,000 | | | | 406,740 | |
California Statewide HFFA Casa Colina Obligated Group (Health Revenue) | | | 5.00 | | | | 4-1-2018 | | | | 400,000 | | | | 421,836 | |
Campbell CA Union High School Capital Projects and Refinancing (Miscellaneous Revenue) | | | 5.00 | | | | 8-1-2024 | | | | 350,000 | | | | 365,722 | |
Campbell CA Union High School Capital Projects and Refinancing (Miscellaneous Revenue) | | | 5.00 | | | | 8-1-2025 | | | | 350,000 | | | | 365,586 | |
Campbell CA Union High School Capital Projects and Refinancing (Miscellaneous Revenue) | | | 5.00 | | | | 8-1-2026 | | | | 375,000 | | | | 391,699 | |
Campbell CA Union High School Capital Projects and Refinancing (Miscellaneous Revenue) | | | 5.00 | | | | 8-1-2027 | | | | 300,000 | | | | 313,242 | |
Carlsbad CA Improvement Bond Act of 1915 (Miscellaneous Revenue) | | | 3.00 | | | | 9-2-2017 | | | | 415,000 | | | | 425,130 | |
Carlsbad CA Improvement Bond Act of 1915 (Miscellaneous Revenue) | | | 3.00 | | | | 9-2-2018 | | | | 300,000 | | | | 313,290 | |
Carlsbad CA Improvement Bond Act of 1915 (Miscellaneous Revenue) | | | 3.00 | | | | 9-2-2019 | | | | 540,000 | | | | 571,412 | |
Carson CA RDA Project Area #1 Series A (Tax Revenue, AGM Insured) | | | 5.00 | | | | 10-1-2020 | | | | 775,000 | | | | 892,374 | |
Carson CA RDA Project Area #1 Series A (Tax Revenue, AGM Insured) | | | 5.00 | | | | 10-1-2021 | | | | 855,000 | | | | 1,006,771 | |
Carson CA RDA Project Area #1 Series A (Tax Revenue, AGM Insured) | | | 5.00 | | | | 10-1-2022 | | | | 600,000 | | | | 720,612 | |
Cathedral City CA Redevelopment Agency Refunding Merged Redevelopment Project Series A (Tax Revenue) | | | 5.00 | | | | 8-1-2020 | | | | 2,295,000 | | | | 2,645,263 | |
Cathedral City CA Redevelopment Agency Refunding Merged Redevelopment Project Series A (Tax Revenue) | | | 5.00 | | | | 8-1-2021 | | | | 2,425,000 | | | | 2,861,233 | |
Cathedral City CA Redevelopment Agency Refunding Merged Redevelopment Project Series A (Tax Revenue) | | | 5.00 | | | | 8-1-2022 | | | | 2,550,000 | | | | 3,071,526 | |
Cathedral City CA Redevelopment Agency Refunding Merged Redevelopment Project Series A (Tax Revenue) | | | 5.00 | | | | 8-1-2023 | | | | 1,735,000 | | | | 2,127,821 | |
Cathedral City CA Redevelopment Agency Refunding Merged Redevelopment Project Series A (Tax Revenue, AGM Insured) | | | 5.00 | | | | 8-1-2024 | | | | 1,770,000 | | | | 2,221,545 | |
Cathedral City CA Redevelopment Agency Refunding Merged Redevelopment Project Series B (Tax Revenue) | | | 4.00 | | | | 8-1-2017 | | | | 435,000 | | | | 450,099 | |
Central California Unified School District Refunding (GO Revenue, AGM Insured) | | | 4.00 | | | | 7-1-2020 | | | | 500,000 | | | | 563,010 | |
Central California Unified School District Refunding (GO Revenue, AGM Insured) | | | 5.00 | | | | 7-1-2021 | | | | 400,000 | | | | 478,748 | |
Central California Unified School District Refunding (GO Revenue, AGM Insured) | | | 5.00 | | | | 7-1-2022 | | | | 750,000 | | | | 918,735 | |
Centralia CA School District (GO Revenue, AGM Insured) | | | 4.00 | | | | 8-1-2018 | | | | 375,000 | | | | 399,975 | |
Chino CA PFA Local Agency Series A (Tax Revenue, AGM Insured) | | | 5.00 | | | | 9-1-2022 | | | | 1,830,000 | | | | 2,189,339 | |
Chino CA PFA Local Agency Series A (Tax Revenue, AGM Insured) | | | 5.00 | | | | 9-1-2024 | | | | 660,000 | | | | 818,631 | |
Chula Vista CA Certificate of Participation Refunding Bond Police Facility Project (Miscellaneous Revenue) | | | 5.00 | | | | 10-1-2021 | | | | 720,000 | | | | 857,441 | |
Chula Vista CA Elementary School District (Miscellaneous Revenue, AGM Insured) | | | 5.00 | | | | 9-1-2024 | | | | 1,370,000 | | | | 1,730,927 | |
The accompanying notes are an integral part of these financial statements.
| | | | | | |
| Portfolio of investments—June 30, 2016 | | Wells Fargo California Limited-Term Tax-Free Fund | | | 13 | |
| | | | | | | | | | | | | | | | |
| Security name | | Interest rate | | | Maturity date | | | Principal | | | Value | |
| | | | |
| California (continued) | | | | | | | | | | | | | | | | |
Coachella Valley CA Unified School District (GO Revenue, Build America Mutual Assurance Company Insured) | | | 4.00 | % | | | 8-1-2020 | | | $ | 2,455,000 | | | $ | 2,745,206 | |
Coachella Valley CA Unified School District (GO Revenue, Build America Mutual Assurance Company Insured) | | | 4.00 | | | | 8-1-2021 | | | | 2,230,000 | | | | 2,538,119 | |
Coachella Valley CA Unified School District (GO Revenue, Build America Mutual Assurance Company Insured) | | | 4.00 | | | | 8-1-2022 | | | | 1,000,000 | | | | 1,156,600 | |
Colton CA PFA Series A (Utilities Revenue) | | | 4.00 | | | | 4-1-2019 | | | | 415,000 | | | | 450,433 | |
Commerce CA Community Development Commission Refunding Series A (Tax Revenue, AGM Insured) | | | 5.00 | | | | 8-1-2026 | | | | 1,710,000 | | | | 2,204,139 | |
Commerce CA Community Development Commission Refunding Series A (Tax Revenue, AGM Insured) | | | 5.00 | | | | 8-1-2027 | | | | 1,760,000 | | | | 2,236,256 | |
Commerce CA RDA CAB Project #1 (Tax Revenue) ¤ | | | 0.00 | | | | 8-1-2021 | | | | 2,110,000 | | | | 1,655,633 | |
Compton CA Community College District (GO Revenue) | | | 5.00 | | | | 7-1-2017 | | | | 1,225,000 | | | | 1,271,893 | |
Compton CA Unified School District CAB Election of 2002 Series D (GO Revenue, Ambac Insured) ¤ | | | 0.00 | | | | 6-1-2017 | | | | 3,075,000 | | | | 3,040,652 | |
Corcoran CA Unified School District Certificate of Participation (Miscellaneous Revenue, AGM Insured) ± | | | 2.70 | | | | 12-1-2039 | | | | 4,500,000 | | | | 4,532,085 | |
Corona Norco CA Unified School District Junior Lien Series B (Tax Revenue) | | | 2.50 | | | | 9-1-2016 | | | | 445,000 | | | | 446,375 | |
Cotati Rohnert Park CA Unified School District Series B (GO Revenue, AGM Insured) | | | 5.00 | | | | 8-1-2020 | | | | 2,275,000 | | | | 2,639,978 | |
Culver City CA Redevelopment Agency CAB Tax Allocation Series A (Tax Revenue) ¤ | | | 0.00 | | | | 11-1-2019 | | | | 2,575,000 | | | | 2,388,467 | |
Cypress CA Elementary School District (Miscellaneous Revenue) | | | 2.00 | | | | 5-1-2017 | | | | 335,000 | | | | 338,229 | |
Cypress CA Elementary School District (Miscellaneous Revenue) | | | 2.25 | | | | 5-1-2018 | | | | 455,000 | | | | 466,020 | |
Delano CA Certificate of Participation Delano Regional Medical Center (Health Revenue) | | | 4.00 | | | | 1-1-2017 | | | | 1,305,000 | | | | 1,322,604 | |
Delano CA Financing Authority Police Station Project Series A (Miscellaneous Revenue) | | | 4.00 | | | | 12-1-2016 | | | | 1,040,000 | | | | 1,054,144 | |
Desert Sands CA Unified School District Certification of Participation (Miscellaneous Revenue, Build America Mutual Assurance Company Insured) | | | 5.00 | | | | 3-1-2024 | | | | 1,500,000 | | | | 1,867,725 | |
Deutsche Bank SPEARS/LIFERS Trust Series DB-649 (GO Revenue, National Insured, Deutsche Bank LIQ) 144Aø | | | 0.63 | | | | 6-1-2031 | | | | 8,501,000 | | | | 8,501,000 | |
Dinuba CA RDA Successor Agency Merged City Project #2 (Tax Revenue, Build America Mutual Assurance Company Insured) | | | 4.00 | | | | 9-1-2019 | | | | 210,000 | | | | 229,142 | |
Dinuba CA RDA Successor Agency Merged City Project #2 (Tax Revenue, Build America Mutual Assurance Company Insured) | | | 5.00 | | | | 9-1-2021 | | | | 250,000 | | | | 296,595 | |
Dinuba CA RDA Successor Agency Merged City Project #2 (Tax Revenue, Build America Mutual Assurance Company Insured) | | | 5.00 | | | | 9-1-2022 | | | | 250,000 | | | | 302,955 | |
Dixon CA Unified School District (GO Revenue, AGM Insured) | | | 5.00 | | | | 8-1-2021 | | | | 1,210,000 | | | | 1,442,114 | |
Dixon CA Unified School District (GO Revenue, AGM Insured) | | | 5.00 | | | | 8-1-2022 | | | | 1,285,000 | | | | 1,566,197 | |
El Centro CA Financing Authority Series A (Water & Sewer Revenue, AGM Insured) | | | 2.50 | | | | 10-1-2016 | | | | 460,000 | | | | 462,139 | |
El Centro CA Financing Authority Series A (Water & Sewer Revenue, AGM Insured) | | | 2.50 | | | | 10-1-2017 | | | | 475,000 | | | | 485,222 | |
El Centro CA Financing Authority Series A (Water & Sewer Revenue, AGM Insured) | | | 2.50 | | | | 10-1-2018 | | | | 485,000 | | | | 502,761 | |
El Cerrito CA Redevelopment Agency Tax Allocation Series A (Tax Revenue, National Insured) | | | 5.00 | | | | 7-1-2019 | | | | 355,000 | | | | 355,742 | |
El Dorado CA Community Facilities District #19-1 (Tax Revenue) | | | 4.00 | | | | 9-1-2018 | | | | 1,000,000 | | | | 1,063,610 | |
El Dorado CA Community Facilities District #92-1 (Tax Revenue) | | | 4.00 | | | | 9-1-2017 | | | | 1,135,000 | | | | 1,174,021 | |
El Monte CA Union High School Refunding (GO Revenue) | | | 5.00 | | | | 6-1-2021 | | | | 1,315,000 | | | | 1,562,575 | |
Encinitas CA Community Facilities District Ranch Public Improvements Project (Tax Revenue) | | | 4.00 | | | | 9-1-2017 | | | | 1,180,000 | | | | 1,222,020 | |
Fairfield CA RDA Successor Agency Refunding (Tax Revenue) | | | 5.00 | | | | 8-1-2020 | | | | 1,000,000 | | | | 1,160,430 | |
Fairfield CA RDA Successor Agency Refunding (Tax Revenue) | | | 5.00 | | | | 8-1-2021 | | | | 3,170,000 | | | | 3,763,995 | |
Fairfield CA RDA Successor Agency Refunding (Tax Revenue) | | | 5.00 | | | | 8-1-2022 | | | | 2,395,000 | | | | 2,898,788 | |
Fairfield CA RDA Successor Agency Refunding (Tax Revenue) | | | 5.00 | | | | 8-1-2023 | | | | 1,025,000 | | | | 1,264,020 | |
The accompanying notes are an integral part of these financial statements.
| | | | |
| 14 | | Wells Fargo California Limited-Term Tax-Free Fund | | Portfolio of investments—June 30, 2016 |
| | | | | | | | | | | | | | | | |
| Security name | | Interest rate | | | Maturity date | | | Principal | | | Value | |
| | | | |
| California (continued) | | | | | | | | | | | | | | | | |
Florin CA Resource Conservation District Series A (Water & Sewer Revenue, National Insured) | | | 5.00 | % | | | 9-1-2019 | | | $ | 1,000,000 | | | $ | 1,124,680 | |
Florin CA Resource Conservation District Series A (Water & Sewer Revenue, National Insured) | | | 5.00 | | | | 9-1-2020 | | | | 1,000,000 | | | | 1,153,910 | |
Florin CA Resource Conservation District Series A (Water & Sewer Revenue, National Insured) | | | 5.00 | | | | 9-1-2021 | | | | 1,250,000 | | | | 1,476,800 | |
Florin CA Resource Conservation District Series A (Water & Sewer Revenue, National Insured) | | | 5.00 | | | | 9-1-2022 | | | | 1,250,000 | | | | 1,507,663 | |
Foothill-Eastern CA Transportation Corridor Agency Series B1 (Transportation Revenue) ± | | | 5.00 | | | | 1-15-2053 | | | | 8,750,000 | | | | 9,085,038 | |
Fowler CA Unified School District School Facilities Improvement District #1 (GO Revenue, National Insured) | | | 5.20 | | | | 7-1-2020 | | | | 1,420,000 | | | | 1,517,100 | |
Fremont CA Community Facilities District (Tax Revenue) | | | 5.00 | | | | 9-1-2024 | | | | 1,000,000 | | | | 1,216,050 | |
Fresno County CA Financing Authority Lease Series A (Miscellaneous Revenue, AGM Insured) | | | 3.00 | | | | 8-1-2019 | | | | 970,000 | | | | 1,035,941 | |
Fullerton CA Community Facilities District (Tax Revenue) | | | 3.50 | | | | 9-1-2017 | | | | 565,000 | | | | 581,153 | |
Fullerton CA Community Facilities District (Tax Revenue) | | | 4.00 | | | | 9-1-2018 | | | | 610,000 | | | | 647,716 | |
Fullerton CA Community Facilities District (Tax Revenue) | | | 4.00 | | | | 9-1-2019 | | | | 665,000 | | | | 722,576 | |
Fullerton CA School District Financing Authority Series A (Tax Revenue, AGM Insured) | | | 4.00 | | | | 9-1-2018 | | | | 400,000 | | | | 425,444 | |
Fullerton CA School District Financing Authority Series A (Tax Revenue, AGM Insured) | | | 3.00 | | | | 9-1-2017 | | | | 450,000 | | | | 460,557 | |
Garden Grove CA Agency Community Refunding Garden Grove Community Project (Tax Revenue, Build America Mutual Assurance Company Insured) | | | 4.00 | | | | 10-1-2021 | | | | 770,000 | | | | 882,374 | |
Garden Grove CA Agency Community Refunding Garden Grove Community Project (Tax Revenue, Build America Mutual Assurance Company Insured) | | | 5.00 | | | | 10-1-2022 | | | | 3,015,000 | | | | 3,680,260 | |
Goleta CA Water District Certificate of Participation Series A (Water & Sewer Revenue, AGM Insured) | | | 5.00 | | | | 12-1-2019 | | | | 125,000 | | | | 142,931 | |
Goleta CA Water District Certificate of Participation Series A (Water & Sewer Revenue, AGM Insured) | | | 5.00 | | | | 12-1-2020 | | | | 140,000 | | | | 164,741 | |
Hawthorne CA School District CAB Election of 2008 Series A (GO Revenue, AGC Insured) ¤ | | | 0.00 | | | | 8-1-2016 | | | | 155,000 | | | | 154,907 | |
Hawthorne CA School District CAB Election of 2008 Series A (GO Revenue, AGC Insured) ¤ | | | 0.00 | | | | 8-1-2017 | | | | 165,000 | | | | 163,055 | |
Hayward CA Unified School District Certificate of Participation (Miscellaneous Revenue, AGM Insured) | | | 3.00 | | | | 6-1-2017 | | | | 705,000 | | | | 720,031 | |
Hayward CA Unified School District Certificate of Participation (Miscellaneous Revenue, AGM Insured) | | | 3.00 | | | | 6-1-2018 | | | | 725,000 | | | | 755,697 | |
Hayward CA Unified School District Certificate of Participation (Miscellaneous Revenue, AGM Insured) | | | 3.00 | | | | 6-1-2019 | | | | 750,000 | | | | 795,803 | |
Hayward CA Unified School District Certificate of Participation (GO Revenue, AGM Insured) | | | 5.00 | | | | 8-1-2022 | | | | 500,000 | | | | 606,800 | |
Hayward CA Unified School District Certificate of Participation (GO Revenue, AGM Insured) | | | 5.00 | | | | 8-1-2023 | | | | 805,000 | | | | 996,373 | |
Hemet CA Unified School District Certificate of Participation (Miscellaneous Revenue) ± | | | 1.06 | | | | 10-1-2036 | | | | 4,905,000 | | | | 4,904,804 | |
Huntington Beach CA City School District Election of 2002 (GO Revenue) | | | 4.00 | | | | 8-1-2019 | | | | 2,875,000 | | | | 3,164,426 | |
Huntington Beach CA City School District Election of 2002 (GO Revenue) | | | 4.00 | | | | 8-1-2021 | | | | 505,000 | | | | 581,518 | |
Huntington Beach CA City School District Election of 2002 (GO Revenue) | | | 5.00 | | | | 8-1-2020 | | | | 3,150,000 | | | | 3,679,389 | |
Imperial Beach CA RDA Palm Avenue Commercial Redevelopment Project (Tax Revenue, Build America Mutual Assurance Company Insured) | | | 4.00 | | | | 6-1-2020 | | | | 775,000 | | | | 855,530 | |
Imperial CA PFA Wastewater Facility (Water & Sewer Revenue) | | | 4.00 | | | | 10-15-2016 | | | | 265,000 | | | | 267,390 | |
Inglewood CA PFA (Miscellaneous Revenue) | | | 5.00 | | | | 8-1-2016 | | | | 1,000,000 | | | | 1,003,570 | |
Irvine CA Limited Obligation Improvement Bonds Reassessment District #12-1 (Miscellaneous Revenue) | | | 4.00 | | | | 9-2-2018 | | | | 1,325,000 | | | | 1,413,338 | |
The accompanying notes are an integral part of these financial statements.
| | | | | | |
| Portfolio of investments—June 30, 2016 | | Wells Fargo California Limited-Term Tax-Free Fund | | | 15 | |
| | | | | | | | | | | | | | | | |
| Security name | | Interest rate | | | Maturity date | | | Principal | | | Value | |
| | | | |
| California (continued) | | | | | | | | | | | | | | | | |
Irvine CA Limited Obligation Improvement Bonds Reassessment District #15-2 (Miscellaneous Revenue) | | | 5.00 | % | | | 9-2-2023 | | | $ | 800,000 | | | $ | 968,488 | |
Irvine CA Limited Obligation Improvement Bonds Reassessment District #15-2 (Miscellaneous Revenue) | | | 5.00 | | | | 9-2-2024 | | | | 850,000 | | | | 1,040,808 | |
Irwindale CA CDA City Industrial Development Project (Tax Revenue, AGM Insured) | | | 5.00 | | | | 7-15-2020 | | | | 320,000 | | | | 372,170 | |
Irwindale CA CDA City Industrial Development Project (Tax Revenue, AGM Insured) | | | 5.00 | | | | 7-15-2021 | | | | 340,000 | | | | 406,620 | |
Irwindale CA CDA City Industrial Development Project (Tax Revenue, AGM Insured) | | | 5.00 | | | | 7-15-2022 | | | | 365,000 | | | | 446,833 | |
Irwindale CA CDA City Industrial Development Project (Tax Revenue, AGM Insured) | | | 5.00 | | | | 7-15-2023 | | | | 375,000 | | | | 470,573 | |
Jurupa CA PFA Series A (Tax Revenue) | | | 5.00 | | | | 9-1-2020 | | | | 550,000 | | | | 636,350 | |
Keyes CA Unified School District CAB (GO Revenue, National Insured) ¤ | | | 0.00 | | | | 8-1-2016 | | | | 155,000 | | | | 154,881 | |
La Habra CA School District Refunding Bond (GO Revenue) | | | 5.00 | | | | 8-1-2019 | | | | 950,000 | | | | 1,073,975 | |
La Habra CA School District Refunding Bond (GO Revenue) | | | 5.00 | | | | 8-1-2020 | | | | 1,045,000 | | | | 1,219,243 | |
La Habra CA School District Refunding Bond (GO Revenue) | | | 5.00 | | | | 8-1-2021 | | | | 805,000 | | | | 965,525 | |
La Quinta CA Redevelopment Agency Project Areas #1 & 2 Series A (Tax Revenue) | | | 5.00 | | | | 9-1-2019 | | | | 1,150,000 | | | | 1,292,094 | |
La Quinta CA Redevelopment Agency Project Areas #1 & 2 Series A (Tax Revenue) | | | 5.00 | | | | 9-1-2020 | | | | 1,045,000 | | | | 1,202,617 | |
La Quinta CA Redevelopment Agency Project Areas #1 & 2 Series A (Tax Revenue) | | | 5.00 | | | | 9-1-2021 | | | | 565,000 | | | | 675,723 | |
La Quinta CA Redevelopment Agency Project Areas #1 & 2 Series A (Tax Revenue) | | | 5.00 | | | | 9-1-2022 | | | | 615,000 | | | | 749,470 | |
Lake Elsinore CA School Financing Authority (Tax Revenue) | | | 3.00 | | | | 9-1-2016 | | | | 1,420,000 | | | | 1,423,223 | |
Lee Lake CA Public Financing Authority Senior Lien Series A (Tax Revenue) | | | 4.00 | | | | 9-1-2017 | | | | 1,620,000 | | | | 1,675,696 | |
Los Alamitos CA Unified School BAN School Facilities Improvement (GO Revenue) ¤ | | | 0.00 | | | | 9-1-2016 | | | | 1,000,000 | | | | 999,140 | |
Los Angeles CA Convention & Exhibit Center Authority Series A (Miscellaneous Revenue) | | | 5.00 | | | | 8-15-2020 | | | | 2,000,000 | | | | 2,185,640 | |
Los Angeles CA Municipal Improvement Corporation Series A (Miscellaneous Revenue) | | | 5.00 | | | | 3-1-2022 | | | | 3,000,000 | | | | 3,624,240 | |
Los Angeles CA Municipal Improvement Corporation Series A (Miscellaneous Revenue) | | | 5.00 | | | | 5-1-2023 | | | | 475,000 | | | | 589,722 | |
Los Angeles CA Municipal Improvement Corporation Series B (Miscellaneous Revenue) | | | 5.00 | | | | 5-1-2021 | | | | 300,000 | | | | 355,836 | |
Los Angeles CA Municipal Improvement Corporation Series B (Miscellaneous Revenue) | | | 5.00 | | | | 5-1-2022 | | | | 350,000 | | | | 424,603 | |
Los Angeles CA Municipal Improvement Corporation Series B (Miscellaneous Revenue) | | | 5.00 | | | | 5-1-2023 | | | | 350,000 | | | | 434,532 | |
Los Angeles CA Public Works Series D (Miscellaneous Revenue) | | | 5.00 | | | | 12-1-2026 | | | | 1,575,000 | | | | 2,033,246 | |
Los Angeles CA Public Works Series D (Miscellaneous Revenue) | | | 5.00 | | | | 12-1-2027 | | | | 1,605,000 | | | | 2,060,290 | |
Los Angeles CA Unified School District Certificate of Participation Headquarters Building Projects Series B (Miscellaneous Revenue) | | | 5.00 | | | | 10-1-2025 | | | | 1,875,000 | | | | 2,276,794 | |
Los Angeles CA Unified School District Election of 2004 Series F (GO Revenue, FGIC Insured) | | | 5.00 | | | | 7-1-2020 | | | | 2,500,000 | | | | 2,500,300 | |
Los Angeles CA Unified School District Refunding Bond Series A (GO Revenue) | | | 5.00 | | | | 7-1-2026 | | | | 10,430,000 | | | | 13,585,701 | |
Los Angeles CA Unified School District Refunding Bond Series A (GO Revenue) | | | 5.00 | | | | 7-1-2027 | | | | 2,500,000 | | | | 3,238,000 | |
Los Angeles CA Unified School District Refunding Bond Series D (GO Revenue) | | | 5.00 | | | | 7-1-2023 | | | | 6,180,000 | | | | 7,769,434 | |
Los Angeles County CA Capital Asset Leasing Corporation Series B (Miscellaneous Revenue, Ambac Insured) | | | 6.00 | | | | 12-1-2016 | | | | 3,285,000 | | | | 3,359,767 | |
Los Angeles County CA Certificate of Participation CAB Disney Package Project (Miscellaneous Revenue) ¤ | | | 0.00 | | | | 3-1-2017 | | | | 675,000 | | | | 672,017 | |
Los Angeles County CA Community Facilities District #5 Rowland Heights Area (Tax Revenue, AGM Insured) | | | 5.00 | | | | 9-1-2019 | | | | 615,000 | | | | 619,914 | |
Los Angeles County CA Metropolitan Transportation Authority Series A (Tax Revenue) | | | 5.00 | | | | 7-1-2017 | | | | 7,880,000 | | | | 8,236,728 | |
Los Angeles County CA Public Works Financing Authority Master Project Series B (Miscellaneous Revenue, National Insured) | | | 5.00 | | | | 9-1-2018 | | | | 400,000 | | | | 403,024 | |
Los Angeles County CA Public Works Multiple Capital Projects II (Miscellaneous Revenue) | | | 5.00 | | | | 8-1-2020 | | | | 500,000 | | | | 582,840 | |
The accompanying notes are an integral part of these financial statements.
| | | | |
| 16 | | Wells Fargo California Limited-Term Tax-Free Fund | | Portfolio of investments—June 30, 2016 |
| | | | | | | | | | | | | | | | |
| Security name | | Interest rate | | | Maturity date | | | Principal | | | Value | |
| | | | |
| California (continued) | | | | | | | | | | | | | | | | |
Los Angeles County CA Redevelopment Refunding Authority Hollywood Redevelopment Project (Tax Revenue) | | | 5.00 | % | | | 7-1-2019 | | | $ | 1,780,000 | | | $ | 2,001,948 | |
Los Angeles County CA Redevelopment Refunding Authority Series D (Tax Revenue) | | | 5.00 | | | | 9-1-2018 | | | | 2,570,000 | | | | 2,799,116 | |
Los Angeles County CA Redevelopment Refunding Authority Series D (Tax Revenue) | | | 5.00 | | | | 9-1-2019 | | | | 2,545,000 | | | | 2,859,460 | |
Los Angeles County CA Regional MonteCedro Incorporated Project Series B1 (Health Revenue) | | | 3.00 | | | | 11-15-2021 | | | | 2,750,000 | | | | 2,756,655 | |
Los Angeles County CA Schools Regionalized Business Services Corporation Series A (Miscellaneous Revenue, AGM Insured) | | | 3.00 | | | | 9-1-2017 | | | | 595,000 | | | | 608,959 | |
Los Angeles County CA Schools Regionalized Business Services Corporation Series B (Miscellaneous Revenue, National Insured) | | | 5.00 | | | | 6-1-2017 | | | | 1,010,000 | | | | 1,048,016 | |
Lynwood CA Unified School District BAN Series A (GO Revenue) | | | 5.00 | | | | 8-1-2017 | | | | 3,000,000 | | | | 3,141,480 | |
Mendocino County CA Certificate of Participation Series A (Miscellaneous Revenue, AGM Insured) | | | 3.25 | | | | 6-1-2018 | | | | 1,115,000 | | | | 1,168,453 | |
Mendocino County CA Certificate of Participation Series A (Miscellaneous Revenue, AGM Insured) | | | 3.00 | | | | 6-1-2017 | | | | 1,085,000 | | | | 1,108,414 | |
Menifee CA Union School District Public Series A (Tax Revenue) | | | 4.00 | | | | 9-1-2022 | | | | 540,000 | | | | 620,854 | |
Merced CA Union High School CAB Series A (GO Revenue, National Insured) ¤ | | | 0.00 | | | | 8-1-2019 | | | | 2,190,000 | | | | 2,095,348 | |
Modesto CA Community Facilities District #2004-1 Village One #2 (Tax Revenue) | | | 4.00 | | | | 9-1-2018 | | | | 595,000 | | | | 632,848 | |
Modesto CA Community Facilities District #2004-1 Village One #2 (Tax Revenue) | | | 4.50 | | | | 9-1-2019 | | | | 605,000 | | | | 666,758 | |
Modesto CA Irrigation District Electric Refunding Bond Series A (Utilities Revenue) | | | 5.00 | | | | 7-1-2020 | | | | 500,000 | | | | 583,100 | |
Monrovia CA RDA Subordinated Central Project #1 (Tax Revenue) | | | 4.00 | | | | 8-1-2016 | | | | 725,000 | | | | 727,291 | |
Monrovia CA RDA Subordinated Central Project #1 (Tax Revenue) | | | 4.00 | | | | 8-1-2017 | | | | 755,000 | | | | 782,127 | |
Monrovia CA RDA Subordinated Central Project #1 (Tax Revenue) | | | 4.00 | | | | 8-1-2018 | | | | 785,000 | | | | 835,766 | |
Monrovia CA RDA Subordinated Central Project #1 (Tax Revenue) | | | 4.00 | | | | 8-1-2019 | | | | 815,000 | | | | 890,502 | |
Montclair CA PFA Public Facilities Projects (Miscellaneous Revenue, AGM Insured) | | | 4.00 | | | | 10-1-2017 | | | | 500,000 | | | | 519,770 | |
Mountain View Whisman CA Refunding (GO Revenue) | | | 5.00 | | | | 9-1-2019 | | | | 1,000,000 | | | | 1,135,670 | |
Mountain View Whisman CA Refunding (GO Revenue) | | | 5.00 | | | | 9-1-2020 | | | | 1,600,000 | | | | 1,876,432 | |
Murrieta CA PFA (Tax Revenue) | | | 5.00 | | | | 9-1-2017 | | | | 870,000 | | | | 910,586 | |
Murrieta Valley CA Unified School District Refunding (GO Revenue, Build America Mutual Assurance Company Insured) | | | 5.00 | | | | 9-1-2027 | | | | 2,000,000 | | | | 2,605,960 | |
Natomas CA Unified School District (GO Revenue, AGM Insured) | | | 3.00 | | | | 9-1-2017 | | | | 955,000 | | | | 981,816 | |
Natomas CA Unified School District (GO Revenue, AGM Insured) | | | 3.00 | | | | 9-1-2018 | | | | 1,025,000 | | | | 1,076,117 | |
Natomas CA Unified School District (GO Revenue, AGM Insured) | | | 3.00 | | | | 9-1-2019 | | | | 1,000,000 | | | | 1,069,890 | |
Newhall CA School District BAN School Facilities Improvement (GO Revenue) ¤ | | | 0.00 | | | | 8-1-2017 | | | | 9,000,000 | | | | 8,932,770 | |
Newhall CA School District CAB BAN (Miscellaneous Revenue) ¤ | | | 0.00 | | | | 8-1-2018 | | | | 14,680,000 | | | | 14,486,518 | |
North City CA West School Facilities Financing Authority Series C (Tax Revenue, Ambac Insured) | | | 5.00 | | | | 9-1-2018 | | | | 1,125,000 | | | | 1,218,611 | |
Norwalk CA Community Facilities Financing Series A (Miscellaneous Revenue, AGM Insured) | | | 4.00 | | | | 6-1-2019 | | | | 280,000 | | | | 303,447 | |
Norwalk CA Community Facilities Financing Series A (Miscellaneous Revenue, AGM Insured) | | | 4.00 | | | | 6-1-2020 | | | | 350,000 | | | | 386,369 | |
Norwalk CA Community Facilities Financing Series B (Miscellaneous Revenue, AGM Insured) | | | 4.00 | | | | 6-1-2018 | | | | 610,000 | | | | 646,826 | |
Norwalk CA Community Facilities Financing Series B (Miscellaneous Revenue, AGM Insured) | | | 4.00 | | | | 6-1-2019 | | | | 625,000 | | | | 677,338 | |
Norwalk CA Community Facilities Financing Series B (Miscellaneous Revenue, AGM Insured) | | | 4.00 | | | | 6-1-2020 | | | | 650,000 | | | | 717,542 | |
Oak Valley CA Hospital District Refunding (GO Revenue) | | | 4.00 | | | | 7-1-2020 | | | | 500,000 | | | | 554,140 | |
Oak Valley CA Hospital District Refunding (GO Revenue) | | | 5.00 | | | | 7-1-2021 | | | | 950,000 | | | | 1,124,268 | |
Oak Valley CA Hospital District Refunding (GO Revenue) | | | 5.00 | | | | 7-1-2022 | | | | 750,000 | | | | 906,383 | |
Oak Valley CA Hospital District Refunding (GO Revenue) | | | 5.00 | | | | 7-1-2023 | | | | 755,000 | | | | 927,518 | |
The accompanying notes are an integral part of these financial statements.
| | | | | | |
| Portfolio of investments—June 30, 2016 | | Wells Fargo California Limited-Term Tax-Free Fund | | | 17 | |
| | | | | | | | | | | | | | | | |
| Security name | | Interest rate | | | Maturity date | | | Principal | | | Value | |
| | | | |
| California (continued) | | | | | | | | | | | | | | | | |
Oakland CA Joint Powers Financing Authority Series A1 (Miscellaneous Revenue, AGC Insured) | | | 5.25 | % | | | 1-1-2017 | | | $ | 1,885,000 | | | $ | 1,928,751 | |
Oakland CA Redevelopment Agency Refunding Sub Housing Set-Aside Series A (Tax Revenue, Ambac Insured) | | | 5.00 | | | | 9-1-2018 | | | | 2,000,000 | | | | 2,015,120 | |
Oakland CA Successor Agency Refunding Sub Lien Central District Redevelopment Project (Tax Revenue) | | | 4.00 | | | | 9-1-2018 | | | | 3,215,000 | | | | 3,432,656 | |
Oakland CA Unified School District Alameda County Election of 2006 Series A (GO Revenue) | | | 3.00 | | | | 8-1-2016 | | | | 540,000 | | | | 541,021 | |
Oakland CA Unified School District Alameda County Election of 2012 (GO Revenue) | | | 5.00 | | | | 8-1-2016 | | | | 3,425,000 | | | | 3,437,364 | |
Oakland CA Unified School District Alameda County Election of 2012 (GO Revenue) | | | 5.00 | | | | 8-1-2017 | | | | 2,250,000 | | | | 2,346,300 | |
Oakland CA Unified School District Alameda County Election of 2012 Series A (GO Revenue) | | | 5.00 | | | | 8-1-2022 | | | | 750,000 | | | | 888,113 | |
Oakland CA Unified School District Alameda County Election of 2012 Series A (GO Revenue) | | | 5.00 | | | | 8-1-2024 | | | | 600,000 | | | | 736,446 | |
Orange County CA Community Facilities #2015-1 Esencia Village Series A (Tax Revenue) | | | 5.00 | | | | 8-15-2023 | | | | 375,000 | | | | 464,959 | |
Orange County CA Community Facilities #2015-1 Esencia Village Series A (Tax Revenue) | | | 5.00 | | | | 8-15-2025 | | | | 335,000 | | | | 419,092 | |
Orange County CA Development Agency Santa Ana Heights Project (Tax Revenue) | | | 5.00 | | | | 9-1-2018 | | | | 200,000 | | | | 218,420 | |
Orange County CA Development Agency Santa Ana Heights Project (Tax Revenue) | | | 5.00 | | | | 9-1-2019 | | | | 1,085,000 | | | | 1,226,104 | |
Orange County CA Development Agency Santa Ana Heights Project (Tax Revenue) | | | 5.00 | | | | 3-1-2020 | | | | 1,110,000 | | | | 1,267,132 | |
Orange County CA Development Agency Santa Ana Heights Project (Tax Revenue) | | | 5.00 | | | | 9-1-2020 | | | | 1,140,000 | | | | 1,318,980 | |
Orange Cove CA Irrigation District (Water & Sewer Revenue) | | | 3.15 | | | | 2-1-2019 | | | | 660,000 | | | | 661,525 | |
Oxnard CA Financing Authority Refunding Bond (Water & Sewer Revenue, AGM Insured) | | | 5.00 | | | | 6-1-2021 | | | | 735,000 | | | | 865,845 | |
Oxnard CA Harbor District Series A (Airport Revenue) | | | 5.00 | | | | 8-1-2018 | | | | 2,275,000 | | | | 2,447,422 | |
Palm Springs CA Financing Authority Convention Center Project Series A (Miscellaneous Revenue) | | | 3.00 | | | | 11-1-2017 | | | | 1,280,000 | | | | 1,315,891 | |
Palo Alto CA Improvement Bond Act of 1915 University Area Off-Street Parking Assessment District (Miscellaneous Revenue) | | | 2.50 | | | | 9-2-2016 | | | | 330,000 | | | | 330,878 | |
Palo Alto CA Improvement Bond Act of 1915 University Area Off-Street Parking Assessment District (Miscellaneous Revenue) | | | 3.00 | | | | 9-2-2018 | | | | 415,000 | | | | 430,749 | |
Palo Alto CA Improvement Bond Act of 1915 University Area Off-Street Parking Assessment District (Miscellaneous Revenue) | | | 4.00 | | | | 9-2-2021 | | | | 450,000 | | | | 501,170 | |
Palo Verde CA Unified School District FlexFund Program (Education Revenue) | | | 4.80 | | | | 9-1-2027 | | | | 736,393 | | | | 784,531 | |
Palomar CA Palomar County CAB Election of 2006 Series B (GO Revenue) ¤ | | | 0.00 | | | | 8-1-2016 | | | | 250,000 | | | | 249,890 | |
Palomar CA Palomar County CAB Election of 2006 Series B (GO Revenue) ¤ | | | 0.00 | | | | 8-1-2017 | | | | 880,000 | | | | 872,854 | |
Palomar Pomerado CA Health System CAB (GO Revenue, National Insured) ¤ | | | 0.00 | | | | 8-1-2017 | | | | 2,000,000 | | | | 1,977,920 | |
Palos Verdes Peninsula CA Refunding Series B (GO Revenue) %% | | | 5.00 | | | | 11-1-2023 | | | | 740,000 | | | | 932,718 | |
Perris CA Community Facilities District Refunding #01-2 Series A (Tax Revenue) | | | 2.00 | | | | 9-1-2016 | | | | 635,000 | | | | 636,410 | |
Perris CA Community Facilities District Refunding #01-2 Series A (Tax Revenue) | | | 2.00 | | | | 9-1-2017 | | | | 670,000 | | | | 675,199 | |
Pioneers Memorial Healthcare District California Refunding (GO Revenue) | | | 4.00 | | | | 10-1-2017 | | | | 810,000 | | | | 837,232 | |
Pittsburg CA Successor Agency Los Medanos Community Development (Tax Revenue, AGM Insured) | | | 5.00 | | | | 8-1-2021 | | | | 1,885,000 | | | | 2,234,121 | |
Pittsburg CA Successor Agency Los Medanos Community Development (Tax Revenue, AGM Insured) | | | 5.00 | | | | 9-1-2021 | | | | 2,000,000 | | | | 2,369,460 | |
Pittsburg CA Successor Agency Los Medanos Community Development (Tax Revenue, AGM Insured) | | | 5.00 | | | | 8-1-2022 | | | | 1,305,000 | | | | 1,579,507 | |
Pittsburg CA Successor Agency Los Medanos Community Development (Tax Revenue, AGM Insured) | | | 5.00 | | | | 8-1-2023 | | | | 780,000 | | | | 963,066 | |
Pittsburg CA Successor Agency Los Medanos Community Development (Tax Revenue, AGM Insured) | | | 5.00 | | | | 9-1-2025 | | | | 3,500,000 | | | | 4,413,465 | |
The accompanying notes are an integral part of these financial statements.
| | | | |
| 18 | | Wells Fargo California Limited-Term Tax-Free Fund | | Portfolio of investments—June 30, 2016 |
| | | | | | | | | | | | | | | | |
| Security name | | Interest rate | | | Maturity date | | | Principal | | | Value | |
| | | | |
| California (continued) | | | | | | | | | | | | | | | | |
Placentia CA Redevelopment Agency Project (Tax Revenue, Build America Mutual Assurance Company Insured) | | | 4.00 | % | | | 8-1-2019 | | | $ | 580,000 | | | $ | 631,753 | |
Placentia CA Redevelopment Agency Project (Tax Revenue, Build America Mutual Assurance Company Insured) | | | 5.00 | | | | 8-1-2020 | | | | 600,000 | | | | 688,014 | |
Placentia Yorba Linda CA Refunding Project Series A (Miscellaneous Revenue, AGM Insured) | | | 5.00 | | | | 10-1-2024 | | | | 1,000,000 | | | | 1,264,720 | |
Placentia Yorba Linda CA Refunding Project Series A (Miscellaneous Revenue, AGM Insured) | | | 5.00 | | | | 10-1-2026 | | | | 400,000 | | | | 506,204 | |
Pomona CA Public Financing Authority Unrefunded Balance Merfed Redevelopment – Series AH (Tax Revenue, Ambac Insured) | | | 5.25 | | | | 2-1-2018 | | | | 725,000 | | | | 727,973 | |
Pomona Valley CA Educational Joint Powers Authority Refunding Bond (Miscellaneous Revenue, Build America Mutual Assurance Company Insured) | | | 4.00 | | | | 8-1-2016 | | | | 805,000 | | | | 807,399 | |
Pomona Valley CA Educational Joint Powers Authority Refunding Bond (Miscellaneous Revenue, Build America Mutual Assurance Company Insured) | | | 4.00 | | | | 8-1-2017 | | | | 1,635,000 | | | | 1,693,517 | |
Poway CA Unified School District PFA (Tax Revenue) | | | 3.00 | | | | 9-15-2017 | | | | 625,000 | | | | 639,694 | |
Poway CA Unified School District PFA (Tax Revenue) | | | 3.00 | | | | 9-15-2018 | | | | 755,000 | | | | 786,023 | |
Poway CA Unified School District PFA (Tax Revenue) | | | 4.00 | | | | 9-15-2020 | | | | 335,000 | | | | 370,483 | |
Poway CA Unified School District PFA (Tax Revenue, Build America Mutual Assurance Company Insured) | | | 4.00 | | | | 10-1-2020 | | | | 300,000 | | | | 333,597 | |
Poway CA Unified School District PFA (Tax Revenue, Build America Mutual Assurance Company Insured) | | | 4.00 | | | | 10-1-2021 | | | | 185,000 | | | | 208,523 | |
Poway CA Unified School District PFA Series B (Tax Revenue, Build America Mutual Assurance Company Insured) | | | 5.00 | | | | 9-1-2024 | | | | 1,115,000 | | | | 1,374,104 | |
Poway CA Unified School District PFA Series B (Tax Revenue, Build America Mutual Assurance Company Insured) | | | 5.00 | | | | 9-1-2025 | | | | 775,000 | | | | 970,595 | |
Poway CA Unified School District Special Community Facilities District #6-4S Ranch (Tax Revenue) | | | 4.00 | | | | 9-1-2017 | | | | 495,000 | | | | 512,018 | |
Poway CA Unified School District Special Community Facilities District #6-4S Ranch (Tax Revenue) | | | 4.00 | | | | 9-1-2018 | | | | 445,000 | | | | 472,514 | |
Rancho Santa Fe CA Community Services District Superior Lien Series A (Tax Revenue) | | | 3.50 | | | | 9-1-2016 | | | | 725,000 | | | | 728,292 | |
Redondo Beach CA Unified School District CAB Election of 2008 Series E (GO Revenue) ¤ | | | 0.00 | | | | 8-1-2016 | | | | 225,000 | | | | 224,876 | |
Redondo Beach CA Unified School District CAB Election of 2008 Series E (GO Revenue) ¤ | | | 0.00 | | | | 8-1-2018 | | | | 345,000 | | | | 336,182 | |
Redondo Beach CA Unified School District CAB Election of 2008 Series E (GO Revenue) ¤ | | | 0.00 | | | | 8-1-2020 | | | | 460,000 | | | | 432,179 | |
Riverside CA Community College District Election of 2004 Series D (GO Revenue) ¤ | | | 0.00 | | | | 8-1-2020 | | | | 535,000 | | | | 506,688 | |
Riverside CA PFA Local Measure Certificate of Participation Riverside Pavement Rehabilitation Project (Tax Revenue, AGM Insured) | | | 5.00 | | | | 6-1-2023 | | | | 845,000 | | | | 1,020,583 | |
Riverside CA Unified School District Financing Authority Superior Lien Series A (Miscellaneous Revenue) | | | 4.00 | | | | 9-1-2018 | | | | 1,735,000 | | | | 1,842,275 | |
Riverside County CA Asset Leasing Corporation County Administrative Center Refunding Project (Miscellaneous Revenue) | | | 4.00 | | | | 11-1-2016 | | | | 640,000 | | | | 647,379 | |
Riverside County CA Asset Leasing Corporation County Administrative Center Refunding Project (Miscellaneous Revenue) | | | 4.00 | | | | 11-1-2017 | | | | 490,000 | | | | 511,418 | |
Riverside County CA Asset Leasing Corporation Riverside Hospital Project (Miscellaneous Revenue, National Insured) ¤ | | | 0.00 | | | | 6-1-2019 | | | | 1,000,000 | | | | 960,270 | |
Riverside County CA PFA Indian Wells Project Series A (Tax Revenue, AGM Insured) | | | 5.00 | | | | 9-1-2020 | | | | 1,610,000 | | | | 1,871,818 | |
Riverside County CA Public Financing County Facilities Projects (Miscellaneous Revenue) | | | 4.00 | | | | 5-1-2018 | | | | 810,000 | | | | 855,368 | |
Riverside County CA Public Financing County Facilities Projects (Miscellaneous Revenue) | | | 4.00 | | | | 5-1-2020 | | | | 795,000 | | | | 876,424 | |
Riverside County CA Public Financing County Facilities Projects (Miscellaneous Revenue) | | | 5.00 | | | | 5-1-2019 | | | | 840,000 | | | | 933,878 | |
Robla CA School District Series B (GO Revenue, National Insured) ¤ | | | 0.00 | | | | 8-1-2018 | | | | 320,000 | | | | 312,922 | |
The accompanying notes are an integral part of these financial statements.
| | | | | | |
| Portfolio of investments—June 30, 2016 | | Wells Fargo California Limited-Term Tax-Free Fund | | | 19 | |
| | | | | | | | | | | | | | | | |
| Security name | | Interest rate | | | Maturity date | | | Principal | | | Value | |
| | | | |
| California (continued) | | | | | | | | | | | | | | | | |
Romoland CA School District Community Facilities District #2004-1 (Tax Revenue) | | | 4.00 | % | | | 9-1-2019 | | | $ | 850,000 | | | $ | 926,466 | |
Roseville CA Special Tax Refunding Community Facilities District (Tax Revenue) | | | 4.00 | | | | 9-1-2019 | | | | 875,000 | | | | 956,585 | |
Roseville CA Special Tax Refunding Community Facilities District (Tax Revenue) | | | 5.00 | | | | 9-1-2020 | | | | 1,050,000 | | | | 1,220,762 | |
Roseville CA Special Tax Refunding Community Facilities District (Tax Revenue) | | | 5.00 | | | | 9-1-2021 | | | | 500,000 | | | | 597,810 | |
Sacramento CA City Financing Refunding Master Lease Program Facilities (Miscellaneous Revenue, Build America Mutual Assurance Company Insured) | | | 5.00 | | | | 12-1-2022 | | | | 800,000 | | | | 983,336 | |
Sacramento CA City Schools Joint Powers Financing Authority Series A (Miscellaneous Revenue, Build America Mutual Assurance Company Insured) | | | 5.00 | | | | 3-1-2019 | | | | 1,050,000 | | | | 1,164,272 | |
Sacramento CA City Schools Joint Powers Financing Authority Series A (Miscellaneous Revenue, Build America Mutual Assurance Company Insured) | | | 5.00 | | | | 3-1-2020 | | | | 1,185,000 | | | | 1,355,048 | |
Sacramento CA City Schools Joint Powers Financing Authority Series A (Miscellaneous Revenue, Build America Mutual Assurance Company Insured) | | | 5.00 | | | | 3-1-2021 | | | | 830,000 | | | | 974,188 | |
Sacramento CA City Schools Joint Powers Financing Authority Series A (Miscellaneous Revenue, Build America Mutual Assurance Company Insured) | | | 5.00 | | | | 3-1-2022 | | | | 775,000 | | | | 930,535 | |
Sacramento CA City Schools Joint Powers Financing Authority Series A (Miscellaneous Revenue, Build America Mutual Assurance Company Insured) | | | 5.00 | | | | 3-1-2023 | | | | 815,000 | | | | 1,000,429 | |
Sacramento CA District Refunding Series D (Utilities Revenue) %% | | | 5.00 | | | | 8-15-2027 | | | | 3,250,000 | | | | 4,329,033 | |
Sacramento CA Regional Transportation District Farebox (Transportation Revenue) | | | 5.00 | | | | 3-1-2019 | | | | 500,000 | | | | 552,080 | |
Salinas CA Union High School District CAB (GO Revenue) ¤ | | | 0.00 | | | | 8-1-2020 | | | | 5,000,000 | | | | 4,688,900 | |
San Bernardino County CA Certificate of Participation Arrowhead Project Series A (Miscellaneous Revenue) | | | 5.50 | | | | 8-1-2020 | | | | 1,000,000 | | | | 1,143,420 | |
San Bernardino County CA Certificate of Participation Justice Center Airport Improvements (Miscellaneous Revenue, National Insured) | | | 5.00 | | | | 7-1-2016 | | | | 430,000 | | | | 430,047 | |
San Bernardino County CA Certificate of Participation Medical Centre Financing Project (Miscellaneous Revenue, National Insured) | | | 5.50 | | | | 8-1-2017 | | | | 590,000 | | | | 603,240 | |
San Buenaventura CA Community Mental Health System (Health Revenue) | | | 6.00 | | | | 12-1-2019 | | | | 2,000,000 | | | | 2,260,020 | |
San Buenaventura CA Community Mental Health System (Health Revenue) | | | 6.50 | | | | 12-1-2021 | | | | 2,585,000 | | | | 3,143,489 | |
San Diego CA Community Facilities District #3 (Tax Revenue) | | | 5.00 | | | | 9-1-2016 | | | | 415,000 | | | | 418,357 | |
San Diego CA Public Facilities Financing Authority Refunding Ballpark (Miscellaneous Revenue) | | | 5.00 | | | | 10-15-2026 | | | | 1,500,000 | | | | 1,931,370 | |
San Diego CA Public Facilities Financing Authority Refunding Ballpark (Miscellaneous Revenue) | | | 5.00 | | | | 10-15-2027 | | | | 500,000 | | | | 638,420 | |
San Diego CA RDA CAB Tax Allocation Center Series A (Tax Revenue, AGM Insured) ¤ | | | 0.00 | | | | 9-1-2018 | | | | 635,000 | | | | 616,509 | |
San Diego CA RDA Naval Training Center Series A (Tax Revenue) | | | 4.00 | | | | 9-1-2016 | | | | 380,000 | | | | 382,094 | |
San Diego CA RDA Naval Training Center Series A (Tax Revenue) | | | 4.50 | | | | 9-1-2017 | | | | 345,000 | | | | 359,097 | |
San Diego CA Redevelopment Agency Refunding Series A (Tax Revenue) | | | 5.00 | | | | 9-1-2025 | | | | 2,750,000 | | | | 3,584,378 | |
San Diego CA Redevelopment Agency Refunding Series A (Tax Revenue) | | | 5.00 | | | | 9-1-2026 | | | | 1,500,000 | | | | 1,936,260 | |
San Francisco CA City & County RDA Successor Agency Community Facilities District #6 Series A (Tax Revenue) | | | 3.00 | | | | 8-1-2016 | | | | 400,000 | | | | 401,012 | |
San Francisco CA City & County RDA Successor Agency Community Facilities District #6 Series A (Tax Revenue) | | | 3.00 | | | | 8-1-2017 | | | | 205,000 | | | | 209,895 | |
San Francisco CA City & County RDA Successor Agency Community Facilities District #6 Series A (Tax Revenue) | | | 4.00 | | | | 8-1-2017 | | | | 885,000 | | | | 915,957 | |
San Francisco CA City & County RDA Successor Agency Community Facilities District #6 Series A (Tax Revenue) | | | 5.00 | | | | 8-1-2018 | | | | 500,000 | | | | 544,610 | |
San Francisco CA City & County RDA Successor Agency Community Facilities District #6 Series A (Tax Revenue) | | | 5.00 | | | | 8-1-2019 | | | | 555,000 | | | | 624,436 | |
San Francisco CA City & County RDFA Mission Bay North Redevelopment Series C (Tax Revenue) | | | 4.50 | | | | 8-1-2016 | | | | 310,000 | | | | 311,076 | |
San Francisco CA City & County RDFA Mission Bay South Redevelopment Series A (Tax Revenue) | | | 5.00 | | | | 8-1-2020 | | | | 500,000 | | | | 579,705 | |
San Francisco CA City & County RDFA Mission Bay South Redevelopment Series A (Tax Revenue) | | | 5.00 | | | | 8-1-2022 | | | | 375,000 | | | | 455,588 | |
The accompanying notes are an integral part of these financial statements.
| | | | |
| 20 | | Wells Fargo California Limited-Term Tax-Free Fund | | Portfolio of investments—June 30, 2016 |
| | | | | | | | | | | | | | | | |
| Security name | | Interest rate | | | Maturity date | | | Principal | | | Value | |
| | | | |
| California (continued) | | | | | | | | | | | | | | | | |
San Francisco CA City & County RDFA San Francisco Redevelopment Project Series B (Tax Revenue, National Insured) | | | 5.25 | % | | | 8-1-2018 | | | $ | 1,155,000 | | | $ | 1,164,667 | |
San Gorgonio CA Memorial Healthcare Refunding (GO Revenue) | | | 5.00 | | | | 8-1-2021 | | | | 275,000 | | | | 325,562 | |
San Gorgonio CA Memorial Healthcare Refunding (GO Revenue) | | | 5.00 | | | | 8-1-2022 | | | | 500,000 | | | | 604,120 | |
San Gorgonio CA Memorial Healthcare Refunding (GO Revenue) | | | 5.00 | | | | 8-1-2023 | | | | 1,000,000 | | | | 1,230,480 | |
San Joaquin Hills County CA Transportation Corridor Agency Series A (Transportation Revenue) | | | 5.00 | | | | 1-15-2017 | | | | 1,500,000 | | | | 1,535,385 | |
San Jose CA Airport Series A (Airport Revenue, Ambac Insured) | | | 5.50 | | | | 3-1-2018 | | | | 4,350,000 | | | | 4,672,727 | |
San Jose CA Airport Series A (Airport Revenue, AGM/Ambac Insured) | | | 5.50 | | | | 3-1-2019 | | | | 5,220,000 | | | | 5,390,851 | |
San Jose CA Convention Center Expansion & Renovation Project (Tax Revenue) | | | 5.25 | | | | 5-1-2023 | | | | 1,465,000 | | | | 1,725,843 | |
San Jose CA Libraries & Parks Project (GO Revenue) | | | 5.00 | | | | 9-1-2017 | | | | 715,000 | | | | 717,881 | |
San Jose CA Redevelopment Agency Tax Refunding Merged Area Redevelopment Project Series A (Tax Revenue, National Insured) | | | 4.36 | | | | 8-1-2016 | | | | 400,000 | | | | 401,376 | |
San Jose CA Redevelopment Agency Tax Refunding Merged Area Redevelopment Project Series A (Tax Revenue, National Insured) | | | 4.54 | | | | 8-1-2018 | | | | 1,035,000 | | | | 1,038,571 | |
San Jose CA Redevelopment Agency Tax Refunding Merged Area Redevelopment Project Series A (Tax Revenue, National Insured) | | | 5.00 | | | | 8-1-2017 | | | | 2,000,000 | | | | 2,007,840 | |
San Jose CA Redevelopment Agency Tax Refunding Merged Area Redevelopment Project Series A (Tax Revenue, National Insured) | | | 5.25 | | | | 8-1-2019 | | | | 1,125,000 | | | | 1,129,613 | |
San Jose CA Redevelopment Agency Tax Refunding Merged Area Redevelopment Project Series A-1 (Tax Revenue) | | | 5.00 | | | | 8-1-2022 | | | | 800,000 | | | | 913,920 | |
San Jose CA Redevelopment Agency Tax Refunding Merged Area Redevelopment Project Series D (Tax Revenue, Ambac Insured) | | | 5.00 | | | | 8-1-2021 | | | | 2,635,000 | | | | 2,749,254 | |
San Jose CA Union Elementary School District Series B (GO Revenue) | | | 3.00 | | | | 9-1-2017 | | | | 1,000,000 | | | | 1,028,480 | |
San Luis & Delta-Mendota CA Water Authority Delta Habitat Conservation & Conveyance Program Development Project Series A (Water & Sewer Revenue, Build America Mutual Assurance Company Insured) | | | 5.00 | | | | 3-1-2019 | | | | 100,000 | | | | 110,305 | |
San Luis & Delta-Mendota CA Water Authority Delta Habitat Conservation & Conveyance Program Development Project Series A (Water & Sewer Revenue, Build America Mutual Assurance Company Insured) | | | 5.00 | | | | 3-1-2020 | | | | 100,000 | | | | 113,511 | |
San Marcos CA PFA Series B (Tax Revenue) | | | 3.00 | | | | 9-1-2016 | | | | 445,000 | | | | 446,700 | |
San Marcos CA PFA Series B (Tax Revenue) | | | 3.00 | | | | 9-1-2017 | | | | 455,000 | | | | 465,674 | |
San Marcos CA PFA Series B (Tax Revenue) | | | 4.00 | | | | 9-1-2018 | | | | 1,000,000 | | | | 1,061,830 | |
San Marcos CA Unified School District Community Facilities District #5 (Tax Revenue, Build America Mutual Assurance Company Insured) | | | 5.00 | | | | 9-1-2020 | | | | 220,000 | | | | 255,908 | |
San Marcos CA Unified School District Community Facilities District #5 (Tax Revenue, Build America Mutual Assurance Company Insured) | | | 5.00 | | | | 9-1-2021 | | | | 270,000 | | | | 321,716 | |
San Marcos CA Unified School District Community Facilities District #5 (Tax Revenue, Build America Mutual Assurance Company Insured) | | | 5.00 | | | | 9-1-2022 | | | | 250,000 | | | | 304,608 | |
San Mateo County CA Transportation Authority Series A (Tax Revenue, National Insured) ¤ | | | 0.00 | | | | 12-1-2018 | | | | 270,000 | | | | 261,185 | |
San Mateo Foster City CA School District (GO Revenue) | | | 5.00 | | | | 8-15-2020 | | | | 2,000,000 | | | | 2,341,520 | |
San Pablo CA Redevelopment Agency Series B (Tax Revenue, AGM Insured) | | | 5.00 | | | | 6-15-2021 | | | | 1,775,000 | | | | 2,104,014 | |
San Pablo CA Redevelopment Agency Series B (Tax Revenue, AGM Insured) | | | 5.00 | | | | 6-15-2022 | | | | 1,865,000 | | | | 2,261,797 | |
San Pablo CA Redevelopment Agency Series B (Tax Revenue, AGM Insured) | | | 5.00 | | | | 6-15-2023 | | | | 1,945,000 | | | | 2,406,782 | |
Santa Ana CA Community Redevelopment Agency Merged Project Area Series A (Tax Revenue) | | | 5.25 | | | | 9-1-2019 | | | | 1,000,000 | | | | 1,130,000 | |
Santa Ana CA Unified School District CAB Election of 2008 Series A (GO Revenue) ¤ | | | 0.00 | | | | 8-1-2020 | | | | 1,815,000 | | | | 1,709,095 | |
Santa Clara County CA Financing Authority Capital Projects Series A (Miscellaneous Revenue) | | | 4.00 | | | | 2-1-2024 | | | | 6,000,000 | | | | 6,857,880 | |
Santa Cruz County CA Capital Financing Public Facilities Project (Miscellaneous Revenue, AGM Insured) | | | 4.00 | | | | 8-1-2020 | | | | 150,000 | | | | 167,115 | |
The accompanying notes are an integral part of these financial statements.
| | | | | | |
| Portfolio of investments—June 30, 2016 | | Wells Fargo California Limited-Term Tax-Free Fund | | | 21 | |
| | | | | | | | | | | | | | | | |
| Security name | | Interest rate | | | Maturity date | | | Principal | | | Value | |
| | | | |
| California (continued) | | | | | | | | | | | | | | | | |
Santa Cruz County CA Capital Financing Public Facilities Project (Miscellaneous Revenue, AGM Insured) | | | 5.00 | % | | | 8-1-2021 | | | $ | 125,000 | | | $ | 148,151 | |
Santa Cruz County CA Capital Financing Public Facilities Project (Miscellaneous Revenue, AGM Insured) | | | 5.00 | | | | 8-1-2022 | | | | 165,000 | | | | 199,708 | |
Santa Cruz County CA Redevelopment Agency Live Oak Soquel Community Series A (Tax Revenue, National Insured) | | | 5.25 | | | | 9-1-2016 | | | | 495,000 | | | | 498,698 | |
Santa Cruz County CA Redevelopment Agency Live Oak Soquel Community Series A (Tax Revenue, National Insured) | | | 5.25 | | | | 9-1-2017 | | | | 495,000 | | | | 519,869 | |
Santa Cruz County CA Redevelopment Successor Agency Tax Allocation Refunding (Tax Revenue, Build America Mutual Assurance Company Insured) | | | 5.00 | | | | 9-1-2019 | | | | 625,000 | | | | 707,331 | |
Santa Cruz County CA Redevelopment Successor Agency Tax Allocation Refunding (Tax Revenue, Build America Mutual Assurance Company Insured) | | | 5.00 | | | | 9-1-2020 | | | | 1,000,000 | | | | 1,166,790 | |
Santa Fe Springs CA Community Development Commission Consolidated Redevelopment Project Series A (Tax Revenue, National Insured) | | | 5.00 | | | | 9-1-2017 | | | | 750,000 | | | | 784,988 | |
Sierra Kings CA Health Care Refunding (GO Revenue) | | | 4.00 | | | | 8-1-2016 | | | | 215,000 | | | | 215,617 | |
Sierra Kings CA Health Care Refunding (GO Revenue) | | | 4.00 | | | | 8-1-2017 | | | | 220,000 | | | | 226,807 | |
Sierra Kings CA Health Care Refunding (GO Revenue) | | | 4.00 | | | | 8-1-2018 | | | | 230,000 | | | | 243,145 | |
Sierra Kings CA Health Care Refunding (GO Revenue) | | | 4.00 | | | | 8-1-2019 | | | | 225,000 | | | | 243,209 | |
Sierra Kings CA Health Care Refunding (GO Revenue) | | | 4.00 | | | | 8-1-2021 | | | | 345,000 | | | | 386,780 | |
Sierra Kings CA Health Care Refunding (GO Revenue) | | | 4.00 | | | | 8-1-2022 | | | | 425,000 | | | | 482,694 | |
Sierra Kings CA Health Care Refunding (GO Revenue) | | | 4.00 | | | | 8-1-2023 | | | | 405,000 | | | | 464,535 | |
Sierra Kings CA Health Care Refunding (GO Revenue) | | | 4.00 | | | | 8-1-2024 | | | | 420,000 | | | | 486,952 | |
Signal Hill CA Redevelopment Project #1 (Tax Revenue) | | | 4.13 | | | | 10-1-2016 | | | | 550,000 | | | | 554,912 | |
Simi Valley CA Unified School District Refunding and Capital Improvement Project (Miscellaneous Revenue, Ambac Insured) | | | 5.25 | | | | 8-1-2017 | | | | 380,000 | | | | 388,926 | |
Solana Beach CA School District Special Tax PFA (Tax Revenue) | | | 3.00 | | | | 9-1-2016 | | | | 450,000 | | | | 451,697 | |
Solana Beach CA School District Special Tax PFA (Tax Revenue) | | | 4.00 | | | | 9-1-2018 | | | | 330,000 | | | | 350,404 | |
Solana Beach CA School District Special Tax PFA (Tax Revenue) | | | 4.00 | | | | 9-1-2019 | | | | 735,000 | | | | 798,636 | |
South Monterey County CA Joint Union High School District (GO Revenue) ## | | | 3.00 | | | | 8-1-2016 | | | | 1,345,000 | | | | 1,347,717 | |
South Monterey County CA Joint Union High School District (GO Revenue) | | | 3.00 | | | | 8-1-2017 | | | | 1,485,000 | | | | 1,519,304 | |
South San Francisco CA Unified School District BAN Series D (GO Revenue) ¤ | | | 0.00 | | | | 5-15-2017 | | | | 3,000,000 | | | | 2,981,940 | |
South Western CA Community College District Refunding Bond (GO Revenue) | | | 5.00 | | | | 8-1-2020 | | | | 1,250,000 | | | | 1,458,975 | |
South Western CA Community College District Refunding Bond (GO Revenue) | | | 5.00 | | | | 8-1-2021 | | | | 2,710,000 | | | | 3,250,401 | |
Southern CA Mono Healthcare District (GO Revenue) | | | 3.00 | | | | 8-1-2016 | | | | 615,000 | | | | 616,082 | |
Southern CA Mono Healthcare District (GO Revenue) | | | 3.00 | | | | 8-1-2017 | | | | 300,000 | | | | 304,974 | |
Southern CA Mono Healthcare District (GO Revenue) | | | 4.00 | | | | 8-1-2019 | | | | 845,000 | | | | 906,482 | |
Southern CA Public Power Authority Refunding Canyon Power Project Series A (Utilities Revenue) | | | 5.00 | | | | 7-1-2026 | | | | 1,000,000 | | | | 1,195,520 | |
Southern CA Public Power Authority Refunding Canyon Power Project Series A (Utilities Revenue) | | | 5.00 | | | | 7-1-2027 | | | | 1,000,000 | | | | 1,193,500 | |
Stanislaus County CA Schools Infrastructure Financing Agency (Tax Revenue, AGM Insured) | | | 5.00 | | | | 9-1-2021 | | | | 1,300,000 | | | | 1,540,149 | |
Stanton CA Redevelopment Agency Consolidated Project Series A (Tax Revenue, AGM Insured) | | | 4.00 | | | | 12-1-2017 | | | | 400,000 | | | | 416,944 | |
Stanton CA Redevelopment Agency Consolidated Project Series A (Tax Revenue, AGM Insured) | | | 4.00 | | | | 12-1-2018 | | | | 410,000 | | | | 438,798 | |
Successor Agency to the Morgan Hill CA Redevelopment Agency Series A (Tax Revenue) | | | 5.00 | | | | 9-1-2021 | | | | 1,055,000 | | | | 1,261,569 | |
Successor Agency to the Rancho Mirage CA Redevelopment Agency Refunding Sub Lien Series A (Tax Revenue, Build America Mutual Assurance Company Insured) | | | 4.00 | | | | 4-1-2017 | | | | 460,000 | | | | 470,897 | |
Successor Agency to the Rancho Mirage CA Redevelopment Agency Refunding Sub Lien Series A (Tax Revenue, Build America Mutual Assurance Company Insured) | | | 5.00 | | | | 4-1-2018 | | | | 400,000 | | | | 428,380 | |
The accompanying notes are an integral part of these financial statements.
| | | | |
| 22 | | Wells Fargo California Limited-Term Tax-Free Fund | | Portfolio of investments—June 30, 2016 |
| | | | | | | | | | | | | | | | |
| Security name | | Interest rate | | | Maturity date | | | Principal | | | Value | |
| | | | |
| California (continued) | | | | | | | | | | | | | | | | |
Successor Agency to the Rancho Mirage CA Redevelopment Agency Refunding Sub Lien Series A (Tax Revenue, Build America Mutual Assurance Company Insured) | | | 5.00 | % | | | 4-1-2019 | | | $ | 580,000 | | | $ | 643,000 | |
Successor Agency to the Rancho Mirage CA Redevelopment Agency Series A (Tax Revenue, Build America Mutual Assurance Company Insured) | | | 4.00 | | | | 4-1-2018 | | | | 750,000 | | | | 790,200 | |
Successor Agency to the Rancho Mirage CA Redevelopment Agency Series A (Tax Revenue, Build America Mutual Assurance Company Insured) | | | 5.00 | | | | 4-1-2018 | | | | 550,000 | | | | 589,023 | |
Successor Agency to the Rancho Mirage CA Redevelopment Agency Series A (Tax Revenue, Build America Mutual Assurance Company Insured) | | | 5.00 | | | | 4-1-2019 | | | | 1,450,000 | | | | 1,607,499 | |
Successor Agency to the Richmond CA Community Redevelopment Agency Series A (Tax Revenue, Build America Mutual Assurance Company Insured) | | | 4.50 | | | | 9-1-2025 | | | | 160,000 | | | | 191,426 | |
Successor Agency to the Richmond CA Community Redevelopment Agency Series A (Tax Revenue, Build America Mutual Assurance Company Insured) | | | 5.00 | | | | 9-1-2021 | | | | 310,000 | | | | 364,380 | |
Successor Agency to the Richmond CA Community Redevelopment Agency Series A (Tax Revenue, Build America Mutual Assurance Company Insured) | | | 5.00 | | | | 9-1-2022 | | | | 300,000 | | | | 359,688 | |
Successor Agency to the Richmond CA Community Redevelopment Agency Series A (Tax Revenue, Build America Mutual Assurance Company Insured) | | | 5.00 | | | | 9-1-2023 | | | | 265,000 | | | | 322,852 | |
Successor Agency to the Richmond CA Community Redevelopment Agency Series A (Tax Revenue, Build America Mutual Assurance Company Insured) | | | 5.00 | | | | 9-1-2025 | | | | 150,000 | | | | 188,297 | |
Successor Agency to the Riverside County CA Redevelopment Agency Desert Communities Project Area Series D (Tax Revenue) | | | 5.00 | | | | 10-1-2020 | | | | 405,000 | | | | 471,679 | |
Successor Agency to the Riverside County CA Redevelopment Agency Desert Communities Project Area Series D (Tax Revenue) | | | 5.00 | | | | 10-1-2022 | | | | 445,000 | | | | 541,400 | |
Successor Agency to the Riverside County CA Redevelopment Agency Desert Communities Project Area Series D (Tax Revenue) | | | 5.00 | | | | 10-1-2023 | | | | 470,000 | | | | 582,274 | |
Successor Agency to the Riverside County CA Redevelopment Agency Project Area #1 Series A (Tax Revenue) | | | 5.00 | | | | 10-1-2020 | | | | 365,000 | | | | 425,094 | |
Successor Agency to the Riverside County CA Redevelopment Agency Project Area #1 Series A (Tax Revenue) | | | 5.00 | | | | 10-1-2022 | | | | 240,000 | | | | 291,991 | |
Successor Agency to the Riverside County CA Redevelopment Agency Project Area #1 Series A (Tax Revenue) | | | 5.00 | | | | 10-1-2023 | | | | 460,000 | | | | 569,885 | |
Successor Agency to the Vacaville CA Redevelopment Agency Projects (Tax Revenue) | | | 5.00 | | | | 9-1-2020 | | | | 600,000 | | | | 694,200 | |
Successor Agency to the Vacaville CA Redevelopment Agency Projects (Tax Revenue) | | | 5.00 | | | | 9-1-2021 | | | | 600,000 | | | | 710,838 | |
Successor Agency to the Vacaville CA Redevelopment Agency Projects (Tax Revenue) | | | 5.00 | | | | 9-1-2022 | | | | 1,050,000 | | | | 1,266,437 | |
Sulphur Springs CA Union School CAB Anticipation Notes Series A (Miscellaneous Revenue) ¤ | | | 0.00 | | | | 1-1-2018 | | | | 2,750,000 | | | | 2,714,360 | |
Sulphur Springs CA Union School District SPL Prerefunded Community Facilities District #2002-1-Series A (Tax Revenue) | | | 3.00 | | | | 9-1-2016 | | | | 75,000 | | | | 75,326 | |
Sulphur Springs CA Union School District SPL Prerefunded Community Facilities District #2002-1-Series A (Tax Revenue) | | | 3.00 | | | | 9-1-2017 | | | | 150,000 | | | | 154,349 | |
Sulphur Springs CA Union School District SPL Prerefunded Community Facilities District #2002-1-Series A (Tax Revenue) | | | 3.00 | | | | 9-1-2018 | | | | 275,000 | | | | 289,080 | |
Sulphur Springs CA Union School District SPL Prerefunded Community Facilities District #2002-1-Series A (Tax Revenue) | | | 3.00 | | | | 9-1-2019 | | | | 295,000 | | | | 315,871 | |
Sulphur Springs CA Union School District SPL Unrefunded Community Facilities District #2002-1-Series A (Tax Revenue) | | | 3.00 | | | | 9-1-2016 | | | | 75,000 | | | | 75,287 | |
Sulphur Springs CA Union School District SPL Unrefunded Community Facilities District #2002-1-Series A (Tax Revenue) | | | 3.00 | | | | 9-1-2017 | | | | 150,000 | | | | 153,519 | |
Sulphur Springs CA Union School District SPL Unrefunded Community Facilities District #2002-1-Series A (Tax Revenue) | | | 3.00 | | | | 9-1-2018 | | | | 280,000 | | | | 291,822 | |
Sulphur Springs CA Union School District SPL Unrefunded Community Facilities District #2002-1-Series A (Tax Revenue) | | | 3.00 | | | | 9-1-2019 | | | | 300,000 | | | | 316,674 | |
The accompanying notes are an integral part of these financial statements.
| | | | | | |
| Portfolio of investments—June 30, 2016 | | Wells Fargo California Limited-Term Tax-Free Fund | | | 23 | |
| | | | | | | | | | | | | | | | |
| Security name | | Interest rate | | | Maturity date | | | Principal | | | Value | |
| | | | |
| California (continued) | | | | | | | | | | | | | | | | |
Sutter Butte CA Flood Agency Assessment (Miscellaneous Revenue, Build America Mutual Assurance Company Insured) | | | 5.00 | % | | | 10-1-2023 | | | $ | 1,280,000 | | | $ | 1,582,797 | |
Sutter Butte CA Flood Agency Assessment (Miscellaneous Revenue, Build America Mutual Assurance Company Insured) | | | 5.00 | | | | 10-1-2024 | | | | 715,000 | | | | 900,178 | |
Sutter Butte CA Flood Agency Assessment (Miscellaneous Revenue, Build America Mutual Assurance Company Insured) | | | 5.00 | | | | 10-1-2025 | | | | 1,575,000 | | | | 2,014,724 | |
Sweetwater CA Union High School District Public Financing Authority Refunding Bond (Miscellaneous Revenue, Build America Mutual Assurance Company Insured) | | | 5.00 | | | | 9-1-2018 | | | | 2,500,000 | | | | 2,728,375 | |
Sweetwater CA Union High School District Public Financing Authority Refunding Bond (Miscellaneous Revenue, Build America Mutual Assurance Company Insured) | | | 5.00 | | | | 9-1-2019 | | | | 1,000,000 | | | | 1,128,920 | |
Sweetwater CA Union High School District Refunding Bond (GO Revenue, Build America Mutual Assurance Company Insured) | | | 5.00 | | | | 8-1-2021 | | | | 620,000 | | | | 740,292 | |
Temecula CA PFA Crown Hill Community Facilities District #3-1 (Tax Revenue) | | | 3.00 | | | | 9-1-2016 | | | | 380,000 | | | | 381,452 | |
Temecula CA PFA Crown Hill Community Facilities District #3-1 (Tax Revenue) | | | 3.00 | | | | 9-1-2017 | | | | 395,000 | | | | 404,267 | |
Temecula CA PFA Crown Hill Community Facilities District #3-1 (Tax Revenue) | | | 3.00 | | | | 9-1-2018 | | | | 405,000 | | | | 422,099 | |
Temecula CA PFA Wolf Creek Community Facilities District #3-3 (Tax Revenue) | | | 3.00 | | | | 9-1-2018 | | | | 870,000 | | | | 906,592 | |
Temecula Valley CA Unified School District Community Facilities District #89-1 (Tax Revenue) | | | 3.00 | | | | 9-1-2016 | | | | 1,185,000 | | | | 1,189,385 | |
Temecula Valley CA Unified School District Community Facilities District #89-1 (Tax Revenue) | | | 3.00 | | | | 9-1-2017 | | | | 1,250,000 | | | | 1,278,488 | |
Torrance CA RDA Referendum Senior Lien Series C (Tax Revenue, National Insured) | | | 5.45 | | | | 9-1-2018 | | | | 845,000 | | | | 848,034 | |
Tracy CA Community Development Agency Refunding (Tax Revenue, AGM Insured) | | | 5.00 | | | | 8-1-2024 | | | | 400,000 | | | | 508,088 | |
Tracy CA Community Development Agency Refunding (Tax Revenue, AGM Insured) | | | 5.00 | | | | 8-1-2026 | | | | 750,000 | | | | 961,613 | |
Tracy CA Community Development Agency Refunding (Tax Revenue, AGM Insured) | | | 5.00 | | | | 8-1-2027 | | | | 1,000,000 | | | | 1,268,150 | |
Tustin CA Community Facilities District Refunding #06-1 Legacy Columbus Villages Series A (Tax Revenue) | | | 5.00 | | | | 9-1-2024 | | | | 1,145,000 | | | | 1,415,953 | |
Twin Rivers CA Unified School District Facility Bridge Funding Program (Miscellaneous Revenue, AGM Insured) ± | | | 3.20 | | | | 6-1-2027 | | | | 4,150,000 | | | | 4,157,470 | |
Twin Rivers CA Unified School District Series A (GO Revenue, Build America Mutual Assurance Company Insured) | | | 4.00 | | | | 8-1-2019 | | | | 385,000 | | | | 423,015 | |
Twin Rivers CA Unified School District Series A (GO Revenue, Build America Mutual Assurance Company Insured) | | | 5.00 | | | | 8-1-2020 | | | | 510,000 | | | | 593,829 | |
Union City CA Community Redevelopment Agency Sub Lien (Tax Revenue) | | | 4.38 | | | | 12-1-2016 | | | | 475,000 | | | | 482,158 | |
University of California Series AK (Education Revenue) ± | | | 5.00 | | | | 5-15-2048 | | | | 10,000,000 | | | | 12,509,700 | |
Upland CA Successor Agency Merged Project Tax Allocation (Tax Revenue, AGM Insured) | | | 5.00 | | | | 9-1-2023 | | | | 1,000,000 | | | | 1,223,340 | |
Vacaville CA Unified School District Series C (GO Revenue, Build America Mutual Assurance Company Insured) | | | 5.00 | | | | 8-1-2022 | | | | 675,000 | | | | 824,999 | |
Val Verde CA Unified School District (Tax Revenue, Build America Mutual Assurance Company Insured) | | | 4.00 | | | | 10-1-2020 | | | | 350,000 | | | | 388,584 | |
Val Verde CA Unified School District (Tax Revenue, Build America Mutual Assurance Company Insured) | | | 4.00 | | | | 10-1-2021 | | | | 375,000 | | | | 422,681 | |
Val Verde CA Unified School District (Tax Revenue, Build America Mutual Assurance Company Insured) | | | 5.00 | | | | 10-1-2022 | | | | 665,000 | | | | 798,678 | |
Val Verde CA Unified School District BAN (GO Revenue) | | | 3.00 | | | | 8-1-2018 | | | | 5,000,000 | | | | 5,011,100 | |
Vallejo CA Unified School District Series A (GO Revenue, National Insured) | | | 5.90 | | | | 2-1-2018 | | | | 2,065,000 | | | | 2,222,952 | |
Vallejo CA Refunding Bond (Water & Sewer Revenue, National Insured) | | | 5.00 | | | | 5-1-2019 | | | | 790,000 | | | | 792,678 | |
Vallejo CA Refunding Bond (Water & Sewer Revenue, National Insured) | | | 5.00 | | | | 5-1-2021 | | | | 1,500,000 | | | | 1,504,050 | |
Ventura County CA Public Financing Authority Series B (Miscellaneous Revenue) | | | 5.00 | | | | 11-1-2019 | | | | 375,000 | | | | 427,583 | |
Ventura County CA Public Financing Authority Series B (Miscellaneous Revenue) | | | 5.00 | | | | 11-1-2020 | | | | 250,000 | | | | 293,738 | |
Visalia CA Certificate of Participation (Miscellaneous Revenue, AGM Insured) | | | 4.00 | | | | 12-1-2020 | | | | 250,000 | | | | 280,853 | |
Visalia CA Certificate of Participation (Miscellaneous Revenue, AGM Insured) | | | 4.00 | | | | 12-1-2021 | | | | 250,000 | | | | 284,950 | |
The accompanying notes are an integral part of these financial statements.
| | | | |
| 24 | | Wells Fargo California Limited-Term Tax-Free Fund | | Portfolio of investments—June 30, 2016 |
| | | | | | | | | | | | | | | | |
| Security name | | Interest rate | | | Maturity date | | | Principal | | | Value | |
| | | | |
| California (continued) | | | | | | | | | | | | | | | | |
Visalia CA Certificate of Participation (Miscellaneous Revenue, AGM Insured) | | | 5.00 | % | | | 12-1-2022 | | | $ | 335,000 | | | $ | 408,311 | |
Walnut CA Energy Center Authority Refunding Series A (Utilities Revenue) | | | 5.00 | | | | 1-1-2021 | | | | 500,000 | | | | 588,325 | |
Walnut CA Improvement Agency Refunding Walnut Improvement Project (Tax Revenue, Build America Mutual Assurance Company Insured) | | | 4.00 | | | | 3-1-2017 | | | | 850,000 | | | | 867,289 | |
Washington Township CA Health Care District Series A (Health Revenue) | | | 5.00 | | | | 7-1-2017 | | | | 1,125,000 | | | | 1,168,403 | |
Washington Township CA Health Refunding Series A (Health Revenue) | | | 5.00 | | | | 7-1-2023 | | | | 600,000 | | | | 717,738 | |
West Contra Costa CA Unified School District (GO Revenue, AGM Insured) | | | 5.00 | | | | 8-1-2016 | | | | 1,055,000 | | | | 1,059,104 | |
West Covina CA Unified School District (GO Revenue, AGM Insured) | | | 4.00 | | | | 8-1-2017 | | | | 325,000 | | | | 337,002 | |
West Covina CA Unified School District (GO Revenue, AGM Insured) | | | 4.00 | | | | 8-1-2018 | | | | 575,000 | | | | 614,537 | |
West Sacramento CA Flood Control Agency (Miscellaneous Revenue) | | | 2.25 | | | | 9-1-2016 | | | | 265,000 | | | | 265,766 | |
West Sacramento CA Flood Control Agency (Miscellaneous Revenue) | | | 2.25 | | | | 9-1-2017 | | | | 270,000 | | | | 274,884 | |
West Sacramento CA Flood Control Agency (Miscellaneous Revenue) | | | 2.50 | | | | 9-1-2018 | | | | 275,000 | | | | 285,093 | |
West Sacramento CA Flood Control Agency (Miscellaneous Revenue) | | | 2.75 | | | | 9-1-2019 | | | | 285,000 | | | | 301,370 | |
West Sacramento CA Flood Control Agency (Miscellaneous Revenue) | | | 5.00 | | | | 9-1-2020 | | | | 290,000 | | | | 335,530 | |
Western Riverside County CA Regional Wastewater Authority Series A-1 (Tax Revenue) | | | 4.00 | | | | 9-1-2016 | | | | 560,000 | | | | 563,293 | |
Western Riverside County CA Regional Wastewater Authority Series A-1 (Tax Revenue) | | | 4.00 | | | | 9-1-2017 | | | | 570,000 | | | | 592,162 | |
Western Riverside County CA Regional Wastewater Authority Series A-1 (Tax Revenue) | | | 4.00 | | | | 9-1-2019 | | | | 1,830,000 | | | | 2,003,612 | |
Western Riverside County CA Water & Wastewater Refunding-Local Agency Series A (Water & Sewer Revenue) | | | 5.00 | | | | 9-1-2027 | | | | 1,940,000 | | | | 2,466,264 | |
Windsor CA Redevelopment Successor Agency Windsor Redevelopment Project (Tax Revenue, Build America Mutual Assurance Company Insured) | | | 3.00 | | | | 9-1-2017 | | | | 615,000 | | | | 630,787 | |
Yuba City CA Redevelopment Agency Refunding (Tax Revenue, AGM Insured) | | | 5.00 | | | | 9-1-2025 | | | | 750,000 | | | | 955,155 | |
| | | | |
| | | | | | | | | | | | | | | 778,982,124 | |
| | | | | | | | | | | | | | | | |
| | | | |
| Guam: 0.28% | | | | | | | | | | | | | | | | |
Guam Government Waterworks Authority (Water & Sewer Revenue) | | | 5.00 | | | | 7-1-2022 | | | | 400,000 | | | | 472,152 | |
Guam Power Authority Series A (Utilities Revenue, AGM Insured) | | | 5.00 | | | | 10-1-2019 | | | | 1,640,000 | | | | 1,851,084 | |
| | | | |
| | | | | | | | | | | | | | | 2,323,236 | |
| | | | | | | | | | | | | | | | |
| | | | |
| Indiana: 0.37% | | | | | | | | | | | | | | | | |
JPMorgan Chase PUTTER/DRIVER Trust Series 3888 Indianapolis IN Industry Local Public Improvement (Miscellaneous Revenue, JPMorgan Chase & Company LIQ) 144Aø | | | 0.69 | | | | 2-1-2019 | | | | 3,000,000 | | | | 3,000,000 | |
| | | | | | | | | | | | | | | | |
| | | | |
| Puerto Rico: 0.89% | | | | | | | | | | | | | | | | |
Puerto Rico HFA Capital Funding Program (Housing Revenue, HUD Insured) | | | 5.00 | | | | 12-1-2016 | | | | 1,815,000 | | | | 1,840,864 | |
Puerto Rico HFA Subordinated Capital Fund Modernization Refunding Bond (Housing Revenue, HUD Insured) | | | 5.50 | | | | 12-1-2016 | | | | 825,000 | | | | 838,910 | |
Puerto Rico HFA Subordinated Capital Fund Modernization Refunding Bond (Housing Revenue, HUD Insured) | | | 5.50 | | | | 12-1-2017 | | | | 2,045,000 | | | | 2,159,275 | |
Puerto Rico HFA Subordinated Capital Fund Modernization Refunding Bond (Housing Revenue, HUD Insured) | | | 5.50 | | | | 12-1-2018 | | | | 1,250,000 | | | | 1,363,350 | |
Puerto Rico HFA Unrefunded Balance Capital Funding Program (Housing Revenue) | | | 5.00 | | | | 12-1-2019 | | | | 1,000,000 | | | | 1,027,850 | |
| | | | |
| | | | | | | | | | | | | | | 7,230,249 | |
| | | | | | | | | | | | | | | | |
| | | | |
| Texas: 1.46% | | | | | | | | | | | | | | | | |
Port Arthur TX Navigation District Jefferson County Environmental Facilities Motiva Enterprises LLC Project Series A (Resource Recovery Revenue) ø | | | 0.54 | | | | 12-1-2039 | | | | 11,900,000 | | | | 11,900,000 | |
| | | | | | | | | | | | | | | | |
| | | | |
Total Municipal Obligations (Cost $771,798,630) | | | | | | | | | | | | | | | 803,435,609 | |
| | | | | | | | | | | | | | | | |
The accompanying notes are an integral part of these financial statements.
| | | | | | |
| Portfolio of investments—June 30, 2016 | | Wells Fargo California Limited-Term Tax-Free Fund | | | 25 | |
| | | | | | | | | | | | | | | | |
| Security name | | Interest rate | | | Maturity date | | | Principal | | | Value | |
| | | | |
Other: 0.31% | | | | | | | | | | | | | | | | |
Nuveen California AMT-Free Municipal Income Fund, Institutional MuniFund Term Preferred Shares ±144A§ | | | 0.88 | % | | | 7-1-2018 | | | $ | 2,500,000 | | | $ | 2,490,300 | |
| | | | | | | | | | | | | | | | |
| | | | |
Total Other (Cost $2,500,000) | | | | | | | | | | | | | | | 2,490,300 | |
| | | | | | | | | | | | | | | | |
| | | Yield | | | | | | Shares | | | | |
| | | | |
Short-Term Investments: 0.50% | | | | | | | | | | | | | | | | |
| | | | |
| Investment Companies: 0.50% | | | | | | | | | | | | | | | | |
Wells Fargo California Municipal Money Market Fund Premier Class (l)(u)## | | | 0.26 | | | | | | | | 4,095,697 | | | | 4,095,697 | |
| | | | | | | | | | | | | | | | |
| | | | |
Total Short-Term Investments (Cost $4,095,697) | | | | | | | | | | | | | | | 4,095,697 | |
| | | | | | | | | | | | | | | | |
| | | | | | | | |
| Total investments in securities (Cost $778,394,327) * | | | 99.46 | % | | | 810,021,606 | |
Other assets and liabilities, net | | | 0.54 | | | | 4,366,729 | |
| | | | | | | | |
| Total net assets | | | 100.00 | % | | $ | 814,388,335 | |
| | | | | | | | |
| ¤ | The security is issued in zero coupon form with no periodic interest payments. |
| ± | Variable rate investment. The rate shown is the rate in effect at period end. |
| 144A | The security may be resold in transactions exempt from registration, normally to qualified institutional buyers, pursuant to Rule 144A under the Securities Act of 1933. |
| (m) | The security is an auction-rate security which has an interest rate that resets at predetermined short-term intervals through a Dutch auction. The rate shown is the rate in effect at period end. |
| ø | Variable rate demand notes are subject to a demand feature which reduces the effective maturity. The maturity date shown represents the final maturity date of the security. The interest rate is determined and reset by the issuer daily, weekly, or monthly depending upon the terms of the security. The rate shown is the rate in effect at period end. |
| %% | The security is issued on a when-issued basis. |
| ## | All or a portion of this security is segregated for when-issued securities. |
| § | The security is subject to a demand feature which reduces the effective maturity. |
| (l) | The issuer of the security is an affiliated person of the Fund as defined in the Investment Company Act of 1940. |
| (u) | The rate represents the 7-day annualized yield at period end. |
| * | Cost for federal income tax purposes is $778,395,149 and unrealized gains (losses) consists of: |
| | | | |
Gross unrealized gains | | $ | 32,142,380 | |
Gross unrealized losses | | | (515,923 | ) |
| | | | |
Net unrealized gains | | $ | 31,626,457 | |
The accompanying notes are an integral part of these financial statements.
| | | | |
| 26 | | Wells Fargo California Limited-Term Tax-Free Fund | | Statement of assets and liabilities—June 30, 2016 |
| | | | |
| | |
| |
Assets | | | | |
Investments | | | | |
In unaffiliated securities, at value (cost $774,298,630) | | $ | 805,925,909 | |
In affiliated securities, at value (cost $4,095,697) | | | 4,095,697 | |
| | | | |
Total investments, at value (cost $778,394,327) | | | 810,021,606 | |
Receivable for investments sold | | | 2,518,009 | |
Receivable for Fund shares sold | | | 1,943,518 | |
Receivable for interest | | | 8,386,697 | |
Prepaid expenses and other assets | | | 31,261 | |
| | | | |
Total assets | | | 822,901,091 | |
| | | | |
| |
Liabilities | | | | |
Dividends payable | | | 532,938 | |
Payable for investments purchased | | | 5,123,053 | |
Payable for Fund shares redeemed | | | 2,405,888 | |
Management fee payable | | | 222,907 | |
Distribution fee payable | | | 24,565 | |
Administration fees payable | | | 72,291 | |
Accrued expenses and other liabilities | | | 131,114 | |
| | | | |
Total liabilities | | | 8,512,756 | |
| | | | |
Total net assets | | $ | 814,388,335 | |
| | | | |
| |
NET ASSETS CONSIST OF | | | | |
Paid-in capital | | $ | 783,192,520 | |
Undistributed net investment income | | | 414,304 | |
Accumulated net realized losses on investments | | | (845,768 | ) |
Net unrealized gains on investments | | | 31,627,279 | |
| | | | |
Total net assets | | $ | 814,388,335 | |
| | | | |
| |
COMPUTATION OF NET ASSET VALUE AND OFFERING PRICE PER SHARE | | | | |
Net assets – Class A | | $ | 196,629,330 | |
Shares outstanding – Class A1 | | | 17,812,575 | |
Net asset value per share – Class A | | | $11.04 | |
Maximum offering price per share – Class A2 | | | $11.27 | |
Net assets – Class C | | $ | 40,098,464 | |
Shares outstanding – Class C1 | | | 3,633,118 | |
Net asset value per share – Class C | | | $11.04 | |
Net assets – Administrator Class | | $ | 226,580,607 | |
Shares outstanding – Administrator Class1 | | | 20,844,398 | |
Net asset value per share – Administrator Class | | | $10.87 | |
Net assets – Institutional Class | | $ | 351,079,934 | |
Shares outstanding – Institutional Class1 | | | 32,315,960 | |
Net asset value per share – Institutional Class | | | $10.86 | |
| 1 | The Fund has an unlimited number of authorized shares. |
| 2 | Maximum offering price is computed as 100/98 of net asset value. On investments of $50,000 or more, the offering price is reduced. |
The accompanying notes are an integral part of these financial statements.
| | | | | | |
| Statement of operations—year ended June 30, 2016 | | Wells Fargo California Limited-Term Tax-Free Fund | | | 27 | |
| | | | |
| | |
| |
Investment income | | | | |
Interest | | $ | 18,912,155 | |
Income from affiliated securities | | | 12,337 | |
| | | | |
Total investment income | | | 18,924,492 | |
| | | | |
| |
Expenses | | | | |
Management fee | | | 3,135,144 | |
Administration fees | | | | |
Class A | | | 319,088 | |
Class C | | | 58,217 | |
Administrator Class | | | 270,921 | |
Institutional Class | | | 236,775 | |
Shareholder servicing fees | | | | |
Class A | | | 498,574 | |
Class C | | | 90,964 | |
Administrator Class | | | 676,196 | |
Distribution fee | | | | |
Class C | | | 272,893 | |
Custody and accounting fees | | | 46,926 | |
Professional fees | | | 40,842 | |
Registration fees | | | 56,496 | |
Shareholder report expenses | | | 29,635 | |
Trustees’ fees and expenses | | | 23,384 | |
Other fees and expenses | | | 16,935 | |
| | | | |
Total expenses | | | 5,772,990 | |
Less: Fee waivers and/or expense reimbursements | | | (516,515 | ) |
| | | | |
Net expenses | | | 5,256,475 | |
| | | | |
Net investment income | | | 13,668,017 | |
| | | | |
| |
REALIZED AND UNREALIZED GAINS (LOSSES) ON INVESTMENTS | | | | |
Net realized gains on investments | | | 307,165 | |
Net change in unrealized gains (losses) on investments | | | 15,198,116 | |
| | | | |
Net realized and unrealized gains (losses) on investments | | | 15,505,281 | |
| | | | |
Net increase in net assets resulting from operations | | $ | 29,173,298 | |
| | | | |
The accompanying notes are an integral part of these financial statements.
| | | | |
| 28 | | Wells Fargo California Limited-Term Tax-Free Fund | | Statement of changes in net assets |
| | | | | | | | | | | | | | | | |
| | | Year ended
June 30, 2016 | | | Year ended
June 30, 2015 | |
| | | |
Operations | | | | | | | | | | | | |
Net investment income | | | | | | $ | 13,668,017 | | | | | | | $ | 14,078,386 | |
Net realized gains on investments | | | | | | | 307,165 | | | | | | | | 364,309 | |
Net change in unrealized gains (losses) on investments | | | | | | | 15,198,116 | | | | | | | | (3,311,723 | ) |
| | | | |
Net increase in net assets resulting from operations | | | | | | | 29,173,298 | | | | | | | | 11,130,972 | |
| | | | |
| | | |
Distributions to shareholders from | | | | | | | | | | | | |
Net investment income | | | | | | | | | | | | | | | | |
Class A | | | | | | | (3,106,736 | ) | | | | | | | (3,064,591 | ) |
Class C | | | | | | | (293,867 | ) | | | | | | | (256,497 | ) |
Administrator Class | | | | | | | (4,753,577 | ) | | | | | | | (8,823,966 | ) |
Institutional Class | | | | | | | (5,513,837 | ) | | | | | | | (1,933,332 | )1 |
| | | | |
Total distributions to shareholders | | | | | | | (13,668,017 | ) | | | | | | | (14,078,386 | ) |
| | | | |
| | | | |
Capital share transactions | | | Shares | | | | | | | | Shares | | | | | |
Proceeds from shares sold | | | | | | | | | | | | | | | | |
Class A | | | 3,717,168 | | | | 40,622,538 | | | | 6,964,431 | | | | 75,889,938 | |
Class C | | | 1,111,875 | | | | 12,161,519 | | | | 553,959 | | | | 6,036,972 | |
Administrator Class | | | 7,716,091 | | | | 82,975,726 | | | | 32,948,716 | | | | 353,805,157 | |
Institutional Class | | | 18,822,453 | | | | 202,617,124 | | | | 36,280,587 | 1 | | | 389,651,041 | 1 |
| | | | |
| | | | | | | 338,376,907 | | | | | | | | 825,383,108 | |
| | | | |
Reinvestment of distributions | | | | | | | | | | | | | | | | |
Class A | | | 255,259 | | | | 2,791,230 | | | | 244,994 | | | | 2,670,137 | |
Class C | | | 24,387 | | | | 266,691 | | | | 21,405 | | | | 233,181 | |
Administrator Class | | | 392,993 | | | | 4,230,319 | | | | 408,698 | | | | 4,385,625 | |
Institutional Class | | | 36,473 | | | | 393,272 | | | | 4,520 | 1 | | | 48,377 | 1 |
| | | | |
| | | | | | | 7,681,512 | | | | | | | | 7,337,320 | |
| | | | |
Payment for shares redeemed | | | | | | | | | | | | | | | | |
Class A | | | (4,482,841 | ) | | | (49,048,097 | ) | | | (7,599,782 | ) | | | (82,821,193 | ) |
Class C | | | (643,275 | ) | | | (7,027,894 | ) | | | (649,944 | ) | | | (7,074,821 | ) |
Administrator Class | | | (16,255,503 | ) | | | (174,866,159 | ) | | | (55,804,196 | ) | | | (599,212,171 | ) |
Institutional Class | | | (12,821,779 | ) | | | (137,811,298 | ) | | | (10,006,294 | )1 | | | (107,468,540 | )1 |
| | | | |
| | | | | | | (368,753,448 | ) | | | | | | | (796,576,725 | ) |
| | | | |
Net increase (decrease) in net assets resulting from capital share transactions | | | | | | | (22,695,029 | ) | | | | | | | 36,143,703 | |
| | | | |
Total increase (decrease) in net assets | | | | | | | (7,189,748 | ) | | | | | | | 33,196,289 | |
| | | | |
| | |
Net assets | | | | | | | | |
Beginning of period | | | | | | | 821,578,083 | | | | | | | | 788,381,794 | |
| | | | |
End of period | | | | | | $ | 814,388,335 | | | | | | | $ | 821,578,083 | |
| | | | |
Undistributed net investment income | | | | | | $ | 414,304 | | | | | | | $ | 408,545 | |
| | | | |
| 1 | For the period from October 31, 2014 (commencement of class operations) to June 30, 2015 |
The accompanying notes are an integral part of these financial statements.
| | | | | | |
| Financial highlights | | Wells Fargo California Limited-Term Tax-Free Fund | | | 29 | |
(For a share outstanding throughout each period)
| | | | | | | | | | | | | | | | | | | | |
| | | Year ended June 30 | |
| CLASS A | | 2016 | | | 2015 | | | 2014 | | | 2013 | | | 2012 | |
Net asset value, beginning of period | | | $10.83 | | | | $10.86 | | | | $10.66 | | | | $10.70 | | | | $10.51 | |
Net investment income | | | 0.17 | | | | 0.16 | | | | 0.18 | | | | 0.21 | | | | 0.27 | |
Net realized and unrealized gains (losses) on investments | | | 0.21 | | | | (0.03 | ) | | | 0.20 | | | | (0.04 | ) | | | 0.19 | |
| | | | | | | | | | | | | | | | | | | | |
Total from investment operations | | | 0.38 | | | | 0.13 | | | | 0.38 | | | | 0.17 | | | | 0.46 | |
Distributions to shareholders from | | | | | | | | | | | | | | | | | | | | |
Net investment income | | | (0.17 | ) | | | (0.16 | ) | | | (0.18 | ) | | | (0.21 | ) | | | (0.27 | ) |
Net asset value, end of period | | | $11.04 | | | | $10.83 | | | | $10.86 | | | | $10.66 | | | | $10.70 | |
Total return1 | | | 3.54 | % | | | 1.22 | % | | | 3.61 | % | | | 1.59 | % | | | 4.41 | % |
Ratios to average net assets (annualized) | | | | | | | | | | | | | | | | | | | | |
Gross expenses | | | 0.83 | % | | | 0.82 | % | | | 0.83 | % | | | 0.83 | % | | | 0.84 | % |
Net expenses | | | 0.80 | % | | | 0.80 | % | | | 0.80 | % | | | 0.80 | % | | | 0.80 | % |
Net investment income | | | 1.56 | % | | | 1.49 | % | | | 1.70 | % | | | 1.95 | % | | | 2.51 | % |
Supplemental data | | | | | | | | | | | | | | | | | | | | |
Portfolio turnover rate | | | 21 | % | | | 31 | % | | | 31 | % | | | 32 | % | | | 56 | % |
Net assets, end of period (000s omitted) | | | $196,629 | | | | $198,402 | | | | $203,306 | | | | $156,366 | | | | $162,381 | |
| 1 | Total return calculations do not include any sales charges. |
The accompanying notes are an integral part of these financial statements.
| | | | |
| 30 | | Wells Fargo California Limited-Term Tax-Free Fund | | Financial highlights |
(For a share outstanding throughout each period)
| | | | | | | | | | | | | | | | | | | | |
| | | Year ended June 30 | |
| CLASS C | | 2016 | | | 2015 | | | 2014 | | | 2013 | | | 2012 | |
Net asset value, beginning of period | | | $10.83 | | | | $10.86 | | | | $10.65 | | | | $10.70 | | | | $10.51 | |
Net investment income | | | 0.09 | | | | 0.08 | | | | 0.10 | | | | 0.13 | | | | 0.19 | |
Net realized and unrealized gains (losses) on investments | | | 0.21 | | | | (0.03 | ) | | | 0.21 | | | | (0.05 | ) | | | 0.19 | |
| | | | | | | | | | | | | | | | | | | | |
Total from investment operations | | | 0.30 | | | | 0.05 | | | | 0.31 | | | | 0.08 | | | | 0.38 | |
Distributions to shareholders from | | | | | | | | | | | | | | | | | | | | |
Net investment income | | | (0.09 | ) | | | (0.08 | ) | | | (0.10 | ) | | | (0.13 | ) | | | (0.19 | ) |
Net asset value, end of period | | | $11.04 | | | | $10.83 | | | | $10.86 | | | | $10.65 | | | | $10.70 | |
Total return1 | | | 2.76 | % | | | 0.47 | % | | | 2.94 | % | | | 0.73 | % | | | 3.63 | % |
Ratios to average net assets (annualized) | | | | | | | | | | | | | | | | | | | | |
Gross expenses | | | 1.58 | % | | | 1.57 | % | | | 1.58 | % | | | 1.58 | % | | | 1.59 | % |
Net expenses | | | 1.55 | % | | | 1.55 | % | | | 1.55 | % | | | 1.55 | % | | | 1.55 | % |
Net investment income | | | 0.81 | % | | | 0.74 | % | | | 0.95 | % | | | 1.19 | % | | | 1.77 | % |
Supplemental data | | | | | | | | | | | | | | | | | | | | |
Portfolio turnover rate | | | 21 | % | | | 31 | % | | | 31 | % | | | 32 | % | | | 56 | % |
Net assets, end of period (000s omitted) | | | $40,098 | | | | $33,996 | | | | $34,920 | | | | $35,309 | | | | $33,414 | |
| 1 | Total return calculations do not include any sales charges. |
The accompanying notes are an integral part of these financial statements.
| | | | | | |
| Financial highlights | | Wells Fargo California Limited-Term Tax-Free Fund | | | 31 | |
(For a share outstanding throughout each period)
| | | | | | | | | | | | | | | | | | | | |
| | | Year ended June 30 | |
| ADMINISTRATOR CLASS | | 2016 | | | 2015 | | | 2014 | | | 2013 | | | 2012 | |
Net asset value, beginning of period | | | $10.66 | | | | $10.70 | | | | $10.49 | | | | $10.53 | | | | $10.34 | |
Net investment income | | | 0.19 | | | | 0.18 | | | | 0.20 | | | | 0.23 | | | | 0.29 | |
Net realized and unrealized gains (losses) on investments | | | 0.21 | | | | (0.04 | ) | | | 0.21 | | | | (0.04 | ) | | | 0.19 | |
| | | | | | | | | | | | | | | | | | | | |
Total from investment operations | | | 0.40 | | | | 0.14 | | | | 0.41 | | | | 0.19 | | | | 0.48 | |
Distributions to shareholders from | | | | | | | | | | | | | | | | | | | | |
Net investment income | | | (0.19 | ) | | | (0.18 | ) | | | (0.20 | ) | | | (0.23 | ) | | | (0.29 | ) |
Net asset value, end of period | | | $10.87 | | | | $10.66 | | | | $10.70 | | | | $10.49 | | | | $10.53 | |
Total return | | | 3.78 | % | | | 1.33 | % | | | 3.95 | % | | | 1.79 | % | | | 4.65 | % |
Ratios to average net assets (annualized) | | | | | | | | | | | | | | | | | | | | |
Gross expenses | | | 0.77 | % | | | 0.76 | % | | | 0.77 | % | | | 0.77 | % | | | 0.77 | % |
Net expenses | | | 0.60 | % | | | 0.60 | % | | | 0.60 | % | | | 0.60 | % | | | 0.60 | % |
Net investment income | | | 1.75 | % | | | 1.69 | % | | | 1.90 | % | | | 2.14 | % | | | 2.72 | % |
Supplemental data | | | | | | | | | | | | | | | | | | | | |
Portfolio turnover rate | | | 21 | % | | | 31 | % | | | 31 | % | | | 32 | % | | | 56 | % |
Net assets, end of period (000s omitted) | | | $226,581 | | | | $309,120 | | | | $550,156 | | | | $388,872 | | | | $269,980 | |
The accompanying notes are an integral part of these financial statements.
| | | | |
| 32 | | Wells Fargo California Limited-Term Tax-Free Fund | | Financial highlights |
(For a share outstanding throughout each period)
| | | | | | | | |
| | | Year ended June 30 | |
| INSTITUTIONAL CLASS | | 2016 | | | 20151 | |
Net asset value, beginning of period | | | $10.66 | | | | $10.75 | |
Net investment income | | | 0.20 | | | | 0.13 | |
Net realized and unrealized gains (losses) on investments | | | 0.20 | | | | (0.09 | ) |
| | | | | | | | |
Total from investment operations | | | 0.40 | | | | 0.04 | |
Distributions to shareholders from | | | | | | | | |
Net investment income | | | (0.20 | ) | | | (0.13 | ) |
Net asset value, end of period | | | $10.86 | | | | $10.66 | |
Total return2 | | | 3.79 | % | | | 0.35 | % |
Ratios to average net assets (annualized) | | | | | | | | |
Gross expenses | | | 0.50 | % | | | 0.50 | % |
Net expenses | | | 0.50 | % | | | 0.50 | % |
Net investment income | | | 1.86 | % | | | 1.82 | % |
Supplemental data | | | | | | | | |
Portfolio turnover rate | | | 21 | % | | | 31 | % |
Net assets, end of period (000s omitted) | | | $351,080 | | | | $280,061 | |
| 1 | For the period from October 31, 2014 (commencement of class operations) to June 30, 2015 |
| 2 | Returns for periods of less than one year are not annualized. |
The accompanying notes are an integral part of these financial statements.
| | | | | | |
| Notes to financial statements | | Wells Fargo California Limited-Term Tax-Free Fund | | | 33 | |
1. ORGANIZATION
Wells Fargo Funds Trust (the “Trust”), a Delaware statutory trust organized on March 10, 1999, is an open-end management investment company registered under the Investment Company Act of 1940, as amended (the “1940 Act”). As an investment company, the Trust follows the accounting and reporting guidance in Financial Accounting Standards Board (“FASB”) Accounting Standards Codification Topic 946, Financial Services – Investment Companies. These financial statements report on the Wells Fargo California Limited-Term Tax-Free Fund (the “Fund”) which is a diversified series of the Trust.
2. SIGNIFICANT ACCOUNTING POLICIES
The following significant accounting policies, which are consistently followed in the preparation of the financial statements of the Fund, are in conformity with U.S. generally accepted accounting principles which require management to make estimates and assumptions that affect the reported amounts of assets and liabilities, disclosure of contingent assets and liabilities at the date of the financial statements, and the reported amounts of revenues and expenses during the reporting period. Actual results could differ from those estimates.
Securities valuation
All investments are valued each business day as of the close of regular trading on the New York Stock Exchange (generally 4 p.m. Eastern Time), although the Fund may deviate from this calculation time under unusual or unexpected circumstances.
Debt securities are valued at the evaluated bid price provided by an independent pricing service or, if a reliable price is not available, the quoted bid price from an independent broker-dealer.
Investments in registered open-end investment companies are valued at net asset value.
Investments which are not valued using any of the methods discussed above are valued at their fair value, as determined in good faith by the Board of Trustees of the Fund. The Board of Trustees has established a Valuation Committee comprised of the Trustees and has delegated to it the authority to take any actions regarding the valuation of portfolio securities that the Valuation Committee deems necessary or appropriate, including determining the fair value of portfolio securities, unless the determination has been delegated to the Management Valuation Team of Wells Fargo Funds Management, LLC (“Funds Management”). The Board of Trustees retains the authority to make or ratify any valuation decisions or approve any changes to the Valuation Procedures as it deems appropriate. On a quarterly basis, the Board of Trustees receives reports on any valuation actions taken by the Valuation Committee or the Management Valuation Team which may include items for ratification.
Valuations of fair valued securities are compared to the next actual sales price when available, or other appropriate market values, to assess the continued appropriateness of the fair valuation methodologies used. These securities are fair valued on a day-to-day basis, taking into consideration changes to appropriate market information and any significant changes to the inputs considered in the valuation process until there is a readily available price provided on an exchange or by an independent pricing service. Valuations received from an independent pricing service or independent broker-dealer quotes are periodically validated by comparisons to most recent trades and valuations provided by other independent pricing services in addition to the review of prices by the manager and/or subadviser. Unobservable inputs used in determining fair valuations are identified based on the type of security, taking into consideration factors utilized by market participants in valuing the investment, knowledge about the issuer and the current market environment.
When-issued transactions
The Fund may purchase securities on a forward commitment or when-issued basis. The Fund records a when-issued transaction on the trade date and will segregate assets in an amount at least equal in value to the Fund’s commitment to purchase when-issued securities. Securities purchased on a when-issued basis are marked-to-market daily and the Fund begins earning interest on the settlement date. Losses may arise due to changes in the market value of the underlying securities or if the counterparty does not perform under the contract.
Security transactions and income recognition
Securities transactions are recorded on a trade date basis. Realized gains or losses are recorded on the basis of identified cost.
Interest income is accrued daily and bond discounts are accreted and premiums are amortized daily based on the effective interest method. To the extent debt obligations are placed on non-accrual status, any related interest income may be reduced by writing off interest receivables when the collection of all or a portion of interest has become doubtful
| | | | |
| 34 | | Wells Fargo California Limited-Term Tax-Free Fund | | Notes to financial statements |
based on consistently applied procedures. If the issuer subsequently resumes interest payments or when the collectability of interest is reasonably assured, the debt obligation is removed from non-accrual status.
Distributions to shareholders
Distributions to shareholders from net investment income are accrued daily and paid monthly. Distributions from net realized gains, if any, are recorded on the ex-dividend date. Such distributions are determined in conformity with federal income tax regulations, which may differ in amount or character from net investment income and realized gains recognized for purposes of U.S. generally accepted accounting principles.
Federal and other taxes
The Fund intends to continue to qualify as a regulated investment company by distributing substantially all of its investment company taxable and tax-exempt income and any net realized capital gains (after reduction for capital loss carryforwards) sufficient to relieve it from all, or substantially all, federal income taxes. Accordingly, no provision for federal income taxes was required.
The Fund’s income and federal excise tax returns and all financial records supporting those returns for the prior three fiscal years are subject to examination by the federal and Delaware revenue authorities. Management has analyzed the Fund’s tax positions taken on federal, state, and foreign tax returns for all open tax years and does not believe that there are any uncertain tax positions that require recognition of a tax liability.
Reclassifications are made to the Fund’s capital accounts for permanent tax differences to reflect income and gains available for distribution (or available capital loss carryforwards) under federal income tax regulations. U.S. generally accepted accounting principles require that certain components of net assets be adjusted to reflect permanent differences between financial and tax reporting. These reclassifications have no effect on net assets or net asset values per share. At June 30, 2016, as a result of permanent book-to-tax differences, the following reclassification adjustments were made on the Statement of Assets and Liabilities:
| | |
Undistributed net investment income | | Accumulated net realized losses on investments |
| $5,759 | | $(5,759) |
As of June 30, 2016, the Fund had capital loss carryforwards available to offset future net realized capital gains in the amount of $844,942 with $734,586 expiring in 2018; $110,356 expiring in 2019.
Class allocations
The separate classes of shares offered by the Fund differ principally in applicable sales charges, distribution, shareholder servicing, and administration fees. Class specific expenses are charged directly to that share class. Investment income, common expenses, and realized and unrealized gains (losses) on investments are allocated daily to each class of shares based on the relative proportion of net assets of each class.
3. FAIR VALUATION MEASUREMENTS
Fair value measurements of investments are determined within a framework that has established a fair value hierarchy based upon the various data inputs utilized in determining the value of the Fund’s investments. The three-level hierarchy gives the highest priority to unadjusted quoted prices in active markets for identical assets or liabilities (Level 1) and the lowest priority to significant unobservable inputs (Level 3). The Fund’s investments are classified within the fair value hierarchy based on the lowest level of input that is significant to the fair value measurement. The inputs are summarized into three broad levels as follows:
| n | | Level 1 – quoted prices in active markets for identical securities |
| n | | Level 2 – other significant observable inputs (including quoted prices for similar securities, interest rates, prepayment speeds, credit risk, use of amortized cost, etc.) |
| n | | Level 3 – significant unobservable inputs (including the Fund’s own assumptions in determining the fair value of investments) |
The inputs or methodologies used for valuing investments in securities are not necessarily an indication of the risk associated with investing in those securities.
| | | | | | |
| Notes to financial statements | | Wells Fargo California Limited-Term Tax-Free Fund | | | 35 | |
The following is a summary of the inputs used in valuing the Fund’s assets and liabilities as of June 30, 2016:
| | | | | | | | | | | | | | | | |
| | | Quoted prices
(Level 1) | | | Other significant
observable inputs
(Level 2) | | | Significant
unobservable inputs (Level 3) | | | Total | |
Assets | | | | | | | | | | | | | | | | |
Investments in: | | | | | | | | | | | | | | | | |
| | | | |
Municipal obligations | | $ | 0 | | | $ | 803,435,609 | | | $ | 0 | | | $ | 803,435,609 | |
| | | | |
Other | | | 0 | | | | 2,490,300 | | | | 0 | | | | 2,490,300 | |
| | | | |
Short-term investments | | | | | | | | | | | | | | | | |
Investment companies | | | 4,095,697 | | | | 0 | | | | 0 | | | | 4,095,697 | |
Total assets | | $ | 4,095,697 | | | $ | 805,925,909 | | | $ | 0 | | | $ | 810,021,606 | |
The Fund recognizes transfers between levels within the fair value hierarchy at the end of the reporting period. At June 30, 2016, the Fund did not have any transfers into/out of Level 1, Level 2, or Level 3.
4. TRANSACTIONS WITH AFFILIATES
Management fee
Funds Management, an indirect wholly owned subsidiary of Wells Fargo & Company (“Wells Fargo”), is the manager of the Fund and provides advisory and fund-level administrative services under an investment management agreement. Under the investment management agreement, Funds Management is responsible for, among other services, implementing the investment objectives and strategies of the Fund, supervising the subadviser, providing fund-level administrative services in connection with the Fund’s operations, and providing any other fund-level administrative services reasonably necessary for the operation of the Fund. As compensation for its services under the investment management agreement, Funds Management is entitled to receive an annual management fee starting at 0.40% and declining to 0.28% as the average daily net assets of the Fund increase. For the year ended June 30, 2016, the management fee was equivalent to an annual rate of 0.39% of the Fund’s average daily net assets.
Funds Management has retained the services of a subadviser to provide daily portfolio management to the Fund. The fee for subadvisory services is borne by Funds Management. Wells Capital Management Incorporated, an affiliate of Funds Management and an indirect wholly owned subsidiary of Wells Fargo, is the subadviser to the Fund and is entitled to receive a fee from Funds Management at an annual rate starting at 0.15% and declining to 0.05% as the average daily net assets of the Fund increase.
Administration fees
Under a class-level administration agreement, Funds Management provides class-level administrative services to the Fund, which includes paying fees and expenses for services provided by the transfer agent, sub-transfer agents, omnibus account servicers and record-keepers. As compensation for its services under the class-level administration agreement, Funds Management receives an annual fee which is calculated based on the average daily net assets of each class as follows:
| | | | |
| | | Class-level
administration fee | |
Class A, Class C | | | 0.16 | % |
Administrator Class | | | 0.10 | |
Institutional Class | | | 0.08 | |
Funds Management has contractually waived and/or reimbursed management and administration fees to the extent necessary to maintain certain net operating expense ratios for the Fund. Waiver of fees and/or reimbursement of expenses by Funds Management were made first from fund level expenses on a proportionate basis and then from class specific expenses. Funds Management has committed through October 31, 2016 to waive fees and/or reimburse expenses to the extent necessary to cap the Fund’s expenses at 0.80% for Class A shares, 1.55% for Class C shares, 0.60% for Administrator Class shares, and 0.50% for Institutional Class shares. After this time, the cap may be increased or the commitment to maintain the cap may be terminated only with the approval of the Board of Trustees.
| | | | |
| 36 | | Wells Fargo California Limited-Term Tax-Free Fund | | Notes to financial statements |
Distribution fee
The Trust has adopted a distribution plan for Class C shares of the Fund pursuant to Rule 12b-1 under the 1940 Act. A distribution fee is charged to Class C shares and paid to Wells Fargo Funds Distributor, LLC (“Funds Distributor”), the principal underwriter, at an annual rate of 0.75% of the average daily net assets of Class C shares.
In addition, Funds Distributor is entitled to receive the front-end sales charge from the purchase of Class A shares and a contingent deferred sales charge on the redemption of certain Class A shares. Funds Distributor is also entitled to receive the contingent deferred sales charges from redemptions of Class C shares. For the year ended June 30, 2016, Funds Distributor received $2,844 from the sale of Class A shares.
Shareholder servicing fees
The Trust has entered into contracts with one or more shareholder servicing agents, whereby Class A, Class C, and Administrator Class of the Fund are charged a fee at an annual rate of 0.25% of the average daily net assets of each respective class.
A portion of these total shareholder servicing fees were paid to affiliates of Wells Fargo.
5. INVESTMENT PORTFOLIO TRANSACTIONS
Purchases and sales of investments, excluding U.S. government obligations (if any) and short-term securities, for the year ended June 30, 2016 were $161,189,004 and $169,274,132, respectively.
The Fund may purchase or sell investment securities to other Wells Fargo funds under procedures adopted by the Board of Trustees. The procedures have been designed to ensure that these interfund transactions, which generally do not incur broker commissions, are effected at current market prices. Interfund trades are included within the respective purchases and sales amounts shown.
6. BANK BORROWINGS
The Trust (excluding the money market funds and certain other funds) and Wells Fargo Variable Trust are parties to a $200,000,000 revolving credit agreement whereby the Fund is permitted to use bank borrowings for temporary or emergency purposes, such as to fund shareholder redemption requests. Interest under the credit agreement is charged to the Fund based on a borrowing rate equal to the higher of the Federal Funds rate in effect on that day plus 1.25% or the overnight LIBOR rate in effect on that day plus 1.25%. In addition, an annual commitment fee equal to 0.20% of the unused balance is allocated to each participating fund. Prior to September 1, 2015, the revolving credit agreement amount was $150,000,000 and the annual commitment fee was equal to 0.10% of the unused balance which was allocated to each participating fund.
For the year ended June 30, 2016, there were no borrowings by the Fund under the agreement.
7. DISTRIBUTIONS TO SHAREHOLDERS
The tax character of distributions paid was $13,668,017 and $14,078,386 of tax-exempt income for the years ended June 30, 2016 and June 30, 2015, respectively.
As of June 30, 2016, the components of distributable earnings on a tax basis were as follows:
| | | | |
Undistributed tax-exempt income | | Unrealized gains | | Capital loss carryforward |
| $947,238 | | $31,626,457 | | $(844,942) |
8. CONCENTRATION RISK
The Fund invests a substantial portion of its assets in issuers of municipal debt securities located in a single state or territories of the U.S. Therefore, it may be more affected by economic and political developments in that state or region than would be a comparable general tax-exempt fund.
9. INDEMNIFICATION
Under the Trust’s organizational documents, the officers and Trustees have been granted certain indemnification rights against certain liabilities that may arise out of performance of their duties to the Trust. Additionally, in the normal course of business, the Trust may enter into contracts with service providers that contain a variety of indemnification clauses. The Trust’s maximum exposure under these arrangements is dependent on future claims that may be made against the Fund and, therefore, cannot be estimated.
| | | | | | |
| Report of independent registered public accounting firm | | Wells Fargo California Limited-Term Tax-Free Fund | | | 37 | |
BOARD OF TRUSTEES AND SHAREHOLDERS OF WELLS FARGO FUNDS TRUST:
We have audited the accompanying statement of assets and liabilities, including the portfolio of investments, of the Wells Fargo California Limited-Term Tax-Free Fund (formerly known as Wells Fargo Advantage California Limited-Term Tax-Free Fund) (the “Fund”), one of the funds constituting the Wells Fargo Funds Trust, as of June 30, 2016, and the related statement of operations for the year then ended, the statements of changes in net assets for each of the years in the two-year period then ended, and the financial highlights for each of the years in the five-year period then ended. These financial statements and financial highlights are the responsibility of the Fund’s management. Our responsibility is to express an opinion on these financial statements and financial highlights based on our audits.
We conducted our audits in accordance with the standards of the Public Company Accounting Oversight Board (United States). Those standards require that we plan and perform the audit to obtain reasonable assurance about whether the financial statements and financial highlights are free of material misstatement. An audit includes examining, on a test basis, evidence supporting the amounts and disclosures in the financial statements. Our procedures included confirmation of securities owned as of June 30, 2016, by correspondence with custodians and brokers, or by other appropriate auditing procedures. An audit also includes assessing the accounting principles used and significant estimates made by management, as well as evaluating the overall financial statement presentation. We believe that our audits provide a reasonable basis for our opinion.
In our opinion, the financial statements and financial highlights referred to above present fairly, in all material respects, the financial position of the Wells Fargo California Limited-Term Tax-Free Fund (formerly known as Wells Fargo Advantage California Limited-Term Tax-Free Fund) as of June 30, 2016, the results of its operations for the year then ended, the changes in its net assets for each of the years in the two-year period then ended, and the financial highlights for each of the years in the five-year period then ended, in conformity with U.S. generally accepted accounting principles.

Boston, Massachusetts
August 25, 2016
| | | | |
| 38 | | Wells Fargo California Limited-Term Tax-Free Fund | | Other information (unaudited) |
TAX INFORMATION
For federal and California income tax purposes, the Fund designates 100% of its distributions paid from net investment income during the fiscal year as exempt-interest dividends under Section 852(b)(5) of the Internal Revenue Code and under Section 17145 of the California Revenue and Taxation Code.
PROXY VOTING INFORMATION
A description of the policies and procedures that the Fund uses to determine how to vote proxies relating to portfolio securities is available, upon request, by calling 1-800-222-8222, visiting our website at wellsfargofunds.com, or visiting the SEC website at sec.gov. Information regarding how the Fund voted proxies relating to portfolio securities during the most recent 12-month period ended June 30 is available on the Fund’s website at wellsfargofunds.com or by visiting the SEC website at sec.gov.
PORTFOLIO HOLDINGS INFORMATION
The complete portfolio holdings for the Fund are publicly available monthly on the Fund’s website (wellsfargofunds.com), on a one-month delayed basis. In addition, top ten holdings information (excluding derivative positions) for the Fund is publicly available on the Fund’s website on a monthly, seven-day or more delayed basis. The Fund files its complete schedule of portfolio holdings with the SEC for the first and third quarters of each fiscal year on Form N-Q, which is available by visiting the SEC website at sec.gov. In addition, the Fund’s Form N-Q may be reviewed and copied at the SEC’s Public Reference Room in Washington, DC, and at regional offices in New York City, at 233 Broadway, and in Chicago, at 175 West Jackson Boulevard, Suite 900. Information about the Public Reference Room may be obtained by calling 1-800-SEC-0330.
| | | | | | |
| Other information (unaudited) | | Wells Fargo California Limited-Term Tax-Free Fund | | | 39 | |
BOARD OF TRUSTEES AND OFFICERS
Each of the Trustees and Officers1 listed in the table below acts in identical capacities for each fund in the Wells Fargo family of funds, which consists of 142 mutual funds comprising the Wells Fargo Funds Trust, Wells Fargo Variable Trust, Wells Fargo Master Trust and four closed-end funds (collectively the “Fund Complex”). This table should be read in conjunction with the Prospectus and the Statement of Additional Information2. The mailing address of each Trustee and Officer is 525 Market Street, 12th Floor, San Francisco, CA 94105. Each Trustee and Officer serves an indefinite term, however, each Trustee serves such term until reaching the mandatory retirement age established by the Trustees.
Independent Trustees
| | | | | | |
Name and year of birth | | Position held and length of service* | | Principal occupations during past five years or longer | | Current other public
company or investment company
directorships |
William R. Ebsworth (Born 1957) | | Trustee, since 2015 | | Retired. From 1984 to 2013, equities analyst, portfolio manager, research director and chief financial officer at Fidelity Management and Research Company in Boston, Tokyo, and Hong Kong and retired in 2013 as Chief Investment Officer of Fidelity Strategic Advisers, Inc. where he lead a team of investment professionals managing client assets. Prior thereto, Board member of Hong Kong Securities Clearing Co., Hong Kong Options Clearing Corp., the Thailand International Fund, Ltd., Fidelity Investments Life Insurance Company, and Empire Fidelity Investments Life Insurance Company. Mr. Ebsworth is a CFA® charterholder and an Adjunct Lecturer, Finance, at Babson College. | | Asset Allocation Trust |
| Jane A. Freeman (Born 1953) | | Trustee, since 2015 | | Retired. From 2012 to 2014 and 1999 to 2008, Chief Financial Officer of Scientific Learning Corporation. From 2008 to 2012, Ms. Freeman provided consulting services related to strategic business projects. Prior to 1999, Portfolio Manager at Rockefeller & Co. and Scudder, Stevens & Clark. Board member of the Harding Loevner Funds from 1996 to 2014, serving as both Lead Independent Director and chair of the Audit Committee. Board member of the Russell Exchange Traded Funds Trust from 2011 to 2012 and the chair of the Audit Committee. Ms. Freeman is Chair of Taproot Foundation (non-profit organization), a Board Member of Ruth Bancroft Garden (non-profit organization) and an inactive chartered financial analyst. | | Asset Allocation Trust |
| Peter G. Gordon (Born 1942) | | Trustee, since 1998; Chairman, since 2005 | | Co-Founder, Retired Chairman, President and CEO of Crystal Geyser Water Company. Trustee Emeritus, Colby College. | | Asset Allocation Trust |
| Isaiah Harris, Jr. (Born 1952) | | Trustee, since 2009 | | Retired. Chairman of the Board of CIGNA Corporation since 2009, and Director since 2005. From 2003 to 2011, Director of Deluxe Corporation. Prior thereto, President and CEO of BellSouth Advertising and Publishing Corp. from 2005 to 2007, President and CEO of BellSouth Enterprises from 2004 to 2005 and President of BellSouth Consumer Services from 2000 to 2003. Emeritus member of the Iowa State University Foundation Board of Governors. Emeritus Member of the Advisory Board of Iowa State University School of Business. Advisory Board Member, Palm Harbor Academy (charter school). Advisory Board Member, Child Evangelism Fellowship (non-profit). Mr. Harris is a certified public accountant (inactive status). | | CIGNA Corporation; Asset Allocation Trust |
| Judith M. Johnson (Born 1949) | | Trustee, since 2008; Audit Committee Chairman, since 2008 | | Retired. Prior thereto, Chief Executive Officer and Chief Investment Officer of Minneapolis Employees Retirement Fund from 1996 to 2008. Ms. Johnson is an attorney, certified public accountant and a certified managerial accountant. | | Asset Allocation Trust |
| David F. Larcker (Born 1950) | | Trustee, since 2009 | | James Irvin Miller Professor of Accounting at the Graduate School of Business, Stanford University, Director of the Corporate Governance Research Initiative and Senior Faculty of The Rock Center for Corporate Governance since 2006. From 2005 to 2008, Professor of Accounting at the Graduate School of Business, Stanford University. Prior thereto, Ernst & Young Professor of Accounting at The Wharton School, University of Pennsylvania from 1985 to 2005. | | Asset Allocation Trust |
| | | | |
| 40 | | Wells Fargo California Limited-Term Tax-Free Fund | | Other information (unaudited) |
| | | | | | |
Name and year of birth | | Position held and length of service* | | Principal occupations during past five years or longer | | Current other public
company or investment company
directorships |
| Olivia S. Mitchell (Born 1953) | | Trustee, since 2006 | | International Foundation of Employee Benefit Plans Professor, Wharton School of the University of Pennsylvania since 1993. Director of Wharton’s Pension Research Council and Boettner Center on Pensions & Retirement Research, and Research Associate at the National Bureau of Economic Research. Previously, Cornell University Professor from 1978 to 1993. | | Asset Allocation Trust |
| Timothy J. Penny (Born 1951) | | Trustee, since 1996 | | President and Chief Executive Officer of Southern Minnesota Initiative Foundation, a non-profit organization, since 2007 and Senior Fellow at the Humphrey Institute Policy Forum at the University of Minnesota since 1995. Member of the Board of Trustees of NorthStar Education Finance, Inc., a non-profit organization, since 2007. | | Asset Allocation Trust |
| Michael S. Scofield (Born 1943) | | Trustee, since 2010 | | Served on the Investment Company Institute’s Board of Governors and Executive Committee from 2008-2011 as well the Governing Council of the Independent Directors Council from 2006-2011 and the Independent Directors Council Executive Committee from 2008-2011. Chairman of the IDC from 2008-2010. Institutional Investor (Fund Directions) Trustee of Year in 2007. Trustee of the Evergreen Funds complex (and its predecessors) from 1984 to 2010. Chairman of the Evergreen Funds from 2000-2010. Former Trustee of the Mentor Funds. Retired Attorney, Law Offices of Michael S. Scofield. | | Asset Allocation Trust |
| * | Length of service dates reflect the Trustee’s commencement of service with the Trust’s predecessor entities, where applicable. |
Officers
| | | | | | |
Name and year of birth | | Position held and
length of service | | Principal occupations during past five years or longer | | |
Karla M. Rabusch
(Born 1959) | | President, since 2003 | | Executive Vice President of Wells Fargo Bank, N.A. and President of Wells Fargo Funds Management, LLC since 2003. | | |
Nancy Wiser1
(Born 1967) | | Treasurer, since 2012 | | Executive Vice President of Wells Fargo Funds Management, LLC since 2011. Chief Operating Officer and Chief Compliance Officer at LightBox Capital Management LLC, from 2008 to 2011. | | |
C. David Messman
(Born 1960) | | Secretary, since 2000; Chief Legal Officer, since 2003 | | Senior Vice President and Secretary of Wells Fargo Funds Management, LLC since 2001. Assistant General Counsel of Wells Fargo Bank, N.A. since 2013 and Vice President and Managing Counsel of Wells Fargo Bank, N.A. from 1996 to 2013. | | |
Michael Whitaker
(Born 1967) | | Chief Compliance Officer, since 2016* | | Executive Vice President of Wells Fargo Funds Management, LLC since 2016. Chief Compliance Officer of Fidelity’s Fixed Income Funds and Asset Allocation Funds from 2008 to 2016, Compliance Officer of FMR Co., Inc. from 2014 to 2016, Fidelity Investments Money Management, Inc. from 2014 to 2016, Fidelity Investments from 2007 to 2016. | | |
David Berardi
(Born 1975) | | Assistant Treasurer, since 2009 | | Vice President of Wells Fargo Funds Management, LLC since 2009. Vice President of Evergreen Investment Management Company, LLC from 2008 to 2010. Manager of Fund Reporting and Control for Evergreen Investment Management Company, LLC from 2004 to 2010. | | |
Jeremy DePalma1
(Born 1974) | | Assistant Treasurer, since 2009 | | Senior Vice President of Wells Fargo Funds Management, LLC since 2009. Senior Vice President of Evergreen Investment Management Company, LLC from 2008 to 2010 and head of the Fund Reporting and Control Team within Fund Administration from 2005 to 2010. | | |
| 1 | Nancy Wiser acts as Treasurer of 73 funds in the Fund Complex. Jeremy DePalma acts as Treasurer of 69 funds and Assistant Treasurer of 73 funds in the Fund Complex. |
| 2 | The Statement of Additional Information includes additional information about the Trustees and is available, without charge, upon request, by calling 1-800-222-8222 or by visiting the website at wellsfargofunds.com. |
| * | Michael Whitaker became Chief Compliance Officer effective May 16, 2016. |
| | | | | | |
| Other information (unaudited) | | Wells Fargo California Limited-Term Tax-Free Fund | | | 41 | |
BOARD CONSIDERATION OF INVESTMENT MANAGEMENT AND SUB-ADVISORY AGREEMENTS:
Under the Investment Company Act of 1940 (the “1940 Act”), the Board of Trustees (the “Board”) of Wells Fargo Funds Trust (the “Trust”) must determine annually whether to approve the continuation of the Trust’s investment management and sub-advisory agreements. In this regard, at an in-person meeting held on May 24-25, 2016 (the “Meeting”), the Board, all the members of which have no direct or indirect interest in the investment management and sub-advisory agreements and are not “interested persons” of the Trust, as defined in the 1940 Act (the “Independent Trustees”), reviewed and approved for Wells Fargo California Limited-Term Tax-Free Fund (the “Fund”): (i) an investment management agreement (the “Management Agreement”) with Wells Fargo Funds Management, LLC (“Funds Management”); and (ii) an investment sub-advisory agreement (the “Sub-Advisory Agreement”) with Wells Capital Management Incorporated (the “Sub-Adviser”), an affiliate of Funds Management. The Management Agreement and the Sub-Advisory Agreement are collectively referred to as the “Advisory Agreements.”
At the Meeting, the Board considered the factors and reached the conclusions described below relating to the selection of Funds Management and the Sub-Adviser and the approval of the Advisory Agreements. Prior to the Meeting, including at an in-person meeting in April 2016, the Trustees conferred extensively among themselves and with representatives of Funds Management about these matters. Also, the Board has adopted a team-based approach, with each team consisting of a sub-set of Trustees, to assist the full Board in the discharge of its duties in reviewing performance and other matters throughout the year. The Independent Trustees were assisted in their evaluation of the Advisory Agreements by independent legal counsel, from whom they received separate legal advice and with whom they met separately.
In providing information to the Board, Funds Management and the Sub-Adviser were guided by a detailed set of requests for information submitted to them by independent legal counsel on behalf of the Independent Trustees at the start of the Board’s annual contract renewal process earlier in 2016. In considering and approving the Advisory Agreements, the Trustees considered the information they believed relevant, including but not limited to the information discussed below. The Board considered not only the specific information presented in connection with the Meeting, but also the knowledge gained over time through interaction with Funds Management and the Sub-Adviser about various topics. In this regard, the Board reviewed reports of Funds Management at each of its quarterly meetings, which included, among other things, portfolio reviews and performance reports. In addition, the Board and the teams mentioned above confer with portfolio managers at various times throughout the year. The Board did not identify any particular information or consideration that was all-important or controlling, and each individual Trustee may have attributed different weights to various factors.
After its deliberations, the Board unanimously approved the continuation of the Advisory Agreements for a one-year term and determined that the compensation payable to Funds Management and the Sub-Adviser under each of the Advisory Agreements was reasonable. The Board considered the approval of the Advisory Agreements for the Fund as part of its consideration of agreements for funds across the complex, but its approvals were made on a fund-by-fund basis. The following summarizes a number of important, but not necessarily all, factors considered by the Board in support of its approvals.
Nature, extent and quality of services
The Board received and considered various information regarding the nature, extent and quality of services provided to the Fund by Funds Management and the Sub-Adviser under the Advisory Agreements. This information included a description of the investment advisory services and Fund-level administrative services covered by the Management Agreement, as well as, among other things, a summary of the background and experience of senior management of Funds Management, and the qualifications, background, tenure and responsibilities of each of the portfolio managers primarily responsible for the day-to-day portfolio management of the Fund.
The Board evaluated the ability of Funds Management and the Sub-Adviser to attract and retain qualified investment professionals, including research, advisory and supervisory personnel. The Board further considered the compliance programs and compliance records of Funds Management and the Sub-Adviser. In addition, the Board took into account the full range of services provided to the Fund by Funds Management and its affiliates.
Fund performance and expenses
The Board considered the performance results for the Fund over various time periods ended December 31, 2015. The Board considered these results in comparison to the performance of funds in a universe that was determined by Broadridge Inc. (“Broadridge”) to be similar to the Fund (the “Universe”), and in comparison to the Fund’s benchmark index and to other comparative data. Broadridge is an independent provider of investment company data. The Board received a description of the methodology used by Broadridge to select the mutual funds in the performance Universe.
| | | | |
| 42 | | Wells Fargo California Limited-Term Tax-Free Fund | | Other information (unaudited) |
The Board noted that the performance of the Fund (Administrator Class) was higher than the average performance of the Universe for all periods under review. The Board also noted that the performance of the Fund was higher than its benchmark, the Barclays Municipal Bond 1-5 Year Blend Index, for all periods under review.
The Board also received and considered information regarding the Fund’s net operating expense ratios and their various components, including actual management fees, custodian and other non-management fees, and Rule 12b-1 and non-Rule 12b-1 shareholder service fees. The Board considered these ratios in comparison to the median ratios of funds in class-specific expense groups that were determined by Broadridge to be similar to the Fund (the “Groups”). The Board received a description of the methodology used by Broadridge to select the mutual funds in the expense Groups and an explanation of how funds comprising expense groups and their expense ratios may vary from year-to-year. Based on the Broadridge reports, the Board noted that the net operating expense ratios of the Fund were lower than,in range of, or equal to the median net operating expense ratios of the expense Groups.
The Board took into account the Fund performance and expense information provided to it among the factors considered in deciding to re-approve the Advisory Agreements.
Investment management and sub-advisory fee rates
The Board reviewed and considered the contractual fee rates payable by the Fund to Funds Management under the Management Agreement, as well as the contractual fee rates payable by the Fund to Funds Management for class-level administrative services under a Class-Level Administration Agreement, which include class-level transfer agency and sub-transfer agency costs (collectively, the “Management Rates”). The Board also reviewed and considered the contractual investment sub-advisory fee rates that are payable by Funds Management to the Sub-Adviser for investment sub-advisory services.
Among other information reviewed by the Board was a comparison of the Fund’s Management Rates with the average contractual investment management fee rates of funds in the expense Groups at a common asset level as well as transfer agency costs of the funds in the expense Groups. The Board noted that the Management Rates of the Fund were lower than or in range of the sum of these average rates for the Fund’s expense Groups for all share classes.
The Board also received and considered information about the portion of the total management fee that was retained by Funds Management after payment of the fee to the Sub-Adviser for sub-advisory services. In assessing the reasonableness of this amount, the Board received and evaluated information about the nature and extent of responsibilities retained and risks assumed by Funds Management and not delegated to or assumed by the Sub-Adviser, and about Funds Management’s on-going oversight services. However, given the affiliation between Funds Management and the Sub-Adviser, the Board ascribed limited relevance to the allocation of fees between them.
The Board also received and considered information about the nature and extent of services offered and fee rates charged by Funds Management and the Sub-Adviser to other types of clients with investment strategies similar to those of the Fund. In this regard, the Board received information about the significantly greater scope of services, and compliance, reporting and other legal burdens and risks of managing mutual funds compared with those associated with managing assets of non-mutual fund clients such as collective funds or institutional separate accounts.
Based on its consideration of the factors and information it deemed relevant, including those described here, the Board determined that the compensation payable to Funds Management under the Management Agreement and to the Sub-Adviser under the Sub-Advisory Agreement was reasonable, in light of the services covered by the Advisory Agreements.
Profitability
The Board received and considered information concerning the profitability of Funds Management, as well as the profitability of Wells Fargo as a whole, from providing services to the Fund and the fund family as a whole. The Board also received and considered information concerning the profitability of the Sub-Adviser from providing services to the fund family as a whole, noting that the Sub-Adviser’s profitability information with respect to providing services to the Fund was subsumed in the Wells Fargo and Funds Management profitability analysis.
Funds Management reported on the methodologies and estimates used in calculating profitability. Among other things, the Board noted that the levels of profitability reported on a fund-by-fund basis varied widely, depending on factors such as the size and type of fund. Based on its review, the Board did not deem the profits reported by Funds Management or Wells Fargo from its services to the Fund to be at a level that would prevent it from approving the continuation of the Advisory Agreements.
| | | | | | |
| Other information (unaudited) | | Wells Fargo California Limited-Term Tax-Free Fund | | �� | 43 | |
Economies of scale
With respect to possible economies of scale, the Board noted the existence of breakpoints in the Fund’s management fee structure, which operate generally to reduce the Fund’s expense ratios as the Fund grows in size. It considered that, for a small fund or a fund that shrinks in size, breakpoints conversely can result in higher fee levels. The Board also considered that fee waiver and expense reimbursement arrangements and competitive fee rates at the outset are means of sharing potential economies of scale with shareholders of the Fund and the fund family as a whole. The Board considered Funds Management’s view that any analyses of potential economies of scale in managing a particular fund are inherently limited in light of the joint and common costs and investments that Funds Management incurs across the fund family as a whole.
The Board concluded that the Fund’s fee and expense arrangements, including contractual breakpoints, constituted a reasonable approach to sharing potential economies of scale with the Fund and its shareholders.
Other benefits to Funds Management and the Sub-Adviser
The Board received and considered information regarding potential “fall-out” or ancillary benefits received by Funds Management and its affiliates, including the Sub-Adviser, as a result of their relationships with the Fund. Ancillary benefits could include, among others, benefits directly attributable to other relationships with the Fund and benefits potentially derived from an increase in Funds Management’s and the Sub-Adviser’s business as a result of their relationships with the Fund. The Board noted that various affiliates of Funds Management may receive distribution-related fees, shareholder servicing payments and sub-transfer agency fees in respect of shares sold or held through them and services provided.
The Board also reviewed information about soft dollar credits earned and utilized by the Sub-Adviser, fees earned by Funds Management and the Sub-Adviser from managing a private investment vehicle for the fund family’s securities lending collateral and commissions earned by an affiliated broker from portfolio transactions.
Based on its consideration of the factors and information it deemed relevant, including those described here, the Board did not find that any ancillary benefits received by Funds Management and its affiliates, including the Sub-Adviser, were unreasonable.
Conclusion
At the Meeting, after considering the above-described factors and based on its deliberations and its evaluation of the information described above, the Board unanimously approved the continuation of the Advisory Agreements for a one-year term and determined that the compensation payable to Funds Management and the Sub-Adviser under each of the Advisory Agreements was reasonable.
| | | | |
| 44 | | Wells Fargo California Limited-Term Tax-Free Fund | | List of abbreviations |
The following is a list of common abbreviations for terms and entities that may have appeared in this report.
| ACA | — ACA Financial Guaranty Corporation |
| ADR | — American depositary receipt |
| ADS | — American depositary shares |
| AGC | — Assured Guaranty Corporation |
| AGM | — Assured Guaranty Municipal |
| Ambac | — Ambac Financial Group Incorporated |
| AMT | — Alternative minimum tax |
| BAN | — Bond anticipation notes |
| BHAC | — Berkshire Hathaway Assurance Corporation |
| CAB | — Capital appreciation bond |
| CCAB | — Convertible capital appreciation bond |
| CDA | — Community Development Authority |
| CDO | — Collateralized debt obligation |
| DRIVER | — Derivative inverse tax-exempt receipts |
| DW&P | — Department of Water & Power |
| DWR | — Department of Water Resources |
| ECFA | — Educational & Cultural Facilities Authority |
| EDA | — Economic Development Authority |
| EDFA | — Economic Development Finance Authority |
| ETF | — Exchange-traded fund |
| FDIC | — Federal Deposit Insurance Corporation |
| FFCB | — Federal Farm Credit Banks |
| FGIC | — Financial Guaranty Insurance Corporation |
| FHA | — Federal Housing Administration |
| FHLB | — Federal Home Loan Bank |
| FHLMC | — Federal Home Loan Mortgage Corporation |
| FICO | — The Financing Corporation |
| FNMA | — Federal National Mortgage Association |
| GDR | — Global depositary receipt |
| GNMA | — Government National Mortgage Association |
| HCFR | — Healthcare facilities revenue |
| HEFA | — Health & Educational Facilities Authority |
| HEFAR | — Higher education facilities authority revenue |
| HFA | — Housing Finance Authority |
| HFFA | — Health Facilities Financing Authority |
| HUD | — Department of Housing and Urban Development |
| IDA | — Industrial Development Authority |
| IDAG | — Industrial Development Agency |
| KRW | — Republic of Korea won |
| LIBOR | — London Interbank Offered Rate |
| LIFER | — Long Inverse Floating Exempt Receipts |
| LLC | — Limited liability company |
| LLLP | — Limited liability limited partnership |
| LLP | — Limited liability partnership |
| MBIA | — Municipal Bond Insurance Association |
| MFHR | — Multifamily housing revenue |
| MSTR | — Municipal securities trust receipts |
| MUD | — Municipal Utility District |
| National | — National Public Finance Guarantee Corporation |
| PCFA | — Pollution Control Financing Authority |
| PCL | — Public Company Limited |
| PCR | — Pollution control revenue |
| PFA | — Public Finance Authority |
| PFFA | — Public Facilities Financing Authority |
| PFOTER | — Puttable floating option tax-exempt receipts |
| plc | — Public limited company |
| PUTTER | — Puttable tax-exempt receipts |
| R&D | — Research & development |
| Radian | — Radian Asset Assurance |
| RAN | — Revenue anticipation notes |
| RDA | — Redevelopment Authority |
| RDFA | — Redevelopment Finance Authority |
| REIT | — Real estate investment trust |
| ROC | — Reset option certificates |
| SAVRS | — Select auction variable rate securities |
| SBA | — Small Business Authority |
| SDR | — Swedish depositary receipt |
| SFHR | — Single-family housing revenue |
| SFMR | — Single-family mortgage revenue |
| SPA | — Standby purchase agreement |
| SPDR | — Standard & Poor’s Depositary Receipts |
| SPEAR | — Short Puttable Exempt Adjustable Receipts |
| STRIPS | — Separate trading of registered interest and |
| TAN | — Tax anticipation notes |
| TIPS | — Treasury inflation-protected securities |
| TRAN | — Tax revenue anticipation notes |
| TTFA | — Transportation Trust Fund Authority |
| TVA | — Tennessee Valley Authority |

For more information
More information about Wells Fargo Funds is available free upon request. To obtain literature, please write, email, visit the Fund’s website, or call:
Wells Fargo Funds
P.O. Box 8266
Boston, MA 02266-8266
Email: fundservice@wellsfargo.com
Website: wellsfargofunds.com
Individual investors: 1-800-222-8222
Retail investment professionals: 1-888-877-9275
Institutional investment professionals: 1-866-765-0778
This report and the financial statements contained herein are submitted for the general information of the shareholders of the Fund. If this report is used for promotional purposes, distribution of the report must be accompanied or preceded by a current prospectus. Before investing, please consider the investment objectives, risks, charges, and expenses of the investment. For a current prospectus and, if available, a summary prospectus, containing this information, call 1-800-222-8222 or visit the Fund’s website at wellsfargofunds.com. Read the prospectus carefully before you invest or send money.
Wells Fargo Asset Management (WFAM) is a trade name used by the asset management businesses of Wells Fargo & Company. Wells Fargo Funds Management, LLC, a wholly owned subsidiary of Wells Fargo & Company, provides investment advisory and administrative services for Wells Fargo Funds. Other affiliates of Wells Fargo & Company provide subadvisory and other services for the funds. The funds are distributed by Wells Fargo Funds Distributor, LLC, Member FINRA, an affiliate of Wells Fargo & Company.
NOT FDIC INSURED ¡ NO BANK GUARANTEE ¡ MAY LOSE VALUE
© 2016 Wells Fargo Funds Management, LLC. All rights reserved.
| | |
 | | 244400 08-16 A248/AR248 6-16 |
Annual Report
June 30, 2016

Wells Fargo California Tax-Free Fund


Reduce clutter. Save trees.
Sign up for electronic delivery of prospectuses and shareholder reports at wellsfargo.com/advantagedelivery
Contents
The views expressed and any forward-looking statements are as of June 30, 2016, unless otherwise noted, and are those of the Fund managers and/or Wells Fargo Funds Management, LLC. Discussions of individual securities, or the markets generally, or any Wells Fargo Fund are not intended as individual recommendations. Future events or results may vary significantly from those expressed in any forward-looking statements. The views expressed are subject to change at any time in response to changing circumstances in the market. Wells Fargo Funds Management, LLC and the Fund disclaim any obligation to publicly update or revise any views expressed or forward-looking statements.
NOT FDIC INSURED ¡ NO BANK GUARANTEE ¡ MAY LOSE VALUE
| | | | |
| 2 | | Wells Fargo California Tax-Free Fund | | Letter to shareholders (unaudited) |

Karla M. Rabusch
President
Wells Fargo Funds
In fact, yields on municipal bonds that matured in 10 years or more experienced yield declines of more than 100 basis points (100 basis points equals 1.00%) during the reporting period.
Dear Valued Shareholder:
We are pleased to offer you this annual report for the Wells Fargo California Tax-Free Fund for the 12-month period that ended June 30, 2016. The U.S. Federal Reserve (Fed) began normalizing monetary policy, raising the federal funds rate to between 0.25% and 0.50% in December 2015. Short-term municipal bond yields rose, but yields on longer-term bonds declined. In fact, yields on municipal bonds that matured in 10 years or more experienced yield declines of more than 100 basis points (100 basis points equals 1.00%) during the reporting period. The Barclays Municipal Bond Index,1 a broad measure tracking investment-grade municipal bonds, returned 7.65% during the 12-month reporting period.
Monetary policy was accommodative.
The Fed continued an easy monetary policy in order to support the economy and the financial system. However, it raised the federal funds target rate in December because it believed the U.S. economy was strong enough to begin normalizing monetary policy. The European Central Bank cut all three of its short-term rates during the reporting period, increased its asset-purchase program from 60 billion euros per month to 80 billion, expanded the list of eligible securities to include investment-grade nonbank debt, and created a fund-to-lend program where banks could be paid to lend money. In Japan, the Bank of Japan maintained an aggressive monetary program aimed at combating deflation.
Despite accommodative central-bank policies that helped keep interest rates at ultra-low levels, there were periods of volatility. Early in 2016, weakness in certain emerging markets economies and commodities hurt riskier assets and a vote in June 2016 by the U.K. to exit the European Union set off another round of global uncertainty. Municipal bonds benefited because they are perceived as a safe-haven asset. In addition, investor demand for yield helped lower-rated debt outperform. The Barclays High Yield Municipal Bond Index2 returned 12.09% during the 12-month period that ended June 30, 2016.
Strong demand, modest supply, and solid credit fundamentals supported municipals.
Market technicals remained favorable. According to the Investment Company Institute, more than $33 billion was allocated to municipal mutual funds during the first half of 2016, which was more than double the inflows during all of 2015. Further, inflows during the second quarter of 2016 were the largest in nearly seven years. In contrast, less new supply helped make 2015 the fifth calendar year of negative net supply and supply in the first half of 2016 was about 4% less than the same period last year.
Municipal credit quality remained on an uptrend despite a number of high-profile negative credit situations. Idiosyncratic credit risks remain, however. With regard to Puerto Rico, the U.S. enacted legislation that prohibits bondholder lawsuits temporarily and instills a fiscal oversight board for Puerto Rico; Puerto Rico then declared a moratorium on paying its general obligation (GO) bonds and defaulted on $911 million in payments due (most of which were GOs) on July 1, 2016. The state of Illinois approved a six-month stopgap budget, a temporary but meaningful
| 1 | The Barclays Municipal Bond Index is an unmanaged index composed of long-term tax-exempt bonds with a minimum credit rating of Baa. You cannot invest directly in an index. |
| 2 | The Barclays High Yield Municipal Bond Index measures the non-investment-grade and nonrated U.S. dollar–denominated, fixed-rate, tax-exempt bond market within the 50 United States and four other qualifying regions (Washington, D.C.; Puerto Rico; Guam; and the Virgin Islands). The index allows state and local general obligation, revenue, insured, and prerefunded bonds; however, historically the index has been composed of mostly revenue bonds. You cannot invest directly in an index. |
| | | | | | |
| Letter to shareholders (unaudited) | | Wells Fargo California Tax-Free Fund | | | 3 | |
step. Under this stopgap budget for the state, the city of Chicago receives authority to raise property taxes for teacher pensions and low-income school districts would receive greater state funding. City of Chicago and school district debt rallied on the news.
Since the end of the financial crisis, structural changes in the fixed-income markets have reduced trading liquidity (the degree to which assets can be bought or sold without affecting the price). New regulations and capital requirements have caused traditional liquidity suppliers (banks and broker/dealers) to be more risk-averse and hold less inventory. Meanwhile, corporate-debt issuance has spiked as companies finance themselves at record-low yields, bond mutual funds hold larger amounts of this new debt supply, trading volumes are lower, and large trades are more difficult to execute. However, fixed-income markets appear to have functioned well over the past year with sufficient liquidity.
Don’t let short-term uncertainty derail long-term investment goals.
Periods of uncertainty can present challenges, but experience has taught us that maintaining long-term investment goals can be an effective way to plan for the future. To help you create a sound strategy based on your personal goals and risk tolerance, Wells Fargo Funds offers more than 100 mutual funds spanning a wide range of asset classes and investment styles. Although diversification cannot guarantee an investment profit or prevent losses, we believe it can be an effective way to manage investment risk and potentially smooth out overall portfolio performance. We encourage investors to know their investments and to understand that appropriate levels of risk-taking may unlock opportunities.
Thank you for choosing to invest in Wells Fargo Funds. We appreciate your confidence in us and remain committed to helping you meet your financial needs.
Sincerely,

Karla M. Rabusch
President
Wells Fargo Funds
Periods of uncertainty can present challenges, but experience has taught us that maintaining long-term investment goals can be an effective way to plan for the future.
For further information about your Fund, contact your investment professional, visit our website at wellsfargofunds.com, or call us directly at 1-800-222-8222. We are available 24 hours a day, 7 days a week.
| | | | |
| 4 | | Wells Fargo California Tax-Free Fund | | Performance highlights (unaudited) |
Investment objective
The Fund seeks current income exempt from federal income tax and California individual income tax.
Manager
Wells Fargo Funds Management, LLC
Subadviser
Wells Capital Management Incorporated
Portfolio managers
Terry J. Goode
Robert J. Miller
Adrian Van Poppel
Average annual total returns (%) as of June 30, 20161
| | | | | | | | | | | | | | | | | | | | | | | | | | | | | | | | | | |
| | | | | Including sales charge | | | Excluding sales charge | | | Expense ratios2 (%) | |
| | | Inception date | | 1 year | | | 5 year | | | 10 year | | | 1 year | | | 5 year | | | 10 year | | | Gross | | | Net3 | |
| Class A (SCTAX) | | 10-6-1988 | | | 3.83 | | | | 6.07 | | | | 4.92 | | | | 8.77 | | | | 7.06 | | | | 5.40 | | | | 0.83 | | | | 0.75 | |
| Class B (SGCBX)* | | 12-15-1997 | | | 3.10 | | | | 5.96 | | | | 4.86 | | | | 8.10 | | | | 6.28 | | | | 4.86 | | | | 1.58 | | | | 1.50 | |
| Class C (SCTCX) | | 7-1-1993 | | | 7.02 | | | | 6.26 | | | | 4.62 | | | | 8.02 | | | | 6.26 | | | | 4.62 | | | | 1.58 | | | | 1.50 | |
| Administrator Class (SGCAX) | | 12-15-1997 | | | – | | | | – | | | | – | | | | 9.06 | | | | 7.28 | | | | 5.63 | | | | 0.77 | | | | 0.55 | |
| Institutional Class (SGTIX) | | 10-31-2014 | | | – | | | | – | | | | – | | | | 9.14 | | | | 7.30 | | | | 5.64 | | | | 0.50 | | | | 0.48 | |
| Barclays Municipal Bond Index4 | | – | | | – | | | | – | | | | – | | | | 7.65 | | | | 5.33 | | | | 5.13 | | | | – | | | | – | |
| Barclays California Municipal Bond Index5 | | – | | | – | | | | – | | | | – | | | | 7.70 | | | | 6.10 | | | | 5.38 | | | | – | | | | – | |
| * | | Class B shares are closed to investment, except in connection with the reinvestment of any distributions and permitted exchanges. |
Figures quoted represent past performance, which is no guarantee of future results, and do not reflect taxes that a shareholder may pay on fund distributions or the redemption of fund shares. Investment return and principal value of an investment will fluctuate so that an investor’s shares, when redeemed, may be worth more or less than their original cost. Performance shown without sales charges would be lower if sales charges were reflected. Current performance may be lower or higher than the performance data quoted, which assumes the reinvestment of dividends and capital gains. Current month-end performance is available on the Fund’s website, wellsfargofunds.com.
Index returns do not include transaction costs associated with buying and selling securities, any mutual fund fees or expenses, or any taxes. It is not possible to invest directly in an index.
For Class A shares, the maximum front-end sales charge is 4.50%. For Class B shares, the maximum contingent deferred sales charge is 5.00%. For Class C shares, the maximum contingent deferred sales charge is 1.00%. Performance including a contingent deferred sales charge assumes the sales charge for the corresponding time period. Administrator Class and Institutional Class shares are sold without a front-end sales charge or contingent deferred sales charge.
Bond values fluctuate in response to the financial condition of individual issuers, general market and economic conditions, and changes in interest rates. Changes in market conditions and government policies may lead to periods of heightened volatility in the bond market and reduced liquidity for certain bonds held by the Fund. In general, when interest rates rise, bond values fall and investors may lose principal value. Interest-rate changes and their impact on the Fund and its share price can be sudden and unpredictable. The use of derivatives may reduce returns and/or increase volatility. Certain investment strategies tend to increase the total risk of an investment (relative to the broader market). The Fund is exposed to California municipal securities risk, high-yield securities risk, and non-diversification risk. Consult the Fund’s prospectus for additional information on these and other risks. A portion of the Fund’s income may be subject to federal, state, and/or local income taxes or the Alternative Minimum Tax (AMT). Any capital gains distributions may be taxable.
Please see footnotes on page 5.
| | | | | | |
| Performance highlights (unaudited) | | Wells Fargo California Tax-Free Fund | | | 5 | |
|
| Growth of $10,000 investment as of June 30, 20166 |
|
 |
| 1 | Historical performance shown for the Institutional Class shares prior to their inception reflects the performance of the Administrator Class shares, and is not adjusted to reflect the Institutional Class expenses. If these expenses had been included, returns for the Institutional Class would be higher. |
| 2 | Reflects the expense ratios as stated in the most recent prospectuses. The expense ratios shown are subject to change and may differ from the annualized expense ratios shown in the financial highlights of this report. |
| 3 | The manager has contractually committed through October 31, 2016, to waive fees and/or reimburse expenses to the extent necessary to cap the Fund’s Total Annual Fund Operating Expenses After Fee Waiver at the amounts shown. After this time, the cap may be increased or the commitment to maintain the cap may be terminated only with the approval of the Board of Trustees. Brokerage commissions, stamp duty fees, interest, taxes, acquired fund fees and expenses, and extraordinary expenses are excluded from the expense cap. Without this cap, the Fund’s returns would have been lower. |
| 4 | The Barclays Municipal Bond Index is an unmanaged index composed of long-term tax-exempt bonds with a minimum credit rating of Baa. You cannot invest directly in an index. |
| 5 | The Barclays California Municipal Bond Index is the California component of the Barclays Municipal Bond Index. You cannot invest directly in an index. |
| 6 | The chart compares the performance of Class A shares for the most recent ten years with the Barclays Municipal Bond Index and the Barclays California Municipal Bond Index. The chart assumes a hypothetical $10,000 investment in Class A shares and reflects all operating expenses and assumes the maximum initial sales charge of 4.50%. |
| 7 | Amounts are calculated based on the total long-term investments of the Fund. These amounts are subject to change and may have changed since the date specified. |
| 8 | The credit quality distribution of portfolio holdings reflected in the chart is based on ratings from Standard & Poor’s, Moody’s Investors Service, and/ or Fitch Ratings Ltd. Credit quality ratings apply to the underlying holdings of the Fund and not to the Fund itself. The percentages of the Fund’s portfolio with the ratings depicted in the chart are calculated based on the total market value of fixed income securities held by the Fund. If a security was rated by all three rating agencies, the middle rating was utilized. If rated by two of three rating agencies, the lower rating was utilized, and if rated by one of the rating agencies, that rating was utilized. Standard & Poor’s rates the creditworthiness of bonds, ranging from AAA (highest) to D (lowest). Ratings from A to CCC may be modified by the addition of a plus (+) or minus (-) sign to show relative standing within the rating categories. Standard & Poor’s rates the creditworthiness of short-term notes from SP-1 (highest) to SP-3 (lowest). Moody’s rates the creditworthiness of bonds, ranging from Aaa (highest) to C (lowest). Ratings Aa to B may be modified by the addition of a number 1 (highest) to 3 (lowest) to show relative standing within the ratings categories. Moody’s rates the creditworthiness of short-term U.S. tax-exempt municipal securities from MIG 1/VMIG 1 (highest) to SG (lowest). Fitch rates the creditworthiness of bonds, ranging from AAA (highest) to D (lowest). Credit quality distribution is subject to change and may have changed since the date specified. |
| | | | |
| 6 | | Wells Fargo California Tax-Free Fund | | Performance highlights (unaudited) |
MANAGER’S DISCUSSION
Fund highlights
| n | | The Fund outperformed both its benchmarks, the Barclays Municipal Bond Index and the Barclays California Municipal Bond Index, for the 12-month period that ended June 30, 2016. |
| n | | Security selection was the biggest contributor to the Fund’s outperformance, followed by duration and credit. The Fund’s exposure to the highest-quality segment underperformed that of the index, but its overweight to A-rated and BBB-rated bonds benefited from spread tightening as investors continued their search for income. Additionally, zero-coupon and 4%-coupon bonds were among the best performers during the period. |
| n | | Fear of a global economic slowdown and mixed economic data within the U.S. pushed Treasury and municipal yields sharply lower and flattened both curves. |
Ultralow yields continued throughout the period
With the U.S. Federal Reserve (Fed) poised to normalize its interest-rate policy, shorter-term maturities appeared less attractive at the beginning of the reporting period due to a potential backup in short-term yields. However, subdued inflation expectations, due in part to low oil prices, combined with a fragile European economy and softening Chinese economy, implied that longer maturities would outperform. Therefore, early in the period, we extended the Fund’s duration in anticipation of lower yields and positioned the Fund for a flatter yield curve. The Fund’s yield-curve positioning, which was underweight short-term and intermediate-term maturities and overweight long-term maturities, helped results. Longer-term maturities outperformed shorter-term maturities by a wide margin because the municipal curve flattened almost 150 basis points (bps; 100 bps equals 1.00%) between the 2- and 30-year maturities.
|
| Effective maturity distribution as of June 30, 20167 |
|
 |
The Fed tightened in December 2015 but signaled that the pace of further increases would be gradual. While the Fed was likely to take its time raising rates, U.S. inflation started to trend higher, unemployment remained below 5%, and economic growth was expected to remain at or above 2%. We kept the Fund’s duration longer than the benchmark’s and held more stable structured bonds. In addition to the flight-to-quality trade in Treasuries, municipals were also supported by the combination of strong demand from positive fund flows and lighter new-issue supply. The Fund benefited as 30-year municipals rallied almost 90 bps from the December 2015 Fed tightening until the end of the period.
|
| Credit quality as of June 30, 20168 |
|
 |
The Fund’s overweight to bonds rated A and below contributed to results as lower-rated bonds outperformed higher-quality bonds by a wide margin. The Fund’s overweight to the local general obligation, special tax, and lease revenue sectors performed well. Although the industrial development revenue/pollution control revenue and resource recovery sectors were among the best-performing sectors in the index, our issue selection within those sectors detracted from results. Additionally, we added longer-term, 4%-coupon bonds whose yield added to the income component of the Fund’s total return.
Please see footnotes on page 5.
| | | | | | |
| Performance highlights (unaudited) | | Wells Fargo California Tax-Free Fund | | | 7 | |
California’s economy continues to improve, becoming the sixth-largest economy in the world in 2015 and moving ahead of Brazil and France in ranking. Higher taxes from Proposition 30 (temporary higher taxes were enacted amid the Great Recession and may be extended in November) and improving fundamentals for many issuers have tightened spreads for both state and local bonds. The Fund does not own any Puerto Rico bonds.
Rates may be lower for longer, making issue selection even more important.
Near the end of the reporting period, the U.K. voted to withdraw from the European Union (E.U.), prompting considerable uncertainty about future political situations, financial markets, and economic growth. U.S. Treasuries and municipal bonds rallied significantly on the news, and both 10-year and 30-year municipal yields reached record-low levels. We expect volatility in rates but don’t see any catalyst for materially higher rates or a steeper yield curve in the near term. Expectations for future federal funds rate increases remain muted and data dependent. Global growth concerns in Europe and uncertainty regarding the effects of the U.K.’s withdrawal from the E.U. will likely keep rates low for some time. In terms of Fund positioning, we expect to remain long duration relative to the index and to focus purchases on the steeper part of the yield curve to benefit from the roll down. We also expect to maintain an overweight to the A-rated and BBB-rated credit tiers. Although we think rates may stay lower for longer, we recognize that an improvement in overseas economies, outflows in mutual funds, or a more hawkish tone from the Fed could lead to a spike in rates. In this record-low interest-rate environment, security selection is even more important as breakeven yields (the sell-off that a bond can endure before the total return drops to zero) decrease.
Please see footnotes on page 5.
| | | | |
| 8 | | Wells Fargo California Tax-Free Fund | | Fund expenses (unaudited) |
As a shareholder of the Fund, you incur two types of costs: (1) transaction costs, including sales charges (loads) on purchase payments and contingent deferred sales charges (if any) on redemptions and (2) ongoing costs, including management fees, distribution (12b-1) and/or shareholder servicing fees, and other Fund expenses. This example is intended to help you understand your ongoing costs (in dollars) of investing in the Fund and to compare these costs with the ongoing costs of investing in other mutual funds.
The example is based on an investment of $1,000 invested at the beginning of the six-month period and held for the entire period from January 1, 2016 to June 30, 2016.
Actual expenses
The “Actual” line of the table below provides information about actual account values and actual expenses. You may use the information in this line, together with the amount you invested, to estimate the expenses that you paid over the period. Simply divide your account value by $1,000 (for example, an $8,600 account value divided by $1,000 = 8.6), then multiply the result by the number in the “Actual” line under the heading entitled “Expenses paid during period” for your applicable class of shares to estimate the expenses you paid on your account during this period.
Hypothetical example for comparison purposes
The “Hypothetical” line of the table below provides information about hypothetical account values and hypothetical expenses based on the Fund’s actual expense ratio and an assumed rate of return of 5% per year before expenses, which is not the Fund’s actual return. The hypothetical account values and expenses may not be used to estimate the actual ending account balance or expenses you paid for the period. You may use this information to compare the ongoing costs of investing in the Fund and other funds. To do so, compare this 5% hypothetical example with the 5% hypothetical examples that appear in the shareholder reports of the other funds.
Please note that the expenses shown in the table are meant to highlight your ongoing costs only and do not reflect any transactional costs, such as sales charges (loads) and contingent deferred sales charges. Therefore, the “Hypothetical” line of the table is useful in comparing ongoing costs only and will not help you determine the relative total costs of owning different funds. In addition, if these transactional costs were included, your costs would have been higher.
| | | | | | | | | | | | | | | | |
| | | Beginning
account value
1-1-2016 | | | Ending
account value
6-30-2016 | | | Expenses
paid during
the period¹ | | | Net annualized
expense ratio | |
Class A | | | | | | | | | | | | | | | | |
Actual | | $ | 1,000.00 | | | $ | 1,050.89 | | | $ | 3.82 | | | | 0.75 | % |
Hypothetical (5% return before expenses) | | $ | 1,000.00 | | | $ | 1,021.13 | | | $ | 3.77 | | | | 0.75 | % |
Class B | | | | | | | | | | | | | | | | |
Actual | | $ | 1,000.00 | | | $ | 1,047.08 | | | $ | 7.63 | | | | 1.50 | % |
Hypothetical (5% return before expenses) | | $ | 1,000.00 | | | $ | 1,017.40 | | | $ | 7.52 | | | | 1.50 | % |
Class C | | | | | | | | | | | | | | | | |
Actual | | $ | 1,000.00 | | | $ | 1,047.11 | | | $ | 7.63 | | | | 1.50 | % |
Hypothetical (5% return before expenses) | | $ | 1,000.00 | | | $ | 1,017.40 | | | $ | 7.52 | | | | 1.50 | % |
Administrator Class | | | | | | | | | | | | | | | | |
Actual | | $ | 1,000.00 | | | $ | 1,051.85 | | | $ | 2.81 | | | | 0.55 | % |
Hypothetical (5% return before expenses) | | $ | 1,000.00 | | | $ | 1,022.13 | | | $ | 2.77 | | | | 0.55 | % |
Institutional Class | | | | | | | | | | | | | | | | |
Actual | | $ | 1,000.00 | | | $ | 1,052.21 | | | $ | 2.45 | | | | 0.48 | % |
Hypothetical (5% return before expenses) | | $ | 1,000.00 | | | $ | 1,022.48 | | | $ | 2.41 | | | | 0.48 | % |
| 1 | Expenses paid is equal to the annualized expense ratio of each class multiplied by the average account value over the period, multiplied by the number of days in the most recent fiscal half-year divided by the number of days in the fiscal year (to reflect the one-half-year period). |
| | | | | | |
| Portfolio of investments—June 30, 2016 | | Wells Fargo California Tax-Free Fund | | | 9 | |
| | | | | | | | | | | | | | | | |
| Security name | | Interest rate | | | Maturity date | | | Principal | | | Value | |
| | | | |
Municipal Obligations: 98.92% | | | | | | | | | | | | | | | | |
| | | | |
| California: 96.67% | | | | | | | | | | | | | | | | |
ABC California Unified School District CAB Election of 1997 Series B (GO Revenue, National Insured) ¤ | | | 0.00 | % | | | 8-1-2018 | | | $ | 1,500,000 | | | $ | 1,467,735 | |
Alameda CA Corridor Transportation Authority CAB Sub Lien Series A (Transportation Revenue, Ambac Insured) ¤ | | | 0.00 | | | | 10-1-2018 | | | | 2,955,000 | | | | 2,899,742 | |
Alameda CA Corridor Transportation Authority CAB Sub Lien Series A (Transportation Revenue, Ambac Insured) ¤ | | | 0.00 | | | | 10-1-2018 | | | | 940,000 | | | | 912,749 | |
Alameda CA Corridor Transportation Authority CAB Sub Lien Series A (Transportation Revenue, Ambac Insured) ¤ | | | 0.00 | | | | 10-1-2019 | | | | 2,780,000 | | | | 2,696,044 | |
Alameda CA Corridor Transportation Authority CAB Sub Lien Series A (Transportation Revenue, Ambac Insured) ¤ | | | 0.00 | | | | 10-1-2019 | | | | 220,000 | | | | 210,443 | |
Alameda CA Corridor Transportation Authority CAB Sub Lien Series A (Transportation Revenue, Ambac Insured) | | | 5.25 | | | | 10-1-2021 | | | | 3,000,000 | | | | 3,175,380 | |
Alameda CA Corridor Transportation Authority CAB Sub Lien Series B (Transportation Revenue, AGM Insured) | | | 4.00 | | | | 10-1-2037 | | | | 2,215,000 | | | | 2,450,388 | |
Alameda CA Corridor Transportation Authority CAB Sub Lien Series B (Transportation Revenue) | | | 5.00 | | | | 10-1-2037 | | | | 1,500,000 | | | | 1,838,775 | |
Alameda CA Joint Powers Authority Multiple Capital Projects Series A (Miscellaneous Revenue) | | | 5.00 | | | | 12-1-2034 | | | | 1,005,000 | | | | 1,243,939 | |
Alhambra CA Unified School District Election of 2008 Series B (GO Revenue, AGM Insured) | | | 6.00 | | | | 8-1-2029 | | | | 4,100,000 | | | | 5,134,102 | |
Alisal CA Unified School District CAB Election of 2006 Series A (GO Revenue, AGC Insured) ¤ | | | 0.00 | | | | 8-1-2017 | | | | 1,105,000 | | | | 1,092,812 | |
Alvord CA Unified School District Election of 2012 Series A (GO Revenue, AGM Insured) | | | 5.25 | | | | 8-1-2037 | | | | 1,620,000 | | | | 1,965,028 | |
Anaheim CA PFA CAB Sub Lien Public Improvements Project Series C (Miscellaneous Revenue, AGM Insured) ¤ | | | 0.00 | | | | 9-1-2018 | | | | 4,455,000 | | | | 4,353,649 | |
Anaheim CA PFA CAB Sub Lien Public Improvements Project Series C (Miscellaneous Revenue, AGM Insured) ¤ | | | 0.00 | | | | 9-1-2025 | | | | 10,000,000 | | | | 8,108,300 | |
Anaheim CA PFA Convention Center Expansion Project Series A (Miscellaneous Revenue) | | | 5.00 | | | | 5-1-2039 | | | | 3,000,000 | | | | 3,664,290 | |
Anaheim CA PFA Convention Center Expansion Project Series A (Miscellaneous Revenue) | | | 5.00 | | | | 5-1-2046 | | | | 3,000,000 | | | | 3,632,730 | |
Antelope Valley CA Health Care District Series A (Health Revenue) | | | 5.00 | | | | 3-1-2046 | | | | 3,000,000 | | | | 3,268,590 | |
Banning CA Financing Authority Refunding Bond Electric System Project (Utilities Revenue, AGM Insured) | | | 5.00 | | | | 6-1-2037 | | | | 5,000,000 | | | | 6,020,350 | |
Bassett CA Unified School District Refunding Bond Series B (GO Revenue, Build America Mutual Assurance Company Insured) | | | 5.00 | | | | 8-1-2027 | | | | 1,050,000 | | | | 1,333,994 | |
Bay Area CA Toll Authority Toll Bridge Series S-4 (Transportation Revenue) | | | 5.00 | | | | 4-1-2030 | | | | 2,000,000 | | | | 2,459,440 | |
Bay Area CA Water Supply & Conservation Agency Series A (Water & Sewer Revenue) | | | 5.00 | | | | 10-1-2034 | | | | 6,000,000 | | | | 7,300,680 | |
Belmont CA Community Facilities Special Tax District #2000-1 Library Project Series A (Tax Revenue, Ambac Insured) | | | 5.75 | | | | 8-1-2030 | | | | 3,190,000 | | | | 4,470,115 | |
Brea CA PFA Tax Allocation Series A (Housing Revenue) | | | 7.00 | | | | 9-1-2023 | | | | 1,000,000 | | | | 1,030,890 | |
Cabrillo CA Unified School District CAB Series A (GO Revenue, Ambac Insured) ¤ | | | 0.00 | | | | 8-1-2021 | | | | 1,500,000 | | | | 1,375,200 | |
California (GO Revenue) | | | 5.25 | | | | 8-1-2038 | | | | 1,925,000 | | | | 2,099,328 | |
California (GO Revenue) | | | 5.25 | | | | 11-1-2040 | | | | 3,000,000 | | | | 3,535,470 | |
California AMT Department of Veterans Affairs Series BZ (GO Revenue, National Insured) | | | 5.35 | | | | 12-1-2021 | | | | 5,000 | | | | 5,015 | |
California Association of Bay Area Governments Finance Authority for Nonprofit Corporations O’Connor Woods Project (Health Revenue) | | | 5.00 | | | | 1-1-2043 | | | | 5,000,000 | | | | 5,974,600 | |
The accompanying notes are an integral part of these financial statements.
| | | | |
| 10 | | Wells Fargo California Tax-Free Fund | | Portfolio of investments—June 30, 2016 |
| | | | | | | | | | | | | | | | |
| Security name | | Interest rate | | | Maturity date | | | Principal | | | Value | |
| | | | |
| California (continued) | | | | | | | | | �� | | | | | | | |
California Association of Bay Area Governments Finance Authority for Nonprofit Corporations Odd Fellows Home Project Series A (Health Revenue) | | | 5.00 | % | | | 4-1-2042 | | | $ | 1,100,000 | | | $ | 1,312,817 | |
California Educational Facilities Authority Pepperdine University Refunding Bond (Education Revenue) | | | 5.00 | | | | 10-1-2046 | | | | 3,000,000 | | | | 3,751,530 | |
California Educational Facilities Authority Pepperdine University Refunding Bond (Education Revenue) | | | 5.00 | | | | 10-1-2049 | | | | 5,000,000 | | | | 6,216,500 | |
California Financial Authority Charter School Palmdale Aerospace Academy Project (Education Revenue) 144A | | | 5.00 | | | | 7-1-2046 | | | | 1,665,000 | | | | 1,808,856 | |
California Financial Authority Charter School Rocketship Education Series A (Education Revenue) 144A | | | 5.00 | | | | 6-1-2036 | | | | 945,000 | | | | 1,014,543 | |
California Financial Authority Charter School Rocketship Education Series A (Education Revenue) 144A | | | 5.00 | | | | 6-1-2046 | | | | 2,100,000 | | | | 2,223,837 | |
California HFA AMT Home Mortgage Series E (Housing Revenue) | | | 5.00 | | | | 2-1-2042 | | | | 80,000 | | | | 80,284 | |
California HFA AMT Home Mortgage Series G (Housing Revenue) | | | 5.50 | | | | 8-1-2042 | | | | 165,000 | | | | 169,125 | |
California HFA AMT Home Mortgage Series K (Housing Revenue) | | | 5.30 | | | | 8-1-2023 | | | | 2,520,000 | | | | 2,581,236 | |
California HFFA Catholic Healthcare West Series A (Health Revenue) | | | 5.25 | | | | 3-1-2023 | | | | 3,000,000 | | | | 3,572,400 | |
California HFFA Catholic Healthcare West Series A (Health Revenue) | | | 6.00 | | | | 7-1-2029 | | | | 4,000,000 | | | | 4,586,360 | |
California HFFA Nevada Methodist Homes (Health Revenue, California Mortgage Insured) | | | 5.00 | | | | 7-1-2030 | | | | 1,830,000 | | | | 2,316,432 | |
California HFFA Nevada Methodist Homes (Health Revenue, California Mortgage Insured) | | | 5.00 | | | | 7-1-2035 | | | | 1,000,000 | | | | 1,241,390 | |
California HFFA Nevada Methodist Homes (Health Revenue, California Mortgage Insured) | | | 5.00 | | | | 7-1-2045 | | | | 4,500,000 | | | | 5,519,880 | |
California HFFA Prerefunded Bond Providence Health Services Series C (Health Revenue) | | | 6.50 | | | | 10-1-2038 | | | | 100,000 | | | | 113,048 | |
California HFFA Sutter Health Series A (Health Revenue) | | | 5.00 | | | | 8-15-2043 | | | | 1,250,000 | | | | 1,519,450 | |
California HFFA Sutter Health Series D (Health Revenue) | | | 5.25 | | | | 8-15-2031 | | | | 3,100,000 | | | | 3,789,564 | |
California Infrastructure & Economic Development King City Joint Union High School (Miscellaneous Revenue) | | | 5.75 | | | | 8-15-2029 | | | | 2,150,000 | | | | 2,490,775 | |
California Municipal Finance Authority California Baptist University Series A (Education Revenue) 144A | | | 5.00 | | | | 11-1-2025 | | | | 1,025,000 | | | | 1,144,771 | |
California Municipal Finance Authority Charter School Albert Einstein Academies Project Series A (Miscellaneous Revenue) | | | 6.75 | | | | 8-1-2033 | | | | 1,525,000 | | | | 1,739,080 | |
California Municipal Finance Authority Charter School Albert Einstein Academies Project Series A (Miscellaneous Revenue) | | | 7.13 | | | | 8-1-2043 | | | | 1,000,000 | | | | 1,159,030 | |
California Municipal Financing Authority Certificate of Participation Community Hospitals of Central California (Health Revenue) | | | 5.00 | | | | 2-1-2020 | | | | 415,000 | | | | 425,512 | |
California Municipal Financing Authority Certificate of Participation Community Hospitals of Central California (Health Revenue) | | | 5.00 | | | | 2-1-2020 | | | | 585,000 | | | | 598,824 | |
California PFOTER PT-2802 (GO Revenue, National Insured, Dexia Credit Local SPA) ø | | | 0.62 | | | | 2-1-2025 | | | | 9,975,000 | | | | 9,975,000 | |
California PFOTER Series DCL-009 (GO Revenue, Dexia Credit Local LOC, AGM Insured) 144Aø | | | 0.59 | | | | 8-1-2027 | | | | 24,375,000 | | | | 24,375,000 | |
California PFOTER Series DCL-010 (GO Revenue, Dexia Credit Local LOC, AGM Insured) 144Aø | | | 0.59 | | | | 8-1-2027 | | | | 27,265,000 | | | | 27,265,000 | |
California PFOTER Series DCL-011 (GO Revenue, Dexia Credit Local LOC, AGM Insured) 144Aø | | | 0.59 | | | | 8-1-2027 | | | | 14,550,000 | | | | 14,550,000 | |
California Public Works Board California State University Projects Series B-1 (Miscellaneous Revenue) | | | 5.70 | | | | 3-1-2035 | | | | 2,210,000 | | | | 2,593,943 | |
California Public Works Board Judicial Council Projects Series A (Miscellaneous Revenue) | | | 5.00 | | | | 3-1-2038 | | | | 7,000,000 | | | | 8,367,660 | |
The accompanying notes are an integral part of these financial statements.
| | | | | | |
| Portfolio of investments—June 30, 2016 | | Wells Fargo California Tax-Free Fund | | | 11 | |
| | | | | | | | | | | | | | | | |
| Security name | | Interest rate | | | Maturity date | | | Principal | | | Value | |
| | | | |
| California (continued) | | | | | | | | | | | | | | | | |
California Public Works Board Judicial Council Projects Series D (Miscellaneous Revenue) | | | 5.25 | % | | | 12-1-2025 | | | $ | 4,000,000 | | | $ | 4,844,360 | |
California Public Works Board Various Capital Projects Series A (Miscellaneous Revenue) | | | 5.00 | | | | 4-1-2037 | | | | 4,925,000 | | | | 5,823,862 | |
California Public Works Board Various Capital Projects Series G (Miscellaneous Revenue) | | | 5.00 | | | | 11-1-2037 | | | | 23,000,000 | | | | 27,601,610 | |
California Public Works Board Various Capital Projects Series I (Miscellaneous Revenue) | | | 5.50 | | | | 11-1-2033 | | | | 2,000,000 | | | | 2,542,600 | |
California Public Works University of California Board of Regents Series G (Miscellaneous Revenue) | | | 5.00 | | | | 12-1-2030 | | | | 9,850,000 | | | | 11,931,010 | |
California Refunding Bond (GO Revenue) | | | 5.00 | | | | 8-1-2025 | | | | 5,000,000 | | | | 5,128,450 | |
California School Finance Authority School Green Dot Public Schools Projects (Education Revenue) 144A | | | 4.00 | | | | 8-1-2025 | | | | 475,000 | | | | 516,463 | |
California School Finance Authority School Green Dot Public Schools Projects (Education Revenue) 144A | | | 5.00 | | | | 8-1-2035 | | | | 2,525,000 | | | | 2,832,166 | |
California School Finance Authority School KIPP Louisiana Projects Series A (Education Revenue) 144A | | | 5.00 | | | | 7-1-2035 | | | | 1,000,000 | | | | 1,133,140 | |
California Special District Association Finance Corporation Program Series MM (Miscellaneous Revenue) | | | 5.50 | | | | 6-1-2021 | | | | 615,000 | | | | 617,153 | |
California Statewide CDA Adventist Health System Series A (Health Revenue) | | | 5.00 | | | | 3-1-2045 | | | | 2,500,000 | | | | 3,036,200 | |
California Statewide CDA Catholic Healthcare West Series A (Health Revenue) | | | 5.50 | | | | 7-1-2030 | | | | 2,940,000 | | | | 3,087,764 | |
California Statewide CDA Certificate of Participation Internext Group (Health Revenue) | | | 5.38 | | | | 4-1-2017 | | | | 100,000 | | | | 100,418 | |
California Statewide CDA Enloe Medical Center (Health Revenue, Ambac Insured) | | | 5.00 | | | | 8-15-2033 | | | | 1,650,000 | | | | 2,068,259 | |
California Statewide CDA Enloe Medical Center (Health Revenue, Ambac Insured) | | | 5.00 | | | | 8-15-2035 | | | | 1,000,000 | | | | 1,244,610 | |
California Statewide CDA Enloe Medical Center (Health Revenue, Ambac Insured) | | | 5.00 | | | | 8-15-2038 | | | | 3,000,000 | | | | 3,707,400 | |
California Statewide CDA Loma Linda University Medical Center Refunding Bond Series A (Health Revenue) | | | 5.25 | | | | 12-1-2044 | | | | 5,150,000 | | | | 5,890,982 | |
California Statewide CDA Poway Retirement Housing Foundation Housing Incorporated Series A (Housing Revenue) | | | 5.25 | | | | 11-15-2035 | | | | 1,500,000 | | | | 1,855,875 | |
California Statewide CDA Redwoods Projects (Health Revenue) | | | 5.13 | | | | 11-15-2035 | | | | 1,500,000 | | | | 1,834,860 | |
California Statewide CDA School Facility Alliance for College-Ready Public Schools (Education Revenue) | | | 6.75 | | | | 7-1-2031 | | | | 1,625,000 | | | | 1,890,541 | |
California Statewide CDA School Facility Aspire Public Schools (Education Revenue) | | | 5.00 | | | | 7-1-2020 | | | | 1,275,000 | | | | 1,347,165 | |
California Statewide CDA School Facility Aspire Public Schools (Education Revenue) | | | 5.20 | | | | 7-1-2020 | | | | 270,000 | | | | 286,016 | |
California Statewide CDA Senior Living Health Facilities Los Angeles Jewish Home for the Aging Series D (Health Revenue) | | | 4.75 | | | | 8-1-2020 | | | | 1,000,000 | | | | 1,004,670 | |
California Statewide CDA St. Joseph Health System (Health Revenue, AGM Insured) | | | 5.25 | | | | 7-1-2021 | | | | 1,775,000 | | | �� | 1,931,431 | |
California Statewide CDA Water & Wastewater Pooled Financing Program Series B (Water & Sewer Revenue, AGM Insured) | | | 5.25 | | | | 10-1-2027 | | | | 1,040,000 | | | | 1,044,316 | |
California Statewide Community Devauth Student Housing CHF-Irvine LLC Refunding Bond (Housing Revenue) | | | 5.00 | | | | 5-15-2032 | | | | 1,250,000 | | | | 1,559,113 | |
California Statewide Community Devauth Student Housing CHF-Irvine LLC Refunding Bond (Housing Revenue) | | | 5.00 | | | | 5-15-2040 | | | | 1,500,000 | | | | 1,832,175 | |
California Statewide Community Development Authority John Muir Health Series A (Health Revenue) | | | 4.00 | | | | 8-15-2051 | | | | 3,000,000 | | | | 3,281,730 | |
California Statewide Community Development Authority John Muir Health Series A (Health Revenue) | | | 5.00 | | | | 8-15-2051 | | | | 2,000,000 | | | | 2,464,580 | |
California Various Purposes (GO Revenue) | | | 4.00 | | | | 9-1-2045 | | | | 1,500,000 | | | | 1,721,220 | |
California Various Purposes (GO Revenue) | | | 5.00 | | | | 9-1-2029 | | | | 1,475,000 | | | | 1,767,389 | |
The accompanying notes are an integral part of these financial statements.
| | | | |
| 12 | | Wells Fargo California Tax-Free Fund | | Portfolio of investments—June 30, 2016 |
| | | | | | | | | | | | | | | | |
| Security name | | Interest rate | | | Maturity date | | | Principal | | | Value | |
| | | | |
| California (continued) | | | | | | | | | | | | | | | | |
California Various Purposes (GO Revenue) | | | 5.00 | % | | | 10-1-2029 | | | $ | 7,000,000 | | | $ | 7,956,550 | |
California Various Purposes (GO Revenue) | | | 5.00 | | | | 9-1-2032 | | | | 5,100,000 | | | | 6,328,488 | |
California Various Purposes (GO Revenue) | | | 5.00 | | | | 6-1-2037 | | | | 4,215,000 | | | | 4,388,826 | |
California Various Purposes (GO Revenue) | | | 5.00 | | | | 2-1-2038 | | | | 5,000,000 | | | | 6,030,800 | |
California Various Purposes (GO Revenue) | | | 5.00 | | | | 9-1-2045 | | | | 1,000,000 | | | | 1,263,230 | |
California Various Purposes (GO Revenue) | | | 5.13 | | | | 4-1-2033 | | | | 6,735,000 | | | | 7,244,570 | |
California Various Purposes (GO Revenue) | | | 5.25 | | | | 9-1-2028 | | | | 5,000,000 | | | | 6,059,500 | |
California Various Purposes (GO Revenue) | | | 5.25 | | | | 10-1-2029 | | | | 800,000 | | | | 915,736 | |
California Various Purposes (GO Revenue) | | | 5.25 | | | | 4-1-2035 | | | | 12,640,000 | | | | 15,351,659 | |
California Various Purposes (GO Revenue) | | | 5.25 | | | | 3-1-2038 | | | | 2,300,000 | | | | 2,465,692 | |
California Various Purposes (GO Revenue) | | | 5.60 | | | | 3-1-2036 | | | | 8,715,000 | | | | 10,186,615 | |
California Various Purposes (GO Revenue) | | | 5.75 | | | | 4-1-2029 | | | | 1,600,000 | | | | 1,818,016 | |
California Various Purposes (GO Revenue) | | | 5.75 | | | | 4-1-2031 | | | | 3,380,000 | | | | 3,843,533 | |
California Various Purposes (GO Revenue) | | | 6.00 | | | | 4-1-2035 | | | | 2,140,000 | | | | 2,441,419 | |
California Various Purposes (GO Revenue) | | | 6.00 | | | | 4-1-2038 | | | | 23,465,000 | | | | 26,770,045 | |
Cathedral City CA Redevelopment Agency Successor Agency Tax Allocation Merged Redevelopment Project Area Series A (Tax Revenue, AGM Insured) | | | 5.00 | | | | 8-1-2032 | | | | 1,450,000 | | | | 1,743,277 | |
Cathedral City CA Redevelopment Agency Successor Agency Tax Allocation Merged Redevelopment Project Area Series A (Tax Revenue, AGM Insured) | | | 5.00 | | | | 8-1-2033 | | | | 880,000 | | | | 1,055,824 | |
Center California Unified School District CAB Series C (GO Revenue, National Insured) ¤ | | | 0.00 | | | | 9-1-2021 | | | | 5,000,000 | | | | 4,559,150 | |
Centinela Valley CA Union High School District Election of 2008 Series B (GO Revenue) | | | 6.00 | | | | 8-1-2036 | | | | 2,500,000 | | | | 3,233,125 | |
Centinela Valley CA Union High School District Election of 2008 Series C (GO Revenue) | | | 5.00 | | | | 8-1-2035 | | | | 2,000,000 | | | | 2,449,220 | |
Central Valley CA School District Financing Authority Series A (Miscellaneous Revenue, National Insured) | | | 6.45 | | | | 2-1-2018 | | | | 870,000 | | | | 901,799 | |
Cerritos CA Community College CAB Election of 2004 (GO Revenue) ¤ | | | 0.00 | | | | 8-1-2029 | | | | 1,750,000 | | | | 1,241,065 | |
Cerritos CA Community College CAB Election of 2004 (GO Revenue) ¤ | | | 0.00 | | | | 8-1-2033 | | | | 1,500,000 | | | | 917,160 | |
Chico CA PFA Redevelopment Project Area (Tax Revenue, National Insured) | | | 5.13 | | | | 4-1-2021 | | | | 3,000,000 | | | | 3,093,000 | |
Chula Vista CA Redevelopment Agency (Tax Revenue, AGM Insured) %% | | | 5.00 | | | | 10-1-2027 | | | | 1,480,000 | | | | 1,898,648 | |
College of the Sequoias Tulare Area Improvement District #3 California CAB Election of 2008 Series A (GO Revenue, AGC Insured) ¤ | | | 0.00 | | | | 8-1-2024 | | | | 1,000,000 | | | | 857,860 | |
Compton CA Community College CAB Election of 2002 Series C (GO Revenue) ¤ | | | 0.00 | | | | 8-1-2035 | | | | 3,445,000 | | | | 1,737,038 | |
Compton CA Community College RDA Project 2nd Lien Series A (Tax Revenue) | | | 5.00 | | | | 8-1-2020 | | | | 1,140,000 | | | | 1,253,350 | |
Contra Costa County CA Community College District Election of 2006 (GO Revenue) | | | 5.00 | | | | 8-1-2038 | | | | 3,250,000 | | | | 3,975,238 | |
Contra Costa County CA Home GNMA Mortgage-Backed Securities Program (Housing Revenue, GNMA Insured) | | | 7.75 | | | | 5-1-2022 | | | | 160,000 | | | | 191,573 | |
Delano CA Union High School Election of 2010 Series B (GO Revenue, AGM Insured) ## | | | 5.75 | | | | 8-1-2035 | | | | 4,510,000 | | | | 5,359,594 | |
Deutsche Bank SPEARS/LIFERS Trust Series DB-649 (GO Revenue, National Insured, Deutsche Bank LIQ) 144Aø | | | 0.63 | | | | 6-1-2031 | | | | 4,170,000 | | | | 4,170,000 | |
Dinuba CA Redevelopment Agency Merged City Redevelopment Project (Tax Revenue, Build America Mutual Assurance Company Insured) | | | 5.00 | | | | 9-1-2033 | | | | 1,500,000 | | | | 1,827,465 | |
Duarte CA RDA CAB Sub-Merged Redevelopment Project (Tax Revenue) ¤ | | | 0.00 | | | | 12-1-2016 | | | | 460,000 | | | | 458,261 | |
East Bay CA Municipal Utility District Water System Series B (Water & Sewer Revenue) | | | 4.00 | | | | 6-1-2045 | | | | 2,160,000 | | | | 2,456,417 | |
El Dorado CA Irrigation District Refunding Bond Series A (Water & Sewer Revenue, AGM Insured) | | | 5.25 | | | | 3-1-2039 | | | | 2,000,000 | | | | 2,458,380 | |
The accompanying notes are an integral part of these financial statements.
| | | | | | |
| Portfolio of investments—June 30, 2016 | | Wells Fargo California Tax-Free Fund | | | 13 | |
| | | | | | | | | | | | | | | | |
| Security name | | Interest rate | | | Maturity date | | | Principal | | | Value | |
| | | | |
| California (continued) | | | | | | | | | | | | | | | | |
Elk Grove CA Financing Authority Special Tax Refunding Bond (Tax Revenue, Build America Mutual Assurance Company Insured) | | | 5.00 | % | | | 9-1-2038 | | | $ | 1,500,000 | | | $ | 1,820,610 | |
Elsinore Valley CA Municipal Water District Financing Authority Refunding Bond Series A (Water & Sewer Revenue) | | | 5.00 | | | | 7-1-2027 | | | | 2,500,000 | | | | 3,253,000 | |
Emeryville CA PFA Assessment Distribution Refinancing (Miscellaneous Revenue) | | | 5.90 | | | | 9-2-2021 | | | | 1,750,000 | | | | 1,755,355 | |
Escondido CA Union High School CAB Election of 2008 Series A (GO Revenue, AGC Insured) ¤ | | | 0.00 | | | | 8-1-2027 | | | | 8,385,000 | | | | 6,401,780 | |
Evergreen CA School District Election of 2014 (GO Revenue) | | | 4.00 | | | | 8-1-2041 | | | | 5,365,000 | | | | 6,043,297 | |
Florin CA Resource Conservation Refunding Bond Second Senior Lien Series A (Water & Sewer Revenue, National Insured) | | | 5.00 | | | | 9-1-2032 | | | | 2,000,000 | | | | 2,439,980 | |
Fontana CA RDA Jurupa Hills Redevelopment Project Series A (Tax Revenue) | | | 5.50 | | | | 10-1-2017 | | | | 1,295,000 | | | | 1,311,408 | |
Fontana CA RDA Jurupa Hills Redevelopment Project Series A (Tax Revenue) | | | 5.60 | | | | 10-1-2027 | | | | 4,785,000 | | | | 4,844,286 | |
Foothill-Eastern Corridor CA Transportation Agency Sub Series B-3 (Transportation Revenue) ± | | | 5.50 | | | | 1-15-2053 | | | | 8,000,000 | | | | 9,595,440 | |
Fremont CA Community Facilities District #1 Refunding Bond (Tax Revenue) | | | 5.00 | | | | 9-1-2040 | | | | 2,700,000 | | | | 3,102,732 | |
Fullerton CA Joint Union High School Project Certificate of Participation (Miscellaneous Revenue, Build America Mutual Assurance Company Insured) | | | 5.00 | | | | 9-1-2035 | | | | 1,385,000 | | | | 1,684,853 | |
Garden Grove CA Unified School District Election of 2010 Series C (GO Revenue) | | | 5.25 | | | | 8-1-2037 | | | | 2,000,000 | | | | 2,481,120 | |
Gilroy CA Unified School District Election of 2008 Series A (GO Revenue, AGC Insured) | | | 6.00 | | | | 8-1-2027 | | | | 1,000,000 | | | | 1,162,460 | |
Golden Empire Schools Financing Authority (Lease Revenue) ± | | | 0.91 | | | | 5-1-2017 | | | | 5,000,000 | | | | 4,998,500 | |
Golden State Tobacco Securitization Corporation Series A (Tobacco Revenue) | | | 5.00 | | | | 6-1-2040 | | | | 22,100,000 | | | | 26,986,310 | |
Golden State Tobacco Securitization Enhanced Asset Backed Refunding Bond Series A (Tobacco Revenue) | | | 5.00 | | | | 6-1-2045 | | | | 10,500,000 | | | | 12,727,050 | |
Hayward CA Unified School District Refunding Bond (GO Revenue) | | | 5.00 | | | | 8-1-2038 | | | | 6,000,000 | | | | 7,213,560 | |
Hollister CA Joint Powers Financing Authority Wastewater Refunding Bond (Water & Sewer Revenue, AGM Insured) | | | 5.00 | | | | 6-1-2036 | | | | 1,270,000 | | | | 1,582,763 | |
Hollister CA Joint Powers Financing Authority Wastewater Refunding Bond (Water & Sewer Revenue, AGM Insured) | | | 5.00 | | | | 6-1-2037 | | | | 5,000,000 | | | | 6,061,850 | |
Imperial CA Irrigation District Electric System Refunding Bond Series A (Utilities Revenue) | | | 5.00 | | | | 11-1-2040 | | | | 3,715,000 | | | | 4,613,287 | |
Imperial CA Irrigation District Electric System Refunding Bond Series A (Utilities Revenue) | | | 5.00 | | | | 11-1-2045 | | | | 1,060,000 | | | | 1,312,259 | |
Imperial CA Irrigation District Electric System Refunding Bond Series C (Utilities Revenue) | | | 5.00 | | | | 11-1-2037 | | | | 2,500,000 | | | | 3,121,025 | |
Imperial CA Irrigation District Electric System Refunding Bond Series C (Utilities Revenue) | | | 5.00 | | | | 11-1-2038 | | | | 1,800,000 | | | | 2,248,956 | |
Imperial CA Irrigation District Series B-1 (Utilities Revenue) %% | | | 5.00 | | | | 11-1-2046 | | | | 7,000,000 | | | | 8,767,640 | |
Independent Cities California Finance Refunding Bond Sanitary Juan Mobile Estates (Housing Revenue) | | | 5.00 | | | | 8-15-2030 | | | | 1,000,000 | | | | 1,185,780 | |
Inland Valley CA Development Agency Series A (Tax Revenue) | | | 5.25 | | | | 9-1-2037 | | | | 4,000,000 | | | | 4,815,840 | |
Irvine CA Improvement Bond Act 1915 Limited Obligation Reassessment District Number 15-2 (Miscellaneous Revenue) | | | 5.00 | | | | 9-2-2025 | | | | 725,000 | | | | 893,621 | |
Irvine CA Improvement Bond Act 1915 Limited Obligation Reassessment District Number 15-2 (Miscellaneous Revenue) | | | 5.00 | | | | 9-2-2026 | | | | 400,000 | | | | 489,320 | |
Irvine CA Improvement Bond Act 1915 Limited Obligation Reassessment District Number 15-2 (Miscellaneous Revenue) | | | 5.00 | | | | 9-2-2042 | | | | 1,500,000 | | | | 1,721,220 | |
Jefferson CA Union High School CAB Election of 2006 Series D (GO Revenue) ¤ | | | 0.00 | | | | 8-1-2033 | | | | 7,000,000 | | | | 2,459,730 | |
Jefferson CA Union High School CAB Election of 2006 Series D (GO Revenue) ¤ | | | 0.00 | | | | 8-1-2034 | | | | 9,905,000 | | | | 3,200,702 | |
Jefferson CA Union High School CAB Election of 2006 Series D (GO Revenue) ¤ | | | 0.00 | | | | 8-1-2036 | | | | 11,130,000 | | | | 3,051,067 | |
The accompanying notes are an integral part of these financial statements.
| | | | |
| 14 | | Wells Fargo California Tax-Free Fund | | Portfolio of investments—June 30, 2016 |
| | | | | | | | | | | | | | | | |
| Security name | | Interest rate | | | Maturity date | | | Principal | | | Value | |
| | | | |
| California (continued) | | | | | | | | | | | | | | | | |
Lafayette CA Redevelopment Agency Refunding Bond Lafayette Redevelopment Project (Tax Revenue, AGM Insured) | | | 5.00 | % | | | 8-1-2033 | | | $ | 1,500,000 | | | $ | 1,821,930 | |
Lafayette CA Redevelopment Agency Refunding Bond Lafayette Redevelopment Project (Tax Revenue, AGM Insured) | | | 5.00 | | | | 8-1-2038 | | | | 1,635,000 | | | | 1,957,667 | |
Lancaster CA RDA Tax Allocation Combined Redevelopment Project Areas (Tax Revenue) | | | 6.50 | | | | 8-1-2029 | | | | 2,000,000 | | | | 2,308,640 | |
Lancaster CA Redevelopment Agency Non-Housing Program Series A-1 (Tax Revenue, AGM Insured) | | | 5.00 | | | | 8-1-2027 | | | | 1,300,000 | | | | 1,661,894 | |
Lodi CA Unified School District School Facility Election of 2006 (GO Revenue, AGM Insured) | | | 5.00 | | | | 8-1-2030 | | | | 2,000,000 | | | | 2,097,140 | |
Long Beach CA Financing Authority Refunding Bond (Miscellaneous Revenue, Ambac Insured) | | | 6.00 | | | | 11-1-2017 | | | | 490,000 | | | | 500,971 | |
Long Beach CA Unified School District CAB Election of 2008 Series B (GO Revenue) ¤ | | | 0.00 | | | | 8-1-2035 | | | | 2,000,000 | | | | 1,112,520 | |
Long Beach CA Unified School District Election of 2008 Series A (GO Revenue) | | | 5.50 | | | | 8-1-2026 | | | | 1,435,000 | | | | 1,645,787 | |
Long Beach CA Unified School District Election of 2008 Series A (GO Revenue) | | | 5.50 | | | | 8-1-2026 | | | | 95,000 | | | | 109,002 | |
Los Angeles CA Certificate of Participation Sonneblick del Rio Project (Miscellaneous Revenue, Ambac Insured) | | | 6.00 | | | | 11-1-2019 | | | | 2,000,000 | | | | 2,009,720 | |
Los Angeles CA Community Redevelopment Vermont Manchester Social Services Project (Miscellaneous Revenue, Ambac Insured) | | | 5.00 | | | | 9-1-2025 | | | | 2,310,000 | | | | 2,318,616 | |
Los Angeles CA Department of Airports Ontario International Series A (Airport Revenue, National Insured) | | | 5.00 | | | | 5-15-2024 | | | | 1,565,000 | | | | 1,570,837 | |
Los Angeles CA Department of Airports Ontario International Series A (Airport Revenue, National Insured) | | | 5.00 | | | | 5-15-2025 | | | | 3,425,000 | | | | 3,437,501 | |
Los Angeles CA Department of Water & Power Series B (Utilities Revenue) | | | 5.00 | | | | 7-1-2045 | | | | 2,450,000 | | | | 3,052,014 | |
Los Angeles CA Department of Water & Power Series E (Utilities Revenue) | | | 5.00 | | | | 7-1-2044 | | | | 12,475,000 | | | | 15,333,522 | |
Los Angeles CA Harbor Department (Airport Revenue) | | | 7.60 | | | | 10-1-2018 | | | | 45,000 | | | | 48,715 | |
Los Angeles CA Public Works Financing Authority Series A (Miscellaneous Revenue) | | | 5.00 | | | | 12-1-2039 | | | | 2,860,000 | | | | 3,492,031 | |
Los Angeles County CA Public Works Financial Authority Series D (Miscellaneous Revenue) | | | 4.00 | | | | 12-1-2040 | | | | 2,000,000 | | | | 2,236,100 | |
Los Angeles County CA Public Works Financial Authority Series D (Miscellaneous Revenue) | | | 5.00 | | | | 12-1-2045 | | | | 7,400,000 | | | | 9,111,472 | |
Lynwood CA Unified School District Election of 2012 Series A (GO Revenue, AGM Insured) | | | 5.00 | | | | 8-1-2033 | | | | 5,000 | | | | 5,957 | |
M-S-R California Energy Authority Gas Series B (Utilities Revenue) | | | 7.00 | | | | 11-1-2034 | | | | 4,000,000 | | | | 6,236,200 | |
M-S-R California Energy Authority Gas Series C (Utilities Revenue) | | | 6.13 | | | | 11-1-2029 | | | | 1,060,000 | | | | 1,432,993 | |
Merced CA City School District Election of 2014 (GO Revenue) | | | 5.00 | | | | 8-1-2045 | | | | 1,000,000 | | | | 1,231,290 | |
Merced CA Community College School Facilities Improvement Project District #1 (GO Revenue, National Insured) | | | 5.00 | | | | 8-1-2031 | | | | 1,635,000 | | | | 1,641,426 | |
Merced CA Irrigation District Water & Hydroelectric System Series A (Water & Sewer Revenue, AGM Insured) | | | 5.00 | | | | 10-1-2038 | | | | 4,000,000 | | | | 4,884,800 | |
Merced CA Union High School District CAB Series A (GO Revenue, National Insured) ¤ | | | 0.00 | | | | 8-1-2018 | | | | 2,135,000 | | | | 2,080,429 | |
Merced CA Union High School District CAB Series C (GO Revenue) ¤ | | | 0.00 | | | | 8-1-2032 | | | | 3,380,000 | | | | 2,127,034 | |
Metropolitan Water District of Southern California Series A (Water & Sewer Revenue) | | | 4.00 | | | | 7-1-2045 | | | | 3,855,000 | | | | 4,388,532 | |
Modesto CA Irrigation District Financing Authority Series A (Utilities Revenue) | | | 5.00 | | | | 10-1-2040 | | | | 3,500,000 | | | | 4,263,910 | |
Montclair CA PFA Refunding Bond (Miscellaneous Revenue, AGM Insured) | | | 5.00 | | | | 10-1-2035 | | | | 2,400,000 | | | | 2,896,488 | |
Morongo Band of Mission Indians California Enterprise Casino Series B (Miscellaneous Revenue) 144A | | | 6.50 | | | | 3-1-2028 | | | | 2,100,000 | | | | 2,274,027 | |
Mount San Antonio CA Community College District CAB Election of 2008 Series A (GO Revenue) ¤ | | | 0.00 | | | | 8-1-2024 | | | | 1,610,000 | | | | 1,381,155 | |
The accompanying notes are an integral part of these financial statements.
| | | | | | |
| Portfolio of investments—June 30, 2016 | | Wells Fargo California Tax-Free Fund | | | 15 | |
| | | | | | | | | | | | | | | | |
| Security name | | Interest rate | | | Maturity date | | | Principal | | | Value | |
| | | | |
| California (continued) | | | | | | | | | | | | | | | | |
Natomas CA Unified School District Series 1999 (GO Revenue, National Insured) | | | 5.95 | % | | | 9-1-2021 | | | $ | 835,000 | | | $ | 911,219 | |
Northern California Power Agency Public Power Prerefunded Bond (Utilities Revenue, Ambac Insured) | | | 7.50 | | | | 7-1-2023 | | | | 50,000 | | | | 60,984 | |
Norwalk-La Mirada CA Unified School District CAB Election of 2002 Series D (GO Revenue, AGM Insured) ¤ | | | 0.00 | | | | 8-1-2023 | | | | 1,500,000 | | | | 1,308,060 | |
Oakland CA Redevelopment Successor Agency Refunding Bond Subordinated Series TE (Tax Revenue, AGM Insured) | | | 5.00 | | | | 9-1-2035 | | | | 2,545,000 | | | | 3,091,310 | |
Oakland CA Redevelopment Successor Agency Refunding Bond Subordinated Series TE (Tax Revenue, AGM Insured) | | | 5.00 | | | | 9-1-2036 | | | | 4,000,000 | | | | 4,836,640 | |
Oakland CA Unified School District Election of 2012 (GO Revenue) | | | 5.50 | | | | 8-1-2023 | | | | 500,000 | | | | 612,025 | |
Oakland CA Unified School District Election of 2012 (GO Revenue) | | | 6.63 | | | | 8-1-2038 | | | | 7,750,000 | | | | 9,555,595 | |
Oakland CA Unified School District Election of 2012 Series A (GO Revenue) | | | 5.00 | | | | 8-1-2040 | | | | 3,500,000 | | | | 4,204,060 | |
Orange County CA Community Facilities District #2015-1 Esencia Village Series A (Tax Revenue) | | | 5.25 | | | | 8-15-2045 | | | | 2,000,000 | | | | 2,365,580 | |
Oxnard CA School District Election of 2012 Series D (GO Revenue, AGM Insured) | | | 5.00 | | | | 8-1-2034 | | | | 1,695,000 | | | | 2,083,901 | |
Pajaro Valley CA Unified School District Election of 2012 Series A (GO Revenue) | | | 5.00 | | | | 8-1-2038 | | | | 1,700,000 | | | | 2,070,464 | |
Palm Springs CA Palm Springs International Airport (Airport Revenue) | | | 6.00 | | | | 7-1-2018 | | | | 125,000 | | | | 125,243 | |
Palm Springs CA Palm Springs International Airport (Airport Revenue) | | | 6.40 | | | | 7-1-2023 | | | | 500,000 | | | | 501,035 | |
Palo Verde CA Unified School District FlexFund Program (Education Revenue) | | | 4.80 | | | | 9-1-2027 | | | | 1,398,611 | | | | 1,490,038 | |
Palomar CA Community College District Election of 2006 Series C (GO Revenue) | | | 5.00 | | | | 8-1-2044 | | | | 15,120,000 | | | | 18,687,262 | |
Paramount CA Unified School District CAB Election of 2006 (GO Revenue) ¤ | | | 0.00 | | | | 8-1-2033 | | | | 2,500,000 | | | | 1,424,700 | |
Pasadena CA Old Pasadena Parking Facilities Project (Miscellaneous Revenue) | | | 6.25 | | | | 1-1-2018 | | | | 385,000 | | | | 403,218 | |
Pico Rivera CA Water Authority Series A (Water & Sewer Revenue, National Insured) | | | 5.50 | | | | 5-1-2019 | | | | 1,265,000 | | | | 1,347,630 | |
Pico Rivera CA Water Authority Series A (Water & Sewer Revenue) | | | 6.25 | | | | 12-1-2032 | | | | 4,830,000 | | | | 4,896,461 | |
Pioneer CA Union Elementary School District Certificate of Participation (Miscellaneous Revenue, National Insured) | | | 5.00 | | | | 8-1-2029 | | | | 1,635,000 | | | | 1,674,060 | |
Pomona CA Unified School District Series A (GO Revenue, National Insured) | | | 6.55 | | | | 8-1-2029 | | | | 1,480,000 | | | | 2,040,609 | |
Poway CA Unified School District CAB Election of 2008 Improvement District 07-1-A (GO Revenue) ¤ | | | 0.00 | | | | 8-1-2024 | | | | 1,800,000 | | | | 1,559,070 | |
Rancho Cucamonga CA Redevelopment Agency Rancho Redevelopment Project Area (Tax Revenue, AGM Insured) | | | 5.00 | | | | 9-1-2032 | | | | 1,870,000 | | | | 2,284,523 | |
Redding CA Joint Powers Financing Authority Election System Series A (Utilities Revenue) | | | 5.00 | | | | 6-1-2032 | | | | 440,000 | | | | 540,927 | |
Redwood City CA RDA CAB Redevelopment Project Area 2-A (Tax Revenue, Ambac Insured) ¤ | | | 0.00 | | | | 7-15-2030 | | | | 3,505,000 | | | | 2,278,741 | |
Rialto CA Unified School District CAB Election of 2010 Series A (GO Revenue, AGM Insured) ¤ | | | 0.00 | | | | 8-1-2026 | | | | 3,320,000 | | | | 2,588,637 | |
Richmond CA Joint Powers Financing Authority Civic Center Project Series A (Miscellaneous Revenue, AGC Insured) | | | 5.88 | | | | 8-1-2037 | | | | 5,000,000 | | | | 5,659,650 | |
Richmond CA Joint Powers Financing Authority Point Potrero Series A (Miscellaneous Revenue) | | | 6.25 | | | | 7-1-2024 | | | | 7,500,000 | | | | 8,597,025 | |
Riverside County CA Asset Leasing Corporation Riverside County Hospital Project (Miscellaneous Revenue, National Insured) ¤ | | | 0.00 | | | | 6-1-2026 | | | | 10,000,000 | | | | 8,082,800 | |
Riverside County CA Palm Desert Financing Authority Series A (Miscellaneous Revenue) | | | 6.00 | | | | 5-1-2022 | | | | 4,105,000 | | | | 4,485,862 | |
Roseville CA Natural Gas Financing Authority (Utilities Revenue) | | | 5.00 | | | | 2-15-2025 | | | | 1,930,000 | | | | 2,323,797 | |
Sacramento CA Airport System AMT Senior Series B (Airport Revenue, AGM Insured) | | | 5.75 | | | | 7-1-2024 | | | | 2,000,000 | | | | 2,196,940 | |
Sacramento CA Certificate of Participation Animal Care & Youth Detention Facilities (Miscellaneous Revenue, Ambac Insured) | | | 5.00 | | | | 10-1-2025 | | | | 1,085,000 | | | | 1,138,078 | |
Sacramento CA City Financing Authority Series A (Miscellaneous Revenue, Ambac Insured) | | | 5.40 | | | | 11-1-2020 | | | | 2,135,000 | | | | 2,343,312 | |
The accompanying notes are an integral part of these financial statements.
| | | | |
| 16 | | Wells Fargo California Tax-Free Fund | | Portfolio of investments—June 30, 2016 |
| | | | | | | | | | | | | | | | |
| Security name | | Interest rate | | | Maturity date | | | Principal | | | Value | |
| | | | |
| California (continued) | | | | | | | | | | | | | | | | |
Sacramento CA City Financing Refunding Bond Master Lease Program Facilities (Miscellaneous Revenue, Build America Mutual Assurance Company Insured) | | | 5.00 | % | | | 12-1-2035 | | | $ | 1,300,000 | | | $ | 1,598,194 | |
Sacramento CA City School Joint Refunding Bond Series A (Miscellaneous Revenue, Build America Mutual Assurance Company Insured) | | | 5.00 | | | | 3-1-2040 | | | | 2,165,000 | | | | 2,568,773 | |
Sacramento CA Unified School District Election of 2012 Series A (GO Revenue, Build America Mutual Assurance Company Insured) | | | 5.25 | | | | 8-1-2033 | | | | 1,000,000 | | | | 1,215,920 | |
Sacramento CA Unified School District Election of 2012 Series C (GO Revenue, AGM Insured) | | | 5.00 | | | | 8-1-2033 | | | | 2,735,000 | | | | 3,393,041 | |
San Bernardino CA Community Election of 2008 Series D (GO Revenue) | | | 5.00 | | | | 8-1-2045 | | | | 2,000,000 | | | | 2,466,300 | |
San Bernardino City CA Unified School District Election of 2012 Series C (GO Revenue, AGM Insured) | | | 5.00 | | | | 8-1-2040 | | | | 8,000,000 | | | | 9,732,560 | |
San Bernardino County CA Certificate of Participation Arrowhead Project Series A (Miscellaneous Revenue) | | | 5.50 | | | | 8-1-2020 | | | | 6,000,000 | | | | 6,860,520 | |
San Bernardino County CA Certificate of Participation Medical Center Financing Project (Miscellaneous Revenue, National Insured) | | | 5.00 | | | | 8-1-2028 | | | | 5,815,000 | | | | 5,833,899 | |
San Buenaventura CA Public Facilities Financing Authority Series B (Water & Sewer Revenue) | | | 5.00 | | | | 7-1-2042 | | | | 4,000,000 | | | | 4,777,960 | |
San Clemente CA Special Tax Community Facilities District #2006-1 (Tax Revenue) | | | 5.00 | | | | 9-1-2040 | | | | 1,000,000 | | | | 1,157,800 | |
San Clemente CA Special Tax Community Facilities District #2006-1 (Tax Revenue) | | | 5.00 | | | | 9-1-2046 | | | | 1,200,000 | | | | 1,384,680 | |
San Diego CA Community College Election of 2002 (GO Revenue) | | | 5.00 | | | | 8-1-2031 | | | | 4,000,000 | | | | 4,974,240 | |
San Diego CA PFFA Ballpark Project Series A (Miscellaneous Revenue, Ambac Insured) | | | 5.25 | | | | 2-15-2026 | | | | 4,950,000 | | | | 5,096,124 | |
San Diego CA PFFA Ballpark Project Series A (Miscellaneous Revenue, Ambac Insured) | | | 5.25 | | | | 2-15-2032 | | | | 3,825,000 | | | | 3,937,914 | |
San Diego CA PFFA Series B (Water & Sewer Revenue) | | | 5.00 | | | | 8-1-2039 | | | | 3,750,000 | | | | 4,722,150 | |
San Diego CA RDA CAB Tax Allocation Centre (Tax Revenue, AGM Insured) ¤ | | | 0.00 | | | | 9-1-2023 | | | | 885,000 | | | | 765,693 | |
San Diego CA RDA Centre City Sub Parking Series B (Transportation Revenue) | | | 5.30 | | | | 9-1-2020 | | | | 1,060,000 | | | | 1,064,314 | |
San Diego CA RDA Naval Training Center Series A (Tax Revenue) | | | 5.00 | | | | 9-1-2025 | | | | 575,000 | | | | 652,211 | |
San Diego CA Unified School District Election of 2012 Series F (GO Revenue) | | | 5.00 | | | | 7-1-2045 | | | | 14,370,000 | | | | 17,838,774 | |
San Francisco CA City & County Certificate of Participation Multiple Capital Improvement Projects Series A (Miscellaneous Revenue) | | | 5.20 | | | | 4-1-2026 | | | | 3,000,000 | | | | 3,349,080 | |
San Francisco CA City & County Redevelopment Agency Mission Bay North Redevelopment Project Series C (Tax Revenue) | | | 4.50 | | | | 8-1-2016 | | | | 250,000 | | | | 250,868 | |
San Francisco CA City & County Redevelopment Agency Mission Bay South Redevelopment Project Series A (Tax Revenue) | | | 5.00 | | | | 8-1-2043 | | | | 2,500,000 | | | | 2,963,000 | |
San Francisco CA Municipal Transportation (Transportation Revenue) | | | 5.00 | | | | 3-1-2039 | | | | 3,000,000 | | | | 3,655,950 | |
San Gorgonio CA Memorial Healthcare (GO Revenue) | | | 5.00 | | | | 8-1-2032 | | | | 1,750,000 | | | | 2,093,945 | |
San Gorgonio CA Memorial Healthcare (GO Revenue) | | | 5.50 | | | | 8-1-2028 | | | | 2,525,000 | | | | 3,199,907 | |
San Gorgonio CA Memorial Healthcare Election of 2006 Series B (GO Revenue) | | | 5.63 | | | | 8-1-2038 | | | | 5,000,000 | | | | 5,022,300 | |
San Gorgonio CA Memorial Healthcare Election of 2006 Series C (GO Revenue) | | | 7.10 | | | | 8-1-2033 | | | | 3,000,000 | | | | 3,214,170 | |
San Joaquin Delta CA Community College District Election of 2004 Series C (GO Revenue) | | | 5.00 | | | | 8-1-2033 | | | | 3,195,000 | | | | 3,947,582 | |
San Joaquin Delta CA Community College District Election of 2004 Series C (GO Revenue) | | | 5.00 | | | | 8-1-2034 | | | | 3,315,000 | | | | 4,076,290 | |
San Jose CA Libraries & Parks Project (GO Revenue) | | | 5.13 | | | | 9-1-2031 | | | | 2,040,000 | | | | 2,048,262 | |
San Jose CA RDA Tax Allocation Refunding Bond Merged Area Redevelopment Project Series C (Tax Revenue, National Insured) | | | 5.00 | | | | 8-1-2025 | | | | 1,845,000 | | | | 1,929,114 | |
San Jose CA RDA Tax Allocation Refunding Bond Merged Area Redevelopment Project Series C (Tax Revenue, National Insured) | | | 5.00 | | | | 8-1-2026 | | | | 950,000 | | | | 992,674 | |
San Jose CA Unified School District CAB (Miscellaneous Revenue, AGM Insured) ¤ | | | 0.00 | | | | 1-1-2021 | | | | 1,205,000 | | | | 1,135,688 | |
San Jose CA Unified School District CAB (Miscellaneous Revenue, AGM Insured) ¤ | | | 0.00 | | | | 1-1-2026 | | | | 3,175,000 | | | | 2,695,575 | |
San Marcos CA Unified School District Special Tax Community Facilities District #4 (Tax Revenue, Build America Mutual Assurance Company Insured) | | | 5.00 | | | | 9-1-2034 | | | | 1,725,000 | | | | 2,094,374 | |
The accompanying notes are an integral part of these financial statements.
| | | | | | |
| Portfolio of investments—June 30, 2016 | | Wells Fargo California Tax-Free Fund | | | 17 | |
| | | | | | | | | | | | | | | | |
| Security name | | Interest rate | | | Maturity date | | | Principal | | | Value | |
| | | | |
| California (continued) | | | | | | | | | | | | | | | | |
San Marcos CA Unified School District Special Tax Community Facilities District #5 (Tax Revenue, Build America Mutual Assurance Company Insured) | | | 5.00 | % | | | 9-1-2028 | | | $ | 1,290,000 | | | $ | 1,599,690 | |
San Marcos CA Unified School District Special Tax Community Facilities District #5 (Tax Revenue, Build America Mutual Assurance Company Insured) | | | 5.00 | | | | 9-1-2029 | | | | 1,345,000 | | | | 1,660,618 | |
San Mateo CA Foster City School District Election of 2015 Series A (GO Revenue) | | | 4.00 | | | | 8-1-2045 | | | | 3,215,000 | | | | 3,621,472 | |
San Rafael CA City High School District CAB Election of 2002 Series B (GO Revenue, National Insured) ¤ | | | 0.00 | | | | 8-1-2023 | | | | 1,260,000 | | | | 1,109,039 | |
San Rafael CA Elementary School District Election of 2015 Series A (GO Revenue) | | | 4.00 | | | | 8-1-2041 | | | | 2,000,000 | | | | 2,244,180 | |
Sanger CA Unified School District Refunding Bond (GO Revenue, National Insured) | | | 5.60 | | | | 8-1-2023 | | | | 1,710,000 | | | | 1,886,113 | |
Santa Ana CA Community Redevelopment Merged Project Area Series A (Tax Revenue) | | | 6.00 | | | | 9-1-2022 | | | | 2,000,000 | | | | 2,417,420 | |
Santa Ana CA Unified School District CAB Election of 2008 Series B (GO Revenue, AGC Insured) ¤ | | | 0.00 | | | | 8-1-2038 | | | | 15,000,000 | | | | 7,945,350 | |
Santa Cruz County CA RDA Live Oak Soquel Community Improvement Project (Tax Revenue) | | | 6.63 | | | | 9-1-2029 | | | | 2,100,000 | | | | 2,487,597 | |
Santa Rosa CA High School District (GO Revenue) | | | 5.00 | | | | 8-1-2024 | | | | 1,005,000 | | | | 1,224,472 | |
Sierra Kings CA Health Care District (GO Revenue) | | | 5.00 | | | | 8-1-2028 | | | | 1,000,000 | | | | 1,239,120 | |
Sierra Kings CA Health Care District (GO Revenue) | | | 5.00 | | | | 8-1-2032 | | | | 1,500,000 | | | | 1,827,600 | |
Sierra Kings CA Health Care District (GO Revenue) | | | 5.00 | | | | 8-1-2037 | | | | 1,750,000 | | | | 2,105,180 | |
Simi Valley CA Unified School District Capital Improvement Projects (Miscellaneous Revenue, Ambac Insured) | | | 5.25 | | | | 8-1-2022 | | | | 1,970,000 | | | | 2,218,969 | |
Sonoma CA Community Development Agency Successor Agency Tax Allocation Sonoma Redevelopment Project (Tax Revenue, National Insured) | | | 5.00 | | | | 6-1-2033 | | | | 1,325,000 | | | | 1,647,306 | |
Sonoma Valley CA Unified School District CAB Election of 2010 Series A (GO Revenue) ¤ | | | 0.00 | | | | 8-1-2027 | | | | 1,020,000 | | | | 758,564 | |
South Pasadena CA Unified School District Series A (GO Revenue, FGIC Insured) | | | 5.55 | | | | 11-1-2020 | | | | 500,000 | | | | 567,530 | |
Southern California Public Power Authority Natural Gas Project #1 Series A (Utilities Revenue) | | | 5.25 | | | | 11-1-2025 | | | | 1,000,000 | | | | 1,249,410 | |
Southwest California Community Finance Authority Riverside County (Miscellaneous Revenue) | | | 6.38 | | | | 5-1-2033 | | | | 3,065,000 | | | | 3,374,810 | |
Stockton CA Unified School District Election of 2012 Series A (GO Revenue, AGM Insured) | | | 5.00 | | | | 8-1-2038 | | | | 1,025,000 | | | | 1,232,317 | |
Sutter Butte CA Flood Control Agency (Miscellaneous Revenue, Build America Mutual Assurance Company Insured) | | | 5.00 | | | | 10-1-2040 | | | | 3,545,000 | | | | 4,276,156 | |
Sweetwater CA Union High School District Refunding Bond (GO Revenue) | | | 4.00 | | | | 8-1-2042 | | | | 10,000,000 | | | | 11,235,100 | |
Sweetwater CA Union High School District Refunding Bond (GO Revenue) | | | 5.00 | | | | 8-1-2036 | | | | 2,500,000 | | | | 3,114,200 | |
Torrance CA Certificate of Participation (Miscellaneous Revenue) | | | 5.25 | | | | 6-1-2039 | | | | 5,385,000 | | | | 6,634,212 | |
Tracy CA Operating Partnership Joint Powers Authority Capital Improvement Projects (Miscellaneous Revenue, AGC Insured) | | | 6.25 | | | | 10-1-2033 | | | | 1,000,000 | | | | 1,120,040 | |
Tulare CA PFFA Capital Facilities Project (Miscellaneous Revenue, AGC Insured) | | | 5.25 | | | | 4-1-2027 | | | | 3,000,000 | | | | 3,235,560 | |
Tulare CA Sewer Refunding Bond (Water & Sewer Revenue, AGM Insured) | | | 5.00 | | | | 11-15-2041 | | | | 1,500,000 | | | | 1,828,440 | |
Turlock CA Irrigation District Revenue Refunding Bond Subordinated First Priority (Utilities Revenue) | | | 5.50 | | | | 1-1-2041 | | | | 2,000,000 | | | | 2,329,980 | |
Tustin CA Community Facilities District Special Tax #2014-1 Legacy/Standard Pacific Series A (Tax Revenue) | | | 5.00 | | | | 9-1-2040 | | | | 750,000 | | | | 865,538 | |
Tustin CA Community Facilities District Special Tax #2014-1 Legacy/Standard Pacific Series A (Tax Revenue) | | | 5.00 | | | | 9-1-2045 | | | | 1,000,000 | | | | 1,149,740 | |
Union City CA Community RDA (Tax Revenue, AGC Insured) | | | 5.25 | | | | 10-1-2033 | | | | 8,000,000 | | | | 9,459,680 | |
Union City CA Community Redevelopment Agency Successor Agency Tax Allocation Community Redevelopment Project Series A (Tax Revenue) | | | 5.00 | | | | 10-1-2035 | | | | 1,250,000 | | | | 1,547,425 | |
Union City CA Community Redevelopment Agency Successor Agency Tax Allocation Community Redevelopment Project Series A (Tax Revenue) | | | 5.00 | | | | 10-1-2036 | | | | 1,000,000 | | | | 1,233,220 | |
The accompanying notes are an integral part of these financial statements.
| | | | |
| 18 | | Wells Fargo California Tax-Free Fund | | Portfolio of investments—June 30, 2016 |
| | | | | | | | | | | | | | | | |
| Security name | | Interest rate | | | Maturity date | | | Principal | | | Value | |
| | | | |
| California (continued) | | | | | | | | | | | | | | | | |
University of California Regents Medical Center Series J (Health Revenue) | | | 5.00 | % | | | 5-15-2033 | | | $ | 2,265,000 | | | $ | 2,732,972 | |
University of California Regents Medical Center Series J (Health Revenue) | | | 5.25 | | | | 5-15-2038 | | | | 10,000,000 | | | | 12,176,600 | |
University of California Series AI (Education Revenue) | | | 5.00 | | | | 5-15-2038 | | | | 2,000,000 | | | | 2,432,280 | |
University of California Series K (Education Revenue) | | | 4.00 | | | | 5-15-2046 | | | | 17,000,000 | | | | 19,282,420 | |
Vacaville CA Unified School District (Miscellaneous Revenue, AGC Insured) | | | 6.50 | | | | 12-1-2034 | | | | 1,260,000 | | | | 1,438,126 | |
Vallejo CA Unified School District Refunding Bond Series A (GO Revenue, National Insured) | | | 5.90 | | | | 2-1-2017 | | | | 1,000,000 | | | | 1,029,510 | |
Vallejo CA Refunding Bond (Water & Sewer Revenue) | | | 5.25 | | | | 5-1-2031 | | | | 1,000,000 | | | | 1,218,080 | |
Ventura County CA PFA Series A (Miscellaneous Revenue) | | | 5.00 | | | | 11-1-2038 | | | | 4,250,000 | | | | 5,142,968 | |
Walnut CA Energy Center Authority Series A (Utilities Revenue) | | | 5.00 | | | | 1-1-2034 | | | | 3,115,000 | | | | 3,865,302 | |
Washington Township Health Care District Election of 2004 Series B (GO Revenue) | | | 5.50 | | | | 8-1-2038 | | | | 1,500,000 | | | | 1,886,325 | |
Washington Township Health Care District Series A (Health Revenue) | | | 5.00 | | | | 7-1-2026 | | | | 1,190,000 | | | | 1,449,956 | |
West Contra Costa CA Unified School District (GO Revenue, AGM Insured) | | | 5.25 | | | | 8-1-2024 | | | | 1,350,000 | | | | 1,629,653 | |
West Contra Costa CA Unified School District CAB Election of 2005 Series B (GO Revenue) | | | 6.00 | | | | 8-1-2027 | | | | 1,080,000 | | | | 1,544,843 | |
West Contra Costa CA Unified School District CAB Election of 2005 Series C-1 (GO Revenue, AGC Insured) ¤ | | | 0.00 | | | | 8-1-2021 | | | | 6,000,000 | | | | 5,536,560 | |
Wiseburn CA School District CAB (GO Revenue, AGC Insured) ¤ | | | 0.00 | | | | 8-1-2027 | | | | 1,525,000 | | | | 1,172,527 | |
Yorba Linda CA RDA CAB Series A (Tax Revenue, National Insured) ¤ | | | 0.00 | | | | 9-1-2019 | | | | 2,010,000 | | | | 1,802,447 | |
| | | | |
| | | | | | | | | | | | | | | 1,094,334,316 | |
| | | | | | | | | | | | | | | | |
| | | | |
| Guam: 0.52% | | | | | | | | | | | | | | | | |
Guam Government Business Privilege Tax Series A (Tax Revenue) | | | 5.00 | | | | 1-1-2031 | | | | 1,000,000 | | | | 1,142,140 | |
Guam Government Waterworks Authority (Water & Sewer Revenue) | | | 5.00 | | | | 1-1-2046 | | | | 2,500,000 | | | | 2,988,975 | |
Guam Government Waterworks Authority (Water & Sewer Revenue) | | | 5.25 | | | | 7-1-2033 | | | | 1,500,000 | | | | 1,781,505 | |
| | | | |
| | | | | | | | | | | | | | | 5,912,620 | |
| | | | | | | | | | | | | | | | |
| | | | |
| Illinois: 0.51% | | | | | | | | | | | | | | | | |
Illinois (GO Revenue, AGM Insured) | | | 5.00 | | | | 2-1-2027 | | | | 5,000,000 | | | | 5,800,350 | |
| | | | | | | | | | | | | | | | |
| | | | |
| New York: 0.24% | | | | | | | | | | | | | | | | |
New York NY Transitional Finance Authority Sub Series 2A (Tax Revenue, Dexia Credit Local LIQ) ø | | | 0.60 | | | | 11-1-2022 | | | | 500,000 | | | | 500,000 | |
New York NY Transitional Finance Authority Sub Series 2B (Tax Revenue, Dexia Credit Local SPA) ø | | | 0.56 | | | | 11-1-2022 | | | | 1,000,000 | | | | 1,000,000 | |
New York NY Transitional Finance Authority Sub Series C3 (Tax Revenue, Dexia Credit Local SPA) ø | | | 0.56 | | | | 8-1-2031 | | | | 1,225,000 | | | | 1,225,000 | |
| | | | |
| | | | | | | | | | | | | | | 2,725,000 | |
| | | | | | | | | | | | | | | | |
| | | | |
| Texas: 0.58% | | | | | | | | | | | | | | | | |
Port Arthur TX Navigation District Jefferson County Environmental Facilities Motiva Enterprises LLC Project Series A (Resource Recovery Revenue) ø | | | 0.54 | | | | 12-1-2039 | | | | 5,000,000 | | | | 5,000,000 | |
Port Arthur TX Navigation District Jefferson County Environmental Facilities Motiva Enterprises LLC Project Series C (Resource Recovery Revenue) ø | | | 0.54 | | | | 12-1-2039 | | | | 1,500,000 | | | | 1,500,000 | |
| | | | |
| | | | | | | | | | | | | | | 6,500,000 | |
| | | | | | | | | | | | | | | | |
| | | | |
| Virgin Islands: 0.40% | | | | | | | | | | | | | | | | |
Virgin Islands PFA Matching Fund Loan Note Senior Lien (Miscellaneous Revenue, AGM Insured) | | | 5.00 | | | | 10-1-2029 | | | | 4,000,000 | | | | 4,553,360 | |
| | | | | | | | | | | | | | | | |
| | | | |
Total Municipal Obligations (Cost $998,765,316) | | | | | | | | | | | | | | | 1,119,825,646 | |
| | | | | | | | | | | | | | | | |
The accompanying notes are an integral part of these financial statements.
| | | | | | |
| Portfolio of investments—June 30, 2016 | | Wells Fargo California Tax-Free Fund | | | 19 | |
| | | | | | | | | | | | | | | | |
| Security name | | Interest rate | | | Maturity date | | | Principal | | | Value | |
| | | | |
Other: 0.22% | | | | | | | | | | | | | | | | |
Nuveen California AMT-Free Municipal Income Fund, Institutional MuniFund Term Preferred Shares ±144A§ | | | 0.88 | % | | | 7-1-2018 | | | $ | 2,500,000 | | | $ | 2,490,300 | |
| | | | | | | | | | | | | | | | |
| | | | |
Total Other (Cost $2,500,000) | | | | | | | | | | | | | | | 2,490,300 | |
| | | | | | | | | | | | | | | | |
| | | | |
| | | Yield | | | | | | Shares | | | | |
| Short-Term Investments: 0.48% | | | | | | | | | | | | | | | | |
| | | | |
| Investment Companies: 0.48% | | | | | | | | | | | | | | | | |
Wells Fargo California Municipal Money Market Fund Premier Class ##(l)(u) | | | 0.26 | | | | | | | | 5,467,738 | | | | 5,467,738 | |
| | | | | | | | | | | | | | | | |
| | | | |
Total Short-Term Investments (Cost $5,467,738) | | | | | | | | | | | | | | | 5,467,738 | |
| | | | | | | | | | | | | | | | |
| | | | | | | | |
| Total investments in securities (Cost $1,006,733,054) * | | | 99.62 | % | | | 1,127,783,684 | |
Other assets and liabilities, net | | | 0.38 | | | | 4,245,930 | |
| | | | | | | | |
| Total net assets | | | 100.00 | % | | $ | 1,132,029,614 | |
| | | | | | | | |
| ¤ | The security is issued in zero coupon form with no periodic interest payments. |
| ± | Variable rate investment. The rate shown is the rate in effect at period end. |
| 144A | The security may be resold in transactions exempt from registration, normally to qualified institutional buyers, pursuant to Rule 144A under the Securities Act of 1933. |
| ø | Variable rate demand notes are subject to a demand feature which reduces the effective maturity. The maturity date shown represents the final maturity date of the security. The interest rate is determined and reset by the issuer daily, weekly, or monthly depending upon the terms of the security. The rate shown is the rate in effect at period end. |
| %% | The security is issued on a when-issued basis. |
| ## | All or a portion of this security is segregated for when-issued and/or unfunded loans. |
| § | The security is subject to a demand feature which reduces the effective maturity. |
| (l) | The issuer of the security is an affiliated person of the Fund as defined in the Investment Company Act of 1940. |
| (u) | The rate represents the 7-day annualized yield at period end. |
| * | Cost for federal income tax purposes is $1,006,827,615 and unrealized gains (losses) consists of: |
| | | | |
Gross unrealized gains | | $ | 121,122,007 | |
Gross unrealized losses | | | (165,938 | ) |
| | | | |
Net unrealized gains | | $ | 120,956,069 | |
The accompanying notes are an integral part of these financial statements.
| | | | |
| 20 | | Wells Fargo California Tax-Free Fund | | Statement of assets and liabilities—June 30, 2016 |
| | | | |
| | | | |
| |
Assets | | | | |
Investments | | | | |
In unaffiliated securities, at value (cost $1,001,265,316) | | $ | 1,122,315,946 | |
In affiliated securities, at value (cost $5,467,738) | | | 5,467,738 | |
| | | | |
Total investments, at value (cost $1,006,733,054) | | | 1,127,783,684 | |
Receivable for investments sold | | | 4,258,675 | |
Receivable for Fund shares sold | | | 2,008,043 | |
Receivable for interest | | | 12,213,364 | |
Prepaid expenses and other assets | | | 50,606 | |
| | | | |
Total assets | | | 1,146,314,372 | |
| | | | |
| |
Liabilities | | | | |
Dividends payable | | | 560,417 | |
Payable for investments purchased | | | 11,892,814 | |
Payable for Fund shares redeemed | | | 1,193,231 | |
Management fee payable | | | 259,751 | |
Distribution fees payable | | | 39,500 | |
Administration fees payable | | | 117,278 | |
Accrued expenses and other liabilities | | | 221,767 | |
| | | | |
Total liabilities | | | 14,284,758 | |
| | | | |
Total net assets | | $ | 1,132,029,614 | |
| | | | |
| |
NET ASSETS CONSIST OF | | | | |
Paid-in capital | | $ | 1,020,055,065 | |
Undistributed net investment income | | | 61,771 | |
Accumulated net realized losses on investments | | | (9,137,852 | ) |
Net unrealized gains on investments | | | 121,050,630 | |
| | | | |
Total net assets | | $ | 1,132,029,614 | |
| | | | |
| |
COMPUTATION OF NET ASSET VALUE AND OFFERING PRICE PER SHARE | | | | |
Net assets – Class A | | $ | 528,238,055 | |
Shares outstanding – Class A1 | | | 42,412,545 | |
Net asset value per share – Class A | | | $12.45 | |
Maximum offering price per share – Class A2 | | | $13.04 | |
Net assets – Class B | | $ | 119,782 | |
Shares outstanding – Class B1 | | | 9,425 | |
Net asset value per share – Class B | | | $12.71 | |
Net assets – Class C | | $ | 66,427,466 | |
Shares outstanding – Class C1 | | | 5,229,829 | |
Net asset value per share – Class C | | | $12.70 | |
Net assets – Administrator Class | | $ | 344,090,161 | |
Shares outstanding – Administrator Class1 | | | 27,569,855 | |
Net asset value per share – Administrator Class | | | $12.48 | |
Net assets – Institutional Class | | $ | 193,154,150 | |
Shares outstanding – Institutional Class1 | | | 15,477,659 | |
Net asset value per share – Institutional Class | | | $12.48 | |
| 1 | The Fund has an unlimited number of authorized shares. |
| 2 | Maximum offering price is computed as 100/95.50 of net asset value. On investments of $50,000 or more, the offering price is reduced. |
The accompanying notes are an integral part of these financial statements.
| | | | | | |
| Statement of operations—year ended June 30, 2016 | | Wells Fargo California Tax-Free Fund | | | 21 | |
| | | | |
| | | | |
| |
Investment income | | | | |
Interest | | $ | 36,853,068 | |
Income from affiliated securities | | | 13,508 | |
| | | | |
Total investment income | | | 36,866,576 | |
| | | | |
| |
Expenses | | | | |
Management fee | | | 3,839,848 | |
Administration fees | | | | |
Class A | | | 797,688 | |
Class B | | | 224 | |
Class C | | | 89,882 | |
Administrator Class | | | 270,122 | |
Institutional Class | | | 134,169 | |
Shareholder servicing fees | | | | |
Class A | | | 1,246,387 | |
Class B | | | 350 | |
Class C | | | 140,441 | |
Administrator Class | | | 675,305 | |
Distribution fees | | | | |
Class B | | | 1,050 | |
Class C | | | 421,322 | |
Custody and accounting fees | | | 56,873 | |
Professional fees | | | 53,806 | |
Registration fees | | | 90,420 | |
Shareholder report expenses | | | 14,984 | |
Trustees’ fees and expenses | | | 22,996 | |
Other fees and expenses | | | 16,537 | |
| | | | |
Total expenses | | | 7,872,404 | |
Less: Fee waivers and/or expense reimbursements | | | (997,814 | ) |
| | | | |
Net expenses | | | 6,874,590 | |
| | | | |
Net investment income | | | 29,991,986 | |
| | | | |
| |
REALIZED AND UNREALIZED GAINS (LOSSES) ON INVESTMENTS | | | | |
Net realized gains on investments | | | 1,334,393 | |
Net change in unrealized gains (losses) on investments | | | 55,001,083 | |
| | | | |
Net realized and unrealized gains (losses) on investments | | | 56,335,476 | |
| | | | |
Net increase in net assets resulting from operations | | $ | 86,327,462 | |
| | | | |
The accompanying notes are an integral part of these financial statements.
| | | | |
| 22 | | Wells Fargo California Tax-Free Fund | | Statement of changes in net assets |
| | | | | | | | | | | | | | | | |
| | | Year ended
June 30, 2016 | | | Year ended
June 30, 2015 | |
| | | | |
Operations | | | | | | | | | | | | | | | | |
Net investment income | | | | | | $ | 29,991,986 | | | | | | | $ | 27,212,446 | |
Net realized gains on investments | | | | | | | 1,334,393 | | | | | | | | 2,254,786 | |
Net change in unrealized gains (losses) on investments | | | | | | | 55,001,083 | | | | | | | | (760,677 | ) |
| | | | |
Net increase in net assets resulting from operations | | | | | | | 86,327,462 | | | | | | | | 28,706,555 | |
| | | | |
| | | | |
Distributions to shareholders from | | | | | | | | | | | | | | | | |
Net investment income | | | | | | | | | | | | | | | | |
Class A | | | | | | | (14,775,252 | ) | | | | | | | (15,140,747 | ) |
Class B | | | | | | | (3,113 | ) | | | | | | | (7,112 | ) |
Class C | | | | | | | (1,242,347 | ) | | | | | | | (1,189,812 | ) |
Administrator Class | | | | | | | (8,542,089 | ) | | | | | | | (8,899,925 | ) |
Institutional Class | | | | | | | (5,429,185 | ) | | | | | | | (1,974,850 | )1 |
| | | | |
Total distributions to shareholders | | | | | | | (29,991,986 | ) | | | | | | | (27,212,446 | ) |
| | | | |
| | | | |
Capital share transactions | | | Shares | | | | | | | | Shares | | | | | |
Proceeds from shares sold | | | | | | | | | | | | | | | | |
Class A | | | 7,403,254 | | | | 89,174,570 | | | | 4,711,161 | | | | 56,157,629 | |
Class C | | | 1,564,126 | | | | 19,286,269 | | | | 775,910 | | | | 9,442,120 | |
Administrator Class | | | 15,429,582 | | | | 186,582,017 | | | | 11,314,902 | | | | 135,638,547 | |
Institutional Class | | | 6,601,583 | | | | 79,772,864 | | | | 13,920,921 | 1 | | | 167,143,717 | 1 |
| | | | |
| | | | | | | 374,815,720 | | | | | | | | 368,382,013 | |
| | | | |
Reinvestment of distributions | | | | | | | | | | | | | | | | |
Class A | | | 1,127,394 | | | | 13,600,711 | | | | 1,156,627 | | | | 13,795,754 | |
Class B | | | 231 | | | | 2,839 | | | | 546 | | | | 6,640 | |
Class C | | | 90,135 | | | | 1,109,354 | | | | 87,749 | | | | 1,067,361 | |
Administrator Class | | | 634,427 | | | | 7,682,854 | | | | 487,746 | | | | 5,829,813 | |
Institutional Class | | | 40,832 | | | | 495,242 | | | | 6,023 | 1 | | | 71,726 | 1 |
| | | | |
| | | | | | | 22,891,000 | | | | | | | | 20,771,294 | |
| | | | |
Payment for shares redeemed | | | | | | | | | | | | | | | | |
Class A | | | (6,028,808 | ) | | | (72,871,296 | ) | | | (5,715,891 | ) | | | (68,058,187 | ) |
Class B | | | (4,785 | ) | | | (58,475 | ) | | | (28,490 | ) | | | (345,266 | ) |
Class C | | | (650,067 | ) | | | (7,959,797 | ) | | | (477,683 | ) | | | (5,795,267 | ) |
Administrator Class | | | (6,300,064 | ) | | | (76,074,940 | ) | | | (17,223,780 | ) | | | (206,068,914 | ) |
Institutional Class | | | (3,813,661 | ) | | | (46,003,940 | ) | | | (1,278,039 | )1 | | | (15,297,220 | )1 |
| | | | |
| | | | | | | (202,968,448 | ) | | | | | | | (295,564,854 | ) |
| | | | |
Net increase in net assets resulting from capital share transactions | | | | | | | 194,738,272 | | | | | | | | 93,588,453 | |
| | | | |
Total increase in net assets | | | | | | | 251,073,748 | | | | | | | | 95,082,562 | |
| | | | |
| | | | |
Net assets | | | | | | | | | | | | | | | | |
Beginning of period | | | | | | | 880,955,866 | | | | | | | | 785,873,304 | |
| | | | |
End of period | | | | | | $ | 1,132,029,614 | | | | | | | $ | 880,955,866 | |
| | | | |
Undistributed net investment income | | | | | | $ | 61,771 | | | | | | | $ | 63,314 | |
| | | | |
| 1 | For the period from October 31, 2014 (commencement of class operations) to June 30, 2015 |
The accompanying notes are an integral part of these financial statements.
| | | | | | |
| Financial highlights | | Wells Fargo California Tax-Free Fund | | | 23 | |
(For a share outstanding throughout each period)
| | | | | | | | | | | | | | | | | | | | |
| | | Year ended June 30 | |
| CLASS A | | 2016 | | | 2015 | | | 2014 | | | 2013 | | | 2012 | |
Net asset value, beginning of period | | | $11.79 | | | | $11.73 | | | | $11.21 | | | | $11.37 | | | | $10.53 | |
Net investment income | | | 0.36 | | | | 0.38 | | | | 0.42 | | | | 0.40 | | | | 0.45 | |
Net realized and unrealized gains (losses) on investments | | | 0.66 | | | | 0.06 | | | | 0.52 | | | | (0.16 | ) | | | 0.84 | |
| | | | | | | | | | | | | | | | | | | | |
Total from investment operations | | | 1.02 | | | | 0.44 | | | | 0.94 | | | | 0.24 | | | | 1.29 | |
Distributions to shareholders from | | | | | | | | | | | | | | | | | | | | |
Net investment income | | | (0.36 | ) | | | (0.38 | ) | | | (0.42 | ) | | | (0.40 | ) | | | (0.45 | ) |
Net asset value, end of period | | | $12.45 | | | | $11.79 | | | | $11.73 | | | | $11.21 | | | | $11.37 | |
Total return1 | | | 8.77 | % | | | 3.74 | % | | | 8.58 | % | | | 2.06 | % | | | 12.46 | % |
Ratios to average net assets (annualized) | | | | | | | | | | | | | | | | | | | | |
Gross expenses | | | 0.82 | % | | | 0.83 | % | | | 0.83 | % | | | 0.83 | % | | | 0.83 | % |
Net expenses | | | 0.75 | % | | | 0.75 | % | | | 0.75 | % | | | 0.75 | % | | | 0.75 | % |
Net investment income | | | 2.96 | % | | | 3.17 | % | | | 3.71 | % | | | 3.46 | % | | | 4.08 | % |
Supplemental data | | | | | | | | | | | | | | | | | | | | |
Portfolio turnover rate | | | 17 | % | | | 30 | % | | | 41 | % | | | 23 | % | | | 41 | % |
Net assets, end of period (000s omitted) | | | $528,238 | | | | $470,368 | | | | $466,411 | | | | $506,770 | | | | $512,957 | |
| 1 | Total return calculations do not include any sales charges. |
The accompanying notes are an integral part of these financial statements.
| | | | |
| 24 | | Wells Fargo California Tax-Free Fund | | Financial highlights |
(For a share outstanding throughout each period)
| | | | | | | | | | | | | | | | | | | | |
| | | Year ended June 30 | |
| CLASS B | | 2016 | | | 2015 | | | 2014 | | | 2013 | | | 2012 | |
Net asset value, beginning of period | | | $12.02 | | | | $11.97 | | | | $11.44 | | | | $11.60 | | | | $10.74 | |
Net investment income | | | 0.27 | 1 | | | 0.30 | 1 | | | 0.34 | 1 | | | 0.32 | 1 | | | 0.38 | 1 |
Net realized and unrealized gains (losses) on investments | | | 0.69 | | | | 0.04 | | | | 0.53 | | | | (0.16 | ) | | | 0.86 | |
| | | | | | | | | | | | | | | | | | | | |
Total from investment operations | | | 0.96 | | | | 0.34 | | | | 0.87 | | | | 0.16 | | | | 1.24 | |
Distributions to shareholders from | | | | | | | | | | | | | | | | | | | | |
Net investment income | | | (0.27 | ) | | | (0.29 | ) | | | (0.34 | ) | | | (0.32 | ) | | | (0.38 | ) |
Net asset value, end of period | | | $12.71 | | | | $12.02 | | | | $11.97 | | | | $11.44 | | | | $11.60 | |
Total return2 | | | 8.10 | % | | | 2.87 | % | | | 7.76 | % | | | 1.33 | % | | | 11.66 | % |
Ratios to average net assets (annualized) | | | | | | | | | | | | | | | | | | | | |
Gross expenses | | | 1.57 | % | | | 1.58 | % | | | 1.58 | % | | | 1.58 | % | | | 1.58 | % |
Net expenses | | | 1.50 | % | | | 1.50 | % | | | 1.50 | % | | | 1.50 | % | | | 1.50 | % |
Net investment income | | | 2.22 | % | | | 2.45 | % | | | 2.97 | % | | | 2.72 | % | | | 3.37 | % |
Supplemental data | | | | | | | | | | | | | | | | | | | | |
Portfolio turnover rate | | | 17 | % | | | 30 | % | | | 41 | % | | | 23 | % | | | 41 | % |
Net assets, end of period (000s omitted) | | | $120 | | | | $168 | | | | $502 | | | | $966 | | | | $1,618 | |
| 1 | Calculated based upon average shares outstanding |
| 2 | Total return calculations do not include any sales charges. |
The accompanying notes are an integral part of these financial statements.
| | | | | | |
| Financial highlights | | Wells Fargo California Tax-Free Fund | | | 25 | |
(For a share outstanding throughout each period)
| | | | | | | | | | | | | | | | | | | | |
| | | Year ended June 30 | |
| CLASS C | | 2016 | | | 2015 | | | 2014 | | | 2013 | | | 2012 | |
Net asset value, beginning of period | | | $12.02 | | | | $11.96 | | | | $11.43 | | | | $11.59 | | | | $10.74 | |
Net investment income | | | 0.27 | | | | 0.29 | | | | 0.34 | | | | 0.32 | | | | 0.38 | |
Net realized and unrealized gains (losses) on investments | | | 0.68 | | | | 0.06 | | | | 0.53 | | | | (0.16 | ) | | | 0.85 | |
| | | | | | | | | | | | | | | | | | | | |
Total from investment operations | | | 0.95 | | | | 0.35 | | | | 0.87 | | | | 0.16 | | | | 1.23 | |
Distributions to shareholders from | | | | | | | | | | | | | | | | | | | | |
Net investment income | | | (0.27 | ) | | | (0.29 | ) | | | (0.34 | ) | | | (0.32 | ) | | | (0.38 | ) |
Net asset value, end of period | | | $12.70 | | | | $12.02 | | | | $11.96 | | | | $11.43 | | | | $11.59 | |
Total return1 | | | 8.02 | % | | | 2.96 | % | | | 7.77 | % | | | 1.33 | % | | | 11.56 | % |
Ratios to average net assets (annualized) | | | | | | | | | | | | | | | | | | | | |
Gross expenses | | | 1.57 | % | | | 1.58 | % | | | 1.58 | % | | | 1.58 | % | | | 1.58 | % |
Net expenses | | | 1.50 | % | | | 1.50 | % | | | 1.50 | % | | | 1.50 | % | | | 1.50 | % |
Net investment income | | | 2.21 | % | | | 2.42 | % | | | 2.96 | % | | | 2.70 | % | | | 3.31 | % |
Supplemental data | | | | | | | | | | | | | | | | | | | | |
Portfolio turnover rate | | | 17 | % | | | 30 | % | | | 41 | % | | | 23 | % | | | 41 | % |
Net assets, end of period (000s omitted) | | | $66,427 | | | | $50,787 | | | | $45,934 | | | | $46,050 | | | | $44,920 | |
| 1 | Total return calculations do not include any sales charges. |
The accompanying notes are an integral part of these financial statements.
| | | | |
| 26 | | Wells Fargo California Tax-Free Fund | | Financial highlights |
(For a share outstanding throughout each period)
| | | | | | | | | | | | | | | | | | | | |
| | | Year ended June 30 | |
| ADMINISTRATOR CLASS | | 2016 | | | 2015 | | | 2014 | | | 2013 | | | 2012 | |
Net asset value, beginning of period | | | $11.81 | | | | $11.75 | | | | $11.23 | | | | $11.39 | | | | $10.55 | |
Net investment income | | | 0.38 | | | | 0.40 | | | | 0.44 | | | | 0.43 | | | | 0.48 | |
Net realized and unrealized gains (losses) on investments | | | 0.67 | | | | 0.06 | | | | 0.52 | | | | (0.16 | ) | | | 0.84 | |
| | | | | | | | | | | | | | | | | | | | |
Total from investment operations | | | 1.05 | | | | 0.46 | | | | 0.96 | | | | 0.27 | | | | 1.32 | |
Distributions to shareholders from | | | | | | | | | | | | | | | | | | | | |
Net investment income | | | (0.38 | ) | | | (0.40 | ) | | | (0.44 | ) | | | (0.43 | ) | | | (0.48 | ) |
Net asset value, end of period | | | $12.48 | | | | $11.81 | | | | $11.75 | | | | $11.23 | | | | $11.39 | |
Total return | | | 9.06 | % | | | 3.95 | % | | | 8.79 | % | | | 2.27 | % | | | 12.67 | % |
Ratios to average net assets (annualized) | | | | | | | | | | | | | | | | | | | | |
Gross expenses | | | 0.76 | % | | | 0.77 | % | | | 0.77 | % | | | 0.77 | % | | | 0.76 | % |
Net expenses | | | 0.55 | % | | | 0.55 | % | | | 0.55 | % | | | 0.55 | % | | | 0.55 | % |
Net investment income | | | 3.16 | % | | | 3.39 | % | | | 3.91 | % | | | 3.65 | % | | | 4.26 | % |
Supplemental data | | | | | | | | | | | | | | | | | | | | |
Portfolio turnover rate | | | 17 | % | | | 30 | % | | | 41 | % | | | 23 | % | | | 41 | % |
Net assets, end of period (000s omitted) | | | $344,090 | | | | $210,265 | | | | $273,026 | | | | $231,383 | | | | $179,670 | |
The accompanying notes are an integral part of these financial statements.
| | | | | | |
| Financial highlights | | Wells Fargo California Tax-Free Fund | | | 27 | |
(For a share outstanding throughout each period)
| | | | | | | | |
| | | Year ended June 30 | |
| INSTITUTIONAL CLASS | | 2016 | | | 20151 | |
Net asset value, beginning of period | | | $11.81 | | | | $11.99 | |
Net investment income | | | 0.39 | | | | 0.27 | |
Net realized and unrealized gains (losses) on investments | | | 0.67 | | | | (0.18 | ) |
| | | | | | | | |
Total from investment operations | | | 1.06 | | | | 0.09 | |
Distributions to shareholders from | | | | | | | | |
Net investment income | | | (0.39 | ) | | | (0.27 | ) |
Net asset value, end of period | | | $12.48 | | | | $11.81 | |
Total return2 | | | 9.14 | % | | | 0.72 | % |
Ratios to average net assets (annualized) | | | | | | | | |
Gross expenses | | | 0.49 | % | | | 0.50 | % |
Net expenses | | | 0.48 | % | | | 0.48 | % |
Net investment income | | | 3.24 | % | | | 3.35 | % |
Supplemental data | | | | | | | | |
Portfolio turnover rate | | | 17 | % | | | 30 | % |
Net assets, end of period (000s omitted) | | | $193,154 | | | | $149,368 | |
| 1 | For the period from October 31, 2014 (commencement of class operations) to June 30, 2015 |
| 2 | Returns for periods of less than one year are not annualized. |
The accompanying notes are an integral part of these financial statements.
| | | | |
| 28 | | Wells Fargo California Tax-Free Fund | | Notes to financial statements |
1. ORGANIZATION
Wells Fargo Funds Trust (the “Trust”), a Delaware statutory trust organized on March 10, 1999, is an open-end management investment company registered under the Investment Company Act of 1940, as amended (the “1940 Act”). As an investment company, the Trust follows the accounting and reporting guidance in Financial Accounting Standards Board (“FASB”) Accounting Standards Codification Topic 946, Financial Services – Investment Companies. These financial statements report on the Wells Fargo California Tax-Free Fund (the “Fund”) which is a non-diversified series of the Trust.
2. SIGNIFICANT ACCOUNTING POLICIES
The following significant accounting policies, which are consistently followed in the preparation of the financial statements of the Fund, are in conformity with U.S. generally accepted accounting principles which require management to make estimates and assumptions that affect the reported amounts of assets and liabilities, disclosure of contingent assets and liabilities at the date of the financial statements, and the reported amounts of revenues and expenses during the reporting period. Actual results could differ from those estimates.
Securities valuation
All investments are valued each business day as of the close of regular trading on the New York Stock Exchange (generally 4 p.m. Eastern Time), although a Fund may deviate from this calculation time under unusual or unexpected circumstances.
Debt securities are valued at the evaluated bid price provided by an independent pricing service or, if a reliable price is not available, the quoted bid price from an independent broker-dealer.
Investments in registered open-end investment companies are valued at net asset value.
Investments which are not valued using any of the methods discussed above are valued at their fair value, as determined in good faith by the Board of Trustees of the Fund. The Board of Trustees has established a Valuation Committee comprised of the Trustees and has delegated to it the authority to take any actions regarding the valuation of portfolio securities that the Valuation Committee deems necessary or appropriate, including determining the fair value of portfolio securities, unless the determination has been delegated to the Management Valuation Team of Wells Fargo Funds Management, LLC (“Funds Management”). The Board of Trustees retains the authority to make or ratify any valuation decisions or approve any changes to the Valuation Procedures as it deems appropriate. On a quarterly basis, the Board of Trustees receives reports on any valuation actions taken by the Valuation Committee or the Management Valuation Team which may include items for ratification.
Valuations of fair valued securities are compared to the next actual sales price when available, or other appropriate market values, to assess the continued appropriateness of the fair valuation methodologies used. These securities are fair valued on a day-to-day basis, taking into consideration changes to appropriate market information and any significant changes to the inputs considered in the valuation process until there is a readily available price provided on an exchange or by an independent pricing service. Valuations received from an independent pricing service or independent broker-dealer quotes are periodically validated by comparisons to most recent trades and valuations provided by other independent pricing services in addition to the review of prices by the manager and/or subadviser. Unobservable inputs used in determining fair valuations are identified based on the type of security, taking into consideration factors utilized by market participants in valuing the investment, knowledge about the issuer and the current market environment.
When-issued transactions
The Fund may purchase securities on a forward commitment or when-issued basis. The Fund records a when-issued transaction on the trade date and will segregate assets in an amount at least equal in value to the Fund’s commitment to purchase when-issued securities. Securities purchased on a when-issued basis are marked-to-market daily and the Fund begins earning interest on the settlement date. Losses may arise due to changes in the market value of the underlying securities or if the counterparty does not perform under the contract.
Security transactions and income recognition
Securities transactions are recorded on a trade date basis. Realized gains or losses are recorded on the basis of identified cost.
Interest income is accrued daily and bond discounts are accreted and premiums are amortized daily based on the effective interest method. To the extent debt obligations are placed on non-accrual status, any related interest income may be reduced by writing off interest receivables when the collection of all or a portion of interest has become doubtful based on consistently applied procedures. If the issuer subsequently resumes interest payments or when the collectability of interest is reasonably assured, the debt obligation is removed from non-accrual status.
| | | | | | |
| Notes to financial statements | | Wells Fargo California Tax-Free Fund | | | 29 | |
Distributions to shareholders
Distributions to shareholders from net investment income are accrued daily and paid monthly. Distributions from net realized gains, if any, are recorded on the ex-dividend date. Such distributions are determined in conformity with federal income tax regulations, which may differ in amount or character from net investment income and realized gains recognized for purposes of U.S. generally accepted accounting principles.
Federal and other taxes
The Fund intends to continue to qualify as a regulated investment company by distributing substantially all of its investment company taxable and tax-exempt income and any net realized capital gains (after reduction for capital loss carryforwards) sufficient to relieve it from all, or substantially all, federal income taxes. Accordingly, no provision for federal income taxes was required.
The Fund’s income and federal excise tax returns and all financial records supporting those returns for the prior three fiscal years are subject to examination by the federal and Delaware revenue authorities. Management has analyzed the Fund’s tax positions taken on federal, state, and foreign tax returns for all open tax years and does not believe that there are any uncertain tax positions that require recognition of a tax liability.
Reclassifications are made to the Fund’s capital accounts for permanent tax differences to reflect income and gains available for distribution (or available capital loss carryforwards) under federal income tax regulations. U.S. generally accepted accounting principles require that certain components of net assets be adjusted to reflect permanent differences between financial and tax reporting. At June 30, 2016, as a result of permanent book-to-tax differences, the following reclassification adjustments were made on the Statement of Assets and Liabilities:
| | |
Undistributed net
investment income | | Accumulated net
realized losses
on investments |
| $(1,543) | | $1,543 |
Capital loss carryforwards that do not expire are required to be utilized prior to capital loss carryforwards that expire. As of June 30, 2016, capital loss carryforwards available to offset future net realized capital gains were as follows through the indicated expiration dates:
| | |
2018 | | No expiration |
| | | Short-term |
| $4,667,645 | | $4,375,648 |
Class allocations
The separate classes of shares offered by the Fund differ principally in applicable sales charges, distribution, shareholder servicing, and administration fees. Class specific expenses are charged directly to that share class. Investment income, common expenses, and realized and unrealized gains (losses) on investments are allocated daily to each class of shares based on the relative proportion of net assets of each class.
3. FAIR VALUATION MEASUREMENTS
Fair value measurements of investments are determined within a framework that has established a fair value hierarchy based upon the various data inputs utilized in determining the value of the Fund’s investments. The three-level hierarchy gives the highest priority to unadjusted quoted prices in active markets for identical assets or liabilities (Level 1) and the lowest priority to significant unobservable inputs (Level 3). The Fund’s investments are classified within the fair value hierarchy based on the lowest level of input that is significant to the fair value measurement. The inputs are summarized into three broad levels as follows:
| n | | Level 1 – quoted prices in active markets for identical securities |
| n | | Level 2 – other significant observable inputs (including quoted prices for similar securities, interest rates, prepayment speeds, credit risk, use of amortized cost, etc.) |
| n | | Level 3 – significant unobservable inputs (including the Fund’s own assumptions in determining the fair value of investments) |
The inputs or methodologies used for valuing investments in securities are not necessarily an indication of the risk associated with investing in those securities.
| | | | |
| 30 | | Wells Fargo California Tax-Free Fund | | Notes to financial statements |
The following is a summary of the inputs used in valuing the Fund’s assets and liabilities as of June 30, 2016:
| | | | | | | | | | | | | | | | |
| | | Quoted prices
(Level 1) | | | Other significant
observable inputs
(Level 2) | | | Significant
unobservable inputs
(Level 3) | | | Total | |
Assets | | | | | | | | | | | | | | | | |
Investments in: | | | | | | | | | | | | | | | | |
| | | | |
Municipal obligations | | $ | 0 | | | $ | 1,119,825,646 | | | $ | 0 | | | $ | 1,119,825,646 | |
| | | | |
Other | | | 0 | | | | 2,490,300 | | | | 0 | | | | 2,490,300 | |
| | | | |
Short-term investments | | | | | | | | | | | | | | | | |
Investment companies | | | 5,467,738 | | | | 0 | | | | 0 | | | | 5,467,738 | |
Total assets | | $ | 5,467,738 | | | $ | 1,122,315,946 | | | $ | 0 | | | $ | 1,127,783,684 | |
The Fund recognizes transfers between levels within the fair value hierarchy at the end of the reporting period. At June 30, 2016, the Fund did not have any transfers into/out of Level 1, Level 2, or Level 3.
4. TRANSACTIONS WITH AFFILIATES
Management fee
Funds Management, an indirect wholly owned subsidiary of Wells Fargo & Company (“Wells Fargo”), is the manager of the Fund and provides advisory and fund-level administrative services under an investment management agreement. Under the investment management agreement, Funds Management is responsible for, among other services, implementing the investment objectives and strategies of the Fund, supervising the subadviser, providing fund-level administrative services in connection with the Fund’s operations, and providing any other fund-level administrative services reasonably necessary for the operation of the Fund. As compensation for its services under the investment management agreement, Funds Management is entitled to receive an annual management fee starting at 0.40% and declining to 0.28% as the average daily net assets of the Fund increase. For the year ended June 30, 2016, the management fee was equivalent to an annual rate of 0.39% of the Fund’s average daily net assets.
Funds Management has retained the services of a subadviser to provide daily portfolio management to the Fund. The fee for subadvisory services is borne by Funds Management. Wells Capital Management Incorporated, an affiliate of Funds Management and an indirect wholly owned subsidiary of Wells Fargo, is the subadviser to the Fund and is entitled to receive a fee from Funds Management at an annual rate starting at 0.20% and declining to 0.10% as the average daily net assets of the Fund increase.
Administration fees
Under a class-level administration agreement, Funds Management provides class-level administrative services to the Fund, which includes paying fees and expenses for services provided by the transfer agent, sub-transfer agents, omnibus account servicers and record-keepers. As compensation for its services under the class-level administration agreement, Funds Management receives an annual fee which is calculated based on the average daily net assets of each class as follows:
| | | | |
| | | Class-level
administration fee | |
Class A, Class B, Class C | | | 0.16 | % |
Administrator Class | | | 0.10 | |
Institutional Class | | | 0.08 | |
Funds Management has contractually waived and/or reimbursed management and administration fees to the extent necessary to maintain certain net operating expense ratios for the Fund. Waiver of fees and/or reimbursement of expenses by Funds Management were made first from fund level expenses on a proportionate basis and then from class specific expenses. Funds Management has committed through October 31, 2016 to waive fees and/or reimburse expenses to the extent necessary to cap the Fund’s expenses at 0.75% for Class A shares, 1.50% for Class B shares, 1.50% for Class C shares, 0.55% for Administrator Class, and 0.48% for Institutional Class shares. After this time, the cap may be increased or the commitment to maintain the cap may be terminated only with the approval of the Board of Trustees.
| | | | | | |
| Notes to financial statements | | Wells Fargo California Tax-Free Fund | | | 31 | |
Distribution fees
The Trust has adopted a distribution plan for Class B and Class C shares of the Fund pursuant to Rule 12b-1 under the 1940 Act. Distribution fees are charged to Class B and Class C shares and paid to Wells Fargo Funds Distributor, LLC (“Funds Distributor”), the principal underwriter, at an annual rate of 0.75% of the average daily net assets of Class B and Class C shares.
In addition, Funds Distributor is entitled to receive the front-end sales charge from the purchase of Class A shares and a contingent deferred sales charge on the redemption of certain Class A shares. Funds Distributor is also entitled to receive the contingent deferred sales charges from redemptions of Class B and Class C shares. For the year ended June 30, 2016, Funds Distributor received $33,137 from the sale of Class A shares and $1,784 in contingent deferred sales charges from redemptions of Class C shares.
Shareholder servicing fees
The Trust has entered into contracts with one or more shareholder servicing agents, whereby Class A, Class B, Class C, and Administrator Class of the Fund are charged a fee at an annual rate of 0.25% of the average daily net assets of each respective class
A portion of these total shareholder servicing fees were paid to affiliates of Wells Fargo.
5. INVESTMENT PORTFOLIO TRANSACTIONS
Purchases and sales of investments, excluding U.S. government obligations (if any) and short-term securities, for the year ended June 30, 2016 were $379,562,717 and $153,405,944, respectively.
The Fund may purchase or sell investment securities to other Wells Fargo funds under procedures adopted by the Board of Trustees. The procedures have been designed to ensure that these interfund transactions, which generally do not incur broker commissions, are effected at current market prices. Interfund trades are included within the respective purchases and sales amounts shown.
6. BANK BORROWINGS
The Trust (excluding the money market funds and certain other funds) and Wells Fargo Variable Trust are parties to a $200,000,000 revolving credit agreement whereby the Fund is permitted to use bank borrowings for temporary or emergency purposes, such as to fund shareholder redemption requests. Interest under the credit agreement is charged to the Fund based on a borrowing rate equal to the higher of the Federal Funds rate in effect on that day plus 1.25% or the overnight LIBOR rate in effect on that day plus 1.25%. In addition, an annual commitment fee equal to 0.20% of the unused balance is allocated to each participating fund. Prior to September 1, 2015, the revolving credit agreement amount was $150,000,000 and the annual commitment fee was equal to 0.10% of the unused balance which was allocated to each participating fund
For the year ended June 30, 2016, there were no borrowings by the Fund under the agreement.
7. DISTRIBUTIONS TO SHAREHOLDERS
The tax character of distributions paid was $29,991,986 and $27,212,446 of exempt-interest income for the years ended June 30, 2016 and June 30, 2015, respectively.
As of June 30, 2016, the components of distributable earnings on a tax basis were as follows:
| | | | |
Undistributed tax-exempt income | | Unrealized gains | | Capital loss carryforward |
| $623,498 | | $120,956,069 | | $(9,043,293) |
8. CONCENTRATION RISK
The Fund invests a substantial portion of its assets in issuers of municipal debt securities located in a single state or territories of the U.S. Therefore, it may be more affected by economic and political developments in that state or region than would be a comparable general tax-exempt fund.
| | | | |
| 32 | | Wells Fargo California Tax-Free Fund | | Notes to financial statements |
9. INDEMNIFICATION
Under the Trust’s organizational documents, the officers and Trustees have been granted certain indemnification rights against certain liabilities that may arise out of performance of their duties to the Trust. Additionally, in the normal course of business, the Trust may enter into contracts with service providers that contain a variety of indemnification clauses. The Trust’s maximum exposure under these arrangements is dependent on future claims that may be made against the Fund and, therefore, cannot be estimated.
| | | | | | |
| Report of independent registered public accounting firm | | Wells Fargo California Tax-Free Fund | | | 33 | |
BOARD OF TRUSTEES AND SHAREHOLDERS OF WELLS FARGO FUNDS TRUST:
We have audited the accompanying statement of assets and liabilities, including the portfolio of investments, of the Wells Fargo California Tax-Free Fund (formerly known as Wells Fargo Advantage California Tax-Free Fund) (the “Fund”), one of the funds constituting the Wells Fargo Funds Trust, as of June 30, 2016, and the related statement of operations for the year then ended, the statements of changes in net assets for each of the years in the two-year period then ended, and the financial highlights for each of the years in the five-year period then ended. These financial statements and financial highlights are the responsibility of the Fund’s management. Our responsibility is to express an opinion on these financial statements and financial highlights based on our audits.
We conducted our audits in accordance with the standards of the Public Company Accounting Oversight Board (United States). Those standards require that we plan and perform the audit to obtain reasonable assurance about whether the financial statements and financial highlights are free of material misstatement. An audit includes examining, on a test basis, evidence supporting the amounts and disclosures in the financial statements. Our procedures included confirmation of securities owned as of June 30, 2016, by correspondence with custodians and brokers, or by other appropriate auditing procedures. An audit also includes assessing the accounting principles used and significant estimates made by management, as well as evaluating the overall financial statement presentation. We believe that our audits provide a reasonable basis for our opinion.
In our opinion, the financial statements and financial highlights referred to above present fairly, in all material respects, the financial position of the Wells Fargo California Tax-Free Fund as of June 30, 2016, and the results of its operations for the year then ended, the changes in its net assets for each of the years in the two-year period then ended, and the financial highlights for each of the years in the five-year period then ended, in conformity with U.S. generally accepted accounting principles.

Boston, Massachusetts
August 25, 2016
| | | | |
| 34 | | Wells Fargo California Tax-Free Fund | | Other information (unaudited) |
TAX INFORMATION
Pursuant to Section 852 of the Internal Revenue Code, 100% of distributions paid from net investment income is designated as exempt-interest dividends for the fiscal year ended June 30, 2016.
PROXY VOTING INFORMATION
A description of the policies and procedures that the Fund uses to determine how to vote proxies relating to portfolio securities is available, upon request, by calling 1-800-222-8222, visiting our website at wellsfargofunds.com, or visiting the SEC website at sec.gov. Information regarding how the Fund voted proxies relating to portfolio securities during the most recent 12-month period ended June 30 is available on the Fund’s website at wellsfargofunds.com or by visiting the SEC website at sec.gov.
PORTFOLIO HOLDINGS INFORMATION
The complete portfolio holdings for the Fund are publicly available monthly on the Fund’s website (wellsfargofunds.com), on a one-month delayed basis. In addition, top ten holdings information (excluding derivative positions) for the Fund is publicly available on the Fund’s website on a monthly, seven-day or more delayed basis. The Fund files its complete schedule of portfolio holdings with the SEC for the first and third quarters of each fiscal year on Form N-Q, which is available by visiting the SEC website at sec.gov. In addition, the Fund’s Form N-Q may be reviewed and copied at the SEC’s Public Reference Room in Washington, DC, and at regional offices in New York City, at 233 Broadway, and in Chicago, at 175 West Jackson Boulevard, Suite 900. Information about the Public Reference Room may be obtained by calling 1-800-SEC-0330.
| | | | | | |
| Other information (unaudited) | | Wells Fargo California Tax-Free Fund | | | 35 | |
BOARD OF TRUSTEES AND OFFICERS
Each of the Trustees and Officers1 listed in the table below acts in identical capacities for each fund in the Wells Fargo family of funds, which consists of 142 mutual funds comprising the Wells Fargo Funds Trust, Wells Fargo Variable Trust, Wells Fargo Master Trust and four closed-end funds (collectively the “Fund Complex”). This table should be read in conjunction with the Prospectus and the Statement of Additional Information2. The mailing address of each Trustee and Officer is 525 Market Street, 12th Floor, San Francisco, CA 94105. Each Trustee and Officer serves an indefinite term, however, each Trustee serves such term until reaching the mandatory retirement age established by the Trustees.
Independent Trustees
| | | | | | |
Name and
year of birth | | Position held and
length of service* | | Principal occupations during past five years or longer | | Current other public
company or investment
company directorships |
William R. Ebsworth (Born 1957) | | Trustee, since 2015 | | Retired. From 1984 to 2013, equities analyst, portfolio manager, research director and chief financial officer at Fidelity Management and Research Company in Boston, Tokyo, and Hong Kong and retired in 2013 as Chief Investment Officer of Fidelity Strategic Advisers, Inc. where he lead a team of investment professionals managing client assets. Prior thereto, Board member of Hong Kong Securities Clearing Co., Hong Kong Options Clearing Corp., the Thailand International Fund, Ltd., Fidelity Investments Life Insurance Company, and Empire Fidelity Investments Life Insurance Company. Mr. Ebsworth is a CFA® charterholder and an Adjunct Lecturer, Finance, at Babson College. | | Asset Allocation Trust |
Jane A. Freeman (Born 1953) | | Trustee, since 2015 | | Retired. From 2012 to 2014 and 1999 to 2008, Chief Financial Officer of Scientific Learning Corporation. From 2008 to 2012, Ms. Freeman provided consulting services related to strategic business projects. Prior to 1999, Portfolio Manager at Rockefeller & Co. and Scudder, Stevens & Clark. Board member of the Harding Loevner Funds from 1996 to 2014, serving as both Lead Independent Director and chair of the Audit Committee. Board member of the Russell Exchange Traded Funds Trust from 2011 to 2012 and the chair of the Audit Committee. Ms. Freeman is Chair of Taproot Foundation (non-profit organization), a Board Member of Ruth Bancroft Garden (non-profit organization) and an inactive chartered financial analyst. | | Asset Allocation Trust |
Peter G. Gordon (Born 1942) | | Trustee, since 1998; Chairman, since 2005 | | Co-Founder, Retired Chairman, President and CEO of Crystal Geyser Water Company. Trustee Emeritus, Colby College. | | Asset Allocation Trust |
Isaiah Harris, Jr. (Born 1952) | | Trustee, since 2009 | | Retired. Chairman of the Board of CIGNA Corporation since 2009, and Director since 2005. From 2003 to 2011, Director of Deluxe Corporation. Prior thereto, President and CEO of BellSouth Advertising and Publishing Corp. from 2005 to 2007, President and CEO of BellSouth Enterprises from 2004 to 2005 and President of BellSouth Consumer Services from 2000 to 2003. Emeritus member of the Iowa State University Foundation Board of Governors. Emeritus Member of the Advisory Board of Iowa State University School of Business. Advisory Board Member, Palm Harbor Academy (charter school). Advisory Board Member, Child Evangelism Fellowship (non-profit). Mr. Harris is a certified public accountant (inactive status). | | CIGNA Corporation; Asset Allocation Trust |
Judith M. Johnson (Born 1949) | | Trustee, since 2008; Audit Committee Chairman, since 2008 | | Retired. Prior thereto, Chief Executive Officer and Chief Investment Officer of Minneapolis Employees Retirement Fund from 1996 to 2008. Ms. Johnson is an attorney, certified public accountant and a certified managerial accountant. | | Asset Allocation Trust |
David F. Larcker (Born 1950) | | Trustee, since 2009 | | James Irvin Miller Professor of Accounting at the Graduate School of Business, Stanford University, Director of the Corporate Governance Research Initiative and Senior Faculty of The Rock Center for Corporate Governance since 2006. From 2005 to 2008, Professor of Accounting at the Graduate School of Business, Stanford University. Prior thereto, Ernst & Young Professor of Accounting at The Wharton School, University of Pennsylvania from 1985 to 2005. | | Asset Allocation Trust |
| | | | |
| 36 | | Wells Fargo California Tax-Free Fund | | Other information (unaudited) |
| | | | | | |
Name and
year of birth | | Position held and
length of service* | | Principal occupations during past five years or longer | | Current other public
company or investment
company directorships |
Olivia S. Mitchell (Born 1953) | | Trustee, since 2006 | | International Foundation of Employee Benefit Plans Professor, Wharton School of the University of Pennsylvania since 1993. Director of Wharton’s Pension Research Council and Boettner Center on Pensions & Retirement Research, and Research Associate at the National Bureau of Economic Research. Previously, Cornell University Professor from 1978 to 1993. | | Asset Allocation Trust |
Timothy J. Penny (Born 1951) | | Trustee, since 1996 | | President and Chief Executive Officer of Southern Minnesota Initiative Foundation, a non-profit organization, since 2007 and Senior Fellow at the Humphrey Institute Policy Forum at the University of Minnesota since 1995. Member of the Board of Trustees of NorthStar Education Finance, Inc., a non-profit organization, since 2007. | | Asset Allocation Trust |
Michael S. Scofield (Born 1943) | | Trustee, since 2010 | | Served on the Investment Company Institute’s Board of Governors and Executive Committee from 2008-2011 as well the Governing Council of the Independent Directors Council from 2006-2011 and the Independent Directors Council Executive Committee from 2008-2011. Chairman of the IDC from 2008-2010. Institutional Investor (Fund Directions) Trustee of Year in 2007. Trustee of the Evergreen Funds complex (and its predecessors) from 1984 to 2010. Chairman of the Evergreen Funds from 2000-2010. Former Trustee of the Mentor Funds. Retired Attorney, Law Offices of Michael S. Scofield. | | Asset Allocation Trust |
| * | Length of service dates reflect the Trustee’s commencement of service with the Trust’s predecessor entities, where applicable. |
Officers
| | | | | | |
Name and
year of birth | | Position held and
length of service | | Principal occupations during past five years or longer | | |
Karla M. Rabusch (Born 1959) | | President, since 2003 | | Executive Vice President of Wells Fargo Bank, N.A. and President of Wells Fargo Funds Management, LLC since 2003. | | |
Nancy Wiser1 (Born 1967) | | Treasurer, since 2012 | | Executive Vice President of Wells Fargo Funds Management, LLC since 2011. Chief Operating Officer and Chief Compliance Officer at LightBox Capital Management LLC, from 2008 to 2011. | | |
C. David Messman (Born 1960) | | Secretary, since 2000; Chief Legal Officer, since 2003 | | Senior Vice President and Secretary of Wells Fargo Funds Management, LLC since 2001. Assistant General Counsel of Wells Fargo Bank, N.A. since 2013 and Vice President and Managing Counsel of Wells Fargo Bank, N.A. from 1996 to 2013. | | |
Michael Whitaker (Born 1967) | | Chief Compliance Officer, since 2016* | | Executive Vice President of Wells Fargo Funds Management, LLC since 2016. Chief Compliance Officer of Fidelity’s Fixed Income Funds and Asset Allocation Funds from 2008 to 2016, Compliance Officer of FMR Co., Inc. from 2014 to 2016, Fidelity Investments Money Management, Inc. from 2014 to 2016, Fidelity Investments from 2007 to 2016. | | |
David Berardi (Born 1975) | | Assistant Treasurer, since 2009 | | Vice President of Wells Fargo Funds Management, LLC since 2009. Vice President of Evergreen Investment Management Company, LLC from 2008 to 2010. Manager of Fund Reporting and Control for Evergreen Investment Management Company, LLC from 2004 to 2010. | | |
Jeremy DePalma1 (Born 1974) | | Assistant Treasurer, since 2009 | | Senior Vice President of Wells Fargo Funds Management, LLC since 2009. Senior Vice President of Evergreen Investment Management Company, LLC from 2008 to 2010 and head of the Fund Reporting and Control Team within Fund Administration from 2005 to 2010. | | |
| 1 | Nancy Wiser acts as Treasurer of 73 funds in the Fund Complex. Jeremy DePalma acts as Treasurer of 69 funds and Assistant Treasurer of 73 funds in the Fund Complex. |
| 2 | The Statement of Additional Information includes additional information about the Trustees and is available, without charge, upon request, by calling 1-800-222-8222 or by visiting the website at wellsfargofunds.com. |
| * | Michael Whitaker became Chief Compliance Officer effective May 16, 2016. |
| | | | | | |
| Other information (unaudited) | | Wells Fargo California Tax-Free Fund | | | 37 | |
BOARD CONSIDERATION OF INVESTMENT MANAGEMENT AND SUB-ADVISORY AGREEMENTS:
Under the Investment Company Act of 1940 (the “1940 Act”), the Board of Trustees (the “Board”) of Wells Fargo Funds Trust (the “Trust”) must determine annually whether to approve the continuation of the Trust’s investment management and sub-advisory agreements. In this regard, at an in-person meeting held on May 24-25, 2016 (the “Meeting”), the Board, all the members of which have no direct or indirect interest in the investment management and sub-advisory agreements and are not “interested persons” of the Trust, as defined in the 1940 Act (the “Independent Trustees”), reviewed and approved for Wells Fargo California Tax-Free Fund (the “Fund”): (i) an investment management agreement (the “Management Agreement”) with Wells Fargo Funds Management, LLC (“Funds Management”); and (ii) an investment sub-advisory agreement (the “Sub-Advisory Agreement”) with Wells Capital Management Incorporated (the “Sub-Adviser”), an affiliate of Funds Management. The Management Agreement and the Sub-Advisory Agreement are collectively referred to as the “Advisory Agreements.”
At the Meeting, the Board considered the factors and reached the conclusions described below relating to the selection of Funds Management and the Sub-Adviser and the approval of the Advisory Agreements. Prior to the Meeting, including at an in-person meeting in April 2016, the Trustees conferred extensively among themselves and with representatives of Funds Management about these matters. Also, the Board has adopted a team-based approach, with each team consisting of a sub-set of Trustees, to assist the full Board in the discharge of its duties in reviewing performance and other matters throughout the year. The Independent Trustees were assisted in their evaluation of the Advisory Agreements by independent legal counsel, from whom they received separate legal advice and with whom they met separately.
In providing information to the Board, Funds Management and the Sub-Adviser were guided by a detailed set of requests for information submitted to them by independent legal counsel on behalf of the Independent Trustees at the start of the Board’s annual contract renewal process earlier in 2016. In considering and approving the Advisory Agreements, the Trustees considered the information they believed relevant, including but not limited to the information discussed below. The Board considered not only the specific information presented in connection with the Meeting, but also the knowledge gained over time through interaction with Funds Management and the Sub-Adviser about various topics. In this regard, the Board reviewed reports of Funds Management at each of its quarterly meetings, which included, among other things, portfolio reviews and performance reports. In addition, the Board and the teams mentioned above confer with portfolio managers at various times throughout the year. The Board did not identify any particular information or consideration that was all-important or controlling, and each individual Trustee may have attributed different weights to various factors.
After its deliberations, the Board unanimously approved the continuation of the Advisory Agreements for a one-year term and determined that the compensation payable to Funds Management and the Sub-Adviser under each of the Advisory Agreements was reasonable. The Board considered the approval of the Advisory Agreements for the Fund as part of its consideration of agreements for funds across the complex, but its approvals were made on a fund-by-fund basis. The following summarizes a number of important, but not necessarily all, factors considered by the Board in support of its approvals.
Nature, extent and quality of services
The Board received and considered various information regarding the nature, extent and quality of services provided to the Fund by Funds Management and the Sub-Adviser under the Advisory Agreements. This information included a description of the investment advisory services and Fund-level administrative services covered by the Management Agreement, as well as, among other things, a summary of the background and experience of senior management of Funds Management, and the qualifications, background, tenure and responsibilities of each of the portfolio managers primarily responsible for the day-to-day portfolio management of the Fund.
The Board evaluated the ability of Funds Management and the Sub-Adviser to attract and retain qualified investment professionals, including research, advisory and supervisory personnel. The Board further considered the compliance programs and compliance records of Funds Management and the Sub-Adviser. In addition, the Board took into account the full range of services provided to the Fund by Funds Management and its affiliates.
Fund performance and expenses
The Board considered the performance results for the Fund over various time periods ended December 31, 2015. The Board considered these results in comparison to the performance of funds in a universe that was determined by Broadridge Inc. (“Broadridge”) to be similar to the Fund (the “Universe”), and in comparison to the Fund’s benchmark index and to other comparative data. Broadridge is an independent provider of investment company data. The Board received a description of the methodology used by Broadridge to select the mutual funds in the performance Universe.
| | | | |
| 38 | | Wells Fargo California Tax-Free Fund | | Other information (unaudited) |
The Board noted that the performance of the Fund (Administrator Class) was higher than or in range of the average performance of the Universe for all periods under review. The Board also noted that the performance of the Fund was higher than its benchmark, the Barclays Municipal Bond Index, for all periods under review.
The Board also received and considered information regarding the Fund’s net operating expense ratios and their various components, including actual management fees, custodian and other non-management fees, and Rule 12b-1 and non-Rule 12b-1 shareholder service fees. The Board considered these ratios in comparison to the median ratios of funds in class-specific expense groups that were determined by Broadridge to be similar to the Fund (the “Groups”). The Board received a description of the methodology used by Broadridge to select the mutual funds in the expense Groups and an explanation of how funds comprising expense groups and their expense ratios may vary from year-to-year. Based on the Broadridge reports, the Board noted that the net operating expense ratios of the Fund were lower than the median net operating expense ratios of the expense Groups.
The Board took into account the Fund performance and expense information provided to it among the factors considered in deciding to re-approve the Advisory Agreements.
Investment management and sub-advisory fee rates
The Board reviewed and considered the contractual fee rates payable by the Fund to Funds Management under the Management Agreement, as well as the contractual fee rates payable by the Fund to Funds Management for class-level administrative services under a Class-Level Administration Agreement, which include class-level transfer agency and sub-transfer agency costs (collectively, the “Management Rates”). The Board also reviewed and considered the contractual investment sub-advisory fee rates that are payable by Funds Management to the Sub-Adviser for investment sub-advisory services.
Among other information reviewed by the Board was a comparison of the Fund’s Management Rates with the average contractual investment management fee rates of funds in the expense Groups at a common asset level as well as transfer agency costs of the funds in the expense Groups. The Board noted that the Management Rates of the Fund were lower than or in range of the sum of these average rates for the Fund’s expense Groups for all share classes.
The Board also received and considered information about the portion of the total management fee that was retained by Funds Management after payment of the fee to the Sub-Adviser for sub-advisory services. In assessing the reasonableness of this amount, the Board received and evaluated information about the nature and extent of responsibilities retained and risks assumed by Funds Management and not delegated to or assumed by the Sub-Adviser, and about Funds Management’s on-going oversight services. However, given the affiliation between Funds Management and the Sub-Adviser, the Board ascribed limited relevance to the allocation of fees between them.
The Board also received and considered information about the nature and extent of services offered and fee rates charged by Funds Management and the Sub-Adviser to other types of clients with investment strategies similar to those of the Fund. In this regard, the Board received information about the significantly greater scope of services, and compliance, reporting and other legal burdens and risks of managing mutual funds compared with those associated with managing assets of non-mutual fund clients such as collective funds or institutional separate accounts.
Based on its consideration of the factors and information it deemed relevant, including those described here, the Board determined that the compensation payable to Funds Management under the Management Agreement and to the Sub-Adviser under the Sub-Advisory Agreement was reasonable, in light of the services covered by the Advisory Agreements.
Profitability
The Board received and considered information concerning the profitability of Funds Management, as well as the profitability of Wells Fargo as a whole, from providing services to the Fund and the fund family as a whole. The Board also received and considered information concerning the profitability of the Sub-Adviser from providing services to the fund family as a whole, noting that the Sub-Adviser’s profitability information with respect to providing services to the Fund was subsumed in the Wells Fargo and Funds Management profitability analysis.
Funds Management reported on the methodologies and estimates used in calculating profitability. Among other things, the Board noted that the levels of profitability reported on a fund-by-fund basis varied widely, depending on factors such as the size and type of fund. Based on its review, the Board did not deem the profits reported by Funds Management or Wells Fargo from its services to the Fund to be at a level that would prevent it from approving the continuation of the Advisory Agreements.
| | | | | | |
| Other information (unaudited) | | Wells Fargo California Tax-Free Fund | | | 39 | |
Economies of scale
With respect to possible economies of scale, the Board noted the existence of breakpoints in the Fund’s management fee structure, which operate generally to reduce the Fund’s expense ratios as the Fund grows in size. It considered that, for a small fund or a fund that shrinks in size, breakpoints conversely can result in higher fee levels. The Board also considered that fee waiver and expense reimbursement arrangements and competitive fee rates at the outset are means of sharing potential economies of scale with shareholders of the Fund and the fund family as a whole. The Board considered Funds Management’s view that any analyses of potential economies of scale in managing a particular fund are inherently limited in light of the joint and common costs and investments that Funds Management incurs across the fund family as a whole.
The Board concluded that the Fund’s fee and expense arrangements, including contractual breakpoints, constituted a reasonable approach to sharing potential economies of scale with the Fund and its shareholders.
Other benefits to Funds Management and the Sub-Adviser
The Board received and considered information regarding potential “fall-out” or ancillary benefits received by Funds Management and its affiliates, including the Sub-Adviser, as a result of their relationships with the Fund. Ancillary benefits could include, among others, benefits directly attributable to other relationships with the Fund and benefits potentially derived from an increase in Funds Management’s and the Sub-Adviser’s business as a result of their relationships with the Fund. The Board noted that various affiliates of Funds Management may receive distribution-related fees, shareholder servicing payments and sub-transfer agency fees in respect of shares sold or held through them and services provided.
The Board also reviewed information about soft dollar credits earned and utilized by the Sub-Adviser, fees earned by Funds Management and the Sub-Adviser from managing a private investment vehicle for the fund family’s securities lending collateral and commissions earned by an affiliated broker from portfolio transactions.
Based on its consideration of the factors and information it deemed relevant, including those described here, the Board did not find that any ancillary benefits received by Funds Management and its affiliates, including the Sub-Adviser, were unreasonable.
Conclusion
At the Meeting, after considering the above-described factors and based on its deliberations and its evaluation of the information described above, the Board unanimously approved the continuation of the Advisory Agreements for a one-year term and determined that the compensation payable to Funds Management and the Sub-Adviser under each of the Advisory Agreements was reasonable.
| | | | |
| 40 | | Wells Fargo California Tax-Free Fund | | List of abbreviations |
The following is a list of common abbreviations for terms and entities that may have appeared in this report.
| ACA | — ACA Financial Guaranty Corporation |
| ADR | — American depositary receipt |
| ADS | — American depositary shares |
| AGC | — Assured Guaranty Corporation |
| AGM | — Assured Guaranty Municipal |
| Ambac | — Ambac Financial Group Incorporated |
| AMT | — Alternative minimum tax |
| BAN | — Bond anticipation notes |
| BHAC | — Berkshire Hathaway Assurance Corporation |
| CAB | — Capital appreciation bond |
| CCAB | — Convertible capital appreciation bond |
| CDA | — Community Development Authority |
| CDO | — Collateralized debt obligation |
| DRIVER | — Derivative inverse tax-exempt receipts |
| DW&P | — Department of Water & Power |
| DWR | — Department of Water Resources |
| ECFA | — Educational & Cultural Facilities Authority |
| EDA | — Economic Development Authority |
| EDFA | — Economic Development Finance Authority |
| ETF | — Exchange-traded fund |
| FDIC | — Federal Deposit Insurance Corporation |
| FFCB | — Federal Farm Credit Banks |
| FGIC | — Financial Guaranty Insurance Corporation |
| FHA | — Federal Housing Administration |
| FHLB | — Federal Home Loan Bank |
| FHLMC | — Federal Home Loan Mortgage Corporation |
| FICO | — The Financing Corporation |
| FNMA | — Federal National Mortgage Association |
| GDR | — Global depositary receipt |
| GNMA | — Government National Mortgage Association |
| HCFR | — Healthcare facilities revenue |
| HEFA | — Health & Educational Facilities Authority |
| HEFAR | — Higher education facilities authority revenue |
| HFA | — Housing Finance Authority |
| HFFA | — Health Facilities Financing Authority |
| HUD | — Department of Housing and Urban Development |
| IDA | — Industrial Development Authority |
| IDAG | — Industrial Development Agency |
| KRW | — Republic of Korea won |
| LIBOR | — London Interbank Offered Rate |
| LIFER | — Long Inverse Floating Exempt Receipts |
| LLC | — Limited liability company |
| LLLP | — Limited liability limited partnership |
| LLP | — Limited liability partnership |
| MBIA | — Municipal Bond Insurance Association |
| MFHR | — Multifamily housing revenue |
| MSTR | — Municipal securities trust receipts |
| MUD | — Municipal Utility District |
| National | — National Public Finance Guarantee Corporation |
| PCFA | — Pollution Control Financing Authority |
| PCL | — Public Company Limited |
| PCR | — Pollution control revenue |
| PFA | — Public Finance Authority |
| PFFA | — Public Facilities Financing Authority |
| PFOTER | — Puttable floating option tax-exempt receipts |
| plc | — Public limited company |
| PUTTER | — Puttable tax-exempt receipts |
| R&D | — Research & development |
| Radian | — Radian Asset Assurance |
| RAN | — Revenue anticipation notes |
| RDA | — Redevelopment Authority |
| RDFA | — Redevelopment Finance Authority |
| REIT | — Real estate investment trust |
| ROC | — Reset option certificates |
| SAVRS | — Select auction variable rate securities |
| SBA | — Small Business Authority |
| SDR | — Swedish depositary receipt |
| SFHR | — Single-family housing revenue |
| SFMR | — Single-family mortgage revenue |
| SPA | — Standby purchase agreement |
| SPDR | — Standard & Poor’s Depositary Receipts |
| SPEAR | — Short Puttable Exempt Adjustable Receipts |
| STRIPS | — Separate trading of registered interest and |
| TAN | — Tax anticipation notes |
| TIPS | — Treasury inflation-protected securities |
| TRAN | — Tax revenue anticipation notes |
| TTFA | — Transportation Trust Fund Authority |
| TVA | — Tennessee Valley Authority |

For more information
More information about Wells Fargo Funds is available free upon request. To obtain literature, please write, email, visit the Fund’s website, or call:
Wells Fargo Funds
P.O. Box 8266
Boston, MA 02266-8266
Email: fundservice@wellsfargo.com
Website: wellsfargofunds.com
Individual investors: 1-800-222-8222
Retail investment professionals: 1-888-877-9275
Institutional investment professionals: 1-866-765-0778
This report and the financial statements contained herein are submitted for the general information of the shareholders of the Fund. If this report is used for promotional purposes, distribution of the report must be accompanied or preceded by a current prospectus. Before investing, please consider the investment objectives, risks, charges, and expenses of the investment. For a current prospectus and, if available, a summary prospectus, containing this information, call 1-800-222-8222 or visit the Fund’s website at wellsfargofunds.com. Read the prospectus carefully before you invest or send money.
Wells Fargo Asset Management (WFAM) is a trade name used by the asset management businesses of Wells Fargo & Company. Wells Fargo Funds Management, LLC, a wholly owned subsidiary of Wells Fargo & Company, provides investment advisory and administrative services for Wells Fargo Funds. Other affiliates of Wells Fargo & Company provide subadvisory and other services for the funds. The funds are distributed by Wells Fargo Funds Distributor, LLC, Member FINRA, an affiliate of Wells Fargo & Company.
NOT FDIC INSURED ¡ NO BANK GUARANTEE ¡ MAY LOSE VALUE
© 2016 Wells Fargo Funds Management, LLC. All rights reserved.
| | |
 | | 244401 08-16 A249/AR249 6-16 |
Annual Report
June 30, 2016

Wells Fargo Colorado Tax-Free Fund


Reduce clutter. Save trees.
Sign up for electronic delivery of prospectuses and shareholder reports at wellsfargo.com/advantagedelivery
Contents
The views expressed and any forward-looking statements are as of June 30, 2016, unless otherwise noted, and are those of the Fund managers and/or Wells Fargo Funds Management, LLC. Discussions of individual securities, or the markets generally, or any Wells Fargo Fund are not intended as individual recommendations. Future events or results may vary significantly from those expressed in any forward-looking statements. The views expressed are subject to change at any time in response to changing circumstances in the market. Wells Fargo Funds Management, LLC and the Fund disclaim any obligation to publicly update or revise any views expressed or forward-looking statements.
NOT FDIC INSURED ¡ NO BANK GUARANTEE ¡ MAY LOSE VALUE
| | | | |
| 2 | | Wells Fargo Colorado Tax-Free Fund | | Letter to shareholders (unaudited) |

Karla M. Rabusch
President
Wells Fargo Funds
In fact, yields on municipal bonds that matured in 10 years or more experienced yield declines of more than 100 basis points (100 basis points equals 1.00%) during the reporting period.
Dear Valued Shareholder:
We are pleased to offer you this annual report for the Wells Fargo Colorado Tax-Free Fund for the 12-month period that ended June 30, 2016. The U.S. Federal Reserve (Fed) began normalizing monetary policy, raising the federal funds rate to between 0.25% and 0.50% in December 2015. Short-term municipal bond yields rose, but yields on longer-term bonds declined. In fact, yields on municipal bonds that matured in 10 years or more experienced yield declines of more than 100 basis points (100 basis points equals 1.00%) during the reporting period. The Barclays Municipal Bond Index,1 a broad measure tracking investment-grade municipal bonds, returned 7.65% during the 12-month reporting period.
Monetary policy was accommodative.
The Fed continued an easy monetary policy in order to support the economy and the financial system. However, it raised the federal funds target rate in December because it believed the U.S. economy was strong enough to begin normalizing monetary policy. The European Central Bank cut all three of its short-term rates during the reporting period, increased its asset-purchase program from 60 billion euros per month to 80 billion, expanded the list of eligible securities to include investment-grade nonbank debt, and created a fund-to-lend program where banks could be paid to lend money. In Japan, the Bank of Japan maintained an aggressive monetary program aimed at combating deflation.
Despite accommodative central-bank policies that helped keep interest rates at ultra-low levels, there were periods of volatility. Early in 2016, weakness in certain emerging markets economies and commodities hurt riskier assets and a vote in June 2016 by the U.K. to exit the European Union set off another round of global uncertainty. Municipal bonds benefited because they are perceived as a safe-haven asset. In addition, investor demand for yield helped lower-rated debt outperform. The Barclays High Yield Municipal Bond Index2 returned 12.09% during the 12-month period that ended June 30, 2016.
Strong demand, modest supply, and solid credit fundamentals supported municipals.
Market technicals remained favorable. According to the Investment Company Institute, more than $33 billion was allocated to municipal mutual funds during the first half of 2016, which was more than double the inflows during all of 2015. Further, inflows during the second quarter of 2016 were the largest in nearly seven years. In contrast, less new supply helped make 2015 the fifth calendar year of negative net supply and supply in the first half of 2016 was about 4% less than the same period last year.
Municipal credit quality remained on an uptrend despite a number of high-profile negative credit situations. Idiosyncratic credit risks remain, however. With regard to Puerto Rico, the U.S. enacted legislation that prohibits bondholder lawsuits temporarily and instills a fiscal oversight board for Puerto Rico; Puerto Rico then declared a moratorium on paying its general obligation (GO) bonds and defaulted
| 1 | The Barclays Municipal Bond Index is an unmanaged index composed of long-term tax-exempt bonds with a minimum credit rating of Baa. You cannot invest directly in an index. |
| 2 | The Barclays High Yield Municipal Bond Index measures the non-investment-grade and nonrated U.S. dollar–denominated, fixed-rate, tax-exempt bond market within the 50 United States and four other qualifying regions (Washington, D.C.; Puerto Rico; Guam; and the Virgin Islands). The index allows state and local general obligation, revenue, insured, and prerefunded bonds; however, historically the index has been composed of mostly revenue bonds. You cannot invest directly in an index. |
| | | | | | |
| Letter to shareholders (unaudited) | | Wells Fargo Colorado Tax-Free Fund | | | 3 | |
on $911 million in payments due (most of which were GOs) on July 1, 2016. The state of Illinois approved a six-month stopgap budget, a temporary but meaningful step. Under this stopgap budget for the state, the city of Chicago receives authority to raise property taxes for teacher pensions and low-income school districts would receive greater state funding. City of Chicago and school district debt rallied on the news.
Since the end of the financial crisis, structural changes in the fixed-income markets have reduced trading liquidity (the degree to which assets can be bought or sold without affecting the price). New regulations and capital requirements have caused traditional liquidity suppliers (banks and broker/dealers) to be more risk-averse and hold less inventory. Meanwhile, corporate-debt issuance has spiked as companies finance themselves at record-low yields, bond mutual funds hold larger amounts of this new debt supply, trading volumes are lower, and large trades are more difficult to execute. However, fixed-income markets appear to have functioned well over the past year with sufficient liquidity.
Don’t let short-term uncertainty derail long-term investment goals.
Periods of uncertainty can present challenges, but experience has taught us that maintaining long-term investment goals can be an effective way to plan for the future. To help you create a sound strategy based on your personal goals and risk tolerance, Wells Fargo Funds offers more than 100 mutual funds spanning a wide range of asset classes and investment styles. Although diversification cannot guarantee an investment profit or prevent losses, we believe it can be an effective way to manage investment risk and potentially smooth out overall portfolio performance. We encourage investors to know their investments and to understand that appropriate levels of risk-taking may unlock opportunities.
Thank you for choosing to invest in Wells Fargo Funds. We appreciate your confidence in us and remain committed to helping you meet your financial needs.
Sincerely,

Karla M. Rabusch
President
Wells Fargo Funds
Periods of uncertainty can present challenges, but experience has taught us that maintaining long-term investment goals can be an effective way to plan for the future.
For further information about your Fund, contact your investment professional, visit our website at wellsfargofunds.com, or call us directly at 1-800-222-8222. We are available 24 hours a day, 7 days a week.
| | | | |
| 4 | | Wells Fargo Colorado Tax-Free Fund | | Performance highlights (unaudited) |
Investment objective
The Fund seeks current income exempt from federal income tax and Colorado individual income tax.
Manager
Wells Fargo Funds Management, LLC
Subadviser
Wells Capital Management Incorporated
Portfolio managers
Terry Goode
Adrian Van Poppel
Average annual total returns (%) as of June 30, 20161
| | | | | | | | | | | | | | | | | | | | | | | | | | | | | | | | | | |
| | | | | Including sales charge | | | Excluding sales charge | | | Expense ratios2 (%) | |
| | | Inception date | | 1 year | | | 5 year | | | 10 year | | | 1 year | | | 5 year | | | 10 year | | | Gross | | | Net3 | |
| Class A (NWCOX) | | 7-31-1995 | | | 3.64 | | | | 4.93 | | | | 4.25 | | | | 8.53 | | | | 5.90 | | | | 4.73 | | | | 0.93 | | | | 0.85 | |
| Class C (WCOTX) | | 3-31-2008 | | | 6.71 | | | | 5.11 | | | | 3.93 | | | | 7.71 | | | | 5.11 | | | | 3.93 | | | | 1.68 | | | | 1.60 | |
| Administrator Class (NCOTX) | | 8-23-1993 | | | – | | | | – | | | | – | | | | 8.80 | | | | 6.16 | | | | 4.99 | | | | 0.87 | | | | 0.60 | |
| Barclays Municipal Bond Index4 | | – | | | – | | | | – | | | | – | | | | 7.65 | | | | 5.33 | | | | 5.13 | | | | – | | | | – | |
| Barclays Colorado Municipal Bond Index5 | | – | | | – | | | | – | | | | – | | | | 8.87 | | | | 6.32 | | | | 5.65 | | | | – | | | | – | |
Figures quoted represent past performance, which is no guarantee of future results, and do not reflect taxes that a shareholder may pay on fund distributions or the redemption of fund shares. Investment return and principal value of an investment will fluctuate so that an investor’s shares, when redeemed, may be worth more or less than their original cost. Performance shown without sales charges would be lower if sales charges were reflected. Current performance may be lower or higher than the performance data quoted, which assumes the reinvestment of dividends and capital gains. Current month-end performance is available on the Fund’s website, wellsfargofunds.com.
Index returns do not include transaction costs associated with buying and selling securities, any mutual fund fees or expenses, or any taxes. It is not possible to invest directly in an index.
For Class A shares, the maximum front-end sales charge is 4.50%. For Class C shares, the maximum contingent deferred sales charge is 1.00%. Performance including a contingent deferred sales charge assumes the sales charge for the corresponding time period. Administrator Class shares are sold without a front-end sales charge or contingent deferred sales charge.
Bond values fluctuate in response to the financial condition of individual issuers, general market and economic conditions, and changes in interest rates. Changes in market conditions and government policies may lead to periods of heightened volatility in the bond market and reduced liquidity for certain bonds held by the Fund. In general, when interest rates rise, bond values fall and investors may lose principal value. Interest-rate changes and their impact on the Fund and its share price can be sudden and unpredictable. The use of derivatives may reduce returns and/or increase volatility. Certain investment strategies tend to increase the total risk of an investment (relative to the broader market). The Fund is exposed to Colorado municipal securities risk, high-yield securities risk, and non-diversification risk. Consult the Fund’s prospectus for additional information on these and other risks. A portion of the Fund’s income may be subject to federal, state, and/or local income taxes or the Alternative Minimum Tax (AMT). Any capital gains distributions may be taxable.
Please see footnotes on page 5.
| | | | | | |
| Performance highlights (unaudited) | | Wells Fargo Colorado Tax-Free Fund | | | 5 | |
|
| Growth of $10,000 investment as of June 30, 20166 |
|
 |
| 1 | Historical performance shown for Class C shares prior to their inception reflects the performance of Class A shares, adjusted to reflect the higher expenses applicable to Class C shares. |
| 2 | Reflects the expense ratios as stated in the most recent prospectuses. The expense ratios shown are subject to change and may differ from the annualized expense ratios shown in the financial highlights of this report. |
| 3 | The manager has contractually committed through October 31, 2016, to waive fees and/or reimburse expenses to the extent necessary to cap the Fund’s Total Annual Fund Operating Expenses After Fee Waiver at the amounts shown. After this time, the cap may be increased or the commitment to maintain the cap may be terminated only with the approval of the Board of Trustees. Brokerage commissions, stamp duty fees, interest, taxes, acquired fund fees and expenses, and extraordinary expenses are excluded from the expense cap. Without this cap, the Fund’s returns would have been lower. |
| 4 | The Barclays Municipal Bond Index is an unmanaged index composed of long-term tax-exempt bonds with a minimum credit rating of Baa. You cannot invest directly in an index. |
| 5 | The Barclays Colorado Municipal Bond Index is the Colorado component of the Barclays Municipal Bond Index. You cannot invest directly in an index. |
| 6 | The chart compares the performance of Class A shares for the most recent ten years with the Barclays Municipal Bond Index and the Barclays Colorado Municipal Bond Index. The chart assumes a hypothetical $10,000 investment in Class A shares and reflects all operating expenses and assumes the maximum initial sales charge of 4.50%. |
| 7 | Amounts are calculated based on the total investments of the Fund. These amounts are subject to change and may have changed since the date specified. |
| 8 | The credit quality distribution of portfolio holdings reflected in the chart is based on ratings from Standard & Poor’s, Moody’s Investors Service, and/or Fitch Ratings Ltd. Credit quality ratings apply to the underlying holdings of the Fund and not to the Fund itself. The percentages of the Fund’s portfolio with the ratings depicted in the chart are calculated based on the total market value of fixed income securities held by the Fund. If a security was rated by all three rating agencies, the middle rating was utilized. If rated by two of three rating agencies, the lower rating was utilized, and if rated by one of the rating agencies, that rating was utilized. Standard & Poor’s rates the creditworthiness of bonds, ranging from AAA (highest) to D (lowest). Ratings from A to CCC may be modified by the addition of a plus (+) or minus (-) sign to show relative standing within the rating categories. Standard & Poor’s rates the creditworthiness of short-term notes from SP-1 (highest) to SP-3 (lowest). Moody’s rates the creditworthiness of bonds, ranging from Aaa (highest) to C (lowest). Ratings Aa to B may be modified by the addition of a number 1 (highest) to 3 (lowest) to show relative standing within the ratings categories. Moody’s rates the creditworthiness of short-term U.S. tax-exempt municipal securities from MIG 1/VMIG 1 (highest) to SG (lowest). Fitch rates the creditworthiness of bonds, ranging from AAA (highest) to D (lowest). Credit quality distribution is subject to change and may have changed since the date specified |
| | | | |
| 6 | | Wells Fargo Colorado Tax-Free Fund | | Performance highlights (unaudited) |
MANAGER’S DISCUSSION
Fund highlights
| n | | The Fund outperformed its benchmark, the Barclays Municipal Bond Index, for the 12-month period that ended June 30, 2016. The Fund underperformed the Barclays Colorado Municipal Bond Index during the same period. |
| n | | The main contributors to performance included security selection, longer duration, yield-curve positioning, and an overweight to BBB-rated bonds. Within security selection, the E-470 Toll Road and Colorado Springs Utility bonds did well. |
| n | | Detractors from performance included an underweight to the industrial development revenue/pollution control revenue sector and poor security selection in the hospital sector. |
| n | | Benign inflation expectations, global growth concerns, and the shape of the yield curve influenced our decision to extend duration and focus on bond purchases in the steeper portion of the yield curve. This resulted in an overweight to maturities 20 years and longer. |
|
| Effective maturity distribution as of June 30, 20167 |
|
 |
Ultralow yields continued throughout the period.
With the U.S. Federal Reserve (Fed) poised to normalize its interest-rate policy, shorter-term maturities appeared less attractive at the beginning of the reporting period due to a potential rise in short-term yields. However, subdued inflation expectations, due in part to low oil prices, combined with a fragile European economy and softening Chinese economy, implied that longer maturities would outperform. The Fund’s yield-curve positioning, which was underweight the area less than 10 years and overweight the 20-year and greater area, helped results. Longer-term maturities outperformed shorter-term maturities by a wide
margin because the municipal curve flattened almost 150 basis points (100 basis points equals 1.00%) between the 2- and 30-year maturities.
The Fed tightened in December 2015 but signaled that the pace of further increases would be gradual. While the Fed was likely to take its time raising rates, U.S. inflation started to trend higher, unemployment remained below 5%, and economic growth was expected to remain at or above 2%. With the Fed likely on hold for an extended period and continued benign inflation, we extended the Fund’s duration longer than the Barclays Municipal Bond Index, which contributed to results as yields fell.
|
| Credit quality as of June 30, 20168 |
|
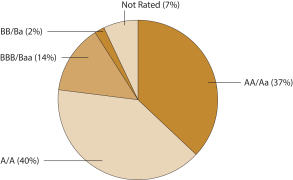 |
Credit-quality allocation helped results.
The Fund’s overweight to A-rated and BBB-rated debt contributed to results because lower-rated bonds outperformed higher-quality bonds by a wide margin during the period. Sector allocation also contributed to results due to the Fund’s overweight to strong-performing appropriation, education, and special tax sectors. The Fund’s underweight to the industrial development revenue/pollution control revenue sector detracted from results. Finally, issue selection was helped by E-470 Toll Road and Colorado Springs Utility bonds but certain hospital issues held by the Fund lagged.
Please see footnotes on page 5.
| | | | | | |
| Performance highlights (unaudited) | | Wells Fargo Colorado Tax-Free Fund | | | 7 | |
Colorado felt the effect of weakness in energy but benefited from growth elsewhere.
With its status as seventh in the nation for oil production and ninth for concentration of oil- and gas-related employment, Colorado did experience weaker growth over the period. However, growth in other industries offset the decreases in the oil sector and the unemployment rate trended lower in the state. Migration to the state continued with 2015 marking the state’s largest increase since 2000.
Rates may be lower for longer, making issue selection even more important.
Near the end of the reporting period, the U.K. voted to withdraw from the European Union, prompting considerable uncertainty about future political situations, financial markets, and economic growth. U.S. Treasuries and municipal bonds rallied significantly on the news, and both 10-year and 30-year municipal yields reached record-low levels. We expect volatility in rates but don’t see any catalyst for materially higher rates or a steeper yield curve in the near term. Strong demand for municipals from both U.S. and global investors in search of yield alongside favorable supply/demand factors may continue to support the municipal market. In terms of Fund positioning, we expect to remain long duration relative to the Barclays Municipal Bond Index and to focus our purchases on the steeper part of the yield curve to benefit from the roll down, or the natural decline in yields as maturities shorten. We also expect to maintain an overweight to the A-rated and BBB-rated credit tiers. Although we think rates may stay lower for longer, we recognize that an improvement in overseas economies, outflows in mutual funds, or a more hawkish tone from the Fed could lead to a spike in rates. In this record-low interest-rate environment, security selection is even more important as breakeven yields (the sell-off that a bond can endure before the total return drops to zero) decrease.
Please see footnotes on page 5.
| | | | |
| 8 | | Wells Fargo Colorado Tax-Free Fund | | Fund expenses (unaudited) |
As a shareholder of the Fund, you incur two types of costs: (1) transaction costs, including sales charges (loads) on purchase payments and contingent deferred sales charges (if any) on redemptions and (2) ongoing costs, including management fees, distribution (12b-1) and/or shareholder servicing fees, and other Fund expenses. This example is intended to help you understand your ongoing costs (in dollars) of investing in the Fund and to compare these costs with the ongoing costs of investing in other mutual funds.
The example is based on an investment of $1,000 invested at the beginning of the six-month period and held for the entire period from January 1, 2016 to June 30, 2016.
Actual expenses
The “Actual” line of the table below provides information about actual account values and actual expenses. You may use the information in this line, together with the amount you invested, to estimate the expenses that you paid over the period. Simply divide your account value by $1,000 (for example, an $8,600 account value divided by $1,000 = 8.6), then multiply the result by the number in the “Actual” line under the heading entitled “Expenses paid during period” for your applicable class of shares to estimate the expenses you paid on your account during this period.
Hypothetical example for comparison purposes
The “Hypothetical” line of the table below provides information about hypothetical account values and hypothetical expenses based on the Fund’s actual expense ratio and an assumed rate of return of 5% per year before expenses, which is not the Fund’s actual return. The hypothetical account values and expenses may not be used to estimate the actual ending account balance or expenses you paid for the period. You may use this information to compare the ongoing costs of investing in the Fund and other funds. To do so, compare this 5% hypothetical example with the 5% hypothetical examples that appear in the shareholder reports of the other funds.
Please note that the expenses shown in the table are meant to highlight your ongoing costs only and do not reflect any transactional costs, such as sales charges (loads) and contingent deferred sales charges. Therefore, the “Hypothetical” line
of the table is useful in comparing ongoing costs only and will not help you determine the relative total costs of owning different funds. In addition, if these transactional costs were included, your costs would have been higher.
| | | | | | | | | | | | | | | | |
| �� | | Beginning
account value
1-1-2016 | | | Ending
account value
6-30-2016 | | | Expenses
paid during
the period¹ | | | Net annualized
expense ratio | |
Class A | | | | | | | | | | | | | | | | |
Actual | | $ | 1,000.00 | | | $ | 1,050.68 | | | $ | 4.33 | | | | 0.85 | % |
Hypothetical (5% return before expenses) | | $ | 1,000.00 | | | $ | 1,020.64 | | | $ | 4.27 | | | | 0.85 | % |
Class C | | | | | | | | | | | | | | | | |
Actual | | $ | 1,000.00 | | | $ | 1,046.72 | | | $ | 8.14 | | | | 1.60 | % |
Hypothetical (5% return before expenses) | | $ | 1,000.00 | | | $ | 1,016.91 | | | $ | 8.02 | | | | 1.60 | % |
Administrator Class | | | | | | | | | | | | | | | | |
Actual | | $ | 1,000.00 | | | $ | 1,051.99 | | | $ | 3.06 | | | | 0.60 | % |
Hypothetical (5% return before expenses) | | $ | 1,000.00 | | | $ | 1,021.88 | | | $ | 3.02 | | | | 0.60 | % |
| 1 | Expenses paid is equal to the annualized expense ratio of each class multiplied by the average account value over the period, multiplied by the number of days in the most recent fiscal half-year divided by the number of days in the fiscal year (to reflect the one-half-year period). |
| | | | | | |
| Portfolio of investments—June 30, 2016 | | Wells Fargo Colorado Tax-Free Fund | | | 9 | |
| | | | | | | | | | | | | | | | |
| Security name | | Interest rate | | | Maturity date | | | Principal | | | Value | |
| | | | |
Municipal Obligations: 100.99% | | | | | | | | | | | | | | | | |
| | | | |
| Arizona: 1.02% | | | | | | | | | | | | | | | | |
Phoenix AZ IDA Rowan University Project (Education Revenue) | | | 5.25 | % | | | 6-1-2034 | | | $ | 1,000,000 | | | $ | 1,175,070 | |
| | | | | | | | | | | | | | | | |
| | | | |
| California: 2.19% | | | | | | | | | | | | | | | | |
Inglewood CA Unified School District (Tax Revenue, AGM Insured) | | | 5.25 | | | | 10-15-2021 | | | | 1,000,000 | | | | 1,204,720 | |
Norco CA Redevelopment Agency Project Area #1 (Tax Revenue) | | | 6.00 | | | | 3-1-2036 | | | | 1,120,000 | | | | 1,312,786 | |
| | | | |
| | | | | | | | | | | | | | | 2,517,506 | |
| | | | | | | | | | | | | | | | |
| | | | |
| Colorado: 91.83% | | | | | | | | | | | | | | | | |
Adams County CO 12 Five Star Schools Certificate of Participation Refunding Bonds (Miscellaneous Revenue) | | | 5.00 | | | | 12-15-2027 | | | | 1,200,000 | | | | 1,590,576 | |
Adams County CO Certificate of Participation Refunding Bonds (Miscellaneous Revenue) | | | 5.00 | | | | 12-1-2034 | | | | 500,000 | | | | 613,735 | |
Adams County CO North Range Metropolitan District No. 1 (GO Revenue) | | | 5.00 | | | | 12-1-2038 | | | | 1,000,000 | | | | 1,184,660 | |
Adams County CO Rangeview Library District Certificate of Participation Series 2015 (Miscellaneous Revenue, AGM Insured) | | | 5.00 | | | | 12-15-2029 | | | | 1,000,000 | | | | 1,250,680 | |
Arapahoe County CO Centennial 25 Metropolitan District (GO Revenue) | | | 6.38 | | | | 12-1-2016 | | | | 70,000 | | | | 70,505 | |
Arapahoe County CO Copperleaf Metropolitan District (GO Revenue) | | | 5.75 | | | | 12-1-2045 | | | | 500,000 | | | | 536,615 | |
Arapahoe County CO Water & Wastewater Authority (Water & Sewer Revenue, AGM Insured) | | | 5.00 | | | | 12-1-2033 | | | | 500,000 | | | | 528,560 | |
Arvada CO Jefferson Center Metropolitan District (Tax Revenue) | | | 4.75 | | | | 12-1-2026 | | | | 1,000,000 | | | | 1,047,380 | |
Aspen Valley CO Hospital Refunding Bonds District Series 2012 (Health Revenue) | | | 5.00 | | | | 10-15-2033 | | | | 600,000 | | | | 678,222 | |
Aurora CO Certificate of Participation Refunding Bonds Series 2009A (Miscellaneous Revenue) | | | 5.00 | | | | 12-1-2027 | | | | 2,000,000 | | | | 2,264,340 | |
Aurora CO E-470 Public Highway Authority Colorado CAB Series A (Miscellaneous Revenue, National Insured) ¤ | | | 0.00 | | | | 9-1-2034 | | | | 4,000,000 | | | | 2,357,960 | |
Aurora CO Eagle Bend Metropolitan District No. 2 Refunding Bonds (GO Revenue, Build America Mutual Assurance Company Insured) | | | 5.00 | | | | 12-1-2037 | | | | 1,000,000 | | | | 1,236,330 | |
Aurora CO First Lien Water Improvement Bonds Series 2007A (Water & Sewer Revenue, Ambac Insured) | | | 5.00 | | | | 8-1-2039 | | | | 1,000,000 | | | | 1,043,580 | |
Canon City CO Finance Authority Certificate of Participation Series 2008 (Miscellaneous Revenue, AGC Insured) | | | 5.00 | | | | 12-1-2032 | | | | 150,000 | | | | 163,529 | |
Colorado Board of Governors State University System Enterprise Bonds Series 2013C (Education Revenue) | | | 5.25 | | | | 3-1-2033 | | | | 725,000 | | | | 893,816 | |
Colorado Board of Governors State University System Enterprise Bonds Series E1 (Education Revenue) | | | 5.00 | | | | 3-1-2040 | | | | 2,000,000 | | | | 2,437,980 | |
Colorado ECFA Alexander Dawson School LLC Project (Education Revenue) | | | 5.00 | | | | 2-15-2040 | | | | 1,000,000 | | | | 1,106,960 | |
Colorado ECFA Charter School American Academy Project (Education Revenue) | | | 7.25 | | | | 12-1-2028 | | | | 1,000,000 | | | | 1,172,120 | |
Colorado ECFA Charter School American Academy Project (Education Revenue) | | | 7.38 | | | | 12-1-2028 | | | | 1,000,000 | | | | 1,175,110 | |
Colorado ECFA Charter School Aspen Ridge School Project Series 2015A (Education Revenue) 144A | | | 4.13 | | | | 7-1-2026 | | | | 625,000 | | | | 657,163 | |
Colorado ECFA Charter School Banning Lewis Ranch Academy Project (Education Revenue) 144A | | | 6.13 | | | | 12-15-2035 | | | | 425,000 | | | | 426,925 | |
Colorado ECFA Charter School Ben Franklin Academy Project (Education Revenue) | | | 5.00 | | | | 7-1-2036 | | | | 750,000 | | | | 879,848 | |
Colorado ECFA Charter School Collegiate Project (Education Revenue, Syncora Guarantee Incorporated Insured) | | | 5.00 | | | | 6-15-2019 | | | | 660,000 | | | | 662,554 | |
Colorado ECFA Charter School Collegiate Project (Education Revenue, Syncora Guarantee Incorporated Insured) | | | 5.25 | | | | 6-15-2024 | | | | 1,140,000 | | | | 1,144,480 | |
Colorado ECFA Charter School District Montessori Charter School Project (Miscellaneous Revenue) | | | 5.00 | | | | 7-15-2037 | | | | 1,150,000 | | | | 1,317,912 | |
The accompanying notes are an integral part of these financial statements.
| | | | |
| 10 | | Wells Fargo Colorado Tax-Free Fund | | Portfolio of investments—June 30, 2016 |
| | | | | | | | | | | | | | | | |
| Security name | | Interest rate | | | Maturity date | | | Principal | | | Value | |
| | | | |
| Colorado (continued) | | | | | | | | | | | | | | | | |
Colorado ECFA Charter School Pinnacle High School Project (Education Revenue) | | | 5.13 | % | | | 12-1-2039 | | | $ | 500,000 | | | $ | 534,275 | |
Colorado ECFA Charter School Refunding and Improvement Bonds Flagstaff Academy Project 2015 (Education Revenue) | | | 5.00 | | | | 8-1-2036 | | | | 335,000 | | | | 397,421 | |
Colorado ECFA Charter School Refunding and Improvement Bonds Frontier Academy Project 2015 (Education Revenue) %% | | | 5.00 | | | | 6-1-2036 | | | | 540,000 | | | | 639,058 | |
Colorado ECFA Charter School Refunding and Improvement Bonds Skyview Academy Project Series 2014 (Education Revenue) 144A | | | 4.13 | | | | 7-1-2024 | | | | 500,000 | | | | 532,970 | |
Colorado ECFA Charter School Refunding and Improvement Bonds University Laboratory School Project 2015 (Education Revenue) 144A | | | 5.00 | | | | 12-15-2028 | | | | 600,000 | | | | 662,772 | |
Colorado ECFA Charter School Refunding and Improvement Bonds University Laboratory School Project 2015 (Education Revenue) 144A | | | 4.00 | | | | 12-15-2025 | | | | 535,000 | | | | 561,654 | |
Colorado ECFA Cheyenne Mountain Charter School Series A (Education Revenue) | | | 5.25 | | | | 6-15-2029 | | | | 590,000 | | | | 616,066 | |
Colorado ECFA Refunding Bonds Regis University Project (Education Revenue) | | | 5.00 | | | | 10-1-2034 | | | | 2,000,000 | | | | 2,358,180 | |
Colorado ECFA Refunding Bonds The University Corporation for Atmosphere Research Project Series 2010 (Education Revenue) | | | 5.00 | | | | 9-1-2032 | | | | 1,265,000 | | | | 1,436,306 | |
Colorado ECFA Refunding Bonds The University Corporation for Atmosphere Research Project Series B (Education Revenue) | | | 5.00 | | | | 9-1-2030 | | | | 1,770,000 | | | | 2,103,840 | |
Colorado ECFA Student Housing Campus Village Apartment (Miscellaneous Revenue) ## | | | 5.50 | | | | 6-1-2033 | | | | 1,735,000 | | | | 1,871,423 | |
Colorado ECFA Twin Peaks Charter Academy (Education Revenue) | | | 6.75 | | | | 11-15-2028 | | | | 750,000 | | | | 856,253 | |
Colorado Fort Lewis College Board of Trustees Series B (Education Revenue) | | | 5.00 | | | | 10-1-2036 | | | | 1,735,000 | | | | 2,164,222 | |
Colorado Health Facilities Authority Adventist Health Sunbelt Series A (Health Revenue) %% | | | 4.00 | | | | 11-15-2046 | | | | 1,000,000 | | | | 1,097,840 | |
Colorado Health Facilities Authority Adventist Health Sunbelt Series C (Health Revenue) %%± | | | 5.00 | | | | 11-15-2036 | | | | 500,000 | | | | 645,350 | |
Colorado Health Facilities Authority Adventist Health Sunbelt Series D (Health Revenue) | | | 5.25 | | | | 11-15-2027 | | | | 1,000,000 | | | | 1,017,040 | |
Colorado Health Facilities Authority Adventist Health Sunbelt Series D (Health Revenue) | | | 5.25 | | | | 11-15-2035 | | | | 1,000,000 | | | | 1,017,040 | |
Colorado Health Facilities Authority Catholic Health Initiatives Series D1 (Health Revenue) | | | 6.25 | | | | 10-1-2033 | | | | 1,000,000 | | | | 1,121,540 | |
Colorado Health Facilities Authority Children’s Hospital Project Series A (Health Revenue) | | | 5.00 | | | | 12-1-2044 | | | | 2,000,000 | | | | 2,438,780 | |
Colorado Health Facilities Authority Covenant Retirement Communities Series 2012C (Health Revenue) | | | 5.00 | | | | 12-1-2022 | | | | 1,000,000 | | | | 1,176,360 | |
Colorado Health Facilities Authority Evangelical Lutheran Good Samaritan Society Series 2015A (Health Revenue) | | | 5.00 | | | | 6-1-2040 | | | | 1,000,000 | | | | 1,150,410 | |
Colorado Health Facilities Authority Sisters of Charity Leavenworth Health System Series 2013A (Health Revenue) | | | 5.50 | | | | 1-1-2035 | | | | 1,000,000 | | | | 1,236,440 | |
Colorado Health Facilities Authority Sunny Vista Living Center Series A (Health Revenue) 144A | | | 5.00 | | | | 12-1-2025 | | | | 670,000 | | | | 700,706 | |
Colorado HFA Waste Management Incorporated Project (Miscellaneous Revenue) | | | 5.70 | | | | 7-1-2018 | | | | 500,000 | | | | 546,480 | |
Colorado High Performance Transportation Enterprise U.S. 36 and I-25 Managed Lanes (Transportation Revenue) | | | 5.75 | | | | 1-1-2044 | | | | 1,200,000 | | | | 1,317,756 | |
Colorado Park Creek Metropolitan District Refunding Bonds Series A (Tax Revenue) | | | 5.00 | | | | 12-1-2045 | | | | 500,000 | | | | 590,510 | |
Colorado Regional Transportation District Certificate of Participation Series 2014A (Miscellaneous Revenue) | | | 5.00 | | | | 6-1-2044 | | | | 2,000,000 | | | | 2,342,180 | |
Colorado Regional Transportation District Certificate of Participation Tax-Exempt Bonds Series 2010A (Miscellaneous Revenue) | | | 5.38 | | | | 6-1-2031 | | | | 2,500,000 | | | | 2,877,075 | |
Colorado Regional Transportation District Certificate of Participation Transit Vehicles Series A (Miscellaneous Revenue, Ambac Insured) | | | 5.00 | | | | 12-1-2022 | | | | 1,000,000 | | | | 1,057,490 | |
The accompanying notes are an integral part of these financial statements.
| | | | | | |
| Portfolio of investments—June 30, 2016 | | Wells Fargo Colorado Tax-Free Fund | | | 11 | |
| | | | | | | | | | | | | | | | |
| Security name | | Interest rate | | | Maturity date | | | Principal | | | Value | |
| | | | |
| Colorado (continued) | | | | | | | | | | | | | | | | |
Colorado Regional Transportation District Fastracks Project Revenue Bonds Series 2013A (Tax Revenue) | | | 5.00 | % | | | 11-1-2031 | | | $ | 1,000,000 | | | $ | 1,223,640 | |
Colorado Springs CO Utilities System Improvement Bonds Series 2013 B-2 (Utilities Revenue) | | | 5.00 | | | | 11-15-2038 | | | | 3,000,000 | | | | 3,662,490 | |
Commerce City CO Sales & Use Tax Bonds Series 2014 (Tax Revenue, AGM Insured) | | | 5.00 | | | | 8-1-2044 | | | | 1,250,000 | | | | 1,487,550 | |
Denver CO City & County Department of Aviation Airport System Bonds Series 2012B (Airport Revenue) | | | 5.00 | | | | 11-15-2030 | | | | 2,000,000 | | | | 2,413,240 | |
Denver CO City & County Excise Tax Series A (Tax Revenue, AGC Insured) | | | 6.00 | | | | 9-1-2021 | | | | 2,000,000 | | | | 2,327,080 | |
Denver CO City & County Refunding and Improvement Bonds Series A (Tax Revenue) | | | 5.00 | | | | 8-1-2044 | | | | 500,000 | | | | 625,495 | |
Denver CO Convention Center (Tax Revenue, Syncora Guarantee Incorporated Insured) | | | 5.00 | | | | 12-1-2030 | | | | 1,205,000 | | | | 1,217,050 | |
Denver CO School District No. 1 Certificate of Participation Series B (Miscellaneous Revenue) | | | 5.00 | | | | 12-15-2035 | | | | 1,000,000 | | | | 1,230,230 | |
Denver CO School District No. 1 Certificate of Participation Series B (Miscellaneous Revenue) | | | 5.00 | | | | 12-15-2045 | | | | 1,200,000 | | | | 1,456,932 | |
Douglas County CO Stonegate Village Metropolitan District (Water & Sewer Revenue, AGM Insured) | | | 5.00 | | | | 12-1-2045 | | | | 525,000 | | | | 619,085 | |
Eagle County CO Eagle River Water and Sanitation District (GO Revenue) | | | 5.00 | | | | 12-1-2045 | | | | 1,360,000 | | | | 1,684,238 | |
East Cherry Creek Valley CO Water and Sanitation District (Water & Sewer Revenue) | | | 5.00 | | | | 11-15-2032 | | | | 750,000 | | | | 939,270 | |
El Paso County CO Lorson Ranch Metropolitan District No. 2 (GO Revenue) | | | 5.00 | | | | 12-1-2041 | | | | 855,000 | | | | 1,014,603 | |
El Paso County CO School District #49 (Miscellaneous Revenue, National Insured) | | | 5.00 | | | | 12-15-2027 | | | | 1,430,000 | | | | 1,522,078 | |
Fountain CO Urban Renewal Authority South Academy Highlands Project Series 2015-A (Tax Revenue) | | | 4.50 | | | | 11-1-2029 | | | | 1,330,000 | | | | 1,468,546 | |
Fremont County CO Finance Corporation Certificate of Participation Series 2013 (Miscellaneous Revenue) | | | 5.25 | | | | 12-15-2038 | | | | 1,265,000 | | | | 1,457,482 | |
Garfield County CO Public Library District Lease Purchase Financing Program (Miscellaneous Revenue) | | | 5.00 | | | | 12-1-2026 | | | | 715,000 | | | | 808,000 | |
Glendale CO Certificate of Participation Series 2006 (Miscellaneous Revenue, Syncora Guarantee Incorporated Insured) | | | 5.00 | | | | 12-1-2025 | | | | 1,000,000 | | | | 1,018,950 | |
Longmont CO Certificates of Participation Series 2014 (Miscellaneous Revenue) | | | 5.00 | | | | 12-1-2034 | | | | 1,000,000 | | | | 1,194,470 | |
Park Meadows CO Business Improvement District (Tax Revenue) | | | 5.00 | | | | 12-1-2017 | | | | 105,000 | | | | 109,657 | |
Platte Valley CO Fire Protection District (Miscellaneous Revenue) | | | 5.00 | | | | 12-1-2036 | | | | 325,000 | | | | 351,868 | |
Regents of the University of Colorado Certificate of Participation Series 2013A (Education Revenue) | | | 5.00 | | | | 11-1-2028 | | | | 2,000,000 | | | | 2,443,820 | |
Tender Option Bond Trust Receipts for Colorado HCFR Series 2015-XF1001 (Health Revenue, Deutsche Bank LIQ) 144Aø | | | 0.64 | | | | 1-1-2045 | | | | 2,360,000 | | | | 2,360,000 | |
Tender Option Bond Trust Receipts for Colorado HCFR Series 2016-XG0068 (Health Revenue, Deutsche Bank LIQ) 144Aø | | | 0.58 | | | | 12-1-2032 | | | | 2,185,000 | | | | 2,185,000 | |
Thornton CO Development Authority East 144th Avenue and I-25 Project Series B (Tax Revenue) | | | 5.00 | | | | 12-1-2034 | | | | 1,375,000 | | | | 1,653,011 | |
University of Colorado Enterprise System Series A (Education Revenue) | | | 5.00 | | | | 6-1-2026 | | | | 1,000,000 | | | | 1,193,660 | |
University of Colorado Hospital Authority Series A (Health Revenue) | | | 6.00 | | | | 11-15-2029 | | | | 2,000,000 | | | | 2,314,760 | |
Weld County CO Eaton Area Park and Recreation District Series 2015 (GO Revenue) | | | 5.50 | | | | 12-1-2038 | | | | 1,075,000 | | | | 1,166,730 | |
Westminster CO Certificate of Participation Series 2015A (Miscellaneous Revenue) | | | 5.00 | | | | 12-1-2035 | | | | 2,000,000 | | | | 2,451,136 | |
Wheatlands CO (GO Revenue, Build America Mutual Assurance Company Insured) | | | 5.00 | | | | 12-1-2030 | | | | 500,000 | | | | 613,775 | |
| | | | |
| | | | | | | | | | | | | | | 105,722,823 | |
| | | | | | | | | | | | | | | | |
| | | | |
| Guam: 2.52% | | | | | | | | | | | | | | | | |
Guam Government Business Privilege Tax Series A (Tax Revenue) | | | 5.00 | | | | 1-1-2031 | | | | 1,000,000 | | | | 1,142,140 | |
Guam Government Limited Obligation Section 30 Series A (Miscellaneous Revenue) | | | 5.75 | | | | 12-1-2034 | | | | 500,000 | | | | 569,490 | |
Guam Government Waterworks Authority (Water & Sewer Revenue) | | | 5.00 | | | | 1-1-2046 | | | | 1,000,000 | | | | 1,195,590 | |
| | | | |
| | | | | | | | | | | | | | | 2,907,220 | |
| | | | | | | | | | | | | | | | |
The accompanying notes are an integral part of these financial statements.
| | | | |
| 12 | | Wells Fargo Colorado Tax-Free Fund | | Portfolio of investments—June 30, 2016 |
| | | | | | | | | | | | | | | | |
| Security name | | Interest rate | | | Maturity date | | | Principal | | | Value | |
| | | | |
| Maryland: 0.42% | | | | | | | | | | | | | | | | |
Maryland Economic Development Corporation Salisbury University Project (Education Revenue) | | | 5.00 | % | | | 6-1-2027 | | | $ | 235,000 | | | $ | 264,518 | |
Maryland Economic Development Corporation Salisbury University Project (Education Revenue) | | | 5.00 | | | | 6-1-2030 | | | | 200,000 | | | | 222,804 | |
| | | | |
| | | | | | | | | | | | | | | 487,322 | |
| | | | | | | | | | | | | | | | |
| | | | |
| Pennsylvania: 1.50% | | | | | | | | | | | | | | | | |
East Hempfield Township PA IDA Student Services Incorporated Student Housing Project of Millersville University (Education Revenue) | | | 5.00 | | | | 7-1-2029 | | | | 500,000 | | | | 570,295 | |
Pennsylvania Higher Education Facilities Authority Indiana University Student Housing Project Series A (Education Revenue) | | | 5.00 | | | | 7-1-2032 | | | | 1,000,000 | | | | 1,155,430 | |
| | | | |
| | | | | | | | | | | | | | | 1,725,725 | |
| | | | | | | | | | | | | | | | |
| | | | |
| Texas: 0.52% | | | | | | | | | | | | | | | | |
Port Arthur TX Navigation District Jefferson County Environmental Facilities Motiva Enterprises LLC Project Series A (Resource Recovery Revenue) ø | | | 0.54 | | | | 12-1-2039 | | | | 600,000 | | | | 600,000 | |
| | | | | | | | | | | | | | | | |
| | | | |
| Virgin Islands: 0.99% | | | | | | | | | | | | | | | | |
Virgin Islands PFA Matching Fund Loan Note Senior Lien (Miscellaneous Revenue, AGM Insured) | | | 5.00 | | | | 10-1-2029 | | | | 1,000,000 | | | | 1,138,340 | |
| | | | | | | | | | | | | | | | |
| | | | |
Total Municipal Obligations (Cost $106,024,174) | | | | | | | | | | | | | | | 116,274,006 | |
| | | | | | | | | | | | | | | | |
| | | | |
| | | Yield | | | | | | Shares | | | | |
| Short-Term Investments: 0.51% | | | | | | | | | | | | | | | | |
| | | | |
| Investment Companies: 0.51% | | | | | | | | | | | | | | | | |
Wells Fargo Municipal Cash Management Fund Institutional Class ##(l)(u) | | | 0.30 | | | | | | | | 583,158 | | | | 583,158 | |
| | | | | | | | | | | | | | | | |
| | | | |
Total Short-Term Investments (Cost $583,158) | | | | | | | | | | | | | | | 583,158 | |
| | | | | | | | | | | | | | | | |
| | | | | | | | |
| Total investments in securities (Cost $106,607,332) * | | | 101.50 | % | | | 116,857,164 | |
Other assets and liabilities, net | | | (1.50 | ) | | | (1,728,049 | ) |
| | | | | | | | |
| Total net assets | | | 100.00 | % | | $ | 115,129,115 | |
| | | | | | | | |
| ¤ | The security is issued in zero coupon form with no periodic interest payments. |
| 144A | The security may be resold in transactions exempt from registration, normally to qualified institutional buyers, pursuant to Rule 144A under the Securities Act of 1933. |
| %% | The security is issued on a when-issued basis. |
| ## | All or a portion of this security is segregated for when-issued securities. |
| ± | Variable rate investment. The rate shown is the rate in effect at period end. |
| ø | Variable rate demand notes are subject to a demand feature which reduces the effective maturity. The maturity date shown represents the final maturity date of the security. The interest rate is determined and reset by the issuer daily, weekly, or monthly depending upon the terms of the security. The rate shown is the rate in effect at period end. |
| (l) | The issuer of the security is an affiliated person of the Fund as defined in the Investment Company Act of 1940. |
| (u) | The rate represents the 7-day annualized yield at period end. |
| * | Cost for federal income tax purposes is $106,607,130 and unrealized gains (losses) consists of: |
| | | | |
Gross unrealized gains | | $ | 10,279,104 | |
Gross unrealized losses | | | (29,070 | ) |
| | | | |
Net unrealized gains | | $ | 10,250,034 | |
The accompanying notes are an integral part of these financial statements.
| | | | | | |
| Statement of assets and liabilities—June 30, 2016 | | Wells Fargo Colorado Tax-Free Fund | | | 13 | |
| | | | |
| | | | |
| |
Assets | | | | |
Investments | | | | |
In unaffiliated securities, at value (cost $106,024,174) | | $ | 116,274,006 | |
In affiliated securities, at value (cost $583,158) | | | 583,158 | |
| | | | |
Total investments, at value (cost $106,607,332) | | | 116,857,164 | |
Receivable for Fund shares sold | | | 48,821 | |
Receivable for interest | | | 835,524 | |
Prepaid expenses and other assets | | | 13,320 | |
| | | | |
Total assets | | | 117,754,829 | |
| | | | |
| |
Liabilities | | | | |
Dividends payable | | | 109,131 | |
Payable for investments purchased | | | 2,355,988 | |
Payable for Fund shares redeemed | | | 96,216 | |
Management fee payable | | | 10,718 | |
Distribution fee payable | | | 5,056 | |
Administration fees payable | | | 11,711 | |
Accrued expenses and other liabilities | | | 36,894 | |
| | | | |
Total liabilities | | | 2,625,714 | |
| | | | |
Total net assets | | $ | 115,129,115 | |
| | | | |
| |
NET ASSETS CONSIST OF | | | | |
Paid-in capital | | $ | 106,054,298 | |
Undistributed net investment income | | | 298,072 | |
Accumulated net realized losses on investments | | | (1,473,087 | ) |
Net unrealized gains on investments | | | 10,249,832 | |
| | | | |
Total net assets | | $ | 115,129,115 | |
| | | | |
| |
COMPUTATION OF NET ASSET VALUE AND OFFERING PRICE PER SHARE | | | | |
Net assets – Class A | | $ | 41,341,392 | |
Shares outstanding – Class A1 | | | 3,595,670 | |
Net asset value per share – Class A | | | $11.50 | |
Maximum offering price per share – Class A2 | | | $12.04 | |
Net assets – Class C | | $ | 8,503,207 | |
Shares outstanding – Class C1 | | | 738,853 | |
Net asset value per share – Class C | | | $11.51 | |
Net assets – Administrator Class | | $ | 65,284,516 | |
Shares outstanding – Administrator Class1 | | | 5,678,009 | |
Net asset value per share – Administrator Class | | | $11.50 | |
| 1 | The Fund has an unlimited number of authorized shares. |
| 2 | Maximum offering price is computed as 100/95.50 of net asset value. On investments of $50,000 or more, the offering price is reduced. |
The accompanying notes are an integral part of these financial statements.
| | | | |
| 14 | | Wells Fargo Colorado Tax-Free Fund | | Statement of operations—year ended June 30, 2016 |
| | | | |
| | | | |
| |
Investment income | | | | |
Interest | | $ | 3,822,834 | |
Income from affiliated securities | | | 1,399 | |
| | | | |
Total investment income | | | 3,824,233 | |
| | | | |
| |
Expenses | | | | |
Management fee | | | 395,503 | |
Administration fees | | | | |
Class A | | | 58,100 | |
Class C | | | 8,816 | |
Administrator Class | | | 57,053 | |
Shareholder servicing fees | | | | |
Class A | | | 90,782 | |
Class C | | | 13,776 | |
Administrator Class | | | 142,632 | |
Distribution fee | | | | |
Class C | | | 41,327 | |
Custody and accounting fees | | | 10,808 | |
Professional fees | | | 45,572 | |
Registration fees | | | 19,687 | |
Shareholder report expenses | | | 12,364 | |
Trustees’ fees and expenses | | | 21,537 | |
Other fees and expenses | | | 6,964 | |
| | | | |
Total expenses | | | 924,921 | |
Less: Fee waivers and/or expense reimbursements | | | (185,783 | ) |
| | | | |
Net expenses | | | 739,138 | |
| | | | |
Net investment income | | | 3,085,095 | |
| | | | |
| |
REALIZED AND UNREALIZED GAINS (LOSSES) ON INVESTMENTS | | | | |
Net realized losses on investments | | | (27,079 | ) |
Net change in unrealized gains (losses) on investments | | | 5,358,174 | |
| | | | |
Net realized and unrealized gains (losses) on investments | | | 5,331,095 | |
| | | | |
Net increase in net assets resulting from operations | | $ | 8,416,190 | |
| | | | |
The accompanying notes are an integral part of these financial statements.
| | | | | | |
| Statement of changes in net assets | | Wells Fargo Colorado Tax-Free Fund | | | 15 | |
| | | | | | | | | | | | | | | | |
| | | Year ended
June 30, 2016 | | | Year ended
June 30, 2015 | |
| | | | |
Operations | | | | | | | | | | | | | | | | |
Net investment income | | | | | | $ | 3,085,095 | | | | | | | $ | 2,765,609 | |
Net realized gains (losses) on investments | | | | | | | (27,079 | ) | | | | | | | 239,821 | |
Net change in unrealized gains (losses) on investments | | | | | | | 5,358,174 | | | | | | | | 235,851 | |
| | | | |
Net increase in net assets resulting from operations | | | | | | | 8,416,190 | | | | | | | | 3,241,281 | |
| | | | |
| | | | |
Distributions to shareholders from | | | | | | | | | | | | | | | | |
Net investment income | | | | | | | | | | | | | | | | |
Class A | | | | | | | (1,095,590 | ) | | | | | | | (1,059,973 | ) |
Class B | | | | | | | N/A | | | | | | | | (102 | )1 |
Class C | | | | | | | (124,324 | ) | | | | | | | (86,629 | ) |
Administrator Class | | | | | | | (1,865,181 | ) | | | | | | | (1,618,905 | ) |
| | | | |
Total distributions to shareholders | | | | | | | (3,085,095 | ) | | | | | | | (2,765,609 | ) |
| | | | |
| | | | |
Capital share transactions | | | Shares | | | | | | | | Shares | | | | | |
Proceeds from shares sold | | | | | | | | | | | | | | | | |
Class A | | | 696,674 | | | | 7,784,831 | | | | 195,576 | | | | 2,149,912 | |
Class C | | | 422,886 | | | | 4,750,010 | | | | 106,467 | | | | 1,175,015 | |
Administrator Class | | | 1,447,561 | | | | 16,128,508 | | | | 1,336,343 | | | | 14,710,217 | |
| | | | |
| | | | | | | 28,663,349 | | | | | | | | 18,035,144 | |
| | | | |
Reinvestment of distributions | | | | | | | | | | | | | | | | |
Class A | | | 95,642 | | | | 1,066,603 | | | | 92,820 | | | | 1,022,854 | |
Class B | | | N/A | | | | N/A | | | | 9 | 1 | | | 102 | 1 |
Class C | | | 10,332 | | | | 115,562 | | | | 7,438 | | | | 82,034 | |
Administrator Class | | | 58,589 | | | | 653,646 | | | | 50,754 | | | | 559,409 | |
| | | | |
| | | | | | | 1,835,811 | | | | | | | | 1,664,399 | |
| | | | |
Payment for shares redeemed | | | | | | | | | | | | | | | | |
Class A | | | (285,488 | ) | | | (3,174,098 | ) | | | (433,987 | ) | | | (4,763,158 | ) |
Class B | | | N/A | | | | N/A | | | | (1,826 | )1 | | | (20,041 | )1 |
Class C | | | (76,234 | ) | | | (855,123 | ) | | | (71,751 | ) | | | (781,903 | ) |
Administrator Class | | | (618,076 | ) | | | (6,860,160 | ) | | | (678,121 | ) | | | (7,490,164 | ) |
| | | | |
| | | | | | | (10,889,381 | ) | | | | | | | (13,055,266 | ) |
| | | | |
Net increase in net assets resulting from capital share transactions | | | | | | | 19,609,779 | | | | | | | | 6,644,277 | |
| | | | |
Total increase in net assets | | | | | | | 24,940,874 | | | | | | | | 7,119,949 | |
| | | | |
| | | | |
Net assets | | | | | | | | | | | | | | | | |
Beginning of period | | | | | | | 90,188,241 | | | | | | | | 83,068,292 | |
| | | | |
End of period | | | | | | $ | 115,129,115 | | | | | | | $ | 90,188,241 | |
| | | | |
Undistributed net investment income | | | | | | $ | 298,072 | | | | | | | $ | 298,072 | |
| | | | |
| 1 | For the period from July 1, 2014 to January 6, 2015. Class B shares of the Fund were no longer offered to shareholders effective January 7, 2015. |
The accompanying notes are an integral part of these financial statements.
| | | | |
| 16 | | Wells Fargo Colorado Tax-Free Fund | | Financial highlights |
(For a share outstanding throughout each period)
| | | | | | | | | | | | | | | | | | | | |
| | | Year ended June 30 | |
| CLASS A | | 2016 | | | 2015 | | | 2014 | | | 2013 | | | 2012 | |
Net asset value, beginning of period | | | $10.92 | | | | $10.85 | | | | $10.46 | | | | $10.72 | | | | $10.15 | |
Net investment income | | | 0.34 | 1 | | | 0.34 | 1 | | | 0.35 | 1 | | | 0.34 | | | | 0.38 | |
Net realized and unrealized gains (losses) on investments | | | 0.58 | | | | 0.07 | | | | 0.39 | | | | (0.26 | ) | | | 0.57 | |
| | | | | | | | | | | | | | | | | | | | |
Total from investment operations | | | 0.92 | | | | 0.41 | | | | 0.74 | | | | 0.08 | | | | 0.95 | |
Distributions to shareholders from | | | | | | | | | | | | | | | | | | | | |
Net investment income | | | (0.34 | ) | | | (0.34 | ) | | | (0.35 | ) | | | (0.34 | ) | | | (0.38 | ) |
Net asset value, end of period | | | $11.50 | | | | $10.92 | | | | $10.85 | | | | $10.46 | | | | $10.72 | |
Total return2 | | | 8.53 | % | | | 3.82 | % | | | 7.26 | % | | | 0.65 | % | | | 9.51 | % |
Ratios to average net assets (annualized) | | | | | | | | | | | | | | | | | | | | |
Gross expenses | | | 0.93 | % | | | 0.93 | % | | | 0.94 | % | | | 0.91 | % | | | 0.91 | % |
Net expenses | | | 0.85 | % | | | 0.85 | % | | | 0.85 | % | | | 0.85 | % | | | 0.85 | % |
Net investment income | | | 3.02 | % | | | 3.12 | % | | | 3.35 | % | | | 3.10 | % | | | 3.64 | % |
Supplemental data | | | | | | | | | | | | | | | | | | | | |
Portfolio turnover rate | | | 13 | % | | | 23 | % | | | 33 | % | | | 36 | % | | | 41 | % |
Net assets, end of period (000s omitted) | | | $41,341 | | | | $33,722 | | | | $35,088 | | | | $46,069 | | | | $53,185 | |
| 1 | Calculated based upon average shares outstanding |
| 2 | Total return calculations do not include any sales charges. |
The accompanying notes are an integral part of these financial statements.
| | | | | | |
| Financial highlights | | Wells Fargo Colorado Tax-Free Fund | | | 17 | |
(For a share outstanding throughout each period)
| | | | | | | | | | | | | | | | | | | | |
| | | Year ended June 30 | |
| CLASS C | | 2016 | | | 2015 | | | 2014 | | | 2013 | | | 2012 | |
Net asset value, beginning of period | | | $10.93 | | | | $10.86 | | | | $10.47 | | | | $10.73 | | | | $10.16 | |
Net investment income | | | 0.25 | | | | 0.26 | | | | 0.28 | | | | 0.26 | | | | 0.30 | |
Net realized and unrealized gains (losses) on investments | | | 0.58 | | | | 0.07 | | | | 0.38 | | | | (0.26 | ) | | | 0.57 | |
| | | | | | | | | | | | | | | | | | | | |
Total from investment operations | | | 0.83 | | | | 0.33 | | | | 0.66 | | | | 0.00 | | | | 0.87 | |
Distributions to shareholders from | | | | | | | | | | | | | | | | | | | | |
Net investment income | | | (0.25 | ) | | | (0.26 | ) | | | (0.27 | ) | | | (0.26 | ) | | | (0.30 | ) |
Net asset value, end of period | | | $11.51 | | | | $10.93 | | | | $10.86 | | | | $10.47 | | | | $10.73 | |
Total return1 | | | 7.71 | % | | | 3.05 | % | | | 6.46 | % | | | (0.10 | )% | | | 8.69 | % |
Ratios to average net assets (annualized) | | | | | | | | | | | | | | | | | | | | |
Gross expenses | | | 1.68 | % | | | 1.68 | % | | | 1.69 | % | | | 1.67 | % | | | 1.66 | % |
Net expenses | | | 1.60 | % | | | 1.60 | % | | | 1.60 | % | | | 1.60 | % | | | 1.60 | % |
Net investment income | | | 2.26 | % | | | 2.35 | % | | | 2.60 | % | | | 2.34 | % | | | 2.89 | % |
Supplemental data | | | | | | | | | | | | | | | | | | | | |
Portfolio turnover rate | | | 13 | % | | | 23 | % | | | 33 | % | | | 36 | % | | | 41 | % |
Net assets, end of period (000s omitted) | | | $8,503 | | | | $4,173 | | | | $3,689 | | | | $4,460 | | | | $4,012 | |
| 1 | Total return calculations do not include any sales charges. |
The accompanying notes are an integral part of these financial statements.
| | | | |
| 18 | | Wells Fargo Colorado Tax-Free Fund | | Financial highlights |
(For a share outstanding throughout each period)
| | | | | | | | | | | | | | | | | | | | |
| | | Year ended June 30 | |
| ADMINISTRATOR CLASS | | 2016 | | | 2015 | | | 2014 | | | 2013 | | | 2012 | |
Net asset value, beginning of period | | | $10.92 | | | | $10.85 | | | | $10.46 | | | | $10.72 | | | | $10.15 | |
Net investment income | | | 0.36 | | | | 0.37 | | | | 0.38 | | | | 0.36 | | | | 0.41 | |
Net realized and unrealized gains (losses) on investments | | | 0.58 | | | | 0.07 | | | | 0.39 | | | | (0.26 | ) | | | 0.57 | |
| | | | | | | | | | | | | | | | | | | | |
Total from investment operations | | | 0.94 | | | | 0.44 | | | | 0.77 | | | | 0.10 | | | | 0.98 | |
Distributions to shareholders from | | | | | | | | | | | | | | | | | | | | |
Net investment income | | | (0.36 | ) | | | (0.37 | ) | | | (0.38 | ) | | | (0.36 | ) | | | (0.41 | ) |
Net asset value, end of period | | | $11.50 | | | | $10.92 | | | | $10.85 | | | | $10.46 | | | | $10.72 | |
Total return | | | 8.80 | % | | | 4.08 | % | | | 7.53 | % | | | 0.90 | % | | | 9.78 | % |
Ratios to average net assets (annualized) | | | | | | | | | | | | | | | | | | | | |
Gross expenses | | | 0.87 | % | | | 0.87 | % | | | 0.88 | % | | | 0.86 | % | | | 0.84 | % |
Net expenses | | | 0.60 | % | | | 0.60 | % | | | 0.60 | % | | | 0.60 | % | | | 0.60 | % |
Net investment income | | | 3.27 | % | | | 3.36 | % | | | 3.60 | % | | | 3.34 | % | | | 3.89 | % |
Supplemental data | | | | | | | | | | | | | | | | | | | | |
Portfolio turnover rate | | | 13 | % | | | 23 | % | | | 33 | % | | | 36 | % | | | 41 | % |
Net assets, end of period (000s omitted) | | | $65,285 | | | | $52,294 | | | | $44,272 | | | | $49,549 | | | | $43,876 | |
The accompanying notes are an integral part of these financial statements.
| | | | | | |
| Notes to financial statements | | Wells Fargo Colorado Tax-Free Fund | | | 19 | |
1. ORGANIZATION
Wells Fargo Funds Trust (the “Trust”), a Delaware statutory trust organized on March 10, 1999, is an open-end management investment company registered under the Investment Company Act of 1940, as amended (the “1940 Act”). As an investment company, the Trust follows the accounting and reporting guidance in Financial Accounting Standards Board (“FASB”) Accounting Standards Codification Topic 946, Financial Services – Investment Companies. These financial statements report on the Wells Fargo Colorado Tax-Free Fund (the “Fund”) which is a non-diversified series of the Trust.
2. SIGNIFICANT ACCOUNTING POLICIES
The following significant accounting policies, which are consistently followed in the preparation of the financial statements of the Fund, are in conformity with U.S. generally accepted accounting principles which require management to make estimates and assumptions that affect the reported amounts of assets and liabilities, disclosure of contingent assets and liabilities at the date of the financial statements, and the reported amounts of revenues and expenses during the reporting period. Actual results could differ from those estimates.
Securities valuation
All investments are valued each business day as of the close of regular trading on the New York Stock Exchange (generally 4 p.m. Eastern Time), although the Fund may deviate from this calculation time under unusual or unexpected circumstances.
Debt securities are valued at the evaluated bid price provided by an independent pricing service or, if a reliable price is not available, the quoted bid price from an independent broker-dealer.
Investments in registered open-end investment companies are valued at net asset value.
Investments which are not valued using any of the methods discussed above are valued at their fair value, as determined in good faith by the Board of Trustees of the Fund. The Board of Trustees has established a Valuation Committee comprised of the Trustees and has delegated to it the authority to take any actions regarding the valuation of portfolio securities that the Valuation Committee deems necessary or appropriate, including determining the fair value of portfolio securities, unless the determination has been delegated to the Management Valuation Team of Wells Fargo Funds Management, LLC (“Funds Management”). The Board of Trustees retains the authority to make or ratify any valuation decisions or approve any changes to the Valuation Procedures as it deems appropriate. On a quarterly basis, the Board of Trustees receives reports on any valuation actions taken by the Valuation Committee or the Management Valuation Team which may include items for ratification.
Valuations of fair valued securities are compared to the next actual sales price when available, or other appropriate market values, to assess the continued appropriateness of the fair valuation methodologies used. These securities are fair valued on a day-to-day basis, taking into consideration changes to appropriate market information and any significant changes to the inputs considered in the valuation process until there is a readily available price provided on an exchange or by an independent pricing service. Valuations received from an independent pricing service or independent broker-dealer quotes are periodically validated by comparisons to most recent trades and valuations provided by other independent pricing services in addition to the review of prices by the manager and/or subadviser. Unobservable inputs used in determining fair valuations are identified based on the type of security, taking into consideration factors utilized by market participants in valuing the investment, knowledge about the issuer and the current market environment.
When-issued transactions
The Fund may purchase securities on a forward commitment or when-issued basis. The Fund records a when-issued transaction on the trade date and will segregate assets in an amount at least equal in value to the Fund’s commitment to purchase when-issued securities. Securities purchased on a when-issued basis are marked-to-market daily and the Fund begins earning interest on the settlement date. Losses may arise due to changes in the market value of the underlying securities or if the counterparty does not perform under the contract.
Security transactions and income recognition
Securities transactions are recorded on a trade date basis. Realized gains or losses are recorded on the basis of identified cost.
Interest income is accrued daily and bond discounts are accreted and premiums are amortized daily based on the effective interest method. To the extent debt obligations are placed on non-accrual status, any related interest income may be reduced by writing off interest receivables when the collection of all or a portion of interest has become doubtful based on consistently applied procedures. If the issuer subsequently resumes interest payments or when the collectability of interest is reasonably assured, the debt obligation is removed from non-accrual status.
| | | | |
| 20 | | Wells Fargo Colorado Tax-Free Fund | | Notes to financial statements |
Distributions to shareholders
Distributions to shareholders from net investment income are accrued daily and paid monthly. Distributions from net realized gains, if any, are recorded on the ex-dividend date. Such distributions are determined in conformity with federal income tax regulations, which may differ in amount or character from net investment income and realized gains recognized for purposes of U.S. generally accepted accounting principles.
Federal and other taxes
The Fund intends to continue to qualify as a regulated investment company by distributing substantially all of its investment company taxable and tax-exempt income and any net realized capital gains (after reduction for capital loss carryforwards) sufficient to relieve it from all, or substantially all, federal income taxes. Accordingly, no provision for federal income taxes was required.
The Fund’s income and federal excise tax returns and all financial records supporting those returns for the prior three fiscal years are subject to examination by the federal and Delaware revenue authorities. Management has analyzed the Fund’s tax positions taken on federal, state, and foreign tax returns for all open tax years and does not believe that there are any uncertain tax positions that require recognition of a tax liability.
Capital loss carryforwards that do not expire are required to be utilized prior to capital loss carryforwards that expire. As of June 30, 2016, capital loss carryforwards available to offset future net realized capital gains were as follows through the indicated expiration dates:
| | | | |
| | | | | No expiration |
| 2018 | | 2019 | | Short-term |
| $548,785 | | $57,793 | | $829,427 |
As of June 30, 2016, the Fund had current year deferred post-October capital losses consisting of $37,285 in long-term losses which will be recognized on the first day of the following fiscal year.
Class allocations
The separate classes of shares offered by the Fund differ principally in applicable sales charges, distribution, shareholder servicing, and administration fees. Class specific expenses are charged directly to that share class. Investment income, common expenses, and realized and unrealized gains (losses) on investments are allocated daily to each class of shares based on the relative proportion of net assets of each class.
3. FAIR VALUATION MEASUREMENTS
Fair value measurements of investments are determined within a framework that has established a fair value hierarchy based upon the various data inputs utilized in determining the value of the Fund’s investments. The three-level hierarchy gives the highest priority to unadjusted quoted prices in active markets for identical assets or liabilities (Level 1) and the lowest priority to significant unobservable inputs (Level 3). The Fund’s investments are classified within the fair value hierarchy based on the lowest level of input that is significant to the fair value measurement. The inputs are summarized into three broad levels as follows:
| n | | Level 1 – quoted prices in active markets for identical securities |
| n | | Level 2 – other significant observable inputs (including quoted prices for similar securities, interest rates, prepayment speeds, credit risk, use of amortized cost, etc.) |
| n | | Level 3 – significant unobservable inputs (including the Fund’s own assumptions in determining the fair value of investments) |
The inputs or methodologies used for valuing investments in securities are not necessarily an indication of the risk associated with investing in those securities.
| | | | | | |
| Notes to financial statements | | Wells Fargo Colorado Tax-Free Fund | | | 21 | |
The following is a summary of the inputs used in valuing the Fund’s assets and liabilities as of June 30, 2016:
| | | | | | | | | | | | | | | | |
| | | Quoted prices
(Level 1) | | | Other significant
observable inputs
(Level 2) | | | Significant unobservable inputs (Level 3) | | | Total | |
Assets | | | | | | | | | | | | | | | | |
Investments in: | | | | | | | | | | | | | | | | |
| | | | |
Municipal obligations | | $ | 0 | | | $ | 116,274,006 | | | $ | 0 | | | $ | 116,274,006 | |
| | | | |
Short-term investments | | | | | | | | | | | | | | | | |
Investment companies | | | 583,158 | | | | 0 | | | | 0 | | | | 583,158 | |
Total assets | | $ | 583,158 | | | $ | 116,274,006 | | | $ | 0 | | | $ | 116,857,164 | |
The Fund recognizes transfers between levels within the fair value hierarchy at the end of the reporting period. At June 30, 2016, the Fund did not have any transfers into/out of Level 1, Level 2, or Level 3.
4. TRANSACTIONS WITH AFFILIATES
Management fee
Funds Management, an indirect wholly owned subsidiary of Wells Fargo & Company (“Wells Fargo”), is the manager of the Fund and provides advisory and fund-level administrative services under an investment management agreement. Under the investment management agreement, Funds Management is responsible for, among other services, implementing the investment objectives and strategies of the Fund, supervising the subadviser, providing fund-level administrative services in connection with the Fund’s operations, and providing any other fund-level administrative services reasonably necessary for the operation of the Fund. As compensation for its services under the investment management agreement, Funds Management is entitled to receive an annual management fee starting at 0.40% and declining to 0.28% as the average daily net assets of the Fund increase. For the year ended June 30, 2016, the management fee was equivalent to an annual rate of 0.40% of the Fund’s average daily net assets.
Funds Management has retained the services of a subadviser to provide daily portfolio management to the Fund. The fee for subadvisory services is borne by Funds Management. Wells Capital Management Incorporated, an affiliate of Funds Management and an indirect wholly owned subsidiary of Wells Fargo, is the subadviser to the Fund and is entitled to receive a fee from Funds Management at an annual rate starting at 0.20% and declining to 0.10% as the average daily net assets of the Fund increase.
Administration fees
Under a class-level administration agreement, Funds Management provides class-level administrative services to the Fund, which includes paying fees and expenses for services provided by the transfer agent, sub-transfer agents, omnibus account servicers and record-keepers. As compensation for its services under the class-level administration agreement, Funds Management receives an annual fee which is calculated based on the average daily net assets of each class as follows:
| | | | |
| | | Class level
administration fee | |
Class A, Class C | | | 0.16 | % |
Administrator Class | | | 0.10 | |
Funds Management has contractually waived and/or reimbursed management and administration fees to the extent necessary to maintain certain net operating expense ratios for the Fund. Waiver of fees and/or reimbursement of expenses by Funds Management were made first from fund level expenses on a proportionate basis and then from class specific expenses. Funds Management has committed through October 31, 2016 to waive fees and/or reimburse expenses to the extent necessary to cap the Fund’s expenses at 0.85% for Class A shares, 1.60% for Class C shares, and 0.60% for Administrator Class shares. After this time, the cap may be increased or the commitment to maintain the cap may be terminated only with the approval of the Board of Trustees.
Distribution fee
The Trust has adopted a Distribution Plan for Class C shares of the Fund pursuant to Rule 12b-1 under the 1940 Act. A distribution fee is charged to Class C shares and paid to Wells Fargo Funds Distributor, LLC (“Funds Distributor”), the principal underwriter, at an annual rate of 0.75% of the average daily net assets of Class C shares.
| | | | |
| 22 | | Wells Fargo Colorado Tax-Free Fund | | Notes to financial statements |
In addition, Funds Distributor is entitled to receive the front-end sales charge from the purchase of Class A shares and a contingent deferred sales charge on the redemption of certain Class A shares. Funds Distributor is also entitled to receive the contingent deferred sales charges from redemptions of Class C shares. For the year ended June 30, 2016, Funds Distributor received $11,949 from the sale of Class A shares.
Shareholder servicing fees
The Trust has entered into contracts with one or more shareholder servicing agents, whereby Class A, Class C, and Administrator Class of the Fund are charged a fee at an annual rate of 0.25% of the average daily net assets of each respective class.
A portion of these total shareholder servicing fees were paid to affiliates of Wells Fargo.
5. INVESTMENT PORTFOLIO TRANSACTIONS
Purchases and sales of investments, excluding U.S. government obligations (if any) and short-term securities, for the year ended June 30, 2016 were $40,504,987 and $12,367,858, respectively.
The Fund may purchase or sell investment securities to other Wells Fargo funds under procedures adopted by the Board of Trustees. The procedures have been designed to ensure that these interfund transactions, which generally do not incur broker commissions, are effected at current market prices. Interfund trades are included within the respective purchases and sales amounts shown.
6. BANK BORROWINGS
The Trust (excluding the money market funds and certain other funds) and Wells Fargo Variable Trust are parties to a $200,000,000 revolving credit agreement whereby the Fund is permitted to use bank borrowings for temporary or emergency purposes, such as to fund shareholder redemption requests. Interest under the credit agreement is charged to the Fund based on a borrowing rate equal to the higher of the Federal Funds rate in effect on that day plus 1.25% or the overnight LIBOR rate in effect on that day plus 1.25%. In addition, an annual commitment fee equal to 0.20% of the unused balance is allocated to each participating fund. Prior to September 1, 2015, the revolving credit agreement amount was $150,000,000 and the annual commitment fee was equal to 0.10% of the unused balance which was allocated to each participating fund.
For the year ended June 30, 2016, there were no borrowings by the Fund under the agreement.
7. DISTRIBUTIONS TO SHAREHOLDERS
The tax character of distributions paid was $3,085,095 and $2,765,609 of exempt-interest income for the years ended June 30, 2016 and June 30, 2015, respectively.
As of June 30, 2016, the components of distributable earnings on a tax basis were as follows:
| | | | | | |
Undistributed
tax-exempt
income | | Unrealized
gains | | Post-October
capital losses
deferred
| | Capital loss
carryforward |
| $407,204 | | $10,250,034 | | $(37,285) | | $(1,436,005) |
8. CONCENTRATION RISK
The Fund invests a substantial portion of its assets in issuers of municipal debt securities located in a single state or territories of the U.S. Therefore, it may be more affected by economic and political developments in that state or region than would be a comparable general tax-exempt fund.
9. INDEMNIFICATION
Under the Trust’s organizational documents, the officers and Trustees have been granted certain indemnification rights against certain liabilities that may arise out of performance of their duties to the Trust. Additionally, in the normal course of business, the Trust may enter into contracts with service providers that contain a variety of indemnification clauses. The Trust’s maximum exposure under these arrangements is dependent on future claims that may be made against the Fund and, therefore, cannot be estimated.
| | | | | | |
| Report of independent registered public accounting firm | | Wells Fargo Colorado Tax-Free Fund | | | 23 | |
BOARD OF TRUSTEES AND SHAREHOLDERS OF WELLS FARGO FUNDS TRUST:
We have audited the accompanying statement of assets and liabilities, including the portfolio of investments, of the Wells Fargo Colorado Tax-Free Fund (formerly known as Wells Fargo Advantage Colorado Tax-Free Fund) (the “Fund”), one of the funds constituting the Wells Fargo Funds Trust, as of June 30, 2016, and the related statement of operations for the year then ended, the statements of changes in net assets for each of the years in the two-year period then ended, and the financial highlights for each of the years in the five-year period then ended. These financial statements and financial highlights are the responsibility of the Fund’s management. Our responsibility is to express an opinion on these financial statements and financial highlights based on our audits.
We conducted our audits in accordance with the standards of the Public Company Accounting Oversight Board (United States). Those standards require that we plan and perform the audit to obtain reasonable assurance about whether the financial statements and financial highlights are free of material misstatement. An audit includes examining, on a test basis, evidence supporting the amounts and disclosures in the financial statements. Our procedures included confirmation of securities owned as of June 30, 2016, by correspondence with custodians and brokers, or by other appropriate auditing procedures. An audit also includes assessing the accounting principles used and significant estimates made by management, as well as evaluating the overall financial statement presentation. We believe that our audits provide a reasonable basis for our opinion.
In our opinion, the financial statements and financial highlights referred to above present fairly, in all material respects, the financial position of the Wells Fargo Colorado Tax-Free Fund as of June 30, 2016, and the results of its operations for the year then ended, the changes in its net assets for each of the years in the two-year period then ended, and the financial highlights for each of the years in the five-year period then ended, in conformity with U.S. generally accepted accounting principles.

Boston, Massachusetts
August 25, 2016
| | | | |
| 24 | | Wells Fargo Colorado Tax-Free Fund | | Other information (unaudited) |
TAX INFORMATION
Pursuant to Section 852 of the Internal Revenue Code, 100% of distributions paid from net investment income is designated as exempt-interest dividends for the fiscal year ended June 30, 2016.
PROXY VOTING INFORMATION
A description of the policies and procedures that the Fund uses to determine how to vote proxies relating to portfolio securities is available, upon request, by calling 1-800-222-8222, visiting our website at wellsfargofunds.com, or visiting the SEC website at sec.gov. Information regarding how the Fund voted proxies relating to portfolio securities during the most recent 12-month period ended June 30 is available on the Fund’s website at wellsfargofunds.com or by visiting the SEC website at sec.gov.
PORTFOLIO HOLDINGS INFORMATION
The complete portfolio holdings for the Fund are publicly available monthly on the Fund’s website (wellsfargofunds.com), on a one-month delayed basis. In addition, top ten holdings information (excluding derivative positions) for the Fund is publicly available on the Fund’s website on a monthly, seven-day or more delayed basis. The Fund files its complete schedule of portfolio holdings with the SEC for the first and third quarters of each fiscal year on Form N-Q, which is available by visiting the SEC website at sec.gov. In addition, the Fund’s Form N-Q may be reviewed and copied at the SEC’s Public Reference Room in Washington, DC, and at regional offices in New York City, at 233 Broadway, and in Chicago, at 175 West Jackson Boulevard, Suite 900. Information about the Public Reference Room may be obtained by calling 1-800-SEC-0330.
| | | | | | |
| Other information (unaudited) | | Wells Fargo Colorado Tax-Free Fund | | | 25 | |
BOARD OF TRUSTEES AND OFFICERS
Each of the Trustees and Officers1 listed in the table below acts in identical capacities for each fund in the Wells Fargo family of funds, which consists of 142 mutual funds comprising the Wells Fargo Funds Trust, Wells Fargo Variable Trust, Wells Fargo Master Trust and four closed-end funds (collectively the “Fund Complex”). This table should be read in conjunction with the Prospectus and the Statement of Additional Information2. The mailing address of each Trustee and Officer is 525 Market Street, 12th Floor, San Francisco, CA 94105. Each Trustee and Officer serves an indefinite term, however, each Trustee serves such term until reaching the mandatory retirement age established by the Trustees.
Independent Trustees
| | | | | | |
Name and year of birth | | Position held and length of service* | | Principal occupations during past five years or longer | | Current other public company or investment
company directorships |
| William R. Ebsworth (Born 1957) | | Trustee, since 2015 | | Retired. From 1984 to 2013, equities analyst, portfolio manager, research director and chief financial officer at Fidelity Management and Research Company in Boston, Tokyo, and Hong Kong and retired in 2013 as Chief Investment Officer of Fidelity Strategic Advisers, Inc. where he lead a team of investment professionals managing client assets. Prior thereto, Board member of Hong Kong Securities Clearing Co., Hong Kong Options Clearing Corp., the Thailand International Fund, Ltd., Fidelity Investments Life Insurance Company, and Empire Fidelity Investments Life Insurance Company. Mr. Ebsworth is a CFA® charterholder and an Adjunct Lecturer, Finance, at Babson College. | | Asset Allocation Trust |
| Jane A. Freeman (Born 1953) | | Trustee, since 2015 | | Retired. From 2012 to 2014 and 1999 to 2008, Chief Financial Officer of Scientific Learning Corporation. From 2008 to 2012, Ms. Freeman provided consulting services related to strategic business projects. Prior to 1999, Portfolio Manager at Rockefeller & Co. and Scudder, Stevens & Clark. Board member of the Harding Loevner Funds from 1996 to 2014, serving as both Lead Independent Director and chair of the Audit Committee. Board member of the Russell Exchange Traded Funds Trust from 2011 to 2012 and the chair of the Audit Committee. Ms. Freeman is Chair of Taproot Foundation (non-profit organization), a Board Member of Ruth Bancroft Garden (non-profit organization) and an inactive chartered financial analyst. | | Asset Allocation Trust |
| Peter G. Gordon (Born 1942) | | Trustee, since 1998; Chairman, since 2005 | | Co-Founder, Retired Chairman, President and CEO of Crystal Geyser Water Company. Trustee Emeritus, Colby College. | | Asset Allocation Trust |
| Isaiah Harris, Jr. (Born 1952) | | Trustee, since 2009 | | Retired. Chairman of the Board of CIGNA Corporation since 2009, and Director since 2005. From 2003 to 2011, Director of Deluxe Corporation. Prior thereto, President and CEO of BellSouth Advertising and Publishing Corp. from 2005 to 2007, President and CEO of BellSouth Enterprises from 2004 to 2005 and President of BellSouth Consumer Services from 2000 to 2003. Emeritus member of the Iowa State University Foundation Board of Governors. Emeritus Member of the Advisory Board of Iowa State University School of Business. Advisory Board Member, Palm Harbor Academy (charter school). Advisory Board Member, Child Evangelism Fellowship (non-profit). Mr. Harris is a certified public accountant (inactive status). | | CIGNA Corporation; Asset Allocation Trust |
| Judith M. Johnson (Born 1949) | | Trustee, since 2008; Audit Committee Chairman, since 2008 | | Retired. Prior thereto, Chief Executive Officer and Chief Investment Officer of Minneapolis Employees Retirement Fund from 1996 to 2008. Ms. Johnson is an attorney, certified public accountant and a certified managerial accountant. | | Asset Allocation Trust |
| David F. Larcker (Born 1950) | | Trustee, since 2009 | | James Irvin Miller Professor of Accounting at the Graduate School of Business, Stanford University, Director of the Corporate Governance Research Initiative and Senior Faculty of The Rock Center for Corporate Governance since 2006. From 2005 to 2008, Professor of Accounting at the Graduate School of Business, Stanford University. Prior thereto, Ernst & Young Professor of Accounting at The Wharton School, University of Pennsylvania from 1985 to 2005. | | Asset Allocation Trust |
| | | | |
| 26 | | Wells Fargo Colorado Tax-Free Fund | | Other information (unaudited) |
| | | | | | |
Name and year of birth | | Position held and length of service* | | Principal occupations during past five years or longer | | Current other public company or investment
company directorships |
| Olivia S. Mitchell (Born 1953) | | Trustee, since 2006 | | International Foundation of Employee Benefit Plans Professor, Wharton School of the University of Pennsylvania since 1993. Director of Wharton’s Pension Research Council and Boettner Center on Pensions & Retirement Research, and Research Associate at the National Bureau of Economic Research. Previously, Cornell University Professor from 1978 to 1993. | | Asset Allocation Trust |
| Timothy J. Penny (Born 1951) | | Trustee, since 1996 | | President and Chief Executive Officer of Southern Minnesota Initiative Foundation, a non-profit organization, since 2007 and Senior Fellow at the Humphrey Institute Policy Forum at the University of Minnesota since 1995. Member of the Board of Trustees of NorthStar Education Finance, Inc., a non-profit organization, since 2007. | | Asset Allocation Trust |
| Michael S. Scofield (Born 1943) | | Trustee, since 2010 | | Served on the Investment Company Institute’s Board of Governors and Executive Committee from 2008-2011 as well the Governing Council of the Independent Directors Council from 2006-2011 and the Independent Directors Council Executive Committee from 2008-2011. Chairman of the IDC from 2008-2010. Institutional Investor (Fund Directions) Trustee of Year in 2007. Trustee of the Evergreen Funds complex (and its predecessors) from 1984 to 2010. Chairman of the Evergreen Funds from 2000-2010. Former Trustee of the Mentor Funds. Retired Attorney, Law Offices of Michael S. Scofield. | | Asset Allocation Trust |
| * | Length of service dates reflect the Trustee’s commencement of service with the Trust’s predecessor entities, where applicable. |
Officers
| | | | | | |
Name and year of birth | | Position held and
length of service | | Principal occupations during past five years or longer | | |
| Karla M. Rabusch (Born 1959) | | President, since 2003 | | Executive Vice President of Wells Fargo Bank, N.A. and President of Wells Fargo Funds Management, LLC since 2003. | | |
| Nancy Wiser1 (Born 1967) | | Treasurer, since 2012 | | Executive Vice President of Wells Fargo Funds Management, LLC since 2011. Chief Operating Officer and Chief Compliance Officer at LightBox Capital Management LLC, from 2008 to 2011. | | |
| C. David Messman (Born 1960) | | Secretary, since 2000; Chief Legal Officer, since 2003 | | Senior Vice President and Secretary of Wells Fargo Funds Management, LLC since 2001. Assistant General Counsel of Wells Fargo Bank, N.A. since 2013 and Vice President and Managing Counsel of Wells Fargo Bank, N.A. from 1996 to 2013. | | |
| Michael Whitaker (Born 1967) | | Chief Compliance Officer, since 2016* | | Executive Vice President of Wells Fargo Funds Management, LLC since 2016. Chief Compliance Officer of Fidelity’s Fixed Income Funds and Asset Allocation Funds from 2008 to 2016, Compliance Officer of FMR Co., Inc. from 2014 to 2016, Fidelity Investments Money Management, Inc. from 2014 to 2016, Fidelity Investments from 2007 to 2016. | | |
| David Berardi (Born 1975) | | Assistant Treasurer, since 2009 | | Vice President of Wells Fargo Funds Management, LLC since 2009. Vice President of Evergreen Investment Management Company, LLC from 2008 to 2010. Manager of Fund Reporting and Control for Evergreen Investment Management Company, LLC from 2004 to 2010. | | |
| Jeremy DePalma1 (Born 1974) | | Assistant Treasurer, since 2009 | | Senior Vice President of Wells Fargo Funds Management, LLC since 2009. Senior Vice President of Evergreen Investment Management Company, LLC from 2008 to 2010 and head of the Fund Reporting and Control Team within Fund Administration from 2005 to 2010. | | |
| 1 | Nancy Wiser acts as Treasurer of 73 funds in the Fund Complex. Jeremy DePalma acts as Treasurer of 69 funds and Assistant Treasurer of 73 funds in the Fund Complex. |
| 2 | The Statement of Additional Information includes additional information about the Trustees and is available, without charge, upon request, by calling
1-800-222-8222 or by visiting the website at wellsfargofunds.com. |
| * | Michael Whitaker became Chief Compliance Officer effective May 16, 2016. |
| | | | | | |
| Other information (unaudited) | | Wells Fargo Colorado Tax-Free Fund | | | 27 | |
BOARD CONSIDERATION OF INVESTMENT MANAGEMENT AND SUB-ADVISORY AGREEMENTS:
Under the Investment Company Act of 1940 (the “1940 Act”), the Board of Trustees (the “Board”) of Wells Fargo Funds Trust (the “Trust”) must determine annually whether to approve the continuation of the Trust’s investment management and sub-advisory agreements. In this regard, at an in-person meeting held on May 24-25, 2016 (the “Meeting”), the Board, all the members of which have no direct or indirect interest in the investment management and sub-advisory agreements and are not “interested persons” of the Trust, as defined in the 1940 Act (the “Independent Trustees”), reviewed and approved for Wells Fargo Colorado Tax-Free Fund (the “Fund”): (i) an investment management agreement (the “Management Agreement”) with Wells Fargo Funds Management, LLC (“Funds Management”); and (ii) an investment sub-advisory agreement (the “Sub-Advisory Agreement”) with Wells Capital Management Incorporated (the “Sub-Adviser”), an affiliate of Funds Management. The Management Agreement and the Sub-Advisory Agreement are collectively referred to as the “Advisory Agreements.”
At the Meeting, the Board considered the factors and reached the conclusions described below relating to the selection of Funds Management and the Sub-Adviser and the approval of the Advisory Agreements. Prior to the Meeting, including at an in-person meeting in April 2016, the Trustees conferred extensively among themselves and with representatives of Funds Management about these matters. Also, the Board has adopted a team-based approach, with each team consisting of a sub-set of Trustees, to assist the full Board in the discharge of its duties in reviewing performance and other matters throughout the year. The Independent Trustees were assisted in their evaluation of the Advisory Agreements by independent legal counsel, from whom they received separate legal advice and with whom they met separately.
In providing information to the Board, Funds Management and the Sub-Adviser were guided by a detailed set of requests for information submitted to them by independent legal counsel on behalf of the Independent Trustees at the start of the Board’s annual contract renewal process earlier in 2016. In considering and approving the Advisory Agreements, the Trustees considered the information they believed relevant, including but not limited to the information discussed below. The Board considered not only the specific information presented in connection with the Meeting, but also the knowledge gained over time through interaction with Funds Management and the Sub-Adviser about various topics. In this regard, the Board reviewed reports of Funds Management at each of its quarterly meetings, which included, among other things, portfolio reviews and performance reports. In addition, the Board and the teams mentioned above confer with portfolio managers at various times throughout the year. The Board did not identify any particular information or consideration that was all-important or controlling, and each individual Trustee may have attributed different weights to various factors.
After its deliberations, the Board unanimously approved the continuation of the Advisory Agreements for a one-year term and determined that the compensation payable to Funds Management and the Sub-Adviser under each of the Advisory Agreements was reasonable. The Board considered the approval of the Advisory Agreements for the Fund as part of its consideration of agreements for funds across the complex, but its approvals were made on a fund-by-fund basis. The following summarizes a number of important, but not necessarily all, factors considered by the Board in support of its approvals.
Nature, extent and quality of services
The Board received and considered various information regarding the nature, extent and quality of services provided to the Fund by Funds Management and the Sub-Adviser under the Advisory Agreements. This information included a description of the investment advisory services and Fund-level administrative services covered by the Management Agreement, as well as, among other things, a summary of the background and experience of senior management of Funds Management, and the qualifications, background, tenure and responsibilities of each of the portfolio managers primarily responsible for the day-to-day portfolio management of the Fund.
The Board evaluated the ability of Funds Management and the Sub-Adviser to attract and retain qualified investment professionals, including research, advisory and supervisory personnel. The Board further considered the compliance programs and compliance records of Funds Management and the Sub-Adviser. In addition, the Board took into account the full range of services provided to the Fund by Funds Management and its affiliates.
Fund performance and expenses
The Board considered the performance results for the Fund over various time periods ended December 31, 2015. The Board considered these results in comparison to the performance of funds in a universe that was determined by Broadridge Inc. (“Broadridge”) to be similar to the Fund (the “Universe”), and in comparison to the Fund’s benchmark index and to other comparative data. Broadridge is an independent provider of investment company data. The Board received a description of the methodology used by Broadridge to select the mutual funds in the performance Universe.
| | | | |
| 28 | | Wells Fargo Colorado Tax-Free Fund | | Other information (unaudited) |
The Board noted that the performance of the Fund (Administrator Class) was higher than the average performance of the Universe for all periods under reviewexcept the ten-year period under review. The Board also noted that the performance of the Fund was higher than its benchmark, the Barclays Municipal Bond Index, for all periods under review.
The Board also received and considered information regarding the Fund’s net operating expense ratios and their various components, including actual management fees, custodian and other non-management fees, and Rule 12b-1 and non-Rule 12b-1 shareholder service fees. The Board considered these ratios in comparison to the median ratios of funds in class-specific expense groups that were determined by Broadridge to be similar to the Fund (the “Groups”). The Board received a description of the methodology used by Broadridge to select the mutual funds in the expense Groups and an explanation of how funds comprising expense groups and their expense ratios may vary from year-to-year. Based on the Broadridge reports, the Board noted that the net operating expense ratios of the Fund were in range of or equal to the median net operating expense ratios of the expense Groups.
The Board took into account the Fund performance and expense information provided to it among the factors considered in deciding to re-approve the Advisory Agreements.
Investment management and sub-advisory fee rates
The Board reviewed and considered the contractual fee rates payable by the Fund to Funds Management under the Management Agreement, as well as the contractual fee rates payable by the Fund to Funds Management for class-level administrative services under a Class-Level Administration Agreement, which include class-level transfer agency and sub-transfer agency costs (collectively, the “Management Rates”). The Board also reviewed and considered the contractual investment sub-advisory fee rates that are payable by Funds Management to the Sub-Adviser for investment sub-advisory services.
Among other information reviewed by the Board was a comparison of the Fund’s Management Rates with the average contractual investment management fee rates of funds in the expense Groups at a common asset level as well as transfer agency costs of the funds in the expense Groups. The Board noted that the Management Rates of the Fund were lower than the sum of these average rates for the Fund’s expense Groups for all share classes.
The Board also received and considered information about the portion of the total management fee that was retained by Funds Management after payment of the fee to the Sub-Adviser for sub-advisory services. In assessing the reasonableness of this amount, the Board received and evaluated information about the nature and extent of responsibilities retained and risks assumed by Funds Management and not delegated to or assumed by the Sub-Adviser, and about Funds Management’s on-going oversight services. However, given the affiliation between Funds Management and the Sub-Adviser, the Board ascribed limited relevance to the allocation of fees between them.
The Board also received and considered information about the nature and extent of services offered and fee rates charged by Funds Management and the Sub-Adviser to other types of clients with investment strategies similar to those of the Fund. In this regard, the Board received information about the significantly greater scope of services, and compliance, reporting and other legal burdens and risks of managing mutual funds compared with those associated with managing assets of non-mutual fund clients such as collective funds or institutional separate accounts.
Based on its consideration of the factors and information it deemed relevant, including those described here, the Board determined that the compensation payable to Funds Management under the Management Agreement and to the Sub-Adviser under the Sub-Advisory Agreement was reasonable, in light of the services covered by the Advisory Agreements.
Profitability
The Board received and considered information concerning the profitability of Funds Management, as well as the profitability of Wells Fargo as a whole, from providing services to the Fund and the fund family as a whole. The Board also received and considered information concerning the profitability of the Sub-Adviser from providing services to the fund family as a whole, noting that the Sub-Adviser’s profitability information with respect to providing services to the Fund was subsumed in the Wells Fargo and Funds Management profitability analysis.
Funds Management reported on the methodologies and estimates used in calculating profitability. Among other things, the Board noted that the levels of profitability reported on a fund-by-fund basis varied widely, depending on factors such as the size and type of fund. Based on its review, the Board did not deem the profits reported by Funds Management or Wells Fargo from its services to the Fund to be at a level that would prevent it from approving the continuation of the Advisory Agreements.
| | | | | | |
| Other information (unaudited) | | Wells Fargo Colorado Tax-Free Fund | | | 29 | |
Economies of scale
With respect to possible economies of scale, the Board noted the existence of breakpoints in the Fund’s management fee structure, which operate generally to reduce the Fund’s expense ratios as the Fund grows in size. It considered that, for a small fund or a fund that shrinks in size, breakpoints conversely can result in higher fee levels. The Board also considered that fee waiver and expense reimbursement arrangements and competitive fee rates at the outset are means of sharing potential economies of scale with shareholders of the Fund and the fund family as a whole. The Board considered Funds Management’s view that any analyses of potential economies of scale in managing a particular fund are inherently limited in light of the joint and common costs and investments that Funds Management incurs across the fund family as a whole.
The Board concluded that the Fund’s fee and expense arrangements, including contractual breakpoints, constituted a reasonable approach to sharing potential economies of scale with the Fund and its shareholders.
Other benefits to Funds Management and the Sub-Adviser
The Board received and considered information regarding potential “fall-out” or ancillary benefits received by Funds Management and its affiliates, including the Sub-Adviser, as a result of their relationships with the Fund. Ancillary benefits could include, among others, benefits directly attributable to other relationships with the Fund and benefits potentially derived from an increase in Funds Management’s and the Sub-Adviser’s business as a result of their relationships with the Fund. The Board noted that various affiliates of Funds Management may receive distribution-related fees, shareholder servicing payments and sub-transfer agency fees in respect of shares sold or held through them and services provided.
The Board also reviewed information about soft dollar credits earned and utilized by the Sub-Adviser, fees earned by Funds Management and the Sub-Adviser from managing a private investment vehicle for the fund family’s securities lending collateral and commissions earned by an affiliated broker from portfolio transactions.
Based on its consideration of the factors and information it deemed relevant, including those described here, the Board did not find that any ancillary benefits received by Funds Management and its affiliates, including the Sub-Adviser, were unreasonable.
Conclusion
At the Meeting, after considering the above-described factors and based on its deliberations and its evaluation of the information described above, the Board unanimously approved the continuation of the Advisory Agreements for a one-year term and determined that the compensation payable to Funds Management and the Sub-Adviser under each of the Advisory Agreements was reasonable.
| | | | |
| 30 | | Wells Fargo Colorado Tax-Free Fund | | List of abbreviations |
The following is a list of common abbreviations for terms and entities that may have appeared in this report.
| ACA | — ACA Financial Guaranty Corporation |
| ADR | — American depositary receipt |
| ADS | — American depositary shares |
| AGC | — Assured Guaranty Corporation |
| AGM | — Assured Guaranty Municipal |
| Ambac | — Ambac Financial Group Incorporated |
| AMT | — Alternative minimum tax |
| BAN | — Bond anticipation notes |
| BHAC | — Berkshire Hathaway Assurance Corporation |
| CAB | — Capital appreciation bond |
| CCAB | — Convertible capital appreciation bond |
| CDA | — Community Development Authority |
| CDO | — Collateralized debt obligation |
| DRIVER | — Derivative inverse tax-exempt receipts |
| DW&P | — Department of Water & Power |
| DWR | — Department of Water Resources |
| ECFA | — Educational & Cultural Facilities Authority |
| EDA | — Economic Development Authority |
| EDFA | — Economic Development Finance Authority |
| ETF | — Exchange-traded fund |
| FDIC | — Federal Deposit Insurance Corporation |
| FFCB | — Federal Farm Credit Banks |
| FGIC | — Financial Guaranty Insurance Corporation |
| FHA | — Federal Housing Administration |
| FHLB | — Federal Home Loan Bank |
| FHLMC | — Federal Home Loan Mortgage Corporation |
| FICO | — The Financing Corporation |
| FNMA | — Federal National Mortgage Association |
| GDR | — Global depositary receipt |
| GNMA | — Government National Mortgage Association |
| HCFR | — Healthcare facilities revenue |
| HEFA | — Health & Educational Facilities Authority |
| HEFAR | — Higher education facilities authority revenue |
| HFA | — Housing Finance Authority |
| HFFA | — Health Facilities Financing Authority |
| HUD | — Department of Housing and Urban Development |
| IDA | — Industrial Development Authority |
| IDAG | — Industrial Development Agency |
| KRW | — Republic of Korea won |
| LIBOR | — London Interbank Offered Rate |
| LIFER | — Long Inverse Floating Exempt Receipts |
| LLC | — Limited liability company |
| LLLP | — Limited liability limited partnership |
| LLP | — Limited liability partnership |
| MBIA | — Municipal Bond Insurance Association |
| MFHR | — Multifamily housing revenue |
| MSTR | — Municipal securities trust receipts |
| MUD | — Municipal Utility District |
| National | — National Public Finance Guarantee Corporation |
| PCFA | — Pollution Control Financing Authority |
| PCL | — Public Company Limited |
| PCR | — Pollution control revenue |
| PFA | — Public Finance Authority |
| PFFA | — Public Facilities Financing Authority |
| PFOTER | — Puttable floating option tax-exempt receipts |
| plc | — Public limited company |
| PUTTER | — Puttable tax-exempt receipts |
| R&D | — Research & development |
| Radian | — Radian Asset Assurance |
| RAN | — Revenue anticipation notes |
| RDA | — Redevelopment Authority |
| RDFA | — Redevelopment Finance Authority |
| REIT | — Real estate investment trust |
| ROC | — Reset option certificates |
| SAVRS | — Select auction variable rate securities |
| SBA | — Small Business Authority |
| SDR | — Swedish depositary receipt |
| SFHR | — Single-family housing revenue |
| SFMR | — Single-family mortgage revenue |
| SPA | — Standby purchase agreement |
| SPDR | — Standard & Poor’s Depositary Receipts |
| SPEAR | — Short Puttable Exempt Adjustable Receipts |
| STRIPS | — Separate trading of registered interest and |
| TAN | — Tax anticipation notes |
| TIPS | — Treasury inflation-protected securities |
| TRAN | — Tax revenue anticipation notes |
| TTFA | — Transportation Trust Fund Authority |
| TVA | — Tennessee Valley Authority |
This page is intentionally left blank.
This page is intentionally left blank.

For more information
More information about Wells Fargo Funds is available free upon request. To obtain literature, please write, email, visit the Fund’s website, or call:
Wells Fargo Funds
P.O. Box 8266
Boston, MA 02266-8266
Email: fundservice@wellsfargo.com
Website: wellsfargofunds.com
Individual investors: 1-800-222-8222
Retail investment professionals: 1-888-877-9275
Institutional investment professionals: 1-866-765-0778
This report and the financial statements contained herein are submitted for the general information of the shareholders of the Fund. If this report is used for promotional purposes, distribution of the report must be accompanied or preceded by a current prospectus. Before investing, please consider the investment objectives, risks, charges, and expenses of the investment. For a current prospectus and, if available, a summary prospectus, containing this information, call 1-800-222-8222 or visit the Fund’s website at wellsfargofunds.com. Read the prospectus carefully before you invest or send money.
Wells Fargo Asset Management (WFAM) is a trade name used by the asset management businesses of Wells Fargo & Company. Wells Fargo Funds Management, LLC, a wholly owned subsidiary of Wells Fargo & Company, provides investment advisory and administrative services for Wells Fargo Funds. Other affiliates of Wells Fargo & Company provide subadvisory and other services for the funds. The funds are distributed by Wells Fargo Funds Distributor, LLC, Member FINRA, an affiliate of Wells Fargo & Company.
NOT FDIC INSURED ¡ NO BANK GUARANTEE ¡ MAY LOSE VALUE
© 2016 Wells Fargo Funds Management, LLC. All rights reserved.
| | |
 | | 244402 08-16 A250/AR250 6-16 |
Annual Report
June 30, 2016

Wells Fargo High Yield Municipal Bond Fund


Reduce clutter. Save trees.
Sign up for electronic delivery of prospectuses and shareholder reports at wellsfargo.com/advantagedelivery
Contents
The views expressed and any forward-looking statements are as of June 30, 2016, unless otherwise noted, and are those of the Fund managers and/or Wells Fargo Funds Management, LLC. Discussions of individual securities, or the markets generally, or any Wells Fargo Fund are not intended as individual recommendations. Future events or results may vary significantly from those expressed in any forward-looking statements. The views expressed are subject to change at any time in response to changing circumstances in the market. Wells Fargo Funds Management, LLC and the Fund disclaim any obligation to publicly update or revise any views expressed or forward-looking statements.
NOT FDIC INSURED ¡ NO BANK GUARANTEE ¡ MAY LOSE VALUE
| | | | |
| 2 | | Wells Fargo High Yield Municipal Bond Fund | | Letter to shareholders (unaudited) |

Karla M. Rabusch
President
Wells Fargo Funds
In fact, yields on municipal bonds that matured in 10 years or more experienced yield declines of more than 100 basis points (100 basis points equals 1.00%) during the reporting period.
Dear Valued Shareholder:
We are pleased to offer you this annual report for the Wells Fargo High Yield Municipal Bond Fund for the 12-month period that ended June 30, 2016. The U.S. Federal Reserve (Fed) began normalizing monetary policy, raising the federal funds rate to between 0.25% and 0.50% in December 2015. Short-term municipal bond yields rose, but yields on longer-term bonds declined. In fact, yields on municipal bonds that matured in 10 years or more experienced yield declines of more than 100 basis points (100 basis points equals 1.00%) during the reporting period. The Barclays Municipal Bond Index,1 a broad measure tracking investment-grade municipal bonds, returned 7.65% during the 12-month reporting period.
Monetary policy was accommodative.
The Fed continued an easy monetary policy in order to support the economy and the financial system. However, it raised the federal funds target rate in December because it believed the U.S. economy was strong enough to begin normalizing monetary policy. The European Central Bank cut all three of its short-term rates during the reporting period, increased its asset-purchase program from 60 billion euros per month to 80 billion, expanded the list of eligible securities to include investment-grade nonbank debt, and created a fund-to-lend program where banks could be paid to lend money. In Japan, the Bank of Japan maintained an aggressive monetary program aimed at combating deflation.
Despite accommodative central-bank policies that helped keep interest rates at ultra-low levels, there were periods of volatility. Early in 2016, weakness in certain emerging markets economies and commodities hurt riskier assets and a vote in June 2016 by the U.K. to exit the European Union set off another round of global uncertainty. Municipal bonds benefited because they are perceived as a safe-haven asset. In addition, investor demand for yield helped lower-rated debt outperform. The Barclays High Yield Municipal Bond Index2 returned 12.09% during the 12-month period that ended June 30, 2016.
Strong demand, modest supply, and solid credit fundamentals supported municipals.
Market technicals remained favorable. According to the Investment Company Institute, more than $33 billion was allocated to municipal mutual funds during the first half of 2016, which was more than double the inflows during all of 2015. Further, inflows during the second quarter of 2016 were the largest in nearly seven years. In contrast, less new supply helped make 2015 the fifth calendar year of negative net supply and supply in the first half of 2016 was about 4% less than the same period last year.
Municipal credit quality remained on an uptrend despite a number of high-profile negative credit situations. Idiosyncratic credit risks remain, however. With regard to Puerto Rico, the U.S. enacted legislation that prohibits bondholder lawsuits temporarily and instills a fiscal oversight board for Puerto Rico; Puerto Rico then declared a moratorium on paying its general obligation (GO) bonds and defaulted on $911 million in payments due (most of which were GOs) on July 1, 2016. The
| 1 | The Barclays Municipal Bond Index is an unmanaged index composed of long-term tax-exempt bonds with a minimum credit rating of Baa. You cannot invest directly in an index. |
| 2 | The Barclays High Yield Municipal Bond Index measures the non-investment-grade and nonrated U.S. dollar–denominated, fixed-rate, tax-exempt bond market within the 50 United States and four other qualifying regions (Washington, D.C.; Puerto Rico; Guam; and the Virgin Islands). The index allows state and local general obligation, revenue, insured, and prerefunded bonds; however, historically the index has been composed of mostly revenue bonds. You cannot invest directly in an index. |
| | | | | | |
| Letter to shareholders (unaudited) | | Wells Fargo High Yield Municipal Bond Fund | | | 3 | |
state of Illinois approved a six-month stopgap budget, a temporary but meaningful step. Under this stopgap budget for the state, the city of Chicago receives authority to raise property taxes for teacher pensions and low-income school districts would receive greater state funding. City of Chicago and school district debt rallied on the news.
Since the end of the financial crisis, structural changes in the fixed-income markets have reduced trading liquidity (the degree to which assets can be bought or sold without affecting the price). New regulations and capital requirements have caused traditional liquidity suppliers (banks and broker/dealers) to be more risk-averse and hold less inventory. Meanwhile, corporate-debt issuance has spiked as companies finance themselves at record-low yields, bond mutual funds hold larger amounts of this new debt supply, trading volumes are lower, and large trades are more difficult to execute. However, fixed-income markets appear to have functioned well over the past year with sufficient liquidity.
Don’t let short-term uncertainty derail long-term investment goals.
Periods of uncertainty can present challenges, but experience has taught us that maintaining long-term investment goals can be an effective way to plan for the future. To help you create a sound strategy based on your personal goals and risk tolerance, Wells Fargo Funds offers more than 100 mutual funds spanning a wide range of asset classes and investment styles. Although diversification cannot guarantee an investment profit or prevent losses, we believe it can be an effective way to manage investment risk and potentially smooth out overall portfolio performance. We encourage investors to know their investments and to understand that appropriate levels of risk-taking may unlock opportunities.
Thank you for choosing to invest in Wells Fargo Funds. We appreciate your confidence in us and remain committed to helping you meet your financial needs.
Sincerely,

Karla M. Rabusch
President
Wells Fargo Funds
Periods of uncertainty can present challenges, but experience has taught us that maintaining long-term investment goals can be an effective way to plan for the future.
For further information about your Fund, contact your investment professional, visit our website at wellsfargofunds.com, or call us directly at 1-800-222-8222. We are available 24 hours a day, 7 days a week.
| | | | |
| 4 | | Wells Fargo High Yield Municipal Bond Fund | | Performance highlights (unaudited) |
Investment objective
The Fund seeks current income exempt from federal income tax, and capital appreciation.
Manager
Wells Fargo Funds Management, LLC
Subadviser
Wells Capital Management Incorporated
Portfolio managers
Dennis Derby
Lyle J. Fitterer, CFA®, CPA
Terry J. Goode
Average annual total returns (%) as of June 30, 2016
| | | | | | | | | | | | | | | | | | | | | | | | | | |
| | | | | Including sales charge | | | Excluding sales charge | | | Expense ratios1 (%) | |
| | | Inception date | | 1 year | | | Since inception | | | 1 year | | | Since inception | | | Gross | | | Net2 | |
| Class A (WHYMX) | | 1-31-2013 | | | 4.49 | | | | 5.23 | | | | 9.44 | | | | 6.66 | | | | 1.08 | | | | 0.86 | |
| Class C (WHYCX) | | 1-31-2013 | | | 7.62 | | | | 5.87 | | | | 8.62 | | | | 5.87 | | | | 1.83 | | | | 1.61 | |
| Administrator Class (WHYDX) | | 1-31-2013 | | | – | | | | – | | | | 9.65 | | | | 6.79 | | | | 1.02 | | | | 0.76 | |
| Institutional Class (WHYIX) | | 1-31-2013 | | | – | | | | – | | | | 9.71 | | | | 6.92 | | | | 0.75 | | | | 0.61 | |
| Barclays Municipal Bond Index3 | | – | | | – | | | | – | | | | 7.65 | | | | 3.93 | | | | – | | | | – | |
| Barclays High Yield Municipal Bond Index4 | | – | | | – | | | | – | | | | 12.09 | | | | 4.69 | | | | – | | | | – | |
Figures quoted represent past performance, which is no guarantee of future results, and do not reflect taxes that a shareholder may pay on fund distributions or the redemption of fund shares. Investment return and principal value of an investment will fluctuate so that an investor’s shares, when redeemed, may be worth more or less than their original cost. Performance shown without sales charges would be lower if sales charges were reflected. Current performance may be lower or higher than the performance data quoted, which assumes the reinvestment of dividends and capital gains. Current month-end performance is available on the Fund’s website, wellsfargofunds.com.
Index returns do not include transaction costs associated with buying and selling securities, any mutual fund fees or expenses, or any taxes. It is not possible to invest directly in an index.
For Class A shares, the maximum front-end sales charge is 4.50%. For Class C shares, the maximum contingent deferred sales charge is 1.00%. Performance including a contingent deferred sales charge assumes the sales charge for the corresponding time period. Administrator Class and Institutional shares are sold without a front-end sales charge or contingent deferred sales charge.
Bond values fluctuate in response to the financial condition of individual issuers, general market and economic conditions, and changes in interest rates. Changes in market conditions and government policies may lead to periods of heightened volatility in the bond market and reduced liquidity for certain bonds held by the Fund. In general, when interest rates rise, bond values fall and investors may lose principal value. Interest-rate changes and their impact on the Fund and its share price can be sudden and unpredictable. High-yield securities have a greater risk of default and tend to be more volatile than higher-rated debt securities. The use of derivatives may reduce returns and/or increase volatility. Certain investment strategies tend to increase the total risk of an investment (relative to the broader market). The Fund is exposed to municipal securities risk. Consult the Fund’s prospectus for additional information on these and other risks. A portion of the Fund’s income may be subject to federal, state, and/or local income taxes or the Alternative Minimum Tax (AMT). Any capital gains distributions may be taxable.
Please see footnotes on page 5.
| | | | | | |
| Performance highlights (unaudited) | | Wells Fargo High Yield Municipal Bond Fund | | | 5 | |
|
| Growth of $10,000 investment as of June 30, 20165 |
|
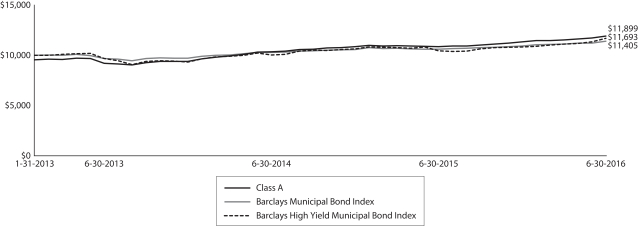 |
| 1 | Reflects the expense ratios as stated in the most recent prospectuses, which include the impact of 0.01% in acquired fund fees and expenses. The expense ratios shown are subject to change and may differ from the annualized expense ratios shown in the financial highlights of this report, which do not include acquired fund fees and expenses. |
| 2 | The manager has contractually committed through October 31, 2016, to waive fees and/or reimburse expenses to the extent necessary to cap the Fund’s Total Annual Fund Operating Expenses After Fee Waiver at 0.85% for Class A, 1.60% for Class C, 0.75% for Administrator Class, and 0.60% for Institutional Class. After this time, the cap may be increased or the commitment to maintain the cap may be terminated only with the approval of the Board of Trustees. Brokerage commissions, stamp duty fees, interest, taxes, acquired fund fees and expenses, and extraordinary expenses are excluded from the expense cap. Without this cap, the Fund’s returns would have been lower. |
| 3 | The Barclays Municipal Bond Index is an unmanaged index composed of long-term tax-exempt bonds with a minimum credit rating of Baa. You cannot invest directly in an index. |
| 4 | The Barclays High Yield Municipal Bond Index measures the non-investment-grade and nonrated U.S. dollar–denominated, fixed-rate, tax-exempt bond market within the 50 United States and four other qualifying regions (Washington, D.C.; Puerto Rico; Guam; and the Virgin Islands). The index allows state and local general obligation, revenue, insured, and prerefunded bonds; however, historically the index has been composed of mostly revenue bonds. You cannot invest directly in an index. |
| 5 | The chart compares the performance of Class A shares since inception with the Barclays Municipal Bond Index and the Barclays High Yield Municipal Bond Index. The chart assumes a hypothetical $10,000 investment in Class A shares and reflects all operating expenses and assumes the maximum initial sales charge of 4.50%. |
| 6 | Amounts are calculated based on the total investments of the Fund. These amounts are subject to change and may have changed since the date specified. |
| 7 | The credit quality distribution of portfolio holdings reflected in the chart is based on ratings from Standard & Poor’s, Moody’s Investors Service, and/or Fitch Ratings Ltd. Credit quality ratings apply to the underlying holdings of the Fund and not to the Fund itself. The percentages of the Fund’s portfolio with the ratings depicted in the chart are calculated based on the total market value of fixed income securities held by the Fund. If a security was rated by all three rating agencies, the middle rating was utilized. If rated by two of three rating agencies, the lower rating was utilized, and if rated by one of the rating agencies, that rating was utilized. Standard & Poor’s rates the creditworthiness of bonds, ranging from AAA (highest) to D (lowest). Ratings from A to CCC may be modified by the addition of a plus (+) or minus (-) sign to show relative standing within the rating categories. Standard & Poor’s rates the creditworthiness of short-term notes from SP-1 (highest) to SP-3 (lowest). Moody’s rates the creditworthiness of bonds, ranging from Aaa (highest) to C (lowest). Ratings Aa to B may be modified by the addition of a number 1 (highest) to 3 (lowest) to show relative standing within the ratings categories. Moody’s rates the creditworthiness of short-term U.S. tax-exempt municipal securities from MIG 1/VMIG 1 (highest) to SG (lowest). Fitch rates the creditworthiness of bonds, ranging from AAA (highest) to D (lowest). Credit quality distribution is subject to change and may have changed since the date specified. |
| | | | |
| 6 | | Wells Fargo High Yield Municipal Bond Fund | | Performance highlights (unaudited) |
MANAGER’S DISCUSSION
Fund highlights
| n | | The Fund outperformed its benchmark, the Barclays Municipal Bond Index, for the 12-month period that ended June 30, 2016. The Fund, however, underperformed the Barclays High Yield Municipal Bond Index over that same period. |
| n | | Investors continued their search for income in this low-yield environment, which caused lower-quality bonds to perform very well. The Fund’s overweight to A-rated, BBB-rated, and out-of-benchmark below-investment-grade debt was the biggest contributor to excess returns. |
| n | | The Fund began the period with a duration that was longer than the benchmark. As rates rallied, we slowly reduced its duration and are now positioned for higher rates. We also began reducing the Fund’s bias for a flatter yield curve in the second quarter of 2016 given the amount of flattening that had already occurred. |
| n | | Issue selection within the special tax, education, health care, and transportation sectors contributed to results, while corporate-backed and resource recovery holdings detracted. Our largest state overweight was to Illinois debt, and it was one of the best-performing states despite its prolonged budgetary crisis. |
|
| Effective maturity distribution as of June 30, 20166 |
|
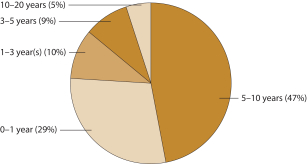 |
Ultralow yields continued throughout the period.
With the U.S. Federal Reserve (Fed) poised to normalize its interest-rate policy, shorter-term maturities between one and five years appeared less attractive at the beginning of the reporting period due to the potential for them to rise. However, subdued inflation expectations, due in part to low oil prices, combined with a fragile European economy and softening Chinese economy, implied that longer maturities would outperform. We, therefore, extended the Fund’s duration in anticipation of lower yields and also positioned the Fund for a flatter yield curve. The Fund’s yield-curve positioning, which was underweight maturities between 1 and 7 years
and overweight the 10-year area, helped results. Longer-term maturities outperformed shorter-term maturities by a wide margin because the municipal curve flattened almost 150 basis points (bps; 100 bps equals 1.00%) between the 1- and 30-year maturities.
The Fed tightened in December 2015 but signaled that the pace of further increases would be gradual. While the Fed was likely to take its time raising rates, U.S. inflation started to trend higher, unemployment remained below 5%, and economic growth was expected to remain at or above 2%. We initially kept the Fund’s duration long but started to reduce it as the market rallied. The Fund’s short duration positioning hurt relative performance during the second half of the reporting period as U.S. rates continued to move lower in sympathy with declining global interest rates.
Please see footnotes on page 5.
| | | | | | |
| Performance highlights (unaudited) | | Wells Fargo High Yield Municipal Bond Fund | | | 7 | |
|
| Credit quality as of June 30, 20167 |
|
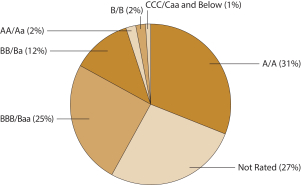 |
Credit-quality allocation helped results.
The Fund’s overweight to BBB-rated debt and its holdings in high-yield and nonrated debt contributed to results because lower-rated bonds outperformed higher-quality bonds by a wide margin. The Fund’s holdings within the special tax, education, and transportation sectors performed well. Notably, within the education sector, smaller private universities outperformed. On the other hand, issue selection within resource recovery and corporate-backed sectors detracted from results. While we have been cautious about the health care sector because we believe credit fundamentals have peaked, the Fund’s lower-rated health care issues contributed to performance. Although taxable corporate bond spreads
increased dramatically during late 2015 and early 2016 as global fears spooked the market, spreads for corporate-backed municipal debt declined. We sold into this rally, but continued new-money flows into high-yield and longer-term municipal bonds funds caused these spreads to move even tighter. Issue selection within Illinois, Colorado, and Michigan added to results. Regarding sector allocations, we reduced exposure to Illinois debt, added New York debt, and increased exposure to senior care
Political noise and a lack of a state budget caused volatility within Illinois, but the state’s bonds had some of the highest returns. We have been overweight Illinois bonds since the Fund’s inception because we feel that the above-market income is compensating investors for the credit issues. We continue to believe that the state’s economic backdrop and ability to raise revenues, combined with Illinois Governor Bruce Rauner’s focus on cutting expenses, should ultimately lead to tighter spreads. During the past 12 months, Puerto Rico had several widely anticipated defaults on its debt. The lack of clarity surrounding the federal government’s restructuring legislation for Puerto Rico debt, the lack of financial statements, and a declining economy make it very hard to develop an investment opinion for the territory. As a result, we had minimal exposure to Puerto Rico bonds. Finally, the Fund ended the year with no exposure to tobacco bonds. While the sector continued to outperform, recent developments highlighted longer-term risks within the sector. Fitch recently withdrew its credit ratings on all tobacco issues, citing the problematic modeling of revenues going forward.
Rates may be lower for longer, making credit allocation and issue selection even more important.
Near the end of the reporting period, the U.K. voted to withdraw from the European Union, prompting considerable uncertainty about future political situations, financial markets, and economic growth. U.S. Treasuries and municipal bonds rallied significantly on the news, and both 10-year and 30-year municipal yields reached record-low levels. Although we think rates may stay lower for longer, we recognize that an improvement in overseas economies, outflows in mutual funds, or a more hawkish tone from the Fed could lead to a spike in rates. In the (we would hope unlikely) event of a materially weaker U.S. economy, that could be the catalyst for us to increase our duration exposure and reduce our credit exposure. In this record-low interest-rate environment, security selection is even more important as breakeven yields (the sell-off that a bond can endure before the total return drops to zero) decrease.
Please see footnotes on page 5.
| | | | |
| 8 | | Wells Fargo High Yield Municipal Bond Fund | | Fund expenses (unaudited) |
As a shareholder of the Fund, you incur two types of costs: (1) transaction costs, including sales charges (loads) on purchase payments and contingent deferred sales charges (if any) on redemptions and (2) ongoing costs, including management fees, distribution (12b-1) and/or shareholder servicing fees, and other Fund expenses. This example is intended to help you understand your ongoing costs (in dollars) of investing in the Fund and to compare these costs with the ongoing costs of investing in other mutual funds.
The example is based on an investment of $1,000 invested at the beginning of the six-month period and held for the entire period from January 1, 2016 to June 30, 2016.
Actual expenses
The “Actual” line of the table below provides information about actual account values and actual expenses. You may use the information in this line, together with the amount you invested, to estimate the expenses that you paid over the period. Simply divide your account value by $1,000 (for example, an $8,600 account value divided by $1,000 = 8.6), then multiply the result by the number in the “Actual” line under the heading entitled “Expenses paid during period” for your applicable class of shares to estimate the expenses you paid on your account during this period.
Hypothetical example for comparison purposes
The “Hypothetical” line of the table below provides information about hypothetical account values and hypothetical expenses based on the Fund’s actual expense ratio and an assumed rate of return of 5% per year before expenses, which is not the Fund’s actual return. The hypothetical account values and expenses may not be used to estimate the actual ending account balance or expenses you paid for the period. You may use this information to compare the ongoing costs of investing in the Fund and other funds. To do so, compare this 5% hypothetical example with the 5% hypothetical examples that appear in the shareholder reports of the other funds.
Please note that the expenses shown in the table are meant to highlight your ongoing costs only and do not reflect any transactional costs, such as sales charges (loads) and contingent deferred sales charges. Therefore, the “Hypothetical” line of the table is useful in comparing ongoing costs only and will not help you determine the relative total costs of owning different funds. In addition, if these transactional costs were included, your costs would have been higher.
| | | | | | | | | | | | | | | | |
| | | Beginning
account value
1-1-2016 | | | Ending
account value
6-30-2016 | | | Expenses
paid during
the period¹ | | | Net annualized
expense ratio | |
Class A | | | | | | | | | | | | | | | | |
Actual | | $ | 1,000.00 | | | $ | 1,049.19 | | | $ | 4.33 | | | | 0.85 | % |
Hypothetical (5% return before expenses) | | $ | 1,000.00 | | | $ | 1,020.64 | | | $ | 4.27 | | | | 0.85 | % |
Class C | | | | | | | | | | | | | | | | |
Actual | | $ | 1,000.00 | | | $ | 1,045.28 | | | $ | 8.14 | | | | 1.60 | % |
Hypothetical (5% return before expenses) | | $ | 1,000.00 | | | $ | 1,016.91 | | | $ | 8.02 | | | | 1.60 | % |
Administrator Class | | | | | | | | | | | | | | | | |
Actual | | $ | 1,000.00 | | | $ | 1,050.67 | | | $ | 3.82 | | | | 0.75 | % |
Hypothetical (5% return before expenses) | | $ | 1,000.00 | | | $ | 1,021.13 | | | $ | 3.77 | | | | 0.75 | % |
Institutional Class | | | | | | | | | | | | | | | | |
Actual | | $ | 1,000.00 | | | $ | 1,050.48 | | | $ | 3.06 | | | | 0.60 | % |
Hypothetical (5% return before expenses) | | $ | 1,000.00 | | | $ | 1,021.88 | | | $ | 3.02 | | | | 0.60 | % |
| 1 | Expenses paid is equal to the annualized expense ratio of each class multiplied by the average account value over the period, multiplied by the number of days in the most recent fiscal half-year divided by the number of days in the fiscal year (to reflect the one-half-year period). |
| | | | | | |
| Portfolio of investments—June 30, 2016 | | Wells Fargo High Yield Municipal Bond Fund | | | 9 | |
| | | | | | | | | | | | | | | | |
| Security name | | Interest rate | | | Maturity date | | | Principal | | | Value | |
| | | | |
Municipal Obligations: 99.79% | | | | | | | | | | | | | | | | |
| | | | |
| Alabama: 1.13% | | | | | | | | | | | | | | | | |
Alabama State University General Tuition and Fee Revenue Bonds (Education Revenue, Syncora Guarantee Incorporated Insured) | | | 5.25 | % | | | 8-1-2032 | | | $ | 1,000,000 | | | $ | 1,000,260 | |
Jefferson County AL Sewer Warrants CAB Senior Lien Series B (Water & Sewer Revenue, AGM Insured) ¤ | | | 0.00 | | | | 10-1-2027 | | | | 920,000 | | | | 595,866 | |
| | | | |
| | | | | | | | | | | | | | | 1,596,126 | |
| | | | | | | | | | | | | | | | |
| | | | |
| Arizona: 1.54% | | | | | | | | | | | | | | | | |
Florence AZ IDA Legacy Traditional School Project Queen Creek & Casa Grande Campuses (Education Revenue) | | | 5.00 | | | | 7-1-2023 | | | | 250,000 | | | | 275,723 | |
Phoenix AZ IDA Great Hearts Academies Project (Education Revenue) | | | 5.20 | | | | 7-1-2022 | | | | 160,000 | | | | 172,522 | |
Phoenix AZ IDA Legacy Traditional Schools Project Series A (Education Revenue) 144A | | | 6.50 | | | | 7-1-2034 | | | | 500,000 | | | | 596,975 | |
Pima County AZ IDA New Plan Learning Project Series A (Education Revenue) | | | 8.13 | | | | 7-1-2041 | | | | 500,000 | | | | 501,515 | |
Pima County AZ IDA Refunding Bond Desert Heights Charter School Facility (Education Revenue) | | | 6.00 | | | | 5-1-2024 | | | | 580,000 | | | | 634,073 | |
| | | | |
| | | | | | | | | | | | | | | 2,180,808 | |
| | | | | | | | | | | | | | | | |
| | | | |
| California: 3.61% | | | | | | | | | | | | | | | | |
Anaheim CA PFA Convention Center Expansion Project Series A (Miscellaneous Revenue) | | | 5.00 | | | | 5-1-2046 | | | | 500,000 | | | | 605,455 | |
California CDA Baptist University Series B (Education Revenue) 144A | | | 5.75 | | | | 11-1-2017 | | | | 100,000 | | | | 103,442 | |
California Municipal Finance Authority Charter School Albert Einstein Academies Project Series A (Miscellaneous Revenue) | | | 7.13 | | | | 8-1-2043 | | | | 250,000 | | | | 289,758 | |
California School Finance Authority View Park Elementary & Middle Schools Series A (Education Revenue) | | | 5.88 | | | | 10-1-2044 | | | | 1,000,000 | | | | 1,115,360 | |
California Statewide CDA Loma Linda University Medical Center Refunding Bond Series A (Health Revenue) | | | 5.25 | | | | 12-1-2044 | | | | 1,000,000 | | | | 1,143,880 | |
California Statewide CDA Senior Living Health Facilities Los Angeles Jewish Home for the Aging Series D (Health Revenue) | | | 4.75 | | | | 8-1-2020 | | | | 1,000,000 | | | | 1,004,670 | |
California Student Education Loan Marketing Corporation Series IV-D1 (Education Revenue) | | | 5.88 | | | | 1-1-2018 | | | | 500,000 | | | | 499,940 | |
Compton CA Community College RDA Project 2nd Lien Series A (Tax Revenue) | | | 4.75 | | | | 8-1-2019 | | | | 225,000 | | | | 241,558 | |
Compton CA Community College RDA Project 2nd Lien Series A (Tax Revenue) | | | 5.00 | | | | 8-1-2020 | | | | 100,000 | | | | 109,943 | |
| | | | |
| | | | | | | | | | | | | | | 5,114,006 | |
| | | | | | | | | | | | | | | | |
| | | | |
| Colorado: 5.47% | | | | | | | | | | | | | | | | |
Arapahoe County CO Copperleaf Metropolitan District (GO Revenue) | | | 5.75 | | | | 12-1-2045 | | | | 500,000 | | | | 536,615 | |
Arvada CO Jefferson Center Metropolitan District (Tax Revenue) | | | 4.75 | | | | 12-1-2026 | | | | 1,280,000 | | | | 1,340,646 | |
Colorado High Performance Transportation Enterprise U.S. 36 and I-25 Managed Lanes (Transportation Revenue) | | | 5.75 | | | | 1-1-2044 | | | | 500,000 | | | | 549,065 | |
Colorado Springs CO Utilities System Sub Lien Improvement Series B (Utilities Revenue, Bayerische Landesbank SPA) ø | | | 0.56 | | | | 11-1-2036 | | | | 2,000,000 | | | | 2,000,000 | |
Eaton CO Area Park & Recreation District (GO Revenue) | | | 5.00 | | | | 12-1-2023 | | | | 810,000 | | | | 885,136 | |
Eaton CO Area Park & Recreation District (GO Revenue) | | | 5.50 | | | | 12-1-2030 | | | | 475,000 | | | | 524,015 | |
Fountain CO Urban Renewal Authority South Academy Highlands Project Series 2015-A (Tax Revenue) | | | 4.50 | | | | 11-1-2029 | | | | 1,725,000 | | | | 1,904,693 | |
| | | | |
| | | | | | | | | | | | | | | 7,740,170 | |
| | | | | | | | | | | | | | | | |
The accompanying notes are an integral part of these financial statements.
| | | | |
| 10 | | Wells Fargo High Yield Municipal Bond Fund | | Portfolio of investments—June 30, 2016 |
| | | | | | | | | | | | | | | | |
| Security name | | Interest rate | | | Maturity date | | | Principal | | | Value | |
| | | | |
| Delaware: 0.73% | | | | | | | | | | | | | | | | |
Delaware EDA Odyssey Charter School Incorporated Project Series A (Education Revenue) 144A | | | 7.00 | % | | | 9-1-2045 | | | $ | 1,000,000 | | | $ | 1,037,980 | |
| | | | | | | | | | | | | | | | |
| | | | |
| District of Columbia: 2.10% | | | | | | | | | | | | | | | | |
District of Columbia Population Services International (Miscellaneous Revenue, SunTrust Bank LOC) ø | | | 0.48 | | | | 11-1-2042 | | | | 2,535,000 | | | | 2,535,000 | |
District of Columbia Tobacco Settlement Financing Corporation (Tobacco Revenue) | | | 6.75 | | | | 5-15-2040 | | | | 435,000 | | | | 437,297 | |
| | | | |
| | | | | | | | | | | | | | | 2,972,297 | |
| | | | | | | | | | | | | | | | |
| | | | |
| Florida: 4.06% | | | | | | | | | | | | | | | | |
Crossings At Fleming Island Florida Community Development District Refunding Bond Senior Lien Series A-1 (Miscellaneous Revenue) | | | 4.00 | | | | 5-1-2024 | | | | 1,000,000 | | | | 1,044,440 | |
Florida Development Finance Corporation Educational Facilities Renaissance Charter School Project Series A (Education Revenue) | | | 8.50 | | | | 6-15-2044 | | | | 250,000 | | | | 296,683 | |
Holmes County FL Hospital Corporation Doctors Memorial Hospital Project (Health Revenue) | | | 6.00 | | | | 11-1-2038 | | | | 250,000 | | | | 250,678 | |
Miami-Dade County FL IDA Youth Co-Op Charter Schools Project Series A (Education Revenue) 144A | | | 6.00 | | | | 9-15-2045 | | | | 1,000,000 | | | | 1,060,110 | |
Orange County FL Health Facilities Authority Lakeside Health Facility (Health Revenue, SunTrust Bank LOC) ø | | | 0.48 | | | | 7-1-2027 | | | | 2,150,000 | | | | 2,150,000 | |
Trout Creek Florida Community Development District (Miscellaneous Revenue) | | | 4.88 | | | | 5-1-2025 | | | | 920,000 | | | | 953,700 | |
| | | | |
| | | | | | | | | | | | | | | 5,755,611 | |
| | | | | | | | | | | | | | | | |
| | | | |
| Georgia: 2.59% | | | | | | | | | | | | | | | | |
Cobb County GA Development Authority Student Housing Refunding Bond Kennesaw State University Foundation Project Series C (Housing Revenue) | | | 5.00 | | | | 7-15-2028 | | | | 800,000 | | | | 922,064 | |
Georgia Road & Tollway Authority Toll Revenue Convertible CAB I-75 South Expressway Lanes Project Series B (Transportation Revenue) 144A± | | | 0.00 | | | | 6-1-2049 | | | | 1,000,000 | | | | 615,000 | |
Savannah GA EDA Calvary Day School Project (Miscellaneous Revenue, SunTrust Bank LOC) ø | | | 0.50 | | | | 11-1-2026 | | | | 2,130,000 | | | | 2,130,000 | |
| | | | |
| | | | | | | | | | | | | | | 3,667,064 | |
| | | | | | | | | | | | | | | | |
| | | | |
| Guam: 0.23% | | | | | | | | | | | | | | | | |
Guam International Airport Authority Series C (Airport Revenue) | | | 6.38 | | | | 10-1-2043 | | | | 260,000 | | | | 318,128 | |
| | | | | | | | | | | | | | | | |
| | | | |
| Idaho: 0.34% | | | | | | | | | | | | | | | | |
Idaho Housing & Finance Association Idaho Arts Charter School Incorporated Project Series A (Education Revenue) | | | 6.50 | | | | 12-1-2038 | | | | 200,000 | | | | 213,316 | |
Idaho Housing & Finance Association Legacy Public Charter School Incorporated Project Series A (Education Revenue) | | | 6.25 | | | | 5-1-2043 | | | | 250,000 | | | | 274,095 | |
| | | | |
| | | | | | | | | | | | | | | 487,411 | |
| | | | | | | | | | | | | | | | |
| | | | |
| Illinois: 14.60% | | | | | | | | | | | | | | | | |
Chicago IL Board of Education CAB School Reform Series A (GO Revenue, National Insured) ¤ | | | 0.00 | | | | 12-1-2023 | | | | 500,000 | | | | 386,985 | |
Chicago IL Board of Education CAB School Reform Series A (GO Revenue, National Insured) ¤ | | | 0.00 | | | | 12-1-2024 | | | | 1,000,000 | | | | 741,530 | |
Chicago IL Board of Education CAB School Reform Series A (GO Revenue, National Insured) ¤ | | | 0.00 | | | | 12-1-2025 | | | | 500,000 | | | | 354,210 | |
Chicago IL Board of Education CAB School Reform Series B-1 (GO Revenue, National Insured) ¤ | | | 0.00 | | | | 12-1-2028 | | | | 1,000,000 | | | | 610,610 | |
The accompanying notes are an integral part of these financial statements.
| | | | | | |
| Portfolio of investments—June 30, 2016 | | Wells Fargo High Yield Municipal Bond Fund | | | 11 | |
| | | | | | | | | | | | | | | | |
| Security name | | Interest rate | | | Maturity date | | | Principal | | | Value | |
| | | | |
| Illinois (continued) | | | | | | | | | | | | | | | | |
Chicago IL Board of Education Refunding Bond Series A (GO Revenue) ± | | | 4.39 | % | | | 3-1-2032 | | | $ | 1,000,000 | | | $ | 980,410 | |
Chicago IL Board of Education Series A (GO Revenue, National Insured) | | | 5.00 | | | | 12-1-2021 | | | | 250,000 | | | | 253,470 | |
Chicago IL Midway Airport Refunding Bond Second Lien Series A (Airport Revenue) | | | 5.00 | | | | 1-1-2031 | | | | 1,000,000 | | | | 1,176,800 | |
Chicago IL O’Hare International Bond Series B (Airport Revenue) | | | 6.00 | | | | 1-1-2041 | | | | 150,000 | | | | 179,864 | |
Chicago IL Sales (Tax Revenue) | | | 5.00 | | | | 1-1-2032 | | | | 1,500,000 | | | | 1,657,275 | |
Chicago IL Sales Series A (Tax Revenue) | | | 5.00 | | | | 1-1-2041 | | | | 1,000,000 | | | | 1,063,680 | |
Chicago IL Series A (GO Revenue) | | | 5.00 | | | | 1-1-2033 | | | | 310,000 | | | | 311,181 | |
Chicago IL Series A (GO Revenue) | | | 5.25 | | | | 1-1-2023 | | | | 500,000 | | | | 509,760 | |
Chicago IL Series B (GO Revenue) | | | 5.50 | | | | 1-1-2032 | | | | 700,000 | | | | 718,634 | |
Chicago IL Transit Authority Sales Tax Receipts Revenue Bonds (Tax Revenue, AGM Insured) | | | 5.00 | | | | 12-1-2044 | | | | 1,000,000 | | | | 1,182,070 | |
Chicago IL Waste Water Transmission Second Lien Series B (Water & Sewer Revenue, National Insured) | | | 5.00 | | | | 1-1-2030 | | | | 600,000 | | | | 609,414 | |
Chicago IL Water Revenue Second Lien Series A (Water & Sewer Revenue, Ambac Insured) | | | 5.00 | | | | 11-1-2032 | | | | 500,000 | | | | 506,925 | |
Cook County IL School District #144 Prairie Hills CAB Refunding Bond Series C (GO Revenue, AGM Insured) ¤ | | | 0.00 | | | | 12-1-2025 | | | | 350,000 | | | | 297,091 | |
Cook County IL School District #144 Prairie Hills CAB Refunding Bond Series C (GO Revenue, AGM Insured) ¤ | | | 0.00 | | | | 12-1-2025 | | | | 730,000 | | | | 519,380 | |
Illinois (GO Revenue) | | | 5.00 | | | | 3-1-2033 | | | | 2,000,000 | | | | 2,150,840 | |
Illinois (Miscellaneous Revenue, Build America Mutual Assurance Company Insured) | | | 5.50 | | | | 7-1-2025 | | | | 525,000 | | | | 626,173 | |
Illinois (Miscellaneous Revenue) | | | 5.50 | | | | 7-1-2025 | | | | 250,000 | | | | 289,213 | |
Illinois Finance Authority Charter School Aid Intrinsic Schools Belmont School Project Series A (Education Revenue) 144A | | | 5.25 | | | | 12-1-2025 | | | | 800,000 | | | | 830,680 | |
Illinois Finance Authority Charter School Refunding Bond Series A (Education Revenue) | | | 6.88 | | | | 10-1-2031 | | | | 725,000 | | | | 804,692 | |
Illinois Finance Authority Educational Facility Senior Rogers Park Montessori School (Miscellaneous Revenue) | | | 6.00 | | | | 2-1-2034 | | | | 680,000 | | | | 740,806 | |
Illinois Series A (GO Revenue, AGM Insured) | | | 5.00 | | | | 4-1-2024 | | | | 500,000 | | | | 581,255 | |
Illinois Sports Facilities Authority State Tax Supported CAB (Tax Revenue, Ambac Insured) ¤ | | | 0.00 | | | | 6-15-2025 | | | | 1,000,000 | | | | 783,400 | |
Lake County IL Community Unit School District #187 North Chicago Series A (GO Revenue, AGM Insured) ¤ | | | 0.00 | | | | 1-1-2023 | | | | 590,000 | | | | 466,637 | |
Sangamon County IL School District #186 Certificate of Participation Hay-Edwards Elementary School Project Series A (Miscellaneous Revenue, ACA Insured) | | | 5.88 | | | | 8-15-2018 | | | | 85,000 | | | | 83,554 | |
Sangamon County IL School District #186 Certificate of Participation Hay-Edwards Elementary School Project Series A (Miscellaneous Revenue, ACA Insured) | | | 6.13 | | | | 8-15-2023 | | | | 250,000 | | | | 240,748 | |
Will County IL Communty High School District #210 Lincoln-Way Series A (GO Revenue) | | | 5.00 | | | | 1-1-2030 | | | | 1,000,000 | | | | 1,027,350 | |
| | | | |
| | | | | | | | | | | | | | | 20,684,637 | |
| | | | | | | | | | | | | | | | |
| | | | |
| Indiana: 1.88% | | | | | | | | | | | | | | | | |
Indiana Business Finance Authority Refunding Bond Marquette Project Series A (Health Revenue) | | | 5.00 | | | | 3-1-2030 | | | | 1,100,000 | | | | 1,264,989 | |
Indiana Finance Authority AMT-I-69 Development Partners LLC (Miscellaneous Revenue) | | | 5.25 | | | | 9-1-2034 | | | | 250,000 | | | | 284,840 | |
Indiana Finance Authority AMT-I-69 Development Partners LLC (Miscellaneous Revenue) | | | 5.25 | | | | 9-1-2040 | | | | 1,000,000 | | | | 1,116,590 | |
| | | | |
| | | | | | | | | | | | | | | 2,666,419 | |
| | | | | | | | | | | | | | | | |
| | | | |
| Iowa: 0.71% | | | | | | | | | | | | | | | | |
Coralville IA Certificate of Participation Series D (Miscellaneous Revenue) | | | 5.25 | | | | 6-1-2026 | | | | 1,000,000 | | | | 1,000,590 | |
| | | | | | | | | | | | | | | | |
The accompanying notes are an integral part of these financial statements.
| | | | |
| 12 | | Wells Fargo High Yield Municipal Bond Fund | | Portfolio of investments—June 30, 2016 |
| | | | | | | | | | | | | | | | |
| Security name | | Interest rate | | | Maturity date | | | Principal | | | Value | |
| | | | |
| Kansas: 1.85% | | | | | | | | | | | | | | | | |
Wyandotte County & Kansas City KS Special Obligation Vacation Village Project Area 4 - Major Multi-Sport Athletic Complex Project CAB Series 2015 (Tax Revenue) 144A¤ | | | 0.00 | % | | | 9-1-2034 | | | $ | 4,400,000 | | | $ | 1,598,828 | |
Wyandotte County & Kansas City KS Special Obligation Refunding and Improvement Bonds Plaza Redevelopment Project (Tax Revenue) | | | 4.00 | | | | 12-1-2028 | | | | 1,000,000 | | | | 1,023,550 | |
| | | | |
| | | | | | | | | | | | | | | 2,622,378 | |
| | | | | | | | | | | | | | | | |
|
| Kentucky: 2.16% | |
Kentucky EDFA Refunding Bond Rosedale Green Project (Health Revenue) | | | 5.50 | | | | 11-15-2035 | | | | 1,000,000 | | | | 1,072,580 | |
Kentucky EDFA Senior Revenue Bonds Next Generation Information Highway Project Series A (Miscellaneous Revenue) | | | 5.00 | | | | 7-1-2037 | | | | 700,000 | | | | 819,742 | |
Kentucky EDFA Senior Revenue Bonds Next Generation Information Highway Project Series A (Miscellaneous Revenue) | | | 5.00 | | | | 1-1-2045 | | | | 1,000,000 | | | | 1,164,140 | |
| | | | |
| | | | | | | | | | | | | | | 3,056,462 | |
| | | | | | | | | | | | | | | | |
|
| Maryland: 0.74% | |
Prince Georges County MD Charter School Chesapeake Lighthouse Obligated Group Series A (Education Revenue) 144A | | | 6.90 | | | | 8-1-2041 | | | | 1,000,000 | | | | 1,048,220 | |
| | | | | | | | | | | | | | | | |
|
| Michigan: 9.10% | |
Charyl Stockwell Academy Michigan Public School Refunding Bond (Miscellaneous Revenue) | | | 4.88 | | | | 10-1-2023 | | | | 500,000 | | | | 519,455 | |
Detroit MI Distribution of State Aid (GO Revenue) | | | 4.50 | | | | 11-1-2023 | | | | 275,000 | | | | 300,955 | |
Detroit MI Downtown Development Authority CAB (Tax Revenue) ¤ | | | 0.00 | | | | 7-1-2020 | | | | 285,000 | | | | 239,582 | |
Detroit MI Downtown Development Authority CAB (Tax Revenue) ¤ | | | 0.00 | | | | 7-1-2021 | | | | 170,000 | | | | 138,009 | |
Detroit MI Downtown Development Authority CAB (Tax Revenue) ¤ | | | 0.00 | | | | 7-1-2024 | | | | 20,000 | | | | 13,937 | |
Detroit MI Downtown Development Authority CAB (Tax Revenue) ¤ | | | 0.00 | | | | 7-1-2025 | | | | 580,000 | | | | 382,029 | |
Detroit MI Wayne County Stadium Authority (Miscellaneous Revenue) | | | 5.00 | | | | 10-1-2018 | | | | 1,000,000 | | | | 1,000,660 | |
Michigan Finance Authority Limited Obligation Public School Academy Cesar Chavez Academy Project (Education Revenue) | | | 5.00 | | | | 2-1-2022 | | | | 250,000 | | | | 252,640 | |
Michigan Finance Authority Refunding Bond Local Government Loan Program City of Detroit Financial Recovery Series F (Tax Revenue) | | | 4.50 | | | | 10-1-2029 | | | | 1,000,000 | | | | 1,120,460 | |
Michigan Finance Authority Refunding Bond Local Government Loan Program Detroit Water & Sewer Series D4 (Water & Sewer Revenue) | | | 5.00 | | | | 7-1-2031 | | | | 1,015,000 | | | | 1,202,866 | |
Michigan Finance Authority Refunding Bond Local Government Loan Program Detroit Water & Sewer Series D6 (Water & Sewer Revenue, National Insured) | | | 5.00 | | | | 7-1-2036 | | | | 1,000,000 | | | | 1,170,030 | |
Michigan Finance Authority Refunding Bonds Local Government Loan Program Public Lighting Authority Series B (Tax Revenue) | | | 5.00 | | | | 7-1-2044 | | | | 1,000,000 | | | | 1,148,250 | |
Michigan Finance Authority Refunding Bonds Local Government Loan Program Series C (Miscellaneous Revenue) | | | 5.00 | | | | 11-1-2020 | | | | 1,000,000 | | | | 1,113,900 | |
Michigan Municipal Bond Authority Local Government Loan Program CAB Series G (Miscellaneous Revenue, Ambac Insured) ¤ | | | 0.00 | | | | 5-1-2017 | | | | 300,000 | | | | 294,018 | |
Michigan Municipal Bond Authority Local Government Loan Program Series C (Miscellaneous Revenue, Ambac Insured) | | | 4.75 | | | | 5-1-2027 | | | | 950,000 | | | | 961,885 | |
Michigan Public Educational Facilities Authority Chandler Park Academy (Miscellaneous Revenue) | | | 6.35 | | | | 11-1-2028 | | | | 225,000 | | | | 225,473 | |
Michigan Public Educational Facilities Authority Limited Obligation Bradford Academy Project (Education Revenue) 144A | | | 6.50 | | | | 9-1-2037 | | | | 200,000 | | | | 160,004 | |
Michigan Public Educational Facilities Authority Limited Obligation Crescent Academy (Education Revenue) | | | 7.00 | | | | 10-1-2036 | | | | 322,500 | | | | 341,973 | |
The accompanying notes are an integral part of these financial statements.
| | | | | | |
| Portfolio of investments—June 30, 2016 | | Wells Fargo High Yield Municipal Bond Fund | | | 13 | |
| | | | | | | | | | | | | | | | |
| Security name | | Interest rate | | | Maturity date | | | Principal | | | Value | |
|
| Michigan (continued) | |
Michigan Strategic Fund Limited Obligation Events Center Project Series A (Tax Revenue) ± | | | 4.13 | % | | | 7-1-2045 | | | $ | 1,000,000 | | | $ | 1,026,830 | |
Oakland County MI Economic Development Corporation The Academy of The Sacred Heart Project Series A (Education Revenue) | | | 6.50 | | | | 12-15-2036 | | | | 250,000 | | | | 254,065 | |
Wayne County MI Building Improvement Series A (GO Revenue) | | | 6.75 | | | | 11-1-2039 | | | | 960,000 | | | | 1,024,762 | |
| | | | |
| | | | | | | | | | | | | | | 12,891,783 | |
| | | | | | | | | | | | | | | | |
|
| Minnesota: 1.38% | |
Deephaven MN Charter School Eagle Ridge Academy Project Series 2015-A (Education Revenue) | | | 5.25 | | | | 7-1-2037 | | | | 240,000 | | | | 260,604 | |
Deephaven MN Charter School Eagle Ridge Academy Project Series A (Education Revenue) | | | 4.40 | | | | 7-1-2025 | | | | 160,000 | | | | 170,808 | |
Deephaven MN Charter School Eagle Ridge Academy Project Series A (Education Revenue) | | | 4.75 | | | | 7-1-2028 | | | | 500,000 | | | | 536,720 | |
Deephaven MN Charter School Eagle Ridge Academy Project Series A (Education Revenue) | | | 5.00 | | | | 7-1-2030 | | | | 195,000 | | | | 211,926 | |
Minneapolis MN Student Housing Refunding Bond Riverton Community Housing Project (Housing Revenue) | | | 4.70 | | | | 8-1-2026 | | | | 335,000 | | | | 355,763 | |
Minneapolis MN Student Housing Refunding Bond Riverton Community Housing Project (Housing Revenue) | | | 4.80 | | | | 8-1-2027 | | | | 400,000 | | | | 424,976 | |
| | | | |
| | | | | | | | | | | | | | | 1,960,797 | |
| | | | | | | | | | | | | | | | |
|
| Mississippi: 1.41% | |
Perry County MS PCR Leaf River Forest Products Incorporated Project (Industrial Development Revenue, Georgia-Pacific LLC LOC) 144Aø | | | 0.60 | | | | 2-1-2022 | | | | 2,000,000 | | | | 2,000,000 | |
| | | | | | | | | | | | | | | | |
|
| Missouri: 0.68% | |
Blue Springs MO Special Obligation Tax Refunding and Improvement Adams Farm Project Series A (Tax Revenue) | | | 4.00 | | | | 6-1-2026 | | | | 915,000 | | | | 956,248 | |
| | | | | | | | | | | | | | | | |
|
| New Jersey: 3.92% | |
Essex County NJ Improvement Authority Lease Newark Project Series A (Miscellaneous Revenue) | | | 6.25 | | | | 11-1-2030 | | | | 200,000 | | | | 216,564 | |
New Jersey EDA Continental Airlines Incorporated Project (Industrial Development Revenue) | | | 5.25 | | | | 9-15-2029 | | | | 250,000 | | | | 280,705 | |
New Jersey EDA School Facilities Construction Project Series NN (Miscellaneous Revenue, National Insured) | | | 5.00 | | | | 3-1-2030 | | | | 1,000,000 | | | | 1,103,500 | |
New Jersey TTFA CAB Series A (Transportation Revenue) ¤ | | | 0.00 | | | | 12-15-2031 | | | | 1,000,000 | | | | 533,990 | |
New Jersey TTFA Series C (Transportation Revenue) | | | 5.25 | | | | 6-15-2032 | | | | 2,000,000 | | | | 2,292,120 | |
Newark NJ Qualified General Improvement Series A (GO Revenue) | | | 5.00 | | | | 7-15-2027 | | | | 1,000,000 | | | | 1,130,490 | |
| | | | |
| | | | | | | | | | | | | | | 5,557,369 | |
| | | | | | | | | | | | | | | | |
|
| New York: 10.51% | |
Green Island NY Power Authority Power System (Utilities Revenue) | | | 6.00 | | | | 12-15-2020 | | | | 890,000 | | | | 907,756 | |
Hempstead NY Local Development Corporation The Academy Charter School Project Series A (Education Revenue) | | | 7.65 | | | | 2-1-2044 | | | | 1,000,000 | | | | 1,146,230 | |
Monroe County NY Industrial Development Agency Continuing Development Services Project (Industrial Development Revenue, Citizens Bank LOC) ø | | | 0.65 | | | | 7-1-2027 | | | | 2,725,000 | | | | 2,725,000 | |
New York NY American Airlines John F. Kennedy International Airport IDA (Industrial Development Revenue, American Airlines Guaranty Agreement) | | | 7.63 | | | | 8-1-2025 | | | | 300,000 | | | | 304,116 | |
The accompanying notes are an integral part of these financial statements.
| | | | |
| 14 | | Wells Fargo High Yield Municipal Bond Fund | | Portfolio of investments—June 30, 2016 |
| | | | | | | | | | | | | | | | |
| Security name | | Interest rate | | | Maturity date | | | Principal | | | Value | |
|
| New York (continued) | |
New York NY Municipal Water Finance Authority Series AA3 (Water & Sewer Revenue, Dexia Credit Local SPA) ø | | | 0.60 | % | | | 6-15-2032 | | | $ | 3,000,000 | | | $ | 3,000,000 | |
New York NY Transitional Finance Authority Sub Series 2E (Tax Revenue, Dexia Credit Local SPA) ø | | | 0.64 | | | | 11-1-2022 | | | | 3,000,000 | | | | 3,000,000 | |
New York Urban Development Corporation Certificate of Participation James A Farley Post Office Project (Miscellaneous Revenue) 144A | | | 4.20 | | | | 2-1-2017 | | | | 1,000,000 | | | | 1,000,400 | |
Oyster Bay NY BAN Series C (GO Revenue) | | | 4.00 | | | | 6-1-2018 | | | | 2,000,000 | | | | 2,026,720 | |
Oyster Bay NY Public Improvement Bonds (GO Revenue) | | | 3.00 | | | | 8-15-2020 | | | | 500,000 | | | | 492,595 | |
Westchester County NY Local Development Corporation Pace University Series A (Education Revenue) | | | 5.00 | | | | 5-1-2034 | | | | 250,000 | | | | 286,725 | |
| | | | |
| | | | | | | | | | | | | | | 14,889,542 | |
| | | | | | | | | | | | | | | | |
|
| Ohio: 1.94% | |
Maple Heights OH City School District Certificate of Participation (Miscellaneous Revenue) | | | 6.00 | | | | 11-1-2028 | | | | 500,000 | | | | 540,555 | |
Ohio Air Quality Development Authority AMT Refunding Bond Pollution Control 1st Energy Series C (Industrial Development Revenue) ± | | | 3.95 | | | | 11-1-2032 | | | | 1,000,000 | | | | 1,023,570 | |
Ohio Private Activity Bond AMT Portsmouth Bypass Project (Industrial Development Revenue, AGM Insured) | | | 5.00 | | | | 12-31-2039 | | | | 1,000,000 | | | | 1,177,440 | |
| | | | |
| | | | | | | | | | | | | | | 2,741,565 | |
| | | | | | | | | | | | | | | | |
| | | | |
| Oklahoma: 0.53% | | | | | | | | | | | | | | | | |
Cherokee Nation of Oklahoma Health Care System Series 2006 (Health Revenue, ACA Insured) 144A | | | 4.60 | | | | 12-1-2021 | | | | 740,000 | | | | 748,939 | |
| | | | | | | | | | | | | | | | |
| | | | |
| Oregon: 0.77% | | | | | | | | | | | | | | | | |
Multnomah County OR Hospital Facilities Authority Refunding Bond Mirabella South Waterfront Project Series A (Health Revenue) | | | 5.00 | | | | 10-1-2019 | | | | 455,000 | | | | 494,021 | |
Polk County OR Hospital Facility Authority Revenue Bond Dallas Retirement Village Project Series 2015-A (Health Revenue) | | | 5.00 | | | | 7-1-2025 | | | | 550,000 | | | | 598,609 | |
| | | | |
| | | | | | | | | | | | | | | 1,092,630 | |
| | | | | | | | | | | | | | | | |
| | | | |
| Pennsylvania: 4.49% | | | | | | | | | | | | | | | | |
Allegheny County PA IDA Propel Charter School Sunrise Project (Education Revenue) | | | 5.25 | | | | 7-15-2023 | | | | 155,000 | | | | 166,884 | |
Chester County PA Health and Education Facilities Immaculata University Project (Education Revenue) | | | 5.50 | | | | 10-15-2025 | | | | 1,000,000 | | | | 1,021,470 | |
East Hempfield Township PA IDA Student Services Incorporated Student Housing Project of Millersville University (Education Revenue) | | | 5.00 | | | | 7-1-2029 | | | | 500,000 | | | | 570,295 | |
Montgomery County PA Higher Education & Health Authority Arcadia University (Education Revenue) | | | 5.00 | | | | 4-1-2026 | | | | 1,655,000 | | | | 2,019,100 | |
Philadelphia PA IDA Tacony Academy Charter School Project (Education Revenue) | | | 6.88 | | | | 6-15-2033 | | | | 375,000 | | | | 431,741 | |
Philadelphia PA State Public School Building Authority School District Project (Miscellaneous Revenue) | | | 5.00 | | | | 4-1-2031 | | | | 1,000,000 | | | | 1,082,910 | |
Scranton PA Redevelopment Authority Guaranteed Series A (Miscellaneous Revenue, Municipal Government Guaranty Insured) | | | 5.00 | | | | 11-15-2021 | | | | 1,000,000 | | | | 1,070,350 | |
| | | | |
| | | | | | | | | | | | | | | 6,362,750 | |
| | | | | | | | | | | | | | | | |
| | | | |
| Puerto Rico: 2.51% | | | | | | | | | | | | | | | | |
Puerto Rico Electric Power Authority Refunding Bond Series LL (Utilities Revenue, National Insured) | | | 5.50 | | | | 7-1-2017 | | | | 700,000 | | | | 724,899 | |
The accompanying notes are an integral part of these financial statements.
| | | | | | |
| Portfolio of investments—June 30, 2016 | | Wells Fargo High Yield Municipal Bond Fund | | | 15 | |
| | | | | | | | | | | | | | | | |
| Security name | | Interest rate | | | Maturity date | | | Principal | | | Value | |
| | | | |
| Puerto Rico (continued) | | | | | | | | | | | | | | | | |
Puerto Rico Electric Power Authority Refunding Bond Series MM (Utilities Revenue, National Insured) | | | 5.00 | % | | | 7-1-2016 | | | $ | 50,000 | | | $ | 50,005 | |
Puerto Rico Highway & Transportation Authority Series A (Tax Revenue, Ambac Insured) ¤ | | | 0.00 | | | | 7-1-2017 | | | | 1,000,000 | | | | 964,000 | |
Puerto Rico Industrial Tourist Educational Medical & Environmental Control Facilities Financing Authority Hospital Auxilio Mutuo Obligated Group Series A (Health Revenue) ## | | | 5.00 | | | | 7-1-2018 | | | | 1,275,000 | | | | 1,325,975 | |
Puerto Rico Public Finance Corporation Commonwealth Appropriation Bond Series B (Tax Revenue, Government Development Bank for Puerto Rico SPA) (s) | | | 6.00 | | | | 8-1-2024 | | | | 1,175,000 | | | | 135,125 | |
Puerto Rico Public Improvement Refunding Bond Series A (Tax Revenue, National Insured) | | | 5.50 | | | | 7-1-2016 | | | | 210,000 | | | | 210,021 | |
Puerto Rico Series PA-650 (Tax Revenue, National Insured) | | | 6.00 | | | | 7-1-2016 | | | | 150,000 | | | | 150,017 | |
| | | | |
| | | | | | | | | | | | | | | 3,560,042 | |
| | | | | | | | | | | | | | | | |
| | | | |
| Rhode Island: 1.06% | | | | | | | | | | | | | | | | |
Rhode Island Commerce Corporation Series D (Airport Revenue) %% | | | 5.00 | | | | 7-1-2037 | | | | 500,000 | | | | 598,255 | |
Rhode Island Commerce Corporation Series D (Airport Revenue) %% | | | 5.00 | | | | 7-1-2041 | | | | 750,000 | | | | 900,293 | |
| | | | |
| | | | | | | | | | | | | | | 1,498,548 | |
| | | | | | | | | | | | | | | | |
| | | | |
| South Carolina: 0.83% | | | | | | | | | | | | | | | | |
Connector 2000 Association Incorporated CAB Series A (Transportation Revenue) ¤ | | | 0.00 | | | | 1-1-2017 | | | | 152,230 | | | | 137,767 | |
Jasper County SC School Project (Miscellaneous Revenue) | | | 4.00 | | | | 4-1-2020 | | | | 30,000 | | | | 31,618 | |
Lee County SC School Facilities Incorporated Series 2006 (Miscellaneous Revenue, AGC Insured) | | | 6.00 | | | | 12-1-2031 | | | | 215,000 | | | | 230,770 | |
South Carolina Jobs EDA York Preparatory Academy Project Series A (Education Revenue) | | | 5.75 | | | | 11-1-2023 | | | | 185,000 | | | | 198,942 | |
South Carolina Jobs EDA York Preparatory Academy Project Series A (Education Revenue) | | | 7.25 | | | | 11-1-2045 | | | | 500,000 | | | | 569,300 | |
| | | | |
| | | | | | | | | | | | | | | 1,168,397 | |
| | | | | | | | | | | | | | | | |
| | | | |
| Tennessee: 1.77% | | | | | | | | | | | | | | | | |
Shelby County TN Health Educational & Housing Facilities Board Methodist Le Bonheur Series B (Health Revenue, AGM Insured, U.S. Bank NA SPA) ø | | | 0.42 | | | | 6-1-2042 | | | | 2,500,000 | | | | 2,500,000 | |
| | | | | | | | | | | | | | | | |
| | | | |
| Texas: 7.97% | | | | | | | | | | | | | | | | |
Arlington TX Higher Education Finance Corporation Universal Academy Series A (Education Revenue) | | | 7.00 | | | | 3-1-2034 | | | | 320,000 | | | | 341,773 | |
Hackberry TX Special Assessment Revenue Public Improvement District #3 Phase #13 (Miscellaneous Revenue) | | | 6.00 | | | | 9-1-2026 | | | | 225,000 | | | | 236,070 | |
Lewisville TX Combination Contract Castle Hills Public Improvement Bonds Project #5 (Miscellaneous Revenue) 144A | | | 6.50 | | | | 9-1-2034 | | | | 1,000,000 | | | | 1,054,290 | |
New Hope TX Cultural Education Facilities Finance Corporation Cardinal Bay Incorporated Village On The Park Carriage Inn Series B (Health Revenue) | | | 5.00 | | | | 7-1-2046 | | | | 2,500,000 | | | | 2,848,150 | |
New Hope TX Cultural Education Facilities Finance Corporation Collegiate Housing San Antonio I LLC A&M Universiity Series A (Housing Revenue) | | | 5.00 | | | | 4-1-2036 | | | | 1,000,000 | | | | 1,154,260 | |
Port Arthur TX Navigation District Jefferson County Environmental Facilities Motiva Enterprises LLC Project Series A (Resource Recovery Revenue) ø | | | 0.54 | | | | 4-1-2040 | | | | 2,500,000 | | | | 2,500,000 | |
Port Arthur TX Navigation District Jefferson County Environmental Facilities Motiva Enterprises LLC Project Series C (Resource Recovery Revenue) ø | | | 0.54 | | | | 4-1-2040 | | | | 1,500,000 | | | | 1,500,000 | |
The accompanying notes are an integral part of these financial statements.
| | | | |
| 16 | | Wells Fargo High Yield Municipal Bond Fund | | Portfolio of investments—June 30, 2016 |
| | | | | | | | | | | | | | | | |
| Security name | | Interest rate | | | Maturity date | | | Principal | | | Value | |
| | | | |
| Texas (continued) | | | | | | | | | | | | | | | | |
Tarrant County TX Cultural Education Facilities Finance Corporation Series B (Health Revenue) | | | 5.00 | % | | | 11-15-2030 | | | $ | 1,000,000 | | | $ | 1,157,930 | |
Texas Gas Supply SA Energy Acquisition Public Facilities Corporation (Utilities Revenue) | | | 5.50 | | | | 8-1-2027 | | | | 190,000 | | | | 245,102 | |
Texas Private Activity Bond Surface Transportation Corporation Project NTE Mobility Partners Segments LLC (Transportation Revenue) | | | 7.00 | | | | 12-31-2038 | | | | 200,000 | | | | 254,658 | |
| | | | |
| | | | | | | | | | | | | | | 11,292,233 | |
| | | | | | | | | | | | | | | | |
| | | | |
| Utah: 0.73% | | | | | | | | | | | | | | | | |
Utah Finance Authority Charter School Revenue Spectrum Academy Project (Education Revenue) 144A | | | 5.00 | | | | 4-15-2030 | | | | 1,000,000 | | | | 1,031,250 | |
| | | | | | | | | | | | | | | | |
| | | | |
| Virginia: 2.77% | | | | | | | | | | | | | | | | |
Albemarle County VA Industrial Development Revenue Jefferson Scholars Foundation Project (Miscellaneous Revenue, SunTrust Bank LOC) ø | | | 0.48 | | | | 10-1-2037 | | | | 2,300,000 | | | | 2,300,000 | |
Stafford County & Staunton VA IDA Community Services Boards League/Central Series B (Miscellaneous Revenue) | | | 6.50 | | | | 8-1-2028 | | | | 1,555,000 | | | | 1,623,364 | |
| | | | |
| | | | | | | | | | | | | | | 3,923,364 | |
| | | | | | | | | | | | | | | | |
| | | | |
| Washington: 0.92% | | | | | | | | | | | | | | | | |
Skagit County WA Public Hospital District #1 Skagit Valley Hospital Project (Health Revenue) | | | 5.25 | | | | 12-1-2025 | | | | 250,000 | | | | 279,990 | |
Washington Housing Finance Commission Nonprofit Housing Revenue Bonds Heron’s Key Senior Living Series B3 (Health Revenue) 144A | | | 4.38 | | | | 1-1-2021 | | | | 1,000,000 | | | | 1,015,410 | |
| | | | |
| | | | | | | | | | | | | | | 1,295,400 | |
| | | | | | | | | | | | | | | | |
| | | | |
| West Virginia: 0.20% | | | | | | | | | | | | | | | | |
West Virginia Hospital Finance Authority (Health Revenue) | | | 6.25 | | | | 10-1-2023 | | | | 270,000 | | | | 287,504 | |
| | | | | | | | | | | | | | | | |
| | | | |
| Wisconsin: 2.19% | | | | | | | | | | | | | | | | |
Wisconsin Center District Refunding Bond Junior Dedicated Series A (Tax Revenue) | | | 5.00 | | | | 12-15-2028 | | | | 1,000,000 | | | | 1,164,610 | |
Wisconsin PFA Charter School Voyager Funding Incorporated Project Series A (Education Revenue) | | | 4.13 | | | | 10-1-2024 | | | | 325,000 | | | | 340,304 | |
Wisconsin PFA Coral Academy Science Las Vegas Series A (Education Revenue) | | | 5.00 | | | | 7-1-2024 | | | | 500,000 | | | | 555,640 | |
Wisconsin PFA Research Triangle High School Project Series 2015-A (Education Revenue) 144A | | | 5.63 | | | | 7-1-2045 | | | | 1,000,000 | | | | 1,042,650 | |
| | | | |
| | | | | | | | | | | | | | | 3,103,204 | |
| | | | | | | | | | | | | | | | |
| | | | |
| Wyoming: 0.37% | | | | | | | | | | | | | | | | |
Sweetwater County WY Solid Waste Disposal Refunding Bond FMC Corporation Project (Industrial Development Revenue) | | | 5.60 | | | | 12-1-2035 | | | | 525,000 | | | | 527,048 | |
| | | | | | | | | | | | | | | | |
| | | | |
Total Municipal Obligations (Cost $134,531,794) | | | | | | | | | | | | | | | 141,336,920 | |
| | | | | | | | | | | | | | | | |
| | | | |
| | | Yield | | | | | | Shares | | | | |
| Short-Term Investments: 0.23% | | | | | | | | | | | | | | | | |
| | | | |
| Investment Companies: 0.16% | | | | | | | | | | | | | | | | |
Wells Fargo Municipal Cash Management Fund Institutional
Class ##(l)(u) | | | 0.30 | | | | | | | | 226,858 | | | | 226,858 | |
| | | | | | | | | | | | | | | | |
The accompanying notes are an integral part of these financial statements.
| | | | | | |
| Portfolio of investments—June 30, 2016 | | Wells Fargo High Yield Municipal Bond Fund | | | 17 | |
| | | | | | | | | | | | | | | | |
| Security name | | Interest rate | | | Maturity date | | | Principal | | | Value | |
| U.S. Treasury Securities: 0.07% | | | | | | | | | | | | | | | | |
Treasury Bill (z)# | | | 0.22 | % | | | 9-15-2016 | | | $ | 100,000 | | | $ | 99,954 | |
| | | | | | | | | | | | | | | | |
| | | | |
Total Short-Term Investments (Cost $326,802) | | | | | | | | | | | | | | | 326,812 | |
| | | | | | | | | | | | | | | | |
| | | | | | | | |
| Total investments in securities (Cost $134,858,596) * | | | 100.02 | % | | | 141,663,732 | |
Other assets and liabilities, net | | | (0.02 | ) | | | (27,257 | ) |
| | | | | | | | |
| Total net assets | | | 100.00 | % | | $ | 141,636,475 | |
| | | | | | | | |
| ¤ | The security is issued in zero coupon form with no periodic interest payments. |
| 144A | The security may be resold in transactions exempt from registration, normally to qualified institutional buyers, pursuant to Rule 144A under the Securities Act of 1933. |
| ø | Variable rate demand notes are subject to a demand feature which reduces the effective maturity. The maturity date shown represents the final maturity date of the security. The interest rate is determined and reset by the issuer daily, weekly, or monthly depending upon the terms of the security. The rate shown is the rate in effect at period end. |
| ± | Variable rate investment. The rate shown is the rate in effect at period end. |
| (s) | The security is currently in default with regards to scheduled interest and/or principal payments. The Fund has stopped accruing interest on the security. |
| ## | All or a portion of this security is segregated for when-issued securities. |
| %% | The security is issued on a when-issued basis. |
| (l) | The issuer of the security is an affiliated person of the Fund as defined in the Investment Company Act of 1940. |
| (u) | The rate represents the 7-day annualized yield at period end. |
| (z) | Zero coupon security. The rate represents the current yield to maturity. |
| # | All or a portion of this security is segregated as collateral for investments in derivative instruments. |
| * | Cost for federal income tax purposes is $134,858,596 and unrealized gains (losses) consists of: |
| | | | |
Gross unrealized gains | | $ | 6,881,227 | |
Gross unrealized losses | | | (76,091 | ) |
| | | | |
Net unrealized gains | | $ | 6,805,136 | |
The accompanying notes are an integral part of these financial statements.
| | | | |
| 18 | | Wells Fargo High Yield Municipal Bond Fund | | Statement of assets and liabilities—June 30, 2016 |
| | | | |
| | | | |
| |
Assets | | | | |
Investments | | | | |
In unaffiliated securities, at value (cost $134,631,738) | | $ | 141,436,874 | |
In affiliated securities, at value (cost $226,858) | | | 226,858 | |
| | | | |
Total investments, at value (cost $134,858,596) | | | 141,663,732 | |
Receivable for investments sold | | | 310,000 | |
Receivable for Fund shares sold | | | 286,003 | |
Receivable for interest | | | 1,370,638 | |
Receivable for daily variation margin on open futures contracts | | | 6,563 | |
Prepaid expenses and other assets | | | 39,165 | |
| | | | |
Total assets | | | 143,676,101 | |
| | | | |
| |
Liabilities | | | | |
Dividends payable | | | 61,067 | |
Payable for investments purchased | | | 1,485,280 | |
Payable for Fund shares redeemed | | | 412,208 | |
Management fee payable | | | 36,927 | |
Distribution fee payable | | | 6,135 | |
Administration fees payable | | | 12,595 | |
Accrued expenses and other liabilities | | | 25,414 | |
| | | | |
Total liabilities | | | 2,039,626 | |
| | | | |
Total net assets | | $ | 141,636,475 | |
| | | | |
| |
NET ASSETS CONSIST OF | | | | |
Paid-in capital | | $ | 133,975,589 | |
Overdistributed net investment income | | | (5,389 | ) |
Accumulated net realized gains on investments | | | 962,488 | |
Net unrealized gains on investments | | | 6,703,787 | |
| | | | |
Total net assets | | $ | 141,636,475 | |
| | | | |
| |
COMPUTATION OF NET ASSET VALUE AND OFFERING PRICE PER SHARE | | | | |
Net assets – Class A | | $ | 38,018,118 | |
Shares outstanding – Class A1 | | | 3,483,386 | |
Net asset value per share – Class A | | | $10.91 | |
Maximum offering price per share – Class A2 | | | $11.42 | |
Net assets – Class C | | $ | 10,572,515 | |
Shares outstanding – Class C1 | | | 968,632 | |
Net asset value per share – Class C | | | $10.91 | |
Net assets – Administrator Class | | $ | 25,178,901 | |
Shares outstanding – Administrator Class1 | | | 2,306,441 | |
Net asset value per share – Administrator Class | | | $10.92 | |
Net assets – Institutional Class | | $ | 67,866,941 | |
Shares outstanding – Institutional Class1 | | | 6,219,367 | |
Net asset value per share – Institutional Class | | | $10.91 | |
| 1 | The Fund has an unlimited number of authorized shares. |
| 2 | Maximum offering price is computed as 100/95.50 of net asset value. On investments of $50,000 or more, the offering price is reduced. |
The accompanying notes are an integral part of these financial statements.
| | | | | | |
| Statement of operations—June 30, 2016 | | Wells Fargo High Yield Municipal Bond Fund | | | 19 | |
| | | | |
| | | | |
| |
Investment income | | | | |
Interest | | $ | 4,898,604 | |
Dividends | | | 63,304 | |
Income from affiliated securities | | | 2,836 | |
| | | | |
Total investment income | | | 4,964,744 | |
| | | | |
| |
Expenses | | | | |
Management fee | | | 596,970 | |
Administration fees | | | | |
Class A | | | 43,549 | |
Class C | | | 9,885 | |
Administrator Class | | | 19,430 | |
Institutional Class | | | 53,254 | |
Shareholder servicing fees | | | | |
Class A | | | 68,045 | |
Class C | | | 15,446 | |
Administrator Class | | | 47,385 | |
Distribution fee | | | | |
Class C | | | 46,337 | |
Custody and accounting fees | | | 12,716 | |
Professional fees | | | 45,580 | |
Registration fees | | | 94,210 | |
Shareholder report expenses | | | 7,825 | |
Trustees’ fees and expenses | | | 20,174 | |
Other fees and expenses | | | 9,971 | |
| | | | |
Total expenses | | | 1,090,777 | |
Less: Fee waivers and/or expense reimbursements | | | (215,439 | ) |
| | | | |
Net expenses | | | 875,338 | |
| | | | |
Net investment income | | | 4,089,406 | |
| | | | |
| |
REALIZED AND UNREALIZED GAINS (LOSSES) ON INVESTMENTS | | | | |
| |
Net realized gains (losses) on: | | | | |
Unaffiliated securities | | | 967,864 | |
Futures transactions | | | (5,355 | ) |
| | | | |
Net realized gains on investments | | | 962,509 | |
| | | | |
| |
Net change in unrealized gains (losses) on: | | | | |
Unaffiliated securities | | | 6,205,509 | |
Futures transactions | | | (101,349 | ) |
| | | | |
Net change in unrealized gains (losses) on investments | | | 6,104,160 | |
| | | | |
Net realized and unrealized gains (losses) on investments | | | 7,066,669 | |
| | | | |
Net increase in net assets resulting from operations | | $ | 11,156,075 | |
| | | | |
The accompanying notes are an integral part of these financial statements.
| | | | |
| 20 | | Wells Fargo High Yield Municipal Bond Fund | | Statement of changes in net assets |
| | | | | | | | | | | | | | | | |
| | | Year ended
June 30, 2016 | | | Year ended
June 30, 2015 | |
| | | | |
Operations | | | | | | | | | | | | | | | | |
Net investment income | | | | | | $ | 4,089,406 | | | | | | | $ | 2,965,276 | |
Net realized gains on investments | | | | | | | 962,509 | | | | | | | | 833,386 | |
Net change in unrealized gains (losses) on investments | | | | | | | 6,104,160 | | | | | | | | (372,294 | ) |
| | | | |
Net increase in net assets resulting from operations | | | | | | | 11,156,075 | | | | | | | | 3,426,368 | |
| | | | |
| | | | |
Distributions to shareholders from | | | | | | | | | | | | | | | | |
Net investment income | | | | | | | | | | | | | | | | |
Class A | | | | | | | (894,513 | ) | | | | | | | (567,578 | ) |
Class C | | | | | | | (154,285 | ) | | | | | | | (103,763 | ) |
Administrator Class | | | | | | | (659,408 | ) | | | | | | | (468,922 | ) |
Institutional Class | | | | | | | (2,387,200 | ) | | | | | | | (1,825,014 | ) |
Net realized gains | | | | | | | | | | | | | | | | |
Class A | | | | | | | (78,573 | ) | | | | | | | (132,615 | ) |
Class C | | | | | | | (16,949 | ) | | | | | | | (34,119 | ) |
Administrator Class | | | | | | | (60,643 | ) | | | | | | | (126,197 | ) |
Institutional Class | | | | | | | (205,261 | ) | | | | | | | (425,024 | ) |
| | | | |
Total distributions to shareholders | | | | | | | (4,456,832 | ) | | | | | | | (3,683,232 | ) |
| | | | |
| | | | |
Capital share transactions | | | Shares | | | | | | | | Shares | | | | | |
Proceeds from shares sold | | | | | | | | | | | | | | | | |
Class A | | | 2,125,225 | | | | 22,523,949 | | | | 2,202,847 | | | | 22,891,217 | |
Class C | | | 634,079 | | | | 6,747,929 | | | | 316,623 | | | | 3,299,033 | |
Administrator Class | | | 1,668,935 | | | | 17,660,288 | | | | 2,186,625 | | | | 22,789,956 | |
Institutional Class | | | 1,691,722 | | | | 17,947,276 | | | | 6,997,943 | | | | 73,016,661 | |
| | | | |
| | | | | | | 64,879,442 | | | | | | | | 121,996,867 | |
| | | | |
Reinvestment of distributions | | | | | | | | | | | | | | | | |
Class A | | | 88,701 | | | | 939,044 | | | | 63,922 | | | | 668,808 | |
Class C | | | 14,306 | | | | 151,701 | | | | 11,333 | | | | 118,567 | |
Administrator Class | | | 56,332 | | | | 597,072 | | | | 45,410 | | | | 475,587 | |
Institutional Class | | | 166,900 | | | | 1,762,332 | | | | 153,261 | | | | 1,603,296 | |
| | | | |
| | | | | | | 3,450,149 | | | | | | | | 2,866,258 | |
| | | | |
Payment for shares redeemed | | | | | | | | | | | | | | | | |
Class A | | | (771,697 | ) | | | (8,162,455 | ) | | | (617,789 | ) | | | (6,419,871 | ) |
Class C | | | (117,144 | ) | | | (1,224,951 | ) | | | (117,137 | ) | | | (1,215,465 | ) |
Administrator Class | | | (750,383 | ) | | | (7,978,247 | ) | | | (1,220,440 | ) | | | (12,812,718 | ) |
Institutional Class | | | (3,003,097 | ) | | | (31,534,674 | ) | | | (2,820,561 | ) | | | (29,381,761 | ) |
| | | | |
| | | | | | | (48,900,327 | ) | | | | | | | (49,829,815 | ) |
| | | | |
Net increase in net assets resulting from capital share transactions | | | | | | | 19,429,264 | | | | | | | | 75,033,310 | |
| | | | |
Total increase in net assets | | | | | | | 26,128,507 | | | | | | | | 74,776,446 | |
| | | | |
| | | | |
Net assets | | | | | | | | | | | | | | | | |
Beginning of period | | | | | | | 115,507,968 | | | | | | | | 40,731,522 | |
| | | | |
End of period | | | | | | $ | 141,636,475 | | | | | | | $ | 115,507,968 | |
| | | | |
Undistributed (overdistributed) net investment income | | | | | | $ | (5,389 | ) | | | | | | $ | 611 | |
| | | | |
The accompanying notes are an integral part of these financial statements.
| | | | | | |
| Financial highlights | | Wells Fargo High Yield Municipal Bond Fund | | | 21 | |
(For a share outstanding throughout each period)
| | | | | | | | | | | | | | | | |
| | | Year ended June 30 | |
| CLASS A | | 2016 | | | 2015 | | | 2014 | | | 20131 | |
Net asset value, beginning of period | | | $10.34 | | | | $10.25 | | | | $9.52 | | | | $10.00 | |
Net investment income | | | 0.35 | | | | 0.34 | | | | 0.40 | | | | 0.13 | |
Net realized and unrealized gains (losses) on investments | | | 0.60 | | | | 0.18 | | | | 0.75 | | | | (0.49 | ) |
| | | | | | | | | | | | | | | | |
Total from investment operations | | | 0.95 | | | | 0.52 | | | | 1.15 | | | | (0.36 | ) |
Distributions to shareholders from | | | | | | | | | | | | | | | | |
Net investment income | | | (0.35 | ) | | | (0.34 | ) | | | (0.40 | ) | | | (0.12 | ) |
Net realized gains | | | (0.03 | ) | | | (0.09 | ) | | | (0.02 | ) | | | 0.00 | |
| | | | | | | | | | | | | | | | |
Total distributions to shareholders | | | (0.38 | ) | | | (0.43 | ) | | | (0.42 | ) | | | (0.12 | ) |
Net asset value, end of period | | | $10.91 | | | | $10.34 | | | | $10.25 | | | | $9.52 | |
Total return2 | | | 9.44 | % | | | 5.06 | % | | | 12.41 | % | | | (3.61 | )% |
Ratios to average net assets (annualized) | | | | | | | | | | | | | | | | |
Gross expenses | | | 1.07 | % | | | 1.07 | % | | | 1.90 | % | | | 3.45 | % |
Net expenses | | | 0.85 | % | | | 0.85 | % | | | 0.85 | % | | | 0.85 | % |
Net investment income | | | 3.28 | % | | | 3.26 | % | | | 3.98 | % | | | 3.21 | % |
Supplemental data | | | | | | | | | | | | | | | | |
Portfolio turnover rate | | | 61 | % | | | 62 | % | | | 65 | % | | | 69 | % |
Net assets, end of period (000s omitted) | | | $38,018 | | | | $21,100 | | | | $4,022 | | | | $998 | |
| 1 | For the period from January 31, 2013 (commencement of operations) to June 30, 2013 |
| 2 | Total return calculations do not include any sales charges. Returns for periods of less than one year are not annualized. |
The accompanying notes are an integral part of these financial statements.
| | | | |
| 22 | | Wells Fargo High Yield Municipal Bond Fund | | Financial highlights |
(For a share outstanding throughout each period)
| | | | | | | | | | | | | | | | |
| | | Year ended June 30 | |
| CLASS C | | 2016 | | | 2015 | | | 2014 | | | 20131 | |
Net asset value, beginning of period | | | $10.34 | | | | $10.25 | | | | $9.52 | | | | $10.00 | |
Net investment income | | | 0.27 | | | | 0.26 | | | | 0.33 | | | | 0.09 | |
Net realized and unrealized gains (losses) on investments | | | 0.60 | | | | 0.18 | | | | 0.75 | | | | (0.48 | ) |
| | | | | | | | | | | | | | | | |
Total from investment operations | | | 0.87 | | | | 0.44 | | | | 1.08 | | | | (0.39 | ) |
Distributions to shareholders from | | | | | | | | | | | | | | | | |
Net investment income | | | (0.27 | ) | | | (0.26 | ) | | | (0.33 | ) | | | (0.09 | ) |
Net realized gains | | | (0.03 | ) | | | (0.09 | ) | | | (0.02 | ) | | | 0.00 | |
| | | | | | | | | | | | | | | | |
Total distributions to shareholders | | | (0.30 | ) | | | (0.35 | ) | | | (0.35 | ) | | | (0.09 | ) |
Net asset value, end of period | | | $10.91 | | | | $10.34 | | | | $10.25 | | | | $9.52 | |
Total return2 | | | 8.62 | % | | | 4.28 | % | | | 11.58 | % | | | (3.89 | )% |
Ratios to average net assets (annualized) | | | | | | | | | | | | | | | | |
Gross expenses | | | 1.82 | % | | | 1.82 | % | | | 2.58 | % | | | 4.05 | % |
Net expenses | | | 1.60 | % | | | 1.60 | % | | | 1.60 | % | | | 1.60 | % |
Net investment income | | | 2.49 | % | | | 2.50 | % | | | 3.15 | % | | | 2.25 | % |
Supplemental data | | | | | | | | | | | | | | | | |
Portfolio turnover rate | | | 61 | % | | | 62 | % | | | 65 | % | | | 69 | % |
Net assets, end of period (000s omitted) | | | $10,573 | | | | $4,522 | | | | $2,323 | | | | $481 | |
| 1 | For the period from January 31, 2013 (commencement of operations) to June 30, 2013 |
| 2 | Total return calculations do not include any sales charges. Returns for periods of less than one year are not annualized. |
The accompanying notes are an integral part of these financial statements.
| | | | | | |
| Financial highlights | | Wells Fargo High Yield Municipal Bond Fund | | | 23 | |
(For a share outstanding throughout each period)
| | | | | | | | | | | | | | | | |
| | | Year ended June 30 | |
| ADMINISTRATOR CLASS | | 2016 | | | 2015 | | | 2014 | | | 20131 | |
Net asset value, beginning of period | | | $10.34 | | | | $10.26 | | | | $9.52 | | | | $10.00 | |
Net investment income | | | 0.36 | | | | 0.35 | | | | 0.41 | | | | 0.13 | |
Net realized and unrealized gains (losses) on investments | | | 0.61 | | | | 0.17 | | | | 0.76 | | | | (0.48 | ) |
| | | | | | | | | | | | | | | | |
Total from investment operations | | | 0.97 | | | | 0.52 | | | | 1.17 | | | | (0.35 | ) |
Distributions to shareholders from | | | | | | | | | | | | | | | | |
Net investment income | | | (0.36 | ) | | | (0.35 | ) | | | (0.41 | ) | | | (0.13 | ) |
Net realized gains | | | (0.03 | ) | | | (0.09 | ) | | | (0.02 | ) | | | 0.00 | |
| | | | | | | | | | | | | | | | |
Total distributions to shareholders | | | (0.39 | ) | | | (0.44 | ) | | | (0.43 | ) | | | (0.13 | ) |
Net asset value, end of period | | | $10.92 | | | | $10.34 | | | | $10.26 | | | | $9.52 | |
Total return2 | | | 9.65 | % | | | 5.07 | % | | | 12.63 | % | | | (3.57 | )% |
Ratios to average net assets (annualized) | | | | | | | | | | | | | | | | |
Gross expenses | | | 1.00 | % | | | 1.00 | % | | | 1.80 | % | | | 3.24 | % |
Net expenses | | | 0.75 | % | | | 0.75 | % | | | 0.75 | % | | | 0.75 | % |
Net investment income | | | 3.39 | % | | | 3.35 | % | | | 4.14 | % | | | 3.10 | % |
Supplemental data | | | | | | | | | | | | | | | | |
Portfolio turnover rate | | | 61 | % | | | 62 | % | | | 65 | % | | | 69 | % |
Net assets, end of period (000s omitted) | | | $25,179 | | | | $13,768 | | | | $3,282 | | | | $482 | |
| 1 | For the period from January 31, 2013 (commencement of operations) to June 30, 2013 |
| 2 | Returns for periods of less than one year are not annualized. |
The accompanying notes are an integral part of these financial statements.
| | | | |
| 24 | | Wells Fargo High Yield Municipal Bond Fund | | Financial highlights |
(For a share outstanding throughout each period)
| | | | | | | | | | | | | | | | |
| | | Year ended June 30 | |
| INSTITUTIONAL CLASS | | 2016 | | | 2015 | | | 2014 | | | 20131 | |
Net asset value, beginning of period | | | $10.34 | | | | $10.25 | | | | $9.52 | | | | $10.00 | |
Net investment income | | | 0.38 | | | | 0.37 | | | | 0.42 | | | | 0.13 | |
Net realized and unrealized gains (losses) on investments | | | 0.60 | | | | 0.18 | | | | 0.75 | | | | (0.48 | ) |
| | | | | | | | | | | | | | | | |
Total from investment operations | | | 0.98 | | | | 0.55 | | | | 1.17 | | | | (0.35 | ) |
Distributions to shareholders from | | | | | | | | | | | | | | | | |
Net investment income | | | (0.38 | ) | | | (0.37 | ) | | | (0.42 | ) | | | (0.13 | ) |
Net realized gains | | | (0.03 | ) | | | (0.09 | ) | | | (0.02 | ) | | | 0.00 | |
| | | | | | | | | | | | | | | | |
Total distributions to shareholders | | | (0.41 | ) | | | (0.46 | ) | | | (0.44 | ) | | | (0.13 | ) |
Net asset value, end of period | | | $10.91 | | | | $10.34 | | | | $10.25 | | | | $9.52 | |
Total return2 | | | 9.71 | % | | | 5.33 | % | | | 12.70 | % | | | (3.52 | )% |
Ratios to average net assets (annualized) | | | | | | | | | | | | | | | | |
Gross expenses | | | 0.74 | % | | | 0.74 | % | | | 1.53 | % | | | 2.97 | % |
Net expenses | | | 0.60 | % | | | 0.60 | % | | | 0.60 | % | | | 0.60 | % |
Net investment income | | | 3.58 | % | | | 3.51 | % | | | 4.26 | % | | | 3.25 | % |
Supplemental data | | | | | | | | | | | | | | | | |
Portfolio turnover rate | | | 61 | % | | | 62 | % | | | 65 | % | | | 69 | % |
Net assets, end of period (000s omitted) | | | $67,867 | | | | $76,118 | | | | $31,105 | | | | $8,204 | |
| 1 | For the period from January 31, 2013 (commencement of operations) to June 30, 2013 |
| 2 | Returns for periods of less than one year are not annualized. |
The accompanying notes are an integral part of these financial statements.
| | | | | | |
| Notes to financial statements | | Wells Fargo High Yield Municipal Bond Fund | | | 25 | |
1. ORGANIZATION
Wells Fargo Funds Trust (the “Trust”), a Delaware statutory trust organized on March 10, 1999, is an open-end management investment company registered under the Investment Company Act of 1940, as amended (the “1940 Act”). As an investment company, the Trust follows the accounting and reporting guidance in Financial Accounting Standards Board (“FASB”) Accounting Standards Codification Topic 946, Financial Services – Investment Companies. These financial statements report on the Wells Fargo High Yield Municipal Bond Fund (the “Fund”) which is a diversified series of the Trust.
2. SIGNIFICANT ACCOUNTING POLICIES
The following significant accounting policies, which are consistently followed in the preparation of the financial statements of the Fund, are in conformity with U.S. generally accepted accounting principles which require management to make estimates and assumptions that affect the reported amounts of assets and liabilities, disclosure of contingent assets and liabilities at the date of the financial statements, and the reported amounts of revenues and expenses during the reporting period. Actual results could differ from those estimates.
Securities valuation
All investments are valued each business day as of the close of regular trading on the New York Stock Exchange (generally 4 p.m. Eastern Time), although a Fund may deviate from this calculation time under unusual or unexpected circumstances.
Debt securities are valued at the evaluated bid price provided by an independent pricing service or, if a reliable price is not available, the quoted bid price from an independent broker-dealer.
Equity securities and futures that are listed on a foreign or domestic exchange or market are valued at the official closing price or, if none, the last sales price. If no sale occurs on the primary exchange or market that day, the prior day’s price will be deemed “stale” and a fair value price will be determined in accordance with the Fund’s Valuation Procedures.
Investments in registered open-end investment companies are valued at net asset value. Interests in non-registered investment vehicles that are redeemable at net asset value are fair valued at net asset value when available.
Investments which are not valued using any of the methods discussed above are valued at their fair value, as determined in good faith by the Board of Trustees of the Fund. The Board of Trustees has established a Valuation Committee comprised of the Trustees and has delegated to it the authority to take any actions regarding the valuation of portfolio securities that the Valuation Committee deems necessary or appropriate, including determining the fair value of portfolio securities, unless the determination has been delegated to the Management Valuation Team of Wells Fargo Funds Management, LLC (��Funds Management”). The Board of Trustees retains the authority to make or ratify any valuation decisions or approve any changes to the Valuation Procedures as it deems appropriate. On a quarterly basis, the Board of Trustees receives reports on any valuation actions taken by the Valuation Committee or the Management Valuation Team which may include items for ratification.
Valuations of fair valued securities are compared to the next actual sales price when available, or other appropriate market values, to assess the continued appropriateness of the fair valuation methodologies used. These securities are fair valued on a day-to-day basis, taking into consideration changes to appropriate market information and any significant changes to the inputs considered in the valuation process until there is a readily available price provided on an exchange or by an independent pricing service. Valuations received from an independent pricing service or independent broker-dealer quotes are periodically validated by comparisons to most recent trades and valuations provided by other independent pricing services in addition to the review of prices by the manager and/or subadviser. Unobservable inputs used in determining fair valuations are identified based on the type of security, taking into consideration factors utilized by market participants in valuing the investment, knowledge about the issuer and the current market environment.
Security loans
The Fund may lend its securities from time to time in order to earn additional income in the form of fees or interest on securities received as collateral or the investment of any cash received as collateral. The Fund continues to receive interest or dividends on the securities loaned. The Fund receives collateral in the form of cash or securities with a value at least equal to the value of the securities on loan. The value of the loaned securities is determined at the close of each business day and any additional required collateral is delivered to the Fund on the next business day. In a securities lending transaction, the net asset value of the Fund will be affected by an increase or decrease in the value of the securities loaned and by an increase or decrease in the value of the instrument in which collateral is invested. The amount of securities lending activity undertaken by the Fund fluctuates from time to time. In the event of default or bankruptcy by the borrower, the Fund may be prevented from recovering the loaned securities or gaining access to the collateral or
| | | | |
| 26 | | Wells Fargo High Yield Municipal Bond Fund | | Notes to financial statements |
may experience delays or costs in doing so. In addition, the investment of any cash collateral received may lose all or part of its value. The Fund has the right under the lending agreement to recover the securities from the borrower on demand.
The Fund lends its securities through an unaffiliated securities lending agent. Cash collateral received in connection with its securities lending transactions is invested in Securities Lending Cash Investments, LLC (the “Securities Lending Fund”). The Securities Lending Fund is exempt from registration under Section 3(c)(7) of the 1940 Act and is managed by Funds Management and is subadvised by Wells Capital Management Incorporated (“WellsCap”), an affiliate of Funds Management and an indirect wholly owned subsidiary of Wells Fargo & Company (“Wells Fargo”). Funds Management receives an advisory fee starting at 0.05% and declining to 0.01% as the average daily net assets of the Securities Lending Fund increase. All of the fees received by Funds Management are paid to WellsCap for its services as subadviser. The Securities Lending Fund seeks to provide a positive return compared to the daily Fed Funds Open rate by investing in high-quality, U.S. dollar-denominated short-term money market instruments. Securities Lending Fund investments are fair valued based upon the amortized cost valuation technique. Income earned from investment in the Securities Lending Fund is included in securities lending income on the Statement of Operations.
When-issued transactions
The Fund may purchase securities on a forward commitment or when-issued basis. The Fund records a when-issued transaction on the trade date and will segregate assets in an amount at least equal in value to the Fund’s commitment to purchase when-issued securities. Securities purchased on a when-issued basis are marked-to-market daily and the Fund begins earning interest on the settlement date. Losses may arise due to changes in the market value of the underlying securities or if the counterparty does not perform under the contract.
Futures contracts
The Fund is subject to interest rate risk in the normal course of pursuing its investment objectives. The Fund may buy and sell futures contracts in order to gain exposure to, or protect against, changes in security values and interest rates. The primary risks associated with the use of futures contracts are the imperfect correlation between changes in market values of securities held by the Fund and the prices of futures contracts, and the possibility of an illiquid market.
The aggregate principal amounts of the contracts are not recorded in the financial statements. Fluctuations in the value of the contracts are recorded in the Statement of Assets and Liabilities as an asset or liability and in the Statement of Operations as unrealized gains or losses until the contracts are closed, at which point they are recorded as net realized gains or losses on futures contracts. With futures contracts, there is minimal counterparty risk to the Fund since futures are exchange traded and the exchange’s clearinghouse, as counterparty to all exchange traded futures, guarantees the futures against default.
Security transactions and income recognition
Securities transactions are recorded on a trade date basis. Realized gains or losses are recorded on the basis of identified cost.
Interest income is accrued daily and bond discounts are accreted and premiums are amortized daily based on the effective interest method. To the extent debt obligations are placed on non-accrual status, any related interest income may be reduced by writing off interest receivables when the collection of all or a portion of interest has become doubtful based on consistently applied procedures. If the issuer subsequently resumes interest payments or when the collectability of interest is reasonably assured, the debt obligation is removed from non-accrual status.
Dividend income is recognized on the ex-dividend date.
Distributions to shareholders
Distributions to shareholders from net investment income are accrued daily and paid monthly. Distributions from net realized gains, if any, are recorded on the ex-dividend date. Such distributions are determined in conformity with federal income tax regulations, which may differ in amount or character from net investment income and realized gains recognized for purposes of U.S. generally accepted accounting principles.
Federal and other taxes
The Fund intends to continue to qualify as a regulated investment company by distributing substantially all of its investment company taxable and tax-exempt income and any net realized capital gains (after reduction for capital loss carryforwards) sufficient to relieve it from all, or substantially all, federal income taxes. Accordingly, no provision for federal income taxes was required.
The Fund’s income and federal excise tax returns and all financial records supporting those returns for the prior three fiscal years are subject to examination by the federal and Delaware revenue authorities. Management has analyzed the
| | | | | | |
| Notes to financial statements | | Wells Fargo High Yield Municipal Bond Fund | | | 27 | |
Fund’s tax positions taken on federal, state, and foreign tax returns for all open tax years and does not believe that there are any uncertain tax positions that require recognition of a tax liability.
Class allocations
The separate classes of shares offered by the Fund differ principally in applicable sales charges, distribution, shareholder servicing, and administration fees. Class specific expenses are charged directly to that share class. Investment income, common expenses, and realized and unrealized gains (losses) on investments are allocated daily to each class of shares based on the relative proportion of net assets of each class.
3. FAIR VALUATION MEASUREMENTS
Fair value measurements of investments are determined within a framework that has established a fair value hierarchy based upon the various data inputs utilized in determining the value of the Fund’s investments. The three-level hierarchy gives the highest priority to unadjusted quoted prices in active markets for identical assets or liabilities (Level 1) and the lowest priority to significant unobservable inputs (Level 3). The Fund’s investments are classified within the fair value hierarchy based on the lowest level of input that is significant to the fair value measurement. The inputs are summarized into three broad levels as follows:
| n | | Level 1 – quoted prices in active markets for identical securities |
| n | | Level 2 – other significant observable inputs (including quoted prices for similar securities, interest rates, prepayment speeds, credit risk, use of amortized cost, etc.) |
| n | | Level 3 – significant unobservable inputs (including the Fund’s own assumptions in determining the fair value of investments) |
The inputs or methodologies used for valuing investments in securities are not necessarily an indication of the risk associated with investing in those securities.
The following is a summary of the inputs used in valuing the Fund’s assets and liabilities as of June 30, 2016:
| | | | | | | | | | | | | | | | |
| | | Quoted prices
(Level 1) | | | Other significant
observable inputs
(Level 2) | | | Significant
unobservable inputs
(Level 3) | | | Total | |
Assets | | | | | | | | | | | | | | | | |
Investments in : | | | | | | | | | | | | | | | | |
| | | | |
Municipal obligations | | $ | 0 | | | $ | 141,336,920 | | | $ | 0 | | | $ | 141,336,920 | |
| | | | |
Short-term investments | | | | | | | | | | | | | | | | |
Investment companies | | | 226,858 | | | | 0 | | | | 0 | | | | 226,858 | |
U.S. Treasury securities | | | 99,954 | | | | 0 | | | | 0 | | | | 99,954 | |
| | | 326,812 | | | | 141,336,920 | | | | 0 | | | | 141,663,732 | |
Futures contracts | | | 6,563 | | | | 0 | | | | 0 | | | | 6,563 | |
Total assets | | $ | 333,375 | | | $ | 141,336,920 | | | $ | 0 | | | $ | 141,670,295 | |
Futures contracts are reported at their variation margin at measurement date, which represents the amount due to the Fund at that date. All other assets and liabilities are reported at their market value at measurement date.
The Fund recognizes transfers between levels within the fair value hierarchy at the end of the reporting period. At June 30, 2016, the Fund did not have any transfers into/out of Level 1 or Level 2, or Level 3.
4. TRANSACTIONS WITH AFFILIATES
Management fee
Funds Management, an indirect wholly owned subsidiary of Wells Fargo, is the manager of the Fund and provides advisory and fund-level administrative services under an investment management agreement. Under the investment management agreement, Funds Management is responsible for, among other services, implementing the investment objectives and strategies of the Fund, supervising the subadviser, providing fund-level administrative services in connection with the Fund’s operations, and providing any other fund-level administrative services reasonably necessary for the operation of the Fund. As compensation for its services under the investment management agreement, Funds
| | | | |
| 28 | | Wells Fargo High Yield Municipal Bond Fund | | Notes to financial statements |
Management is entitled to receive an annual management fee starting at 0.50% and declining to 0.38% as the average daily net assets of the Fund increase. For the year ended June 30, 2016, the management fee was equivalent to an annual rate of 0.50% of the Fund’s average daily net assets.
Funds Management has retained the services of a subadviser to provide daily portfolio management to the Fund. The fee for subadvisory services is borne by Funds Management. WellsCap is the subadviser to the Fund and is entitled to receive a fee from Funds Management at an annual rate starting at 0.35% and declining to 0.20% as the average daily net assets of the Fund increase.
Administration fees
Under a class-level administration agreement, Funds Management provides class-level administrative services to the Fund, which includes paying fees and expenses for services provided by the transfer agent, sub-transfer agents, omnibus account servicers and record-keepers. As compensation for its services under the class-level administration agreement, Funds Management receives an annual fee which is calculated based on the average daily net assets of each class as follows:
| | | | |
| | | Class-level
administration fee | |
Class A, Class C | | | 0.16 | % |
Administrator Class | | | 0.10 | |
Institutional Class | | | 0.08 | |
Funds Management has contractually waived and/or reimbursed management and administration fees to the extent necessary to maintain certain net operating expense ratios for the Fund. Waiver of fees and/or reimbursement of expenses by Funds Management were made first from fund level expenses on a proportionate basis and then from class specific expenses. Funds Management has committed through October 31, 2016 to waive fees and/or reimburse expenses to the extent necessary to cap the Fund’s expenses at 0.85% for Class A shares, 1.60% for Class C shares, 0.75% for Administrator Class shares, and 0.60% for Institutional Class shares. After this time, the cap may be increased or the commitment to maintain the cap may be terminated only with the approval of the Board of Trustees.
Distribution fee
The Trust has adopted a distribution plan for Class C shares of the Fund pursuant to Rule 12b-1 under the 1940 Act. A distribution fee is charged to Class C shares and paid to Wells Fargo Funds Distributor, LLC (“Funds Distributor”), the principal underwriter, at an annual rate of 0.75% of the average daily net assets of Class C shares.
In addition, Funds Distributor is entitled to receive the front-end sales charge from the purchase of Class A shares and a contingent deferred sales charge on the redemption of certain Class A shares. Funds Distributor is also entitled to receive the contingent deferred sales charges from redemptions of Class C shares. For the year ended June 30, 2016, Funds Distributor received $5,591 from the sale of Class A shares.
Shareholder servicing fees
The Trust has entered into contracts with one or more shareholder servicing agents, whereby Class A, Class C, and Administrator Class of the Fund are charged a fee at an annual rate of 0.25% of the average daily net assets of each respective class.
A portion of these total shareholder servicing fees were paid to affiliates of Wells Fargo.
5. INVESTMENT PORTFOLIO TRANSACTIONS
Purchases and sales of investments, excluding U.S. government obligations (if any) and short-term securities, for the year ended June 30, 2016 were $72,132,384 and $65,711,558, respectively.
The Fund may purchase or sell investment securities to other Wells Fargo funds under procedures adopted by the Board of Trustees. The procedures have been designed to ensure that these interfund transactions, which generally do not incur broker commissions, are effected at current market prices. Interfund trades are included within the respective purchases and sales amounts shown.
6. DERIVATIVE TRANSACTIONS
During the year ended June 30, 2016, the Fund entered into futures contracts to take advantage of the differences between municipal and treasury yields and to help manage the duration of the portfolio.
| | | | | | |
| Notes to financial statements | | Wells Fargo High Yield Municipal Bond Fund | | | 29 | |
At June 30, 2016, the Fund had short futures contracts outstanding as follows:
| | | | | | | | | | | | | | | | |
| Expiration date | | Counterparty | | Contracts | | Type | | | Contract
value at
June 30, 2016 | | | Unrealized
losses | |
9-21-2016 | | JPMorgan | | 10 Short | | | U.S. Treasury Bonds | | | $ | 1,723,438 | | | $ | (101,349 | ) |
The Fund had an average notional amount of $471,414 in futures contracts during the year ended June 30, 2016.
On June 30, 2016, the cumulative unrealized losses on futures contracts in the amount of $101,349 are reflected in net unrealized gains on investments on the Statement of Assets and Liabilities. The receivable for daily variation margin on open futures contracts reflected in the Statement of Assets and Liabilities only represents the current day’s variation margin. The realized losses and change in unrealized gains (losses) on futures contracts are reflected in the Statement of Operations.
For certain types of derivative transactions, the Fund has entered into International Swaps and Derivatives Association, Inc. master agreements (“ISDA Master Agreements”) or similar agreements with approved counterparties. The ISDA Master Agreements or similar agreements may have requirements to deliver/deposit securities or cash to/with an exchange or broker-dealer as collateral and allows the Fund to offset, with each counterparty, certain derivative financial instrument’s assets and/or liabilities with collateral held or pledged. Collateral requirements differ by type of derivative. Collateral or margin requirements are set by the broker or exchange clearing house for exchange traded derivatives while collateral terms are contract specific for over-the-counter traded derivatives. Cash collateral that has been pledged to cover obligations of the Fund under ISDA Master Agreements or similar agreements, if any, are reported separately in the Statement of Assets and Liabilities. Securities pledged as collateral, if any, are noted in the Portfolio of Investments. With respect to balance sheet offsetting, absent an event of default by the counterparty or a termination of the agreement, the reported amounts of financial assets and financial liabilities in the Statement of Assets and Liabilities are not offset across transactions between the Fund and the applicable counterparty. A reconciliation of the gross amounts on the Statement of Assets and Liabilities to the net amounts by derivative type, including any collateral exposure, is as follows:
| | | | | | | | | | | | | | | | |
| Derivative type | | Counterparty | | Gross amounts
of assets in the
Statement of
Assets and
Liabilities | | Amounts
subject to
netting
agreements | | | Collateral
received | | | Net amount
of assets | |
Futures – variation margin | | JPMorgan | | $6,563 | | $ | 0 | | | $ | 0 | | | $ | 6,563 | |
7. BANK BORROWINGS
The Trust (excluding the money market funds and certain other funds) and Wells Fargo Variable Trust are parties to a $200,000,000 revolving credit agreement whereby the Fund is permitted to use bank borrowings for temporary or emergency purposes, such as to fund shareholder redemption requests. Interest under the credit agreement is charged to the Fund based on a borrowing rate equal to the higher of the Federal Funds rate in effect on that day plus 1.25% or the overnight LIBOR rate in effect on that day plus 1.25%. In addition, an annual commitment fee equal to 0.20% of the unused balance is allocated to each participating fund. Prior to September 1, 2015, the revolving credit agreement amount was $150,000,000 and the annual commitment fee was equal to 0.10% of the unused balance which was allocated to each participating fund.
For the year ended June 30, 2016, there were no borrowings by the Fund under the agreement.
8. DISTRIBUTIONS TO SHAREHOLDERS
The tax character of distributions paid during the years ended June 30, 2016 and June 30, 2015 were as follows:
| | | | | | | | |
| | | Year ended June 30 | |
| | | 2016 | | | 2015 | |
Ordinary income | | $ | 361,426 | | | $ | 699,045 | |
Tax-exempt income | | | 4,095,406 | | | | 2,965,277 | |
Long-term capital gain | | | 0 | | | | 18,910 | |
| | | | |
| 30 | | Wells Fargo High Yield Municipal Bond Fund | | Notes to financial statements |
As of June 30, 2016, the components of distributable earnings on a tax basis were as follows:
| | | | | | |
Undistributed ordinary income | | Undistributed tax-exempt income | | Undistributed long-term gain | | Unrealized gains |
| $324,047 | | $55,678 | | $537,092 | | $6,805,136 |
9. INDEMNIFICATION
Under the Trust’s organizational documents, the officers and Trustees have been granted certain indemnification rights against certain liabilities that may arise out of performance of their duties to the Trust. Additionally, in the normal course of business, the Trust may enter into contracts with service providers that contain a variety of indemnification clauses. The Trust’s maximum exposure under these arrangements is dependent on future claims that may be made against the Fund and, therefore, cannot be estimated.
| | | | | | |
| Report of independent registered public accounting firm | | Wells Fargo High Yield Municipal Bond Fund | | | 31 | |
BOARD OF TRUSTEES AND SHAREHOLDERS OF WELLS FARGO FUNDS TRUST:
We have audited the accompanying statement of assets and liabilities, including the portfolio of investments, of the Wells Fargo High Yield Municipal Bond Fund (formerly known as Wells Fargo Advantage High Yield Municipal Bond Fund) (the “Fund”), one of the funds constituting the Wells Fargo Funds Trust, as of June 30, 2016, and the related statement of operations for the year then ended, the statements of changes in net assets for each of the years in the two-year period then ended, and the financial highlights for each of the years in the three-year period then ended and the period from January 31, 2013 (commencement of operations) to June 30, 2013. These financial statements and financial highlights are the responsibility of the Fund’s management. Our responsibility is to express an opinion on these financial statements and financial highlights based on our audits.
We conducted our audits in accordance with the standards of the Public Company Accounting Oversight Board (United States). Those standards require that we plan and perform the audit to obtain reasonable assurance about whether the financial statements and financial highlights are free of material misstatement. An audit includes examining, on a test basis, evidence supporting the amounts and disclosures in the financial statements. Our procedures included confirmation of securities owned as of June 30, 2016, by correspondence with custodians and brokers, or by other appropriate auditing procedures. An audit also includes assessing the accounting principles used and significant estimates made by management, as well as evaluating the overall financial statement presentation. We believe that our audits provide a reasonable basis for our opinion.
In our opinion, the financial statements and financial highlights referred to above present fairly, in all material respects, the financial position of the Wells Fargo High Yield Municipal Bond Fund as of June 30, 2016, and the results of its operations for the year then ended, the changes in its net assets for each of the years in the two-year period then ended, and the financial highlights for each of the years in the three-year period then ended and the period from January 31, 2013 (commencement of operations) to June 30, 2013, in conformity with U.S. generally accepted accounting principles.

Boston, Massachusetts
August 25, 2016
| | | | |
| 32 | | Wells Fargo High Yield Municipal Bond Fund | | Other information (unaudited) |
TAX INFORMATION
Pursuant to Section 852 of the Internal Revenue Code, 100% of distributions paid from net investment income is designated as exempt-interest dividends for the fiscal year ended June 30, 2016.
For the fiscal year ended June 30, 2016, $361,426 has been designated as short-term capital gain dividends for nonresident alien shareholders pursuant to Section 871 of the Internal Revenue Code.
PROXY VOTING INFORMATION
A description of the policies and procedures that the Fund uses to determine how to vote proxies relating to portfolio securities is available, upon request, by calling 1-800-222-8222, visiting our website at wellsfargofunds.com, or visiting the SEC website at sec.gov. Information regarding how the Fund voted proxies relating to portfolio securities during the most recent 12-month period ended June 30 is available on the Fund’s website at wellsfargofunds.com or by visiting the SEC website at sec.gov.
PORTFOLIO HOLDINGS INFORMATION
The complete portfolio holdings for the Fund are publicly available monthly on the Fund’s website (wellsfargofunds.com), on a one-month delayed basis. In addition, top ten holdings information (excluding derivative positions) for the Fund is publicly available on the Fund’s website on a monthly, seven-day or more delayed basis. The Fund files its complete schedule of portfolio holdings with the SEC for the first and third quarters of each fiscal year on Form N-Q, which is available by visiting the SEC website at sec.gov. In addition, the Fund’s Form N-Q may be reviewed and copied at the SEC’s Public Reference Room in Washington, DC, and at regional offices in New York City, at 233 Broadway, and in Chicago, at 175 West Jackson Boulevard, Suite 900. Information about the Public Reference Room may be obtained by calling 1-800-SEC-0330.
| | | | | | |
| Other information (unaudited) | | Wells Fargo High Yield Municipal Bond Fund | | | 33 | |
BOARD OF TRUSTEES AND OFFICERS
Each of the Trustees and Officers1 listed in the table below acts in identical capacities for each fund in the Wells Fargo family of funds, which consists of 142 mutual funds comprising the Wells Fargo Funds Trust, Wells Fargo Variable Trust, Wells Fargo Master Trust and four closed-end funds (collectively the “Fund Complex”). This table should be read in conjunction with the Prospectus and the Statement of Additional Information2. The mailing address of each Trustee and Officer is 525 Market Street, 12th Floor, San Francisco, CA 94105. Each Trustee and Officer serves an indefinite term, however, each Trustee serves such term until reaching the mandatory retirement age established by the Trustees.
Independent Trustees
| | | | | | |
Name and year of birth | | Position held and length of service* | | Principal occupations during past five years or longer | | Current other public
company or investment
company directorships |
William R. Ebsworth
(Born 1957) | | Trustee, since 2015 | | Retired. From 1984 to 2013, equities analyst, portfolio manager, research director and chief financial officer at Fidelity Management and Research Company in Boston, Tokyo, and Hong Kong and retired in 2013 as Chief Investment Officer of Fidelity Strategic Advisers, Inc. where he lead a team of investment professionals managing client assets. Prior thereto, Board member of Hong Kong Securities Clearing Co., Hong Kong Options Clearing Corp., the Thailand International Fund, Ltd., Fidelity Investments Life Insurance Company, and Empire Fidelity Investments Life Insurance Company. Mr. Ebsworth is a CFA® charterholder and an Adjunct Lecturer, Finance, at Babson College. | | Asset Allocation Trust |
Jane A. Freeman
(Born 1953) | | Trustee, since 2015 | | Retired. From 2012 to 2014 and 1999 to 2008, Chief Financial Officer of Scientific Learning Corporation. From 2008 to 2012, Ms. Freeman provided consulting services related to strategic business projects. Prior to 1999, Portfolio Manager at Rockefeller & Co. and Scudder, Stevens & Clark. Board member of the Harding Loevner Funds from 1996 to 2014, serving as both Lead Independent Director and chair of the Audit Committee. Board member of the Russell Exchange Traded Funds Trust from 2011 to 2012 and the chair of the Audit Committee. Ms. Freeman is Chair of Taproot Foundation (non-profit organization), a Board Member of Ruth Bancroft Garden (non-profit organization) and an inactive chartered financial analyst. | | Asset Allocation Trust |
Peter G. Gordon
(Born 1942) | | Trustee, since 1998; Chairman, since 2005 | | Co-Founder, Retired Chairman, President and CEO of Crystal Geyser Water Company. Trustee Emeritus, Colby College. | | Asset Allocation Trust |
Isaiah Harris, Jr.
(Born 1952) | | Trustee, since 2009 | | Retired. Chairman of the Board of CIGNA Corporation since 2009, and Director since 2005. From 2003 to 2011, Director of Deluxe Corporation. Prior thereto, President and CEO of BellSouth Advertising and Publishing Corp. from 2005 to 2007, President and CEO of BellSouth Enterprises from 2004 to 2005 and President of BellSouth Consumer Services from 2000 to 2003. Emeritus member of the Iowa State University Foundation Board of Governors. Emeritus Member of the Advisory Board of Iowa State University School of Business. Advisory Board Member, Palm Harbor Academy (charter school). Advisory Board Member, Child Evangelism Fellowship (non-profit). Mr. Harris is a certified public accountant (inactive status). | | CIGNA Corporation; Asset Allocation Trust |
Judith M. Johnson
(Born 1949) | | Trustee, since 2008; Audit Committee Chairman, since 2008 | | Retired. Prior thereto, Chief Executive Officer and Chief Investment Officer of Minneapolis Employees Retirement Fund from 1996 to 2008. Ms. Johnson is an attorney, certified public accountant and a certified managerial accountant. | | Asset Allocation Trust |
David F. Larcker
(Born 1950) | | Trustee, since 2009 | | James Irvin Miller Professor of Accounting at the Graduate School of Business, Stanford University, Director of the Corporate Governance Research Initiative and Senior Faculty of The Rock Center for Corporate Governance since 2006. From 2005 to 2008, Professor of Accounting at the Graduate School of Business, Stanford University. Prior thereto, Ernst & Young Professor of Accounting at The Wharton School, University of Pennsylvania from 1985 to 2005. | | Asset Allocation Trust |
| | | | |
| 34 | | Wells Fargo High Yield Municipal Bond Fund | | Other information (unaudited) |
| | | | | | |
Name and year of birth | | Position held and length of service* | | Principal occupations during past five years or longer | | Current other public
company or investment
company directorships |
Olivia S. Mitchell
(Born 1953) | | Trustee, since 2006 | | International Foundation of Employee Benefit Plans Professor, Wharton School of the University of Pennsylvania since 1993. Director of Wharton’s Pension Research Council and Boettner Center on Pensions & Retirement Research, and Research Associate at the National Bureau of Economic Research. Previously, Cornell University Professor from 1978 to 1993. | | Asset Allocation Trust |
Timothy J. Penny
(Born 1951) | | Trustee, since 1996 | | President and Chief Executive Officer of Southern Minnesota Initiative Foundation, a non-profit organization, since 2007 and Senior Fellow at the Humphrey Institute Policy Forum at the University of Minnesota since 1995. Member of the Board of Trustees of NorthStar Education Finance, Inc., a non-profit organization, since 2007. | | Asset Allocation Trust |
Michael S. Scofield
(Born 1943) | | Trustee, since 2010 | | Served on the Investment Company Institute’s Board of Governors and Executive Committee from 2008-2011 as well the Governing Council of the Independent Directors Council from 2006-2011 and the Independent Directors Council Executive Committee from 2008-2011. Chairman of the IDC from 2008-2010. Institutional Investor (Fund Directions) Trustee of Year in 2007. Trustee of the Evergreen Funds complex (and its predecessors) from 1984 to 2010. Chairman of the Evergreen Funds from 2000-2010. Former Trustee of the Mentor Funds. Retired Attorney, Law Offices of Michael S. Scofield. | | Asset Allocation Trust |
| * | Length of service dates reflect the Trustee’s commencement of service with the Trust’s predecessor entities, where applicable. |
Officers
| | | | | | |
Name and year of birth | | Position held and
length of service | | Principal occupations during past five years or longer | | |
Karla M. Rabusch
(Born 1959) | | President, since 2003 | | Executive Vice President of Wells Fargo Bank, N.A. and President of Wells Fargo Funds Management, LLC since 2003. | | |
Nancy Wiser1
(Born 1967) | | Treasurer, since 2012 | | Executive Vice President of Wells Fargo Funds Management, LLC since 2011. Chief Operating Officer and Chief Compliance Officer at LightBox Capital Management LLC, from 2008 to 2011. | | |
C. David Messman
(Born 1960) | | Secretary, since 2000; Chief Legal Officer, since 2003 | | Senior Vice President and Secretary of Wells Fargo Funds Management, LLC since 2001. Assistant General Counsel of Wells Fargo Bank, N.A. since 2013 and Vice President and Managing Counsel of Wells Fargo Bank, N.A. from 1996 to 2013. | | |
Michael Whitaker
(Born 1967) | | Chief Compliance Officer, since 2016* | | Executive Vice President of Wells Fargo Funds Management, LLC since 2016. Chief Compliance Officer of Fidelity’s Fixed Income Funds and Asset Allocation Funds from 2008 to 2016, Compliance Officer of FMR Co., Inc. from 2014 to 2016, Fidelity Investments Money Management, Inc. from 2014 to 2016, Fidelity Investments from 2007 to 2016. | | |
David Berardi
(Born 1975) | | Assistant Treasurer, since 2009 | | Vice President of Wells Fargo Funds Management, LLC since 2009. Vice President of Evergreen Investment Management Company, LLC from 2008 to 2010. Manager of Fund Reporting and Control for Evergreen Investment Management Company, LLC from 2004 to 2010. | | |
Jeremy DePalma1
(Born 1974) | | Assistant Treasurer, since 2009 | | Senior Vice President of Wells Fargo Funds Management, LLC since 2009. Senior Vice President of Evergreen Investment Management Company, LLC from 2008 to 2010 and head of the Fund Reporting and Control Team within Fund Administration from 2005 to 2010. | | |
| 1 | Nancy Wiser acts as Treasurer of 73 funds in the Fund Complex. Jeremy DePalma acts as Treasurer of 69 funds and Assistant Treasurer of 73 funds in the Fund Complex. |
| 2 | The Statement of Additional Information includes additional information about the Trustees and is available, without charge, upon request, by calling 1-800-222-8222 or by visiting the website at wellsfargofunds.com. |
| * | Michael Whitaker became Chief Compliance Officer effective May 16, 2016. |
| | | | | | |
| Other information (unaudited) | | Wells Fargo High Yield Municipal Bond Fund | | | 35 | |
BOARD CONSIDERATION OF INVESTMENT MANAGEMENT AND SUB-ADVISORY AGREEMENTS:
Under the Investment Company Act of 1940 (the “1940 Act”), the Board of Trustees (the “Board”) of Wells Fargo Funds Trust (the “Trust”) must determine annually whether to approve the continuation of the Trust’s investment management and sub-advisory agreements. In this regard, at an in-person meeting held on May 24-25, 2016 (the “Meeting”), the Board, all the members of which have no direct or indirect interest in the investment management and sub-advisory agreements and are not “interested persons” of the Trust, as defined in the 1940 Act (the “Independent Trustees”), reviewed and approved for Wells Fargo High Yield Municipal Bond Fund (the “Fund”): (i) an investment management agreement (the “Management Agreement”) with Wells Fargo Funds Management, LLC (“Funds Management”); and (ii) an investment sub-advisory agreement (the “Sub-Advisory Agreement”) with Wells Capital Management Incorporated (the “Sub-Adviser”), an affiliate of Funds Management. The Management Agreement and the Sub-Advisory Agreement are collectively referred to as the “Advisory Agreements.”
At the Meeting, the Board considered the factors and reached the conclusions described below relating to the selection of Funds Management and the Sub-Adviser and the approval of the Advisory Agreements. Prior to the Meeting, including at an in-person meeting in April 2016, the Trustees conferred extensively among themselves and with representatives of Funds Management about these matters. Also, the Board has adopted a team-based approach, with each team consisting of a sub-set of Trustees, to assist the full Board in the discharge of its duties in reviewing performance and other matters throughout the year. The Independent Trustees were assisted in their evaluation of the Advisory Agreements by independent legal counsel, from whom they received separate legal advice and with whom they met separately.
In providing information to the Board, Funds Management and the Sub-Adviser were guided by a detailed set of requests for information submitted to them by independent legal counsel on behalf of the Independent Trustees at the start of the Board’s annual contract renewal process earlier in 2016. In considering and approving the Advisory Agreements, the Trustees considered the information they believed relevant, including but not limited to the information discussed below. The Board considered not only the specific information presented in connection with the Meeting, but also the knowledge gained over time through interaction with Funds Management and the Sub-Adviser about various topics. In this regard, the Board reviewed reports of Funds Management at each of its quarterly meetings, which included, among other things, portfolio reviews and performance reports. In addition, the Board and the teams mentioned above confer with portfolio managers at various times throughout the year. The Board did not identify any particular information or consideration that was all-important or controlling, and each individual Trustee may have attributed different weights to various factors.
After its deliberations, the Board unanimously approved the continuation of the Advisory Agreements for a one-year term and determined that the compensation payable to Funds Management and the Sub-Adviser under each of the Advisory Agreements was reasonable. The Board considered the approval of the Advisory Agreements for the Fund as part of its consideration of agreements for funds across the complex, but its approvals were made on a fund-by-fund basis. The following summarizes a number of important, but not necessarily all, factors considered by the Board in support of its approvals.
Nature, extent and quality of services
The Board received and considered various information regarding the nature, extent and quality of services provided to the Fund by Funds Management and the Sub-Adviser under the Advisory Agreements. This information included a description of the investment advisory services and Fund-level administrative services covered by the Management Agreement, as well as, among other things, a summary of the background and experience of senior management of Funds Management, and the qualifications, background, tenure and responsibilities of each of the portfolio managers primarily responsible for the day-to-day portfolio management of the Fund.
The Board evaluated the ability of Funds Management and the Sub-Adviser to attract and retain qualified investment professionals, including research, advisory and supervisory personnel. The Board further considered the compliance programs and compliance records of Funds Management and the Sub-Adviser. In addition, the Board took into account the full range of services provided to the Fund by Funds Management and its affiliates.
Fund performance and expenses
The Board considered the performance results for the Fund over various time periods ended December 31, 2015. The Board considered these results in comparison to the performance of funds in a universe that was determined by Broadridge Inc. (“Broadridge”) to be similar to the Fund (the “Universe”), and in comparison to the Fund’s benchmark index and to other comparative data. Broadridge is an independent provider of investment company data. The Board received a description of the methodology used by Broadridge to select the mutual funds in the performance
| | | | |
| 36 | | Wells Fargo High Yield Municipal Bond Fund | | Other information (unaudited) |
Universe. The Board noted that the performance of the Fund (Administrator Class) was higher than the average performance of the Universe for all periods under review. The Board also noted that the performance of the Fund was higher than its benchmark, the Barclays Municipal Bond Index, for all periods under review.
The Board also received and considered information regarding the Fund’s net operating expense ratios and their various components, including actual management fees, custodian and other non-management fees, and Rule 12b-1 and non-Rule 12b-1 shareholder service fees. The Board considered these ratios in comparison to the median ratios of funds in class-specific expense groups that were determined by Broadridge to be similar to the Fund (the “Groups”). The Board received a description of the methodology used by Broadridge to select the mutual funds in the expense Groups and an explanation of how funds comprising expense groups and their expense ratios may vary from year-to-year. Based on the Broadridge reports, the Board noted that the net operating expense ratios of the Fund were lower than or equal to the median net operating expense ratios of the expense Groups.
The Board took into account the Fund performance and expense information provided to it among the factors considered in deciding to re-approve the Advisory Agreements.
Investment management and sub-advisory fee rates
The Board reviewed and considered the contractual fee rates payable by the Fund to Funds Management under the Management Agreement, as well as the contractual fee rates payable by the Fund to Funds Management for class-level administrative services under a Class-Level Administration Agreement, which include class-level transfer agency and sub-transfer agency costs (collectively, the “Management Rates”). The Board also reviewed and considered the contractual investment sub-advisory fee rates that are payable by Funds Management to the Sub-Adviser for investment sub-advisory services.
Among other information reviewed by the Board was a comparison of the Fund’s Management Rates with the average contractual investment management fee rates of funds in the expense Groups at a common asset level as well as transfer agency costs of the funds in the expense Groups. The Board noted that the Management Rates of the Fund were lower than or in range of the sum of these average rates for the Fund’s expense Groups for all share classes.
The Board also received and considered information about the portion of the total management fee that was retained by Funds Management after payment of the fee to the Sub-Adviser for sub-advisory services. In assessing the reasonableness of this amount, the Board received and evaluated information about the nature and extent of responsibilities retained and risks assumed by Funds Management and not delegated to or assumed by the Sub-Adviser, and about Funds Management’s on-going oversight services. However, given the affiliation between Funds Management and the Sub-Adviser, the Board ascribed limited relevance to the allocation of fees between them.
The Board also received and considered information about the nature and extent of services offered and fee rates charged by Funds Management and the Sub-Adviser to other types of clients with investment strategies similar to those of the Fund. In this regard, the Board received information about the significantly greater scope of services, and compliance, reporting and other legal burdens and risks of managing mutual funds compared with those associated with managing assets of non-mutual fund clients such as collective funds or institutional separate accounts.
Based on its consideration of the factors and information it deemed relevant, including those described here, the Board determined that the compensation payable to Funds Management under the Management Agreement and to the Sub-Adviser under the Sub-Advisory Agreement was reasonable, in light of the services covered by the Advisory Agreements.
Profitability
The Board received and considered information concerning the profitability of Funds Management, as well as the profitability of Wells Fargo as a whole, from providing services to the Fund and the fund family as a whole. The Board also received and considered information concerning the profitability of the Sub-Adviser from providing services to the fund family as a whole, noting that the Sub-Adviser’s profitability information with respect to providing services to the Fund was subsumed in the Wells Fargo and Funds Management profitability analysis.
Funds Management reported on the methodologies and estimates used in calculating profitability. Among other things, the Board noted that the levels of profitability reported on a fund-by-fund basis varied widely, depending on factors such as the size and type of fund. Based on its review, the Board did not deem the profits reported by Funds Management or Wells Fargo from its services to the Fund to be at a level that would prevent it from approving the continuation of the Advisory Agreements.
| | | | | | |
| Other information (unaudited) | | Wells Fargo High Yield Municipal Bond Fund | | | 37 | |
Economies of scale
With respect to possible economies of scale, the Board noted the existence of breakpoints in the Fund’s management fee structure, which operate generally to reduce the Fund’s expense ratios as the Fund grows in size. It considered that, for a small fund or a fund that shrinks in size, breakpoints conversely can result in higher fee levels. The Board also considered that fee waiver and expense reimbursement arrangements and competitive fee rates at the outset are means of sharing potential economies of scale with shareholders of the Fund and the fund family as a whole. The Board considered Funds Management’s view that any analyses of potential economies of scale in managing a particular fund are inherently limited in light of the joint and common costs and investments that Funds Management incurs across the fund family as a whole.
The Board concluded that the Fund’s fee and expense arrangements, including contractual breakpoints, constituted a reasonable approach to sharing potential economies of scale with the Fund and its shareholders.
Other benefits to Funds Management and the Sub-Adviser
The Board received and considered information regarding potential “fall-out” or ancillary benefits received by Funds Management and its affiliates, including the Sub-Adviser, as a result of their relationships with the Fund. Ancillary benefits could include, among others, benefits directly attributable to other relationships with the Fund and benefits potentially derived from an increase in Funds Management’s and the Sub-Adviser’s business as a result of their relationships with the Fund. The Board noted that various affiliates of Funds Management may receive distribution-related fees, shareholder servicing payments and sub-transfer agency fees in respect of shares sold or held through them and services provided.
The Board also reviewed information about soft dollar credits earned and utilized by the Sub-Adviser, fees earned by Funds Management and the Sub-Adviser from managing a private investment vehicle for the fund family’s securities lending collateral and commissions earned by an affiliated broker from portfolio transactions.
Based on its consideration of the factors and information it deemed relevant, including those described here, the Board did not find that any ancillary benefits received by Funds Management and its affiliates, including the Sub-Adviser, were unreasonable.
Conclusion
At the Meeting, after considering the above-described factors and based on its deliberations and its evaluation of the information described above, the Board unanimously approved the continuation of the Advisory Agreements for a one-year term and determined that the compensation payable to Funds Management and the Sub-Adviser under each of the Advisory Agreements was reasonable.
| | | | |
| 38 | | Wells Fargo High Yield Municipal Bond Fund | | List of abbreviations |
The following is a list of common abbreviations for terms and entities that may have appeared in this report.
| ACA | — ACA Financial Guaranty Corporation |
| ADR | — American depositary receipt |
| ADS | — American depositary shares |
| AGC | — Assured Guaranty Corporation |
| AGM | — Assured Guaranty Municipal |
| Ambac | — Ambac Financial Group Incorporated |
| AMT | — Alternative minimum tax |
| BAN | — Bond anticipation notes |
| BHAC | — Berkshire Hathaway Assurance Corporation |
| CAB | — Capital appreciation bond |
| CCAB | — Convertible capital appreciation bond |
| CDA | — Community Development Authority |
| CDO | — Collateralized debt obligation |
| DRIVER | — Derivative inverse tax-exempt receipts |
| DW&P | — Department of Water & Power |
| DWR | — Department of Water Resources |
| ECFA | — Educational & Cultural Facilities Authority |
| EDA | — Economic Development Authority |
| EDFA | — Economic Development Finance Authority |
| ETF | — Exchange-traded fund |
| FDIC | — Federal Deposit Insurance Corporation |
| FFCB | — Federal Farm Credit Banks |
| FGIC | — Financial Guaranty Insurance Corporation |
| FHA | — Federal Housing Administration |
| FHLB | — Federal Home Loan Bank |
| FHLMC | — Federal Home Loan Mortgage Corporation |
| FICO | — The Financing Corporation |
| FNMA | — Federal National Mortgage Association |
| GDR | — Global depositary receipt |
| GNMA | — Government National Mortgage Association |
| HCFR | — Healthcare facilities revenue |
| HEFA | — Health & Educational Facilities Authority |
| HEFAR | — Higher education facilities authority revenue |
| HFA | — Housing Finance Authority |
| HFFA | — Health Facilities Financing Authority |
| HUD | — Department of Housing and Urban Development |
| IDA | — Industrial Development Authority |
| IDAG | — Industrial Development Agency |
| KRW | — Republic of Korea won |
| LIBOR | — London Interbank Offered Rate |
| LIFER | — Long Inverse Floating Exempt Receipts |
| LLC | — Limited liability company |
| LLLP | — Limited liability limited partnership |
| LLP | — Limited liability partnership |
| MBIA | — Municipal Bond Insurance Association |
| MFHR | — Multifamily housing revenue |
| MSTR | — Municipal securities trust receipts |
| MUD | — Municipal Utility District |
| National | — National Public Finance Guarantee Corporation |
| PCFA | — Pollution Control Financing Authority |
| PCL | — Public Company Limited |
| PCR | — Pollution control revenue |
| PFA | — Public Finance Authority |
| PFFA | — Public Facilities Financing Authority |
| PFOTER | — Puttable floating option tax-exempt receipts |
| plc | — Public limited company |
| PUTTER | — Puttable tax-exempt receipts |
| R&D | — Research & development |
| Radian | — Radian Asset Assurance |
| RAN | — Revenue anticipation notes |
| RDA | — Redevelopment Authority |
| RDFA | — Redevelopment Finance Authority |
| REIT | — Real estate investment trust |
| ROC | — Reset option certificates |
| SAVRS | — Select auction variable rate securities |
| SBA | — Small Business Authority |
| SDR | — Swedish depositary receipt |
| SFHR | — Single-family housing revenue |
| SFMR | — Single-family mortgage revenue |
| SPA | — Standby purchase agreement |
| SPDR | — Standard & Poor’s Depositary Receipts |
| SPEAR | — Short Puttable Exempt Adjustable Receipts |
| STRIPS | — Separate trading of registered interest and |
| TAN | — Tax anticipation notes |
| TIPS | — Treasury inflation-protected securities |
| TRAN | — Tax revenue anticipation notes |
| TTFA | — Transportation Trust Fund Authority |
| TVA | — Tennessee Valley Authority |
This page is intentionally left blank.
This page is intentionally left blank.

For more information
More information about Wells Fargo Funds is available free upon request. To obtain literature, please write, email, visit the Fund’s website, or call:
Wells Fargo Funds
P.O. Box 8266
Boston, MA 02266-8266
Email: fundservice@wellsfargo.com
Website: wellsfargofunds.com
Individual investors: 1-800-222-8222
Retail investment professionals: 1-888-877-9275
Institutional investment professionals: 1-866-765-0778
This report and the financial statements contained herein are submitted for the general information of the shareholders of the Fund. If this report is used for promotional purposes, distribution of the report must be accompanied or preceded by a current prospectus. Before investing, please consider the investment objectives, risks, charges, and expenses of the investment. For a current prospectus and, if available, a summary prospectus, containing this information, call 1-800-222-8222 or visit the Fund’s website at wellsfargofunds.com. Read the prospectus carefully before you invest or send money.
Wells Fargo Asset Management (WFAM) is a trade name used by the asset management businesses of Wells Fargo & Company. Wells Fargo Funds Management, LLC, a wholly owned subsidiary of Wells Fargo & Company, provides investment advisory and administrative services for Wells Fargo Funds. Other affiliates of Wells Fargo & Company provide subadvisory and other services for the funds. The funds are distributed by Wells Fargo Funds Distributor, LLC, Member FINRA, an affiliate of Wells Fargo & Company.
NOT FDIC INSURED ¡ NO BANK GUARANTEE ¡ MAY LOSE VALUE
© 2016 Wells Fargo Funds Management, LLC. All rights reserved.
| | |
 | | 244403 08-16 A264/AR264 6-16 |
Annual Report
June 30, 2016

Wells Fargo Intermediate Tax/AMT-Free Fund


Reduce clutter. Save trees.
Sign up for electronic delivery of prospectuses and shareholder reports at wellsfargo.com/advantagedelivery
Contents
| * | A complete schedule of portfolio holdings as of the report date may be obtained, free of charge, by accessing the following website: https://www.wellsfargofunds.com/assets/edocs/regulatory/holdings/intermediate-tax-amt-free-ann.pdf or by calling Wells Fargo Funds at 1-800-222-8222. This complete schedule, filed on Form N-CSR, is also available on the SEC’s website at sec.gov. |
The views expressed and any forward-looking statements are as of June 30, 2016, unless otherwise noted, and are those of the Fund managers and/or Wells Fargo Funds Management, LLC. Discussions of individual securities, or the markets generally, or any Wells Fargo Fund are not intended as individual recommendations. Future events or results may vary significantly from those expressed in any forward-looking statements. The views expressed are subject to change at any time in response to changing circumstances in the market. Wells Fargo Funds Management, LLC and the Fund disclaim any obligation to publicly update or revise any views expressed or forward-looking statements.
NOT FDIC INSURED ¡ NO BANK GUARANTEE ¡ MAY LOSE VALUE
| | | | |
| 2 | | Wells Fargo Intermediate Tax/AMT-Free Fund | | Letter to shareholders (unaudited) |

Karla M. Rabusch
President
Wells Fargo Funds
In fact, yields on municipal bonds that matured in 10 years or more experienced yield declines of more than 100 basis points (100 basis points equals 1.00%) during the reporting period.
Dear Valued Shareholder:
We are pleased to offer you this annual report for the Wells Fargo Intermediate Tax/AMT-Free Fund for the 12-month period that ended June 30, 2016. The U.S. Federal Reserve (Fed) began normalizing monetary policy, raising the federal funds rate to between 0.25% and 0.50% in December 2015. Short-term municipal bond yields rose, but yields on longer-term bonds declined. In fact, yields on municipal bonds that matured in 10 years or more experienced yield declines of more than 100 basis points (100 basis points equals 1.00%) during the reporting period. The Barclays Municipal Bond Index,1 a broad measure tracking investment-grade municipal bonds, returned 7.65% during the 12-month reporting period.
Monetary policy was accommodative.
The Fed continued an easy monetary policy in order to support the economy and the financial system. However, it raised the federal funds target rate in December because it believed the U.S. economy was strong enough to begin normalizing monetary policy. The European Central Bank cut all three of its short-term rates during the reporting period, increased its asset-purchase program from 60 billion euros per month to 80 billion, expanded the list of eligible securities to include investment-grade nonbank debt, and created a fund-to-lend program where banks could be paid to lend money. In Japan, the Bank of Japan maintained an aggressive monetary program aimed at combating deflation.
Despite accommodative central-bank policies that helped keep interest rates at ultra-low levels, there were periods of volatility. Early in 2016, weakness in certain emerging markets economies and commodities hurt riskier assets and a vote in June 2016 by the U.K. to exit the European Union set off another round of global uncertainty. Municipal bonds benefited because they are perceived as a safe-haven asset. In addition, investor demand for yield helped lower-rated debt outperform. The Barclays High Yield Municipal Bond Index2 returned 12.09% during the 12-month period that ended June 30, 2016.
Strong demand, modest supply, and solid credit fundamentals supported municipals.
Market technicals remained favorable. According to the Investment Company Institute, more than $33 billion was allocated to municipal mutual funds during the first half of 2016, which was more than double the inflows during all of 2015. Further, inflows during the second quarter of 2016 were the largest in nearly seven years. In contrast, less new supply helped make 2015 the fifth calendar year of negative net supply and supply in the first half of 2016 was about 4% less than the same period last year.
Municipal credit quality remained on an uptrend despite a number of high-profile negative credit situations. Idiosyncratic credit risks remain, however. With regard to Puerto Rico, the U.S. enacted legislation that prohibits bondholder lawsuits temporarily and instills a fiscal oversight board for Puerto Rico; Puerto Rico then declared a moratorium on paying its general obligation (GO) bonds and defaulted on $911 million in payments due (most of which were GOs) on July 1, 2016. The
| 1 | The Barclays Municipal Bond Index is an unmanaged index composed of long-term tax-exempt bonds with a minimum credit rating of Baa. You cannot invest directly in an index. |
| 2 | The Barclays High Yield Municipal Bond Index measures the non-investment-grade and nonrated U.S. dollar–denominated, fixed-rate, tax-exempt bond market within the 50 United States and four other qualifying regions (Washington, D.C.; Puerto Rico; Guam; and the Virgin Islands). The index allows state and local general obligation, revenue, insured, and prerefunded bonds; however, historically the index has been composed of mostly revenue bonds. You cannot invest directly in an index. |
| | | | | | |
| Letter to shareholders (unaudited) | | Wells Fargo Intermediate Tax/AMT-Free Fund | | | 3 | |
state of Illinois approved a six-month stopgap budget, a temporary but meaningful step. Under this stopgap budget for the state, the city of Chicago receives authority to raise property taxes for teacher pensions and low-income school districts would receive greater state funding. City of Chicago and school district debt rallied on the news.
Since the end of the financial crisis, structural changes in the fixed-income markets have reduced trading liquidity (the degree to which assets can be bought or sold without affecting the price). New regulations and capital requirements have caused traditional liquidity suppliers (banks and broker/dealers) to be more risk-averse and hold less inventory. Meanwhile, corporate-debt issuance has spiked as companies finance themselves at record-low yields, bond mutual funds hold larger amounts of this new debt supply, trading volumes are lower, and large trades are more difficult to execute. However, fixed-income markets appear to have functioned well over the past year with sufficient liquidity.
Don’t let short-term uncertainty derail long-term investment goals.
Periods of uncertainty can present challenges, but experience has taught us that maintaining long-term investment goals can be an effective way to plan for the future. To help you create a sound strategy based on your personal goals and risk tolerance, Wells Fargo Funds offers more than 100 mutual funds spanning a wide range of asset classes and investment styles. Although diversification cannot guarantee an investment profit or prevent losses, we believe it can be an effective way to manage investment risk and potentially smooth out overall portfolio performance. We encourage investors to know their investments and to understand that appropriate levels of risk-taking may unlock opportunities.
Thank you for choosing to invest in Wells Fargo Funds. We appreciate your confidence in us and remain committed to helping you meet your financial needs.
Sincerely,

Karla M. Rabusch
President
Wells Fargo Funds
Periods of uncertainty can present challenges, but experience has taught us that maintaining long-term investment goals can be an effective way to plan for the future.
For further information about your Fund, contact your investment professional, visit our website at wellsfargofunds.com, or call us directly at 1-800-222-8222. We are available 24 hours a day, 7 days a week.
| | | | |
| 4 | | Wells Fargo Intermediate Tax/AMT-Free Fund | | Performance highlights (unaudited) |
Investment objective
The Fund seeks current income exempt from federal income tax.
Manager
Wells Fargo Funds Management, LLC
Subadviser
Wells Capital Management Incorporated
Portfolio managers
Lyle J. Fitterer, CFA®, CPA
Robert J. Miller
Average annual total returns (%) as of June 30, 20161
| | | | | | | | | | | | | | | | | | | | | | | | | | | | | | | | | | |
| | | | | Including sales charge | | | Excluding sales charge | | | Expense ratios2 (%) | |
| | | Inception date | | 1 year | | | 5 year | | | 10 year | | | 1 year | | | 5 year | | | 10 year | | | Gross | | | Net3 | |
| Class A (WFTAX) | | 7-31-2007 | | | 2.81 | | | | 3.84 | | | | 4.26 | | | | 5.99 | | | | 4.47 | | | | 4.58 | | | | 0.80 | | | | 0.70 | |
| Class C (WFTFX) | | 7-31-2007 | | | 4.20 | | | | 3.69 | | | | 3.81 | | | | 5.20 | | | | 3.69 | | | | 3.81 | | | | 1.55 | | | | 1.45 | |
| Administrator Class (WFITX) | | 3-31-2008 | | | – | | | | – | | | | – | | | | 6.09 | | | | 4.58 | | | | 4.68 | | | | 0.74 | | | | 0.60 | |
| Institutional Class (WITIX) | | 3-31-2008 | | | – | | | | – | | | | – | | | | 6.26 | | | | 4.76 | | | | 4.84 | | | | 0.47 | | | | 0.45 | |
| Barclays Municipal Bond 1-15 Year Blend Index4 | | – | | | – | | | | – | | | | – | | | | 6.12 | | | | 4.22 | | | | 4.75 | | | | – | | | | – | |
Figures quoted represent past performance, which is no guarantee of future results, and do not reflect taxes that a shareholder may pay on fund distributions or the redemption of fund shares. Investment return and principal value of an investment will fluctuate so that an investor’s shares, when redeemed, may be worth more or less than their original cost. Performance shown without sales charges would be lower if sales charges were reflected. Current performance may be lower or higher than the performance data quoted, which assumes the reinvestment of dividends and capital gains. Current month-end performance is available on the Fund’s website, wellsfargofunds.com.
Index returns do not include transaction costs associated with buying and selling securities, any mutual fund fees or expenses, or any taxes. It is not possible to invest directly in an index.
For Class A shares, the maximum front-end sales charge is 3.00%. For Class C shares, the maximum contingent deferred sales charge is 1.00%. Performance including a contingent deferred sales charge assumes the sales charge for the corresponding time period. Administrator Class and Institutional shares are sold without a front-end sales charge or contingent deferred sales charge.
Bond values fluctuate in response to the financial condition of individual issuers, general market and economic conditions, and changes in interest rates. Changes in market conditions and government policies may lead to periods of heightened volatility in the bond market and reduced liquidity for certain bonds held by the Fund. In general, when interest rates rise, bond values fall and investors may lose principal value. Interest-rate changes and their impact on the Fund and its share price can be sudden and unpredictable. High-yield securities have a greater risk of default and tend to be more volatile than higher-rated debt securities. The use of derivatives may reduce returns and/or increase volatility. Certain investment strategies tend to increase the total risk of an investment (relative to the broader market). The Fund is exposed to municipal securities risk. Consult the Fund’s prospectus for additional information on these and other risks. A portion of the Fund’s income may be subject to federal, state, and/or local income taxes or the Alternative Minimum Tax (AMT). Any capital gains distributions may be taxable.
Please see footnotes on page 5.
| | | | | | |
| Performance highlights (unaudited) | | Wells Fargo Intermediate Tax/AMT-Free Fund | | | 5 | |
|
| Growth of $10,000 investment as of June 30, 20165 |
|
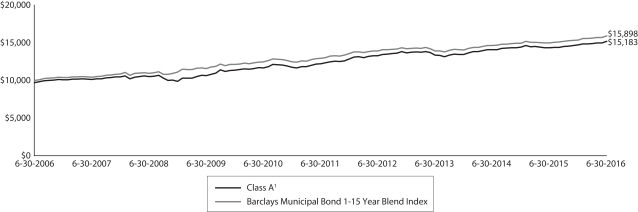 |
| 1 | Historical performance shown for Class A shares prior to their inception reflects the performance of the former Investor Class shares, and includes the higher expenses applicable to the former Investor Class shares (except during those periods in which expenses of Class A shares would have been higher than those of the former Investor Class shares, no such adjustment is reflected). Historical performance shown for Class C shares prior to their inception reflects the performance of the former Investor Class shares, adjusted to reflect the higher expenses applicable to Class C shares. Historical performance shown for Administrator Class and Institutional Class shares prior to their inception reflects the performance of Class A shares, and includes the higher expenses applicable to Class A shares. If these expenses had not been included, returns would be higher. |
| 2 | Reflects the expense ratios as stated in the most recent prospectuses. The expense ratios shown are subject to change and may differ from the annualized expense ratios shown in the financial highlights of this report. |
| 3 | The manager has contractually committed through October 31, 2016, to waive fees and/or reimburse expenses to the extent necessary to cap the Fund’s Total Annual Fund Operating Expenses After Fee Waiver at the amount shown. After this time, the cap may be increased or the commitment to maintain the cap may be terminated only with the approval of the Board of Trustees. Brokerage commissions, stamp duty fees, interest, taxes, acquired fund fees and expenses, and extraordinary expenses are excluded from the expense cap. Without this cap, the Fund’s returns would have been lower. |
| 4 | The Barclays Municipal Bond 1–15 Year Blend Index is the 1–15 Year Blend component of the Barclays Municipal Bond Index. The Barclays Municipal Bond Index is an unmanaged index composed of tax-exempt bonds with maturities between six and eight years and a minimum credit rating of Baa. You cannot invest directly in an index. |
| 5 | The chart compares the performance of Class A shares for the most recent ten years with the Barclays Municipal Bond 1–15 Year Blend Index. The chart assumes a hypothetical $10,000 investment in Class A shares and reflects all operating expenses and assumes the maximum initial sales charge of 3.00%. |
| 6 | The credit quality distribution of portfolio holdings reflected in the chart is based on ratings from Standard & Poor’s, Moody’s Investors Service, and/or Fitch Ratings Ltd. Credit quality ratings apply to the underlying holdings of the Fund and not to the Fund itself. The percentages of the Fund’s portfolio with the ratings depicted in the chart are calculated based on the total market value of fixed income securities held by the Fund. If a security was rated by all three rating agencies, the middle rating was utilized. If rated by two of three rating agencies, the lower rating was utilized, and if rated by one of the rating agencies, that rating was utilized. Standard & Poor’s rates the creditworthiness of bonds, ranging from AAA (highest) to D (lowest). Ratings from A to CCC may be modified by the addition of a plus (+) or minus (-) sign to show relative standing within the rating categories. Standard & Poor’s rates the creditworthiness of short-term notes from SP-1 (highest) to SP-3 (lowest). Moody’s rates the creditworthiness of bonds, ranging from Aaa (highest) to C (lowest). Ratings Aa to B may be modified by the addition of a number 1 (highest) to 3 (lowest) to show relative standing within the ratings categories. Moody’s rates the creditworthiness of short-term U.S. tax-exempt municipal securities from MIG 1/VMIG 1 (highest) to SG (lowest). Fitch rates the creditworthiness of bonds, ranging from AAA (highest) to D (lowest). Credit quality distribution is subject to change and may have changed since the date specified. |
| 7 | Amounts are calculated based on the total investments of the Fund. These amounts are subject to change and may have changed since the date specified. |
| | | | |
| 6 | | Wells Fargo Intermediate Tax/AMT-Free Fund | | Performance highlights (unaudited) |
MANAGER’S DISCUSSION
Fund highlights
| n | | The Fund underperformed its benchmark, the Barclays Municipal Bond 1–15 Year Blend Index, for the 12-month period that ended June 30, 2016. |
| n | | The Fund was short duration compared with the benchmark, which detracted from results as the market rallied. |
| n | | Investors’ search for income, which favored higher yielding, lower-quality bonds in this low-yield environment, caused lower-quality bonds to perform very well. Consequently, the Fund’s overweight to A-rated, BBB-rated, and out-of-benchmark below-investment-grade debt was the biggest contributor to returns. |
| n | | Sector and issue selection also contributed to performance. Our overweight to the essential service revenue bonds and local general obligation (GO) bonds was positive as these sectors outperformed. Our largest state overweight continues to be to Illinois, and it was one of the best-performing states. |
Ultralow-yields continued throughout the period.
With the U.S. Federal Reserve (Fed) poised to normalize its interest-rate policy, shorter-term maturities appeared less attractive at the beginning of the reporting period due to a potential for higher short-term yields. Subdued inflation expectations, due in part to low oil prices, combined with a fragile European economy and softening Chinese economy, implied that longer maturities would outperform. We, therefore, positioned the Fund for a flatter yield curve. While we owned bonds across the curve, the Fund had a concentration of positions in bonds with 20 years or more to maturity and in securities with less than 1 year to maturity. Overall, the Fund benefited from its flattening bias, with the longer-dated securities performing well. However, our allocation to the very short end of the yield curve somewhat muted performance.
The Fed tightened in December 2015 but signaled that the pace of further increases would be gradual. We began the period short duration relative to the benchmark, but with the Fed likely on hold for an extended period, we extended duration to near neutral. Less-than-benchmark duration hurt relative performance, especially during the second half of the period as U.S. rates continued to move lower in sympathy with declining global interest rates.
|
| Credit quality as of June 30, 20166 |
|
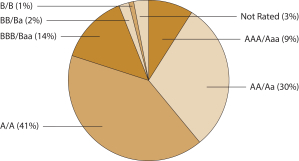 |
Credit-quality allocation helped results.
The Fund’s overweight to A-rated and BBB-rated debt and its out-of-benchmark holdings in high-yield and nonrated debt contributed to results because lower-rated bonds outperformed higher-quality bonds by a wide margin during the period. The Fund’s holdings within the local GO, electric, transportation, water and sewer, leasing, and special tax sectors performed well. On the other hand, the health care and industrial development revenue/pollution control revenue (corporate-backed municipals) sectors within the index performed well, but our issue selection within those sectors lagged, largely because of their shorter duration profile. We have been
cautious within the health care sector for quite some time because we believe credit fundamentals have peaked. Our largest state overweight continues to be to Illinois, and it was one of the best-performing states. Issue selection within Illinois, California, and Michigan contributed to results, while issue selection within New Jersey detracted from results, even though the state did well. Although taxable corporate bond spreads increased dramatically during late 2015 and early 2016 as global fears spooked the market, spreads for corporate-backed municipal debt declined. We sold into this rally, but continued new-money flows into high-yield and longer-term municipal bond funds caused these spreads to move even tighter.
Political noise and a lack of a state budget caused volatility within Illinois, but the state’s bonds had some of the highest returns. We have been overweight Illinois bonds for several years because we feel that the above-market income is compensating investors for the credit issues. We continue to believe that the state’s economic backdrop and ability to raise revenues, combined with Illinois Governor Bruce Rauner’s focus on cutting expenses, should ultimately lead to
Please see footnotes on page 5.
| | | | | | |
| Performance highlights (unaudited) | | Wells Fargo Intermediate Tax/AMT-Free Fund | | | 7 | |
tighter spreads. New Jersey bonds also performed well as spreads tightened; however, issue selection within the state detracted from results, primarily due to our exposure to longer-dated floating-rate notes that repriced to reflect a protracted rate-hike cycle. During the past 12 months, Puerto Rico had several widely anticipated defaults on its debt. The lack of clarity surrounding the federal government’s restructuring legislation for Puerto Rico debt, the lack of financial statements, and a declining economy make it very hard to develop an investment opinion for the territory. As a result, we continue to have minimal exposure to Puerto Rico bonds.
|
| Effective maturity distribution as of June 30, 20167 |
|
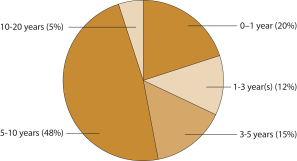 |
Rates may be lower for longer, making credit allocation and issue selection even more important.
Near the end of the reporting period, the U.K. voted to withdraw from the European Union, prompting considerable uncertainty about future political situations, financial markets, and economic growth. U.S. Treasuries and municipal bonds rallied significantly on the news, and both 10-year and 30-year municipal yields reached record-low levels. Although we think rates may stay lower for longer, we recognize that an improvement in overseas economies, outflows in mutual funds, or a more hawkish tone from the Fed could lead to a spike in rates. In the (we would hope unlikely) event of a materially weaker U.S. economy, that could be the catalyst for us to increase our duration exposure and reduce our credit exposure. In this record-low interest-rate environment, security selection is even more important as breakeven yields (the sell-off that a bond can endure before the total return drops to zero) decrease.
Please see footnotes on page 5.
| | | | |
| 8 | | Wells Fargo Intermediate Tax/AMT-Free Fund | | Fund expenses (unaudited) |
As a shareholder of the Fund, you incur two types of costs: (1) transaction costs, including sales charges (loads) on purchase payments and contingent deferred sales charges (if any) on redemptions and (2) ongoing costs, including management fees, distribution (12b-1) and/or shareholder servicing fees, and other Fund expenses. This example is intended to help you understand your ongoing costs (in dollars) of investing in the Fund and to compare these costs with the ongoing costs of investing in other mutual funds.
The example is based on an investment of $1,000 invested at the beginning of the six-month period and held for the entire period from January 1, 2016 to June 30, 2016.
Actual expenses
The “Actual” line of the table below provides information about actual account values and actual expenses. You may use the information in this line, together with the amount you invested, to estimate the expenses that you paid over the period. Simply divide your account value by $1,000 (for example, an $8,600 account value divided by $1,000 = 8.6), then multiply the result by the number in the “Actual” line under the heading entitled “Expenses paid during period” for your applicable class of shares to estimate the expenses you paid on your account during this period.
Hypothetical example for comparison purposes
The “Hypothetical” line of the table below provides information about hypothetical account values and hypothetical expenses based on the Fund’s actual expense ratio and an assumed rate of return of 5% per year before expenses, which is not the Fund’s actual return. The hypothetical account values and expenses may not be used to estimate the actual ending account balance or expenses you paid for the period. You may use this information to compare the ongoing costs of investing in the Fund and other funds. To do so, compare this 5% hypothetical example with the 5% hypothetical examples that appear in the shareholder reports of the other funds.
Please note that the expenses shown in the table are meant to highlight your ongoing costs only and do not reflect any transactional costs, such as sales charges (loads) and contingent deferred sales charges. Therefore, the “Hypothetical” line of the table is useful in comparing ongoing costs only and will not help you determine the relative total costs of owning different funds. In addition, if these transactional costs were included, your costs would have been higher.
| | | | | | | | | | | | | | | | |
| | | Beginning
account value
1-1-2016 | | | Ending
account value
6-30-2016 | | | Expenses
paid during
the period¹ | | | Net annualized
expense ratio | |
Class A | | | | | | | | | | | | | | | | |
Actual | | $ | 1,000.00 | | | $ | 1,031.88 | | | $ | 3.54 | | | | 0.70 | % |
Hypothetical (5% return before expenses) | | $ | 1,000.00 | | | $ | 1,021.38 | | | $ | 3.52 | | | | 0.70 | % |
Class C | | | | | | | | | | | | | | | | |
Actual | | $ | 1,000.00 | | | $ | 1,028.05 | | | $ | 7.31 | | | | 1.45 | % |
Hypothetical (5% return before expenses) | | $ | 1,000.00 | | | $ | 1,017.65 | | | $ | 7.27 | | | | 1.45 | % |
Administrator Class | | | | | | | | | | | | | | | | |
Actual | | $ | 1,000.00 | | | $ | 1,032.37 | | | $ | 3.03 | | | | 0.60 | % |
Hypothetical (5% return before expenses) | | $ | 1,000.00 | | | $ | 1,021.88 | | | $ | 3.02 | | | | 0.60 | % |
Institutional Class | | | | | | | | | | | | | | | | |
Actual | | $ | 1,000.00 | | | $ | 1,033.12 | | | $ | 2.27 | | | | 0.45 | % |
Hypothetical (5% return before expenses) | | $ | 1,000.00 | | | $ | 1,022.63 | | | $ | 2.26 | | | | 0.45 | % |
| 1 | Expenses paid is equal to the annualized expense ratio of each class multiplied by the average account value over the period, multiplied by the number of days in the most recent fiscal half-year divided by the number of days in the fiscal year (to reflect the one-half-year period). |
| | | | | | |
| Summary portfolio of investments—June 30, 2016 | | Wells Fargo Intermediate Tax/AMT-Free Fund | | | 9 | |
The Summary portfolio of investments shows the 50 largest portfolio holdings in unaffiliated issuers and any holdings exceeding 1% of the total net assets as of the report date. The remaining securities held are grouped as “Other securities” in each category.
| | | | | | | | | | | | | | | | | | | | |
| Security name | | Interest rate | | | Maturity date | | | Principal | | | Value | | | Percent of
net assets | |
| | | | | |
Municipal Obligations: 101.06% | | | | | | | | | | | | | | | | | | | | |
| | | | | |
| Alabama: 0.24% | | | | | | | | | | | | | | | | | | | | |
Other securities | | | | | | | | | | | | | | $ | 6,360,725 | | | | 0.24 | % |
| | | | | | | | | | | | | | | | | | | | |
| | | | | |
| Alaska: 0.17% | | | | | | | | | | | | | | | | | | | | |
Other securities | | | | | | | | | | | | | | | 4,546,002 | | | | 0.17 | |
| | | | | | | | | | | | | | | | | | | | |
| | | | | |
| Arizona: 1.50% | | | | | | | | | | | | | | | | | | | | |
Other securities | | | | | | | | | | | | | | | 40,060,617 | | | | 1.50 | |
| | | | | | | | | | | | | | | | | | | | |
| | | | | |
| California: 10.03% | | | | | | | | | | | | | | | | | | | | |
Bay Area CA Toll Authority Series A (Transportation Revenue) ± | | | 1.66 | % | | | 4-1-2036 | | | $ | 20,000,000 | | | | 19,757,800 | | | | 0.74 | |
California PFOTER Series DCL-009 (GO Revenue, Dexia Credit Local LOC, AGM Insured) 144Aø | | | 0.59 | | | | 8-1-2027 | | | | 14,975,000 | | | | 14,975,000 | | | | 0.56 | |
California Public Works University of California Board of Regents Series G (Miscellaneous Revenue) | | | 5.00 | | | | 12-1-2030 | | | | 12,110,000 | | | | 14,668,480 | | | | 0.55 | |
San Jose CA MFHR Casa Del Pueblo Apartments Project Series D (Housing Revenue) ± | | | 0.95 | | | | 12-1-2017 | | | | 10,000,000 | | | | 10,003,100 | | | | 0.37 | |
University of California Limited Project Series G (Education Revenue) | | | 5.00 | | | | 5-15-2037 | | | | 10,390,000 | | | | 12,274,019 | | | | 0.46 | |
University of California Medical Center Series J (Health Revenue) | | | 5.25 | | | | 5-15-2030 | | | | 15,000,000 | | | | 18,427,800 | | | | 0.69 | |
Other securities | | | | | | | | | | | | | | | 178,326,770 | | | | 6.66 | |
| | | | | |
| | | | | | | | | | | | | | | 268,432,969 | | | | 10.03 | |
| | | | | | | | | | | | | | | | | | | | |
| | | | | |
| Colorado: 0.80% | | | | | | | | | | | | | | | | | | | | |
Colorado Springs CO Utilities System Sub Lien Improvement Series B (Utilities Revenue, Bayerische Landesbank SPA) ø | | | 0.56 | | | | 11-1-2036 | | | | 12,000,000 | | | | 12,000,000 | | | | 0.45 | |
Other securities | | | | | | | | | | | | | | | 9,453,342 | | | | 0.35 | |
| | | | | |
| | | | | | | | | | | | | | | 21,453,342 | | | | 0.80 | |
| | | | | | | | | | | | | | | | | | | | |
| | | | | |
| Connecticut: 3.00% | | | | | | | | | | | | | | | | | | | | |
Connecticut HEFA Yale University Series A (Education Revenue) ±%% | | | 1.00 | | | | 7-1-2042 | | | | 25,000,000 | | | | 25,072,500 | | | | 0.94 | |
Connecticut HEFAR Yale University Issue Series A (Education Revenue) ± | | | 1.38 | | | | 7-1-2035 | | | | 10,000,000 | | | | 10,119,300 | | | | 0.38 | |
Other securities | | | | | | | | | | | | | | | 45,013,709 | | | | 1.68 | |
| | | | | |
| | | | | | | | | | | | | | | 80,205,509 | | | | 3.00 | |
| | | | | | | | | | | | | | | | | | | | |
| | | | | |
| Delaware: 0.08% | | | | | | | | | | | | | | | | | | | | |
Other securities | | | | | | | | | | | | | | | 2,069,980 | | | | 0.08 | |
| | | | | | | | | | | | | | | | | | | | |
| | | | | |
| District of Columbia: 0.56% | | | | | | | | | | | | | | | | | | | | |
Other securities | | | | | | | | | | | | | | | 14,862,743 | | | | 0.56 | |
| | | | | | | | | | | | | | | | | | | | |
| | | | | |
| Florida: 4.85% | | | | | | | | | | | | | | | | | | | | |
Miami-Dade County FL School Board Certificate of Participation Series 4 (Miscellaneous Revenue, Dexia Credit Local LOC, Dexia Credit Local LIQ) 144Aø | | | 0.79 | | | | 9-25-2024 | | | | 12,705,000 | | | | 12,705,000 | | | | 0.47 | |
Other securities | | | | | | | | | | | | | | | 116,989,022 | | | | 4.38 | |
| | | | | |
| | | | | | | | | | | | | | | 129,694,022 | | | | 4.85 | |
| | | | | | | | | | | | | | | | | | | | |
The accompanying notes are an integral part of these financial statements.
| | | | |
| 10 | | Wells Fargo Intermediate Tax/AMT-Free Fund | | Summary portfolio of investments—June 30, 2016 |
| | | | | | | | | | | | | | | | | | | | |
| Security name | | Interest rate | | | Maturity date | | | Principal | | | Value | | | Percent of
net assets | |
| | | | | |
| Georgia: 0.94% | | | | | | | | | | | | | | | | | | | | |
Other securities | | | | | | | | | | | | | | $ | 25,219,538 | | | | 0.94 | % |
| | | | | | | | | | | | | | | | | | | | |
| | | | | |
| Guam: 0.42% | | | | | | | | | | | | | | | | | | | | |
Other securities | | | | | | | | | | | | | | | 11,138,901 | | | | 0.42 | |
| | | | | | | | | | | | | | | | | | | | |
| | | | | |
| Illinois: 16.32% | | | | | | | | | | | | | | | | | | | | |
Chicago IL Board of Education (GO Revenue) µ | | | 0.00-5.25 | % | | | 12-1-2020 to 3-1-2036 | | | $ | 44,170,000 | | | | 40,176,331 | | | | 1.50 | |
Chicago IL O’Hare International Airport Senior Lien (Airport Revenue) | | | 5.25 | | | | 1-1-2032 | | | | 8,755,000 | | | | 10,588,822 | | | | 0.40 | |
Chicago IL (GO Revenue) µ | | | 0.00-5.25 | | | | 1-1-2019 to 1-1-2037 | | | | 32,310,000 | | | | 32,226,292 | | | | 1.20 | |
Chicago IL Series G (GO Revenue, Ambac Insured) | | | 5.00 | | | | 12-1-2024 | | | | 16,865,000 | | | | 17,158,788 | | | | 0.64 | |
Chicago IL Second Lien Series A (Water & Sewer Revenue, Ambac Insured) | | | 5.00 | | | | 11-1-2032 | | | | 10,000,000 | | | | 10,138,500 | | | | 0.38 | |
Illinois (Various Revenue) µ | | | 4.75-5.50 | | | | 9-1-2016 to 7-1-2026 | | | | 18,985,000 | | | | 21,281,264 | | | | 0.79 | |
Illinois (Tax Revenue) | | | 5.00 | | | | 6-15-2023 | | | | 16,050,000 | | | | 19,563,345 | | | | 0.73 | |
Illinois Finance Authority OSF Healthcare System Series F (Health Revenue, Barclays Bank plc LOC) ø## | | | 0.42 | | | | 11-15-2037 | | | | 20,000,000 | | | | 20,000,000 | | | | 0.75 | |
Illinois Regional Transportation Authority (Tax Revenue, National Insured) | | | 6.50 | | | | 7-1-2026 | | | | 7,815,000 | | | | 10,693,421 | | | | 0.40 | |
Illinois Series A (Tax Revenue) | | | 5.00 | | | | 1-1-2027 | | | | 10,625,000 | | | | 11,516,013 | | | | 0.43 | |
Other securities | | | | | | | | | | | | | | | 243,342,859 | | | | 9.10 | |
| | | | | |
| | | | | | | | | | | | | | | 436,685,635 | | | | 16.32 | |
| | | | | | | | | | | | | | | | | | | | |
| | | | | |
| Indiana: 2.39% | | | | | | | | | | | | | | | | | | | | |
Indiana HEFA Ascension Health Series B3 (Health Revenue) ± | | | 1.26 | | | | 11-15-2031 | | | | 15,000,000 | | | | 15,000,150 | | | | 0.56 | |
Other securities | | | | | | | | | | | | | | | 49,079,317 | | | | 1.83 | |
| | | | | |
| | | | | | | | | | | | | | | 64,079,467 | | | | 2.39 | |
| | | | | | | | | | | | | | | | | | | | |
| | | | | |
| Iowa: 0.44% | | | | | | | | | | | | | | | | | | | | |
Other securities | | | | | | | | | | | | | | | 11,794,576 | | | | 0.44 | |
| | | | | | | | | | | | | | | | | | | | |
| | | | | |
| Kansas: 0.23% | | | | | | | | | | | | | | | | | | | | |
Other securities | | | | | | | | | | | | | | | 6,235,310 | | | | 0.23 | |
| | | | | | | | | | | | | | | | | | | | |
| | | | | |
| Kentucky: 0.46% | | | | | | | | | | | | | | | | | | | | |
Other securities | | | | | | | | | | | | | | | 12,213,528 | | | | 0.46 | |
| | | | | | | | | | | | | | | | | | | | |
| | | | | |
| Louisiana: 2.02% | | | | | | | | | | | | | | | | | | | | |
St. James Parish LA Nucor Steel LLC Project Gulf Opportunity Zone Series B-1 (Industrial Development Revenue) ø## | | | 0.70 | | | | 11-1-2040 | | | | 25,000,000 | | | | 25,000,000 | | | | 0.94 | |
Other securities | | | | | | | | | | | | | | | 29,024,369 | | | | 1.08 | |
| | | | | |
| | | | | | | | | | | | | | | 54,024,369 | | | | 2.02 | |
| | | | | | | | | | | | | | | | | | | | |
| | | | | |
| Maryland: 1.53% | | | | | | | | | | | | | | | | | | | | |
Maryland Series B (GO Revenue) | | | 4.00 | | | | 8-1-2024 | | | | 15,000,000 | | | | 18,141,600 | | | | 0.68 | |
Other securities | | | | | | | | | | | | | | | 22,860,864 | | | | 0.85 | |
| | | | | |
| | | | | | | | | | | | | | | 41,002,464 | | | | 1.53 | |
| | | | | | | | | | | | | | | | | | | | |
The accompanying notes are an integral part of these financial statements.
| | | | | | |
| Summary portfolio of investments—June 30, 2016 | | Wells Fargo Intermediate Tax/AMT-Free Fund | | | 11 | |
| | | | | | | | | | | | | | | | | | | | |
| Security name | | Interest rate | | | Maturity date | | | Principal | | | Value | | | Percent of
net assets | |
| | | | | |
| Massachusetts: 2.23% | | | | | | | | | | | | | | | | | | | | |
Massachusetts HEFA Various Partners Healthcare Series G-6 (Health Revenue) ± | | | 1.29 | % | | | 7-1-2038 | | | $ | 14,000,000 | | | $ | 13,998,740 | | | | 0.52 | % |
Other securities | | | | | | | | | | | | | | | 45,591,939 | | | | 1.71 | |
| | | | | |
| | | | | | | | | | | | | | | 59,590,679 | | | | 2.23 | |
| | | | | | | | | | | | | | | | | | | | |
| | | | | |
| Michigan: 3.69% | | | | | | | | | | | | | | | | | | | | |
Michigan Finance Authority Local Government Loan Program Series D (Water & Sewer Revenue) | | | 5.00 | | | | 7-1-2030 | | | | 12,000,000 | | | | 14,269,080 | | | | 0.53 | |
Michigan Strategic Fund Limited Obligation Events Center Project Series A (Tax Revenue) ± | | | 4.13 | | | | 7-1-2045 | | | | 11,500,000 | | | | 11,808,545 | | | | 0.44 | |
Other securities | | | | | | | | | | | | | | | 72,806,072 | | | | 2.72 | |
| | | | | |
| | | | | | | | | | | | | | | 98,883,697 | | | | 3.69 | |
| | | | | | | | | | | | | | | | | | | | |
| | | | | |
| Minnesota: 0.28% | | | | | | | | | | | | | | | | | | | | |
Other securities | | | | | | | | | | | | | | | 7,601,084 | | | | 0.28 | |
| | | | | | | | | | | | | | | | | | | | |
| | | | | |
| Mississippi: 0.54% | | | | | | | | | | | | | | | | | | | | |
Mississippi Development Bank Special Obligation Jackson Water & Sewer System Project Series A (Water & Sewer Revenue, AGM Insured) | | | 5.00 | | | | 9-1-2030 | | | | 10,000,000 | | | | 11,918,300 | | | | 0.44 | |
Other securities | | | | | | | | | | | | | | | 2,652,866 | | | | 0.10 | |
| | | | | |
| | | | | | | | | | | | | | | 14,571,166 | | | | 0.54 | |
| | | | | | | | | | | | | | | | | | | | |
| | | | | |
| Missouri: 0.29% | | | | | | | | | | | | | | | | | | | | |
Other securities | | | | | | | | | | | | | | | 7,667,993 | | | | 0.29 | |
| | | | | | | | | | | | | | | | | | | | |
| | | | | |
| Nebraska: 0.12% | | | | | | | | | | | | | | | | | | | | |
Other securities | | | | | | | | | | | | | | | 3,229,996 | | | | 0.12 | |
| | | | | | | | | | | | | | | | | | | | |
| | | | | |
| Nevada: 1.32% | | | | | | | | | | | | | | | | | | | | |
Other securities | | | | | | | | | | | | | | | 35,320,350 | | | | 1.32 | |
| | | | | | | | | | | | | | | | | | | | |
| | | | | |
| New Hampshire: 0.08% | | | | | | | | | | | | | | | | | | | | |
Other securities | | | | | | | | | | | | | | | 2,229,752 | | | | 0.08 | |
| | | | | | | | | | | | | | | | | | | | |
| | | | | |
| New Jersey: 4.07% | | | | | | | | | | | | | | | | | | | | |
New Jersey EDA School Facilities (Miscellaneous Revenue) µ | | | 2.01-5.00 | | | | 6-15-2026 to 3-1-2028 | | | | 13,380,000 | | | | 13,936,479 | | | | 0.52 | |
New Jersey EDA School Facilities Construction Refunding Bond Series NN (Miscellaneous Revenue) | | | 5.00 | | | | 3-1-2021 | | | | 15,035,000 | | | | 16,649,158 | | | | 0.62 | |
New Jersey HEFAR Student Assistance Authority Series A (Education Revenue) | | | 5.00 | | | | 6-1-2019 | | | | 9,860,000 | | | | 10,842,549 | | | | 0.40 | |
New Jersey TTFA Series DC8033 (Transportation Revenue, Dexia Credit Local LOC, AGM Insured, Dexia Credit Local LIQ) 144Aø | | | 0.59 | | | | 12-15-2022 | | | | 19,850,000 | | | | 19,850,000 | | | | 0.74 | |
Other securities | | | | | | | | | | | | | | | 47,732,711 | | | | 1.79 | |
| | | | | |
| | | | | | | | | | | | | | | 109,010,897 | | | | 4.07 | |
| | | | | | | | | | | | | | | | | | | | |
The accompanying notes are an integral part of these financial statements.
| | | | |
| 12 | | Wells Fargo Intermediate Tax/AMT-Free Fund | | Summary portfolio of investments—June 30, 2016 |
| | | | | | | | | | | | | | | | | | | | |
| Security name | | Interest rate | | | Maturity date | | | Principal | | | Value | | | Percent of
net assets | |
| | | | | |
| New Mexico: 0.65% | | | | | | | | | | | | | | | | | | | | |
Clayton NM Jail Project Improvement & Refunding Bonds (Miscellaneous Revenue, National Insured) | | | 5.00 | % | | | 11-1-2028 | | | $ | 9,265,000 | | | $ | 11,199,717 | | | | 0.42 | % |
Other securities | | | | | | | | | | | | | | | 6,247,030 | | | | 0.23 | |
| | | | | |
| | | | | | | | | | | | | | | 17,446,747 | | | | 0.65 | |
| | | | | | | | | | | | | | | | | | | | |
| | | | | |
| New York: 10.92% | | | | | | | | | | | | | | | | | | | | |
Metropolitan Transportation Authority New York (Transportation Revenue) µ | | | 5.00-5.25 | | | | 11-15-2025 to 11-15-2031 | | | | 20,450,000 | | | | 25,835,815 | | | | 0.96 | |
Metropolitan Transportation Authority New York Series C (Transportation Revenue) | | | 5.25 | | | | 11-15-2029 | | | | 11,100,000 | | | | 14,417,568 | | | | 0.54 | |
Metropolitan Transportation Authority New York Series C (Transportation Revenue) | | | 5.25 | | | | 11-15-2030 | | | | 8,350,000 | | | | 10,824,773 | | | | 0.40 | |
New York Convention Center Development Corporation (Tax Revenue) | | | 5.00 | | | | 11-15-2028 | | | | 8,000,000 | | | | 10,219,040 | | | | 0.38 | |
New York NY Municipal Water Finance Authority Series AA-2 (Water & Sewer Revenue, Dexia Credit Local SPA) ø | | | 0.50 | | | | 6-15-2032 | | | | 15,475,000 | | | | 15,475,000 | | | | 0.58 | |
New York NY Series J-4 (GO Revenue) ± | | | 0.96 | | | | 8-1-2025 | | | | 10,000,000 | | | | 10,000,300 | | | | 0.37 | |
New York NY Sub Series H-5 (GO Revenue, Dexia Credit Local LOC) ø | | | 0.60 | | | | 3-1-2034 | | | | 16,660,000 | | | | 16,660,000 | | | | 0.62 | |
New York NY Transitional Finance Authority Sub Series 2B (Tax Revenue, Dexia Credit Local SPA) ø## | | | 0.56 | | | | 11-1-2022 | | | | 23,400,000 | | | | 23,400,000 | | | | 0.87 | |
New York Urban Development Corporation Certificate of Participation James A Farley Post Office Project (Miscellaneous Revenue) 144A | | | 4.20 | | | | 2-1-2017 | | | | 14,940,000 | | | | 14,945,976 | | | | 0.56 | |
Suffolk County NY TAN (GO Revenue) ## | | | 2.00 | | | | 7-27-2016 | | | | 20,855,000 | | | | 20,875,438 | | | | 0.78 | |
Other securities | | | | | | | | | | | | | | | 129,715,891 | | | | 4.86 | |
| | | | | |
| | | | | | | | | | | | | | | 292,369,801 | | | | 10.92 | |
| | | | | | | | | | | | | | | | | | | | |
| | | | | |
| North Carolina: 0.60% | | | | | | | | | | | | | | | | | | | | |
Other securities | | | | | | | | | | | | | | | 16,044,558 | | | | 0.60 | |
| | | | | | | | | | | | | | | | | | | | |
| | | | | |
| North Dakota: 0.18% | | | | | | | | | | | | | | | | | | | | |
Other securities | | | | | | | | | | | | | | | 4,711,677 | | | | 0.18 | |
| | | | | | | | | | | | | | | | | | | | |
| | | | | |
| Ohio: 2.43% | | | | | | | | | | | | | | | | | | | | |
Ohio Water Development Authority Pollution Control First Energy Nuclear Generation Project Series A (Water & Sewer Revenue) ± | | | 3.75 | | | | 6-1-2033 | | | | 10,000,000 | | | | 10,278,900 | | | | 0.38 | |
Ohio Water Development Authority Series A (Industrial Development Revenue) ± | | | 3.75 | | | | 7-1-2033 | | | | 15,000,000 | | | | 15,427,050 | | | | 0.58 | |
Other securities | | | | | | | | | | | | | | | 39,446,522 | | | | 1.47 | |
| | | | | |
| | | | | | | | | | | | | | | 65,152,472 | | | | 2.43 | |
| | | | | | | | | | | | | | | | | | | | |
| | | | | |
| Oklahoma: 1.88% | | | | | | | | | | | | | | | | | | | | |
Other securities | | | | | | | | | | | | | | | 50,286,783 | | | | 1.88 | |
| | | | | | | | | | | | | | | | | | | | |
| | | | | |
| Oregon: 0.05% | | | | | | | | | | | | | | | | | | | | |
Other securities | | | | | | | | | | | | | | | 1,312,992 | | | | 0.05 | |
| | | | | | | | | | | | | | | | | | | | |
The accompanying notes are an integral part of these financial statements.
| | | | | | |
| Summary portfolio of investments—June 30, 2016 | | Wells Fargo Intermediate Tax/AMT-Free Fund | | | 13 | |
| | | | | | | | | | | | | | | | | | | | |
| Security name | | Interest rate | | | Maturity date | | | Principal | | | Value | | | Percent of
net assets | |
| | | | | |
| Pennsylvania: 8.19% | | | | | | | | | | | | | | | | | | | | |
Berks County PA Municipal Authority Reading Hospital & Medical Center Project Series B (Health Revenue) ± | | | 1.93 | % | | | 11-1-2039 | | | $ | 10,000,000 | | | $ | 10,079,100 | | | | 0.38 | % |
Pennsylvania Public School Building Authority Series A (Miscellaneous Revenue, AGM Insured) %% | | | 5.00 | | | | 12-1-2030 | | | | 8,300,000 | | | | 10,243,694 | | | | 0.38 | |
Pennsylvania Turnpike Commission Sub Series B (Transportation Revenue) | | | 5.00 | | | | 6-1-2029 | | | | 10,000,000 | | | | 12,276,200 | | | | 0.46 | |
Other securities | | | | | | | | | | | | | | | 186,708,743 | | | | 6.97 | |
| | | | | |
| | | | | | | | | | | | | | | 219,307,737 | | | | 8.19 | |
| | | | | | | | | | | | | | | | | | | | |
| | | | | |
| Puerto Rico: 0.05% | | | | | | | | | | | | | | | | | | | | |
Other securities | | | | | | | | | | | | | | | 1,350,135 | | | | 0.05 | |
| | | | | | | | | | | | | | | | | | | | |
| | | | | |
| Rhode Island: 0.18% | | | | | | | | | | | | | | | | | | | | |
Other securities | | | | | | | | | | | | | | | 4,722,369 | | | | 0.18 | |
| | | | | | | | | | | | | | | | | | | | |
| | | | | |
| South Carolina: 1.36% | | | | | | | | | | | | | | | | | | | | |
South Carolina Public Service Authority Series A (Utilities Revenue) | | | 5.00 | | | | 12-1-2037 | | | | 12,215,000 | | | | 15,015,380 | | | | 0.56 | |
Other securities | | | | | | | | | | | | | | | 21,333,832 | | | | 0.80 | |
| | | | | |
| | | | | | | | | | | | | | | 36,349,212 | | | | 1.36 | |
| | | | | | | | | | | | | | | | | | | | |
| | | | | |
| South Dakota: 0.04% | | | | | | | | | | | | | | | | | | | | |
Other securities | | | | | | | | | | | | | | | 1,035,083 | | | | 0.04 | |
| | | | | | | | | | | | | | | | | | | | |
| | | | | |
| Tennessee: 0.34% | | | | | | | | | | | | | | | | | | | | |
Other securities | | | | | | | | | | | | | | | 9,063,211 | | | | 0.34 | |
| | | | | | | | | | | | | | | | | | | | |
| | | | | |
| Texas: 9.69% | | | | | | | | | | | | | | | | | | | | |
Cypress-Fairbanks TX Independent School District Series B-2 (GO Revenue) ± | | | 3.00 | | | | 2-15-2040 | | | | 11,010,000 | | | | 11,493,779 | | | | 0.43 | |
Harris County TX Refunding Bond Series A (GO Revenue) | | | 5.00 | | | | 10-1-2025 | | | | 8,445,000 | | | | 10,763,068 | | | | 0.40 | |
Port Arthur TX Navigation District Jefferson County Environmental Facilities Motiva Enterprises LLC Project Series B (Resource Recovery Revenue) ø | | | 0.54 | | | | 12-1-2039 | | | | 15,000,000 | | | | 15,000,000 | | | | 0.56 | |
Port Arthur TX Navigation District Jefferson County Environmental Facilities Motiva Enterprises LLC Project Series C (Resource Recovery Revenue) ø | | | 0.54 | | | | 12-1-2039 | | | | 14,600,000 | | | | 14,600,000 | | | | 0.55 | |
Other securities | | | | | | | | | | | | | | | 207,577,704 | | | | 7.75 | |
| | | | | |
| | | | | | | | | | | | | | | 259,434,551 | | | | 9.69 | |
| | | | | | | | | | | | | | | | | | | | |
| | | | | |
| Utah: 0.17% | | | | | | | | | | | | | | | | | | | | |
Other securities | | | | | | | | | | | | | | | 4,422,423 | | | | 0.17 | |
| | | | | | | | | | | | | | | | | | | | |
| | | | | |
| Virgin Islands: 0.29% | | | | | | | | | | | | | | | | | | | | |
Other securities | | | | | | | | | | | | | | | 7,889,696 | | | | 0.29 | |
| | | | | | | | | | | | | | | | | | | | |
| | | | | |
| Virginia: 1.63% | | | | | | | | | | | | | | | | | | | | |
Virginia College Building Authority Educational Facilities Series A (Education Revenue) %% | | | 3.00 | | | | 9-1-2025 | | | | 13,630,000 | | | | 15,303,219 | | | | 0.57 | |
The accompanying notes are an integral part of these financial statements.
| | | | |
| 14 | | Wells Fargo Intermediate Tax/AMT-Free Fund | | Summary portfolio of investments—June 30, 2016 |
| | | | | | | | | | | | | | | | | | | | |
| Security name | | Interest rate | | | Maturity date | | | Principal | | | Value | | | Percent of
net assets | |
| | | | | |
| Virginia (continued) | | | | | | | | | | | | | | | | | | | | |
Virginia Public School Authority Special Obligation Financing & Refunding Bond (Miscellaneous Revenue) | | | 5.00 | % | | | 8-1-2026 | | | $ | 10,000,000 | | | $ | 13,332,800 | | | | 0.50 | % |
Other securities | | | | | | | | | | | | | | | 15,073,487 | | | | 0.56 | |
| | | | | |
| | | | | | | | | | | | | | | 43,709,506 | | | | 1.63 | |
| | | | | | | | | | | | | | | | | | | | |
| | | | | |
| Washington: 2.85% | | | | | | | | | | | | | | | | | | | | |
Washington Various Purpose Refunding Bond Series B (GO Revenue) | | | 5.00 | | | | 7-1-2025 | | | | 8,000,000 | | | | 10,338,160 | | | | 0.39 | |
Other securities | | | | | | | | | | | | | | | 66,061,016 | | | | 2.46 | |
| | | | | |
| | | | | | | | | | | | | | | 76,399,176 | | | | 2.85 | |
| | | | | | | | | | | | | | | | | | | | |
| | | | | |
| West Virginia: 0.28% | | | | | | | | | | | | | | | | | | | | |
Other securities | | | | | | | | | | | | | | | 7,384,543 | | | | 0.28 | |
| | | | | | | | | | | | | | | | | | | | |
| | | | | |
| Wisconsin: 0.68% | | | | | | | | | | | | | | | | | | | | |
Other securities | | | | | | | | | | | | | | | 18,199,742 | | | | 0.68 | |
| | | | | | | | | | | | | | | | | | | | |
| Total Municipal Obligations (Cost $2,552,799,827) | | | | | | | | | | | | | | | 2,704,777,725 | | | | 101.06 | |
| | | | | | | | | | | | | | | | | | | | |
| | | | | |
| | | Yield | | | | | | Shares | | | | | | | |
| Short-Term Investments: 0.76% | | | | | | | | | | | | | | | | | | | | |
| | | | | |
| Investment Companies: 0.74% | | | | | | | | | | | | | | | | | | | | |
Wells Fargo National Tax-Free Money Market Fund Premier Class ##(l)(u) | | | 0.27 | | | | | | | | 19,871,388 | | | | 19,871,388 | | | | 0.74 | |
| | | | | |
| | | | | | | | | Principal | | | | | | | |
| U.S. Treasury Securities: 0.02% | | | | | | | | | | | | | | | | | | | | |
Treasury Bill (z)# | | | 0.22 | | | | 9-15-2016 | | | $ | 500,000 | | | | 499,772 | | | | 0.02 | |
| Total Short-Term Investments (Cost $20,371,151) | | | | | | | | | | | | | | | 20,371,160 | | | | 0.76 | |
| | | | | | | | | | | | | | | | | | | | |
| | | | | |
Total investments in securities
(Cost $2,573,170,978) * | | | | | | | | | | | | | | | 2,725,148,885 | | | | 101.82 | |
Other assets and liabilities, net | | | | | | | | | | | | | | | (48,712,056 | ) | | | (1.82 | ) |
| | | | | | | | | | | | | | | | | | | | |
| Total net assets | | | | | | | | | | | | | | $ | 2,676,436,829 | | | | 100.00 | % |
| | | | | | | | | | | | | | | | | | | | |
| ± | Variable rate investment. The rate shown is the rate in effect at period end. |
| 144A | The security may be resold in transactions exempt from registration, normally to qualified institutional buyers, pursuant to Rule 144A under the Securities Act of 1933. |
| ø | Variable rate demand notes are subject to a demand feature which reduces the effective maturity. The maturity date shown represents the final maturity date of the security. The interest rate is determined and reset by the issuer daily, weekly, or monthly depending upon the terms of the security. The rate shown is the rate in effect at period end. |
| %% | The security is issued on a when-issued basis. |
| µ | All or some of these obligations have credit enhancements or liquidity features that may, under certain circumstances, provide for repayment of principal and interest. |
| ## | All or a portion of this security is segregated for when-issued securities. |
| (l) | The issuer of the security is an affiliated person of the Fund as defined in the Investment Company Act of 1940. |
| (u) | The rate represents the 7-day annualized yield at period end. |
| (z) | Zero coupon security. The rate represents the current yield to maturity. |
| # | All or a portion of this security is segregated as collateral for investments in derivative instruments. |
| * | Cost for federal income tax purposes is $2,573,233,309 and unrealized gains (losses) consists of: |
| | | | |
Gross unrealized gains | | $ | 156,105,295 | |
Gross unrealized losses | | | (4,189,719 | ) |
| | | | |
Net unrealized gains | | $ | 151,915,576 | |
The accompanying notes are an integral part of these financial statements.
| | | | | | |
| Statement of assets and liabilities—June 30, 2016 | | Wells Fargo Intermediate Tax/AMT-Free Fund | | | 15 | |
| | | | |
| | | | |
| |
Assets | | | | |
Investments | | | | |
In unaffiliated securities, at value (cost $2,553,299,590) | | $ | 2,705,277,497 | |
In affiliated securities, at value (cost $19,871,388) | | | 19,871,388 | |
| | | | |
Total investments, at value (cost $2,573,170,978) | | | 2,725,148,885 | |
Cash | | | 356,063 | |
Receivable for investments sold | | | 36,444,144 | |
Receivable for Fund shares sold | | | 2,866,166 | |
Receivable for interest | | | 25,559,133 | |
Prepaid expenses and other assets | | | 85,172 | |
| | | | |
Total assets | | | 2,790,459,563 | |
| | | | |
| |
Liabilities | | | | |
Dividends payable | | | 1,235,146 | |
Payable for investments purchased | | | 107,313,784 | |
Payable for Fund shares redeemed | | | 4,158,683 | |
Payable for daily variation margin on open futures contracts | | | 38,081 | |
Management fee payable | | | 643,226 | |
Distribution fee payable | | | 34,825 | |
Administration fees payable | | | 227,443 | |
Accrued expenses and other liabilities | | | 371,546 | |
| | | | |
Total liabilities | | | 114,022,734 | |
| | | | |
Total net assets | | $ | 2,676,436,829 | |
| | | | |
| |
NET ASSETS CONSIST OF | | | | |
Paid-in capital | | $ | 2,522,494,283 | |
Overdistributed net investment income | | | (52,331 | ) |
Accumulated net realized gains on investments | | | 1,977,961 | |
Net unrealized gains on investments | | | 152,016,916 | |
| | | | |
Total net assets | | $ | 2,676,436,829 | |
| | | | |
| |
COMPUTATION OF NET ASSET VALUE AND OFFERING PRICE PER SHARE | | | | |
Net assets – Class A | | $ | 556,672,587 | |
Shares outstanding – Class A1 | | | 46,816,676 | |
Net asset value per share – Class A | | | $11.89 | |
Maximum offering price per share – Class A2 | | | $12.26 | |
Net assets – Class C | | $ | 56,600,877 | |
Shares outstanding – Class C1 | | | 4,760,205 | |
Net asset value per share – Class C | | | $11.89 | |
Net assets – Administrator Class | | $ | 802,527,153 | |
Shares outstanding – Administrator Class1 | | | 67,451,075 | |
Net asset value per share – Administrator Class | | | $11.90 | |
Net assets – Institutional Class | | $ | 1,260,636,212 | |
Shares outstanding – Institutional Class1 | | | 105,881,870 | |
Net asset value per share – Institutional Class | | | $11.91 | |
| 1 | The Fund has an unlimited number of authorized shares. |
| 2 | Maximum offering price is computed as 100/97 of net asset value. On investments of $50,000 or more, the offering price is reduced. |
The accompanying notes are an integral part of these financial statements.
| | | | |
| 16 | | Wells Fargo Intermediate Tax/AMT-Free Fund | | Statement of operations—June 30, 2016 |
| | | | |
| | | | |
| |
Investment income | | | | |
Interest | | $ | 72,161,645 | |
Income from affiliated securities | | | 21,862 | |
| | | | |
Total investment income | | | 72,183,507 | |
| | | | |
| |
Expenses | | | | |
Management fee | | | 9,001,446 | |
Administration fees | |
Class A | | | 742,329 | |
Class C | | | 90,350 | |
Administrator Class | | | 764,986 | |
Institutional Class | | | 836,950 | |
Investor Class | | | 252,894 | 1 |
Shareholder servicing fees | |
Class A | | | 1,159,225 | |
Class C | | | 141,171 | |
Administrator Class | | | 1,912,464 | |
Investor Class | | | 332,755 | 1 |
Distribution fee | |
Class C | | | 423,513 | |
Custody and accounting fees | | | 136,302 | |
Professional fees | | | 53,725 | |
Registration fees | | | 162,943 | |
Shareholder report expenses | | | 119,938 | |
Trustees’ fees and expenses | | | 23,768 | |
Other fees and expenses | | | 24,302 | |
| | | | |
Total expenses | | | 16,179,061 | |
Less: Fee waivers and/or expense reimbursements | | | (1,936,534 | ) |
| | | | |
Net expenses | | | 14,242,527 | |
| | | | |
Net investment income | | | 57,940,980 | |
| | | | |
| |
REALIZED AND UNREALIZED GAINS (LOSSES) ON INVESTMENTS | | | | |
| |
Net realized gains on investments | | | 2,232,112 | |
|
Net change in unrealized gains (losses) on: | |
Unaffiliated securities | | | 86,223,661 | |
Futures transactions | | | 39,009 | |
| | | | |
Net change in unrealized gains (losses) on investments | | | 86,262,670 | |
| | | | |
Net realized and unrealized gains (losses) on investments | | | 88,494,782 | |
| | | | |
Net increase in net assets resulting from operations | | $ | 146,435,762 | |
| | | | |
| 1 | For the period from July 1, 2015 to October 23, 2015. Effective at the close of business on October 23, 2015, Investor Class shares were converted to Class A shares and are no longer offered by the Fund. |
The accompanying notes are an integral part of these financial statements.
| | | | | | |
| Statement of changes in net assets | | Wells Fargo Intermediate Tax/AMT-Free Fund | | | 17 | |
| | | | | | | | | | | | | | | | |
| | | Year ended
June 30, 2016 | | | Year ended
June 30, 2015 | |
| |
Operations | | | | | |
Net investment income | | | | | | $ | 57,940,980 | | | | | | | $ | 51,156,829 | |
Net realized gains on investments | | | | | | | 2,232,112 | | | | | | | | 6,324,555 | |
Net change in unrealized gains (losses) on investments | | | | | | | 86,262,670 | | | | | | | | (20,839,190 | ) |
| | | | |
Net increase in net assets resulting from operations | | | | | | | 146,435,762 | | | | | | | | 36,642,194 | |
| | | | |
| |
Distributions to shareholders from | | | | | |
Net investment income | |
Class A | | | | | | | (10,348,026 | ) | | | | | | | (4,728,054 | ) |
Class C | | | | | | | (835,135 | ) | | | | | | | (830,216 | ) |
Administrator Class | | | | | | | (17,804,373 | ) | | | | | | | (16,785,583 | ) |
Institutional Class | | | | | | | (26,049,426 | ) | | | | | | | (19,241,370 | ) |
Investor Class | | | | | | | (2,904,150 | )1 | | | | | | | (9,569,866 | ) |
| | | | |
Total distributions to shareholders | | | | | | | (57,941,110 | ) | | | | | | | (51,155,089 | ) |
| | | | |
| | | | |
Capital share transactions | | | Shares | | | | | | | | Shares | | | | | |
Proceeds from shares sold | | | | | | | | | | | | | | | | |
Class A | | | 39,565,308 | | | | 458,186,456 | | | | 5,045,158 | | | | 58,687,151 | |
Class C | | | 603,319 | | | | 7,044,101 | | | | 960,317 | | | | 11,184,212 | |
Administrator Class | | | 20,607,008 | | | | 240,192,483 | | | | 21,365,779 | | | | 248,531,364 | |
Institutional Class | | | 52,291,609 | | | | 610,662,188 | | | | 43,496,123 | | | | 505,863,626 | |
Investor Class | | | 1,416,573 | 1 | | | 16,288,070 | 1 | | | 7,046,199 | | | | 81,897,022 | |
| | | | |
| | | | | | | 1,332,373,298 | | | | | | | | 906,163,375 | |
| | | | |
Reinvestment of distributions | |
Class A | | | 848,840 | | | | 9,927,258 | | | | 382,977 | | | | 4,450,514 | |
Class C | | | 63,902 | | | | 745,237 | | | | 62,813 | | | | 729,984 | |
Administrator Class | | | 1,448,279 | | | | 16,905,947 | | | | 1,357,124 | | | | 15,782,218 | |
Institutional Class | | | 1,258,565 | | | | 14,714,093 | | | | 929,789 | | | | 10,821,859 | |
Investor Class | | | 195,909 | 1 | | | 2,256,316 | 1 | | | 808,378 | | | | 9,391,930 | |
| | | | |
| | | | | | | 44,548,851 | | | | | | | | 41,176,505 | |
| | | | |
Payment for shares redeemed | |
Class A | | | (12,323,773 | ) | | | (144,035,345 | ) | | | (9,666,672 | ) | | | (111,817,381 | ) |
Class C | | | (848,510 | ) | | | (9,891,073 | ) | | | (1,075,380 | ) | | | (12,489,765 | ) |
Administrator Class | | | (21,996,551 | ) | | | (255,465,209 | ) | | | (13,275,704 | ) | | | (154,374,644 | ) |
Institutional Class | | | (24,133,951 | ) | | | (281,891,835 | ) | | | (19,902,760 | ) | | | (231,743,877 | ) |
Investor Class | | | (39,753,597 | )1 | | | (459,096,510 | )1 | | | (8,797,973 | ) | | | (102,040,606 | ) |
| | | | |
| | | | | | | (1,150,379,972 | ) | | | | | | | (612,466,273 | ) |
| | | | |
Net increase in net assets resulting from capital share transactions | | | | | | | 226,542,177 | | | | | | | | 334,873,607 | |
| | | | |
Total increase in net assets | | | | | | | 315,036,829 | | | | | | | | 320,360,712 | |
| | | | |
| | |
Net assets | | | | | | | | |
Beginning of period | | | | | | | 2,361,400,000 | | | | | | | | 2,041,039,288 | |
| | | | |
End of period | | | | | | $ | 2,676,436,829 | | | | | | | $ | 2,361,400,000 | |
| | | | |
Overdistributed net investment income | | | | | | $ | (52,331 | ) | | | | | | $ | (52,201 | ) |
| | | | |
| 1 | For the period from July 1, 2015 to October 23, 2015. Effective at the close of business on October 23, 2015, Investor Class shares were converted to Class A shares and are no longer offered by the Fund. |
The accompanying notes are an integral part of these financial statements.
| | | | |
| 18 | | Wells Fargo Intermediate Tax/AMT-Free Fund | | Financial highlights |
(For a share outstanding throughout each period)
| | | | | | | | | | | | | | | | | | | | |
| | | Year ended June 30 | |
| CLASS A | | 2016 | | | 2015 | | | 2014 | | | 2013 | | | 2012 | |
Net asset value, beginning of period | | | $11.47 | | | | $11.53 | | | | $11.31 | | | | $11.53 | | | | $10.94 | |
Net investment income | | | 0.26 | | | | 0.25 | | | | 0.30 | | | | 0.28 | | | | 0.35 | |
Net realized and unrealized gains (losses) on investments | | | 0.42 | | | | (0.06 | ) | | | 0.29 | | | | (0.18 | ) | | | 0.59 | |
| | | | | | | | | | | | | | | | | | | | |
Total from investment operations | | | 0.68 | | | | 0.19 | | | | 0.59 | | | | 0.10 | | | | 0.94 | |
Distributions to shareholders from | | | | | | | | | | | | | | | | | | | | |
Net investment income | | | (0.26 | ) | | | (0.25 | ) | | | (0.30 | ) | | | (0.28 | ) | | | (0.35 | ) |
Net realized gains | | | 0.00 | | | | 0.00 | | | | (0.07 | ) | | | (0.04 | ) | | | (0.00 | )1 |
| | | | | | | | | | | | | | | | | | | | |
Total distributions to shareholders | | | (0.26 | ) | | | (0.25 | ) | | | (0.37 | ) | | | (0.32 | ) | | | (0.35 | ) |
Net asset value, end of period | | | $11.89 | | | | $11.47 | | | | $11.53 | | | | $11.31 | | | | $11.53 | |
Total return2 | | | 5.99 | % | | | 1.68 | % | | | 5.37 | % | | | 0.82 | % | | | 8.71 | % |
Ratios to average net assets (annualized) | | | | | | | | | | | | | | | | | | | | |
Gross expenses | | | 0.80 | % | | | 0.80 | % | | | 0.81 | % | | | 0.80 | % | | | 0.81 | % |
Net expenses | | | 0.70 | % | | | 0.70 | % | | | 0.70 | % | | | 0.70 | % | | | 0.70 | % |
Net investment income | | | 2.23 | % | | | 2.19 | % | | | 2.66 | % | | | 2.36 | % | | | 3.07 | % |
Supplemental data | | | | | | | | | | | | | | | | | | | | |
Portfolio turnover rate | | | 14 | % | | | 38 | % | | | 29 | % | | | 24 | % | | | 38 | % |
Net assets, end of period (000s omitted) | | | $556,673 | | | | $214,880 | | | | $264,796 | | | | $289,931 | | | | $307,991 | |
| 1 | Amount is less than $0.005. |
| 2 | Total return calculations do not include any sales charges. |
The accompanying notes are an integral part of these financial statements.
| | | | | | |
| Financial highlights | | Wells Fargo Intermediate Tax/AMT-Free Fund | | | 19 | |
(For a share outstanding throughout each period)
| | | | | | | | | | | | | | | | | | | | |
| | | Year ended June 30 | |
| CLASS C | | 2016 | | | 2015 | | | 2014 | | | 2013 | | | 2012 | |
Net asset value, beginning of period | | | $11.47 | | | | $11.53 | | | | $11.31 | | | | $11.53 | | | | $10.94 | |
Net investment income | | | 0.17 | | | | 0.17 | | | | 0.22 | | | | 0.19 | | | | 0.27 | |
Net realized and unrealized gains (losses) on investments | | | 0.42 | | | | (0.06 | ) | | | 0.29 | | | | (0.18 | ) | | | 0.59 | |
| | | | | | | | | | | | | | | | | | | | |
Total from investment operations | | | 0.59 | | | | 0.11 | | | | 0.51 | | | | 0.01 | | | | 0.86 | |
Distributions to shareholders from | | | | | | | | | | | | | | | | | | | | |
Net investment income | | | (0.17 | ) | | | (0.17 | ) | | | (0.22 | ) | | | (0.19 | ) | | | (0.27 | ) |
Net realized gains | | | 0.00 | | | | 0.00 | | | | (0.07 | ) | | | (0.04 | ) | | | (0.00 | )1 |
| | | | | | | | | | | | | | | | | | | | |
Total distributions to shareholders | | | (0.17 | ) | | | (0.17 | ) | | | (0.29 | ) | | | (0.23 | ) | | | (0.27 | ) |
Net asset value, end of period | | | $11.89 | | | | $11.47 | | | | $11.53 | | | | $11.31 | | | | $11.53 | |
Total return2 | | | 5.20 | % | | | 0.92 | % | | | 4.59 | % | | | 0.07 | % | | | 7.90 | % |
Ratios to average net assets (annualized) | | | | | | | | | | | | | | | | | | | | |
Gross expenses | | | 1.55 | % | | | 1.55 | % | | | 1.56 | % | | | 1.55 | % | | | 1.56 | % |
Net expenses | | | 1.45 | % | | | 1.45 | % | | | 1.45 | % | | | 1.45 | % | | | 1.45 | % |
Net investment income | | | 1.48 | % | | | 1.44 | % | | | 1.92 | % | | | 1.61 | % | | | 2.32 | % |
Supplemental data | | | | | | | | | | | | | | | | | | | | |
Portfolio turnover rate | | | 14 | % | | | 38 | % | | | 29 | % | | | 24 | % | | | 38 | % |
Net assets, end of period (000s omitted) | | | $56,601 | | | | $56,703 | | | | $57,580 | | | | $72,106 | | | | $67,598 | |
| 1 | Amount is less than $0.005. |
| 2 | Total return calculations do not include any sales charges. |
The accompanying notes are an integral part of these financial statements.
| | | | |
| 20 | | Wells Fargo Intermediate Tax/AMT-Free Fund | | Financial highlights |
(For a share outstanding throughout each period)
| | | | | | | | | | | | | | | | | | | | |
| | | Year ended June 30 | |
| ADMINISTRATOR CLASS | | 2016 | | | 2015 | | | 2014 | | | 2013 | | | 2012 | |
Net asset value, beginning of period | | | $11.48 | | | | $11.54 | | | | $11.32 | | | | $11.54 | | | | $10.95 | |
Net investment income | | | 0.27 | | | | 0.27 | | | | 0.31 | | | | 0.29 | | | | 0.36 | |
Net realized and unrealized gains (losses) on investments | | | 0.42 | | | | (0.06 | ) | | | 0.29 | | | | (0.18 | ) | | | 0.59 | |
| | | | | | | | | | | | | | | | | | | | |
Total from investment operations | | | 0.69 | | | | 0.21 | | | | 0.60 | | | | 0.11 | | | | 0.95 | |
Distributions to shareholders from | | | | | | | | | | | | | | | | | | | | |
Net investment income | | | (0.27 | ) | | | (0.27 | ) | | | (0.31 | ) | | | (0.29 | ) | | | (0.36 | ) |
Net realized gains | | | 0.00 | | | | 0.00 | | | | (0.07 | ) | | | (0.04 | ) | | | (0.00 | )1 |
| | | | | | | | | | | | | | | | | | | | |
Total distributions to shareholders | | | (0.27 | ) | | | (0.27 | ) | | | (0.38 | ) | | | (0.33 | ) | | | (0.36 | ) |
Net asset value, end of period | | | $11.90 | | | | $11.48 | | | | $11.54 | | | | $11.32 | | | | $11.54 | |
Total return | | | 6.09 | % | | | 1.78 | % | | | 5.47 | % | | | 0.92 | % | | | 8.81 | % |
Ratios to average net assets (annualized) | | | | | | | | | | | | | | | | | | | | |
Gross expenses | | | 0.74 | % | | | 0.74 | % | | | 0.75 | % | | | 0.74 | % | | | 0.75 | % |
Net expenses | | | 0.60 | % | | | 0.60 | % | | | 0.60 | % | | | 0.60 | % | | | 0.60 | % |
Net investment income | | | 2.33 | % | | | 2.29 | % | | | 2.76 | % | | | 2.46 | % | | | 3.18 | % |
Supplemental data | | | | | | | | | | | | | | | | | | | | |
Portfolio turnover rate | | | 14 | % | | | 38 | % | | | 29 | % | | | 24 | % | | | 38 | % |
Net assets, end of period (000s omitted) | | | $802,527 | | | | $773,770 | | | | $668,517 | | | | $621,627 | | | | $494,528 | |
| 1 | Amount is less than $0.005. |
The accompanying notes are an integral part of these financial statements.
| | | | | | |
| Financial highlights | | Wells Fargo Intermediate Tax/AMT-Free Fund | | | 21 | |
(For a share outstanding throughout each period)
| | | | | | | | | | | | | | | | | | | | |
| | | Year ended June 30 | |
| INSTITUTIONAL CLASS | | 2016 | | | 2015 | | | 2014 | | | 2013 | | | 2012 | |
Net asset value, beginning of period | | | $11.49 | | | | $11.55 | | | | $11.32 | | | | $11.54 | | | | $10.96 | |
Net investment income | | | 0.29 | | | | 0.29 | | | | 0.33 | | | | 0.31 | | | | 0.38 | |
Net realized and unrealized gains (losses) on investments | | | 0.42 | | | | (0.06 | ) | | | 0.30 | | | | (0.18 | ) | | | 0.58 | |
| | | | | | | | | | | | | | | | | | | | |
Total from investment operations | | | 0.71 | | | | 0.23 | | | | 0.63 | | | | 0.13 | | | | 0.96 | |
Distributions to shareholders from | | | | | | | | | | | | | | | | | | | | |
Net investment income | | | (0.29 | ) | | | (0.29 | ) | | | (0.33 | ) | | | (0.31 | ) | | | (0.38 | ) |
Net realized gains | | | 0.00 | | | | 0.00 | | | | (0.07 | ) | | | (0.04 | ) | | | (0.00 | )1 |
| | | | | | | | | | | | | | | | | | | | |
Total distributions to shareholders | | | (0.29 | ) | | | (0.29 | ) | | | (0.40 | ) | | | (0.35 | ) | | | (0.38 | ) |
Net asset value, end of period | | | $11.91 | | | | $11.49 | | | | $11.55 | | | | $11.32 | | | | $11.54 | |
Total return | | | 6.26 | % | | | 1.97 | % | | | 5.75 | % | | | 1.10 | % | | | 8.91 | % |
Ratios to average net assets (annualized) | | | | | | | | | | | | | | | | | | | | |
Gross expenses | | | 0.47 | % | | | 0.47 | % | | | 0.48 | % | | | 0.48 | % | | | 0.49 | % |
Net expenses | | | 0.44 | % | | | 0.42 | % | | | 0.42 | % | | | 0.42 | % | | | 0.42 | % |
Net investment income | | | 2.49 | % | | | 2.47 | % | | | 2.94 | % | | | 2.65 | % | | | 3.32 | % |
Supplemental data | | | | | | | | | | | | | | | | | | | | |
Portfolio turnover rate | | | 14 | % | | | 38 | % | | | 29 | % | | | 24 | % | | | 38 | % |
Net assets, end of period (000s omitted) | | | $1,260,636 | | | | $878,585 | | | | $599,686 | | | | $461,403 | | | | $326,772 | |
| 1 | Amount is less than $0.005. |
The accompanying notes are an integral part of these financial statements.
| | | | |
| 22 | | Wells Fargo Intermediate Tax/AMT-Free Fund | | Notes to financial statements |
1. ORGANIZATION
Wells Fargo Funds Trust (the “Trust”), a Delaware statutory trust organized on March 10, 1999, is an open-end management investment company registered under the Investment Company Act of 1940, as amended (the “1940 Act”). As an investment company, the Trust follows the accounting and reporting guidance in Financial Accounting Standards Board (“FASB”) Accounting Standards Codification Topic 946, Financial Services – Investment Companies. These financial statements report on the Wells Fargo Intermediate Tax/AMT-Free Fund (the “Fund”) which is a diversified series of the Trust.
Effective at the close of business on October 23, 2015, Investor Class shares became Class A shares in a tax-free conversion. Shareholders of Investor Class received Class A shares at a value equal to the value of their Investor Class shares immediately prior to the conversion. Investor Class shares are no longer offered by the Fund.
2. SIGNIFICANT ACCOUNTING POLICIES
The following significant accounting policies, which are consistently followed in the preparation of the financial statements of the Fund, are in conformity with U.S. generally accepted accounting principles which require management to make estimates and assumptions that affect the reported amounts of assets and liabilities, disclosure of contingent assets and liabilities at the date of the financial statements, and the reported amounts of revenues and expenses during the reporting period. Actual results could differ from those estimates.
Securities valuation
All investments are valued each business day as of the close of regular trading on the New York Stock Exchange (generally 4 p.m. Eastern Time), although the Fund may deviate from this calculation time under unusual or unexpected circumstances.
Debt securities are valued at the evaluated bid price provided by an independent pricing service or, if a reliable price is not available, the quoted bid price from an independent broker-dealer.
Futures that are listed on a foreign or domestic exchange or market are valued at the official closing price or, if none, the last sales price.
Investments in registered open-end investment companies are valued at net asset value.
Investments which are not valued using any of the methods discussed above are valued at their fair value, as determined in good faith by the Board of Trustees of the Fund. The Board of Trustees has established a Valuation Committee comprised of the Trustees and has delegated to it the authority to take any actions regarding the valuation of portfolio securities that the Valuation Committee deems necessary or appropriate, including determining the fair value of portfolio securities, unless the determination has been delegated to the Management Valuation Team of Wells Fargo Funds Management, LLC (“Funds Management”). The Board of Trustees retains the authority to make or ratify any valuation decisions or approve any changes to the Valuation Procedures as it deems appropriate. On a quarterly basis, the Board of Trustees receives reports on any valuation actions taken by the Valuation Committee or the Management Valuation Team which may include items for ratification.
Valuations of fair valued securities are compared to the next actual sales price when available, or other appropriate market values, to assess the continued appropriateness of the fair valuation methodologies used. These securities are fair valued on a day-to-day basis, taking into consideration changes to appropriate market information and any significant changes to the inputs considered in the valuation process until there is a readily available price provided on an exchange or by an independent pricing service. Valuations received from an independent pricing service or independent broker-dealer quotes are periodically validated by comparisons to most recent trades and valuations provided by other independent pricing services in addition to the review of prices by the manager and/or subadviser. Unobservable inputs used in determining fair valuations are identified based on the type of security, taking into consideration factors utilized by market participants in valuing the investment, knowledge about the issuer and the current market environment.
When-issued transactions
The Fund may purchase securities on a forward commitment or when-issued basis. The Fund records a when-issued transaction on the trade date and will segregate assets in an amount at least equal in value to the Fund’s commitment to purchase when-issued securities. Securities purchased on a when-issued basis are marked-to-market daily and the Fund begins earning interest on the settlement date. Losses may arise due to changes in the market value of the underlying securities or if the counterparty does not perform under the contract.
| | | | | | |
| Notes to financial statements | | Wells Fargo Intermediate Tax/AMT-Free Fund | | | 23 | |
Futures contracts
The Fund is subject to interest rate risk in the normal course of pursuing its investment objectives. The Fund may buy and sell futures contracts in order to gain exposure to, or protect against, changes in security values and interest rates. The primary risks associated with the use of futures contracts are the imperfect correlation between changes in market values of securities held by the Fund and the prices of futures contracts, and the possibility of an illiquid market.
The aggregate principal amounts of the contracts are not recorded in the financial statements. Fluctuations in the value of the contracts are recorded in the Statement of Assets and Liabilities as an asset or liability and in the Statement of Operations as unrealized gains or losses until the contracts are closed, at which point they are recorded as net realized gains or losses on futures contracts. With futures contracts, there is minimal counterparty risk to the Fund since futures are exchange traded and the exchange’s clearinghouse, as counterparty to all exchange traded futures, guarantees the futures against default.
Security transactions and income recognition
Securities transactions are recorded on a trade date basis. Realized gains or losses are recorded on the basis of identified cost.
Interest income is accrued daily and bond discounts are accreted and premiums are amortized daily based on the effective interest method. To the extent debt obligations are placed on non-accrual status, any related interest income may be reduced by writing off interest receivables when the collection of all or a portion of interest has become doubtful based on consistently applied procedures. If the issuer subsequently resumes interest payments or when the collectability of interest is reasonably assured, the debt obligation is removed from non-accrual status.
Distributions to shareholders
Distributions to shareholders from net investment income are accrued daily and paid monthly. Distributions from net realized gains, if any, are recorded on the ex-dividend date. Such distributions are determined in conformity with federal income tax regulations, which may differ in amount or character from net investment income and realized gains recognized for purposes of U.S. generally accepted accounting principles.
Federal and other taxes
The Fund intends to continue to qualify as a regulated investment company by distributing substantially all of its investment company taxable and tax-exempt income and any net realized capital gains (after reduction for capital loss carryforwards) sufficient to relieve it from all, or substantially all, federal income taxes. Accordingly, no provision for federal income taxes was required.
The Fund’s income and federal excise tax returns and all financial records supporting those returns for the prior three fiscal years are subject to examination by the federal and Delaware revenue authorities. Management has analyzed the Fund’s tax positions taken on federal, state, and foreign tax returns for all open tax years and does not believe that there are any uncertain tax positions that require recognition of a tax liability.
Class allocations
The separate classes of shares offered by the Fund differ principally in applicable sales charges, distribution, shareholder servicing, and administration fees. Class specific expenses are charged directly to that share class. Investment income, common expenses, and realized and unrealized gains (losses) on investments are allocated daily to each class of shares based on the relative proportion of net assets of each class.
3. FAIR VALUATION MEASUREMENTS
Fair value measurements of investments are determined within a framework that has established a fair value hierarchy based upon the various data inputs utilized in determining the value of the Fund’s investments. The three-level hierarchy gives the highest priority to unadjusted quoted prices in active markets for identical assets or liabilities (Level 1) and the lowest priority to significant unobservable inputs (Level 3). The Fund’s investments are classified within the fair value hierarchy based on the lowest level of input that is significant to the fair value measurement. The inputs are summarized into three broad levels as follows:
| n | | Level 1 – quoted prices in active markets for identical securities |
| n | | Level 2 – other significant observable inputs (including quoted prices for similar securities, interest rates, prepayment speeds, credit risk, use of amortized cost, etc.) |
| n | | Level 3 – significant unobservable inputs (including the Fund’s own assumptions in determining the fair value of investments) |
| | | | |
| 24 | | Wells Fargo Intermediate Tax/AMT-Free Fund | | Notes to financial statements |
The inputs or methodologies used for valuing investments in securities are not necessarily an indication of the risk associated with investing in those securities.
The following is a summary of the inputs used in valuing the Fund’s assets and liabilities as of June 30, 2016:
| | | | | | | | | | | | | | | | |
| | | Quoted prices
(Level 1) | | | Other significant
observable inputs
(Level 2) | | | Significant
unobservable inputs
(Level 3) | | | Total | |
Assets | | | | | | | | | | | | | | | | |
Investments in : | | | | | | | | | | | | | | | | |
| | | | |
Municipal obligations | | $ | 0 | | | $ | 2,704,777,725 | | | $ | 0 | | | $ | 2,704,777,725 | |
| | | | |
Short-term investments | | | | | | | | | | | | | | | | |
Investment companies | | | 19,871,388 | | | | 0 | | | | 0 | | | | 19,871,388 | |
U.S. Treasury securities | | | 499,772 | | | | 0 | | | | 0 | | | | 499,772 | |
Total assets | | $ | 20,371,160 | | | $ | 2,704,777,725 | | | $ | 0 | | | $ | 2,725,148,885 | |
Liabilities | | | | | | | | | | | | | | | | |
Futures contracts | | $ | 38,081 | | | $ | 0 | | | $ | 0 | | | $ | 38,081 | |
Total Liabilities | | $ | 38,081 | | | $ | 0 | | | $ | 0 | | | $ | 38,081 | |
Futures contracts are reported at their variation margin at measurement date, which represents the amount due from the Fund at that date. All other assets and liabilities are reported at their market value at measurement date.
The Fund recognizes transfers between levels within the fair value hierarchy at the end of the reporting period. At June 30, 2016, the Fund did not have any transfers into/out of Level 1. The Fund had no material transfers between Level 2 and Level 3.
4. TRANSACTIONS WITH AFFILIATES
Management fee
Funds Management, an indirect wholly owned subsidiary of Wells Fargo & Company (“Wells Fargo”), is the manager of the Fund and provides advisory and fund-level administrative services under an investment management agreement. Under the investment management agreement, Funds Management is responsible for, among other services, implementing the investment objectives and strategies of the Fund, supervising the subadviser, providing fund-level administrative services in connection with the Fund’s operations, and providing any other fund-level administrative services reasonably necessary for the operation of the Fund. As compensation for its services under the investment management agreement, Funds Management is entitled to receive an annual management fee starting at 0.40% and declining to 0.28% as the average daily net assets of the Fund increase. For the year ended June 30, 2016, the management fee was equivalent to an annual rate of 0.37% of the Fund’s average daily net assets.
Funds Management has retained the services of a subadviser to provide daily portfolio management to the Fund. The fee for subadvisory services is borne by Funds Management. Wells Capital Management Incorporated, an affiliate of Funds Management and an indirect wholly owned subsidiary of Wells Fargo, is subadviser to the Fund and is entitled to receive a fee from Funds Management at an annual rate starting at 0.20% and declining to 0.10% as the average daily net assets of the Fund increase.
Administration fees
Under a class-level administration agreement, Funds Management provides class-level administrative services to the Fund, which includes paying fees and expenses for services provided by the transfer agent, sub-transfer agents, omnibus account servicers and record-keepers. As compensation for its services under the class-level administration agreement, Funds Management receives an annual fee which is calculated based on the average daily net assets of each class as follows:
| | | | |
| | | Class-level
administration fee | |
Class A, Class C | | | 0.16 | % |
Administrator Class | | | 0.10 | |
Institutional Class | | | 0.08 | |
Investor Class | | | 0.19 | |
| | | | | | |
| Notes to financial statements | | Wells Fargo Intermediate Tax/AMT-Free Fund | | | 25 | |
Funds Management has contractually waived and/or reimbursed management and administration fees to the extent necessary to maintain certain net operating expense ratios for the Fund. Waiver of fees and/or reimbursement of expenses by Funds Management were made first from fund level expenses on a proportionate basis and then from class specific expenses. Funds Management has committed through October 31, 2016 to waive fees and/or reimburse expenses to the extent necessary to cap the Fund’s expenses at 0.70% for Class A shares, 1.45% for Class C shares, 0.60% for Administrator Class shares, and 0.45% for Institutional Class shares. After this time, the cap may be increased or the commitment to maintain the cap may be terminated only with the approval of the Board of Trustees. Prior to November 1, 2015, the Fund’s expenses were capped at 0.42% for Institutional Class shares.
Distribution fee
The Trust has adopted a distribution plan for Class C shares of the Fund pursuant to Rule 12b-1 under the 1940 Act. A distribution fee is charged to Class C shares and paid to Wells Fargo Funds Distributor, LLC, the principal underwriter, at an annual rate of 0.75% of the average daily net assets of Class C shares.
In addition, Funds Distributor is entitled to receive the front-end sales charge from the purchase of Class A shares and a contingent deferred sales charge on the redemption of certain Class A shares. Funds Distributor is also entitled to receive the contingent deferred sales charges from redemptions Class C shares. For the year ended June 30, 2016, Funds Distributor received $15,906 from the sale of Class A shares and $500 in contingent deferred sales charges from redemptions of Class C share.
Shareholder servicing fees
The Trust has entered into contracts with one or more shareholder servicing agents, whereby Class A, Class C, Administrator Class, and Investor Class of the Fund are charged a fee at an annual rate of 0.25% of the average daily net assets of each respective class.
A portion of these total shareholder servicing fees were paid to affiliates of Wells Fargo.
5. INVESTMENT PORTFOLIO TRANSACTIONS
Purchases and sales of investments, excluding U.S. government obligations (if any) and short-term securities, for the year ended June 30, 2016 were $787,876,437 and $293,412,851, respectively.
The Fund may purchase or sell investment securities to other Wells Fargo funds under procedures adopted by the Board of Trustees. The procedures have been designed to ensure that these interfund transactions, which generally do not incur broker commissions, are effected at current market prices. Interfund trades are included within the respective purchases and sales amounts shown.
6. DERIVATIVE TRANSACTIONS
During the year ended June 30, 2016, the Fund entered into futures contracts to take advantage of the differences between municipal and treasury yields and to help manage the duration of the Fund.
At June 30, 2016, the Fund had short futures contracts outstanding as follows:
| | | | | | | | | | | | | | |
| Expiration date | | Counterparty | | Contracts | | Type | | Contract
value at
June 30, 2016 | | | Unrealized
gains | |
9-30-2016 | | JPMorgan | | 625 Short | | 5-Year U.S. Treasury Notes | | $ | 76,352,539 | | | $ | 39,009 | |
The Fund had an average notional amount of $734,722 in short futures contracts during the year ended June 30, 2016.
On June 30, 2016, the cumulative unrealized gains on futures contracts in the amount of $39,009 are reflected in net unrealized gains on investments on the Statement of Assets and Liabilities. The payable for daily variation margin on open futures contracts reflected in the Statement of Assets and Liabilities only represents the current day’s variation margin. The change in unrealized gains (losses) on futures contracts are reflected in the Statement of Operations.
For certain types of derivative transactions, the Fund has entered into International Swaps and Derivatives Association, Inc. master agreements (“ISDA Master Agreements”) or similar agreements with approved counterparties. The ISDA Master Agreements or similar agreements may have requirements to deliver/deposit securities or cash to/with an exchange or broker-dealer as collateral and allows the Fund to offset, with each counterparty, certain derivative financial instrument’s assets and/or liabilities with collateral held or pledged. Collateral requirements differ by type of derivative. Collateral or margin requirements are set by the broker or exchange clearing house for exchange traded derivatives while
| | | | |
| 26 | | Wells Fargo Intermediate Tax/AMT-Free Fund | | Notes to financial statements |
collateral terms are contract specific for over-the-counter traded derivatives. Cash collateral that has been pledged to cover obligations of the Fund under ISDA Master Agreements or similar agreements, if any, are reported separately in the Statement of Assets and Liabilities. Securities pledged as collateral, if any, are noted in the Portfolio of Investments. With respect to balance sheet offsetting, absent an event of default by the counterparty or a termination of the agreement, the reported amounts of financial assets and financial liabilities in the Statement of Assets and Liabilities are not offset across transactions between the Fund and the applicable counterparty. A reconciliation of the gross amounts on the Statement of Assets and Liabilities to the net amounts by derivative type, including any collateral exposure, is as follows:
| | | | | | | | | | | | | | | | |
| Derivative type | | Counterparty | | Gross amounts of liabilities in the Statement of Assets and Liabilities | | Amounts
subject to
netting
agreements | | | Collateral
pledged1 | | | Net amount
of liabilities | |
Futures – variation margin | | JPMorgan | | $38,081 | | $ | 0 | | | $ | (38,081 | ) | | $ | 0 | |
| | 1 | Collateral pledged within this table is limited to the collateral for the net transaction with the counterparty. | |
7. BANK BORROWINGS
The Trust (excluding the money market funds and certain other funds) and Wells Fargo Variable Trust are parties to a $200,000,000 revolving credit agreement whereby the Fund is permitted to use bank borrowings for temporary or emergency purposes, such as to fund shareholder redemption requests. Interest under the credit agreement is charged to the Fund based on a borrowing rate equal to the higher of the Federal Funds rate in effect on that day plus 1.25% or the overnight LIBOR rate in effect on that day plus 1.25%. In addition, an annual commitment fee equal to 0.20% of the unused balance is allocated to each participating fund. Prior to September 1, 2015, the revolving credit agreement amount was $150,000,000 and the annual commitment fee was equal to 0.10% of the unused balance which was allocated to each participating fund.
For the year ended June 30, 2016, there were no borrowings by the Fund under the agreement.
8. DISTRIBUTIONS TO SHAREHOLDERS
The tax character of distributions paid during the years ended June 30, 2016 and June 30, 2015 were as follows:
| | | | | | | | |
| | | Year ended June 30 | |
| | | 2016 | | | 2015 | |
Tax-exempt income | | $ | 57,941,110 | | | $ | 51,155,089 | |
As of June 30, 2016, the components of distributable earnings on a tax basis were as follows:
| | | | |
Undistributed
tax-exempt
income | | Undistributed
long-term
gain | | Unrealized
gains |
$1,257,535 | | $2,015,768 | | $151,915,576 |
9. INDEMNIFICATION
Under the Trust’s organizational documents, the officers and Trustees have been granted certain indemnification rights against certain liabilities that may arise out of performance of their duties to the Trust. Additionally, in the normal course of business, the Trust may enter into contracts with service providers that contain a variety of indemnification clauses. The Trust’s maximum exposure under these arrangements is dependent on future claims that may be made against the Fund and, therefore, cannot be estimated.
| | | | | | |
| Report of independent registered public accounting firm | | Wells Fargo Intermediate Tax/AMT-Free Fund | | | 27 | |
BOARD OF TRUSTEES AND SHAREHOLDERS OF WELLS FARGO FUNDS TRUST:
We have audited the accompanying statement of assets and liabilities, including the summary portfolio of investments, of the Wells Fargo Intermediate Tax/AMT-Free Fund (formerly known as Wells Fargo Advantage Intermediate Tax/AMT-Free Fund) (the “Fund”), one of the funds constituting the Wells Fargo Funds Trust, as of June 30, 2016, and the related statement of operations for the year then ended, the statements of changes in net assets for each of the years in the two-year period then ended, and the financial highlights for each of the years in the five-year period then ended. These financial statements and financial highlights are the responsibility of the Fund’s management. Our responsibility is to express an opinion on these financial statements and financial highlights based on our audits.
We conducted our audits in accordance with the standards of the Public Company Accounting Oversight Board (United States). Those standards require that we plan and perform the audit to obtain reasonable assurance about whether the financial statements and financial highlights are free of material misstatement. An audit includes examining, on a test basis, evidence supporting the amounts and disclosures in the financial statements. Our procedures included confirmation of securities owned as of June 30, 2016, by correspondence with custodians and brokers, or by other appropriate auditing procedures. An audit also includes assessing the accounting principles used and significant estimates made by management, as well as evaluating the overall financial statement presentation. We believe that our audits provide a reasonable basis for our opinion.
In our opinion, the financial statements and financial highlights referred to above present fairly, in all material respects, the financial position of the Wells Fargo Intermediate Tax/AMT-Free Fund as of June 30, 2016, and the results of its operations for the year then ended, the changes in its net assets for each of the years in the two-year period then ended, and the financial highlights for each of the years in the five-year period then ended, in conformity with U.S. generally accepted accounting principles.

Boston, Massachusetts
August 25, 2016
| | | | |
| 28 | | Wells Fargo Intermediate Tax/AMT-Free Fund | | Other information (unaudited) |
TAX INFORMATION
Pursuant to Section 852 of the Internal Revenue Code, 100% of distributions paid from net investment income is designated as exempt-interest dividends for the fiscal year ended June 30, 2016.
PROXY VOTING INFORMATION
A description of the policies and procedures that the Fund uses to determine how to vote proxies relating to portfolio securities is available, upon request, by calling 1-800-222-8222, visiting our website at wellsfargofunds.com, or visiting the SEC website at sec.gov. Information regarding how the Fund voted proxies relating to portfolio securities during the most recent 12-month period ended June 30 is available on the Fund’s website at wellsfargofunds.com or by visiting the SEC website at sec.gov.
PORTFOLIO HOLDINGS INFORMATION
The complete portfolio holdings for the Fund are publicly available monthly on the Fund’s website (wellsfargofunds.com), on a one-month delayed basis. In addition, top ten holdings information (excluding derivative positions) for the Fund is publicly available on the Fund’s website on a monthly, seven-day or more delayed basis. The Fund files its complete schedule of portfolio holdings with the SEC for the first and third quarters of each fiscal year on Form N-Q, which is available by visiting the SEC website at sec.gov. In addition, the Fund’s Form N-Q may be reviewed and copied at the SEC’s Public Reference Room in Washington, DC, and at regional offices in New York City, at 233 Broadway, and in Chicago, at 175 West Jackson Boulevard, Suite 900. Information about the Public Reference Room may be obtained by calling 1-800-SEC-0330.
| | | | | | |
| Other information (unaudited) | | Wells Fargo Intermediate Tax/AMT-Free Fund | | | 29 | |
BOARD OF TRUSTEES AND OFFICERS
Each of the Trustees and Officers1 listed in the table below acts in identical capacities for each fund in the Wells Fargo family of funds, which consists of 142 mutual funds comprising the Wells Fargo Funds Trust, Wells Fargo Variable Trust, Wells Fargo Master Trust and four closed-end funds (collectively the “Fund Complex”). This table should be read in conjunction with the Prospectus and the Statement of Additional Information2. The mailing address of each Trustee and Officer is 525 Market Street, 12th Floor, San Francisco, CA 94105. Each Trustee and Officer serves an indefinite term, however, each Trustee serves such term until reaching the mandatory retirement age established by the Trustees.
Independent Trustees
| | | | | | |
Name and
year of birth | | Position held and
length of service* | | Principal occupations during past five years or longer | | Current other public
company or investment
company directorships |
William R. Ebsworth
(Born 1957) | | Trustee, since 2015 | | Retired. From 1984 to 2013, equities analyst, portfolio manager, research director and chief financial officer at Fidelity Management and Research Company in Boston, Tokyo, and Hong Kong and retired in 2013 as Chief Investment Officer of Fidelity Strategic Advisers, Inc. where he lead a team of investment professionals managing client assets. Prior thereto, Board member of Hong Kong Securities Clearing Co., Hong Kong Options Clearing Corp., the Thailand International Fund, Ltd., Fidelity Investments Life Insurance Company, and Empire Fidelity Investments Life Insurance Company. Mr. Ebsworth is a CFA® charterholder and an Adjunct Lecturer, Finance, at Babson College. | | Asset Allocation Trust |
| Jane A. Freeman (Born 1953) | | Trustee, since 2015 | | Retired. From 2012 to 2014 and 1999 to 2008, Chief Financial Officer of Scientific Learning Corporation. From 2008 to 2012, Ms. Freeman provided consulting services related to strategic business projects. Prior to 1999, Portfolio Manager at Rockefeller & Co. and Scudder, Stevens & Clark. Board member of the Harding Loevner Funds from 1996 to 2014, serving as both Lead Independent Director and chair of the Audit Committee. Board member of the Russell Exchange Traded Funds Trust from 2011 to 2012 and the chair of the Audit Committee. Ms. Freeman is Chair of Taproot Foundation (non-profit organization), a Board Member of Ruth Bancroft Garden (non-profit organization) and an inactive chartered financial analyst. | | Asset Allocation Trust |
| Peter G. Gordon (Born 1942) | | Trustee, since 1998; Chairman, since 2005 | | Co-Founder, Retired Chairman, President and CEO of Crystal Geyser Water Company. Trustee Emeritus, Colby College. | | Asset Allocation Trust |
| Isaiah Harris, Jr. (Born 1952) | | Trustee, since 2009 | | Retired. Chairman of the Board of CIGNA Corporation since 2009, and Director since 2005. From 2003 to 2011, Director of Deluxe Corporation. Prior thereto, President and CEO of BellSouth Advertising and Publishing Corp. from 2005 to 2007, President and CEO of BellSouth Enterprises from 2004 to 2005 and President of BellSouth Consumer Services from 2000 to 2003. Emeritus member of the Iowa State University Foundation Board of Governors. Emeritus Member of the Advisory Board of Iowa State University School of Business. Advisory Board Member, Palm Harbor Academy (charter school). Advisory Board Member, Child Evangelism Fellowship (non-profit). Mr. Harris is a certified public accountant (inactive status). | | CIGNA Corporation; Asset Allocation Trust |
| Judith M. Johnson (Born 1949) | | Trustee, since 2008; Audit Committee Chairman, since 2008 | | Retired. Prior thereto, Chief Executive Officer and Chief Investment Officer of Minneapolis Employees Retirement Fund from 1996 to 2008. Ms. Johnson is an attorney, certified public accountant and a certified managerial accountant. | | Asset Allocation Trust |
| David F. Larcker (Born 1950) | | Trustee, since 2009 | | James Irvin Miller Professor of Accounting at the Graduate School of Business, Stanford University, Director of the Corporate Governance Research Initiative and Senior Faculty of The Rock Center for Corporate Governance since 2006. From 2005 to 2008, Professor of Accounting at the Graduate School of Business, Stanford University. Prior thereto, Ernst & Young Professor of Accounting at The Wharton School, University of Pennsylvania from 1985 to 2005. | | Asset Allocation Trust |
| | | | |
| 30 | | Wells Fargo Intermediate Tax/AMT-Free Fund | | Other information (unaudited) |
| | | | | | |
Name and
year of birth | | Position held and
length of service* | | Principal occupations during past five years or longer | | Current other public
company or investment
company directorships |
| Olivia S. Mitchell (Born 1953) | | Trustee, since 2006 | | International Foundation of Employee Benefit Plans Professor, Wharton School of the University of Pennsylvania since 1993. Director of Wharton’s Pension Research Council and Boettner Center on Pensions & Retirement Research, and Research Associate at the National Bureau of Economic Research. Previously, Cornell University Professor from 1978 to 1993. | | Asset Allocation Trust |
| Timothy J. Penny (Born 1951) | | Trustee, since 1996 | | President and Chief Executive Officer of Southern Minnesota Initiative Foundation, a non-profit organization, since 2007 and Senior Fellow at the Humphrey Institute Policy Forum at the University of Minnesota since 1995. Member of the Board of Trustees of NorthStar Education Finance, Inc., a non-profit organization, since 2007. | | Asset Allocation Trust |
| Michael S. Scofield (Born 1943) | | Trustee, since 2010 | | Served on the Investment Company Institute’s Board of Governors and Executive Committee from 2008-2011 as well the Governing Council of the Independent Directors Council from 2006-2011 and the Independent Directors Council Executive Committee from 2008-2011. Chairman of the IDC from 2008-2010. Institutional Investor (Fund Directions) Trustee of Year in 2007. Trustee of the Evergreen Funds complex (and its predecessors) from 1984 to 2010. Chairman of the Evergreen Funds from 2000-2010. Former Trustee of the Mentor Funds. Retired Attorney, Law Offices of Michael S. Scofield. | | Asset Allocation Trust |
| * | Length of service dates reflect the Trustee’s commencement of service with the Trust’s predecessor entities, where applicable. |
Officers
| | | | | | |
Name and
year of birth | | Position held and
length of service | | Principal occupations during past five years or longer | | |
| Karla M. Rabusch (Born 1959) | | President, since 2003 | | Executive Vice President of Wells Fargo Bank, N.A. and President of Wells Fargo Funds Management, LLC since 2003. | | |
Nancy Wiser1
(Born 1967) | | Treasurer, since 2012 | | Executive Vice President of Wells Fargo Funds Management, LLC since 2011. Chief Operating Officer and Chief Compliance Officer at LightBox Capital Management LLC, from 2008 to 2011. | | |
| C. David Messman (Born 1960) | | Secretary, since 2000; Chief Legal Officer, since 2003 | | Senior Vice President and Secretary of Wells Fargo Funds Management, LLC since 2001. Assistant General Counsel of Wells Fargo Bank, N.A. since 2013 and Vice President and Managing Counsel of Wells Fargo Bank, N.A. from 1996 to 2013. | | |
| Michael Whitaker (Born 1967) | | Chief Compliance Officer, since 2016* | | Executive Vice President of Wells Fargo Funds Management, LLC since 2016. Chief Compliance Officer of Fidelity’s Fixed Income Funds and Asset Allocation Funds from 2008 to 2016, Compliance Officer of FMR Co., Inc. from 2014 to 2016, Fidelity Investments Money Management, Inc. from 2014 to 2016, Fidelity Investments from 2007 to 2016. | | |
David Berardi
(Born 1975) | | Assistant Treasurer, since 2009 | | Vice President of Wells Fargo Funds Management, LLC since 2009. Vice President of Evergreen Investment Management Company, LLC from 2008 to 2010. Manager of Fund Reporting and Control for Evergreen Investment Management Company, LLC from 2004 to 2010. | | |
| Jeremy DePalma1 (Born 1974) | | Assistant Treasurer, since 2009 | | Senior Vice President of Wells Fargo Funds Management, LLC since 2009. Senior Vice President of Evergreen Investment Management Company, LLC from 2008 to 2010 and head of the Fund Reporting and Control Team within Fund Administration from 2005 to 2010. | | |
| 1 | Nancy Wiser acts as Treasurer of 73 funds in the Fund Complex. Jeremy DePalma acts as Treasurer of 69 funds and Assistant Treasurer of 73 funds in the Fund Complex. |
| 2 | The Statement of Additional Information includes additional information about the Trustees and is available, without charge, upon request, by calling 1-800-222-8222 or by visiting the website at wellsfargofunds.com. |
| * | Michael Whitaker became Chief Compliance Officer effective May 16, 2016. |
| | | | | | |
| Other information (unaudited) | | Wells Fargo Intermediate Tax/AMT-Free Fund | | | 31 | |
BOARD CONSIDERATION OF INVESTMENT MANAGEMENT AND SUB-ADVISORY AGREEMENTS:
Under the Investment Company Act of 1940 (the “1940 Act”), the Board of Trustees (the “Board”) of Wells Fargo Funds Trust (the “Trust”) must determine annually whether to approve the continuation of the Trust’s investment management and sub-advisory agreements. In this regard, at an in-person meeting held on May 24-25, 2016 (the “Meeting”), the Board, all the members of which have no direct or indirect interest in the investment management and sub-advisory agreements and are not “interested persons” of the Trust, as defined in the 1940 Act (the “Independent Trustees”), reviewed and approved for Wells Fargo Intermediate Tax/AMT-Free Fund (the “Fund”):(i) an investment management agreement (the “Management Agreement”) with Wells Fargo Funds Management, LLC (“Funds Management”); and (ii) an investment sub-advisory agreement (the “Sub-Advisory Agreement”) with Wells Capital Management Incorporated (the “Sub-Adviser”), an affiliate of Funds Management. The Management Agreement and the Sub-Advisory Agreement are collectively referred to as the “Advisory Agreements.”
At the Meeting, the Board considered the factors and reached the conclusions described below relating to the selection of Funds Management and the Sub-Adviser and the approval of the Advisory Agreements. Prior to the Meeting, including at an in-person meeting in April 2016, the Trustees conferred extensively among themselves and with representatives of Funds Management about these matters. Also, the Board has adopted a team-based approach, with each team consisting of a sub-set of Trustees, to assist the full Board in the discharge of its duties in reviewing performance and other matters throughout the year. The Independent Trustees were assisted in their evaluation of the Advisory Agreements by independent legal counsel, from whom they received separate legal advice and with whom they met separately.
In providing information to the Board, Funds Management and the Sub-Adviser were guided by a detailed set of requests for information submitted to them by independent legal counsel on behalf of the Independent Trustees at the start of the Board’s annual contract renewal process earlier in 2016. In considering and approving the Advisory Agreements, the Trustees considered the information they believed relevant, including but not limited to the information discussed below. The Board considered not only the specific information presented in connection with the Meeting, but also the knowledge gained over time through interaction with Funds Management and the Sub-Adviser about various topics. In this regard, the Board reviewed reports of Funds Management at each of its quarterly meetings, which included, among other things, portfolio reviews and performance reports. In addition, the Board and the teams mentioned above confer with portfolio managers at various times throughout the year. The Board did not identify any particular information or consideration that was all-important or controlling, and each individual Trustee may have attributed different weights to various factors.
After its deliberations, the Board unanimously approved the continuation of the Advisory Agreements for a one-year term and determined that the compensation payable to Funds Management and the Sub-Adviser under each of the Advisory Agreements was reasonable. The Board considered the approval of the Advisory Agreements for the Fund as part of its consideration of agreements for funds across the complex, but its approvals were made on a fund-by-fund basis. The following summarizes a number of important, but not necessarily all, factors considered by the Board in support of its approvals.
Nature, extent and quality of services
The Board received and considered various information regarding the nature, extent and quality of services provided to the Fund by Funds Management and the Sub-Adviser under the Advisory Agreements. This information included a description of the investment advisory services and Fund-level administrative services covered by the Management Agreement, as well as, among other things, a summary of the background and experience of senior management of Funds Management, and the qualifications, background, tenure and responsibilities of each of the portfolio managers primarily responsible for the day-to-day portfolio management of the Fund.
The Board evaluated the ability of Funds Management and the Sub-Adviser to attract and retain qualified investment professionals, including research, advisory and supervisory personnel. The Board further considered the compliance programs and compliance records of Funds Management and the Sub-Adviser. In addition, the Board took into account the full range of services provided to the Fund by Funds Management and its affiliates.
Fund performance and expenses
The Board considered the performance results for the Fund over various time periods ended December 31, 2015. The Board considered these results in comparison to the performance of funds in a universe that was determined by Broadridge Inc. (“Broadridge”) to be similar to the Fund (the “Universe”), and in comparison to the Fund’s benchmark index and to other comparative data. Broadridge is an independent provider of investment company data. The Board received a description of the methodology used by Broadridge to select the mutual funds in the performance Universe.
| | | | |
| 32 | | Wells Fargo Intermediate Tax/AMT-Free Fund | | Other information (unaudited) |
The Board noted that the performance of the Fund (Administrator Class) was higher than or in range of the average performance of the Universe for all periods under review. The Board also noted that the performance of the Fund was higher than or in range of its benchmark, the Barclays Municipal Bond 1-15 Year Blend Index, for all periods under review except the one-year period.
The Board also received and considered information regarding the Fund’s net operating expense ratios and their various components, including actual management fees, custodian and other non-management fees, and Rule 12b-1 and non-Rule 12b-1 shareholder service fees. The Board considered these ratios in comparison to the median ratios of funds in class-specific expense groups that were determined by Broadridge to be similar to the Fund (the “Groups”). The Board received a description of the methodology used by Broadridge to select the mutual funds in the expense Groups and an explanation of how funds comprising expense groups and their expense ratios may vary from year-to-year. Based on the Broadridge reports, the Board noted that the net operating expense ratios of the Fund were lower than the median net operating expense ratios of the expense Groups.
The Board took into account the Fund performance and expense information provided to it among the factors considered in deciding to re-approve the Advisory Agreements.
Investment management and sub-advisory fee rates
The Board reviewed and considered the contractual fee rates payable by the Fund to Funds Management under the Management Agreement, as well as the contractual fee rates payable by the Fund to Funds Management for class-level administrative services under a Class-Level Administration Agreement, which include class-level transfer agency and sub-transfer agency costs (collectively, the “Management Rates”). The Board also reviewed and considered the contractual investment sub-advisory fee rates that are payable by Funds Management to the Sub-Adviser for investment sub-advisory services.
Among other information reviewed by the Board was a comparison of the Fund’s Management Rates with the average contractual investment management fee rates of funds in the expense Groups at a common asset level as well as transfer agency costs of the funds in the expense Groups. The Board noted that the Management Rates of the Fund were lower than or in range of the sum of these average rates for the Fund’s expense Groups for all share classes.
The Board also received and considered information about the portion of the total management fee that was retained by Funds Management after payment of the fee to the Sub-Adviser for sub-advisory services. In assessing the reasonableness of this amount, the Board received and evaluated information about the nature and extent of responsibilities retained and risks assumed by Funds Management and not delegated to or assumed by the Sub-Adviser, and about Funds Management’s on-going oversight services. However, given the affiliation between Funds Management and the Sub-Adviser, the Board ascribed limited relevance to the allocation of fees between them.
The Board also received and considered information about the nature and extent of services offered and fee rates charged by Funds Management and the Sub-Adviser to other types of clients with investment strategies similar to those of the Fund. In this regard, the Board received information about the significantly greater scope of services, and compliance, reporting and other legal burdens and risks of managing mutual funds compared with those associated with managing assets of non-mutual fund clients such as collective funds or institutional separate accounts.
Based on its consideration of the factors and information it deemed relevant, including those described here, the Board determined that the compensation payable to Funds Management under the Management Agreement and to the Sub-Adviser under the Sub-Advisory Agreement was reasonable, in light of the services covered by the Advisory Agreements.
Profitability
The Board received and considered information concerning the profitability of Funds Management, as well as the profitability of Wells Fargo as a whole, from providing services to the Fund and the fund family as a whole. The Board also received and considered information concerning the profitability of the Sub-Adviser from providing services to the fund family as a whole, noting that the Sub-Adviser’s profitability information with respect to providing services to the Fund was subsumed in the Wells Fargo and Funds Management profitability analysis.
Funds Management reported on the methodologies and estimates used in calculating profitability. Among other things, the Board noted that the levels of profitability reported on a fund-by-fund basis varied widely, depending on factors such as the size and type of fund. Based on its review, the Board did not deem the profits reported by Funds Management or Wells Fargo from its services to the Fund to be at a level that would prevent it from approving the continuation of the Advisory Agreements.
| | | | | | |
| Other information (unaudited) | | Wells Fargo Intermediate Tax/AMT-Free Fund | | | 33 | |
Economies of scale
With respect to possible economies of scale, the Board noted the existence of breakpoints in the Fund’s management fee structure, which operate generally to reduce the Fund’s expense ratios as the Fund grows in size. It considered that, for a small fund or a fund that shrinks in size, breakpoints conversely can result in higher fee levels. The Board also considered that fee waiver and expense reimbursement arrangements and competitive fee rates at the outset are means of sharing potential economies of scale with shareholders of the Fund and the fund family as a whole. The Board considered Funds Management’s view that any analyses of potential economies of scale in managing a particular fund are inherently limited in light of the joint and common costs and investments that Funds Management incurs across the fund family as a whole.
The Board concluded that the Fund’s fee and expense arrangements, including contractual breakpoints, constituted a reasonable approach to sharing potential economies of scale with the Fund and its shareholders.
Other Benefits to Funds Management and the Sub-Adviser
The Board received and considered information regarding potential “fall-out” or ancillary benefits received by Funds Management and its affiliates, including the Sub-Adviser, as a result of their relationships with the Fund. Ancillary benefits could include, among others, benefits directly attributable to other relationships with the Fund and benefits potentially derived from an increase in Funds Management’s and the Sub-Adviser’s business as a result of their relationships with the Fund. The Board noted that various affiliates of Funds Management may receive distribution-related fees, shareholder servicing payments and sub-transfer agency fees in respect of shares sold or held through them and services provided.
The Board also reviewed information about soft dollar credits earned and utilized by the Sub-Adviser, fees earned by Funds Management and the Sub-Adviser from managing a private investment vehicle for the fund family’s securities lending collateral and commissions earned by an affiliated broker from portfolio transactions.
Based on its consideration of the factors and information it deemed relevant, including those described here, the Board did not find that any ancillary benefits received by Funds Management and its affiliates, including the Sub-Adviser, were unreasonable.
Conclusion
At the Meeting, after considering the above-described factors and based on its deliberations and its evaluation of the information described above, the Board unanimously approved the continuation of the Advisory Agreements for a one-year term and determined that the compensation payable to Funds Management and the Sub-Adviser under each of the Advisory Agreements was reasonable.
| | | | |
| 34 | | Wells Fargo Intermediate Tax/AMT-Free Fund | | List of abbreviations |
The following is a list of common abbreviations for terms and entities that may have appeared in this report.
| ACA | — ACA Financial Guaranty Corporation |
| ADR | — American depositary receipt |
| ADS | — American depositary shares |
| AGC | — Assured Guaranty Corporation |
| AGM | — Assured Guaranty Municipal |
| Ambac | — Ambac Financial Group Incorporated |
| AMT | — Alternative minimum tax |
| BAN | — Bond anticipation notes |
| BHAC | — Berkshire Hathaway Assurance Corporation |
| CAB | — Capital appreciation bond |
| CCAB | — Convertible capital appreciation bond |
| CDA | — Community Development Authority |
| CDO | — Collateralized debt obligation |
| DRIVER | — Derivative inverse tax-exempt receipts |
| DW&P | — Department of Water & Power |
| DWR | — Department of Water Resources |
| ECFA | — Educational & Cultural Facilities Authority |
| EDA | — Economic Development Authority |
| EDFA | — Economic Development Finance Authority |
| ETF | — Exchange-traded fund |
| FDIC | — Federal Deposit Insurance Corporation |
| FFCB | — Federal Farm Credit Banks |
| FGIC | — Financial Guaranty Insurance Corporation |
| FHA | — Federal Housing Administration |
| FHLB | — Federal Home Loan Bank |
| FHLMC | — Federal Home Loan Mortgage Corporation |
| FICO | — The Financing Corporation |
| FNMA | — Federal National Mortgage Association |
| GDR | — Global depositary receipt |
| GNMA | — Government National Mortgage Association |
| HCFR | — Healthcare facilities revenue |
| HEFA | — Health & Educational Facilities Authority |
| HEFAR | — Higher education facilities authority revenue |
| HFA | — Housing Finance Authority |
| HFFA | — Health Facilities Financing Authority |
| HUD | — Department of Housing and Urban Development |
| IDA | — Industrial Development Authority |
| IDAG | — Industrial Development Agency |
| KRW | — Republic of Korea won |
| LIBOR | — London Interbank Offered Rate |
| LIFER | — Long Inverse Floating Exempt Receipts |
| LLC | — Limited liability company |
| LLLP | — Limited liability limited partnership |
| LLP | — Limited liability partnership |
| MBIA | — Municipal Bond Insurance Association |
| MFHR | — Multifamily housing revenue |
| MSTR | — Municipal securities trust receipts |
| MUD | — Municipal Utility District |
| National | — National Public Finance Guarantee Corporation |
| PCFA | — Pollution Control Financing Authority |
| PCL | — Public Company Limited |
| PCR | — Pollution control revenue |
| PFA | — Public Finance Authority |
| PFFA | — Public Facilities Financing Authority |
| PFOTER | — Puttable floating option tax-exempt receipts |
| plc | — Public limited company |
| PUTTER | — Puttable tax-exempt receipts |
| R&D | — Research & development |
| Radian | — Radian Asset Assurance |
| RAN | — Revenue anticipation notes |
| RDA | — Redevelopment Authority |
| RDFA | — Redevelopment Finance Authority |
| REIT | — Real estate investment trust |
| ROC | — Reset option certificates |
| SAVRS | — Select auction variable rate securities |
| SBA | — Small Business Authority |
| SDR | — Swedish depositary receipt |
| SFHR | — Single-family housing revenue |
| SFMR | — Single-family mortgage revenue |
| SPA | — Standby purchase agreement |
| SPDR | — Standard & Poor’s Depositary Receipts |
| SPEAR | — Short Puttable Exempt Adjustable Receipts |
| STRIPS | — Separate trading of registered interest and |
| TAN | — Tax anticipation notes |
| TIPS | — Treasury inflation-protected securities |
| TRAN | — Tax revenue anticipation notes |
| TTFA | — Transportation Trust Fund Authority |
| TVA | — Tennessee Valley Authority |
This page is intentionally left blank.
This page is intentionally left blank.

For more information
More information about Wells Fargo Funds is available free upon request. To obtain literature, please write, email, visit the Fund’s website, or call:
Wells Fargo Funds
P.O. Box 8266
Boston, MA 02266-8266
Email: fundservice@wellsfargo.com
Website: wellsfargofunds.com
Individual investors: 1-800-222-8222
Retail investment professionals: 1-888-877-9275
Institutional investment professionals: 1-866-765-0778
This report and the financial statements contained herein are submitted for the general information of the shareholders of the Fund. If this report is used for promotional purposes, distribution of the report must be accompanied or preceded by a current prospectus. Before investing, please consider the investment objectives, risks, charges, and expenses of the investment. For a current prospectus and, if available, a summary prospectus, containing this information, call 1-800-222-8222 or visit the Fund’s website at wellsfargofunds.com. Read the prospectus carefully before you invest or send money.
Wells Fargo Asset Management (WFAM) is a trade name used by the asset management businesses of Wells Fargo & Company. Wells Fargo Funds Management, LLC, a wholly owned subsidiary of Wells Fargo & Company, provides investment advisory and administrative services for Wells Fargo Funds. Other affiliates of Wells Fargo & Company provide subadvisory and other services for the funds. The funds are distributed by Wells Fargo Funds Distributor, LLC, Member FINRA, an affiliate of Wells Fargo & Company.
NOT FDIC INSURED ¡ NO BANK GUARANTEE ¡ MAY LOSE VALUE
© 2016 Wells Fargo Funds Management, LLC. All rights reserved.
| | |
 | | 244404 08-16 A251/AR251 6-16 |
Annual Report
June 30, 2016

Wells Fargo Minnesota Tax-Free Fund


Reduce clutter. Save trees.
Sign up for electronic delivery of prospectuses and shareholder reports at wellsfargo.com/advantagedelivery
Contents
The views expressed and any forward-looking statements are as of June 30, 2016, unless otherwise noted, and are those of the Fund managers and/or Wells Fargo Funds Management, LLC. Discussions of individual securities, or the markets generally, or any Wells Fargo Fund are not intended as individual recommendations. Future events or results may vary significantly from those expressed in any forward-looking statements. The views expressed are subject to change at any time in response to changing circumstances in the market. Wells Fargo Funds Management, LLC and the Fund disclaim any obligation to publicly update or revise any views expressed or forward-looking statements.
NOT FDIC INSURED ¡ NO BANK GUARANTEE ¡ MAY LOSE VALUE
| | | | |
| 2 | | Wells Fargo Minnesota Tax-Free Fund | | Letter to shareholders (unaudited) |

Karla M. Rabusch
President
Wells Fargo Funds
In fact, yields on municipal bonds that matured in 10 years or more experienced yield declines of more than 100 basis points (100 basis points equals 1.00%) during the reporting period.
Dear Valued Shareholder:
We are pleased to offer you this annual report for the Wells Fargo Minnesota Tax-Free Fund for the 12-month period that ended June 30, 2016. The U.S. Federal Reserve (Fed) began normalizing monetary policy, raising the federal funds rate to between 0.25% and 0.50% in December 2015. Short-term municipal bond yields rose, but yields on longer-term bonds declined. In fact, yields on municipal bonds that matured in 10 years or more experienced yield declines of more than 100 basis points (100 basis points equals 1.00%) during the reporting period. The Barclays Municipal Bond Index,1 a broad measure tracking investment-grade municipal bonds, returned 7.65% during the 12-month reporting period.
Monetary policy was accommodative.
The Fed continued an easy monetary policy in order to support the economy and the financial system. However, it raised the federal funds target rate in December because it believed the U.S. economy was strong enough to begin normalizing monetary policy. The European Central Bank cut all three of its short-term rates during the reporting period, increased its asset-purchase program from 60 billion euros per month to 80 billion, expanded the list of eligible securities to include investment-grade nonbank debt, and created a fund-to-lend program where banks could be paid to lend money. In Japan, the Bank of Japan maintained an aggressive monetary program aimed at combating deflation.
Despite accommodative central-bank policies that helped keep interest rates at ultra-low levels, there were periods of volatility. Early in 2016, weakness in certain emerging markets economies and commodities hurt riskier assets and a vote in June 2016 by the U.K. to exit the European Union set off another round of global uncertainty. Municipal bonds benefited because they are perceived as a safe-haven asset. In addition, investor demand for yield helped lower-rated debt outperform. The Barclays High Yield Municipal Bond Index2 returned 12.09% during the 12-month period that ended June 30, 2016.
Strong demand, modest supply, and solid credit fundamentals supported municipals.
Market technicals remained favorable. According to the Investment Company Institute, more than $33 billion was allocated to municipal mutual funds during the first half of 2016, which was more than double the inflows during all of 2015. Further, inflows during the second quarter of 2016 were the largest in nearly seven years. In contrast, less new supply helped make 2015 the fifth calendar year of negative net supply and supply in the first half of 2016 was about 4% less than the same period last year.
Municipal credit quality remained on an uptrend despite a number of high-profile negative credit situations. Idiosyncratic credit risks remain, however. With regard to Puerto Rico, the U.S. enacted legislation that prohibits bondholder lawsuits temporarily and instills a fiscal oversight board for Puerto Rico; Puerto Rico then declared a moratorium on paying its general obligation (GO) bonds and defaulted on $911 million in payments due (most of which were GOs) on July 1, 2016. The
| 1 | The Barclays Municipal Bond Index is an unmanaged index composed of long-term tax-exempt bonds with a minimum credit rating of Baa. You cannot invest directly in an index. |
| 2 | The Barclays High Yield Municipal Bond Index measures the non-investment-grade and nonrated U.S. dollar–denominated, fixed-rate, tax-exempt bond market within the 50 United States and four other qualifying regions (Washington, D.C.; Puerto Rico; Guam; and the Virgin Islands). The index allows state and local general obligation, revenue, insured, and prerefunded bonds; however, historically the index has been composed of mostly revenue bonds. You cannot invest directly in an index. |
| | | | | | |
| Letter to shareholders (unaudited) | | Wells Fargo Minnesota Tax-Free Fund | | | 3 | |
state of Illinois approved a six-month stopgap budget, a temporary but meaningful step. Under this stopgap budget for the state, the city of Chicago receives authority to raise property taxes for teacher pensions and low-income school districts would receive greater state funding. City of Chicago and school district debt rallied on the news.
Since the end of the financial crisis, structural changes in the fixed-income markets have reduced trading liquidity (the degree to which assets can be bought or sold without affecting the price). New regulations and capital requirements have caused traditional liquidity suppliers (banks and broker/dealers) to be more risk-averse and hold less inventory. Meanwhile, corporate-debt issuance has spiked as companies finance themselves at record-low yields, bond mutual funds hold larger amounts of this new debt supply, trading volumes are lower, and large trades are more difficult to execute. However, fixed-income markets appear to have functioned well over the past year with sufficient liquidity.
Don’t let short-term uncertainty derail long-term investment goals.
Periods of uncertainty can present challenges, but experience has taught us that maintaining long-term investment goals can be an effective way to plan for the future. To help you create a sound strategy based on your personal goals and risk tolerance, Wells Fargo Funds offers more than 100 mutual funds spanning a wide range of asset classes and investment styles. Although diversification cannot guarantee an investment profit or prevent losses, we believe it can be an effective way to manage investment risk and potentially smooth out overall portfolio performance. We encourage investors to know their investments and to understand that appropriate levels of risk-taking may unlock opportunities.
Thank you for choosing to invest in Wells Fargo Funds. We appreciate your confidence in us and remain committed to helping you meet your financial needs.
Sincerely,

Karla M. Rabusch
President
Wells Fargo Funds
Periods of uncertainty can present challenges, but experience has taught us that maintaining long-term investment goals can be an effective way to plan for the future.
For further information about your Fund, contact your investment professional, visit our website at wellsfargofunds.com, or call us directly at 1-800-222-8222. We are available 24 hours a day, 7 days a week.
| | | | |
| 4 | | Wells Fargo Minnesota Tax-Free Fund | | Performance highlights (unaudited) |
Investment objective
The Fund seeks current income exempt from federal income tax and Minnesota individual income tax.
Manager
Wells Fargo Funds Management, LLC
Subadviser
Wells Capital Management Incorporated
Portfolio managers
Wendy Casetta
Bruce R. Johns
Average annual total returns (%) as of June 30, 2016
| | | | | | | | | | | | | | | | | | | | | | | | | | | | | | | | | | |
| | | | | Including sales charge | | | Excluding sales charge | | | Expense ratios1 (%) | |
| | | Inception date | | 1 year | | | 5 year | | | 10 year | | | 1 year | | | 5 year | | | 10 year | | | Gross | | | Net2 | |
| Class A (NMTFX) | | 1-2-1988 | | | 0.98 | | | | 3.51 | | | | 3.89 | | | | 5.74 | | | | 4.46 | | | | 4.37 | | | | 0.89 | | | | 0.85 | |
| Class C (WMTCX) | | 4-8-2005 | | | 3.95 | | | | 3.68 | | | | 3.60 | | | | 4.95 | | | | 3.68 | | | | 3.60 | | | | 1.64 | | | | 1.60 | |
| Administrator Class (NWMIX) | | 8-2-1993 | | | – | | | | – | | | | – | | | | 6.10 | | | | 4.72 | | | | 4.64 | | | | 0.83 | | | | 0.60 | |
| Barclays Municipal Bond Index3 | | – | | | – | | | | – | | | | – | | | | 7.65 | | | | 5.33 | | | | 5.13 | | | | – | | | | – | |
| Barclays Minnesota Municipal Bond Index4 | | – | | | – | | | | – | | | | – | | | | 6.35 | | | | 4.54 | | | | 4.89 | | | | – | | | | – | |
Figures quoted represent past performance, which is no guarantee of future results, and do not reflect taxes that a shareholder may pay on fund distributions or the redemption of fund shares. Investment return and principal value of an investment will fluctuate so that an investor’s shares, when redeemed, may be worth more or less than their original cost. Performance shown without sales charges would be lower if sales charges were reflected. Current performance may be lower or higher than the performance data quoted, which assumes the reinvestment of dividends and capital gains. Current month-end performance is available on the Fund’s website, wellsfargofunds.com.
Index returns do not include transaction costs associated with buying and selling securities, any mutual fund fees or expenses, or any taxes. It is not possible to invest directly in an index.
For Class A shares, the maximum front-end sales charge is 4.50%. For Class C shares, the maximum contingent deferred sales charge is 1.00%. Performance including a contingent deferred sales charge assumes the sales charge for the corresponding time period. Administrator Class shares are sold without a front-end sales charge or contingent deferred sales charge.
Bond values fluctuate in response to the financial condition of individual issuers, general market and economic conditions, and changes in interest rates. Changes in market conditions and government policies may lead to periods of heightened volatility in the bond market and reduced liquidity for certain bonds held by the Fund. In general, when interest rates rise, bond values fall and investors may lose principal value. Interest-rate changes and their impact on the Fund and its share price can be sudden and unpredictable. The use of derivatives may reduce returns and/or increase volatility. Certain investment strategies tend to increase the total risk of an investment (relative to the broader market). The Fund is exposed to Minnesota municipal securities risk and high-yield securities risk. Consult the Fund’s prospectus for additional information on these and other risks. A portion of the Fund’s income may be subject to federal, state, and/or local income taxes or the Alternative Minimum Tax (AMT). Any capital gains distributions may be taxable.
Please see footnotes on page 5.
| | | | | | |
| Performance highlights (unaudited) | | Wells Fargo Minnesota Tax-Free Fund | | | 5 | |
|
| Growth of $10,000 investment as of June 30, 20165 |
|
 |
| 1 | Reflects the expense ratios as stated in the most recent prospectuses. The expense ratios shown are subject to change and may differ from the annualized expense ratios shown in the financial highlights of this report. |
| 2 | The manager has contractually committed through October 31, 2016, to waive fees and/or reimburse expenses to the extent necessary to cap the Fund’s Total Annual Fund Operating Expenses After Fee Waiver at the amounts shown. After this time, the cap may be increased or the commitment to maintain the cap may be terminated only with the approval of the Board of Trustees. Brokerage commissions, stamp duty fees, interest, taxes, acquired fund fees and expenses, and extraordinary expenses are excluded from the expense cap. Without this cap, the Fund’s returns would have been lower. |
| 3 | The Barclays Municipal Bond Index is an unmanaged index composed of long-term tax-exempt bonds with a minimum credit rating of Baa. You cannot invest directly in an index. |
| 4 | The Barclays Minnesota Municipal Bond Index is the Minnesota component of the Barclays Municipal Bond Index. You cannot invest directly in an index. |
| 5 | The chart compares the performance of Class A shares for the most recent ten years with the Barclays Municipal Bond Index and the Barclays Minnesota Municipal Bond Index. The chart assumes a hypothetical $10,000 investment in Class A shares and reflects all operating expenses and assumes the maximum initial sales charge of 4.50%. |
| 6 | Amounts are calculated based on the total investments of the Fund. These amounts are subject to change and may have changed since the date specified. |
| 7 | The credit quality distribution of portfolio holdings reflected in the chart is based on ratings from Standard & Poor’s, Moody’s Investors Service, and/or Fitch Ratings Ltd. Credit quality ratings apply to the underlying holdings of the Fund and not to the Fund itself. The percentages of the Fund’s portfolio with the ratings depicted in the chart are calculated based on the total market value of fixed income securities held by the Fund. If a security was rated by all three rating agencies, the middle rating was utilized. If rated by two of three rating agencies, the lower rating was utilized, and if rated by one of the rating agencies, that rating was utilized. Standard & Poor’s rates the creditworthiness of bonds, ranging from AAA (highest) to D (lowest). Ratings from A to CCC may be modified by the addition of a plus (+) or minus (-) sign to show relative standing within the rating categories. Standard & Poor’s rates the creditworthiness of short-term notes from SP-1 (highest) to SP-3 (lowest). Moody’s rates the creditworthiness of bonds, ranging from Aaa (highest) to C (lowest). Ratings Aa to B may be modified by the addition of a number 1 (highest) to 3 (lowest) to show relative standing within the ratings categories. Moody’s rates the creditworthiness of short-term U.S. tax-exempt municipal securities from MIG 1/VMIG 1 (highest) to SG (lowest). Fitch rates the creditworthiness of bonds, ranging from AAA (highest) to D (lowest). Credit quality distribution is subject to change and may have changed since the date specified. |
| | | | |
| 6 | | Wells Fargo Minnesota Tax-Free Fund | | Performance highlights (unaudited) |
MANAGER’S DISCUSSION
Fund highlights
| n | | The Fund underperformed both its benchmarks, the Barclays Municipal Bond Index and the Barclays Minnesota Municipal Bond Index, for the 12-month period that ended June 30, 2016. |
| n | | While we opportunistically extended the Fund’s duration when opportunities presented themselves, the Fund remained short duration and underweight the long end of the curve during the entire reporting period. This detracted from performance as rates moved lower and the curve flattened. |
| n | | The Fund was overweight lower-rated investment-grade bonds (A-rated and BBB-rated), which outperformed higher-rated credit tiers (AAA-rated and AA-rated) and contributed to performance. |
| n | | Sector allocation contributed to performance because we were overweight outperforming revenue bonds and underweight general obligation (GO) and prerefunded bonds. |
Ultralow yields continued throughout the period.
With the U.S. Federal Reserve (Fed) poised to normalize its interest-rate policy, shorter-term maturities appeared less attractive at the beginning of the reporting period due to a potential backup in short-term yields. However, subdued inflation expectations, due in part to low oil prices, combined with a fragile European economy and softening Chinese economy, implied that longer maturities would outperform. The Fed tightened in December 2015 but signaled that the pace of further increases would be gradual. While the Fed was likely to take its time raising rates, U.S. inflation started to trend higher, unemployment remained below 5%, and economic growth was expected to remain at or above 2%.
|
| Effective maturity distribution as of June 30, 20166 |
|
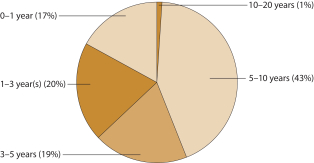 |
|
| Credit quality as of June 30, 20167 |
|
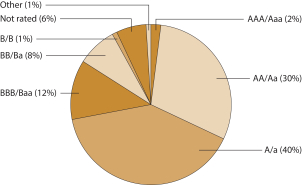 |
With the Fed likely on hold for an extended period, we initially purchased some longer-dated, national municipal securities to extend the Fund’s duration but later allowed duration to shorten as the market rallied and U.S. inflation measures started to move higher. Our below-benchmark duration exposure hurt relative performance during the period as U.S. interest rates continued to move lower in sympathy with declining global interest rates.
Credit-quality allocation helped results.
The Fund’s overweight to A-rated and BBB-rated debt and its holdings in high-yield and nonrated debt contributed to results because lower-rated bonds outperformed higher-quality bonds by a wide margin during the period. Its exposure to lower-quality Minnesota health care issuers and a local charter school were some of our best-performing issues. Other issues that performed well included longer-dated, double-exempt Minnesota municipal securities and several national issues we purchased, such as city of Chicago GO bonds and Chicago Board of Education bonds. While the national municipal debt did not generate state-exempt income, it produced some of the Fund’s highest total returns. We sold some of these national names as we found opportunities to reinvest in double-exempt issues, such as the University of St. Thomas in St. Paul, Minnesota.
Please see footnotes on page 5.
| | | | | | |
| Performance highlights (unaudited) | | Wells Fargo Minnesota Tax-Free Fund | | | 7 | |
Minnesota’s financial position was supported by its strong economy, stable debt and pension liabilities, and recent tax reform. The state’s economy is characterized by low unemployment, diversity in the employer base, and above-average income levels. Economic expansion and the implementation of a new tax bracket for the highest earners resulted in increased income-tax collections and allowed the state to operate with a balanced budget. The improved revenue collections have also allowed the state to build reserves and pay down deferred liabilities to local governments. The paydown of deferred liabilities has directly improved the liquidity position of school districts throughout the state. Looking ahead, low commodity prices and a strong dollar are expected to pressure Minnesota’s mining and manufacturing sectors, potentially dampening the state’s economy expansion. The municipal market within Minnesota is dominated by the state GOs and the health care sector. Health care debt has performed well because of the state’s election to participate in Medicaid expansion as well as the additional income the sector offered. At the end of the reporting period, the state of Minnesota credit ratings were Aa1/AA+/AA+ by Moody’s Investors Service, Incorporated; Standard & Poor’s; and Fitch, respectively. Citing a reduction in deferred liabilities and improved structural balance, Standard & Poor’s assigned a positive outlook to the state’s rating in mid-to-late 2015.
With the economy continuing to improve and the Fed wanting to normalize monetary policy but concerned with overall global growth and interest rates, we are monitoring macroeconomic trends and municipal-specific events for tactical opportunities. We expect the process of interest-rate increases will be slower than past cycles. If economic growth continues to accelerate and global markets remain constant, we expect the Fed could raise its target rate in early 2017. As a result, we anticipate having a more neutral duration compared with the Barclays Minnesota Municipal Bond Index and being overweight medium- and lower-quality bonds.
Please see footnotes on page 5.
| | | | |
| 8 | | Wells Fargo Minnesota Tax-Free Fund | | Fund expenses (unaudited) |
As a shareholder of the Fund, you incur two types of costs: (1) transaction costs, including sales charges (loads) on purchase payments and contingent deferred sales charges (if any) on redemptions and (2) ongoing costs, including management fees, distribution (12b-1) and/or shareholder servicing fees, and other Fund expenses. This example is intended to help you understand your ongoing costs (in dollars) of investing in the Fund and to compare these costs with the ongoing costs of investing in other mutual funds.
The example is based on an investment of $1,000 invested at the beginning of the six-month period and held for the entire period from January 1, 2016 to June 30, 2016.
Actual expenses
The “Actual” line of the table below provides information about actual account values and actual expenses. You may use the information in this line, together with the amount you invested, to estimate the expenses that you paid over the period. Simply divide your account value by $1,000 (for example, an $8,600 account value divided by $1,000 = 8.6), then multiply the result by the number in the “Actual” line under the heading entitled “Expenses paid during period” for your applicable class of shares to estimate the expenses you paid on your account during this period.
Hypothetical example for comparison purposes
The “Hypothetical” line of the table below provides information about hypothetical account values and hypothetical expenses based on the Fund’s actual expense ratio and an assumed rate of return of 5% per year before expenses, which is not the Fund’s actual return. The hypothetical account values and expenses may not be used to estimate the actual ending account balance or expenses you paid for the period. You may use this information to compare the ongoing costs of investing in the Fund and other funds. To do so, compare this 5% hypothetical example with the 5% hypothetical examples that appear in the shareholder reports of the other funds.
Please note that the expenses shown in the table are meant to highlight your ongoing costs only and do not reflect any transactional costs, such as sales charges (loads) and contingent deferred sales charges. Therefore, the “Hypothetical” line of the table is useful in comparing ongoing costs only and will not help you determine the relative total costs of owning different funds. In addition, if these transactional costs were included, your costs would have been higher.
| | | | | | | | | | | | | | | | |
| | | Beginning
account value
1-1-2016 | | | Ending
account value
6-30-2016 | | | Expenses
paid during
the period1 | | | Net annualized
expense ratio | |
Class A | | | | | | | | | | | | | | | | |
Actual | | $ | 1,000.00 | | | $ | 1,033.14 | | | $ | 4.30 | | | | 0.85 | % |
Hypothetical (5% return before expenses) | | $ | 1,000.00 | | | $ | 1,020.64 | | | $ | 4.27 | | | | 0.85 | % |
Class C | | | | | | | | | | | | | | | | |
Actual | | $ | 1,000.00 | | | $ | 1,029.30 | | | $ | 8.07 | | | | 1.60 | % |
Hypothetical (5% return before expenses) | | $ | 1,000.00 | | | $ | 1,016.91 | | | $ | 8.02 | | | | 1.60 | % |
Administrator Class | | | | | | | | | | | | | | | | |
Actual | | $ | 1,000.00 | | | $ | 1,034.42 | | | $ | 3.03 | | | | 0.60 | % |
Hypothetical (5% return before expenses) | | $ | 1,000.00 | | | $ | 1,021.88 | | | $ | 3.02 | | | | 0.60 | % |
| 1 | Expenses paid is equal to the annualized expense ratio of each class multiplied by the average account value over the period, multiplied by the number of days in the most recent fiscal half-year divided by the number of days in the fiscal year (to reflect the one-half-year period). |
| | | | | | |
| Portfolio of investments—June 30, 2016 | | Wells Fargo Minnesota Tax-Free Fund | | | 9 | |
| | | | | | | | | | | | | | | | |
| Security name | | Interest rate | | | Maturity date | | | Principal | | | Value | |
| | | | | | | | | | | | | | | | |
| | | | |
Municipal Obligations: 99.10% | | | | | | | | | | | | | | | | |
| | | | |
| Guam: 1.26% | | | | | | | | | | | | | | | | |
Guam Government Business Privilege Series D (Tax Revenue) | | | 5.00 | % | | | 11-15-2022 | | | $ | 500,000 | | | $ | 594,335 | |
Guam Government Waterworks Authority Water & Wastewater System Project Series 2013 (Water & Sewer Revenue) | | | 5.25 | | | | 7-1-2022 | | | | 865,000 | | | | 1,033,277 | |
Guam International Airport Authority Series 2013A (Airport Revenue) | | | 5.00 | | | | 10-1-2017 | | | | 200,000 | | | | 210,836 | |
Guam International Airport Authority Series 2013A (Airport Revenue) | | | 5.00 | | | | 10-1-2018 | | | | 100,000 | | | | 108,946 | |
Guam International Airport Authority Series 2013B (Airport Revenue) | | | 5.00 | | | | 10-1-2017 | | | | 300,000 | | | | 316,584 | |
| |
| | | | 2,263,978 | |
| | | | | | | | | | | | | | | | |
| | | | |
| Illinois: 0.54% | | | | | | | | | | | | | | | | |
Chicago IL Board of Education Refunding Bond Series A (GO Revenue) | | | 4.39 | | | | 3-1-2032 | | | | 1,000,000 | | | | 980,410 | |
| | | | | | | | | | | | | | | | |
| | | | |
| Minnesota: 96.25% | | | | | | | | | | | | | | | | |
Anoka County MN Capital Improvement Series A (GO Revenue) | | | 5.00 | | | | 2-1-2024 | | | | 500,000 | | | | 532,670 | |
Anoka County MN Charter School Series A (Education Revenue) | | | 3.40 | | | | 6-1-2019 | | | | 225,000 | | | | 230,344 | |
Anoka County MN Charter School Series A (Education Revenue) | | | 3.65 | | | | 6-1-2020 | | | | 185,000 | | | | 191,421 | |
Anoka County MN Charter School Series A (Education Revenue) | | | 3.75 | | | | 6-1-2021 | | | | 245,000 | | | | 254,822 | |
Anoka County MN Charter School Series A (Education Revenue) | | | 5.00 | | | | 6-1-2027 | | | | 510,000 | | | | 558,511 | |
Anoka County MN Charter School Series A (Education Revenue) | | | 5.00 | | | | 6-1-2032 | | | | 300,000 | | | | 326,661 | |
Anoka County MN Charter School Series A (Education Revenue) | | | 5.00 | | | | 6-1-2043 | | | | 1,100,000 | | | | 1,188,264 | |
Anoka Hennepin MN Independent School District #11 Certificates of Participation Series 2014A (Miscellaneous Revenue) | | | 5.00 | | | | 2-1-2034 | | | | 1,000,000 | | | | 1,201,590 | |
Austin MN Housing & RDA Courtyard Residence Project Series A (Housing Revenue) | | | 5.00 | | | | 1-1-2031 | | | | 1,500,000 | | | | 1,600,980 | |
Baytown Township MN St. Croix Preparatory Academy Series A (Education Revenue) | | | 7.00 | | | | 8-1-2038 | | | | 2,150,000 | | | | 2,198,031 | |
Brooklyn Park MN Charter School Athlos Leadership Academy Project Series 2015A (Education Revenue) | | | 4.00 | | | | 7-1-2020 | | | | 245,000 | | | | 248,714 | |
Brooklyn Park MN Charter School Athlos Leadership Academy Project Series 2015A (Education Revenue) | | | 5.50 | | | | 7-1-2040 | | | | 750,000 | | | | 778,020 | |
Brooklyn Park MN Charter School Prairie Seeds Academy Project Series 2015A (Miscellaneous Revenue) | | | 5.00 | | | | 3-1-2034 | | | | 1,500,000 | | | | 1,627,200 | |
Center City MN Health Care Facilities Hazelden Betty Ford Foundation Project Series 2011 (Miscellaneous Revenue) | | | 5.00 | | | | 11-1-2041 | | | | 1,400,000 | | | | 1,516,452 | |
Center City MN Health Care Facilities Hazelden Betty Ford Foundation Project Series 2014 (Health Revenue) | | | 5.00 | | | | 11-1-2026 | | | | 750,000 | | | | 929,955 | |
Center City MN Health Care Facilities Hazelden Betty Ford Foundation Project Series 2014 (Health Revenue) | | | 5.00 | | | | 11-1-2027 | | | | 500,000 | | | | 615,420 | |
Center City MN Health Care Facilities Hazelden Betty Ford Foundation Project Series 2014 (Health Revenue) | | | 5.00 | | | | 11-1-2029 | | | | 300,000 | | | | 367,491 | |
Central Minnesota Municipal Power Agency Brookings Southeast Twin Cities Transmission Project Series 2012 (Utilities Revenue) | | | 5.00 | | | | 1-1-2042 | | | | 1,500,000 | | | | 1,728,315 | |
Cologne MN Charter School Cologne Academy Project Series 2014A (Education Revenue) | | | 5.00 | | | | 7-1-2029 | | | | 590,000 | | | | 661,803 | |
Cologne MN Charter School Cologne Academy Project Series 2014A (Education Revenue) | | | 5.00 | | | | 7-1-2034 | | | | 500,000 | | | | 551,585 | |
Columbus MN Charter School New Millennium Academy Project Series 2015A (Education Revenue) | | | 5.50 | | | | 7-1-2030 | | | | 1,000,000 | | | | 1,047,700 | |
Dakota County MN Community Development Agency SFMR (Housing Revenue, GNMA/FNMA/FHLMC Insured) | | | 5.30 | | | | 12-1-2039 | | | | 51,600 | | | | 53,385 | |
Deephaven MN Charter School Eagle Ridge Academy Project Series 2015-A (Education Revenue) | | | 5.25 | | | | 7-1-2037 | | | | 500,000 | | | | 542,925 | |
The accompanying notes are an integral part of these financial statements.
| | | | |
| 10 | | Wells Fargo Minnesota Tax-Free Fund | | Portfolio of investments—June 30, 2016 |
| | | | | | | | | | | | | | | | |
| Security name | | Interest rate | | | Maturity date | | | Principal | | | Value | |
| | | | | | | | | | | | | | | | |
| | | | |
| Minnesota (continued) | | | | | | | | | | | | | | | | |
Deephaven MN Charter School Eagle Ridge Academy Project Series 2015A (Education Revenue) | | | 5.25 | % | | | 7-1-2040 | | | $ | 500,000 | | | $ | 543,710 | |
Duluth MN Duluth Entertainment Convention Center Series A (GO Revenue) | | | 5.00 | | | | 2-1-2034 | | | | 1,000,000 | | | | 1,069,540 | |
Duluth MN Housing & RDA Public School Academy Series 2010A (Education Revenue) | | | 5.60 | | | | 11-1-2030 | | | | 2,000,000 | | | | 2,134,880 | |
Forest Lakes MN Charter School Lakes International Language Academy Project Series 2014A (Education Revenue) | | | 5.50 | | | | 8-1-2036 | | | | 500,000 | | | | 549,425 | |
Glencoe MN HCFR Glencoe Regional Health Services Project Series 2013 (Health Revenue) | | | 4.00 | | | | 4-1-2022 | | | | 735,000 | | | | 813,233 | |
Goodhue County MN Education District #6051 Red Wing Certificates of Participation Series 2014A (Miscellaneous Revenue) | | | 5.00 | | | | 2-1-2029 | | | | 750,000 | | | | 899,835 | |
Ham Lake MN Charter School Lease Revenue Bonds DaVinci Academy Project Series 2012A (Education Revenue) | | | 4.00 | | | | 7-1-2028 | | | | 370,000 | | | | 373,652 | |
Ham Lake MN Charter School Lease Revenue Bonds DaVinci Academy Project Series 2016A (Education Revenue) | | | 5.00 | | | | 7-1-2031 | | | | 625,000 | | | | 676,644 | |
Hayward MN HCFR St. John’s Lutheran Home of Albert Lea Project Series 2015 (Health Revenue) | | | 2.75 | | | | 11-1-2017 | | | | 500,000 | | | | 503,275 | |
Hugo MN Charter School Lease Revenue Bonds Noble Academy Project Series 2014A (Education Revenue) | | | 5.00 | | | | 7-1-2029 | | | | 600,000 | | | | 638,628 | |
Hutchinson MN Public Utility Revenue Refunding Bonds Series 2012A (Utilities Revenue) | | | 5.00 | | | | 12-1-2026 | | | | 700,000 | | | | 846,853 | |
Maple Grove MN HCFR North Memorial Health Care Series 2015 (Health Revenue) | | | 5.00 | | | | 9-1-2023 | | | | 655,000 | | | | 802,775 | |
Maple Grove MN Maple Grove Hospital Corporation (Health Revenue) | | | 5.25 | | | | 5-1-2024 | | | | 1,735,000 | | | | 1,797,408 | |
Meeker County MN Memorial Hospital Project Series 2007 (Health Revenue) | | | 5.63 | | | | 11-1-2022 | | | | 800,000 | | | | 834,232 | |
Minneapolis & St. Paul MN Housing & RDA Children’s Health Care Facilities Series A (Health Revenue) | | | 5.25 | | | | 8-15-2025 | | | | 1,000,000 | | | | 1,157,110 | |
Minneapolis & St. Paul MN Housing & RDA Children’s Health Care Facilities Series A (Health Revenue) | | | 5.25 | | | | 8-15-2035 | | | | 1,000,000 | | | | 1,157,260 | |
Minneapolis & St. Paul MN Housing & RDA HealthSpan Series B (Health Revenue, Ambac Insured) ±(m)(n) | | | 0.59 | | | | 11-15-2017 | | | | 1,620,000 | | | | 1,603,800 | |
Minneapolis & St. Paul MN Metropolitan Airports Commission Sub Series 2014A (Airport Revenue) | | | 5.00 | | | | 1-1-2029 | | | | 500,000 | | | | 613,395 | |
Minneapolis & St. Paul MN Metropolitan Airports Commission Sub Series 2014B (Airport Revenue) | | | 5.00 | | | | 1-1-2026 | | | | 500,000 | | | | 612,610 | |
Minneapolis & St. Paul MN Metropolitan Airports Commission Sub Series B (Airport Revenue, National Insured) | | | 5.00 | | | | 1-1-2018 | | | | 1,000,000 | | | | 1,022,620 | |
Minneapolis MN Charter School Yinghua Academy Project Series 2013A (Education Revenue) | | | 5.00 | | | | 7-1-2023 | | | | 300,000 | | | | 323,865 | |
Minneapolis MN Development Limited Tax Supported Common Bond Series 2A (Miscellaneous Revenue) | | | 5.00 | | | | 6-1-2028 | | | | 1,115,000 | | | | 1,140,277 | |
Minneapolis MN Development Limited Tax Supported Common Bond Series 2A (Miscellaneous Revenue) | | | 6.00 | | | | 12-1-2040 | | | | 1,000,000 | | | | 1,189,390 | |
Minneapolis MN Fairview Health Services Series A (Health Revenue, AGM Insured) | | | 6.63 | | | | 11-15-2028 | | | | 1,000,000 | | | | 1,139,240 | |
Minneapolis MN Health Care System Fairview Health Services Series 2015A (Health Revenue) | | | 5.00 | | | | 11-15-2033 | | | | 2,000,000 | | | | 2,436,040 | |
Minneapolis MN Health Care System Revenue Prerefunded (Health Revenue, AGC Insured) | | | 6.50 | | | | 11-15-2038 | | | | 345,000 | | | | 392,024 | |
Minneapolis MN Health Care System Revenue Unrefunded (Health Revenue, AGC Insured) | | | 6.50 | | | | 11-15-2038 | | | | 1,890,000 | | | | 2,121,752 | |
Minneapolis MN Plymouth Stevens House Project Series A (Housing Revenue) | | | 1.00 | | | | 12-1-2017 | | | | 1,000,000 | | | | 1,000,560 | |
Minneapolis MN Seward Towers Apartments Project Series A (Housing Revenue) | | | 1.10 | | | | 1-1-2018 | | | | 2,000,000 | | | | 2,003,380 | |
The accompanying notes are an integral part of these financial statements.
| | | | | | |
| Portfolio of investments—June 30, 2016 | | Wells Fargo Minnesota Tax-Free Fund | | | 11 | |
| | | | | | | | | | | | | | | | |
| Security name | | Interest rate | | | Maturity date | | | Principal | | | Value | |
| | | | | | | | | | | | | | | | |
|
| Minnesota (continued) | |
Minneapolis MN Student Housing Riverton Community Housing Project Series 2014 (Housing Revenue) | | | 5.00 | % | | | 8-1-2032 | | | $ | 860,000 | | | $ | 913,389 | |
Minnesota Agricultural & Economic Development Board Health Care Essentia Health Series C1 (Health Revenue, AGC Insured) | | | 4.00 | | | | 2-15-2020 | | | | 50,000 | | | | 55,101 | |
Minnesota Agricultural & Economic Development Board Health Care Essentia Health Series C1 (Health Revenue, AGC Insured) | | | 5.00 | | | | 2-15-2030 | | | | 2,000,000 | | | | 2,246,800 | |
Minnesota Agricultural & Economic Development Board Health Care Essentia Health Series E (Health Revenue, AGC Insured) | | | 5.00 | | | | 2-15-2037 | | | | 4,030,000 | | | | 4,244,839 | |
Minnesota Certificates of Participation Legislative Office Facility Project Series 2014 (Miscellaneous Revenue) | | | 5.00 | | | | 6-1-2023 | | | | 435,000 | | | | 538,012 | |
Minnesota General Fund Revenue Appropriation Bonds Series 2012B (Miscellaneous Revenue) | | | 5.00 | | | | 3-1-2027 | | | | 2,000,000 | | | | 2,393,700 | |
Minnesota General Fund Revenue Appropriation Bonds Series 2012B (Miscellaneous Revenue) | | | 5.00 | | | | 3-1-2028 | | | | 2,000,000 | | | | 2,417,340 | |
Minnesota General Fund Revenue Appropriation Bonds Series 2012B (Miscellaneous Revenue) | | | 5.00 | | | | 3-1-2029 | | | | 2,000,000 | | | | 2,411,260 | |
Minnesota General Fund Revenue Appropriation Bonds Series 2014A (Miscellaneous Revenue) | | | 5.00 | | | | 6-1-2033 | | | | 1,000,000 | | | | 1,220,390 | |
Minnesota HEFAR Bethel University Series 6R (Education Revenue) | | | 5.50 | | | | 5-1-2025 | | | | 1,535,000 | | | | 1,566,514 | |
Minnesota HEFAR Carleton College Series 7D (Education Revenue) | | | 5.00 | | | | 3-1-2030 | | | | 2,000,000 | | | | 2,207,960 | |
Minnesota HEFAR College of St. Scholastica Incorporated Series 7R (Education Revenue) | | | 4.25 | | | | 12-1-2027 | | | | 400,000 | | | | 434,732 | |
Minnesota HEFAR Hamline University Series 7E (Education Revenue) | | | 4.50 | | | | 10-1-2021 | | | | 300,000 | | | | 329,457 | |
Minnesota HEFAR Hamline University Series 7E (Education Revenue) | | | 5.00 | | | | 10-1-2029 | | | | 500,000 | | | | 546,945 | |
Minnesota HEFAR St. Benedict College Series 7M (Education Revenue) | | | 5.13 | | | | 3-1-2036 | | | | 275,000 | | | | 303,661 | |
Minnesota HEFAR St. Benedict College Series 7V (Education Revenue) | | | 5.00 | | | | 3-1-2018 | | | | 635,000 | | | | 674,103 | |
Minnesota HEFAR St. Olaf College Series 7F (Education Revenue) | | | 4.50 | | | | 10-1-2030 | | | | 500,000 | | | | 548,355 | |
Minnesota HEFAR St. Thomas University Series 6W (Education Revenue) | | | 5.00 | | | | 10-1-2018 | | | | 1,100,000 | | | | 1,112,518 | |
Minnesota HEFAR St. Thomas University Series 6W (Education Revenue) | | | 6.00 | | | | 10-1-2025 | | | | 1,030,000 | | | | 1,044,327 | |
Minnesota HEFAR St. Thomas University Series 6W (Education Revenue) | | | 6.00 | | | | 10-1-2030 | | | | 1,000,000 | | | | 1,013,910 | |
Minnesota HEFAR St. Thomas University Series 6X (Education Revenue) | | | 5.00 | | | | 4-1-2029 | | | | 1,000,000 | | | | 1,033,030 | |
Minnesota HEFAR St. Thomas University Series 7U (Education Revenue) | | | 5.00 | | | | 4-1-2023 | | | | 750,000 | | | | 920,138 | |
Minnesota HEFAR St. Thomas University Series 8-L (Education Revenue) | | | 5.00 | | | | 4-1-2024 | | | | 750,000 | | | | 933,360 | |
Minnesota HEFAR St. Thomas University Series 8-L (Education Revenue) | | | 5.00 | | | | 4-1-2028 | | | | 920,000 | | | | 1,163,653 | |
Minnesota HEFAR St. Thomas University Series 8-L (Education Revenue) | | | 5.00 | | | | 4-1-2029 | | | | 750,000 | | | | 943,155 | |
Minnesota HEFAR St. Thomas University Series 8-L (Education Revenue) | | | 5.00 | | | | 4-1-2035 | | | | 750,000 | | | | 917,903 | |
Minnesota Housing Finance Agency Residential Housing Series 2007Q (Housing Revenue) | | | 5.25 | | | | 7-1-2033 | | | | 685,000 | | | | 699,570 | |
Minnesota Housing Finance Agency Residential Housing Series 2009E (Housing Revenue) | | | 4.20 | | | | 7-1-2021 | | | | 1,035,000 | | | | 1,080,706 | |
Minnesota Housing Finance Agency Residential Housing Series 2012D (Housing Revenue, GNMA/FNMA/FHLMC Insured) | | | 4.00 | | | | 7-1-2040 | | | | 725,000 | | | | 755,994 | |
Minnesota Housing Finance Agency Series 2009B (Housing Revenue) | | | 5.90 | | | | 7-1-2028 | | | | 65,000 | | | | 67,233 | |
Minnesota Housing Finance Agency Series 2015A (Housing Revenue) | | | 5.00 | | | | 8-1-2027 | | | | 1,665,000 | | | | 2,087,977 | |
Minnesota Municipal Power Agency Series 2007 (Utilities Revenue) | | | 5.00 | | | | 10-1-2037 | | | | 1,200,000 | | | | 1,258,548 | |
Minnesota Municipal Power Agency Series 2010A & Series 2010B (Utilities Revenue) | | | 5.00 | | | | 10-1-2025 | | | | 2,335,000 | | | | 2,663,698 | |
Minnesota Prerefunded Bond (GO Revenue) | | | 5.00 | | | | 8-1-2022 | | | | 100,000 | | | | 104,801 | |
Minnesota Refunded Bond (GO Revenue) | | | 5.00 | | | | 8-1-2022 | | | | 2,400,000 | | | | 2,515,224 | |
Minnetonka MN Independent School District #276 Series F (Miscellaneous Revenue) | | | 5.00 | | | | 2-1-2022 | | | | 175,000 | | | | 208,976 | |
Minnetonka MN Independent School District #276 Series F (Miscellaneous Revenue) | | | 5.00 | | | | 2-1-2023 | | | | 185,000 | | | | 226,270 | |
Minnetonka MN Independent School District #276 Series F (Miscellaneous Revenue) | | | 5.00 | | | | 2-1-2024 | | | | 195,000 | | | | 237,247 | |
The accompanying notes are an integral part of these financial statements.
| | | | |
| 12 | | Wells Fargo Minnesota Tax-Free Fund | | Portfolio of investments—June 30, 2016 |
| | | | | | | | | | | | | | | | |
| Security name | | Interest rate | | | Maturity date | | | Principal | | | Value | |
| | | | | | | | | | | | | | | | |
| | | | |
| Minnesota (continued) | | | | | | | | | | | | | | | | |
Minnetonka MN Independent School District #276 Series F (Miscellaneous Revenue) | | | 5.00 | % | | | 2-1-2025 | | | $ | 205,000 | | | $ | 251,937 | |
Mounds View MN Independent School District #621 Series A (GO Revenue, South Dakota Credit Program Insured) | | | 4.00 | | | | 2-1-2022 | | | | 530,000 | | | | 577,324 | |
Northeastern Minnesota Metropolitan Intermediate School District #916 Certificates of Participation Series 2013A (Miscellaneous Revenue) | | | 4.00 | | | | 2-1-2024 | | | | 1,100,000 | | | | 1,251,415 | |
Northeastern Minnesota Metropolitan Intermediate School District #916 Certificates of Participation Series 2015B (Miscellaneous Revenue) | | | 5.00 | | | | 2-1-2034 | | | | 1,000,000 | | | | 1,206,670 | |
Northern Minnesota Municipal Power Agency Series 2008A (Utilities Revenue, AGC Insured) ## | | | 5.00 | | | | 1-1-2017 | | | | 1,000,000 | | | | 1,021,950 | |
Northern Minnesota Municipal Power Agency Series 2008A (Utilities Revenue, AGC Insured) | | | 5.00 | | | | 1-1-2018 | | | | 820,000 | | | | 871,726 | |
Northern Minnesota Municipal Power Agency Series 2008A (Utilities Revenue, AGC Insured) | | | 5.00 | | | | 1-1-2021 | | | | 50,000 | | | | 53,022 | |
Northern Minnesota Municipal Power Agency Series 2013A (Utilities Revenue) | | | 4.00 | | | | 1-1-2028 | | | | 450,000 | | | | 505,499 | |
Northern Minnesota Municipal Power Agency Series 2016 (Utilities Revenue) | | | 5.00 | | | | 1-1-2030 | | | | 520,000 | | | | 652,865 | |
Northern Minnesota Municipal Power Agency Series 2016 (Utilities Revenue) | | | 5.00 | | | | 1-1-2031 | | | | 350,000 | | | | 437,367 | |
Otsego MN Charter School Kaleidoscope Charter School Project Series 2014A (Education Revenue) | | | 4.15 | | | | 9-1-2024 | | | | 600,000 | | | | 635,358 | |
Otsego MN Charter School Kaleidoscope Charter School Project Series 2014A (Education Revenue) | | | 5.00 | | | | 9-1-2034 | | | | 1,100,000 | | | | 1,180,718 | |
Plymouth MN Certificate of Participation Intermediate School District #287 Series A (Miscellaneous Revenue) | | | 5.00 | | | | 2-1-2024 | | | | 250,000 | | | | 278,680 | |
Red Wing MN Senior Housing Deer Crest Project Series A (Health Revenue) | | | 5.00 | | | | 11-1-2032 | | | | 660,000 | | | | 710,404 | |
Red Wing MN Senior Housing Deer Crest Project Series A (Health Revenue) | | | 5.00 | | | | 11-1-2042 | | | | 560,000 | | | | 598,080 | |
Rice County MN Educational Facilities Shattuck-St. Mary’s School Project (Education Revenue) 144A | | | 5.00 | | | | 8-1-2022 | | | | 990,000 | | | | 1,074,130 | |
Rochester MN Electric Utility Revenue Series 2007C (Utilities Revenue) | | | 5.00 | | | | 12-1-2030 | | | | 1,000,000 | | | | 1,018,279 | |
Rochester MN Electric Utility Revenue Series 2013B (Utilities Revenue) | | | 5.00 | | | | 12-1-2023 | | | | 815,000 | | | | 1,024,822 | |
Rochester MN Electric Utility Revenue Series 2013B (Utilities Revenue) | | | 5.00 | | | | 12-1-2025 | | | | 315,000 | | | | 394,752 | |
Rochester MN Electric Utility Revenue Series 2013B (Utilities Revenue) | | | 5.00 | | | | 12-1-2026 | | | | 250,000 | | | | 313,278 | |
Sartell MN Independent School District 748 St. Stephen Public Schools GO Series 2016A (GO Revenue, South Dakota Credit Program Insured) %% | | | 5.00 | | | | 2-1-2027 | | | | 1,250,000 | | | | 1,570,038 | |
Shakopee MN St. Francis Regional Medical Center Series 2014 (Health Revenue) | | | 5.00 | | | | 9-1-2027 | | | | 700,000 | | | | 859,110 | |
Shakopee MN St. Francis Regional Medical Center Series 2014 (Health Revenue) | | | 5.00 | | | | 9-1-2029 | | | | 725,000 | | | | 881,455 | |
South St. Paul MN Housing & RDA Airport Project Series 2007 (Industrial Development Revenue, AGC Insured) | | | 4.70 | | | | 9-1-2019 | | | | 300,000 | | | | 302,121 | |
South St. Paul MN Housing & RDA Airport Project Series 2007 (Industrial Development Revenue, AGC Insured) | | | 5.13 | | | | 9-1-2029 | | | | 500,000 | | | | 504,055 | |
Southern Minnesota Municipal Power Agency Series 1994A (Utilities Revenue, National Insured) ¤ | | | 0.00 | | | | 1-1-2020 | | | | 5,100,000 | | | | 4,846,632 | |
Southern Minnesota Municipal Power Agency Series 2009A (Utilities Revenue) | | | 5.25 | | | | 1-1-2030 | | | | 2,000,000 | | | | 2,223,260 | |
St. Cloud MN Charter School Lease Revenue Bonds Stride Academy Project Series 2016A (Miscellaneous Revenue) | | | 5.00 | | | | 4-1-2036 | | | | 750,000 | | | | 783,510 | |
St. Cloud MN Health Care Prerefunded Revenue Bonds CentraCare Health (Health Revenue) | | | 5.13 | | | | 5-1-2030 | | | | 1,890,000 | | | | 2,193,515 | |
St. Cloud MN Health Care Revenue Bonds Series 2016A (Health Revenue) | | | 5.00 | | | | 5-1-2030 | | | | 2,000,000 | | | | 2,512,960 | |
St. Cloud MN Health Care Revenue Bonds Series 2016A (Health Revenue) | | | 5.00 | | | | 5-1-2031 | | | | 2,000,000 | | | | 2,504,880 | |
St. Cloud MN Health Care Unrefunded Revenue Bonds CentraCare Health (Health Revenue) | | | 5.13 | | | | 5-1-2030 | | | | 125,000 | | | | 142,480 | |
St. Louis Park MN Nicollett Health Services Series 2009 (Health Revenue) | | | 5.50 | | | | 7-1-2029 | | | | 1,000,000 | | | | 1,140,780 | |
St. Paul MN Housing & RDA Allina Health Systems Series A1 (Health Revenue) | | | 5.00 | | | | 11-15-2024 | | | | 2,350,000 | | | | 2,658,555 | |
The accompanying notes are an integral part of these financial statements.
| | | | | | |
| Portfolio of investments—June 30, 2016 | | Wells Fargo Minnesota Tax-Free Fund | | | 13 | |
| | | | | | | | | | | | | | | | |
| Security name | | Interest rate | | | Maturity date | | | Principal | | | Value | |
| | | | | | | | | | | | | | | | |
| | | | |
| Minnesota (continued) | | | | | | | | | | | | | | | | |
St. Paul MN Housing & RDA Charter School Lease Revenue German Immersion School Project Series 2013A (Education Revenue) | | | 4.00 | % | | | 7-1-2023 | | | $ | 250,000 | | | $ | 257,548 | |
St. Paul MN Housing & RDA Charter School Lease Revenue Twin Cities Academy Project Series 2015A (Education Revenue) | | | 5.00 | | | | 7-1-2035 | | | | 925,000 | | | | 975,033 | |
St. Paul MN Housing & RDA Charter School Nova Classical Academy Project Series 2011A (Miscellaneous Revenue) | | | 6.63 | | | | 9-1-2042 | | | | 865,000 | | | | 1,005,071 | |
St. Paul MN Housing & RDA Health Care Facilities Revenue Refunding Bonds Series 2015A (Health Revenue) | | | 5.00 | | | | 7-1-2025 | | | | 250,000 | | | | 316,100 | |
St. Paul MN Housing & RDA HealthEast Care Systems Project Series 2015A (Health Revenue) | | | 4.00 | | | | 11-15-2017 | | | | 550,000 | | | | 570,994 | |
St. Paul MN Housing & RDA HealthEast Care Systems Project Series 2015A (Health Revenue) | | | 5.00 | | | | 11-15-2027 | | | | 1,000,000 | | | | 1,225,210 | |
St. Paul MN Housing & RDA HealthPartners Obligated Group Series 2015A (Health Revenue) | | | 5.00 | | | | 7-1-2031 | | | | 2,010,000 | | | | 2,467,376 | |
St. Paul MN Housing & RDA Hmong Academy Project Series A (Education Revenue) | | | 5.75 | | | | 9-1-2026 | | | | 650,000 | | | | 651,898 | |
St. Paul MN Housing & RDA Hmong Academy Project Series A (Education Revenue) | | | 6.00 | | | | 9-1-2036 | | | | 500,000 | | | | 501,530 | |
St. Paul MN Housing & RDA Hope Community Academy Project Series 2015A (Education Revenue) | | | 5.00 | | | | 12-1-2034 | | | | 1,645,000 | | | | 1,781,124 | |
St. Paul MN Housing & RDA Parking Facilities Project Series A (Transportation Revenue) | | | 5.00 | | | | 8-1-2035 | | | | 875,000 | | | | 962,106 | |
St. Paul MN Housing & RDA St. Paul Academy & Summit School Project (Education Revenue) | | | 5.00 | | | | 10-1-2024 | | | | 2,000,000 | | | | 2,096,740 | |
St. Paul MN Housing & RDA St. Paul Conservatory for Performing Artists Series A (Education Revenue) | | | 4.00 | | | | 3-1-2028 | | | | 150,000 | | | | 154,602 | |
St. Paul MN Housing RDA Healtheast Care System Project Series 2015A (Health Revenue) | | | 5.00 | | | | 11-15-2025 | | | | 1,000,000 | | | | 1,137,590 | |
St. Paul MN Port Authority Lease Revenue Freeman Office Building Series 2 (Miscellaneous Revenue) | | | 5.00 | | | | 12-1-2024 | | | | 2,000,000 | | | | 2,480,080 | |
Todd Morrison Cass & Wadena Counties MN United Hospital District Lakewood Health System Series 2004 (GO Revenue) | | | 5.13 | | | | 12-1-2024 | | | | 1,000,000 | | | | 1,003,560 | |
University of Minnesota Series 2009A (Education Revenue) | | | 5.00 | | | | 4-1-2021 | | | | 1,180,000 | | | | 1,311,830 | |
University of Minnesota Series 2009A (Education Revenue) | | | 5.13 | | | | 4-1-2034 | | | | 1,000,000 | | | | 1,116,790 | |
University of Minnesota Series 2016A (Education Revenue) | | | 5.00 | | | | 4-1-2032 | | | | 2,470,000 | | | | 3,179,137 | |
University of Minnesota State Supported Biomedical Science Series 2011B (Education Revenue) | | | 5.00 | | | | 8-1-2036 | | | | 1,000,000 | | | | 1,170,810 | |
University of Minnesota State Supported Stadium Debt Series 2006 (Education Revenue) | | | 5.00 | | | | 8-1-2025 | | | | 5,000,000 | | | | 5,019,650 | |
Virginia MN Housing & RDA HCFR Series 2005 (Miscellaneous Revenue) | | | 5.25 | | | | 10-1-2025 | | | | 2,085,000 | | | | 2,090,484 | |
Washington County MN Capital Improvement Plan Series A (GO Revenue) | | | 5.00 | | | | 2-1-2021 | | | | 2,495,000 | | | | 2,610,319 | |
Western Minnesota Municipal Power Agency Series A (Utilities Revenue) | | | 5.00 | | | | 1-1-2027 | | | | 1,565,000 | | | | 1,912,931 | |
Western Minnesota Municipal Power Agency Series A (Utilities Revenue) | | | 5.00 | | | | 1-1-2030 | | | | 1,000,000 | | | | 1,216,080 | |
Western Minnesota Municipal Power Agency Series A (Utilities Revenue) | | | 5.00 | | | | 1-1-2031 | | | | 1,000,000 | | | | 1,264,390 | |
Western Minnesota Municipal Power Agency Series A (Utilities Revenue) | | | 5.00 | | | | 1-1-2032 | | | | 1,250,000 | | | | 1,531,525 | |
Willmar MN Rice Memorial Hospital Project Series 2012A (GO Revenue) | | | 5.00 | | | | 2-1-2026 | | | | 1,000,000 | | | | 1,169,790 | |
Winona MN Health Care Facilities Refunding Bond Series 2012 (Health Revenue) | | | 3.00 | | | | 7-1-2018 | | | | 295,000 | | | | 302,815 | |
Winona MN Health Care Facilities Refunding Bond Series 2012 (Health Revenue) | | | 5.00 | | | | 7-1-2034 | | | | 500,000 | | | | 552,740 | |
Woodbury MN Charter School Series A (Education Revenue) | | | 3.15 | | | | 12-1-2018 | | | | 190,000 | | | | 194,951 | |
Woodbury MN Charter School Series A (Education Revenue) | | | 3.90 | | | | 12-1-2022 | | | | 220,000 | | | | 235,215 | |
Woodbury MN Charter School Series A (Education Revenue) | | | 5.00 | | | | 12-1-2027 | | | | 215,000 | | | | 234,470 | |
Woodbury MN Charter School Series A (Education Revenue) | | | 5.00 | | | | 12-1-2032 | | | | 220,000 | | | | 238,971 | |
| | | | |
| | | | | | | | | | | | | | | 173,511,555 | |
| | | | | | | | | | | | | | | | |
The accompanying notes are an integral part of these financial statements.
| | | | |
| 14 | | Wells Fargo Minnesota Tax-Free Fund | | Portfolio of investments—June 30, 2016 |
| | | | | | | | | | | | | | | | |
| Security name | | Interest rate | | | Maturity date | | | Principal | | | Value | |
| | | | | | | | | | | | | | | | |
| | | | |
| Puerto Rico: 0.74% | | | | | | | | | | | | | | | | |
Puerto Rico Electric Power Authority Refunding Bond Series KK (Utilities Revenue, National Insured) | | | 5.50 | % | | | 7-1-2016 | | | $ | 1,305,000 | | | $ | 1,305,131 | |
Puerto Rico Public Finance Corporation Commonwealth Appropriation Bond Series B (Miscellaneous Revenue, Government Development Bank for Puerto Rico SPA) (s) | | | 5.50 | | | | 8-1-2031 | | | | 250,000 | | | | 28,750 | |
| | | | |
| | | | | | | | | | | | | | | 1,333,881 | |
| | | | | | | | | | | | | | | | |
| | | | |
| Virgin Islands: 0.31% | | | | | | | | | | | | | | | | |
Virgin Islands PFA Matching Fund Loan Notes Senior Lien Series B (Miscellaneous Revenue, AGM Insured) | | | 5.00 | | | | 10-1-2025 | | | | 500,000 | | | | 563,845 | |
| | | | | | | | | | | | | | | | |
| | | | |
Total Municipal Obligations (Cost $167,386,909) | | | | | | | | | | | | | | | 178,653,669 | |
| | | | | | | | | | | | | | | | |
| | | | | | | | |
| Total investments in securities (Cost $167,386,909) * | | | 99.10 | % | | | 178,653,669 | |
Other assets and liabilities, net | | | 0.90 | | | | 1,626,461 | |
| | | | | | | | |
| Total net assets | | | 100.00 | % | | $ | 180,280,130 | |
| | | | | | | | |
| ± | Variable rate investment. The rate shown is the rate in effect at period end. |
| (m) | The security is an auction-rate security which has an interest rate that resets at predetermined short-term intervals through a Dutch auction. The rate shown is the rate in effect at period end. |
| (n) | The auction to set the interest rate on the security failed at period end due to insufficient investor interest. A failed auction does not itself cause a default. |
| ## | All or a portion of this security is segregated for when-issued securities. |
| 144A | The security may be resold in transactions exempt from registration, normally to qualified institutional buyers, pursuant to Rule 144A under the Securities Act of 1933. |
| %% | The security is issued on a when-issued basis. |
| ¤ | The security is issued in zero coupon form with no periodic interest payments. |
| (s) | The security is currently in default with regards to scheduled interest and/or principal payments. The Fund has stopped accruing interest on the security. |
| * | Cost for federal income tax purposes is $167,385,091 and unrealized gains (losses) consists of: |
| | | | |
Gross unrealized gains | | $ | 11,312,258 | |
Gross unrealized losses | | | (43,680 | ) |
| | | | |
Net unrealized gains | | $ | 11,268,578 | |
The accompanying notes are an integral part of these financial statements.
| | | | | | |
| Statement of assets and liabilities—June 30, 2016 | | Wells Fargo Minnesota Tax-Free Fund | | | 15 | |
| | | | |
| | | | |
| |
Assets | | | | |
Investment in unaffiliated securities, at value (cost $167,386,909) | | $ | 178,653,669 | |
Cash | | | 919,752 | |
Receivable for investments sold | | | 125,138 | |
Receivable for Fund shares sold | | | 186,242 | |
Receivable for interest | | | 2,343,699 | |
Prepaid expenses and other assets | | | 14,358 | |
| | | | |
Total assets | | | 182,242,858 | |
| | | | |
| |
Liabilities | | | | |
Dividends payable | | | 92,457 | |
Payable for investments purchased | | | 1,570,038 | |
Payable for Fund shares redeemed | | | 201,068 | |
Management fee payable | | | 24,470 | |
Distribution fee payable | | | 6,267 | |
Administration fees payable | | | 17,338 | |
Accrued expenses and other liabilities | | | 51,090 | |
| | | | |
Total liabilities | | | 1,962,728 | |
| | | | |
Total net assets | | $ | 180,280,130 | |
| | | | |
| |
NET ASSETS CONSIST OF | | | | |
Paid-in capital | | $ | 168,155,656 | |
Undistributed net investment income | | | 625,178 | |
Accumulated net realized gains on investments | | | 232,536 | |
Net unrealized gains on investments | | | 11,266,760 | |
| | | | |
Total net assets | | $ | 180,280,130 | |
| | | | |
| |
COMPUTATION OF NET ASSET VALUE AND OFFERING PRICE PER SHARE | | | | |
Net assets – Class A | | $ | 45,437,206 | |
Shares outstanding – Class A1 | | | 4,104,238 | |
Net asset value per share – Class A | | | $11.07 | |
Maximum offering price per share – Class A2 | | | $11.59 | |
Net assets – Class C | | $ | 10,358,189 | |
Shares outstanding – Class C1 | | | 935,677 | |
Net asset value per share – Class C | | | $11.07 | |
Net assets – Administrator Class | | $ | 124,484,735 | |
Shares outstanding – Administrator Class1 | | | 11,248,030 | |
Net asset value per share – Administrator Class | | | $11.07 | |
| 1 | The Fund has an unlimited number of authorized shares. |
| 2 | Maximum offering price is computed as 100/95.50 of net asset value. On investments of $50,000 or more, the offering price is reduced. |
The accompanying notes are an integral part of these financial statements.
| | | | |
| 16 | | Wells Fargo Minnesota Tax-Free Fund | | Statement of operations—year ended June 30, 2016 |
| | | | |
| | | | |
| |
Investment income | | | | |
Interest | | $ | 6,554,660 | |
| | | | |
| |
Expenses | | | | |
Management fee | | | 682,871 | |
Administration fees | | | | |
Class A | | | 71,822 | |
Class C | | | 15,949 | |
Administrator Class | | | 115,861 | |
Shareholder servicing fees | | | | |
Class A | | | 112,221 | |
Class C | | | 24,920 | |
Administrator Class | | | 289,653 | |
Distribution fee | | | | |
Class C | | | 74,761 | |
Custody and accounting fees | | | 9,793 | |
Professional fees | | | 46,669 | |
Registration fees | | | 38,961 | |
Shareholder report expenses | | | 13,769 | |
Trustees’ fees and expenses | | | 20,320 | |
Other fees and expenses | | | 9,827 | |
| | | | |
Total expenses | | | 1,527,397 | |
Less: Fee waivers and/or expense reimbursements | | | (291,187 | ) |
| | | | |
Net expenses | | | 1,236,210 | |
| | | | |
Net investment income | | | 5,318,450 | |
| | | | |
| |
REALIZED AND UNREALIZED GAINS (LOSSES) ON INVESTMENTS | | | | |
Net realized gains on investments | | | 288,003 | |
Net change in unrealized gains (losses) on investments | | | 4,267,904 | |
| | | | |
Net realized and unrealized gains (losses) on investments | | | 4,555,907 | |
| | | | |
Net increase in net assets resulting from operations | | $ | 9,874,357 | |
| | | | |
The accompanying notes are an integral part of these financial statements.
| | | | | | |
| Statement of changes in net assets | | Wells Fargo Minnesota Tax-Free Fund | | | 17 | |
| | | | | | | | | | | | | | | | |
| | | Year ended
June 30, 2016 | | | Year ended
June 30, 2015 | |
| | | |
Operations | | | | | | | | | | | | |
Net investment income | | | | | | $ | 5,318,450 | | | | | | | $ | 5,061,230 | |
Net realized gains on investments | | | | | | | 288,003 | | | | | | | | 467,383 | |
Net change in unrealized gains (losses) on investments | | | | | | | 4,267,904 | | | | | | | | (1,118,830 | ) |
| | | | |
Net increase in net assets resulting from operations | | | | | | | 9,874,357 | | | | | | | | 4,409,783 | |
| | | | |
| | | |
Distributions to shareholders from | | | | | | | | | | | | |
Net investment income | | | | | | | | | | | | | | | | |
Class A | | | | | | | (1,342,912 | ) | | | | | | | (1,363,496 | ) |
Class B | | | | | | | N/A | | | | | | | | (612 | )1 |
Class C | | | | | | | (223,290 | ) | | | | | | | (215,214 | ) |
Administrator Class | | | | | | | (3,752,248 | ) | | | | | | | (3,481,908 | ) |
Net realized gains | | | | | | | | | | | | | | | | |
Class A | | | | | | | (15,554 | ) | | | | | | | (138,361 | ) |
Class C | | | | | | | (3,355 | ) | | | | | | | (28,745 | ) |
Administrator Class | | | | | | | (39,659 | ) | | | | | | | (319,450 | ) |
| | | | |
Total distributions to shareholders | | | | | | | (5,377,018 | ) | | | | | | | (5,547,786 | ) |
| | | | |
| | | | |
Capital share transactions | | | Shares | | | | | | | | Shares | | | | | |
Proceeds from shares sold | | | | | | | | | | | | | | | | |
Class A | | | 361,762 | | | | 3,948,616 | | | | 469,808 | | | | 5,128,940 | |
Class C | | | 96,385 | | | | 1,052,616 | | | | 184,666 | | | | 2,013,042 | |
Administrator Class | | | 2,631,468 | | | | 28,640,215 | | | | 2,675,608 | | | | 29,172,385 | |
| | | | |
| | | | | | | 33,641,447 | | | | | | | | 36,314,367 | |
| | | | |
Reinvestment of distributions | | | | | | | | | | | | | | | | |
Class A | | | 123,205 | | | | 1,342,193 | | | | 135,870 | | | | 1,482,869 | |
Class B | | | N/A | | | | N/A | | | | 54 | 1 | | | 592 | 1 |
Class C | | | 20,786 | | | | 226,424 | | | | 22,312 | | | | 243,436 | |
Administrator Class | | | 241,208 | | | | 2,627,645 | | | | 233,860 | | | | 2,551,103 | |
| | | | |
| | | | | | | 4,196,262 | | | | | | | | 4,278,000 | |
| | | | |
Payment for shares redeemed | | | | | | | | | | | | | | | | |
Class A | | | (592,484 | ) | | | (6,450,893 | ) | | | (491,780 | ) | | | (5,365,514 | ) |
Class B | | | N/A | | | | N/A | | | | (7,573 | )1 | | | (82,744 | )1 |
Class C | | | (114,142 | ) | | | (1,239,380 | ) | | | (81,777 | ) | | | (890,891 | ) |
Administrator Class | | | (1,961,032 | ) | | | (21,337,031 | ) | | | (1,644,985 | ) | | | (17,973,787 | ) |
| | | | |
| | | | | | | (29,027,304 | ) | | | | | | | (24,312,936 | ) |
| | | | |
Net increase in net assets resulting from capital share transactions | | | | | | | 8,810,405 | | | | | | | | 16,279,431 | |
| | | | |
Total increase in net assets | | | | | | | 13,307,744 | | | | | | | | 15,141,428 | |
| | | | |
| | |
Net assets | | | | | | | | |
Beginning of period | | | | | | | 166,972,386 | | | | | | | | 151,830,958 | |
| | | | |
End of period | | | | | | $ | 180,280,130 | | | | | | | $ | 166,972,386 | |
| | | | |
Undistributed net investment income | | | | | | $ | 625,178 | | | | | | | $ | 573,849 | |
| | | | |
| 1 | For the period from July 1, 2014 to December 9, 2014, Class B shares of the Fund were no longer offered to shareholders effective December 10, 2014. |
The accompanying notes are an integral part of these financial statements.
| | | | |
| 18 | | Wells Fargo Minnesota Tax-Free Fund | | Financial highlights |
(For a share outstanding throughout each period)
| | | | | | | | | | | | | | | | | | | | |
| | | Year ended June 30 | |
| CLASS A | | 2016 | | | 2015 | | | 2014 | | | 2013 | | | 2012 | |
Net asset value, beginning of period | | | $10.79 | | | | $10.86 | | | | $10.74 | | | | $11.08 | | | | $10.68 | |
Net investment income | | | 0.33 | | | | 0.33 | | | | 0.35 | | | | 0.32 | | | | 0.37 | |
Net realized and unrealized gains (losses) on investments | | | 0.28 | | | | (0.04 | ) | | | 0.20 | | | | (0.31 | ) | | | 0.55 | |
| | | | | | | | | | | | | | | | | | | | |
Total from investment operations | | | 0.61 | | | | 0.29 | | | | 0.55 | | | | 0.01 | | | | 0.92 | |
Distributions to shareholders from | | | | | | | | | | | | | | | | | | | | |
Net investment income | | | (0.33 | ) | | | (0.33 | ) | | | (0.35 | ) | | | (0.32 | ) | | | (0.37 | ) |
Net realized gains | | | (0.00 | )1 | | | (0.03 | ) | | | (0.08 | ) | | | (0.03 | ) | | | (0.15 | ) |
| | | | | | | | | | | | | | | | | | | | |
Total distributions to shareholders | | | (0.33 | ) | | | (0.36 | ) | | | (0.43 | ) | | | (0.35 | ) | | | (0.52 | ) |
Net asset value, end of period | | | $11.07 | | | | $10.79 | | | | $10.86 | | | | $10.74 | | | | $11.08 | |
Total return2 | | | 5.74 | % | | | 2.72 | % | | | 5.29 | % | | | (0.01 | )% | | | 8.80 | % |
Ratios to average net assets (annualized) | | | | | | | | | | | | | | | | | | | | |
Gross expenses | | | 0.89 | % | | | 0.89 | % | | | 0.89 | % | | | 0.88 | % | | | 0.89 | % |
Net expenses | | | 0.85 | % | | | 0.85 | % | | | 0.85 | % | | | 0.85 | % | | | 0.85 | % |
Net investment income | | | 2.99 | % | | | 3.03 | % | | | 3.28 | % | | | 2.87 | % | | | 3.35 | % |
Supplemental data | | | | | | | | | | | | | | | | | | | | |
Portfolio turnover rate | | | 16 | %3 | | | 20 | %3 | | | 15 | %3 | | | 14 | %3 | | | 36 | % |
Net assets, end of period (000s omitted) | | | $45,437 | | | | $45,437 | | | | $44,499 | | | | $49,535 | | | | $52,550 | |
| 1 | Amount is less than $0.005. |
| 2 | Total return calculations do not include any sales charges. |
| 3 | Portfolio turnover rate excludes variable rate demand notes which may account for changes from rates reported in prior periods. |
The accompanying notes are an integral part of these financial statements.
| | | | | | |
| Financial highlights | | Wells Fargo Minnesota Tax-Free Fund | | | 19 | |
(For a share outstanding throughout each period)
| | | | | | | | | | | | | | | | | | | | |
| | | Year ended June 30 | |
| CLASS C | | 2016 | | | 2015 | | | 2014 | | | 2013 | | | 2012 | |
Net asset value, beginning of period | | | $10.79 | | | | $10.86 | | | | $10.74 | | | | $11.08 | | | | $10.68 | |
Net investment income | | | 0.24 | | | | 0.25 | | | | 0.27 | | | | 0.24 | | | | 0.28 | |
Net realized and unrealized gains (losses) on investments | | | 0.28 | | | | (0.04 | ) | | | 0.20 | | | | (0.31 | ) | | | 0.55 | |
| | | | | | | | | | | | | | | | | | | | |
Total from investment operations | | | 0.52 | | | | 0.21 | | | | 0.47 | | | | (0.07 | ) | | | 0.83 | |
Distributions to shareholders from | | | | | | | | | | | | | | | | | | | | |
Net investment income | | | (0.24 | ) | | | (0.25 | ) | | | (0.27 | ) | | | (0.24 | ) | | | (0.28 | ) |
Net realized gains | | | (0.00 | )1 | | | (0.03 | ) | | | (0.08 | ) | | | (0.03 | ) | | | (0.15 | ) |
| | | | | | | | | | | | | | | | | | | | |
Total distributions to shareholders | | | (0.24 | ) | | | (0.28 | ) | | | (0.35 | ) | | | (0.27 | ) | | | (0.43 | ) |
Net asset value, end of period | | | $11.07 | | | | $10.79 | | | | $10.86 | | | | $10.74 | | | | $11.08 | |
Total return2 | | | 4.95 | % | | | 1.96 | % | | | 4.50 | % | | | (0.76 | )% | | | 7.99 | % |
Ratios to average net assets (annualized) | | | | | | | | | | | | | | | | | | | | |
Gross expenses | | | 1.64 | % | | | 1.64 | % | | | 1.64 | % | | | 1.63 | % | | | 1.64 | % |
Net expenses | | | 1.60 | % | | | 1.60 | % | | | 1.60 | % | | | 1.60 | % | | | 1.60 | % |
Net investment income | | | 2.24 | % | | | 2.28 | % | | | 2.53 | % | | | 2.12 | % | | | 2.58 | % |
Supplemental data | | | | | | | | | | | | | | | | | | | | |
Portfolio turnover rate | | | 16 | %3 | | | 20 | %3 | | | 15 | %3 | | | 14 | %3 | | | 36 | % |
Net assets, end of period (000s omitted) | | | $10,358 | | | | $10,061 | | | | $8,768 | | | | $8,972 | | | | $9,144 | |
| 1 | Amount is less than $0.005. |
| 2 | Total return calculations do not include any sales charges. |
| 3 | Portfolio turnover rate excludes variable rate demand notes which may account for changes from rates reported in prior periods. |
The accompanying notes are an integral part of these financial statements.
| | | | |
| 20 | | Wells Fargo Minnesota Tax-Free Fund | | Financial highlights |
(For a share outstanding throughout each period)
| | | | | | | | | | | | | | | | | | | | |
| | | Year ended June 30 | |
| ADMINISTRATOR CLASS | | 2016 | | | 2015 | | | 2014 | | | 2013 | | | 2012 | |
Net asset value, beginning of period | | | $10.78 | | | | $10.86 | | | | $10.74 | | | | $11.07 | | | | $10.68 | |
Net investment income | | | 0.35 | | | | 0.36 | | | | 0.38 | | | | 0.35 | | | | 0.39 | |
Net realized and unrealized gains (losses) on investments | | | 0.29 | | | | (0.05 | ) | | | 0.20 | | | | (0.30 | ) | | | 0.54 | |
| | | | | | | | | | | | | | | | | | | | |
Total from investment operations | | | 0.64 | | | | 0.31 | | | | 0.58 | | | | 0.05 | | | | 0.93 | |
Distributions to shareholders from | | | | | | | | | | | | | | | | | | | | |
Net investment income | | | (0.35 | ) | | | (0.36 | ) | | | (0.38 | ) | | | (0.35 | ) | | | (0.39 | ) |
Net realized gains | | | (0.00 | )1 | | | (0.03 | ) | | | (0.08 | ) | | | (0.03 | ) | | | (0.15 | ) |
| | | | | | | | | | | | | | | | | | | | |
Total distributions to shareholders | | | (0.35 | ) | | | (0.39 | ) | | | (0.46 | ) | | | (0.38 | ) | | | (0.54 | ) |
Net asset value, end of period | | | $11.07 | | | | $10.78 | | | | $10.86 | | | | $10.74 | | | | $11.07 | |
Total return | | | 6.10 | % | | | 2.88 | % | | | 5.55 | % | | | 0.32 | % | | | 8.97 | % |
Ratios to average net assets (annualized) | | | | | | | | | | | | | | | | | | | | |
Gross expenses | | | 0.83 | % | | | 0.83 | % | | | 0.83 | % | | | 0.82 | % | | | 0.83 | % |
Net expenses | | | 0.60 | % | | | 0.60 | % | | | 0.60 | % | | | 0.60 | % | | | 0.60 | % |
Net investment income | | | 3.24 | % | | | 3.28 | % | | | 3.53 | % | | | 3.11 | % | | | 3.59 | % |
Supplemental data | | | | | | | | | | | | | | | | | | | | |
Portfolio turnover rate | | | 16 | %2 | | | 20 | %2 | | | 15 | %2 | | | 14 | %2 | | | 36 | % |
Net assets, end of period (000s omitted) | | | $124,485 | | | | $111,475 | | | | $98,483 | | | | $98,992 | | | | $109,637 | |
| 1 | Amount is less than $0.005. |
| 2 | Portfolio turnover rate excludes variable rate demand notes which may account for changes from rates reported in prior periods. |
The accompanying notes are an integral part of these financial statements.
| | | | | | |
| Notes to financial statements | | Wells Fargo Minnesota Tax-Free Fund | | | 21 | |
1. ORGANIZATION
Wells Fargo Funds Trust (the “Trust”), a Delaware statutory trust organized on March 10, 1999, is an open-end management investment company registered under the Investment Company Act of 1940, as amended (the “1940 Act”). As an investment company, the Trust follows the accounting and reporting guidance in Financial Accounting Standards Board (“FASB”) Accounting Standards Codification Topic 946, Financial Services – Investment Companies. These financial statements report on the Wells Fargo Minnesota Tax-Free Fund (the “Fund”) which is a diversified series of the Trust.
2. SIGNIFICANT ACCOUNTING POLICIES
The following significant accounting policies, which are consistently followed in the preparation of the financial statements of the Fund, are in conformity with U.S. generally accepted accounting principles which require management to make estimates and assumptions that affect the reported amounts of assets and liabilities, disclosure of contingent assets and liabilities at the date of the financial statements, and the reported amounts of revenues and expenses during the reporting period. Actual results could differ from those estimates.
Securities valuation
All investments are valued each business day as of the close of regular trading on the New York Stock Exchange (generally 4 p.m. Eastern Time), although a Fund may deviate from this calculation time under unusual or unexpected circumstances.
Debt securities are valued at the evaluated bid price provided by an independent pricing service or, if a reliable price is not available, the quoted bid price from an independent broker-dealer.
Investments which are not valued using any of the methods discussed above are valued at their fair value, as determined in good faith by the Board of Trustees of the Fund. The Board of Trustees has established a Valuation Committee comprised of the Trustees and has delegated to it the authority to take any actions regarding the valuation of portfolio securities that the Valuation Committee deems necessary or appropriate, including determining the fair value of portfolio securities, unless the determination has been delegated to the Management Valuation Team of Wells Fargo Funds Management, LLC (“Funds Management”). The Board of Trustees retains the authority to make or ratify any valuation decisions or approve any changes to the Valuation Procedures as it deems appropriate. On a quarterly basis, the Board of Trustees receives reports on any valuation actions taken by the Valuation Committee or the Management Valuation Team which may include items for ratification.
Valuations of fair valued securities are compared to the next actual sales price when available, or other appropriate market values, to assess the continued appropriateness of the fair valuation methodologies used. These securities are fair valued on a day-to-day basis, taking into consideration changes to appropriate market information and any significant changes to the inputs considered in the valuation process until there is a readily available price provided on an exchange or by an independent pricing service. Valuations received from an independent pricing service or independent broker-dealer quotes are periodically validated by comparisons to most recent trades and valuations provided by other independent pricing services in addition to the review of prices by the manager and/or subadviser. Unobservable inputs used in determining fair valuations are identified based on the type of security, taking into consideration factors utilized by market participants in valuing the investment, knowledge about the issuer and the current market environment.
When-issued transactions
The Fund may purchase securities on a forward commitment or when-issued basis. The Fund records a when-issued transaction on the trade date and will segregate assets in an amount at least equal in value to the Fund’s commitment to purchase when-issued securities. Securities purchased on a when-issued basis are marked-to-market daily and the Fund begins earning interest on the settlement date. Losses may arise due to changes in the market value of the underlying securities or if the counterparty does not perform under the contract.
Security transactions and income recognition
Securities transactions are recorded on a trade date basis. Realized gains or losses are recorded on the basis of identified cost.
Interest income is accrued daily and bond discounts are accreted and premiums are amortized daily based on the effective interest method. To the extent debt obligations are placed on non-accrual status, any related interest income may be reduced by writing off interest receivables when the collection of all or a portion of interest has become doubtful based on consistently applied procedures. If the issuer subsequently resumes interest payments or when the collectability of interest is reasonably assured, the debt obligation is removed from non-accrual status.
| | | | |
| 22 | | Wells Fargo Minnesota Tax-Free Fund | | Notes to financial statements |
Distributions to shareholders
Distributions to shareholders from net investment income are accrued daily and paid monthly. Distributions from net realized gains, if any, are recorded on the ex-dividend date. Such distributions are determined in conformity with federal income tax regulations, which may differ in amount or character from net investment income and realized gains recognized for purposes of U.S. generally accepted accounting principles.
Federal and other taxes
The Fund intends to continue to qualify as a regulated investment company by distributing substantially all of its investment company taxable and tax-exempt income and any net realized capital gains (after reduction for capital loss carryforwards) sufficient to relieve it from all, or substantially all, federal income taxes. Accordingly, no provision for federal income taxes was required.
The Fund’s income and federal excise tax returns and all financial records supporting those returns for the prior three fiscal years are subject to examination by the federal and Delaware revenue authorities. Management has analyzed the Fund’s tax positions taken on federal, state, and foreign tax returns for all open tax years and does not believe that there are any uncertain tax positions that require recognition of a tax liability.
Reclassifications are made to the Fund’s capital accounts for permanent tax differences to reflect income and gains available for distribution (or available capital loss carryforwards) under federal income tax regulations. U.S. generally accepted accounting principles require that certain components of net assets be adjusted to reflect permanent differences between financial and tax reporting. These reclassifications have no effect on net assets or net asset values per share. The primary permanent difference causing such reclassification is due to market discount. At June 30, 2016, as a result of permanent book-to-tax differences, the following reclassification adjustments were made on the Statement of Assets and Liabilities:
| | |
Undistributed
net investment
income | | Accumulated
net realized
gains on
investments |
| $51,329 | | $(51,329) |
Class allocations
The separate classes of shares offered by the Fund differ principally in applicable sales charges, distribution, shareholder servicing, and administration fees. Class specific expenses are charged directly to that share class. Investment income, common expenses, and realized and unrealized gains (losses) on investments are allocated daily to each class of shares based on the relative proportion of net assets of each class.
3. FAIR VALUATION MEASUREMENTS
Fair value measurements of investments are determined within a framework that has established a fair value hierarchy based upon the various data inputs utilized in determining the value of the Fund’s investments. The three-level hierarchy gives the highest priority to unadjusted quoted prices in active markets for identical assets or liabilities (Level 1) and the lowest priority to significant unobservable inputs (Level 3). The Fund’s investments are classified within the fair value hierarchy based on the lowest level of input that is significant to the fair value measurement. The inputs are summarized into three broad levels as follows:
| n | | Level 1 – quoted prices in active markets for identical securities |
| n | | Level 2 – other significant observable inputs (including quoted prices for similar securities, interest rates, prepayment speeds, credit risk, use of amortized cost, etc.) |
| n | | Level 3 – significant unobservable inputs (including the Fund’s own assumptions in determining the fair value of investments) |
The inputs or methodologies used for valuing investments in securities are not necessarily an indication of the risk associated with investing in those securities.
| | | | | | |
| Notes to financial statements | | Wells Fargo Minnesota Tax-Free Fund | | | 23 | |
The following is a summary of the inputs used in valuing the Fund’s assets and liabilities as of June 30, 2016:
| | | | | | | | | | | | | | | | |
| | | Quoted prices
(Level 1) | | | Other significant
observable inputs
(Level 2) | | | Significant
unobservable inputs (Level 3) | | | Total | |
Assets | | | | | | | | | | | | | | | | |
Investments in: | | | | | | | | | | | | | | | | |
| | | | |
Municipal obligations | | $ | 0 | | | $ | 178,653,669 | | | $ | 0 | | | $ | 178,653,669 | |
The Fund recognizes transfers between levels within the fair value hierarchy at the end of the reporting period. At June 30, 2016, the Fund did not have any transfers into/out of Level 1. The Fund had no material transfers between Level 2 and Level 3.
4. TRANSACTIONS WITH AFFILIATES
Management fee
Funds Management, an indirect wholly owned subsidiary of Wells Fargo & Company (“Wells Fargo”), is the manager of the Fund and provides advisory and fund-level administrative services under an investment management agreement. Under the investment management agreement, Funds Management is responsible for, among other services, implementing the investment objectives and strategies of the Fund, supervising the subadviser, providing fund-level administrative services in connection with the Fund’s operations, and providing any other fund-level administrative services reasonably necessary for the operation of the Fund. As compensation for its services under the investment management agreement, Funds Management is entitled to receive an annual management fee starting at 0.40% and declining to 0.28% as the average daily net assets of the Fund increase. For the year ended June 30, 2016, the management fee was equivalent to an annual rate of 0.40% of the Fund’s average daily net assets.
Funds Management has retained the services of a subadviser to provide daily portfolio management to the Fund. The fee for subadvisory services is borne by Funds Management. Wells Capital Management Incorporated, an affiliate of Funds Management and an indirect wholly owned subsidiary of Wells Fargo, is the subadviser to the Fund and is entitled to receive a fee from Funds Management at an annual rate starting at 0.20% and declining to 0.10% as the average daily net assets of the Fund increase.
Administration fees
Under a class-level administration agreement, Funds Management provides class-level administrative services to the Fund, which includes paying fees and expenses for services provided by the transfer agent, sub-transfer agents, omnibus account servicers and record-keepers. As compensation for its services under the class-level administration agreement, Funds Management receives an annual fee which is calculated based on the average daily net assets of each class as follows:
| | | | |
| | | Class-level
administration fee | |
Class A, Class C | | | 0.16 | % |
Administrator Class | | | 0.10 | |
Funds Management has contractually waived and/or reimbursed management and administration fees to the extent necessary to maintain certain net operating expense ratios for the Fund. Waiver of fees and/or reimbursement of expenses by Funds Management were made first from fund level expenses on a proportionate basis and then from class specific expenses. Funds Management has committed through October 31, 2016 to waive fees and/or reimburse expenses to the extent necessary to cap the Fund’s expenses at 0.85% for Class A shares, 1.60% for Class C shares, and 0.60 for Administrator Class shares. After this time, the cap may be increased or the commitment to maintain the cap may be terminated only with the approval of the Board of Trustees.
Distribution fee
The Trust has adopted a distribution plan for Class C shares of the Fund pursuant to Rule 12b-1 under the 1940 Act. A distribution fee is charged to Class C shares and paid to Wells Fargo Funds Distributor, LLC (“Funds Distributor”), the principal underwriter, at an annual rate of 0.75% of the average daily net assets of Class C shares.
| | | | |
| 24 | | Wells Fargo Minnesota Tax-Free Fund | | Notes to financial statements |
In addition, Funds Distributor is entitled to receive the front-end sales charge from the purchase of Class A shares and a contingent deferred sales charge on the redemption of certain Class A shares. Funds Distributor is also entitled to receive the contingent deferred sales charges from redemptions of Class C shares. For the year ended June 30, 2016, Funds Distributor received $4,408 from the sale of Class A shares.
Shareholder servicing fees
The Trust has entered into contracts with one or more shareholder servicing agents, whereby Class A, Class C, and Administrator Class of the Fund are charged a fee at an annual rate of 0.25% of the average daily net assets of each respective class.
A portion of these total shareholder servicing fees were paid to affiliates of Wells Fargo.
5. INVESTMENT PORTFOLIO TRANSACTIONS
Purchases and sales of investments, excluding U.S. government obligations (if any) and short-term securities, for the year ended June 30, 2016 were $41,427,030 and $27,198,046, respectively.
The Fund may purchase or sell investment securities to other Wells Fargo funds under procedures adopted by the Board of Trustees. The procedures have been designed to ensure that these interfund transactions, which generally do not incur broker commissions, are effected at current market prices. Interfund trades are included within the respective purchases and sales amounts shown.
6. BANK BORROWINGS
The Trust (excluding the money market funds and certain other funds) and Wells Fargo Variable Trust are parties to a $200,000,000 revolving credit agreement whereby the Fund is permitted to use bank borrowings for temporary or emergency purposes, such as to fund shareholder redemption requests. Interest under the credit agreement is charged to the Fund based on a borrowing rate equal to the higher of the Federal Funds rate in effect on that day plus 1.25% or the overnight LIBOR rate in effect on that day plus 1.25%. In addition, an annual commitment fee equal to 0.20% of the unused balance is allocated to each participating fund. Prior to September 1, 2015, the revolving credit agreement amount was $150,000,000 and the annual commitment fee was equal to 0.10% of the unused balance which was allocated to each participating fund
For the year ended June 30, 2016, there were no borrowings by the Fund under the agreement.
7. DISTRIBUTIONS TO SHAREHOLDERS
The tax character of distributions paid during the years ended June 30, 2016 and June 30, 2015 were as follows:
| | | | | | | | |
| | | Year ended June 30 | |
| | | 2016 | | | 2015 | |
Ordinary income | | $ | 13,326 | | | $ | 130,687 | |
Tax-exempt income | | | 5,318,450 | | | | 5,061,230 | |
Long-term capital gain | | | 45,242 | | | | 355,869 | |
As of June 30, 2016, the components of distributable earnings on a tax basis were as follows:
| | | | |
Undistributed tax-exempt income | | Undistributed long-term gain | | Unrealized gains |
$717,631 | | $230,722 | | $11,268,578 |
8. CONCENTRATION RISK
The Fund invests a substantial portion of its assets in issuers of municipal debt securities located in a single state or territories of the U.S. Therefore, it may be more affected by economic and political developments in that state or region than would be a comparable general tax-exempt fund.
9. INDEMNIFICATION
Under the Trust’s organizational documents, the officers and Trustees have been granted certain indemnification rights against certain liabilities that may arise out of performance of their duties to the Trust. Additionally, in the normal course of business, the Trust may enter into contracts with service providers that contain a variety of indemnification clauses. The Trust’s maximum exposure under these arrangements is dependent on future claims that may be made against the Fund and, therefore, cannot be estimated.
| | | | | | |
| Report of independent registered public accounting firm | | Wells Fargo Minnesota Tax-Free Fund | | | 25 | |
BOARD OF TRUSTEES AND SHAREHOLDERS OF WELLS FARGO FUNDS TRUST:
We have audited the accompanying statement of assets and liabilities, including the portfolio of investments, of the Wells Fargo Minnesota Tax-Free Fund (formerly known as Wells Fargo Advantage Minnesota Tax-Free Fund) (the “Fund”), one of the funds constituting the Wells Fargo Funds Trust, as of June 30, 2016, and the related statement of operations for the year then ended, the statements of changes in net assets for each of the years in the two-year period then ended, and the financial highlights for each of the years in the five-year period then ended. These financial statements and financial highlights are the responsibility of the Fund’s management. Our responsibility is to express an opinion on these financial statements and financial highlights based on our audits.
We conducted our audits in accordance with the standards of the Public Company Accounting Oversight Board (United States). Those standards require that we plan and perform the audit to obtain reasonable assurance about whether the financial statements and financial highlights are free of material misstatement. An audit includes examining, on a test basis, evidence supporting the amounts and disclosures in the financial statements. Our procedures included confirmation of securities owned as of June 30, 2016, by correspondence with custodians and brokers, or by other appropriate auditing procedures. An audit also includes assessing the accounting principles used and significant estimates made by management, as well as evaluating the overall financial statement presentation. We believe that our audits provide a reasonable basis for our opinion.
In our opinion, the financial statements and financial highlights referred to above present fairly, in all material respects, the financial position of the Wells Fargo Minnesota Tax-Free Fund as of June 30, 2016, and the results of its operations for the year then ended, the changes in its net assets for each of the years in the two-year period then ended, and the financial highlights for each of the years in the five-year period then ended, in conformity with U.S. generally accepted accounting principles.

Boston, Massachusetts
August 25, 2016
| | | | |
| 26 | | Wells Fargo Minnesota Tax-Free Fund | | Other information (unaudited) |
TAX INFORMATION
Pursuant to Section 852 of the Internal Revenue Code, $45,242 was designated as a 20% rate gain distribution for the fiscal year ended June 30, 2016.
For the fiscal year ended June 30, 2016, $13,326 has been designated as short-term capital gain dividends for nonresident alien shareholders pursuant to Section 871 of the Internal Revenue Code.
Pursuant to Section 852 of the Internal Revenue Code, 100% of distributions paid from net investment income is designated as exempt-interest dividends for the fiscal year ended June 30, 2016.
PROXY VOTING INFORMATION
A description of the policies and procedures that the Fund uses to determine how to vote proxies relating to portfolio securities is available, upon request, by calling 1-800-222-8222, visiting our website at wellsfargofunds.com, or visiting the SEC website at sec.gov. Information regarding how the Fund voted proxies relating to portfolio securities during the most recent 12-month period ended June 30 is available on the Fund’s website at wellsfargofunds.com or by visiting the SEC website at sec.gov.
PORTFOLIO HOLDINGS INFORMATION
The complete portfolio holdings for the Fund are publicly available monthly on the Fund’s website (wellsfargofunds.com), on a one-month delayed basis. In addition, top ten holdings information (excluding derivative positions) for the Fund is publicly available on the Fund’s website on a monthly, seven-day or more delayed basis. The Fund files its complete schedule of portfolio holdings with the SEC for the first and third quarters of each fiscal year on Form N-Q, which is available by visiting the SEC website at sec.gov. In addition, the Fund’s Form N-Q may be reviewed and copied at the SEC’s Public Reference Room in Washington, DC, and at regional offices in New York City, at
233 Broadway, and in Chicago, at 175 West Jackson Boulevard, Suite 900. Information about the Public Reference Room may be obtained by calling 1-800-SEC-0330.
| | | | | | |
| Other information (unaudited) | | Wells Fargo Minnesota Tax-Free Fund | | | 27 | |
BOARD OF TRUSTEES AND OFFICERS
Each of the Trustees and Officers1 listed in the table below acts in identical capacities for each fund in the Wells Fargo family of funds, which consists of 142 mutual funds comprising the Wells Fargo Funds Trust, Wells Fargo Variable Trust, Wells Fargo Master Trust and four closed-end funds (collectively the “Fund Complex”). This table should be read in conjunction with the Prospectus and the Statement of Additional Information2. The mailing address of each Trustee and Officer is 525 Market Street, 12th Floor, San Francisco, CA 94105. Each Trustee and Officer serves an indefinite term, however, each Trustee serves such term until reaching the mandatory retirement age established by the Trustees.
Independent Trustees
| | | | | | |
Name and
year of birth | | Position held and
length of service* | | Principal occupations during past five years or longer | | Current other public
company or investment
company directorships |
William R. Ebsworth
(Born 1957) | | Trustee, since 2015 | | Retired. From 1984 to 2013, equities analyst, portfolio manager, research director and chief financial officer at Fidelity Management and Research Company in Boston, Tokyo, and Hong Kong and retired in 2013 as Chief Investment Officer of Fidelity Strategic Advisers, Inc. where he lead a team of investment professionals managing client assets. Prior thereto, Board member of Hong Kong Securities Clearing Co., Hong Kong Options Clearing Corp., the Thailand International Fund, Ltd., Fidelity Investments Life Insurance Company, and Empire Fidelity Investments Life Insurance Company. Mr. Ebsworth is a CFA® charterholder and an Adjunct Lecturer, Finance, at Babson College. | | Asset Allocation Trust |
Jane A. Freeman
(Born 1953) | | Trustee, since 2015 | | Retired. From 2012 to 2014 and 1999 to 2008, Chief Financial Officer of Scientific Learning Corporation. From 2008 to 2012, Ms. Freeman provided consulting services related to strategic business projects. Prior to 1999, Portfolio Manager at Rockefeller & Co. and Scudder, Stevens & Clark. Board member of the Harding Loevner Funds from 1996 to 2014, serving as both Lead Independent Director and chair of the Audit Committee. Board member of the Russell Exchange Traded Funds Trust from 2011 to 2012 and the chair of the Audit Committee. Ms. Freeman is Chair of Taproot Foundation (non-profit organization), a Board Member of Ruth Bancroft Garden (non-profit organization) and an inactive chartered financial analyst. | | Asset Allocation Trust |
Peter G. Gordon
(Born 1942) | | Trustee, since 1998; Chairman, since 2005 | | Co-Founder, Retired Chairman, President and CEO of Crystal Geyser Water Company. Trustee Emeritus, Colby College. | | Asset Allocation Trust |
Isaiah Harris, Jr.
(Born 1952) | | Trustee, since 2009 | | Retired. Chairman of the Board of CIGNA Corporation since 2009, and Director since 2005. From 2003 to 2011, Director of Deluxe Corporation. Prior thereto, President and CEO of BellSouth Advertising and Publishing Corp. from 2005 to 2007, President and CEO of BellSouth Enterprises from 2004 to 2005 and President of BellSouth Consumer Services from 2000 to 2003. Emeritus member of the Iowa State University Foundation Board of Governors. Emeritus Member of the Advisory Board of Iowa State University School of Business. Advisory Board Member, Palm Harbor Academy (charter school). Advisory Board Member, Child Evangelism Fellowship (non-profit). Mr. Harris is a certified public accountant (inactive status). | | CIGNA Corporation; Asset Allocation Trust |
Judith M. Johnson
(Born 1949) | | Trustee, since 2008; Audit Committee Chairman, since 2008 | | Retired. Prior thereto, Chief Executive Officer and Chief Investment Officer of Minneapolis Employees Retirement Fund from 1996 to 2008. Ms. Johnson is an attorney, certified public accountant and a certified managerial accountant. | | Asset Allocation Trust |
David F. Larcker
(Born 1950) | | Trustee, since 2009 | | James Irvin Miller Professor of Accounting at the Graduate School of Business, Stanford University, Director of the Corporate Governance Research Initiative and Senior Faculty of The Rock Center for Corporate Governance since 2006. From 2005 to 2008, Professor of Accounting at the Graduate School of Business, Stanford University. Prior thereto, Ernst & Young Professor of Accounting at The Wharton School, University of Pennsylvania from 1985 to 2005. | | Asset Allocation Trust |
| | | | |
| 28 | | Wells Fargo Minnesota Tax-Free Fund | | Other information (unaudited) |
| | | | | | |
Name and
year of birth | | Position held and
length of service* | | Principal occupations during past five years or longer | | Current other public
company or investment
company directorships |
Olivia S. Mitchell
(Born 1953) | | Trustee, since 2006 | | International Foundation of Employee Benefit Plans Professor, Wharton School of the University of Pennsylvania since 1993. Director of Wharton’s Pension Research Council and Boettner Center on Pensions & Retirement Research, and Research Associate at the National Bureau of Economic Research. Previously, Cornell University Professor from 1978 to 1993. | | Asset Allocation Trust |
Timothy J. Penny
(Born 1951) | | Trustee, since 1996 | | President and Chief Executive Officer of Southern Minnesota Initiative Foundation, a non-profit organization, since 2007 and Senior Fellow at the Humphrey Institute Policy Forum at the University of Minnesota since 1995. Member of the Board of Trustees of NorthStar Education Finance, Inc., a non-profit organization, since 2007. | | Asset Allocation Trust |
Michael S. Scofield
(Born 1943) | | Trustee, since 2010 | | Served on the Investment Company Institute’s Board of Governors and Executive Committee from 2008-2011 as well the Governing Council of the Independent Directors Council from 2006-2011 and the Independent Directors Council Executive Committee from 2008-2011. Chairman of the IDC from 2008-2010. Institutional Investor (Fund Directions) Trustee of Year in 2007. Trustee of the Evergreen Funds complex (and its predecessors) from 1984 to 2010. Chairman of the Evergreen Funds from 2000-2010. Former Trustee of the Mentor Funds. Retired Attorney, Law Offices of Michael S. Scofield. | | Asset Allocation Trust |
| * | Length of service dates reflect the Trustee’s commencement of service with the Trust’s predecessor entities, where applicable. |
Officers
| | | | | | |
Name and
year of birth | | Position held and
length of service | | Principal occupations during past five years or longer | | |
Karla M. Rabusch
(Born 1959) | | President, since 2003 | | Executive Vice President of Wells Fargo Bank, N.A. and President of Wells Fargo Funds Management, LLC since 2003. | | |
Nancy Wiser1
(Born 1967) | | Treasurer, since 2012 | | Executive Vice President of Wells Fargo Funds Management, LLC since 2011. Chief Operating Officer and Chief Compliance Officer at LightBox Capital Management LLC, from 2008 to 2011. | | |
C. David Messman
(Born 1960) | | Secretary, since 2000; Chief Legal Officer, since 2003 | | Senior Vice President and Secretary of Wells Fargo Funds Management, LLC since 2001. Assistant General Counsel of Wells Fargo Bank, N.A. since 2013 and Vice President and Managing Counsel of Wells Fargo Bank, N.A. from 1996 to 2013. | | |
Michael Whitaker
(Born 1967) | | Chief Compliance Officer, since 2016* | | Executive Vice President of Wells Fargo Funds Management, LLC since 2016. Chief Compliance Officer of Fidelity’s Fixed Income Funds and Asset Allocation Funds from 2008 to 2016, Compliance Officer of FMR Co., Inc. from 2014 to 2016, Fidelity Investments Money Management, Inc. from 2014 to 2016, Fidelity Investments from 2007 to 2016. | | |
David Berardi
(Born 1975) | | Assistant Treasurer, since 2009 | | Vice President of Wells Fargo Funds Management, LLC since 2009. Vice President of Evergreen Investment Management Company, LLC from 2008 to 2010. Manager of Fund Reporting and Control for Evergreen Investment Management Company, LLC from 2004 to 2010. | | |
Jeremy DePalma1
(Born 1974) | | Assistant Treasurer, since 2009 | | Senior Vice President of Wells Fargo Funds Management, LLC since 2009. Senior Vice President of Evergreen Investment Management Company, LLC from 2008 to 2010 and head of the Fund Reporting and Control Team within Fund Administration from 2005 to 2010. | | |
| 1 | Nancy Wiser acts as Treasurer of 73 funds in the Fund Complex. Jeremy DePalma acts as Treasurer of 69 funds and Assistant Treasurer of 73 funds in the Fund Complex. |
| 2 | The Statement of Additional Information includes additional information about the Trustees and is available, without charge, upon request, by calling 1-800-222-8222 or by visiting the website at wellsfargofunds.com. |
| * | Michael Whitaker became Chief Compliance Officer effective May 16, 2016. |
| | | | | | |
| Other information (unaudited) | | Wells Fargo Minnesota Tax-Free Fund | | | 29 | |
BOARD CONSIDERATION OF INVESTMENT MANAGEMENT AND SUB-ADVISORY AGREEMENTS:
Under the Investment Company Act of 1940 (the “1940 Act”), the Board of Trustees (the “Board”) of Wells Fargo Funds Trust (the “Trust”) must determine annually whether to approve the continuation of the Trust’s investment management and sub-advisory agreements. In this regard, at an in-person meeting held on May 24-25, 2016 (the “Meeting”), the Board, all the members of which have no direct or indirect interest in the investment management and sub-advisory agreements and are not “interested persons” of the Trust, as defined in the 1940 Act (the “Independent Trustees”), reviewed and approved for Wells Fargo Minnesota Tax-Free Fund (the “Fund”): (i) an investment management agreement (the “Management Agreement”) with Wells Fargo Funds Management, LLC (“Funds Management”); and (ii) an investment sub-advisory agreement (the “Sub-Advisory Agreement”) with Wells Capital Management Incorporated (the “Sub-Adviser”), an affiliate of Funds Management. The Management Agreement and the Sub-Advisory Agreement are collectively referred to as the “Advisory Agreements.”
At the Meeting, the Board considered the factors and reached the conclusions described below relating to the selection of Funds Management and the Sub-Adviser and the approval of the Advisory Agreements. Prior to the Meeting, including at an in-person meeting in April 2016, the Trustees conferred extensively among themselves and with representatives of Funds Management about these matters. Also, the Board has adopted a team-based approach, with each team consisting of a sub-set of Trustees, to assist the full Board in the discharge of its duties in reviewing performance and other matters throughout the year. The Independent Trustees were assisted in their evaluation of the Advisory Agreements by independent legal counsel, from whom they received separate legal advice and with whom they met separately.
In providing information to the Board, Funds Management and the Sub-Adviser were guided by a detailed set of requests for information submitted to them by independent legal counsel on behalf of the Independent Trustees at the start of the Board’s annual contract renewal process earlier in 2016. In considering and approving the Advisory Agreements, the Trustees considered the information they believed relevant, including but not limited to the information discussed below. The Board considered not only the specific information presented in connection with the Meeting, but also the knowledge gained over time through interaction with Funds Management and the Sub-Adviser about various topics. In this regard, the Board reviewed reports of Funds Management at each of its quarterly meetings, which included, among other things, portfolio reviews and performance reports. In addition, the Board and the teams mentioned above confer with portfolio managers at various times throughout the year. The Board did not identify any particular information or consideration that was all-important or controlling, and each individual Trustee may have attributed different weights to various factors.
After its deliberations, the Board unanimously approved the continuation of the Advisory Agreements for a one-year term and determined that the compensation payable to Funds Management and the Sub-Adviser under each of the Advisory Agreements was reasonable. The Board considered the approval of the Advisory Agreements for the Fund as part of its consideration of agreements for funds across the complex, but its approvals were made on a fund-by-fund basis. The following summarizes a number of important, but not necessarily all, factors considered by the Board in support of its approvals.
Nature, extent and quality of services
The Board received and considered various information regarding the nature, extent and quality of services provided to the Fund by Funds Management and the Sub-Adviser under the Advisory Agreements. This information included a description of the investment advisory services and Fund-level administrative services covered by the Management Agreement, as well as, among other things, a summary of the background and experience of senior management of Funds Management, and the qualifications, background, tenure and responsibilities of each of the portfolio managers primarily responsible for the day-to-day portfolio management of the Fund.
The Board evaluated the ability of Funds Management and the Sub-Adviser to attract and retain qualified investment professionals, including research, advisory and supervisory personnel. The Board further considered the compliance programs and compliance records of Funds Management and the Sub-Adviser. In addition, the Board took into account the full range of services provided to the Fund by Funds Management and its affiliates.
Fund performance and expenses
The Board considered the performance results for the Fund over various time periods ended December 31, 2015. The Board considered these results in comparison to the performance of funds in a universe that was determined by Broadridge Inc. (“Broadridge”) to be similar to the Fund (the “Universe”), and in comparison to the Fund’s benchmark index and to other comparative data. Broadridge is an independent provider of investment company data. The Board received a description of the methodology used by Broadridge to select the mutual funds in the performance Universe.
| | | | |
| 30 | | Wells Fargo Minnesota Tax-Free Fund | | Other information (unaudited) |
The Board noted that the performance of the Fund (Administrator Class) was higher than or in range of the average performance of the Universe for all periods under review. The Board also noted that the performance of the Fund was lower than its benchmark, the Barclays Municipal Bond Index, for all periods under review.
The Board also received and considered information regarding the Fund’s net operating expense ratios and their various components, including actual management fees, custodian and other non-management fees, and Rule 12b-1 and non-Rule 12b-1 shareholder service fees. The Board considered these ratios in comparison to the median ratios of funds in class-specific expense groups that were determined by Broadridge to be similar to the Fund (the “Groups”). The Board received a description of the methodology used by Broadridge to select the mutual funds in the expense Groups and an explanation of how funds comprising expense groups and their expense ratios may vary from year-to-year. Based on the Broadridge reports, the Board noted that the net operating expense ratios of the Fund were in range of or equal to the median net operating expense ratios of the expense Groups.
The Board took into account the Fund performance and expense information provided to it among the factors considered in deciding to re-approve the Advisory Agreements.
Investment management and sub-advisory fee rates
The Board reviewed and considered the contractual fee rates payable by the Fund to Funds Management under the Management Agreement, as well as the contractual fee rates payable by the Fund to Funds Management for class-level administrative services under a Class-Level Administration Agreement, which include class-level transfer agency and sub-transfer agency costs (collectively, the “Management Rates”). The Board also reviewed and considered the contractual investment sub-advisory fee rates that are payable by Funds Management to the Sub-Adviser for investment sub-advisory services.
Among other information reviewed by the Board was a comparison of the Fund’s Management Rates with the average contractual investment management fee rates of funds in the expense Groups at a common asset level as well as transfer agency costs of the funds in the expense Groups. The Board noted that the Management Rates of the Fund were lower than or equal to the sum of these average rates for the Fund’s expense Groups for all share classes.
The Board also received and considered information about the portion of the total management fee that was retained by Funds Management after payment of the fee to the Sub-Adviser for sub-advisory services. In assessing the reasonableness of this amount, the Board received and evaluated information about the nature and extent of responsibilities retained and risks assumed by Funds Management and not delegated to or assumed by the Sub-Adviser, and about Funds Management’s on-going oversight services. However, given the affiliation between Funds Management and the Sub-Adviser, the Board ascribed limited relevance to the allocation of fees between them.
The Board also received and considered information about the nature and extent of services offered and fee rates charged by Funds Management and the Sub-Adviser to other types of clients with investment strategies similar to those of the Fund. In this regard, the Board received information about the significantly greater scope of services, and compliance, reporting and other legal burdens and risks of managing mutual funds compared with those associated with managing assets of non-mutual fund clients such as collective funds or institutional separate accounts.
Based on its consideration of the factors and information it deemed relevant, including those described here, the Board determined that the compensation payable to Funds Management under the Management Agreement and to the Sub-Adviser under the Sub-Advisory Agreement was reasonable, in light of the services covered by the Advisory Agreements.
Profitability
The Board received and considered information concerning the profitability of Funds Management, as well as the profitability of Wells Fargo as a whole, from providing services to the Fund and the fund family as a whole. The Board also received and considered information concerning the profitability of the Sub-Adviser from providing services to the fund family as a whole, noting that the Sub-Adviser’s profitability information with respect to providing services to the Fund was subsumed in the Wells Fargo and Funds Management profitability analysis.
Funds Management reported on the methodologies and estimates used in calculating profitability. Among other things, the Board noted that the levels of profitability reported on a fund-by-fund basis varied widely, depending on factors such as the size and type of fund. Based on its review, the Board did not deem the profits reported by Funds Management or Wells Fargo from its services to the Fund to be at a level that would prevent it from approving the continuation of the Advisory Agreements.
| | | | | | |
| Other information (unaudited) | | Wells Fargo Minnesota Tax-Free Fund | | | 31 | |
Economies of scale
With respect to possible economies of scale, the Board noted the existence of breakpoints in the Fund’s management fee structure, which operate generally to reduce the Fund’s expense ratios as the Fund grows in size. It considered that, for a small fund or a fund that shrinks in size, breakpoints conversely can result in higher fee levels. The Board also considered that fee waiver and expense reimbursement arrangements and competitive fee rates at the outset are means of sharing potential economies of scale with shareholders of the Fund and the fund family as a whole. The Board considered Funds Management’s view that any analyses of potential economies of scale in managing a particular fund are inherently limited in light of the joint and common costs and investments that Funds Management incurs across the fund family as a whole.
The Board concluded that the Fund’s fee and expense arrangements, including contractual breakpoints, constituted a reasonable approach to sharing potential economies of scale with the Fund and its shareholders.
Other benefits to Funds Management and the Sub-Adviser
The Board received and considered information regarding potential “fall-out” or ancillary benefits received by Funds Management and its affiliates, including the Sub-Adviser, as a result of their relationships with the Fund. Ancillary benefits could include, among others, benefits directly attributable to other relationships with the Fund and benefits potentially derived from an increase in Funds Management’s and the Sub-Adviser’s business as a result of their relationships with the Fund. The Board noted that various affiliates of Funds Management may receive distribution-related fees, shareholder servicing payments and sub-transfer agency fees in respect of shares sold or held through them and services provided.
The Board also reviewed information about soft dollar credits earned and utilized by the Sub-Adviser, fees earned by Funds Management and the Sub-Adviser from managing a private investment vehicle for the fund family’s securities lending collateral and commissions earned by an affiliated broker from portfolio transactions.
Based on its consideration of the factors and information it deemed relevant, including those described here, the Board did not find that any ancillary benefits received by Funds Management and its affiliates, including the Sub-Adviser, were unreasonable.
Conclusion
At the Meeting, after considering the above-described factors and based on its deliberations and its evaluation of the information described above, the Board unanimously approved the continuation of the Advisory Agreements for a one-year term and determined that the compensation payable to Funds Management and the Sub-Adviser under each of the Advisory Agreements was reasonable.
| | | | |
| 32 | | Wells Fargo Minnesota Tax-Free Fund | | List of abbreviations |
The following is a list of common abbreviations for terms and entities that may have appeared in this report.
| ACA | — ACA Financial Guaranty Corporation |
| ADR | — American depositary receipt |
| ADS | — American depositary shares |
| AGC | — Assured Guaranty Corporation |
| AGM | — Assured Guaranty Municipal |
| Ambac | — Ambac Financial Group Incorporated |
| AMT | — Alternative minimum tax |
| BAN | — Bond anticipation notes |
| BHAC | — Berkshire Hathaway Assurance Corporation |
| CAB | — Capital appreciation bond |
| CCAB | — Convertible capital appreciation bond |
| CDA | — Community Development Authority |
| CDO | — Collateralized debt obligation |
| DRIVER | — Derivative inverse tax-exempt receipts |
| DW&P | — Department of Water & Power |
| DWR | — Department of Water Resources |
| ECFA | — Educational & Cultural Facilities Authority |
| EDA | — Economic Development Authority |
| EDFA | — Economic Development Finance Authority |
| ETF | — Exchange-traded fund |
| FDIC | — Federal Deposit Insurance Corporation |
| FFCB | — Federal Farm Credit Banks |
| FGIC | — Financial Guaranty Insurance Corporation |
| FHA | — Federal Housing Administration |
| FHLB | — Federal Home Loan Bank |
| FHLMC | — Federal Home Loan Mortgage Corporation |
| FICO | — The Financing Corporation |
| FNMA | — Federal National Mortgage Association |
| GDR | — Global depositary receipt |
| GNMA | — Government National Mortgage Association |
| HCFR | — Healthcare facilities revenue |
| HEFA | — Health & Educational Facilities Authority |
| HEFAR | — Higher education facilities authority revenue |
| HFA | — Housing Finance Authority |
| HFFA | — Health Facilities Financing Authority |
| HUD | — Department of Housing and Urban Development |
| IDA | — Industrial Development Authority |
| IDAG | — Industrial Development Agency |
| KRW | — Republic of Korea won |
| LIBOR | — London Interbank Offered Rate |
| LIFER | — Long Inverse Floating Exempt Receipts |
| LLC | — Limited liability company |
| LLLP | — Limited liability limited partnership |
| LLP | — Limited liability partnership |
| MBIA | — Municipal Bond Insurance Association |
| MFHR | — Multifamily housing revenue |
| MSTR | — Municipal securities trust receipts |
| MUD | — Municipal Utility District |
| National | — National Public Finance Guarantee Corporation |
| PCFA | — Pollution Control Financing Authority |
| PCL | — Public Company Limited |
| PCR | — Pollution control revenue |
| PFA | — Public Finance Authority |
| PFFA | — Public Facilities Financing Authority |
| PFOTER | — Puttable floating option tax-exempt receipts |
| plc | — Public limited company |
| PUTTER | — Puttable tax-exempt receipts |
| R&D | — Research & development |
| Radian | — Radian Asset Assurance |
| RAN | — Revenue anticipation notes |
| RDA | — Redevelopment Authority |
| RDFA | — Redevelopment Finance Authority |
| REIT | — Real estate investment trust |
| ROC | — Reset option certificates |
| SAVRS | — Select auction variable rate securities |
| SBA | — Small Business Authority |
| SDR | — Swedish depositary receipt |
| SFHR | — Single-family housing revenue |
| SFMR | — Single-family mortgage revenue |
| SPA | — Standby purchase agreement |
| SPDR | — Standard & Poor’s Depositary Receipts |
| SPEAR | — Short Puttable Exempt Adjustable Receipts |
| STRIPS | — Separate trading of registered interest and |
| TAN | — Tax anticipation notes |
| TIPS | — Treasury inflation-protected securities |
| TRAN | — Tax revenue anticipation notes |
| TTFA | — Transportation Trust Fund Authority |
| TVA | — Tennessee Valley Authority |

For more information
More information about Wells Fargo Funds is available free upon request. To obtain literature, please write, email, visit the Fund’s website, or call:
Wells Fargo Funds
P.O. Box 8266
Boston, MA 02266-8266
Email: fundservice@wellsfargo.com
Website: wellsfargofunds.com
Individual investors: 1-800-222-8222
Retail investment professionals: 1-888-877-9275
Institutional investment professionals: 1-866-765-0778
This report and the financial statements contained herein are submitted for the general information of the shareholders of the Fund. If this report is used for promotional purposes, distribution of the report must be accompanied or preceded by a current prospectus. Before investing, please consider the investment objectives, risks, charges, and expenses of the investment. For a current prospectus and, if available, a summary prospectus, containing this information, call 1-800-222-8222 or visit the Fund’s website at wellsfargofunds.com. Read the prospectus carefully before you invest or send money.
Wells Fargo Asset Management (WFAM) is a trade name used by the asset management businesses of Wells Fargo & Company. Wells Fargo Funds Management, LLC, a wholly owned subsidiary of Wells Fargo & Company, provides investment advisory and administrative services for Wells Fargo Funds. Other affiliates of Wells Fargo & Company provide subadvisory and other services for the funds. The funds are distributed by Wells Fargo Funds Distributor, LLC, Member FINRA, an affiliate of Wells Fargo & Company.
NOT FDIC INSURED ¡ NO BANK GUARANTEE ¡ MAY LOSE VALUE
© 2016 Wells Fargo Funds Management, LLC. All rights reserved.
| | |
 | | 244405 08-16 A252/AR252 6-16 |
Annual Report
June 30, 2016

Wells Fargo
Municipal Bond Fund


Reduce clutter. Save trees.
Sign up for electronic delivery of prospectuses and shareholder reports at wellsfargo.com/advantagedelivery
Contents
| * | A complete schedule of portfolio holdings as of the report date may be obtained, free of charge, by accessing the following website: https://www.wellsfargofunds.com/assets/edocs/regulatory/holdings/municipal-bond-ann.pdf or by calling Wells Fargo Funds at 1-800-222-8222. This complete schedule, filed on Form N-CSR, is also available on the SEC’s website at sec.gov. |
The views expressed and any forward-looking statements are as of June 30, 2016, unless otherwise noted, and are those of the Fund managers and/or Wells Fargo Funds Management, LLC. Discussions of individual securities, or the markets generally, or any Wells Fargo Fund are not intended as individual recommendations. Future events or results may vary significantly from those expressed in any forward-looking statements. The views expressed are subject to change at any time in response to changing circumstances in the market. Wells Fargo Funds Management, LLC and the Fund disclaim any obligation to publicly update or revise any views expressed or forward-looking statements.
NOT FDIC INSURED ¡ NO BANK GUARANTEE ¡ MAY LOSE VALUE
| | | | |
| 2 | | Wells Fargo Municipal Bond Fund | | Letter to shareholders (unaudited) |

Karla M. Rabusch
President
Wells Fargo Funds
In fact, yields on municipal bonds that matured in 10 years or more experienced yield declines of more than 100 basis points (100 basis points equals 1.00%) during the reporting period.
Dear Valued Shareholder:
We are pleased to offer you this annual report for the Wells Fargo Municipal Bond Fund for the 12-month period that ended June 30, 2016. The U.S. Federal Reserve (Fed) began normalizing monetary policy, raising the federal funds rate to between 0.25% and 0.50% in December 2015. Short-term municipal bond yields rose, but yields on longer-term bonds declined. In fact, yields on municipal bonds that matured in 10 years or more experienced yield declines of more than 100 basis points (100 basis points equals 1.00%) during the reporting period. The Barclays Municipal Bond Index,1 a broad measure tracking investment-grade municipal bonds, returned 7.65% during the 12-month reporting period.
Monetary policy was accommodative.
The Fed continued an easy monetary policy in order to support the economy and the financial system. However, it raised the federal funds target rate in December because it believed the U.S. economy was strong enough to begin normalizing monetary policy. The European Central Bank cut all three of its short-term rates during the reporting period, increased its asset-purchase program from 60 billion euros per month to 80 billion, expanded the list of eligible securities to include investment-grade nonbank debt, and created a fund-to-lend program where banks could be paid to lend money. In Japan, the Bank of Japan maintained an aggressive monetary program aimed at combating deflation.
Despite accommodative central-bank policies that helped keep interest rates at ultra-low levels, there were periods of volatility. Early in 2016, weakness in certain emerging markets economies and commodities hurt riskier assets and a vote in June 2016 by the U.K. to exit the European Union set off another round of global uncertainty. Municipal bonds benefited because they are perceived as a safe-haven asset. In addition, investor demand for yield helped lower-rated debt outperform. The Barclays High Yield Municipal Bond Index2 returned 12.09% during the 12-month period that ended June 30, 2016.
Strong demand, modest supply, and solid credit fundamentals supported municipals.
Market technicals remained favorable. According to the Investment Company Institute, more than $33 billion was allocated to municipal mutual funds during the first half of 2016, which was more than double the inflows during all of 2015. Further, inflows during the second quarter of 2016 were the largest in nearly seven years. In contrast, less new supply helped make 2015 the fifth calendar year of negative net supply and supply in the first half of 2016 was about 4% less than the same period last year.
Municipal credit quality remained on an uptrend despite a number of high-profile negative credit situations. Idiosyncratic credit risks remain, however. With regard to Puerto Rico, the U.S. enacted legislation that prohibits bondholder lawsuits temporarily and instills a fiscal oversight board for Puerto Rico; Puerto Rico then declared a moratorium on paying its general obligation (GO) bonds and defaulted
| 1 | The Barclays Municipal Bond Index is an unmanaged index composed of long-term tax-exempt bonds with a minimum credit rating of Baa. You cannot invest directly in an index. |
| 2 | The Barclays High Yield Municipal Bond Index measures the non-investment-grade and nonrated U.S. dollar–denominated, fixed-rate, tax-exempt bond market within the 50 United States and four other qualifying regions (Washington, D.C.; Puerto Rico; Guam; and the Virgin Islands). The index allows state and local general obligation, revenue, insured, and prerefunded bonds; however, historically the index has been composed of mostly revenue bonds. You cannot invest directly in an index. |
| | | | | | |
| Letter to shareholders (unaudited) | | Wells Fargo Municipal Bond Fund | | | 3 | |
on $911 million in payments due (most of which were GOs) on July 1, 2016. The state of Illinois approved a six-month stopgap budget, a temporary but meaningful step. Under this stopgap budget for the state, the city of Chicago receives authority to raise property taxes for teacher pensions and low-income school districts would receive greater state funding. City of Chicago and school district debt rallied on the news.
Since the end of the financial crisis, structural changes in the fixed-income markets have reduced trading liquidity (the degree to which assets can be bought or sold without affecting the price). New regulations and capital requirements have caused traditional liquidity suppliers (banks and broker/dealers) to be more risk-averse and hold less inventory. Meanwhile, corporate-debt issuance has spiked as companies finance themselves at record-low yields, bond mutual funds hold larger amounts of this new debt supply, trading volumes are lower, and large trades are more difficult to execute. However, fixed-income markets appear to have functioned well over the past year with sufficient liquidity.
Don’t let short-term uncertainty derail long-term investment goals.
Periods of uncertainty can present challenges, but experience has taught us that maintaining long-term investment goals can be an effective way to plan for the future. To help you create a sound strategy based on your personal goals and risk tolerance, Wells Fargo Funds offers more than 100 mutual funds spanning a wide range of asset classes and investment styles. Although diversification cannot guarantee an investment profit or prevent losses, we believe it can be an effective way to manage investment risk and potentially smooth out overall portfolio performance. We encourage investors to know their investments and to understand that appropriate levels of risk-taking may unlock opportunities.
Thank you for choosing to invest in Wells Fargo Funds. We appreciate your confidence in us and remain committed to helping you meet your financial needs.
Sincerely,

Karla M. Rabusch
President
Wells Fargo Funds
Periods of uncertainty can present challenges, but experience has taught us that maintaining long-term investment goals can be an effective way to plan for the future.
For further information about your Fund, contact your investment professional, visit our website at wellsfargofunds.com, or call us directly at 1-800-222-8222. We are available 24 hours a day, 7 days a week.
| | | | |
| 4 | | Wells Fargo Municipal Bond Fund | | Performance highlights (unaudited) |
Investment objective
The Fund seeks current income exempt from federal income tax.
Manager
Wells Fargo Funds Management, LLC
Subadviser
Wells Capital Management Incorporated
Portfolio managers
Lyle J. Fitterer, CFA®, CPA
Robert J. Miller
Average annual total returns (%) as of June 30, 20161
| | | | | | | | | | | | | | | | | | | | | | | | | | | | | | | | | | |
| | | | | Including sales charge | | | Excluding sales charge | | | Expense ratios2 (%) | |
| | | Inception date | | 1 year | | | 5 year | | | 10 year | | | 1 year | | | 5 year | | | 10 year | | | Gross | | | Net3 | |
| Class A (WMFAX) | | 4-8-2005 | | | 3.21 | | | | 5.29 | | | | 5.18 | | | | 8.04 | | | | 6.26 | | | | 5.66 | | | | 0.80 | | | | 0.75 | |
| Class B (WMFBX)* | | 4-8-2005 | | | 2.13 | | | | 5.14 | | | | 5.11 | | | | 7.13 | | | | 5.47 | | | | 5.11 | | | | 1.55 | | | | 1.50 | |
| Class C (WMFCX) | | 4-8-2005 | | | 6.14 | | | | 5.47 | | | | 4.87 | | | | 7.14 | | | | 5.47 | | | | 4.87 | | | | 1.55 | | | | 1.50 | |
| Administrator Class (WMFDX) | | 4-8-2005 | | | – | | | | – | | | | – | | | | 8.10 | | | | 6.42 | | | | 5.86 | | | | 0.74 | | | | 0.60 | |
| Institutional Class (WMBIX) | | 3-31-2008 | | | – | | | | – | | | | – | | | | 8.35 | | | | 6.56 | | | | 5.92 | | | | 0.47 | | | | 0.47 | |
| Barclays Municipal Bond Index4 | | – | | | – | | | | – | | | | – | | | | 7.65 | | | | 5.33 | | | | 5.13 | | | | – | | | | – | |
| * | | Class B shares are closed to investment, except in connection with the reinvestment of any distributions and permitted exchanges. |
Figures quoted represent past performance, which is no guarantee of future results, and do not reflect taxes that a shareholder may pay on fund distributions or the redemption of fund shares. Investment return and principal value of an investment will fluctuate so that an investor’s shares, when redeemed, may be worth more or less than their original cost. Performance shown without sales charges would be lower if sales charges were reflected. Current performance may be lower or higher than the performance data quoted, which assumes the reinvestment of dividends and capital gains. Current month-end performance is available on the Fund’s website, wellsfargofunds.com.
Index returns do not include transaction costs associated with buying and selling securities, any mutual fund fees or expenses, or any taxes. It is not possible to invest directly in an index.
For Class A shares, the maximum front-end sales charge is 4.50%. For Class B shares, the maximum contingent deferred sales charge is 5.00%. For Class C shares, the maximum contingent deferred sales charge is 1.00%. Performance including a contingent deferred sales charge assumes the sales charge for the corresponding time period. Administrator Class and Institutional shares are sold without a front-end sales charge or contingent deferred sales charge.
Bond values fluctuate in response to the financial condition of individual issuers, general market and economic conditions, and changes in interest rates. Changes in market conditions and government policies may lead to periods of heightened volatility in the bond market and reduced liquidity for certain bonds held by the Fund. In general, when interest rates rise, bond values fall and investors may lose principal value. Interest-rate changes and their impact on the Fund and its share price can be sudden and unpredictable. The use of derivatives may reduce returns and/or increase volatility. Certain investment strategies tend to increase the total risk of an investment (relative to the broader market). The Fund is exposed to high-yield securities risk and municipal securities risk. Consult the Fund’s prospectus for additional information on these and other risks. A portion of the Fund’s income may be subject to federal, state, and/or local income taxes or the Alternative Minimum Tax (AMT). Any capital gains distributions may be taxable.
Please see footnotes on page 5.
| | | | | | |
| Performance highlights (unaudited) | | Wells Fargo Municipal Bond Fund | | | 5 | |
|
| Growth of $10,000 investment as of June 30, 20165 |
|
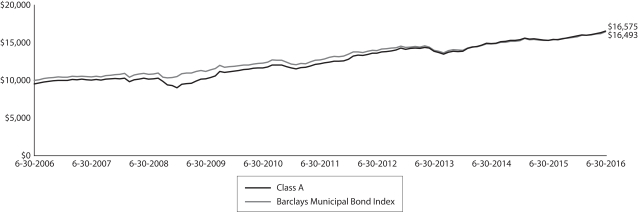 |
| 1 | Historical performance shown for Institutional Class shares prior to their inception reflects the performance of the former Investor Class shares, and includes the higher expenses applicable to the former Investor Class shares. If these expenses had not been included, returns would be higher. |
| 2 | Reflects the expense ratios as stated in the most recent prospectuses. The expense ratios shown are subject to change and may differ from the annualized expense ratios shown in the financial highlights of this report. |
| 3 | The manager has contractually committed through October 31, 2016, to waive fees and/or reimburse expenses to the extent necessary to cap the Fund’s Total Annual Fund Operating Expenses After Fee Waiver at 0.75% for Class A, 1.50% for Class B, 1.50% for Class C, 0.60% for Administrator Class, and 0.48% for Institutional Class. After this time, the cap may be increased or the commitment to maintain the cap may be terminated only with the approval of the Board of Trustees. Brokerage commissions, stamp duty fees, interest, taxes, acquired fund fees and expenses, and extraordinary expenses are excluded from the expense cap. Without this cap, the Fund’s returns would have been lower. |
| 4 | The Barclays Municipal Bond Index is an unmanaged index composed of long-term tax-exempt bonds with a minimum credit rating of Baa. You cannot invest directly in an index. |
| 5 | The chart compares the performance of Class A shares for the most recent ten years with the Barclays Municipal Bond Index. The chart assumes a hypothetical $10,000 investment in Class A shares and reflects all operating expenses and assumes the maximum initial sales charge of 4.50%. |
| 6 | The credit quality distribution of portfolio holdings reflected in the chart is based on ratings from Standard & Poor’s, Moody’s Investors Service, and/or Fitch Ratings Ltd. Credit quality ratings apply to the underlying holdings of the Fund and not to the Fund itself. The percentages of the Fund’s portfolio with the ratings depicted in the chart are calculated based on the total market value of fixed income securities held by the Fund. If a security was rated by all three rating agencies, the middle rating was utilized. If rated by two of three rating agencies, the lower rating was utilized, and if rated by one of the rating agencies, that rating was utilized. Standard & Poor’s rates the creditworthiness of bonds, ranging from AAA (highest) to D (lowest). Ratings from A to CCC may be modified by the addition of a plus (+) or minus (-) sign to show relative standing within the rating categories. Standard & Poor’s rates the creditworthiness of short-term notes from SP-1 (highest) to SP-3 (lowest). Moody’s rates the creditworthiness of bonds, ranging from Aaa (highest) to C (lowest). Ratings Aa to B may be modified by the addition of a number 1 (highest) to 3 (lowest) to show relative standing within the ratings categories. Moody’s rates the creditworthiness of short-term U.S. tax-exempt municipal securities from MIG 1/VMIG 1 (highest) to SG (lowest). Fitch rates the creditworthiness of bonds, ranging from AAA (highest) to D (lowest). Credit quality distribution is subject to change and may have changed since the date specified. |
| 7 | Amounts are calculated based on the total investments of the Fund. These amounts are subject to change and may have changed since the date specified. |
| | | | |
| 6 | | Wells Fargo Municipal Bond Fund | | Performance highlights (unaudited) |
MANAGER’S DISCUSSION
Fund highlights
| n | | The Fund (Class A, excluding sales charges) outperformed its benchmark, the Barclays Municipal Bond Index, for the 12-month period that ended June 30, 2016. |
| n | | Investors continued their search for income in this low-yield environment, which caused lower-quality bonds to perform very well. The Fund’s overweight to A-rated, BBB-rated, and out-of-benchmark below-investment-grade debt was the biggest contributor to excess returns. |
| n | | The Fund began the period with a duration that was longer than the benchmark. As rates rallied, we slowly reduced its duration and are now positioned for higher rates. We also began reducing the Fund’s bias for a flatter yield curve in the second quarter of 2016 given the amount of flattening that had already occurred. |
| n | | The Fund’s exposure to local general obligation (GO), education, special tax, and transportation issues did well, while corporate-backed and health care holdings didn’t perform as well. Our largest state overweight continues to be to Illinois, and it was one of the best-performing states. |
Ultralow yields continued throughout the period.
With the U.S. Federal Reserve (Fed) poised to normalize its interest-rate policy, shorter-term maturities appeared less attractive at the beginning of the reporting period due to a potential backup in short-term yields. However, subdued inflation expectations, due in part to low oil prices, combined with a fragile European economy and softening Chinese economy, implied that longer maturities would outperform. We, therefore, extended the Fund’s duration in anticipation of lower yields and also positioned the Fund for a flatter yield curve. The Fund’s yield-curve positioning, which was underweight maturities between 1 and 7 years and overweight the 10-year area, helped results. Longer-term maturities outperformed shorter-term maturities by a wide margin because the municipal curve flattened almost 150 basis points (bps; 100 bps equals 1.00%) between the 1- and 30-year maturities. The Fund also held variable-rate demand notes, which provided liquidity but weighed on results.
The Fed tightened in December 2015 but signaled that the pace of further increases would be gradual. While the Fed was likely to take its time raising rates, U.S. inflation started to trend higher, unemployment remained below 5%, and economic growth was expected to remain at or above 2%, and we reduced duration as the market rallied. The Fund’s short duration hurt results in the second half of the reporting period because yields continued to decline.
|
| Credit quality as of June 30, 20166 |
|
 |
Credit-quality allocation helped results.
The Fund’s overweight to A-rated and BBB-rated debt and its out-of-benchmark holdings in high-yield and nonrated debt contributed to results because lower-rated bonds outperformed higher-quality bonds by a wide margin during the period. The Fund’s holdings within the local GO, special tax, education, and transportation sectors performed well. On the other hand, issue selection within the health care and corporate-backed sectors detracted from results, largely because of their shorter duration profile. We have been cautious within the health care sector for quite some time because we believe credit fundamentals have peaked. Although taxable corporate bond spreads increased dramatically during late 2015 and early 2016 as global fears spooked the market, spreads for corporate-backed municipal debt declined. We sold into this rally, but continued new-money flows into high-yield and longer-term municipal bond funds caused these spreads to move even tighter.
Please see footnotes on page 5.
| | | | | | |
| Performance highlights (unaudited) | | Wells Fargo Municipal Bond Fund | | | 7 | |
Political noise and a lack of a state budget caused volatility within Illinois, but the state’s bonds had some of the highest returns. We have been overweight Illinois bonds for several years because we feel that the above-market income is compensating investors for the credit issues. We continue to believe that the state’s economic backdrop and ability to raise revenues, combined with Illinois Governor Bruce Rauner’s focus on cutting expenses, should ultimately lead to tighter spreads. New Jersey bonds also performed well as spreads tightened; however, issue selection within the state detracted from results, primarily due to our exposure to longer-dated floating-rate notes that repriced to reflect a protracted rate-hike cycle. During the past 12 months, Puerto Rico had several widely anticipated defaults on its debt. The lack of clarity surrounding the federal government’s restructuring legislation for Puerto Rico debt, the lack of financial statements, and a declining economy make it very hard to develop an investment opinion for the territory. As a result, we continue to have minimal exposure to Puerto Rico bonds.
|
| Effective maturity distribution as of June 30, 20167 |
|
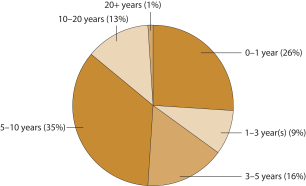 |
Rates may be lower for longer, making credit allocation and issue selection even more important.
Near the end of the reporting period, the U.K. voted to withdraw from the European Union, prompting considerable uncertainty about future political situations, financial markets, and economic growth. U.S. Treasuries and municipal bonds rallied significantly on the news, and both 10-year and 30-year municipal yields reached record-low levels. Although we think rates may stay lower for longer, we recognize that an improvement in overseas economies, outflows in mutual funds, or a more hawkish tone from the Fed could lead to a spike in rates. However, if the U.S. economy does weaken materially, this could be the catalyst for us to increase our duration exposure and reduce our credit exposure. In this record-low interest-rate environment, security selection is even more important as breakeven yields (the sell-off that a bond can endure before the total return drops to zero) decrease.
Please see footnotes on page 5.
| | | | |
| 8 | | Wells Fargo Municipal Bond Fund | | Fund expenses (unaudited) |
As a shareholder of the Fund, you incur two types of costs: (1) transaction costs, including sales charges (loads) on purchase payments and contingent deferred sales charges (if any) on redemptions and (2) ongoing costs, including management fees, distribution (12b-1) and/or shareholder servicing fees, and other Fund expenses. This example is intended to help you understand your ongoing costs (in dollars) of investing in the Fund and to compare these costs with the ongoing costs of investing in other mutual funds.
The example is based on an investment of $1,000 invested at the beginning of the six-month period and held for the entire period from January 1, 2016 to June 30, 2016.
Actual expenses
The “Actual” line of the table below provides information about actual account values and actual expenses. You may use the information in this line, together with the amount you invested, to estimate the expenses that you paid over the period. Simply divide your account value by $1,000 (for example, an $8,600 account value divided by $1,000 = 8.6), then multiply the result by the number in the “Actual” line under the heading entitled “Expenses paid during period” for your applicable class of shares to estimate the expenses you paid on your account during this period.
Hypothetical example for comparison purposes
The “Hypothetical” line of the table below provides information about hypothetical account values and hypothetical expenses based on the Fund’s actual expense ratio and an assumed rate of return of 5% per year before expenses, which is not the Fund’s actual return. The hypothetical account values and expenses may not be used to estimate the actual ending account balance or expenses you paid for the period. You may use this information to compare the ongoing costs of investing in the Fund and other funds. To do so, compare this 5% hypothetical example with the 5% hypothetical examples that appear in the shareholder reports of the other funds.
Please note that the expenses shown in the table are meant to highlight your ongoing costs only and do not reflect any transactional costs, such as sales charges (loads) and contingent deferred sales charges. Therefore, the “Hypothetical” line of the table is useful in comparing ongoing costs only and will not help you determine the relative total costs of owning different funds. In addition, if these transactional costs were included, your costs would have been higher.
| | | | | | | | | | | | | | | | |
| | | Beginning
account value
1-1-2016 | | | Ending
account value
6-30-2016 | | | Expenses
paid during
the period¹ | | | Net annualized
expense ratio | |
Class A | | | | | | | | | | | | | | | | |
Actual | | $ | 1,000.00 | | | $ | 1,040.86 | | | $ | 3.81 | | | | 0.75 | % |
Hypothetical (5% return before expenses) | | $ | 1,000.00 | | | $ | 1,021.13 | | | $ | 3.77 | | | | 0.75 | % |
Class B | | | | | | | | | | | | | | | | |
Actual | | $ | 1,000.00 | | | $ | 1,035.99 | | | $ | 7.59 | | | | 1.50 | % |
Hypothetical (5% return before expenses) | | $ | 1,000.00 | | | $ | 1,017.40 | | | $ | 7.52 | | | | 1.50 | % |
Class C | | | | | | | | | | | | | | | | |
Actual | | $ | 1,000.00 | | | $ | 1,036.02 | | | $ | 7.59 | | | | 1.50 | % |
Hypothetical (5% return before expenses) | | $ | 1,000.00 | | | $ | 1,017.40 | | | $ | 7.52 | | | | 1.50 | % |
Administrator Class | | | | | | | | | | | | | | | | |
Actual | | $ | 1,000.00 | | | $ | 1,041.62 | | | $ | 3.05 | | | | 0.60 | % |
Hypothetical (5% return before expenses) | | $ | 1,000.00 | | | $ | 1,021.88 | | | $ | 3.02 | | | | 0.60 | % |
Institutional Class | | | | | | | | | | | | | | | | |
Actual | | $ | 1,000.00 | | | $ | 1,042.34 | | | $ | 2.34 | | | | 0.46 | % |
Hypothetical (5% return before expenses) | | $ | 1,000.00 | | | $ | 1,022.57 | | | $ | 2.32 | | | | 0.46 | % |
| 1 | Expenses paid is equal to the annualized expense ratio of each class multiplied by the average account value over the period, multiplied by the number of days in the most recent fiscal half-year divided by the number of days in the fiscal year (to reflect the one-half-year period). |
| | | | | | |
| Summary portfolio of investments—June 30, 2016 | | Wells Fargo Municipal Bond Fund | | | 9 | |
The Summary portfolio of investments shows the 50 largest portfolio holdings in unaffiliated issuers and any holdings exceeding 1% of the total net assets as of the report date. The remaining securities held are grouped as “Other securities” in each category.
| | | | | | | | | | | | | | | | | | | | |
| Security name | | Interest rate | | | Maturity date | | | Principal | | | Value | | | Percent of
net assets | |
| | | | | |
Corporate Bonds and Notes: 0.50% | | | | | | | | | | | | | | | | | | | | |
| | | | | |
Consumer Discretionary: 0.50% | | | | | | | | | | | | | | | | | | | | |
| | | | | |
| Diversified Consumer Services: 0.50% | | | | | | | | | | | | | | | | | | | | |
Toll Road Investors Partnership II 144A¤ | | | 0.00 | % | | | 2-15-2028 | | | $ | 30,780,000 | | | $ | 14,660,083 | | | | 0.50 | % |
| | | | | | | | | | | | | | | | | | | | |
| | | | | |
Total Corporate Bonds and Notes (Cost $15,367,850) | | | | | | | | | | | | | | | 14,660,083 | | | | 0.50 | |
| | | | | | | | | | | | | | | | | | | | |
| | | | | |
Municipal Obligations: 98.14% | | | | | | | | | | | | | | | | | | | | |
| | | | | |
| Alabama: 1.07% | | | | | | | | | | | | | | | | | | | | |
Other securities | | | | | | | | | | | | | | | 31,670,438 | | | | 1.07 | |
| | | | | | | | | | | | | | | | | | | | |
| | | | | |
| Alaska: 0.45% | | | | | | | | | | | | | | | | | | | | |
Other securities | | | | | | | | | | | | | | | 13,266,993 | | | | 0.45 | |
| | | | | | | | | | | | | | | | | | | | |
| | | | | |
| Arizona: 0.80% | | | | | | | | | | | | | | | | | | | | |
Other securities | | | | | | | | | | | | | | | 23,725,487 | | | | 0.80 | |
| | | | | | | | | | | | | | | | | | | | |
| | | | | |
| California: 10.30% | | | | | | | | | | | | | | | | | | | | |
Bay Area CA Toll Authority Toll Bridge Revenue Series A (Transportation Revenue) ± | | | 1.66 | | | | 4-1-2036 | | | | 28,000,000 | | | | 27,660,920 | | | | 0.94 | |
California HFFA Children’s Hospital of Orange County Series C (Health Revenue, U.S. Bank NA LOC) ø | | | 0.39 | | | | 11-1-2038 | | | | 14,900,000 | | | | 14,900,000 | | | | 0.51 | |
M-S-R California Energy Authority Gas Series B (Utilities Revenue) | | | 6.13 | | | | 11-1-2029 | | | | 15,925,000 | | | | 21,528,689 | | | | 0.73 | |
Northern California Gas Authority #1 LIBOR Series B (Utilities Revenue) ± | | | 1.14 | | | | 7-1-2027 | | | | 27,660,000 | | | | 25,234,495 | | | | 0.86 | |
Tender Option Bond Trust Receipts for Palomar CA Pomerado Health Series XG0017 (GO Revenue, Bank of America NA LIQ) 144Aø | | | 0.69 | | | | 8-1-2037 | | | | 31,250,000 | | | | 31,250,000 | | | | 1.06 | |
Other securities | | | | | | | | | | | | | | | 183,072,138 | | | | 6.20 | |
| | | | | |
| | | | | | | | | | | | | | | 303,646,242 | | | | 10.30 | |
| | | | | | | | | | | | | | | | | | | | |
| | | | | |
| Colorado: 1.78% | | | | | | | | | | | | | | | | | | | | |
Other securities | | | | | | | | | | | | | | | 52,353,470 | | | | 1.78 | |
| | | | | | | | | | | | | | | | | | | | |
| | | | | |
| Connecticut: 0.44% | | | | | | | | | | | | | | | | | | | | |
Other securities | | | | | | | | | | | | | | | 13,052,687 | | | | 0.44 | |
| | | | | | | | | | | | | | | | | | | | |
| | | | | |
| Delaware: 0.86% | | | | | | | | | | | | | | | | | | | | |
Other securities | | | | | | | | | | | | | | | 25,260,703 | | | | 0.86 | |
| | | | | | | | | | | | | | | | | | | | |
| | | | | |
| District of Columbia: 0.59% | | | | | | | | | | | | | | | | | | | | |
Other securities | | | | | | | | | | | | | | | 17,330,331 | | | | 0.59 | |
| | | | | | | | | | | | | | | | | | | | |
| | | | | |
| Florida: 3.31% | | | | | | | | | | | | | | | | | | | | |
Florida Development Finance Corporation Educational Facilities Revenue Renaissance Charter School Project Series A (Education Revenue) | | | 8.50 | | | | 6-15-2044 | | | | 13,290,000 | | | | 15,771,642 | | | | 0.54 | |
The accompanying notes are an integral part of these financial statements.
| | | | |
| 10 | | Wells Fargo Municipal Bond Fund | | Summary portfolio of investments—June 30, 2016 |
| | | | | | | | | | | | | | | | | | | | |
| Security name | | Interest rate | | | Maturity date | | | Principal | | | Value | | | Percent of
net assets | |
| | | | | |
| Florida (continued) | | | | | | | | | | | | | | | | | | | | |
Miami-Dade County FL School Board Certificate of Participation Series 4 (Miscellaneous Revenue, Dexia Credit Local LOC, Dexia Credit Local LIQ) 144Aø | | | 0.78 | % | | | 9-25-2024 | | | $ | 15,000,000 | | | $ | 15,000,000 | | | | 0.51 | % |
Other securities | | | | | | | | | | | | | | | 66,730,084 | | | | 2.26 | |
| | | | | |
| | | | | | | | | | | | | | | 97,501,726 | | | | 3.31 | |
| | | | | | | | | | | | | | | | | | | | |
| | | | | |
| Georgia: 0.76% | | | | | | | | | | | | | | | | | | | | |
Other securities | | | | | | | | | | | | | | | 22,350,005 | | | | 0.76 | |
| | | | | | | | | | | | | | | | | | | | |
| | | | | |
| Guam: 0.14% | | | | | | | | | | | | | | | | | | | | |
Other securities | | | | | | | | | | | | | | | 4,203,314 | | | | 0.14 | |
| | | | | | | | | | | | | | | | | | | | |
| | | | | |
| Hawaii: 0.11% | | | | | | | | | | | | | | | | | | | | |
Other securities | | | | | | | | | | | | | | | 3,203,091 | | | | 0.11 | |
| | | | | | | | | | | | | | | | | | | | |
| | | | | |
| Idaho: 0.63% | | | | | | | | | | | | | | | | | | | | |
Other securities | | | | | | | | | | | | | | | 18,432,311 | | | | 0.63 | |
| | | | | | | | | | | | | | | | | | | | |
| | | | | |
| Illinois: 19.21% | | | | | | | | | | | | | | | | | | | | |
Chicago IL (Various Revenue) µ | | | 0.00-5.56 | | | | 1-1-2021 to 1-1-2038 | | | | 74,125,000 | | | | 71,426,015 | | | | 2.42 | |
Chicago IL Board of Education (GO Revenue) µ | | | 0.00-5.25 | | | | 12-1-2020 to 12-1-2031 | | | | 57,930,000 | | | | 38,647,209 | | | | 1.31 | |
Chicago IL Board of Education CAB School Reform Series B-1 (GO Revenue, National Insured) ¤ | | | 0.00 | | | | 12-1-2028 | | | | 24,270,000 | | | | 14,819,505 | | | | 0.50 | |
Chicago IL O’Hare International Airport (Airport Revenue) µ | | | 5.00-5.75 | | | | 1-1-2025 to 1-1-2044 | | | | 30,290,000 | | | | 35,956,716 | | | | 1.22 | |
Chicago IL Series A (GO Revenue) | | | 5.50 | | | | 1-1-2033 | | | | 12,730,000 | | | | 13,060,089 | | | | 0.44 | |
Cook County IL (GO Revenue) µ | | | 5.00-5.25 | | | | 11-15-2022 to 11-15-2027 | | | | 9,705,000 | | | | 11,210,012 | | | | 0.38 | |
Cook County IL Series G (GO Revenue) | | | 5.00 | | | | 11-15-2028 | | | | 27,000,000 | | | | 29,765,610 | | | | 1.01 | |
Illinois (Various Revenue) µ | | | 5.00-6.00 | | | | 4-1-2021 to 7-1-2038 | | | | 68,135,000 | | | | 75,370,843 | | | | 2.56 | |
Illinois Finance Authority (Various Revenue) µ | | | 0.42-7.13 | | | | 9-1-2018 to 10-1-2041 | | | | 68,460,000 | | | | 74,029,289 | | | | 2.52 | |
Illinois Sports Facilities Authority (Tax Revenue) µ | | | 0.00-5.25 | | | | 6-15-2021 to 6-15-2032 | | | | 33,040,000 | | | | 36,095,326 | | | | 1.23 | |
Illinois Sports Facilities Authority State Tax Supported CAB (Tax Revenue, Ambac Insured) ¤ | | | 0.00 | | | | 6-15-2024 | | | | 17,510,000 | | | | 14,214,443 | | | | 0.48 | |
Kane-Cook-DuPage Counties IL School District #46 CAB Series B (GO Revenue, Ambac Insured) ¤ | | | 0.00 | | | | 1-1-2023 | | | | 15,025,000 | | | | 12,750,666 | | | | 0.43 | |
Metropolitan Pier & Exposition Authority Illinois Series 2015-XM0036 (Airport Revenue, Morgan Stanley Bank LIQ) 144Aø | | | 1.00 | | | | 6-15-2050 | | | | 12,640,000 | | | | 12,640,000 | | | | 0.43 | |
University of Illinois Auxiliary Facilities Systems Series A (Education Revenue) | | | 5.75 | | | | 4-1-2038 | | | | 14,000,000 | | | | 15,893,220 | | | | 0.54 | |
Other securities | | | | | | | | | | | | | | | 110,486,579 | | | | 3.74 | |
| | | | | |
| | | | | | | | | | | | | | | 566,365,522 | | | | 19.21 | |
| | | | | | | | | | | | | | | | | | | | |
| | | | | |
| Indiana: 1.37% | | | | | | | | | | | | | | | | | | | | |
Rockport IN AEP Generating Company Project (Industrial Development Revenue, Bank of Tokyo-Mitsubishi LOC) ø | | | 0.43 | | | | 7-1-2025 | | | | 16,200,000 | | | | 16,200,000 | | | | 0.55 | |
Other securities | | | | | | | | | | | | | | | 24,201,566 | | | | 0.82 | |
| | | | | |
| | | | | | | | | | | | | | | 40,401,566 | | | | 1.37 | |
| | | | | | | | | | | | | | | | | | | | |
The accompanying notes are an integral part of these financial statements.
| | | | | | |
| Summary portfolio of investments—June 30, 2016 | | Wells Fargo Municipal Bond Fund | | | 11 | |
| | | | | | | | | | | | | | | | | | | | |
| Security name | | Interest rate | | | Maturity date | | | Principal | | | Value | | | Percent of
net assets | |
| | | | | |
| Iowa: 0.17% | | | | | | | | | | | | | | | | | | | | |
Other securities | | | | | | | | | | | | | | $ | 4,899,250 | | | | 0.17 | % |
| | | | | | | | | | | | | | | | | | | | |
| | | | | |
| Kansas: 1.20% | | | | | | | | | | | | | | | | | | | | |
Wyandotte County & Kansas City KS Sales Tax Special Obligation Vacation Village Project Area 4—Major Multi-Sport Athletic Complex Project CAB Series 2015 (Tax Revenue) 144A¤ | | | 0.00 | % | | | 9-1-2034 | | | $ | 97,000,000 | | | | 35,246,890 | | | | 1.20 | |
Wyandotte County & Kansas City KS Unified Government Special Obligation Second Lien CAB Series B (Tax Revenue) ¤ | | | 0.00 | | | | 6-1-2021 | | | | 45,000 | | | | 34,244 | | | | 0.00 | |
Other securities | | | | | | | | | | | | | | | 70,610 | | | | 0.00 | |
| | | | | |
| | | | | | | | | | | | | | | 35,351,744 | | | | 1.20 | |
| | | | | | | | | | | | | | | | | | | | |
| | | | | |
| Kentucky: 1.69% | | | | | | | | | | | | | | | | | | | | |
Kentucky EDFA (Various Revenue) µ | | | 0.00-0.73 | | | | 8-15-2024 to 10-1-2028 | | | | 24,605,000 | | | | 21,372,462 | | | | 0.73 | |
Kentucky EDFA Catholic Health Initiatives Series B (Health Revenue) ± | | | 1.79 | | | | 2-1-2046 | | | | 22,715,000 | | | | 22,343,610 | | | | 0.76 | |
Other securities | | | | | | | | | | | | | | | 6,081,928 | | | | 0.20 | |
| | | | | |
| | | | | | | | | | | | | | | 49,798,000 | | | | 1.69 | |
| | | | | | | | | | | | | | | | | | | | |
| | | | | |
| Louisiana: 0.78% | | | | | | | | | | | | | | | | | | | | |
Other securities | | | | | | | | | | | | | | | 23,091,116 | | | | 0.78 | |
| | | | | | | | | | | | | | | | | | | | |
| | | | | |
| Maine: 0.08% | | | | | | | | | | | | | | | | | | | | |
Other securities | | | | | | | | | | | | | | | 2,241,385 | | | | 0.08 | |
| | | | | | | | | | | | | | | | | | | | |
| | | | | |
| Maryland: 0.31% | | | | | | | | | | | | | | | | | | | | |
Other securities | | | | | | | | | | | | | | | 9,255,493 | | | | 0.31 | |
| | | | | | | | | | | | | | | | | | | | |
| | | | | |
| Massachusetts: 0.73% | | | | | | | | | | | | | | | | | | | | |
Other securities | | | | | | | | | | | | | | | 21,446,658 | | | | 0.73 | |
| | | | | | | | | | | | | | | | | | | | |
| | | | | |
| Michigan: 5.74% | | | | | | | | | | | | | | | | | | | | |
Michigan Finance Authority (Various Revenue) µ | | | 4.50-8.25 | | | | 10-1-2020 to 10-1-2040 | | | | 52,735,000 | | | | 62,189,171 | | | | 2.10 | |
Michigan Finance Authority Refunding Notes Local Government Loan Program Public Lighting Authority Series B (Tax Revenue) | | | 5.00 | | | | 7-1-2044 | | | | 12,625,000 | | | | 14,496,656 | | | | 0.49 | |
Michigan Strategic Fund Limited Obligation Events Center Project Series A (Tax Revenue) ± | | | 4.13 | | | | 7-1-2045 | | | | 15,500,000 | | | | 15,915,865 | | | | 0.54 | |
Other securities | | | | | | | | | | | | | | | 76,695,006 | | | | 2.61 | |
| | | | | |
| | | | | | | | | | | | | | | 169,296,698 | | | | 5.74 | |
| | | | | | | | | | | | | | | | | | | | |
| | | | | |
| Minnesota: 0.03% | | | | | | | | | | | | | | | | | | | | |
Other securities | | | | | | | | | | | | | | | 766,755 | | | | 0.03 | |
| | | | | | | | | | | | | | | | | | | | |
| | | | | |
| Mississippi: 1.01% | | | | | | | | | | | | | | | | | | | | |
Perry County MS PCR Leaf River Forest Products Incorporated Project (Industrial Development Revenue, Georgia-Pacific LLC LOC) 144Aø | | | 0.60 | | | | 2-1-2022 | | | | 20,000,000 | | | | 20,000,000 | | | | 0.68 | |
The accompanying notes are an integral part of these financial statements.
| | | | |
| 12 | | Wells Fargo Municipal Bond Fund | | Summary portfolio of investments—June 30, 2016 |
| | | | | | | | | | | | | | | | | | | | |
| Security name | | Interest rate | | | Maturity date | | | Principal | | | Value | | | Percent of
net assets | |
| | | | | |
| Mississippi (continued) | | | | | | | | | | | | | | | | | | | | |
Other securities | | | | | | | | | | | | | | $ | 9,719,374 | | | | 0.33 | % |
| | | | | |
| | | | | | | | | | | | | | | 29,719,374 | | | | 1.01 | |
| | | | | | | | | | | | | | | | | | | | |
| | | | | |
| Missouri: 0.59% | | | | | | | | | | | | | | | | | | | | |
Other securities | | | | | | | | | | | | | | | 17,507,363 | | | | 0.59 | |
| | | | | | | | | | | | | | | | | | | | |
| | | | | |
| Nebraska: 0.04% | | | | | | | | | | | | | | | | | | | | |
Other securities | | | | | | | | | | | | | | | 1,189,657 | | | | 0.04 | |
| | | | | | | | | | | | | | | | | | | | |
| | | | | |
| Nevada: 0.67% | | | | | | | | | | | | | | | | | | | | |
Washoe County NV Series 2011-001 (GO Revenue, Dexia Credit Local LIQ) 144Aø | | | 0.76 | % | | | 12-9-2030 | | | $ | 13,555,000 | | | | 13,555,000 | | | | 0.46 | |
Other securities | | | | | | | | | | | | | | | 6,282,000 | | | | 0.21 | |
| | | | | |
| | | | | | | | | | | | | | | 19,837,000 | | | | 0.67 | |
| | | | | | | | | | | | | | | | | | | | |
| | | | | |
| New Jersey: 5.44% | | | | | | | | | | | | | | | | | | | | |
New Jersey EDA (Various Revenue) µ | | | 1.64-5.00 | | | | 9-1-2025 to 10-1-2040 | | | | 18,195,000 | | | | 17,764,807 | | | | 0.60 | |
New Jersey EDA School Facilities Construction Project Series I (Miscellaneous Revenue) ± | | | 1.96 | | | | 9-1-2027 | | | | 22,245,000 | | | | 19,992,916 | | | | 0.68 | |
New Jersey EDA School Facilities Construction Project Series NN (Miscellaneous Revenue) | | | 5.00 | | | | 3-1-2026 | | | | 15,000,000 | | | | 16,738,500 | | | | 0.57 | |
New Jersey TTFA (Various Revenue) µ | | | 0.00-6.00 | | | | 6-15-2023 to 6-15-2044 | | | | 60,215,000 | | | | 57,937,479 | | | | 1.96 | |
New Jersey TTFA Series A (Miscellaneous Revenue, National Insured) | | | 5.75 | | | | 6-15-2025 | | | | 10,000,000 | | | | 12,550,800 | | | | 0.43 | |
Other securities | | | | | | | | | | | | | | | 35,348,340 | | | | 1.20 | |
| | | | | |
| | | | | | | | | | | | | | | 160,332,842 | | | | 5.44 | |
| | | | | | | | | | | | | | | | | | | | |
| | | | | |
| New Mexico: 0.36% | | | | | | | | | | | | | | | | | | | | |
Other securities | | | | | | | | | | | | | | | 10,718,481 | | | | 0.36 | |
| | | | | | | | | | | | | | | | | | | | |
| | | | | |
| New York: 11.77% | | | | | | | | | | | | | | | | | | | | |
Metropolitan Transportation Authority New York Subseries E-2 (Transportation Revenue, Bank of Tokyo-Mitsubishi LOC) ø | | | 0.40 | | | | 11-15-2050 | | | | 15,000,000 | | | | 15,000,000 | | | | 0.51 | |
New York NY Municipal Water Finance Authority 2nd General Resolution Series AA (Water & Sewer Revenue) | | | 5.00 | | | | 6-15-2044 | | | | 17,400,000 | | | | 20,342,514 | | | | 0.69 | |
New York NY Municipal Water Finance Authority 2nd General Resolution Series BB (Water & Sewer Revenue) | | | 5.00 | | | | 6-15-2044 | | | | 30,265,000 | | | | 35,834,971 | | | | 1.22 | |
New York NY Municipal Water Finance Authority (Water & Sewer Revenue) µ | | | 0.37-5.75 | | | | 6-15-2026 to 6-15-2044 | | | | 28,055,000 | | | | 31,169,353 | | | | 1.05 | |
New York NY Municipal Water Finance Authority 2nd General Resolution Series DD (Water & Sewer Revenue) | | | 6.00 | | | | 6-15-2040 | | | | 11,625,000 | | | | 12,815,749 | | | | 0.43 | |
New York NY Municipal Water Finance Authority Water & Sewer System Series A (Water & Sewer Revenue) | | | 5.00 | | | | 6-15-2038 | | | | 36,650,000 | | | | 38,150,818 | | | | 1.29 | |
New York NY Transitional Finance Authority (Tax Revenue) µ | | | 0.64-5.75 | | | | 11-1-2022 to 1-15-2039 | | | | 24,030,000 | | | | 25,552,686 | | | | 0.87 | |
New York NY Transitional Finance Authority Future Tax Secured Bonds Fiscal 2007 Series A (Tax Revenue, Dexia Credit Local SPA) ø | | | 0.60 | | | | 8-1-2022 | | | | 20,500,000 | | | | 20,500,000 | | | | 0.70 | |
New York NY Transitional Finance Authority Future Tax Secured Subordinate Bonds Series A (Tax Revenue) | | | 5.00 | | | | 8-1-2031 | | | | 17,075,000 | | | | 21,432,369 | | | | 0.73 | |
The accompanying notes are an integral part of these financial statements.
| | | | | | |
| Summary portfolio of investments—June 30, 2016 | | Wells Fargo Municipal Bond Fund | | | 13 | |
| | | | | | | | | | | | | | | | | | | | |
| Security name | | Interest rate | | | Maturity date | | | Principal | | | Value | | | Percent of
net assets | |
| | | | | |
| New York (continued) | | | | | | | | | | | | | | | | | | | | |
New York NY Transitional Finance Authority Sub Series C3 (Tax Revenue, Dexia Credit Local SPA) ø | | | 0.56 | % | | | 8-1-2031 | | | $ | 24,200,000 | | | $ | 24,200,000 | | | | 0.82 | % |
New York Urban Development Corporation Certificate of Participation James A Farley Post Office Project (Miscellaneous Revenue) 144A | | | 4.20 | | | | 2-1-2017 | | | | 20,920,000 | | | | 20,928,368 | | | | 0.71 | |
Other securities | | | | | | | | | | | | | | | 81,030,600 | | | | 2.75 | |
| | | | | |
| | | | | | | | | | | | | | | 346,957,428 | | | | 11.77 | |
| | | | | | | | | | | | | | | | | | | | |
| | | | | |
| North Carolina: 0.64% | | | | | | | | | | | | | | | | | | | | |
Other securities | | | | | | | | | | | | | | | 18,968,770 | | | | 0.64 | |
| | | | | | | | | | | | | | | | | | | | |
| | | | | |
| Ohio: 2.73% | | | | | | | | | | | | | | | | | | | | |
Ohio Private Activity Bond AMT Portsmouth Bypass Project (Industrial Development Revenue, AGM Insured) | | | 5.00 | | | | 12-31-2035 | | | | 12,000,000 | | | | 14,202,720 | | | | 0.48 | |
Ohio Water Development Authority Series A (Industrial Development Revenue) ± | | | 3.75 | | | | 7-1-2033 | | | | 18,000,000 | | | | 18,512,460 | | | | 0.63 | |
Other securities | | | | | | | | | | | | | | | 47,627,209 | | | | 1.62 | |
| | | | | |
| | | | | | | | | | | | | | | 80,342,389 | | | | 2.73 | |
| | | | | | | | | | | | | | | | | | | | |
| | | | | |
| Oklahoma: 0.40% | | | | | | | | | | | | | | | | | | | | |
Other securities | | | | | | | | | | | | | | | 11,711,778 | | | | 0.40 | |
| | | | | | | | | | | | | | | | | | | | |
| | | | | |
| Oregon: 0.18% | | | | | | | | | | | | | | | | | | | | |
Other securities | | | | | | | | | | | | | | | 5,338,980 | | | | 0.18 | |
| | | | | | | | | | | | | | | | | | | | |
| | | | | |
| Pennsylvania: 7.66% | | | | | | | | | | | | | | | | | | | | |
Berks County PA Municipal Authority Reading Hospital & Medical Center Project Series B (Health Revenue) | | | 1.93 | | | | 11-1-2039 | | | | 20,000,000 | | | | 20,158,200 | | | | 0.68 | |
Bristol Township PA School District Series 27W Residual Interest Bonds Trust (GO Revenue, Barclays Bank plc LIQ) 144Aø | | | 0.78 | | | | 6-1-2031 | | | | 12,790,000 | | | | 12,790,000 | | | | 0.44 | |
Delaware Valley PA Regional Finance Authority (Miscellaneous Revenue) µ | | | 5.75-7.75 | | | | 7-1-2027 to 7-1-2032 | | | | 8,975,000 | | | | 12,760,990 | | | | 0.43 | |
Delaware Valley PA Regional Finance Authority Series A (Miscellaneous Revenue, Ambac Insured) | | | 5.50 | | | | 8-1-2028 | | | | 16,420,000 | | | | 21,281,634 | | | | 0.72 | |
Montgomery County PA IDA Exelon Generation Company LLC Project Series A (Industrial Development Revenue) ± | | | 2.55 | | | | 12-1-2029 | | | | 15,530,000 | | | | 15,967,014 | | | | 0.54 | |
Pennsylvania Public School Building Authority Series DCL-016 (Miscellaneous Revenue, Dexia Credit Local LOC, AGM Insured) 144Aø | | | 0.88 | | | | 6-1-2023 | | | | 15,710,000 | | | | 15,710,000 | | | | 0.53 | |
Pennsylvania Turnpike Commission Motor License Series B1 (Transportation Revenue) | | | 5.00 | | | | 12-1-2040 | | | | 12,410,000 | | | | 14,050,478 | | | | 0.48 | |
Philadelphia PA Series B (GO Revenue, Barclays Bank plc LOC) ø | | | 0.42 | | | | 8-1-2031 | | | | 15,000,000 | | | | 15,000,000 | | | | 0.51 | |
Other securities | | | | | | | | | | | | | | | 97,984,990 | | | | 3.33 | |
| | | | | |
| | | | | | | | | | | | | | | 225,703,306 | | | | 7.66 | |
| | | | | | | | | | | | | | | | | | | | |
| | | | | |
| Puerto Rico: 0.39% | | | | | | | | | | | | | | | | | | | | |
Other securities | | | | | | | | | | | | | | | 11,591,053 | | | | 0.39 | |
| | | | | | | | | | | | | | | | | | | | |
The accompanying notes are an integral part of these financial statements.
| | | | |
| 14 | | Wells Fargo Municipal Bond Fund | | Summary portfolio of investments—June 30, 2016 |
| | | | | | | | | | | | | | | | | | | | |
| Security name | | Interest rate | | | Maturity date | | | Principal | | | Value | | | Percent of
net assets | |
| | | | | |
| Rhode Island: 0.19% | | | | | | | | | | | | | | | | | | | | |
Other securities | | | | | | | | | | | | | | $ | 5,655,482 | | | | 0.19 | % |
| | | | | | | | | | | | | | | | | | | | |
| | | | | |
| South Carolina: 0.63% | | | | | | | | | | | | | | | | | | | | |
Other securities | | | | | | | | | | | | | | | 18,584,308 | | | | 0.63 | |
| | | | | | | | | | | | | | | | | | | | |
| | | | | |
| South Dakota: 0.26% | | | | | | | | | | | | | | | | | | | | |
Other securities | | | | | | | | | | | | | | | 7,686,117 | | | | 0.26 | |
| | | | | | | | | | | | | | | | | | | | |
| | | | | |
| Tennessee: 0.49% | | | | | | | | | | | | | | | | | | | | |
Other securities | | | | | | | | | | | | | | | 14,530,000 | | | | 0.49 | |
| | | | | | | | | | | | | | | | | | | | |
| | | | | |
| Texas: 7.66% | | | | | | | | | | | | | | | | | | | | |
Port Arthur TX Navigation District Jefferson County Environmental Facilities Motiva Enterprises LLC Project Series D (Resource Recovery Revenue) ø | | | 0.54 | % | | | 11-1-2040 | | | $ | 25,000,000 | | | | 25,000,000 | | | | 0.85 | |
Texas Municipal Gas Acquisition & Supply Corporation II Series B (Utilities Revenue, JPMorgan Chase & Company Guaranteed) ± | | | 0.88 | | | | 9-15-2017 | | | | 8,405,000 | | | | 8,374,490 | | | | 0.28 | |
Texas Municipal Gas Acquisition & Supply Corporation Sub Lien Series C (Utilities Revenue) ± | | | 1.88 | | | | 12-15-2026 | | | | 28,780,000 | | | | 26,458,030 | | | | 0.90 | |
Texas Private Activity Bond Surface Transportation Corporation Project NTE Mobility Partners Segments LLC (Transportation Revenue) | | | 7.00 | | | | 12-31-2038 | | | | 12,500,000 | | | | 15,916,125 | | | | 0.54 | |
Texas Transportation Commission Highway Improvement (Miscellaneous Revenue) | | | 5.00 | | | | 4-1-2028 | | | | 7,280,000 | | | | 9,129,047 | | | | 0.31 | |
Texas Transportation Commission State Highway Fund Floating 1st Tier Series B (Transportation Revenue, Banco Bilboa Vizcaya SPA) ø | | | 0.65 | | | | 4-1-2026 | | | | 20,650,000 | | | | 20,650,000 | | | | 0.70 | |
Other securities | | | | | | | | | | | | | | | 120,137,379 | | | | 4.08 | |
| | | | | |
| | | | | | | | | | | | | | | 225,665,071 | | | | 7.66 | |
| | | | | | | | | | | | | | | | | | | | |
| | | | | |
| Utah: 0.52% | | | | | | | | | | | | | | | | | | | | |
Other securities | | | | | | | | | | | | | | | 15,324,560 | | | | 0.52 | |
| | | | | | | | | | | | | | | | | | | | |
| | | | | |
| Vermont: 1.38% | | | | | | | | | | | | | | | | | | | | |
Vermont Student Assistance Corporation Series B Class A2 (Education Revenue) ± | | | 3.68 | | | | 12-3-2035 | | | | 16,800,000 | | | | 17,451,000 | | | | 0.59 | |
Vermont Student Assistance Corporation Series B Class B (Education Revenue) ± | | | 1.46 | | | | 6-2-2042 | | | | 23,782,086 | | | | 23,353,533 | | | | 0.79 | |
| | | | | |
| | | | | | | | | | | | | | | 40,804,533 | | | | 1.38 | |
| | | | | | | | | | | | | | | | | | | | |
| | | | | |
| Virgin Islands: 0.32% | | | | | | | | | | | | | | | | | | | | |
Other securities | | | | | | | | | | | | | | | 9,455,481 | | | | 0.32 | |
| | | | | | | | | | | | | | | | | | | | |
| | | | | |
| Virginia: 0.22% | | | | | | | | | | | | | | | | | | | | |
Other securities | | | | | | | | | | | | | | | 6,498,874 | | | | 0.22 | |
| | | | | | | | | | | | | | | | | | | | |
| | | | | |
| Washington: 0.26% | | | | | | | | | | | | | | | | | | | | |
Other securities | | | | | | | | | | | | | | | 7,671,676 | | | | 0.26 | |
| | | | | | | | | | | | | | | | | | | | |
| | | | | |
| West Virginia: 0.43% | | | | | | | | | | | | | | | | | | | | |
Other securities | | | | | | | | | | | | | | | 12,570,836 | | | | 0.43 | |
| | | | | | | | | | | | | | | | | | | | |
The accompanying notes are an integral part of these financial statements.
| | | | | | |
| Summary portfolio of investments—June 30, 2016 | | Wells Fargo Municipal Bond Fund | | | 15 | |
| | | | | | | | | | | | | | | | | | | | |
| Security name | | Interest rate | | | Maturity date | | | Principal | | | Value | | | Percent of
net assets | |
| | | | | |
| Wisconsin: 0.56% | | | | | | | | | | | | | | | | | | | | |
Other securities | | | | | | | | | | | | | | $ | 16,619,853 | | | | 0.56 | % |
| | | | | | | | | | | | | | | | | | | | |
| | | | | |
| Wyoming: 0.79% | | | | | | | | | | | | | | | | | | | | |
Sweetwater County WY PCR Refunding PacifiCorp Project Series A (Industrial Development Revenue) ø | | | 0.52 | % | | | 1-1-2017 | | | $ | 21,000,000 | | | | 21,000,000 | | | | 0.71 | |
Other securities | | | | | | | | | | | | | | | 2,429,981 | | | | 0.08 | |
| | | | | |
| | | | | | | | | | | | | | | 23,429,981 | | | | 0.79 | |
| | | | | | | | | | | | | | | | | | | | |
| | | | | |
Total Municipal Obligations (Cost $2,679,389,675) | | | | | | | | | | | | | | | 2,893,326,178 | | | | 98.14 | |
| | | | | | | | | | | | | | | | | | | | |
| | | | | |
| | | Yield | | | | | | Shares | | | | | | | |
| Short-Term Investments: 0.19% | | | | | | | | | | | | | | | | | | | | |
| | | | | |
| Investment Companies: 0.08% | | | | | | | | | | | | | | | | | | | | |
Wells Fargo Municipal Cash Management Fund Institutional Class (l)(u)## | | | 0.30 | | | | | | | | 2,204,064 | | | | 2,204,064 | | | | 0.08 | |
| | | | | | | | | | | | | | | | | | | | |
| | | | | |
| | | | | | | | | Principal | | | | | | | |
| U.S. Treasury Securities: 0.11% | | | | | | | | | | | | | | | | | | | | |
U.S. Treasury Bill (z)# | | | 0.26 | | | | 9-15-2016 | | | $ | 3,325,000 | | | | 3,323,480 | | | | 0.11 | |
| | | | | | | | | | | | | | | | | | | | |
| Total Short-Term Investments (Cost $5,527,197) | | | | | | | | | | | | | | | 5,527,544 | | | | 0.19 | |
| | | | | | | | | | | | | | | | | | | | |
| | | | |
| Total investments in securities (Cost $2,700,284,722) * | | | | | | | | | | | | 2,913,513,805 | | | | 98.83 | % |
Other assets and liabilities, net | | | | | | | | | | | | | | | 34,457,016 | | | | 1.17 | |
| | | | | | | | | | | | | | | | | | | | |
| Total net assets | | | | | | | | | | | | | | $ | 2,947,970,821 | | | | 100.00 | % |
| | | | | | | | | | | | | | | | | | | | |
| ± | Variable rate investment. The rate shown is the rate in effect at period end. |
| ¤ | The security is issued in zero coupon form with no periodic interest payments. |
| 144A | The security may be resold in transactions exempt from registration, normally to qualified institutional buyers, pursuant to Rule 144A under the Securities Act of 1933. |
| ø | Variable rate demand notes are subject to a demand feature which reduces the effective maturity. The maturity date shown represents the final maturity date of the security. The interest rate is determined and reset by the issuer daily, weekly, or monthly depending upon the terms of the security. The rate shown is the rate in effect at period end. |
| µ | All or some of these obligations have credit enhancements or liquidity features that may, under certain circumstances, provide for repayment of principal and interest. |
| (l) | The issuer of the security is an affiliated person of the Fund as defined in the Investment Company Act of 1940. |
| (u) | The rate represents the 7-day annualized yield at period end. |
| ## | All or a portion of this security is segregated for when-issued securities. |
| (z) | Zero coupon security. The rate represents the current yield to maturity. |
| # | All or a portion of this security is segregated as collateral for investments in derivative instruments. |
| * | Cost for federal income tax purposes is $2,701,438,187 and unrealized gains (losses) consists of: |
| | | | |
Gross unrealized gains | | $ | 221,205,311 | |
Gross unrealized losses | | | (9,129,693 | ) |
| | | | |
Net unrealized gains | | $ | 212,075,618 | |
The accompanying notes are an integral part of these financial statements.
| | | | |
| 16 | | Wells Fargo Municipal Bond Fund | | Statement of assets and liabilities—June 30, 2016 |
| | | | |
| | | | |
| |
Assets | | | | |
Investments | | | | |
In unaffiliated securities, at value (cost $2,698,080,658) | | $ | 2,911,309,741 | |
In affiliated securities, at value (cost $2,204,064) | | | 2,204,064 | |
| | | | |
Total investments, at value (cost $2,700,284,722) | | | 2,913,513,805 | |
Cash | | | 783,750 | |
Receivable for investments sold | | | 31,592,483 | |
Receivable for Fund shares sold | | | 5,218,165 | |
Receivable for interest | | | 24,469,801 | |
Receivable for daily variation margin on open futures contracts | | | 148,859 | |
Prepaid expenses and other assets | | | 250,185 | |
| | | | |
Total assets | | | 2,975,977,048 | |
| | | | |
| |
Liabilities | | | | |
Dividends payable | | | 1,008,811 | |
Payable for investments purchased | | | 12,744,237 | |
Payable for floating-rate notes issued | | | 5,025,000 | |
Payable for Fund shares redeemed | | | 7,459,260 | |
Interest and fee expense payable | | | 15,912 | |
Management fee payable | | | 785,882 | |
Distribution fees payable | | | 113,386 | |
Administration fees payable | | | 307,847 | |
Accrued expenses and other liabilities | | | 545,892 | |
| | | | |
Total liabilities | | | 28,006,227 | |
| | | | |
Total net assets | | $ | 2,947,970,821 | |
| | | | |
| |
NET ASSETS CONSIST OF | | | | |
Paid-in capital | | $ | 2,730,019,358 | |
Overdistributed net investment income | | | (270,939 | ) |
Accumulated net realized gains on investments | | | 6,808,151 | |
Net unrealized gains on investments | | | 211,414,251 | |
| | | | |
Total net assets | | $ | 2,947,970,821 | |
| | | | |
| |
COMPUTATION OF NET ASSET VALUE AND OFFERING PRICE PER SHARE | | | | |
Net assets – Class A | | $ | 1,529,883,568 | |
Shares outstanding – Class A1 | | | 143,020,541 | |
Net asset value per share – Class A | | | $10.70 | |
Maximum offering price per share – Class A2 | | | $11.20 | |
Net assets – Class B | | $ | 457,865 | |
Shares outstanding – Class B1 | | | 42,777 | |
Net asset value per share – Class B | | | $10.70 | |
Net assets – Class C | | $ | 186,036,106 | |
Shares outstanding – Class C1 | | | 17,395,562 | |
Net asset value per share – Class C | | | $10.69 | |
Net assets – Administrator Class | | $ | 270,304,289 | |
Shares outstanding – Administrator Class1 | | | 25,258,262 | |
Net asset value per share – Administrator Class | | | $10.70 | |
Net assets – Institutional Class | | $ | 961,288,993 | |
Shares outstanding – Institutional Class1 | | | 89,872,485 | |
Net asset value per share – Institutional Class | | | $10.70 | |
| 1 | The Fund has an unlimited number of authorized shares. |
| 2 | Maximum offering price is computed as 100/95.50 of net asset value. On investments of $50,000 or more, the offering price is reduced. |
The accompanying notes are an integral part of these financial statements.
| | | | | | |
| Statement of operations —year ended June 30, 2016 | | Wells Fargo Municipal Bond Fund | | | 17 | |
| | | | |
| | | | |
| |
Investment income | | | | |
Interest | | $ | 112,091,383 | |
Dividends | | | 645,148 | |
Income from affiliated securities | | | 32,870 | |
| | | | |
Total investment income | | | 112,769,401 | |
| | | | |
| |
Expenses | | | | |
Management fee | | | 10,895,512 | |
Administration fees | | | | |
Class A | | | 2,650,509 | |
Class B | | | 1,706 | |
Class C | | | 274,588 | |
Administrator Class | | | 279,526 | |
Institutional Class | | | 597,984 | |
Investor Class | | | 295,966 | 1 |
Shareholder servicing fees | | | | |
Class A | | | 4,141,421 | |
Class B | | | 2,666 | |
Class C | | | 429,044 | |
Administrator Class | | | 689,207 | 1 |
Investor Class | | | 388,782 | |
Distribution fees | | | | |
Class B | | | 7,996 | |
Class C | | | 1,287,131 | |
Custody and accounting fees | | | 160,842 | |
Professional fees | | | 72,197 | |
Registration fees | | | 134,077 | |
Shareholder report expenses | | | 129,467 | |
Trustees’ fees and expenses | | | 6,479 | |
Interest and fee expense | | | 42,771 | |
Other fees and expenses | | | 32,025 | |
| | | | |
Total expenses | | | 22,519,896 | |
Less: Fee waivers and/or expense reimbursements | | | (1,135,612 | ) |
| | | | |
Net expenses | | | 21,384,284 | |
| | | | |
Net investment income | | | 91,385,117 | |
| | | | |
| |
REALIZED AND UNREALIZED GAINS (LOSSES) ON INVESTMENTS | | | | |
| |
Net realized gains (losses) on: | | | | |
Unaffiliated securities | | | 27,481,533 | |
Futures transactions | | | (1,695,499 | ) |
| | | | |
Net realized gains on investments | | | 25,786,034 | |
| | | | |
| |
Net change in unrealized gains (losses) on: | | | | |
Unaffiliated securities | | | 119,086,904 | |
Futures transactions | | | (1,814,832 | ) |
| | | | |
Net change in unrealized gains (losses) on investments | | | 117,272,072 | |
| | | | |
Net realized and unrealized gains (losses) on investments | | | 143,058,106 | |
| | | | |
Net increase in net assets resulting from operations | | $ | 234,443,223 | |
| | | | |
| 1 | For the period from July 1, 2015 to October 23, 2015. Effective at the close of business on October 23, 2015, Investor Class shares were converted to Class A shares and are no longer offered by the Fund. |
The accompanying notes are an integral part of these financial statements.
| | | | |
| 18 | | Wells Fargo Municipal Bond Fund | | Statement of changes in net assets |
| | | | | | | | | | | | | | | | |
| | | Year ended
June 30, 2016 | | | Year ended
June 30, 2015 | |
| | | | |
Operations | | | | | | | | | | | | | | | | |
Net investment income | | | | | | $ | 91,385,117 | | | | | | | $ | 86,557,165 | |
Net realized gains on investments | | | | | | | 25,786,034 | | | | | | | | 29,866,649 | |
Net change in unrealized gains (losses) on investments | | | | | | | 117,272,072 | | | | | | | | (32,280,612 | ) |
| | | | |
Net increase in net assets resulting from operations | | | | | | | 234,443,223 | | | | | | | | 84,143,202 | |
| | | | |
| | | | |
Distributions to shareholders from | | | | | | | | | | | | | | | | |
Net investment income | | | | | | | | | | | | | | | | |
Class A | | | | | | | (49,506,305 | ) | | | | | | | (44,193,043 | ) |
Class B | | | | | | | (24,157 | ) | | | | | | | (52,448 | ) |
Class C | | | | | | | (3,837,158 | ) | | | | | | | (3,216,672 | ) |
Administrator Class | | | | | | | (8,790,709 | ) | | | | | | | (11,782,289 | ) |
Institutional Class | | | | | | | (24,426,383 | ) | | | | | | | (13,405,172 | ) |
Investor Class | | | | | | | (4,799,469 | )1 | | | | | | | (13,894,674 | ) |
Net realized gains | | | | | | | | | | | | | | | | |
Class A | | | | | | | (9,166,267 | ) | | | | | | | (13,650,951 | ) |
Class B | | | | | | | (5,119 | ) | | | | | | | (23,225 | ) |
Class C | | | | | | | (776,529 | ) | | | | | | | (1,383,944 | ) |
Administrator Class | | | | | | | (1,141,943 | ) | | | | | | | (3,527,595 | ) |
Institutional Class | | | | | | | (3,376,986 | ) | | | | | | | (3,771,405 | ) |
Investor Class | | | | | | | 0 | 1 | | | | | | | (4,402,074 | ) |
| | | | |
Total distributions to shareholders | | | | | | | (105,851,025 | ) | | | | | | | (113,303,492 | ) |
| | | | |
| | | | |
Capital share transactions | | | Shares | | | | | | | | Shares | | | | | |
Proceeds from shares sold | | | | | | | | | | | | | | | | |
Class A | | | 64,653,820 | | | | 669,764,488 | | | | 23,973,044 | | | | 250,012,763 | |
Class B | | | 27 | | | | 279 | | | | 117 | | | | 1,222 | |
Class C | | | 3,347,238 | | | | 35,008,106 | | | | 3,143,375 | | | | 32,806,096 | |
Administrator Class | | | 10,079,801 | | | | 104,821,922 | | | | 20,246,598 | | | | 211,455,411 | |
Institutional Class | | | 55,658,632 | | | | 579,421,682 | | | | 41,693,219 | | | | 434,469,984 | |
Investor Class | | | 1,789,189 | 1 | | | 18,389,280 | 1 | | | 11,800,968 | | | | 123,113,464 | |
| | | | |
| | | | | | | 1,407,405,757 | | | | | | | | 1,051,858,940 | |
| | | | |
Reinvestment of distributions | | | | | | | | | | | | | | | | |
Class A | | | 5,096,119 | | | | 53,145,243 | | | | 5,027,417 | | | | 52,416,400 | |
Class B | | | 2,442 | | | | 25,421 | | | | 5,886 | | | | 61,452 | |
Class C | | | 375,341 | | | | 3,915,284 | | | | 372,563 | | | | 3,884,533 | |
Administrator Class | | | 922,285 | | | | 9,615,221 | | | | 1,393,587 | | | | 14,546,594 | |
Institutional Class | | | 1,934,077 | | | | 20,220,148 | | | | 1,139,701 | | | | 11,881,442 | |
Investor Class | | | 339,015 | 1 | | | 3,486,525 | 1 | | | 1,628,050 | | | | 16,974,411 | |
| | | | |
| | | | | | | 90,407,842 | | | | | | | | 99,764,832 | |
| | | | |
The accompanying notes are an integral part of these financial statements.
| | | | | | |
| Statement of changes in net assets | | Wells Fargo Municipal Bond Fund | | | 19 | |
| | | | | | | | | | | | | | | | |
| | | Year ended
June 30, 2016 | | | Year ended
June 30, 2015 | |
| | | | |
| | | Shares | | | | | | Shares | | | | |
| | | | |
Capital share transactions (continued) | | | | | | | | | | | | | | | | |
Payment for shares redeemed | | | | | | | | | | | | | | | | |
Class A | | | (83,965,428 | ) | | | (877,180,351 | ) | | | (32,551,574 | ) | | | (338,551,266 | ) |
Class B | | | (122,606 | ) | | | (1,277,115 | ) | | | (196,214 | ) | | | (2,047,558 | ) |
Class C | | | (2,393,610 | ) | | | (24,976,011 | ) | | | (2,440,156 | ) | | | (25,378,976 | ) |
Administrator Class | | | (23,257,159 | ) | | | (239,883,451 | ) | | | (19,225,008 | ) | | | (200,313,517 | ) |
Institutional Class | | | (18,804,492 | ) | | | (196,444,238 | ) | | | (16,438,142 | ) | | | (171,254,683 | ) |
Investor Class | | | (50,409,942 | )1 | | | (520,861,783 | )1 | | | (17,852,131 | ) | | | (185,133,597 | ) |
| | | | |
| | | | | | | (1,860,622,949 | ) | | | | | | | (922,679,597 | ) |
| | | | |
Net increase (decrease) in net assets resulting from capital share transactions | | | | | | | (362,809,350 | ) | | | | | | | 228,944,175 | |
| | | | |
Total increase (decrease) in net assets | | | | | | | (234,217,152 | ) | | | | | | | 199,783,885 | |
| | | | |
| | | | |
Net assets | | | | | | | | | | | | | | | | |
Beginning of period | | | | | | | 3,182,187,973 | | | | | | | | 2,982,404,088 | |
| | | | |
End of period | | | | | | $ | 2,947,970,821 | | | | | | | $ | 3,182,187,973 | |
| | | | |
Overdistributed net investment income | | | | | | $ | (270,939 | ) | | | | | | $ | (271,875 | ) |
| | | | |
| 1 | For the period from July 1, 2015 to October 23, 2015. Effective at the close of business on October 23, 2015, Investor Class shares were converted to Class A shares and are no longer offered by the Fund. |
The accompanying notes are an integral part of these financial statements.
| | | | |
| 20 | | Wells Fargo Municipal Bond Fund | | Financial highlights |
(For a share outstanding throughout each period)
| | | | | | | | | | | | | | | | | | | | |
| | | Year ended June 30 | |
| CLASS A | | 2016 | | | 2015 | | | 2014 | | | 2013 | | | 2012 | |
Net asset value, beginning of period | | | $10.25 | | | | $10.33 | | | | $10.00 | | | | $10.24 | | | | $9.54 | |
Net investment income | | | 0.31 | | | | 0.28 | | | | 0.33 | | | | 0.27 | | | | 0.37 | |
Net realized and unrealized gains (losses) on investments | | | 0.50 | | | | 0.01 | | | | 0.40 | | | | (0.08 | ) | | | 0.70 | |
| | | | | | | | | | | | | | | | | | | | |
Total from investment operations | | | 0.81 | | | | 0.29 | | | | 0.73 | | | | 0.19 | | | | 1.07 | |
Distributions to shareholders from | | | | | | | | | | | | | | | | | | | | |
Net investment income | | | (0.31 | ) | | | (0.28 | ) | | | (0.33 | ) | | | (0.27 | ) | | | (0.37 | ) |
Net realized gains | | | (0.05 | ) | | | (0.09 | ) | | | (0.07 | ) | | | (0.16 | ) | | | (0.00 | )1 |
| | | | | | | | | | | | | | | | | | | | |
Total distributions to shareholders | | | (0.36 | ) | | | (0.37 | ) | | | (0.40 | ) | | | (0.43 | ) | | | (0.37 | ) |
Net asset value, end of period | | | $10.70 | | | | $10.25 | | | | $10.33 | | | | $10.00 | | | | $10.24 | |
Total return2 | | | 8.04 | % | | | 2.81 | % | | | 7.60 | % | | | 1.70 | % | | | 11.45 | % |
Ratios to average net assets (annualized) | | | | | | | | | | | | | | | | | | | | |
Gross expenses | | | 0.79 | %3 | | | 0.80 | %3 | | | 0.80 | %3 | | | 0.80 | %3 | | | 0.81 | %3 |
Net expenses | | | 0.75 | %3 | | | 0.75 | %3 | | | 0.76 | %3 | | | 0.75 | %3 | | | 0.75 | %3 |
Net investment income | | | 2.99 | % | | | 2.71 | % | | | 3.36 | % | | | 2.56 | % | | | 3.72 | % |
Supplemental data | | | | | | | | | | | | | | | | | | | | |
Portfolio turnover rate | | | 16 | % | | | 27 | % | | | 37 | % | | | 54 | % | | | 63 | % |
Net assets, end of period (000s omitted) | | | $1,529,884 | | | | $1,612,212 | | | | $1,661,362 | | | | $1,807,790 | | | | $1,759,128 | |
| 1 | Amount is less than $0.005. |
| 2 | Total return calculations do not include any sales charges. |
| 3 | Ratios include interest and fee expense relating to inverse floating-rate obligations as follows: |
| | |
Year ended June 30, 2016 | | 0.00% |
Year ended June 30, 2015 | | 0.00% |
Year ended June 30, 2014 | | 0.01% |
Year ended June 30, 2013 | | 0.00% |
Year ended June 30, 2012 | | 0.00% |
The accompanying notes are an integral part of these financial statements.
| | | | | | |
| Financial highlights | | Wells Fargo Municipal Bond Fund | | | 21 | |
(For a share outstanding throughout each period)
| | | | | | | | | | | | | | | | | | | | |
| | | Year ended June 30 | |
| CLASS B | | 2016 | | | 2015 | | | 2014 | | | 2013 | | | 2012 | |
Net asset value, beginning of period | | | $10.26 | | | | $10.34 | | | | $10.00 | | | | $10.24 | | | | $9.54 | |
Net investment income | | | 0.24 | 1 | | | 0.20 | 1 | | | 0.26 | 1 | | | 0.19 | | | | 0.29 | |
Net realized and unrealized gains (losses) on investments | | | 0.48 | | | | 0.02 | | | | 0.41 | | | | (0.08 | ) | | | 0.71 | |
| | | | | | | | | | | | | | | | | | | | |
Total from investment operations | | | 0.72 | | | | 0.22 | | | | 0.67 | | | | 0.11 | | | | 1.00 | |
Distributions to shareholders from | | | | | | | | | | | | | | | | | | | | |
Net investment income | | | (0.23 | ) | | | (0.21 | ) | | | (0.26 | ) | | | (0.19 | ) | | | (0.30 | ) |
Net realized gains | | | (0.05 | ) | | | (0.09 | ) | | | (0.07 | ) | | | (0.16 | ) | | | (0.00 | )2 |
| | | | | | | | | | | | | | | | | | | | |
Total distributions to shareholders | | | (0.28 | ) | | | (0.30 | ) | | | (0.33 | ) | | | (0.35 | ) | | | (0.30 | ) |
Net asset value, end of period | | | $10.70 | | | | $10.26 | | | | $10.34 | | | | $10.00 | | | | $10.24 | |
Total return3 | | | 7.13 | % | | | 2.05 | % | | | 6.90 | % | | | 0.94 | % | | | 10.62 | % |
Ratios to average net assets (annualized) | | | | | | | | | | | | | | | | | | | | |
Gross expenses | | | 1.54 | %4 | | | 1.54 | %4 | | | 1.55 | %4 | | | 1.54 | %4 | | | 1.56 | %4 |
Net expenses | | | 1.50 | %4 | | | 1.50 | %4 | | | 1.51 | %4 | | | 1.50 | %4 | | | 1.50 | %4 |
Net investment income | | | 2.26 | % | | | 1.94 | % | | | 2.66 | % | | | 1.83 | % | | | 3.05 | % |
Supplemental data | | | | | | | | | | | | | | | | | | | | |
Portfolio turnover rate | | | 16 | % | | | 27 | % | | | 37 | % | | | 54 | % | | | 63 | % |
Net assets, end of period (000s omitted) | | | $458 | | | | $1,671 | | | | $3,650 | | | | $7,604 | | | | $14,723 | |
| 1 | Calculated based upon average shares outstanding |
| 2 | Amount is less than $0.005. |
| 3 | Total return calculations do not include any sales charges. |
| 4 | Ratios include interest and fee expense relating to inverse floating-rate obligations as follows: |
| | |
Year ended June 30, 2016 | | 0.00% |
Year ended June 30, 2015 | | 0.00% |
Year ended June 30, 2014 | | 0.01% |
Year ended June 30, 2013 | | 0.00% |
Year ended June 30, 2012 | | 0.00% |
The accompanying notes are an integral part of these financial statements.
| | | | |
| 22 | | Wells Fargo Municipal Bond Fund | | Financial highlights |
(For a share outstanding throughout each period)
| | | | | | | | | | | | | | | | | | | | |
| | | Year ended June 30 | |
| CLASS C | | 2016 | | | 2015 | | | 2014 | | | 2013 | | | 2012 | |
Net asset value, beginning of period | | | $10.25 | | | | $10.33 | | | | $10.00 | | | | $10.23 | | | | $9.53 | |
Net investment income | | | 0.23 | | | | 0.20 | | | | 0.26 | | | | 0.19 | | | | 0.30 | |
Net realized and unrealized gains (losses) on investments | | | 0.49 | | | | 0.01 | | | | 0.40 | | | | (0.07 | ) | | | 0.70 | |
| | | | | | | | | | | | | | | | | | | | |
Total from investment operations | | | 0.72 | | | | 0.21 | | | | 0.66 | | | | 0.12 | | | | 1.00 | |
Distributions to shareholders from | | | | | | | | | | | | | | | | | | | | |
Net investment income | | | (0.23 | ) | | | (0.20 | ) | | | (0.26 | ) | | | (0.19 | ) | | | (0.30 | ) |
Net realized gains | | | (0.05 | ) | | | (0.09 | ) | | | (0.07 | ) | | | (0.16 | ) | | | (0.00 | )1 |
| | | | | | | | | | | | | | | | | | | | |
Total distributions to shareholders | | | (0.28 | ) | | | (0.29 | ) | | | (0.33 | ) | | | (0.35 | ) | | | (0.30 | ) |
Net asset value, end of period | | | $10.69 | | | | $10.25 | | | | $10.33 | | | | $10.00 | | | | $10.23 | |
Total return2 | | | 7.14 | % | | | 2.05 | % | | | 6.80 | % | | | 1.04 | % | | | 10.63 | % |
Ratios to average net assets (annualized) | | | | | | | | | | | | | | | | | | | | |
Gross expenses | | | 1.54 | %3 | | | 1.55 | %3 | | | 1.55 | %3 | | | 1.55 | %3 | | | 1.56 | %3 |
Net expenses | | | 1.50 | %3 | | | 1.50 | %3 | | | 1.51 | %3 | | | 1.50 | %3 | | | 1.50 | %3 |
Net investment income | | | 2.24 | % | | | 1.97 | % | | | 2.60 | % | | | 1.82 | % | | | 2.95 | % |
Supplemental data | | | | | | | | | | | | | | | | | | | | |
Portfolio turnover rate | | | 16 | % | | | 27 | % | | | 37 | % | | | 54 | % | | | 63 | % |
Net assets, end of period (000s omitted) | | | $186,036 | | | | $164,703 | | | | $154,863 | | | | $168,658 | | | | $168,883 | |
| 1 | Amount is less than $0.005. |
| 2 | Total return calculations do not include any sales charges. |
| 3 | Ratios include interest and fee expense relating to inverse floating-rate obligations as follows: |
| | |
Year ended June 30, 2016 | | 0.00% |
Year ended June 30, 2015 | | 0.00% |
Year ended June 30, 2014 | | 0.01% |
Year ended June 30, 2013 | | 0.00% |
Year ended June 30, 2012 | | 0.00% |
The accompanying notes are an integral part of these financial statements.
| | | | | | |
| Financial highlights | | Wells Fargo Municipal Bond Fund | | | 23 | |
(For a share outstanding throughout each period)
| | | | | | | | | | | | | | | | | | | | |
| | | Year ended June 30 | |
| ADMINISTRATOR CLASS | | 2016 | | | 2015 | | | 2014 | | | 2013 | | | 2012 | |
Net asset value, beginning of period | | | $10.26 | | | | $10.34 | | | | $10.01 | | | | $10.24 | | | | $9.54 | |
Net investment income | | | 0.33 | | | | 0.30 | | | | 0.35 | | | | 0.28 | | | | 0.39 | |
Net realized and unrealized gains (losses) on investments | | | 0.49 | | | | 0.01 | | | | 0.40 | | | | (0.07 | ) | | | 0.69 | |
| | | | | | | | | | | | | | | | | | | | |
Total from investment operations | | | 0.82 | | | | 0.31 | | | | 0.75 | | | | 0.21 | | | | 1.08 | |
Distributions to shareholders from | | | | | | | | | | | | | | | | | | | | |
Net investment income | | | (0.33 | ) | | | (0.30 | ) | | | (0.35 | ) | | | (0.28 | ) | | | (0.38 | ) |
Net realized gains | | | (0.05 | ) | | | (0.09 | ) | | | (0.07 | ) | | | (0.16 | ) | | | (0.00 | )1 |
| | | | | | | | | | | | | | | | | | | | |
Total distributions to shareholders | | | (0.38 | ) | | | (0.39 | ) | | | (0.42 | ) | | | (0.44 | ) | | | (0.38 | ) |
Net asset value, end of period | | | $10.70 | | | | $10.26 | | | | $10.34 | | | | $10.01 | | | | $10.24 | |
Total return | | | 8.10 | % | | | 2.97 | % | | | 7.75 | % | | | 1.96 | % | | | 11.62 | % |
Ratios to average net assets (annualized) | | | | | | | | | | | | | | | | | | | | |
Gross expenses | | | 0.73 | %2 | | | 0.73 | %2 | | | 0.74 | %2 | | | 0.74 | %2 | | | 0.74 | %2 |
Net expenses | | | 0.60 | %2 | | | 0.60 | %2 | | | 0.61 | %2 | | | 0.60 | %2 | | | 0.60 | %2 |
Net investment income | | | 3.15 | % | | | 2.86 | % | | | 3.49 | % | | | 2.72 | % | | | 3.74 | % |
Supplemental data | | | | | | | | | | | | | | | | | | | | |
Portfolio turnover rate | | | 16 | % | | | 27 | % | | | 37 | % | | | 54 | % | | | 63 | % |
Net assets, end of period (000s omitted) | | | $270,304 | | | | $384,884 | | | | $362,896 | | | | $451,005 | | | | $227,942 | |
| 1 | Amount is less than $0.005. |
| 2 | Ratios include interest and fee expense relating to inverse floating-rate obligations as follows: |
| | |
Year ended June 30, 2016 | | 0.00% |
Year ended June 30, 2015 | | 0.00% |
Year ended June 30, 2014 | | 0.01% |
Year ended June 30, 2013 | | 0.00% |
Year ended June 30, 2012 | | 0.00% |
The accompanying notes are an integral part of these financial statements.
| | | | |
| 24 | | Wells Fargo Municipal Bond Fund | | Financial highlights |
(For a share outstanding throughout each period)
| | | | | | | | | | | | | | | | | | | | |
| | | Year ended June 30 | |
| INSTITUTIONAL CLASS | | 2016 | | | 2015 | | | 2014 | | | 2013 | | | 2012 | |
Net asset value, beginning of period | | | $10.25 | | | | $10.33 | | | | $10.00 | | | | $10.24 | | | | $9.54 | |
Net investment income | | | 0.34 | | | | 0.31 | | | | 0.36 | | | | 0.30 | | | | 0.40 | |
Net realized and unrealized gains (losses) on investments | | | 0.50 | | | | 0.01 | | | | 0.40 | | | | (0.08 | ) | | | 0.70 | |
| | | | | | | | | | | | | | | | | | | | |
Total from investment operations | | | 0.84 | | | | 0.32 | | | | 0.76 | | | | 0.22 | | | | 1.10 | |
Distributions to shareholders from | | | | | | | | | | | | | | | | | | | | |
Net investment income | | | (0.34 | ) | | | (0.31 | ) | | | (0.36 | ) | | | (0.30 | ) | | | (0.40 | ) |
Net realized gains | | | (0.05 | ) | | | (0.09 | ) | | | (0.07 | ) | | | (0.16 | ) | | | (0.00 | )1 |
| | | | | | | | | | | | | | | | | | | | |
Total distributions to shareholders | | | (0.39 | ) | | | (0.40 | ) | | | (0.43 | ) | | | (0.46 | ) | | | (0.40 | ) |
Net asset value, end of period | | | $10.70 | | | | $10.25 | | | | $10.33 | | | | $10.00 | | | | $10.24 | |
Total return | | | 8.35 | % | | | 3.11 | % | | | 7.90 | % | | | 2.00 | % | | | 11.76 | % |
Ratios to average net assets (annualized) | | | | | | | | | | | | | | | | | | | | |
Gross expenses | | | 0.46 | %2 | | | 0.47 | %2 | | | 0.47 | %2 | | | 0.47 | %2 | | | 0.47 | %2 |
Net expenses | | | 0.46 | %2 | | | 0.47 | %2 | | | 0.47 | %2 | | | 0.47 | %2 | | | 0.47 | %2 |
Net investment income | | | 3.27 | % | | | 3.02 | % | | | 3.58 | % | | | 2.85 | % | | | 4.15 | % |
Supplemental data | | | | | | | | | | | | | | | | | | | | |
Portfolio turnover rate | | | 16 | % | | | 27 | % | | | 37 | % | | | 54 | % | | | 63 | % |
Net assets, end of period (000s omitted) | | | $961,289 | | | | $523,736 | | | | $255,112 | | | | $143,062 | | | | $151,285 | |
| 1 | Amount is less than $0.005. |
| 2 | Ratios include interest and fee expense relating to inverse floating-rate obligations as follows: |
| | |
Year ended June 30, 2016 | | 0.00% |
Year ended June 30, 2015 | | 0.00% |
Year ended June 30, 2014 | | 0.01% |
Year ended June 30, 2013 | | 0.00% |
Year ended June 30, 2012 | | 0.00% |
The accompanying notes are an integral part of these financial statements.
| | | | | | |
| Notes to financial statements | | Wells Fargo Municipal Bond Fund | | | 25 | |
1. ORGANIZATION
Wells Fargo Funds Trust (the “Trust”), a Delaware statutory trust organized on March 10, 1999, is an open-end management investment company registered under the Investment Company Act of 1940, as amended (the “1940 Act”). As an investment company, the Trust follows the accounting and reporting guidance in Financial Accounting Standards Board (“FASB”) Accounting Standards Codification Topic 946, Financial Services – Investment Companies. These financial statements report on the Wells Fargo Municipal Bond Fund (the “Fund”) which is a diversified series of the Trust.
Effective at the close of business on October 23, 2015, Investor Class shares became Class A shares in a tax-free conversion. Shareholders of Investor Class received Class A shares at a value equal to the value of their Investor Class shares immediately prior to the conversion. Investor Class shares are no longer offered by the Fund.
2. SIGNIFICANT ACCOUNTING POLICIES
The following significant accounting policies, which are consistently followed in the preparation of the financial statements of the Fund, are in conformity with U.S. generally accepted accounting principles which require management to make estimates and assumptions that affect the reported amounts of assets and liabilities, disclosure of contingent assets and liabilities at the date of the financial statements, and the reported amounts of revenues and expenses during the reporting period. Actual results could differ from those estimates.
Securities valuation
All investments are valued each business day as of the close of regular trading on the New York Stock Exchange (generally 4 p.m. Eastern Time), although a Fund may deviate from this calculation time under unusual or unexpected circumstances.
Debt securities are valued at the evaluated bid price provided by an independent pricing service or, if a reliable price is not available, the quoted bid price from an independent broker-dealer.
Equity securities and futures that are listed on a foreign or domestic exchange or market are valued at the official closing price or, if none, the last sales price. If no sale occurs on the principal exchange or market that day, the prior day’s price will be deemed “stale” and a fair value price will be determined in accordance with the Fund’s Valuation Procedures.
Investments in registered open-end investment companies are valued at net asset value.
Investments which are not valued using any of the methods discussed above are valued at their fair value, as determined in good faith by the Board of Trustees of the Fund. The Board of Trustees has established a Valuation Committee comprised of the Trustees and has delegated to it the authority to take any actions regarding the valuation of portfolio securities that the Valuation Committee deems necessary or appropriate, including determining the fair value of portfolio securities, unless the determination has been delegated to the Management Valuation Team of Wells Fargo Funds Management, LLC (“Funds Management”). The Board of Trustees retains the authority to make or ratify any valuation decisions or approve any changes to the Valuation Procedures as it deems appropriate. On a quarterly basis, the Board of Trustees receives reports on any valuation actions taken by the Valuation Committee or the Management Valuation Team which may include items for ratification.
Valuations of fair valued securities are compared to the next actual sales price when available, or other appropriate market values, to assess the continued appropriateness of the fair valuation methodologies used. These securities are fair valued on a day-to-day basis, taking into consideration changes to appropriate market information and any significant changes to the inputs considered in the valuation process until there is a readily available price provided on an exchange or by an independent pricing service. Valuations received from an independent pricing service or independent broker-dealer quotes are periodically validated by comparisons to most recent trades and valuations provided by other independent pricing services in addition to the review of prices by the manager and/or subadviser. Unobservable inputs used in determining fair valuations are identified based on the type of security, taking into consideration factors utilized by market participants in valuing the investment, knowledge about the issuer and the current market environment.
When-issued transactions
The Fund may purchase securities on a forward commitment or when-issued basis. The Fund records a when-issued transaction on the trade date and will segregate assets in an amount at least equal in value to the Fund’s commitment to purchase when-issued securities. Securities purchased on a when-issued basis are marked-to-market daily and the Fund begins earning interest on the settlement date. Losses may arise due to changes in the market value of the underlying securities or if the counterparty does not perform under the contract.
Futures contracts
The Fund is subject to interest rate risk in the normal course of pursuing its investment objectives. The Fund may buy and sell futures contracts in order to gain exposure to, or protect against, changes in security values and interest rates. The
| | | | |
| 26 | | Wells Fargo Municipal Bond Fund | | Notes to financial statements |
primary risks associated with the use of futures contracts are the imperfect correlation between changes in market values of securities held by the Fund and the prices of futures contracts, and the possibility of an illiquid market.
The aggregate principal amounts of the contracts are not recorded in the financial statements. Fluctuations in the value of the contracts are recorded in the Statement of Assets and Liabilities as an asset or liability and in the Statement of Operations as unrealized gains or losses until the contracts are closed, at which point they are recorded as net realized gains or losses on futures contracts. With futures contracts, there is minimal counterparty risk to the Fund since futures are exchange traded and the exchange’s clearinghouse, as counterparty to all exchange traded futures, guarantees the futures against default.
Inverse floating-rate obligations
The Fund may participate in inverse floating-rate obligation (“Inverse Floater”) structures whereby a fixed-rate bond (“Fixed-Rate Bond”) purchased by the Fund is transferred to a tender option bond trust (“TOB Trust”). The TOB Trust issues floating-rate notes (“Floating-Rate Notes”) to third-parties, which are collateralized by the Fixed-Rate Bond, and the Fund buys a residual interest in the TOB Trust’s assets and cash flows. The Inverse Floater held by the Fund gives the Fund the right (1) to cause the holders of the Floating-Rate Notes to tender their notes at par, and (2) to have the Fixed-Rate Bond held by the TOB Trust transferred back to the Fund, thereby collapsing the TOB Trust. The Fund accounts for the transaction described above as a secured borrowing by including the Fixed-Rate Bond in its Portfolio of Investments, and by recording the Floating-Rate Notes as a liability in the Statement of Assets and Liabilities. The Fund also records the interest paid on Floating-Rate Notes as interest expense. The Floating-Rate Notes have interest rates that generally reset weekly and their holders have the option to tender their notes for redemption at par at each reset date. Inverse Floaters held by the Fund are securities exempt from registration under Rule 144A of the Securities Act of 1933, as amended.
Security transactions and income recognition
Securities transactions are recorded on a trade date basis. Realized gains or losses are recorded on the basis of identified cost.
Interest income is accrued daily and bond discounts are accreted and premiums are amortized daily based on the effective interest method. To the extent debt obligations are placed on non-accrual status, any related interest income may be reduced by writing off interest receivables when the collection of all or a portion of interest has become doubtful based on consistently applied procedures. If the issuer subsequently resumes interest payments or when the collectability of interest is reasonably assured, the debt obligation is removed from non-accrual status.
Dividend income is recognized on the ex-dividend date.
Distributions to shareholders
Distributions to shareholders from net investment income are accrued daily and paid monthly. Distributions from net realized gains, if any, are recorded on the ex-dividend date. Such distributions are determined in conformity with federal income tax regulations, which may differ in amount or character from net investment income and realized gains recognized for purposes of U.S. generally accepted accounting principles.
Federal and other taxes
The Fund intends to continue to qualify as a regulated investment company by distributing substantially all of its investment company taxable and tax-exempt income and any net realized capital gains (after reduction for capital loss carryforwards) sufficient to relieve it from all, or substantially all, federal income taxes. Accordingly, no provision for federal income taxes was required.
The Fund’s income and federal excise tax returns and all financial records supporting those returns for the prior three fiscal years are subject to examination by the federal and Delaware revenue authorities. Management has analyzed the Fund’s tax positions taken on federal, state, and foreign tax returns for all open tax years and does not believe that there are any uncertain tax positions that require recognition of a tax liability.
Reclassifications are made to the Fund’s capital accounts for permanent tax differences to reflect income and gains available for distribution (or available capital loss carryforwards) under federal income tax regulations. U.S. generally accepted accounting principles require that certain components of net assets be adjusted to reflect permanent differences between financial and tax reporting. These reclassifications have no effect on net assets or net asset values per share. At June 30, 2016, as a result of permanent book-to-tax differences, the following reclassification adjustments were made on the Statement of Assets and Liabilities:
| | |
| Paid-in capital | | Accumulated net
realized gains
on investments |
| $(50,229) | | $50,229 |
| | | | | | |
| Notes to financial statements | | Wells Fargo Municipal Bond Fund | | | 27 | |
As of June 30, 2016, capital loss carryforwards available to offset future net realized capital gains were as follows through the indicated expiration dates:
| | | | |
| 2017 | | 2018 | | 2019 |
| $5,924,646 | | $5,924,646 | | $130,027 |
Class allocations
The separate classes of shares offered by the Fund differ principally in applicable sales charges, distribution, shareholder servicing, and administration fees. Class specific expenses are charged directly to that share class. Investment income, common expenses, and realized and unrealized gains (losses) on investments are allocated daily to each class of shares based on the relative proportion of net assets of each class.
3. FAIR VALUATION MEASUREMENTS
Fair value measurements of investments are determined within a framework that has established a fair value hierarchy based upon the various data inputs utilized in determining the value of the Fund’s investments. The three-level hierarchy gives the highest priority to unadjusted quoted prices in active markets for identical assets or liabilities (Level 1) and the lowest priority to significant unobservable inputs (Level 3). The Fund’s investments are classified within the fair value hierarchy based on the lowest level of input that is significant to the fair value measurement. The inputs are summarized into three broad levels as follows:
| n | | Level 1 – quoted prices in active markets for identical securities |
| n | | Level 2 – other significant observable inputs (including quoted prices for similar securities, interest rates, prepayment speeds, credit risk, use of amortized cost, etc.) |
| n | | Level 3 – significant unobservable inputs (including the Fund’s own assumptions in determining the fair value of investments) |
The inputs or methodologies used for valuing investments in securities are not necessarily an indication of the risk associated with investing in those securities.
The following is a summary of the inputs used in valuing the Fund’s assets and liabilities as of June 30, 2016:
| | | | | | | | | | | | | | | | |
| | | Quoted prices (Level 1) | | | Other significant
observable inputs
(Level 2) | | | Significant
unobservable inputs (Level 3) | | | Total | |
Assets | | | | | | | | | | | | | | | | |
Investments in: | | | | | | | | | | | | | | | | |
| | | | |
Corporate bonds and notes | | $ | 0 | | | $ | 14,660,083 | | | $ | 0 | | | $ | 14,660,083 | |
| | | | |
Municipal obligations | | | 0 | | | | 2,893,326,178 | | | | 0 | | | | 2,893,326,178 | |
| | | | |
Short-term investments | | | | | | | | | | | | | | | | |
Investment companies | | | 2,204,064 | | | | 0 | | | | 0 | | | | 2,204,064 | |
U.S. Treasury securities | | | 3,323,480 | | | | 0 | | | | 0 | | | | 3,323,480 | |
| | | 5,527,544 | | | | 2,907,986,261 | | | | 0 | | | | 2,913,513,805 | |
Futures contracts | | | 0 | | | | 148,859 | | | | 0 | | | | 148,859 | |
Total assets | | $ | 5,527,544 | | | $ | 2,908,135,120 | | | $ | 0 | | | $ | 2,913,662,664 | |
Futures contracts are reported at their variation margin at measurement date, which represents the amount due to the Fund at that date. All other assets and liabilities are reported at their market value at measurement date.
The Fund recognizes transfers between levels within the fair value hierarchy at the end of the reporting period. At June 30, 2016, the Fund did not have any transfers into/out of Level 1. The Fund had no material transfers between Level 2 and Level 3.
| | | | |
| 28 | | Wells Fargo Municipal Bond Fund | | Notes to financial statements |
4. TRANSACTIONS WITH AFFILIATES
Management fee
Funds Management, an indirect wholly owned subsidiary of Wells Fargo & Company (“Wells Fargo”), is the manager of the Fund and provides advisory and fund-level administrative services under an investment management agreement. Under the investment management agreement, Funds Management is responsible for, among other services, implementing the investment objectives and strategies of the Fund, supervising the subadviser, providing fund-level administrative services in connection with the Fund’s operations, and providing any other fund-level administrative services reasonably necessary for the operation of the Fund. As compensation for its services under the investment management agreement, Funds Management is entitled to receive an annual management fee starting at 0.40% and declining to 0.28% as the average daily net assets of the Fund increase. For the year ended June 30, 2016, the management fee was equivalent to an annual rate of 0.36% of the Fund’s average daily net assets.
Funds Management has retained the services of a subadviser to provide daily portfolio management to the Fund. The fee for subadvisory services is borne by Funds Management. Wells Capital Management Incorporated, an affiliate of Funds Management and an indirect wholly owned subsidiary of Wells Fargo, is the subadviser to the Fund and is entitled to receive a fee from Funds Management at an annual rate starting at 0.20% and declining to 0.10% as the average daily net assets of the Fund increase.
Administration fees
Under a class-level administration agreement, Funds Management provides class-level administrative services to the Fund, which includes paying fees and expenses for services provided by the transfer agent, sub-transfer agents, omnibus account servicers and record-keepers. As compensation for its services under the class-level administration agreement, Funds Management receives an annual fee which is calculated based on the average daily net assets of each class as follows:
| | | | |
| | | Class-level
administration fee | |
Class A, Class B, Class C | | | 0.16 | % |
Administrator Class | | | 0.10 | |
Institutional Class | | | 0.08 | |
Investor Class | | | 0.19 | |
Funds Management has contractually waived and/or reimbursed management and administration fees to the extent necessary to maintain certain net operating expense ratios for the Fund. Waiver of fees and/or reimbursement of expenses by Funds Management were made first from fund level expenses on a proportionate basis and then from class specific expenses. Funds Management has committed through October 31, 2016 to waive fees and/or reimburse expenses to the extent necessary to cap the Fund’s expenses at 0.75% for Class A shares, 1.50% for Class B shares, 1.50% for Class C shares, 0.60% for Administrator Class shares, and 0.48% for Institutional Class shares. After this time, the cap may be increased or the commitment to maintain the cap may be terminated only with the approval of the Board of Trustees.
Distribution fees
The Trust has adopted a distribution plan for Class B and Class C shares of the Fund pursuant to Rule 12b-1 under the 1940 Act. Distribution fees are charged to Class B and Class C shares and paid to Wells Fargo Funds Distributor, LLC (“Funds Distributor”), the principal underwriter, at an annual rate of 0.75% of the average daily net assets of Class B and Class C shares.
In addition, Funds Distributor is entitled to receive the front-end sales charge from the purchase of Class A shares and a contingent deferred sales charge on the redemption of certain Class A shares. Funds Distributor is also entitled to receive the contingent deferred sales charges from redemptions of Class B and Class C shares. For the year ended June 30, 2016, Funds Distributor received $61,000 from the sale of Class A shares and $266 in contingent deferred sales charges from redemptions of Class C shares.
Shareholder servicing fees
The Trust has entered into contracts with one or more shareholder servicing agents, whereby Class A, Class B, Class C, Administrator Class, and Investor Class of the Fund are charged a fee at an annual rate of 0.25% of the average daily net assets of each respective class.
| | | | | | |
| Notes to financial statements | | Wells Fargo Municipal Bond Fund | | | 29 | |
A portion of these total shareholder servicing fees were paid to affiliates of Wells Fargo.
5. INVESTMENT PORTFOLIO TRANSACTIONS
Purchases and sales of investments, excluding U.S. government obligations (if any) and short-term securities, for the year ended June 30, 2016 were $420,264,951 and $1,071,548,125, respectively.
The Fund may purchase or sell investment securities to other Wells Fargo funds under procedures adopted by the Board of Trustees. The procedures have been designed to ensure that these interfund transactions, which generally do not incur broker commissions, are effected at current market prices. Interfund trades are included within the respective purchases and sales amounts shown.
6. DERIVATIVE TRANSACTIONS
During the year ended June 30, 2016, the Fund entered into futures contracts to take advantage of the differences between municipal and treasury yields and to help manage the duration of the portfolio.
At June 30, 2016, the Fund had short futures contracts outstanding as follows:
| | | | | | | | | | | | | | | | |
| Expiration date | | Counterparty | | Contracts | | Type | | | Contract value at June 30, 2016 | | | Unrealized
gains
(losses) | |
9-21-2016 | | JPMorgan | | 200 Short | | | U.S. Treasury Bonds | | | $ | 34,468,750 | | | $ | (1,832,441 | ) |
9-30-2016 | | JPMorgan | | 600 Short | | | 5-Year U.S. Treasury Notes | | | | 73,298,438 | | | | 17,609 | |
The Fund had an average notional amount of $279,000 in long futures contracts and $69,364,673 in short futures contracts during the year ended June 30, 2016.
On June 30, 2016, the cumulative unrealized losses on futures contracts in the amount of $1,814,832 are reflected in net unrealized gains on investments on the Statement of Assets and Liabilities. The receivable for daily variation margin on open futures contracts reflected in the Statement of Assets and Liabilities only represents the current day’s variation margin. The realized losses and change in unrealized gains (losses) on futures contracts are reflected in the Statement of Operations.
For certain types of derivative transactions, the Fund has entered into International Swaps and Derivatives Association, Inc. master agreements (“ISDA Master Agreements”) or similar agreements with approved counterparties. The ISDA Master Agreements or similar agreements may have requirements to deliver/deposit securities or cash to/with an exchange or broker-dealer as collateral and allows the Fund to offset, with each counterparty, certain derivative financial instrument’s assets and/or liabilities with collateral held or pledged. Collateral requirements differ by type of derivative. Collateral or margin requirements are set by the broker or exchange clearing house for exchange traded derivatives while collateral terms are contract specific for over-the-counter traded derivatives. Cash collateral that has been pledged to cover obligations of the Fund under ISDA Master Agreements or similar agreements, if any, are reported separately in the Statement of Assets and Liabilities. Securities pledged as collateral, if any, are noted in the Portfolio of Investments. With respect to balance sheet offsetting, absent an event of default by the counterparty or a termination of the agreement, the reported amounts of financial assets and financial liabilities in the Statement of Assets and Liabilities are not offset across transactions between the Fund and the applicable counterparty. A reconciliation of the gross amounts on the Statement of Assets and Liabilities to the net amounts by derivative type, including any collateral exposure, is as follows:
| | | | | | | | | | | | | | | | |
Derivative type | | Counterparty | | Gross amounts
of assets in the
Statement of
Assets and
Liabilities | | Amounts
subject to
netting
agreements | | | Collateral
received | | | Net amount
of assets | |
Futures – variation margin | | JPMorgan | | $148,859 | | $ | 0 | | | $ | 0 | | | $ | 148,859 | |
7. BORROWINGS
The Trust (excluding the money market funds and certain other funds) and Wells Fargo Variable Trust are parties to a $200,000,000 revolving credit agreement whereby the Fund is permitted to use bank borrowings for temporary or emergency purposes, such as to fund shareholder redemption requests. Interest under the credit agreement is charged to the Fund based on a borrowing rate equal to the higher of the Federal Funds rate in effect on that day plus 1.25% or the overnight LIBOR rate in effect on that day plus 1.25%. In addition, an annual commitment fee equal to 0.20% of the
| | | | |
| 30 | | Wells Fargo Municipal Bond Fund | | Notes to financial statements |
unused balance is allocated to each participating fund. Prior to September 1, 2015, the revolving credit agreement amount was $150,000,000 and the annual commitment fee was equal to 0.10% of the unused balance which was allocated to each participating fund.
For the year ended June 30, 2016, there were no borrowings by the Fund under the agreement.
During the year ended June 30, 2016, the Fund participated in Inverse Floaters which are accounted for as a secured borrowing. At June 30, 2016, the value of Floating-Rate Notes outstanding and the related collateral were $5,025,000 and $11,373,484, respectively. During the year ended June 30, 2016, the Fund held Floating-Rate Notes that had an average daily balance outstanding of $5,025,000 and incurred interest and fee expense in the amount of $42,771.
8. DISTRIBUTIONS TO SHAREHOLDERS
The tax character of distributions paid during the years ended June 30, 2016 and June 30, 2015 were as follows:
| | | | | | | | |
| | | Year ended June 30, | |
| | | 2016 | | | 2015 | |
Ordinary income | | $ | 2,352,986 | | | $ | 883,048 | |
Tax-exempt income | | | 89,031,195 | | | | 85,661,250 | |
Long-term capital gain | | | 14,466,844 | | | | 26,759,194 | |
As of June 30, 2016, the components of distributable earnings on a tax basis were as follows:
| | | | | | |
Undistributed
tax-exempt
income | | Unrealized gains | | Undistributed
long-term gain | | Capital loss
carryforward |
| $906,459 | | $212,075,618 | | $18,063,743 | | $(11,979,319) |
9. INDEMNIFICATION
Under the Trust’s organizational documents, the officers and Trustees have been granted certain indemnification rights against certain liabilities that may arise out of performance of their duties to the Trust. Additionally, in the normal course of business, the Trust may enter into contracts with service providers that contain a variety of indemnification clauses. The Trust’s maximum exposure under these arrangements is dependent on future claims that may be made against the Fund and, therefore, cannot be estimated.
| | | | | | |
| Report of independent registered public accounting firm | | Wells Fargo Municipal Bond Fund | | | 31 | |
BOARD OF TRUSTEES AND SHAREHOLDERS OF WELLS FARGO FUNDS TRUST:
We have audited the accompanying statement of assets and liabilities, including the summary portfolio of investments, of the Wells Fargo Municipal Bond Fund (formerly known as Wells Fargo Advantage Municipal Bond Fund) (the “Fund”), one of the funds constituting the Wells Fargo Funds Trust, as of June 30, 2016, and the related statement of operations for the year then ended, the statements of changes in net assets for each of the years in the two-year period then ended, and the financial highlights for each of the years in the five-year period then ended. These financial statements and financial highlights are the responsibility of the Fund’s management. Our responsibility is to express an opinion on these financial statements and financial highlights based on our audits.
We conducted our audits in accordance with the standards of the Public Company Accounting Oversight Board (United States). Those standards require that we plan and perform the audit to obtain reasonable assurance about whether the financial statements and financial highlights are free of material misstatement. An audit includes examining, on a test basis, evidence supporting the amounts and disclosures in the financial statements. Our procedures included confirmation of securities owned as of June 30, 2016, by correspondence with custodians and brokers, or by other appropriate auditing procedures. An audit also includes assessing the accounting principles used and significant estimates made by management, as well as evaluating the overall financial statement presentation. We believe that our audits provide a reasonable basis for our opinion.
In our opinion, the financial statements and financial highlights referred to above present fairly, in all material respects, the financial position of the Wells Fargo Municipal Bond Fund as of June 30, 2016, and the results of its operations for the year then ended, the changes in its net assets for each of the years in the two-year period then ended, and the financial highlights for each of the years in the five-year period then ended, in conformity with U.S. generally accepted accounting principles.

Boston, Massachusetts
August 25, 2016
| | | | |
| 32 | | Wells Fargo Municipal Bond Fund | | Other information (unaudited) |
TAX INFORMATION
Pursuant to Section 852 of the Internal Revenue Code, $14,466,844 was designated as a 20% rate gain distribution for the fiscal year ended June 30, 2016.
For the fiscal year ended June 30, 2016, $1,816,740 has been designated as interest-related dividends for nonresident alien shareholders pursuant to Section 871 of the Internal Revenue Code.
Pursuant to Section 852 of the Internal Revenue Code, 100% of distributions paid from net investment income is designated as exempt-interest dividends for the fiscal year ended June 30, 2016.
PROXY VOTING INFORMATION
A description of the policies and procedures that the Fund uses to determine how to vote proxies relating to portfolio securities is available, upon request, by calling 1-800-222-8222, visiting our website at wellsfargofunds.com, or visiting the SEC website at sec.gov. Information regarding how the Fund voted proxies relating to portfolio securities during the most recent 12-month period ended June 30 is available on the Fund’s website at wellsfargofunds.com or by visiting the SEC website at sec.gov.
PORTFOLIO HOLDINGS INFORMATION
The complete portfolio holdings for the Fund are publicly available monthly on the Fund’s website (wellsfargofunds.com), on a one-month delayed basis. In addition, top ten holdings information (excluding derivative positions) for the Fund is publicly available on the Fund’s website on a monthly, seven-day or more delayed basis. The Fund files its complete schedule of portfolio holdings with the SEC for the first and third quarters of each fiscal year on Form N-Q, which is available by visiting the SEC website at sec.gov. In addition, the Fund’s Form N-Q may be reviewed and copied at the SEC’s Public Reference Room in Washington, DC, and at regional offices in New York City, at 233 Broadway, and in Chicago, at 175 West Jackson Boulevard, Suite 900. Information about the Public Reference Room may be obtained by calling 1-800-SEC-0330.
| | | | | | |
| Other information (unaudited) | | Wells Fargo Municipal Bond Fund | | | 33 | |
BOARD OF TRUSTEES AND OFFICERS
Each of the Trustees and Officers1 listed in the table below acts in identical capacities for each fund in the Wells Fargo family of funds, which consists of 142 mutual funds comprising the Wells Fargo Funds Trust, Wells Fargo Variable Trust, Wells Fargo Master Trust and four closed-end funds (collectively the “Fund Complex”). This table should be read in conjunction with the Prospectus and the Statement of Additional Information2. The mailing address of each Trustee and Officer is 525 Market Street, 12th Floor, San Francisco, CA 94105. Each Trustee and Officer serves an indefinite term, however, each Trustee serves such term until reaching the mandatory retirement age established by the Trustees.
Independent Trustees
| | | | | | |
Name and year of birth | | Position held and length of service* | | Principal occupations during past five years or longer | | Current other
public company or
investment company
directorships |
| William R. Ebsworth (Born 1957) | | Trustee, since 2015 | | Retired. From 1984 to 2013, equities analyst, portfolio manager, research director and chief financial officer at Fidelity Management and Research Company in Boston, Tokyo, and Hong Kong and retired in 2013 as Chief Investment Officer of Fidelity Strategic Advisers, Inc. where he lead a team of investment professionals managing client assets. Prior thereto, Board member of Hong Kong Securities Clearing Co., Hong Kong Options Clearing Corp., the Thailand International Fund, Ltd., Fidelity Investments Life Insurance Company, and Empire Fidelity Investments Life Insurance Company. Mr. Ebsworth is a CFA® charterholder and an Adjunct Lecturer, Finance, at Babson College. | | Asset Allocation Trust |
| Jane A. Freeman (Born 1953) | | Trustee, since 2015 | | Retired. From 2012 to 2014 and 1999 to 2008, Chief Financial Officer of Scientific Learning Corporation. From 2008 to 2012, Ms. Freeman provided consulting services related to strategic business projects. Prior to 1999, Portfolio Manager at Rockefeller & Co. and Scudder, Stevens & Clark. Board member of the Harding Loevner Funds from 1996 to 2014, serving as both Lead Independent Director and chair of the Audit Committee. Board member of the Russell Exchange Traded Funds Trust from 2011 to 2012 and the chair of the Audit Committee. Ms. Freeman is Chair of Taproot Foundation (non-profit organization), a Board Member of Ruth Bancroft Garden (non-profit organization) and an inactive chartered financial analyst. | | Asset Allocation Trust |
| Peter G. Gordon (Born 1942) | | Trustee, since 1998; Chairman, since 2005 | | Co-Founder, Retired Chairman, President and CEO of Crystal Geyser Water Company. Trustee Emeritus, Colby College. | | Asset Allocation Trust |
| Isaiah Harris, Jr. (Born 1952) | | Trustee, since 2009 | | Retired. Chairman of the Board of CIGNA Corporation since 2009, and Director since 2005. From 2003 to 2011, Director of Deluxe Corporation. Prior thereto, President and CEO of BellSouth Advertising and Publishing Corp. from 2005 to 2007, President and CEO of BellSouth Enterprises from 2004 to 2005 and President of BellSouth Consumer Services from 2000 to 2003. Emeritus member of the Iowa State University Foundation Board of Governors. Emeritus Member of the Advisory Board of Iowa State University School of Business. Advisory Board Member, Palm Harbor Academy (charter school). Advisory Board Member, Child Evangelism Fellowship (non-profit). Mr. Harris is a certified public accountant (inactive status). | | CIGNA Corporation; Asset Allocation Trust |
| Judith M. Johnson (Born 1949) | | Trustee, since 2008; Audit Committee Chairman, since 2008 | | Retired. Prior thereto, Chief Executive Officer and Chief Investment Officer of Minneapolis Employees Retirement Fund from 1996 to 2008. Ms. Johnson is an attorney, certified public accountant and a certified managerial accountant. | | Asset Allocation Trust |
| David F. Larcker (Born 1950) | | Trustee, since 2009 | | James Irvin Miller Professor of Accounting at the Graduate School of Business, Stanford University, Director of the Corporate Governance Research Initiative and Senior Faculty of The Rock Center for Corporate Governance since 2006. From 2005 to 2008, Professor of Accounting at the Graduate School of Business, Stanford University. Prior thereto, Ernst & Young Professor of Accounting at The Wharton School, University of Pennsylvania from 1985 to 2005. | | Asset Allocation Trust |
| | | | |
| 34 | | Wells Fargo Municipal Bond Fund | | Other information (unaudited) |
| | | | | | |
Name and year of birth | | Position held and length of service* | | Principal occupations during past five years or longer | | Current other
public company or
investment company
directorships |
| Olivia S. Mitchell (Born 1953) | | Trustee, since 2006 | | International Foundation of Employee Benefit Plans Professor, Wharton School of the University of Pennsylvania since 1993. Director of Wharton’s Pension Research Council and Boettner Center on Pensions & Retirement Research, and Research Associate at the National Bureau of Economic Research. Previously, Cornell University Professor from 1978 to 1993. | | Asset Allocation Trust |
| Timothy J. Penny (Born 1951) | | Trustee, since 1996 | | President and Chief Executive Officer of Southern Minnesota Initiative Foundation, a non-profit organization, since 2007 and Senior Fellow at the Humphrey Institute Policy Forum at the University of Minnesota since 1995. Member of the Board of Trustees of NorthStar Education Finance, Inc., a non-profit organization, since 2007. | | Asset Allocation Trust |
| Michael S. Scofield (Born 1943) | | Trustee, since 2010 | | Served on the Investment Company Institute’s Board of Governors and Executive Committee from 2008-2011 as well the Governing Council of the Independent Directors Council from 2006-2011 and the Independent Directors Council Executive Committee from 2008-2011. Chairman of the IDC from 2008-2010. Institutional Investor (Fund Directions) Trustee of Year in 2007. Trustee of the Evergreen Funds complex (and its predecessors) from 1984 to 2010. Chairman of the Evergreen Funds from 2000-2010. Former Trustee of the Mentor Funds. Retired Attorney, Law Offices of Michael S. Scofield. | | Asset Allocation Trust |
| * | Length of service dates reflect the Trustee’s commencement of service with the Trust’s predecessor entities, where applicable. |
Officers
| | | | | | |
Name and
year of birth | | Position held and
length of service | | Principal occupations during past five years or longer | | |
Karla M. Rabusch
(Born 1959) | | President, since 2003 | | Executive Vice President of Wells Fargo Bank, N.A. and President of Wells Fargo Funds Management, LLC since 2003. | | |
Nancy Wiser1
(Born 1967) | | Treasurer, since 2012 | | Executive Vice President of Wells Fargo Funds Management, LLC since 2011. Chief Operating Officer and Chief Compliance Officer at LightBox Capital Management LLC, from 2008 to 2011. | | |
C. David Messman
(Born 1960) | | Secretary, since 2000; Chief Legal Officer, since 2003 | | Senior Vice President and Secretary of Wells Fargo Funds Management, LLC since 2001. Assistant General Counsel of Wells Fargo Bank, N.A. since 2013 and Vice President and Managing Counsel of Wells Fargo Bank, N.A. from 1996 to 2013. | | |
Michael Whitaker
(Born 1967) | | Chief Compliance Officer, since 2016* | | Executive Vice President of Wells Fargo Funds Management, LLC since 2016. Chief Compliance Officer of Fidelity’s Fixed Income Funds and Asset Allocation Funds from 2008 to 2016, Compliance Officer of FMR Co., Inc. from 2014 to 2016, Fidelity Investments Money Management, Inc. from 2014 to 2016, Fidelity Investments from 2007 to 2016. | | |
David Berardi
(Born 1975) | | Assistant Treasurer, since 2009 | | Vice President of Wells Fargo Funds Management, LLC since 2009. Vice President of Evergreen Investment Management Company, LLC from 2008 to 2010. Manager of Fund Reporting and Control for Evergreen Investment Management Company, LLC from 2004 to 2010. | | |
Jeremy DePalma1
(Born 1974) | | Assistant Treasurer, since 2009 | | Senior Vice President of Wells Fargo Funds Management, LLC since 2009. Senior Vice President of Evergreen Investment Management Company, LLC from 2008 to 2010 and head of the Fund Reporting and Control Team within Fund Administration from 2005 to 2010. | | |
| 1 | Nancy Wiser acts as Treasurer of 73 funds in the Fund Complex. Jeremy DePalma acts as Treasurer of 69 funds and Assistant Treasurer of 73 funds in the Fund Complex. |
| 2 | The Statement of Additional Information includes additional information about the Trustees and is available, without charge, upon request, by calling 1-800-222-8222 or by visiting the website at wellsfargofunds.com. |
| * | Michael Whitaker became Chief Compliance Officer effective May 16, 2016. |
| | | | | | |
| Other information (unaudited) | | Wells Fargo Municipal Bond Fund | | | 35 | |
BOARD CONSIDERATION OF INVESTMENT MANAGEMENT AND SUB-ADVISORY AGREEMENTS:
Under the Investment Company Act of 1940 (the “1940 Act”), the Board of Trustees (the “Board”) of Wells Fargo Funds Trust (the “Trust”) must determine annually whether to approve the continuation of the Trust’s investment management and sub-advisory agreements. In this regard, at an in-person meeting held on May 24-25, 2016 (the “Meeting”), the Board, all the members of which have no direct or indirect interest in the investment management and sub-advisory agreements and are not “interested persons” of the Trust, as defined in the 1940 Act (the “Independent Trustees”), reviewed and approved for Wells Fargo Municipal Bond Fund (the “Fund”): (i) an investment management agreement (the “Management Agreement”) with Wells Fargo Funds Management, LLC (“Funds Management”); and (ii) an investment sub-advisory agreement (the “Sub-Advisory Agreement”) with Wells Capital Management Incorporated (the “Sub-Adviser”), an affiliate of Funds Management. The Management Agreement and the Sub-Advisory Agreement are collectively referred to as the “Advisory Agreements.”
At the Meeting, the Board considered the factors and reached the conclusions described below relating to the selection of Funds Management and the Sub-Adviser and the approval of the Advisory Agreements. Prior to the Meeting, including at an in-person meeting in April 2016, the Trustees conferred extensively among themselves and with representatives of Funds Management about these matters. Also, the Board has adopted a team-based approach, with each team consisting of a sub-set of Trustees, to assist the full Board in the discharge of its duties in reviewing performance and other matters throughout the year. The Independent Trustees were assisted in their evaluation of the Advisory Agreements by independent legal counsel, from whom they received separate legal advice and with whom they met separately.
In providing information to the Board, Funds Management and the Sub-Adviser were guided by a detailed set of requests for information submitted to them by independent legal counsel on behalf of the Independent Trustees at the start of the Board’s annual contract renewal process earlier in 2016. In considering and approving the Advisory Agreements, the Trustees considered the information they believed relevant, including but not limited to the information discussed below. The Board considered not only the specific information presented in connection with the Meeting, but also the knowledge gained over time through interaction with Funds Management and the Sub-Adviser about various topics. In this regard, the Board reviewed reports of Funds Management at each of its quarterly meetings, which included, among other things, portfolio reviews and performance reports. In addition, the Board and the teams mentioned above confer with portfolio managers at various times throughout the year. The Board did not identify any particular information or consideration that was all-important or controlling, and each individual Trustee may have attributed different weights to various factors.
After its deliberations, the Board unanimously approved the continuation of the Advisory Agreements for a one-year term and determined that the compensation payable to Funds Management and the Sub-Adviser under each of the Advisory Agreements was reasonable. The Board considered the approval of the Advisory Agreements for the Fund as part of its consideration of agreements for funds across the complex, but its approvals were made on a fund-by-fund basis. The following summarizes a number of important, but not necessarily all, factors considered by the Board in support of its approvals.
Nature, extent and quality of services
The Board received and considered various information regarding the nature, extent and quality of services provided to the Fund by Funds Management and the Sub-Adviser under the Advisory Agreements. This information included a description of the investment advisory services and Fund-level administrative services covered by the Management Agreement, as well as, among other things, a summary of the background and experience of senior management of Funds Management, and the qualifications, background, tenure and responsibilities of each of the portfolio managers primarily responsible for the day-to-day portfolio management of the Fund.
The Board evaluated the ability of Funds Management and the Sub-Adviser to attract and retain qualified investment professionals, including research, advisory and supervisory personnel. The Board further considered the compliance programs and compliance records of Funds Management and the Sub-Adviser. In addition, the Board took into account the full range of services provided to the Fund by Funds Management and its affiliates.
Fund performance and expenses
The Board considered the performance results for the Fund over various time periods ended December 31, 2015. The Board considered these results in comparison to the performance of funds in a universe that was determined by Broadridge Inc. (“Broadridge”) to be similar to the Fund (the “Universe��), and in comparison to the Fund’s benchmark index and to other comparative data. Broadridge is an independent provider of investment company data. The Board received a description of the methodology used by Broadridge to select the mutual funds in the performance Universe.
| | | | |
| 36 | | Wells Fargo Municipal Bond Fund | | Other information (unaudited) |
The Board noted that the performance of the Fund (Administrator Class) was higher than the average performance of the Universe for all periods under review. The Board also noted that the performance of the Fund was higher than its benchmark, the Barclays Municipal Bond Index, for all periods under review.
The Board also received and considered information regarding the Fund’s net operating expense ratios and their various components, including actual management fees, custodian and other non-management fees, and Rule 12b-1 and non-Rule 12b-1 shareholder service fees. The Board considered these ratios in comparison to the median ratios of funds in class-specific expense groups that were determined by Broadridge to be similar to the Fund (the “Groups”). The Board received a description of the methodology used by Broadridge to select the mutual funds in the expense Groups and an explanation of how funds comprising expense groups and their expense ratios may vary from year-to-year. Based on the Broadridge reports, the Board noted that the net operating expense ratios of the Fund were lower than or equal to the median net operating expense ratios of the expense Groups.
The Board took into account the Fund performance and expense information provided to it among the factors considered in deciding to re-approve the Advisory Agreements.
Investment management and sub-advisory fee rates
The Board reviewed and considered the contractual fee rates payable by the Fund to Funds Management under the Management Agreement, as well as the contractual fee rates payable by the Fund to Funds Management for class-level administrative services under a Class-Level Administration Agreement, which include class-level transfer agency and sub-transfer agency costs (collectively, the “Management Rates”). The Board also reviewed and considered the contractual investment sub-advisory fee rates that are payable by Funds Management to the Sub-Adviser for investment sub-advisory services.
Among other information reviewed by the Board was a comparison of the Fund’s Management Rates with the average contractual investment management fee rates of funds in the expense Groups at a common asset level as well as transfer agency costs of the funds in the expense Groups. The Board noted that the Management Rates of the Fund were lower than or in range of the sum of these average rates for the Fund’s expense Groups for all share classes.
The Board also received and considered information about the portion of the total management fee that was retained by Funds Management after payment of the fee to the Sub-Adviser for sub-advisory services. In assessing the reasonableness of this amount, the Board received and evaluated information about the nature and extent of responsibilities retained and risks assumed by Funds Management and not delegated to or assumed by the Sub-Adviser, and about Funds Management’s on-going oversight services. However, given the affiliation between Funds Management and the Sub-Adviser, the Board ascribed limited relevance to the allocation of fees between them.
The Board also received and considered information about the nature and extent of services offered and fee rates charged by Funds Management and the Sub-Adviser to other types of clients with investment strategies similar to those of the Fund. In this regard, the Board received information about the significantly greater scope of services, and compliance, reporting and other legal burdens and risks of managing mutual funds compared with those associated with managing assets of non-mutual fund clients such as collective funds or institutional separate accounts.
Based on its consideration of the factors and information it deemed relevant, including those described here, the Board determined that the compensation payable to Funds Management under the Management Agreement and to the Sub-Adviser under the Sub-Advisory Agreement was reasonable, in light of the services covered by the Advisory Agreements.
Profitability
The Board received and considered information concerning the profitability of Funds Management, as well as the profitability of Wells Fargo as a whole, from providing services to the Fund and the fund family as a whole. The Board also received and considered information concerning the profitability of the Sub-Adviser from providing services to the fund family as a whole, noting that the Sub-Adviser’s profitability information with respect to providing services to the Fund was subsumed in the Wells Fargo and Funds Management profitability analysis.
Funds Management reported on the methodologies and estimates used in calculating profitability. Among other things, the Board noted that the levels of profitability reported on a fund-by-fund basis varied widely, depending on factors such as the size and type of fund. Based on its review, the Board did not deem the profits reported by Funds Management or Wells Fargo from its services to the Fund to be at a level that would prevent it from approving the continuation of the Advisory Agreements.
| | | | | | |
| Other information (unaudited) | | Wells Fargo Municipal Bond Fund | | | 37 | |
Economies of scale
With respect to possible economies of scale, the Board noted the existence of breakpoints in the Fund’s management fee structure, which operate generally to reduce the Fund’s expense ratios as the Fund grows in size. It considered that, for a small fund or a fund that shrinks in size, breakpoints conversely can result in higher fee levels. The Board also considered that fee waiver and expense reimbursement arrangements and competitive fee rates at the outset are means of sharing potential economies of scale with shareholders of the Fund and the fund family as a whole. The Board considered Funds Management’s view that any analyses of potential economies of scale in managing a particular fund are inherently limited in light of the joint and common costs and investments that Funds Management incurs across the fund family as a whole.
The Board concluded that the Fund’s fee and expense arrangements, including contractual breakpoints, constituted a reasonable approach to sharing potential economies of scale with the Fund and its shareholders.
Other benefits to Funds Management and the Sub-Adviser
The Board received and considered information regarding potential “fall-out” or ancillary benefits received by Funds Management and its affiliates, including the Sub-Adviser, as a result of their relationships with the Fund. Ancillary benefits could include, among others, benefits directly attributable to other relationships with the Fund and benefits potentially derived from an increase in Funds Management’s and the Sub-Adviser’s business as a result of their relationships with the Fund. The Board noted that various affiliates of Funds Management may receive distribution-related fees, shareholder servicing payments and sub-transfer agency fees in respect of shares sold or held through them and services provided.
The Board also reviewed information about soft dollar credits earned and utilized by the Sub-Adviser, fees earned by Funds Management and the Sub-Adviser from managing a private investment vehicle for the fund family’s securities lending collateral and commissions earned by an affiliated broker from portfolio transactions.
Based on its consideration of the factors and information it deemed relevant, including those described here, the Board did not find that any ancillary benefits received by Funds Management and its affiliates, including the Sub-Adviser, were unreasonable.
Conclusion
At the Meeting, after considering the above-described factors and based on its deliberations and its evaluation of the information described above, the Board unanimously approved the continuation of the Advisory Agreements for a one-year term and determined that the compensation payable to Funds Management and the Sub-Adviser under each of the Advisory Agreements was reasonable.
| | | | |
| 38 | | Wells Fargo Municipal Bond Fund | | List of abbreviations |
The following is a list of common abbreviations for terms and entities that may have appeared in this report.
| ACA | — ACA Financial Guaranty Corporation |
| ADR | — American depositary receipt |
| ADS | — American depositary shares |
| AGC | — Assured Guaranty Corporation |
| AGM | — Assured Guaranty Municipal |
| Ambac | — Ambac Financial Group Incorporated |
| AMT | — Alternative minimum tax |
| BAN | — Bond anticipation notes |
| BHAC | — Berkshire Hathaway Assurance Corporation |
| CAB | — Capital appreciation bond |
| CCAB | — Convertible capital appreciation bond |
| CDA | — Community Development Authority |
| CDO | — Collateralized debt obligation |
| DRIVER | — Derivative inverse tax-exempt receipts |
| DW&P | — Department of Water & Power |
| DWR | — Department of Water Resources |
| ECFA | — Educational & Cultural Facilities Authority |
| EDA | — Economic Development Authority |
| EDFA | — Economic Development Finance Authority |
| ETF | — Exchange-traded fund |
| FDIC | — Federal Deposit Insurance Corporation |
| FFCB | — Federal Farm Credit Banks |
| FGIC | — Financial Guaranty Insurance Corporation |
| FHA | — Federal Housing Administration |
| FHLB | — Federal Home Loan Bank |
| FHLMC | — Federal Home Loan Mortgage Corporation |
| FICO | — The Financing Corporation |
| FNMA | — Federal National Mortgage Association |
| GDR | — Global depositary receipt |
| GNMA | — Government National Mortgage Association |
| HCFR | — Healthcare facilities revenue |
| HEFA | — Health & Educational Facilities Authority |
| HEFAR | — Higher education facilities authority revenue |
| HFA | — Housing Finance Authority |
| HFFA | — Health Facilities Financing Authority |
| HUD | — Department of Housing and Urban Development |
| IDA | — Industrial Development Authority |
| IDAG | — Industrial Development Agency |
| KRW | — Republic of Korea won |
| LIBOR | — London Interbank Offered Rate |
| LIFER | — Long Inverse Floating Exempt Receipts |
| LLC | — Limited liability company |
| LLLP | — Limited liability limited partnership |
| LLP | — Limited liability partnership |
| MBIA | — Municipal Bond Insurance Association |
| MFHR | — Multifamily housing revenue |
| MSTR | — Municipal securities trust receipts |
| MUD | — Municipal Utility District |
| National | — National Public Finance Guarantee Corporation |
| PCFA | — Pollution Control Financing Authority |
| PCL | — Public Company Limited |
| PCR | — Pollution control revenue |
| PFA | — Public Finance Authority |
| PFFA | — Public Facilities Financing Authority |
| PFOTER | — Puttable floating option tax-exempt receipts |
| plc | — Public limited company |
| PUTTER | — Puttable tax-exempt receipts |
| R&D | — Research & development |
| Radian | — Radian Asset Assurance |
| RAN | — Revenue anticipation notes |
| RDA | — Redevelopment Authority |
| RDFA | — Redevelopment Finance Authority |
| REIT | — Real estate investment trust |
| ROC | — Reset option certificates |
| SAVRS | — Select auction variable rate securities |
| SBA | — Small Business Authority |
| SDR | — Swedish depositary receipt |
| SFHR | — Single-family housing revenue |
| SFMR | — Single-family mortgage revenue |
| SPA | — Standby purchase agreement |
| SPDR | — Standard & Poor’s Depositary Receipts |
| SPEAR | — Short Puttable Exempt Adjustable Receipts |
| STRIPS | — Separate trading of registered interest and |
| TAN | — Tax anticipation notes |
| TIPS | — Treasury inflation-protected securities |
| TRAN | — Tax revenue anticipation notes |
| TTFA | — Transportation Trust Fund Authority |
| TVA | — Tennessee Valley Authority |
This page is intentionally left blank.
This page is intentionally left blank.

For more information
More information about Wells Fargo Funds is available free upon request. To obtain literature, please write, email, visit the Fund’s website, or call:
Wells Fargo Funds
P.O. Box 8266
Boston, MA 02266-8266
Email: fundservice@wellsfargo.com
Website: wellsfargofunds.com
Individual investors: 1-800-222-8222
Retail investment professionals: 1-888-877-9275
Institutional investment professionals: 1-866-765-0778
This report and the financial statements contained herein are submitted for the general information of the shareholders of the Fund. If this report is used for promotional purposes, distribution of the report must be accompanied or preceded by a current prospectus. Before investing, please consider the investment objectives, risks, charges, and expenses of the investment. For a current prospectus and, if available, a summary prospectus, containing this information, call 1-800-222-8222 or visit the Fund’s website at wellsfargofunds.com. Read the prospectus carefully before you invest or send money.
Wells Fargo Asset Management (WFAM) is a trade name used by the asset management businesses of Wells Fargo & Company. Wells Fargo Funds Management, LLC, a wholly owned subsidiary of Wells Fargo & Company, provides investment advisory and administrative services for Wells Fargo Funds. Other affiliates of Wells Fargo & Company provide subadvisory and other services for the funds. The funds are distributed by Wells Fargo Funds Distributor, LLC, Member FINRA, an affiliate of Wells Fargo & Company.
NOT FDIC INSURED ¡ NO BANK GUARANTEE ¡ MAY LOSE VALUE
© 2016 Wells Fargo Funds Management, LLC. All rights reserved.
| | |
 | | 244406 08-16 A253/AR253 6-16 |
Annual Report
June 30, 2016

Wells Fargo
North Carolina Tax-Free Fund


Reduce clutter. Save trees.
Sign up for electronic delivery of prospectuses and shareholder reports at wellsfargo.com/advantagedelivery
Contents
The views expressed and any forward-looking statements are as of June 30, 2016, unless otherwise noted, and are those of the Fund managers and/or Wells Fargo Funds Management, LLC. Discussions of individual securities, or the markets generally, or any Wells Fargo Fund are not intended as individual recommendations. Future events or results may vary significantly from those expressed in any forward-looking statements. The views expressed are subject to change at any time in response to changing circumstances in the market. Wells Fargo Funds Management, LLC and the Fund disclaim any obligation to publicly update or revise any views expressed or forward-looking statements.
NOT FDIC INSURED ¡ NO BANK GUARANTEE ¡ MAY LOSE VALUE
| | | | |
| 2 | | Wells Fargo North Carolina Tax-Free Fund | | Letter to shareholders (unaudited) |

Karla M. Rabusch
President
Wells Fargo Funds
In fact, yields on municipal bonds that matured in 10 years or more experienced yield declines of more than 100 basis points (100 basis points equals 1.00%) during the reporting period.
Dear Valued Shareholder:
We are pleased to offer you this annual report for the Wells Fargo North Carolina Tax-Free Fund for the 12-month period that ended June 30, 2016. The U.S. Federal Reserve (Fed) began normalizing monetary policy, raising the federal funds rate to between 0.25% and 0.50% in December 2015. Short-term municipal bond yields rose, but yields on longer-term bonds declined. In fact, yields on municipal bonds that matured in 10 years or more experienced yield declines of more than 100 basis points (100 basis points equals 1.00%) during the reporting period. The Barclays Municipal Bond Index,1 a broad measure tracking investment-grade municipal bonds, returned 7.65% during the 12-month reporting period.
Monetary policy was accommodative.
The Fed continued an easy monetary policy in order to support the economy and the financial system. However, it raised the federal funds target rate in December because it believed the U.S. economy was strong enough to begin normalizing monetary policy. The European Central Bank cut all three of its short-term rates during the reporting period, increased its asset-purchase program from 60 billion euros per month to 80 billion, expanded the list of eligible securities to include investment-grade nonbank debt, and created a fund-to-lend program where banks could be paid to lend money. In Japan, the Bank of Japan maintained an aggressive monetary program aimed at combating deflation.
Despite accommodative central-bank policies that helped keep interest rates at ultra-low levels, there were periods of volatility. Early in 2016, weakness in certain emerging markets economies and commodities hurt riskier assets and a vote in June 2016 by the U.K. to exit the European Union set off another round of global uncertainty. Municipal bonds benefited because they are perceived as a safe-haven asset. In addition, investor demand for yield helped lower-rated debt outperform. The Barclays High Yield Municipal Bond Index2 returned 12.09% during the 12-month period that ended June 30, 2016.
Strong demand, modest supply, and solid credit fundamentals supported municipals.
Market technicals remained favorable. According to the Investment Company Institute, more than $33 billion was allocated to municipal mutual funds during the first half of 2016, which was more than double the inflows during all of 2015. Further, inflows during the second quarter of 2016 were the largest in nearly seven years. In contrast, less new supply helped make 2015 the fifth calendar year of negative net supply and supply in the first half of 2016 was about 4% less than the same period last year.
Municipal credit quality remained on an uptrend despite a number of high-profile negative credit situations. Idiosyncratic credit risks remain, however. With regard to Puerto Rico, the U.S. enacted legislation that prohibits bondholder lawsuits temporarily and instills a fiscal oversight board for Puerto Rico; Puerto Rico then declared a moratorium on paying its general obligation (GO) bonds and defaulted on $911 million in payments due (most of which were GOs) on July 1, 2016. The
| 1 | The Barclays Municipal Bond Index is an unmanaged index composed of long-term tax-exempt bonds with a minimum credit rating of Baa. You cannot invest directly in an index. |
| 2 | The Barclays High Yield Municipal Bond Index measures the non-investment-grade and nonrated U.S. dollar–denominated, fixed-rate, tax-exempt bond market within the 50 United States and four other qualifying regions (Washington, D.C.; Puerto Rico; Guam; and the Virgin Islands). The index allows state and local general obligation, revenue, insured, and prerefunded bonds; however, historically the index has been composed of mostly revenue bonds. You cannot invest directly in an index. |
| | | | | | |
| Letter to shareholders (unaudited) | | Wells Fargo North Carolina Tax-Free Fund | | | 3 | |
state of Illinois approved a six-month stopgap budget, a temporary but meaningful step. Under this stopgap budget for the state, the city of Chicago receives authority to raise property taxes for teacher pensions and low-income school districts would receive greater state funding. City of Chicago and school district debt rallied on the news.
Since the end of the financial crisis, structural changes in the fixed-income markets have reduced trading liquidity (the degree to which assets can be bought or sold without affecting the price). New regulations and capital requirements have caused traditional liquidity suppliers (banks and broker/dealers) to be more risk-averse and hold less inventory. Meanwhile, corporate-debt issuance has spiked as companies finance themselves at record-low yields, bond mutual funds hold larger amounts of this new debt supply, trading volumes are lower, and large trades are more difficult to execute. However, fixed-income markets appear to have functioned well over the past year with sufficient liquidity.
Don’t let short-term uncertainty derail long-term investment goals.
Periods of uncertainty can present challenges, but experience has taught us that maintaining long-term investment goals can be an effective way to plan for the future. To help you create a sound strategy based on your personal goals and risk tolerance, Wells Fargo Funds offers more than 100 mutual funds spanning a wide range of asset classes and investment styles. Although diversification cannot guarantee an investment profit or prevent losses, we believe it can be an effective way to manage investment risk and potentially smooth out overall portfolio performance. We encourage investors to know their investments and to understand that appropriate levels of risk-taking may unlock opportunities.
Thank you for choosing to invest in Wells Fargo Funds. We appreciate your confidence in us and remain committed to helping you meet your financial needs.
Sincerely,

Karla M. Rabusch
President
Wells Fargo Funds
Periods of uncertainty can present challenges, but experience has taught us that maintaining long-term investment goals can be an effective way to plan for the future.
For further information about your Fund, contact your investment professional, visit our website at wellsfargofunds.com, or call us directly at 1-800-222-8222. We are available 24 hours a day, 7 days a week.
| | | | |
| 4 | | Wells Fargo North Carolina Tax-Free Fund | | Performance highlights (unaudited) |
Investment objective
The Fund seeks current income exempt from federal income tax and North Carolina individual income tax.
Manager
Wells Fargo Funds Management, LLC
Subadviser
Wells Capital Management Incorporated
Portfolio managers
Bruce R. Johns
Robert J. Miller
Average annual total returns (%) as of June 30, 20161
| | | | | | | | | | | | | | | | | | | | | | | | | | | | | | | | | | |
| | | | | Including sales charge | | | Excluding sales charge | | | Expense ratios2 (%) | |
| | | Inception date | | 1 year | | | 5 year | | | 10 year | | | 1 year | | | 5 year | | | 10 year | | | Gross | | | Net3 | |
| Class A (ENCMX) | | 1-11-1993 | | | 0.67 | | | | 4.05 | | | | 3.62 | | | | 5.43 | | | | 5.01 | | | | 4.10 | | | | 0.94 | | | | 0.85 | |
| Class C (ENCCX) | | 3-27-2002 | | | 3.65 | | | | 4.23 | | | | 3.33 | | | | 4.65 | | | | 4.23 | | | | 3.33 | | | | 1.69 | | | | 1.60 | |
| Institutional Class (ENCYX) | | 2-28-1994 | | | – | | | | – | | | | – | | | | 5.76 | | | | 5.34 | | | | 4.40 | | | | 0.61 | | | | 0.54 | |
| Barclays Municipal Bond Index4 | | – | | | – | | | | – | | | | – | | | | 7.65 | | | | 5.33 | | | | 5.13 | | | | – | | | | – | |
| Barclays North Carolina Municipal Bond Index5 | | – | | | – | | | | – | | | | – | | | | 6.09 | | | | 4.51 | | | | 4.87 | | | | – | | | | – | |
Figures quoted represent past performance, which is no guarantee of future results, and do not reflect taxes that a shareholder may pay on fund distributions or the redemption of fund shares. Investment return and principal value of an investment will fluctuate so that an investor’s shares, when redeemed, may be worth more or less than their original cost. Performance shown without sales charges would be lower if sales charges were reflected. Current performance may be lower or higher than the performance data quoted, which assumes the reinvestment of dividends and capital gains. Current month-end performance is available on the Fund’s website, wellsfargofunds.com.
Index returns do not include transaction costs associated with buying and selling securities, any mutual fund fees or expenses, or any taxes. It is not possible to invest directly in an index.
For Class A shares, the maximum front-end sales charge is 4.50%. For Class C shares, the maximum contingent deferred sales charge is 1.00%. Performance including a contingent deferred sales charge assumes the sales charge for the corresponding time period. Institutional Class shares are sold without a front-end sales charge or contingent deferred sales charge.
Bond values fluctuate in response to the financial condition of individual issuers, general market and economic conditions, and changes in interest rates. Changes in market conditions and government policies may lead to periods of heightened volatility in the bond market and reduced liquidity for certain bonds held by the Fund. In general, when interest rates rise, bond values fall and investors may lose principal value. Interest-rate changes and their impact on the Fund and its share price can be sudden and unpredictable. The use of derivatives may reduce returns and/or increase volatility. Certain investment strategies tend to increase the total risk of an investment (relative to the broader market). The Fund is exposed to North Carolina municipal securities risk, high-yield securities risk, and non-diversification risk. Consult the Fund’s prospectus for additional information on these and other risks. A portion of the Fund’s income may be subject to federal, state, and/or local income taxes or the Alternative Minimum Tax (AMT). Any capital gains distributions may be taxable.
Please see footnotes on page 5.
| | | | | | |
| Performance highlights (unaudited) | | Wells Fargo North Carolina Tax-Free Fund | | | 5 | |
|
| Growth of $10,000 investment as of June 30, 20166 |
|
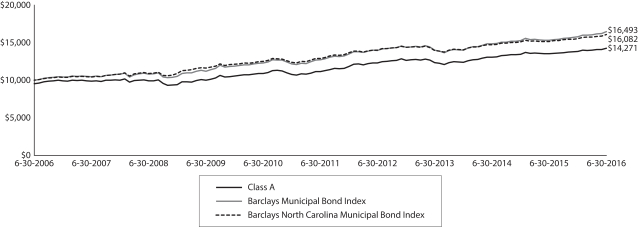 |
| 1 | Historical performance shown for all classes of the Fund prior to July 12, 2010, is based on the performance of the Fund’s predecessor, Evergreen North Carolina Municipal Bond Fund. |
| 2 | Reflects the expense ratios as stated in the most recent prospectuses. The expense ratios shown are subject to change and may differ from the annualized expense ratios shown in the financial highlights of this report. |
| 3 | The manager has contractually committed through October 31, 2016, to waive fees and/or reimburse expenses to the extent necessary to cap the Fund’s Total Annual Fund Operating Expenses After Fee Waiver at the amounts shown. After this time, the cap may be increased or the commitment to maintain the cap may be terminated only with the approval of the Board of Trustees. Brokerage commissions, stamp duty fees, interest, taxes, acquired fund fees and expenses, and extraordinary expenses are excluded from the expense cap. Without this cap, the Fund’s returns would have been lower. |
| 4 | The Barclays Municipal Bond Index is an unmanaged index composed of long-term tax-exempt bonds with a minimum credit rating of Baa. You cannot invest directly in an index. |
| 5 | The Barclays North Carolina Municipal Bond Index is the North Carolina component of the Barclays Municipal Bond Index. You cannot invest directly in an index. |
| 6 | The chart compares the performance of Class A shares for the most recent ten years with the Barclays Municipal Bond Index and the Barclays North Carolina Municipal Bond Index. The chart assumes a hypothetical $10,000 investment in Class A shares and reflects all operating expenses and assumes the maximum initial sales charge of 4.50%. |
| 7 | The credit quality distribution of portfolio holdings reflected in the chart is based on ratings from Standard & Poor’s, Moody’s Investors Service, and/or Fitch Ratings Ltd. Credit quality ratings apply to the underlying holdings of the Fund and not to the Fund itself. The percentages of the Fund’s portfolio with the ratings depicted in the chart are calculated based on the total market value of fixed income securities held by the Fund. If a security was rated by all three rating agencies, the middle rating was utilized. If rated by two of three rating agencies, the lower rating was utilized, and if rated by one of the rating agencies, that rating was utilized. Standard & Poor’s rates the creditworthiness of bonds, ranging from AAA (highest) to D (lowest). Ratings from A to CCC may be modified by the addition of a plus (+) or minus (-) sign to show relative standing within the rating categories. Standard & Poor’s rates the creditworthiness of short-term notes from SP-1 (highest) to SP-3 (lowest). Moody’s rates the creditworthiness of bonds, ranging from Aaa (highest) to C (lowest). Ratings Aa to B may be modified by the addition of a number 1 (highest) to 3 (lowest) to show relative standing within the ratings categories. Moody’s rates the creditworthiness of short-term U.S. tax-exempt municipal securities from MIG 1/VMIG 1 (highest) to SG (lowest). Fitch rates the creditworthiness of bonds, ranging from AAA (highest) to D (lowest). Credit quality distribution is subject to change and may have changed since the date specified. |
| 8 | Amounts are calculated based on the total investments of the Fund. These amounts are subject to change and may have changed since the date specified. |
| | | | |
| 6 | | Wells Fargo North Carolina Tax-Free Fund | | Performance highlights (unaudited) |
MANAGER’S DISCUSSION
Fund highlights
| n | | The Fund underperformed both of its benchmarks, the Barclays Municipal Bond Index and the Barclays North Carolina Municipal Bond Index, for the 12-month period that ended June 30, 2016. |
| n | | We focused on defensively structured bonds in credits that we believed would outperform if interest rates rose. A short duration detracted from performance as yields fell and the market rallied. Yield-curve positioning also detracted from performance because it was underweight the long end of the yield curve, which was the best-performing part. |
| n | | Investors reached for income in an ultralow-yield environment, which resulted in a strong technical rally in credit. The Fund’s overweight to BBB-rated and A-rated bonds was the largest contributor to performance for the period. Sector allocation and security selection contributed to performance. |
The period was marked by the long-term bonds outperforming.
The period began with the federal funds target rate expected to increase by late 2015, which made shorter maturities between one and five years less attractive due to a potential backup in municipal rates. The U.S. Federal Reserve (Fed) tightened in December 2015 but signaled that the pace of further increases would be gradual. While the Fed was likely to take its time raising rates, U.S. inflation started to trend higher, unemployment dropped below 5% and economic growth was expected to remain at or above 2%. Municipal yields declined with longer-dated maturities outperforming by a significant margin. Less new-issue supply and strong demand (as evidenced by positive inflows to municipal bond funds) helped support the market. As investors reached for yield, credit spreads fell to near their lowest historical levels and the long end rallied to an all-time low of 2% on June 27, 2016.
|
| Credit quality as of as of June 30, 20167 |
|
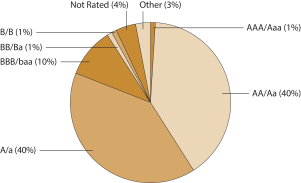 |
The Fund’s credit positioning contributed to performance.
The Fund’s overweight to bonds A-rated and below was beneficial as lower-rated bonds outperformed higher-quality bonds. As credit spreads contracted, we moved up in credit quality because we believed higher-rated bonds represented better relative value compared with lower-rated bonds. Many state-specific funds have exposure to Puerto Rico debt due to its triple tax exemption; however, we hold no Puerto Rico debt in the Fund. While the credit performed well over the past year, significant challenges remain and additional defaults are highly likely. The Fund was overweight essential-service revenue bonds, which outperformed, and underweight general obligation (GO) bonds, which underperformed. We saw more relative value in revenue bonds with predictable revenue streams that offered higher income than we did in GO bonds.
Please see footnotes on page 5.
| | | | | | |
| Performance highlights (unaudited) | | Wells Fargo North Carolina Tax-Free Fund | | | 7 | |
|
| Effective maturity distribution as of June 30, 20168 |
|
 |
The Fund was positioned in a defensive manner, which was a detractor to performance.
We kept the Fund’s duration short throughout the period, which detracted from results as yields declined. Yield-curve positioning was suboptimal. The Fund was concentrated in the 10-year to 20-year part of the curve because we felt it offered the best risk-adjusted returns. While this part of the curve performed well, it was not enough to offset our underweight to the long end of the yield curve, which was the best-performing part of the curve.
North Carolina continues to improve in credit quality.
The state of North Carolina is rated Aaa/AAA/AAA (stable) by Moody’s, Standard & Poor’s, and Fitch Ratings, respectively, based on conservative fiscal practices, moderate debt levels, and a well-funded pension system. The governor serves as the budget director, which allows for quick response when needed to balance operations. The state’s debt burden is a low 1.7% of personal income at $656 per capita with 80% of principal retired in 10 years. The state’s savings reserve account (rainy day fund) improved to 5% of operating expenses in 2016. Sales tax revenue is forecast to increase 6.1% in fiscal-year 2017, with income tax budgeted to increase 1.3%. We expect the state’s economy to continue to recover and expand while maintaining moderate debt levels.
Rates may be lower for longer, making credit allocation and issue selection even more important.
Near the end of the reporting period, the U.K. voted to withdraw from the European Union, prompting considerable uncertainty about future political situations, financial markets, and economic growth. U.S. Treasuries and municipal bonds rallied significantly on the news, and both 10-year and 30-year municipal yields reached record-low levels. Although we think rates may stay lower for longer, we recognize that an improvement in overseas economies, outflows in mutual funds, or a more hawkish tone from the Fed could lead to a spike in rates. However, if the U.S. economy does weaken materially, this could be the catalyst for us to increase our duration exposure and reduce our credit exposure. In this record-low interest-rate environment, security selection is even more important as breakeven yields (the sell-off that a bond can endure before the total return drops to zero) decrease.
Please see footnotes on page 5.
| | | | |
| 8 | | Wells Fargo North Carolina Tax-Free Fund | | Fund expenses (unaudited) |
As a shareholder of the Fund, you incur two types of costs: (1) transaction costs, including sales charges (loads) on purchase payments and contingent deferred sales charges (if any) on redemptions and (2) ongoing costs, including management fees, distribution (12b-1) and/or shareholder servicing fees, and other Fund expenses. This example is intended to help you understand your ongoing costs (in dollars) of investing in the Fund and to compare these costs with the ongoing costs of investing in other mutual funds.
The example is based on an investment of $1,000 invested at the beginning of the six-month period and held for the entire period from January 1, 2016 to June 30, 2016.
Actual expenses
The “Actual” line of the table below provides information about actual account values and actual expenses. You may use the information in this line, together with the amount you invested, to estimate the expenses that you paid over the period. Simply divide your account value by $1,000 (for example, an $8,600 account value divided by $1,000 = 8.6), then multiply the result by the number in the “Actual” line under the heading entitled “Expenses paid during period” for your applicable class of shares to estimate the expenses you paid on your account during this period.
Hypothetical example for comparison purposes
The “Hypothetical” line of the table below provides information about hypothetical account values and hypothetical expenses based on the Fund’s actual expense ratio and an assumed rate of return of 5% per year before expenses, which is not the Fund’s actual return. The hypothetical account values and expenses may not be used to estimate the actual ending account balance or expenses you paid for the period. You may use this information to compare the ongoing costs of investing in the Fund and other funds. To do so, compare this 5% hypothetical example with the 5% hypothetical examples that appear in the shareholder reports of the other funds.
Please note that the expenses shown in the table are meant to highlight your ongoing costs only and do not reflect any transactional costs, such as sales charges (loads) and contingent deferred sales charges. Therefore, the “Hypothetical” line of the table is useful in comparing ongoing costs only and will not help you determine the relative total costs of owning different funds. In addition, if these transactional costs were included, your costs would have been higher.
| | | | | | | | | | | | | | | | |
| | | Beginning
account value
1-1-2016 | | | Ending
account value
6-30-2016 | | | Expenses
paid during
the period¹ | | | Net annualized
expense ratio | |
Class A | | | | | | | | | | | | | | | | |
Actual | | $ | 1,000.00 | | | $ | 1,029.43 | | | $ | 4.29 | | | | 0.85 | % |
Hypothetical (5% return before expenses) | | $ | 1,000.00 | | | $ | 1,020.64 | | | $ | 4.27 | | | | 0.85 | % |
Class C | | | | | | | | | | | | | | | | |
Actual | | $ | 1,000.00 | | | $ | 1,025.59 | | | $ | 8.06 | | | | 1.60 | % |
Hypothetical (5% return before expenses) | | $ | 1,000.00 | | | $ | 1,016.91 | | | $ | 8.02 | | | | 1.60 | % |
Institutional Class | | | | | | | | | | | | | | | | |
Actual | | $ | 1,000.00 | | | $ | 1,031.01 | | | $ | 2.73 | | | | 0.54 | % |
Hypothetical (5% return before expenses) | | $ | 1,000.00 | | | $ | 1,022.18 | | | $ | 2.72 | | | | 0.54 | % |
| 1 | Expenses paid is equal to the annualized expense ratio of each class multiplied by the average account value over the period, multiplied by the number of days in the most recent fiscal half-year divided by the number of days in the fiscal year (to reflect the one-half-year period). |
| | | | | | |
| Portfolio of investments—June 30, 2016 | | Wells Fargo North Carolina Tax-Free Fund | | | 9 | |
| | | | | | | | | | | | | | | | |
| Security name | | Interest rate | | | Maturity date | | | Principal | | | Value | |
| | | | |
Municipal Obligations: 98.74% | | | | | | | | | | | | | | | | |
| | | | |
| California: 1.12% | | | | | | | | | | | | | | | | |
University of California Limited Project Series G (Education Revenue) | | | 5.00 | % | | | 5-15-2037 | | | $ | 1,000,000 | | | $ | 1,181,330 | |
| | | | | | | | | | | | | | | | |
| | | | |
| Guam: 4.51% | | | | | | | | | | | | | | | | |
Guam Government Business Privilege Tax Series A (Tax Revenue) | | | 5.00 | | | | 1-1-2031 | | | | 1,000,000 | | | | 1,142,140 | |
Guam Government Hotel Occupancy Series A (Tax Revenue) | | | 6.00 | | | | 11-1-2026 | | | | 2,000,000 | | | | 2,408,600 | |
Guam Government Waterworks Authority (Water & Sewer Revenue) | | | 5.25 | | | | 7-1-2023 | | | | 1,000,000 | | | | 1,220,170 | |
| | | | |
| | | | | | | | | | | | | | | 4,770,910 | |
| | | | | | | | | | | | | | | | |
| | | | |
| Illinois: 0.93% | | | | | | | | | | | | | | | | |
Chicago IL Board of Education Refunding Bond Series A (GO Revenue) | | | 4.39 | | | | 3-1-2032 | | | | 1,000,000 | | | | 980,410 | |
| | | | | | | | | | | | | | | | |
| | | | |
| Indiana: 1.16% | | | | | | | | | | | | | | | | |
Indiana Finance Authority Clean Water Act Project Series A (Water & Sewer Revenue) | | | 5.00 | | | | 10-1-2031 | | | | 1,000,000 | | | | 1,225,450 | |
| | | | | | | | | | | | | | | | |
| | | | |
| New York: 1.68% | | | | | | | | | | | | | | | | |
New York Dormitory Authority Personal Income Tax Series B (Tax Revenue) | | | 5.00 | | | | 3-15-2042 | | | | 1,500,000 | | | | 1,781,100 | |
| | | | | | | | | | | | | | | | |
| | | | |
| North Carolina: 80.71% | | | | | | | | | | | | | | | | |
Cape Fear NC Public Utility Authority (Water & Sewer Revenue) | | | 5.00 | | | | 8-1-2035 | | | | 3,000,000 | | | | 3,270,930 | |
Carolina Beach NC Enterprise System (Water & Sewer Revenue) | | | 5.00 | | | | 6-1-2029 | | | | 250,000 | | | | 320,065 | |
Carolina Beach NC Enterprise System (Water & Sewer Revenue) | | | 5.00 | | | | 6-1-2031 | | | | 245,000 | | | | 311,081 | |
Charlotte Mecklenburg NC Hospital (Health Revenue, JPMorgan Chase & Company SPA) ± | | | 0.44 | | | | 1-15-2037 | | | | 2,500,000 | | | | 2,500,000 | |
Charlotte NC Airport Series A (Airport Revenue) | | | 5.50 | | | | 7-1-2034 | | | | 2,500,000 | | | | 2,884,475 | |
Charlotte NC Airport Series D (Airport Revenue, Bank of America NA LOC) ø | | | 0.46 | | | | 7-1-2034 | | | | 1,000,000 | | | | 1,000,000 | |
Charlotte NC AMT Series B (Airport Revenue) | | | 5.00 | | | | 7-1-2020 | | | | 1,480,000 | | | | 1,704,161 | |
Charlotte NC AMT Series B (Airport Revenue) | | | 5.50 | | | | 7-1-2024 | | | | 810,000 | | | | 933,371 | |
Charlotte NC Certificate of Participation Series A (Miscellaneous Revenue) | | | 5.00 | | | | 12-1-2026 | | | | 1,160,000 | | | | 1,388,242 | |
Charlotte NC Certificate of Participation Series A (Miscellaneous Revenue) | | | 5.00 | | | | 6-1-2030 | | | | 1,000,000 | | | | 1,235,130 | |
Charlotte NC Certificate of Participation Series E (Miscellaneous Revenue) | | | 5.00 | | | | 6-1-2023 | | | | 3,650,000 | | | | 4,090,446 | |
Charlotte NC Douglas Airport Series A (Airport Revenue) | | | 5.00 | | | | 7-1-2025 | | | | 1,645,000 | | | | 1,908,151 | |
Charlotte-Mecklenburg NC Hospital Authority (Health Revenue) | | | 5.00 | | | | 1-15-2027 | | | | 1,885,000 | | | | 2,058,665 | |
Cumberland County NC Limited Obligation Series B (Miscellaneous Revenue) | | | 5.00 | | | | 11-1-2025 | | | | 1,000,000 | | | | 1,208,310 | |
Cumberland County NC Limited Obligation Series B (Miscellaneous Revenue) | | | 5.00 | | | | 11-1-2026 | | | | 1,000,000 | | | | 1,204,370 | |
Fayetteville NC Public Works Commission Series B (Utilities Revenue) | | | 5.00 | | | | 3-1-2023 | | | | 600,000 | | | | 667,662 | |
Jacksonville NC Enterprise System (Water & Sewer Revenue) | | | 5.25 | | | | 5-1-2028 | | | | 500,000 | | | | 673,425 | |
Johnston County NC Memorial Hospital Authority (Health Revenue, AGM/FHA Insured) | | | 5.25 | | | | 10-1-2036 | | | | 1,960,000 | | | | 2,117,035 | |
Mecklenburg County NC Public Facilities Corporation (Miscellaneous Revenue) | | | 5.00 | | | | 3-1-2022 | | | | 1,035,000 | | | | 1,151,137 | |
New Hanover County NC New Hanover Regional Medical Center (Health Revenue) | | | 5.00 | | | | 10-1-2026 | | | | 1,000,000 | | | | 1,191,900 | |
New Hanover County NC New Hanover Regional Medical Center (Health Revenue) | | | 5.00 | | | | 10-1-2028 | | | | 3,000,000 | | | | 3,501,960 | |
New Hanover County NC New Hanover Regional Medical Center (Health Revenue, AGM Insured) | | | 5.13 | | | | 10-1-2031 | | | | 1,800,000 | | | | 2,008,782 | |
North Carolina Capital Improvement Limited Series A (Miscellaneous Revenue) | | | 5.00 | | | | 5-1-2026 | | | | 3,000,000 | | | | 3,237,600 | |
North Carolina Department of Transportation (Transportation Revenue) | | | 5.00 | | | | 6-30-2028 | | | | 1,275,000 | | | | 1,486,854 | |
North Carolina Facilities Finance Agency (Housing Revenue, AGC Insured) | | | 5.00 | | | | 6-1-2027 | | | | 1,000,000 | | | | 1,206,820 | |
North Carolina HFA Series 25-A (Housing Revenue) | | | 4.65 | | | | 7-1-2021 | | | | 1,735,000 | | | | 1,738,886 | |
North Carolina HFA Series B (Housing Revenue) | | | 4.25 | | | | 1-1-2028 | | | | 2,860,000 | | | | 2,960,643 | |
North Carolina Medical Care Commission Baptist Hospital Project (Health Revenue) | | | 5.25 | | | | 6-1-2029 | | | | 2,000,000 | | | | 2,300,360 | |
The accompanying notes are an integral part of these financial statements.
| | | | |
| 10 | | Wells Fargo North Carolina Tax-Free Fund | | Portfolio of investments—June 30, 2016 |
| | | | | | | | | | | | | | | | |
| Security name | | Interest rate | | | Maturity date | | | Principal | | | Value | |
|
| North Carolina (continued) | |
North Carolina Medical Care Commission Cleveland County Health Care System (Health Revenue) | | | 5.00 | % | | | 1-1-2018 | | | $ | 500,000 | | | $ | 533,020 | |
North Carolina Medical Care Commission Presbyterian Homes Project (Health Revenue) | | | 5.50 | | | | 10-1-2031 | | | | 2,000,000 | | | | 2,013,980 | |
North Carolina Medical Care Commission Presbyterian Homes Project (Health Revenue) | | | 5.60 | | | | 10-1-2036 | | | | 1,500,000 | | | | 1,509,810 | |
North Carolina Medical Care Commission Southeastern Regional Medical Center (Health Revenue) | | | 5.00 | | | | 6-1-2026 | | | | 385,000 | | | | 446,065 | |
North Carolina Medical Care Commission Southeastern Regional Medical Center (Health Revenue) | | | 5.00 | | | | 6-1-2032 | | | | 500,000 | | | | 566,315 | |
North Carolina Medical Care Commission Stanley Memorial Hospital Project (Health Revenue) | | | 5.00 | | | | 7-1-2033 | | | | 1,000,000 | | | | 1,040,140 | |
North Carolina Medical Care Commission University Health Systems of Eastern Carolina Series D (Health Revenue) | | | 6.25 | | | | 12-1-2033 | | | | 1,500,000 | | | | 1,700,340 | |
North Carolina Medical Care Commission Wake Forest Baptist Medical Center (Health Revenue) | | | 5.00 | | | | 12-1-2022 | | | | 1,950,000 | | | | 2,375,061 | |
North Carolina Municipal Power Agency #1 Catawba Nuclear Power Project Series A (Utilities Revenue) | | | 5.00 | | | | 1-1-2021 | | | | 2,720,000 | | | | 3,111,789 | |
North Carolina Municipal Power Agency #1 Catawba Nuclear Power Project Prerefunded Series A (Utilities Revenue) | | | 5.00 | | | | 1-1-2030 | | | | 1,105,000 | | | | 1,222,384 | |
North Carolina Municipal Power Agency #1 Catawba Nuclear Power Project Unrefunded Series A (Utilities Revenue) | | | 5.00 | | | | 1-1-2030 | | | | 445,000 | | | | 488,770 | |
North Carolina Port Authority Series B (Airport Revenue) | | | 5.00 | | | | 2-1-2025 | | | | 3,540,000 | | | | 3,944,480 | |
North Carolina Raleigh-Durham Airport Authority Series B-1 (Airport Revenue) | | | 5.00 | | | | 11-1-2028 | | | | 1,500,000 | | | | 1,717,920 | |
Onslow County NC Water and Sewer Authority (Water & Sewer Revenue) | | | 5.00 | | | | 12-1-2027 | | | | 495,000 | | | | 642,956 | |
Onslow County NC Water and Sewer Authority (Water & Sewer Revenue) | | | 5.00 | | | | 12-1-2028 | | | | 505,000 | | | | 654,233 | |
Orange County NC Public Facilities Company Limited Obligation (Miscellaneous Revenue) | | | 5.00 | | | | 10-1-2026 | | | | 1,000,000 | | | | 1,201,480 | |
Pitt County NC Limited Obligation Series A (Miscellaneous Revenue) | | | 5.00 | | | | 4-1-2027 | | | | 875,000 | | | | 1,111,758 | |
Raleigh NC Limited Obligation Series A (Miscellaneous Revenue) | | | 5.00 | | | | 2-1-2028 | | | | 600,000 | | | | 774,966 | |
Raleigh NC Limited Obligation Series A (Miscellaneous Revenue) | | | 5.00 | | | | 2-1-2029 | | | | 900,000 | | | | 1,157,850 | |
Raleigh NC Limited Obligation Series A (Miscellaneous Revenue) | | | 5.00 | | | | 10-1-2033 | | | | 1,000,000 | | | | 1,241,760 | |
University of North Carolina at Greensboro (Education Revenue) | | | 5.00 | | | | 4-1-2033 | | | | 2,000,000 | | | | 2,432,060 | |
University of North Carolina at Greensboro (Education Revenue) | | | 5.00 | | | | 4-1-2039 | | | | 1,620,000 | | | | 1,944,194 | |
Wilmington NC Certificate of Participation Series A (Miscellaneous Revenue) | | | 5.00 | | | | 6-1-2029 | | | | 2,580,000 | | | | 2,795,198 | |
Wilmington NC Limited Obligation Series A (Miscellaneous Revenue) | | | 5.00 | | | | 6-1-2030 | | | | 400,000 | | | | 512,868 | |
| |
| | | | 85,399,858 | |
| | | | | | | | | | | | | | | | |
| | | | |
| Tennessee: 3.41% | | | | | | | | | | | | | | | | |
Tennessee Energy Acquisition Corporation Series A (Utilities Revenue) | | | 5.25 | | | | 9-1-2026 | | | | 1,020,000 | | | | 1,287,209 | |
Tennessee Energy Acquisition Corporation Series C (Utilities Revenue) | | | 5.00 | | | | 2-1-2021 | | | | 2,000,000 | | | | 2,320,660 | |
| |
| | | | 3,607,869 | |
| | | | | | | | | | | | | | | | |
| | | | |
| Virgin Islands: 2.97% | | | | | | | | | | | | | | | | |
Virgin Islands PFA (Miscellaneous Revenue) | | | 6.75 | | | | 10-1-2019 | | | | 2,890,000 | | | | 3,139,841 | |
| | | | | | | | | | | | | | | | |
| | | | |
| Washington: 1.17% | | | | | | | | | | | | | | | | |
Tumwater Office Properties Washington Office Buildings (Miscellaneous Revenue) | | | 5.00 | | | | 7-1-2026 | | | | 1,000,000 | | | | 1,243,000 | |
| | | | | | | | | | | | | | | | |
| | | | |
| Wisconsin: 1.08% | | | | | | | | | | | | | | | | |
Wisconsin PFA Carolina International School Series A (Education Revenue) 144A | | | 6.75 | | | | 8-1-2033 | | | | 1,000,000 | | | | 1,139,400 | |
| | | | | | | | | | | | | | | | |
| | | | |
Total Municipal Obligations (Cost $94,972,588) | | | | | | | | | | | | | | | 104,469,168 | |
| | | | | | | | | | | | | | | | |
The accompanying notes are an integral part of these financial statements.
| | | | | | |
| Portfolio of investments—June 30, 2016 | | Wells Fargo North Carolina Tax-Free Fund | | | 11 | |
| | | | | | | | | | | | | | | | |
| Security name | | Yield | | | | | | Shares | | | Value | |
| | | | |
Short-Term Investments: 0.14% | | | | | | | | | | | | | | | | |
| | | | |
| Investment Companies: 0.14% | | | | | | | | | | | | | | | | |
Wells Fargo Municipal Cash Management Fund Institutional Class (l)(u) | | | 0.30 | % | | | | | | | 143,783 | | | $ | 143,783 | |
| | | | | | | | | | | | | | | | |
| | | | |
Total Short-Term Investments (Cost $143,783) | | | | | | | | | | | | | | | 143,783 | |
| | | | | | | | | | | | | | | | |
| | | | | | | | |
| Total investments in securities (Cost $95,116,371) * | | | 98.88 | % | | | 104,612,951 | |
Other assets and liabilities, net | | | 1.12 | | | | 1,190,262 | |
| | | | | | | | |
| Total net assets | | | 100.00 | % | | $ | 105,803,213 | |
| | | | | | | | |
| ± | Variable rate investment. The rate shown is the rate in effect at period end. |
| ø | Variable rate demand notes are subject to a demand feature which reduces the effective maturity. The maturity date shown represents the final maturity date of the security. The interest rate is determined and reset by the issuer daily, weekly, or monthly depending upon the terms of the security. The rate shown is the rate in effect at period end. |
| 144A | The security may be resold in transactions exempt from registration, normally to qualified institutional buyers, pursuant to Rule 144A under the Securities Act of 1933. |
| (l) | The issuer of the security is an affiliated person of the Fund as defined in the Investment Company Act of 1940. |
| (u) | The rate represents the 7-day annualized yield at period end. |
| * | Cost for federal income tax purposes is $95,116,370 and unrealized gains (losses) consists of: |
| | | | |
Gross unrealized gains | | $ | 9,516,171 | |
Gross unrealized losses | | | (19,590 | ) |
| | | | |
Net unrealized gains | | $ | 9,496,581 | |
The accompanying notes are an integral part of these financial statements.
| | | | |
| 12 | | Wells Fargo North Carolina Tax-Free Fund | | Statement of assets and liabilities —June 30, 2016 |
| | | | |
| | | | |
| |
Assets | | | | |
Investments | | | | |
In unaffiliated securities, at value (cost $94,972,588) | | $ | 104,469,168 | |
In affiliated securities, at value (cost $143,783) | | | 143,783 | |
| | | | |
Total investments, at value (cost $95,116,371) | | | 104,612,951 | |
Receivable for investments sold | | | 110,000 | |
Receivable for Fund shares sold | | | 39,986 | |
Receivable for interest | | | 1,294,084 | |
Prepaid expenses and other assets | | | 24,830 | |
| | | | |
Total assets | | | 106,081,851 | |
| | | | |
| |
Liabilities | | | | |
Dividends payable | | | 130,038 | |
Payable for Fund shares redeemed | | | 75,693 | |
Management fee payable | | | 26,166 | |
Distribution fee payable | | | 3,742 | |
Administration fees payable | | | 9,588 | |
Accrued expenses and other liabilities | | | 33,411 | |
| | | | |
Total liabilities | | | 278,638 | |
| | | | |
Total net assets | | $ | 105,803,213 | |
| | | | |
| |
NET ASSETS CONSIST OF | | | | |
Paid-in capital | | $ | 106,655,671 | |
Overdistributed net investment income | | | (59,574 | ) |
Accumulated net realized losses on investments | | | (10,289,464 | ) |
Net unrealized gains on investments | | | 9,496,580 | |
| | | | |
Total net assets | | $ | 105,803,213 | |
| | | | |
| |
COMPUTATION OF NET ASSET VALUE AND OFFERING PRICE PER SHARE | | | | |
Net assets – Class A | | $ | 36,889,820 | |
Shares outstanding – Class A1 | | | 3,481,001 | |
Net asset value per share – Class A | | | $10.60 | |
Maximum offering price per share – Class A2 | | | $11.10 | |
Net assets – Class C | | $ | 6,120,669 | |
Shares outstanding – Class C1 | | | 577,526 | |
Net asset value per share – Class C | | | $10.60 | |
Net assets – Institutional Class | | $ | 62,792,724 | |
Shares outstanding – Institutional Class1 | | | 5,925,228 | |
Net asset value per share – Institutional Class | | | $10.60 | |
| 1 | The Fund has an unlimited number of authorized shares. |
| 2 | Maximum offering price is computed as 100/95.50 of net asset value. On investments of $50,000 or more, the offering price is reduced. |
The accompanying notes are an integral part of these financial statements.
| | | | | | |
| Statement of operations—year ended June 30, 2016 | | Wells Fargo North Carolina Tax-Free Fund | | | 13 | |
| | | | |
| | | | |
| |
Investment income | | | | |
Interest | | $ | 3,866,238 | |
Income from affiliated securities | | | 1,573 | |
| | | | |
Total investment income | | | 3,867,811 | |
| | | | |
| |
Expenses | | | | |
Management fee | | | 401,302 | |
Administration fees | | | | |
Class A | | | 56,494 | |
Class C | | | 7,817 | |
Institutional Class | | | 48,105 | |
Shareholder servicing fees | | | | |
Class A | | | 88,273 | |
Class C | | | 12,214 | |
Distribution fee | | | | |
Class C | | | 36,641 | |
Custody and accounting fees | | | 10,375 | |
Professional fees | | | 47,156 | |
Registration fees | | | 49,972 | |
Shareholder report expenses | | | 9,005 | |
Trustees’ fees and expenses | | | 22,770 | |
Other fees and expenses | | | 8,465 | |
| | | | |
Total expenses | | | 798,589 | |
Less: Fee waivers and/or expense reimbursements | | | (95,585 | ) |
| | | | |
Net expenses | | | 703,004 | |
| | | | |
Net investment income | | | 3,164,807 | |
| | | | |
| |
REALIZED AND UNREALIZED GAINS (LOSSES) ON INVESTMENTS | | | | |
Net realized losses on investments | | | (55,699 | ) |
Net change in unrealized gains (losses) on investments | | | 2,346,419 | |
| | | | |
Net realized and unrealized gains (losses) on investments | | | 2,290,720 | |
| | | | |
Net increase in net assets resulting from operations | | $ | 5,455,527 | |
| | | | |
The accompanying notes are an integral part of these financial statements.
| | | | |
| 14 | | Wells Fargo North Carolina Tax-Free Fund | | Statement of changes in net assets |
| | | | | | | | | | | | | | | | |
| | | Year ended
June 30, 2016 | | | Year ended
June 30, 2015 | |
| | | |
Operations | | | | | | | | | | | | |
Net investment income | | | | | | $ | 3,164,807 | | | | | | | $ | 3,380,153 | |
Net realized gains (losses) on investments | | | | | | | (55,699 | ) | | | | | | | 901,303 | |
Net change in unrealized gains (losses) on investments | | | | | | | 2,346,419 | | | | | | | | (448,372 | ) |
| | | | |
Net increase in net assets resulting from operations | | | | | | | 5,455,527 | | | | | | | | 3,833,084 | |
| | | | |
| | | |
Distributions to shareholders from | | | | | | | | | | | | |
Net investment income | | | | | | | | | | | | | | | | |
Class A | | | | | | | (1,060,689 | ) | | | | | | | (1,066,500 | ) |
Class C | | | | | | | (109,808 | ) | | | | | | | (102,579 | ) |
Institutional Class | | | | | | | (1,994,310 | ) | | | | | | | (2,211,074 | ) |
| | | | |
Total distributions to shareholders | | | | | | | (3,164,807 | ) | | | | | | | (3,380,153 | ) |
| | | | |
| | | | |
Capital share transactions | | | Shares | | | | | | | | Shares | | | | | |
Proceeds from shares sold | | | | | | | | | | | | | | | | |
Class A | | | 424,558 | | | | 4,432,275 | | | | 66,427 | | | | 692,635 | |
Class C | | | 186,322 | | | | 1,956,171 | | | | 53,420 | | | | 558,887 | |
Institutional Class | | | 1,135,937 | | | | 11,925,410 | | | | 976,885 | | | | 10,167,225 | |
| | | | |
| | | | | | | 18,313,856 | | | | | | | | 11,418,747 | |
| | | | |
Reinvestment of distributions | | | | | | | | | | | | | | | | |
Class A | | | 94,806 | | | | 992,485 | | | | 92,637 | | | | 968,218 | |
Class C | | | 9,754 | | | | 102,165 | | | | 8,722 | | | | 91,170 | |
Institutional Class | | | 39,018 | | | | 408,587 | | | | 35,923 | | | | 375,472 | |
| | | | |
| | | | | | | 1,503,237 | | | | | | | | 1,434,860 | |
| | | | |
Payment for shares redeemed | | | | | | | | | | | | | | | | |
Class A | | | (317,128 | ) | | | (3,313,134 | ) | | | (468,709 | ) | | | (4,906,152 | ) |
Class C | | | (46,145 | ) | | | (483,983 | ) | | | (76,563 | ) | | | (796,737 | ) |
Institutional Class | | | (1,122,422 | ) | | | (11,750,628 | ) | | | (2,156,709 | ) | | | (22,473,470 | ) |
| | | | |
| | | | | | | (15,547,745 | ) | | | | | | | (28,176,359 | ) |
| | | | |
Net increase (decrease) in net assets resulting from capital share transactions | | | | | | | 4,269,348 | | | | | | | | (15,322,752 | ) |
| | | | |
Total increase (decrease) in net assets | | | | | | | 6,560,068 | | | | | | | | (14,869,821 | ) |
| | | | |
| | |
Net assets | | | | | | | | |
Beginning of period | | | | | | | 99,243,145 | | | | | | | | 114,112,966 | |
| | | | |
End of period | | | | | | $ | 105,803,213 | | | | | | | $ | 99,243,145 | |
| | | | |
Overdistributed net investment income | | | | | | $ | (59,574 | ) | | | | | | $ | (59,574 | ) |
| | | | |
The accompanying notes are an integral part of these financial statements.
| | | | | | |
| Financial highlights | | Wells Fargo North Carolina Tax-Free Fund | | | 15 | |
(For a share outstanding throughout each period)
| | | | | | | | | | | | | | | | | | | | |
| | | Year ended June 30 | |
| CLASS A | | 2016 | | | 2015 | | | 2014 | | | 2013 | | | 2012 | |
Net asset value, beginning of period | | | $10.36 | | | | $10.33 | | | | $10.08 | | | | $10.34 | | | | $9.71 | |
Net investment income | | | 0.31 | | | | 0.32 | | | | 0.33 | | | | 0.32 | | | | 0.34 | |
Net realized and unrealized gains (losses) on investments | | | 0.24 | | | | 0.03 | | | | 0.25 | | | | (0.26 | ) | | | 0.63 | |
| | | | | | | | | | | | | | | | | | | | |
Total from investment operations | | | 0.55 | | | | 0.35 | | | | 0.58 | | | | 0.06 | | | | 0.97 | |
Distributions to shareholders from | | | | | | | | | | | | | | | | | | | | |
Net investment income | | | (0.31 | ) | | | (0.32 | ) | | | (0.33 | ) | | | (0.32 | ) | | | (0.34 | ) |
Net asset value, end of period | | | $10.60 | | | | $10.36 | | | | $10.33 | | | | $10.08 | | | | $10.34 | |
Total return1 | | | 5.43 | % | | | 3.35 | % | | | 5.92 | % | | | 0.51 | % | | | 10.09 | % |
Ratios to average net assets (annualized) | | | | | | | | | | | | | | | | | | | | |
Gross expenses | | | 0.96 | % | | | 0.94 | % | | | 0.94 | % | | | 0.91 | % | | | 0.90 | % |
Net expenses | | | 0.85 | % | | | 0.85 | % | | | 0.85 | % | | | 0.85 | % | | | 0.85 | % |
Net investment income | | | 3.00 | % | | | 3.01 | % | | | 3.32 | % | | | 3.06 | % | | | 3.34 | % |
Supplemental data | | | | | | | | | | | | | | | | | | | | |
Portfolio turnover rate | | | 7 | % | | | 12 | % | | | 15 | % | | | 15 | % | | | 48 | % |
Net assets, end of period (000s omitted) | | | $36,890 | | | | $33,969 | | | | $37,067 | | | | $41,879 | | | | $44,082 | |
| 1 | Total return calculations do not include any sales charges. |
The accompanying notes are an integral part of these financial statements.
| | | | |
| 16 | | Wells Fargo North Carolina Tax-Free Fund | | Financial highlights |
(For a share outstanding throughout each period)
| | | | | | | | | | | | | | | | | | | | |
| | | Year ended June 30 | |
| CLASS C | | 2016 | | | 2015 | | | 2014 | | | 2013 | | | 2012 | |
Net asset value, beginning of period | | | $10.36 | | | | $10.33 | | | | $10.08 | | | | $10.34 | | | | $9.71 | |
Net investment income | | | 0.24 | | | | 0.24 | | | | 0.26 | | | | 0.24 | | | | 0.26 | |
Net realized and unrealized gains (losses) on investments | | | 0.24 | | | | 0.03 | | | | 0.25 | | | | (0.26 | ) | | | 0.63 | |
| | | | | | | | | | | | | | | | | | | | |
Total from investment operations | | | 0.48 | | | | 0.27 | | | | 0.51 | | | | (0.02 | ) | | | 0.89 | |
Distributions to shareholders from | | | | | | | | | | | | | | | | | | | | |
Net investment income | | | (0.24 | ) | | | (0.24 | ) | | | (0.26 | ) | | | (0.24 | ) | | | (0.26 | ) |
Net asset value, end of period | | | $10.60 | | | | $10.36 | | | | $10.33 | | | | $10.08 | | | | $10.34 | |
Total return1 | | | 4.65 | % | | | 2.58 | % | | | 5.13 | % | | | (0.24 | )% | | | 9.27 | % |
Ratios to average net assets (annualized) | | | | | | | | | | | | | | | | | | | | |
Gross expenses | | | 1.71 | % | | | 1.69 | % | | | 1.69 | % | | | 1.66 | % | | | 1.65 | % |
Net expenses | | | 1.60 | % | | | 1.60 | % | | | 1.60 | % | | | 1.60 | % | | | 1.60 | % |
Net investment income | | | 2.25 | % | | | 2.26 | % | | | 2.56 | % | | | 2.31 | % | | | 2.59 | % |
Supplemental data | | | | | | | | | | | | | | | | | | | | |
Portfolio turnover rate | | | 7 | % | | | 12 | % | | | 15 | % | | | 15 | % | | | 48 | % |
Net assets, end of period (000s omitted) | | | $6,121 | | | | $4,431 | | | | $4,566 | | | | $5,164 | | | | $5,523 | |
| 1 | Total return calculations do not include any sales charges. |
The accompanying notes are an integral part of these financial statements.
| | | | | | |
| Financial highlights | | Wells Fargo North Carolina Tax-Free Fund | | | 17 | |
(For a share outstanding throughout each period)
| | | | | | | | | | | | | | | | | | | | |
| | | Year ended June 30 | |
| INSTITUTIONAL CLASS | | 2016 | | | 2015 | | | 2014 | | | 2013 | | | 2012 | |
Net asset value, beginning of period | | | $10.36 | | | | $10.33 | | | | $10.08 | | | | $10.34 | | | | $9.71 | |
Net investment income | | | 0.35 | | | | 0.35 | | | | 0.36 | | | | 0.35 | | | | 0.37 | |
Net realized and unrealized gains (losses) on investments | | | 0.24 | | | | 0.03 | | | | 0.26 | | | | (0.26 | ) | | | 0.63 | |
| | | | | | | | | | | | | | | | | | | | |
Total from investment operations | | | 0.59 | | | | 0.38 | | | | 0.62 | | | | 0.09 | | | | 1.00 | |
Distributions to shareholders from | | | | | | | | | | | | | | | | | | | | |
Net investment income | | | (0.35 | ) | | | (0.35 | ) | | | (0.37 | ) | | | (0.35 | ) | | | (0.37 | ) |
Net asset value, end of period | | | $10.60 | | | | $10.36 | | | | $10.33 | | | | $10.08 | | | | $10.34 | |
Total return | | | 5.76 | % | | | 3.67 | % | | | 6.25 | % | | | 0.82 | % | | | 10.43 | % |
Ratios to average net assets (annualized) | | | | | | | | | | | | | | | | | | | | |
Gross expenses | | | 0.63 | % | | | 0.61 | % | | | 0.61 | % | | | 0.58 | % | | | 0.57 | % |
Net expenses | | | 0.54 | % | | | 0.54 | % | | | 0.54 | % | | | 0.54 | % | | | 0.54 | % |
Net investment income | | | 3.32 | % | | | 3.32 | % | | | 3.61 | % | | | 3.37 | % | | | 3.65 | % |
Supplemental data | | | | | | | | | | | | | | | | | | | | |
Portfolio turnover rate | | | 7 | % | | | 12 | % | | | 15 | % | | | 15 | % | | | 48 | % |
Net assets, end of period (000s omitted) | | | $62,793 | | | | $60,844 | | | | $72,479 | | | | $77,926 | | | | $90,439 | |
The accompanying notes are an integral part of these financial statements.
| | | | |
| 18 | | Wells Fargo North Carolina Tax-Free Fund | | Notes to financial statements |
1. ORGANIZATION
Wells Fargo Funds Trust (the “Trust”), a Delaware statutory trust organized on March 10, 1999, is an open-end management investment company registered under the Investment Company Act of 1940, as amended (the “1940 Act”). As an investment company, the Trust follows the accounting and reporting guidance in Financial Accounting Standards Board (“FASB”) Accounting Standards Codification Topic 946, Financial Services – Investment Companies. These financial statements report on the Wells Fargo North Carolina Tax-Free Fund (the “Fund”) which is a non-diversified series of the Trust.
2. SIGNIFICANT ACCOUNTING POLICIES
The following significant accounting policies, which are consistently followed in the preparation of the financial statements of the Fund, are in conformity with U.S. generally accepted accounting principles which require management to make estimates and assumptions that affect the reported amounts of assets and liabilities, disclosure of contingent assets and liabilities at the date of the financial statements, and the reported amounts of revenues and expenses during the reporting period. Actual results could differ from those estimates.
Securities valuation
All investments are valued each business day as of the close of regular trading on the New York Stock Exchange (generally 4 p.m. Eastern Time), although a Fund may deviate from this calculation time under unusual or unexpected circumstances.
Debt securities are valued at the evaluated bid price provided by an independent pricing service or, if a reliable price is not available, the quoted bid price from an independent broker-dealer.
Investments in registered open-end investment companies are valued at net asset value.
Investments which are not valued using any of the methods discussed above are valued at their fair value, as determined in good faith by the Board of Trustees of the Fund. The Board of Trustees has established a Valuation Committee comprised of the Trustees and has delegated to it the authority to take any actions regarding the valuation of portfolio securities that the Valuation Committee deems necessary or appropriate, including determining the fair value of portfolio securities, unless the determination has been delegated to the Management Valuation Team of Wells Fargo Funds Management, LLC (“Funds Management”). The Board of Trustees retains the authority to make or ratify any valuation decisions or approve any changes to the Valuation Procedures as it deems appropriate. On a quarterly basis, the Board of Trustees receives reports on any valuation actions taken by the Valuation Committee or the Management Valuation Team which may include items for ratification.
Valuations of fair valued securities are compared to the next actual sales price when available, or other appropriate market values, to assess the continued appropriateness of the fair valuation methodologies used. These securities are fair valued on a day-to-day basis, taking into consideration changes to appropriate market information and any significant changes to the inputs considered in the valuation process until there is a readily available price provided on an exchange or by an independent pricing service. Valuations received from an independent pricing service or independent broker-dealer quotes are periodically validated by comparisons to most recent trades and valuations provided by other independent pricing services in addition to the review of prices by the manager and/or subadviser. Unobservable inputs used in determining fair valuations are identified based on the type of security, taking into consideration factors utilized by market participants in valuing the investment, knowledge about the issuer and the current market environment.
Security transactions and income recognition
Securities transactions are recorded on a trade date basis. Realized gains or losses are recorded on the basis of identified cost.
Interest income is accrued daily and bond discounts are accreted and premiums are amortized daily based on the effective interest method. To the extent debt obligations are placed on non-accrual status, any related interest income may be reduced by writing off interest receivables when the collection of all or a portion of interest has become doubtful based on consistently applied procedures. If the issuer subsequently resumes interest payments or when the collectability of interest is reasonably assured, the debt obligation is removed from non-accrual status.
Distributions to shareholders
Distributions to shareholders from net investment income are accrued daily and paid monthly. Distributions from net realized gains, if any, are recorded on the ex-dividend date. Such distributions are determined in conformity with federal income tax regulations, which may differ in amount or character from net investment income and realized gains recognized for purposes of U.S. generally accepted accounting principles.
| | | | | | |
| Notes to financial statements | | Wells Fargo North Carolina Tax-Free Fund | | | 19 | |
Federal and other taxes
The Fund intends to continue to qualify as a regulated investment company by distributing substantially all of its investment company taxable and tax-exempt income and any net realized capital gains (after reduction for capital loss carryforwards) sufficient to relieve it from all, or substantially all, federal income taxes. Accordingly, no provision for federal income taxes was required.
The Fund’s income and federal excise tax returns and all financial records supporting those returns for the prior three fiscal years are subject to examination by the federal and Delaware revenue authorities. Management has analyzed the Fund’s tax positions taken on federal, state, and foreign tax returns for all open tax years and does not believe that there are any uncertain tax positions that require recognition of a tax liability.
Capital loss carryforwards that do not expire are required to be utilized prior to capital loss carryforwards that expire. As of June 30, 2016, capital loss carryforwards available to offset future net realized capital gains were as follows through the indicated expiration dates:
| | | | |
| | | | | No expiration |
| 2017 | | 2018 | | Long-term |
| $6,610,328 | | $3,623,438 | | $21,451 |
As of June 30, 2016, the Fund had current year deferred post-October capital losses consisting of $34,248 in long-term losses which will be recognized on the first day of the following fiscal year.
Class allocations
The separate classes of shares offered by the Fund differ principally in applicable sales charges, distribution, shareholder servicing, and administration fees. Class specific expenses are charged directly to that share class. Investment income, common expenses, and realized and unrealized gains (losses) on investments are allocated daily to each class of shares based on the relative proportion of net assets of each class.
3. FAIR VALUATION MEASUREMENTS
Fair value measurements of investments are determined within a framework that has established a fair value hierarchy based upon the various data inputs utilized in determining the value of the Fund’s investments. The three-level hierarchy gives the highest priority to unadjusted quoted prices in active markets for identical assets or liabilities (Level 1) and the lowest priority to significant unobservable inputs (Level 3). The Fund’s investments are classified within the fair value hierarchy based on the lowest level of input that is significant to the fair value measurement. The inputs are summarized into three broad levels as follows:
| n | | Level 1 – quoted prices in active markets for identical securities |
| n | | Level 2 – other significant observable inputs (including quoted prices for similar securities, interest rates, prepayment speeds, credit risk, use of amortized cost, etc.) |
| n | | Level 3 – significant unobservable inputs (including the Fund’s own assumptions in determining the fair value of investments) |
The inputs or methodologies used for valuing investments in securities are not necessarily an indication of the risk associated with investing in those securities.
| | | | |
| 20 | | Wells Fargo North Carolina Tax-Free Fund | | Notes to financial statements |
The following is a summary of the inputs used in valuing the Fund’s assets and liabilities as of June 30, 2016:
| | | | | | | | | | | | | | | | |
| | | Quoted prices
(Level 1) | | | Other significant
observable inputs (Level 2) | | | Significant
unobservable inputs (Level 3) | | | Total | |
Assets | | | | | | | | | | | | | | | | |
Investments in: | | | | | | | | | | | | | | | | |
| | | | |
Municipal obligations | | $ | 0 | | | $ | 104,469,168 | | | $ | 0 | | | $ | 104,469,168 | |
| | | | |
Short-term investments | | | | | | | | | | | | | | | | |
Investment companies | | | 143,783 | | | | 0 | | | | 0 | | | | 143,783 | |
Total assets | | $ | 143,783 | | | $ | 104,469,168 | | | $ | 0 | | | $ | 104,612,951 | |
The Fund recognizes transfers between levels within the fair value hierarchy at the end of the reporting period. At June 30, 2016, the Fund did not have any transfers into/out of Level 1, Level 2, or Level 3.
4. TRANSACTIONS WITH AFFILIATES
Management fee
Funds Management, an indirect wholly owned subsidiary of Wells Fargo & Company (“Wells Fargo”), is the manager of the Fund and provides advisory and fund-level administrative services under an investment management agreement. Under the investment management agreement, Funds Management is responsible for, among other services, implementing the investment objectives and strategies of the Fund, supervising the subadviser, providing fund-level administrative services in connection with the Fund’s operations, and providing any other fund-level administrative services reasonably necessary for the operation of the Fund. As compensation for its services under the investment management agreement, Funds Management is entitled to receive an annual management fee starting at 0.40% and declining to 0.28% as the average daily net assets of the Fund increase. For the year ended June 30, 2016, the management fee was equivalent to an annual rate of 0.40% of the Fund’s average daily net assets.
Funds Management has retained the services of a subadviser to provide daily portfolio management to the Fund. The fee for subadvisory services is borne by Funds Management. Wells Capital Management Incorporated, an affiliate of Funds Management and an indirect wholly owned subsidiary of Wells Fargo, is the subadviser to the Fund and is entitled to receive a fee from Funds Management at an annual rate starting at 0.20% and declining to 0.10% as the average daily net assets of the Fund increase.
Administration fees
Under a class-level administration agreement, Funds Management provides class-level administrative services to the Fund, which includes paying fees and expenses for services provided by the transfer agent, sub-transfer agents, omnibus account servicers and record-keepers. As compensation for its services under the class-level administration agreement, Funds Management receives an annual fee which is calculated based on the average daily net assets of each class as follows:
| | | | |
| | | Class-level
administration fee | |
Class A, Class C | | | 0.16 | % |
Institutional Class | | | 0.08 | |
Funds Management has contractually waived and/or reimbursed management and administration fees to the extent necessary to maintain certain net operating expense ratios for the Fund. Waiver of fees and/or reimbursement of expenses by Funds Management were made first from fund level expenses on a proportionate basis and then from class specific expenses. Funds Management has committed through October 31, 2016 to waive fees and/or reimburse expenses to the extent necessary to cap the Fund’s expenses at 0.85% for Class A shares, 1.60% for Class C shares, and 0.54% for Institutional Class shares. After this time, the cap may be increased or the commitment to maintain the cap may be terminated only with the approval of the Board of Trustees.
Distribution fee
The Trust has adopted a distribution plan for Class C shares of the Fund pursuant to Rule 12b-1 under the 1940 Act. A distribution fee is charged to Class C shares and paid to Wells Fargo Funds Distributor, LLC (“Funds Distributor”), the principal underwriter, at an annual rate of 0.75% of the average daily net assets of Class C shares.
| | | | | | |
| Notes to financial statements | | Wells Fargo North Carolina Tax-Free Fund | | | 21 | |
In addition, Funds Distributor is entitled to receive the front-end sales charge from the purchase of Class A shares and a contingent deferred sales charge on the redemption of certain Class A shares. Funds Distributor is also entitled to receive the contingent deferred sales charges from redemptions of Class C shares. For the year ended June 30, 2016, Funds Distributor received $3,365 from the sale of Class A shares.
Shareholder servicing fees
The Trust has entered into contracts with one or more shareholder servicing agents, whereby Class A and Class C of the Fund are charged a fee at an annual rate of 0.25% of the average daily net assets of each respective class.
A portion of these total shareholder servicing fees were paid to affiliates of Wells Fargo.
5. INVESTMENT PORTFOLIO TRANSACTIONS
Purchases and sales of investments, excluding U.S. government obligations (if any) and short-term securities, for the year ended June 30, 2016 were $11,242,248 and $6,639,692, respectively.
The Fund may purchase or sell investment securities to other Wells Fargo funds under procedures adopted by the Board of Trustees. The procedures have been designed to ensure that these interfund transactions, which generally do not incur broker commissions, are effected at current market prices. Interfund trades are included within the respective purchases and sales amounts shown.
6. BANK BORROWINGS
The Trust (excluding the money market funds and certain other funds) and Wells Fargo Variable Trust are parties to a $200,000,000 revolving credit agreement whereby the Fund is permitted to use bank borrowings for temporary or emergency purposes, such as to fund shareholder redemption requests. Interest under the credit agreement is charged to the Fund based on a borrowing rate equal to the higher of the Federal Funds rate in effect on that day plus 1.25% or the overnight LIBOR rate in effect on that day plus 1.25%. In addition, an annual commitment fee equal to 0.20% of the unused balance is allocated to each participating fund. Prior to September 1, 2015, the revolving credit agreement amount was $150,000,000 and the annual commitment fee was equal to 0.10% of the unused balance which was allocated to each participating fund.
For the year ended June 30, 2016, there were no borrowings by the Fund under the agreement.
7. DISTRIBUTIONS TO SHAREHOLDERS
The tax character of distributions paid during the years ended June 30, 2016 and June 30, 2015 were as follows:
| | | | | | | | |
| | | Year ended June 30 | |
| | | 2016 | | | 2015 | |
Tax-exempt income | | $ | 3,164,807 | | | $ | 3,345,284 | |
As of June 30, 2016, the components of distributable earnings on a tax basis were as follows:
| | | | | | |
Undistributed tax-exempt income | | Unrealized gains | | Post-October capital losses deferred | | Capital loss carryforward |
| $84,678 | | $9,496,581 | | $(34,248) | | $(10,255,217) |
8. CONCENTRATION RISK
The Fund invests a substantial portion of its assets in issuers of municipal debt securities located in a single state or territories of the U.S. Therefore, it may be more affected by economic and political developments in that state or region than would be a comparable general tax-exempt fund.
9. INDEMNIFICATION
Under the Trust’s organizational documents, the officers and Trustees have been granted certain indemnification rights against certain liabilities that may arise out of performance of their duties to the Trust. Additionally, in the normal course of business, the Trust may enter into contracts with service providers that contain a variety of indemnification clauses. The Trust’s maximum exposure under these arrangements is dependent on future claims that may be made against the Fund and, therefore, cannot be estimated.
| | | | |
| 22 | | Wells Fargo North Carolina Tax-Free Fund | | Report of independent registered public accounting firm |
BOARD OF TRUSTEES AND SHAREHOLDERS OF WELLS FARGO FUNDS TRUST:
We have audited the accompanying statement of assets and liabilities, including the portfolio of investments, of the Wells Fargo North Carolina Tax-Free Fund (formerly known as Wells Fargo Advantage North Carolina Tax-Free Fund) (the “Fund”), one of the funds constituting the Wells Fargo Funds Trust, as of June 30, 2016, and the related statement of operations for the year then ended, the statements of changes in net assets for each of the years in the two-year period then ended, and the financial highlights for each of the years in the five-year period then ended. These financial statements and financial highlights are the responsibility of the Fund’s management. Our responsibility is to express an opinion on these financial statements and financial highlights based on our audits.
We conducted our audits in accordance with the standards of the Public Company Accounting Oversight Board (United States). Those standards require that we plan and perform the audit to obtain reasonable assurance about whether the financial statements and financial highlights are free of material misstatement. An audit includes examining, on a test basis, evidence supporting the amounts and disclosures in the financial statements. Our procedures included confirmation of securities owned as of June 30, 2016, by correspondence with custodians and brokers, or by other appropriate auditing procedures. An audit also includes assessing the accounting principles used and significant estimates made by management, as well as evaluating the overall financial statement presentation. We believe that our audits provide a reasonable basis for our opinion.
In our opinion, the financial statements and financial highlights referred to above present fairly, in all material respects, the financial position of the Wells Fargo North Carolina Tax-Free Fund as of June 30, 2016, and the results of its operations for the year then ended, the changes in its net assets for each of the years in the two-year period then ended, and the financial highlights for each of the years in the five-year period then ended, in conformity with U.S. generally accepted accounting principles.

Boston, Massachusetts
August 25, 2016
| | | | | | |
| Other information (unaudited) | | Wells Fargo North Carolina Tax-Free Fund | | | 23 | |
TAX INFORMATION
Pursuant to Section 852 of the Internal Revenue Code, 100% of distributions paid from net investment income is designated as exempt-interest dividends for the fiscal year ended June 30, 2016.
PROXY VOTING INFORMATION
A description of the policies and procedures that the Fund uses to determine how to vote proxies relating to portfolio securities is available, upon request, by calling 1-800-222-8222, visiting our website at wellsfargofunds.com, or visiting the SEC website at sec.gov. Information regarding how the Fund voted proxies relating to portfolio securities during the most recent 12-month period ended June 30 is available on the Fund’s website at wellsfargofunds.com or by visiting the SEC website at sec.gov.
PORTFOLIO HOLDINGS INFORMATION
The complete portfolio holdings for the Fund are publicly available monthly on the Fund’s website (wellsfargofunds.com), on a one-month delayed basis. In addition, top ten holdings information (excluding derivative positions) for the Fund is publicly available on the Fund’s website on a monthly, seven-day or more delayed basis. The Fund files its complete schedule of portfolio holdings with the SEC for the first and third quarters of each fiscal year on Form N-Q, which is available by visiting the SEC website at sec.gov. In addition, the Fund’s Form N-Q may be reviewed and copied at the SEC’s Public Reference Room in Washington, DC, and at regional offices in New York City, at 233 Broadway, and in Chicago, at 175 West Jackson Boulevard, Suite 900. Information about the Public Reference Room may be obtained by calling 1-800-SEC-0330.
| | | | |
| 24 | | Wells Fargo North Carolina Tax-Free Fund | | Other information (unaudited) |
BOARD OF TRUSTEES AND OFFICERS
Each of the Trustees and Officers1 listed in the table below acts in identical capacities for each fund in the Wells Fargo family of funds, which consists of 142 mutual funds comprising the Wells Fargo Funds Trust, Wells Fargo Variable Trust, Wells Fargo Master Trust and four closed-end funds (collectively the “Fund Complex”). This table should be read in conjunction with the Prospectus and the Statement of Additional Information2. The mailing address of each Trustee and Officer is 525 Market Street, 12th Floor, San Francisco, CA 94105. Each Trustee and Officer serves an indefinite term, however, each Trustee serves such term until reaching the mandatory retirement age established by the Trustees.
Independent Trustees
| | | | | | |
Name and year of birth | | Position held and length of service* | | Principal occupations during past five years or longer | | Current other public
company or
investment company
directorships |
William R. Ebsworth (Born 1957) | | Trustee, since 2015 | | Retired. From 1984 to 2013, equities analyst, portfolio manager, research director and chief financial officer at Fidelity Management and Research Company in Boston, Tokyo, and Hong Kong and retired in 2013 as Chief Investment Officer of Fidelity Strategic Advisers, Inc. where he lead a team of investment professionals managing client assets. Prior thereto, Board member of Hong Kong Securities Clearing Co., Hong Kong Options Clearing Corp., the Thailand International Fund, Ltd., Fidelity Investments Life Insurance Company, and Empire Fidelity Investments Life Insurance Company. Mr. Ebsworth is a CFA® charterholder and an Adjunct Lecturer, Finance, at Babson College. | | Asset Allocation Trust |
| Jane A. Freeman (Born 1953) | | Trustee, since 2015 | | Retired. From 2012 to 2014 and 1999 to 2008, Chief Financial Officer of Scientific Learning Corporation. From 2008 to 2012, Ms. Freeman provided consulting services related to strategic business projects. Prior to 1999, Portfolio Manager at Rockefeller & Co. and Scudder, Stevens & Clark. Board member of the Harding Loevner Funds from 1996 to 2014, serving as both Lead Independent Director and chair of the Audit Committee. Board member of the Russell Exchange Traded Funds Trust from 2011 to 2012 and the chair of the Audit Committee. Ms. Freeman is Chair of Taproot Foundation (non-profit organization), a Board Member of Ruth Bancroft Garden (non-profit organization) and an inactive chartered financial analyst. | | Asset Allocation Trust |
| Peter G. Gordon (Born 1942) | | Trustee, since 1998; Chairman, since 2005 | | Co-Founder, Retired Chairman, President and CEO of Crystal Geyser Water Company. Trustee Emeritus, Colby College. | | Asset Allocation Trust |
| Isaiah Harris, Jr. (Born 1952) | | Trustee, since 2009 | | Retired. Chairman of the Board of CIGNA Corporation since 2009, and Director since 2005. From 2003 to 2011, Director of Deluxe Corporation. Prior thereto, President and CEO of BellSouth Advertising and Publishing Corp. from 2005 to 2007, President and CEO of BellSouth Enterprises from 2004 to 2005 and President of BellSouth Consumer Services from 2000 to 2003. Emeritus member of the Iowa State University Foundation Board of Governors. Emeritus Member of the Advisory Board of Iowa State University School of Business. Advisory Board Member, Palm Harbor Academy (charter school). Advisory Board Member, Child Evangelism Fellowship (non-profit). Mr. Harris is a certified public accountant (inactive status). | | CIGNA Corporation; Asset Allocation Trust |
| Judith M. Johnson (Born 1949) | | Trustee, since 2008; Audit Committee Chairman, since 2008 | | Retired. Prior thereto, Chief Executive Officer and Chief Investment Officer of Minneapolis Employees Retirement Fund from 1996 to 2008. Ms. Johnson is an attorney, certified public accountant and a certified managerial accountant. | | Asset Allocation Trust |
| David F. Larcker (Born 1950) | | Trustee, since 2009 | | James Irvin Miller Professor of Accounting at the Graduate School of Business, Stanford University, Director of the Corporate Governance Research Initiative and Senior Faculty of The Rock Center for Corporate Governance since 2006. From 2005 to 2008, Professor of Accounting at the Graduate School of Business, Stanford University. Prior thereto, Ernst & Young Professor of Accounting at The Wharton School, University of Pennsylvania from 1985 to 2005. | | Asset Allocation Trust |
| | | | | | |
| Other information (unaudited) | | Wells Fargo North Carolina Tax-Free Fund | | | 25 | |
| | | | | | |
Name and year of birth | | Position held and length of service* | | Principal occupations during past five years or longer | | Current other public
company or
investment company
directorships |
| Olivia S. Mitchell (Born 1953) | | Trustee, since 2006 | | International Foundation of Employee Benefit Plans Professor, Wharton School of the University of Pennsylvania since 1993. Director of Wharton’s Pension Research Council and Boettner Center on Pensions & Retirement Research, and Research Associate at the National Bureau of Economic Research. Previously, Cornell University Professor from 1978 to 1993. | | Asset Allocation Trust |
| Timothy J. Penny (Born 1951) | | Trustee, since 1996 | | President and Chief Executive Officer of Southern Minnesota Initiative Foundation, a non-profit organization, since 2007 and Senior Fellow at the Humphrey Institute Policy Forum at the University of Minnesota since 1995. Member of the Board of Trustees of NorthStar Education Finance, Inc., a non-profit organization, since 2007. | | Asset Allocation Trust |
| Michael S. Scofield (Born 1943) | | Trustee, since 2010 | | Served on the Investment Company Institute’s Board of Governors and Executive Committee from 2008-2011 as well the Governing Council of the Independent Directors Council from 2006-2011 and the Independent Directors Council Executive Committee from 2008-2011. Chairman of the IDC from 2008-2010. Institutional Investor (Fund Directions) Trustee of Year in 2007. Trustee of the Evergreen Funds complex (and its predecessors) from 1984 to 2010. Chairman of the Evergreen Funds from 2000-2010. Former Trustee of the Mentor Funds. Retired Attorney, Law Offices of Michael S. Scofield. | | Asset Allocation Trust |
| * | Length of service dates reflect the Trustee’s commencement of service with the Trust’s predecessor entities, where applicable. |
Officers
| | | | | | |
Name and year of birth | | Position held and
length of service | | Principal occupations during past five years or longer | | |
| Karla M. Rabusch (Born 1959) | | President, since 2003 | | Executive Vice President of Wells Fargo Bank, N.A. and President of Wells Fargo Funds Management, LLC since 2003. | | |
Nancy Wiser1 (Born 1967) | | Treasurer, since 2012 | | Executive Vice President of Wells Fargo Funds Management, LLC since 2011. Chief Operating Officer and Chief Compliance Officer at LightBox Capital Management LLC, from 2008 to 2011. | | |
| C. David Messman (Born 1960) | | Secretary, since 2000; Chief Legal Officer, since 2003 | | Senior Vice President and Secretary of Wells Fargo Funds Management, LLC since 2001. Assistant General Counsel of Wells Fargo Bank, N.A. since 2013 and Vice President and Managing Counsel of Wells Fargo Bank, N.A. from 1996 to 2013. | | |
| Michael Whitaker (Born 1967) | | Chief Compliance Officer, since 2016* | | Executive Vice President of Wells Fargo Funds Management, LLC since 2016. Chief Compliance Officer of Fidelity’s Fixed Income Funds and Asset Allocation Funds from 2008 to 2016, Compliance Officer of FMR Co., Inc. from 2014 to 2016, Fidelity Investments Money Management, Inc. from 2014 to 2016, Fidelity Investments from 2007 to 2016. | | |
David Berardi (Born 1975) | | Assistant Treasurer, since 2009 | | Vice President of Wells Fargo Funds Management, LLC since 2009. Vice President of Evergreen Investment Management Company, LLC from 2008 to 2010. Manager of Fund Reporting and Control for Evergreen Investment Management Company, LLC from 2004 to 2010. | | |
| Jeremy DePalma1 (Born 1974) | | Assistant Treasurer, since 2009 | | Senior Vice President of Wells Fargo Funds Management, LLC since 2009. Senior Vice President of Evergreen Investment Management Company, LLC from 2008 to 2010 and head of the Fund Reporting and Control Team within Fund Administration from 2005 to 2010. | | |
| 1 | Nancy Wiser acts as Treasurer of 73 funds in the Fund Complex. Jeremy DePalma acts as Treasurer of 69 funds and Assistant Treasurer of 73 funds in the Fund Complex. |
| 2 | The Statement of Additional Information includes additional information about the Trustees and is available, without charge, upon request, by calling 1-800-222-8222 or by visiting the website at wellsfargofunds.com. |
| * | Michael Whitaker became Chief Compliance Officer effective May 16, 2016. |
| | | | |
| 26 | | Wells Fargo North Carolina Tax-Free Fund | | Other information (unaudited) |
BOARD CONSIDERATION OF INVESTMENT MANAGEMENT AND SUB-ADVISORY AGREEMENTS:
Under the Investment Company Act of 1940 (the “1940 Act”), the Board of Trustees (the “Board”) of Wells Fargo Funds Trust (the “Trust”) must determine annually whether to approve the continuation of the Trust’s investment management and sub-advisory agreements. In this regard, at an in-person meeting held on May 24-25, 2016 (the “Meeting”), the Board, all the members of which have no direct or indirect interest in the investment management and sub-advisory agreements and are not “interested persons” of the Trust, as defined in the 1940 Act (the “Independent Trustees”), reviewed and approved for Wells Fargo North Carolina Tax-Free Fund (the “Fund”): (i) an investment management agreement (the “Management Agreement”) with Wells Fargo Funds Management, LLC (“Funds Management”); and (ii) an investment sub-advisory agreement (the “Sub-Advisory Agreement”) with Wells Capital Management Incorporated (the “Sub-Adviser”), an affiliate of Funds Management. The Management Agreement and the Sub-Advisory Agreement are collectively referred to as the “Advisory Agreements.”
At the Meeting, the Board considered the factors and reached the conclusions described below relating to the selection of Funds Management and the Sub-Adviser and the approval of the Advisory Agreements. Prior to the Meeting, including at an in-person meeting in April 2016, the Trustees conferred extensively among themselves and with representatives of Funds Management about these matters. Also, the Board has adopted a team-based approach, with each team consisting of a sub-set of Trustees, to assist the full Board in the discharge of its duties in reviewing performance and other matters throughout the year. The Independent Trustees were assisted in their evaluation of the Advisory Agreements by independent legal counsel, from whom they received separate legal advice and with whom they met separately.
In providing information to the Board, Funds Management and the Sub-Adviser were guided by a detailed set of requests for information submitted to them by independent legal counsel on behalf of the Independent Trustees at the start of the Board’s annual contract renewal process earlier in 2016. In considering and approving the Advisory Agreements, the Trustees considered the information they believed relevant, including but not limited to the information discussed below. The Board considered not only the specific information presented in connection with the Meeting, but also the knowledge gained over time through interaction with Funds Management and the Sub-Adviser about various topics. In this regard, the Board reviewed reports of Funds Management at each of its quarterly meetings, which included, among other things, portfolio reviews and performance reports. In addition, the Board and the teams mentioned above confer with portfolio managers at various times throughout the year. The Board did not identify any particular information or consideration that was all-important or controlling, and each individual Trustee may have attributed different weights to various factors.
After its deliberations, the Board unanimously approved the continuation of the Advisory Agreements for a one-year term and determined that the compensation payable to Funds Management and the Sub-Adviser under each of the Advisory Agreements was reasonable. The Board considered the approval of the Advisory Agreements for the Fund as part of its consideration of agreements for funds across the complex, but its approvals were made on a fund-by-fund basis. The following summarizes a number of important, but not necessarily all, factors considered by the Board in support of its approvals.
Nature, extent and quality of services
The Board received and considered various information regarding the nature, extent and quality of services provided to the Fund by Funds Management and the Sub-Adviser under the Advisory Agreements. This information included a description of the investment advisory services and Fund-level administrative services covered by the Management Agreement, as well as, among other things, a summary of the background and experience of senior management of Funds Management, and the qualifications, background, tenure and responsibilities of each of the portfolio managers primarily responsible for the day-to-day portfolio management of the Fund.
The Board evaluated the ability of Funds Management and the Sub-Adviser to attract and retain qualified investment professionals, including research, advisory and supervisory personnel. The Board further considered the compliance programs and compliance records of Funds Management and the Sub-Adviser. In addition, the Board took into account the full range of services provided to the Fund by Funds Management and its affiliates.
Fund performance and expenses
The Board considered the performance results for the Fund over various time periods ended December 31, 2015. The Board considered these results in comparison to the performance of funds in a universe that was determined by Broadridge Inc. (“Broadridge”) to be similar to the Fund (the “Universe”), and in comparison to the Fund’s benchmark index and to other comparative data. Broadridge is an independent provider of investment company data. The Board received a description of the methodology used by Broadridge to select the mutual funds in the performance Universe.
| | | | | | |
| Other information (unaudited) | | Wells Fargo North Carolina Tax-Free Fund | | | 27 | |
The Board noted that the performance of the Fund (Class A) was higher than or in range of the average performance of the Universe for all periods under review. The Board also noted that the performance of the Fund was in range of its benchmark, the Barclays Municipal Bond Index, for all periods under review except the one, five and ten-year periods.
The Board also received and considered information regarding the Fund’s net operating expense ratios and their various components, including actual management fees, custodian and other non-management fees, and Rule 12b-1 and non-Rule 12b-1 shareholder service fees. The Board considered these ratios in comparison to the median ratios of funds in class-specific expense groups that were determined by Broadridge to be similar to the Fund (the “Groups”). The Board received a description of the methodology used by Broadridge to select the mutual funds in the expense Groups and an explanation of how funds comprising expense groups and their expense ratios may vary from year-to-year. Based on the Broadridge reports, the Board noted that the net operating expense ratios of the Fund were lower than or in range of the median net operating expense ratios of the expense Groups.
The Board took into account the Fund performance and expense information provided to it among the factors considered in deciding to re-approve the Advisory Agreements.
Investment management and sub-advisory fee rates
The Board reviewed and considered the contractual fee rates payable by the Fund to Funds Management under the Management Agreement, as well as the contractual fee rates payable by the Fund to Funds Management for class-level administrative services under a Class-Level Administration Agreement, which include class-level transfer agency and sub-transfer agency costs (collectively, the “Management Rates”). The Board also reviewed and considered the contractual investment sub-advisory fee rates that are payable by Funds Management to the Sub-Adviser for investment sub-advisory services.
Among other information reviewed by the Board was a comparison of the Fund’s Management Rates with the average contractual investment management fee rates of funds in the expense Groups at a common asset level as well as transfer agency costs of the funds in the expense Groups. The Board noted that the Management Rates of the Fund were lower than the sum of these average rates for the Fund’s expense Groups for all share classes.
The Board also received and considered information about the portion of the total management fee that was retained by Funds Management after payment of the fee to the Sub-Adviser for sub-advisory services. In assessing the reasonableness of this amount, the Board received and evaluated information about the nature and extent of responsibilities retained and risks assumed by Funds Management and not delegated to or assumed by the Sub-Adviser, and about Funds Management’s on-going oversight services. However, given the affiliation between Funds Management and the Sub-Adviser, the Board ascribed limited relevance to the allocation of fees between them.
The Board also received and considered information about the nature and extent of services offered and fee rates charged by Funds Management and the Sub-Adviser to other types of clients with investment strategies similar to those of the Fund. In this regard, the Board received information about the significantly greater scope of services, and compliance, reporting and other legal burdens and risks of managing mutual funds compared with those associated with managing assets of non-mutual fund clients such as collective funds or institutional separate accounts.
Based on its consideration of the factors and information it deemed relevant, including those described here, the Board determined that the compensation payable to Funds Management under the Management Agreement and to the Sub-Adviser under the Sub-Advisory Agreement was reasonable, in light of the services covered by the Advisory Agreements.
Profitability
The Board received and considered information concerning the profitability of Funds Management, as well as the profitability of Wells Fargo as a whole, from providing services to the Fund and the fund family as a whole. The Board also received and considered information concerning the profitability of the Sub-Adviser from providing services to the fund family as a whole, noting that the Sub-Adviser’s profitability information with respect to providing services to the Fund was subsumed in the Wells Fargo and Funds Management profitability analysis.
Funds Management reported on the methodologies and estimates used in calculating profitability. Among other things, the Board noted that the levels of profitability reported on a fund-by-fund basis varied widely, depending on factors such as the size and type of fund. Based on its review, the Board did not deem the profits reported by Funds Management or Wells Fargo from its services to the Fund to be at a level that would prevent it from approving the continuation of the Advisory Agreements.
| | | | |
| 28 | | Wells Fargo North Carolina Tax-Free Fund | | Other information (unaudited) |
Economies of scale
With respect to possible economies of scale, the Board noted the existence of breakpoints in the Fund’s management fee structure, which operate generally to reduce the Fund’s expense ratios as the Fund grows in size. It considered that, for a small fund or a fund that shrinks in size, breakpoints conversely can result in higher fee levels. The Board also considered that fee waiver and expense reimbursement arrangements and competitive fee rates at the outset are means of sharing potential economies of scale with shareholders of the Fund and the fund family as a whole. The Board considered Funds Management’s view that any analyses of potential economies of scale in managing a particular fund are inherently limited in light of the joint and common costs and investments that Funds Management incurs across the fund family as a whole.
The Board concluded that the Fund’s fee and expense arrangements, including contractual breakpoints, constituted a reasonable approach to sharing potential economies of scale with the Fund and its shareholders.
Other benefits to Funds Management and the Sub-Adviser
The Board received and considered information regarding potential “fall-out” or ancillary benefits received by Funds Management and its affiliates, including the Sub-Adviser, as a result of their relationships with the Fund. Ancillary benefits could include, among others, benefits directly attributable to other relationships with the Fund and benefits potentially derived from an increase in Funds Management’s and the Sub-Adviser’s business as a result of their relationships with the Fund. The Board noted that various affiliates of Funds Management may receive distribution-related fees, shareholder servicing payments and sub-transfer agency fees in respect of shares sold or held through them and services provided.
The Board also reviewed information about soft dollar credits earned and utilized by the Sub-Adviser, fees earned by Funds Management and the Sub-Adviser from managing a private investment vehicle for the fund family’s securities lending collateral and commissions earned by an affiliated broker from portfolio transactions.
Based on its consideration of the factors and information it deemed relevant, including those described here, the Board did not find that any ancillary benefits received by Funds Management and its affiliates, including the Sub-Adviser, were unreasonable.
Conclusion
At the Meeting, after considering the above-described factors and based on its deliberations and its evaluation of the information described above, the Board unanimously approved the continuation of the Advisory Agreements for a one-year term and determined that the compensation payable to Funds Management and the Sub-Adviser under each of the Advisory Agreements was reasonable.
| | | | | | |
| List of abbreviations | | Wells Fargo North Carolina Tax-Free Fund | | | 29 | |
The following is a list of common abbreviations for terms and entities that may have appeared in this report.
| ACA | — ACA Financial Guaranty Corporation |
| ADR | — American depositary receipt |
| ADS | — American depositary shares |
| AGC | — Assured Guaranty Corporation |
| AGM | — Assured Guaranty Municipal |
| Ambac | — Ambac Financial Group Incorporated |
| AMT | — Alternative minimum tax |
| BAN | — Bond anticipation notes |
| BHAC | — Berkshire Hathaway Assurance Corporation |
| CAB | — Capital appreciation bond |
| CCAB | — Convertible capital appreciation bond |
| CDA | — Community Development Authority |
| CDO | — Collateralized debt obligation |
| DRIVER | — Derivative inverse tax-exempt receipts |
| DW&P | — Department of Water & Power |
| DWR | — Department of Water Resources |
| ECFA | — Educational & Cultural Facilities Authority |
| EDA | — Economic Development Authority |
| EDFA | — Economic Development Finance Authority |
| ETF | — Exchange-traded fund |
| FDIC | — Federal Deposit Insurance Corporation |
| FFCB | — Federal Farm Credit Banks |
| FGIC | — Financial Guaranty Insurance Corporation |
| FHA | — Federal Housing Administration |
| FHLB | — Federal Home Loan Bank |
| FHLMC | — Federal Home Loan Mortgage Corporation |
| FICO | — The Financing Corporation |
| FNMA | — Federal National Mortgage Association |
| GDR | — Global depositary receipt |
| GNMA | — Government National Mortgage Association |
| HCFR | — Healthcare facilities revenue |
| HEFA | — Health & Educational Facilities Authority |
| HEFAR | — Higher education facilities authority revenue |
| HFA | — Housing Finance Authority |
| HFFA | — Health Facilities Financing Authority |
| HUD | — Department of Housing and Urban Development |
| IDA | — Industrial Development Authority |
| IDAG | — Industrial Development Agency |
| KRW | — Republic of Korea won |
| LIBOR | — London Interbank Offered Rate |
| LIFER | — Long Inverse Floating Exempt Receipts |
| LLC | — Limited liability company |
| LLLP | — Limited liability limited partnership |
| LLP | — Limited liability partnership |
| MBIA | — Municipal Bond Insurance Association |
| MFHR | — Multifamily housing revenue |
| MSTR | — Municipal securities trust receipts |
| MUD | — Municipal Utility District |
| National | — National Public Finance Guarantee Corporation |
| PCFA | — Pollution Control Financing Authority |
| PCL | — Public Company Limited |
| PCR | — Pollution control revenue |
| PFA | — Public Finance Authority |
| PFFA | — Public Facilities Financing Authority |
| PFOTER | — Puttable floating option tax-exempt receipts |
| plc | — Public limited company |
| PUTTER | — Puttable tax-exempt receipts |
| R&D | — Research & development |
| Radian | — Radian Asset Assurance |
| RAN | — Revenue anticipation notes |
| RDA | — Redevelopment Authority |
| RDFA | — Redevelopment Finance Authority |
| REIT | — Real estate investment trust |
| ROC | — Reset option certificates |
| SAVRS | — Select auction variable rate securities |
| SBA | — Small Business Authority |
| SDR | — Swedish depositary receipt |
| SFHR | — Single-family housing revenue |
| SFMR | — Single-family mortgage revenue |
| SPA | — Standby purchase agreement |
| SPDR | — Standard & Poor’s Depositary Receipts |
| SPEAR | — Short Puttable Exempt Adjustable Receipts |
| STRIPS | — Separate trading of registered interest and |
| TAN | — Tax anticipation notes |
| TIPS | — Treasury inflation-protected securities |
| TRAN | — Tax revenue anticipation notes |
| TTFA | — Transportation Trust Fund Authority |
| TVA | — Tennessee Valley Authority |
This page is intentionally left blank.
This page is intentionally left blank.
This page is intentionally left blank.

For more information
More information about Wells Fargo Funds is available free upon request. To obtain literature, please write, email, visit the Fund’s website, or call:
Wells Fargo Funds
P.O. Box 8266
Boston, MA 02266-8266
Email: fundservice@wellsfargo.com
Website: wellsfargofunds.com
Individual investors: 1-800-222-8222
Retail investment professionals: 1-888-877-9275
Institutional investment professionals: 1-866-765-0778
This report and the financial statements contained herein are submitted for the general information of the shareholders of the Fund. If this report is used for promotional purposes, distribution of the report must be accompanied or preceded by a current prospectus. Before investing, please consider the investment objectives, risks, charges, and expenses of the investment. For a current prospectus and, if available, a summary prospectus, containing this information, call 1-800-222-8222 or visit the Fund’s website at wellsfargofunds.com. Read the prospectus carefully before you invest or send money.
Wells Fargo Asset Management (WFAM) is a trade name used by the asset management businesses of Wells Fargo & Company. Wells Fargo Funds Management, LLC, a wholly owned subsidiary of Wells Fargo & Company, provides investment advisory and administrative services for Wells Fargo Funds. Other affiliates of Wells Fargo & Company provide subadvisory and other services for the funds. The funds are distributed by Wells Fargo Funds Distributor, LLC, Member FINRA, an affiliate of Wells Fargo & Company.
NOT FDIC INSURED ¡ NO BANK GUARANTEE ¡ MAY LOSE VALUE
© 2016 Wells Fargo Funds Management, LLC. All rights reserved.
| | |
 | | 244407 08-16 A254/AR254 6-16 |
Annual Report
June 30, 2016

Wells Fargo
Pennsylvania Tax-Free Fund


Reduce clutter. Save trees.
Sign up for electronic delivery of prospectuses and shareholder reports at wellsfargo.com/advantagedelivery
Contents
The views expressed and any forward-looking statements are as of June 30, 2016, unless otherwise noted, and are those of the Fund managers and/or Wells Fargo Funds Management, LLC. Discussions of individual securities, or the markets generally, or any Wells Fargo Fund are not intended as individual recommendations. Future events or results may vary significantly from those expressed in any forward-looking statements. The views expressed are subject to change at any time in response to changing circumstances in the market. Wells Fargo Funds Management, LLC and the Fund disclaim any obligation to publicly update or revise any views expressed or forward-looking statements.
NOT FDIC INSURED ¡ NO BANK GUARANTEE ¡ MAY LOSE VALUE
| | | | |
| 2 | | Wells Fargo Pennsylvania Tax-Free Fund | | Letter to shareholders (unaudited) |

Karla M. Rabusch
President
Wells Fargo Funds
In fact, yields on municipal bonds that matured in 10 years or more experienced yield declines of more than 100 basis points (100 basis points equals 1.00%) during the reporting period.
Dear Valued Shareholder:
We are pleased to offer you this annual report for the Wells Fargo Pennsylvania Tax-Free Fund for the 12-month period that ended June 30, 2016. The U.S. Federal Reserve (Fed) began normalizing monetary policy, raising the federal funds rate to between 0.25% and 0.50% in December 2015. Short-term municipal bond yields rose, but yields on longer-term bonds declined. In fact, yields on municipal bonds that matured in 10 years or more experienced yield declines of more than 100 basis points (100 basis points equals 1.00%) during the reporting period. The Barclays Municipal Bond Index,1 a broad measure tracking investment-grade municipal bonds, returned 7.65% during the 12-month reporting period.
Monetary policy was accommodative.
The Fed continued an easy monetary policy in order to support the economy and the financial system. However, it raised the federal funds target rate in December because it believed the U.S. economy was strong enough to begin normalizing monetary policy. The European Central Bank cut all three of its short-term rates during the reporting period, increased its asset-purchase program from 60 billion euros per month to 80 billion, expanded the list of eligible securities to include investment-grade nonbank debt, and created a fund-to-lend program where banks could be paid to lend money. In Japan, the Bank of Japan maintained an aggressive monetary program aimed at combating deflation.
Despite accommodative central-bank policies that helped keep interest rates at ultra-low levels, there were periods of volatility. Early in 2016, weakness in certain emerging markets economies and commodities hurt riskier assets and a vote in June 2016 by the U.K. to exit the European Union set off another round of global uncertainty. Municipal bonds benefited because they are perceived as a safe-haven asset. In addition, investor demand for yield helped lower-rated debt outperform. The Barclays High Yield Municipal Bond Index2 returned 12.09% during the 12-month period that ended June 30, 2016.
Strong demand, modest supply, and solid credit fundamentals supported municipals.
Market technicals remained favorable. According to the Investment Company Institute, more than $33 billion was allocated to municipal mutual funds during the first half of 2016, which was more than double the inflows during all of 2015. Further, inflows during the second quarter of 2016 were the largest in nearly seven years. In contrast, less new supply helped make 2015 the fifth calendar year of negative net supply and supply in the first half of 2016 was about 4% less than the same period last year.
Municipal credit quality remained on an uptrend despite a number of high-profile negative credit situations. Idiosyncratic credit risks remain, however. With regard to Puerto Rico, the U.S. enacted legislation that prohibits bondholder lawsuits temporarily and instills a fiscal oversight board for Puerto Rico; Puerto Rico then declared a moratorium on paying its general obligation (GO) bonds and defaulted on $911 million in payments due (most of which were GOs) on July 1, 2016. The state of Illinois approved a six-month stopgap budget, a temporary but
| 1 | The Barclays Municipal Bond Index is an unmanaged index composed of long-term tax-exempt bonds with a minimum credit rating of Baa. You cannot invest directly in an index. |
| 2 | The Barclays High Yield Municipal Bond Index measures the non-investment-grade and nonrated U.S. dollar–denominated, fixed-rate, tax-exempt bond market within the 50 United States and four other qualifying regions (Washington, D.C.; Puerto Rico; Guam; and the Virgin Islands). The index allows state and local general obligation, revenue, insured, and prerefunded bonds; however, historically the index has been composed of mostly revenue bonds. You cannot invest directly in an index. |
| | | | | | |
| Letter to shareholders (unaudited) | | Wells Fargo Pennsylvania Tax-Free Fund | | | 3 | |
meaningful step. Under this stopgap budget for the state, the city of Chicago receives authority to raise property taxes for teacher pensions and low-income school districts would receive greater state funding. City of Chicago and school district debt rallied on the news.
Since the end of the financial crisis, structural changes in the fixed-income markets have reduced trading liquidity (the degree to which assets can be bought or sold without affecting the price). New regulations and capital requirements have caused traditional liquidity suppliers (banks and broker/dealers) to be more risk-averse and hold less inventory. Meanwhile, corporate-debt issuance has spiked as companies finance themselves at record-low yields, bond mutual funds hold larger amounts of this new debt supply, trading volumes are lower, and large trades are more difficult to execute. However, fixed-income markets appear to have functioned well over the past year with sufficient liquidity.
Don’t let short-term uncertainty derail long-term investment goals.
Periods of uncertainty can present challenges, but experience has taught us that maintaining long-term investment goals can be an effective way to plan for the future. To help you create a sound strategy based on your personal goals and risk tolerance, Wells Fargo Funds offers more than 100 mutual funds spanning a wide range of asset classes and investment styles. Although diversification cannot guarantee an investment profit or prevent losses, we believe it can be an effective way to manage investment risk and potentially smooth out overall portfolio performance. We encourage investors to know their investments and to understand that appropriate levels of risk-taking may unlock opportunities.
Thank you for choosing to invest in Wells Fargo Funds. We appreciate your confidence in us and remain committed to helping you meet your financial needs.
Sincerely,

Karla M. Rabusch
President
Wells Fargo Funds
Periods of uncertainty can present challenges, but experience has taught us that maintaining long-term investment goals can be an effective way to plan for the future.
For further information about your Fund, contact your investment professional, visit our website at wellsfargofunds.com, or call us directly at 1-800-222-8222. We are available 24 hours a day, 7 days a week.
| | | | |
| 4 | | Wells Fargo Pennsylvania Tax-Free Fund | | Performance highlights (unaudited) |
Investment objective
The Fund seeks current income exempt from federal income tax and Pennsylvania individual income tax.
Manager
Wells Fargo Funds Management, LLC
Subadviser
Wells Capital Management Incorporated
Portfolio managers
Bruce R. Johns
Robert J. Miller
Average annual total returns (%) as of June 30, 20161
| | | | | | | | | | | | | | | | | | | | | | | | | | | | | | | | | | |
| | | | | Including sales charge | | | Excluding sales charge | | | Expense ratios2 (%) | |
| | | Inception date | | 1 year | | | 5 year | | | 10 year | | | 1 year | | | 5 year | | | 10 year | | | Gross | | | Net3 | |
| Class A (EKVAX) | | 12-27-1990 | | | 1.85 | | | | 4.84 | | | | 4.45 | | | | 6.62 | | | | 5.82 | | | | 4.93 | | | | 0.90 | | | | 0.74 | |
| Class B (EKVBX)* | | 2-1-1993 | | | 0.83 | | | | 4.71 | | | | 4.38 | | | | 5.83 | | | | 5.04 | | | | 4.38 | | | | 1.65 | | | | 1.49 | |
| Class C (EKVCX) | | 2-1-1993 | | | 4.83 | | | | 5.04 | | | | 4.14 | | | | 5.83 | | | | 5.04 | | | | 4.14 | | | | 1.65 | | | | 1.49 | |
| Institutional Class (EKVYX) | | 11-24-1997 | | | – | | | | – | | | | – | | | | 6.88 | | | | 6.08 | | | | 5.19 | | | | 0.57 | | | | 0.49 | |
| Barclays Municipal Bond Index4 | | – | | | – | | | | – | | | | – | | | | 7.65 | | | | 5.33 | | | | 5.13 | | | | – | | | | – | |
| Barclays Pennsylvania Municipal Bond Index5 | | – | | | – | | | | – | | | | – | | | | 8.03 | | | | 5.61 | | | | 5.33 | | | | – | | | | – | |
| * | | Class B shares are closed to investment, except in connection with the reinvestment of any distribution and permitted exchanges. |
Figures quoted represent past performance, which is no guarantee of future results, and do not reflect taxes that a shareholder may pay on fund distributions or the redemption of fund shares. Investment return and principal value of an investment will fluctuate so that an investor’s shares, when redeemed, may be worth more or less than their original cost. Performance shown without sales charges would be lower if sales charges were reflected. Current performance may be lower or higher than the performance data quoted, which assumes the reinvestment of dividends and capital gains. Current month-end performance is available on the Fund’s website, wellsfargofunds.com.
Index returns do not include transaction costs associated with buying and selling securities, any mutual fund fees or expenses, or any taxes. It is not possible to invest directly in an index.
For Class A shares, the maximum front-end sales charge is 4.50%. For Class B shares, the maximum contingent deferred sales charge is 5.00%. For Class C shares, the maximum contingent deferred sales charge is 1.00%. Performance including a contingent deferred sales charge assumes the sales charge for the corresponding time period. Institutional Class shares are sold without a front-end sales charge or contingent deferred sales charge.
Bond values fluctuate in response to the financial condition of individual issuers, general market and economic conditions, and changes in interest rates. Changes in market conditions and government policies may lead to periods of heightened volatility in the bond market and reduced liquidity for certain bonds held by the Fund. In general, when interest rates rise, bond values fall and investors may lose principal value. Interest-rate changes and their impact on the Fund and its share price can be sudden and unpredictable. The use of derivatives may reduce returns and/or increase volatility. Certain investment strategies tend to increase the total risk of an investment (relative to the broader market). The Fund is exposed to Pennsylvania municipal securities risk and high-yield securities risk. Consult the Fund’s prospectus for additional information on these and other risks. A portion of the Fund’s income may be subject to federal, state, and/or local income taxes or the Alternative Minimum Tax (AMT). Any capital gains distributions may be taxable.
Please see footnotes on page 5.
| | | | | | |
| Performance highlights (unaudited) | | Wells Fargo Pennsylvania Tax-Free Fund | | | 5 | |
|
| Growth of $10,000 investment as of June 30, 20166 |
|
 |
| 1 | Historical performance shown for all classes of the Fund prior to July 12, 2010, is based on the performance of the Fund’s predecessor, Evergreen Pennsylvania Municipal Bond Fund. |
| 2 | Reflects the expense ratios as stated in the most recent prospectuses. The expense ratios shown are subject to change and may differ from the annualized expense ratios shown in the financial highlights of this report. |
| 3 | The manager has contractually committed through October 31, 2016, to waive fees and/or reimburse expenses to the extent necessary to cap the Fund’s Total Annual Fund Operating Expenses After Fee Waiver at the amounts shown. After this time, the cap may be increased or the commitment to maintain the cap may be terminated only with the approval of the Board of Trustees. Brokerage commissions, stamp duty fees, interest, taxes, acquired fund fees and expenses, and extraordinary expenses are excluded from the expense cap. Without this cap, the Fund’s returns would have been lower. |
| 4 | The Barclays Municipal Bond Index is an unmanaged index composed of long-term tax-exempt bonds with a minimum credit rating of Baa. You cannot invest directly in an index. |
| 5 | The Barclays Pennsylvania Municipal Bond Index is the Pennsylvania component of the Barclays Municipal Bond Index. You cannot invest directly in an index. |
| 6 | The chart compares the performance of Class A shares for the most recent ten years with the Barclays Municipal Bond Index and the Barclays Pennsylvania Municipal Bond Index. The chart assumes a hypothetical $10,000 investment in Class A shares and reflects all operating expenses and assumes the maximum initial sales charge of 4.50%. |
| 7 | Amounts are calculated based on the total investments of the Fund. These amounts are subject to change and may have changed since the date specified. |
| 8 | The credit quality distribution of portfolio holdings reflected in the chart is based on ratings from Standard & Poor’s, Moody’s Investors Service, and/or Fitch Ratings Ltd. Credit quality ratings apply to the underlying holdings of the Fund and not to the Fund itself. The percentages of the Fund’s portfolio with the ratings depicted in the chart are calculated based on the total market value of fixed income securities held by the Fund. If a security was rated by all three rating agencies, the middle rating was utilized. If rated by two of three rating agencies, the lower rating was utilized, and if rated by one of the rating agencies, that rating was utilized. Standard & Poor’s rates the creditworthiness of bonds, ranging from AAA (highest) to D (lowest). Ratings from A to CCC may be modified by the addition of a plus (+) or minus (-) sign to show relative standing within the rating categories. Standard & Poor’s rates the creditworthiness of short-term notes from SP-1 (highest) to SP-3 (lowest). Moody’s rates the creditworthiness of bonds, ranging from Aaa (highest) to C (lowest). Ratings Aa to B may be modified by the addition of a number 1 (highest) to 3 (lowest) to show relative standing within the ratings categories. Moody’s rates the creditworthiness of short-term U.S. tax-exempt municipal securities from MIG 1/VMIG 1 (highest) to SG (lowest). Fitch rates the creditworthiness of bonds, ranging from AAA (highest) to D (lowest). Credit quality distribution is subject to change and may have changed since the date specified. |
| | | | |
| 6 | | Wells Fargo Pennsylvania Tax-Free Fund | | Performance highlights (unaudited) |
MANAGER’S DISCUSSION
Fund highlights
| n | | The Fund underperformed both of its benchmarks, the Barclays Municipal Bond Index and the Barclays Pennsylvania Municipal Bond Index, for the 12-month period that ended June 30, 2016. |
| n | | The Fund was positioned to help protect against higher interest rates. The Fund also maintained a defensive credit positioning, moving up in credit quality as credit spreads contracted. We kept the Fund’s duration short compared with both its benchmarks, which detracted from performance as yields fell and the market rallied. Yield-curve positioning also detracted from performance because the Fund was underweight the longest part of the yield curve, which was the best-performing part. |
| n | | Investors reached for income in an ultralow-yield environment, which resulted in a strong rally in higher-yielding bonds. The Fund’s overweight to BBB-rated and A-rated bonds as well as a modest allocation to high yield were the largest contributors to performance. |
The period was marked by the long-term bonds outperforming.
At the beginning of the period, the U.S. Federal Reserve (Fed) was expected to begin raising its federal funds target rate by late 2015, which made shorter-term maturities less attractive due to a potential backup in rates. The Fed tightened in December 2015 but signaled that the pace of further increases would be gradual. While the Fed was likely to take its time raising rates, U.S. inflation started to trend higher, unemployment remained below 5%, and economic growth was expected to remain at or above 2%. Municipal yields declined with longer-dated maturities outperforming by a significant margin.
|
| Effective maturity distribution as of June 30, 20167 |
|
 |
|
| Credit quality as of June 30, 20168 |
|
 |
The Fund was positioned in a defensive manner, which detracted from performance.
We kept the Fund’s duration short relative to the benchmark, which detracted from performance as the market rallied. Yield-curve positioning proved to be suboptimal. The Fund was concentrated in the 6- to 17-year part of the curve because we felt it offered the best risk-adjusted returns. While this part of the curve performed well, it was not enough to offset an underweight to the best-performing long end of the yield curve.
The Fund’s credit positioning contributed to performance.
The Fund was overweight A-rated and BBB-rated bonds, which contributed to results. As credit spreads contracted, we moved up in quality because we believed higher-rated bonds represented better relative value than lower-rated bonds. Many state-specific funds have exposure to Puerto Rico debt due to its triple tax exemption; however, we hold no Puerto Rico debt in the Fund. While the credit performed well over the last year, significant challenges remain and additional defaults are highly likely.
Sector allocation also benefited results. The Fund was overweight essential-service revenue bonds, which outperformed, and underweight general obligation (GO) bonds, which underperformed. We saw more relative value in revenue bonds with predictable revenue streams that offered higher income than we did in GO bonds.
While the Fund remained underweight state and local GOs, we selectively added some local GOs that represented relative-value opportunities.
Please see footnotes on page 5.
| | | | | | |
| Performance highlights (unaudited) | | Wells Fargo Pennsylvania Tax-Free Fund | | | 7 | |
Pennsylvania remained challenged by political gridlock.
The commonwealth of Pennsylvania is rated Aa3/AA-/ AA- by Moody’s, Standard & Poor’s, and Fitch Ratings, respectively. With 12.8 million people, Pennsylvania is the sixth-largest state by population. Its economy is supported by the relative stability of the health care and higher education sectors, primarily in the cities of Philadelphia and Pittsburgh, which account for 40% of state population. Revenue growth was a modest 2.5% in 2016 with a moderate debt structure at 2.3% of personal income and $1,116 per capita. Political negotiations were contentious in 2016, and a budget was not approved until nine months into the fiscal year. The magnitude of structural budget challenges is not insurmountable, in our view; however, political gridlock calls into question lawmakers’ ability to resolve structural imbalances and continues to be a credit risk and the reason for our negative outlook.
Rates may be lower for longer, making credit allocation and issue selection even more important.
Near the end of the reporting period, the U.K. voted to withdraw from the European Union, prompting considerable uncertainty about future political situations, financial markets, and economic growth. U.S. Treasuries and municipal bonds rallied significantly on the news, and both 10-year and 30-year municipal yields reached record-low levels. Although we think rates may stay lower for longer, we recognize that an improvement in overseas economies, outflows in mutual funds, or a more hawkish tone from the Fed could lead to a spike in rates. However, if the U.S. economy does weaken materially, this could be the catalyst for us to increase our duration exposure and reduce our credit exposure. In this record-low interest-rate environment, security selection is even more important as breakeven yields (the sell-off that a bond can endure before the total return drops to zero) decrease.
Please see footnotes on page 5.
| | | | |
| 8 | | Wells Fargo Pennsylvania Tax-Free Fund | | Fund expenses (unaudited) |
As a shareholder of the Fund, you incur two types of costs: (1) transaction costs, including sales charges (loads) on purchase payments and contingent deferred sales charges (if any) on redemptions and (2) ongoing costs, including management fees, distribution (12b-1) and/or shareholder servicing fees, and other Fund expenses. This example is intended to help you understand your ongoing costs (in dollars) of investing in the Fund and to compare these costs with the ongoing costs of investing in other mutual funds.
The example is based on an investment of $1,000 invested at the beginning of the six-month period and held for the entire period from January 1, 2016 to June 30, 2016.
Actual expenses
The “Actual” line of the table below provides information about actual account values and actual expenses. You may use the information in this line, together with the amount you invested, to estimate the expenses that you paid over the period. Simply divide your account value by $1,000 (for example, an $8,600 account value divided by $1,000 = 8.6), then multiply the result by the number in the “Actual” line under the heading entitled “Expenses paid during period” for your applicable class of shares to estimate the expenses you paid on your account during this period.
Hypothetical example for comparison purposes
The “Hypothetical” line of the table below provides information about hypothetical account values and hypothetical expenses based on the Fund’s actual expense ratio and an assumed rate of return of 5% per year before expenses, which is not the Fund’s actual return. The hypothetical account values and expenses may not be used to estimate the actual ending account balance or expenses you paid for the period. You may use this information to compare the ongoing costs of investing in the Fund and other funds. To do so, compare this 5% hypothetical example with the 5% hypothetical examples that appear in the shareholder reports of the other funds.
Please note that the expenses shown in the table are meant to highlight your ongoing costs only and do not reflect any transactional costs, such as sales charges (loads) and contingent deferred sales charges. Therefore, the “Hypothetical” line of the table is useful in comparing ongoing costs only and will not help you determine the relative total costs of owning different funds. In addition, if these transactional costs were included, your costs would have been higher.
| | | | | | | | | | | | | | | | |
| | | Beginning
account value
1-1-2016 | | | Ending
account value
6-30-2016 | | | Expenses
paid during
the period¹ | | | Net annualized
expense ratio | |
Class A | | | | | | | | | | | | | | | | |
Actual | | $ | 1,000.00 | | | $ | 1,035.85 | | | $ | 3.75 | | | | 0.74 | % |
Hypothetical (5% return before expenses) | | $ | 1,000.00 | | | $ | 1,021.18 | | | $ | 3.72 | | | | 0.74 | % |
Class B | | | | | | | | | | | | | | | | |
Actual | | $ | 1,000.00 | | | $ | 1,032.95 | | | $ | 7.53 | | | | 1.49 | % |
Hypothetical (5% return before expenses) | | $ | 1,000.00 | | | $ | 1,017.45 | | | $ | 7.47 | | | | 1.49 | % |
Class C | | | | | | | | | | | | | | | | |
Actual | | $ | 1,000.00 | | | $ | 1,032.03 | | | $ | 7.53 | | | | 1.49 | % |
Hypothetical (5% return before expenses) | | $ | 1,000.00 | | | $ | 1,017.45 | | | $ | 7.47 | | | | 1.49 | % |
Institutional Class | | | | | | | | | | | | | | | | |
Actual | | $ | 1,000.00 | | | $ | 1,037.14 | | | $ | 2.48 | | | | 0.49 | % |
Hypothetical (5% return before expenses) | | $ | 1,000.00 | | | $ | 1,022.43 | | | $ | 2.46 | | | | 0.49 | % |
| 1 | Expenses paid is equal to the annualized expense ratio of each class multiplied by the average account value over the period, multiplied by the number of days in the most recent fiscal half-year divided by the number of days in the fiscal year (to reflect the one-half-year period). |
| | | | | | |
| Portfolio of investments—June 30, 2016 | | Wells Fargo Pennsylvania Tax-Free Fund | | | 9 | |
| | | | | | | | | | | | | | | | |
| Security name | | Interest rate | | | Maturity date | | | Principal | | | Value | |
| | | | |
Municipal Obligations: 100.67% | | | | | | | | | | | | | | | | |
| | | | |
| Florida: 0.48% | | | | | | | | | | | | | | | | |
Jacksonville FL Economic Development AMT Metropolitan Parking Solutions Project (Industrial Development Revenue, ACA Insured) | | | 5.50 | % | | | 10-1-2030 | | | $ | 1,000,000 | | | $ | 1,002,450 | |
| | | | | | | | | | | | | | | | |
| | | | |
| Guam: 1.15% | | | | | | | | | | | | | | | | |
Guam Government Business Privilege Series D (Tax Revenue) | | | 5.00 | | | | 11-15-2022 | | | | 1,000,000 | | | | 1,188,670 | |
Guam Government Waterworks Authority Water & Wastewater System Project (Water & Sewer Revenue) | | | 5.25 | | | | 7-1-2025 | | | | 1,000,000 | | | | 1,209,220 | |
| |
| | | | 2,397,890 | |
| | | | | | | | | | | | | | | | |
| | | | |
| Illinois: 0.47% | | | | | | | | | | | | | | | | |
Chicago IL Board of Education Refunding Bond Series A (GO Revenue) | | | 4.39 | | | | 3-1-2032 | | | | 1,000,000 | | | | 980,410 | |
| | | | | | | | | | | | | | | | |
| | | | |
| Pennsylvania: 96.52% | | | | | | | | | | | | | | | | |
Allegheny County PA Higher Education Building Authority Refunding Bond Duquesne University of The Holy Spirit Series A (Education Revenue) | | | 5.00 | | | | 3-1-2029 | | | | 1,135,000 | | | | 1,401,044 | |
Allegheny County PA Hospital Development Authority Health Center Series B (Health Revenue, National Insured) | | | 6.00 | | | | 7-1-2027 | | | | 1,800,000 | | | | 2,517,696 | |
Allegheny County PA Port Authority Refunding Bond (Tax Revenue) | | | 5.75 | | | | 3-1-2029 | | | | 3,000,000 | | | | 3,590,340 | |
Allegheny County PA Series C-65 (GO Revenue) | | | 5.50 | | | | 5-1-2024 | | | | 4,675,000 | | | | 5,555,303 | |
Blair County PA (GO Revenue, Build America Mutual Assurance Company Insured) | | | 5.00 | | | | 10-1-2026 | | | | 955,000 | | | | 1,193,970 | |
Bucks County PA IDA Lane Charter School Project Series A (Education Revenue) 144A | | | 4.88 | | | | 3-15-2027 | | | | 1,700,000 | | | | 1,718,751 | |
Bucks County PA Refunding Bond (GO Revenue) | | | 5.00 | | | | 5-1-2024 | | | | 310,000 | | | | 394,484 | |
Bucks County PA Refunding Bond (GO Revenue) | | | 5.00 | | | | 5-1-2025 | | | | 425,000 | | | | 551,064 | |
Bucks County PA Refunding Bond (GO Revenue) | | | 5.00 | | | | 5-1-2026 | | | | 500,000 | | | | 661,815 | |
Bucks County PA Refunding Bond (GO Revenue) | | | 5.00 | | | | 5-1-2027 | | | | 525,000 | | | | 686,112 | |
Capital Region Water Pennsylvania Series A (Water & Sewer Revenue, Build America Mutual Assurance Company Insured) | | | 5.00 | | | | 7-15-2024 | | | | 750,000 | | | | 929,715 | |
Capital Region Water Pennsylvania Series A (Water & Sewer Revenue, Build America Mutual Assurance Company Insured) | | | 5.00 | | | | 7-15-2029 | | | | 525,000 | | | | 656,717 | |
Centre County PA Hospital Authority Mount Nittany Medical Center Series A (Health Revenue) | | | 5.00 | | | | 11-15-2029 | | | | 800,000 | | | | 991,864 | |
Centre County PA Hospital Authority Mount Nittany Medical Center Series A (Health Revenue) | | | 5.00 | | | | 11-15-2030 | | | | 675,000 | | | | 833,659 | |
Cheltenham Township PA School District Series A (GO Revenue) | | | 5.00 | | | | 2-15-2032 | | | | 1,055,000 | | | | 1,298,346 | |
Chester County PA IDA Avon Grove Charter School Project Series A (Education Revenue) | | | 5.65 | | | | 12-15-2017 | | | | 250,000 | | | | 257,653 | |
Chester County PA IDA Avon Grove Charter School Project Series A (Education Revenue) | | | 6.25 | | | | 12-15-2027 | | | | 2,370,000 | | | | 2,493,311 | |
Chester County PA IDA Collegium Charter School Project Series A (Education Revenue) | | | 5.00 | | | | 10-15-2022 | | | | 1,695,000 | | | | 1,812,667 | |
Chester County PA IDA Renaissance Academy Charter School (Education Revenue) | | | 3.75 | | | | 10-1-2024 | | | | 1,000,000 | | | | 1,064,220 | |
Chester County PA IDA University Student Housing LLC Project Series A (Housing Revenue) | | | 5.00 | | | | 8-1-2030 | | | | 555,000 | | | | 623,110 | |
Commonwealth Financing Authority Pennsylvania Series B-1 (Miscellaneous Revenue, AGM Insured) | | | 5.00 | | | | 6-1-2025 | | | | 1,500,000 | | | | 1,866,045 | |
Commonwealth of Pennsylvania Financing Authority Series B (Water & Sewer Revenue) | | | 5.00 | | | | 6-1-2026 | | | | 1,000,000 | | | | 1,194,830 | |
Cumberland County PA Municipal Authority Diakon Lutheran Ministries Project (Health Revenue) | | | 5.00 | | | | 1-1-2028 | | | | 2,090,000 | | | | 2,503,925 | |
Cumberland County PA Municipal Authority Diakon Lutheran Ministries Project (Health Revenue) | | | 5.00 | | | | 1-1-2036 | | | | 5,000,000 | | | | 5,109,500 | |
Cumberland County PA Municipal Authority Dickinson College Project Series HH1 (Education Revenue) | | | 5.00 | | | | 11-1-2039 | | | | 1,200,000 | | | | 1,332,828 | |
The accompanying notes are an integral part of these financial statements.
| | | | |
| 10 | | Wells Fargo Pennsylvania Tax-Free Fund | | Portfolio of investments—June 30, 2016 |
| | | | | | | | | | | | | | | | |
| Security name | | Interest rate | | | Maturity date | | | Principal | | | Value | |
|
| Pennsylvania (continued) | |
Cumberland County PA Municipal Authority Refunding Bond Dickson College Project (Education Revenue) | | | 5.00 | % | | | 5-1-2028 | | | $ | 1,170,000 | | | $ | 1,486,368 | |
Dauphin County PA Authority Pinnacle Health System Project Series A (Health Revenue) | | | 5.00 | | | | 6-1-2035 | | | | 1,000,000 | | | | 1,218,410 | |
Delaware County PA Authority Neumann University Refunding Bond (Miscellaneous Revenue) | | | 5.00 | | | | 10-1-2031 | | | | 1,500,000 | | | | 1,744,710 | |
Delaware County PA IDA Chester Community Charter School Series A (Education Revenue) | | | 5.00 | | | | 8-15-2020 | | | | 1,795,000 | | | | 1,831,062 | |
Delaware County PA Vocational & Technical School Authority (Miscellaneous Revenue, Build America Mutual Assurance Company Insured) | | | 5.25 | | | | 11-1-2033 | | | | 1,000,000 | | | | 1,206,310 | |
Delaware Valley PA Regional Finance Authority Series A (Miscellaneous Revenue, Ambac Insured) | | | 5.50 | | | | 8-1-2028 | | | | 4,390,000 | | | | 5,689,791 | |
Delaware Valley PA Regional Finance Authority Series B (Miscellaneous Revenue, Ambac Insured) | | | 5.60 | | | | 7-1-2017 | | | | 2,000,000 | | | | 2,095,480 | |
East Hempfield Township PA IDA Refunding Bond Willow Valley Communities Project (Health Revenue) | | | 5.00 | | | | 12-1-2028 | | | | 450,000 | | | | 548,991 | |
East Hempfield Township PA IDA Refunding Bond Willow Valley Communities Project (Health Revenue) | | | 5.00 | | | | 12-1-2029 | | | | 375,000 | | | | 456,401 | |
Easton PA Area Joint Sewer Authority (Water & Sewer Revenue, Build America Mutual Assurance Company Insured) | | | 5.00 | | | | 12-1-2026 | | | | 180,000 | | | | 220,219 | |
Easton PA Area Joint Sewer Authority (Water & Sewer Revenue, Build America Mutual Assurance Company Insured) | | | 5.00 | | | | 12-1-2027 | | | | 200,000 | | | | 243,562 | |
Easton PA Area Joint Sewer Authority (Water & Sewer Revenue, Build America Mutual Assurance Company Insured) | | | 5.00 | | | | 12-1-2028 | | | | 150,000 | | | | 182,199 | |
Easton PA Area Joint Sewer Authority (Water & Sewer Revenue, Build America Mutual Assurance Company Insured) | | | 5.00 | | | | 12-1-2029 | | | | 200,000 | | | | 242,148 | |
General Authority of South Central Pennsylvania Association of Independent Colleges & Universities (Education Revenue) | | | 6.00 | | | | 11-1-2031 | | | | 2,500,000 | | | | 2,975,675 | |
Lehigh County PA General Purpose Authority Water & Sewer CAB Allentown Project (Water & Sewer Revenue) ¤ | | | 0.00 | | | | 12-1-2030 | | | | 2,000,000 | | | | 1,311,120 | |
Lycoming County PA Authority Pennsylvania College of Technology (Education Revenue) | | | 5.50 | | | | 7-1-2026 | | | | 3,000,000 | | | | 3,577,080 | |
McKeesport PA Municipal Authority (Water & Sewer Revenue, AGM Insured) | | | 5.50 | | | | 12-15-2027 | | | | 2,405,000 | | | | 2,888,140 | |
Monroe County PA Hospital Authority Pocono Medical Center Series A (Health Revenue) | | | 5.00 | | | | 1-1-2027 | | | | 840,000 | | | | 953,350 | |
Monroe County PA Hospital Authority Pocono Medical Center Series A (Health Revenue) | | | 5.00 | | | | 1-1-2032 | | | | 880,000 | | | | 987,642 | |
Montgomery County PA Higher Education & Health Authority Abington Memorial Hospital Project (Health Revenue) | | | 5.00 | | | | 6-1-2031 | | | | 2,000,000 | | | | 2,316,400 | |
Montgomery County PA Higher Education & Health Authority Refunding Bond Arcadia University (Education Revenue) | | | 5.00 | | | | 4-1-2030 | | | | 1,500,000 | | | | 1,750,425 | |
Montgomery County PA IDA ACTS Retirement-Life Communities Incorporated Obligated Group (Housing Revenue) %% | | | 5.00 | | | | 11-15-2036 | | | | 4,200,000 | | | | 5,047,140 | |
Montgomery County PA IDA Adult Communities Total Services Retirement Community Series B (Health Revenue) | | | 5.00 | | | | 11-15-2022 | | | | 6,000,000 | | | | 6,078,120 | |
Montgomery County PA IDA Jefferson Health System Series A (Health Revenue) | | | 5.00 | | | | 10-1-2027 | | | | 1,000,000 | | | | 1,162,080 | |
Montgomery County PA IDA New Regional Medical Center Project (Health Revenue, FHA Insured) | | | 5.00 | | | | 8-1-2020 | | | | 980,000 | | | | 1,142,543 | |
Moon Area PA School District Series A (GO Revenue) | | | 5.00 | | | | 11-15-2029 | | | | 1,445,000 | | | | 1,763,406 | |
Norristown Area PA School District (GO Revenue) | | | 5.00 | | | | 9-1-2029 | | | | 1,250,000 | | | | 1,571,650 | |
Northampton County PA St. Luke’s Hospital of Bethlehem Series A (Health Revenue) | | | 5.00 | | | | 8-15-2033 | | | | 1,500,000 | | | | 1,732,725 | |
Palmer Township PA Refunding Bond (GO Revenue) | | | 4.00 | | | | 5-15-2019 | | | | 320,000 | | | | 348,045 | |
The accompanying notes are an integral part of these financial statements.
| | | | | | |
| Portfolio of investments—June 30, 2016 | | Wells Fargo Pennsylvania Tax-Free Fund | | | 11 | |
| | | | | | | | | | | | | | | | |
| Security name | | Interest rate | | | Maturity date | | | Principal | | | Value | |
|
| Pennsylvania (continued) | |
Palmer Township PA Refunding Bond (GO Revenue) | | | 4.00 | % | | | 5-15-2020 | | | $ | 635,000 | | | $ | 705,891 | |
Palmer Township PA Refunding Bond (GO Revenue) | | | 4.00 | | | | 5-15-2021 | | | | 250,000 | | | | 282,963 | |
Palmer Township PA Refunding Bond (GO Revenue) | | | 4.00 | | | | 5-15-2025 | | | | 225,000 | | | | 264,285 | |
Pennsylvania 1st Series (GO Revenue, AGM Insured) | | | 5.00 | | | | 9-15-2025 | | | | 3,000,000 | | | | 3,812,550 | |
Pennsylvania Financing Authority Pennsylvania Hills Project Series B (Miscellaneous Revenue, National Insured) ¤ | | | 0.00 | | | | 12-1-2022 | | | | 1,200,000 | | | | 1,029,276 | |
Pennsylvania Financing Authority Pennsylvania Hills Project Series B (Miscellaneous Revenue, National Insured) ¤ | | | 0.00 | | | | 12-1-2023 | | | | 3,790,000 | | | | 3,173,215 | |
Pennsylvania HEFAR La Salle University Series A (Education Revenue) | | | 5.25 | | | | 5-1-2027 | | | | 5,250,000 | | | | 5,472,548 | |
Pennsylvania HEFAR Shippensburg University Project (Education Revenue) | | | 5.00 | | | | 10-1-2020 | | | | 1,460,000 | | | | 1,586,042 | |
Pennsylvania HEFAR Shippensburg University Project (Education Revenue) ## | | | 6.00 | | | | 10-1-2031 | | | | 3,000,000 | | | | 3,367,530 | |
Pennsylvania HEFAR Temple University First Series (Education Revenue) | | | 5.00 | | | | 4-1-2032 | | | | 1,000,000 | | | | 1,181,900 | |
Pennsylvania Housing Finance Agency SFMR Series 108-B (Housing Revenue) | | | 4.50 | | | | 10-1-2024 | | | | 1,825,000 | | | | 1,962,569 | |
Pennsylvania Housing Finance Agency SFMR Series 112 (Housing Revenue) | | | 5.00 | | | | 4-1-2028 | | | | 1,760,000 | | | | 1,881,810 | |
Pennsylvania Public School Building Authority Series B-2 (Miscellaneous Revenue, Build America Mutual Assurance Company Insured) | | | 5.00 | | | | 12-1-2027 | | | | 1,010,000 | | | | 1,257,420 | |
Pennsylvania Turnpike Commission (Transportation Revenue) | | | 5.00 | | | | 6-1-2039 | | | | 3,000,000 | | | | 3,591,090 | |
Pennsylvania Turnpike Commission Motor License Series B1 (Transportation Revenue) | | | 5.00 | | | | 12-1-2040 | | | | 1,500,000 | | | | 1,698,285 | |
Pennsylvania Turnpike Commission Series A (Miscellaneous Revenue, AGM Insured) | | | 5.25 | | | | 7-15-2021 | | | | 2,000,000 | | | | 2,388,120 | |
Pennsylvania Turnpike Commission Series A-1 (Transportation Revenue) | | | 5.00 | | | | 12-1-2046 | | | | 2,000,000 | | | | 2,409,500 | |
Pennsylvania Turnpike Commission Series C (Transportation Revenue, AGC Insured) | | | 6.25 | | | | 6-1-2038 | | | | 3,500,000 | | | | 3,874,535 | |
Philadelphia PA Airport Refunding Bond AMT Series A (Airport Revenue) | | | 5.00 | | | | 6-15-2030 | | | | 1,500,000 | | | | 1,810,725 | |
Philadelphia PA Hospital & HEFAR Refunding Bond Temple University Health System Series B (Health Revenue) | | | 6.25 | | | | 7-1-2023 | | | | 1,000,000 | | | | 1,041,370 | |
Philadelphia PA IDA 1st Philadelphia Preparatory Charter School Project Series A (Education Revenue) | | | 7.00 | | | | 6-15-2033 | | | | 1,000,000 | | | | 1,196,710 | |
Philadelphia PA IDA Architecture & Design Charter School Project (Education Revenue) | | | 5.25 | | | | 3-15-2023 | | | | 750,000 | | | | 816,600 | |
Philadelphia PA IDA Charter School Project Series A (Education Revenue) | | | 5.30 | | | | 9-15-2027 | | | | 5,150,000 | | | | 5,280,141 | |
Philadelphia PA IDA Global Leadership Academy Project (Education Revenue) | | | 5.13 | | | | 11-15-2020 | | | | 1,220,000 | | | | 1,298,958 | |
Philadelphia PA IDA Global Leadership Academy Project (Education Revenue) | | | 5.75 | | | | 11-15-2030 | | | | 1,000,000 | | | | 1,085,000 | |
Philadelphia PA IDA Master Charter School (Education Revenue) | | | 5.00 | | | | 8-1-2020 | | | | 705,000 | | | | 750,550 | |
Philadelphia PA IDA Refunding Bond Cultural & Commercial Corridors Program Series A (Miscellaneous Revenue) | | | 5.00 | | | | 12-1-2028 | | | | 2,500,000 | | | | 3,057,425 | |
Philadelphia PA IDA Tacony Academy Charter School Project (Education Revenue) | | | 6.88 | | | | 6-15-2033 | | | | 1,000,000 | | | | 1,151,310 | |
Philadelphia PA IDA Temple University 1st Series 2015 (Education Revenue) | | | 5.00 | | | | 4-1-2033 | | | | 2,500,000 | | | | 3,054,475 | |
Philadelphia PA IDA Temple University 1st Series 2016 (Education Revenue) | | | 5.00 | | | | 4-1-2029 | | | | 1,000,000 | | | | 1,241,580 | |
Philadelphia PA IDA West Philadelphia Achievement Charter Elementary School Project (Education Revenue) | | | 7.50 | | | | 5-1-2031 | | | | 1,285,000 | | | | 1,409,247 | |
Philadelphia PA School District Refunding Bond Series A (GO Revenue, AGM/FGIC Insured) | | | 5.00 | | | | 6-1-2024 | | | | 1,425,000 | | | | 1,690,919 | |
Philadelphia PA School District Refunding Bond Series C (GO Revenue) | | | 5.00 | | | | 9-1-2018 | | | | 3,000,000 | | | | 3,209,250 | |
Philadelphia PA School District Refunding Bond Series C (GO Revenue) | | | 5.00 | | | | 9-1-2021 | | | | 1,395,000 | | | | 1,570,993 | |
Philadelphia PA Series A (GO Revenue) | | | 5.25 | | | | 7-15-2033 | | | | 1,500,000 | | | | 1,825,620 | |
Pittsburgh & Allegheny Counties PA Sports & Exhibition Authority (Tax Revenue, AGM Insured) | | | 5.00 | | | | 2-1-2031 | | | | 3,000,000 | | | | 3,424,320 | |
Pittsburgh PA (GO Revenue, Build America Mutual Assurance Company Insured) | | | 5.00 | | | | 9-1-2030 | | | | 500,000 | | | | 621,035 | |
Reading PA School District Notes Series A (GO Revenue, AGM Insured) | | | 5.00 | | | | 2-1-2033 | | | | 1,500,000 | | | | 1,772,865 | |
Reading PA School District Refunding Bond (GO Revenue) | | | 3.13 | | | | 4-1-2024 | | | | 1,000,000 | | | | 1,007,300 | |
Southeastern Pennsylvania Transportation Authority (Miscellaneous Revenue) | | | 5.00 | | | | 6-1-2028 | | | | 4,000,000 | | | | 4,654,440 | |
State Public School Building Authority Pennsylvania Chester Upland School Project Series C (Miscellaneous Revenue, AGM Insured) | | | 5.00 | | | | 9-15-2026 | | | | 875,000 | | | | 1,025,640 | |
The accompanying notes are an integral part of these financial statements.
| | | | |
| 12 | | Wells Fargo Pennsylvania Tax-Free Fund | | Portfolio of investments—June 30, 2016 |
| | | | | | | | | | | | | | | | |
| Security name | | Interest rate | | | Maturity date | | | Principal | | | Value | |
|
| Pennsylvania (continued) | |
State Public School Building Authority Pennsylvania Northampton County Area Community College Project (Education Revenue) | | | 5.50 | % | | | 3-1-2031 | | | $ | 5,000,000 | | | $ | 5,869,400 | |
State Public School Building Authority Pennsylvania Northampton County Area Community College Project Series A (Education Revenue, Build America Mutual Assurance Company Insured) | | | 5.00 | | | | 6-15-2027 | | | | 1,610,000 | | | | 1,877,244 | |
State Public School Building Authority Philadelphia Community College Project Series A (Education Revenue, Build America Mutual Assurance Company Insured) | | | 5.00 | | | | 6-15-2027 | | | | 1,500,000 | | | | 1,832,730 | |
University Area Joint Authority Pennsylvania Refunding Bond (Water & Sewer Revenue) ± | | | 0.79 | | | | 11-1-2028 | | | | 1,500,000 | | | | 1,497,675 | |
Wilkes-Barre PA Finance Authority University of Scranton (Education Revenue) | | | 5.00 | | | | 11-1-2020 | | | | 1,005,000 | | | | 1,159,864 | |
Wilkes-Barre PA Finance Authority Wilkes University Project (Education Revenue) | | | 5.00 | | | | 3-1-2027 | | | | 1,550,000 | | | | 1,595,338 | |
Wilkes-Barre PA FInance Authority Wilkes University Project (Education Revenue) | | | 5.00 | | | | 3-1-2027 | | | | 1,050,000 | | | | 1,074,486 | |
York County PA Series B (GO Revenue) | | | 5.00 | | | | 6-1-2033 | | | | 4,000,000 | | | | 4,971,080 | |
York PA City School District Refunding Bond (GO Revenue, Build America Mutual Assurance Company Insured) | | | 4.00 | | | | 6-1-2019 | | | | 895,000 | | | | 965,338 | |
York PA City School District Refunding Bond (GO Revenue, Build America Mutual Assurance Company Insured) | | | 4.00 | | | | 6-1-2020 | | | | 970,000 | | | | 1,069,105 | |
York PA City School District Refunding Bond (GO Revenue, Build America Mutual Assurance Company Insured) | | | 4.00 | | | | 6-1-2021 | | | | 1,000,000 | | | | 1,121,650 | |
| |
| | | | 200,980,073 | |
| | | | | | | | | | | | | | | | |
| | | | |
| Virgin Islands: 2.05% | | | | | | | | | | | | | | | | |
Virgin Islands PFA Grant Anticipation Federal Highway Grant (Miscellaneous Revenue) 144A | | | 4.00 | | | | 9-1-2017 | | | | 600,000 | | | | 619,608 | |
Virgin Islands PFA Grant Anticipation Federal Highway Grant (Miscellaneous Revenue) 144A | | | 5.00 | | | | 9-1-2018 | | | | 750,000 | | | | 809,828 | |
Virgin Islands PFA Grant Anticipation Federal Highway Grant (Miscellaneous Revenue) 144A | | | 5.00 | | | | 9-1-2019 | | | | 500,000 | | | | 555,710 | |
Virgin Islands PFA Matching Fund Loan Note Senior Lien (Miscellaneous Revenue, AGM Insured) | | | 5.00 | | | | 10-1-2029 | | | | 2,000,000 | | | | 2,276,681 | |
| | | | |
| | | | | | | | | | | | | | | 4,261,827 | |
| | | | | | | | | | | | | | | | |
| | | | |
Total Municipal Obligations (Cost $194,055,880) | | | | | | | | | | | | | | | 209,622,650 | |
| | | | | | | | | | | | | | | | |
| | | | |
| | | Yield | | | | | | Shares | | | | |
| Short-Term Investments: 0.82% | | | | | | | | | | | | | | | | |
| | | | |
| Investment Companies: 0.82% | | | | | | | | | | | | | | | | |
Wells Fargo Municipal Cash Management Fund Institutional
Class (l)(u)## | | | 0.30 | | | | | | | | 1,714,696 | | | | 1,714,696 | |
| | | | | | | | | | | | | | | | |
| | | | |
Total Short-Term Investments (Cost $1,714,696) | | | | | | | | | | | | | | | 1,714,696 | |
| | | | | | | | | | | | | | | | |
| | | | | | | | |
| Total investments in securities (Cost $195,770,576) * | | | 101.49 | % | | | 211,337,346 | |
Other assets and liabilities, net | | | (1.49 | ) | | | (3,109,961 | ) |
| | | | | | | | |
| Total net assets | | | 100.00 | % | | $ | 208,227,385 | |
| | | | | | | | |
The accompanying notes are an integral part of these financial statements.
| | | | | | |
| Portfolio of investments—June 30, 2016 | | Wells Fargo Pennsylvania Tax-Free Fund | | | 13 | |
| 144A | The security may be resold in transactions exempt from registration, normally to qualified institutional buyers, pursuant to Rule 144A under the Securities Act of 1933. |
| ¤ | The security is issued in zero coupon form with no periodic interest payments. |
| %% | The security is issued on a when-issued basis. |
| ± | Variable rate investment. The rate shown is the rate in effect at period end. |
| (l) | The issuer of the security is an affiliated person of the Fund as defined in the Investment Company Act of 1940. |
| (u) | The rate represents the 7-day annualized yield at period end. |
| ## | All or a portion of this security is segregated for when-issued securities. |
| * | Cost for federal income tax purposes is $195,825,003 and unrealized gains (losses) consists of: |
| | | | |
Gross unrealized gains | | $ | 15,588,685 | |
Gross unrealized losses | | | (76,342 | ) |
| | | | |
Net unrealized gains | | $ | 15,512,343 | |
The accompanying notes are an integral part of these financial statements.
| | | | |
| 14 | | Wells Fargo Pennsylvania Tax-Free Fund | | Statement of assets and liabilities—June 30, 2016 |
| | | | |
| | | | |
| |
Assets | | | | |
Investments | | | | |
In unaffiliated securities, at value (cost $194,055,880) | | $ | 209,622,650 | |
In affiliated securities, at value (cost $1,714,696) | | | 1,714,696 | |
| | | | |
Total investments, at value (cost $195,770,576) | | | 211,337,346 | |
Receivable for Fund shares sold | | | 300,868 | |
Receivable for interest | | | 2,132,552 | |
Prepaid expenses and other assets | | | 30,937 | |
| | | | |
Total assets | | | 213,801,703 | |
| | | | |
| |
Liabilities | | | | |
Dividends payable | | | 291,947 | |
Payable for investments purchased | | | 5,047,140 | |
Payable for Fund shares redeemed | | | 103,206 | |
Management fee payable | | | 50,126 | |
Distribution fees payable | | | 12,011 | |
Administration fees payable | | | 18,309 | |
Accrued expenses and other liabilities | | | 51,579 | |
| | | | |
Total liabilities | | | 5,574,318 | |
| | | | |
Total net assets | | $ | 208,227,385 | |
| | | | |
| |
NET ASSETS CONSIST OF | | | | |
Paid-in capital | | $ | 198,836,747 | |
Overdistributed net investment income | | | (245,938 | ) |
Accumulated net realized losses on investments | | | (5,930,194 | ) |
Net unrealized gains on investments | | | 15,566,770 | |
| | | | |
Total net assets | | $ | 208,227,385 | |
| | | | |
| |
COMPUTATION OF NET ASSET VALUE AND OFFERING PRICE PER SHARE | | | | |
Net assets – Class A | | $ | 55,352,413 | |
Shares outstanding – Class A1 | | | 4,562,454 | |
Net asset value per share – Class A | | | $12.13 | |
Maximum offering price per share – Class A2 | | | $12.70 | |
Net assets – Class B | | $ | 538,409 | |
Shares outstanding – Class B1 | | | 44,543 | |
Net asset value per share – Class B | | | $12.09 | |
Net assets – Class C | | $ | 19,492,830 | |
Shares outstanding – Class C1 | | | 1,609,662 | |
Net asset value per share – Class C | | | $12.11 | |
Net assets – Institutional Class | | $ | 132,843,733 | |
Shares outstanding – Institutional Class1 | | | 10,949,753 | |
Net asset value per share – Institutional Class | | | $12.13 | |
| 1 | The Fund has an unlimited number of authorized shares. |
| 2 | Maximum offering price is computed as 100/95.50 of net asset value. On investments of $50,000 or more, the offering price is reduced. |
The accompanying notes are an integral part of these financial statements.
| | | | | | |
| Statement of operations—year ended June 30, 2016 | | Wells Fargo Pennsylvania Tax-Free Fund | | | 15 | |
| | | | |
| | | | |
| |
Investment income | | | | |
Interest | | $ | 7,396,729 | |
Income from affiliated securities | | | 4,073 | |
| | | | |
Total investment income | | | 7,400,802 | |
| | | | |
| |
Expenses | | | | |
Management fee | | | 746,918 | |
Administration fees | |
Class A | | | 81,008 | |
Class B | | | 942 | |
Class C | | | 24,073 | |
Institutional Class | | | 96,372 | |
Shareholder servicing fees | |
Class A | | | 126,575 | |
Class B | | | 1,473 | |
Class C | | | 37,614 | |
Distribution fees | |
Class B | | | 4,418 | |
Class C | | | 112,840 | |
Custody and accounting fees | | | 14,012 | |
Professional fees | | | 46,266 | |
Registration fees | | | 66,419 | |
Shareholder report expenses | | | 13,611 | |
Trustees’ fees and expenses | | | 23,984 | |
Other fees and expenses | | | 4,487 | |
| | | | |
Total expenses | | | 1,401,012 | |
Less: Fee waivers and/or expense reimbursements | | | (203,120 | ) |
| | | | |
Net expenses | | | 1,197,892 | |
| | | | |
Net investment income | | | 6,202,910 | |
| | | | |
| |
REALIZED AND UNREALIZED GAINS (LOSSES) ON INVESTMENTS | | | | |
| |
Net realized gains on investments | | | 317,819 | |
Net change in unrealized gains (losses) on investments | | | 5,818,175 | |
| | | | |
Net realized and unrealized gains (losses) on investments | | | 6,135,994 | |
| | | | |
Net increase in net assets resulting from operations | | $ | 12,338,904 | |
| | | | |
The accompanying notes are an integral part of these financial statements.
| | | | |
| 16 | | Wells Fargo Pennsylvania Tax-Free Fund | | Statement of changes in net assets |
| | | | | | | | | | | | | | | | |
| | | Year ended
June 30, 2016 | | | Year ended
June 30, 2015 | |
| |
Operations | | | | | |
Net investment income | | | | | | $ | 6,202,910 | | | | | | | $ | 6,375,933 | |
Net realized gains on investments | | | | | | | 317,819 | | | | | | | | 966,812 | |
Net change in unrealized gains (losses) on investments | | | | | | | 5,818,175 | | | | | | | | 627,422 | |
| | | | |
Net increase in net assets resulting from operations | | | | | | | 12,338,904 | | | | | | | | 7,970,167 | |
| | | | |
| | | |
Distributions to shareholders from | | | | | | | | | | | | |
Net investment income | | | | | | | | | | | | | | | | |
Class A | | | | | | | (1,633,459 | ) | | | | | | | (1,606,030 | ) |
Class B | | | | | | | (14,671 | ) | | | | | | | (20,931 | ) |
Class C | | | | | | | (370,055 | ) | | | | | | | (339,975 | ) |
Institutional Class | | | | | | | (4,184,725 | ) | | | | | | | (4,344,447 | ) |
| | | | |
Total distributions to shareholders | | | | | | | (6,202,910 | ) | | | | | | | (6,311,383 | ) |
| | | | |
| | | | |
Capital share transactions | | | Shares | | | | | | | | Shares | | | | | |
Proceeds from shares sold | | | | | | | | | | | | | | | | |
Class A | | | 907,836 | | | | 10,807,655 | | | | 605,396 | | | | 7,163,115 | |
Class B | | | 504 | | | | 5,931 | | | | 94 | | | | 1,089 | |
Class C | | | 578,544 | | | | 6,894,873 | | | | 299,119 | | | | 3,526,413 | |
Institutional Class | | | 3,425,123 | | | | 40,716,691 | | | | 1,203,338 | | | | 14,230,622 | |
| | | | |
| | | | | | | 58,425,150 | | | | | | | | 24,921,239 | |
| | | | |
Reinvestment of distributions | |
Class A | | | 126,426 | | | | 1,505,841 | | | | 120,989 | | | | 1,431,526 | |
Class B | | | 1,211 | | | | 14,352 | | | | 1,704 | | | | 20,089 | |
Class C | | | 28,590 | | | | 340,015 | | | | 25,787 | | | | 304,625 | |
Institutional Class | | | 79,004 | | | | 940,589 | | | | 81,893 | | | | 968,892 | |
| | | | |
| | | | | | | 2,800,797 | | | | | | | | 2,725,132 | |
| | | | |
Payment for shares redeemed | |
Class A | | | (499,387 | ) | | | (5,949,813 | ) | | | (519,400 | ) | | | (6,135,536 | ) |
Class B | | | (11,946 | ) | | | (141,573 | ) | | | (21,585 | ) | | | (254,079 | ) |
Class C | | | (111,231 | ) | | | (1,317,623 | ) | | | (173,825 | ) | | | (2,051,259 | ) |
Institutional Class | | | (1,641,421 | ) | | | (19,520,308 | ) | | | (2,438,641 | ) | | | (28,902,651 | ) |
| | | | |
| | | | | | | (26,929,317 | ) | | | | | | | (37,343,525 | ) |
| | | | |
Net increase (decrease) in net assets resulting from capital share transactions | | | | | | | 34,296,630 | | | | | | | | (9,697,154 | ) |
| | | | |
Total increase (decrease) in net assets | | | | | | | 40,432,624 | | | | | | | | (8,038,370 | ) |
| | | | |
| | |
Net assets | | | | | | | | |
Beginning of period | | | | | | | 167,794,761 | | | | | | | | 175,833,131 | |
| | | | |
End of period | | | | | | $ | 208,227,385 | | | | | | | $ | 167,794,761 | |
| | | | |
Overdistributed net investment income | | | | | | $ | (245,938 | ) | | | | | | $ | (245,938 | ) |
| | | | |
The accompanying notes are an integral part of these financial statements.
| | | | | | |
| Financial highlights | | Wells Fargo Pennsylvania Tax-Free Fund | | | 17 | |
(For a share outstanding throughout each period)
| | | | | | | | | | | | | | | | | | | | |
| | | Year ended June 30 | |
| CLASS A | | 2016 | | | 2015 | | | 2014 | | | 2013 | | | 2012 | |
Net asset value, beginning of period | | | $11.75 | | | | $11.65 | | | | $11.36 | | | | $11.65 | | | | $10.93 | |
Net investment income | | | 0.38 | | | | 0.42 | | | | 0.43 | | | | 0.42 | | | | 0.44 | |
Net realized and unrealized gains (losses) on investments | | | 0.38 | | | | 0.09 | | | | 0.29 | | | | (0.29 | ) | | | 0.72 | |
| | | | | | | | | | | | | | | | | | | | |
Total from investment operations | | | 0.76 | | | | 0.51 | | | | 0.72 | | | | 0.13 | | | | 1.16 | |
Distributions to shareholders from | | | | | | | | | | | | | | | | | | | | |
Net investment income | | | (0.38 | ) | | | (0.41 | ) | | | (0.43 | ) | | | (0.42 | ) | | | (0.44 | ) |
Net asset value, end of period | | | $12.13 | | | | $11.75 | | | | $11.65 | | | | $11.36 | | | | $11.65 | |
Total return1 | | | 6.62 | % | | | 4.44 | % | | | 6.45 | % | | | 1.02 | % | | | 10.81 | % |
Ratios to average net assets (annualized) | | | | | | | | | | | | | | | | | | | | |
Gross expenses | | | 0.90 | % | | | 0.90 | % | | | 0.91 | %2 | | | 0.88 | %2 | | | 0.88 | %2 |
Net expenses | | | 0.74 | % | | | 0.74 | % | | | 0.74 | %2 | | | 0.75 | %2 | | | 0.74 | %2 |
Net investment income | | | 3.23 | % | | | 3.54 | % | | | 3.75 | % | | | 3.55 | % | | | 3.90 | % |
Supplemental data | | | | | | | | | | | | | | | | | | | | |
Portfolio turnover rate | | | 13 | % | | | 15 | % | | | 15 | % | | | 14 | % | | | 21 | % |
Net assets, end of period (000s omitted) | | | $55,352 | | | | $47,323 | | | | $44,500 | | | | $43,167 | | | | $45,178 | |
| 1 | Total return calculations do not include any sales charges. |
| 2 | Ratios include interest and fee expense relating to inverse floating-rate obligations as follows: |
| | | | |
Year ended June 30, 2014 | | | 0.00 | % |
Year ended June 30, 2013 | | | 0.01 | % |
Year ended June 30, 2012 | | | 0.00 | % |
The accompanying notes are an integral part of these financial statements.
| | | | |
| 18 | | Wells Fargo Pennsylvania Tax-Free Fund | | Financial highlights |
(For a share outstanding throughout each period)
| | | | | | | | | | | | | | | | | | | | |
| | | Year ended June 30 | |
| CLASS B | | 2016 | | | 2015 | | | 2014 | | | 2013 | | | 2012 | |
Net asset value, beginning of period | | | $11.71 | | | | $11.60 | | | | $11.32 | | | | $11.61 | | | | $10.89 | |
Net investment income | | | 0.30 | 1 | | | 0.33 | 1 | | | 0.34 | 1 | | | 0.33 | 1 | | | 0.36 | 1 |
Net realized and unrealized gains (losses) on investments | | | 0.37 | | | | 0.10 | | | | 0.28 | | | | (0.29 | ) | | | 0.72 | |
| | | | | | | | | | | | | | | | | | | | |
Total from investment operations | | | 0.67 | | | | 0.43 | | | | 0.62 | | | | 0.04 | | | | 1.08 | |
Distributions to shareholders from | | | | | | | | | | | | | | | | | | | | |
Net investment income | | | (0.29 | ) | | | (0.32 | ) | | | (0.34 | ) | | | (0.33 | ) | | | (0.36 | ) |
Net asset value, end of period | | | $12.09 | | | | $11.71 | | | | $11.60 | | | | $11.32 | | | | $11.61 | |
Total return2 | | | 5.83 | % | | | 3.75 | % | | | 5.58 | % | | | 0.26 | % | | | 10.01 | % |
Ratios to average net assets (annualized) | | | | | | | | | | | | | | | | | | | | |
Gross expenses | | | 1.65 | % | | | 1.65 | % | | | 1.66 | %3 | | | 1.63 | %3 | | | 1.62 | %3 |
Net expenses | | | 1.49 | % | | | 1.49 | % | | | 1.49 | %3 | | | 1.50 | %3 | | | 1.49 | %3 |
Net investment income | | | 2.49 | % | | | 2.78 | % | | | 3.00 | % | | | 2.80 | % | | | 3.15 | % |
Supplemental data | | | | | | | | | | | | | | | | | | | | |
Portfolio turnover rate | | | 13 | % | | | 15 | % | | | 15 | % | | | 14 | % | | | 21 | % |
Net assets, end of period (000s omitted) | | | $538 | | | | $641 | | | | $865 | | | | $1,377 | | | | $2,264 | |
| 1 | Calculated based upon average shares outstanding |
| 2 | Total return calculations do not include any sales charges. |
| 3 | Ratios include interest and fee expense relating to inverse floating-rate obligations as follows: |
| | | | |
Year ended June 30, 2014 | | | 0.00 | % |
Year ended June 30, 2013 | | | 0.01 | % |
Year ended June 30, 2012 | | | 0.00 | % |
The accompanying notes are an integral part of these financial statements.
| | | | | | |
| Financial highlights | | Wells Fargo Pennsylvania Tax-Free Fund | | | 19 | |
(For a share outstanding throughout each period)
| | | | | | | | | | | | | | | | | | | | |
| | | Year ended June 30 | |
| CLASS C | | 2016 | | | 2015 | | | 2014 | | | 2013 | | | 2012 | |
Net asset value, beginning of period | | | $11.73 | | | | $11.63 | | | | $11.34 | | | | $11.63 | | | | $10.91 | |
Net investment income | | | 0.29 | 1 | | | 0.33 | | | | 0.34 | | | | 0.33 | | | | 0.36 | |
Net realized and unrealized gains (losses) on investments | | | 0.38 | | | | 0.09 | | | | 0.29 | | | | (0.29 | ) | | | 0.72 | |
| | | | | | | | | | | | | | | | | | | | |
Total from investment operations | | | 0.67 | | | | 0.42 | | | | 0.63 | | | | 0.04 | | | | 1.08 | |
Distributions to shareholders from | | | | | | | | | | | | | | | | | | | | |
Net investment income | | | (0.29 | ) | | | (0.32 | ) | | | (0.34 | ) | | | (0.33 | ) | | | (0.36 | ) |
Net asset value, end of period | | | $12.11 | | | | $11.73 | | | | $11.63 | | | | $11.34 | | | | $11.63 | |
Total return2 | | | 5.83 | % | | | 3.66 | % | | | 5.67 | % | | | 0.27 | % | | | 9.99 | % |
Ratios to average net assets (annualized) | | | | | | | | | | | | | | | | | | | | |
Gross expenses | | | 1.65 | % | | | 1.65 | % | | | 1.66 | %3 | | | 1.63 | %3 | | | 1.63 | %3 |
Net expenses | | | 1.49 | % | | | 1.49 | % | | | 1.49 | %3 | | | 1.50 | %3 | | | 1.49 | %3 |
Net investment income | | | 2.46 | % | | | 2.78 | % | | | 3.00 | % | | | 2.79 | % | | | 3.15 | % |
Supplemental data | | | | | | | | | | | | | | | | | | | | |
Portfolio turnover rate | | | 13 | % | | | 15 | % | | | 15 | % | | | 14 | % | | | 21 | % |
Net assets, end of period (000s omitted) | | | $19,493 | | | | $13,062 | | | | $11,192 | | | | $9,798 | | | | $9,815 | |
| 1 | Calculated based upon average shares outstanding |
| 2 | Total return calculations do not include any sales charges. |
| 3 | Ratios include interest and fee expense relating to inverse floating-rate obligations as follows: |
| | | | |
Year ended June 30, 2014 | | | 0.00 | % |
Year ended June 30, 2013 | | | 0.01 | % |
Year ended June 30, 2012 | | | 0.00 | % |
The accompanying notes are an integral part of these financial statements.
| | | | |
| 20 | | Wells Fargo Pennsylvania Tax-Free Fund | | Financial highlights |
(For a share outstanding throughout each period)
| | | | | | | | | | | | | | | | | | | | |
| | | Year ended June 30 | |
| INSTITUTIONAL CLASS | | 2016 | | | 2015 | | | 2014 | | | 2013 | | | 2012 | |
Net asset value, beginning of period | | | $11.75 | | | | $11.65 | | | | $11.36 | | | | $11.65 | | | | $10.93 | |
Net investment income | | | 0.41 | 1 | | | 0.44 | | | | 0.45 | | | | 0.45 | 1 | | | 0.47 | |
Net realized and unrealized gains (losses) on investments | | | 0.38 | | | | 0.10 | | | | 0.29 | | | | (0.29 | ) | | | 0.72 | |
| | | | | | | | | | | | | | | | | | | | |
Total from investment operations | | | 0.79 | | | | 0.54 | | | | 0.74 | | | | 0.16 | | | | 1.19 | |
Distributions to shareholders from | | | | | | | | | | | | | | | | | | | | |
Net investment income | | | (0.41 | ) | | | (0.44 | ) | | | (0.45 | ) | | | (0.45 | ) | | | (0.47 | ) |
Net asset value, end of period | | | $12.13 | | | | $11.75 | | | | $11.65 | | | | $11.36 | | | | $11.65 | |
Total return | | | 6.88 | % | | | 4.70 | % | | | 6.72 | % | | | 1.28 | % | | | 11.08 | % |
Ratios to average net assets (annualized) | | | | | | | | | | | | | | | | | | | | |
Gross expenses | | | 0.57 | % | | | 0.57 | % | | | 0.58 | %2 | | | 0.55 | %2 | | | 0.55 | %2 |
Net expenses | | | 0.49 | % | | | 0.49 | % | | | 0.49 | %2 | | | 0.50 | %2 | | | 0.49 | %2 |
Net investment income | | | 3.47 | % | | | 3.78 | % | | | 4.00 | % | | | 3.79 | % | | | 4.15 | % |
Supplemental data | | | | | | | | | | | | | | | | | | | | |
Portfolio turnover rate | | | 13 | % | | | 15 | % | | | 15 | % | | | 14 | % | | | 21 | % |
Net assets, end of period (000s omitted) | | | $132,844 | | | | $106,769 | | | | $119,276 | | | | $148,684 | | | | $171,861 | |
| 1 | Calculated based upon average shares outstanding |
| 2 | Ratios include interest and fee expense relating to inverse floating-rate obligations as follows: |
| | | | |
Year ended June 30, 2014 | | | 0.00 | % |
Year ended June 30, 2013 | | | 0.01 | % |
Year ended June 30, 2012 | | | 0.00 | % |
The accompanying notes are an integral part of these financial statements.
| | | | | | |
| Notes to financial statements | | Wells Fargo Pennsylvania Tax-Free Fund | | | 21 | |
1. ORGANIZATION
Wells Fargo Funds Trust (the “Trust”), a Delaware statutory trust organized on March 10, 1999, is an open-end management investment company registered under the Investment Company Act of 1940, as amended (the “1940 Act”). As an investment company, the Trust follows the accounting and reporting guidance in Financial Accounting Standards Board (“FASB”) Accounting Standards Codification Topic 946, Financial Services – Investment Companies. These financial statements report on the Wells Fargo Pennsylvania Tax-Free Fund (the “Fund”) which is a diversified series of the Trust.
2. SIGNIFICANT ACCOUNTING POLICIES
The following significant accounting policies, which are consistently followed in the preparation of the financial statements of the Fund, are in conformity with U.S. generally accepted accounting principles which require management to make estimates and assumptions that affect the reported amounts of assets and liabilities, disclosure of contingent assets and liabilities at the date of the financial statements, and the reported amounts of revenues and expenses during the reporting period. Actual results could differ from those estimates.
Securities valuation
All investments are valued each business day as of the close of regular trading on the New York Stock Exchange (generally 4 p.m. Eastern Time), although a Fund may deviate from this calculation time under unusual or unexpected circumstances.
Debt securities are valued at the evaluated bid price provided by an independent pricing service or, if a reliable price is not available, the quoted bid price from an independent broker-dealer.
Investments in registered open-end investment companies are valued at net asset value.
Investments which are not valued using any of the methods discussed above are valued at their fair value, as determined in good faith by the Board of Trustees of the Fund. The Board of Trustees has established a Valuation Committee comprised of the Trustees and has delegated to it the authority to take any actions regarding the valuation of portfolio securities that the Valuation Committee deems necessary or appropriate, including determining the fair value of portfolio securities, unless the determination has been delegated to the Management Valuation Team of Wells Fargo Funds Management, LLC (“Funds Management”). The Board of Trustees retains the authority to make or ratify any valuation decisions or approve any changes to the Valuation Procedures as it deems appropriate. On a quarterly basis, the Board of Trustees receives reports on any valuation actions taken by the Valuation Committee or the Management Valuation Team which may include items for ratification.
Valuations of fair valued securities are compared to the next actual sales price when available, or other appropriate market values, to assess the continued appropriateness of the fair valuation methodologies used. These securities are fair valued on a day-to-day basis, taking into consideration changes to appropriate market information and any significant changes to the inputs considered in the valuation process until there is a readily available price provided on an exchange or by an independent pricing service. Valuations received from an independent pricing service or independent broker-dealer quotes are periodically validated by comparisons to most recent trades and valuations provided by other independent pricing services in addition to the review of prices by the manager and/or subadviser. Unobservable inputs used in determining fair valuations are identified based on the type of security, taking into consideration factors utilized by market participants in valuing the investment, knowledge about the issuer and the current market environment.
When-issued transactions
The Fund may purchase securities on a forward commitment or when-issued basis. The Fund records a when-issued transaction on the trade date and will segregate assets in an amount at least equal in value to the Fund’s commitment to purchase when-issued securities. Securities purchased on a when-issued basis are marked-to-market daily and the Fund begins earning interest on the settlement date. Losses may arise due to changes in the market value of the underlying securities or if the counterparty does not perform under the contract.
Security transactions and income recognition
Securities transactions are recorded on a trade date basis. Realized gains or losses are recorded on the basis of identified cost.
Interest income is accrued daily and bond discounts are accreted and premiums are amortized daily based on the effective interest method. To the extent debt obligations are placed on non-accrual status, any related interest income may be reduced by writing off interest receivables when the collection of all or a portion of interest has become doubtful based on consistently applied procedures. If the issuer subsequently resumes interest payments or when the collectability of interest is reasonably assured, the debt obligation is removed from non-accrual status.
| | | | |
| 22 | | Wells Fargo Pennsylvania Tax-Free Fund | | Notes to financial statements (unaudited) |
Distributions to shareholders
Distributions to shareholders from net investment income are accrued daily and paid monthly. Distributions from net realized gains, if any, are recorded on the ex-dividend date. Such distributions are determined in conformity with federal income tax regulations, which may differ in amount or character from net investment income and realized gains recognized for purposes of U.S. generally accepted accounting principles.
Federal and other taxes
The Fund intends to continue to qualify as a regulated investment company by distributing substantially all of its investment company taxable and tax-exempt income and any net realized capital gains (after reduction for capital loss carryforwards) sufficient to relieve it from all, or substantially all, federal income taxes. Accordingly, no provision for federal income taxes was required.
The Fund’s income and federal excise tax returns and all financial records supporting those returns for the prior three fiscal years are subject to examination by the federal and Delaware revenue authorities. Management has analyzed the Fund’s tax positions taken on federal, state, and foreign tax returns for all open tax years and does not believe that there are any uncertain tax positions that require recognition of a tax liability.
Reclassifications are made to the Fund’s capital accounts for permanent tax differences to reflect income and gains available for distribution (or available capital loss carryforwards) under federal income tax regulations. U.S. generally accepted accounting principles require that certain components of net assets be adjusted to reflect permanent differences between financial and tax reporting. These reclassifications have no effect on net assets or net asset values per share. The primary permanent differences causing such reclassifications are due to expiration of capital loss carryforwards. At June 30, 2016, as a result of permanent book-to-tax differences, the following reclassification adjustments were made on the Statement of Assets and Liabilities:
| | |
Paid-in capital | | Accumulated net
realized losses
on investments |
| (4,125,739) | | $4,125,739 |
As of June 30, 2016, the Fund had capital loss carryforwards available to offset future net realized capital gains in the amount of $5,875,768 expiring in 2017.
Class allocations
The separate classes of shares offered by the Fund differ principally in applicable sales charges, distribution, shareholder servicing, and administration fees. Class specific expenses are charged directly to that share class. Investment income, common expenses, and realized and unrealized gains (losses) on investments are allocated daily to each class of shares based on the relative proportion of net assets of each class.
3. FAIR VALUATION MEASUREMENTS
Fair value measurements of investments are determined within a framework that has established a fair value hierarchy based upon the various data inputs utilized in determining the value of the Fund’s investments. The three-level hierarchy gives the highest priority to unadjusted quoted prices in active markets for identical assets or liabilities (Level 1) and the lowest priority to significant unobservable inputs (Level 3). The Fund’s investments are classified within the fair value hierarchy based on the lowest level of input that is significant to the fair value measurement. The inputs are summarized into three broad levels as follows:
| n | | Level 1 – quoted prices in active markets for identical securities |
| n | | Level 2 – other significant observable inputs (including quoted prices for similar securities, interest rates, prepayment speeds, credit risk, use of amortized cost, etc.) |
| n | | Level 3 – significant unobservable inputs (including the Fund’s own assumptions in determining the fair value of investments) |
The inputs or methodologies used for valuing investments in securities are not necessarily an indication of the risk associated with investing in those securities.
| | | | | | |
| Notes to financial statements | | Wells Fargo Pennsylvania Tax-Free Fund | | | 23 | |
The following is a summary of the inputs used in valuing the Fund’s assets and liabilities as of June 30, 2016:
| | | | | | | | | | | | | | | | |
| | | Quoted prices
(Level 1) | | | Other significant
observable inputs
(Level 2) | | | Significant
unobservable inputs (Level 3) | | | Total | |
Assets | | | | | | | | | | | | | | | | |
Investments in: | | | | | | | | | | | | | | | | |
| | | | |
Municipal obligations | | $ | 0 | | | $ | 209,622,650 | | | $ | 0 | | | $ | 209,622,650 | |
| | | | |
Short-term investments | | | | | | | | | | | | | | | | |
Investment companies | | | 1,714,696 | | | | 0 | | | | 0 | | | | 1,714,696 | |
Total assets | | $ | 1,714,696 | | | $ | 209,622,650 | | | $ | 0 | | | $ | 211,337,346 | |
The Fund recognizes transfers between levels within the fair value hierarchy at the end of the reporting period. At June 30, 2016, the Fund did not have any transfers into/out of Level 1, Level 2, or Level 3.
4. TRANSACTIONS WITH AFFILIATES
Management fee
Funds Management, an indirect wholly owned subsidiary of Wells Fargo & Company (“Wells Fargo”), is the manager of the Fund and provides advisory and fund-level administrative services under an investment management agreement. Under the investment management agreement, Funds Management is responsible for, among other services, implementing the investment objectives and strategies of the Fund, supervising the subadviser, providing fund-level administrative services in connection with the Fund’s operations, and providing any other fund-level administrative services reasonably necessary for the operation of the Fund. As compensation for its services under the investment management agreement, Funds Management is entitled to receive an annual management fee starting at 0.40% and declining to 0.28% as the average daily net assets of the Fund increase. For the year ended June 30, 2016, the management fee was equivalent to an annual rate of 0.40% of the Fund’s average daily net assets.
Funds Management has retained the services of a subadviser to provide daily portfolio management to the Fund. The fee for subadvisory services is borne by Funds Management. Wells Capital Management Incorporated, an affiliate of Funds Management and an indirect wholly owned subsidiary of Wells Fargo, is the subadviser to the Fund and is entitled to receive a fee from Funds Management at an annual rate starting at 0.20% and declining to 0.10% as the average daily net assets of the Fund increase.
Administration fees
Under a class-level administration agreement, Funds Management provides class-level administrative services to the Fund, which includes paying fees and expenses for services provided by the transfer agent, sub-transfer agents, omnibus account servicers and record-keepers. As compensation for its services under the class-level administration agreement, Funds Management receives an annual fee which is calculated based on the average daily net assets of each class as follows:
| | | | |
| | | Class-level administration fee | |
Class A, Class B, Class C | | | 0.16 | % |
Institutional Class | | | 0.08 | |
Funds Management has contractually waived and/or reimbursed management and administration fees to the extent necessary to maintain certain net operating expense ratios for the Fund. Waiver of fees and/or reimbursement of expenses by Funds Management were made first from fund level expenses on a proportionate basis and then from class specific expenses. Funds Management has committed through October 31, 2016 to waive fees and/or reimburse expenses to the extent necessary to cap the Fund’s expenses at 0.74% for Class A shares, 1.49% for Class B shares, 1.49% for Class C shares, and 0.49% for Institutional Class shares. After this time, the cap may be increased or the commitment to maintain the cap may be terminated only with the approval of the Board of Trustees.
Distribution fees
The Trust has adopted a distribution plan for Class B and Class C shares of the Fund pursuant to Rule 12b-1 under the 1940 Act. Distribution fees are charged to Class B and Class C shares and paid to Wells Fargo Funds Distributor, LLC (“Funds Distributor”), the principal underwriter, at an annual rate of 0.75% of the average daily net assets of Class B and Class C shares.
| | | | |
| 24 | | Wells Fargo Pennsylvania Tax-Free Fund | | Notes to financial statements |
In addition, Funds Distributor is entitled to receive the front-end sales charge from the purchase of Class A shares and a contingent deferred sales charge on the redemption of certain Class A shares. Funds Distributor is also entitled to receive the contingent deferred sales charges from redemptions of Class B and Class C shares. For the year ended June 30, 2016, Funds Distributor received $18,749 from the sale of Class A shares.
Shareholder servicing fees
The Trust has entered into contracts with one or more shareholder servicing agents, whereby Class A, Class B, and Class C of the Fund are charged a fee at an annual rate of 0.25% of the average daily net assets of each respective class. A portion of these total shareholder servicing fees were paid to affiliates of Wells Fargo.
5. INVESTMENT PORTFOLIO TRANSACTIONS
Purchases and sales of investments, excluding U.S. government obligations (if any) and short-term securities, for the year ended June 30, 2016 were $73,067,034 and $24,116,368, respectively.
The Fund may purchase or sell investment securities to other Wells Fargo funds under procedures adopted by the Board of Trustees. The procedures have been designed to ensure that these interfund transactions, which generally do not incur broker commissions, are effected at current market prices. Interfund trades are included within the respective purchases and sales amounts shown.
6. BANK BORROWINGS
The Trust (excluding the money market funds and certain other funds) and Wells Fargo Variable Trust are parties to a $200,000,000 revolving credit agreement whereby the Fund is permitted to use bank borrowings for temporary or emergency purposes, such as to fund shareholder redemption requests. Interest under the credit agreement is charged to the Fund based on a borrowing rate equal to the higher of the Federal Funds rate in effect on that day plus 1.25% or the overnight LIBOR rate in effect on that day plus 1.25%. In addition, an annual commitment fee equal to 0.20% of the unused balance is allocated to each participating fund. Prior to September 1, 2015, the revolving credit agreement amount was $150,000,000 and the annual commitment fee was equal to 0.10% of the unused balance which was allocated to each participating fund.
For the year ended June 30, 2016, there were no borrowings by the Fund under the agreement.
7. DISTRIBUTIONS TO SHAREHOLDERS
The tax character of distributions paid during the years ended June 30, 2016 and June 30, 2015 were as follows:
| | | | | | | | |
| | | Year ended June 30, | |
| | | 2016 | | | 2015 | |
Ordinary income | | $ | 0 | | | $ | 56,319 | |
Tax-exempt income | | | 6,202,910 | | | | 6,255,064 | |
As of June 30, 2016, the components of distributable earnings on a tax basis were as follows:
| | | | |
Undistributed tax-exempt income | | Unrealized gains | | Capital loss carryforward |
| $62,036 | | $15,512,343 | | $(5,875,768) |
8. CONCENTRATION RISK
The Fund invests a substantial portion of its assets in issuers of municipal debt securities located in a single state or territories of the U.S. Therefore, it may be more affected by economic and political developments in that state or region than would be a comparable general tax-exempt fund.
9. INDEMNIFICATION
Under the Trust’s organizational documents, the officers and Trustees have been granted certain indemnification rights against certain liabilities that may arise out of performance of their duties to the Trust. Additionally, in the normal course of business, the Trust may enter into contracts with service providers that contain a variety of indemnification clauses. The Trust’s maximum exposure under these arrangements is dependent on future claims that may be made against the Fund and, therefore, cannot be estimated.
| | | | | | |
| Report of independent registered public accounting firm | | Wells Fargo Pennsylvania Tax-Free Fund | | | 25 | |
BOARD OF TRUSTEES AND SHAREHOLDERS OF WELLS FARGO FUNDS TRUST:
We have audited the accompanying statement of assets and liabilities, including the portfolio of investments, of the Wells Fargo Pennsylvania Tax-Free Fund (formerly known as Wells Fargo Advantage Pennsylvania Tax-Free Fund) (the “Fund”), one of the funds constituting the Wells Fargo Funds Trust, as of June 30, 2016, and the related statement of operations for the year then ended, the statements of changes in net assets for each of the years in the two-year period then ended, and the financial highlights for each of the years in the five-year period then ended. These financial statements and financial highlights are the responsibility of the Fund’s management. Our responsibility is to express an opinion on these financial statements and financial highlights based on our audits.
We conducted our audits in accordance with the standards of the Public Company Accounting Oversight Board (United States). Those standards require that we plan and perform the audit to obtain reasonable assurance about whether the financial statements and financial highlights are free of material misstatement. An audit includes examining, on a test basis, evidence supporting the amounts and disclosures in the financial statements. Our procedures included confirmation of securities owned as of June 30, 2016, by correspondence with custodians and brokers, or by other appropriate auditing procedures. An audit also includes assessing the accounting principles used and significant estimates made by management, as well as evaluating the overall financial statement presentation. We believe that our audits provide a reasonable basis for our opinion.
In our opinion, the financial statements and financial highlights referred to above present fairly, in all material respects, the financial position of the Wells Fargo Pennsylvania Tax-Free Fund as of June 30, 2016, and the results of its operations for the year then ended, the changes in its net assets for each of the years in the two-year period then ended, and the financial highlights for each of the years in the five-year period then ended, in conformity with U.S. generally accepted accounting principles.

Boston, Massachusetts
August 25, 2016
| | | | |
| 26 | | Wells Fargo Pennsylvania Tax-Free Fund | | Other information (unaudited) |
TAX INFORMATION
Pursuant to Section 852 of the Internal Revenue Code, 100% of distributions paid from net investment income is designated as exempt-interest dividends for the fiscal year ended June 30, 2016.
PROXY VOTING INFORMATION
A description of the policies and procedures that the Fund uses to determine how to vote proxies relating to portfolio securities is available, upon request, by calling 1-800-222-8222, visiting our website at wellsfargofunds.com, or visiting the SEC website at sec.gov. Information regarding how the Fund voted proxies relating to portfolio securities during the most recent 12-month period ended June 30 is available on the Fund’s website at wellsfargofunds.com or by visiting the SEC website at sec.gov.
PORTFOLIO HOLDINGS INFORMATION
The complete portfolio holdings for the Fund are publicly available monthly on the Fund’s website (wellsfargofunds.com), on a one-month delayed basis. In addition, top ten holdings information (excluding derivative positions) for the Fund is publicly available on the Fund’s website on a monthly, seven-day or more delayed basis. The Fund files its complete schedule of portfolio holdings with the SEC for the first and third quarters of each fiscal year on Form N-Q, which is available by visiting the SEC website at sec.gov. In addition, the Fund’s Form N-Q may be reviewed and copied at the SEC’s Public Reference Room in Washington, DC, and at regional offices in New York City, at 233 Broadway, and in Chicago, at 175 West Jackson Boulevard, Suite 900. Information about the Public Reference Room may be obtained by calling 1-800-SEC-0330.
| | | | | | |
| Other information (unaudited) | | Wells Fargo Pennsylvania Tax-Free Fund | | | 27 | |
BOARD OF TRUSTEES AND OFFICERS
Each of the Trustees and Officers1 listed in the table below acts in identical capacities for each fund in the Wells Fargo family of funds, which consists of 142 mutual funds comprising the Wells Fargo Funds Trust, Wells Fargo Variable Trust, Wells Fargo Master Trust and four closed-end funds (collectively the “Fund Complex”). This table should be read in conjunction with the Prospectus and the Statement of Additional Information2. The mailing address of each Trustee and Officer is 525 Market Street, 12th Floor, San Francisco, CA 94105. Each Trustee and Officer serves an indefinite term, however, each Trustee serves such term until reaching the mandatory retirement age established by the Trustees.
Independent Trustees
| | | | | | |
Name and year of birth | | Position held and length of service* | | Principal occupations during past five years or longer | | Current other public
company or investment
company directorships |
| William R. Ebsworth (Born 1957) | | Trustee, since 2015 | | Retired. From 1984 to 2013, equities analyst, portfolio manager, research director and chief financial officer at Fidelity Management and Research Company in Boston, Tokyo, and Hong Kong and retired in 2013 as Chief Investment Officer of Fidelity Strategic Advisers, Inc. where he lead a team of investment professionals managing client assets. Prior thereto, Board member of Hong Kong Securities Clearing Co., Hong Kong Options Clearing Corp., the Thailand International Fund, Ltd., Fidelity Investments Life Insurance Company, and Empire Fidelity Investments Life Insurance Company. Mr. Ebsworth is a CFA® charterholder and an Adjunct Lecturer, Finance, at Babson College. | | Asset Allocation Trust |
| Jane A. Freeman (Born 1953) | | Trustee, since 2015 | | Retired. From 2012 to 2014 and 1999 to 2008, Chief Financial Officer of Scientific Learning Corporation. From 2008 to 2012, Ms. Freeman provided consulting services related to strategic business projects. Prior to 1999, Portfolio Manager at Rockefeller & Co. and Scudder, Stevens & Clark. Board member of the Harding Loevner Funds from 1996 to 2014, serving as both Lead Independent Director and chair of the Audit Committee. Board member of the Russell Exchange Traded Funds Trust from 2011 to 2012 and the chair of the Audit Committee. Ms. Freeman is Chair of Taproot Foundation (non-profit organization), a Board Member of Ruth Bancroft Garden (non-profit organization) and an inactive chartered financial analyst. | | Asset Allocation Trust |
| Peter G. Gordon (Born 1942) | | Trustee, since 1998; Chairman, since 2005 | | Co-Founder, Retired Chairman, President and CEO of Crystal Geyser Water Company. Trustee Emeritus, Colby College. | | Asset Allocation Trust |
| Isaiah Harris, Jr. (Born 1952) | | Trustee, since 2009 | | Retired. Chairman of the Board of CIGNA Corporation since 2009, and Director since 2005. From 2003 to 2011, Director of Deluxe Corporation. Prior thereto, President and CEO of BellSouth Advertising and Publishing Corp. from 2005 to 2007, President and CEO of BellSouth Enterprises from 2004 to 2005 and President of BellSouth Consumer Services from 2000 to 2003. Emeritus member of the Iowa State University Foundation Board of Governors. Emeritus Member of the Advisory Board of Iowa State University School of Business. Advisory Board Member, Palm Harbor Academy (charter school). Advisory Board Member, Child Evangelism Fellowship (non-profit). Mr. Harris is a certified public accountant (inactive status). | | CIGNA Corporation; Asset Allocation Trust |
| Judith M. Johnson (Born 1949) | | Trustee, since 2008; Audit Committee Chairman, since 2008 | | Retired. Prior thereto, Chief Executive Officer and Chief Investment Officer of Minneapolis Employees Retirement Fund from 1996 to 2008. Ms. Johnson is an attorney, certified public accountant and a certified managerial accountant. | | Asset Allocation Trust |
| David F. Larcker (Born 1950) | | Trustee, since 2009 | | James Irvin Miller Professor of Accounting at the Graduate School of Business, Stanford University, Director of the Corporate Governance Research Initiative and Senior Faculty of The Rock Center for Corporate Governance since 2006. From 2005 to 2008, Professor of Accounting at the Graduate School of Business, Stanford University. Prior thereto, Ernst & Young Professor of Accounting at The Wharton School, University of Pennsylvania from 1985 to 2005. | | Asset Allocation Trust |
| | | | |
| 28 | | Wells Fargo Pennsylvania Tax-Free Fund | | Other information (unaudited) |
| | | | | | |
Name and year of birth | | Position held and length of service* | | Principal occupations during past five years or longer | | Current other public
company or investment
company directorships |
| Olivia S. Mitchell (Born 1953) | | Trustee, since 2006 | | International Foundation of Employee Benefit Plans Professor, Wharton School of the University of Pennsylvania since 1993. Director of Wharton’s Pension Research Council and Boettner Center on Pensions & Retirement Research, and Research Associate at the National Bureau of Economic Research. Previously, Cornell University Professor from 1978 to 1993. | | Asset Allocation Trust |
| Timothy J. Penny (Born 1951) | | Trustee, since 1996 | | President and Chief Executive Officer of Southern Minnesota Initiative Foundation, a non-profit organization, since 2007 and Senior Fellow at the Humphrey Institute Policy Forum at the University of Minnesota since 1995. Member of the Board of Trustees of NorthStar Education Finance, Inc., a non-profit organization, since 2007. | | Asset Allocation Trust |
| Michael S. Scofield (Born 1943) | | Trustee, since 2010 | | Served on the Investment Company Institute’s Board of Governors and Executive Committee from 2008-2011 as well the Governing Council of the Independent Directors Council from 2006-2011 and the Independent Directors Council Executive Committee from 2008-2011. Chairman of the IDC from 2008-2010. Institutional Investor (Fund Directions) Trustee of Year in 2007. Trustee of the Evergreen Funds complex (and its predecessors) from 1984 to 2010. Chairman of the Evergreen Funds from 2000-2010. Former Trustee of the Mentor Funds. Retired Attorney, Law Offices of Michael S. Scofield. | | Asset Allocation Trust |
| * | Length of service dates reflect the Trustee’s commencement of service with the Trust’s predecessor entities, where applicable. |
Officers
| | | | | | |
Name and year of birth | | Position held and length of service | | Principal occupations during past five years or longer | | |
| Karla M. Rabusch (Born 1959) | | President, since 2003 | | Executive Vice President of Wells Fargo Bank, N.A. and President of Wells Fargo Funds Management, LLC since 2003. | | |
Nancy Wiser1 (Born 1967) | | Treasurer, since 2012 | | Executive Vice President of Wells Fargo Funds Management, LLC since 2011. Chief Operating Officer and Chief Compliance Officer at LightBox Capital Management LLC, from 2008 to 2011. | | |
| C. David Messman (Born 1960) | | Secretary, since 2000; Chief Legal Officer, since 2003 | | Senior Vice President and Secretary of Wells Fargo Funds Management, LLC since 2001. Assistant General Counsel of Wells Fargo Bank, N.A. since 2013 and Vice President and Managing Counsel of Wells Fargo Bank, N.A. from 1996 to 2013. | | |
| Michael Whitaker (Born 1967) | | Chief Compliance Officer, since 2016* | | Executive Vice President of Wells Fargo Funds Management, LLC since 2016. Chief Compliance Officer of Fidelity’s Fixed Income Funds and Asset Allocation Funds from 2008 to 2016, Compliance Officer of FMR Co., Inc. from 2014 to 2016, Fidelity Investments Money Management, Inc. from 2014 to 2016, Fidelity Investments from 2007 to 2016. | | |
David Berardi (Born 1975) | | Assistant Treasurer, since 2009 | | Vice President of Wells Fargo Funds Management, LLC since 2009. Vice President of Evergreen Investment Management Company, LLC from 2008 to 2010. Manager of Fund Reporting and Control for Evergreen Investment Management Company, LLC from 2004 to 2010. | | |
| Jeremy DePalma1 (Born 1974) | | Assistant Treasurer, since 2009 | | Senior Vice President of Wells Fargo Funds Management, LLC since 2009. Senior Vice President of Evergreen Investment Management Company, LLC from 2008 to 2010 and head of the Fund Reporting and Control Team within Fund Administration from 2005 to 2010. | | |
| 1 | Nancy Wiser acts as Treasurer of 73 funds in the Fund Complex. Jeremy DePalma acts as Treasurer of 69 funds and Assistant Treasurer of 73 funds in the Fund Complex. |
| 2 | The Statement of Additional Information includes additional information about the Trustees and is available, without charge, upon request, by calling 1-800-222-8222 or by visiting the website at wellsfargofunds.com. |
| * | Michael Whitaker became Chief Compliance Officer effective May 16, 2016. |
| | | | | | |
| Other information (unaudited) | | Wells Fargo Pennsylvania Tax-Free Fund | | | 29 | |
BOARD CONSIDERATION OF INVESTMENT MANAGEMENT AND SUB-ADVISORY AGREEMENTS:
Under the Investment Company Act of 1940 (the “1940 Act”), the Board of Trustees (the “Board”) of Wells Fargo Funds Trust (the “Trust”) must determine annually whether to approve the continuation of the Trust’s investment management and sub-advisory agreements. In this regard, at an in-person meeting held on May 24-25, 2016 (the “Meeting”), the Board, all the members of which have no direct or indirect interest in the investment management and sub-advisory agreements and are not “interested persons” of the Trust, as defined in the 1940 Act (the “Independent Trustees”), reviewed and approved for Wells Fargo Pennsylvania Tax-Free Fund (the “Fund”): (i) an investment management agreement (the “Management Agreement”) with Wells Fargo Funds Management, LLC (“Funds Management”); and (ii) an investment sub-advisory agreement (the “Sub-Advisory Agreement”) with Wells Capital Management Incorporated (the “Sub-Adviser”), an affiliate of Funds Management. The Management Agreement and the Sub-Advisory Agreement are collectively referred to as the “Advisory Agreements.”
At the Meeting, the Board considered the factors and reached the conclusions described below relating to the selection of Funds Management and the Sub-Adviser and the approval of the Advisory Agreements. Prior to the Meeting, including at an in-person meeting in April 2016, the Trustees conferred extensively among themselves and with representatives of Funds Management about these matters. Also, the Board has adopted a team-based approach, with each team consisting of a sub-set of Trustees, to assist the full Board in the discharge of its duties in reviewing performance and other matters throughout the year. The Independent Trustees were assisted in their evaluation of the Advisory Agreements by independent legal counsel, from whom they received separate legal advice and with whom they met separately.
In providing information to the Board, Funds Management and the Sub-Adviser were guided by a detailed set of requests for information submitted to them by independent legal counsel on behalf of the Independent Trustees at the start of the Board’s annual contract renewal process earlier in 2016. In considering and approving the Advisory Agreements, the Trustees considered the information they believed relevant, including but not limited to the information discussed below. The Board considered not only the specific information presented in connection with the Meeting, but also the knowledge gained over time through interaction with Funds Management and the Sub-Adviser about various topics. In this regard, the Board reviewed reports of Funds Management at each of its quarterly meetings, which included, among other things, portfolio reviews and performance reports. In addition, the Board and the teams mentioned above confer with portfolio managers at various times throughout the year. The Board did not identify any particular information or consideration that was all-important or controlling, and each individual Trustee may have attributed different weights to various factors.
After its deliberations, the Board unanimously approved the continuation of the Advisory Agreements for a one-year term and determined that the compensation payable to Funds Management and the Sub-Adviser under each of the Advisory Agreements was reasonable. The Board considered the approval of the Advisory Agreements for the Fund as part of its consideration of agreements for funds across the complex, but its approvals were made on a fund-by-fund basis. The following summarizes a number of important, but not necessarily all, factors considered by the Board in support of its approvals.
Nature, extent and quality of services
The Board received and considered various information regarding the nature, extent and quality of services provided to the Fund by Funds Management and the Sub-Adviser under the Advisory Agreements. This information included a description of the investment advisory services and Fund-level administrative services covered by the Management Agreement, as well as, among other things, a summary of the background and experience of senior management of Funds Management, and the qualifications, background, tenure and responsibilities of each of the portfolio managers primarily responsible for the day-to-day portfolio management of the Fund.
The Board evaluated the ability of Funds Management and the Sub-Adviser to attract and retain qualified investment professionals, including research, advisory and supervisory personnel. The Board further considered the compliance programs and compliance records of Funds Management and the Sub-Adviser. In addition, the Board took into account the full range of services provided to the Fund by Funds Management and its affiliates.
Fund performance and expenses
The Board considered the performance results for the Fund over various time periods ended December 31, 2015. The Board considered these results in comparison to the performance of funds in a universe that was determined by Broadridge Inc. (“Broadridge”) to be similar to the Fund (the “Universe”), and in comparison to the Fund’s benchmark index and to other comparative data. Broadridge is an independent provider of investment company data. The Board received a description of the methodology used by Broadridge to select the mutual funds in the performance
| | | | |
| 30 | | Wells Fargo Pennsylvania Tax-Free Fund | | Other information (unaudited) |
Universe. The Board noted that the performance of the Fund (Class A) was higher than the average performance of the Universe for all periods under review. The Board also noted that the performance of the Fund was higher than or in range of its benchmark, the Barclays Municipal Bond Index, for all periods under review.
The Board also received and considered information regarding the Fund’s net operating expense ratios and their various components, including actual management fees, custodian and other non-management fees, and Rule 12b-1 and non-Rule 12b-1 shareholder service fees. The Board considered these ratios in comparison to the median ratios of funds in class-specific expense groups that were determined by Broadridge to be similar to the Fund (the “Groups”). The Board received a description of the methodology used by Broadridge to select the mutual funds in the expense Groups and an explanation of how funds comprising expense groups and their expense ratios may vary from year-to-year. Based on the Broadridge reports, the Board noted that the net operating expense ratios of the Fund were lower than the median net operating expense ratios of the expense Groups.
The Board took into account the Fund performance and expense information provided to it among the factors considered in deciding to re-approve the Advisory Agreements.
Investment management and sub-advisory fee rates
The Board reviewed and considered the contractual fee rates payable by the Fund to Funds Management under the Management Agreement, as well as the contractual fee rates payable by the Fund to Funds Management for class-level administrative services under a Class-Level Administration Agreement, which include class-level transfer agency and sub-transfer agency costs (collectively, the “Management Rates”). The Board also reviewed and considered the contractual investment sub-advisory fee rates that are payable by Funds Management to the Sub-Adviser for investment sub-advisory services.
Among other information reviewed by the Board was a comparison of the Fund’s Management Rates with the average contractual investment management fee rates of funds in the expense Groups at a common asset level as well as transfer agency costs of the funds in the expense Groups. The Board noted that the Management Rates of the Fund were lower than the sum of these average rates for the Fund’s expense Groups for all share classes.
The Board also received and considered information about the portion of the total management fee that was retained by Funds Management after payment of the fee to the Sub-Adviser for sub-advisory services. In assessing the reasonableness of this amount, the Board received and evaluated information about the nature and extent of responsibilities retained and risks assumed by Funds Management and not delegated to or assumed by the Sub-Adviser, and about Funds Management’s on-going oversight services. However, given the affiliation between Funds Management and the Sub-Adviser, the Board ascribed limited relevance to the allocation of fees between them.
The Board also received and considered information about the nature and extent of services offered and fee rates charged by Funds Management and the Sub-Adviser to other types of clients with investment strategies similar to those of the Fund. In this regard, the Board received information about the significantly greater scope of services, and compliance, reporting and other legal burdens and risks of managing mutual funds compared with those associated with managing assets of non-mutual fund clients such as collective funds or institutional separate accounts.
Based on its consideration of the factors and information it deemed relevant, including those described here, the Board determined that the compensation payable to Funds Management under the Management Agreement and to the Sub-Adviser under the Sub-Advisory Agreement was reasonable, in light of the services covered by the Advisory Agreements.
Profitability
The Board received and considered information concerning the profitability of Funds Management, as well as the profitability of Wells Fargo as a whole, from providing services to the Fund and the fund family as a whole. The Board also received and considered information concerning the profitability of the Sub-Adviser from providing services to the fund family as a whole, noting that the Sub-Adviser’s profitability information with respect to providing services to the Fund was subsumed in the Wells Fargo and Funds Management profitability analysis.
Funds Management reported on the methodologies and estimates used in calculating profitability. Among other things, the Board noted that the levels of profitability reported on a fund-by-fund basis varied widely, depending on factors such as the size and type of fund. Based on its review, the Board did not deem the profits reported by Funds Management or Wells Fargo from its services to the Fund to be at a level that would prevent it from approving the continuation of the Advisory Agreements.
| | | | | | |
| Other information (unaudited) | | Wells Fargo Pennsylvania Tax-Free Fund | | | 31 | |
Economies of scale
With respect to possible economies of scale, the Board noted the existence of breakpoints in the Fund’s management fee structure, which operate generally to reduce the Fund’s expense ratios as the Fund grows in size. It considered that, for a small fund or a fund that shrinks in size, breakpoints conversely can result in higher fee levels. The Board also considered that fee waiver and expense reimbursement arrangements and competitive fee rates at the outset are means of sharing potential economies of scale with shareholders of the Fund and the fund family as a whole. The Board considered Funds Management’s view that any analyses of potential economies of scale in managing a particular fund are inherently limited in light of the joint and common costs and investments that Funds Management incurs across the fund family as a whole.
The Board concluded that the Fund’s fee and expense arrangements, including contractual breakpoints, constituted a reasonable approach to sharing potential economies of scale with the Fund and its shareholders.
Other benefits to Funds Management and the Sub-Adviser
The Board received and considered information regarding potential “fall-out” or ancillary benefits received by Funds Management and its affiliates, including the Sub-Adviser, as a result of their relationships with the Fund. Ancillary benefits could include, among others, benefits directly attributable to other relationships with the Fund and benefits potentially derived from an increase in Funds Management’s and the Sub-Adviser’s business as a result of their relationships with the Fund. The Board noted that various affiliates of Funds Management may receive distribution-related fees, shareholder servicing payments and sub-transfer agency fees in respect of shares sold or held through them and services provided.
The Board also reviewed information about soft dollar credits earned and utilized by the Sub-Adviser, fees earned by Funds Management and the Sub-Adviser from managing a private investment vehicle for the fund family’s securities lending collateral and commissions earned by an affiliated broker from portfolio transactions.
Based on its consideration of the factors and information it deemed relevant, including those described here, the Board did not find that any ancillary benefits received by Funds Management and its affiliates, including the Sub-Adviser, were unreasonable.
Conclusion
At the Meeting, after considering the above-described factors and based on its deliberations and its evaluation of the information described above, the Board unanimously approved the continuation of the Advisory Agreements for a one-year term and determined that the compensation payable to Funds Management and the Sub-Adviser under each of the Advisory Agreements was reasonable.
| | | | |
| 32 | | Wells Fargo Pennsylvania Tax-Free Fund | | List of abbreviations |
The following is a list of common abbreviations for terms and entities that may have appeared in this report.
| ACA | — ACA Financial Guaranty Corporation |
| ADR | — American depositary receipt |
| ADS | — American depositary shares |
| AGC | — Assured Guaranty Corporation |
| AGM | — Assured Guaranty Municipal |
| Ambac | — Ambac Financial Group Incorporated |
| AMT | — Alternative minimum tax |
| BAN | — Bond anticipation notes |
| BHAC | — Berkshire Hathaway Assurance Corporation |
| CAB | — Capital appreciation bond |
| CCAB | — Convertible capital appreciation bond |
| CDA | — Community Development Authority |
| CDO | — Collateralized debt obligation |
| DRIVER | — Derivative inverse tax-exempt receipts |
| DW&P | — Department of Water & Power |
| DWR | — Department of Water Resources |
| ECFA | — Educational & Cultural Facilities Authority |
| EDA | — Economic Development Authority |
| EDFA | — Economic Development Finance Authority |
| ETF | — Exchange-traded fund |
| FDIC | — Federal Deposit Insurance Corporation |
| FFCB | — Federal Farm Credit Banks |
| FGIC | — Financial Guaranty Insurance Corporation |
| FHA | — Federal Housing Administration |
| FHLB | — Federal Home Loan Bank |
| FHLMC | — Federal Home Loan Mortgage Corporation |
| FICO | — The Financing Corporation |
| FNMA | — Federal National Mortgage Association |
| GDR | — Global depositary receipt |
| GNMA | — Government National Mortgage Association |
| HCFR | — Healthcare facilities revenue |
| HEFA | — Health & Educational Facilities Authority |
| HEFAR | — Higher education facilities authority revenue |
| HFA | — Housing Finance Authority |
| HFFA | — Health Facilities Financing Authority |
| HUD | — Department of Housing and Urban Development |
| IDA | — Industrial Development Authority |
| IDAG | — Industrial Development Agency |
| KRW | — Republic of Korea won |
| LIBOR | — London Interbank Offered Rate |
| LIFER | — Long Inverse Floating Exempt Receipts |
| LLC | — Limited liability company |
| LLLP | — Limited liability limited partnership |
| LLP | — Limited liability partnership |
| MBIA | — Municipal Bond Insurance Association |
| MFHR | — Multifamily housing revenue |
| MSTR | — Municipal securities trust receipts |
| MUD | — Municipal Utility District |
| National | — National Public Finance Guarantee Corporation |
| PCFA | — Pollution Control Financing Authority |
| PCL | — Public Company Limited |
| PCR | — Pollution control revenue |
| PFA | — Public Finance Authority |
| PFFA | — Public Facilities Financing Authority |
| PFOTER | — Puttable floating option tax-exempt receipts |
| plc | — Public limited company |
| PUTTER | — Puttable tax-exempt receipts |
| R&D | — Research & development |
| Radian | — Radian Asset Assurance |
| RAN | — Revenue anticipation notes |
| RDA | — Redevelopment Authority |
| RDFA | — Redevelopment Finance Authority |
| REIT | — Real estate investment trust |
| ROC | — Reset option certificates |
| SAVRS | — Select auction variable rate securities |
| SBA | — Small Business Authority |
| SDR | — Swedish depositary receipt |
| SFHR | — Single-family housing revenue |
| SFMR | — Single-family mortgage revenue |
| SPA | — Standby purchase agreement |
| SPDR | — Standard & Poor’s Depositary Receipts |
| SPEAR | — Short Puttable Exempt Adjustable Receipts |
| STRIPS | — Separate trading of registered interest and |
| TAN | — Tax anticipation notes |
| TIPS | — Treasury inflation-protected securities |
| TRAN | — Tax revenue anticipation notes |
| TTFA | — Transportation Trust Fund Authority |
| TVA | — Tennessee Valley Authority |

For more information
More information about Wells Fargo Funds is available free upon request. To obtain literature, please write, email, visit the Fund’s website, or call:
Wells Fargo Funds
P.O. Box 8266
Boston, MA 02266-8266
Email: fundservice@wellsfargo.com
Website: wellsfargofunds.com
Individual investors: 1-800-222-8222
Retail investment professionals: 1-888-877-9275
Institutional investment professionals: 1-866-765-0778
This report and the financial statements contained herein are submitted for the general information of the shareholders of the Fund. If this report is used for promotional purposes, distribution of the report must be accompanied or preceded by a current prospectus. Before investing, please consider the investment objectives, risks, charges, and expenses of the investment. For a current prospectus and, if available, a summary prospectus, containing this information, call 1-800-222-8222 or visit the Fund’s website at wellsfargofunds.com. Read the prospectus carefully before you invest or send money.
Wells Fargo Asset Management (WFAM) is a trade name used by the asset management businesses of Wells Fargo & Company. Wells Fargo Funds Management, LLC, a wholly owned subsidiary of Wells Fargo & Company, provides investment advisory and administrative services for Wells Fargo Funds. Other affiliates of Wells Fargo & Company provide subadvisory and other services for the funds. The funds are distributed by Wells Fargo Funds Distributor, LLC, Member FINRA, an affiliate of Wells Fargo & Company.
NOT FDIC INSURED ¡ NO BANK GUARANTEE ¡ MAY LOSE VALUE
© 2016 Wells Fargo Funds Management, LLC. All rights reserved.
| | |
 | | 244408 08-16 A255/AR255 6-16 |
Annual Report
June 30, 2016

Wells Fargo
Short-Term Municipal Bond Fund


Reduce clutter. Save trees.
Sign up for electronic delivery of prospectuses and shareholder reports at wellsfargo.com/advantagedelivery
Contents
The views expressed and any forward-looking statements are as of June 30, 2016, unless otherwise noted, and are those of the Fund managers and/or Wells Fargo Funds Management, LLC. Discussions of individual securities, or the markets generally, or any Wells Fargo Fund are not intended as individual recommendations. Future events or results may vary significantly from those expressed in any forward-looking statements. The views expressed are subject to change at any time in response to changing circumstances in the market. Wells Fargo Funds Management, LLC and the Fund disclaim any obligation to publicly update or revise any views expressed or forward-looking statements.
NOT FDIC INSURED ¡ NO BANK GUARANTEE ¡ MAY LOSE VALUE
| | | | |
| 2 | | Wells Fargo Short-Term Municipal Bond Fund | | Letter to shareholders (unaudited) |

Karla M. Rabusch
President
Wells Fargo Funds
In fact, yields on municipal bonds that matured in 10 years or more experienced yield declines of more than 100 basis points (100 basis points equals 1.00%) during the reporting period.
Dear Valued Shareholder:
We are pleased to offer you this annual report for the Wells Fargo Short-Term Municipal Bond Fund for the 12-month period that ended June 30, 2016. The U.S. Federal Reserve (Fed) began normalizing monetary policy, raising the federal funds rate to between 0.25% and 0.50% in December 2015. Short-term municipal bond yields rose, but yields on longer-term bonds declined. In fact, yields on municipal bonds that matured in 10 years or more experienced yield declines of more than 100 basis points (100 basis points equals 1.00%) during the reporting period. The Barclays Municipal Bond Index,1 a broad measure tracking investment-grade municipal bonds, returned 7.65% during the 12-month reporting period.
Monetary policy was accommodative.
The Fed continued an easy monetary policy in order to support the economy and the financial system. However, it raised the federal funds target rate in December because it believed the U.S. economy was strong enough to begin normalizing monetary policy. The European Central Bank cut all three of its short-term rates during the reporting period, increased its asset-purchase program from 60 billion euros per month to 80 billion, expanded the list of eligible securities to include investment-grade nonbank debt, and created a fund-to-lend program where banks could be paid to lend money. In Japan, the Bank of Japan maintained an aggressive monetary program aimed at combating deflation.
Despite accommodative central-bank policies that helped keep interest rates at ultra-low levels, there were periods of volatility. Early in 2016, weakness in certain emerging markets economies and commodities hurt riskier assets and a vote in June 2016 by the U.K. to exit the European Union set off another round of global uncertainty. Municipal bonds benefited because they are perceived as a safe-haven asset. In addition, investor demand for yield helped lower-rated debt outperform. The Barclays High Yield Municipal Bond Index2 returned 12.09% during the 12-month period that ended June 30, 2016.
Strong demand, modest supply, and solid credit fundamentals supported municipals.
Market technicals remained favorable. According to the Investment Company Institute, more than $33 billion was allocated to municipal mutual funds during the first half of 2016, which was more than double the inflows during all of 2015. Further, inflows during the second quarter of 2016 were the largest in nearly seven years. In contrast, less new supply helped make 2015 the fifth calendar year of negative net supply and supply in the first half of 2016 was about 4% less than the same period last year.
Municipal credit quality remained on an uptrend despite a number of high-profile negative credit situations. Idiosyncratic credit risks remain, however. With regard to Puerto Rico, the U.S. enacted legislation that prohibits bondholder lawsuits temporarily and instills a fiscal oversight board for Puerto Rico; Puerto Rico then declared a moratorium on paying its general obligation (GO) bonds and defaulted on $911 million in payments due (most of which were GOs) on July 1, 2016. The state of Illinois approved a six-month stopgap budget, a temporary but
| 1 | The Barclays Municipal Bond Index is an unmanaged index composed of long-term tax-exempt bonds with a minimum credit rating of Baa. You cannot invest directly in an index. |
| 2 | The Barclays High Yield Municipal Bond Index measures the non-investment-grade and nonrated U.S. dollar–denominated, fixed-rate, tax-exempt bond market within the 50 United States and four other qualifying regions (Washington, D.C.; Puerto Rico; Guam; and the Virgin Islands). The index allows state and local general obligation, revenue, insured, and prerefunded bonds; however, historically the index has been composed of mostly revenue bonds. You cannot invest directly in an index. |
| | | | | | |
| Letter to shareholders (unaudited) | | Wells Fargo Short-Term Municipal Bond Fund | | | 3 | |
meaningful step. Under this stopgap budget for the state, the city of Chicago receives authority to raise property taxes for teacher pensions and low-income school districts would receive greater state funding. City of Chicago and school district debt rallied on the news.
Since the end of the financial crisis, structural changes in the fixed-income markets have reduced trading liquidity (the degree to which assets can be bought or sold without affecting the price). New regulations and capital requirements have caused traditional liquidity suppliers (banks and broker/dealers) to be more risk-averse and hold less inventory. Meanwhile, corporate-debt issuance has spiked as companies finance themselves at record-low yields, bond mutual funds hold larger amounts of this new debt supply, trading volumes are lower, and large trades are more difficult to execute. However, fixed-income markets appear to have functioned well over the past year with sufficient liquidity.
Don’t let short-term uncertainty derail long-term investment goals.
Periods of uncertainty can present challenges, but experience has taught us that maintaining long-term investment goals can be an effective way to plan for the future. To help you create a sound strategy based on your personal goals and risk tolerance, Wells Fargo Funds offers more than 100 mutual funds spanning a wide range of asset classes and investment styles. Although diversification cannot guarantee an investment profit or prevent losses, we believe it can be an effective way to manage investment risk and potentially smooth out overall portfolio performance. We encourage investors to know their investments and to understand that appropriate levels of risk-taking may unlock opportunities.
Thank you for choosing to invest in Wells Fargo Funds. We appreciate your confidence in us and remain committed to helping you meet your financial needs.
Sincerely,

Karla M. Rabusch
President
Wells Fargo Funds
Periods of uncertainty can present challenges, but experience has taught us that maintaining long-term investment goals can be an effective way to plan for the future.
For further information about your Fund, contact your investment professional, visit our website at wellsfargofunds.com, or call us directly at 1-800-222-8222. We are available 24 hours a day, 7 days a week.
| | | | |
| 4 | | Wells Fargo Short-Term Municipal Bond Fund | | Performance highlights (unaudited) |
Investment objective
The Fund seeks current income exempt from federal income tax consistent with capital preservation.
Manager
Wells Fargo Funds Management, LLC
Subadviser
Wells Capital Management Incorporated
Portfolio managers
Wendy Casetta
Lyle J. Fitterer, CFA®, CPA
Average annual total returns (%) as of June 30, 20161
| | | | | | | | | | | | | | | | | | | | | | | | | | | | | | | | | | |
| | | | | Including sales charge | | | Excluding sales charge | | | Expense ratios2 (%) | |
| | | Inception date | | 1 year | | | 5 year | | | 10 year | | | 1 year | | | 5 year | | | 10 year | | | Gross | | | Net3 | |
| Class A (WSMAX) | | 7-18-2008 | | | (0.54 | ) | | | 1.02 | | | | 2.48 | | | | 1.49 | | | | 1.43 | | | | 2.68 | | | | 0.75 | | | | 0.63 | |
| Class C (WSSCX) | | 1-31-2003 | | | (0.27 | ) | | | 0.67 | | | | 1.89 | | | | 0.73 | | | | 0.67 | | | | 1.89 | | | | 1.50 | | | | 1.38 | |
| Administrator Class (WSTMX) | | 7-30-2010 | | | – | | | | – | | | | – | | | | 1.42 | | | | 1.41 | | | | 2.65 | | | | 0.69 | | | | 0.60 | |
| Institutional Class (WSBIX) | | 3-31-2008 | | | – | | | | – | | | | – | | | | 1.71 | | | | 1.63 | | | | 2.86 | | | | 0.42 | | | | 0.40 | |
| Barclays 1-3 Year Composite Municipal Bond Index4 | | – | | | – | | | | – | | | | – | | | | 1.65 | | | | 1.24 | | | | 2.59 | | | | – | | | | – | |
Figures quoted represent past performance, which is no guarantee of future results, and do not reflect taxes that a shareholder may pay on fund distributions or the redemption of fund shares. Investment return and principal value of an investment will fluctuate so that an investor’s shares, when redeemed, may be worth more or less than their original cost. Performance shown without sales charges would be lower if sales charges were reflected. Current performance may be lower or higher than the performance data quoted, which assumes the reinvestment of dividends and capital gains. Current month-end performance is available on the Fund’s website, wellsfargofunds.com.
Index returns do not include transaction costs associated with buying and selling securities, any mutual fund fees or expenses, or any taxes. It is not possible to invest directly in an index.
For Class A shares, the maximum front-end sales charge is 2.00%. For Class C shares, the maximum contingent deferred sales charge is 1.00%. Performance including a contingent deferred sales charge assumes the sales charge for the corresponding time period. Administrator Class and Institutional Class shares are sold without a front-end sales charge or contingent deferred sales charge.
Bond values fluctuate in response to the financial condition of individual issuers, general market and economic conditions, and changes in interest rates. Changes in market conditions and government policies may lead to periods of heightened volatility in the bond market and reduced liquidity for certain bonds held by the Fund. In general, when interest rates rise, bond values fall and investors may lose principal value. Interest-rate changes and their impact on the Fund and its share price can be sudden and unpredictable. The use of derivatives may reduce returns and/or increase volatility. Certain investment strategies tend to increase the total risk of an investment (relative to the broader market). The Fund is exposed to high-yield securities risk and municipal securities risk. Consult the Fund’s prospectus for additional information on these and other risks. A portion of the Fund’s income may be subject to federal, state, and/or local income taxes or the Alternative Minimum Tax (AMT). Any capital gains distributions may be taxable.
Please see footnotes on page 5.
| | | | | | |
| Performance highlights (unaudited) | | Wells Fargo Short-Term Municipal Bond Fund | | | 5 | |
|
| Growth of $10,000 investment as of June 30, 20165 |
|
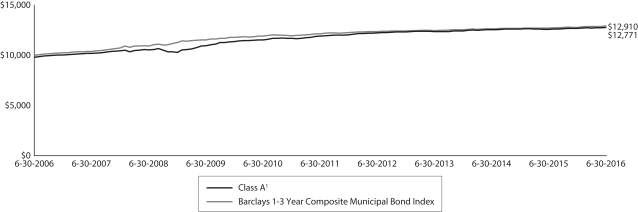 |
| 1 | Historical performance shown for Class A shares prior to their inception reflects the performance of the former Investor Class shares, and includes the higher expenses applicable to the former Investor Class shares (except during those periods in which expenses of Class A shares would have been higher than those of the former Investor Class shares). If these expenses had not been included, returns would be higher. Historical performance shown for Administrator Class shares prior to their inception reflects the performance of Institutional Class shares, adjusted to reflect the higher expenses applicable to Administrator Class shares. Historical performance shown for Institutional Class shares prior to their inception reflects the performance of the former Investor Class shares, and includes the higher expenses applicable to the former Investor Class shares. If these expenses had not been included, returns would be higher. |
| 2 | Reflects the expense ratios as stated in the most recent prospectuses. The expense ratios shown are subject to change and may differ from the annualized expense ratios shown in the financial highlights of this report. |
| 3 | The manager has contractually committed through October 31, 2016, to waive fees and/or reimburse expenses to the extent necessary to cap the Fund’s Total Annual Fund Operating Expenses After Fee Waiver at the amounts shown. After this time, the cap may be increased or the commitment to maintain the cap may be terminated only with the approval of the Board of Trustees. Brokerage commissions, stamp duty fees, interest, taxes, acquired fund fees and expenses, and extraordinary expenses are excluded from the expense cap. Without this cap, the Fund’s returns would have been lower. |
| 4 | The Barclays 1-3 Year Composite Municipal Bond Index is a blended index weighted 50% in the Barclays 1-Year Municipal Bond Index and 50% in the Barclays 3-Year Municipal Bond Index. You cannot invest directly in an index. |
| 5 | The chart compares the performance of Class A shares for the most recent ten years with the Barclays 1-3 Year Composite Municipal Bond Index. The chart assumes a hypothetical $10,000 investment in Class A shares and reflects all operating expenses and assumes the maximum initial sales charge of 2.00%. |
| 6 | Amounts are calculated based on the total investments of the Fund. These amounts are subject to change and may have changed since the date specified. |
| 7 | The credit quality distribution of portfolio holdings reflected in the chart is based on ratings from Standard & Poor’s, Moody’s Investors Service, and/or Fitch Ratings Ltd. Credit quality ratings apply to the underlying holdings of the Fund and not to the Fund itself. The percentages of the Fund’s portfolio with the ratings depicted in the chart are calculated based on the total market value of fixed income securities held by the Fund. If a security was rated by all three rating agencies, the middle rating was utilized. If rated by two of three rating agencies, the lower rating was utilized, and if rated by one of the rating agencies, that rating was utilized. Standard & Poor’s rates the creditworthiness of bonds, ranging from AAA (highest) to D (lowest). Ratings from A to CCC may be modified by the addition of a plus (+) or minus (-) sign to show relative standing within the rating categories. Standard & Poor’s rates the creditworthiness of short-term notes from SP-1 (highest) to SP-3 (lowest). Moody’s rates the creditworthiness of bonds, ranging from Aaa (highest) to C (lowest). Ratings Aa to B may be modified by the addition of a number 1 (highest) to 3 (lowest) to show relative standing within the ratings categories. Moody’s rates the creditworthiness of short-term U.S. tax-exempt municipal securities from MIG 1/VMIG 1 (highest) to SG (lowest). Fitch rates the creditworthiness of bonds, ranging from AAA (highest) to D (lowest). Credit quality distribution is subject to change and may have changed since the date specified. |
| | | | |
| 6 | | Wells Fargo Short-Term Municipal Bond Fund | | Performance highlights (unaudited) |
MANAGER’S DISCUSSION
Fund highlights
| n | | The Fund underperformed its benchmark, the Barclays 1–3 Year Composite Municipal Bond Index, for the 12-month period that ended June 30, 2016. |
| n | | Security selection within industrial development revenue and health care detracted from performance. On the flip side, exposure to Illinois and New Jersey-related debt added to performance as investors looked for yield. |
| n | | Because we expected interest rates would gradually increase, we kept the Fund’s duration short throughout the year, which detracted from performance. We positioned the Fund along the steeper part of the front end of the yield curve while keeping a large liquidity position to redeploy in a higher-interest-rate environment, and this yield-curve positioning contributed to results. |
|
| Effective maturity distribution as of June 30, 20166 |
|
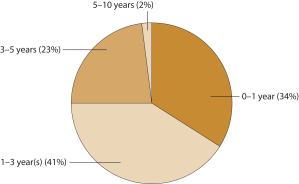 |
Ultralow yields continued throughout the period.
With the U.S. Federal Reserve (Fed) poised to normalize its interest-rate policy, shorter-term maturities appeared less attractive at the beginning of the reporting period due to a potential backup in short-term yields. However, subdued inflation expectations, due in part to low oil prices, combined with a fragile European economy and softening Chinese economy, implied that longer maturities would outperform. We, therefore, extended the Fund’s duration in anticipation of lower yields and also positioned the Fund for a flatter yield curve. The Fund’s yield-curve positioning, which was underweight maturities between one and four years and overweight the five- to seven-year area, helped results. Longer-term
maturities outperformed shorter-term maturities by a wide margin because the municipal curve flattened 100 basis points (bps; 100 bps equals 1.00%) between one-and seven-year maturities.
The Fed tightened in December 2015 but signaled that the pace of further increases would be gradual. While the Fed was likely to take its time raising rates, U.S. inflation started to trend higher, unemployment remained below 5%, and economic growth was expected to remain at or above 2%. We reduced duration as the market rallied. The Fund’s short duration hurt results during 2016 because yields continued to decline
|
| Credit quality as of June 30, 20167 |
|
 |
Credit-quality allocation helped results.
The Fund’s overweight to A-rated and BBB-rated debt and its out-of-benchmark holdings in high-yield and nonrated debt contributed to results because lower-rated bonds outperformed higher-quality bonds by a wide margin during the period. In addition, its overweight to BBB-rated bonds with relatively short maturities allowed it to maintain a competitive yield without taking on significant duration risk. The Fund’s holdings within the local general obligation, special tax, education, and transportation sectors performed well. On the other hand, issue selection within the health care and industrial development revenue sectors detracted from results, largely because of their shorter duration profile. We have
been cautious within the health care sector for quite
some time because we believe credit fundamentals have peaked. Although taxable corporate bond spreads increased dramatically during late 2015 and early 2016 as global fears spooked the market, spreads for corporate-backed municipal debt declined. We sold into this rally, but continued new-money flows into municipal bonds funds caused these spreads to move even tighter. Finally, sector allocation also benefited performance, particularly because the Fund was underweight prerefunded bonds.
Please see footnotes on page 5.
| | | | | | |
| Performance highlights (unaudited) | | Wells Fargo Short-Term Municipal Bond Fund | | | 7 | |
Political noise and a lack of a state budget caused volatility within Illinois, but the state’s bonds had some of the highest returns. We have been overweight Illinois bonds for several years because we feel that the above-market income is compensating investors for the credit issues. We continue to believe that the state’s economic backdrop and ability to raise revenues, combined with Illinois Governor Bruce Rauner’s focus on cutting expenses, should ultimately lead to tighter spreads. New Jersey bonds also performed well as spreads tightened; however, issue selection within the state detracted from results, primarily due to our exposure to longer-dated floating-rate notes that repriced to reflect a protracted rate-hike cycle. During the past 12 months, Puerto Rico had several widely anticipated defaults on its debt. The lack of clarity surrounding the federal government’s restructuring legislation for Puerto Rico debt, the lack of financial statements, and a declining economy make it hard to develop an investment opinion for the territory. As a result, we had minimal exposure to Puerto Rico bonds.
Rates may be lower for longer, making credit allocation and issue selection even more important.
Near the end of the reporting period, the U.K. voted to withdraw from the European Union, prompting considerable uncertainty about future political situations, financial markets, and economic growth. U.S. Treasuries and municipal bonds rallied significantly on the news, and both 10-year and 30-year municipal yields reached record-low levels. Although we think rates may stay lower for longer, we recognize that an improvement in overseas economies, outflows in mutual funds, or a more hawkish tone from the Fed could lead to a spike in rates. However, if the U.S. economy does weaken materially, this could be the catalyst for us to increase our duration exposure and reduce our credit exposure. In this record-low interest-rate environment, security selection is even more important as breakeven yields (the sell-off that a bond can endure before the total return drops to zero) decrease.
Please see footnotes on page 5.
| | | | |
| 8 | | Wells Fargo Short-Term Municipal Bond Fund | | Fund expenses (unaudited) |
As a shareholder of the Fund, you incur two types of costs: (1) transaction costs, including sales charges (loads) on purchase payments and contingent deferred sales charges (if any) on redemptions and (2) ongoing costs, including management fees, distribution (12b-1) and/or shareholder servicing fees, and other Fund expenses. This example is intended to help you understand your ongoing costs (in dollars) of investing in the Fund and to compare these costs with the ongoing costs of investing in other mutual funds.
The example is based on an investment of $1,000 invested at the beginning of the six-month period and held for the entire period from January 1, 2016 to June 30, 2016.
Actual expenses
The “Actual” line of the table below provides information about actual account values and actual expenses. You may use the information in this line, together with the amount you invested, to estimate the expenses that you paid over the period. Simply divide your account value by $1,000 (for example, an $8,600 account value divided by $1,000 = 8.6), then multiply the result by the number in the “Actual” line under the heading entitled “Expenses paid during period” for your applicable class of shares to estimate the expenses you paid on your account during this period.
Hypothetical example for comparison purposes
The “Hypothetical” line of the table below provides information about hypothetical account values and hypothetical expenses based on the Fund’s actual expense ratio and an assumed rate of return of 5% per year before expenses, which is not the Fund’s actual return. The hypothetical account values and expenses may not be used to estimate the actual ending account balance or expenses you paid for the period. You may use this information to compare the ongoing costs of investing in the Fund and other funds. To do so, compare this 5% hypothetical example with the 5% hypothetical examples that appear in the shareholder reports of the other funds.
Please note that the expenses shown in the table are meant to highlight your ongoing costs only and do not reflect any transactional costs, such as sales charges (loads) and contingent deferred sales charges. Therefore, the “Hypothetical” line of the table is useful in comparing ongoing costs only and will not help you determine the relative total costs of owning different funds. In addition, if these transactional costs were included, your costs would have been higher.
| | | | | | | | | | | | | | | | |
| | | Beginning
account value
1-1-2016 | | | Ending
account value
6-30-2016 | | | Expenses
paid during
the period¹ | | | Net annualized
expense ratio | |
Class A | | | | | | | | | | | | | | | | |
Actual | | $ | 1,000.00 | | | $ | 1,007.86 | | | $ | 3.15 | | | | 0.63 | % |
Hypothetical (5% return before expenses) | | $ | 1,000.00 | | | $ | 1,021.73 | | | $ | 3.17 | | | | 0.63 | % |
Class C | | | | | | | | | | | | | | | | |
Actual | | $ | 1,000.00 | | | $ | 1,004.11 | | | $ | 6.88 | | | | 1.38 | % |
Hypothetical (5% return before expenses) | | $ | 1,000.00 | | | $ | 1,018.00 | | | $ | 6.92 | | | | 1.38 | % |
Administrator Class | | | | | | | | | | | | | | | | |
Actual | | $ | 1,000.00 | | | $ | 1,008.01 | | | $ | 3.00 | | | | 0.60 | % |
Hypothetical (5% return before expenses) | | $ | 1,000.00 | | | $ | 1,021.88 | | | $ | 3.02 | | | | 0.60 | % |
Institutional Class | | | | | | | | | | | | | | | | |
Actual | | $ | 1,000.00 | | | $ | 1,009.01 | | | $ | 2.00 | | | | 0.40 | % |
Hypothetical (5% return before expenses) | | $ | 1,000.00 | | | $ | 1,022.87 | | | $ | 2.01 | | | | 0.40 | % |
| 1 | Expenses paid is equal to the annualized expense ratio of each class multiplied by the average account value over the period, multiplied by the number of days in the most recent fiscal half-year divided by the number of days in the fiscal year (to reflect the one-half-year period). |
| | | | | | |
| Portfolio of investments—June 30, 2016 | | Wells Fargo Short-Term Municipal Bond Fund | | | 9 | |
| | | | | | | | | | | | | | | | |
| Security name | | Interest rate | | | Maturity date | | | Principal | | | Value | |
| | | | | | | | | | | | | | | | |
| | | | |
Municipal Obligations: 97.20% | | | | | | | | | | | | | | | | |
| | | | |
| Alabama: 1.05% | | | | | | | | | | | | | | | | |
Alabama 21st Century Authority Series A (Tobacco Revenue) | | | 5.00 | % | | | 6-1-2017 | | | $ | 3,000,000 | | | $ | 3,114,240 | |
Board of Education of Shelby County AL Public School Warrants Series 2016 (Tax Revenue) | | | 4.00 | | | | 2-1-2020 | | | | 410,000 | | | | 451,689 | |
Chatom AL Industrial Development Board Gulf Opportunity Zone PowerSouth Energy Cooperative Projects Series A (Utilities Revenue, National Rural Utilities Finance Corporation SPA) ± | | | 0.88 | | | | 11-15-2038 | | | | 14,615,000 | | | | 14,619,531 | |
Jefferson County AL Warrants Series C (GO Revenue) | | | 4.90 | | | | 4-1-2021 | | | | 26,520,000 | | | | 28,305,592 | |
Jefferson County AL Warrants Series D (Water & Sewer Revenue) | | | 5.00 | | | | 10-1-2018 | | | | 1,890,000 | | | | 2,027,876 | |
Mobile County AL Industrial Development Board PCR Alabama Power Company Barry Plant (Industrial Development Revenue) ± | | | 1.63 | | | | 7-15-2034 | | | | 12,500,000 | | | | 12,658,250 | |
| |
| | | | 61,177,178 | |
| | | | | | | | | | | | | | | | |
| | | | |
| Alaska: 0.07% | | | | | | | | | | | | | | | | |
Alaska IDA Snettisham Hydroelectric Project (Utilities Revenue) | | | 5.00 | | | | 1-1-2021 | | | | 1,400,000 | | | | 1,589,686 | |
Alaska International Airport Refunding Bond Series D (Airport Revenue, National Insured) | | | 5.00 | | | | 10-1-2018 | | | | 2,235,000 | | | | 2,261,909 | |
| |
| | | | 3,851,595 | |
| | | | | | | | | | | | | | | | |
| | | | |
| Arizona: 2.13% | | | | | | | | | | | | | | | | |
Arizona Board of Regents Certificate of Participation Series A (Education Revenue) | | | 5.00 | | | | 6-1-2021 | | | | 3,000,000 | | | | 3,544,530 | |
Arizona Health Facilities Authority Catholic West Series B (Health Revenue, Barclays Bank LOC) ø | | | 0.42 | | | | 7-1-2035 | | | | 22,000,000 | | | | 22,000,000 | |
Cochise County AZ Community College District of Cochise County Series 2016A (Education Revenue, Build America Mutual Assurance Company Insured) | | | 5.00 | | | | 7-1-2020 | | | | 405,000 | | | | 464,628 | |
Cochise County AZ Community College District of Cochise County Series 2016A (Education Revenue, Build America Mutual Assurance Company Insured) | | | 5.00 | | | | 7-1-2021 | | | | 425,000 | | | | 498,228 | |
Gilbert AZ Water Reserve Municipal Property Corporation Sub Lien (Water & Sewer Revenue) | | | 4.75 | | | | 10-1-2032 | | | | 1,105,000 | | | | 1,116,978 | |
Maricopa County AZ Certificate of Participation (Miscellaneous Revenue) | | | 3.00 | | | | 7-1-2017 | | | | 3,500,000 | | | | 3,577,455 | |
Maricopa County AZ Certificate of Participation (Miscellaneous Revenue) | | | 5.00 | | | | 7-1-2017 | | | | 32,500,000 | | | | 33,867,275 | |
Maricopa County AZ Certificate of Participation (Miscellaneous Revenue) | | | 5.00 | | | | 7-1-2018 | | | | 6,100,000 | | | | 6,595,320 | |
Maricopa County AZ PCR Series A (Utilities Revenue) ± | | | 2.40 | | | | 6-1-2043 | | | | 9,300,000 | | | | 9,556,494 | |
Maricopa County AZ PCR Series B (Utilities Revenue) | | | 5.20 | | | | 6-1-2043 | | | | 2,500,000 | | | | 2,798,100 | |
Maricopa County AZ USD Refunding Bond Series 2016 (GO Revenue, Build America Mutual Assurance Company Insured) | | | 2.00 | | | | 7-1-2019 | | | | 2,265,000 | | | | 2,336,597 | |
Navajo Nation Arizona Refunding Bond Series A (Miscellaneous Revenue) 144A | | | 2.90 | | | | 12-1-2020 | | | | 14,205,000 | | | | 14,488,958 | |
Navajo Tribal Arizona Utility Authority (Miscellaneous Revenue, Municipal Government Guaranty Insured) | | | 4.00 | | | | 1-1-2021 | | | | 13,490,000 | | | | 13,884,583 | |
Scottsdale AZ IDA Scottsdale Healthcare Series D (Health Revenue) | | | 5.00 | | | | 9-1-2017 | | | | 2,000,000 | | | | 2,081,280 | |
Verrado AZ Community Facilities District #1 Refunding Bond Series A (GO Revenue) 144A | | | 4.00 | | | | 7-15-2016 | | | | 1,280,000 | | | | 1,281,152 | |
Verrado AZ Community Facilities District #1 Refunding Bond Series A (GO Revenue) 144A | | | 4.00 | | | | 7-15-2017 | | | | 1,365,000 | | | | 1,388,737 | |
Verrado AZ Community Facilities District #1 Refunding Bond Series A (GO Revenue) 144A | | | 4.00 | | | | 7-15-2018 | | | | 1,245,000 | | | | 1,278,179 | |
Yavapai County AZ IDA Waste Management Incorporated Project Series A2 (Resource Recovery Revenue) ± | | | 1.60 | | | | 3-1-2028 | | | | 2,500,000 | | | | 2,519,525 | |
| |
| | | | 123,278,019 | |
| | | | | | | | | | | | | | | | |
The accompanying notes are an integral part of these financial statements.
| | | | |
| 10 | | Wells Fargo Short-Term Municipal Bond Fund | | Portfolio of investments—June 30, 2016 |
| | | | | | | | | | | | | | | | |
| Security name | | Interest rate | | | Maturity date | | | Principal | | | Value | |
| | | | | | | | | | | | | | | | |
| | | | |
| California: 5.81% | | | | | | | | | | | | | | | | |
Alameda County CA Corridor Transportation Authority CAB Series A (Transportation Revenue, Ambac Insured) ¤ | | | 0.00 | % | | | 10-1-2016 | | | $ | 8,845,000 | | | $ | 8,831,202 | |
Bay Area Toll Authority California San Francisco Bay Area Toll Bridge Series B (Transportation Revenue) ± | | | 1.50 | | | | 4-1-2047 | | | | 11,900,000 | | | | 12,019,952 | |
California (GO Revenue) ± | | | 4.00 | | | | 12-1-2027 | | | | 55,200,000 | | | | 56,931,072 | |
California Golden State Tobacco Securitization Series 2954 (Tobacco Revenue, Morgan Stanley Bank LIQ) ø144A | | | 0.96 | | | | 6-1-2047 | | | | 31,160,000 | | | | 31,160,000 | |
California HFA Home Mortgage Series G (Housing Revenue) | | | 4.95 | | | | 8-1-2023 | | | | 9,000,000 | | | | 9,176,220 | |
California Infrastructure & Economic Development Bank Museum Art Project Series A (Miscellaneous Revenue) ± | | | 2.06 | | | | 12-1-2037 | | | | 12,000,000 | | | | 12,225,720 | |
California Infrastructure & Economic Development Bank Series A (Education Revenue) ± | | | 1.41 | | | | 8-1-2037 | | | | 25,460,000 | | | | 25,496,917 | |
California PCFA Solid Waste Disposal Waste Management Project Series A (Resource Recovery Revenue) ± | | | 1.65 | | | | 7-1-2031 | | | | 6,000,000 | | | | 6,004,500 | |
California Refunding Bond Series B (GO Revenue) ± | | | 1.16 | | | | 5-1-2017 | | | | 7,000,000 | | | | 7,010,570 | |
California Refunding Bond Series B (GO Revenue) ± | | | 1.31 | | | | 5-1-2018 | | | | 6,000,000 | | | | 6,034,320 | |
California Series D (GO Revenue) ± | | | 1.03 | | | | 12-1-2028 | | | | 27,000,000 | | | | 27,005,400 | |
California Series E (GO Revenue) ± | | | 1.16 | | | | 12-1-2029 | | | | 18,000,000 | | | | 18,007,200 | |
California Statewide CDA Health Facilities Catholic Series D (Health Revenue, AGM Insured) ±(m) | | | 0.51 | | | | 7-1-2041 | | | | 15,050,000 | | | | 15,050,000 | |
California Statewide CDA Health Facilities Catholic Series E (Health Revenue, AGM Insured) ±(m) | | | 0.55 | | | | 7-1-2040 | | | | 5,625,000 | | | | 5,625,000 | |
California Statewide CDA Health Facilities Catholic Series F (Health Revenue, AGM Insured) ±(m) | | | 0.52 | | | | 7-1-2040 | | | | 4,300,000 | | | | 4,300,000 | |
Chula Vista CA Elementary School Building Projects Certificate of Participation Series A (Miscellaneous Revenue, AGM Insured) | | | 5.00 | | | | 9-1-2017 | | | | 1,765,000 | | | | 1,854,009 | |
Chula Vista CA Elementary School Building Projects Certificate of Participation Series A (Miscellaneous Revenue, AGM Insured) | | | 5.00 | | | | 9-1-2018 | | | | 1,985,000 | | | | 2,166,171 | |
Chula Vista CA Industrial Development Revenue San Diego Gas & Electric Company Series A (Utilities Revenue) | | | 1.65 | | | | 7-1-2018 | | | | 5,570,000 | | | | 5,575,236 | |
Commerce CA RDA CAB Project #1 (Tax Revenue) ¤ | | | 0.00 | | | | 8-1-2021 | | | | 5,050,000 | | | | 3,962,533 | |
Compton CA Unified School District CAB Election of 2002 Series D (GO Revenue, Ambac Insured) ¤ | | | 0.00 | | | | 6-1-2017 | | | | 3,070,000 | | | | 3,035,708 | |
El Monte CA Union High School District (GO Revenue) | | | 5.00 | | | | 6-1-2018 | | | | 5,840,000 | | | | 6,319,698 | |
Foothill-Eastern CA Transportation Corridor Agency Series B1 (Transportation Revenue) ± | | | 5.00 | | | | 1-15-2053 | | | | 24,435,000 | | | | 25,370,616 | |
Oakland CA Unified School District Alameda County Election of 2012 (GO Revenue) | | | 5.00 | | | | 8-1-2018 | | | | 1,000,000 | | | | 1,078,120 | |
Oakland CA Unified School District Alameda County Election of 2012 (GO Revenue) | | | 5.00 | | | | 8-1-2019 | | | | 1,000,000 | | | | 1,111,020 | |
Oakland CA Unified School District Alameda County Refunding Bond (GO Revenue, National Insured) | | | 5.00 | | | | 8-1-2016 | | | | 3,030,000 | | | | 3,041,575 | |
Palomar CA Pomerado Health CAB Election of 2004 Series A (GO Revenue, National Insured) ¤ | | | 0.00 | | | | 8-1-2019 | | | | 2,215,000 | | | | 2,124,473 | |
Palomar CA Pomerado Health Care District Certificate of Participation Series C (Health Revenue, AGM Insured) ±(m) | | | 1.36 | | | | 11-1-2036 | | | | 14,225,000 | | | | 14,225,000 | |
San Buenaventura CA Community Memorial Health System (Health Revenue) | | | 5.00 | | | | 12-1-2016 | | | | 1,730,000 | | | | 1,754,774 | |
San Ysidro CA School District (GO Revenue, AGM Insured) ¤ | | | 0.00 | | | | 8-1-2047 | | | | 3,610,000 | | | | 477,639 | |
South San Francisco CA Unified School District BAN Series D (GO Revenue) ¤ | | | 0.00 | | | | 5-15-2017 | | | | 20,000,000 | | | | 19,879,600 | |
| |
| | | | 336,854,245 | |
| | | | | | | | | | | | | | | | |
The accompanying notes are an integral part of these financial statements.
| | | | | | |
| Portfolio of investments—June 30, 2016 | | Wells Fargo Short-Term Municipal Bond Fund | | | 11 | |
| | | | | | | | | | | | | | | | |
| Security name | | Interest rate | | | Maturity date | | | Principal | | | Value | |
| | | | | | | | | | | | | | | | |
| | | | |
| Colorado: 0.62% | | | | | | | | | | | | | | | | |
Aurora CO E-470 Public Highway Authority CAB Series B (Transportation Revenue, National Insured) ¤ | | | 0.00 | % | | | 9-1-2018 | | | $ | 2,000,000 | | | $ | 1,938,280 | |
Aurora CO E-470 Public Highway Authority Senior Series CD-2 (Transportation Revenue, National Insured) ± | | | 2.14 | | | | 9-1-2039 | | | | 15,325,000 | | | | 15,357,796 | |
Colorado HCFR Catholic Health Initiatives Series C2 (Health Revenue) ± | | | 1.56 | | | | 10-1-2039 | | | | 8,500,000 | | | | 8,451,975 | |
Colorado HCFR Catholic Health Initiatives Series C4 (Health Revenue) ± | | | 1.56 | | | | 10-1-2039 | | | | 3,495,000 | | | | 3,474,624 | |
Colorado Housing & Finance Authority Traditions Englewood Project (Housing Revenue) | | | 0.90 | | | | 12-1-2017 | | | | 7,000,000 | | | | 7,010,850 | |
| |
| | | | 36,233,525 | |
| | | | | | | | | | | | | | | | |
| | | | |
| Connecticut: 3.51% | | | | | | | | | | | | | | | | |
Connecticut Economic Recovery Notes Series A (Miscellaneous Revenue) ± | | | 0.74 | | | | 1-1-2018 | | | | 9,810,000 | | | | 9,781,845 | |
Connecticut HEFA Series 2010A-4 (Education Revenue) ± | | | 1.20 | | | | 7-1-2049 | | | | 33,190,000 | | | | 33,467,137 | |
Connecticut HEFA Yale University Series X-2 (Education Revenue) ± | | | 0.90 | | | | 7-1-2037 | | | | 34,000,000 | | | | 34,087,380 | |
Connecticut HEFAR Bridgeport Hospital Series D (Health Revenue) | | | 5.00 | | | | 7-1-2016 | | | | 2,380,000 | | | | 2,380,286 | |
Connecticut HEFAR Hartford Healthcare Series G (Health Revenue) ± | | | 1.26 | | | | 7-1-2049 | | | | 10,000,000 | | | | 9,979,500 | |
Connecticut HEFAR Yale University Issue Series A (Education Revenue) ± | | | 1.38 | | | | 7-1-2035 | | | | 12,515,000 | | | | 12,664,304 | |
Connecticut HEFAR Yale University Issue Series A-1 (Education Revenue) ±%% | | | 1.00 | | | | 7-1-2042 | | | | 600,000 | | | | 601,770 | |
Connecticut Securities Industry and Financial Market Association Index Refunding Bond (Miscellaneous Revenue) ± | | | 1.49 | | | | 5-15-2019 | | | | 3,500,000 | | | | 3,521,945 | |
Connecticut Series A (Miscellaneous Revenue) ± | | | 0.96 | | | | 3-1-2019 | | | | 3,200,000 | | | | 3,189,600 | |
Connecticut Series A (Miscellaneous Revenue) ± | | | 1.04 | | | | 3-1-2020 | | | | 8,285,000 | | | | 8,221,288 | |
Connecticut Series A (Miscellaneous Revenue) ± | | | 1.09 | | | | 4-15-2017 | | | | 4,700,000 | | | | 4,700,940 | |
Connecticut Series A (Miscellaneous Revenue) ± | | | 1.16 | | | | 5-15-2017 | | | | 17,000,000 | | | | 17,041,650 | |
Connecticut Series A (Miscellaneous Revenue) ± | | | 1.31 | | | | 5-15-2018 | | | | 17,740,000 | | | | 17,778,496 | |
Connecticut Series A (Miscellaneous Revenue) ± | | | 1.51 | | | | 4-15-2019 | | | | 5,600,000 | | | | 5,633,264 | |
Connecticut Series A (Miscellaneous Revenue) ± | | | 1.76 | | | | 3-1-2019 | | | | 21,500,000 | | | | 21,500,000 | |
Connecticut Series D (GO Revenue) ± | | | 0.93 | | | | 9-15-2017 | | | | 2,100,000 | | | | 2,101,743 | |
Hamden CT Refunding Bond (GO Revenue) | | | 5.00 | | | | 8-15-2017 | | | | 1,500,000 | | | | 1,562,070 | |
Hamden CT Refunding Bond (GO Revenue) | | | 5.00 | | | | 8-15-2018 | | | | 1,000,000 | | | | 1,077,070 | |
Hartford CT Series A (GO Revenue, AGM Insured) | | | 5.00 | | | | 7-1-2018 | | | | 650,000 | | | | 703,183 | |
Hartford CT Series A (GO Revenue, AGM Insured) | | | 5.00 | | | | 7-1-2019 | | | | 700,000 | | | | 780,640 | |
Hartford CT Series B (GO Revenue, AGM Insured) | | | 5.00 | | | | 10-1-2018 | | | | 1,000,000 | | | | 1,097,230 | |
Mohegan Tribe of Indians of Connecticut (Miscellaneous Revenue) | | | 2.65 | | | | 12-15-2017 | | | | 8,230,000 | | | | 8,340,200 | |
New Haven CT Series A (GO Revenue, AGM Insured) | | | 3.00 | | | | 11-1-2019 | | | | 3,405,000 | | | | 3,602,081 | |
| |
| | | | 203,813,622 | |
| | | | | | | | | | | | | | | | |
| | | | |
| Delaware: 0.04% | | | | | | | | | | | | | | | | |
Delaware HCFR Nanticoke Memorial Hospital Project (Health Revenue) | | | 4.00 | | | | 7-1-2016 | | | | 1,045,000 | | | | 1,045,073 | |
Delaware HCFR Nanticoke Memorial Hospital Project (Health Revenue) | | | 5.00 | | | | 7-1-2017 | | | | 1,225,000 | | | | 1,261,052 | |
| |
| | | | 2,306,125 | |
| | | | | | | | | | | | | | | | |
| | | | |
| District of Columbia: 0.22% | | | | | | | | | | | | | | | | |
District of Columbia Income Tax Secured Refunding Bond Series E (Tax Revenue) ± | | | 1.14 | | | | 12-1-2017 | | | | 13,000,000 | | | | 12,931,880 | |
| | | | | | | | | | | | | | | | |
| | | | |
| Florida: 2.18% | | | | | | | | | | | | | | | | |
Brevard County FL HCFR Refunding Bond Health First Incorporated Series A (Health Revenue) | | | 5.00 | | | | 4-1-2018 | | | | 1,140,000 | | | | 1,214,795 | |
Brevard County FL Space Coast Infrastructure Agency I-95 Project (Industrial Development Revenue) | | | 4.00 | | | | 6-15-2018 | | | | 5,695,000 | | | | 6,013,180 | |
The accompanying notes are an integral part of these financial statements.
| | | | |
| 12 | | Wells Fargo Short-Term Municipal Bond Fund | | Portfolio of investments—June 30, 2016 |
| | | | | | | | | | | | | | | | |
| Security name | | Interest rate | | | Maturity date | | | Principal | | | Value | |
| | | | | | | | | | | | | | | | |
|
| Florida (continued) | |
Escambia County FL Gulf Power Company Project (Resource Recovery Revenue) ± | | | 1.40 | % | | | 4-1-2039 | | | $ | 9,500,000 | | | $ | 9,558,520 | |
Florida Mid-Bay Bridge Authority Series C (Transportation Revenue) | | | 5.00 | | | | 10-1-2019 | | | | 675,000 | | | | 748,460 | |
Florida Mid-Bay Bridge Authority Series C (Transportation Revenue) | | | 5.00 | | | | 10-1-2020 | | | | 785,000 | | | | 889,955 | |
Jacksonville FL Sales Tax Refunding Bond Better Jacksonville (Tax Revenue) | | | 5.00 | | | | 10-1-2017 | | | | 2,000,000 | | | | 2,107,840 | |
Lee County FL IDA Alliance Community Project (Health Revenue) | | | 5.00 | | | | 11-15-2016 | | | | 1,000,000 | | | | 1,014,210 | |
Miami Beach FL Health Facilities Refunding Bond Mount Sinai Medical Center (Health Revenue) | | | 3.00 | | | | 11-15-2016 | | | | 1,995,000 | | | | 2,008,466 | |
Miami Beach FL Health Facilities Refunding Bond Mount Sinai Medical Center (Health Revenue) | | | 4.00 | | | | 11-15-2017 | | | | 1,750,000 | | | | 1,809,483 | |
Miami FL Refunding Bond Homeland Defense (GO Revenue, National Insured) | | | 5.00 | | | | 1-1-2017 | | | | 5,000,000 | | | | 5,098,500 | |
Miami-Dade County FL Expressway Authority Toll System (Transportation Revenue, Dexia Credit Local LOC, Dexia Credit Local LIQ) ±144A | | | 0.91 | | | | 10-13-2023 | | | | 6,670,000 | | | | 6,670,000 | |
Miami-Dade County FL Miami International Airport Series C (Airport Revenue, AGM Insured) | | | 5.25 | | | | 10-1-2021 | | | | 16,000,000 | | | | 16,838,560 | |
Miami-Dade County FL School Board Foundation Incorporated (Miscellaneous Revenue, Dexia Credit Local LOC, National Insured, Dexia Credit Local LIQ) ø144A | | | 0.78 | | | | 5-1-2031 | | | | 15,875,000 | | | | 15,875,000 | |
Miami-Dade County FL Seaport Department Series A (Airport Revenue, Bank of Tokyo-Mitsubishi LOC) ± | | | 0.42 | | | | 10-1-2050 | | | | 10,000,000 | | | | 10,000,000 | |
Orange County FL School Board Certificate of Participation Series A (Miscellaneous Revenue) | | | 5.00 | | | | 8-1-2016 | | | | 600,000 | | | | 602,352 | |
Palm Beach County FL HCFR ACTS Retirement Life Series 2016 (Health Revenue) %% | | | 5.00 | | | | 11-15-2021 | | | | 3,265,000 | | | | 3,846,823 | |
Palm Beach County FL HCFR ACTS Retirement Life Series B (Health Revenue) | | | 5.00 | | | | 11-15-2020 | | | | 6,300,000 | | | | 6,404,769 | |
Palm Beach County FL HCFR Jupiter Medical Center Project Series A (Health Revenue) | | | 4.00 | | | | 11-1-2018 | | | | 1,235,000 | | | | 1,298,985 | |
Sarasota County FL Educational Facilities School Arts & Sciences Project (Education Revenue) | | | 5.20 | | | | 7-1-2017 | | | | 170,000 | | | | 172,870 | |
Space Coast Infrastructure Agency I-95 Brevard County FL Project (Industrial Development Revenue) | | | 4.00 | | | | 6-15-2017 | | | | 14,865,000 | | | | 15,303,518 | |
St. Johns County FL School Board Refunding Bond Certificate of Participation (Miscellaneous Revenue) | | | 5.00 | | | | 7-1-2020 | | | | 2,010,000 | | | | 2,317,852 | |
St. Johns County FL School Board Refunding Bond Certificate of Participation (Miscellaneous Revenue) | | | 5.00 | | | | 7-1-2021 | | | | 1,670,000 | | | | 1,974,575 | |
Sunshine Florida Governmental Funding Commission Miami-Dade County Project Series A (Miscellaneous Revenue) | | | 5.00 | | | | 9-1-2016 | | | | 3,675,000 | | | | 3,702,893 | |
Volusia County FL School Board (Tax Revenue, AGM Insured) | | | 5.00 | | | | 10-1-2016 | | | | 10,000,000 | | | | 10,091,700 | |
Volusia County FL School Board (Tax Revenue, National Insured) | | | 5.00 | | | | 10-1-2016 | | | | 1,000,000 | | | | 1,005,890 | |
| |
| | | | 126,569,196 | |
| | | | | | | | | | | | | | | | |
| | | | |
| Georgia: 2.39% | | | | | | | | | | | | | | | | |
Atlanta GA Water & Wastewater Project Series A-1 (Water & Sewer Revenue) ± | | | 1.80 | | | | 11-1-2038 | | | | 21,500,000 | | | | 21,838,195 | |
Bartow County GA Development Authority Georgia Power Company Bowen Project (Utilities Revenue) ± | | | 2.70 | | | | 8-1-2043 | | | | 20,000,000 | | | | 20,716,600 | |
Burke County GA Development Authority Oglethorpe Power Corporation Vogtle Project Series A (Utilities Revenue) ± | | | 2.40 | | | | 1-1-2040 | | | | 17,825,000 | | | | 18,495,577 | |
Floyd County GA PCR Georgia Power Company Plant Hammond Project (Utilities Revenue) ± | | | 2.35 | | | | 7-1-2022 | | | | 11,000,000 | | | | 11,457,050 | |
Gainesville & Hall County GA Hospital Authority Health System Project Series B (Health Revenue) ± | | | 1.34 | | | | 8-15-2035 | | | | 23,000,000 | | | | 22,971,710 | |
Georgia Private Colleges & Universities Authority Mercer University Series B (Education Revenue) | | | 4.00 | | | | 10-1-2017 | | | | 3,285,000 | | | | 3,405,034 | |
The accompanying notes are an integral part of these financial statements.
| | | | | | |
| Portfolio of investments—June 30, 2016 | | Wells Fargo Short-Term Municipal Bond Fund | | | 13 | |
| | | | | | | | | | | | | | | | |
| Security name | | Interest rate | | | Maturity date | | | Principal | | | Value | |
| | | | | | | | | | | | | | | | |
| | | | |
| Georgia (continued) | | | | | | | | | | | | | | | | |
Main Street Natural Gas Incorporated Georgia Gas Project Series B (Utilities Revenue) | | | 5.00 | % | | | 3-15-2017 | | | $ | 8,015,000 | | | $ | 8,215,135 | |
Main Street Natural Gas Incorporated Georgia Gas Project Series B (Utilities Revenue) | | | 5.00 | | | | 3-15-2018 | | | | 4,815,000 | | | | 5,093,355 | |
Main Street Natural Gas Incorporated Georgia Gas Project Series B (Utilities Revenue) | | | 5.00 | | | | 3-15-2021 | | | | 2,600,000 | | | | 2,960,048 | |
Milledgeville & Baldwin County GA Development Authority College & State University (Education Revenue, Ambac Insured) ± | | | 0.92 | | | | 10-1-2016 | | | | 1,010,000 | | | | 1,009,010 | |
Monroe County GA PCR Georgia Power Company Plant Scherer Project (Industrial Development Revenue) ± | | | 2.35 | | | | 10-1-2048 | | | | 16,000,000 | | | | 16,664,800 | |
Savannah GA MFHR Wessels Blackshear Home Project (Housing Revenue) ± | | | 1.15 | | | | 7-1-2019 | | | | 5,550,000 | | | | 5,546,726 | |
| |
| | | | 138,373,240 | |
| | | | | | | | | | | | | | | | |
| | | | |
| Guam: 0.09% | | | | | | | | | | | | | | | | |
Guam International Airport Authority Series A (Airport Revenue) | | | 5.00 | | | | 10-1-2019 | | | | 450,000 | | | | 506,768 | |
Guam International Airport Authority Series B (Airport Revenue) | | | 5.00 | | | | 10-1-2018 | | | | 675,000 | | | | 739,037 | |
Guam International Airport Authority Series C (Airport Revenue) | | | 5.00 | | | | 10-1-2018 | | | | 3,560,000 | | | | 3,838,214 | |
| |
| | | | 5,084,019 | |
| | | | | | | | | | | | | | | | |
| | | | |
| Illinois: 10.34% | | | | | | | | | | | | | | | | |
Chicago IL Board of Education Dedicated Series C2 (GO Revenue) ± | | | 1.49 | | | | 3-1-2032 | | | | 33,000,000 | | | | 31,770,750 | |
Chicago IL Board of Education Dedicated Series D (Miscellaneous Revenue, AGC Insured) | | | 5.00 | | | | 12-1-2018 | | | | 1,400,000 | | | | 1,477,588 | |
Chicago IL Board of Education Lease Certificates Refunding Bond Series A (Miscellaneous Revenue, National Insured) | | | 6.00 | | | | 1-1-2020 | | | | 11,990,000 | | | | 12,721,630 | |
Chicago IL Board of Education Series A (GO Revenue, National Insured) | | | 5.00 | | | | 12-1-2019 | | | | 895,000 | | | | 960,272 | |
Chicago IL Board of Education Series A (GO Revenue, National Insured) | | | 5.00 | | | | 12-1-2020 | | | | 765,000 | | | | 775,618 | |
Chicago IL Board of Education Series A2 (GO Revenue) ± | | | 1.15 | | | | 3-1-2035 | | | | 24,000,000 | | | | 22,636,560 | |
Chicago IL Board of Education Series A3 (GO Revenue) ± | | | 1.22 | | | | 3-1-2036 | | | | 48,000,000 | | | | 42,058,560 | |
Chicago IL Board of Education Series C (GO Revenue) | | | 5.00 | | | | 12-1-2019 | | | | 5,335,000 | | | | 5,068,303 | |
Chicago IL Board of Education Series D (GO Revenue, AGM Insured) | | | 5.00 | | | | 12-1-2019 | | | | 1,105,000 | | | | 1,151,940 | |
Chicago IL Board of Education Series G (GO Revenue) ± | | | 4.39 | | | | 3-1-2032 | | | | 3,500,000 | | | | 3,442,985 | |
Chicago IL City Colleges of Chicago Capital Improvement Project CAB (GO Revenue, National Insured) ¤ | | | 0.00 | | | | 1-1-2019 | | | | 8,555,000 | | | | 7,971,977 | |
Chicago IL Modern Schools Across Chicago Program Series A-K (GO Revenue, Ambac Insured) | | | 5.00 | | | | 12-1-2019 | | | | 1,000,000 | | | | 1,017,250 | |
Chicago IL Motor Fuel Refunding Bond (Tax Revenue) | | | 5.00 | | | | 1-1-2017 | | | | 1,820,000 | | | | 1,842,131 | |
Chicago IL Motor Fuel Refunding Bond (Tax Revenue) | | | 5.00 | | | | 1-1-2018 | | | | 330,000 | | | | 341,501 | |
Chicago IL O’Hare International Airport Customer Facility Charge (Airport Revenue) | | | 5.00 | | | | 1-1-2019 | | | | 1,000,000 | | | | 1,092,120 | |
Chicago IL O’Hare International Airport Customer Facility Charge (Airport Revenue) | | | 5.00 | | | | 1-1-2020 | | | | 890,000 | | | | 997,530 | |
Chicago IL O’Hare International Airport Senior Lien Series A (Airport Revenue) | | | 5.00 | | | | 1-1-2017 | | | | 2,630,000 | | | | 2,686,782 | |
Chicago IL Park District Personal Property Replacement Tax (GO Revenue) | | | 5.00 | | | | 1-1-2019 | | | | 500,000 | | | | 543,990 | |
Chicago IL Park District Refunding Bonds Series B (GO Revenue) | | | 5.00 | | | | 1-1-2019 | | | | 3,555,000 | | | | 3,867,769 | |
Chicago IL Park District Refunding Bonds Series D (GO Revenue) | | | 4.00 | | | | 1-1-2019 | | | | 1,890,000 | | | | 2,009,958 | |
Chicago IL Park District Refunding Bonds Series D (GO Revenue) | | | 5.00 | | | | 1-1-2019 | | | | 1,060,000 | | | | 1,153,259 | |
Chicago IL Park District Refunding Bonds Series D (GO Revenue) | | | 5.00 | | | | 1-1-2020 | | | | 1,000,000 | | | | 1,110,680 | |
Chicago IL Park District Refunding Bonds Series D (GO Revenue) | | | 5.00 | | | | 1-1-2021 | | | | 1,000,000 | | | | 1,135,030 | |
Chicago IL Prerefunded Balance Project Series A (GO Revenue, Ambac Insured) | | | 4.00 | | | | 1-1-2017 | | | | 720,000 | | | | 731,794 | |
Chicago IL Project & Refunding Bond Series A (GO Revenue, National Insured) | | | 5.00 | | | | 1-1-2019 | | | | 4,465,000 | | | | 4,662,308 | |
Chicago IL Project & Refunding Bond Series A (GO Revenue, Ambac Insured) | | | 5.00 | | | | 1-1-2020 | | | | 1,985,000 | | | | 2,014,021 | |
Chicago IL Project & Refunding Bond Series C (GO Revenue, National Insured) | | | 4.00 | | | | 1-1-2017 | | | | 345,000 | | | | 347,329 | |
The accompanying notes are an integral part of these financial statements.
| | | | |
| 14 | | Wells Fargo Short-Term Municipal Bond Fund | | Portfolio of investments—June 30, 2016 |
| | | | | | | | | | | | | | | | |
| Security name | | Interest rate | | | Maturity date | | | Principal | | | Value | |
| | | | | | | | | | | | | | | | |
|
| Illinois (continued) | |
Chicago IL Project & Refunding Bond Series C (GO Revenue, Ambac Insured) | | | 5.00 | % | | | 1-1-2021 | | | $ | 10,280,000 | | | $ | 10,409,220 | |
Chicago IL Recovery Zone Facility (Industrial Development Revenue) | | | 6.13 | | | | 12-1-2018 | | | | 4,955,000 | | | | 5,082,244 | |
Chicago IL Refunding Bond Emergency Telephone System (GO Revenue, National Insured) | | | 5.25 | | | | 1-1-2018 | | | | 1,770,000 | | | | 1,834,977 | |
Chicago IL Refunding Bond Emergency Telephone System (GO Revenue, National Insured) | | | 5.25 | | | | 1-1-2020 | | | | 3,765,000 | | | | 4,051,178 | |
Chicago IL Refunding Bond Emergency Telephone System (GO Revenue, National Insured) | | | 5.50 | | | | 1-1-2019 | | | | 2,600,000 | | | | 2,767,232 | |
Chicago IL Refunding Bond Series A (GO Revenue, AGM Insured) | | | 5.00 | | | | 1-1-2019 | | | | 1,335,000 | | | | 1,338,404 | |
Chicago IL Refunding Bond Series A (GO Revenue, AGM Insured) | | | 5.00 | | | | 1-1-2020 | | | | 10,200,000 | | | | 10,238,148 | |
Chicago IL Refunding Bond Series A (GO Revenue, AGM Insured) | | | 5.00 | | | | 1-1-2021 | | | | 1,100,000 | | | | 1,109,724 | |
Chicago IL Refunding Bond Series B (GO Revenue, Ambac Insured) | | | 5.13 | | | | 1-1-2022 | | | | 8,010,000 | | | | 8,384,307 | |
Chicago IL Second Lien (Water & Sewer Revenue, AGM Insured) | | | 4.25 | | | | 11-1-2018 | | | | 1,925,000 | | | | 2,060,578 | |
Chicago IL Second Lien (Water & Sewer Revenue) | | | 5.00 | | | | 1-1-2017 | | | | 1,200,000 | | | | 1,222,176 | |
Chicago IL Second Lien (Water & Sewer Revenue) | | | 5.00 | | | | 11-1-2020 | | | | 730,000 | | | | 831,353 | |
Chicago IL Second Lien (Water & Sewer Revenue, National Insured) | | | 5.50 | | | | 1-1-2019 | | | | 1,460,000 | | | | 1,608,613 | |
Chicago IL Series A (GO Revenue) | | | 5.00 | | | | 1-1-2018 | | | | 550,000 | | | | 563,437 | |
Chicago IL Series A (GO Revenue) | | | 5.00 | | | | 1-1-2019 | | | | 5,750,000 | | | | 5,876,903 | |
Chicago IL Series A (GO Revenue) | | | 5.25 | | | | 1-1-2021 | | | | 640,000 | | | | 654,560 | |
Chicago IL Series A (GO Revenue, National Insured) | | | 5.53 | | | | 1-1-2020 | | | | 1,290,000 | | | | 1,307,892 | |
Chicago IL Series A2 (GO Revenue, Ambac Insured) | | | 5.50 | | | | 1-1-2018 | | | | 4,805,000 | | | | 4,955,156 | |
Chicago IL Series B (GO Revenue, AGM Insured) | | | 5.00 | | | | 1-1-2019 | | | | 8,090,000 | | | | 8,161,516 | |
Chicago IL Series B (GO Revenue, AGM Insured) | | | 5.00 | | | | 1-1-2020 | | | | 2,860,000 | | | | 2,885,282 | |
Chicago IL Series C (GO Revenue) | | | 5.00 | | | | 1-1-2021 | | | | 3,000,000 | | | | 3,140,130 | |
Chicago IL Series C (GO Revenue) | | | 5.00 | | | | 1-1-2022 | | | | 12,780,000 | | | | 13,284,043 | |
Chicago IL Series C (GO Revenue) | | | 5.00 | | | | 1-1-2023 | | | | 4,750,000 | | | | 4,958,763 | |
Chicago IL Transit Authority Federal Transit Administration Section 5309 (Transportation Revenue, AGC Insured) | | | 5.00 | | | | 6-1-2018 | | | | 375,000 | | | | 401,771 | |
Chicago IL Transit Authority Federal Transit Administration Section 5309 (Transportation Revenue, AGC Insured) | | | 5.25 | | | | 6-1-2019 | | | | 1,480,000 | | | | 1,589,772 | |
Chicago IL Unrefunded Balance Project Series A (GO Revenue, Ambac Insured) | | | 4.00 | | | | 1-1-2017 | | | | 455,000 | | | | 457,867 | |
Cook County IL Community High School District #217 Series 2016 (Miscellaneous Revenue) ± | | | 1.25 | | | | 12-15-2025 | | | | 12,800,000 | | | | 12,798,848 | |
Cook County IL Forest Preserve District Series A (GO Revenue) | | | 5.00 | | | | 11-15-2018 | | | | 1,005,000 | | | | 1,093,460 | |
Cook County IL Refunding Bond Series 2016 A (GO Revenue) %% | | | 5.00 | | | | 11-15-2020 | | | | 5,430,000 | | | | 6,175,268 | |
Cook County IL Series 2009D (GO Revenue) | | | 5.00 | | | | 11-15-2020 | | | | 2,220,000 | | | | 2,461,381 | |
Cook County IL Series A (GO Revenue) | | | 5.00 | | | | 11-15-2019 | | | | 2,150,000 | | | | 2,398,218 | |
Cook County IL Series B (GO Revenue, National Insured) | | | 5.00 | | | | 11-15-2019 | | | | 6,020,000 | | | | 6,290,117 | |
Cook County IL Series C (GO Revenue) | | | 5.00 | | | | 11-15-2020 | | | | 21,535,000 | | | | 23,876,501 | |
Illinois (Miscellaneous Revenue) | | | 3.00 | | | | 7-1-2018 | | | | 2,000,000 | | | | 2,054,580 | |
Illinois (GO Revenue) | | | 4.00 | | | | 2-1-2019 | | | | 6,300,000 | | | | 6,624,324 | |
Illinois (GO Revenue) | | | 4.00 | | | | 2-1-2020 | | | | 1,750,000 | | | | 1,857,135 | |
Illinois (GO Revenue) | | | 5.00 | | | | 1-1-2017 | | | | 3,200,000 | | | | 3,214,336 | |
Illinois (GO Revenue) | | | 5.00 | | | | 3-1-2018 | | | | 1,795,000 | | | | 1,896,041 | |
Illinois (GO Revenue, Ambac Insured) | | | 5.00 | | | | 11-1-2018 | | | | 10,650,000 | | | | 10,735,946 | |
Illinois (GO Revenue) | | | 5.00 | | | | 2-1-2019 | | | | 1,500,000 | | | | 1,614,870 | |
Illinois (GO Revenue) | | | 5.00 | | | | 2-1-2020 | | | | 2,520,000 | | | | 2,761,895 | |
Illinois (GO Revenue) | | | 5.00 | | | | 2-1-2021 | | | | 11,635,000 | | | | 12,808,041 | |
Illinois (Miscellaneous Revenue) | | | 5.00 | | | | 5-1-2021 | | | | 2,000,000 | | | | 2,209,100 | |
The accompanying notes are an integral part of these financial statements.
| | | | | | |
| Portfolio of investments—June 30, 2016 | | Wells Fargo Short-Term Municipal Bond Fund | | | 15 | |
| | | | | | | | | | | | | | | | |
| Security name | | Interest rate | | | Maturity date | | | Principal | | | Value | |
| | | | | | | | | | | | | | | | |
|
| Illinois (continued) | |
Illinois Development Finance Authority St. Vincent De Paul Center Project Series A (Health Revenue) ± | | | 1.88 | % | | | 11-15-2039 | | | $ | 5,605,000 | | | $ | 5,721,080 | |
Illinois Finance Authority Centegra Health System Project (Health Revenue) | | | 5.00 | | | | 9-1-2019 | | | | 2,265,000 | | | | 2,477,706 | |
Illinois Finance Authority OSF Healthcare System Series F (Health Revenue, Barclays Bank plc LOC) ± | | | 0.42 | | | | 11-15-2037 | | | | 15,000,000 | | | | 15,000,000 | |
Illinois Finance Authority Provena Health Series A (Health Revenue) | | | 5.75 | | | | 5-1-2019 | | | | 3,000,000 | | | | 3,349,110 | |
Illinois Finance Authority Refunding Bond Lifespace Communities (Health Revenue) | | | 4.00 | | | | 5-15-2018 | | | | 700,000 | | | | 736,897 | |
Illinois Finance Authority Refunding Bond Lifespace Communities (Health Revenue) | | | 4.00 | | | | 5-15-2019 | | | | 1,000,000 | | | | 1,074,700 | |
Illinois Housing Development Authority (Housing Revenue, GNMA Insured) | | | 5.00 | | | | 8-1-2028 | | | | 1,240,000 | | | | 1,277,956 | |
Illinois Municipal Electric Agency Power Supply Series A (Utilities Revenue, National Insured) | | | 5.25 | | | | 2-1-2020 | | | | 2,705,000 | | | | 2,779,252 | |
Illinois Refunding Bond (GO Revenue) | | | 5.00 | | | | 1-1-2018 | | | | 1,905,000 | | | | 2,002,250 | |
Illinois Refunding Bond (GO Revenue, AGM Insured) | | | 5.00 | | | | 1-1-2017 | | | | 1,725,000 | | | | 1,760,397 | |
Illinois Refunding Bond (GO Revenue, AGM Insured) | | | 5.00 | | | | 1-1-2018 | | | | 7,740,000 | | | | 8,175,530 | |
Illinois Refunding Bond (Miscellaneous Revenue) | | | 5.00 | | | | 8-1-2018 | | | | 1,525,000 | | | | 1,629,951 | |
Illinois Refunding Bond (GO Revenue) | | | 5.00 | | | | 1-1-2019 | | | | 12,570,000 | | | | 13,505,208 | |
Illinois Refunding Bond (GO Revenue) | | | 5.00 | | | | 1-1-2020 | | | | 13,515,000 | | | | 14,803,115 | |
Illinois Refunding Bond (Miscellaneous Revenue, AGM Insured) | | | 5.00 | | | | 8-1-2020 | | | | 5,000,000 | | | | 5,642,200 | |
Illinois Refunding Bond (Miscellaneous Revenue, Build America Mutual Assurance Company Insured) | | | 5.00 | | | | 8-1-2020 | | | | 9,175,000 | | | | 10,353,437 | |
Illinois Refunding Bond (Miscellaneous Revenue) | | | 5.00 | | | | 8-1-2020 | | | | 5,000,000 | | | | 5,498,850 | |
Illinois Refunding Bond (Tax Revenue) | | | 5.00 | | | | 1-1-2021 | | | | 1,510,000 | | | | 1,660,351 | |
Illinois Refunding Bond Series B (Miscellaneous Revenue) | | | 5.25 | | | | 1-1-2018 | | | | 1,430,000 | | | | 1,508,293 | |
Illinois Series 2004 (GO Revenue) | | | 5.00 | | | | 9-1-2016 | | | | 10,000,000 | | | | 10,033,200 | |
Illinois Series A (GO Revenue) | | | 3.75 | | | | 9-1-2016 | | | | 2,000,000 | | | | 2,009,740 | |
Illinois Series A (Tax Revenue) | | | 4.00 | | | | 1-1-2020 | | | | 12,265,000 | | | | 13,018,071 | |
Illinois Series A (Tax Revenue) | | | 4.00 | | | | 1-1-2021 | | | | 2,715,000 | | | | 2,867,230 | |
Illinois Series A (GO Revenue) | | | 5.00 | | | | 4-1-2019 | | | | 5,000,000 | | | | 5,404,550 | |
Illinois Series A (GO Revenue) | | | 5.00 | | | | 4-1-2020 | | | | 2,500,000 | | | | 2,743,150 | |
Illinois Series A (GO Revenue) | | | 5.00 | | | | 4-1-2022 | | | | 3,575,000 | | | | 3,983,551 | |
Illinois Unemployment Insurance Series A (Tax Revenue) | | | 5.00 | | | | 12-15-2016 | | | | 5,200,000 | | | | 5,308,108 | |
Illinois Unemployment Insurance Series B (Tax Revenue) | | | 5.00 | | | | 12-15-2017 | | | | 4,700,000 | | | | 4,797,196 | |
Illinois Unemployment Insurance Series B (Tax Revenue) | | | 5.00 | | | | 6-15-2018 | | | | 17,120,000 | | | | 17,466,338 | |
Illinois Unrefunded Balance Series A (Miscellaneous Revenue) | | | 5.00 | | | | 10-1-2016 | | | | 3,965,000 | | | | 3,978,085 | |
Kane County IL School District Series B (GO Revenue) | | | 2.00 | | | | 2-1-2021 | | | | 880,000 | | | | 900,451 | |
Kankakee County IL School District #111 Series 2016 (GO Revenue) ±144A | | | 1.50 | | | | 6-1-2035 | | | | 10,200,000 | | | | 10,201,020 | |
Kendall, Kane & Will Counties IL Community Unit School District #308 (GO Revenue, AGM Insured) ¤ | | | 0.00 | | | | 2-1-2020 | | | | 1,000,000 | | | | 936,870 | |
Lake County IL Community High School District #117 Antioch CAB Series B (GO Revenue, National Insured) ¤ | | | 0.00 | | | | 12-1-2016 | | | | 4,975,000 | | | | 4,955,598 | |
Lake County IL Community Unit School District #60 Waukegan CAB Series A (GO Revenue, AGM Insured) ¤ | | | 0.00 | | | | 12-1-2018 | | | | 1,715,000 | | | | 1,645,920 | |
Lake County IL Forest Preservation District Series A (GO Revenue) ± | | | 0.88 | | | | 12-15-2016 | | | | 1,085,000 | | | | 1,084,468 | |
McHenry-Kane Counties IL Community Consolidated School District #158 CAB (GO Revenue, National Insured) ¤ | | | 0.00 | | | | 1-1-2021 | | | | 1,000,000 | | | | 900,150 | |
Metropolitan Pier & Exposition Authority Illinois CAB McCormick Place Project Series A (Tax Revenue, National Insured) ¤ | | | 0.00 | | | | 6-15-2017 | | | | 11,210,000 | | | | 11,072,117 | |
Metropolitan Pier & Exposition Authority Illinois CAB McCormick Place Project Series A (Tax Revenue, National Insured) ¤ | | | 0.00 | | | | 12-15-2017 | | | | 6,160,000 | | | | 6,043,083 | |
The accompanying notes are an integral part of these financial statements.
| | | | |
| 16 | | Wells Fargo Short-Term Municipal Bond Fund | | Portfolio of investments—June 30, 2016 |
| | | | | | | | | | | | | | | | |
| Security name | | Interest rate | | | Maturity date | | | Principal | | | Value | |
| | | | | | | | | | | | | | | | |
|
| Illinois (continued) | |
Metropolitan Pier & Exposition Authority Illinois CAB McCormick Place Project Series B (Tax Revenue) | | | 5.00 | % | | | 12-15-2020 | | | $ | 1,000,000 | | | $ | 1,126,750 | |
Regional Transportation Authority Illinois Refunding Bond Series B (Tax Revenue) ± | | | 0.65 | | | | 6-1-2025 | | | | 13,395,000 | | | | 13,395,000 | |
Springfield IL Electric Senior Lien (Utilities Revenue, National Insured) | | | 5.00 | | | | 3-1-2018 | | | | 12,000,000 | | | | 12,349,440 | |
Springfield IL Electric Senior Lien (Utilities Revenue, National Insured) | | | 5.00 | | | | 3-1-2019 | | | | 5,900,000 | | | | 6,071,808 | |
Western Illinois University Auxiliary Facilities System (Education Revenue) | | | 4.00 | | | | 4-1-2017 | | | | 1,135,000 | | | | 1,147,201 | |
Western Illinois University Auxiliary Facilities System (Education Revenue) | | | 4.00 | | | | 4-1-2020 | | | | 1,480,000 | | | | 1,529,269 | |
| |
| | | | 599,559,589 | |
| | | | | | | | | | | | | | | | |
| | | | |
| Indiana: 4.23% | | | | | | | | | | | | | | | | |
Evansville City IN MFHR Consolidated RAD Project Series A (Housing Revenue) ± | | | 0.90 | | | | 6-1-2018 | | | | 4,600,000 | | | | 4,603,910 | |
Indiana Finance Authority Ohio River Bridges East End Crossing Project Series B (Industrial Development Revenue) | | | 5.00 | | | | 1-1-2019 | | | | 79,215,000 | | | | 80,862,672 | |
Indiana Finance Authority Refunding Bond Series A (Miscellaneous Revenue, National Insured) | | | 4.50 | | | | 12-1-2021 | | | | 5,000,000 | | | | 5,088,750 | |
Indiana Finance Authority Refunding Bond Southern Indiana Gas & Electric Company Series E (Utilities Revenue) ± | | | 1.95 | | | | 5-1-2037 | | | | 3,000,000 | | | | 3,041,130 | |
Indiana HFFA Ascension Health Series A1 (Health Revenue) ± | | | 2.80 | | | | 11-1-2027 | | | | 11,285,000 | | | | 11,868,322 | |
Indiana HFFA Ascension Health Series A7 (Health Revenue) ± | | | 2.00 | | | | 10-1-2026 | | | | 9,925,000 | | | | 10,147,022 | |
Indiana HEFA Ascension Health Series B3 (Health Revenue) ± | | | 1.26 | | | | 11-15-2031 | | | | 70,710,000 | | | | 70,710,707 | |
Indiana HFFA Ascension Health Subordinate Credit Group Series 2015 A-4 (Health Revenue) ± | | | 1.50 | | | | 10-1-2027 | | | | 2,705,000 | | | | 2,725,856 | |
Petersburg IN PCR Refunding Bond Industry Power & Light (Industrial Development Revenue, National Insured) | | | 5.40 | | | | 8-1-2017 | | | | 1,000,000 | | | | 1,049,370 | |
Rockport IN PCR Indiana-Michigan Power Company Series B (Utilities Revenue) ± | | | 1.75 | | | | 6-1-2025 | | | | 4,285,000 | | | | 4,323,736 | |
Warrick County IN Environment Import Revenue Vectren Energy Delivery of Indiana Incorporated (Utilities Revenue) ± | | | 2.38 | | | | 9-1-2055 | | | | 6,550,000 | | | | 6,737,723 | |
Whiting IN BP Products North America Incorporated Project (Resource Recovery Revenue) | | | 1.14 | | | | 12-1-2044 | | | | 45,000,000 | | | | 43,960,050 | |
| |
| | | | 245,119,248 | |
| | | | | | | | | | | | | | | | |
| | | | |
| Iowa: 0.09% | | | | | | | | | | | | | | | | |
Iowa Student Loan Liquidity Corporation Senior Series A1 (Education Revenue) | | | 4.40 | | | | 12-1-2018 | | | | 5,220,000 | | | | 5,442,111 | |
| | | | | | | | | | | | | | | | |
| | | | |
| Kansas: 0.20% | | | | | | | | | | | | | | | | |
Kansas Development Finance Authority Series A (Miscellaneous Revenue) | | | 5.00 | | | | 5-1-2019 | | | | 10,305,000 | | | | 11,490,487 | |
Wyandotte County & Kansas City KS Unified Government Special Obligation Second Lien CAB Series B (Tax Revenue) ¤ | | | 0.00 | | | | 6-1-2021 | | | | 225,000 | | | | 171,221 | |
| |
| | | | 11,661,708 | |
| | | | | | | | | | | | | | | | |
| | | | |
| Kentucky: 1.94% | | | | | | | | | | | | | | | | |
Ashland KY Ashland Hospital Corporation Kings Daughters Medical Center Project (Health Revenue) ± | | | 2.14 | | | | 2-1-2040 | | | | 33,495,000 | | | | 33,514,092 | |
Ashland KY Ashland Hospital Corporation Medical Center Project Series B (Health Revenue) | | | 5.00 | | | | 2-1-2019 | | | | 1,500,000 | | | | 1,613,025 | |
Kentucky EDA Next Generation Kentucky Information Highway Project Series 2015 A (Miscellaneous Revenue) | | | 5.00 | | | | 7-1-2020 | | | | 1,000,000 | | | | 1,123,320 | |
Kentucky EDFA King’s Daughters Medical Center (Health Revenue) | | | 5.00 | | | | 2-1-2017 | | | | 1,000,000 | | | | 1,017,410 | |
Kentucky EDFA Series B1 (Health Revenue) ± | | | 1.21 | | | | 2-1-2046 | | | | 10,720,000 | | | | 10,590,395 | |
Kentucky EDFA Series B2 (Health Revenue) ± | | | 1.21 | | | | 2-1-2046 | | | | 11,220,000 | | | | 11,084,350 | |
The accompanying notes are an integral part of these financial statements.
| | | | | | |
| Portfolio of investments—June 30, 2016 | | Wells Fargo Short-Term Municipal Bond Fund | | | 17 | |
| | | | | | | | | | | | | | | | |
| Security name | | Interest rate | | | Maturity date | | | Principal | | | Value | |
| | | | | | | | | | | | | | | | |
|
| Kentucky (continued) | |
Kentucky Higher Education Student Loan Corporation Series A (Education Revenue) | | | 3.75 | % | | | 6-1-2026 | | | $ | 1,330,000 | | | $ | 1,446,481 | |
Kentucky Higher Education Student Loan Corporation Series A (Education Revenue) | | | 5.00 | | | | 6-1-2018 | | | | 1,200,000 | | | | 1,278,372 | |
Kentucky Municipal Power Agency Prairie State Project Series B (Utilities Revenue) ± | | | 1.79 | | | | 9-1-2042 | | | | 25,000,000 | | | | 24,991,000 | |
Kentucky Public Transportation Infrastructure Authority Tolls Downtown Crossing Project BAN Series A (Transportation Revenue) | | | 5.00 | | | | 7-1-2017 | | | | 25,000,000 | | | | 25,954,250 | |
| |
| | | | 112,612,695 | |
| | | | | | | | | | | | | | | | |
| | | | |
| Louisiana: 2.59% | | | | | | | | | | | | | | | | |
Desoto Parish LA PCR (Utilities Revenue) | | | 1.60 | | | | 1-1-2019 | | | | 15,000,000 | | | | 15,123,750 | |
East Baton Rouge Parish LA Sewerage Commission Refunding Bond Series A (Water & Sewer Revenue) ± | | | 0.82 | | | | 2-1-2046 | | | | 42,585,000 | | | | 42,182,146 | |
Louisiana Local Government Environmental Facilities & CDA East Baton Rouge Sewer Commission Series B (Tax Revenue) ± | | | 1.02 | | | | 2-1-2049 | | | | 35,500,000 | | | | 35,147,840 | |
Louisiana Local Government Environmental Facilities & Community Development Authority Series 2015 (Tax Revenue, Build America Mutual Assurance Company Insured) | | | 5.00 | | | | 12-1-2020 | | | | 1,135,000 | | | | 1,321,231 | |
Louisiana Regional Transit Authority CAB (Tax Revenue, National Insured) ¤ | | | 0.00 | | | | 12-1-2021 | | | | 5,000,000 | | | | 3,849,050 | |
New Orleans LA Master Lease Agreement (GO Revenue) (i) | | | 5.25 | | | | 1-1-2018 | | | | 6,121,493 | | | | 6,239,699 | |
St. Bernard Parish LA Sales & Uses Tax (Tax Revenue) | | | 4.00 | | | | 3-1-2017 | | | | 3,135,000 | | | | 3,201,054 | |
St. Bernard Parish LA Sales & Uses Tax (Tax Revenue) | | | 4.00 | | | | 3-1-2018 | | | | 3,245,000 | | | | 3,403,356 | |
St. James Parish LA Nucor Steel LLC Project Gulf Opportunity Zone Series A-1 (Industrial Development Revenue) ø | | | 0.65 | | | | 11-1-2040 | | | | 34,000,000 | | | | 34,000,000 | |
St. James Parish LA Nucor Steel LLC Project Gulf Opportunity Zone Series B-1 (Industrial Development Revenue) ø | | | 0.70 | | | | 11-1-2040 | | | | 6,000,000 | | | | 6,000,000 | |
| |
| | | | 150,468,126 | |
| | | | | | | | | | | | | | | | |
| | | | |
| Maryland: 1.80% | | | | | | | | | | | | | | | | |
Howard County MD Housing Commission Series A (Housing Revenue) ± | | | 1.66 | | | | 7-1-2034 | | | | 16,050,000 | | | | 16,023,678 | |
Maryland Community Development Administration Department Housing & Community Multifamily Bernard E Mason Apartments Series F (Housing Revenue) | | | 1.17 | | | | 11-1-2017 | | | | 18,020,000 | | | | 18,030,091 | |
Maryland Community Development Administration Department Housing & Community Multifamily Riverwatch Apartments Series J (Housing Revenue) | | | 1.00 | | | | 4-1-2017 | | | | 11,750,000 | | | | 11,750,823 | |
Maryland Health & HEFAR John Hopkins Health System Series A (Health Revenue) ± | | | 0.91 | | | | 5-15-2046 | | | | 8,000,000 | | | | 7,989,600 | |
Maryland Health & HEFAR John Hopkins Health System Series B (Health Revenue) ± | | | 0.89 | | | | 5-15-2029 | | | | 9,815,000 | | | | 9,798,609 | |
Maryland Health & HEFAR John Hopkins Health System Series C (Health Revenue) ± | | | 1.14 | | | | 5-15-2038 | | | | 22,100,000 | | | | 22,090,055 | |
Maryland Health & HEFAR John Hopkins Health System Series D (Health Revenue) ± | | | 1.14 | | | | 5-15-2038 | | | | 18,890,000 | | | | 18,881,500 | |
| |
| | | | 104,564,356 | |
| | | | | | | | | | | | | | | | |
| | | | |
| Massachusetts: 3.21% | | | | | | | | | | | | | | | | |
Massachusetts Consolidated Loan Series D-1 (Miscellaneous Revenue) ± | | | 1.05 | | | | 8-1-2043 | | | | 93,750,000 | | | | 93,750,000 | |
Massachusetts Development Finance Agency Dominion Energy Brayton Recovery Zone Series A (Utilities Revenue) | | | 2.25 | | | | 12-1-2041 | | | | 2,665,000 | | | | 2,672,808 | |
Massachusetts Development Finance Agency Southcoast Health System Obligation Series F (Health Revenue) | | | 3.00 | | | | 7-1-2016 | | | | 500,000 | | | | 500,035 | |
Massachusetts Development Finance Agency Southcoast Health System Obligation Series F (Health Revenue) | | | 3.00 | | | | 7-1-2017 | | | | 500,000 | | | | 510,815 | |
Massachusetts Development Finance Agency Waste Management Incorporated (Resource Recovery Revenue) ± | | | 1.60 | | | | 5-1-2027 | | | | 7,000,000 | | | | 7,042,280 | |
The accompanying notes are an integral part of these financial statements.
| | | | |
| 18 | | Wells Fargo Short-Term Municipal Bond Fund | | Portfolio of investments—June 30, 2016 |
| | | | | | | | | | | | | | | | |
| Security name | | Interest rate | | | Maturity date | | | Principal | | | Value | |
| | | | | | | | | | | | | | | | |
|
| Massachusetts (continued) | |
Massachusetts Educational Financing Authority Education Loan Series I (Education Revenue) | | | 4.00 | % | | | 1-1-2018 | | | $ | 1,750,000 | | | $ | 1,819,020 | |
Massachusetts Educational Financing Authority Series A (Education Revenue) | | | 3.50 | | | | 1-1-2019 | | | | 2,500,000 | | | | 2,613,575 | |
Massachusetts Educational Financing Authority Series A (Education Revenue) | | | 5.00 | | | | 1-1-2018 | | | | 1,500,000 | | | | 1,581,405 | |
Massachusetts Educational Financing Authority Series A (Education Revenue) | | | 5.00 | | | | 1-1-2019 | | | | 3,000,000 | | | | 3,246,180 | |
Massachusetts Educational Financing Authority Series A (Education Revenue) | | | 5.00 | | | | 1-1-2020 | | | | 3,000,000 | | | | 3,327,720 | |
Massachusetts Educational Financing Authority Series A (Education Revenue) | | | 5.00 | | | | 1-1-2022 | | | | 2,955,000 | | | | 3,379,959 | |
Massachusetts Educational Financing Authority Series K (Education Revenue) | | | 5.00 | | | | 7-1-2019 | | | | 2,000,000 | | | | 2,195,500 | |
Massachusetts Educational Financing Authority Tender Option Bond Trust Receipts Floaters Series 2016-XF2306 (Education Revenue, Morgan Stanley Bank LIQ) ø144A | | | 0.70 | | | | 7-1-2033 | | | | 10,000,000 | | | | 10,000,000 | |
Massachusetts HEFA Partners Healthcare Series G6 (Health Revenue) ± | | | 1.29 | | | | 7-1-2038 | | | | 40,000,000 | | | | 39,996,400 | |
Massachusetts Series A (GO Revenue) ± | | | 0.93 | | | | 9-1-2016 | | | | 4,000,000 | | | | 4,000,720 | |
Massachusetts Various Consolidated Loans Series D (Tax Revenue) ± | | | 0.84 | | | | 1-1-2018 | | | | 9,500,000 | | | | 9,504,180 | |
| |
| | | | 186,140,597 | |
| | | | | | | | | | | | | | | | |
| | | | |
| Michigan: 4.18% | | | | | | | | | | | | | | | | |
Birmingham MI City School District (GO Revenue) | | | 5.00 | | | | 11-1-2018 | | | | 905,000 | | | | 994,704 | |
Birmingham MI City School District (GO Revenue) | | | 5.00 | | | | 11-1-2019 | | | | 5,970,000 | | | | 6,795,830 | |
Caledonia MI Community Schools (GO Revenue, Qualified School Board Loan Fund Insured) | | | 5.00 | | | | 5-1-2017 | | | | 250,000 | | | | 258,980 | |
Caledonia MI Community Schools (GO Revenue, Qualified School Board Loan Fund Insured) | | | 5.00 | | | | 5-1-2018 | | | | 1,315,000 | | | | 1,415,203 | |
Caledonia MI Community Schools (GO Revenue, Qualified School Board Loan Fund Insured) | | | 5.00 | | | | 5-1-2020 | | | | 500,000 | | | | 574,060 | |
Caledonia MI Community Schools (GO Revenue, Qualified School Board Loan Fund Insured) | | | 5.00 | | | | 5-1-2021 | | | | 1,140,000 | | | | 1,343,137 | |
Chippewa Hills MI School District (GO Revenue, Qualified School Board Loan Fund Insured) | | | 4.00 | | | | 5-1-2017 | | | | 740,000 | | | | 760,424 | |
Chippewa Hills MI School District (GO Revenue, Qualified School Board Loan Fund Insured) | | | 4.00 | | | | 5-1-2018 | | | | 1,535,000 | | | | 1,624,061 | |
Chippewa Hills MI School District (GO Revenue, Qualified School Board Loan Fund Insured) | | | 4.00 | | | | 5-1-2019 | | | | 1,595,000 | | | | 1,732,361 | |
Detroit MI (GO Revenue) | | | 5.00 | | | | 11-1-2016 | | | | 855,000 | | | | 865,739 | |
Detroit MI Sewage Disposal System Series A (Water & Sewer Revenue, AGM Insured) | | | 5.25 | | | | 7-1-2019 | | | | 980,000 | | | | 1,099,491 | |
Detroit MI Wayne County Stadium Authority (Miscellaneous Revenue) | | | 5.00 | | | | 10-1-2016 | | | | 4,060,000 | | | | 4,061,380 | |
Detroit MI Wayne County Stadium Authority (Miscellaneous Revenue) | | | 5.00 | | | | 10-1-2017 | | | | 3,000,000 | | | | 3,003,210 | |
Flint MI International Academy Public School Project (Education Revenue) | | | 5.00 | | | | 10-1-2017 | | | | 510,000 | | | | 516,701 | |
Flushing MI Community Schools School District (GO Revenue, Qualified School Board Loan Fund Insured) | | | 4.00 | | | | 5-1-2017 | | | | 975,000 | | | | 1,001,910 | |
Flushing MI Community Schools School District (GO Revenue, Qualified School Board Loan Fund Insured) | | | 4.00 | | | | 5-1-2021 | | | | 1,135,000 | | | | 1,284,071 | |
Forest Hills MI Public Schools (GO Revenue) | | | 5.00 | | | | 5-1-2018 | | | | 2,000,000 | | | | 2,155,340 | |
Forest Hills MI Public Schools (GO Revenue) | | | 5.00 | | | | 5-1-2019 | | | | 1,375,000 | | | | 1,534,693 | |
Fraser MI Public Schools District (GO Revenue, Qualified School Board Loan Fund Insured) | | | 5.00 | | | | 5-1-2017 | | | | 1,000,000 | | | | 1,035,920 | |
Fraser MI Public Schools District (GO Revenue, Qualified School Board Loan Fund Insured) | | | 5.00 | | | | 5-1-2019 | | | | 1,050,000 | | | | 1,169,753 | |
Gibraltar MI School District (GO Revenue, Qualified School Board Loan Fund Insured) | | | 5.00 | | | | 5-1-2019 | | | | 1,085,000 | | | | 1,206,270 | |
The accompanying notes are an integral part of these financial statements.
| | | | | | |
| Portfolio of investments—June 30, 2016 | | Wells Fargo Short-Term Municipal Bond Fund | | | 19 | |
| | | | | | | | | | | | | | | | |
| Security name | | Interest rate | | | Maturity date | | | Principal | | | Value | |
| | | | | | | | | | | | | | | | |
|
| Michigan (continued) | |
Gibraltar MI School District (GO Revenue, Qualified School Board Loan Fund Insured) | | | 5.00 | % | | | 5-1-2020 | | | $ | 1,100,000 | | | $ | 1,258,323 | |
Gibraltar MI School District (GO Revenue, Qualified School Board Loan Fund Insured) | | | 5.00 | | | | 5-1-2021 | | | | 1,185,000 | | | | 1,388,654 | |
Grand Ledge MI Public School District (GO Revenue, Qualified School Board Loan Fund Insured) | | | 5.00 | | | | 5-1-2020 | | | | 2,680,000 | | | | 3,076,962 | |
Haslett MI Public Schools (GO Revenue, Qualified School Board Loan Fund Insured) | | | 4.00 | | | | 5-1-2019 | | | | 515,000 | | | | 559,352 | |
Haslett MI Public Schools (GO Revenue, Qualified School Board Loan Fund Insured) | | | 4.00 | | | | 5-1-2020 | | | | 370,000 | | | | 410,929 | |
Haslett MI Public Schools (GO Revenue, Qualified School Board Loan Fund Insured) | | | 5.00 | | | | 5-1-2021 | | | | 500,000 | | | | 589,095 | |
Hudsonville MI Public Schools (GO Revenue, Qualified School Board Loan Fund Insured) | | | 5.00 | | | | 5-1-2018 | | | | 750,000 | | | | 807,150 | |
Hudsonville MI Public Schools (GO Revenue, Qualified School Board Loan Fund Insured) | | | 5.00 | | | | 5-1-2019 | | | | 1,605,000 | | | | 1,788,050 | |
Lake Orion MI Community School District (GO Revenue, Qualified School Board Loan Fund Insured) | | | 5.00 | | | | 5-1-2019 | | | | 2,325,000 | | | | 2,590,166 | |
Lake Orion MI Community School District (GO Revenue, Qualified School Board Loan Fund Insured) | | | 5.00 | | | | 5-1-2019 | | | | 915,000 | | | | 1,019,356 | |
Lake Orion MI Community School District (GO Revenue, Qualified School Board Loan Fund Insured) | | | 5.00 | | | | 5-1-2021 | | | | 1,385,000 | | | | 1,631,793 | |
Lake Orion MI Community School District Refunding Bond (GO Revenue, Qualified School Board Loan Fund Insured) | | | 5.00 | | | | 5-1-2020 | | | | 2,940,000 | | | | 3,375,473 | |
Michigan Finance Authority Refunding Bond 2nd Lien Detroit Water & Sewer Series C-7 (Water & Sewer Revenue, National Insured) | | | 5.00 | | | | 7-1-2019 | | | | 2,500,000 | | | | 2,784,850 | |
Michigan Finance Authority Refunding Bond 2nd Lien Detroit Water & Sewer Series C-7 (Water & Sewer Revenue, National Insured) | | | 5.00 | | | | 7-1-2020 | | | | 3,835,000 | | | | 4,389,925 | |
Michigan Finance Authority Refunding Bond 2nd Lien Detroit Water & Sewer Series C-7 (Water & Sewer Revenue, National Insured) | | | 5.00 | | | | 7-1-2021 | | | | 3,095,000 | | | | 3,629,878 | |
Michigan Finance Authority Refunding Bond 2nd Lien Detroit Water & Sewer Series C-8 (Water & Sewer Revenue) | | | 5.00 | | | | 7-1-2016 | | | | 2,000,000 | | | | 2,000,260 | |
Michigan Finance Authority Refunding Bond 2nd Lien Detroit Water & Sewer Series C-8 (Water & Sewer Revenue) | | | 5.00 | | | | 7-1-2017 | | | | 2,500,000 | | | | 2,597,225 | |
Michigan Finance Authority Refunding Bond 2nd Lien Detroit Water & Sewer Series C-8 (Water & Sewer Revenue) | | | 5.00 | | | | 7-1-2018 | | | | 2,000,000 | | | | 2,147,880 | |
Michigan Finance Authority Refunding Bond Local Government Loan Program Detroit Water & Sewer Series D-1 (Water & Sewer Revenue, AGM Insured) | | | 5.00 | | | | 7-1-2020 | | | | 10,000,000 | | | | 11,476,500 | |
Michigan Finance Authority Refunding Bond Local Government Loan Program Detroit Water & Sewer Series D-3 (Water & Sewer Revenue, National Insured) | | | 5.00 | | | | 7-1-2019 | | | | 7,000,000 | | | | 7,797,580 | |
Michigan Finance Authority Refunding Bond Local Government Loan Program Detroit Water & Sewer Series D-6 (Water & Sewer Revenue, National Insured) | | | 5.00 | | | | 7-1-2019 | | | | 1,500,000 | | | | 1,670,910 | |
Michigan Finance Authority Refunding Bond Local Government Loan Program Detroit Water & Sewer Series D-6 (Water & Sewer Revenue, National Insured) | | | 5.00 | | | | 7-1-2020 | | | | 1,800,000 | | | | 2,060,460 | |
Michigan Finance Authority Refunding Bond Senior Lien Detroit Water & Sewer Series C-3 (Water & Sewer Revenue, AGM Insured) | | | 5.00 | | | | 7-1-2021 | | | | 7,500,000 | | | | 8,812,050 | |
Michigan Finance Authority Refunding Bond Senior Lien Detroit Water & Sewer Series C-5 (Water & Sewer Revenue, National Insured) | | | 5.00 | | | | 7-1-2019 | | | | 7,000,000 | | | | 7,797,580 | |
Michigan Finance Authority Refunding Bond Senior Lien Detroit Water & Sewer Series C-5 (Water & Sewer Revenue, National Insured) | | | 5.00 | | | | 7-1-2020 | | | | 8,720,000 | �� | | | 9,981,784 | |
Michigan Finance Authority School District (Miscellaneous Revenue) | | | 4.00 | | | | 6-1-2017 | | | | 800,000 | | | | 814,712 | |
Michigan Finance Authority School District (Miscellaneous Revenue) | | | 5.00 | | | | 6-1-2017 | | | | 750,000 | | | | 770,595 | |
Michigan Finance Authority School District (Miscellaneous Revenue) | | | 5.00 | | | | 7-1-2021 | | | | 2,060,000 | | | | 2,237,160 | |
The accompanying notes are an integral part of these financial statements.
| | | | |
| 20 | | Wells Fargo Short-Term Municipal Bond Fund | | Portfolio of investments—June 30, 2016 |
| | | | | | | | | | | | | | | | |
| Security name | | Interest rate | | | Maturity date | | | Principal | | | Value | |
| | | | | | | | | | | | | | | | |
|
| Michigan (continued) | |
Michigan Finance Authority Unemployment Obligation Assessment Series B (Miscellaneous Revenue) | | | 5.00 | % | | | 1-1-2020 | | | $ | 15,000,000 | | | $ | 16,889,400 | |
Michigan Hospital Finance Authority Ascension Health Subordinate Credit Group Series 2005 A-4 (Health Revenue) ± | | | 1.63 | | | | 11-1-2027 | | | | 3,505,000 | | | | 3,552,282 | |
Michigan Hospital Finance Authority Ascension Health Series A-3 (Health Revenue) ± | | | 1.87 | | | | 11-1-2027 | | | | 23,815,000 | | | | 24,209,853 | |
Michigan Housing Development Authority Limited Greenwood Villa Project (Housing Revenue, AGM Insured) | | | 4.75 | | | | 9-15-2017 | | | | 1,280,000 | | | | 1,300,442 | |
Michigan Housing Development Authority Series A (Housing Revenue) | | | 1.80 | | | | 4-1-2019 | | | | 7,000,000 | | | | 7,073,850 | |
Michigan Strategic Fund Limited Obligation Events Center Project Series A (Tax Revenue) ± | | | 4.13 | | | | 7-1-2045 | | | | 29,250,000 | | | | 30,034,778 | |
Rochester MI Community School District (GO Revenue, Qualified School Board Loan Fund Insured) | | | 5.00 | | | | 5-1-2017 | | | | 900,000 | | | | 932,715 | |
Rochester MI Community School District (GO Revenue, Qualified School Board Loan Fund Insured) | | | 5.00 | | | | 5-1-2019 | | | | 900,000 | | | | 1,004,526 | |
South Lyon MI Community School District (GO Revenue) | | | 4.00 | | | | 5-1-2018 | | | | 2,060,000 | | | | 2,179,521 | |
South Lyon MI Community School District (GO Revenue) | | | 4.00 | | | | 5-1-2019 | | | | 1,860,000 | | | | 2,020,183 | |
South Lyon MI Community School District (GO Revenue) | | | 4.00 | | | | 5-1-2020 | | | | 1,425,000 | | | | 1,582,634 | |
Southgate MI Community School District (GO Revenue, Build America Mutual Assurance Company Insured) | | | 5.00 | | | | 5-1-2019 | | | | 1,000,000 | | | | 1,116,140 | |
Southgate MI Community School District (GO Revenue, Build America Mutual Assurance Company Insured) | | | 5.00 | | | | 5-1-2020 | | | | 500,000 | | | | 576,445 | |
Warren Woods MI Public Schools (GO Revenue, Qualified School Board Loan Fund Insured) | | | 5.00 | | | | 5-1-2017 | | | | 1,445,000 | | | | 1,496,904 | |
Warren Woods MI Public Schools (GO Revenue, Qualified School Board Loan Fund Insured) | | | 5.00 | | | | 5-1-2020 | | | | 1,445,000 | | | | 1,659,033 | |
Wayne County MI Airport Authority Refunding Bond Series A (Airport Revenue) | | | 5.00 | | | | 12-1-2019 | | | | 19,405,000 | | | | 21,755,722 | |
Western Michigan University Refunding Bond (Education Revenue) | | | 5.00 | | | | 11-15-2020 | | | | 1,000,000 | | | | 1,166,830 | |
| |
| | | | 242,449,148 | |
| | | | | | | | | | | | | | | | |
| | | | |
| Minnesota: 0.31% | | | | | | | | | | | | | | | | |
Central Minnesota Municipal Power Agency Brookings Southeast Twin Cities Transmission Project (Utilities Revenue) | | | 5.00 | | | | 1-1-2017 | | | | 1,215,000 | | | | 1,219,216 | |
Hayward MN HCFR St. John’s Lutheran Home of Albert Lea Project Series 2015 (Health Revenue) | | | 2.75 | | | | 11-1-2017 | | | | 10,410,000 | | | | 10,478,186 | |
Minneapolis & St. Paul MN Housing & RDA HealthSpan Series B (Health Revenue, Ambac Insured) ±(m)(n) | | | 0.59 | | | | 11-15-2017 | | | | 5,800,000 | | | | 5,742,000 | |
Northern Minnesota Municipal Power Agency Series 2008A (Utilities Revenue, AGC Insured) | | | 5.00 | | | | 1-1-2018 | | | | 670,000 | | | | 712,264 | |
| |
| | | | 18,151,666 | |
| | | | | | | | | | | | | | | | |
| | | | |
| Mississippi: 0.31% | | | | | | | | | | | | | | | | |
Mississippi Business Finance Corporation Power Company Project 1st Series (Utilities Revenue) ± | | | 1.63 | | | | 12-1-2040 | | | | 10,075,000 | | | | 10,153,182 | |
Mississippi Development Bank Special Obligation Jackson Water & Sewer System Project (Water & Sewer Revenue, AGM Insured) | | | 5.00 | | | | 12-1-2016 | | | | 495,000 | | | | 503,994 | |
Mississippi Refunding Bond Capital Improvements Projects Series D (Miscellaneous Revenue) ± | | | 0.92 | | | | 9-1-2017 | | | | 7,605,000 | | | | 7,604,848 | |
| |
| | | | 18,262,024 | |
| | | | | | | | | | | | | | | | |
The accompanying notes are an integral part of these financial statements.
| | | | | | |
| Portfolio of investments—June 30, 2016 | | Wells Fargo Short-Term Municipal Bond Fund | | | 21 | |
| | | | | | | | | | | | | | | | |
| Security name | | Interest rate | | | Maturity date | | | Principal | | | Value | |
| | | | | | | | | | | | | | | | |
| | | | |
| Missouri: 0.34% | | | | | | | | | | | | | | | | |
Jackson County MO Special Obligation Harry S. Truman Sports Complex (Tax Revenue, Ambac Insured) | | | 5.00 | % | | | 12-1-2019 | | | $ | 3,000,000 | | | $ | 3,055,830 | |
Kansas City MO Series A (GO Revenue) | | | 5.00 | | | | 2-1-2018 | | | | 1,150,000 | | | | 1,228,741 | |
Kansas City MO Series A (GO Revenue) | | | 5.00 | | | | 2-1-2019 | | | | 1,000,000 | | | | 1,108,280 | |
Kansas City MO Series A (GO Revenue) | | | 5.00 | | | | 2-1-2020 | | | | 1,495,000 | | | | 1,714,122 | |
Sikeston MO Electric System Refunding Bond (Utilities Revenue) | | | 5.00 | | | | 6-1-2019 | | | | 11,625,000 | | | | 12,751,928 | |
| |
| | | | 19,858,901 | |
| | | | | | | | | | | | | | | | |
| | | | |
| Nebraska: 0.02% | | | | | | | | | | | | | | | | |
Public Power Generation Agency Whelan Energy Center Unit (Utilities Revenue) | | | 5.00 | | | | 1-1-2020 | | | | 1,000,000 | | | | 1,128,130 | |
| | | | | | | | | | | | | | | | |
| | | | |
| Nevada: 1.12% | | | | | | | | | | | | | | | | |
Clark County NV Airport Jet Aviation Fuel Tax Series A (Airport Revenue) | | | 5.00 | | | | 7-1-2019 | | | | 1,000,000 | | | | 1,114,260 | |
Clark County NV Airport Jet Aviation Fuel Tax Series A (Airport Revenue) | | | 5.00 | | | | 7-1-2020 | | | | 1,000,000 | | | | 1,145,120 | |
Clark County NV Department of Aviation Subordinated Lien Series D-3 (Airport Revenue, Bank of America NA LOC) ø | | | 0.41 | | | | 7-1-2029 | | | | 4,000,000 | | | | 4,000,000 | |
Clark County NV PCR (Industrial Development Revenue) ± | | | 1.88 | | | | 6-1-2031 | | | | 880,000 | | | | 900,258 | |
Clark County NV School District Series A (GO Revenue, National Insured) | | | 5.00 | | | | 6-15-2021 | | | | 2,000,000 | | | | 2,142,080 | |
Clark County NV School District Series B (GO Revenue) | | | 5.00 | | | | 6-15-2019 | | | | 18,800,000 | | | | 21,094,164 | |
Clark County NV School District Series B (GO Revenue) | | | 5.00 | | | | 6-15-2021 | | | | 1,400,000 | | | | 1,486,842 | |
Nevada River Commission Hoover Upgrading Project Series E (GO Revenue) | | | 5.00 | | | | 10-1-2016 | | | | 4,595,000 | | | | 4,647,888 | |
Washoe County NV Water Facilities Refunding Bond AMT Sierra Pacific Power Company Project Series 2016 (Water & Sewer Revenue) ± | | | 0.63 | | | | 3-1-2036 | | | | 9,250,000 | | | | 9,250,000 | |
Washoe County NV Water Facilities Refunding Bond AMT Sierra Pacific Power Company Project Series 2016D (Water & Sewer Revenue) ± | | | 0.64 | | | | 3-1-2036 | | | | 11,000,000 | | | | 11,000,000 | |
Washoe County NV Water Facilities Refunding Bond AMT Sierra Pacific Power Company Project Series 2016E (Water & Sewer Revenue) ± | | | 0.65 | | | | 3-1-2036 | | | | 8,000,000 | | | | 8,000,000 | |
| |
| | | | 64,780,612 | |
| | | | | | | | | | | | | | | | |
| | | | |
| New Hampshire: 0.12% | | | | | | | | | | | | | | | | |
New Hampshire HEFA Catholic Medical Center (Health Revenue) | | | 4.00 | | | | 7-1-2018 | | | | 2,405,000 | | | | 2,517,843 | |
New Hampshire HEFA Catholic Medical Center (Health Revenue) | | | 4.00 | | | | 7-1-2019 | | | | 2,635,000 | | | | 2,810,096 | |
New Hampshire HFA SFMR Series B (Housing Revenue) | | | 5.00 | | | | 7-1-2027 | | | | 1,465,000 | | | | 1,540,067 | |
| |
| | | | 6,868,006 | |
| | | | | | | | | | | | | | | | |
| | | | |
| New Jersey: 5.01% | | | | | | | | | | | | | | | | |
Casino Reinvestment Development Authority New Jersey (Tax Revenue) | | | 4.00 | | | | 11-1-2017 | | | | 1,000,000 | | | | 1,013,700 | |
Casino Reinvestment Development Authority New Jersey (Tax Revenue) | | | 4.00 | | | | 11-1-2019 | | | | 1,500,000 | | | | 1,541,130 | |
Hudson County NJ Refunding Bond County College (GO Revenue) | | | 4.00 | | | | 7-15-2017 | | | | 1,000,000 | | | | 1,034,910 | |
Hudson County NJ Refunding Bond County College (GO Revenue) | | | 4.00 | | | | 7-15-2018 | | | | 1,135,000 | | | | 1,211,420 | |
Jersey City NJ Refunding Bond (GO Revenue, AGM Insured) | | | 4.00 | | | | 9-1-2017 | | | | 1,620,000 | | | | 1,677,947 | |
Morris-Union Jointure Commission New Jersey Refunding Bond (Miscellaneous Revenue, AGM Insured) | | | 4.00 | | | | 8-1-2016 | | | | 2,235,000 | | | | 2,240,386 | |
New Jersey Certificate of Participation Equipment Lease Purchase Agreement Series A (Miscellaneous Revenue) | | | 5.00 | | | | 6-15-2018 | | | | 11,160,000 | | | | 11,865,535 | |
New Jersey EDA (Tobacco Revenue) | | | 4.00 | | | | 6-15-2019 | | | | 2,500,000 | | | | 2,643,100 | |
New Jersey EDA CAB Saint Barnabas Hospital Series A (Health Revenue, National Insured) ¤ | | | 0.00 | | | | 7-1-2017 | | | | 2,740,000 | | | | 2,704,627 | |
New Jersey EDA Cigarette Tax (Tobacco Revenue) | | | 5.00 | | | | 6-15-2017 | | | | 18,520,000 | | | | 19,099,306 | |
New Jersey EDA Motor Vehicle Commission Series A (Miscellaneous Revenue, National Insured) | | | 5.25 | | | | 7-1-2016 | | | | 2,190,000 | | | | 2,190,307 | |
The accompanying notes are an integral part of these financial statements.
| | | | |
| 22 | | Wells Fargo Short-Term Municipal Bond Fund | | Portfolio of investments—June 30, 2016 |
| | | | | | | | | | | | | | | | |
| Security name | | Interest rate | | | Maturity date | | | Principal | | | Value | |
| | | | | | | | | | | | | | | | |
|
| New Jersey (continued) | |
New Jersey EDA Prerefunded School Facilities Construction Series EE (Miscellaneous Revenue) | | | 5.00 | % | | | 9-1-2018 | | | $ | 2,375,000 | | | $ | 2,594,118 | |
New Jersey EDA Prerefunded School Facilities Construction Series EE (Miscellaneous Revenue) | | | 5.00 | | | | 9-1-2020 | | | | 1,650,000 | | | | 1,923,240 | |
New Jersey EDA Series UU (Miscellaneous Revenue) | | | 5.00 | | | | 6-15-2017 | | | | 3,000,000 | | | | 3,112,320 | |
New Jersey EDA Series UU (Miscellaneous Revenue) | | | 5.00 | | | | 6-15-2018 | | | | 7,355,000 | | | | 7,812,702 | |
New Jersey EDA Unrefunded School Facilities Construction Series EE (Miscellaneous Revenue) | | | 5.00 | | | | 9-1-2020 | | | | 610,000 | | | | 672,531 | |
New Jersey EDA Unrefunded School Facilities School Facilities Construction Series EE (Miscellaneous Revenue) | | | 5.00 | | | | 9-1-2018 | | | | 865,000 | | | | 923,344 | |
New Jersey EDA School Facilities Construction Bonds Series DD-1 (Miscellaneous Revenue) | | | 5.00 | | | | 12-15-2019 | | | | 1,000,000 | | | | 1,094,760 | |
New Jersey EDA School Facilities Construction Bonds Series K (Miscellaneous Revenue, National Insured) | | | 5.25 | | | | 12-15-2021 | | | | 1,040,000 | | | | 1,197,976 | |
New Jersey EDA School Facilities Construction Notes (Miscellaneous Revenue) ± | | | 1.31 | | | | 2-1-2017 | | | | 20,725,000 | | | | 20,579,925 | |
New Jersey EDA School Facilities Construction Notes Series C (Miscellaneous Revenue) ± | | | 2.21 | | | | 2-1-2018 | | | | 38,000,000 | | | | 37,841,160 | |
New Jersey EDA School Facilities Construction Notes Series DD1 (Miscellaneous Revenue) | | | 5.00 | | | | 12-15-2018 | | | | 4,690,000 | | | | 5,040,906 | |
New Jersey EDA School Facilities Construction Notes Series K (Miscellaneous Revenue) ± | | | 1.12 | | | | 2-1-2017 | | | | 10,000,000 | | | | 9,976,700 | |
New Jersey EDA School Facilities Construction Notes Series NN (Miscellaneous Revenue) | | | 5.00 | | | | 3-1-2022 | | | | 330,000 | | | | 369,128 | |
New Jersey Educational Facilities Authority Higher Education Capital Improvement Project Series A (Education Revenue) | | | 4.00 | | | | 9-1-2017 | | | | 2,425,000 | | | | 2,503,522 | |
New Jersey Educational Facilities Authority Higher Education Capital Improvement Project Series B (Education Revenue) | | | 4.00 | | | | 9-1-2017 | | | | 525,000 | | | | 542,000 | |
New Jersey Educational Facilities Authority Higher Education Capital Improvement Project Series D (Education Revenue) | | | 4.00 | | | | 9-1-2016 | | | | 540,000 | | | | 542,884 | |
New Jersey Educational Facilities Authority Higher Education Capital Improvement Project Series D (Education Revenue) | | | 4.00 | | | | 9-1-2017 | | | | 565,000 | | | | 583,295 | |
New Jersey HFFA Trinitas Hospital Obligation Series B (Health Revenue) | | | 5.25 | | | | 7-1-2023 | | | | 4,475,000 | | | | 4,675,570 | |
New Jersey HFFA Greystone Park Psychiatric Hospital Project Series B (Miscellaneous Revenue) | | | 5.00 | | | | 9-15-2019 | | | | 2,135,000 | | | | 2,326,253 | |
New Jersey Higher Education Assistance Authority Series A1 (Education Revenue) | | | 3.63 | | | | 12-1-2030 | | | | 2,120,000 | | | | 2,230,749 | |
New Jersey Higher Education Assistance Authority Series A1 (Education Revenue) | | | 5.00 | | | | 12-1-2020 | | | | 9,775,000 | | | | 10,997,462 | |
New Jersey Housing and Mortgage Finance Agency Series B (Housing Revenue) | | | 1.15 | | | | 11-1-2018 | | | | 11,095,000 | | | | 11,115,304 | |
New Jersey Housing and Mortgage Finance Agency Series B (Housing Revenue) | | | 1.25 | | | | 5-1-2019 | | | | 6,000,000 | | | | 6,018,900 | |
New Jersey Sports & Exposition Authority Series B (Miscellaneous Revenue) | | | 5.00 | | | | 9-1-2018 | | | | 1,605,000 | | | | 1,713,257 | |
New Jersey Transit Corporation Federal Transit Administration Grants Series A (Miscellaneous Revenue, National Insured) | | | 5.00 | | | | 9-15-2017 | | | | 7,265,000 | | | | 7,647,430 | |
New Jersey Transportation Program Series B (Miscellaneous Revenue, National Insured) | | | 5.50 | | | | 12-15-2016 | | | | 2,205,000 | | | | 2,253,091 | |
New Jersey Transportation Trust Fund Series A (Miscellaneous Revenue) | | | 5.00 | | | | 12-15-2019 | | | | 3,000,000 | | | | 3,280,950 | |
New Jersey TTFA Series A (Miscellaneous Revenue) | | | 5.00 | | | | 12-15-2018 | | | | 1,000,000 | | | | 1,074,950 | |
New Jersey TTFA Series A (Transportation Revenue) | | | 5.25 | | | | 12-15-2020 | | | | 33,465,000 | | | | 37,486,154 | |
New Jersey TTFA Series AA (Transportation Revenue) | | | 5.00 | | | | 6-15-2019 | | | | 2,070,000 | | | | 2,241,065 | |
New Jersey TTFA Transit System Series A (GO Revenue) | | | 5.75 | | | | 6-15-2020 | | | | 4,150,000 | | | | 4,674,809 | |
New Jersey Turnpike Authority Series B-2 (Transportation Revenue) ± | | | 0.73 | | | | 1-1-2024 | | | | 25,000,000 | | | | 24,965,000 | |
New Jersey Turnpike Authority Series B-3 (Transportation Revenue) ± | | | 0.88 | | | | 1-1-2024 | | | | 4,700,000 | | | | 4,686,793 | |
Newark NJ Housing Authority Refunding Bond Newark Redevelopment Project (Miscellaneous Revenue, National Insured) | | | 5.25 | | | | 1-1-2020 | | | | 2,170,000 | | | | 2,458,588 | |
Newark NJ Housing Authority Refunding Bond Newark Redevelopment Project (Miscellaneous Revenue, National Insured) | | | 5.25 | | | | 1-1-2021 | | | | 4,570,000 | | | | 5,285,434 | |
The accompanying notes are an integral part of these financial statements.
| | | | | | |
| Portfolio of investments—June 30, 2016 | | Wells Fargo Short-Term Municipal Bond Fund | | | 23 | |
| | | | | | | | | | | | | | | | |
| Security name | | Interest rate | | | Maturity date | | | Principal | | | Value | |
| | | | | | | | | | | | | | | | |
|
| New Jersey (continued) | |
Rutgers University Series J (Education Revenue) | | | 4.00 | % | | | 5-1-2018 | | | $ | 700,000 | | | $ | 741,979 | |
Rutgers University Series L (Education Revenue) | | | 5.00 | | | | 5-1-2017 | | | | 600,000 | | | | 622,068 | |
Rutgers University Series L (Education Revenue) | | | 5.00 | | | | 5-1-2018 | | | | 300,000 | | | | 323,454 | |
Trenton City NJ Refunding Bond (GO Revenue) | | | 4.00 | | | | 7-15-2019 | | | | 1,815,000 | | | | 1,923,537 | |
Trenton City NJ Refunding Bond (GO Revenue) | | | 4.00 | | | | 7-15-2020 | | | | 1,685,000 | | | | 1,805,983 | |
Trenton NJ Refunding Bond (GO Revenue, Build America Mutual Assurance Company Insured) | | | 4.00 | | | | 12-1-2017 | | | | 1,710,000 | | | | 1,774,706 | |
Trenton NJ Refunding Bond (GO Revenue, Build America Mutual Assurance Company Insured) | | | 5.00 | | | | 12-1-2020 | | | | 1,675,000 | | | | 1,907,172 | |
Winslow Township NJ Board of Education Refunding Bond (GO Revenue) | | | 3.00 | | | | 8-1-2017 | | | | 600,000 | | | | 613,224 | |
Winslow Township NJ Board of Education Refunding Bond (GO Revenue) | | | 4.00 | | | | 8-1-2018 | | | | 425,000 | | | | 450,815 | |
Winslow Township NJ Board of Education Refunding Bond (GO Revenue) | | | 4.00 | | | | 8-1-2019 | | | | 525,000 | | | | 570,791 | |
| |
| | | | 290,398,367 | |
| | | | | | | | | | | | | | | | |
| | | | |
| New Mexico: 0.91% | | | | | | | | | | | | | | | | |
Clayton NM Jail Project (Miscellaneous Revenue, CIFG Insured) | | | 5.00 | | | | 11-1-2016 | | | | 2,100,000 | | | | 2,131,584 | |
Farmington NM PCR Series B (Utilities Revenue) ± | | | 4.75 | | | | 6-1-2040 | | | | 5,080,000 | | | | 5,247,234 | |
Farmington NM PCR Southern California Edison Company Four Corners Project Series B (Utilities Revenue) ± | | | 1.88 | | | | 4-1-2029 | | | | 4,750,000 | | | | 4,873,453 | |
New Mexico Educational Assistance Foundation Series A2 (Education Revenue) ± | | | 1.32 | | | | 12-1-2028 | | | | 395,000 | | | | 393,045 | |
New Mexico Mortgage Finance Authority SFMR Class I-A-2 (Housing Revenue, GNMA/FNMA/FHLMC Insured) | | | 5.60 | | | | 1-1-2039 | | | | 265,000 | | | | 281,247 | |
New Mexico Municipal Energy Acquisition Authority Gas Supply Sub Series B (Utilities Revenue, Royal Bank of Canada SPA) ± | | | 1.06 | | | | 11-1-2039 | | | | 40,000,000 | | | | 39,689,200 | |
| |
| | | | 52,615,763 | |
| | | | | | | | | | | | | | | | |
| | | | |
| New York: 11.15% | | | | | | | | | | | | | | | | |
Broome County NY BAN (GO Revenue) | | | 2.00 | | | | 5-5-2017 | | | | 20,000,000 | | | | 20,208,800 | |
Candor Central School District Tioga and Tompkins Counties NY BAN (GO Revenue) | | | 2.00 | | | | 6-29-2017 | | | | 12,000,000 | | | | 12,137,760 | |
Long Island NY Power Authority Electric System Series C (Utilities Revenue) ± | | | 0.97 | | | | 5-1-2033 | | | | 12,000,000 | | | | 11,913,960 | |
Long Island NY Power Authority Electric System Series C (Utilities Revenue) ± | | | 1.20 | | | | 5-1-2033 | | | | 33,750,000 | | | | 33,686,213 | |
Metropolitan Transportation Authority New York Sub Series D2 (Transportation Revenue) ± | | | 4.00 | | | | 11-15-2034 | | | | 14,665,000 | | | | 16,009,194 | |
Metropolitan Transportation Authority New York Sub Series A2 (Transportation Revenue) ± | | | 0.97 | | | | 11-15-2039 | | | | 2,000,000 | | | | 1,989,400 | |
Metropolitan Transportation Authority New York Sub Series A3 (Transportation Revenue) ± | | | 0.91 | | | | 11-15-2042 | | | | 39,500,000 | | | | 39,095,125 | |
Metropolitan Transportation Authority New York Sub Series B3 (Tax Revenue) ± | | | 1.29 | | | | 11-1-2018 | | | | 32,600,000 | | | | 32,617,604 | |
Metropolitan Transportation Authority New York Sub Series B4 (Transportation Revenue) ± | | | 5.00 | | | | 11-15-2030 | | | | 12,445,000 | | | | 14,087,242 | |
Metropolitan Transportation Authority New York Sub Series C2 (Transportation Revenue) ± | | | 4.00 | | | | 11-15-2033 | | | | 8,000,000 | | | | 8,974,800 | |
Metropolitan Transportation Authority New York Sub Series D2 (Transportation Revenue, AGM Insured) ± | | | 0.92 | | | | 11-1-2032 | | | | 15,750,000 | | | | 15,687,473 | |
Metropolitan Transportation Authority New York Sub Series G1 (Transportation Revenue) ± | | | 0.79 | | | | 11-1-2026 | | | | 31,950,000 | | | | 31,677,147 | |
Metropolitan Transportation Authority New York Sub Series G3 (Transportation Revenue) ± | | | 1.01 | | | | 11-1-2031 | | | | 16,000,000 | | | | 16,006,720 | |
Metropolitan Transportation Authority New York Sub Series G4 (Transportation Revenue) ± | | | 1.15 | | | | 11-1-2030 | | | | 11,655,000 | | | | 11,666,072 | |
The accompanying notes are an integral part of these financial statements.
| | | | |
| 24 | | Wells Fargo Short-Term Municipal Bond Fund | | Portfolio of investments—June 30, 2016 |
| | | | | | | | | | | | | | | | |
| Security name | | Interest rate | | | Maturity date | | | Principal | | | Value | |
| | | | | | | | | | | | | | | | |
|
| New York (continued) | |
Nassau County NY Local Economic Assistance Winthrop University Hospital Project (Health Revenue) | | | 4.00 | % | | | 7-1-2016 | | | $ | 1,400,000 | | | $ | 1,400,126 | |
Nassau County NY Prerefunded Bond Series C (GO Revenue) | | | 5.00 | | | | 10-1-2020 | | | | 3,020,000 | | | | 3,422,234 | |
Nassau County NY Series F (GO Revenue) | | | 5.00 | | | | 10-1-2020 | | | | 1,780,000 | | | | 2,004,832 | |
Nassau County NY Unrefunded Bond Series C (GO Revenue) | | | 5.00 | | | | 10-1-2020 | | | | 45,000 | | | | 50,870 | |
New York Dormitory Authority Non Miriam Osborn Memorial Home Association (Health Revenue) | | | 2.00 | | | | 7-1-2016 | | | | 1,800,000 | | | | 1,800,072 | |
New York Dormitory Authority North Shore-Long Island Jewish Obligated Group Series B (Health Revenue) ± | | | 1.16 | | | | 5-1-2018 | | | | 6,655,000 | | | | 6,646,215 | |
New York Environmental Facilities Corporation Municipal Water Series A (Water & Sewer Revenue) | | | 5.00 | | | | 6-15-2017 | | | | 2,250,000 | | | | 2,346,098 | |
New York Environmental Facilities Corporation Municipal Water Series A (Water & Sewer Revenue) | | | 5.00 | | | | 6-15-2018 | | | | 750,000 | | | | 814,815 | |
New York Environmental Facilities Corporation Municipal Water Series A (Water & Sewer Revenue) | | | 5.00 | | | | 6-15-2019 | | | | 1,000,000 | | | | 1,127,680 | |
New York IDA American Airlines JFK International Airport (Industrial Development Revenue) | | | 7.50 | | | | 8-1-2016 | | | | 3,580,000 | | | | 3,601,301 | |
New York Local Government Assistance Corporation Series A9V (Tax Revenue, AGM Insured) ±(m)(n) | | | 0.48 | | | | 4-1-2017 | | | | 4,225,000 | | | | 4,214,438 | |
New York NY Adjusted Fiscal 2008 Sub Series A4 (GO Revenue, AGM Insured) ±(m) | | | 0.55 | | | | 8-1-2026 | | | | 4,450,000 | | | | 4,450,000 | |
New York NY Adjusted Fiscal 2008 Sub Series C4 (GO Revenue, AGC Insured) ±(m) | | | 0.55 | | | | 10-1-2027 | | | | 10,000,000 | | | | 10,000,000 | |
New York NY Adjusted Fiscal 2008 Sub Series J7 (GO Revenue) ± | | | 0.88 | | | | 8-1-2021 | | | | 19,000,000 | | | | 19,000,760 | |
New York NY Energy Research & Development Authority Gas Facilities Brooklyn Union Gas Project Series A1 (Utilities Revenue, National Insured) ±(m)(n) | | | 0.75 | | | | 12-1-2020 | | | | 15,000,000 | | | | 14,362,500 | |
New York NY Health & Hospital Corporation Health System Series A (Health Revenue) | | | 5.50 | | | | 2-15-2020 | | | | 5,755,000 | | | | 6,196,121 | |
New York NY IDAG Refunding Bond Senior Trips Series A (Airport Revenue) | | | 5.00 | | | | 7-1-2016 | | | | 2,250,000 | | | | 2,250,248 | |
New York NY IDAG Refunding Bond Senior Trips Series A (Airport Revenue) | | | 5.00 | | | | 7-1-2017 | | | | 2,000,000 | | | | 2,077,980 | |
New York NY John F. Kennedy International Airport Project Series B (Industrial Development Revenue) ± | | | 2.00 | | | | 8-1-2028 | | | | 10,800,000 | | | | 10,788,984 | |
New York NY Municipal Water Finance Authority Series AA3 (Water & Sewer Revenue, Dexia Credit Local SPA) ø | | | 0.55 | | | | 6-15-2032 | | | | 6,500,000 | | | | 6,500,000 | |
New York NY Refunding Bond 2015 Series A (GO Revenue) | | | 5.00 | | | | 8-1-2021 | | | | 7,515,000 | | | | 8,964,869 | |
New York NY Series J-4 (GO Revenue) ± | | | 0.96 | | | | 8-1-2025 | | | | 2,000,000 | | | | 2,000,060 | |
New York NY Sub Series J-11 (GO Revenue) ± | | | 0.99 | | | | 8-1-2027 | | | | 40,960,000 | | | | 40,715,878 | |
New York NY Urban Development Corporation Personal Income Tax Series A (Tax Revenue) | | | 5.00 | | | | 3-15-2019 | | | | 1,855,000 | | | | 2,069,345 | |
New York Tobacco Settlement Financing Corporation Series B (Tobacco Revenue) | | | 5.00 | | | | 6-1-2017 | | | | 6,500,000 | | | | 6,762,210 | |
New York Transportation Development Corporation American Airlines Incorporated John F. Kennedy International Airport Project Series 2016 (Airport Revenue) | | | 5.00 | | | | 8-1-2019 | | | | 15,000,000 | | | | 16,194,900 | |
New York Transportation Development Corporation American Airlines Incorporated John F Kennedy International Airport Project Series 2016 (Airport Revenue) | | | 5.00 | | | | 8-1-2020 | | | | 7,000,000 | | | | 7,704,200 | |
New York Urban Development Corporation Certificate of Participation James A Farley Post Office Project (Miscellaneous Revenue) 144A | | | 4.20 | | | | 2-1-2017 | | | | 42,840,000 | | | | 42,857,136 | |
New York Urban Development Corporation Personal Income Tax Series A (Tax Revenue) | | | 5.00 | | | | 3-15-2020 | | | | 25,175,000 | | | | 29,010,160 | |
Oyster Bay NY BAN Series A (GO Revenue) | | | 2.75 | | | | 2-3-2017 | | | | 15,000,000 | | | | 15,076,050 | |
Oyster Bay NY BAN Series D (GO Revenue) | | | 3.88 | | | | 6-28-2017 | | | | 3,485,000 | | | | 3,520,233 | |
Oyster Bay NY Public Improvement Series B (GO Revenue, AGM Insured) | | | 3.00 | | | | 11-1-2018 | | | | 1,140,000 | | | | 1,183,183 | |
The accompanying notes are an integral part of these financial statements.
| | | | | | |
| Portfolio of investments—June 30, 2016 | | Wells Fargo Short-Term Municipal Bond Fund | | | 25 | |
| | | | | | | | | | | | | | | | |
| Security name | | Interest rate | | | Maturity date | | | Principal | | | Value | |
| | | | | | | | | | | | | | | | |
|
| New York (continued) | |
Rockland County NY Public Improvement Series C (GO Revenue, AGM Insured) | | | 3.00 | % | | | 5-1-2020 | | | $ | 1,390,000 | | | $ | 1,472,413 | |
Rockland County NY Refunding Bond (GO Revenue, Build America Mutual Assurance Company Insured) | | | 3.00 | | | | 2-15-2018 | | | | 2,475,000 | | | | 2,554,175 | |
Rockland County NY Refunding Bond (GO Revenue, Build America Mutual Assurance Company Insured) | | | 3.00 | | | | 2-15-2019 | | | | 1,830,000 | | | | 1,913,411 | |
Rockland County NY Refunding Bond (GO Revenue, Build America Mutual Assurance Company Insured) | | | 3.00 | | | | 2-15-2020 | | | | 630,000 | | | | 666,313 | |
Suffolk County NY Economic Development Corporation Catholic Health Services (Health Revenue) | | | 5.00 | | | | 7-1-2016 | | | | 1,250,000 | | | | 1,250,163 | |
Suffolk County NY Judicial Facilities Agency Leases H. Lee Dennison Building (Miscellaneous Revenue) | | | 5.00 | | | | 11-1-2016 | | | | 2,245,000 | | | | 2,273,624 | |
Suffolk County NY Judicial Facilities Agency Leases H. Lee Dennison Building (Miscellaneous Revenue) | | | 5.00 | | | | 11-1-2017 | | | | 2,365,000 | | | | 2,476,841 | |
Suffolk County NY Judicial Facilities Agency Leases H. Lee Dennison Building (Miscellaneous Revenue) | | | 5.00 | | | | 11-1-2018 | | | | 2,640,000 | | | | 2,852,124 | |
Suffolk County NY Judicial Facilities Agency Leases H. Lee Dennison Building (Miscellaneous Revenue) | | | 5.00 | | | | 11-1-2019 | | | | 2,775,000 | | | | 3,076,421 | |
Suffolk County NY Judicial Facilities Agency Leases H. Lee Dennison Building (Miscellaneous Revenue) | | | 5.00 | | | | 11-1-2020 | | | | 2,915,000 | | | | 3,300,130 | |
Suffolk County NY Public Improvement Series A (GO Revenue) | | | 4.00 | | | | 5-15-2018 | | | | 1,615,000 | | | | 1,708,573 | |
Suffolk County NY Refunding Bond (GO Revenue, AGM Insured) | | | 5.00 | | | | 2-1-2017 | | | | 1,500,000 | | | | 1,538,310 | |
Suffolk County NY Refunding Bond Series A (GO Revenue) | | | 5.00 | | | | 4-1-2018 | | | | 2,700,000 | | | | 2,893,779 | |
Suffolk County NY Refunding Bond Series A (GO Revenue) | | | 5.00 | | | | 4-1-2019 | | | | 1,385,000 | | | | 1,537,433 | |
Suffolk County NY TAN (GO Revenue) | | | 2.00 | | | | 7-27-2016 | | | | 35,000,000 | | | | 35,034,300 | |
Triborough Bridge & Tunnel Authority New York Refunding Bond Sub Series ABCD-3 (Transportation Revenue, AGM Insured) ± | | | 0.64 | | | | 1-1-2017 | | | | 4,100,000 | | | | 4,094,875 | |
Triborough Bridge & Tunnel Authority New York Refunding Bond Sub Series BE (Transportation Revenue) ± | | | 0.96 | | | | 1-1-2032 | | | | 31,200,000 | | | | 31,214,976 | |
Yonkers NY Series A (GO Revenue) | | | 5.00 | | | | 10-1-2016 | | | | 2,000,000 | | | | 2,022,220 | |
| |
| | | | 646,751,089 | |
| | | | | | | | | | | | | | | | |
| | | | |
| North Carolina: 0.57% | | | | | | | | | | | | | | | | |
North Carolina Capital Finance Republic Services Incorporated Project Series 2013 (Resource Recovery Revenue) ± | | | 0.80 | | | | 6-1-2038 | | | | 7,000,000 | | | | 7,000,000 | |
North Carolina Eastern Municipal Power Agency Series C (Utilities Revenue, AGC Insured) | | | 6.00 | | | | 1-1-2019 | | | | 710,000 | | | | 765,153 | |
North Carolina Eastern Municipal Power Agency Series D (Utilities Revenue) | | | 5.00 | | | | 1-1-2017 | | | | 10,000,000 | | | | 10,222,100 | |
North Carolina Grant Anticipation Capital Improvement (Miscellaneous Revenue) ± | | | 4.00 | | | | 3-1-2023 | | | | 13,145,000 | | | | 13,632,548 | |
North Carolina Medical Care Commission Novant Health Obligated Group Series A (Health Revenue) | | | 4.00 | | | | 11-1-2017 | | | | 1,330,000 | | | | 1,386,804 | |
| |
| | | | 33,006,605 | |
| | | | | | | | | | | | | | | | |
| | | | |
| North Dakota: 0.10% | | | | | | | | | | | | | | | | |
Hazen ND Sakakawea Medical Center Project BAN (Health Revenue) | | | 2.50 | | | | 7-1-2017 | | | | 5,000,000 | | | | 5,010,450 | |
Ward County ND HCFR Trinity Obligated Group (Health Revenue) | | | 5.13 | | | | 7-1-2018 | | | | 1,000,000 | | | | 1,003,400 | |
| |
| | | | 6,013,850 | |
| | | | | | | | | | | | | | | | |
The accompanying notes are an integral part of these financial statements.
| | | | |
| 26 | | Wells Fargo Short-Term Municipal Bond Fund | | Portfolio of investments—June 30, 2016 |
| | | | | | | | | | | | | | | | |
| Security name | | Interest rate | | | Maturity date | | | Principal | | | Value | |
| | | | | | | | | | | | | | | | |
| | | | |
| Ohio: 3.42% | | | | | | | | | | | | | | | | |
Cleveland OH Municipal School District (GO Revenue, South Dakota Credit Program Insured) | | | 5.00 | % | | | 12-1-2016 | | | $ | 1,705,000 | | | $ | 1,736,866 | |
Crawford County OH Avita Health System Obligated Group Project (Health Revenue) | | | 1.43 | | | | 11-1-2017 | | | | 10,000,000 | | | | 10,035,400 | |
Cuyahoga OH Metropolitan Housing Authority Headquarters Project (Housing Revenue) | | | 1.75 | | | | 3-1-2020 | | | | 5,900,000 | | | | 5,933,748 | |
Cuyahoga OH Metropolitan Housing Authority Heritage View Homes Project (Housing Revenue) | | | 1.00 | | | | 6-1-2017 | | | | 5,550,000 | | | | 5,552,775 | |
Franklin County OH Hospital Facilities Refunding Bond Ohio Health Corporation Series B (Health Revenue) ± | | | 5.00 | | | | 11-15-2033 | | | | 16,705,000 | | | | 17,433,505 | |
Lancaster OH Port Authority Gas Supply (Utilities Revenue) ± | | | 1.03 | | | | 5-1-2038 | | | | 73,500,000 | | | | 73,570,560 | |
Lorain County OH Port Authority EDA Series A (Health Revenue) | | | 4.00 | | | | 11-15-2018 | | | | 670,000 | | | | 709,899 | |
Lucas Metropolitan Housing Authority OH Certificate of Participation (Housing Revenue) | | | 2.25 | | | | 11-1-2020 | | | | 1,015,000 | | | | 1,030,367 | |
Muskingum County OH Hospital Facilities Genesis Healthcare System Project (Health Revenue) | | | 5.00 | | | | 2-15-2017 | | | | 1,575,000 | | | | 1,609,241 | |
Muskingum County OH Hospital Facilities Genesis Healthcare System Project (Health Revenue) | | | 5.00 | | | | 2-15-2018 | | | | 1,000,000 | | | | 1,053,150 | |
Ohio Air Quality Development Authority PCR Facilities Refunding Bond FirstEnergy Generation Project (Resource Recovery Revenue) ± | | | 3.10 | | | | 3-1-2023 | | | | 10,000,000 | | | | 10,104,700 | |
Ohio Air Quality Development Authority Series A (Miscellaneous Revenue) ± | | | 3.13 | | | | 7-1-2033 | | | | 1,500,000 | | | | 1,515,855 | |
Ohio Air Quality Development Authority Series A (Utilities Revenue) ± | | | 3.75 | | | | 12-1-2023 | | | | 5,000,000 | | | | 5,136,600 | |
Ohio Air Quality Development Authority Series B (Industrial Development Revenue) ± | | | 3.63 | | | | 12-1-2033 | | | | 2,000,000 | | | | 2,046,600 | |
Ohio Portsmouth Bypass Project (Industrial Development Revenue) | | | 5.00 | | | | 12-31-2020 | | | | 1,000,000 | | | | 1,146,590 | |
Ohio Portsmouth Bypass Project (Industrial Development Revenue) | | | 5.00 | | | | 12-31-2021 | | | | 1,205,000 | | | | 1,404,006 | |
Ohio Water Development Authority First Energy Nuclear Generation Project (Water & Sewer Revenue) ± | | | 4.00 | | | | 12-1-2033 | | | | 4,000,000 | | | | 4,139,520 | |
Ohio Water Development Authority First Energy Nuclear Generation Project Series A (Water & Sewer Revenue) | | | 3.00 | | | | 5-15-2019 | | | | 31,000,000 | | | | 31,263,500 | |
Ohio Water Development Authority Series A (Industrial Development Revenue) ± | | | 3.75 | | | | 7-1-2033 | | | | 17,950,000 | | | | 18,461,037 | |
Warren County OH HCFR Otterbein Homes Series A (Health Revenue) | | | 5.00 | | | | 7-1-2018 | | | | 2,000,000 | | | | 2,155,340 | |
Warren County OH HCFR Otterbein Homes Series A (Health Revenue) | | | 5.00 | | | | 7-1-2019 | | | | 2,215,000 | | | | 2,462,504 | |
| |
| | | | 198,501,763 | |
| | | | | | | | | | | | | | | | |
| | | | |
| Oklahoma: 0.57% | | | | | | | | | | | | | | | | |
Blaine County OK Educational Facilities Authority Watonga Public Schools Project (Miscellaneous Revenue) | | | 5.00 | | | | 12-1-2021 | | | | 945,000 | | | | 1,110,687 | |
Cleveland County OK Educational Facilities Authority Norman Public Schools Project (Miscellaneous Revenue) | | | 5.00 | | | | 7-1-2018 | | | | 2,680,000 | | | | 2,896,490 | |
Cleveland County OK Educational Facilities Authority Norman Public Schools Project (Miscellaneous Revenue) | | | 5.00 | | | | 7-1-2019 | | | | 2,000,000 | | | | 2,234,800 | |
Cleveland County OK Justice Authority Detention Facility Project (Tax Revenue) | | | 4.00 | | | | 3-1-2020 | | | | 500,000 | | | | 537,995 | |
Creek County OK Educational Facilities Authority Sapulpa Public School Project (Miscellaneous Revenue) | | | 5.00 | | | | 9-1-2020 | | | | 2,550,000 | | | | 2,937,243 | |
Grady County OK School Finance Authority Tuttle Public School Project (Miscellaneous Revenue) | | | 5.00 | | | | 9-1-2019 | | | | 1,000,000 | | | | 1,122,680 | |
Grady County OK School Finance Authority Tuttle Public School Project (Miscellaneous Revenue) | | | 5.00 | | | | 9-1-2021 | | | | 1,065,000 | | | | 1,253,771 | |
Oklahoma City OK Industrial & Cultural Facilities Series B (Health Revenue, National Insured) ±(m)(n) | | | 0.74 | | | | 6-1-2019 | | | | 10,300,000 | | | | 9,900,875 | |
The accompanying notes are an integral part of these financial statements.
| | | | | | |
| Portfolio of investments—June 30, 2016 | | Wells Fargo Short-Term Municipal Bond Fund | | | 27 | |
| | | | | | | | | | | | | | | | |
| Security name | | Interest rate | | | Maturity date | | | Principal | | | Value | |
| | | | | | | | | | | | | | | | |
| | | | |
| Oklahoma (continued) | | | | | | | | | | | | | | | | |
Tulsa OK Airports Improvement Trust Series A (Airport Revenue) | | | 4.00 | % | | | 6-1-2017 | | | $ | 1,250,000 | | | $ | 1,276,775 | |
Tulsa OK Airports Improvement Trust Series A (Airport Revenue, Build America Mutual Assurance Company Insured) | | | 4.00 | | | | 6-1-2018 | | | | 1,240,000 | | | | 1,301,194 | |
Tulsa OK Airports Improvement Trust Series A (Airport Revenue, Build America Mutual Assurance Company Insured) | | | 5.00 | | | | 6-1-2018 | | | | 530,000 | | | | 566,787 | |
Tulsa OK Airports Improvement Trust Series A (Airport Revenue, Build America Mutual Assurance Company Insured) | | | 5.00 | | | | 6-1-2019 | | | | 3,025,000 | | | | 3,319,151 | |
Tulsa OK Airports Improvement Trust Series A (Airport Revenue, Build America Mutual Assurance Company Insured) | | | 5.00 | | | | 6-1-2020 | | | | 1,000,000 | | | | 1,123,180 | |
Tulsa OK Airports Improvement Trust Series A (Airport Revenue, Build America Mutual Assurance Company Insured) | | | 5.00 | | | | 6-1-2020 | | | | 695,000 | | | | 780,610 | |
Tulsa OK Airports Improvement Trust Series B (Airport Revenue, Build America Mutual Assurance Company Insured) | | | 4.00 | | | | 6-1-2018 | | | | 860,000 | | | | 902,441 | |
Woodward County OK PFFA Series B (Tax Revenue) | | | 3.25 | | | | 9-1-2026 | | | | 2,000,000 | | | | 2,025,200 | |
| |
| | | | 33,289,879 | |
| | | | | | | | | | | | | | | | |
| | | | |
| Other: 0.90% | | | | | | | | | | | | | | | | |
Branch Banking & Trust Municipal Trust Various States Class C (Miscellaneous Revenue, Rabobank LOC) ±144A | | | 1.09 | | | | 11-15-2017 | | | | 13,648,476 | | | | 13,592,926 | |
Branch Banking & Trust Municipal Trust Various States Class D (Miscellaneous Revenue, Rabobank LOC) ± | | | 1.16 | | | | 12-1-2017 | | | | 6,370,000 | | | | 6,370,000 | |
Branch Banking & Trust Municipal Trust Various States Class D (Miscellaneous Revenue, Rabobank LOC) ±144A | | | 1.19 | | | | 11-15-2019 | | | | 6,000,000 | | | | 5,947,560 | |
FHLMC Multifamily Certificates Series M012 Class A1B (Miscellaneous Revenue) | | | 2.70 | | | | 8-15-2051 | | | | 15,000,000 | | | | 15,399,750 | |
Public Housing Capital Fund Trust I (Miscellaneous Revenue, HUD Insured) 144A | | | 4.50 | | | | 7-1-2022 | | | | 7,998,869 | | | | 8,389,293 | |
Public Housing Capital Fund Trust II (Miscellaneous Revenue, HUD Insured) 144A | | | 4.50 | | | | 7-1-2022 | | | | 2,605,338 | | | | 2,714,996 | |
| |
| | | | 52,414,525 | |
| | | | | | | | | | | | | | | | |
| | | | |
| Pennsylvania: 5.29% | | | | | | | | | | | | | | | | |
Allegheny County PA Airport Authority Pittsburgh International Airport (Airport Revenue, FGIC Insured) | | | 5.00 | | | | 1-1-2017 | | | | 2,500,000 | | | | 2,552,450 | |
Allegheny County PA Hospital Development Authority University of Pittsburgh Medical Center Series A-1 (Health Revenue) ± | | | 1.13 | | | | 2-1-2021 | | | | 3,190,000 | | | | 3,177,814 | |
Allegheny County PA Series C-68 (GO Revenue) | | | 5.00 | | | | 11-1-2017 | | | | 1,340,000 | | | | 1,416,420 | |
Beaver County PA IDA FirstEnergy Generation Series B (Industrial Development Revenue) ± | | | 3.50 | | | | 12-1-2035 | | | | 4,300,000 | | | | 4,380,453 | |
Beaver County PA IDA Pollution Control Series A (Utilities Revenue) ± | | | 2.70 | | | | 4-1-2035 | | | | 1,400,000 | | | | 1,406,188 | |
Delaware County PA Authority Neumann University (Miscellaneous Revenue) | | | 4.00 | | | | 10-1-2021 | | | | 3,215,000 | | | | 3,495,477 | |
Delaware County PA IDA Resource Recovery Facility Series A (Resource Recovery Revenue) | | | 6.20 | | | | 7-1-2019 | | | | 2,010,000 | | | | 2,018,040 | |
Delaware Valley PA Regional Finance Authority (Miscellaneous Revenue, Ambac Insured) | | | 5.50 | | | | 8-1-2018 | | | | 1,270,000 | | | | 1,380,274 | |
Delaware Valley PA Regional Finance Authority (Miscellaneous Revenue) | | | 5.75 | | | | 7-1-2017 | | | | 8,900,000 | | | | 9,338,236 | |
Delaware Valley PA Regional Finance Authority Series B (Miscellaneous Revenue, Ambac Insured) | | | 5.60 | | | | 7-1-2017 | | | | 5,015,000 | | | | 5,254,416 | |
Erie PA Higher Education Building Authority Mercyhurst College Project (Education Revenue) | | | 5.00 | | | | 3-15-2018 | | | | 735,000 | | | | 762,886 | |
Hempfield PA School District (GO Revenue) ± | | | 0.67 | | | | 8-1-2017 | | | | 3,770,000 | | | | 3,747,229 | |
Lackawanna County PA Riverside School District Project (GO Revenue, Build America Mutual Assurance Company Insured) | | | 4.00 | | | | 10-15-2019 | | | | 1,400,000 | | | | 1,530,732 | |
The accompanying notes are an integral part of these financial statements.
| | | | |
| 28 | | Wells Fargo Short-Term Municipal Bond Fund | | Portfolio of investments—June 30, 2016 |
| | | | | | | | | | | | | | | | |
| Security name | | Interest rate | | | Maturity date | | | Principal | | | Value | |
| | | | | | | | | | | | | | | | |
|
| Pennsylvania (continued) | |
Lackawanna County PA Riverside School District Project (GO Revenue, Build America Mutual Assurance Company Insured) | | | 4.00 | % | | | 10-15-2020 | | | $ | 1,455,000 | | | $ | 1,616,854 | |
Manheim Township PA School District Series A (GO Revenue) ± | | | 0.71 | | | | 5-1-2025 | | | | 4,700,000 | | | | 4,642,237 | |
Montgomery County PA IDA Albert Einstein Healthcare Network Issue Series A (Health Revenue) | | | 5.00 | | | | 1-15-2017 | | | | 1,250,000 | | | | 1,275,475 | |
Montgomery County PA IDA Albert Einstein Healthcare Network Issue Series A (Health Revenue) | | | 5.00 | | | | 1-15-2018 | | | | 1,000,000 | | | | 1,053,570 | |
Montgomery County PA IDA Albert Einstein Healthcare Network Issue Series A (Health Revenue) | | | 5.00 | | | | 1-15-2020 | | | | 1,315,000 | | | | 1,457,165 | |
Montgomery County PA IDA Exelon Generation Company LLC (Industrial Development Revenue) ± | | | 2.50 | | | | 10-1-2030 | | | | 40,795,000 | | | | 41,617,427 | |
Montgomery County PA IDA Peco Energy Company Project Series A (Industrial Development Revenue) ± | | | 2.50 | | | | 10-1-2030 | | | | 30,000,000 | | | | 30,604,800 | |
Montgomery County PA IDA Peco Energy Company Project Series A (Industrial Development Revenue) ± | | | 2.60 | | | | 3-1-2034 | | | | 1,925,000 | | | | 1,986,562 | |
Nazareth PA Area School District (GO Revenue) ± | | | 0.83 | | | | 2-1-2031 | | | | 15,055,000 | | | | 15,004,566 | |
Northampton County PA General Purpose Hospital Authority St. Luke’s Hospital Project Series C (Health Revenue) ± | | | 4.50 | | | | 8-15-2032 | | | | 1,425,000 | | | | 1,430,999 | |
Penn Hills PA School District (GO Revenue, Build America Mutual Assurance Company Insured) | | | 5.00 | | | | 11-15-2020 | | | | 825,000 | | | | 932,234 | |
Penn Hills PA School District (GO Revenue, Build America Mutual Assurance Company Insured) | | | 5.00 | | | | 11-15-2021 | | | | 1,275,000 | | | | 1,456,063 | |
Pennsylvania EDFA Pennsylvania Rapid Bridge Replacement Project (Industrial Development Revenue) | | | 4.00 | | | | 6-30-2018 | | | | 6,675,000 | | | | 7,035,116 | |
Pennsylvania EDFA Solid Waste Disposal Republic Services Incorporated Project (Resource Recovery Revenue) ± | | | 0.90 | | | | 6-1-2044 | | | | 30,000,000 | | | | 30,000,000 | |
Pennsylvania HEFAR Foundation Indiana University PA Series A (Education Revenue, Syncora Guarantee Incorporated Insured) ± | | | 0.87 | | | | 7-1-2017 | | | | 860,000 | | | | 860,387 | |
Pennsylvania Public School Building Authority (Miscellaneous Revenue) | | | 5.00 | | | | 4-1-2018 | | | | 2,200,000 | | | | 2,326,566 | |
Pennsylvania Public School Building Authority Series 11396 (Miscellaneous Revenue, AGM Insured, Citibank NA LIQ) ø144A | | | 0.59 | | | | 12-1-2023 | | | | 5,000,000 | | | | 5,000,000 | |
Pennsylvania Public School Building Authority The School District of Pennsylvania Project (Miscellaneous Revenue) | | | 5.00 | | | | 4-1-2017 | | | | 2,685,000 | | | | 2,754,810 | |
Pennsylvania Turnpike Commission Series A (Transportation Revenue) ± | | | 1.01 | | | | 12-1-2017 | | | | 14,765,000 | | | | 14,748,611 | |
Pennsylvania Turnpike Commission Series B (Transportation Revenue) ± | | | 1.56 | | | | 12-1-2019 | | | | 18,150,000 | | | | 18,256,904 | |
Pennsylvania Turnpike Commission Series B (Transportation Revenue) ± | | | 1.66 | | | | 12-1-2020 | | | | 11,300,000 | | | | 11,399,892 | |
Philadelphia PA Gas Works 10th Series 1998 General Ordinance (Utilities Revenue, AGM Insured) | | | 5.00 | | | | 7-1-2019 | | | | 2,500,000 | | | | 2,799,025 | |
Philadelphia PA Gas Works 17th Series 1975 General Ordinance (Utilities Revenue, AGM Insured) | | | 5.38 | | | | 7-1-2016 | | | | 5,000,000 | | | | 5,000,700 | |
Philadelphia PA Hospital & HEFAR Temple University Health System Series B (Health Revenue) | | | 5.00 | | | | 7-1-2016 | | | | 1,500,000 | | | | 1,500,150 | |
Philadelphia PA Hospital & HEFAR Temple University Health System Series B (Health Revenue) | | | 5.00 | | | | 7-1-2018 | | | | 8,385,000 | | | | 8,932,708 | |
Philadelphia PA Housing Authority Series A (Housing Revenue, AGM Insured) | | | 5.25 | | | | 12-1-2017 | | | | 2,335,000 | | | | 2,344,503 | |
Philadelphia PA RDA Transformation Initiative (Miscellaneous Revenue) | | | 5.00 | | | | 4-15-2017 | | | | 1,500,000 | | | | 1,547,565 | |
Philadelphia PA RDA Transformation Initiative Series B (Miscellaneous Revenue) | | | 5.00 | | | | 4-15-2019 | | | | 2,000,000 | | | | 2,207,660 | |
Philadelphia PA RDA Transformation Initiative Series B (Miscellaneous Revenue) | | | 5.00 | | | | 4-15-2020 | | | | 1,870,000 | | | | 2,113,455 | |
Philadelphia PA School District Series A (GO Revenue) | | | 4.00 | | | | 9-1-2017 | | | | 500,000 | | | | 514,505 | |
Philadelphia PA School District Series C (GO Revenue) | | | 5.00 | | | | 9-1-2017 | | | | 2,150,000 | | | | 2,237,183 | |
Philadelphia PA School District Series D (GO Revenue) | | | 5.00 | | | | 9-1-2018 | | | | 5,300,000 | | | | 5,706,987 | |
The accompanying notes are an integral part of these financial statements.
| | | | | | |
| Portfolio of investments—June 30, 2016 | | Wells Fargo Short-Term Municipal Bond Fund | | | 29 | |
| | | | | | | | | | | | | | | | |
| Security name | | Interest rate | | | Maturity date | | | Principal | | | Value | |
| | | | | | | | | | | | | | | | |
|
| Pennsylvania (continued) | |
Philadelphia PA School District Series E (GO Revenue) | | | 5.25 | % | | | 9-1-2023 | | | $ | 7,000,000 | | | $ | 7,707,840 | |
Philadelphia PA Series A (GO Revenue) | | | 5.00 | | | | 7-15-2017 | | | | 1,000,000 | | | | 1,043,680 | |
Philadelphia PA Series A (GO Revenue) | | | 5.00 | | | | 7-15-2018 | | | | 1,000,000 | | | | 1,083,360 | |
Philadelphia PA Series A (GO Revenue, AGM Insured) | | | 5.00 | | | | 8-1-2019 | | | | 4,550,000 | | | | 4,749,290 | |
Pittsburgh PA Series A (GO Revenue) | | | 4.00 | | | | 9-1-2016 | | | | 600,000 | | | | 603,516 | |
Reading PA Parking Authority CAB (Transportation Revenue, National Insured) ¤ | | | 0.00 | | | | 11-15-2019 | | | | 1,000,000 | | | | 928,820 | |
Susquehanna PA Regional Airport Authority Sub Series C (Airport Revenue) | | | 3.00 | | | | 1-1-2017 | | | | 1,140,000 | | | | 1,150,317 | |
Warwick PA School District (GO Revenue) | | | 4.00 | | | | 2-15-2020 | | | | 1,000,000 | | | | 1,108,050 | |
West Mifflin PA School District (GO Revenue, AGM Insured) | | | 3.00 | | | | 10-1-2016 | | | | 715,000 | | | | 718,882 | |
West Mifflin PA School District (GO Revenue, AGM Insured) | | | 3.00 | | | | 10-1-2017 | | | | 400,000 | | | | 409,072 | |
West Mifflin PA School District (GO Revenue, AGM Insured) | | | 4.00 | | | | 10-1-2017 | | | | 410,000 | | | | 424,383 | |
West Mifflin PA School District (GO Revenue, AGM Insured) | | | 5.00 | | | | 10-1-2018 | | | | 605,000 | | | | 654,386 | |
West Mifflin PA School District (GO Revenue, AGM Insured) | | | 5.00 | | | | 10-1-2019 | | | | 750,000 | | | | 831,878 | |
York County PA Refunding Bond (GO Revenue) ± | | | 0.61 | | | | 6-1-2033 | | | | 14,690,000 | | | | 14,650,337 | |
| |
| | | | 306,889,105 | |
| | | | | | | | | | | | | | | | |
| | | | |
| Puerto Rico: 1.06% | | | | | | | | | | | | | | | | |
Puerto Rico Commonwealth Public Improvement Refunding Bond Series A (Tax Revenue, National Insured) | | | 5.50 | | | | 7-1-2016 | | | | 3,925,000 | | | | 3,925,393 | |
Puerto Rico Electric Power Authority Refunding Bond Series KK (Utilities Revenue, National Insured) | | | 5.50 | | | | 7-1-2016 | | | | 25,890,000 | | | | 25,892,589 | |
Puerto Rico Electric Power Authority Refunding Bond Series LL (Utilities Revenue, National Insured) | | | 5.50 | | | | 7-1-2017 | | | | 11,825,000 | | | | 12,245,615 | |
Puerto Rico Electric Power Authority Refunding Bond Series SS (Utilities Revenue, National Insured) | | | 4.25 | | | | 7-1-2017 | | | | 550,000 | | | | 550,847 | |
Puerto Rico Highway & Transportation Authority Refunding Bond Series AA (Transportation Revenue, National Insured) | | | 5.50 | | | | 7-1-2017 | | | | 7,500,000 | | | | 7,762,350 | |
Puerto Rico Public Buildings Authority Government Facilities Refunding Bond Series F (Miscellaneous Revenue, CIFG Insured) | | | 5.25 | | | | 7-1-2017 | | | | 10,200,000 | | | | 10,282,926 | |
Puerto Rico Public Finance Corporation Commonwealth Appropriation Bond Series B (Miscellaneous Revenue, Government Development Bank for Puerto Rico SPA) (s) | | | 5.50 | | | | 8-1-2031 | | | | 5,405,000 | | | | 621,575 | |
| |
| | | | 61,281,295 | |
| | | | | | | | | | | | | | | | |
| | | | |
| Rhode Island: 0.35% | | | | | | | | | | | | | | | | |
Rhode Island Health & Educational Building Corporation Providence College (Education Revenue) | | | 5.00 | | | | 11-1-2018 | | | | 265,000 | | | | 289,605 | |
Rhode Island Health & Educational Building Corporation Providence Public Schools Program Series A (Miscellaneous Revenue) | | | 4.00 | | | | 5-15-2017 | | | | 1,500,000 | | | | 1,537,995 | |
Rhode Island Health & Educational Building Corporation Providence Public Schools Program Series A (Miscellaneous Revenue) | | | 5.00 | | | | 5-15-2019 | | | | 1,000,000 | | | | 1,098,040 | |
Rhode Island Health & Educational Building Corporation Refunding Bonds Lifespan Obligated Group Issue Series A (Health Revenue, AGM Insured) | | | 5.00 | | | | 5-15-2018 | | | | 4,300,000 | | | | 4,315,007 | |
Rhode Island Student Loan Authority AMT Series A (Education Revenue) | | | 5.00 | | | | 12-1-2019 | | | | 450,000 | | | | 498,960 | |
Tobacco Settlement Financing Corporation Series A (Tobacco Revenue) | | | 2.25 | | | | 6-1-2041 | | | | 12,525,000 | | | | 12,610,796 | |
| |
| | | | 20,350,403 | |
| | | | | | | | | | | | | | | | |
| | | | |
| South Carolina: 0.05% | | | | | | | | | | | | | | | | |
Connector 2000 Association Incorporated CAB Series A (Transportation Revenue) ¤ | | | 0.00 | | | | 1-1-2017 | | | | 179,606 | | | | 162,542 | |
Connector 2000 Association Incorporated CAB Series A (Transportation Revenue) ¤ | | | 0.00 | | | | 1-1-2018 | | | | 198,490 | | | | 148,866 | |
The accompanying notes are an integral part of these financial statements.
| | | | |
| 30 | | Wells Fargo Short-Term Municipal Bond Fund | | Portfolio of investments—June 30, 2016 |
| | | | | | | | | | | | | | | | |
| Security name | | Interest rate | | | Maturity date | | | Principal | | | Value | |
| | | | | | | | | | | | | | | | |
|
| South Carolina (continued) | |
Scago SC Educational Facilities Corporation Calhoun School District Project (Miscellaneous Revenue, AGC Insured) | | | 5.00 | % | | | 12-1-2021 | | | $ | 2,500,000 | | | $ | 2,546,825 | |
| |
| | | | 2,858,233 | |
| | | | | | | | | | | | | | | | |
| | | | |
| Tennessee: 1.38% | | | | | | | | | | | | | | | | |
Clarksville TN Natural Gas Acquisition Corporation (Utilities Revenue) | | | 5.00 | | | | 12-15-2016 | | | | 3,230,000 | | | | 3,291,079 | |
Clarksville TN Natural Gas Acquisition Corporation (Utilities Revenue) | | | 5.00 | | | | 12-15-2017 | | | | 1,330,000 | | | | 1,399,360 | |
Clarksville TN Water Sewer & Gas Refunding Bond (Water & Sewer Revenue) | | | 4.00 | | | | 2-1-2017 | | | | 835,000 | | | | 851,191 | |
Knox County TN Health Educational & Housing Facilities Board University Health Systems Incorporated (Health Revenue) | | | 5.00 | | | | 4-1-2019 | | | | 1,450,000 | | | | 1,488,643 | |
Memphis-Shelby County TN Airport Authority Series A1 (Airport Revenue) | | | 5.75 | | | | 7-1-2019 | | | | 1,500,000 | | | | 1,701,180 | |
Memphis-Shelby County TN Airport Authority Series B (Airport Revenue) | | | 5.38 | | | | 7-1-2018 | | | | 1,000,000 | | | | 1,084,040 | |
Memphis-Shelby County TN Airport Authority Series B (Airport Revenue) | | | 5.50 | | | | 7-1-2019 | | | | 1,505,000 | | | | 1,695,774 | |
Memphis-Shelby County TN Nucor Steel Memphis Incorporation (Industrial Development Revenue) ø | | | 0.70 | | | | 9-1-2037 | | | | 10,000,000 | | | | 10,000,000 | |
Metro Government Nashville & Davidson County TN Prerefunded (Education Revenue) ± | | | 0.99 | | | | 10-1-2038 | | | | 4,875,000 | | | | 4,874,805 | |
Metro Government Nashville & Davidson County TN Unrefunded (Education Revenue) ± | | | 0.99 | | | | 10-1-2038 | | | | 5,125,000 | | | | 5,118,030 | |
Nashville TN DWR (Water & Sewer Revenue) | | | 0.68 | | | | 7-27-2016 | | | | 10,000,000 | | | | 10,000,000 | |
Tennessee Energy Acquisition Corporation Series A (Utilities Revenue) | | | 5.00 | | | | 9-1-2016 | | | | 7,330,000 | | | | 7,381,457 | |
Tennessee Energy Acquisition Corporation Series A (Utilities Revenue) | | | 5.25 | | | | 9-1-2017 | | | | 5,440,000 | | | | 5,695,462 | |
Tennessee Energy Acquisition Corporation Series A (Utilities Revenue) | | | 5.25 | | | | 9-1-2018 | | | | 3,300,000 | | | | 3,582,348 | |
Tennessee Energy Acquisition Corporation Series A (Utilities Revenue) | | | 5.25 | | | | 9-1-2019 | | | | 6,225,000 | | | | 6,959,177 | |
Tennessee Energy Acquisition Corporation Series C (Utilities Revenue) | | | 5.00 | | | | 2-1-2018 | | | | 8,895,000 | | | | 9,444,711 | |
Tennessee Energy Acquisition Corporation Series C (Utilities Revenue) | | | 5.00 | | | | 2-1-2019 | | | | 5,110,000 | | | | 5,597,443 | |
| |
| | | | 80,164,700 | |
| | | | | | | | | | | | | | | | |
| | | | |
| Texas: 14.17% | | | | | | | | | | | | | | | | |
Central Texas Regional Mobility Authority Senior Lien (Transportation Revenue) | | | 5.75 | | | | 1-1-2017 | | | | 500,000 | | | | 512,880 | |
Central Texas Regional Mobility Authority Senior Lien Series A (Transportation Revenue) | | | 5.00 | | | | 1-1-2017 | | | | 1,500,000 | | | | 1,532,550 | |
Central Texas Regional Mobility Authority Sub Lien (Transportation Revenue) | | | 5.00 | | | | 1-1-2018 | | | | 250,000 | | | | 263,223 | |
Central Texas Regional Mobility Authority Sub Lien (Transportation Revenue) | | | 5.00 | | | | 1-1-2019 | | | | 750,000 | | | | 808,283 | |
Clear Creek TX Independent School District Series B (GO Revenue) ± | | | 1.35 | | | | 2-15-2038 | | | | 12,000,000 | | | | 12,113,520 | |
Clear Creek TX Independent School District Series B (GO Revenue) ± | | | 3.00 | | | | 2-15-2032 | | | | 3,750,000 | | | | 3,983,250 | |
Coastal Bend TX Health Facilities Development Corporation (Health Revenue, AGM Insured) ±(m) | | | 0.55 | | | | 7-1-2031 | | | | 5,100,000 | | | | 5,100,000 | |
Corpus Christi TX Utility System Junior Lien Series B (Water & Sewer Revenue) ± | | | 2.00 | | | | 7-15-2045 | | | | 12,585,000 | | | | 12,661,517 | |
Cypress Fairbanks TX School District (GO Revenue) | | | 4.25 | | | | 2-15-2021 | | | | 2,775,000 | | | | 2,840,962 | |
Cypress Fairbanks TX School District Series B-1 (GO Revenue) ± | | | 3.00 | | | | 2-15-2036 | | | | 10,000,000 | | | | 10,616,200 | |
Denton TX Independent School District Series A (GO Revenue) ± | | | 2.13 | | | | 8-1-2042 | | | | 10,895,000 | | | | 11,140,900 | |
Denton TX Independent School District Series B (GO Revenue) ± | | | 2.00 | | | | 8-1-2044 | | | | 39,075,000 | | | | 40,293,749 | |
Eagle Mountain & Saginaw TX Independent School District (GO Revenue) ± | | | 2.00 | | | | 8-1-2050 | | | | 12,150,000 | | | | 12,536,370 | |
Fort Bend Independent School District School Building Series B (GO Revenue) ± | | | 2.00 | | | | 8-1-2040 | | | | 12,000,000 | | | | 12,158,640 | |
Georgetown TX Independent School District (GO Revenue) ± | | | 2.00 | | | | 8-1-2034 | | | | 4,620,000 | | | | 4,710,783 | |
Goose Creek TX Consolidated Independent School District (GO Revenue) ± | | | 1.35 | | | | 2-15-2040 | | | | 15,160,000 | | | | 15,290,679 | |
Harlandale TX Independent School District (GO Revenue) ± | | | 2.00 | | | | 8-15-2045 | | | | 22,165,000 | | | | 22,654,625 | |
Harris County TX Health Facilities Development Corporation Series A3 (Health Revenue, AGM Insured) ±(m) | | | 0.55 | | | | 7-1-2031 | | | | 16,125,000 | | | | 16,125,000 | |
The accompanying notes are an integral part of these financial statements.
| | | | | | |
| Portfolio of investments—June 30, 2016 | | Wells Fargo Short-Term Municipal Bond Fund | | | 31 | |
| | | | | | | | | | | | | | | | |
| Security name | | Interest rate | | | Maturity date | | | Principal | | | Value | |
| | | | | | | | | | | | | | | | |
|
| Texas (continued) | |
Harris County TX Health Facilities Development Corporation Series A4 (Health Revenue, AGM Insured) ±(m) | | | 0.55 | % | | | 7-1-2031 | | | $ | 13,475,000 | | | $ | 13,475,000 | |
Houston TX (GO Revenue) | | | 5.00 | | | | 3-1-2019 | | | | 7,000,000 | | | | 7,763,770 | |
Houston TX Hotel Occupancy (Tax Revenue, Ambac Insured) ¤ | | | 0.00 | | | | 9-1-2016 | | | | 2,350,000 | | | | 2,347,016 | |
Houston TX Independent School District Limited Tax (GO Revenue) | | | 4.25 | | | | 2-15-2021 | | | | 5,075,000 | | | | 5,190,304 | |
Houston TX Independent School District School House Series A2R (GO Revenue) ± | | | 4.00 | | | | 6-1-2039 | | | | 43,100,000 | | | | 44,377,484 | |
Houston TX Utility System Series C (Water & Sewer Revenue) ± | | | 1.01 | | | | 5-15-2034 | | | | 90,000,000 | | | | 89,973,000 | |
Hutto TX Independent School District Series 2015 (GO Revenue) ± | | | 3.00 | | | | 2-1-2055 | | | | 23,425,000 | | | | 25,208,111 | |
Laredo TX Public Property Finance Contractual Obligation (GO Revenue) | | | 3.88 | | | | 2-15-2018 | | | | 1,420,000 | | | | 1,479,299 | |
Love Field TX Airport Modernization Corporation Southwest Airlines Company Project (Airport Revenue) | | | 5.00 | | | | 11-1-2016 | | | | 5,000,000 | | | | 5,072,500 | |
Mansfield TX Independent School District (GO Revenue) ± | | | 1.75 | | | | 8-1-2042 | | | | 8,455,000 | | | | 8,542,087 | |
North East TX Independent School District (GO Revenue) ± | | | 2.00 | | | | 8-1-2044 | | | | 9,000,000 | | | | 9,280,710 | |
North East TX Independent School District Series A (GO Revenue) ± | | | 2.00 | | | | 8-1-2042 | | | | 29,470,000 | | | | 30,135,138 | |
North Texas Health Facilities Development Corporation United Regional Health Care System (Health Revenue, AGM Insured) | | | 5.00 | | | | 9-1-2017 | | | | 850,000 | | | | 889,109 | |
North Texas Higher Education Authority Incorporated Student Loan Series 2 Class A (Education Revenue) ± | | | 1.63 | | | | 4-1-2037 | | | | 7,655,000 | | | | 7,655,919 | |
North Texas Tollway Authority Refunding Bond Series A (Transportation Revenue) ± | | | 1.19 | | | | 1-1-2050 | | | | 17,250,000 | | | | 17,145,120 | |
North Texas Tollway Authority Series A (Transportation Revenue) | | | 5.00 | | | | 1-1-2020 | | | | 1,050,000 | | | | 1,188,779 | |
North Texas Tollway Authority Series A (Transportation Revenue) | | | 5.00 | | | | 1-1-2021 | | | | 1,860,000 | | | | 2,157,395 | |
Northside TX Independent School District Building Project (GO Revenue) ± | | | 1.65 | | | | 8-1-2045 | | | | 6,250,000 | | | | 6,343,375 | |
Northside TX Independent School District Building Project (GO Revenue) ± | | | 2.00 | | | | 8-1-2044 | | | | 21,195,000 | | | | 21,856,072 | |
Northside TX Independent School District Building Project (GO Revenue) ± | | | 2.00 | | | | 6-1-2046 | | | | 5,000,000 | | | | 5,199,850 | |
Northside TX Independent School District Series A (GO Revenue) ± | | | 2.00 | | | | 6-1-2039 | | | | 2,845,000 | | | | 2,929,553 | |
Pasadena TX Independent School District Building Project Series B (GO Revenue) ± | | | 3.00 | | | | 2-15-2044 | | | | 44,870,000 | | | | 47,606,173 | |
Pflugerville TX Independent School District Prerefunded School Building Series A (GO Revenue) ± | | | 2.00 | | | | 8-15-2039 | | | | 4,830,000 | | | | 5,005,136 | |
Pflugerville TX Independent School District Unrefunded Balance School (GO Revenue) ± | | | 2.00 | | | | 8-15-2039 | | | | 22,870,000 | | | | 23,591,549 | |
Port Arthur TX Navigation District Jefferson County Environmental Facilities Motiva Enterprises LLC Project Series C (Resource Recovery Revenue) ø | | | 0.53 | | | | 4-1-2040 | | | | 30,000,000 | | | | 30,000,000 | |
Port Arthur TX Navigation District Jefferson County Environmental Facilities Motiva Enterprises LLC Project Series D (Resource Recovery Revenue) ± | | | 0.52 | | | | 11-1-2040 | | | | 10,000,000 | | | | 10,000,000 | |
San Antonio TX Energy Acquisition Public Facility Corporation (Utilities Revenue) | | | 5.25 | | | | 8-1-2018 | | | | 510,000 | | | | 551,983 | |
San Antonio TX Junior Lien Series A (Utilities Revenue) ± | | | 2.00 | | | | 12-1-2027 | | | | 20,320,000 | | | | 20,770,088 | |
San Antonio TX Junior Lien Series B (Utilities Revenue) ± | | | 0.77 | | | | 2-1-2033 | | | | 26,700,000 | | | | 26,605,215 | |
San Antonio TX Junior Lien Series B (Utilities Revenue) ± | | | 1.75 | | | | 12-1-2027 | | | | 11,000,000 | | | | 11,174,130 | |
San Antonio TX Junior Lien Series C (Utilities Revenue) ± | | | 3.00 | | | | 12-1-2045 | | | | 12,000,000 | | | | 12,806,040 | |
San Antonio TX Junior Lien Series D (Utilities Revenue) ± | | | 3.00 | | | | 12-1-2045 | | | | 12,000,000 | | | | 12,942,960 | |
Tarrant County TX ECFA Hendrick Medical Center Group (Health Revenue) | | | 5.00 | | | | 9-1-2019 | | | | 655,000 | | | | 729,565 | |
Tarrant County TX ECFA Hendrick Medical Center Group (Health Revenue) | | | 5.00 | | | | 9-1-2020 | | | | 920,000 | | | | 1,053,658 | |
Tarrant County TX ECFA Hendrick Medical Center Group Edgemere Project Series B (Health Revenue) | | | 5.00 | | | | 11-15-2020 | | | | 1,045,000 | | | | 1,171,832 | |
Tennessee Energy Acquisition Corporation Series C (Utilities Revenue) | | | 5.00 | | | | 2-1-2017 | | | | 14,000,000 | | | | 14,335,580 | |
Texas Lower Neches Valley Authority Chevron USA Incorporated Project (Industrial Development Revenue) | | | 0.20 | | | | 2-15-2017 | | | | 10,000,000 | | | | 9,993,200 | |
Texas Municipal Gas Acquisition & Supply Corporation II Series A (Utilities Revenue, JPMorgan Chase & Company Guaranteed) ± | | | 1.13 | | | | 9-15-2017 | | | | 2,735,000 | | | | 2,735,164 | |
Texas Municipal Gas Acquisition & Supply Corporation II Series B (Utilities Revenue, JPMorgan Chase & Company Guaranteed) ± | | | 0.88 | | | | 9-15-2017 | | | | 26,595,000 | | | | 26,498,460 | |
The accompanying notes are an integral part of these financial statements.
| | | | |
| 32 | | Wells Fargo Short-Term Municipal Bond Fund | | Portfolio of investments—June 30, 2016 |
| | | | | | | | | | | | | | | | |
| Security name | | Interest rate | | | Maturity date | | | Principal | | | Value | |
| | | | | | | | | | | | | | | | |
|
| Texas (continued) | |
Texas Municipal Gas Acquisition & Supply Corporation III (Utilities Revenue) | | | 5.00 | % | | | 12-15-2016 | | | $ | 500,000 | | | $ | 509,865 | |
Texas Municipal Gas Acquisition & Supply Corporation III (Utilities Revenue) | | | 5.00 | | | | 12-15-2017 | | | | 6,450,000 | | | | 6,810,491 | |
Texas Municipal Gas Acquisition & Supply Corporation III (Utilities Revenue) | | | 5.00 | | | | 12-15-2018 | | | | 4,500,000 | | | | 4,902,660 | |
Texas Municipal Gas Acquisition & Supply Corporation III (Utilities Revenue) | | | 5.00 | | | | 12-15-2019 | | | | 7,000,000 | | | | 7,815,080 | |
Texas Municipal Gas Acquisition & Supply Corporation Senior Lien Series A (Utilities Revenue) | | | 5.25 | | | | 12-15-2017 | | | | 1,745,000 | | | | 1,842,319 | |
Texas PFA Assessment Unemployment Compensation Series B (Miscellaneous Revenue) | | | 4.00 | | | | 1-1-2018 | | | | 7,495,000 | | | | 7,518,235 | |
Texas PFA Southern University Financing System (Education Revenue, Build America Mutual Assurance Company Insured) | | | 5.00 | | | | 11-1-2017 | | | | 4,000,000 | | | | 4,193,520 | |
Texas PFA Southern University Financing System (Education Revenue, Build America Mutual Assurance Company Insured) | | | 5.00 | | | | 11-1-2018 | | | | 3,395,000 | | | | 3,658,011 | |
Texas PFA Southern University Financing System (Education Revenue, Build America Mutual Assurance Company Insured) | | | 5.00 | | | | 11-1-2019 | | | | 2,375,000 | | | | 2,623,995 | |
Texas Transportation Commission State Highway Fund 1st Tier Series B (Transportation Revenue, Banco Bilboa Vizcaya SPA) ø | | | 0.65 | | | | 4-1-2026 | | | | 17,500,000 | | | | 17,500,000 | |
Tomball TX Independent School District Series B2 (GO Revenue) ± | | | 3.00 | | | | 2-15-2039 | | | | 10,000,000 | | | | 10,439,400 | |
Walnut Creek TX Special Utility District (Water & Sewer Revenue, Build America Mutual Assurance Company Insured) | | | 3.00 | | | | 1-10-2017 | | | | 405,000 | | | | 409,564 | |
Walnut Creek TX Special Utility District (Water & Sewer Revenue, Build America Mutual Assurance Company Insured) | | | 4.00 | | | | 1-10-2018 | | | | 640,000 | | | | 668,621 | |
Walnut Creek TX Special Utility District (Water & Sewer Revenue, Build America Mutual Assurance Company Insured) | | | 4.00 | | | | 1-10-2019 | | | | 1,010,000 | | | | 1,083,548 | |
Walnut Creek TX Special Utility District (Water & Sewer Revenue, Build America Mutual Assurance Company Insured) | | | 4.00 | | | | 1-10-2020 | | | | 500,000 | | | | 547,990 | |
| |
| | | | 821,646,754 | |
| | | | | | | | | | | | | | | | |
| | | | |
| Utah: 0.01% | | | | | | | | | | | | | | | | |
Utah Charter School Finance Authority Summit Academy Series A (Education Revenue) | | | 5.13 | | | | 6-15-2017 | | | | 325,000 | | | | 330,467 | |
| | | | | | | | | | | | | | | | |
| | | | |
| Vermont: 0.32% | | | | | | | | | | | | | | | | |
Vermont Student Assistance Corporation Series BCL-A1 (Education Revenue) ± | | | 2.18 | | | | 6-1-2022 | | | | 18,272,740 | | | | 18,480,319 | |
| | | | | | | | | | | | | | | | |
| | | | |
| Virgin Islands: 0.13% | | | | | | | | | | | | | | | | |
Virgin Islands PFA Sub Lien Series C (Miscellaneous Revenue) | | | 5.00 | | | | 10-1-2016 | | | | 7,500,000 | | | | 7,563,300 | |
| | | | | | | | | | | | | | | | |
| | | | |
| Virginia: 1.24% | | | | | | | | | | | | | | | | |
Charles City VA EDA Solid Waste Disposal Waste Management Incorporated (Resource Recovery Revenue) ± | | | 1.60 | | | | 8-1-2027 | | | | 3,150,000 | | | | 3,170,003 | |
Gloucester County VA EDA Solid Waste Disposal Waste Management Services Series A (Resource Recovery Revenue) ± | | | 1.60 | | | | 9-1-2038 | | | | 1,500,000 | | | | 1,509,015 | |
Greater Richmond VA Convention Center Authority (Tax Revenue) | | | 5.00 | | | | 6-15-2019 | | | | 1,250,000 | | | | 1,399,800 | |
Greater Richmond VA Convention Center Authority (Tax Revenue) | | | 5.00 | | | | 6-15-2020 | | | | 1,000,000 | | | | 1,152,970 | |
Halifax County VA IDA (Utilities Revenue) ± | | | 2.15 | | | | 12-1-2041 | | | | 57,500,000 | | | | 59,704,550 | |
Marquis VA CDA CAB Series A (Tax Revenue) (i) | | | 5.10 | | | | 9-1-2036 | | | | 2,169,000 | | | | 1,725,852 | |
Marquis VA CDA CAB Series C (Tax Revenue) ¤(i) | | | 0.00 | | | | 9-1-2041 | | | | 3,493,000 | | | | 488,042 | |
Marquis VA CDA Convertible CAB (Tax Revenue) ±144A | | | 7.50 | | | | 9-1-2045 | | | | 680,000 | | | | 449,065 | |
Washington VA County IDA Series C (Health Revenue) | | | 7.25 | | | | 7-1-2019 | | | | 1,995,000 | | | | 2,157,752 | |
| |
| | | | 71,757,049 | |
| | | | | | | | | | | | | | | | |
The accompanying notes are an integral part of these financial statements.
| | | | | | |
| Portfolio of investments—June 30, 2016 | | Wells Fargo Short-Term Municipal Bond Fund | | | 33 | |
| | | | | | | | | | | | | | | | |
| Security name | | Interest rate | | | Maturity date | | | Principal | | | Value | |
| | | | | | | | | | | | | | | | |
| | | | |
| Washington: 0.18% | | | | | | | | | | | | | | | | |
Washington HCFR Catholic Health Initiatives Series B (Health Revenue) ± | | | 1.39 | % | | | 1-1-2035 | | | $ | 8,550,000 | | | $ | 8,483,738 | |
Washington Health Care Facilities Authority Series 2015 (Health Revenue) | | | 5.00 | | | | 7-1-2020 | | | | 850,000 | | | | 958,800 | |
Washington Housing Financing Commission Nonprofit Wesley Homes Series A (Health Revenue, AGC Insured) | | | 5.38 | | | | 1-1-2017 | | | | 1,110,000 | | | | 1,134,753 | |
| |
| | | | 10,577,291 | |
| | | | | | | | | | | | | | | | |
| | | | |
| West Virginia: 0.05% | | | | | | | | | | | | | | | | |
West Virginia EDA PCR Appalachian Power Company Series D (Resource Recovery Revenue) | | | 3.25 | | | | 5-1-2019 | | | | 2,745,000 | | | | 2,868,964 | |
| | | | | | | | | | | | | | | | |
| | | | |
| Wisconsin: 1.43% | | | | | | | | | | | | | | | | |
Johnson Creek WI School District BAN (Miscellaneous Revenue) ## | | | 3.00 | | | | 3-1-2020 | | | | 2,550,000 | | | | 2,592,118 | |
Milwaukee WI RDA Public Schools Refunding Bond Series A (Miscellaneous Revenue) | | | 5.00 | | | | 8-1-2018 | | | | 4,320,000 | | | | 4,677,221 | |
Milwaukee WI RDA Wisconsin Housing Preservation Corporation (Housing Revenue, Johnson Bank LOC) ø | | | 1.25 | | | | 12-1-2038 | | | | 1,545,000 | | | | 1,545,000 | |
Racine WI Elderly Housing Authority Wisconsin Housing Preservation Corporation (Housing Revenue, Johnson Bank LOC) ø | | | 1.25 | | | | 10-1-2042 | | | | 2,200,000 | | | | 2,200,000 | |
Waukesha County WI Series B (Miscellaneous Revenue) ## | | | 3.00 | | | | 5-1-2021 | | | | 17,400,000 | | | | 18,049,890 | |
Wisconsin Airport Facilities PFA Senior Obligation Group Series B (Airport Revenue) | | | 5.00 | | | | 7-1-2022 | | | | 14,590,000 | | | | 16,403,683 | |
Wisconsin HEFA Ascension Health Alliance Series B (Health Revenue) ± | | | 4.00 | | | | 11-15-2043 | | | | 13,000,000 | | | | 14,128,790 | |
Wisconsin HEFA Mercy Alliance Incorporated Project Series A (Health Revenue) | | | 5.00 | | | | 6-1-2019 | | | | 2,100,000 | | | | 2,200,296 | |
Wisconsin HEFA Ministry Healthcare Series C (Health Revenue) ## | | | 5.00 | | | | 8-15-2016 | | | | 500,000 | | | | 502,835 | |
Wisconsin HEFA Vernon Memorial Healthcare Incorporated (Health Revenue) | | | 4.00 | | | | 3-1-2017 | | | | 200,000 | | | | 203,694 | |
Wisconsin HEFA Vernon Memorial Healthcare Incorporated (Health Revenue) ## | | | 4.00 | | | | 3-1-2018 | | | | 300,000 | | | | 312,636 | |
Wisconsin HEFA Vernon Memorial Healthcare Incorporated (Health Revenue) | | | 4.00 | | | | 3-1-2019 | | | | 445,000 | | | | 473,516 | |
Wisconsin HEFA Vernon Memorial Healthcare Incorporated (Health Revenue) | | | 5.00 | | | | 3-1-2020 | | | | 375,000 | | | | 420,068 | |
Wisconsin HEFA Wheaton Franciscan Healthcare (Health Revenue) ## | | | 5.25 | | | | 8-15-2017 | | | | 8,230,000 | | | | 8,277,569 | |
Wisconsin HEFAR Series 2012 Tender Option Bond Trust Receipts Series 2015-XF1028 (Health Revenue, Deutsche Bank LIQ) ø144A | | | 0.59 | | | | 11-15-2044 | | | | 10,880,000 | | | | 10,880,000 | |
| |
| | | | 82,867,316 | |
| | | | | | | | | | | | | | | | |
| |
Total Municipal Obligations (Cost $5,601,721,269) | | | | 5,638,166,598 | |
| | | | | | | | | | | | | | | | |
| | | | |
| Other: 1.73% | | | | | | | | | | | | | | | | |
Eaton Vance Municipal Income Trust ±144A§ | | | 1.91 | | | | 9-1-2019 | | | | 23,000,000 | | | | 23,034,960 | |
Nuveen California AMT-Free Municipal Income Fund, Institutional MuniFund Term Preferred Shares ±144A§ | | | 0.88 | | | | 7-1-2018 | | | | 3,000,000 | | | | 2,988,360 | |
Nuveen Dividend Advantage Municipal Fund 3 Institutional MuniFund Term Preferred Shares ±144A | | | 1.16 | | | | 10-1-2017 | | | | 62,000,000 | | | | 62,159,960 | |
Nuveen Texas Quality Income Municipal Fund Institutional MuniFund Term Preferred Shares ±144A | | | 1.01 | | | | 11-1-2018 | | | | 12,000,000 | | | | 12,066,000 | |
| |
Total Other (Cost $100,000,000) | | | | 100,249,280 | |
| | | | | | | | | | | | | | | | |
| | | | |
| | | Yield | | | | | | Shares | | | | |
| Short-Term Investments: 0.72% | | | | | | | | | | | | | | | | |
| | | | |
| Investment Companies: 0.70% | | | | | | | | | | | | | | | | |
Wells Fargo Municipal Cash Management Fund Institutional Class ##(l)(u) | | | 0.30 | | | | | | | | 40,594,369 | | | | 40,594,369 | |
| | | | | | | | | | | | | | | | |
The accompanying notes are an integral part of these financial statements.
| | | | |
| 34 | | Wells Fargo Short-Term Municipal Bond Fund | | Portfolio of investments—June 30, 2016 |
| | | | | | | | | | | | | | | | |
| Security name | | Yield | | | Maturity date | | | Principal | | | Value | |
| | | | | | | | | | | | | | | | |
| | | | |
| U.S. Treasury Securities: 0.02% | | | | | | | | | | | | | | | | |
Treasury Bill (z)# | | | 0.26 | % | | | 9-15-2016 | | | $ | 925,000 | | | $ | 924,577 | |
| | | | | | | | | | | | | | | | |
| |
Total Short-Term Investments (Cost $41,518,850) | | | | 41,518,946 | |
| | | | | | | | | | | | | | | | |
| | | | | | | | |
| Total investments in securities (Cost $5,743,240,119) * | | | 99.65 | % | | | 5,779,934,824 | |
Other assets and liabilities, net | | | 0.35 | | | | 20,536,285 | |
| | | | | | | | |
| Total net assets | | | 100.00 | % | | $ | 5,800,471,109 | |
| | | | | | | | |
| ± | Variable rate investment. The rate shown is the rate in effect at period end. |
| ø | Variable rate demand notes are subject to a demand feature which reduces the effective maturity. The maturity date shown represents the final maturity date of the security. The interest rate is determined and reset by the issuer daily, weekly, or monthly depending upon the terms of the security. The rate shown is the rate in effect at period end. |
| 144A | The security may be resold in transactions exempt from registration, normally to qualified institutional buyers, pursuant to Rule 144A under the Securities Act of 1933. |
| ¤ | The security is issued in zero coupon form with no periodic interest payments. |
| (m) | The security is an auction-rate security which has an interest rate that resets at predetermined short-term intervals through a Dutch auction. The rate shown is the rate in effect at period end. |
| %% | The security is issued on a when-issued basis. |
| (i) | Illiquid security for which the designation as illiquid is unaudited. |
| (n) | The auction to set the interest rate on the security failed at period end due to insufficient investor interest. A failed auction does not itself cause a default. |
| (s) | The security is currently in default with regards to scheduled interest and/or principal payments. The Fund has stopped accruing interest on the security. |
| ## | All or a portion of this security is segregated for when-issued securities. |
| § | The security is subject to a demand feature which reduces the effective maturity. |
| (l) | The issuer of the security is an affiliated person of the Fund as defined in the Investment Company Act of 1940. |
| (u) | The rate represents the 7-day annualized yield at period end. |
| (z) | Zero coupon security. The rate represents the current yield to maturity. |
| # | All or a portion of this security is segregated as collateral for investments in derivative instruments. |
| * | Cost for federal income tax purposes is $5,743,324,677 and unrealized gains (losses) consists of: |
| | | | |
Gross unrealized gains | | $ | 53,540,920 | |
Gross unrealized losses | | | (16,930,773 | ) |
| | | | |
Net unrealized gains | | $ | 36,610,147 | |
The accompanying notes are an integral part of these financial statements.
| | | | | | |
| Statement of assets and liabilities—June 30, 2016 | | Wells Fargo Short-Term Municipal Bond Fund | | | 35 | |
| | | | |
| | | | |
| |
Assets | | | | |
Investments | | | | |
In unaffiliated securities, at value (cost $5,702,645,750) | | $ | 5,739,340,455 | |
In affiliated securities, at value (cost $40,594,369) | | | 40,594,369 | |
| | | | |
Total investments, at value (cost $5,743,240,119) | | | 5,779,934,824 | |
Cash | | | 135,342 | |
Receivable for investments sold | | | 12,250,679 | |
Receivable for Fund shares sold | | | 11,621,678 | |
Receivable for interest | | | 39,893,982 | |
Prepaid expenses and other assets | | | 231,519 | |
| | | | |
Total assets | | | 5,844,068,024 | |
| | | | |
| |
Liabilities | | | | |
Dividends payable | | | 1,156,638 | |
Payable for investments purchased | | | 23,721,667 | |
Payable for Fund shares redeemed | | | 15,887,893 | |
Payable for daily variation margin on open futures contracts | | | 78,125 | |
Management fee payable | | | 1,146,885 | |
Distribution fee payable | | | 51,246 | |
Administration fees payable | | | 604,388 | |
Accrued expenses and other liabilities | | | 950,073 | |
| | | | |
Total liabilities | | | 43,596,915 | |
| | | | |
Total net assets | | $ | 5,800,471,109 | |
| | | | |
| |
NET ASSETS CONSIST OF | | | | |
Paid-in capital | | $ | 5,765,741,499 | |
Undistributed net investment income | | | 163,950 | |
Accumulated net realized gains on investments | | | 115,043 | |
Net unrealized gains on investments | | | 34,450,617 | |
| | | | |
Total net assets | | $ | 5,800,471,109 | |
| | | | |
| |
COMPUTATION OF NET ASSET VALUE AND OFFERING PRICE PER SHARE | | | | |
Net assets – Class A | | $ | 3,362,147,190 | |
Shares outstanding – Class A1 | | | 337,447,798 | |
Net asset value per share – Class A | | | $9.96 | |
Maximum offering price per share – Class A2 | | | $10.16 | |
Net assets – Class C | | $ | 82,110,853 | |
Shares outstanding – Class C1 | | | 8,240,596 | |
Net asset value per share – Class C | | | $9.96 | |
Net assets – Administrator Class | | $ | 95,120,814 | |
Shares outstanding – Administrator Class1 | | | 9,540,435 | |
Net asset value per share – Administrator Class | | | $9.97 | |
Net assets – Institutional Class | | $ | 2,261,092,252 | |
Shares outstanding – Institutional Class1 | | | 226,522,042 | |
Net asset value per share – Institutional Class | | | $9.98 | |
| 1 | The Fund has an unlimited number of authorized shares. |
| 2 | Maximum offering price is computed as 100/98 of net asset value. On investments of $50,000 or more, the offering price is reduced. |
The accompanying notes are an integral part of these financial statements.
| | | | |
| 36 | | Wells Fargo Short-Term Municipal Bond Fund | | Statement of operations—year ended June 30, 2016 |
| | | | |
| | | | |
| |
Investment income | | | | |
Interest | | $ | 102,853,158 | |
Income from affiliated securities | | | 27,841 | |
| | | | |
Total investment income | | | 102,880,999 | |
| | | | |
| |
Expenses | | | | |
Management fee | | | 19,352,934 | |
Administration fees | | | | |
Class A | | | 4,907,743 | |
Class C | | | 148,085 | |
Administrator Class | | | 169,623 | |
Institutional Class | | | 1,722,560 | |
Investor Class | | | 952,004 | 1 |
Shareholder servicing fees | | | | |
Class A | | | 7,668,349 | |
Class C | | | 231,382 | |
Administrator Class | | | 384,392 | |
Investor Class | | | 1,250,818 | 1 |
Distribution fee | | | | |
Class C | | | 694,147 | |
Custody and accounting fees | | | 297,419 | |
Professional fees | | | 62,985 | |
Registration fees | | | 186,455 | |
Shareholder report expenses | | | 276,842 | |
Trustees’ fees and expenses | | | 24,021 | |
Other fees and expenses | | | 68,026 | |
| | | | |
Total expenses | | | 38,397,785 | |
Less: Fee waivers and/or expense reimbursements | | | (5,270,784 | ) |
| | | | |
Net expenses | | | 33,127,001 | |
| | | | |
Net investment income | | | 69,753,998 | |
| | | | |
| |
REALIZED AND UNREALIZED GAINS (LOSSES) ON INVESTMENTS | | | | |
| |
Net realized gains (losses) on: | | | | |
Unaffiliated securities | | | (813,090 | ) |
Futures transactions | | | 1,126,432 | |
| | | | |
Net realized gains on investments | | | 313,342 | |
| | | | |
| |
Net change in unrealized gains (losses) on: | | | | |
Unaffiliated securities | | | 27,924,213 | |
Futures transactions | | | (2,244,088 | ) |
| | | | |
Net change in unrealized gains (losses) on investments | | | 25,680,125 | |
| | | | |
Net realized and unrealized gains (losses) on investments | | | 25,993,467 | |
| | | | |
Net increase in net assets resulting from operations | | $ | 95,747,465 | |
| | | | |
| 1 | For the period from July 1, 2015 to October 23, 2015. Effective at the close of business on October 23, 2015, Investor Class shares were converted to Class A shares and are no longer offered by the Fund. |
The accompanying notes are an integral part of these financial statements.
| | | | | | |
| Statement of changes in net assets | | Wells Fargo Short-Term Municipal Bond Fund | | | 37 | |
| | | | | | | | | | | | | | | | |
| | | Year ended
June 30, 2016 | | | Year ended
June 30, 2015 | |
| | | | |
Operations | | | | | | | | | | | | | | | | |
Net investment income | | | | | | $ | 69,753,998 | | | | | | | $ | 59,559,572 | |
Net realized gains on investments | | | | | | | 313,342 | | | | | | | | 4,458,534 | |
Net change in unrealized gains (losses) on investments | | | | | | | 25,680,125 | | | | | | | | (47,490,704 | ) |
| | | | |
Net increase in net assets resulting from operations | | | | | | | 95,747,465 | | | | | | | | 16,527,402 | |
| | | | |
| | | | |
Distributions to shareholders from | | | | | | | | | | | | | | | | |
Net investment income | | | | | | | | | | | | | | | | |
Class A | | | | | | | (34,052,798 | ) | | | | | | | (18,228,640 | ) |
Class C | | | | | | | (323,418 | ) | | | | | | | (168,307 | ) |
Administrator Class | | | | | | | (1,830,622 | ) | | | | | | | (4,821,365 | ) |
Institutional Class | | | | | | | (28,544,540 | ) | | | | | | | (19,067,395 | ) |
Investor Class | | | | | | | (4,994,406 | )1 | | | | | | | (17,268,417 | ) |
Net realized gains | | | | | | | | | | | | | | | | |
Class A | | | | | | | (2,591,530 | ) | | | | | | | (1,768,741 | ) |
Class C | | | | | | | (67,566 | ) | | | | | | | (103,290 | ) |
Administrator Class | | | | | | | (68,933 | ) | | | | | | | (424,465 | ) |
Institutional Class | | | | | | | (1,635,693 | ) | | | | | | | (1,497,994 | ) |
Investor Class | | | | | | | 0 | 1 | | | | | | | (1,714,158 | ) |
| | | | |
Total distributions to shareholders | | | | | | | (74,109,506 | ) | | | | | | | (65,062,772 | ) |
| | | | |
| | | | |
Capital share transactions | | | Shares | | | | | | | | Shares | | | | | |
Proceeds from shares sold | | | | | | | | | | | | | | | | |
Class A | | | 222,039,298 | | | | 2,209,060,220 | | | | 100,470,523 | | | | 1,002,622,059 | |
Class C | | | 619,066 | | | | 6,157,726 | | | | 652,931 | | | | 6,524,656 | |
Administrator Class | | | 6,630,944 | | | | 66,017,256 | | | | 24,472,555 | | | | 245,072,969 | |
Institutional Class | | | 144,491,550 | | | | 1,439,440,660 | | | | 146,967,678 | | | | 1,470,629,417 | |
Investor Class | | | 7,146,734 | 1 | | | 71,071,037 | 1 | | | 43,428,997 | | | | 434,388,748 | |
| | | | |
| | | | | | | 3,791,746,899 | | | | | | | | 3,159,237,849 | |
| | | | |
Reinvestment of distributions | | | | | | | | | | | | | | | | |
Class A | | | 3,592,827 | | | | 35,741,018 | | | | 1,932,583 | | | | 19,296,238 | |
Class C | | | 34,436 | | | | 342,547 | | | | 23,645 | | | | 236,105 | |
Administrator Class | | | 189,138 | | | | 1,882,997 | | | | 494,039 | | | | 4,945,102 | |
Institutional Class | | | 1,702,491 | | | | 16,967,909 | | | | 1,063,590 | | | | 10,639,180 | |
Investor Class | | | 384,006 | 1 | | | 3,819,645 | 1 | | | 1,840,275 | | | | 18,395,287 | |
| | | | |
| | | | | | | 58,754,116 | | | | | | | | 53,511,912 | |
| | | | |
Payment for shares redeemed | | | | | | | | | | | | | | | | |
Class A | | | (112,700,409 | ) | | | (1,121,238,204 | ) | | | (81,006,886 | ) | | | (809,103,344 | ) |
Class C | | | (2,801,679 | ) | | | (27,864,138 | ) | | | (3,629,431 | ) | | | (36,231,608 | ) |
Administrator Class | | | (48,717,360 | ) | | | (485,134,480 | ) | | | (29,948,664 | ) | | | (300,075,428 | ) |
Institutional Class | | | (110,273,026 | ) | | | (1,098,863,134 | ) | | | (95,400,356 | ) | | | (954,344,112 | ) |
Investor Class | | | (169,667,638 | )1 | | | (1,689,668,427 | )1 | | | (108,020,090 | ) | | | (1,078,832,475 | ) |
| | | | |
| | | | | | | (4,422,768,383 | ) | | | | | | | (3,178,586,967 | ) |
| | | | |
Net increase (decrease) in net assets resulting from capital share transactions | | | | | | | (572,267,368 | ) | | | | | | | 34,162,794 | |
| | | | |
Total decrease in net assets | | | | | | | (550,629,409 | ) | | | | | | | (14,372,576 | ) |
| | | | |
| | | | |
Net assets | | | | | | | | | | | | | | | | |
Beginning of period | | | | | | | 6,351,100,518 | | | | | | | | 6,365,473,094 | |
| | | | |
End of period | | | | | | $ | 5,800,471,109 | | | | | | | $ | 6,351,100,518 | |
| | | | |
Undistributed net investment income | | | | | | $ | 163,950 | | | | | | | $ | 64,590 | |
| | | | |
| 1 | For the period from July 1, 2015 to October 23, 2015. Effective at the close of business on October 23, 2015, Investor Class shares were converted to Class A shares and are no longer offered by the Fund. |
The accompanying notes are an integral part of these financial statements.
| | | | |
| 38 | | Wells Fargo Short-Term Municipal Bond Fund | | Financial highlights |
(For a share outstanding throughout each period)
| | | | | | | | | | | | | | | | | | | | |
| | | Year ended June 30 | |
| CLASS A | | 2016 | | | 2015 | | | 2014 | | | 2013 | | | 2012 | |
Net asset value, beginning of period | | | $9.93 | | | | $10.00 | | | | $9.97 | | | | $10.01 | | | | $9.94 | |
Net investment income | | | 0.11 | | | | 0.09 | | | | 0.11 | | | | 0.11 | | | | 0.19 | |
Net realized and unrealized gains (losses) on investments | | | 0.04 | | | | (0.06 | ) | | | 0.05 | | | | 0.00 | 1 | | | 0.08 | |
| | | | | | | | | | | | | | | | | | | | |
Total from investment operations | | | 0.15 | | | | 0.03 | | | | 0.16 | | | | 0.11 | | | | 0.27 | |
Distributions to shareholders from | | | | | | | | | | | | | | | | | | | | |
Net investment income | | | (0.11 | ) | | | (0.09 | ) | | | (0.11 | ) | | | (0.11 | ) | | | (0.19 | ) |
Net realized gains | | | (0.01 | ) | | | (0.01 | ) | | | (0.02 | ) | | | (0.04 | ) | | | (0.01 | ) |
| | | | | | | | | | | | | | | | | | | | |
Total distributions to shareholders | | | (0.12 | ) | | | (0.10 | ) | | | (0.13 | ) | | | (0.15 | ) | | | (0.20 | ) |
Net asset value, end of period | | | $9.96 | | | | $9.93 | | | | $10.00 | | | | $9.97 | | | | $10.01 | |
Total return2 | | | 1.49 | % | | | 0.27 | % | | | 1.55 | % | | | 1.07 | % | | | 2.77 | % |
Ratios to average net assets (annualized) | | | | | | | | | | | | | | | | | | | | |
Gross expenses | | | 0.75 | % | | | 0.75 | % | | | 0.76 | % | | | 0.77 | % | | | 0.78 | % |
Net expenses | | | 0.62 | % | | | 0.60 | % | | | 0.60 | % | | | 0.60 | % | | | 0.60 | % |
Net investment income | | | 1.11 | % | | | 0.89 | % | | | 1.08 | % | | | 1.10 | % | | | 1.91 | % |
Supplemental data | | | | | | | | | | | | | | | | | | | | |
Portfolio turnover rate | | | 16 | %3 | | | 24 | %3 | | | 28 | %3 | | | 39 | %3 | | | 72 | % |
Net assets, end of period (000s omitted) | | | $3,362,147 | | | | $2,228,977 | | | | $2,031,798 | | | | $1,620,994 | | | | $1,467,816 | |
| 1 | Amount is less than $0.005. |
| 2 | Total return calculations do not include any sales charges. |
| 3 | Portfolio turnover rate excludes variable rate demand notes which may account for changes from rates reported in prior periods. |
The accompanying notes are an integral part of these financial statements.
| | | | | | |
| Financial highlights | | Wells Fargo Short-Term Municipal Bond Fund | | | 39 | |
(For a share outstanding throughout each period)
| | | | | | | | | | | | | | | | | | | | |
| | | Year ended June 30 | |
| CLASS C | | 2016 | | | 2015 | | | 2014 | | | 2013 | | | 2012 | |
Net asset value, beginning of period | | | $9.93 | | | | $10.00 | | | | $9.97 | | | | $10.01 | | | | $9.94 | |
Net investment income | | | 0.04 | | | | 0.01 | | | | 0.03 | | | | 0.04 | | | | 0.12 | |
Net realized and unrealized gains (losses) on investments | | | 0.04 | | | | (0.06 | ) | | | 0.05 | | | | 0.00 | 1 | | | 0.08 | |
| | | | | | | | | | | | | | | | | | | | |
Total from investment operations | | | 0.08 | | | | (0.05 | ) | | | 0.08 | | | | 0.04 | | | | 0.20 | |
Distributions to shareholders from | | | | | | | | | | | | | | | | | | | | |
Net investment income | | | (0.04 | ) | | | (0.01 | ) | | | (0.03 | ) | | | (0.04 | ) | | | (0.12 | ) |
Net realized gains | | | (0.01 | ) | | | (0.01 | ) | | | (0.02 | ) | | | (0.04 | ) | | | (0.01 | ) |
| | | | | | | | | | | | | | | | | | | | |
Total distributions to shareholders | | | (0.05 | ) | | | (0.02 | ) | | | (0.05 | ) | | | (0.08 | ) | | | (0.13 | ) |
Net asset value, end of period | | | $9.96 | | | | $9.93 | | | | $10.00 | | | | $9.97 | | | | $10.01 | |
Total return2 | | | 0.73 | % | | | (0.48 | )% | | | 0.79 | % | | | 0.32 | % | | | 2.01 | % |
Ratios to average net assets (annualized) | | | | | | | | | | | | | | | | | | | | |
Gross expenses | | | 1.50 | % | | | 1.50 | % | | | 1.51 | % | | | 1.52 | % | | | 1.53 | % |
Net expenses | | | 1.37 | % | | | 1.35 | % | | | 1.35 | % | | | 1.35 | % | | | 1.35 | % |
Net investment income | | | 0.35 | % | | | 0.14 | % | | | 0.34 | % | | | 0.37 | % | | | 1.18 | % |
Supplemental data | | | | | | | | | | | | | | | | | | | | |
Portfolio turnover rate | | | 16 | %3 | | | 24 | %3 | | | 28 | %3 | | | 39 | %3 | | | 72 | % |
Net assets, end of period (000s omitted) | | | $82,111 | | | | $103,146 | | | | $133,463 | | | | $172,364 | | | | $211,286 | |
| 1 | Amount is less than $0.005. |
| 2 | Total return calculations do not include any sales charges. |
| 3 | Portfolio turnover rate excludes variable rate demand notes which may account for changes from rates reported in prior periods. |
The accompanying notes are an integral part of these financial statements.
| | | | |
| 40 | | Wells Fargo Short-Term Municipal Bond Fund | | Financial highlights |
(For a share outstanding throughout each period)
| | | | | | | | | | | | | | | | | | | | |
| | | Year ended June 30 | |
| ADMINISTRATOR CLASS | | 2016 | | | 2015 | | | 2014 | | | 2013 | | | 2012 | |
Net asset value, beginning of period | | | $9.95 | | | | $10.03 | | | | $9.99 | | | | $10.03 | | | | $9.96 | |
Net investment income | | | 0.11 | 1 | | | 0.09 | | | | 0.11 | | | | 0.11 | | | | 0.19 | |
Net realized and unrealized gains (losses) on investments | | | 0.03 | | | | (0.07 | ) | | | 0.06 | | | | 0.00 | 2 | | | 0.08 | |
| | | | | | | | | | | | | | | | | | | | |
Total from investment operations | | | 0.14 | | | | 0.02 | | | | 0.17 | | | | 0.11 | | | | 0.27 | |
Distributions to shareholders from | | | | | | | | | | | | | | | | | | | | |
Net investment income | | | (0.11 | ) | | | (0.09 | ) | | | (0.11 | ) | | | (0.11 | ) | | | (0.19 | ) |
Net realized gains | | | (0.01 | ) | | | (0.01 | ) | | | (0.02 | ) | | | (0.04 | ) | | | (0.01 | ) |
| | | | | | | | | | | | | | | | | | | | |
Total distributions to shareholders | | | (0.12 | ) | | | (0.10 | ) | | | (0.13 | ) | | | (0.15 | ) | | | (0.20 | ) |
Net asset value, end of period | | | $9.97 | | | | $9.95 | | | | $10.03 | | | | $9.99 | | | | $10.03 | |
Total return | | | 1.42 | % | | | 0.17 | % | | | 1.65 | % | | | 1.07 | % | | | 2.77 | % |
Ratios to average net assets (annualized) | | | | | | | | | | | | | | | | | | | | |
Gross expenses | | | 0.66 | % | | | 0.68 | % | | | 0.70 | % | | | 0.71 | % | | | 0.72 | % |
Net expenses | | | 0.59 | % | | | 0.60 | % | | | 0.60 | % | | | 0.60 | % | | | 0.60 | % |
Net investment income | | | 1.08 | % | | | 0.89 | % | | | 1.08 | % | | | 1.07 | % | | | 1.82 | % |
Supplemental data | | | | | | | | | | | | | | | | | | | | |
Portfolio turnover rate | | | 16 | %3 | | | 24 | %3 | | | 28 | %3 | | | 39 | %3 | | | 72 | % |
Net assets, end of period (000s omitted) | | | $95,121 | | | | $511,894 | | | | $565,737 | | | | $547,806 | | | | $201,225 | |
| 1 | Calculated based upon average shares outstanding |
| 2 | Amount is less than $0.005. |
| 3 | Portfolio turnover rate excludes variable rate demand notes which may account for changes from rates reported in prior periods. |
The accompanying notes are an integral part of these financial statements.
| | | | | | |
| Financial highlights | | Wells Fargo Short-Term Municipal Bond Fund | | | 41 | |
(For a share outstanding throughout each period)
| | | | | | | | | | | | | | | | | | | | |
| | | Year ended June 30 | |
| INSTITUTIONAL CLASS | | 2016 | | | 2015 | | | 2014 | | | 2013 | | | 2012 | |
Net asset value, beginning of period | | | $9.95 | | | | $10.02 | | | | $9.99 | | | | $10.02 | | | | $9.96 | |
Net investment income | | | 0.13 | | | | 0.11 | | | | 0.13 | | | | 0.13 | | | | 0.21 | |
Net realized and unrealized gains (losses) on investments | | | 0.04 | | | | (0.06 | ) | | | 0.05 | | | | 0.01 | | | | 0.07 | |
| | | | | | | | | | | | | | | | | | | | |
Total from investment operations | | | 0.17 | | | | 0.05 | | | | 0.18 | | | | 0.14 | | | | 0.28 | |
Distributions to shareholders from | | | | | | | | | | | | | | | | | | | | |
Net investment income | | | (0.13 | ) | | | (0.11 | ) | | | (0.13 | ) | | | (0.13 | ) | | | (0.21 | ) |
Net realized gains | | | (0.01 | ) | | | (0.01 | ) | | | (0.02 | ) | | | (0.04 | ) | | | (0.01 | ) |
| | | | | | | | | | | | | | | | | | | | |
Total distributions to shareholders | | | (0.14 | ) | | | (0.12 | ) | | | (0.15 | ) | | | (0.17 | ) | | | (0.22 | ) |
Net asset value, end of period | | | $9.98 | | | | $9.95 | | | | $10.02 | | | | $9.99 | | | | $10.02 | |
Total return | | | 1.71 | % | | | 0.47 | % | | | 1.75 | % | | | 1.37 | % | | | 2.88 | % |
Ratios to average net assets (annualized) | | | | | | | | | | | | | | | | | | | | |
Gross expenses | | | 0.42 | % | | | 0.42 | % | | | 0.43 | % | | | 0.45 | % | | | 0.45 | % |
Net expenses | | | 0.40 | % | | | 0.40 | % | | | 0.40 | % | | | 0.40 | % | | | 0.40 | % |
Net investment income | | | 1.33 | % | | | 1.09 | % | | | 1.29 | % | | | 1.30 | % | | | 2.10 | % |
Supplemental data | | | | | | | | | | | | | | | | | | | | |
Portfolio turnover rate | | | 16 | %1 | | | 24 | %1 | | | 28 | %1 | | | 39 | %1 | | | 72 | % |
Net assets, end of period (000s omitted) | | | $2,261,092 | | | | $1,895,713 | | | | $1,382,576 | | | | $1,185,687 | | | | $935,583 | |
| 1 | Portfolio turnover rate excludes variable rate demand notes which may account for changes from rates reported in prior periods. |
The accompanying notes are an integral part of these financial statements.
| | | | |
| 42 | | Wells Fargo Short-Term Municipal Bond Fund | | Notes to financial statements |
1. ORGANIZATION
Wells Fargo Funds Trust (the “Trust”), a Delaware statutory trust organized on March 10, 1999, is an open-end management investment company registered under the Investment Company Act of 1940, as amended (the “1940 Act”). As an investment company, the Trust follows the accounting and reporting guidance in Financial Accounting Standards Board (“FASB”) Accounting Standards Codification Topic 946, Financial Services – Investment Companies. These financial statements report on the Wells Fargo Short-Term Municipal Bond Fund (the “Fund”) which is a diversified series of the Trust.
Effective at the close of business on October 23, 2015, Investor Class shares became Class A shares in a tax-free conversion. Shareholders of Investor Class received Class A shares at a value equal to the value of their Investor Class shares immediately prior to the conversion. Investor Class shares are no longer offered by the Fund.
2. SIGNIFICANT ACCOUNTING POLICIES
The following significant accounting policies, which are consistently followed in the preparation of the financial statements of the Fund, are in conformity with U.S. generally accepted accounting principles which require management to make estimates and assumptions that affect the reported amounts of assets and liabilities, disclosure of contingent assets and liabilities at the date of the financial statements, and the reported amounts of revenues and expenses during the reporting period. Actual results could differ from those estimates.
Securities valuation
All investments are valued each business day as of the close of regular trading on the New York Stock Exchange (generally 4 p.m. Eastern Time), although a Fund may deviate from this calculation time under unusual or unexpected circumstances.
Debt securities are valued at the evaluated bid price provided by an independent pricing service or, if a reliable price is not available, the quoted bid price from an independent broker-dealer.
Futures that are listed on a foreign or domestic exchange or market are valued at the official closing price or, if none, the last sales price.
Investments in registered open-end investment companies are valued at net asset value.
Investments which are not valued using any of the methods discussed above are valued at their fair value, as determined in good faith by the Board of Trustees of the Fund. The Board of Trustees has established a Valuation Committee comprised of the Trustees and has delegated to it the authority to take any actions regarding the valuation of portfolio securities that the Valuation Committee deems necessary or appropriate, including determining the fair value of portfolio securities, unless the determination has been delegated to the Management Valuation Team of Wells Fargo Funds Management, LLC (“Funds Management”). The Board of Trustees retains the authority to make or ratify any valuation decisions or approve any changes to the Valuation Procedures as it deems appropriate. On a quarterly basis, the Board of Trustees receives reports on any valuation actions taken by the Valuation Committee or the Management Valuation Team which may include items for ratification.
Valuations of fair valued securities are compared to the next actual sales price when available, or other appropriate market values, to assess the continued appropriateness of the fair valuation methodologies used. These securities are fair valued on a day-to-day basis, taking into consideration changes to appropriate market information and any significant changes to the inputs considered in the valuation process until there is a readily available price provided on an exchange or by an independent pricing service. Valuations received from an independent pricing service or independent broker-dealer quotes are periodically validated by comparisons to most recent trades and valuations provided by other independent pricing services in addition to the review of prices by the manager and/or subadviser. Unobservable inputs used in determining fair valuations are identified based on the type of security, taking into consideration factors utilized by market participants in valuing the investment, knowledge about the issuer and the current market environment.
When-issued transactions
The Fund may purchase securities on a forward commitment or when-issued basis. The Fund records a when-issued transaction on the trade date and will segregate assets in an amount at least equal in value to the Fund’s commitment to purchase when-issued securities. Securities purchased on a when-issued basis are marked-to-market daily and the Fund begins earning interest on the settlement date. Losses may arise due to changes in the market value of the underlying securities or if the counterparty does not perform under the contract.
| | | | | | |
| Notes to financial statements | | Wells Fargo Short-Term Municipal Bond Fund | | | 43 | |
Futures contracts
The Fund is subject to interest rate risk in the normal course of pursuing its investment objectives. The Fund may buy and sell futures contracts in order to gain exposure to, or protect against, changes in security values and interest rates. The primary risks associated with the use of futures contracts are the imperfect correlation between changes in market values of securities held by the Fund and the prices of futures contracts, and the possibility of an illiquid market.
The aggregate principal amounts of the contracts are not recorded in the financial statements. Fluctuations in the value of the contracts are recorded in the Statement of Assets and Liabilities as an asset or liability and in the Statement of Operations as unrealized gains or losses until the contracts are closed, at which point they are recorded as net realized gains or losses on futures contracts. With futures contracts, there is minimal counterparty risk to the Fund since futures are exchange traded and the exchange’s clearinghouse, as counterparty to all exchange traded futures, guarantees the futures against default.
Security transactions and income recognition
Securities transactions are recorded on a trade date basis. Realized gains or losses are recorded on the basis of identified cost.
Interest income is accrued daily and bond discounts are accreted and premiums are amortized daily based on the effective interest method. To the extent debt obligations are placed on non-accrual status, any related interest income may be reduced by writing off interest receivables when the collection of all or a portion of interest has become doubtful based on consistently applied procedures. If the issuer subsequently resumes interest payments or when the collectability of interest is reasonably assured, the debt obligation is removed from non-accrual status.
Distributions to shareholders
Distributions to shareholders from net investment income are accrued daily and paid monthly. Distributions from net realized gains, if any, are recorded on the ex-dividend date. Such distributions are determined in conformity with federal income tax regulations, which may differ in amount or character from net investment income and realized gains recognized for purposes of U.S. generally accepted accounting principles.
Federal and other taxes
The Fund intends to continue to qualify as a regulated investment company by distributing substantially all of its investment company taxable and tax-exempt income and any net realized capital gains (after reduction for capital loss carryforwards) sufficient to relieve it from all, or substantially all, federal income taxes. Accordingly, no provision for federal income taxes was required.
The Fund’s income and federal excise tax returns and all financial records supporting those returns for the prior three fiscal years are subject to examination by the federal and Delaware revenue authorities. Management has analyzed the Fund’s tax positions taken on federal, state, and foreign tax returns for all open tax years and does not believe that there are any uncertain tax positions that require recognition of a tax liability.
Reclassifications are made to the Fund’s capital accounts for permanent tax differences to reflect income and gains available for distribution (or available capital loss carryforwards) under federal income tax regulations. U.S. generally accepted accounting principles require that certain components of net assets be adjusted to reflect permanent differences between financial and tax reporting. These reclassifications have no effect on net assets or net asset values per share. At June 30, 2016, as a result of permanent book-to-tax differences, the following reclassification adjustments were made on the Statement of Assets and Liabilities:
| | |
Undistributed net investment income | | Accumulated net realized gains on investments |
| $91,146 | | $(91,146) |
As of June 30, 2016, the Fund had current year deferred post-October capital losses consisting of $2,044,486 in long-term losses which will be recognized on the first day of the following fiscal year.
Class allocations
The separate classes of shares offered by the Fund differ principally in applicable sales charges, distribution, shareholder servicing, and administration fees. Class specific expenses are charged directly to that share class. Investment income, common expenses, and realized and unrealized gains (losses) on investments are allocated daily to each class of shares based on the relative proportion of net assets of each class.
| | | | |
| 44 | | Wells Fargo Short-Term Municipal Bond Fund | | Notes to financial statements |
3. FAIR VALUATION MEASUREMENTS
Fair value measurements of investments are determined within a framework that has established a fair value hierarchy based upon the various data inputs utilized in determining the value of the Fund’s investments. The three-level hierarchy gives the highest priority to unadjusted quoted prices in active markets for identical assets or liabilities (Level 1) and the lowest priority to significant unobservable inputs (Level 3). The Fund’s investments are classified within the fair value hierarchy based on the lowest level of input that is significant to the fair value measurement. The inputs are summarized into three broad levels as follows:
| n | | Level 1 – quoted prices in active markets for identical securities |
| n | | Level 2 – other significant observable inputs (including quoted prices for similar securities, interest rates, prepayment speeds, credit risk, use of amortized cost, etc.) |
| n | | Level 3 – significant unobservable inputs (including the Fund’s own assumptions in determining the fair value of investments) |
The inputs or methodologies used for valuing investments in securities are not necessarily an indication of the risk associated with investing in those securities.
The following is a summary of the inputs used in valuing the Fund’s assets and liabilities as of June 30, 2016:
| | | | | | | | | | | | | | | | |
| | | Quoted prices (Level 1) | | | Other significant observable inputs (Level 2) | | | Significant unobservable inputs (Level 3) | | | Total | |
Assets | | | | | | | | | | | | | | | | |
Investments in: | | | | | | | | | | | | | | | | |
| | | | |
Municipal obligations | | $ | 0 | | | $ | 5,622,766,848 | | | $ | 15,399,750 | | | $ | 5,638,166,598 | |
| | | | |
Other | | | 0 | | | | 100,249,280 | | | | 0 | | | | 100,249,280 | |
| | | | |
Short-term investments | | | | | | | | | | | | | | | | |
Investment companies | | | 40,594,369 | | | | 0 | | | | 0 | | | | 40,594,369 | |
U.S. Treasury securities | | | 924,577 | | | | 0 | | | | 0 | | | | 924,577 | |
Total assets | | $ | 41,518,946 | | | $ | 5,723,016,128 | | | $ | 15,399,750 | | | $ | 5,779,934,824 | |
Liabilities | | | | | | | | | | | | | | | | |
Futures contracts | | $ | 78,125 | | | $ | 0 | | | $ | 0 | | | $ | 78,125 | |
Total liabilities | | $ | 78,125 | | | $ | 0 | | | $ | 0 | | | $ | 78,125 | |
Futures contracts are reported at their variation margin at measurement date, which represents the amount due from the Fund at that date. All other assets and liabilities are reported at their market value at measurement date.
The Fund recognizes transfers between levels within the fair value hierarchy at the end of the reporting period. At June 30, 2016, the Fund did not have any transfers into/out of Level 1. The Fund had no material transfers between Level 2 and Level 3.
4. TRANSACTIONS WITH AFFILIATES
Management fee
Funds Management, an indirect wholly owned subsidiary of Wells Fargo & Company (“Wells Fargo”), is the manager of the Fund and provides advisory and fund-level administrative services under an investment management agreement. Under the investment management agreement, Funds Management is responsible for, among other services, implementing the investment objectives and strategies of the Fund, supervising the subadviser, providing fund-level administrative services in connection with the Fund’s operations, and providing any other fund-level administrative services reasonably necessary for the operation of the Fund. As compensation for its services under the investment management agreement, Funds Management is entitled to receive an annual management fee starting at 0.35% and declining to 0.255% as the average daily net assets of the Fund increase. For the year ended June 30, 2016, the management fee was equivalent to an annual rate of 0.32% of the Fund’s average daily net assets.
| | | | | | |
| Notes to financial statements | | Wells Fargo Short-Term Municipal Bond Fund | | | 45 | |
Funds Management has retained the services of a subadviser to provide daily portfolio management to the Fund. The fee for subadvisory services is borne by Funds Management. Wells Capital Management Incorporated, an affiliate of Funds Management and an indirect wholly owned subsidiary of Wells Fargo, is the subadviser to the Fund and is entitled to receive a fee from Funds Management at an annual rate starting at 0.15% and declining to 0.05% as the average daily net assets of the Fund increase.
Administration fees
Under a class-level administration agreement, Funds Management provides class-level administrative services to the Fund, which includes paying fees and expenses for services provided by the transfer agent, sub-transfer agents, omnibus account servicers and record-keepers. As compensation for its services under the class-level administration agreement, Funds Management receives an annual fee which is calculated based on the average daily net assets of each class as follows:
| | | | |
| | | Class-level administration fee | |
Class A, Class C | | | 0.16 | % |
Administrator Class | | | 0.10 | |
Institutional Class, | | | 0.08 | |
Investor Class | | | 0.19 | |
Funds Management has contractually waived and/or reimbursed management and administration fees to the extent necessary to maintain certain net operating expense ratios for the Fund. Waiver of fees and/or reimbursement of expenses by Funds Management were made first from fund level expenses on a proportionate basis and then from class specific expenses. Funds Management has committed through October 31, 2016 to waive fees and/or reimburse expenses to the extent necessary to cap the Fund’s expenses at 0.63% for Class A shares, 1.38% for Class C shares, 0.60% for Administrator Class shares, and 0.40% for Institutional Class shares. After this time, the cap may be increased or the commitment to maintain the cap may be terminated only with the approval of the Board of Trustees. Prior to November 1, 2015, the Fund’s expenses were capped at 0.60% for Class A shares and 1.35% for Class C shares.
Distribution fee
The Trust has adopted a distribution plan for Class C shares of the Fund pursuant to Rule 12b-1 under the 1940 Act. A distribution fee is charged to Class C shares and paid to Wells Fargo Funds Distributor, LLC, the principal underwriter, at an annual rate of 0.75% of the average daily net assets of Class C shares.
In addition, Funds Distributor is entitled to receive the front-end sales charge from the purchase of Class A shares and a contingent deferred sales charge on the redemption of certain Class A shares. Funds Distributor is also entitled to receive the contingent deferred sales charges from redemptions of Class C shares. For the year ended June 30, 2016, Funds Distributor received $6,740 from the sale of Class A shares and $673 in contingent deferred sales charges from redemptions of Class C shares, respectively.
Shareholder servicing fees
The Trust has entered into contracts with one or more shareholder servicing agents, whereby Class A, Class C, Administrator Class, and Investor Class of the Fund are charged a fee at an annual rate of 0.25% of the average daily net assets of each respective class.
A portion of these total shareholder servicing fees were paid to affiliates of Wells Fargo.
5. INVESTMENT PORTFOLIO TRANSACTIONS
Purchases and sales of investments, excluding U.S. government obligations (if any) and short-term securities, for the year ended June 30, 2016 were $1,460,013,620 and $862,182,669, respectively.
The Fund may purchase or sell investment securities to other Wells Fargo funds under procedures adopted by the Board of Trustees. The procedures have been designed to ensure that these interfund transactions, which generally do not incur broker commissions, are effected at current market prices. Interfund trades are included within the respective purchases and sales amounts shown.
| | | | |
| 46 | | Wells Fargo Short-Term Municipal Bond Fund | | Notes to financial statements |
6. DERIVATIVE TRANSACTIONS
During the year ended June 30, 2016, the Fund entered into futures contracts to take advantage of the differences between municipal and treasury yields and to help manage the duration of the portfolio.
At June 30, 2016, the Fund had short futures contracts outstanding as follows:
| | | | | | | | | | | | | | | | |
| Expiration date | | Counterparty | | Contracts | | Type | | | Contract value at June 30, 2016 | | | Unrealized losses | |
9-30-2016 | | JPMorgan | | 1,000 Short | | | 5-Year U.S. Treasury Notes | | | $ | 122,164,063 | | | $ | (2,244,088 | ) |
The Fund had an average notional amount of $54,386,336 in short futures contracts during the year ended June 30, 2016.
On June 30, 2016, the cumulative unrealized losses on futures contracts in the amount of $2,244,088 are reflected in net unrealized gains on investments on the Statement of Assets and Liabilities. The payable for daily variation margin on open futures contracts reflected in the Statement of Assets and Liabilities only represents the current day’s variation margin. The realized gains and change in unrealized gains (losses) on futures contracts are reflected in the Statement of Operations.
For certain types of derivative transactions, the Fund has entered into International Swaps and Derivatives Association, Inc. master agreements (“ISDA Master Agreements”) or similar agreements with approved counterparties. The ISDA Master Agreements or similar agreements may have requirements to deliver/deposit securities or cash to/with an exchange or broker-dealer as collateral and allows the Fund to offset, with each counterparty, certain derivative financial instrument’s assets and/or liabilities with collateral held or pledged. Collateral requirements differ by type of derivative. Collateral or margin requirements are set by the broker or exchange clearing house for exchange traded derivatives while collateral terms are contract specific for over-the-counter traded derivatives. Cash collateral that has been pledged to cover obligations of the Fund under ISDA Master Agreements or similar agreements, if any, are reported separately in the Statement of Assets and Liabilities. Securities pledged as collateral, if any, are noted in the Portfolio of Investments. With respect to balance sheet offsetting, absent an event of default by the counterparty or a termination of the agreement, the reported amounts of financial assets and financial liabilities in the Statement of Assets and Liabilities are not offset across transactions between the Fund and the applicable counterparty. A reconciliation of the gross amounts on the Statement of Assets and Liabilities to the net amounts by derivative type, including any collateral exposure, is as follows:
| | | | | | | | | | | | | | | | | | | | |
| Derivative type | | Counterparty | | | Gross amounts of liabilities in the Statement of Assets and Liabilities | | | Amounts subject to netting agreements | | | Collateral pledged1 | | | Net amount
of liabilities | |
Futures – variation margin | | | JPMorgan | | | $ | 78,125 | | | $ | 0 | | | $ | (78,125 | ) | | $ | 0 | |
| | 1 | Collateral pledged within this table is limited to the collateral for the net transaction with the counterparty. | |
7. BANK BORROWINGS
The Trust (excluding the money market funds and certain other funds) and Wells Fargo Variable Trust are parties to a $200,000,000 revolving credit agreement whereby the Fund is permitted to use bank borrowings for temporary or emergency purposes, such as to fund shareholder redemption requests. Interest under the credit agreement is charged to the Fund based on a borrowing rate equal to the higher of the Federal Funds rate in effect on that day plus 1.25% or the overnight LIBOR rate in effect on that day plus 1.25%. In addition, an annual commitment fee equal to 0.20% of the unused balance is allocated to each participating fund. Prior to September 1, 2015, the revolving credit agreement amount was $150,000,000 and the annual commitment fee was equal to 0.10% of the unused balance which was allocated to each participating fund.
For the year ended June 30, 2016, there were no borrowings by the Fund under the agreement.
| | | | | | |
| Notes to financial statements | | Wells Fargo Short-Term Municipal Bond Fund | | | 47 | |
8. DISTRIBUTIONS TO SHAREHOLDERS
The tax character of distributions paid during the years ended June 30, 2016 and June 30, 2015 were as follows:
| | | | | | | | |
| | | Year ended June 30 | |
| | | 2016 | | | 2015 | |
Ordinary income | | $ | 2,626,176 | | | $ | 3,350,823 | |
Tax-exempt income | | | 69,745,784 | | | | 59,554,124 | |
Long-term capital gain | | | 1,737,546 | | | | 2,157,825 | |
As of June 30, 2016, the components of distributable earnings on a tax basis were as follows:
| | | | |
Undistributed tax-exempt income | | Unrealized gains | | Post-October capital losses deferred |
| $1,334,990 | | $36,610,147 | | $(2,044,486) |
9. INDEMNIFICATION
Under the Trust’s organizational documents, the officers and Trustees have been granted certain indemnification rights against certain liabilities that may arise out of performance of their duties to the Trust. Additionally, in the normal course of business, the Trust may enter into contracts with service providers that contain a variety of indemnification clauses. The Trust’s maximum exposure under these arrangements is dependent on future claims that may be made against the Fund and, therefore, cannot be estimated.
| | | | |
| 48 | | Wells Fargo Short-Term Municipal Bond Fund | | Report of independent registered public accounting firm |
BOARD OF TRUSTEES AND SHAREHOLDERS OF WELLS FARGO FUNDS TRUST:
We have audited the accompanying statement of assets and liabilities, including the portfolio of investments, of the Wells Fargo Short-Term Municipal Bond Fund (formerly known as Wells Fargo Advantage Short-Term Municipal Bond Fund) (the “Fund”), one of the funds constituting the Wells Fargo Funds Trust, as of June 30, 2016, and the related statement of operations for the year then ended, the statements of changes in net assets for each of the years in the two-year period then ended, and the financial highlights for each of the years in the five-year period then ended. These financial statements and financial highlights are the responsibility of the Fund’s management. Our responsibility is to express an opinion on these financial statements and financial highlights based on our audits.
We conducted our audits in accordance with the standards of the Public Company Accounting Oversight Board (United States). Those standards require that we plan and perform the audit to obtain reasonable assurance about whether the financial statements and financial highlights are free of material misstatement. An audit includes examining, on a test basis, evidence supporting the amounts and disclosures in the financial statements. Our procedures included confirmation of securities owned as of June 30, 2016, by correspondence with custodians and brokers, or by other appropriate auditing procedures. An audit also includes assessing the accounting principles used and significant estimates made by management, as well as evaluating the overall financial statement presentation. We believe that our audits provide a reasonable basis for our opinion.
In our opinion, the financial statements and financial highlights referred to above present fairly, in all material respects, the financial position of the Wells Fargo Short-Term Municipal Bond Fund as of June 30, 2016, and the results of its operations for the year then ended, the changes in its net assets for each of the years in the two-year period then ended, and the financial highlights for each of the years in the five-year period then ended, in conformity with U.S. generally accepted accounting principles.

Boston, Massachusetts
August 25, 2016
| | | | | | |
| Other information (unaudited) | | Wells Fargo Short-Term Municipal Bond Fund | | | 49 | |
TAX INFORMATION
Pursuant to Section 852 of the Internal Revenue Code, $1,737,546 was designated as a 20% rate gain distribution for the fiscal year ended June 30, 2016.
For the fiscal year ended June 30, 2016, $2,626,176 has been designated as short-term capital gain dividends for nonresident alien shareholders pursuant to Section 871 of the Internal Revenue Code.
Pursuant to Section 852 of the Internal Revenue Code, 100% of distributions paid from net investment income is designated as exempt-interest dividends for the fiscal year ended June 30, 2016.
PROXY VOTING INFORMATION
A description of the policies and procedures that the Fund uses to determine how to vote proxies relating to portfolio securities is available, upon request, by calling 1-800-222-8222, visiting our website at wellsfargofunds.com, or visiting the SEC website at sec.gov. Information regarding how the Fund voted proxies relating to portfolio securities during the most recent 12-month period ended June 30 is available on the Fund’s website at wellsfargofunds.com or by visiting the SEC website at sec.gov.
PORTFOLIO HOLDINGS INFORMATION
The complete portfolio holdings for the Fund are publicly available monthly on the Fund’s website (wellsfargofunds.com), on a one-month delayed basis. In addition, top ten holdings information (excluding derivative positions) for the Fund is publicly available on the Fund’s website on a monthly, seven-day or more delayed basis. The Fund files its complete schedule of portfolio holdings with the SEC for the first and third quarters of each fiscal year on Form N-Q, which is available by visiting the SEC website at sec.gov. In addition, the Fund’s Form N-Q may be reviewed and copied at the SEC’s Public Reference Room in Washington, DC, and at regional offices in New York City, at 233 Broadway, and in Chicago, at 175 West Jackson Boulevard, Suite 900. Information about the Public Reference Room may be obtained by calling 1-800-SEC-0330.
| | | | |
| 50 | | Wells Fargo Short-Term Municipal Bond Fund | | Other information (unaudited) |
BOARD OF TRUSTEES AND OFFICERS
Each of the Trustees and Officers1 listed in the table below acts in identical capacities for each fund in the Wells Fargo family of funds, which consists of 142 mutual funds comprising the Wells Fargo Funds Trust, Wells Fargo Variable Trust, Wells Fargo Master Trust and four closed-end funds (collectively the “Fund Complex”). This table should be read in conjunction with the Prospectus and the Statement of Additional Information2. The mailing address of each Trustee and Officer is 525 Market Street, 12th Floor, San Francisco, CA 94105. Each Trustee and Officer serves an indefinite term, however, each Trustee serves such term until reaching the mandatory retirement age established by the Trustees.
Independent Trustees
| | | | | | |
Name and year of birth | | Position held and length of service* | | Principal occupations during past five years or longer | | Current other public company or investment company directorships |
William R. Ebsworth (Born 1957) | | Trustee, since 2015 | | Retired. From 1984 to 2013, equities analyst, portfolio manager, research director and chief financial officer at Fidelity Management and Research Company in Boston, Tokyo, and Hong Kong and retired in 2013 as Chief Investment Officer of Fidelity Strategic Advisers, Inc. where he lead a team of investment professionals managing client assets. Prior thereto, Board member of Hong Kong Securities Clearing Co., Hong Kong Options Clearing Corp., the Thailand International Fund, Ltd., Fidelity Investments Life Insurance Company, and Empire Fidelity Investments Life Insurance Company. Mr. Ebsworth is a CFA® charterholder and an Adjunct Lecturer, Finance, at Babson College. | | Asset Allocation Trust |
Jane A. Freeman (Born 1953) | | Trustee, since 2015 | | Retired. From 2012 to 2014 and 1999 to 2008, Chief Financial Officer of Scientific Learning Corporation. From 2008 to 2012, Ms. Freeman provided consulting services related to strategic business projects. Prior to 1999, Portfolio Manager at Rockefeller & Co. and Scudder, Stevens & Clark. Board member of the Harding Loevner Funds from 1996 to 2014, serving as both Lead Independent Director and chair of the Audit Committee. Board member of the Russell Exchange Traded Funds Trust from 2011 to 2012 and the chair of the Audit Committee. Ms. Freeman is Chair of Taproot Foundation (non-profit organization), a Board Member of Ruth Bancroft Garden (non-profit organization) and an inactive chartered financial analyst. | | Asset Allocation Trust |
Peter G. Gordon (Born 1942) | | Trustee, since 1998; Chairman, since 2005 | | Co-Founder, Retired Chairman, President and CEO of Crystal Geyser Water Company. Trustee Emeritus, Colby College. | | Asset Allocation Trust |
Isaiah Harris, Jr. (Born 1952) | | Trustee, since 2009 | | Retired. Chairman of the Board of CIGNA Corporation since 2009, and Director since 2005. From 2003 to 2011, Director of Deluxe Corporation. Prior thereto, President and CEO of BellSouth Advertising and Publishing Corp. from 2005 to 2007, President and CEO of BellSouth Enterprises from 2004 to 2005 and President of BellSouth Consumer Services from 2000 to 2003. Emeritus member of the Iowa State University Foundation Board of Governors. Emeritus Member of the Advisory Board of Iowa State University School of Business. Advisory Board Member, Palm Harbor Academy (charter school). Advisory Board Member, Child Evangelism Fellowship (non-profit). Mr. Harris is a certified public accountant (inactive status). | | CIGNA Corporation; Asset Allocation Trust |
Judith M. Johnson (Born 1949) | | Trustee, since 2008;
Audit Committee Chairman, since 2008 | | Retired. Prior thereto, Chief Executive Officer and Chief Investment Officer of Minneapolis Employees Retirement Fund from 1996 to 2008. Ms. Johnson is an attorney, certified public accountant and a certified managerial accountant. | | Asset Allocation Trust |
David F. Larcker (Born 1950) | | Trustee, since 2009 | | James Irvin Miller Professor of Accounting at the Graduate School of Business, Stanford University, Director of the Corporate Governance Research Initiative and Senior Faculty of The Rock Center for Corporate Governance since 2006. From 2005 to 2008, Professor of Accounting at the Graduate School of Business, Stanford University. Prior thereto, Ernst & Young Professor of Accounting at The Wharton School, University of Pennsylvania from 1985 to 2005. | | Asset Allocation Trust |
| | | | | | |
| Other information (unaudited) | | Wells Fargo Short-Term Municipal Bond Fund | | | 51 | |
| | | | | | |
Name and year of birth | | Position held and length of service* | | Principal occupations during past five years or longer | | Current other public company or investment company directorships |
| Olivia S. Mitchell (Born 1953) | | Trustee, since 2006 | | International Foundation of Employee Benefit Plans Professor, Wharton School of the University of Pennsylvania since 1993. Director of Wharton’s Pension Research Council and Boettner Center on Pensions & Retirement Research, and Research Associate at the National Bureau of Economic Research. Previously, Cornell University Professor from 1978 to 1993. | | Asset Allocation Trust |
| Timothy J. Penny (Born 1951) | | Trustee, since 1996 | | President and Chief Executive Officer of Southern Minnesota Initiative Foundation, a non-profit organization, since 2007 and Senior Fellow at the Humphrey Institute Policy Forum at the University of Minnesota since 1995. Member of the Board of Trustees of NorthStar Education Finance, Inc., a non-profit organization, since 2007. | | Asset Allocation Trust |
Michael S. Scofield (Born 1943) | | Trustee, since 2010 | | Served on the Investment Company Institute’s Board of Governors and Executive Committee from 2008-2011 as well the Governing Council of the Independent Directors Council from 2006-2011 and the Independent Directors Council Executive Committee from 2008-2011. Chairman of the IDC from 2008-2010. Institutional Investor (Fund Directions) Trustee of Year in 2007. Trustee of the Evergreen Funds complex (and its predecessors) from 1984 to 2010. Chairman of the Evergreen Funds from 2000-2010. Former Trustee of the Mentor Funds. Retired Attorney, Law Offices of Michael S. Scofield. | | Asset Allocation Trust |
| * | Length of service dates reflect the Trustee’s commencement of service with the Trust’s predecessor entities, where applicable. |
Officers
| | | | | | |
Name and year of birth | | Position held and length of service | | Principal occupations during past five years or longer | | |
Karla M. Rabusch (Born 1959) | | President, since 2003 | | Executive Vice President of Wells Fargo Bank, N.A. and President of Wells Fargo Funds Management, LLC since 2003. | | |
Nancy Wiser1 (Born 1967) | | Treasurer, since 2012 | | Executive Vice President of Wells Fargo Funds Management, LLC since 2011. Chief Operating Officer and Chief Compliance Officer at LightBox Capital Management LLC, from 2008 to 2011. | | |
| C. David Messman (Born 1960) | | Secretary, since 2000; Chief Legal Officer, since 2003 | | Senior Vice President and Secretary of Wells Fargo Funds Management, LLC since 2001. Assistant General Counsel of Wells Fargo Bank, N.A. since 2013 and Vice President and Managing Counsel of Wells Fargo Bank, N.A. from 1996 to 2013. | | |
Michael Whitaker (Born 1967) | | Chief Compliance Officer, since 2016* | | Executive Vice President of Wells Fargo Funds Management, LLC since 2016. Chief Compliance Officer of Fidelity’s Fixed Income Funds and Asset Allocation Funds from 2008 to 2016, Compliance Officer of FMR Co., Inc. from 2014 to 2016, Fidelity Investments Money Management, Inc. from 2014 to 2016, Fidelity Investments from 2007 to 2016. | | |
David Berardi (Born 1975) | | Assistant Treasurer, since 2009 | | Vice President of Wells Fargo Funds Management, LLC since 2009. Vice President of Evergreen Investment Management Company, LLC from 2008 to 2010. Manager of Fund Reporting and Control for Evergreen Investment Management Company, LLC from 2004 to 2010. | | |
Jeremy DePalma1 (Born 1974) | | Assistant Treasurer, since 2009 | | Senior Vice President of Wells Fargo Funds Management, LLC since 2009. Senior Vice President of Evergreen Investment Management Company, LLC from 2008 to 2010 and head of the Fund Reporting and Control Team within Fund Administration from 2005 to 2010. | | |
| 1 | Nancy Wiser acts as Treasurer of 73 funds in the Fund Complex. Jeremy DePalma acts as Treasurer of 69 funds and Assistant Treasurer of 73 funds in the Fund Complex. |
| 2 | The Statement of Additional Information includes additional information about the Trustees and is available, without charge, upon request, by calling 1-800-222-8222 or by visiting the website at wellsfargofunds.com. |
| * | Michael Whitaker became Chief Compliance Officer effective May 16, 2016. |
| | | | |
| 52 | | Wells Fargo Short-Term Municipal Bond Fund | | Other information (unaudited) |
BOARD CONSIDERATION OF INVESTMENT MANAGEMENT AND SUB-ADVISORY AGREEMENTS:
Under the Investment Company Act of 1940 (the “1940 Act”), the Board of Trustees (the “Board”) of Wells Fargo Funds Trust (the “Trust”) must determine annually whether to approve the continuation of the Trust’s investment management and sub-advisory agreements. In this regard, at an in-person meeting held on May 24-25, 2016 (the “Meeting”), the Board, all the members of which have no direct or indirect interest in the investment management and sub-advisory agreements and are not “interested persons” of the Trust, as defined in the 1940 Act (the “Independent Trustees”), reviewed and approved for Wells Fargo Short-Term Municipal Bond Fund (the “Fund”): (i) an investment management agreement (the “Management Agreement”) with Wells Fargo Funds Management, LLC (“Funds Management”); and (ii) an investment sub-advisory agreement (the “Sub-Advisory Agreement”) with Wells Capital Management Incorporated (the “Sub-Adviser”), an affiliate of Funds Management. The Management Agreement and the Sub-Advisory Agreement are collectively referred to as the “Advisory Agreements.”
At the Meeting, the Board considered the factors and reached the conclusions described below relating to the selection of Funds Management and the Sub-Adviser and the approval of the Advisory Agreements. Prior to the Meeting, including at an in-person meeting in April 2016, the Trustees conferred extensively among themselves and with representatives of Funds Management about these matters. Also, the Board has adopted a team-based approach, with each team consisting of a sub-set of Trustees, to assist the full Board in the discharge of its duties in reviewing performance and other matters throughout the year. The Independent Trustees were assisted in their evaluation of the Advisory Agreements by independent legal counsel, from whom they received separate legal advice and with whom they met separately.
In providing information to the Board, Funds Management and the Sub-Adviser were guided by a detailed set of requests for information submitted to them by independent legal counsel on behalf of the Independent Trustees at the start of the Board’s annual contract renewal process earlier in 2016. In considering and approving the Advisory Agreements, the Trustees considered the information they believed relevant, including but not limited to the information discussed below. The Board considered not only the specific information presented in connection with the Meeting, but also the knowledge gained over time through interaction with Funds Management and the Sub-Adviser about various topics. In this regard, the Board reviewed reports of Funds Management at each of its quarterly meetings, which included, among other things, portfolio reviews and performance reports. In addition, the Board and the teams mentioned above confer with portfolio managers at various times throughout the year. The Board did not identify any particular information or consideration that was all-important or controlling, and each individual Trustee may have attributed different weights to various factors.
After its deliberations, the Board unanimously approved the continuation of the Advisory Agreements for a one-year term and determined that the compensation payable to Funds Management and the Sub-Adviser under each of the Advisory Agreements was reasonable. The Board considered the approval of the Advisory Agreements for the Fund as part of its consideration of agreements for funds across the complex, but its approvals were made on a fund-by-fund basis. The following summarizes a number of important, but not necessarily all, factors considered by the Board in support of its approvals.
Nature, extent and quality of services
The Board received and considered various information regarding the nature, extent and quality of services provided to the Fund by Funds Management and the Sub-Adviser under the Advisory Agreements. This information included a description of the investment advisory services and Fund-level administrative services covered by the Management Agreement, as well as, among other things, a summary of the background and experience of senior management of Funds Management, and the qualifications, background, tenure and responsibilities of each of the portfolio managers primarily responsible for the day-to-day portfolio management of the Fund.
The Board evaluated the ability of Funds Management and the Sub-Adviser to attract and retain qualified investment professionals, including research, advisory and supervisory personnel. The Board further considered the compliance programs and compliance records of Funds Management and the Sub-Adviser. In addition, the Board took into account the full range of services provided to the Fund by Funds Management and its affiliates.
Fund performance and expenses
The Board considered the performance results for the Fund over various time periods ended December 31, 2015. The Board considered these results in comparison to the performance of funds in a universe that was determined by Broadridge Inc. (“Broadridge”) to be similar to the Fund (the “Universe”), and in comparison to the Fund’s benchmark index and to other comparative data. Broadridge is an independent provider of investment company data. The Board received a description of the methodology used by Broadridge to select the mutual funds in the performance Universe.
| | | | | | |
| Other information (unaudited) | | Wells Fargo Short-Term Municipal Bond Fund | | | 53 | |
The Board noted that the performance of the Fund (Class A) was higher than the average performance of the Universe for all periods under review. The Board also noted that the performance of the Fund was higher than or in range of its benchmark, the Barclays 1-3 Year Composite Municipal Bond Index, for all periods under review except the one-year period.
The Board also received and considered information regarding the Fund’s net operating expense ratios and their various components, including actual management fees, custodian and other non-management fees, and Rule 12b-1 and non-Rule 12b-1 shareholder service fees. The Board considered these ratios in comparison to the median ratios of funds in class-specific expense groups that were determined by Broadridge to be similar to the Fund (the “Groups”). The Board received a description of the methodology used by Broadridge to select the mutual funds in the expense Groups and an explanation of how funds comprising expense groups and their expense ratios may vary from year-to-year. Based on the Broadridge reports, the Board noted that the net operating expense ratios of the Fund were lower than the median net operating expense ratios of the expense Groups.
The Board took into account the Fund performance and expense information provided to it among the factors considered in deciding to re-approve the Advisory Agreements.
Investment management and sub-advisory fee rates
The Board reviewed and considered the contractual fee rates payable by the Fund to Funds Management under the Management Agreement, as well as the contractual fee rates payable by the Fund to Funds Management for class-level administrative services under a Class-Level Administration Agreement, which include class-level transfer agency and sub-transfer agency costs (collectively, the “Management Rates”). The Board also reviewed and considered the contractual investment sub-advisory fee rates that are payable by Funds Management to the Sub-Adviser for investment sub-advisory services.
Among other information reviewed by the Board was a comparison of the Fund’s Management Rates with the average contractual investment management fee rates of funds in the expense Groups at a common asset level as well as transfer agency costs of the funds in the expense Groups. The Board noted that the Management Rates of the Fund were lower than or equal to the sum of these average rates for the Fund’s expense Groups for all share classes.
The Board also received and considered information about the portion of the total management fee that was retained by Funds Management after payment of the fee to the Sub-Adviser for sub-advisory services. In assessing the reasonableness of this amount, the Board received and evaluated information about the nature and extent of responsibilities retained and risks assumed by Funds Management and not delegated to or assumed by the Sub-Adviser, and about Funds Management’s on-going oversight services. However, given the affiliation between Funds Management and the Sub-Adviser, the Board ascribed limited relevance to the allocation of fees between them.
The Board also received and considered information about the nature and extent of services offered and fee rates charged by Funds Management and the Sub-Adviser to other types of clients with investment strategies similar to those of the Fund. In this regard, the Board received information about the significantly greater scope of services, and compliance, reporting and other legal burdens and risks of managing mutual funds compared with those associated with managing assets of non-mutual fund clients such as collective funds or institutional separate accounts.
Based on its consideration of the factors and information it deemed relevant, including those described here, the Board determined that the compensation payable to Funds Management under the Management Agreement and to the Sub-Adviser under the Sub-Advisory Agreement was reasonable, in light of the services covered by the Advisory Agreements.
Profitability
The Board received and considered information concerning the profitability of Funds Management, as well as the profitability of Wells Fargo as a whole, from providing services to the Fund and the fund family as a whole. The Board also received and considered information concerning the profitability of the Sub-Adviser from providing services to the fund family as a whole, noting that the Sub-Adviser’s profitability information with respect to providing services to the Fund was subsumed in the Wells Fargo and Funds Management profitability analysis.
Funds Management reported on the methodologies and estimates used in calculating profitability. Among other things, the Board noted that the levels of profitability reported on a fund-by-fund basis varied widely, depending on factors such as the size and type of fund. Based on its review, the Board did not deem the profits reported by Funds Management or Wells Fargo from its services to the Fund to be at a level that would prevent it from approving the continuation of the Advisory Agreements.
| | | | |
| 54 | | Wells Fargo Short-Term Municipal Bond Fund | | Other information (unaudited) |
Economies of Scale
With respect to possible economies of scale, the Board noted the existence of breakpoints in the Fund’s management fee structure, which operate generally to reduce the Fund’s expense ratios as the Fund grows in size. It considered that, for a small fund or a fund that shrinks in size, breakpoints conversely can result in higher fee levels. The Board also considered that fee waiver and expense reimbursement arrangements and competitive fee rates at the outset are means of sharing potential economies of scale with shareholders of the Fund and the fund family as a whole. The Board considered Funds Management’s view that any analyses of potential economies of scale in managing a particular fund are inherently limited in light of the joint and common costs and investments that Funds Management incurs across the fund family as a whole.
The Board concluded that the Fund’s fee and expense arrangements, including contractual breakpoints, constituted a reasonable approach to sharing potential economies of scale with the Fund and its shareholders.
Other benefits to Funds Management and the Sub-Adviser
The Board received and considered information regarding potential “fall-out” or ancillary benefits received by Funds Management and its affiliates, including the Sub-Adviser, as a result of their relationships with the Fund. Ancillary benefits could include, among others, benefits directly attributable to other relationships with the Fund and benefits potentially derived from an increase in Funds Management’s and the Sub-Adviser’s business as a result of their relationships with the Fund. The Board noted that various affiliates of Funds Management may receive distribution-related fees, shareholder servicing payments and sub-transfer agency fees in respect of shares sold or held through them and services provided.
The Board also reviewed information about soft dollar credits earned and utilized by the Sub-Adviser, fees earned by Funds Management and the Sub-Adviser from managing a private investment vehicle for the fund family’s securities lending collateral and commissions earned by an affiliated broker from portfolio transactions.
Based on its consideration of the factors and information it deemed relevant, including those described here, the Board did not find that any ancillary benefits received by Funds Management and its affiliates, including the Sub-Adviser, were unreasonable.
Conclusion
At the Meeting, after considering the above-described factors and based on its deliberations and its evaluation of the information described above, the Board unanimously approved the continuation of the Advisory Agreements for a one-year term and determined that the compensation payable to Funds Management and the Sub-Adviser under each of the Advisory Agreements was reasonable.
| | | | | | |
| List of abbreviations | | Wells Fargo Short-Term Municipal Bond Fund | | | 55 | |
The following is a list of common abbreviations for terms and entities that may have appeared in this report.
| ACA | — ACA Financial Guaranty Corporation |
| ADR | — American depositary receipt |
| ADS | — American depositary shares |
| AGC | — Assured Guaranty Corporation |
| AGM | — Assured Guaranty Municipal |
| Ambac | — Ambac Financial Group Incorporated |
| AMT | — Alternative minimum tax |
| BAN | — Bond anticipation notes |
| BHAC | — Berkshire Hathaway Assurance Corporation |
| CAB | — Capital appreciation bond |
| CCAB | — Convertible capital appreciation bond |
| CDA | — Community Development Authority |
| CDO | — Collateralized debt obligation |
| DRIVER | — Derivative inverse tax-exempt receipts |
| DW&P | — Department of Water & Power |
| DWR | — Department of Water Resources |
| ECFA | — Educational & Cultural Facilities Authority |
| EDA | — Economic Development Authority |
| EDFA | — Economic Development Finance Authority |
| ETF | — Exchange-traded fund |
| FDIC | — Federal Deposit Insurance Corporation |
| FFCB | — Federal Farm Credit Banks |
| FGIC | — Financial Guaranty Insurance Corporation |
| FHA | — Federal Housing Administration |
| FHLB | — Federal Home Loan Bank |
| FHLMC | — Federal Home Loan Mortgage Corporation |
| FICO | — The Financing Corporation |
| FNMA | — Federal National Mortgage Association |
| GDR | — Global depositary receipt |
| GNMA | — Government National Mortgage Association |
| HCFR | — Healthcare facilities revenue |
| HEFA | — Health & Educational Facilities Authority |
| HEFAR | — Higher education facilities authority revenue |
| HFA | — Housing Finance Authority |
| HFFA | — Health Facilities Financing Authority |
| HUD | — Department of Housing and Urban Development |
| IDA | — Industrial Development Authority |
| IDAG | — Industrial Development Agency |
| KRW | — Republic of Korea won |
| LIBOR | — London Interbank Offered Rate |
| LIFER | — Long Inverse Floating Exempt Receipts |
| LLC | — Limited liability company |
| LLLP | — Limited liability limited partnership |
| LLP | — Limited liability partnership |
| MBIA | — Municipal Bond Insurance Association |
| MFHR | — Multifamily housing revenue |
| MSTR | — Municipal securities trust receipts |
| MUD | — Municipal Utility District |
| National | — National Public Finance Guarantee Corporation |
| PCFA | — Pollution Control Financing Authority |
| PCL | — Public Company Limited |
| PCR | — Pollution control revenue |
| PFA | — Public Finance Authority |
| PFFA | — Public Facilities Financing Authority |
| PFOTER | — Puttable floating option tax-exempt receipts |
| plc | — Public limited company |
| PUTTER | — Puttable tax-exempt receipts |
| R&D | — Research & development |
| Radian | — Radian Asset Assurance |
| RAN | — Revenue anticipation notes |
| RDA | — Redevelopment Authority |
| RDFA | — Redevelopment Finance Authority |
| REIT | — Real estate investment trust |
| ROC | — Reset option certificates |
| SAVRS | — Select auction variable rate securities |
| SBA | — Small Business Authority |
| SDR | — Swedish depositary receipt |
| SFHR | — Single-family housing revenue |
| SFMR | — Single-family mortgage revenue |
| SPA | — Standby purchase agreement |
| SPDR | — Standard & Poor’s Depositary Receipts |
| SPEAR | — Short Puttable Exempt Adjustable Receipts |
| STRIPS | — Separate trading of registered interest and |
| TAN | — Tax anticipation notes |
| TIPS | — Treasury inflation-protected securities |
| TRAN | — Tax revenue anticipation notes |
| TTFA | — Transportation Trust Fund Authority |
| TVA | — Tennessee Valley Authority |
This page is intentionally left blank.

For more information
More information about Wells Fargo Funds is available free upon request. To obtain literature, please write, email, visit the Fund’s website, or call:
Wells Fargo Funds
P.O. Box 8266
Boston, MA 02266-8266
Email: fundservice@wellsfargo.com
Website: wellsfargofunds.com
Individual investors: 1-800-222-8222
Retail investment professionals: 1-888-877-9275
Institutional investment professionals: 1-866-765-0778
This report and the financial statements contained herein are submitted for the general information of the shareholders of the Fund. If this report is used for promotional purposes, distribution of the report must be accompanied or preceded by a current prospectus. Before investing, please consider the investment objectives, risks, charges, and expenses of the investment. For a current prospectus and, if available, a summary prospectus, containing this information, call 1-800-222-8222 or visit the Fund’s website at wellsfargofunds.com. Read the prospectus carefully before you invest or send money.
Wells Fargo Asset Management (WFAM) is a trade name used by the asset management businesses of Wells Fargo & Company. Wells Fargo Funds Management, LLC, a wholly owned subsidiary of Wells Fargo & Company, provides investment advisory and administrative services for Wells Fargo Funds. Other affiliates of Wells Fargo & Company provide subadvisory and other services for the funds. The funds are distributed by Wells Fargo Funds Distributor, LLC, Member FINRA, an affiliate of Wells Fargo & Company.
NOT FDIC INSURED ¡ NO BANK GUARANTEE ¡ MAY LOSE VALUE
© 2016 Wells Fargo Funds Management, LLC. All rights reserved.
| | |
 | | 244409 08-16 A256/AR256 6-16 |
Annual Report
June 30, 2016

Wells Fargo
Small Cap Core Fund


Reduce clutter. Save trees.
Sign up for electronic delivery of prospectuses and shareholder reports at wellsfargo.com/advantagedelivery
Contents
The views expressed and any forward-looking statements are as of June 30, 2016, unless otherwise noted, and are those of the Fund managers and/or Wells Fargo Funds Management, LLC. Discussions of individual securities, or the markets generally, or any Wells Fargo Fund are not intended as individual recommendations. Future events or results may vary significantly from those expressed in any forward-looking statements. The views expressed are subject to change at any time in response to changing circumstances in the market. Wells Fargo Funds Management, LLC and the Fund disclaim any obligation to publicly update or revise any views expressed or forward-looking statements.
NOT FDIC INSURED ¡ NO BANK GUARANTEE ¡ MAY LOSE VALUE
| | | | |
| 2 | | Wells Fargo Small Cap Core Fund | | Letter to shareholders (unaudited) |

Karla M. Rabusch
President
Wells Fargo Funds
Despite significant market fluctuations over the course of the year, U.S. stocks generally delivered positive results overall for the 12-month reporting period; large- and mid-cap stocks generally outperformed small-cap stocks, which delivered negative results for the period.
Dear Valued Shareholder:
We are pleased to offer you this annual report for the Wells Fargo Small Cap Core Fund for the 12-month period that ended June 30, 2016. Please note that the Fund acquired the assets of the former Golden Small Cap Core Fund in a merger transaction on May 20, 2016 and has also adopted its accounting and performance history. During the 12-month period, which began with the third quarter of 2015, U.S. and international stock markets experienced heightened volatility, with intermittent rebounds interspersed with sell-offs. The U.S. economy displayed resilience throughout the period, although growth was somewhat sluggish amid ongoing pressures that included slowing growth in China, a strengthening U.S. dollar, and uncertainty regarding interest-rate increases by the U.S. Federal Reserve (Fed); international economies faced deeper ongoing challenges. During June 2016, global markets became especially volatile as the U.K.’s vote over whether to leave the European Union (E.U.) approached. Despite significant market fluctuations over the course of the year, U.S. stocks generally delivered positive results overall for the 12-month reporting period; large- and mid-cap stocks generally outperformed small-cap stocks, which delivered negative results for the period. International markets generally declined as well.
In the third quarter of 2015, China’s slowdown took a toll on economies and markets worldwide.
U.S. stocks sagged during the quarter, experiencing the most volatility since 2011. Economic data released during the quarter suggested the U.S. economy remained solid but had lost some steam, burdened by the drag of the U.S. dollar’s strength coupled with global economic turmoil. The fact that the Fed left the federal funds interest rate unchanged at its September 2015 meeting surprised investors and fueled increased uncertainty about the U.S. economy’s stamina to remain healthy while facing the challenges of slowing in China and troubles elsewhere in the world. Outside the U.S., markets were even more volatile and delivered generally weaker quarterly results, also largely due to investors’ increasing anxiety over China’s weakened economy. Because China is the world’s largest importer of many commodities, a number of emerging markets—key commodities exporters—struggled under the dual strains of reduced demand for commodities and, because of weaker demand, lower prices for the commodities they did sell. In the eurozone, however, where only about 3% of exports are sent to China, household spending and business investment appeared relatively unaffected by troubles elsewhere. However, the European Central Bank (ECB) warned that China’s slowing could lead to slower growth and lower inflation rates in the eurozone than previously forecast and indicated additional stimulus could be provided should this occur.
Despite ongoing concerns, U.S. stocks generally rose in the fourth quarter of 2015; international markets lagged.
While the broad U.S. stock market bounced back in the quarter, stock markets outside the U.S. failed to keep pace as economic concerns, including China’s ongoing slowdown, continued to affect many countries. U.S. economic data released during the quarter indicated the economy remained solid, although the strong U.S. dollar and weakness in international economies remained headwinds. In December, the Fed, as expected, raised its target interest rate by 25 basis points (bps; 100 bps equals 1.00%) after keeping it near zero for seven years. The move reflected confidence in the U.S. economy’s ability to stay healthy with less central-bank support. The Fed also clarified that future interest-rate increases would be gradual.
In the first quarter of 2016, market volatility increased globally amid ongoing concerns.
Stock markets worldwide fluctuated widely in the first quarter of 2016. Most declined sharply in the first six weeks of the year on concerns such as weak global growth, falling commodity prices, and uncertainty over the timing and impact of the Fed’s interest-rate increases. As the quarter progressed, fears abated
| | | | | | |
| Letter to shareholders (unaudited) | | Wells Fargo Small Cap Core Fund | | | 3 | |
somewhat and global markets generally rallied back. The U.S. economy ended the quarter on a positive note as much of the quarter’s data reflected resiliency. With ongoing uncertainties about global growth and financial markets, however, the Fed held off from raising the target interest rate during the quarter. Outside the U.S., the eurozone fell into deflation in February; in response, the ECB announced an expansion of its stimulus program. In China, the government in March set a growth rate of 6.5% to 7.0% for 2016, an acknowledgment of weakening growth. In emerging markets, although central-bank stimulus and improved prices for oil and other commodities led to stock-market rallies in the quarter, many of these countries’ economies face credit downgrades due to challenges such as the likelihood of a stronger U.S. dollar, which would make dollar-denominated debt more expensive.
Worries over interest rates and the U.K.’s vote largely drove the markets during the second quarter of 2016.
U.S. stocks began the quarter in positive territory but started to lose steam in early May on worries that a possible June interest-rate increase by the Fed could hurt the market. In mid-May, stocks briefly plunged following comments by Fed officials noting that a June interest-rate increase remained on the table. But once investors had processed this information, stocks again rallied, finishing up for the month. The first three weeks of June brought heightened volatility, spurred largely by a disappointing jobs report and uncertainty over whether the U.K. would remain in the E.U. The U.K.’s Brexit vote on June 23 shocked countries in Europe and much of the rest of the world. Stock markets plummeted as investors worried that the U.K.’s departure from the E.U. would slow global growth and prolong the low-interest-rate environment. Following the initial rout, however, U.S. stocks rallied as investors seemed to decide that any negative effects would be more localized and not create a serious risk for global growth. By quarter-end, the broad U.S. stock market had moved back into positive territory.
Don’t let short-term uncertainty derail long-term investment goals.
Periods of uncertainty can present challenges, but experience has taught us that maintaining long-term investment goals can be an effective way to plan for the future. To help you create a sound strategy based on your personal goals and risk tolerance, Wells Fargo Funds offers more than 100 mutual funds spanning a wide range of asset classes and investment styles. Although diversification cannot guarantee an investment profit or prevent losses, we believe it can be an effective way to manage investment risk and potentially smooth out overall portfolio performance. We encourage investors to know their investments and to understand that appropriate levels of risk-taking may unlock opportunities.
Thank you for choosing to invest in Wells Fargo Funds. We appreciate your confidence in us and remain committed to helping you meet your financial needs.
Sincerely,

Karla M. Rabusch
President
Wells Fargo Funds
Although diversification cannot guarantee an investment profit or prevent losses, we believe it can be an effective way to manage investment risk and potentially smooth out overall portfolio performance.
For further information about your Fund, contact your investment professional, visit our website at wellsfargofunds.com, or call us directly at 1-800-222-8222. We are available 24 hours a day, 7 days a week.
| | | | |
| 4 | | Wells Fargo Small Cap Core Fund | | Performance highlights (unaudited) |
Investment objective
The Fund seeks long-term capital appreciation.
Manager
Wells Fargo Funds Management, LLC
Subadviser
Golden Capital Management, LLC
Portfolio managers
John R. Campbell, CFA®
Justin P. Carr, CFA®
Greg W. Golden, CFA®
Average annual total returns (%) as of June 30, 20161
| | | | | | | | | | | | | | | | | | | | | | | | | | | | | | | | | | |
| | | | | Including sales charge | | | Excluding sales charge | | | Expense ratios2 (%) | |
| | | Inception date | | 1 year | | | 5 year | | | 10 year | | | 1 year | | | 5 year | | | 10 year | | | Gross | | | Net3 | |
| Class A (WOSCX) | | 5-20-2016 | | | (15.09 | ) | | | 7.46 | | | | 3.31 | | | | (9.91 | ) | | | 8.74 | | | | 3.92 | | | | 1.47 | | | | 1.35 | |
| Class C (WCSCX) | | 5-20-2016 | | | (11.51 | ) | | | 7.93 | | | | 3.14 | | | | (10.61 | ) | | | 7.93 | | | | 3.14 | | | | 2.22 | | | | 2.10 | |
| Class R6 (WRSCX) | | 5-20-2016 | | | – | | | | – | | | | – | | | | (9.57 | ) | | | 9.13 | | | | 4.29 | | | | 1.04 | | | | 0.90 | |
| Administrator Class (WNSCX) | | 5-20-2016 | | | – | | | | – | | | | – | | | | (9.83 | ) | | | 8.85 | | | | 4.02 | | | | 1.39 | | | | 1.25 | |
| Institutional Class (WYSCX) | | 9-13-2005 | | | – | | | | – | | | | – | | | | (9.57 | ) | | | 9.13 | | | | 4.29 | | | | 1.14 | | | | 1.00 | |
| Russell 2000® Index4 | | – | | | – | | | | – | | | | – | | | | (6.73 | ) | | | 8.35 | | | | 6.20 | | | | – | | | | – | |
Figures quoted represent past performance, which is no guarantee of future results, and do not reflect taxes that a shareholder may pay on fund distributions or the redemption of fund shares. Investment return and principal value of an investment will fluctuate so that an investor’s shares, when redeemed, may be worth more or less than their original cost. Performance shown without sales charges would be lower if sales charges were reflected. Current performance may be lower or higher than the performance data quoted, which assumes the reinvestment of dividends and capital gains. Current month-end performance is available on the Fund’s website, wellsfargofunds.com.
Index returns do not include transaction costs associated with buying and selling securities, any mutual fund fees or expenses, or any taxes. It is not possible to invest directly in an index.
For Class A shares, the maximum front-end sales charge is 5.75%. For Class C shares, the maximum contingent deferred sales charge is 1.00%. Performance including a contingent deferred sales charge assumes the sales charge for the corresponding time period. Class R6, Administrator Class, and Institutional Class shares are sold without a front-end sales charge or contingent deferred sales charge.
Stock values fluctuate in response to the activities of individual companies and general market and economic conditions. Certain investment strategies tend to increase the total risk of an investment (relative to the broader market). The Fund is exposed to foreign investment risk and smaller-company securities risk. Consult the Fund’s prospectus for additional information on these and other risks.
Please see footnotes on page 5.
| | | | | | |
| Performance highlights (unaudited) | | Wells Fargo Small Cap Core Fund | | | 5 | |
|
| Growth of $10,000 investment as of June 30, 20165 |
|
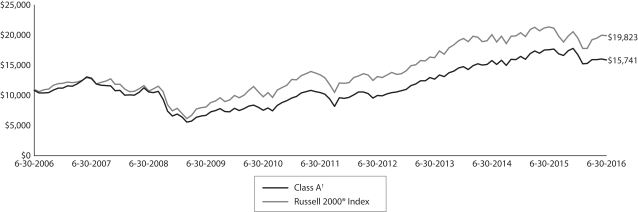
|
| 1 | Historical performance shown for the Class A, Class C and Administrator Class shares prior to their inception reflects the performance of the Institutional Class shares, and are adjusted to reflect Class A, Class C and Administrator shares expenses, respectively. Historical performance shown for the Class R6 shares prior to their inception reflects the performance of the Institutional Class shares, and has not been adjusted to reflect Class R6 shares expenses. If these expenses had been included, returns for Class R6 shares would be higher. Historical performance shown for all classes of the Fund prior to May 20, 2016 is based on the performance of the Fund’s predecessor, Golden Small Cap Core Fund. |
| 2 | Reflects the expense ratios as stated in the most recent prospectuses. The expense ratios shown are subject to change and may differ from the annualized expense ratios shown in the financial highlights of this report. |
| 3 | The manager has contractually committed through July 31, 2019, to waive fees and/or reimburse expenses to the extent necessary to cap the Fund’s Total Annual Fund Operating Expenses After Fee Waiver at the amounts shown. After this time, the cap may be increased or the commitment to maintain the cap may be terminated only with the approval of the Board of Trustees. Brokerage commissions, stamp duty fees, interest, taxes, acquired fund fees and expenses, and extraordinary expenses are excluded from the expense cap. Without this cap, the Fund’s returns would have been lower. |
| 4 | The Russell 2000® Index measures the performance of the 2,000 smallest companies in the Russell 3000® Index, which represents approximately 8% of the total market capitalization of the Russell 3000® Index. You cannot invest directly in an index. |
| 5 | The chart compares the performance of Class A shares for the most recent ten years with the Russell 2000® Index . The chart assumes a hypothetical $10,000 investment in Class A shares and reflects all operating expenses and assumes the maximum initial sales charge of 5.75%. |
| 6 | The ten largest holdings, excluding cash and cash equivalents, are calculated based on the value of the investments divided by total net assets of the Fund. Holdings are subject to change and may have changed since the date specified. |
| 7 | Amounts are calculated based on the total investments of the Fund. These amounts are subject to change and may have changed since the date specified. |
| | | | |
| 6 | | Wells Fargo Small Cap Core Fund | | Performance highlights (unaudited) |
MANAGER’S DISCUSSION
Fund highlights
| n | | The Fund underperformed the Russell 2000® Index for the 12-month period that ended June 30, 2016. |
| n | | From a sector-weighting perspective, the largest detractors included underweights to the utilities and financials sectors and overweights to the health care and energy sectors. |
| n | | As market volatility increased during the period, we remained focused on identifying strong companies with solid fundamentals and attractive valuations that would offer potential for capital appreciation over time. |
Market volatility in the second half of 2015 and the beginning of 2016, coupled with a very-low-interest-rate environment, drove many investors into lower-risk sectors, such as utilities and telecommunication services. Also, continued weakness in oil prices compared with prior-year levels caused many energy-related companies to sell off sharply. The Fund, while broadly diversified, was not positioned for the themes that dominated the market during the reporting period.
Fund positioning drove underperformance for the period.
The Fund’s underweights to the utilities sector and to the real estate investment trust (REIT) industry within the financials sector detracted significantly from performance. Investors seeking yield drove stock prices for both utilities and REITs far above market averages for the 12-month period. Overweights to two of the weakest-performing sectors for the period, energy and health care, also hindered results. Within energy, the Fund primarily was focused on companies in the oil-tanker storage segment, such as Teekay Tankers Limited and Navios Maritime Acquisition Corporation. These companies experienced weakness as tanker lease rates began weakening due to concerns of oversupply in the market. Within health care, pharmaceutical companies Lannett Company, Incorporated, and Sucampo Pharmaceuticals, Incorporated, drove relative underperformance; weakening fundamentals and analyst downgrades led to stock declines for both companies.
The Fund benefited from stock selection within the materials sector. Trinseo S.A., a manufacturer of plastic, latex, and rubber products for the automotive industry, consumer electronics, and portable appliances, rallied strongly in response to strong earnings growth and the announcement of a share buy-back plan.
Current Fund positioning includes overweights to the health care, information technology, and industrials sectors and underweights to the financials, utilities, and consumer discretionary sectors.
| | | | |
| Ten largest holdings (%) as of June 30, 20166 | |
Gigamon Incorporated | | | 2.41 | |
Cirrus Logic Incorporated | | | 2.35 | |
Supernus Pharmaceuticals Incorporated | | | 2.13 | |
AmSurg Corporation | | | 2.09 | |
Argan Incorporated | | | 2.09 | |
Deluxe Corporation | | | 2.08 | |
FBL Financial Group Incorporated | | | 2.08 | |
Inphi Corporation | | | 2.05 | |
Sanmina Corporation | | | 2.04 | |
QTS Realty Trust Incorporated Class A | | | 2.03 | |
Our investment process seeks attractively valued companies likely to exceed earnings expectations.
Our investment process, which we refer to as an active-quant approach, combines quantitative and qualitative evaluations of each company being considered. Our quantitative evaluation looks at valuation, earnings, and momentum related factors to produce an objective, unbiased review of each company in the investment universe and its ranking compared with other companies being considered. A company’s ranking is the primary basis for our buy and sell decisions. We also place a high value on qualitative analysis; our investment professionals evaluate each company in light of overall market conditions and the company’s potential impact on the Fund from a risk/reward perspective. We have developed measurement tools and tailored our investment process in support of two key tenets of our investment philosophy: Companies purchased should be available at a reasonable price, and they should be profitable and capable of increasing revenues and earnings.
Please see footnotes on page 5.
| | | | | | |
| Performance highlights (unaudited) | | Wells Fargo Small Cap Core Fund | | | 7 | |
Despite recent and possible future risks, we believe our process will continue uncovering potentially attractive investment opportunities.
As we enter the third quarter of 2016, investors have appeared most concerned about geopolitical risks and potential contagion in the financials markets. The Brexit vote has set off a new round of global market volatility that likely will remain elevated for a while. Only time will tell if current fears will be realized; historically, many geopolitical shocks have been short term in nature, and economies and markets have adjusted to new realities.
While heightened volatility has been affecting all asset classes, we believe the impact on currencies and central banks’ responses to currency moves are likely to be the most significant factors influencing the U.S. economy and markets over the near term. The British pound already has depreciated significantly in response to the Brexit vote and could weaken further, which would make goods from the U.K. cheaper and thus more attractive to global consumers. In turn, global central banks could be compelled to take steps to make their currencies and goods more competitively priced in global markets. The U.S. dollar’s position as the global reserve currency may lead to defensive flows into dollar-denominated assets, which then may cause the dollar to strengthen. As a result, the U.S. Federal Reserve (Fed) could delay interest-rate increases due to the heightened risks and uncertainty in global markets. If the Fed does delay rate increases and other major central banks continue to pursue monetary-stimulus measures, we believe that monetary authorities would be doing the best they can to create a supportive environment for risk assets like stocks.
As a result of the increased volatility, risk aversion, and low-interest-rate environment, we believe investors may have been overpaying for lower-volatility and higher-yielding stocks in recent months. Although the market has not been rewarding companies displaying the traditional value metrics on which we focus, we believe companies with attractive valuations that potentially would benefit from positive economic growth remain the most attractive investment opportunities. We will stick to our investment philosophy centered on a disciplined, objective, and repeatable stock-selection process and emphasize firms we view as attractively valued and most likely to exceed earnings expectations.
|
| Sector allocation as of June 30, 20167 |
|
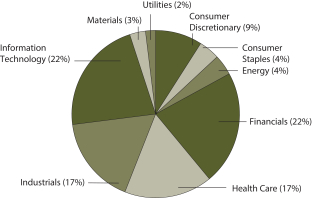 |
Please see footnotes on page 5.
| | | | |
| 8 | | Wells Fargo Small Cap Core Fund | | Fund expenses (unaudited) |
As a shareholder of the Fund, you incur two types of costs: (1) transaction costs, including sales charges (loads) on purchase payments and contingent deferred sales charges (if any) on redemptions and (2) ongoing costs, including management fees, distribution (12b-1) and/or shareholder servicing fees, and other Fund expenses. This example is intended to help you understand your ongoing costs (in dollars) of investing in the Fund and to compare these costs with the ongoing costs of investing in other mutual funds.
The example is based on an investment of $1,000 invested at the beginning of the six-month period and held for the entire period from January 1, 2016 to June 30, 2016.
Actual expenses
The “Actual” line of the table below provides information about actual account values and actual expenses. You may use the information in this line, together with the amount you invested, to estimate the expenses that you paid over the period. Simply divide your account value by $1,000 (for example, an $8,600 account value divided by $1,000 = 8.6), then multiply the result by the number in the “Actual” line under the heading entitled “Expenses paid during period” for your applicable class of shares to estimate the expenses you paid on your account during this period.
Hypothetical example for comparison purposes
The “Hypothetical” line of the table below provides information about hypothetical account values and hypothetical expenses based on the Fund’s actual expense ratio and an assumed rate of return of 5% per year before expenses, which is not the Fund’s actual return. The hypothetical account values and expenses may not be used to estimate the actual ending account balance or expenses you paid for the period. You may use this information to compare the ongoing costs of investing in the Fund and other funds. To do so, compare this 5% hypothetical example with the 5% hypothetical examples that appear in the shareholder reports of the other funds.
Please note that the expenses shown in the table are meant to highlight your ongoing costs only and do not reflect any transactional costs, such as sales charges (loads) and contingent deferred sales charges. Therefore, the “Hypothetical” line of the table is useful in comparing ongoing costs only and will not help you determine the relative total costs of owning different funds. In addition, if these transactional costs were included, your costs would have been higher.
| | | | | | | | | | | | | | | | |
| | | Beginning
account value
1-1-2016 | | | Ending
account value
6-30-2016 | | | Expenses
paid during
the period¹ | | | Net annualized
expense ratio | |
Class A | | | | | | | | | | | | | | | | |
Actual | | $ | 1,000.00 | | | $ | 948.10 | | | $ | 6.54 | | | | 1.35 | % |
Hypothetical (5% return before expenses) | | $ | 1,000.00 | | | $ | 1,018.15 | | | $ | 6.77 | | | | 1.35 | % |
Class C | | | | | | | | | | | | | | | | |
Actual | | $ | 1,000.00 | | | $ | 944.30 | | | $ | 10.15 | | | | 2.10 | % |
Hypothetical (5% return before expenses) | | $ | 1,000.00 | | | $ | 1,014.42 | | | $ | 10.52 | | | | 2.10 | % |
Class R6 | | | | | | | | | | | | | | | | |
Actual | | $ | 1,000.00 | | | $ | 950.00 | | | $ | 4.36 | | | | 0.90 | % |
Hypothetical (5% return before expenses) | | $ | 1,000.00 | | | $ | 1,020.39 | | | $ | 4.52 | | | | 0.90 | % |
Administrator Class | | | | | | | | | | | | | | | | |
Actual | | $ | 1,000.00 | | | $ | 948.50 | | | $ | 6.06 | | | | 1.25 | % |
Hypothetical (5% return before expenses) | | $ | 1,000.00 | | | $ | 1,018.64 | | | $ | 6.28 | | | | 1.25 | % |
Institutional Class | | | | | | | | | | | | | | | | |
Actual | | $ | 1,000.00 | | | $ | 950.00 | | | $ | 5.24 | | | | 1.08 | % |
Hypothetical (5% return before expenses) | | $ | 1,000.00 | | | $ | 1,019.49 | | | $ | 5.43 | | | | 1.08 | % |
| 1 | Expenses paid is equal to the annualized expense ratio of each class multiplied by the average account value over the period, multiplied by the number of days in the most recent fiscal half-year divided by the number of days in the fiscal year (to reflect the one-half-year period). |
| | | | | | |
| Portfolio of investments—June 30, 2016 | | Wells Fargo Small Cap Core Fund | | | 9 | |
| | | | | | | | | | | | | | | | |
| Security name | | | | | | | | Shares | | | Value | |
| | | | |
Common Stocks: 98.95% | | | | | | | | | | | | | | | | |
| | | | |
Consumer Discretionary: 9.00% | | | | | | | | | | | | | | | | |
| | | | |
| Auto Components: 1.13% | | | | | | | | | | | | | | | | |
Tower International Incorporated | | | | | | | | | | | 61,421 | | | $ | 1,264,044 | |
| | | | | | | | | | | | | | | | |
| | | | |
| Hotels, Restaurants & Leisure: 3.37% | | | | | | | | | | | | | | | | |
Denny’s Corporation † | | | | | | | | | | | 164,515 | | | | 1,765,246 | |
Ruth’s Chris Steak House Incorporated | | | | | | | | | | | 126,791 | | | | 2,022,316 | |
| | | | |
| | | | | | | | | | | | | | | 3,787,562 | |
| | | | | | | | | | | | | | | | |
| | | | |
| Internet & Catalog Retail: 1.97% | | | | | | | | | | | | | | | | |
Nutri System Incorporated | | | | | | | | | | | 87,315 | | | | 2,214,308 | |
| | | | | | | | | | | | | | | | |
| | | | |
| Specialty Retail: 1.25% | | | | | | | | | | | | | | | | |
Express Incorporated † | | | | | | | | | | | 96,682 | | | | 1,402,856 | |
| | | | | | | | | | | | | | | | |
| | | | |
| Textiles, Apparel & Luxury Goods: 1.28% | | | | | | | | | | | | | | | | |
Skechers U.S.A. Incorporated † | | | | | | | | | | | 48,512 | | | | 1,441,777 | |
| | | | | | | | | | | | | | | | |
| | | | |
Consumer Staples: 3.56% | | | | | | | | | | | | | | | | |
| | | | |
| Food Products: 3.56% | | | | | | | | | | | | | | | | |
Cal-Maine Foods Incorporated | | | | | | | | | | | 44,423 | | | | 1,968,827 | |
Dean Foods Company | | | | | | | | | | | 112,285 | | | | 2,031,236 | |
| | | | |
| | | | | | | | | | | | | | | 4,000,063 | |
| | | | | | | | | | | | | | | | |
| | | | |
Energy: 3.69% | | | | | | | | | | | | | | | | |
| | | | |
| Energy Equipment & Services: 1.37% | | | | | | | | | | | | | | | | |
Matrix Service Company † | | | | | | | | | | | 93,253 | | | | 1,537,742 | |
| | | | | | | | | | | | | | | | |
| | | | |
| Leisure Products: 1.61% | | | | | | | | | | | | | | | | |
Smith & Wesson Holding Corporation † | | | | | | | | | | | 66,608 | | | | 1,810,405 | |
| | | | | | | | | | | | | | | | |
| | | | |
| Oil, Gas & Consumable Fuels: 0.71% | | | | | | | | | | | | | | | | |
Navios Maritime Acquisition Corporation | | | | | | | | | | | 504,270 | | | | 791,704 | |
| | | | | | | | | | | | | | | | |
| | | | |
Financials: 21.37% | | | | | | | | | | | | | | | | |
| | | | |
| Banks: 1.85% | | | | | | | | | | | | | | | | |
FCB Financial Holdings Class A † | | | | | | | | | | | 61,267 | | | | 2,083,078 | |
| | | | | | | | | | | | | | | | |
| | | | |
| Capital Markets: 1.45% | | | | | | | | | | | | | | | | |
Evercore Partners Incorporated Class A | | | | | | | | | | | 36,957 | | | | 1,633,130 | |
| | | | | | | | | | | | | | | | |
| | | | |
| Insurance: 13.32% | | | | | | | | | | | | | | | | |
AmTrust Financial Services Incorporated | | | | | | | | | | | 70,063 | | | | 1,716,544 | |
Employers Holdings Incorporated | | | | | | | | | | | 70,151 | | | | 2,035,782 | |
FBL Financial Group Incorporated | | | | | | | | | | | 38,448 | | | | 2,332,640 | |
Federated National Holding Company | | | | | | | | | | | 93,454 | | | | 1,779,364 | |
Heritage Insurance Holdings | | | | | | | | | | | 136,275 | | | | 1,631,212 | |
Maiden Holdings Limited | | | | | | | | | | | 124,830 | | | | 1,527,919 | |
National General Holdings Corporation | | | | | | | | | | | 101,911 | | | | 2,182,934 | |
The accompanying notes are an integral part of these financial statements.
| | | | |
| 10 | | Wells Fargo Small Cap Core Fund | | Portfolio of investments—June 30, 2016 |
| | | | | | | | | | | | | | | | |
| Security name | | | | | | | | Shares | | | Value | |
| | | | |
| Insurance (continued) | | | | | | | | | | | | | | | | |
United Insurance Holdings Company | | | | | | | | | | | 106,934 | | | $ | 1,751,579 | |
| | | | |
| | | | | | | | | | | | | | | 14,957,974 | |
| | | | | | | | | | | | | | | | |
| | | | |
| REITs: 4.75% | | | | | | | | | | | | | | | | |
Ashford Hospitality Trust Incorporated | | | | | | | | | | | 273,882 | | | | 1,470,746 | |
InfraReit Incorporated | | | | | | | | | | | 90,017 | | | | 1,578,898 | |
QTS Realty Trust Incorporated Class A | | | | | | | | | | | 40,808 | | | | 2,284,432 | |
| | | | |
| | | | | | | | | | | | | | | 5,334,076 | |
| | | | | | | | | | | | | | | | |
| | | | |
Health Care: 17.17% | | | | | | | | | | | | | | | | |
| | | | |
| Biotechnology: 1.29% | | | | | | | | | | | | | | | | |
MiMedx Group Incorporated † | | | | | | | | | | | 181,504 | | | | 1,448,402 | |
| | | | | | | | | | | | | | | | |
| | | | |
| Health Care Equipment & Supplies: 3.76% | | | | | | | | | | | | | | | | |
ICU Medical Incorporated † | | | | | | | | | | | 17,861 | | | | 2,013,828 | |
NuVasive Incorporated † | | | | | | | | | | | 37,020 | | | | 2,210,834 | |
| | | | |
| | | | | | | | | | | | | | | 4,224,662 | |
| | | | | | | | | | | | | | | | |
| | | | |
| Health Care Providers & Services: 8.27% | | | | | | | | | | | | | | | | |
AmSurg Corporation † | | | | | | | | | | | 30,256 | | | | 2,346,050 | |
Biotelemetry Incorporated † | | | | | | | | | | | 134,314 | | | | 2,189,318 | |
HealthSouth Corporation | | | | | | | | | | | 46,749 | | | | 1,814,796 | |
PharMerica Corporation † | | | | | | | | | | | 66,119 | | | | 1,630,495 | |
Select Medical Holdings Corporation † | | | | | | | | | | | 120,251 | | | | 1,307,128 | |
| | | | |
| | | | | | | | | | | | | | | 9,287,787 | |
| | | | | | | | | �� | | | | | | | |
| | | | |
| Life Sciences Tools & Services: 1.72% | | | | | | | | | | | | | | | | |
INC Research Holdings Incorporated Class A † | | | | | | | | | | | 50,728 | | | | 1,934,259 | |
| | | | | | | | | | | | | | | | |
| | | | |
| Pharmaceuticals: 2.13% | | | | | | | | | | | | | | | | |
Supernus Pharmaceuticals Incorporated † | | | | | | | | | | | 117,414 | | | | 2,391,723 | |
| | | | | | | | | | | | | | | | |
| | | | |
Industrials: 17.38% | | | | | | | | | | | | | | | | |
| | | | |
| Airlines: 1.88% | | | | | | | | | | | | | | | | |
SkyWest Incorporated | | | | | | | | | | | 79,718 | | | | 2,109,338 | |
| | | | | | | | | | | | | | | | |
| | | | |
| Commercial Services & Supplies: 3.78% | | | | | | | | | | | | | | | | |
Deluxe Corporation | | | | | | | | | | | 35,184 | | | | 2,335,162 | |
UniFirst Corporation | | | | | | | | | | | 16,543 | | | | 1,914,356 | |
| | | | |
| | | | | | | | | | | | | | | 4,249,518 | |
| | | | | | | | | | | | | | | | |
| | | | |
| Construction & Engineering: 5.45% | | | | | | | | | | | | | | | | |
Argan Incorporated | | | | | | | | | | | 56,173 | | | | 2,343,538 | |
Comfort Systems USA Incorporated | | | | | | | | | | | 61,462 | | | | 2,001,817 | |
EMCOR Group Incorporated | | | | | | | | | | | 36,030 | | | | 1,774,838 | |
| | | | |
| | | | | | | | | | | | | | | 6,120,193 | |
| | | | | | | | | | | | | | | | |
The accompanying notes are an integral part of these financial statements.
| | | | | | |
| Portfolio of investments—June 30, 2016 | | Wells Fargo Small Cap Core Fund | | | 11 | |
| | | | | | | | | | | | | | | | |
| Security name | | | | | | | | Shares | | | Value | |
| | | | |
| Machinery: 3.67% | | | | | | | | | | | | | | | | |
ITT Incorporated | | | | | | | | | | | 46,233 | | | $ | 1,478,531 | |
The Greenbrier Companies Incorporated | | | | | | | | | | | 24,166 | | | | 703,956 | |
Wabash National Corporation † | | | | | | | | | | | 153,001 | | | | 1,943,113 | |
| | | | |
| | | | | | | | | | | | | | | 4,125,600 | |
| | | | | | | | | | | | | | | | |
| | | | |
| Professional Services: 2.60% | | | | | | | | | | | | | | | | |
Insperity Incorporated | | | | | | | | | | | 25,281 | | | | 1,952,452 | |
RPX Corporation † | | | | | | | | | | | 105,355 | | | | 966,105 | |
| | | | |
| | | | | | | | | | | | | | | 2,918,557 | |
| | | | | | | | | | | | | | | | |
| | | | |
Information Technology: 21.78% | | | | | | | | | | | | | | | | |
| | | | |
| Communications Equipment: 1.74% | | | | | | | | | | | | | | | | |
Brocade Communications Systems Incorporated | | | | | | | | | | | 213,587 | | | | 1,960,729 | |
| | | | | | | | | | | | | | | | |
| | | | |
| Electronic Equipment, Instruments & Components: 3.49% | | | | | | | | | | | | | | | | |
Methode Electronics Incorporated | | | | | | | | | | | 47,816 | | | | 1,636,742 | |
Sanmina Corporation † | | | | | | | | | | | 85,359 | | | | 2,288,475 | |
| | | | |
| | | | | | | | | | | | | | | 3,925,217 | |
| | | | | | | | | | | | | | | | |
| | | | |
| Internet Software & Services: 4.63% | | | | | | | | | | | | | | | | |
J2 Global Incorporated | | | | | | | | | | | 29,529 | | | | 1,865,347 | |
Tessera Technologies Incorporated | | | | | | | | | | | 53,015 | | | | 1,624,380 | |
Web.com Group Incorporated † | | | | | | | | | | | 94,053 | | | | 1,709,884 | |
| | | | |
| | | | | | | | | | | | | | | 5,199,611 | |
| | | | | | | | | | | | | | | | |
| | | | |
| IT Services: 1.75% | | | | | | | | | | | | | | | | |
Hackett Group Incorporated | | | | | | | | | | | 141,591 | | | | 1,963,867 | |
| | | | | | | | | | | | | | | | |
| | | | |
| Semiconductors & Semiconductor Equipment: 7.76% | | | | | | | | | | | | | | | | |
Cirrus Logic Incorporated † | | | | | | | | | | | 68,185 | | | | 2,644,896 | |
Inphi Corporation † | | | | | | | | | | | 71,937 | | | | 2,304,142 | |
Integrated Device Technology Incorporated † | | | | | | | | | | | 104,513 | | | | 2,103,847 | |
MaxLinear Incorporated Class A † | | | | | | | | | | | 92,427 | | | | 1,661,837 | |
| | | | |
| | | | | | | | | | | | | | | 8,714,722 | |
| | | | | | | | | | | | | | | | |
| | | | |
| Software: 2.41% | | | | | | | | | | | | | | | | |
Gigamon Incorporated † | | | | | | | | | | | 72,327 | | | | 2,704,307 | |
| | | | | | | | | | | | | | | | |
| | | | |
Materials: 3.37% | | | | | | | | | | | | | | | | |
| | | | |
| Chemicals: 1.75% | | | | | | | | | | | | | | | | |
Trinseo SA | | | | | | | | | | | 45,795 | | | | 1,965,979 | |
| | | | | | | | | | | | | | | | |
| | | | |
| Containers & Packaging: 1.62% | | | | | | | | | | | | | | | | |
Graphic Packaging Holding Company | | | | | | | | | | | 145,089 | | | | 1,819,416 | |
| | | | | | | | | | | | | | | | |
| | | | |
Utilities: 1.63% | | | | | | | | | | | | | | | | |
| | | | |
| Electric Utilities: 1.63% | | | | | | | | | | | | | | | | |
Spark Energy Incorporated Class A | | | | | | | | | | | 55,467 | | | | 1,833,183 | |
| | | | | | | | | | | | | | | | |
| | | | |
Total Common Stocks (Cost $105,989,851) | | | | | | | | | | | | | | | 111,155,789 | |
| | | | | | | | | | | | | | | | |
The accompanying notes are an integral part of these financial statements.
| | | | |
| 12 | | Wells Fargo Small Cap Core Fund | | Portfolio of investments—June 30, 2016 |
| | | | | | | | | | | | | | | | |
| Security name | | | | | Yield | | | Shares | | | Value | |
| Short-Term Investments: 1.11% | | | | | | | | | | | | | | | | |
| | | | |
| Investment Companies: 1.11% | | | | | | | | | | | | | | | | |
Wells Fargo Cash Investment Money Market Fund Select Class (l)(u) | | | | | | | 0.43 | % | | | 1,251,302 | | | $ | 1,251,302 | |
| | | | | | | | | | | | | | | | |
| | | | |
Total Short-Term Investments (Cost $1,251,302) | | | | | | | | | | | | | | | 1,251,302 | |
| | | | | | | | | | | | | | | | |
| | | | | | | | |
| Total investments in securities (Cost $107,241,153) * | | | 100.06 | % | | | 112,407,091 | |
Other assets and liabilities, net | | | (0.06 | ) | | | (69,128 | ) |
| | | | | | | | |
| Total net assets | | | 100.00 | % | | $ | 112,337,963 | |
| | | | | | | | |
| † | Non-income-earning security |
| (l) | The issuer of the security is an affiliated person of the Fund as defined in the Investment Company Act of 1940. |
| (u) | The rate represents the 7-day annualized yield at period end. |
| * | Cost for federal income tax purposes is $107,852,771 and unrealized gains (losses) consists of: |
| | | | |
Gross unrealized gains | | $ | 13,295,157 | |
Gross unrealized losses | | | (8,740,837 | ) |
| | | | |
Net unrealized gains | | $ | 4,554,320 | |
The accompanying notes are an integral part of these financial statements.
| | | | | | |
| Statement of assets and liabilities—June 30, 2016 | | Wells Fargo Small Cap Core Fund | | | 13 | |
| | | | |
| | | | |
| |
Assets | | | | |
Investments | | | | |
In unaffiliated securities, at value (cost $105,989,851) | | $ | 111,155,789 | |
In affiliated securities, at value (cost $1,251,302) | | | 1,251,302 | |
| | | | |
Total investments, at value (cost $107,241,153) | | | 112,407,091 | |
Receivable for Fund shares sold | | | 150,210 | |
Receivable for dividends | | | 169,761 | |
| | | | |
Total assets | | | 112,727,062 | |
| | | | |
| |
Liabilities | | | | |
Payable for Fund shares redeemed | | | 289,179 | |
Management fee payable | | | 69,358 | |
Distribution fee payable | | | 63 | |
Administration fees payable | | | 12,438 | |
Accrued expenses and other liabilities | | | 18,061 | |
| | | | |
Total liabilities | | | 389,099 | |
| | | | |
Total net assets | | $ | 112,337,963 | |
| | | | |
| |
NET ASSETS CONSIST OF | | | | |
Paid-in capital | | $ | 167,089,890 | |
Undistributed net investment income | | | 216,815 | |
Accumulated net realized losses on investments | | | (60,134,680 | ) |
Net unrealized gains on investments | | | 5,165,938 | |
| | | | |
Total net assets | | $ | 112,337,963 | |
| | | | |
| |
COMPUTATION OF NET ASSET VALUE AND OFFERING PRICE PER SHARE | | | | |
Net assets – Class A | | $ | 131,546 | |
Shares outstanding – Class A1 | | | 7,790 | |
Net asset value per share – Class A | | | $16.89 | |
Maximum offering price per share – Class A2 | | | $17.92 | |
Net assets – Class C | | $ | 101,528 | |
Shares outstanding – Class C1 | | | 6,017 | |
Net asset value per share – Class C | | | $16.87 | |
Net assets – Class R6 | | $ | 101,658 | |
Shares outstanding – Class R61 | | | 6,017 | |
Net asset value per share – Class R6 | | | $16.90 | |
Net assets – Administrator Class | | $ | 101,625 | |
Shares outstanding – Administrator Class1 | | | 6,017 | |
Net asset value per share – Administrator Class | | | $16.89 | |
Net assets – Institutional Class | | $ | 111,901,606 | |
Shares outstanding – Institutional Class1 | | | 6,622,947 | |
Net asset value per share – Institutional Class | | | $16.90 | |
| 1 | The Fund has an unlimited number of authorized shares. |
| 2 | Maximum offering price is computed as 100/94.25 of net asset value. On investments of $50,000 or more, the offering price is reduced. |
The accompanying notes are an integral part of these financial statements.
| | | | |
| 14 | | Wells Fargo Small Cap Core Fund | | Statement of operations —year ended June 30, 20161 |
| | | | |
| | | | |
| |
Investment income | | | | |
Dividends | | $ | 1,513,654 | |
Income from affiliated securities | | | 2,865 | |
| | | | |
Total investment income | | | 1,516,519 | |
| | | | |
| |
Expenses | | | | |
Management fee | | | 1,220,746 | |
Administration fees | | | | |
Class A | | | 24 | 2 |
Class C | | | 23 | 2 |
Class R6 | | | 3 | 2 |
Administrator Class | | | 14 | 2 |
Institutional Class | | | 16,192 | |
Shareholder servicing fees | | | | |
Class A | | | 29 | 2 |
Class C | | | 27 | 2 |
Administrator Class | | | 27 | 2 |
Distribution fee | | | | |
Class C | | | 82 | 2 |
Custody and accounting fees | | | 1,969 | |
Professional fees | | | 4,592 | |
Registration fees | | | 5,342 | |
Shareholder report expenses | | | 3,633 | |
Trustees’ fees and expenses | | | 1,500 | |
Other fees and expenses | | | 961 | |
| | | | |
Total expenses | | | 1,255,164 | |
Less: Fee waivers and/or expense reimbursements | | | (24,517 | ) |
| | | | |
Net expenses | | | 1,230,647 | |
| | | | |
Net investment income | | | 285,872 | |
| | | | |
| |
REALIZED AND UNREALIZED GAINS (LOSSES) ON INVESTMENTS | | | | |
Net realized losses on investments | | | (10,551,715 | ) |
Net change in unrealized gains (losses) on investments | | | (2,795,570 | ) |
| | | | |
Net realized and unrealized gains (losses) on investments | | | (13,347,285 | ) |
| | | | |
Net decrease in net assets resulting from operations | | $ | (13,061,413 | ) |
| | | | |
| 1 | After the close of business on May 20, 2016, the Fund acquired the net assets of Golden Small Cap Core Fund, which became the accounting and performance survivor in the transaction. The information for the period prior to May 20, 2016 is that of Golden Small Cap Core Fund. |
| 2 | For the period May 20, 2016 (commencement of class operations) to June 30, 2016. |
The accompanying notes are an integral part of these financial statements.
| | | | | | |
| Statement of changes in net assets | | Wells Fargo Small Cap Core Fund | | | 15 | |
| | | | | | | | | | | | | | | | |
| | | Year ended
June 30, 20161 | | | Year ended
June 30, 20151 | |
| | | | |
Operations | | | | | | | | | | | | | | | | |
Net investment income | | | | | | $ | 285,872 | | | | | | | $ | 154,172 | |
Net realized gains (losses) on investments | | | | | | | (10,551,715 | ) | | | | | | | 2,177,443 | |
Net change in unrealized gains (losses) on investments | | | | | | | (2,795,570 | ) | | | | | | | 2,762,213 | |
| | | | |
Net increase (decrease) in net assets resulting from operations | | | | | | | (13,061,413 | ) | | | | | | | 5,093,828 | |
| | | | |
| | | | |
Distributions to shareholders from | | | | | | | | | | | | | | | | |
Net investment income | | | | | | | | | | | | | | | | |
Institutional Class | | | | | | | (153,914 | ) | | | | | | | (55,322 | ) |
| | | | |
| | | | |
Capital share transactions | | | Shares | | | | | | | | Shares | | | | | |
Proceeds from shares sold | | | | | | | | | | | | | | | | |
Class A | | | 7,790 | 2 | | | 130,000 | 2 | | | N/A | | | | N/A | |
Class C | | | 6,017 | 2 | | | 100,000 | 2 | | | N/A | | | | N/A | |
Class R6 | | | 6,017 | 2 | | | 100,000 | 2 | | | N/A | | | | N/A | |
Administrator Class | | | 6,017 | 2 | | | 100,000 | 2 | | | N/A | | | | N/A | |
Institutional Class | | | 5,103,153 | | | | 91,283,720 | | | | 3,539,453 | | | | 63,438,443 | |
| | | | |
| | | | | | | 91,713,720 | | | | | | | | 63,438,443 | |
| | | | |
Reinvestment of distributions | | | | | | | | | | | | | | | | |
Institutional Class | | | 1,813 | | | | 32,246 | | | | 293 | | | | 5,120 | |
| | | | |
Payment for shares redeemed | | | | | | | | | | | | | | | | |
Institutional Class | | | (2,992,788 | ) | | | (50,609,931 | ) | | | (352,069 | ) | | | (6,234,965 | ) |
| | | | |
Net increase in net assets resulting from capital share transactions | | | | | | | 41,136,035 | | | | | | | | 57,208,598 | |
| | | | |
Total increase in net assets | | | | | | | 27,920,708 | | | | | | | | 62,247,104 | |
| | | | |
| | | | |
Net assets | | | | | | | | | | | | | | | | |
Beginning of period | | | | | | | 84,417,255 | | | | | | | | 22,170,151 | |
| | | | |
End of period | | | | | | $ | 112,337,963 | | | | | | | $ | 84,417,255 | |
| | | | |
Undistributed net investment income | | | | | | $ | 216,815 | | | | | | | $ | 153,878 | |
| | | | |
| 1 | After the close of business on May 20, 2016, the Fund acquired the net assets of Golden Small Cap Core Fund, which became the accounting and performance survivor in the transaction. The information for the period prior to May 20, 2016 is that of Golden Small Cap Core Fund. |
| 2 | For the period May 20, 2016 (commencement of class operations) to June 30, 2016. |
The accompanying notes are an integral part of these financial statements.
| | | | |
| 16 | | Wells Fargo Small Cap Core Fund | | Financial highlights |
(For a share outstanding throughout the period)
| | | | |
| CLASS A | | Year ended
June 30, 20161 | |
Net asset value, beginning of period | | | $16.62 | |
Net investment income | | | 0.01 | 2 |
Net realized and unrealized gains (losses) on investments | | | 0.26 | |
| | | | |
Total from investment operations | | | 0.27 | |
Net asset value, end of period | | | $16.89 | |
Total return3 | | | 1.62 | % |
Ratios to average net assets (annualized) | | | | |
Gross expenses | | | 1.46 | % |
Net expenses | | | 1.35 | % |
Net investment income | | | 0.65 | % |
Supplemental data | | | | |
Portfolio turnover rate | | | 61 | % |
Net assets, end of period (000s omitted) | | | $132 | |
| 1 | For the period May 20, 2016 (commencement of class operations) to June 30, 2016. |
| 2 | Calculated based upon average shares outstanding |
| 3 | Total return calculations do not include any sales charges. Returns for periods of less than one year are not annualized. |
The accompanying notes are an integral part of these financial statements.
| | | | | | |
| Financial highlights | | Wells Fargo Small Cap Core Fund | | | 17 | |
(For a share outstanding throughout the period)
| | | | |
| CLASS C | | Year ended
June 30, 20161 | |
Net asset value, beginning of period | | | $16.62 | |
Net investment loss | | | (0.00 | )2,3 |
Net realized and unrealized gains (losses) on investments | | | 0.25 | |
| | | | |
Total from investment operations | | | 0.25 | |
Net asset value, end of period | | | $16.87 | |
Total return4 | | | 1.50 | % |
Ratios to average net assets (annualized) | | | | |
Gross expenses | | | 2.21 | % |
Net expenses | | | 2.10 | % |
Net investment loss | | | (0.27 | )% |
Supplemental data | | | | |
Portfolio turnover rate | | | 61 | % |
Net assets, end of period (000s omitted) | | | $102 | |
| 1 | For the period May 20, 2016 (commencement of class operations) to June 30, 2016. |
| 2 | Calculated based upon average shares outstanding |
| 3 | Amount is less than $0.005. |
| 4 | Total return calculations do not include any sales charges. Returns for periods of less than one year are not annualized. |
The accompanying notes are an integral part of these financial statements.
| | | | |
| 18 | | Wells Fargo Small Cap Core Fund | | Financial highlights |
(For a share outstanding throughout the period)
| | | | |
| CLASS R6 | | Year ended
June 30, 20161 | |
Net asset value, beginning of period | | | $16.62 | |
Net investment income | | | 0.02 | 2 |
Net realized and unrealized gains (losses) on investments | | | 0.26 | |
| | | | |
Total from investment operations | | | 0.28 | |
Net asset value, end of period | | | $16.90 | |
Total return3 | | | 1.68 | % |
Ratios to average net assets (annualized) | | | | |
Gross expenses | | | 1.03 | % |
Net expenses | | | 0.90 | % |
Net investment income | | | 0.93 | % |
Supplemental data | | | | |
Portfolio turnover rate | | | 61 | % |
Net assets, end of period (000s omitted) | | | $102 | |
| 1 | For the period May 20, 2016 (commencement of class operations) to June 30, 2016. |
| 2 | Calculated based upon average shares outstanding |
| 3 | Returns for periods of less than one year are not annualized. |
The accompanying notes are an integral part of these financial statements.
| | | | | | |
| Financial highlights | | Wells Fargo Small Cap Core Fund | | | 19 | |
(For a share outstanding throughout the period)
| | | | |
| ADMINISTRATOR CLASS | | Year ended
June 30, 20161 | |
Net asset value, beginning of period | | | $16.62 | |
Net investment income | | | 0.01 | 2 |
Net realized and unrealized gains (losses) on investments | | | 0.26 | |
| | | | |
Total from investment operations | | | 0.27 | |
Net asset value, end of period | | | $16.89 | |
Total return3 | | | 1.62 | % |
Ratios to average net assets (annualized) | | | | |
Gross expenses | | | 1.37 | % |
Net expenses | | | 1.25 | % |
Net investment income | | | 0.58 | % |
Supplemental data | | | | |
Portfolio turnover rate | | | 61 | % |
Net assets, end of period (000s omitted) | | | $102 | |
| 1 | For the period May 20, 2016 (commencement of class operations) to June 30, 2016. |
| 2 | Calculated based upon average shares outstanding |
| 3 | Returns for periods of less than one year are not annualized. |
The accompanying notes are an integral part of these financial statements.
| | | | |
| 20 | | Wells Fargo Small Cap Core Fund | | Financial highlights |
(For a share outstanding throughout each period)
| | | | | | | | | | | | | | | | | | | | |
| | | Year ended June 30 | |
| INSTITUTIONAL CLASS | | 20161 | | | 20151 | | | 20141 | | | 20131 | | | 20121 | |
Net asset value, beginning of period | | | $18.71 | | | | $16.76 | | | | $13.57 | | | | $10.64 | | | | $11.10 | |
Net investment income (loss) | | | 0.04 | 2 | | | 0.06 | 2 | | | 0.05 | 2 | | | 0.16 | 2 | | | (0.01 | )2 |
Net realized and unrealized gains (losses) on investments | | | (1.83 | ) | | | 1.92 | | | | 3.36 | | | | 2.77 | | | | (0.45 | ) |
| | | | | | | | | | | | | | | | | | | | |
Total from investment operations | | | (1.79 | ) | | | 1.98 | | | | 3.41 | | | | 2.93 | | | | (0.46 | ) |
Distributions to shareholders from | | | | | | | | | | | | | | | | | | | | |
Net investment income | | | (0.02 | ) | | | (0.03 | ) | | | (0.22 | ) | | | 0.00 | | | | 0.00 | |
Net asset value, end of period | | | $16.90 | | | | $18.71 | | | | $16.76 | | | | $13.57 | | | | $10.64 | |
Total return | | | (9.57 | )% | | | 11.80 | % | | | 25.21 | % | | | 27.54 | % | | | (4.14 | )% |
Ratios to average net assets (annualized) | | | | | | | | | | | | | | | | | | | | |
Gross expenses | | | 1.11 | % | | | 1.10 | % | | | 1.10 | % | | | 1.10 | % | | | 1.11 | % |
Net expenses | | | 1.09 | % | | | 1.10 | % | | | 1.10 | % | | | 1.10 | % | | | 1.10 | % |
Net investment income (loss) | | | 0.25 | % | | | 0.37 | % | | | 0.30 | % | | | 1.32 | % | | | (0.12 | )% |
Supplemental data | | | | | | | | | | | | | | | | | | | | |
Portfolio turnover rate | | | 61 | % | | | 57 | % | | | 68 | % | | | 52 | % | | | 56 | % |
Net assets, end of period (000s omitted) | | | $111,902 | | | | $84,417 | | | | $22,170 | | | | $20,093 | | | | $27,427 | |
| 1 | After the close of business on May 20, 2016, the Fund acquired the net assets of Golden Small Cap Core Fund, which became the accounting and performance survivor in the transaction. The information for the period prior to May 20, 2016 is that of Golden Small Cap Core Fund. |
| 2 | Calculated based upon average shares outstanding |
The accompanying notes are an integral part of these financial statements.
| | | | | | |
| Notes to financial statements | | Wells Fargo Small Cap Core Fund | | | 21 | |
1. ORGANIZATION
Wells Fargo Funds Trust (the “Trust”), a Delaware statutory trust organized on March 10, 1999, is an open-end management investment company registered under the Investment Company Act of 1940, as amended (the “1940 Act”). As an investment company, the Trust follows the accounting and reporting guidance in Financial Accounting Standards Board (“FASB”) Accounting Standards Codification Topic 946, Financial Services – Investment Companies. These financial statements report on the Wells Fargo Small Cap Core Fund (the “Fund”) which is a diversified series of the Trust.
After the close of business on May 20, 2016, the net assets of Golden Small Cap Core Fund were acquired by the Fund, which was created to receive the assets of Golden Small Cap Core Fund, in an exchange for shares of the Fund. Institutional shareholders of Golden Small Cap Core Fund received shares of Institutional Class of the Fund in the transaction. Since Golden Small Cap Core Fund contributed all of the net assets and shareholders to the newly created Wells Fargo fund, the accounting and performance history of Golden Small Cap Core Fund has been carried forward in the financial statements contained herein.
2. SIGNIFICANT ACCOUNTING POLICIES
The following significant accounting policies, which are consistently followed in the preparation of the financial statements of the Fund, are in conformity with U.S. generally accepted accounting principles which require management to make estimates and assumptions that affect the reported amounts of assets and liabilities, disclosure of contingent assets and liabilities at the date of the financial statements, and the reported amounts of revenues and expenses during the reporting period. Actual results could differ from those estimates.
All investments are valued each business day as of the close of regular trading on the New York Stock Exchange (generally 4 p.m. Eastern Time), although the Fund may deviate from this calculation time under unusual or unexpected circumstances.
Equity securities that are listed on a foreign or domestic exchange or market are valued at the official closing price or, if none, the last sales price. If no sale occurs on the principal exchange or market that day, the prior day’s price will be deemed “stale” and a fair value price will be determined in accordance with the Fund’s Valuation Procedures.
Investments in registered open-end investment companies are valued at net asset value.
Investments which are not valued using any of the methods discussed above are valued at their fair value, as determined in good faith by the Board of Trustees of the Fund. The Board of Trustees has established a Valuation Committee comprised of the Trustees and has delegated to it the authority to take any actions regarding the valuation of portfolio securities that the Valuation Committee deems necessary or appropriate, including determining the fair value of portfolio securities, unless the determination has been delegated to the Management Valuation Team of Wells Fargo Funds Management, LLC (“Funds Management”). The Board of Trustees retains the authority to make or ratify any valuation decisions or approve any changes to the Valuation Procedures as it deems appropriate. On a quarterly basis, the Board of Trustees receives reports on any valuation actions taken by the Valuation Committee or the Management Valuation Team which may include items for ratification.
Valuations of fair valued securities are compared to the next actual sales price when available, or other appropriate market values, to assess the continued appropriateness of the fair valuation methodologies used. These securities are fair valued on a day-to-day basis, taking into consideration changes to appropriate market information and any significant changes to the inputs considered in the valuation process until there is a readily available price provided on an exchange or by an independent pricing service. Valuations received from an independent pricing service or independent broker-dealer quotes are periodically validated by comparisons to most recent trades and valuations provided by other independent pricing services in addition to the review of prices by the manager and/or subadviser. Unobservable inputs used in determining fair valuations are identified based on the type of security, taking into consideration factors utilized by market participants in valuing the investment, knowledge about the issuer and the current market environment.
Security transactions and income recognition
Securities transactions are recorded on a trade date basis. Realized gains or losses are recorded on the basis of identified cost.
Dividend income is recognized on the ex-dividend date.
Distributions to shareholders
Distributions to shareholders from net investment income and net realized gains, if any, are recorded on the ex-dividend date. Such distributions are determined in conformity with federal income tax regulations, which may differ in amount or character from net investment income and realized gains recognized for purposes of U.S. generally accepted accounting principles.
| | | | |
| 22 | | Wells Fargo Small Cap Core Fund | | Notes to financial statements |
Federal and other taxes
The Fund intends to continue to qualify as a regulated investment company by distributing substantially all of its investment company taxable income and any net realized capital gains (after reduction for capital loss carryforwards) sufficient to relieve it from all, or substantially all, federal income taxes. Accordingly, no provision for federal income taxes was required.
The Fund’s income and federal excise tax returns and all financial records supporting those returns for the prior three fiscal years are subject to examination by the federal and Delaware revenue authorities. Management has analyzed the Fund’s tax positions taken on federal, state, and foreign tax returns for all open tax years and does not believe that there are any uncertain tax positions that require recognition of a tax liability.
Reclassifications are made to the Fund’s capital accounts for permanent tax differences to reflect income and gains available for distribution (or available capital loss carryforwards) under federal income tax regulations. U.S. generally accepted accounting principles require that certain components of net assets be adjusted to reflect permanent differences between financial and tax reporting. These reclassifications have no effect on net assets or net asset values per share. The primary permanent difference causing such reclassifications is due to dividends from certain securities. At June 30, 2016, as a result of permanent book-to-tax differences, the following reclassification adjustments were made on the Statement of Assets and Liabilities:
| | |
Undistributed net
investment income | | Accumulated net
realized losses
on investments |
| $(69,021) | | $69,021 |
Capital loss carryforwards that do not expire are required to be utilized prior to capital loss carryforwards that expire. As of June 30, 2016, capital loss carryforwards available to offset future net realized capital gains were as follows through the indicated expiration dates:
| | | | |
| | | No expiration |
2018 | | Short-term | | Long-term |
| $49,578,591 | | $9,232,422 | | $712,049 |
Class allocations
The separate classes of shares offered by the Fund differ principally in applicable sales charges, distribution, shareholder servicing, and administration fees. Class specific expenses are charged directly to that share class. Investment income, common expenses, and realized and unrealized gains (losses) on investments are allocated daily to each class of shares based on the relative proportion of net assets of each class.
3. FAIR VALUATION MEASUREMENTS
Fair value measurements of investments are determined within a framework that has established a fair value hierarchy based upon the various data inputs utilized in determining the value of the Fund’s investments. The three-level hierarchy gives the highest priority to unadjusted quoted prices in active markets for identical assets or liabilities (Level 1) and the lowest priority to significant unobservable inputs (Level 3). The Fund’s investments are classified within the fair value hierarchy based on the lowest level of input that is significant to the fair value measurement. The inputs are summarized into three broad levels as follows:
| n | | Level 1 – quoted prices in active markets for identical securities |
| n | | Level 2 – other significant observable inputs (including quoted prices for similar securities, interest rates, prepayment speeds, credit risk, use of amortized cost, etc.) |
| n | | Level 3 – significant unobservable inputs (including the Fund’s own assumptions in determining the fair value of investments) |
| | | | | | |
| Notes to financial statements | | Wells Fargo Small Cap Core Fund | | | 23 | |
The inputs or methodologies used for valuing investments in securities are not necessarily an indication of the risk associated with investing in those securities.
The following is a summary of the inputs used in valuing the Fund’s assets and liabilities as of June 30, 2016:
| | | | | | | | | | | | | | | | |
| | | Quoted prices
(Level 1) | | | Other significant observable inputs (Level 2) | | | Significant unobservable inputs (Level 3) | | | Total | |
Assets | | | | | | | | | | | | | | | | |
Investments in : | | | | | | | | | | | | | | | | |
| | | | |
Common stocks | | | | | | | | | | | | | | | | |
Consumer discretionary | | $ | 10,110,547 | | | $ | 0 | | | $ | 0 | | | $ | 10,110,547 | |
Consumer staples | | | 4,000,063 | | | | 0 | | | | 0 | | | | 4,000,063 | |
Energy | | | 4,139,851 | | | | 0 | | | | 0 | | | | 4,139,851 | |
Financials | | | 24,008,258 | | | | 0 | | | | 0 | | | | 24,008,258 | |
Health care | | | 19,286,833 | | | | 0 | | | | 0 | | | | 19,286,833 | |
Industrials | | | 19,523,206 | | | | 0 | | | | 0 | | | | 19,523,206 | |
Information technology | | | 24,468,453 | | | | 0 | | | | 0 | | | | 24,468,453 | |
Materials | | | 3,785,395 | | | | 0 | | | | 0 | | | | 3,785,395 | |
Utilities | | | 1,833,183 | | | | 0 | | | | 0 | | | | 1,833,183 | |
| | | | |
Short-term investments | | | | | | | | | | | 0 | | | | | |
Investment companies | | | 1,251,302 | | | | 0 | | | | 0 | | | | 1,251,302 | |
Total assets | | $ | 112,407,091 | | | $ | 0 | | | $ | 0 | | | $ | 112,407,091 | |
The Fund recognizes transfers between levels within the fair value hierarchy at the end of the reporting period. At June 30, 2016, the Fund did not have any transfers into/out of Level 1, Level 2, or Level 3.
4. TRANSACTIONS WITH AFFILIATES
Management fee
Funds Management, an indirect wholly owned subsidiary of Wells Fargo & Company (“Wells Fargo”), is the manager of the Fund and provides advisory and fund-level administrative services under an investment management agreement. Under the investment management agreement, Funds Management is responsible for, among other services, implementing the investment objectives and strategies of the Fund, supervising the subadviser, providing fund-level administrative services in connection with the Fund’s operations, and providing any other fund-level administrative services reasonably necessary for the operation of the Fund. As compensation for its services under the investment management agreement, Funds Management is entitled to receive an annual management fee starting at 0.85% and declining to 0.71% as the average daily net assets of the Fund increase.
Prior to May 20, 2016, Golden Capital Management, LLC, an affiliate of Funds Management and an indirect wholly owned subsidiary of Wells Fargo was the investment adviser to the predecessor fund and received an advisory fee at an annual rate of 1.10% of the average daily net assets of the predecessor fund. For financial statement purposes, the advisory fee incurred prior to May 20, 2016 has been included in management fee on the Statement of Operations.
For the year ended June 30, 2016, the management fee was equivalent to an annual rate of 1.08% of the Fund’s average daily net assets.
Funds Management has retained the services of a subadviser to provide daily portfolio management to the Fund. The fee for subadvisory services is borne by Funds Management. Golden Capital Management, LLC, is the subadviser to the Fund and is entitled to receive a fee from Funds Management at an annual rate starting at 0.55% and declining to 0.45% as the average daily net assets of the Fund increase.
| | | | |
| 24 | | Wells Fargo Small Cap Core Fund | | Notes to financial statements |
Administration fees
Under a class-level administration agreement, Funds Management provides class-level administrative services to the Fund, which includes paying fees and expenses for services provided by the transfer agent, sub-transfer agents, omnibus account servicers and record-keepers. As compensation for its services under the class-level administration agreement, Funds Management receives an annual fee which is calculated based on the average daily net assets of each class as follows:
| | | | |
| | | Class-level
administration fee | |
Class A, Class C | | | 0.21 | % |
Class R6 | | | 0.03 | |
Administrator Class, Institutional Class | | | 0.13 | |
Prior to May 20, 2016, the Institutional Class of the predecessor fund did not incur any administration fees.
Funds Management has contractually waived and/or reimbursed management and administration fees to the extent necessary to maintain certain net operating expense ratios for the Fund. Waiver of fees and/or reimbursement of expenses by Funds Management were made first from fund level expenses on a proportionate basis and then from class specific expenses. Funds Management has committed through July 31, 2019 to waive fees and/or reimburse expenses to the extent necessary to cap the Fund’s expenses at 1.35% for Class A shares, 2.10% for Class C shares, 0.90% for Class R6 shares, 1.25% for Administrator Class and 1.00% for Institutional Class shares. After this time, the cap may be increased or the commitment to maintain the cap may be terminated only with the approval of the Board of Trustees. Prior to May 20, 2016, the adviser of the predecessor fund had capped the expenses of Institutional Class at 1.10% through October 31, 2015.
Distribution fee
The Trust has adopted a distribution plan for Class C shares of the Fund pursuant to Rule 12b-1 under the 1940 Act. A distribution fees is charged to Class C shares and paid to Wells Fargo Funds Distributor, LLC (“Funds Distributor”), the principal underwriter, at an annual rate of 0.75% of the average daily net assets of Class C shares. Prior to May 20, 2016, the predecessor fund did not have a distribution plan.
Funds Distributor is also entitled to receive the front-end sales charge from the purchase of Class A shares and a contingent deferred sales charge on the redemption of certain Class A shares. Funds Distributor is also entitled to receive the contingent deferred sales charges from redemptions of Class C shares.
Shareholder servicing fees
The Trust has entered into contracts with one or more shareholder servicing agents, whereby Class A, Class C, and Administrator Class, of the Fund are charged a fee at an annual rate of 0.25% of the average daily net assets of each respective class.
A portion of these total shareholder servicing fees were paid to affiliates of Wells Fargo.
5. INVESTMENT PORTFOLIO TRANSACTIONS
Purchases and sales of investments, excluding U.S. government obligations (if any) and short-term securities, for the year ended June 30, 2016 were $107,650,608 and $67,972,332, respectively.
The Fund may purchase or sell investment securities to other Wells Fargo funds under procedures adopted by the Board of Trustees. The procedures have been designed to ensure that these interfund transactions, which generally do not incur broker commissions, are effected at current market prices. Interfund trades are included within the respective purchases and sales amounts shown.
6. DISTRIBUTIONS TO SHAREHOLDERS
The tax character of distributions paid was $153,914 and $55,322 of ordinary income for the years ended June 30, 2016 and June 30, 2015, respectively.
As of June 30, 2016, the components of distributable earnings on a tax basis were as follows:
| | | | |
Undistributed ordinary income | | Unrealized gains | | Capital loss carryforward |
$216,815 | | $4,554,320 | | $(59,523,062) |
| | | | | | |
| Notes to financial statements | | Wells Fargo Small Cap Core Fund | | | 25 | |
7. INDEMNIFICATION
Under the Trust’s organizational documents, the officers and Trustees have been granted certain indemnification rights against certain liabilities that may arise out of performance of their duties to the Trust. Additionally, in the normal course of business, the Trust may enter into contracts with service providers that contain a variety of indemnification clauses. The Trust’s maximum exposure under these arrangements is dependent on future claims that may be made against the Fund and, therefore, cannot be estimated.
| | | | |
| 26 | | Wells Fargo Small Cap Core Fund | | Report of independent registered public accounting firm |
BOARD OF TRUSTEES AND SHAREHOLDERS OF WELLS FARGO FUNDS TRUST:
We have audited the accompanying statement of assets and liabilities, including the portfolio of investments, of the Wells Fargo Small Cap Core Fund (formerly the Golden Small Cap Core Fund) (the “Fund”), one of the funds constituting the Wells Fargo Funds Trust, as of June 30, 2016, and the related statement of operations and statement of changes in net assets for the year then ended, the financial highlights of Class A, Class C, Class R6, and Administrative Class for the period from May 20, 2016 (commencement of class operations) to June 30, 2016, and the financial highlights of Institutional Class for the year ended June 30, 2016. These financial statements and financial highlights are the responsibility of the Fund’s management. Our responsibility is to express an opinion on these financial statements and financial highlights based on our audits. The accompanying financial statements and financial highlights of Wells Fargo Small Cap Core Fund as of and for the four-year period ended June 30, 2015, were audited by other auditors whose report thereon dated August 19, 2015, expressed an unqualified opinion on those statements.
We conducted our audits in accordance with the standards of the Public Company Accounting Oversight Board (United States). Those standards require that we plan and perform the audit to obtain reasonable assurance about whether the financial statements and financial highlights are free of material misstatement. An audit includes examining, on a test basis, evidence supporting the amounts and disclosures in the financial statements. Our procedures included confirmation of securities owned as of June 30, 2016, by correspondence with custodians and brokers, or by other appropriate auditing procedures. An audit also includes assessing the accounting principles used and significant estimates made by management, as well as evaluating the overall financial statement presentation. We believe that our audit provides a reasonable basis for our opinion.
In our opinion, the financial statements and financial highlights referred to above present fairly, in all material respects, the financial position of the Wells Fargo Small Cap Core Fund as of June 30, 2016, the results of its operations and changes in its assets for the year then ended, the financial highlights of Class A, Class C, Class R6, and Administrative Class for the period from May 20, 2016 (commencement of class operations) to June 30, 2016, and the financial highlights of Institutional Class for the year ended June 30, 2016, in conformity with U.S. generally accepted principles.

Boston, Massachusetts
August 25, 2016
| | | | | | |
| Other information (unaudited) | | Wells Fargo Small Cap Core Fund | | | 27 | |
TAX INFORMATION
Pursuant to Section 854 of the Internal Revenue Code, $153,914 of income dividends paid during the fiscal year ended June 30, 2016 has been designated as qualified dividend income (QDI).
For corporate shareholders, pursuant to Section 854 of the Internal Revenue Code, 100% of ordinary income dividends qualify for the corporate dividends-received deduction for the fiscal year ended June 30, 2016.
PROXY VOTING INFORMATION
A description of the policies and procedures that the Fund uses to determine how to vote proxies relating to portfolio securities is available, upon request, by calling 1-800-222-8222, visiting our website at wellsfargofunds.com, or visiting the SEC website at sec.gov. Information regarding how the Fund voted proxies relating to portfolio securities during the most recent 12-month period ended June 30 is available on the Fund’s website at wellsfargofunds.com or by visiting the SEC website at sec.gov.
PORTFOLIO HOLDINGS INFORMATION
The complete portfolio holdings for the Fund are publicly available monthly on the Fund’s website (wellsfargofunds.com), on a one-month delayed basis. In addition, top ten holdings information (excluding derivative positions) for the Fund is publicly available on the Fund’s website on a monthly, seven-day or more delayed basis. The Fund files its complete schedule of portfolio holdings with the SEC for the first and third quarters of each fiscal year on Form N-Q, which is available by visiting the SEC website at sec.gov. In addition, the Fund’s Form N-Q may be reviewed and copied at the SEC’s Public Reference Room in Washington, DC, and at regional offices in New York City, at 233 Broadway, and in Chicago, at 175 West Jackson Boulevard, Suite 900. Information about the Public Reference Room may be obtained by calling 1-800-SEC-0330.
| | | | |
| 28 | | Wells Fargo Small Cap Core Fund | | Other information (unaudited) |
BOARD OF TRUSTEES AND OFFICERS
Each of the Trustees and Officers1 listed in the table below acts in identical capacities for each fund in the Wells Fargo family of funds, which consists of 142 mutual funds comprising the Wells Fargo Funds Trust, Wells Fargo Variable Trust, Wells Fargo Master Trust and four closed-end funds (collectively the “Fund Complex”). This table should be read in conjunction with the Prospectus and the Statement of Additional Information2. The mailing address of each Trustee and Officer is 525 Market Street, 12th Floor, San Francisco, CA 94105. Each Trustee and Officer serves an indefinite term, however, each Trustee serves such term until reaching the mandatory retirement age established by the Trustees.
Independent Trustees
| | | | | | |
Name and year of birth | | Position held and length of service* | | Principal occupations during past five years or longer | | Current other public company or
investment company
directorships |
William R. Ebsworth
(Born 1957) | | Trustee, since 2015 | | Retired. From 1984 to 2013, equities analyst, portfolio manager, research director and chief financial officer at Fidelity Management and Research Company in Boston, Tokyo, and Hong Kong and retired in 2013 as Chief Investment Officer of Fidelity Strategic Advisers, Inc. where he lead a team of investment professionals managing client assets. Prior thereto, Board member of Hong Kong Securities Clearing Co., Hong Kong Options Clearing Corp., the Thailand International Fund, Ltd., Fidelity Investments Life Insurance Company, and Empire Fidelity Investments Life Insurance Company. Mr. Ebsworth is a CFA® charterholder and an Adjunct Lecturer, Finance, at Babson College. | | Asset Allocation Trust |
Jane A. Freeman
(Born 1953) | | Trustee, since 2015 | | Retired. From 2012 to 2014 and 1999 to 2008, Chief Financial Officer of Scientific Learning Corporation. From 2008 to 2012, Ms. Freeman provided consulting services related to strategic business projects. Prior to 1999, Portfolio Manager at Rockefeller & Co. and Scudder, Stevens & Clark. Board member of the Harding Loevner Funds from 1996 to 2014, serving as both Lead Independent Director and chair of the Audit Committee. Board member of the Russell Exchange Traded Funds Trust from 2011 to 2012 and the chair of the Audit Committee. Ms. Freeman is Chair of Taproot Foundation (non-profit organization), a Board Member of Ruth Bancroft Garden (non-profit organization) and an inactive chartered financial analyst. | | Asset Allocation Trust |
Peter G. Gordon
(Born 1942) | | Trustee, since 1998; Chairman, since 2005 | | Co-Founder, Retired Chairman, President and CEO of Crystal Geyser Water Company. Trustee Emeritus, Colby College. | | Asset Allocation Trust |
Isaiah Harris, Jr.
(Born 1952) | | Trustee, since 2009 | | Retired. Chairman of the Board of CIGNA Corporation since 2009, and Director since 2005. From 2003 to 2011, Director of Deluxe Corporation. Prior thereto, President and CEO of BellSouth Advertising and Publishing Corp. from 2005 to 2007, President and CEO of BellSouth Enterprises from 2004 to 2005 and President of BellSouth Consumer Services from 2000 to 2003. Emeritus member of the Iowa State University Foundation Board of Governors. Emeritus Member of the Advisory Board of Iowa State University School of Business. Advisory Board Member, Palm Harbor Academy (charter school). Advisory Board Member, Child Evangelism Fellowship (non-profit). Mr. Harris is a certified public accountant (inactive status). | | CIGNA Corporation; Asset Allocation Trust |
Judith M. Johnson
(Born 1949) | | Trustee, since 2008; Audit Committee Chairman, since 2008 | | Retired. Prior thereto, Chief Executive Officer and Chief Investment Officer of Minneapolis Employees Retirement Fund from 1996 to 2008. Ms. Johnson is an attorney, certified public accountant and a certified managerial accountant. | | Asset Allocation Trust |
David F. Larcker
(Born 1950) | | Trustee, since 2009 | | James Irvin Miller Professor of Accounting at the Graduate School of Business, Stanford University, Director of the Corporate Governance Research Initiative and Senior Faculty of The Rock Center for Corporate Governance since 2006. From 2005 to 2008, Professor of Accounting at the Graduate School of Business, Stanford University. Prior thereto, Ernst & Young Professor of Accounting at The Wharton School, University of Pennsylvania from 1985 to 2005. | | Asset Allocation Trust |
| | | | | | |
| Other information (unaudited) | | Wells Fargo Small Cap Core Fund | | | 29 | |
| | | | | | |
Name and year of birth | | Position held and length of service* | | Principal occupations during past five years or longer | | Current other public company or
investment company
directorships |
Olivia S. Mitchell
(Born 1953) | | Trustee, since 2006 | | International Foundation of Employee Benefit Plans Professor, Wharton School of the University of Pennsylvania since 1993. Director of Wharton’s Pension Research Council and Boettner Center on Pensions & Retirement Research, and Research Associate at the National Bureau of Economic Research. Previously, Cornell University Professor from 1978 to 1993. | | Asset Allocation Trust |
Timothy J. Penny
(Born 1951) | | Trustee, since 1996 | | President and Chief Executive Officer of Southern Minnesota Initiative Foundation, a non-profit organization, since 2007 and Senior Fellow at the Humphrey Institute Policy Forum at the University of Minnesota since 1995. Member of the Board of Trustees of NorthStar Education Finance, Inc., a non-profit organization, since 2007. | | Asset Allocation Trust |
Michael S. Scofield
(Born 1943) | | Trustee, since 2010 | | Served on the Investment Company Institute’s Board of Governors and Executive Committee from 2008-2011 as well the Governing Council of the Independent Directors Council from 2006-2011 and the Independent Directors Council Executive Committee from 2008-2011. Chairman of the IDC from 2008-2010. Institutional Investor (Fund Directions) Trustee of Year in 2007. Trustee of the Evergreen Funds complex (and its predecessors) from 1984 to 2010. Chairman of the Evergreen Funds from 2000-2010. Former Trustee of the Mentor Funds. Retired Attorney, Law Offices of Michael S. Scofield. | | Asset Allocation Trust |
| * | Length of service dates reflect the Trustee’s commencement of service with the Trust’s predecessor entities, where applicable. |
Officers
| | | | | | |
Name and year of birth | | Position held and
length of service | | Principal occupations during past five years or longer | | |
Karla M. Rabusch
(Born 1959) | | President, since 2003 | | Executive Vice President of Wells Fargo Bank, N.A. and President of Wells Fargo Funds Management, LLC since 2003. | | |
Nancy Wiser1
(Born 1967) | | Treasurer, since 2012 | | Executive Vice President of Wells Fargo Funds Management, LLC since 2011. Chief Operating Officer and Chief Compliance Officer at LightBox Capital Management LLC, from 2008 to 2011. | | |
C. David Messman
(Born 1960) | | Secretary, since 2000; Chief Legal Officer, since 2003 | | Senior Vice President and Secretary of Wells Fargo Funds Management, LLC since 2001. Assistant General Counsel of Wells Fargo Bank, N.A. since 2013 and Vice President and Managing Counsel of Wells Fargo Bank, N.A. from 1996 to 2013. | | |
Michael Whitaker
(Born 1967) | | Chief Compliance Officer, since 2016* | | Executive Vice President of Wells Fargo Funds Management, LLC since 2016. Chief Compliance Officer of Fidelity’s Fixed Income Funds and Asset Allocation Funds from 2008 to 2016, Compliance Officer of FMR Co., Inc. from 2014 to 2016, Fidelity Investments Money Management, Inc. from 2014 to 2016, Fidelity Investments from 2007 to 2016. | | |
David Berardi
(Born 1975) | | Assistant Treasurer, since 2009 | | Vice President of Wells Fargo Funds Management, LLC since 2009. Vice President of Evergreen Investment Management Company, LLC from 2008 to 2010. Manager of Fund Reporting and Control for Evergreen Investment Management Company, LLC from 2004 to 2010. | | |
Jeremy DePalma1
(Born 1974) | | Assistant Treasurer, since 2009 | | Senior Vice President of Wells Fargo Funds Management, LLC since 2009. Senior Vice President of Evergreen Investment Management Company, LLC from 2008 to 2010 and head of the Fund Reporting and Control Team within Fund Administration from 2005 to 2010. | | |
| 1 | Nancy Wiser acts as Treasurer of 73 funds in the Fund Complex. Jeremy DePalma acts as Treasurer of 69 funds and Assistant Treasurer of 73 funds in the Fund Complex. |
| 2 | The Statement of Additional Information includes additional information about the Trustees and is available, without charge, upon request, by calling 1-800-222-8222 or by visiting the website at wellsfargofunds.com. |
| * | Michael Whitaker became Chief Compliance Officer effective May 16, 2016. |
| | | | |
| 30 | | Wells Fargo Small Cap Core Fund | | List of abbreviations |
The following is a list of common abbreviations for terms and entities that may have appeared in this report.
| ACA | — ACA Financial Guaranty Corporation |
| ADR | — American depositary receipt |
| ADS | — American depositary shares |
| AGC | — Assured Guaranty Corporation |
| AGM | — Assured Guaranty Municipal |
| Ambac | — Ambac Financial Group Incorporated |
| AMT | — Alternative minimum tax |
| BAN | — Bond anticipation notes |
| BHAC | — Berkshire Hathaway Assurance Corporation |
| CAB | — Capital appreciation bond |
| CCAB | — Convertible capital appreciation bond |
| CDA | — Community Development Authority |
| CDO | — Collateralized debt obligation |
| DRIVER | — Derivative inverse tax-exempt receipts |
| DW&P | — Department of Water & Power |
| DWR | — Department of Water Resources |
| ECFA | — Educational & Cultural Facilities Authority |
| EDA | — Economic Development Authority |
| EDFA | — Economic Development Finance Authority |
| ETF | — Exchange-traded fund |
| FDIC | — Federal Deposit Insurance Corporation |
| FFCB | — Federal Farm Credit Banks |
| FGIC | — Financial Guaranty Insurance Corporation |
| FHA | — Federal Housing Administration |
| FHLB | — Federal Home Loan Bank |
| FHLMC | — Federal Home Loan Mortgage Corporation |
| FICO | — The Financing Corporation |
| FNMA | — Federal National Mortgage Association |
| GDR | — Global depositary receipt |
| GNMA | — Government National Mortgage Association |
| HCFR | — Healthcare facilities revenue |
| HEFA | — Health & Educational Facilities Authority |
| HEFAR | — Higher education facilities authority revenue |
| HFA | — Housing Finance Authority |
| HFFA | — Health Facilities Financing Authority |
| HUD | — Department of Housing and Urban Development |
| IDA | — Industrial Development Authority |
| IDAG | — Industrial Development Agency |
| KRW | — Republic of Korea won |
| LIBOR | — London Interbank Offered Rate |
| LIFER | — Long Inverse Floating Exempt Receipts |
| LLC | — Limited liability company |
| LLLP | — Limited liability limited partnership |
| LLP | — Limited liability partnership |
| MBIA | — Municipal Bond Insurance Association |
| MFHR | — Multifamily housing revenue |
| MSTR | — Municipal securities trust receipts |
| MUD | — Municipal Utility District |
| National | — National Public Finance Guarantee Corporation |
| PCFA | — Pollution Control Financing Authority |
| PCL | — Public Company Limited |
| PCR | — Pollution control revenue |
| PFA | — Public Finance Authority |
| PFFA | — Public Facilities Financing Authority |
| PFOTER | — Puttable floating option tax-exempt receipts |
| plc | — Public limited company |
| PUTTER | — Puttable tax-exempt receipts |
| R&D | — Research & development |
| Radian | — Radian Asset Assurance |
| RAN | — Revenue anticipation notes |
| RDA | — Redevelopment Authority |
| RDFA | — Redevelopment Finance Authority |
| REIT | — Real estate investment trust |
| ROC | — Reset option certificates |
| SAVRS | — Select auction variable rate securities |
| SBA | — Small Business Authority |
| SDR | — Swedish depositary receipt |
| SFHR | — Single-family housing revenue |
| SFMR | — Single-family mortgage revenue |
| SPA | — Standby purchase agreement |
| SPDR | — Standard & Poor’s Depositary Receipts |
| SPEAR | — Short Puttable Exempt Adjustable Receipts |
| STRIPS | — Separate trading of registered interest and |
| TAN | — Tax anticipation notes |
| TIPS | — Treasury inflation-protected securities |
| TRAN | — Tax revenue anticipation notes |
| TTFA | — Transportation Trust Fund Authority |
| TVA | — Tennessee Valley Authority |
This page is intentionally left blank.
This page is intentionally left blank.

For more information
More information about Wells Fargo Funds is available free upon request. To obtain literature, please write, email, visit the Fund’s website, or call:
Wells Fargo Funds
P.O. Box 8266
Boston, MA 02266-8266
Email: fundservice@wellsfargo.com
Website: wellsfargofunds.com
Individual investors: 1-800-222-8222
Retail investment professionals: 1-888-877-9275
Institutional investment professionals: 1-866-765-0778
This report and the financial statements contained herein are submitted for the general information of the shareholders of the Fund. If this report is used for promotional purposes, distribution of the report must be accompanied or preceded by a current prospectus. Before investing, please consider the investment objectives, risks, charges, and expenses of the investment. For a current prospectus and, if available, a summary prospectus, containing this information, call 1-800-222-8222 or visit the Fund’s website at wellsfargofunds.com. Read the prospectus carefully before you invest or send money.
Wells Fargo Asset Management (WFAM) is a trade name used by the asset management businesses of Wells Fargo & Company. Wells Fargo Funds Management, LLC, a wholly owned subsidiary of Wells Fargo & Company, provides investment advisory and administrative services for Wells Fargo Funds. Other affiliates of Wells Fargo & Company provide subadvisory and other services for the funds. The funds are distributed by Wells Fargo Funds Distributor, LLC, Member FINRA, an affiliate of Wells Fargo & Company.
NOT FDIC INSURED ¡ NO BANK GUARANTEE ¡ MAY LOSE VALUE
© 2016 Wells Fargo Funds Management, LLC. All rights reserved.
| | |
 | | 244410 08-16 A269/AR269 6-16 |
Annual Report
June 30, 2016

Wells Fargo Strategic Municipal Bond Fund


Reduce clutter. Save trees.
Sign up for electronic delivery of prospectuses and shareholder reports at wellsfargo.com/advantagedelivery
Contents
The views expressed and any forward-looking statements are as of June 30, 2016, unless otherwise noted, and are those of the Fund managers and/or Wells Fargo Funds Management, LLC. Discussions of individual securities, or the markets generally, or any Wells Fargo Fund are not intended as individual recommendations. Future events or results may vary significantly from those expressed in any forward-looking statements. The views expressed are subject to change at any time in response to changing circumstances in the market. Wells Fargo Funds Management, LLC and the Fund disclaim any obligation to publicly update or revise any views expressed or forward-looking statements.
NOT FDIC INSURED ¡ NO BANK GUARANTEE ¡ MAY LOSE VALUE
| | | | |
| 2 | | Wells Fargo Strategic Municipal Bond Fund | | Letter to shareholders (unaudited) |

Karla M. Rabusch
President
Wells Fargo Funds
In fact, yields on municipal bonds that matured in 10 years or more experienced yield declines of more than 100 basis points (100 basis points equals 1.00%) during the reporting period.
Dear Valued Shareholder:
We are pleased to offer you this annual report for the Wells Fargo Strategic Municipal Bond Fund for the 12-month period that ended June 30, 2016. The U.S. Federal Reserve (Fed) began normalizing monetary policy, raising the federal funds rate to between 0.25% and 0.50% in December 2015. Short-term municipal bond yields rose, but yields on longer-term bonds declined. In fact, yields on municipal bonds that matured in 10 years or more experienced yield declines of more than 100 basis points (100 basis points equals 1.00%) during the reporting period. The Barclays Municipal Bond Index,1 a broad measure tracking investment-grade municipal bonds, returned 7.65% during the 12-month reporting period.
Monetary policy was accommodative.
The Fed continued an easy monetary policy in order to support the economy and the financial system. However, it raised the federal funds target rate in December because it believed the U.S. economy was strong enough to begin normalizing monetary policy. The European Central Bank cut all three of its short-term rates during the reporting period, increased its asset-purchase program from 60 billion euros per month to 80 billion, expanded the list of eligible securities to include investment-grade nonbank debt, and created a fund-to-lend program where banks could be paid to lend money. In Japan, the Bank of Japan maintained an aggressive monetary program aimed at combating deflation.
Despite accommodative central-bank policies that helped keep interest rates at ultra-low levels, there were periods of volatility. Early in 2016, weakness in certain emerging markets economies and commodities hurt riskier assets and a vote in June 2016 by the U.K. to exit the European Union set off another round of global uncertainty. Municipal bonds benefited because they are perceived as a safe-haven asset. In addition, investor demand for yield helped lower-rated debt outperform. The Barclays High Yield Municipal Bond Index2 returned 12.09% during the 12-month period that ended June 30, 2016.
Strong demand, modest supply, and solid credit fundamentals supported municipals.
Market technicals remained favorable. According to the Investment Company Institute, more than $33 billion was allocated to municipal mutual funds during the first half of 2016, which was more than double the inflows during all of 2015. Further, inflows during the second quarter of 2016 were the largest in nearly seven years. In contrast, less new supply helped make 2015 the fifth calendar year of negative net supply and supply in the first half of 2016 was about 4% less than the same period last year.
Municipal credit quality remained on an uptrend despite a number of high-profile negative credit situations. Idiosyncratic credit risks remain, however. With regard to Puerto Rico, the U.S. enacted legislation that prohibits bondholder lawsuits temporarily and instills a fiscal oversight board for Puerto Rico; Puerto Rico then declared a moratorium on paying its general obligation (GO) bonds and defaulted on $911 million in payments due (most of which were GOs) on July 1, 2016. The state of Illinois approved a six-month stopgap budget, a temporary but
| 1 | The Barclays Municipal Bond Index is an unmanaged index composed of long-term tax-exempt bonds with a minimum credit rating of Baa. You cannot invest directly in an index. |
| 2 | The Barclays High Yield Municipal Bond Index measures the non-investment-grade and nonrated U.S. dollar–denominated, fixed-rate, tax-exempt bond market within the 50 United States and four other qualifying regions (Washington, D.C.; Puerto Rico; Guam; and the Virgin Islands). The index allows state and local general obligation, revenue, insured, and prerefunded bonds; however, historically the index has been composed of mostly revenue bonds. You cannot invest directly in an index. |
| | | | | | |
| Letter to shareholders (unaudited) | | Wells Fargo Strategic Municipal Bond Fund | | | 3 | |
meaningful step. Under this stopgap budget for the state, the city of Chicago receives authority to raise property taxes for teacher pensions and low-income school districts would receive greater state funding. City of Chicago and school district debt rallied on the news.
Since the end of the financial crisis, structural changes in the fixed-income markets have reduced trading liquidity (the degree to which assets can be bought or sold without affecting the price). New regulations and capital requirements have caused traditional liquidity suppliers (banks and broker/dealers) to be more risk-averse and hold less inventory. Meanwhile, corporate-debt issuance has spiked as companies finance themselves at record-low yields, bond mutual funds hold larger amounts of this new debt supply, trading volumes are lower, and large trades are more difficult to execute. However, fixed-income markets appear to have functioned well over the past year with sufficient liquidity.
Don’t let short-term uncertainty derail long-term investment goals.
Periods of uncertainty can present challenges, but experience has taught us that maintaining long-term investment goals can be an effective way to plan for the future. To help you create a sound strategy based on your personal goals and risk tolerance, Wells Fargo Funds offers more than 100 mutual funds spanning a wide range of asset classes and investment styles. Although diversification cannot guarantee an investment profit or prevent losses, we believe it can be an effective way to manage investment risk and potentially smooth out overall portfolio performance. We encourage investors to know their investments and to understand that appropriate levels of risk-taking may unlock opportunities.
Thank you for choosing to invest in Wells Fargo Funds. We appreciate your confidence in us and remain committed to helping you meet your financial needs.
Sincerely,

Karla M. Rabusch
President
Wells Fargo Funds
Periods of uncertainty can present challenges, but experience has taught us that maintaining long-term investment goals can be an effective way to plan for the future.
For further information about your Fund, contact your investment professional, visit our website at wellsfargofunds.com, or call us directly at 1-800-222-8222. We are available 24 hours a day, 7 days a week.
| | | | |
| 4 | | Wells Fargo Strategic Municipal Bond Fund | | Performance highlights (unaudited) |
Investment objective
The Fund seeks current income exempt from regular federal income tax.
Manager
Wells Fargo Funds Management, LLC
Subadviser
Wells Capital Management Incorporated
Portfolio managers
Wendy Casetta
Lyle J. Fitterer, CFA®, CPA
Robert Miller
Average annual total returns (%) as of June 30, 20161
| | | | | | | | | | | | | | | | | | | | | | | | | | | | | | | | | | |
| | | | | Including sales charge | | | Excluding sales charge | | | Expense ratios2 (%) | |
| | | Inception date | | 1 year | | | 5 year | | | 10 year | | | 1 year | | | 5 year | | | 10 year | | | Gross | | | Net3 | |
| Class A (VMPAX) | | 12-1-1994 | | | (0.46 | ) | | | 2.08 | | | | 2.79 | | | | 3.67 | | | | 2.93 | | | | 3.21 | | | | 0.81 | | | | 0.81 | |
| Class B (VMPIX)* | | 3-21-1985 | | | (2.09 | ) | | | 1.80 | | | | 2.67 | | | | 2.91 | | | | 2.16 | | | | 2.67 | | | | 1.56 | | | | 1.56 | |
| Class C (DHICX) | | 8-18-1997 | | | 1.78 | | | | 2.16 | | | | 2.44 | | | | 2.78 | | | | 2.16 | | | | 2.44 | | | | 1.56 | | | | 1.56 | |
| Administrator Class (VMPYX) | | 10-6-1997 | | | – | | | | – | | | | – | | | | 3.80 | | | | 3.09 | | | | 3.40 | | | | 0.75 | | | | 0.68 | |
| Institutional Class (STRIX) | | 11-30-2012 | | | – | | | | – | | | | – | | | | 4.02 | | | | 3.24 | | | | 3.48 | | | | 0.48 | | | | 0.48 | |
| Barclays Short-Intermediate Municipal Bond Index4 | | – | | | – | | | | – | | | | – | | | | 4.21 | | | | 3.03 | | | | 4.07 | | | | – | | | | – | |
| * | | Class B shares are closed to investment, except in connection with the reinvestment of any distributions and permitted exchanges. |
Figures quoted represent past performance, which is no guarantee of future results, and do not reflect taxes that a shareholder may pay on fund distributions or the redemption of fund shares. Investment return and principal value of an investment will fluctuate so that an investor’s shares, when redeemed, may be worth more or less than their original cost. Performance shown without sales charges would be lower if sales charges were reflected. Current performance may be lower or higher than the performance data quoted, which assumes the reinvestment of dividends and capital gains. Current month-end performance is available on the Fund’s website,wellsfargofunds.com.
Index returns do not include transaction costs associated with buying and selling securities, any mutual fund fees or expenses, or any taxes. It is not possible to invest directly in an index.
For Class A shares, the maximum front-end sales charge is 4.00%. For Class B shares, the maximum contingent deferred sales charge is 5.00% For Class C shares, the maximum contingent deferred sales charge is 1.00%. Performance including a contingent deferred sales charge assumes the sales charge for the corresponding time period. Administrator Class and Institutional Class shares are sold without a front-end sales charge or contingent deferred sales charge.
Bond values fluctuate in response to the financial condition of individual issuers, general market and economic conditions, and changes in interest rates. Changes in market conditions and government policies may lead to periods of heightened volatility in the bond market and reduced liquidity for certain bonds held by the Fund. In general, when interest rates rise, bond values fall and investors may lose principal value. Interest-rate changes and their impact on the Fund and its share price can be sudden and unpredictable. High-yield securities have a greater risk of default and tend to be more volatile than higher-rated debt securities. The use of derivatives may reduce returns and/or increase volatility. Certain investment strategies tend to increase the total risk of an investment (relative to the broader market). The Fund is exposed to municipal securities risk. Consult the Fund’s prospectus for additional information on these and other risks. A portion of the Fund’s income may be subject to federal, state, and/or local income taxes or the Alternative Minimum Tax (AMT). Any capital gains distributions may be taxable.
Please see footnotes on page 5.
| | | | | | |
| Performance highlights (unaudited) | | Wells Fargo Strategic Municipal Bond Fund | | | 5 | |
|
| Growth of $10,000 investment as of June 30, 20165 |
|
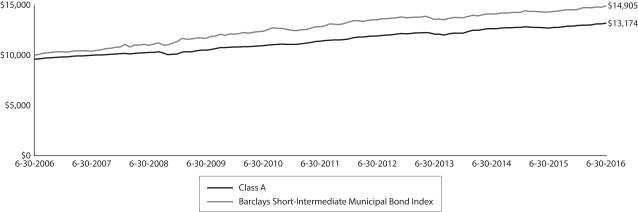 |
| 1 | Historical performance shown for the Institutional Class shares prior to their inception reflects the performance of the Administrator Class shares, and includes the higher expenses applicable to the Administrator Class shares. If these expenses had not been included, returns would be higher. Historical performance shown for all classes of the Fund prior to July 12, 2010, is based on the performance of the Fund’s predecessor, Evergreen Strategic Municipal Bond Fund. |
| 2 | Reflects the expense ratios as stated in the most recent prospectuses. The expense ratios shown are subject to change and may differ from the annualized expense ratios shown in the financial highlights of this report. |
| 3 | The manager has contractually committed through October 31, 2016, to waive fees and/or reimburse expenses to the extent necessary to cap the Fund’s Total Annual Fund Operating Expenses After Fee Waiver at 0.82% for Class A, 1.57% for Class B, 1.57% for Class C, 0.68% for Administrator Class, and 0.48% for Institutional Class. After this time, the cap may be increased or the commitment to maintain the cap may be terminated only with the approval of the Board of Trustees. Brokerage commissions, stamp duty fees, interest, taxes, acquired fund fees and expenses, and extraordinary expenses are excluded from the expense cap. Without this cap, the Fund’s returns would have been lower. |
| 4 | The Barclays Short-Intermediate Municipal Bond Index is a rules-based, market-value-weighted index composed of publicly traded municipal bonds that cover the U.S. dollar–denominated short-term tax-exempt bond market, including state and local general obligation bonds, revenue bonds, insured bonds, and prefunded bonds. You cannot invest directly in an index. |
| 5 | The chart compares the performance of Class A shares for the most recent ten years with the Barclays Short-Intermediate Municipal Bond Index. The chart assumes a hypothetical $10,000 investment in Class A shares and reflects all operating expenses and assumes the maximum initial sales charge of 4.00%. |
| 6 | Amounts are calculated based on the total investments of the Fund. These amounts are subject to change and may have changed since the date specified. |
| 7 | The credit quality distribution of portfolio holdings reflected in the chart is based on ratings from Standard & Poor’s, Moody’s Investors Service, and/or Fitch Ratings Ltd. Credit quality ratings apply to the underlying holdings of the Fund and not to the Fund itself. The percentages of the Fund’s portfolio with the ratings depicted in the chart are calculated based on the total market value of fixed income securities held by the Fund. If a security was rated by all three rating agencies, the middle rating was utilized. If rated by two of three rating agencies, the lower rating was utilized, and if rated by one of the rating agencies, that rating was utilized. Standard & Poor’s rates the creditworthiness of bonds, ranging from AAA (highest) to D (lowest). Ratings from A to CCC may be modified by the addition of a plus (+) or minus (-) sign to show relative standing within the rating categories. Standard & Poor’s rates the creditworthiness of short-term notes from SP-1 (highest) to SP-3 (lowest). Moody’s rates the creditworthiness of bonds, ranging from Aaa (highest) to C (lowest). Ratings Aa to B may be modified by the addition of a number 1 (highest) to 3 (lowest) to show relative standing within the ratings categories. Moody’s rates the creditworthiness of short-term U.S. tax-exempt municipal securities from MIG 1/VMIG 1 (highest) to SG (lowest). Fitch rates the creditworthiness of bonds, ranging from AAA (highest) to D (lowest). Credit quality distribution is subject to change and may have changed since the date specified. |
| | | | |
| 6 | | Wells Fargo Strategic Municipal Bond Fund | | Performance highlights (unaudited) |
MANAGER’S DISCUSSION
Fund highlights
| n | | The Fund underperformed its benchmark, the Barclays Short-Intermediate Municipal Bond Index, for the 12-month period that ended June 30, 2016. |
| n | | We extended the Fund’s duration at the beginning of the period but remained short relative to the benchmark. As interest rates fell, we reduced the Fund’s interest-rate exposure and ended the period at the lower end of our targeted range. A short duration detracted from results as yields fell. |
| n | | Investors continued their search for income in this low-yield environment, which caused lower-quality bonds to perform very well. The Fund’s overweight to A-rated, BBB-rated, and out-of-benchmark below-investment-grade debt was the biggest contributor to returns. |
| n | | Sector allocation and security selection within the better-performing local general obligation (GO), education, and corporate-backed sectors contributed to results, whereas allocations to the health care and electric revenue sectors detracted. |
|
| Effective maturity distribution as of June 30, 20166 |
|
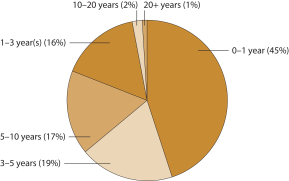 |
With the U.S. Federal Reserve (Fed) poised to normalize its interest-rate policy, shorter-term maturities appeared less attractive at the beginning of the reporting period due to a potential backup in short-term yields. However, subdued inflation expectations, due in part to low oil prices, combined with a fragile European economy and softening Chinese economy, implied that longer maturities would outperform. We, therefore, extended the Fund’s duration in anticipation of lower yields and also positioned the Fund for a flatter yield curve. The Fund’s yield-curve positioning, which was underweight maturities between one and four years and overweight the seven-year and greater area, helped results. Longer-term maturities outperformed shorter-term maturities by a wide margin because the municipal curve flattened almost 115 basis points (bps; 100 bps equals 1.00%) between the 1- and 10-year maturities.
The Fed tightened in December 2015 but signaled that the pace of further increases would be gradual. While the Fed was likely to take its time raising rates, U.S. inflation started to trend higher, unemployment remained below 5%, and economic growth was expected to remain at or above 2%, and we reduced duration as the market rallied. The Fund’s short duration hurt results because yields continued to decline. By the end of the reporting period, the Fund’s duration was about 1.5 years.
|
| Credit quality as of June 30, 20167 |
|
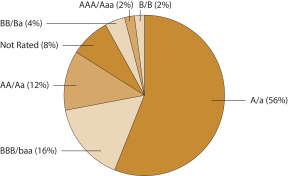 |
Credit-quality allocation helped results.
The Fund’s overweight to A-rated and BBB-rated debt and its out-of-benchmark holdings in high-yield and nonrated debt contributed to results because lower-rated bonds outperformed higher-quality bonds by a wide margin during the period. The Fund’s holdings within the local GO, education, and corporate-backed sectors contributed to results. On the other hand, issue selection within the health care and electric revenue sectors detracted from results. We have been cautious within the health care sector for quite some time because we believe credit fundamentals have peaked. Overweight allocations to Illinois and New Jersey, two of the
Please see footnotes on page 5.
| | | | | | |
| Performance highlights (unaudited) | | Wells Fargo Strategic Municipal Bond Fund | | | 7 | |
best-performing states, helped results, while an underweight to California also benefited results because the state lagged the broader index. Although taxable corporate bond spreads increased dramatically during late 2015 and early 2016 as global fears spooked the market, spreads for corporate-backed municipal debt declined. We put on a relative-value trade by selling some corporate-backed municipal debt into this rally and buying taxable corporate debt. Corporate debt spreads then narrowed between February and May 2016, and we sold most of these taxable issues by the end of the reporting period.
Political noise and a lack of a state budget caused volatility within Illinois, but the state’s bonds had some of the highest returns. We have been overweight Illinois bonds for several years because we feel that the above-market income is compensating investors for the credit issues. We continue to believe that the state’s economic backdrop and ability to raise revenues, combined with Illinois Governor Bruce Rauner’s focus on cutting expenses, should ultimately lead to tighter spreads. New Jersey bonds also performed well as spreads tightened; however, issue selection within the state detracted from results, primarily due to our exposure to longer-dated floating-rate notes that repriced to reflect a protracted rate-hike cycle. During the past 12 months, Puerto Rico had several widely anticipated defaults on its debt. The lack of clarity surrounding the federal government’s restructuring legislation for Puerto Rico debt, the lack of financial statements, and a declining economy make it very hard to develop an investment opinion for the territory. As a result, we had minimal exposure to Puerto Rico bonds.
Rates may be lower for longer, making credit allocation and issue selection even more important.
Near the end of the reporting period, the U.K. voted to withdraw from the European Union, prompting considerable uncertainty about future political situations, financial markets, and economic growth. U.S. Treasuries and municipal bonds rallied significantly on the news, and both 10-year and 30-year municipal yields reached record-low levels. Although we think rates may stay lower for longer, we recognize that an improvement in overseas economies, outflows in mutual funds, or a more hawkish tone from the Fed could lead to a spike in rates. However, if the U.S. economy does weaken materially, this could be the catalyst for us to increase our duration exposure and reduce our credit exposure. In this record-low interest-rate environment, security selection is even more important as breakeven yields (the sell-off that a bond can endure before the total return drops to zero) decrease.
Please see footnotes on page 5.
| | | | |
| 8 | | Wells Fargo Strategic Municipal Bond Fund | | Fund expenses (unaudited) |
As a shareholder of the Fund, you incur two types of costs: (1) transaction costs, including sales charges (loads) on purchase payments and contingent deferred sales charges (if any) on redemptions and (2) ongoing costs, including management fees, distribution (12b-1) and/or shareholder servicing fees, and other Fund expenses. This example is intended to help you understand your ongoing costs (in dollars) of investing in the Fund and to compare these costs with the ongoing costs of investing in other mutual funds.
The example is based on an investment of $1,000 invested at the beginning of the six-month period and held for the entire period from January 1, 2016 to June 30, 2016.
Actual expenses
The “Actual” line of the table below provides information about actual account values and actual expenses. You may use the information in this line, together with the amount you invested, to estimate the expenses that you paid over the period. Simply divide your account value by $1,000 (for example, an $8,600 account value divided by $1,000 = 8.6), then multiply the result by the number in the “Actual” line under the heading entitled “Expenses paid during period” for your applicable class of shares to estimate the expenses you paid on your account during this period.
Hypothetical example for comparison purposes
The “Hypothetical” line of the table below provides information about hypothetical account values and hypothetical expenses based on the Fund’s actual expense ratio and an assumed rate of return of 5% per year before expenses, which is not the Fund’s actual return. The hypothetical account values and expenses may not be used to estimate the actual ending account balance or expenses you paid for the period. You may use this information to compare the ongoing costs of investing in the Fund and other funds. To do so, compare this 5% hypothetical example with the 5% hypothetical examples that appear in the shareholder reports of the other funds.
Please note that the expenses shown in the table are meant to highlight your ongoing costs only and do not reflect any transactional costs, such as sales charges (loads) and contingent deferred sales charges. Therefore, the “Hypothetical” line of the table is useful in comparing ongoing costs only and will not help you determine the relative total costs of owning different funds. In addition, if these transactional costs were included, your costs would have been higher.
| | | | | | | | | | | | | | | | |
| | | Beginning
account value
1-1-2016 | | | Ending
account value
6-30-2016 | | | Expenses
paid during
the period¹ | | | Net annualized
expense ratio | |
Class A | | | | | | | | | | | | | | | | |
Actual | | $ | 1,000.00 | | | $ | 1,016.94 | | | $ | 4.03 | | | | 0.80 | % |
Hypothetical (5% return before expenses) | | $ | 1,000.00 | | | $ | 1,020.87 | | | $ | 4.04 | | | | 0.80 | % |
Class B | | | | | | | | | | | | | | | | |
Actual | | $ | 1,000.00 | | | $ | 1,014.31 | | | $ | 7.78 | | | | 1.55 | % |
Hypothetical (5% return before expenses) | | $ | 1,000.00 | | | $ | 1,017.14 | | | $ | 7.79 | | | | 1.55 | % |
Class C | | | | | | | | | | | | | | | | |
Actual | | $ | 1,000.00 | | | $ | 1,013.13 | | | $ | 7.78 | | | | 1.55 | % |
Hypothetical (5% return before expenses) | | $ | 1,000.00 | | | $ | 1,017.14 | | | $ | 7.79 | | | | 1.55 | % |
Administrator Class | | | | | | | | | | | | | | | | |
Actual | | $ | 1,000.00 | | | $ | 1,018.70 | | | $ | 3.41 | | | | 0.68 | % |
Hypothetical (5% return before expenses) | | $ | 1,000.00 | | | $ | 1,021.48 | | | $ | 3.42 | | | | 0.68 | % |
Institutional Class | | | | | | | | | | | | | | | | |
Actual | | $ | 1,000.00 | | | $ | 1,018.61 | | | $ | 2.38 | | | | 0.47 | % |
Hypothetical (5% return before expenses) | | $ | 1,000.00 | | | $ | 1,022.51 | | | $ | 2.38 | | | | 0.47 | % |
| 1 | Expenses paid is equal to the annualized expense ratio of each class multiplied by the average account value over the period, multiplied by the number of days in the most recent fiscal half-year divided by the number of days in the fiscal year (to reflect the one-half-year period). |
| | | | | | |
| Portfolio of investments—June 30, 2016 | | Wells Fargo Strategic Municipal Bond Fund | | | 9 | |
| | | | | | | | | | | | | | | | |
| Security name | | Interest rate | | | Maturity date | | | Principal | | | Value | |
| | | | |
Municipal Obligations: 94.98% | | | | | | | | | | | | | | | | |
| | | | |
| Alabama: 0.40% | | | | | | | | | | | | | | | | |
Chatom AL Industrial Development Board Solid Waste Disposal (Utilities Revenue) | | | 4.00 | % | | | 8-1-2016 | | | $ | 1,875,000 | | | $ | 1,880,100 | |
Jefferson County AL Series A (GO Revenue) | | | 4.90 | | | | 4-1-2021 | | | | 5,325,000 | | | | 5,698,016 | |
| | | | |
| | | | | | | | | | | | | | | 7,578,116 | |
| | | | | | | | | | | | | | | | |
| | | | |
| Alaska: 0.94% | | | | | | | | | | | | | | | | |
Alaska Housing Finance Corporation Series A (Housing Revenue, Landesbank Baden-Wuerttemberg SPA) ø | | | 0.43 | | | | 12-1-2041 | | | | 10,000,000 | | | | 10,000,000 | |
Alaska Industrial Development & Export Authority Power Refunding Bonds Snettisham Hydroelectric Project Series 2015 (Utilities Revenue) | | | 5.00 | | | | 1-1-2022 | | | | 1,200,000 | | | | 1,384,680 | |
Alaska Industrial Development & Export Authority Power Refunding Bonds Snettisham Hydroelectric Project Series 2015 (Utilities Revenue) | | | 5.00 | | | | 1-1-2023 | | | | 1,545,000 | | | | 1,813,954 | |
Valdez AK Marine Terminal BP Pipelines Project Series 2003B (Industrial Development Revenue) | | | 5.00 | | | | 1-1-2021 | | | | 4,000,000 | | | | 4,586,680 | |
| | | | |
| | | | | | | | | | | | | | | 17,785,314 | |
| | | | | | | | | | | | | | | | |
| | | | |
| Arizona: 2.04% | | | | | | | | | | | | | | | | |
Arizona Health Facilities Authority Banner Health Series B (Health Revenue, Bank of Tokyo-Mitsubishi LOC) ø | | | 0.42 | | | | 1-1-2046 | | | | 7,915,000 | | | | 7,915,000 | |
Arizona Sports & Tourism Authority Multipurpose Stadium Facility Project Series A (Tax Revenue) | | | 4.00 | | | | 7-1-2017 | | | | 900,000 | | | | 926,325 | |
Florence AZ IDA Legacy Traditional School Project (Education Revenue) | | | 4.00 | | | | 7-1-2018 | | | | 515,000 | | | | 525,743 | |
Maricopa County AZ IDA Educational Horizon Community Learning Center Project (Education Revenue) | | | 2.63 | | | | 7-1-2021 | | | | 1,500,000 | | | | 1,507,710 | |
Navajo Nation Arizona Series A (Miscellaneous Revenue) 144A | | | 4.00 | | | | 12-1-2022 | | | | 6,345,000 | | | | 6,794,797 | |
Navajo Tribal Arizona Utility Authority (Miscellaneous Revenue, Municipal Government Guaranty Insured) | | | 4.00 | | | | 1-1-2021 | | | | 3,372,000 | | | | 3,470,631 | |
Phoenix AZ IDA Basis Schools Projects Series A (Education Revenue) 144A | | | 3.00 | | | | 7-1-2020 | | | | 1,300,000 | | | | 1,322,126 | |
Phoenix AZ IDA Great Hearts Academies Project (Education Revenue) | | | 5.20 | | | | 7-1-2022 | | | | 645,000 | | | | 695,478 | |
Phoenix AZ IDA Guam Facilities Foundation Incorporated Project Series 2014 (Industrial Development Revenue) | | | 5.00 | | | | 2-1-2017 | | | | 2,845,000 | | | | 2,888,073 | |
Phoenix AZ IDA Legacy Traditional School Project Series 2015 (Education Revenue) 144A | | | 3.00 | | | | 7-1-2020 | | | | 515,000 | | | | 520,042 | |
Pima County AZ IDA American Leadership Academy Project Series 2015 (Education Revenue) 144A | | | 4.60 | | | | 6-15-2025 | | | | 1,530,000 | | | | 1,614,318 | |
Pima County AZ IDA New Plan Learning Project Series A (Education Revenue) | | | 7.75 | | | | 7-1-2035 | | | | 1,000,000 | | | | 1,002,450 | |
Pima County AZ IDA New Plan Learning Project Series A (Education Revenue) | | | 8.13 | | | | 7-1-2041 | | | | 3,000,000 | | | | 3,009,090 | |
Pima County AZ IDA Noah Webster Schools Project Series A (Education Revenue) | | | 5.50 | | | | 12-15-2023 | | | | 1,070,000 | | | | 1,188,620 | |
Pima County AZ Industrial Development Charter School (Education Revenue) | | | 4.00 | | | | 7-1-2016 | | | | 395,000 | | | | 395,020 | |
Pima County AZ Industrial Development Charter School (Education Revenue) | | | 4.00 | | | | 7-1-2017 | | | | 1,125,000 | | | | 1,144,868 | |
Tempe AZ IDA Friendship Village Series A (Health Revenue) | | | 4.00 | | | | 12-1-2017 | | | | 220,000 | | | | 226,844 | |
Tempe AZ IDA Friendship Village Series A (Health Revenue) | | | 5.00 | | | | 12-1-2018 | | | | 800,000 | | | | 859,344 | |
Verrado AZ Community Facilities District #1 Series A (GO Revenue) 144A | | | 4.25 | | | | 7-15-2019 | | | | 1,320,000 | | | | 1,375,427 | |
Verrado AZ Community Facilities District #1 Series A (GO Revenue) 144A | | | 5.00 | | | | 7-15-2020 | | | | 700,000 | | | | 755,671 | |
Verrado AZ Community Facilities District #1 Series A (GO Revenue) 144A | | | 5.00 | | | | 7-15-2021 | | | | 500,000 | | | | 546,460 | |
| | | | |
| | | | | | | | | | | | | | | 38,684,037 | |
| | | | | | | | | | | | | | | | |
| | | | |
| Arkansas: 0.25% | | | | | | | | | | | | | | | | |
Boone County AR Hospital Construction Series 2006 (Health Revenue, BOKF NA LOC) ø | | | 0.62 | | | | 5-1-2037 | | | | 4,700,000 | | | | 4,700,000 | |
The accompanying notes are an integral part of these financial statements.
| | | | |
| 10 | | Wells Fargo Strategic Municipal Bond Fund | | Portfolio of investments—June 30, 2016 |
| | | | | | | | | | | | | | | | |
| Security name | | Interest rate | | | Maturity date | | | Principal | | | Value | |
| | | | |
| Arkansas (continued) | | | | | | | | | | | | | | | | |
Fort Smith AR Sales & Use Tax Improvement Bonds (Tax Revenue) | | | 2.38 | % | | | 5-1-2027 | | | $ | 20,000 | | | $ | 20,008 | |
| | | | |
| | | | | | | | | | | | | | | 4,720,008 | |
| | | | | | | | | | | | | | | | |
| | | | | | | | | | | | | | | | |
| | | | |
| California: 7.04% | | | | | | | | | | | | | | | | |
Alameda CA Corridor Transportation Authority Unrefunded CAB Sub Lien Series A (Transportation Revenue, Ambac Insured) ¤ | | | 0.00 | | | | 10-1-2017 | | | | 425,000 | | | | 418,910 | |
Alameda CA Corridor Transportation Authority Prerefunded CAB Sub Lien Series A (Transportation Revenue, Ambac Insured) ¤ | | | 0.00 | | | | 10-1-2017 | | | | 1,660,000 | | | | 1,645,326 | |
California Association of Bay Area Governments Financing Authority Series A (Health Revenue, Bank of America NA LOC) ø | | | 0.39 | | | | 8-1-2024 | | | | 4,525,000 | | | | 4,525,000 | |
California Bay Area Toll Authority Toll Bridge Series E-3 (Transportation Revenue) ± | | | 1.11 | | | | 4-1-2047 | | | | 11,600,000 | | | | 11,600,464 | |
California CDA Tender Option Bond Trust Receipts Series ZF0199 (Health Revenue, JPMorgan Chase & Company LIQ) 144Aø | | | 0.61 | | | | 10-1-2020 | | | | 4,805,000 | | | | 4,805,000 | |
California Golden State Tobacco Securitization Series 2954 (Tobacco Revenue, Morgan Stanley Bank LIQ) 144Aø | | | 0.96 | | | | 6-1-2047 | | | | 25,000,000 | | | | 25,000,000 | |
California HFFA Catholic Healthcare West Series 2005-H (Health Revenue, Sumitomo Mitsui Banking LOC) ø | | | 0.39 | | | | 7-1-2035 | | | | 11,000,000 | | | | 11,000,000 | |
California Infrastructure & Economic Development Bank Colburn School Series B (Education Revenue) ± | | | 1.61 | | | | 8-1-2037 | | | | 6,325,000 | | | | 6,344,987 | |
California Infrastructure & Economic Development Bank Museum Art Project Series A (Miscellaneous Revenue) ± | | | 2.06 | | | | 12-1-2037 | | | | 3,000,000 | | | | 3,056,430 | |
California PCFA Refunding Bond Pacific Gas & Electric Company Series D (Industrial Development Revenue, FGIC Insured) | | | 4.75 | | | | 12-1-2023 | | | | 1,515,000 | | | | 1,567,177 | |
California PCFA Series A (Resource Recovery Revenue) 144A± | | | 0.90 | | | | 8-1-2023 | | | | 15,405,000 | | | | 15,405,308 | |
California Refunding Bond Series B (GO Revenue) ± | | | 1.31 | | | | 5-1-2018 | | | | 3,000,000 | | | | 3,017,160 | |
California Statewide CDA Eskaton Properties Incorporated (Health Revenue) | | | 5.00 | | | | 11-15-2017 | | | | 1,130,000 | | | | 1,183,087 | |
California Statewide CDA Eskaton Properties Incorporated (Health Revenue) | | | 5.00 | | | | 11-15-2018 | | | | 1,060,000 | | | | 1,142,616 | |
California Student Education Loan Marketing Corporation Series IV-D1 (Education Revenue) | | | 5.88 | | | | 1-1-2018 | | | | 2,370,000 | | | | 2,369,716 | |
California Various Purpose Bonds (Miscellaneous Revenue) | | | 6.25 | | | | 10-1-2019 | | | | 15,000 | | | | 15,229 | |
Chemehuevi Indian Tribe California (Miscellaneous Revenue) | | | 2.00 | | | | 7-15-2017 | | | | 5,935,440 | | | | 5,941,079 | |
Delhi CA Unified School District CAB (GO Revenue, Ambac Insured) ¤ | | | 0.00 | | | | 8-1-2019 | | | | 1,975,000 | | | | 1,760,554 | |
Grossmont CA Union High School District Floaters Series 2015 (GO Revenue, Citibank NA LIQ) 144Aø | | | 0.56 | | | | 2-1-2017 | | | | 7,525,000 | | | | 7,525,000 | |
Los Angeles County CA Schools Regionalized Business Services CAB Series A (Miscellaneous Revenue, Ambac Insured) ¤ | | | 0.00 | | | | 8-1-2016 | | | | 1,945,000 | | | | 1,943,347 | |
Northern California Gas Authority #1 LIBOR Series B (Utilities Revenue) ± | | | 1.14 | | | | 7-1-2027 | | | | 11,805,000 | | | | 10,769,820 | |
Northern California Power Agency Hydroelectric Project Series A (Utilities Revenue, Bank of Montreal LOC) ø | | | 0.39 | | | | 7-1-2032 | | | | 2,000,000 | | | | 2,000,000 | |
Riverside CA Tender Option Bond Trust Receipts Series 2016 (GO Revenue, AGM/National Insured, Bank of America NA LIQ) 144Aø | | | 0.65 | | | | 8-1-2032 | | | | 6,920,000 | | | | 6,920,000 | |
San Buenaventura CA Community Memorial Health System (Health Revenue) | | | 5.25 | | | | 12-1-2017 | | | | 1,455,000 | | | | 1,524,069 | |
San Buenaventura CA Community Memorial Health System (Health Revenue) | | | 5.75 | | | | 12-1-2018 | | | | 2,110,000 | | | | 2,298,887 | |
| | | | |
| | | | | | | | | | | | | | | 133,779,166 | |
| | | | | | | | | | | | | | | | |
| | | | |
| Colorado: 1.24% | | | | | | | | | | | | | | | | |
Colorado ECFA Rocky Mountain Classical Academy Project (Education Revenue) | | | 6.38 | | | | 9-1-2023 | | | | 2,115,000 | | | | 2,205,437 | |
Colorado ECFA Vanguard School Project (Education Revenue) | | | 4.00 | | | | 6-15-2021 | | | | 250,000 | | | | 276,782 | |
Colorado ECFA Vanguard School Project (Education Revenue) | | | 4.00 | | | | 6-15-2022 | | | | 515,000 | | | | 575,317 | |
The accompanying notes are an integral part of these financial statements.
| | | | | | |
| Portfolio of investments—June 30, 2016 | | Wells Fargo Strategic Municipal Bond Fund | | | 11 | |
| | | | | | | | | | | | | | | | |
| Security name | | Interest rate | | | Maturity date | | | Principal | | | Value | |
| | | | |
| Colorado (continued) | | | | | | | | | | | | | | | | |
Colorado Health Facilities Authority Series C (Health Revenue) ± | | | 0.39 | % | | | 12-1-2045 | | | $ | 5,000,000 | | | $ | 5,000,000 | |
Colorado Health Facilities Authority Unrefunded Balance (Health Revenue) | | | 5.25 | | | | 6-1-2024 | | | | 980,000 | | | | 983,391 | |
Colorado Springs CO Utilities System Sub Lien Improvement Series B (Utilities Revenue, Bayerische Landesbank SPA) ø | | | 0.56 | | | | 11-1-2036 | | | | 11,400,000 | | | | 11,400,000 | |
Fountain CO Urban Renewal Authority South Academy Highlands Project Series 2015-A (Tax Revenue) | | | 4.50 | | | | 11-1-2029 | | | | 2,855,000 | | | | 3,152,405 | |
| | | | |
| | | | | | | | | | | | | | | 23,593,332 | |
| | | | | | | | | | | | | | | | |
| | | | |
| Connecticut: 3.21% | | | | | | | | | | | | | | | | |
Connecticut Economic Recovery Notes Series A-4 (GO Revenue) ø | | | 0.65 | | | | 1-1-2018 | | | | 13,000,000 | | | | 13,000,000 | |
Connecticut HEFA Bridgeport Hospital Series D (Health Revenue) | | | 5.00 | | | | 7-1-2017 | | | | 1,070,000 | | | | 1,113,474 | |
Connecticut HEFA Bridgeport Hospital Series D (Health Revenue) | | | 5.00 | | | | 7-1-2020 | | | | 500,000 | | | | 575,945 | |
Connecticut HEFA Yale University Series Z-1 (Education Revenue) | | | 5.00 | | | | 7-1-2042 | | | | 1,724,000 | | | | 1,724,224 | |
Connecticut Series A (Miscellaneous Revenue) ± | | | 1.14 | | | | 3-1-2021 | | | | 4,990,000 | | | | 4,943,543 | |
Connecticut Series A (Miscellaneous Revenue) ± | | | 1.29 | | | | 4-15-2018 | | | | 5,000,000 | | | | 5,007,750 | |
Connecticut Series A (Miscellaneous Revenue) ± | | | 1.31 | | | | 5-15-2018 | | | | 2,000,000 | | | | 2,004,340 | |
Connecticut Series A (Miscellaneous Revenue) ± | | | 1.66 | | | | 4-15-2020 | | | | 7,000,000 | | | | 7,071,610 | |
Connecticut Series A (Miscellaneous Revenue) ± | | | 1.76 | | | | 3-1-2019 | | | | 4,050,000 | | | | 4,050,000 | |
Connecticut Series D (GO Revenue) ± | | | 1.18 | | | | 9-15-2018 | | | | 1,000,000 | | | | 999,610 | |
Connecticut Series D (GO Revenue) ± | | | 1.33 | | | | 9-15-2019 | | | | 3,345,000 | | | | 3,369,485 | |
Hamden CT Refunding Bond (GO Revenue) | | | 5.00 | | | | 8-15-2019 | | | | 1,835,000 | | | | 2,033,749 | |
Hartford CT EDA Series B (Transportation Revenue, Bank of America NA SPA) ø | | | 0.53 | | | | 6-15-2034 | | | | 15,100,000 | | | | 15,100,000 | |
| | | | |
| | | | | | | | | | | | | | | 60,993,730 | |
| | | | | | | | | | | | | | | | |
| | | | |
| Delaware: 0.11% | | | | | | | | | | | | | | | | |
Delaware EDA Odyssey Charter School Project Series A (Education Revenue) 144A | | | 6.25 | | | | 9-1-2025 | | | | 2,035,000 | | | | 2,109,115 | |
| | | | | | | | | | | | | | | | |
| | | | |
| Florida: 3.86% | | | | | | | | | | | | | | | | |
Brevard County FL Space Coast Infrastructure Agency I-95 Project (Industrial Development Revenue) | | | 4.00 | | | | 6-15-2018 | | | | 5,000,000 | | | | 5,279,350 | |
Eustis FL Multi-Purpose Series A (Miscellaneous Revenue, SunTrust Bank LOC) ø | | | 0.50 | | | | 12-1-2027 | | | | 605,000 | | | | 605,000 | |
Florida Cityplace Community Development District Special Assessment (Miscellaneous Revenue) | | | 5.00 | | | | 5-1-2017 | | | | 500,000 | | | | 514,210 | |
Florida Cityplace Community Development District Special Assessment (Miscellaneous Revenue) | | | 5.00 | | | | 5-1-2018 | | | | 1,375,000 | | | | 1,456,139 | |
Florida Mid-Bay Bridge Authority Series B (Transportation Revenue) | | | 5.00 | | | | 10-1-2016 | | | | 2,000,000 | | | | 2,022,500 | |
Florida Village Community Development District #10 Special Assignment (Miscellaneous Revenue) | | | 5.13 | | | | 5-1-2024 | | | | 3,770,000 | | | | 4,374,331 | |
Lakeland FL Hospital System Lakeland Regional Health System (Health Revenue) | | | 5.00 | | | | 11-15-2022 | | | | 4,495,000 | | | | 5,337,678 | |
Manatee County FL HFA SFHR Series A (Housing Revenue, GNMA/FNMA/FHLMC Insured) | | | 6.57 | | | | 5-1-2039 | | | | 15,000 | | | | 15,807 | |
Miami FL Special Obligation (Miscellaneous Revenue, AGM Insured) | | | 5.00 | | | | 2-1-2017 | | | | 1,000,000 | | | | 1,024,740 | |
Miami-Dade County FL IDA Youth Charter Schools Project Series 2015A (Education Revenue) 144A | | | 5.00 | | | | 9-15-2025 | | | | 1,000,000 | | | | 1,051,920 | |
Miami-Dade County FL School Board Certificate of Participation Series 3 (Miscellaneous Revenue, Dexia Credit Local LOC, Ambac Insured, Dexia Credit Local LIQ) 144Aø | | | 0.84 | | | | 9-25-2024 | | | | 6,895,000 | | | | 6,895,000 | |
Miami-Dade County FL School Board Certificate of Participation Series 4 (Miscellaneous Revenue, Dexia Credit Local LOC, Dexia Credit Local LIQ) 144Aø | | | 0.78 | | | | 9-25-2024 | | | | 6,865,000 | | | | 6,865,000 | |
Miami-Dade County FL Seaport Department Series A (Airport Revenue, Bank of Tokyo-Mitsubishi LOC) ± | | | 0.42 | | | | 10-1-2050 | | | | 7,800,000 | | | | 7,800,000 | |
The accompanying notes are an integral part of these financial statements.
| | | | |
| 12 | | Wells Fargo Strategic Municipal Bond Fund | | Portfolio of investments—June 30, 2016 |
| | | | | | | | | | | | | | | | |
| Security name | | Interest rate | | | Maturity date | | | Principal | | | Value | |
| | | | |
| Florida (continued) | | | | | | | | | | | | | | | | |
North Brevard County FL Parrish Medical Center Project (Health Revenue) | | | 5.50 | % | | | 10-1-2018 | | | $ | 500,000 | | | $ | 542,150 | |
Orange County FL IDA Central Florida Kidney Center Project (Industrial Development Revenue, SunTrust Bank LOC) ø | | | 0.48 | | | | 12-1-2020 | | | | 3,250,000 | | | | 3,250,000 | |
Orange County FL Tourist Development Tax (Miscellaneous Revenue, Ambac/MBIA Insured) | | | 6.00 | | | | 10-1-2016 | | | | 85,000 | | | | 85,674 | |
Sumter County FL Village Community Development District #5 Special Assessment Bond Phase I (Miscellaneous Revenue) | | | 3.00 | | | | 5-1-2017 | | | | 545,000 | | | | 553,360 | |
Sumter County FL Village Community Development District #5 Special Assessment Bond Phase I (Miscellaneous Revenue) | | | 3.00 | | | | 5-1-2018 | | | | 565,000 | | | | 581,843 | |
Sumter County FL Village Community Development District #5 Special Assessment Bond Phase II (Miscellaneous Revenue) | | | 3.00 | | | | 5-1-2017 | | | | 780,000 | | | | 791,965 | |
Sumter County FL Village Community Development District #5 Special Assessment Bond Phase II (Miscellaneous Revenue) | | | 3.00 | | | | 5-1-2018 | | | | 805,000 | | | | 828,997 | |
Volusia County FL Eclipse Funding Trust Series 0036 (Miscellaneous Revenue, U.S. Bank NA LOC, AGM Insured, U.S. Bank NA LIQ) 144Aø | | | 0.39 | | | | 8-1-2032 | | | | 20,395,000 | | | | 20,395,000 | |
Volusia County FL School Board (Tax Revenue, AGM Insured) | | | 5.00 | | | | 10-1-2016 | | | | 3,055,000 | | | | 3,083,014 | |
| | | | |
| | | | | | | | | | | | | | | 73,353,678 | |
| | | | | | | | | | | | | | | | |
| | | | |
| Georgia: 1.49% | | | | | | | | | | | | | | | | |
Atlanta GA Water & Wastewater Project Series A-1 (Water & Sewer Revenue) ± | | | 1.80 | | | | 11-1-2038 | | | | 5,000,000 | | | | 5,078,650 | |
Burke County GA Development Authority Georgia Power Company Vogtle Plant Project Second Series 2012 (Utilities Revenue) ± | | | 1.75 | | | | 12-1-2049 | | | | 2,000,000 | | | | 2,016,480 | |
Burke County GA Development Authority Oglethorpe Power Corporation Vogtle Project Series A (Utilities Revenue) ± | | | 2.40 | | | | 1-1-2040 | | | | 5,720,000 | | | | 5,935,186 | |
Cherokee County GA Water & Sewage Authority (Water & Sewer Revenue, National Insured) | | | 6.90 | | | | 8-1-2018 | | | | 5,000 | | | | 5,027 | |
Floyd County GA PCR Georgia Power Company Plant Hammond Project (Utilities Revenue) ± | | | 2.35 | | | | 7-1-2022 | | | | 6,000,000 | | | | 6,249,300 | |
Gainesville & Hall County GA Hospital Authority Health System Project Series B (Health Revenue) ± | | | 1.34 | | | | 8-15-2035 | | | | 6,000,000 | | | | 5,992,620 | |
Georgia Private Colleges & Universities Authority (Education Revenue) | | | 5.00 | | | | 10-1-2019 | | | | 1,325,000 | | | | 1,485,113 | |
Georgia Road & Tollway Authority I-75 S Express Lanes Project Series A (Transportation Revenue) 144A¤ | | | 0.00 | | | | 6-1-2024 | | | | 2,500,000 | | | | 1,645,700 | |
| | | | |
| | | | | | | | | | | | | | | 28,408,076 | |
| | | | | | | | | | | | | | | | |
| | | | |
| Guam: 0.13% | | | | | | | | | | | | | | | | |
Guam Government Waterworks Authority Water & Wastewater System Series 2010 (Water & Sewer Revenue) | | | 4.00 | | | | 7-1-2016 | | | | 1,255,000 | | | | 1,255,113 | |
Guam Government Waterworks Authority Water & Wastewater System Series 2014A (Water & Sewer Revenue) | | | 5.00 | | | | 7-1-2020 | | | | 1,000,000 | | | | 1,136,320 | |
| | | | |
| | | | | | | | | | | | | | | 2,391,433 | |
| | | | | | | | | | | | | | | | |
| | | | |
| Hawaii: 0.57% | | | | | | | | | | | | | | | | |
Hawaii Department of Budget and Finance Queens Health System Series B (Health Revenue) ± | | | 0.88 | | | | 7-1-2039 | | | | 10,765,000 | | | | 10,765,000 | |
| | | | | | | | | | | | | | | | |
| | | | |
| Illinois: 15.52% | | | | | | | | | | | | | | | | |
Chicago IL Board of Education CAB School Reform Series B-1 (GO Revenue, National Insured) ¤ | | | 0.00 | | | | 12-1-2021 | | | | 10,255,000 | | | | 8,615,636 | |
Chicago IL Board of Education Dedicated Series C2 (GO Revenue) ± | | | 1.49 | | | | 3-1-2032 | | | | 9,900,000 | | | | 9,531,225 | |
Chicago IL Board of Education Refunding Bond Series A (GO Revenue) ± | | | 4.39 | | | | 3-1-2032 | | | | 7,000,000 | | | | 6,862,870 | |
The accompanying notes are an integral part of these financial statements.
| | | | | | |
| Portfolio of investments—June 30, 2016 | | Wells Fargo Strategic Municipal Bond Fund | | | 13 | |
| | | | | | | | | | | | | | | | |
| Security name | | Interest rate | | | Maturity date | | | Principal | | | Value | |
| | | | |
| Illinois (continued) | | | | | | | | | | | | | | | | |
Chicago IL Board of Education Series A3 (GO Revenue) ± | | | 1.22 | % | | | 3-1-2036 | | | $ | 17,200,000 | | | $ | 15,070,984 | |
Chicago IL CAB City Colleges Series 1999 (GO Revenue, National Insured) ¤ | | | 0.00 | | | | 1-1-2024 | | | | 9,975,000 | | | | 7,700,101 | |
Chicago IL Motor Fuel Tax Refunding Bonds Series 2013 (Tax Revenue) | | | 5.00 | | | | 1-1-2021 | | | | 1,450,000 | | | | 1,563,694 | |
Chicago IL Motor Fuel Tax Refunding Bonds Series 2013 (Tax Revenue) | | | 5.00 | | | | 1-1-2023 | | | | 2,400,000 | | | | 2,626,728 | |
Chicago IL Motor Fuel Tax Refunding Bonds Series 2013 (Tax Revenue) | | | 5.00 | | | | 1-1-2022 | | | | 1,810,000 | | | | 1,969,389 | |
Chicago IL Motor Fuel Tax Refunding Bonds Series 2013 (Tax Revenue) | | | 5.00 | | | | 1-1-2024 | | | | 2,460,000 | | | | 2,710,157 | |
Chicago IL Neighborhoods Alive 21 Series B (GO Revenue) | | | 5.00 | | | | 1-1-2026 | | | | 5,835,000 | | | | 5,940,147 | |
Chicago IL O’Hare International Airport Senior Lien Bonds Series 2015 C (Airport Revenue) | | | 5.00 | | | | 1-1-2022 | | | | 695,000 | | | | 819,801 | |
Chicago IL O’Hare International Airport Senior Lien Bonds Series 2015 D (Airport Revenue) | | | 5.00 | | | | 1-1-2021 | | | | 500,000 | | | | 583,520 | |
Chicago IL O’Hare International Airport Customer Facility Charge (Airport Revenue) | | | 5.25 | | | | 1-1-2023 | | | | 1,350,000 | | | | 1,628,167 | |
Chicago IL O’Hare International Airport Customer Facility Charge (Airport Revenue) | | | 5.25 | | | | 1-1-2024 | | | | 1,415,000 | | | | 1,703,674 | |
Chicago IL Park District Harbor Facilities Series D (GO Revenue) | | | 5.00 | | | | 1-1-2022 | | | | 1,500,000 | | | | 1,725,780 | |
Chicago IL Park District Harbor Facilities Series D (GO Revenue) | | | 5.00 | | | | 1-1-2023 | | | | 1,175,000 | | | | 1,374,104 | |
Chicago IL Park District Limited Tax Series B (GO Revenue) | | | 5.00 | | | | 1-1-2022 | | | | 4,495,000 | | | | 5,171,587 | |
Chicago IL Series A (Tax Revenue) | | | 5.00 | | | | 1-1-2029 | | | | 5,000,000 | | | | 5,335,300 | |
Chicago IL Series A (GO Revenue) | | | 5.25 | | | | 1-1-2022 | | | | 2,395,000 | | | | 2,445,271 | |
Chicago IL Series C (GO Revenue) | | | 5.00 | | | | 1-1-2021 | | | | 1,000,000 | | | | 1,046,710 | |
Chicago IL Series C (GO Revenue) | | | 5.00 | | | | 1-1-2022 | | | | 2,250,000 | | | | 2,338,740 | |
Chicago IL Series C (GO Revenue) | | | 5.00 | | | | 1-1-2023 | | | | 2,500,000 | | | | 2,609,875 | |
Chicago IL Series C (GO Revenue) | | | 5.00 | | | | 1-1-2025 | | | | 4,865,000 | | | | 5,014,501 | |
Chicago IL Series D (GO Revenue, Ambac Insured) | | | 5.00 | | | | 12-1-2022 | | | | 3,915,000 | | | | 3,982,847 | |
Chicago IL Series G (GO Revenue, Ambac Insured) | | | 5.00 | | | | 12-1-2024 | | | | 1,140,000 | | | | 1,159,859 | |
Chicago IL Tax Increment Bond Pilson Redevelopment Project Series A (Tax Revenue) | | | 5.00 | | | | 6-1-2022 | | | | 1,635,000 | | | | 1,881,574 | |
Chicago IL Transit Authority Capital Grant Federal Transit Administration Section 5307-A (Transportation Revenue, AGC Insured) | | | 5.25 | | | | 6-1-2022 | | | | 2,100,000 | | | | 2,233,455 | |
Chicago IL Transit Authority Capital Grant Receipts Refunding Bond Series 2011 (Miscellaneous Revenue, AGM Insured) | | | 5.25 | | | | 6-1-2024 | | | | 4,450,000 | | | | 5,078,740 | |
Chicago IL Unrefunded Balance Series A (GO Revenue, AGM Insured) | | | 5.00 | | | | 1-1-2024 | | | | 305,000 | | | | 307,696 | |
Chicago IL Waterworks Series A (Water & Sewer Revenue, Ambac Insured) | | | 5.00 | | | | 11-1-2021 | | | | 1,000,000 | | | | 1,014,410 | |
Chicago lL Series A (Tax Revenue) | | | 5.00 | | | | 1-1-2022 | | | | 3,000,000 | | | | 3,232,260 | |
Cook County IL Community High School District #217 Series 2016 (Miscellaneous Revenue) ± | | | 1.25 | | | | 12-15-2025 | | | | 5,000,000 | | | | 4,999,550 | |
Cook County IL Refunding Bonds Series 2010 G (GO Revenue) | | | 5.00 | | | | 11-15-2026 | | | | 1,000,000 | | | | 1,112,570 | |
Cook County IL School District #123 Oak Lawn CAB (GO Revenue, National Insured) ¤ | | | 0.00 | | | | 12-1-2021 | | | | 1,090,000 | | | | 939,275 | |
Cook County IL Series A (GO Revenue) %% | | | 5.00 | | | | 11-15-2021 | | | | 2,250,000 | | | | 2,607,885 | |
Cook County IL Series A (GO Revenue, Ambac Insured) | | | 5.00 | | | | 11-15-2024 | | | | 830,000 | | | | 831,569 | |
Cook County IL Series A (GO Revenue) | | | 5.25 | | | | 11-15-2022 | | | | 11,040,000 | | | | 12,544,797 | |
Cook County IL Series C (GO Revenue, National Insured) | | | 5.00 | | | | 11-15-2020 | | | | 1,150,000 | | | | 1,201,600 | |
Cook County IL Series C (GO Revenue, National Insured) | | | 5.00 | | | | 11-15-2021 | | | | 5,000,000 | | | | 5,224,350 | |
DeWitt & Ford Counties IL Community College District #540 (GO Revenue, AGM Insured) | | | 5.00 | | | | 12-1-2021 | | | | 5,920,000 | | | | 6,248,915 | |
DuPage County IL Forest Preservation District Series 2015 (GO Revenue) | | | 5.00 | | | | 1-1-2023 | | | | 2,455,000 | | | | 3,011,057 | |
Huntley IL Special Service Area #6 (Tax Revenue, AGC Insured) | | | 4.60 | | | | 3-1-2017 | | | | 252,000 | | | | 255,147 | |
The accompanying notes are an integral part of these financial statements.
| | | | |
| 14 | | Wells Fargo Strategic Municipal Bond Fund | | Portfolio of investments—June 30, 2016 |
| | | | | | | | | | | | | | | | |
| Security name | | Interest rate | | | Maturity date | | | Principal | | | Value | |
| | | | |
| Illinois (continued) | | | | | | | | | | | | | | | | |
Illinois Finance Authority Little Company of Mark Hospital Series B (Health Revenue, Barclays Bank plc LOC) ø | | | 0.42 | % | | | 8-15-2035 | | | $ | 11,840,000 | | | $ | 11,840,000 | |
Illinois Finance Authority OSF Healthcare System Series F (Health Revenue, Barclays Bank plc LOC) ± | | | 0.42 | | | | 11-15-2037 | | | | 10,000,000 | | | | 10,000,000 | |
Illinois Series B (GO Revenue) | | | 5.01 | | | | 4-1-2028 | | | | 7,415,000 | | | | 7,343,075 | |
Illinois Municipal Electric Agency Power Series A (Utilities Revenue, National Insured) | | | 5.25 | | | | 2-1-2021 | | | | 3,840,000 | | | | 3,945,408 | |
Illinois Refunding Bond (Miscellaneous Revenue, AGM Insured) | | | 5.00 | | | | 8-1-2020 | | | | 5,050,000 | | | | 5,698,622 | |
Illinois Refunding Bond (Miscellaneous Revenue) | | | 5.00 | | | | 8-1-2020 | | | | 5,000,000 | | | | 5,498,850 | |
Illinois Series 2004 (GO Revenue) | | | 5.00 | | | | 9-1-2016 | | | | 1,400,000 | | | | 1,404,648 | |
Illinois Series 2006 (GO Revenue) | | | 5.00 | | | | 1-1-2025 | | | | 5,025,000 | | | | 5,047,512 | |
Illinois Series 2012 (Miscellaneous Revenue) | | | 5.00 | | | | 8-1-2021 | | | | 5,620,000 | | | | 6,227,466 | |
Illinois Series 2013 (Miscellaneous Revenue) | | | 5.00 | | | | 7-1-2022 | | | | 1,900,000 | | | | 2,124,485 | |
Illinois Series 2013 (Miscellaneous Revenue, AGM Insured) | | | 5.00 | | | | 7-1-2023 | | | | 4,875,000 | | | | 5,715,060 | |
Illinois Series A (GO Revenue) | | | 5.00 | | | | 4-1-2020 | | | | 2,000,000 | | | | 2,194,520 | |
Illinois Series A (GO Revenue) | | | 5.00 | | | | 4-1-2023 | | | | 3,500,000 | | | | 3,945,410 | |
Illinois Sports Facilities Authority State Tax Supported CAB (Tax Revenue, Ambac Insured) ¤ | | | 0.00 | | | | 6-15-2018 | | | | 4,000,000 | | | | 3,838,440 | |
Illinois Sports Facilities Authority State Tax Supported CAB (Tax Revenue, Ambac Insured) ¤ | | | 0.00 | | | | 6-15-2022 | | | | 3,005,000 | | | | 2,593,465 | |
Illinois Sports Facilities Authority State Tax Supported CAB (Tax Revenue, Ambac Insured) ¤ | | | 0.00 | | | | 6-15-2023 | | | | 7,305,000 | | | | 6,122,686 | |
Kane Cook & DuPage Counties IL School District #46 Prerefunded Bond CAB Series B (GO Revenue, Ambac Insured) ¤ | | | 0.00 | | | | 1-1-2021 | | | | 510,000 | | | | 482,822 | |
Kane Cook & DuPage Counties IL School District #46 Unrefunded Bond CAB Series B (GO Revenue, Ambac Insured) ¤ | | | 0.00 | | | | 1-1-2021 | | | | 595,000 | | | | 541,343 | |
Kane County IL Aurora West School District #129 (GO Revenue, AGM Insured) | | | 5.00 | | | | 2-1-2022 | | | | 6,290,000 | | | | 7,388,486 | |
Kendall Kane & Will Counties IL Community Unit School District #308 Oswego Prerefunded Bond Series C (GO Revenue, AGM Insured) ¤ | | | 0.00 | | | | 10-1-2017 | | | | 1,325,000 | | | | 1,311,724 | |
Kendall Kane & Will Counties IL Community Unit School District #308 Oswego Unrefunded Bond Series C (GO Revenue, AGM Insured) ¤ | | | 0.00 | | | | 10-1-2017 | | | | 25,000 | | | | 24,619 | |
Lake County IL Community Consolidated School District #3 Beach Park CAB (GO Revenue, Ambac Insured) ¤ | | | 0.00 | | | | 2-1-2017 | | | | 1,610,000 | | | | 1,584,804 | |
Lake County IL Community Consolidated School District #3 Beach Park CAB (GO Revenue, Ambac Insured) ¤ | | | 0.00 | | | | 2-1-2018 | | | | 1,000,000 | | | | 950,540 | |
Lake County IL Community Consolidated School District #3 Beach Park CAB (GO Revenue, Ambac Insured) ¤ | | | 0.00 | | | | 2-1-2019 | | | | 1,100,000 | | | | 1,006,654 | |
Lake County IL School District #38 Big Hollow CAB (GO Revenue, Ambac Insured) ¤ | | | 0.00 | | | | 2-1-2019 | | | | 1,175,000 | | | | 1,101,680 | |
McHenry & Kane Counties IL Community Consolidated School District #158 CAB (GO Revenue, National Insured) ¤ | | | 0.00 | | | | 1-1-2018 | | | | 4,000,000 | | | | 3,944,600 | |
McHenry & Kane Counties IL Community Consolidated School District #158 CAB (GO Revenue, AGM/FGIC Insured) ¤ | | | 0.00 | | | | 1-1-2019 | | | | 1,185,000 | | | | 1,154,925 | |
Metropolitan Pier & Exposition Authority McCormick Series A (Tax Revenue, National Insured) ± | | | 0.00 | | | | 6-15-2025 | | | | 1,000,000 | | | | 1,131,940 | |
Metropolitan Pier & Exposition Authority McCormick Series A (Tax Revenue, National Insured) ¤ | | | 0.00 | | | | 12-15-2022 | | | | 1,200,000 | | | | 1,006,896 | |
Metropolitan Pier & Exposition Authority McCormick Series A (Tax Revenue, National Insured) ¤ | | | 0.00 | | | | 12-15-2023 | | | | 500,000 | | | | 404,965 | |
Metropolitan Pier & Exposition Authority McCormick Series B (Tax Revenue) | | | 5.00 | | | | 12-15-2022 | | | | 11,520,000 | | | | 11,895,091 | |
Romeoville IL Series B (GO Revenue, AGC Insured) ¤ | | | 0.00 | | | | 12-30-2023 | | | | 3,410,000 | | | | 2,479,854 | |
The accompanying notes are an integral part of these financial statements.
| | | | | | |
| Portfolio of investments—June 30, 2016 | | Wells Fargo Strategic Municipal Bond Fund | | | 15 | |
| | | | | | | | | | | | | | | | |
| Security name | | Interest rate | | | Maturity date | | | Principal | | | Value | |
| | | | |
| Illinois (continued) | | | | | | | | | | | | | | | | |
Romeoville IL Series B (GO Revenue, AGC Insured) ¤ | | | 0.00 | % | | | 12-30-2024 | | | $ | 2,840,000 | | | $ | 1,946,309 | |
Springfield IL Electric Senior Lien (Utilities Revenue, National Insured) | | | 5.00 | | | | 3-1-2021 | | | | 7,410,000 | | | | 7,625,779 | |
St. Clair County IL School District Series B (GO Revenue, National Insured) | | | 4.75 | | | | 1-1-2018 | | | | 655,000 | | | | 681,934 | |
University of Illinois Auxiliary Facilities (Education Revenue, JPMorgan Chase & Company SPA) ø | | | 0.88 | | | | 4-1-2038 | | | | 7,580,000 | | | | 7,580,000 | |
Will County IL School District #114 CAB Series C (GO Revenue, National Insured) ¤ | | | 0.00 | | | | 12-1-2021 | | | | 855,000 | | | | 759,727 | |
Winnebago & Boone Counties IL School District #205 Series A (GO Revenue) ¤ | | | 0.00 | | | | 2-1-2021 | | | | 1,305,000 | | | | 1,194,049 | |
Winnebago & Boone Counties IL School District #205 Series B (GO Revenue) ¤ | | | 0.00 | | | | 2-1-2021 | | | | 3,400,000 | | | | 3,110,932 | |
| | | | |
| | | | | | | | | | | | | | | 295,104,837 | |
| | | | | | | | | | | | | | | | |
| | | | |
| Indiana: 2.51% | | | | | | | | | | | | | | | | |
Indiana Finance Authority Ohio River Bridges East End Crossing Project Series B (Industrial Development Revenue) | | | 5.00 | | | | 1-1-2019 | | | | 16,205,000 | | | | 16,542,064 | |
Indiana HEFA Ascension Health Series B3 (Health Revenue) ± | | | 1.26 | | | | 11-15-2031 | | | | 11,000,000 | | | | 11,000,110 | |
Indiana HFFA Ancilla System Incorporated (Health Revenue, National Insured) | | | 5.25 | | | | 7-1-2022 | | | | 325,000 | | | | 326,378 | |
Indiana Housing and Community Development Authority Series A-2 (Housing Revenue, GNMA/FNMA/FHLMC Insured) ± | | | 0.86 | | | | 7-1-2039 | | | | 4,735,000 | | | | 4,735,000 | |
Knox County IN EDA Good Samaritan Hospital Series A (Health Revenue) | | | 4.00 | | | | 4-1-2017 | | | | 625,000 | | | | 636,331 | |
Knox County IN EDA Good Samaritan Hospital Series A (Health Revenue) | | | 4.00 | | | | 4-1-2018 | | | | 400,000 | | | | 416,168 | |
Whiting IN BP Products North America Incorporated Project (Resource Recovery Revenue) | | | 1.14 | | | | 12-1-2044 | | | | 11,400,000 | | | | 11,136,546 | |
Whiting IN BP Products North America Incorporated Project (Industrial Development Revenue) ± | | | 1.85 | | | | 6-1-2044 | | | | 2,950,000 | | | | 2,981,123 | |
| | | | |
| | | | | | | | | | | | | | | 47,773,720 | |
| | | | | | | | | | | | | | | | |
| | | | |
| Iowa: 0.14% | | | | | | | | | | | | | | | | |
Iowa Student Loan Liquidity Corporation Series A1 (Education Revenue) | | | 3.88 | | | | 12-1-2016 | | | | 1,950,000 | | | | 1,967,706 | |
Iowa Student Loan Liquidity Corporation Series A1 (Education Revenue) | | | 4.13 | | | | 12-1-2017 | | | | 620,000 | | | | 641,867 | |
| | | | |
| | | | | | | | | | | | | | | 2,609,573 | |
| | | | | | | | | | | | | | | | |
| | | | |
| Kansas: 0.99% | | | | | | | | | | | | | | | | |
Wyandotte County & Kansas City KS Sales Tax Special Obligation Vacation Village Project Area 4 – Major Multi-Sport Athletic Complex Project CAB Series 2015 (Tax Revenue) 144A¤ | | | 0.00 | | | | 9-1-2034 | | | | 49,000,000 | | | | 17,805,130 | |
Wyandotte County & Kansas City KS Special Obligation Refunding and Improvement Bonds Plaza Redevelopment Project (Tax Revenue) | | | 4.00 | | | | 12-1-2028 | | | | 1,000,000 | | | | 1,023,550 | |
| | | | |
| | | | | | | | | | | | | | | 18,828,680 | |
| | | | | | | | | | | | | | | | |
| | | | |
| Kentucky: 1.02% | | | | | | | | | | | | | | | | |
Ashland KY Ashland Hospital Corporation Kings Daughters Medical Center Project (Health Revenue) ± | | | 2.14 | | | | 2-1-2040 | | | | 7,650,000 | | | | 7,654,360 | |
Christian County KY Jennie Stuart Medical Center (Health Revenue, AGC Insured) | | | 5.25 | | | | 2-1-2018 | | | | 1,040,000 | | | | 1,072,718 | |
Kentucky EDFA Healthcare Facilities Rosedale Green Project Series 2015 (Health Revenue) | | | 2.75 | | | | 11-15-2018 | | | | 300,000 | | | | 305,241 | |
Kentucky EDFA Healthcare Facilities Rosedale Green Project Series 2015 (Health Revenue) | | | 3.00 | | | | 11-15-2019 | | | | 350,000 | | | | 359,055 | |
Kentucky EDFA Healthcare Facilities Rosedale Green Project Series 2015 (Health Revenue) | | | 3.35 | | | | 11-15-2020 | | | | 335,000 | | | | 346,501 | |
Kentucky EDFA Healthcare Facilities Rosedale Green Project Series 2015 (Health Revenue) | | | 5.00 | | | | 11-15-2025 | | | | 1,500,000 | | | | 1,627,230 | |
Kentucky EDFA Masonic Homes of Kentucky (Health Revenue) | | | 4.00 | | | | 11-15-2016 | | | | 740,000 | | | | 746,246 | |
Kentucky EDFA Norton Healthcare Incorporated Series B (Health Revenue, National Insured) ¤ | | | 0.00 | | | | 10-1-2022 | | | | 1,000,000 | | | | 862,750 | |
The accompanying notes are an integral part of these financial statements.
| | | | |
| 16 | | Wells Fargo Strategic Municipal Bond Fund | | Portfolio of investments—June 30, 2016 |
| | | | | | | | | | | | | | | | |
| Security name | | Interest rate | | | Maturity date | | | Principal | | | Value | |
| | | | |
| Kentucky (continued) | | | | | | | | | | | | | | | | |
Kentucky Municipal Power Agency Prairie State Project Series B (Utilities Revenue) ± | | | 1.79 | % | | | 9-1-2042 | | | $ | 6,500,000 | | | $ | 6,497,660 | |
| | | | |
| | | | | | | | | | | | | | | 19,471,761 | |
| | | | | | | | | | | | | | | | |
| | | | |
| Louisiana: 0.65% | | | | | | | | | | | | | | | | |
Louisiana Offshore Terminal Authority Deepwater Loop LLC Project Series B-1A1 (Airport Revenue) ± | | | 1.38 | | | | 10-1-2037 | | | | 100,000 | | | | 100,082 | |
Louisiana Tobacco Settlement Financing Corporation Bonds Series A (Tobacco Revenue) | | | 5.00 | | | | 5-15-2025 | | | | 1,445,000 | | | | 1,448,743 | |
St. Bernard Parish LA Series 2012 (Tax Revenue) | | | 4.00 | | | | 3-1-2019 | | | | 3,355,000 | | | | 3,599,814 | |
St. James Parish LA Nucor Steel LLC Project Gulf Opportunity Zone Series B-1 (Industrial Development Revenue) ø | | | 0.70 | | | | 11-1-2040 | | | | 7,250,000 | | | | 7,250,000 | |
| | | | |
| | | | | | | | | | | | | | | 12,398,639 | |
| | | | | | | | | | | | | | | | |
| | | | |
| Maine: 0.50% | | | | | | | | | | | | | | | | |
Maine Eclipse Funding Trust Various States Solar Eclipse ( U.S. Bank NA LOC, U.S. Bank NA LIQ) 144Aø | | | 0.49 | | | | 7-1-2037 | | | | 9,485,000 | | | | 9,485,000 | |
| | | | | | | | | | | | | | | | |
| | | | |
| Maryland: 0.68% | | | | | | | | | | | | | | | | |
Baltimore MD Series A (Water & Sewer Revenue, National Insured) | | | 5.65 | | | | 7-1-2020 | | | | 4,100,000 | | | | 4,425,089 | |
Howard County MD Housing Commission Series A (Housing Revenue) ± | | | 1.66 | | | | 7-1-2034 | | | | 6,665,000 | | | | 6,654,069 | |
Prince Georges County MD Chesapeake Lighthouse Charter School Project Series 2015 (Education Revenue) 144A | | | 5.25 | | | | 8-1-2022 | | | | 1,790,000 | | | | 1,827,268 | |
| | | | |
| | | | | | | | | | | | | | | 12,906,426 | |
| | | | | | | | | | | | | | | | |
| | | | |
| Massachusetts: 1.25% | | | | | | | | | | | | | | | | |
Massachusetts Development Finance Agency Sabis International Charter School Series 2015 (Education Revenue) | | | 5.00 | | | | 4-15-2025 | | | | 1,000,000 | | | | 1,187,500 | |
Massachusetts Educational Financing Authority Series J (Education Revenue) | | | 5.00 | | | | 7-1-2018 | | | | 750,000 | | | | 803,603 | |
Massachusetts Educational Financing Authority Series J (Education Revenue) | | | 5.00 | | | | 7-1-2019 | | | | 6,000,000 | | | | 6,586,500 | |
Massachusetts HEFA Milford Regional Medical Center Series E (Health Revenue) | | | 5.00 | | | | 7-15-2022 | | | | 2,250,000 | | | | 2,346,548 | |
Massachusetts Various Consolidated Loans Series D (Tax Revenue) ± | | | 0.84 | | | | 1-1-2018 | | | | 3,000,000 | | | | 3,001,320 | |
Massachusetts Water Resources Authority Series DCL 005 (Water & Sewer Revenue, Dexia Credit Local LOC, AGM Insured) 144Aø | | | 0.53 | | | | 8-1-2025 | | | | 9,925,000 | | | | 9,925,000 | |
| | | | |
| | | | | | | | | | | | | | | 23,850,471 | |
| | | | | | | | | | | | | | | | |
| | | | |
| Michigan: 5.09% | | | | | | | | | | | | | | | | |
Birmingham MI Public Schools (GO Revenue) | | | 5.00 | | | | 11-1-2021 | | | | 1,405,000 | | | | 1,688,993 | |
Clarkston MI Community Schools (GO Revenue, Qualified School Board Loan Fund Insured) | | | 5.00 | | | | 5-1-2022 | | | | 5,000,000 | | | | 6,024,000 | |
Constantine MI Public Schools (GO Revenue, Qualified School Board Loan Fund Insured) | | | 5.00 | | | | 5-1-2020 | | | | 350,000 | | | | 401,842 | |
Constantine MI Public Schools (GO Revenue, Qualified School Board Loan Fund Insured) | | | 5.00 | | | | 5-1-2021 | | | | 1,200,000 | | | | 1,413,828 | |
Detroit MI Distribution of State Aid (GO Revenue) | | | 4.50 | | | | 11-1-2023 | | | | 975,000 | | | | 1,067,020 | |
Detroit MI Downtown Development Authority CAB (Tax Revenue) ¤ | | | 0.00 | | | | 7-1-2016 | | | | 1,395,000 | | | | 1,394,902 | |
Detroit MI Downtown Development Authority CAB (Tax Revenue) ¤ | | | 0.00 | | | | 7-1-2017 | | | | 3,015,000 | | | | 2,908,450 | |
Detroit MI Wayne County Stadium Authority (Miscellaneous Revenue) | | | 5.00 | | | | 10-1-2017 | | | | 1,245,000 | | | | 1,246,332 | |
Detroit MI Wayne County Stadium Authority (Miscellaneous Revenue) | | | 5.00 | | | | 10-1-2018 | | | | 3,425,000 | | | | 3,427,260 | |
Forest Hills MI Public Schools (GO Revenue) | | | 5.00 | | | | 5-1-2020 | | | | 1,600,000 | | | | 1,844,624 | |
Forest Hills MI Public Schools (GO Revenue) | | | 5.00 | | | | 5-1-2021 | | | | 1,600,000 | | | | 1,894,752 | |
The accompanying notes are an integral part of these financial statements.
| | | | | | |
| Portfolio of investments—June 30, 2016 | | Wells Fargo Strategic Municipal Bond Fund | | | 17 | |
| | | | | | | | | | | | | | | | |
| Security name | | Interest rate | | | Maturity date | | | Principal | | | Value | |
| | | | |
| Michigan (continued) | | | | | | | | | | | | | | | | |
Fraser MI Public Schools District (GO Revenue, Qualified School Board Loan Fund Insured) | | | 5.00 | % | | | 5-1-2021 | | | $ | 1,000,000 | | | $ | 1,178,190 | |
Fraser MI Public Schools District (GO Revenue, Qualified School Board Loan Fund Insured) | | | 5.00 | | | | 5-1-2022 | | | | 610,000 | | | | 734,928 | |
Grand Haven MI Electric System Series 2003 (Utilities Revenue, National Insured) | | | 5.50 | | | | 7-1-2016 | | | | 1,000,000 | | | | 1,000,100 | |
Hudsonville MI Public Schools (GO Revenue, Qualified School Board Loan Fund Insured) | | | 5.00 | | | | 5-1-2021 | | | | 1,465,000 | | | | 1,726,048 | |
Hudsonville MI Public Schools (GO Revenue, Qualified School Board Loan Fund Insured) | | | 5.00 | | | | 5-1-2022 | | | | 1,475,000 | | | | 1,777,080 | |
Ingham County MI Williamston Community Schools Series A (GO Revenue, Qualified School Board Loan Fund Insured) | | | 4.00 | | | | 5-1-2024 | | | | 1,025,000 | | | | 1,182,368 | |
Ingham County MI Williamston Community Schools Series A (GO Revenue, Qualified School Board Loan Fund Insured) | | | 4.00 | | | | 5-1-2025 | | | | 1,000,000 | | | | 1,158,900 | |
Michigan Finance Authority Detroit Recovery Project Series 2014F (Tax Revenue) | | | 3.88 | | | | 10-1-2023 | | | | 2,500,000 | | | | 2,780,650 | |
Michigan Finance Authority Detroit Recovery Project Series 2014F (Tax Revenue) | | | 3.40 | | | | 10-1-2020 | | | | 500,000 | | | | 524,015 | |
Michigan Finance Authority Detroit Recovery Project Series 2014F (Tax Revenue) | | | 3.60 | | | | 10-1-2021 | | | | 500,000 | | | | 533,485 | |
Michigan Finance Authority Detroit Recovery Project Series 2014F (Tax Revenue) | | | 3.80 | | | | 10-1-2022 | | | | 500,000 | | | | 542,825 | |
Michigan Finance Authority Healthcare Equipment Loan Program Bonds Series C (Health Revenue, Fifth Third Bank LOC) ø | | | 0.48 | | | | 12-1-2032 | | | | 1,750,000 | | | | 1,750,000 | |
Michigan Finance Authority Limited Obligation Cesar Chavez Academy Project (Education Revenue) | | | 4.25 | | | | 2-1-2017 | | | | 345,000 | | | | 345,445 | |
Michigan Finance Authority Refunding Bonds Local Government Loan Program Series C (Miscellaneous Revenue) | | | 5.00 | | | | 11-1-2020 | | | | 1,500,000 | | | | 1,670,850 | |
Michigan Finance Authority Series 25-A (Education Revenue) | | | 5.00 | | | | 11-1-2018 | | | | 3,100,000 | | | | 3,332,252 | |
Michigan Finance Authority Series 25-A (Education Revenue) | | | 5.00 | | | | 11-1-2019 | | | | 1,500,000 | | | | 1,653,840 | |
Michigan Finance Authority Series H-1 (Tax Revenue) | | | 5.00 | | | | 10-1-2021 | | | | 1,565,000 | | | | 1,798,169 | |
Michigan Finance Authority St. John Health System Series A (Health Revenue, Ambac Insured) | | | 5.00 | | | | 5-15-2018 | | | | 300,000 | | | | 301,197 | |
Michigan Financial Authority Local Government Loan Program Series C7 (Water & Sewer Revenue, National Insured) | | | 5.00 | | | | 7-1-2022 | | | | 2,000,000 | | | | 2,379,580 | |
Michigan Financial Authority Local Government Loan Program Series D1 (Water & Sewer Revenue, AGM Insured) | | | 5.00 | | | | 7-1-2022 | | | | 2,700,000 | | | | 3,220,911 | |
Michigan Financial Authority Local Government Loan Program Series D1 (Water & Sewer Revenue, AGM Insured) | | | 5.00 | | | | 7-1-2023 | | | | 2,000,000 | | | | 2,429,620 | |
Michigan Financial Authority Local Government Loan Program Series D6 (Water & Sewer Revenue, National Insured) | | | 5.00 | | | | 7-1-2021 | | | | 6,355,000 | | | | 7,453,271 | |
Michigan Financial Authority Local Government Loan Program Series D6 (Water & Sewer Revenue, National Insured) | | | 5.00 | | | | 7-1-2022 | | | | 2,080,000 | | | | 2,474,763 | |
Michigan Financial Authority Local Government Loan Program Series D6 (Water & Sewer Revenue, National Insured) | | | 5.00 | | | | 7-1-2023 | | | | 3,670,000 | | | | 4,431,452 | |
Michigan Financial Authority Local Government Loan Program Series D6 (Water & Sewer Revenue, National Insured) | | | 5.00 | | | | 7-1-2024 | | | | 2,130,000 | | | | 2,616,300 | |
Michigan Municipal Bond Authority Local Government Loan Program Series A (Miscellaneous Revenue, Ambac Insured) | | | 4.00 | | | | 11-1-2019 | | | | 500,000 | | | | 505,920 | |
Michigan Municipal Bond Authority Local Government Loan Program Series A (Miscellaneous Revenue, Ambac Insured) | | | 5.00 | | | | 5-1-2018 | | | | 595,000 | | | | 596,285 | |
Michigan Municipal Bond Authority Local Government Loan Program Series C (Miscellaneous Revenue, Ambac Insured) | | | 4.13 | | | | 5-1-2020 | | | | 500,000 | | | | 506,060 | |
Michigan Municipal Bond Authority Local Government Loan Program Series C (Miscellaneous Revenue, Ambac Insured) | | | 5.00 | | | | 5-1-2023 | | | | 1,900,000 | | | | 1,932,338 | |
Michigan Public Educational Facilities Authority Chandler Park Academy (Miscellaneous Revenue) | | | 6.35 | | | | 11-1-2028 | | | | 1,500,000 | | | | 1,503,150 | |
The accompanying notes are an integral part of these financial statements.
| | | | |
| 18 | | Wells Fargo Strategic Municipal Bond Fund | | Portfolio of investments—June 30, 2016 |
| | | | | | | | | | | | | | | | |
| Security name | | Interest rate | | | Maturity date | | | Principal | | | Value | |
| | | | |
| Michigan (continued) | | | | | | | | | | | | | | | | |
Michigan Strategic Fund Limited Obligation Events Center Project Series A (Tax Revenue) ± | | | 4.13 | % | | | 7-1-2045 | | | $ | 7,500,000 | | | $ | 7,701,225 | |
Southfield MI Public Schools (GO Revenue, National/Qualified School Board Loan Fund Insured) | | | 4.38 | | | | 5-1-2025 | | | | 1,950,000 | | | | 2,004,971 | |
Tender Option Bond Trust Receipts Portage Public School (GO Revenue, AGM Insured, Bank of America NA LIQ) 144Aø | | | 0.55 | | | | 5-1-2031 | | | | 5,000,000 | | | | 5,000,000 | |
Wayne County MI Series 2016 (GO Revenue) | | | 4.25 | | | | 12-1-2018 | | | | 3,500,000 | | | | 3,534,755 | |
Wayne County MI Airport Authority AMT Detroit Metropolitan Airport Series C (Airport Revenue) | | | 5.00 | | | | 12-1-2022 | | | | 1,000,000 | | | | 1,142,350 | |
| | | | |
| | | | | | | | | | | | | | | 96,735,296 | |
| | | | | | | | | | | | | | | | |
| | | | |
| Minnesota: 0.29% | | | | | | | | | | | | | | | | |
Hayward MN HCFR St. John’s Lutheran Home of Albert Lea Project Series 2015 (Health Revenue) | | | 2.75 | | | | 11-1-2017 | | | | 5,000,000 | | | | 5,032,750 | |
St. Paul MN Housing & RDA Charter School Hmong College Prep Academy Series A (Miscellaneous Revenue) | | | 4.75 | | | | 9-1-2022 | | | | 500,000 | | | | 531,965 | |
| | | | |
| | | | | | | | | | | | | | | 5,564,715 | |
| | | | | | | | | | | | | | | | |
| | | | |
| Mississippi: 1.13% | | | | | | | | | | | | | | | | |
Mississippi HFFA Baptist Health System Series A (Health Revenue) ± | | | 1.69 | | | | 8-15-2036 | | | | 5,000,000 | | | | 4,956,850 | |
Perry County MS PCR Leaf River Forest Products Incorporated Project (Industrial Development Revenue, Georgia-Pacific LLC LOC) 144Aø | | | 0.60 | | | | 2-1-2022 | | | | 16,600,000 | | | | 16,600,000 | |
| | | | |
| | | | | | | | | | | | | | | 21,556,850 | |
| | | | | | | | | | | | | | | | |
| | | | |
| Nevada: 0.35% | | | | | | | | | | | | | | | | |
Carson City NV Carson Tahoe Regional Medical Center (Health Revenue) | | | 4.00 | | | | 9-1-2016 | | | | 545,000 | | | | 547,665 | |
Carson City NV Carson Tahoe Regional Medical Center (Health Revenue) | | | 5.00 | | | | 9-1-2018 | | | | 700,000 | | | | 750,631 | |
Clark County NV Department of Aviation Subordinated Lien Series D-3 (Airport Revenue, Bank of America NA LOC) ø | | | 0.41 | | | | 7-1-2029 | | | | 4,000,000 | | | | 4,000,000 | |
Las Vegas NV Special Improvement District #60 (Miscellaneous Revenue) | | | 3.00 | | | | 6-1-2017 | | | | 675,000 | | | | 682,594 | |
Las Vegas NV Special Improvement District #60 (Miscellaneous Revenue) | | | 4.00 | | | | 6-1-2018 | | | | 665,000 | | | | 687,876 | |
| | | | |
| | | | | | | | | | | | | | | 6,668,766 | |
| | | | | | | | | | | | | | | | |
| | | | |
| New Hampshire: 0.03% | | | | | | | | | | | | | | | | |
New Hampshire HEFA Covenant Health Project Series B (Health Revenue) | | | 5.00 | | | | 7-1-2016 | | | | 520,000 | | | | 520,057 | |
| | | | | | | | | | | | | | | | |
| | | | |
| New Jersey: 4.20% | | | | | | | | | | | | | | | | |
Delaware River NJ Port Authority Pennsylvania & New Jersey Port District Project (Airport Revenue) | | | 5.00 | | | | 1-1-2017 | | | | 2,100,000 | | | | 2,150,841 | |
Delaware River NJ Port Authority Pennsylvania & New Jersey Port District Project (Airport Revenue) | | | 5.00 | | | | 1-1-2018 | | | | 1,230,000 | | | | 1,307,650 | |
Hudson County NJ Qualified General and Water Improvements Series 2012A and 2012B (GO Revenue, AGM Insured) | | | 4.00 | | | | 9-1-2018 | | | | 1,140,000 | | | | 1,212,949 | |
New Jersey EDA Elite Pharmaceuticals Project Series A (Industrial Development Revenue) | | | 6.50 | | | | 9-1-2030 | | | | 465,000 | | | | 399,714 | |
New Jersey EDA Port Newark Container Series B (Industrial Development Revenue, Sovereign Bank LOC) ø | | | 0.69 | | | | 7-1-2030 | | | | 11,200,000 | | | | 11,200,000 | |
New Jersey EDA School Facilities Construction Project Prerefunded Bond Series EE (Miscellaneous Revenue) | | | 5.50 | | | | 9-1-2021 | | | | 2,025,000 | | | | 2,437,675 | |
New Jersey EDA School Facilities Construction Project Series I (Miscellaneous Revenue) ± | | | 1.96 | | | | 9-1-2027 | | | | 12,500,000 | | | | 11,234,500 | |
The accompanying notes are an integral part of these financial statements.
| | | | | | |
| Portfolio of investments—June 30, 2016 | | Wells Fargo Strategic Municipal Bond Fund | | | 19 | |
| | | | | | | | | | | | | | | | |
| Security name | | Interest rate | | | Maturity date | | | Principal | | | Value | |
| | | | |
| New Jersey (continued) | | | | | | | | | | | | | | | | |
New Jersey EDA School Facilities Construction Project Series K (Miscellaneous Revenue, Ambac Insured) | | | 5.25 | % | | | 12-15-2020 | | | $ | 3,000,000 | | | $ | 3,361,200 | |
New Jersey EDA School Facilities Construction Project Series NN (Miscellaneous Revenue, AGM Insured) | | | 5.00 | | | | 3-1-2024 | | | | 1,645,000 | | | | 1,921,278 | |
New Jersey EDA School Facilities Construction Project Unrefunded Bond Series EE (Miscellaneous Revenue) | | | 5.50 | | | | 9-1-2021 | | | | 750,000 | | | | 846,308 | |
New Jersey EDA School Facilities Construction Series C (Miscellaneous Revenue) ± | | | 2.21 | | | | 2-1-2018 | | | | 6,500,000 | | | | 6,472,830 | |
New Jersey EDA The Goethals Bridge Replacement Project (Industrial Development Revenue) | | | 5.00 | | | | 7-1-2020 | | | | 500,000 | | | | 569,620 | |
New Jersey EDA The Goethals Bridge Replacement Project (Industrial Development Revenue) | | | 5.00 | | | | 1-1-2021 | | | | 585,000 | | | | 669,164 | |
New Jersey EDA The Goethals Bridge Replacement Project (Industrial Development Revenue) | | | 5.00 | | | | 7-1-2021 | | | | 900,000 | | | | 1,042,803 | |
New Jersey EDA The Goethals Bridge Replacement Project (Industrial Development Revenue) | | | 5.00 | | | | 1-1-2023 | | | | 400,000 | | | | 466,856 | |
New Jersey TTFA CAB Series A (Transportation Revenue) ¤ | | | 0.00 | | | | 12-15-2026 | | | | 12,000,000 | | | | 8,156,400 | |
New Jersey TTFA Series A (Transportation Revenue) | | | 5.25 | | | | 12-15-2020 | | | | 1,900,000 | | | | 2,128,304 | |
New Jersey TTFA Series AA (Transportation Revenue) | | | 2.50 | | | | 6-15-2018 | | | | 2,150,000 | | | | 2,182,852 | |
New Jersey TTFA Series AA (Transportation Revenue) | | | 4.00 | | | | 6-15-2018 | | | | 2,900,000 | | | | 3,027,745 | |
New Jersey TTFA Series AA (Transportation Revenue) | | | 5.00 | | | | 6-15-2023 | | | | 4,665,000 | | | | 5,278,587 | |
New Jersey TTFA Series B (Transportation Revenue) | | | 5.00 | | | | 6-15-2020 | | | | 2,000,000 | | | | 2,202,940 | |
New Jersey TTFA Series D (Transportation Revenue) | | | 5.00 | | | | 12-15-2023 | | | | 6,960,000 | | | | 7,901,758 | |
Newark NJ Housing Authority (Miscellaneous Revenue, National Insured) | | | 5.25 | | | | 1-1-2019 | | | | 2,995,000 | | | | 3,290,067 | |
Paterson NJ General Improvement (GO Revenue, AGM Insured) | | | 5.00 | | | | 6-15-2020 | | | | 400,000 | | | | 438,952 | |
| | | | |
| | | | | | | | | | | | | | | 79,900,993 | |
| | | | | | | | | | | | | | | | |
| | | | |
| New Mexico: 0.91% | | | | | | | | | | | | | | | | |
New Mexico Educational Assistance Foundation Series A2 (Education Revenue) ± | | | 1.32 | | | | 12-1-2028 | | | | 260,000 | | | | 258,713 | |
New Mexico Municipal Energy Acquisition Authority Gas Supply Sub Series B (Utilities Revenue, Royal Bank of Canada SPA) ± | | | 1.06 | | | | 11-1-2039 | | | | 17,100,000 | | | | 16,967,133 | |
| | | | |
| | | | | | | | | | | | | | | 17,225,846 | |
| | | | | | | | | | | | | | | | |
| | | | | | | | | | | | | | | | |
| | | | |
| New York: 9.20% | | | | | | | | | | | | | | | | |
Albany NY IDA Foundation State University Project Series A (Education Revenue) ± | | | 0.77 | | | | 7-1-2032 | | | | 3,030,000 | | | | 3,030,000 | |
Albany NY IDA Teresan House Series A (Health Revenue, Citizens Bank LOC) ø | | | 0.65 | | | | 7-1-2016 | | | | 545,000 | | | | 545,000 | |
Build New York City Resource Corporation Bronx Charter School for International Cultures & Arts Series A (Education Revenue) | | | 3.88 | | | | 4-15-2023 | | | | 1,000,000 | | | | 1,012,760 | |
Deutsche Bank SPEAR/LIFER Trust Series DBE 1088 (GO Revenue, HUD Insured, Deutsche Bank LIQ) 144Aø | | | 1.06 | | | | 9-1-2029 | | | | 8,255,000 | | | | 8,255,000 | |
East Rochester NY Housing Authority Home Good Sheperd Project Series A (Housing Revenue, Citizens Bank LOC) ø | | | 0.65 | | | | 12-1-2036 | | | | 2,655,000 | | | | 2,655,000 | |
Metropolitan Transportation Authority Subseries E-2 (Transportation Revenue, Bank of Tokyo-Mitsubishi LOC) ø | | | 0.40 | | | | 11-15-2050 | | | | 10,000,000 | | | | 10,000,000 | |
Monroe County NY Greece New York Central School (GO Revenue) | | | 2.00 | | | | 6-30-2017 | | | | 7,900,000 | | | | 7,990,929 | |
Monroe County NY Industrial Development Corporation Unity Hospital Rochester Project (Health Revenue, FHA Insured) | | | 4.20 | | | | 8-15-2025 | | | | 7,195,000 | | | | 7,209,390 | |
New York IDA American Airlines JFK International Airport (Industrial Development Revenue) | | | 7.50 | | | | 8-1-2016 | | | | 840,000 | | | | 844,998 | |
New York Local Government Assistance Corporation Series A9V (Tax Revenue, AGM Insured) ±(m)(n) | | | 0.57 | | | | 4-1-2017 | | | | 625,000 | | | | 623,438 | |
The accompanying notes are an integral part of these financial statements.
| | | | |
| 20 | | Wells Fargo Strategic Municipal Bond Fund | | Portfolio of investments—June 30, 2016 |
| | | | | | | | | | | | | | | | |
| Security name | | Interest rate | | | Maturity date | | | Principal | | | Value | |
| | | | |
| New York (continued) | | | | | | | | | | | | | | | | |
New York Metropolitan Transportation Authority Dedicated Tax Fund (Tax Revenue) ± | | | 1.36 | % | | | 11-1-2019 | | | $ | 7,500,000 | | | $ | 7,503,900 | |
New York NY Energy Research & Development Authority Gas Facilities Brooklyn Union Gas Project Series A1 (Utilities Revenue, National Insured) ±(m)(n) | | | 0.75 | | | | 12-1-2020 | | | | 8,250,000 | | | | 7,899,375 | |
New York NY Industrial Development Agency Congregation Machine Chaim Incorporated (Miscellaneous Revenue, Santander Bank NA LOC) ø | | | 0.68 | | | | 5-1-2036 | | | | 7,050,000 | | | | 7,050,000 | |
New York NY John F. Kennedy International Airport Project Series B (Industrial Development Revenue) ± | | | 2.00 | | | | 8-1-2028 | | | | 2,800,000 | | | | 2,797,144 | |
New York NY Series A-6 (GO Revenue, AGM Insured, Dexia Credit Local SPA) ø | | | 0.55 | | | | 11-1-2026 | | | | 7,000,000 | | | | 7,000,000 | |
New York NY Series J-4 (GO Revenue) ± | | | 0.96 | | | | 8-1-2025 | | | | 6,700,000 | | | | 6,700,201 | |
New York NY Transitional Finance Authority Sub Series 2B (Tax Revenue, Dexia Credit Local SPA) ø | | | 0.54 | | | | 11-1-2022 | | | | 5,000,000 | | | | 5,000,000 | |
New York NY Transitional Finance Authority Sub Series 2E (Tax Revenue, Dexia Credit Local SPA) ø | | | 0.64 | | | | 11-1-2022 | | | | 3,005,000 | | | | 3,005,000 | |
New York NY Transitional Finance Authority Sub Series A3 (Tax Revenue, Dexia Credit Local SPA) ø | | | 0.55 | | | | 8-1-2023 | | | | 16,050,000 | | | | 16,050,000 | |
New York NY Transitional Finance Authority Sub Series C3 (Tax Revenue, Dexia Credit Local SPA) ø | | | 0.54 | | | | 8-1-2031 | | | | 10,000,000 | | | | 10,000,000 | |
New York Tobacco Settlement Financing Corporation Series A (Tobacco Revenue) | | | 5.00 | | | | 6-1-2022 | | | | 3,000,000 | | | | 3,116,220 | |
New York Tobacco Settlement Financing Corporation Series B (Tobacco Revenue) | | | 5.00 | | | | 6-1-2021 | | | | 9,500,000 | | | | 9,869,360 | |
New York Transportation Development Corporation American Airlines Incorporated John F Kennedy International Airport Project Series 2016 (Airport Revenue) | | | 5.00 | | | | 8-1-2026 | | | | 2,750,000 | | | | 3,041,748 | |
New York Transportation Development Corporation American Airlines Incorporated John F Kennedy International Airport Project Series 2016 (Airport Revenue) | | | 5.00 | | | | 8-1-2020 | | | | 8,000,000 | | | | 8,804,800 | |
New York Urban Development Corporation Certificate of Participation James A Farley Post Office Project (Miscellaneous Revenue) 144A | | | 4.20 | | | | 2-1-2017 | | | | 13,950,000 | | | | 13,955,580 | |
New York Urban Development Corporation Personal Income Tax Series A (Tax Revenue) | | | 5.00 | | | | 3-15-2020 | | | | 10,000,000 | | | | 11,523,400 | |
Niagara NY Area Development Corporation (Education Revenue) | | | 5.00 | | | | 5-1-2017 | | | | 250,000 | | | | 257,863 | |
Niagara NY Area Development Corporation (Education Revenue) | | | 5.00 | | | | 5-1-2018 | | | | 500,000 | | | | 533,830 | |
Oyster Bay NY (GO Revenue) | | | 3.75 | | | | 3-31-2017 | | | | 1,350,000 | | | | 1,362,366 | |
Suffolk County NY Economic Development Corporation (Health Revenue) | | | 5.00 | | | | 7-1-2017 | | | | 1,000,000 | | | | 1,041,350 | |
Suffolk County NY Tobacco Asset Securitization Corporation (Tobacco Revenue) | | | 5.00 | | | | 6-1-2019 | | | | 575,000 | | | | 637,698 | |
Suffolk County NY Tobacco Asset Securitization Corporation (Tobacco Revenue) | | | 5.00 | | | | 6-1-2020 | | | | 625,000 | | | | 710,938 | |
Suffolk County NY Village of Ocean Beach BAN (GO Revenue) | | | 2.00 | | | | 4-13-2017 | | | | 4,000,000 | | | | 4,035,840 | |
Ulster County NY Resource Recovery Agency (Resource Recovery Revenue) | | | 3.00 | | | | 3-1-2017 | | | | 900,000 | | | | 911,916 | |
| | | | |
| | | | | | | | | | | | | | | 174,975,044 | |
| | | | | | | | | | | | | | | | |
| | | | |
| North Carolina: 0.10% | | | | | | | | | | | | | | | | |
North Carolina Capital Finance Republic Services Incorporated Project Series 2013 (Resource Recovery Revenue) ± | | | 0.80 | | | | 6-1-2038 | | | | 1,975,000 | | | | 1,975,000 | |
| | | | | | | | | | | | | | | | |
| | | | |
| North Dakota: 0.06% | | | | | | | | | | | | | | | | |
Ward County ND Health Care Facility Trinity Obligated Group Series B (Health Revenue) | | | 6.25 | | | | 7-1-2021 | | | | 1,080,000 | | | | 1,085,000 | |
| | | | | | | | | | | | | | | | |
| | | | |
| Ohio: 2.67% | | | | | | | | | | | | | | | | |
Akron OH Sanitary Sewer System Improvement Project (Water & Sewer Revenue, Ambac Insured) | | | 5.00 | | | | 12-1-2017 | | | | 750,000 | | | | 791,242 | |
The accompanying notes are an integral part of these financial statements.
| | | | | | |
| Portfolio of investments—June 30, 2016 | | Wells Fargo Strategic Municipal Bond Fund | | | 21 | |
| | | | | | | | | | | | | | | | |
| Security name | | Interest rate | | | Maturity date | | | Principal | | | Value | |
| | | | |
| Ohio (continued) | | | | | | | | | | | | | | | | |
Alliance OH Hospital Alliance Obligated Group (HCFR, Radian Insured) (Health Revenue, JPMorgan Chase & Company LOC, AGC Insured) ± | | | 0.35 | % | | | 12-1-2032 | | | $ | 4,650,000 | | | $ | 4,650,000 | |
Cleveland OH Airport System Series B (Airport Revenue, AGM Insured) %% | | | 5.00 | | | | 1-1-2022 | | | | 3,270,000 | | | | 3,798,497 | |
Cleveland OH Airport System Series B (Airport Revenue, AGM Insured) %% | | | 5.00 | | | | 1-1-2023 | | | | 3,010,000 | | | | 3,562,546 | |
Cleveland OH Airport System Series B (Airport Revenue, AGM Insured) %% | | | 5.00 | | | | 1-1-2024 | | | | 2,100,000 | | | | 2,530,668 | |
Cleveland OH Airport System Series C (Airport Revenue, AGM Insured) | | | 5.00 | | | | 1-1-2020 | | | | 1,000,000 | | | | 1,022,310 | |
Cleveland OH Airport System Series C (Airport Revenue, AGM Insured) | | | 5.00 | | | | 1-1-2022 | | | | 5,000,000 | | | | 5,111,550 | |
Ohio Air Quality Development Authority PCR Facilities Refunding Bond FirstEnergy Generation Project (Resource Recovery Revenue) ± | | | 3.10 | | | | 3-1-2023 | | | | 2,000,000 | | | | 2,020,940 | |
Ohio University Hospital Health System Series B (Health Revenue) ø | | | 0.72 | | | | 1-15-2045 | | | | 10,000,000 | | | | 10,000,000 | |
Ohio University Hospital Health System Series B (Health Revenue) ø | | | 0.72 | | | | 1-15-2033 | | | | 5,000,000 | | | | 5,000,000 | |
Ohio Water Development Authority First Energy Nuclear Generation Project Series A (Water & Sewer Revenue) | | | 3.00 | | | | 5-15-2019 | | | | 7,000,000 | | | | 7,059,500 | |
Ohio Water Development Authority Series A (Industrial Development Revenue) ± | | | 3.75 | | | | 7-1-2033 | | | | 5,000,000 | | | | 5,142,350 | |
| | | | |
| | | | | | | | | | | | | | | 50,689,603 | |
| | | | | | | | | | | | | | | | |
| | | | |
| Oklahoma: 0.15% | | | | | | | | | | | | | | | | |
Comanche County OK Hospital Authority Series A (Health Revenue) | | | 5.00 | | | | 7-1-2018 | | | | 795,000 | | | | 834,543 | |
Woodward County OK PFFA Series B (Tax Revenue) | | | 3.25 | | | | 9-1-2026 | | | | 2,000,000 | | | | 2,025,200 | |
| | | | |
| | | | | | | | | | | | | | | 2,859,743 | |
| | | | | | | | | | | | | | | | |
| | | | |
| Oregon: 0.16% | | | | | | | | | | | | | | | | |
Polk County OR Hospital Facility Authority Dallas Retirement Village Project Series A (Health Revenue) | | | 3.63 | | | | 7-1-2020 | | | | 3,000,000 | | | | 3,013,800 | |
| | | | | | | | | | | | | | | | |
| | | | |
| Other: 0.10% | | | | | | | | | | | | | | | | |
Public Housing Capital Fund Trust II (Miscellaneous Revenue, HUD Insured) 144A | | | 4.50 | | | | 7-1-2022 | | | | 1,894,791 | | | | 1,974,543 | |
| | | | | | | | | | | | | | | | |
| | | | |
| Pennsylvania: 4.46% | | | | | | | | | | | | | | | | |
Allegheny County PA Penn Hills School District Series 2015 (GO Revenue, Build America Mutual Assurance Company Insured) | | | 5.00 | | | | 11-15-2023 | | | | 1,025,000 | | | | 1,206,312 | |
Allegheny County PA Penn Hills Schools District Series 2015 (GO Revenue, Build America Mutual Assurance Company Insured) | | | 5.00 | | | | 11-15-2022 | | | | 340,000 | | | | 394,138 | |
Beaver County PA IDA FirstEnergy Generation Series B (Industrial Development Revenue) ± | | | 3.50 | | | | 12-1-2035 | | | | 2,000,000 | | | | 2,037,420 | |
Berks County PA Municipal Authority Reading Hospital & Medical Center Project Series B (Health Revenue) | | | 1.93 | | | | 11-1-2039 | | | | 8,750,000 | | | | 8,819,212 | |
Delaware County PA IDA Chester Charter School Series A (Education Revenue) 144A | | | 4.38 | | | | 6-1-2026 | | | | 1,785,000 | | | | 1,819,522 | |
Delaware County PA IDA Chester Community Charter School (Education Revenue) | | | 4.50 | | | | 8-15-2017 | | | | 2,035,000 | | | | 2,058,748 | |
Delaware Valley PA Regional Finance Authority (Miscellaneous Revenue) | | | 5.75 | | | | 7-1-2017 | | | | 1,191,000 | | | | 1,249,645 | |
Fulton County PA IDA Medical Center Project (Health Revenue) | | | 2.40 | | | | 7-1-2020 | | | | 3,125,000 | | | | 3,164,406 | |
Montgomery County PA HEFAR Arcadia University (Education Revenue) | | | 5.00 | | | | 4-1-2022 | | | | 1,575,000 | | | | 1,818,716 | |
Montgomery County PA HEFAR Arcadia University (Education Revenue) | | | 5.00 | | | | 4-1-2023 | | | | 1,655,000 | | | | 1,941,729 | |
Montgomery County PA IDA Peco Energy Company Project Series A (Industrial Development Revenue) ± | | | 2.60 | | | | 3-1-2034 | | | | 7,500,000 | | | | 7,739,850 | |
Montgomery County PA IDA Peco Energy Company Project Series B (Industrial Development Revenue) ± | | | 2.55 | | | | 6-1-2029 | | | | 10,340,000 | | | | 10,576,889 | |
Pennsylvania EDFA Solid Waste Disposal Republic Services Incorporated Project (Resource Recovery Revenue) ± | | | 0.90 | | | | 6-1-2044 | | | | 2,000,000 | | | | 2,000,000 | |
Pennsylvania HEFAR Shippensburg University Student Services (Education Revenue) | | | 4.00 | | | | 10-1-2017 | | | | 550,000 | | | | 564,564 | |
The accompanying notes are an integral part of these financial statements.
| | | | |
| 22 | | Wells Fargo Strategic Municipal Bond Fund | | Portfolio of investments—June 30, 2016 |
| | | | | | | | | | | | | | | | |
| Security name | | Interest rate | | | Maturity date | | | Principal | | | Value | |
| | | | |
| Pennsylvania (continued) | | | | | | | | | | | | | | | | |
Pennsylvania Public School Building Authority (Miscellaneous Revenue) | | | 5.00 | % | | | 4-1-2019 | | | $ | 4,650,000 | | | $ | 5,041,251 | |
Pennsylvania Public School Building Authority Albert Gallatin Area School District Project (Miscellaneous Revenue) ± | | | 1.11 | | | | 9-1-2024 | | | | 4,235,000 | | | | 4,234,915 | |
Pennsylvania Turnpike Commission Series A (Transportation Revenue) ± | | | 1.09 | | | | 12-1-2018 | | | | 11,150,000 | | | | 11,132,829 | |
Pennsylvania Turnpike Commission Series B (Transportation Revenue) ± | | | 1.66 | | | | 12-1-2020 | | | | 10,000,000 | | | | 10,088,400 | |
Philadelphia PA Authority for Industrial Development Tacony Academy Christian School Project Series A-1 (Education Revenue) | | | 6.25 | | | | 6-15-2023 | | | | 730,000 | | | | 830,317 | |
Philadelphia PA Hospital & HEFAR Temple University Health System Series B (Health Revenue) | | | 5.00 | | | | 7-1-2017 | | | | 1,500,000 | | | | 1,553,280 | |
Philadelphia PA School District Series B (GO Revenue) | | | 3.13 | | | | 9-1-2020 | | | | 200,000 | | | | 206,462 | |
Philadelphia PA School District Series E (GO Revenue) | | | 5.25 | | | | 9-1-2023 | | | | 5,770,000 | | | | 6,353,462 | |
| | | | |
| | | | | | | | | | | | | | | 84,832,067 | |
| | | | | | | | | | | | | | | | |
| | | | |
| Puerto Rico: 1.39% | | | | | | | | | | | | | | | | |
Puerto Rico Aqueduct & Sewer Authority Series A (Water & Sewer Revenue, AGC Insured) | | | 5.00 | | | | 7-1-2016 | | | | 5,190,000 | | | | 5,190,571 | |
Puerto Rico CAB Refunding Bonds (Miscellaneous Revenue, National Insured) ¤ | | | 0.00 | | | | 7-1-2016 | | | | 400,000 | | | | 399,928 | |
Puerto Rico Electric Power Authority Refunding Bond Series LL (Utilities Revenue, National Insured) | | | 5.50 | | | | 7-1-2017 | | | | 1,000,000 | | | | 1,035,570 | |
Puerto Rico Electric Power Authority Refunding Bond Series UU (Utilities Revenue, AGM Insured) | | | 5.00 | | | | 7-1-2016 | | | | 1,015,000 | | | | 1,015,081 | |
Puerto Rico Electric Power Authority Series L (Utilities Revenue, National Insured) | | | 5.50 | | | | 7-1-2016 | | | | 2,740,000 | | | | 2,740,274 | |
Puerto Rico Highway & Transportation Authority Series A (Tax Revenue, Ambac Insured) ¤ | | | 0.00 | | | | 7-1-2017 | | | | 1,890,000 | | | | 1,821,960 | |
Puerto Rico Highway & Transportation Authority Series BB (Transportation Revenue, Ambac Insured) | | | 5.25 | | | | 7-1-2017 | | | | 3,185,000 | | | | 3,223,124 | |
Puerto Rico Industrial Tourist Educational Medical & Environmental Control Facilities Financing Authority Hospital Auxilio Mutuo Obligated Group Series A (Health Revenue) | | | 5.00 | | | | 7-1-2019 | | | | 1,840,000 | | | | 1,948,174 | |
Puerto Rico Municipal Finance Authority Series C (Miscellaneous Revenue, AGM Insured) | | | 5.25 | | | | 8-1-2017 | | | | 300,000 | | | | 312,000 | |
Puerto Rico Municipal Finance Authority Series C (Tobacco Revenue, BHAC/FGIC Insured) | | | 5.50 | | | | 7-1-2020 | | | | 7,050,000 | | | | 8,023,817 | |
Puerto Rico Public Finance Corporation Commonwealth Appropriation Bond Series B (Miscellaneous Revenue, Government Development Bank for Puerto Rico SPA) (s) | | | 5.50 | | | | 8-1-2031 | | | | 2,800,000 | | | | 322,000 | |
Puerto Rico Series PA-650 (Tax Revenue, National Insured) | | | 6.00 | | | | 7-1-2016 | | | | 325,000 | | | | 325,036 | |
| | | | |
| | | | | | | | | | | | | | | 26,357,535 | |
| | | | | | | | | | | | | | | | |
| | | | |
| Rhode Island: 0.43% | | | | | | | | | | | | | | | | |
Providence RI RDA Series A (Miscellaneous Revenue) | | | 5.00 | | | | 4-1-2022 | | | | 1,940,000 | | | | 2,245,899 | |
Providence RI RDA Series A (Miscellaneous Revenue) | | | 5.00 | | | | 4-1-2023 | | | | 1,585,000 | | | | 1,857,446 | |
Rhode Island Clean Water Finance Agency Cranston Wastewater Treatment System (Miscellaneous Revenue, National Insured) | | | 5.80 | | | | 9-1-2022 | | | | 975,000 | | | | 977,057 | |
Rhode Island Housing & Mortgage Finance (Housing Revenue) | | | 6.50 | | | | 4-1-2027 | | | | 15,000 | | | | 15,130 | |
Tobacco Settlement Financing Corporation Series A (Tobacco Revenue) | | | 2.25 | | | | 6-1-2041 | | | | 3,135,000 | | | | 3,156,475 | |
| | | | |
| | | | | | | | | | | | | | | 8,252,007 | |
| | | | | | | | | | | | | | | | |
| | | | |
| South Carolina: 1.57% | | | | | | | | | | | | | | | | |
Berkeley County SC Nucor Corporation Project (Industrial Development Revenue) ø | | | 0.70 | | | | 9-1-2028 | | | | 12,700,000 | | | | 12,700,000 | |
The accompanying notes are an integral part of these financial statements.
| | | | | | |
| Portfolio of investments—June 30, 2016 | | Wells Fargo Strategic Municipal Bond Fund | | | 23 | |
| | | | | | | | | | | | | | | | |
| Security name | | Interest rate | | | Maturity date | | | Principal | | | Value | |
| | | | |
| South Carolina (continued) | | | | | | | | | | | | | | | | |
Royal Bank of Canada Municipal Products Incorporated Trust Floater Series O-9 (Utilities Revenue, Royal Bank of Canada LIQ) 144Aø | | | 0.50 | % | | | 7-1-2018 | | | $ | 9,300,000 | | | $ | 9,300,000 | |
South Carolina Jobs EDA Brashier Charter LLC Project (Education Revenue, SunTrust Bank LOC) ø | | | 0.48 | | | | 12-1-2038 | | | | 6,860,000 | | | | 6,860,000 | |
South Carolina Jobs EDA York Preparatory Academy Project Series A (Education Revenue) | | | 5.75 | | | | 11-1-2023 | | | | 985,000 | | | | 1,059,230 | |
| | | | |
| | | | | | | | | | | | | | | 29,919,230 | |
| | | | | | | | | | | | | | | | |
| | | | |
| South Dakota: 0.06% | | | | | | | | | | | | | | | | |
South Dakota HEFA (Health Revenue) | | | 4.50 | | | | 9-1-2019 | | | | 990,000 | | | | 1,070,685 | |
| | | | | | | | | | | | | | | | |
| | | | |
| Tennessee: 1.13% | | | | | | | | | | | | | | | | |
Shelby County TN Health Educational & Housing Facilities Board Methodist Le Bonheur Series B (Health Revenue, AGM Insured, U.S. Bank NA SPA) ø | | | 0.38 | | | | 6-1-2042 | | | | 10,000,000 | | | | 10,000,000 | |
Tennessee Energy Acquisition Corporation Series A (Utilities Revenue) | | | 5.25 | | | | 9-1-2017 | | | | 1,655,000 | | | | 1,732,719 | |
Tennessee Energy Acquisition Corporation Series A (Utilities Revenue) | | | 5.25 | | | | 9-1-2018 | | | | 4,000,000 | | | | 4,342,240 | |
Tennessee Energy Acquisition Corporation Series A (Utilities Revenue) | | | 5.25 | | | | 9-1-2020 | | | | 4,720,000 | | | | 5,430,643 | |
| | | | |
| | | | | | | | | | | | | | | 21,505,602 | |
| | | | | | | | | | | | | | | | |
| | | | |
| Texas: 7.88% | | | | | | | | | | | | | | | | |
Austin TX Airport Systems Bond (Airport Revenue) | | | 5.00 | | | | 11-15-2026 | | | | 1,655,000 | | | | 2,023,055 | |
Austin TX Community College District Series A (Education Revenue) | | | 4.00 | | | | 2-1-2023 | | | | 300,000 | | | | 347,745 | |
Central Texas Regional Mobility Authority Senior Lien Series A (Transportation Revenue) | | | 5.00 | | | | 1-1-2021 | | | | 1,000,000 | | | | 1,167,040 | |
Central Texas Regional Mobility Authority Senior Lien Series A (Transportation Revenue) | | | 5.00 | | | | 1-1-2023 | | | | 500,000 | | | | 607,005 | |
Clifton TX Higher Education Finance Corporation International Leadership Series 2015A (Education Revenue) | | | 4.63 | | | | 8-15-2025 | | | | 8,905,000 | | | | 9,502,080 | |
Clifton TX Higher Education Finance Corporation Uplift Education Series A (Education Revenue) | | | 4.00 | | | | 12-1-2025 | | | | 3,740,000 | | | | 4,163,817 | |
Coastal Water Authority Texas Conveyance System (Water & Sewer Revenue, FGIC Insured) | | | 7.50 | | | | 12-15-2016 | | | | 20,000 | | | | 20,123 | |
Galveston TX Wharves & Terminal (Airport Revenue) | | | 5.00 | | | | 2-1-2017 | | | | 1,100,000 | | | | 1,123,760 | |
Guadalupe County TX City of Seguin Board of Managers Hospital Mortgage Refunding and Improvement Bonds Series 2015 (Health Revenue) | | | 5.00 | | | | 12-1-2016 | | | | 1,000,000 | | | | 1,016,610 | |
Guadalupe County TX City of Seguin Board of Managers Hospital Mortgage Refunding and Improvement Bonds Series 2015 (Health Revenue) | | | 5.00 | | | | 12-1-2017 | | | | 725,000 | | | | 760,815 | |
Houston TX Independent School District Series B (GO Revenue) ± | | | 1.70 | | | | 6-1-2036 | | | | 14,000,000 | | | | 14,209,440 | |
Houston TX Midtown RDA Series 2011 (Tax Revenue) | | | 5.00 | | | | 1-1-2017 | | | | 2,270,000 | | | | 2,314,855 | |
Houston TX Public Improvement Refunding Bonds Series A (GO Revenue) | | | 5.00 | | | | 3-1-2020 | | | | 11,000,000 | | | | 12,575,640 | |
Hunt TX Memorial Hospital Series 1998 (Health Revenue, AGM Insured, JPMorgan Chase & Company SPA) ø | | | 0.53 | | | | 8-15-2017 | | | | 2,725,000 | | | | 2,725,000 | |
Lewisville TX Independent School District Series B (GO Revenue) | | | 5.00 | | | | 8-15-2024 | | | | 5,290,000 | | | | 6,634,771 | |
Mesquite TX Health Facilities Development Corporation Christian Care Centers Incorporated Project Series 2016 (Health Revenue) | | | 1.75 | | | | 2-15-2018 | | | | 250,000 | | | | 250,538 | |
Mesquite TX Health Facilities Development Corporation Christian Care Centers Incorporated Project Series 2016 (Health Revenue) | | | 1.40 | | | | 2-15-2017 | | | | 225,000 | | | | 224,975 | |
Mesquite TX Health Facilities Development Corporation Christian Care Centers Incorporated Project Series 2016 (Health Revenue) | | | 1.95 | | | | 2-15-2019 | | | | 250,000 | | | | 251,340 | |
Mesquite TX Health Facilities Development Corporation Christian Care Centers Incorporated Project Series 2016 (Health Revenue) | | | 5.00 | | | | 2-15-2020 | | | | 810,000 | | | | 899,351 | |
The accompanying notes are an integral part of these financial statements.
| | | | |
| 24 | | Wells Fargo Strategic Municipal Bond Fund | | Portfolio of investments—June 30, 2016 |
| | | | | | | | | | | | | | | | |
| Security name | | Interest rate | | | Maturity date | | | Principal | | | Value | |
| | | | |
| Texas (continued) | | | | | | | | | | | | | | | | |
Mesquite TX Health Facilities Development Corporation Christian Care Centers Incorporated Project Series 2016 (Health Revenue) | | | 5.00 | % | | | 2-15-2021 | | | $ | 560,000 | | | $ | 634,911 | |
Newark TX Higher Educational Finance Corporation Charter Schools Incorporated Series 2015 A (Education Revenue) 144A | | | 4.63 | | | | 8-15-2025 | | | | 1,485,000 | | | | 1,559,948 | |
North Texas Higher Education Authority Incorporated Student Loan Series 2 Class A (Education Revenue) ± | | | 1.63 | | | | 4-1-2037 | | | | 2,225,000 | | | | 2,225,267 | |
North Texas Tollway Authority System Refunding Bonds Series C (Transportation Revenue) ± | | | 1.06 | | | | 1-1-2038 | | | | 3,550,000 | | | | 3,524,121 | |
Pearland TX Permanent Improvement Series 2015 (GO Revenue) | | | 5.00 | | | | 3-1-2021 | | | | 1,000,000 | | | | 1,180,560 | |
Port Arthur TX Navigation District Jefferson County Environmental Facilities Motiva Enterprises LLC Project Series A (Resource Recovery Revenue) ø | | | 0.52 | | | | 4-1-2040 | | | | 5,700,000 | | | | 5,700,000 | |
Port Arthur TX Navigation District Jefferson County Environmental Facilities Motiva Enterprises LLC Project Series C (Resource Recovery Revenue) ø | | | 0.53 | | | | 4-1-2040 | | | | 3,100,000 | | | | 3,100,000 | |
Port Arthur TX Navigation District Jefferson County Environmental Facilities Motiva Enterprises LLC Project Series D (Resource Recovery Revenue) ± | | | 0.52 | | | | 11-1-2040 | | | | 10,000,000 | | | | 10,000,000 | |
Port Arthur TX Navigation District Jefferson County Environmental Facilities Motiva Enterprises LLC Project Series D (Resource Recovery Revenue) ø | | | 0.53 | | | | 11-1-2040 | | | | 8,000,000 | | | | 8,000,000 | |
Sam Rayburn TX Municipal Power Agency Bonds Series 2012 (Utilities Revenue) | | | 5.00 | | | | 10-1-2017 | | | | 560,000 | | | | 588,672 | |
Tarrant County TX Cultural Education Facilities Finance Corporation Series 2974 (Health Revenue, Credit Suisse LIQ) 144Aø | | | 0.61 | | | | 11-15-2029 | | | | 2,700,000 | | | | 2,700,000 | |
Tender Option Bond Trust Receipts Floaters Series 2015 (Transportation Revenue, Barclays Bank plc LIQ) 144Aø | | | 0.67 | | | | 7-1-2021 | | | | 10,500,000 | | | | 10,500,000 | |
Tennessee Energy Acquisition Corporation Series C (Utilities Revenue) | | | 5.00 | | | | 2-1-2017 | | | | 1,010,000 | | | | 1,034,210 | |
Texas Municipal Gas Acquisition & Supply Corporation II Series B (Utilities Revenue, JPMorgan Chase & Company Guaranteed) ± | | | 0.88 | | | | 9-15-2017 | | | | 4,465,000 | | | | 4,448,792 | |
Texas New Hope ECFA Collegiate Housing Tarleton State University Series A (Housing Revenue) | | | 4.00 | | | | 4-1-2020 | | | | 185,000 | | | | 199,073 | |
Texas New Hope ECFA Collegiate Housing Tarleton State University Series A (Housing Revenue) | | | 4.00 | | | | 4-1-2021 | | | | 310,000 | | | | 337,674 | |
Texas New Hope ECFA Collegiate Housing Tarleton State University Series A (Housing Revenue) | | | 4.00 | | | | 4-1-2022 | | | | 430,000 | | | | 472,084 | |
Texas New Hope ECFA Collegiate Housing Tarleton State University Series A (Housing Revenue) | | | 5.00 | | | | 4-1-2025 | | | | 480,000 | | | | 571,714 | |
Texas PFA Southern University Financing System (Education Revenue, Build America Mutual Assurance Company Insured) | | | 5.00 | | | | 11-1-2020 | | | | 1,715,000 | | | | 1,931,913 | |
Texas PFA Southern University Financing System (Education Revenue, Build America Mutual Assurance Company Insured) | | | 5.00 | | | | 11-1-2021 | | | | 1,275,000 | | | | 1,459,748 | |
Texas Transportation Commission State Highway Fund Floating 1st Tier Series B (Transportation Revenue, Banco Bilboa Vizcaya SPA) ø | | | 0.65 | | | | 4-1-2026 | | | | 13,000,000 | | | | 13,000,000 | |
Weslaco TX Health Facilities Development Various Refunding and Improvement Knapp Medical Center Series A (Health Revenue, Compass Bank LOC) ø | | | 0.74 | | | | 6-1-2038 | | | | 6,480,000 | | | | 6,480,000 | |
Weslaco TX Health Facilities Development Various Refunding and Improvement Knapp Medical Center Series B (Health Revenue, Compass Bank LOC) ø | | | 0.74 | | | | 6-1-2031 | | | | 6,795,000 | | | | 6,795,000 | |
Wood Glen TX Housing Finance Corporation Mortgage Copperwood Project Series A (Miscellaneous Revenue, National/FHA Insured) | | | 7.65 | | | | 7-1-2022 | | | | 2,125,000 | | | | 2,614,260 | |
| | | | |
| | | | | | | | | | | | | �� | | 149,875,907 | |
| | | | | | | | | | | | | | | | |
| | | | |
| Vermont: 1.01% | | | | | | | | | | | | | | | | |
Vermont Student Assistance Corporation Education Loan Series A (Education Revenue) | | | 5.00 | | | | 6-15-2021 | | | | 1,800,000 | | | | 2,043,162 | |
Vermont Student Assistance Corporation Education Loan Series A (Education Revenue) | | | 5.00 | | | | 6-15-2022 | | | | 550,000 | | | | 630,207 | |
The accompanying notes are an integral part of these financial statements.
| | | | | | |
| Portfolio of investments—June 30, 2016 | | Wells Fargo Strategic Municipal Bond Fund | | | 25 | |
| | | | | | | | | | | | | | | | |
| Security name | | Interest rate | | | Maturity date | | | Principal | | | Value | |
| | | | |
| Vermont (continued) | | | | | | | | | | | | | | | | |
Vermont Student Assistance Corporation Education Loan Series A (Education Revenue) | | | 5.00 | % | | | 6-15-2023 | | | $ | 1,200,000 | | | $ | 1,396,944 | |
Vermont Student Assistance Corporation Series B Class B (Education Revenue) ± | | | 1.46 | | | | 6-2-2042 | | | | 11,713,564 | | | | 11,502,486 | |
Vermont Student Assistance Corporation Series BCL-A1 (Education Revenue) ± | | | 2.18 | | | | 6-1-2022 | | | | 3,654,548 | | | | 3,696,064 | |
| | | | |
| | | | | | | | | | | | | | | 19,268,863 | |
| | | | | | | | | | | | | | | | |
| | | | |
| Virgin Islands: 0.09% | | | | | | | | | | | | | | | | |
Virgin Islands PFA Sub Lien Series C (Miscellaneous Revenue) | | | 5.00 | | | | 10-1-2017 | | | | 1,600,000 | | | | 1,662,496 | |
| | | | | | | | | | | | | | | | |
| | | | |
| Virginia: 1.23% | | | | | | | | | | | | | | | | |
Caroline County VA Industrial Development Public Facility Lease BAN (Miscellaneous Revenue) | | | 4.00 | | | | 8-1-2016 | | | | 1,800,000 | | | | 1,803,402 | |
Dulles VA Town Center CDA (Miscellaneous Revenue) | | | 4.00 | | | | 3-1-2017 | | | | 1,910,000 | | | | 1,933,818 | |
Louisa VA Electric and Power IDA Series 2008B (Utilities Revenue) ± | | | 2.15 | | | | 11-1-2035 | | | | 19,000,000 | | | | 19,712,690 | |
| | | | |
| | | | | | | | | | | | | | | 23,449,910 | |
| | | | | | | | | | | | | | | | |
| | | | |
| Washington: 2.08% | | | | | | | | | | | | | | | | |
King County WA Sewer Series B (Water & Sewer Revenue, Landesbank Hessen-Thüringen LOC) ± | | | 0.42 | | | | 1-1-2032 | | | | 6,000,000 | | | | 6,000,000 | |
Redmond WA Library Capital Facilities Area (GO Revenue) | | | 5.00 | | | | 12-1-2017 | | | | 200,000 | | | | 200,804 | |
Washington Eclipse Funding Trust Various States Solar Eclipse (Miscellaneous Revenue, U.S. Bank NA LOC, U.S. Bank NA LIQ) 144Aø | | | 0.42 | | | | 12-1-2031 | | | | 9,945,000 | | | | 9,945,000 | |
Washington HCFR Catholic Health Initiatives Series B (Health Revenue) ± | | | 1.81 | | | | 1-1-2035 | | | | 15,000,000 | | | | 14,867,700 | |
Washington Housing Finance Commission Nonprofit Housing Bonds Heron’s Key Senior Living Series B3 (Health Revenue) 144A | | | 4.38 | | | | 1-1-2021 | | | | 1,625,000 | | | | 1,650,041 | |
Washington Housing Finance Commission Wesley Homes (Health Revenue, AGC Insured) | | | 5.63 | | | | 1-1-2022 | | | | 6,545,000 | | | | 6,914,531 | |
| | | | |
| | | | | | | | | | | | | | | 39,578,076 | |
| | | | | | | | | | | | | | | | |
| | | | |
| West Virginia: 0.28% | | | | | | | | | | | | | | | | |
West Virginia EDA Solid Waste Disposal Appalachian Power Company (Utilities Revenue, Mizuho Corporate Bank LOC) ø | | | 0.72 | | | | 2-1-2036 | | | | 5,275,000 | | | | 5,275,000 | |
| | | | | | | | | | | | | | | | |
| | | | |
| Wisconsin: 2.23% | | | | | | | | | | | | | | | | |
Franklin WI Waste Management Series A (Resource Recovery Revenue) | | | 1.00 | | | | 11-1-2016 | | | | 15,000,000 | | | | 15,005,100 | |
Milwaukee WI RDA Public Schools Series A (Miscellaneous Revenue) | | | 5.00 | | | | 8-1-2019 | | | | 3,800,000 | | | | 4,253,758 | |
Milwaukee WI RDA Science Education Consortium Incorporated Project Series A (Education Revenue) | | | 4.75 | | | | 8-1-2023 | | | | 1,140,000 | | | | 1,261,102 | |
Pine Lake WI PFA Preparatory Series 2015 (Education Revenue) 144A | | | 4.35 | | | | 3-1-2025 | | | | 2,710,000 | | | | 2,874,199 | |
Wisconsin HEFA Bellin Memorial Hospital Series 2015 (Health Revenue) | | | 3.00 | | | | 12-1-2020 | | | | 720,000 | | | | 770,630 | |
Wisconsin HEFA Bellin Memorial Hospital Series 2015 (Health Revenue) | | | 5.00 | | | | 12-1-2022 | | | | 755,000 | | | | 915,966 | |
Wisconsin HEFA Wheaton Franciscan Healthcare Series A (Health Revenue) | | | 5.25 | | | | 8-15-2034 | | | | 10,000,000 | | | | 10,057,800 | |
Wisconsin PFA Airport Series C (Airport Revenue) | | | 5.00 | | | | 7-1-2022 | | | | 2,700,000 | | | | 2,964,438 | |
Wisconsin Residual Interest Bonds Floater Trust Various States Series 2WE (Miscellaneous Revenue, Barclays Bank plc LOC) 144Aø | | | 0.58 | | | | 5-1-2018 | | | | 4,310,000 | | | | 4,310,000 | |
| | | | |
| | | | | | | | | | | | | | | 42,412,993 | |
| | | | | | | | | | | | | | | | |
| | | | |
| Wyoming: 2.16% | | | | | | | | | | | | | | | | |
Gillette WY Customized Purchase Pollution Control Series 1988 (Industrial Development Revenue) ø | | | 0.47 | | | | 1-1-2018 | | | | 10,000,000 | | | | 10,000,000 | |
The accompanying notes are an integral part of these financial statements.
| | | | |
| 26 | | Wells Fargo Strategic Municipal Bond Fund | | Portfolio of investments—June 30, 2016 |
| | | | | | | | | | | | | | | | |
| Security name | | Interest rate | | | Maturity date | | | Principal | | | Value | |
| | | | |
| Wyoming (continued) | | | | | | | | | | | | | | | | |
Lincoln County WY PCR Refunding Bond PacifiCorp Project Series 1994 (Industrial Development Revenue) ø | | | 0.47 | % | | | 11-1-2024 | | | $ | 7,530,000 | | | $ | 7,530,000 | |
Sweetwater County WY PCR Refunding Bond PacifiCorp Project Series A (Industrial Development Revenue) ø | | | 0.52 | | | | 1-1-2017 | | | | 23,500,000 | | | | 23,500,000 | |
| | | | |
| | | | | | | | | | | | | | | 41,030,000 | |
| | | | | | | | | | | | | | | | |
| Total Municipal Obligations (Cost $1,776,671,195) | | | | | | | | | | | | | | | 1,805,825,739 | |
| | | | | | | | | | | | | | | | |
| | | | |
Yankee Corporate Bonds and Notes: 0.53% | | | | | | | | | | | | | | | | |
| | | | |
Financials: 0.53% | | | | | | | | | | | | | | | | |
| | | | |
| Banks: 0.53% | | | | | | | | | | | | | | | | |
HSBC Holdings plc | | | 4.25 | | | | 8-18-2025 | | | | 10,000,000 | | | | 10,095,510 | |
| | | | | | | | | | | | | | | | |
| | | | |
Total Yankee Corporate Bonds and Notes (Cost $9,994,900) | | | | | | | | | | | | | | | 10,095,510 | |
| | | | | | | | | | | | | | | | |
| | | | |
| Other: 0.56% | | | | | | | | | | | | | | | | |
Eaton Vance New York Municipal Income Trust | | | 1.91 | | | | 9-1-2019 | | | | 10,600,000 | | | | 10,616,112 | |
| | | | | | | | | | | | | | | | |
| | | | |
Total Other (Cost $10,600,000) | | | | | | | | | | | | | | | 10,616,112 | |
| | | | | | | | | | | | | | | | |
| | | Yield | | | | | | Shares | | | | |
| Short-Term Investments: 1.53% | | | | | | | | | | | | | | | | |
| | | | |
| Investment Companies: 1.44% | | | | | | | | | | | | | | | | |
Wells Fargo Municipal Cash Management Fund Institutional Class (l)(u)## | | | 0.30 | | | | | | | | 27,442,222 | | | | 27,442,222 | |
| | | | | | | | | | | | | | | | |
| | | | |
| | | | | | | | | Principal | | | | |
| U.S. Treasury Securities: 0.09% | | | | | | | | | | | | | | | | |
U.S. Treasury Bill #(z) | | | 0.26 | | | | 9-15-2016 | | | $ | 1,650,000 | | | | 1,649,246 | |
| | | | | | | | | | | | | | | | |
| | | | |
Total Short-Term Investments (Cost $29,091,295) | | | | | | | | | | | | | | $ | 29,091,468 | |
| | | | | | | | | | | | | | | | |
| | | | | | | | |
| | | | | | | | |
| Total investments in securities (Cost $1,826,357,390) * | | | 97.60 | % | | | 1,855,628,829 | |
Other assets and liabilities, net | | | 2.40 | | | | 45,536,041 | |
| | | | | | | | |
| Total net assets | | | 100.00 | % | | $ | 1,901,164,870 | |
| | | | | | | | |
The accompanying notes are an integral part of these financial statements.
| | | | | | |
| Portfolio of investments—June 30, 2016 | | Wells Fargo Strategic Municipal Bond Fund | | | 27 | |
| ø | Variable rate demand notes are subject to a demand feature which reduces the effective maturity. The maturity date shown represents the final maturity date of the security. The interest rate is determined and reset by the issuer daily, weekly, or monthly depending upon the terms of the security. The rate shown is the rate in effect at period end. |
| 144A | The security may be resold in transactions exempt from registration, normally to qualified institutional buyers, pursuant to Rule 144A under the Securities Act of 1933. |
| ¤ | The security is issued in zero coupon form with no periodic interest payments. |
| ± | Variable rate investment. The rate shown is the rate in effect at period end. |
| %% | The security is issued on a when-issued basis. |
| (m) | The security is an auction-rate security which has an interest rate that resets at predetermined short-term intervals through a Dutch auction. The rate shown is the rate in effect at period end. |
| (n) | The auction to set the interest rate on the security failed at period end due to insufficient investor interest. A failed auction does not itself cause a default. |
| (s) | The security is currently in default with regards to scheduled interest and/or principal payments. The Fund has stopped accruing interest on the security. |
| (l) | The issuer of the security is an affiliated person of the Fund as defined in the Investment Company Act of 1940. |
| (u) | The rate represents the 7-day annualized yield at period end. |
| ## | All or a portion of this security is segregated for when-issued securities. |
| # | All or a portion of this security is segregated as collateral for investments in derivative instruments. |
| (z) | Zero coupon security. The rate represents the current yield to maturity. |
| * | Cost for federal income tax purposes is $1,826,358,431 and unrealized gains (losses) consists of: |
| | | | |
Gross unrealized gains | | $ | 33,879,254 | |
Gross unrealized losses | | | (4,608,856 | ) |
| | | | |
Net unrealized gains | | $ | 29,270,398 | |
The accompanying notes are an integral part of these financial statements.
| | | | |
| 28 | | Wells Fargo Strategic Municipal Bond Fund | | Statement of assets and liabilities—June 30, 2016 |
| | | | |
| | | | |
| |
Assets | | | | |
Investments | | | | |
In unaffiliated securities, at value (cost $1,798,915,168) | | $ | 1,828,186,607 | |
In affiliated securities, at value (cost $27,442,222) | | | 27,442,222 | |
| | | | |
Total investments, at value (cost $1,826,357,390) | | | 1,855,628,829 | |
Receivable for investments sold | | | 49,711,052 | |
Receivable for Fund shares sold | | | 8,202,545 | |
Receivable for interest | | | 11,898,599 | |
Receivable for daily variation margin on open futures contracts | | | 56,651 | |
Prepaid expenses and other assets | | | 180,843 | |
| | | | |
Total assets | | | 1,925,678,519 | |
| | | | |
| |
Liabilities | | | | |
Dividends payable | | | 246,988 | |
Payable for investments purchased | | | 12,222,263 | |
Payable for Fund shares redeemed | | | 5,989,803 | |
Payable for daily variation margin on open futures contracts | | | 10,703 | |
Due to custodian | | | 4,920,781 | |
Management fee payable | | | 545,364 | |
Distribution fees payable | | | 95,979 | |
Administration fees payable | | | 185,385 | |
Accrued expenses and other liabilities | | | 296,383 | |
| | | | |
Total liabilities | | | 24,513,649 | |
| | | | |
Total net assets | | $ | 1,901,164,870 | |
| | | | |
| |
NET ASSETS CONSIST OF | | | | |
Paid-in capital | | $ | 1,865,284,071 | |
Overdistributed net investment income | | | (260,322 | ) |
Accumulated net realized gains on investments | | | 9,518,646 | |
Net unrealized gains on investments | | | 26,622,475 | |
| | | | |
Total net assets | | $ | 1,901,164,870 | |
| | | | |
| |
COMPUTATION OF NET ASSET VALUE AND OFFERING PRICE PER SHARE | | | | |
Net assets – Class A | | $ | 726,135,016 | |
Shares outstanding – Class A1 | | | 80,129,221 | |
Net asset value per share – Class A | | | $9.06 | |
Maximum offering price per share – Class A2 | | | $9.44 | |
Net assets – Class B | | $ | 629,069 | |
Shares outstanding – Class B1 | | | 69,595 | |
Net asset value per share – Class B | | | $9.04 | |
Net assets – Class C | | $ | 156,559,504 | |
Shares outstanding – Class C1 | | | 17,215,921 | |
Net asset value per share – Class C | | | $9.09 | |
Net assets – Administrator Class | | $ | 408,846,026 | |
Shares outstanding – Administrator Class1 | | | 45,131,246 | |
Net asset value per share – Administrator Class | | | $9.06 | |
Net assets – Institutional Class | | $ | 608,995,255 | |
Shares outstanding – Institutional Class1 | | | 67,214,530 | |
Net asset value per share – Institutional Class | | | $9.06 | |
| 1 | The Fund has an unlimited number of authorized shares. |
| 2 | Maximum offering price is computed as 100/96 of net asset value. On investments of $50,000 or more, the offering price is reduced. |
The accompanying notes are an integral part of these financial statements.
| | | | | | |
| Statement of operations—year ended June 30, 2016 | | Wells Fargo Strategic Municipal Bond Fund | | | 29 | |
| | | | |
| | | | |
| |
Investment income | | | | |
Interest | | $ | 38,457,796 | |
Dividends | | | 1,047,342 | |
Income from affiliated securities | | | 24,386 | |
| | | | |
Total investment income | | | 39,529,524 | |
| | | | |
| |
Expenses | | | | |
Management fee | | | 6,297,461 | |
Administration fees | | | | |
Class A | | | 1,033,624 | |
Class B | | | 1,418 | |
Class C | | | 244,775 | |
Administrator Class | | | 470,057 | |
Institutional Class | | | 337,751 | |
Shareholder servicing fees | | | | |
Class A | | | 1,615,037 | |
Class B | | | 2,216 | |
Class C | | | 382,461 | |
Administrator Class | | | 1,171,119 | |
Distribution fees | | | | |
Class B | | | 6,648 | |
Class C | | | 1,147,384 | |
Custody and accounting fees | | | 102,149 | |
Professional fees | | | 62,524 | |
Registration fees | | | 156,000 | |
Shareholder report expenses | | | 43,118 | |
Trustees’ fees and expenses | | | 7,971 | |
Other fees and expenses | | | 20,060 | |
| | | | |
Total expenses | | | 13,101,773 | |
Less: Fee waivers and/or expense reimbursements | | | (303,087 | ) |
| | | | |
Net expenses | | | 12,798,686 | |
| | | | |
Net investment income | | | 26,730,838 | |
| | | | |
| |
REALIZED AND UNREALIZED GAINS (LOSSES) ON INVESTMENTS | | | | |
| |
Net realized gains (losses) on: | | | | |
Unaffiliated securities | | | 13,411,419 | |
Futures transactions | | | (1,848,979 | ) |
| | | | |
Net realized gains on investments | | | 11,562,440 | |
| | | | |
| |
Net change in unrealized gains (losses) on: | | | | |
Unaffiliated securities | | | 25,888,304 | |
Futures transactions | | | (2,648,964 | ) |
| | | | |
Net change in unrealized gains (losses) on investments | | | 23,239,340 | |
| | | | |
Net realized and unrealized gains (losses) on investments | | | 34,801,780 | |
| | | | |
Net increase in net assets resulting from operations | | $ | 61,532,618 | |
| | | | |
The accompanying notes are an integral part of these financial statements.
| | | | |
| 30 | | Wells Fargo Strategic Municipal Bond Fund | | Statement of changes in net assets |
| | | | | | | | | | | | | | | | |
| | | Year ended
June 30, 2016 | | | Year ended
June 30, 2015 | |
| | |
Operations | | | | | | | | |
Net investment income | | | | | | $ | 26,730,838 | | | | | | | $ | 18,254,823 | |
Net realized gains on investments | | | | | | | 11,562,440 | | | | | | | | 6,401,428 | |
Net change in unrealized gains (losses) on investments | | | | | | | 23,239,340 | | | | | | | | (15,967,757 | ) |
| | | | | | | | | | | | | | | | |
Net increase in net assets resulting from operations | | | | | | | 61,532,618 | | | | | | | | 8,688,494 | |
| | | | | | | | | | | | | | | | |
| | |
Distributions to shareholders from | | | | | | | | |
Net investment income | | | | | | | | | | | | | | | | |
Class A | | | | | | | (10,092,186 | ) | | | | | | | (7,013,266 | ) |
Class B | | | | | | | (7,361 | ) | | | | | | | (5,108 | ) |
Class C | | | | | | | (1,247,141 | ) | | | | | | | (618,851 | ) |
Administrator Class | | | | | | | (7,962,494 | ) | | | | | | | (7,224,681 | ) |
Institutional Class | | | | | | | (7,975,567 | ) | | | | | | | (3,392,920 | ) |
Net realized gains | | | | | | | | | | | | | | | | |
Class A | | | | | | | (1,603,578 | ) | | | | | | | (5,154,519 | ) |
Class B | | | | | | | (2,508 | ) | | | | | | | (10,851 | ) |
Class C | | | | | | | (403,600 | ) | | | | | | | (1,307,185 | ) |
Administrator Class | | | | | | | (1,254,440 | ) | | | | | | | (4,674,679 | ) |
Institutional Class | | | | | | | (1,022,196 | ) | | | | | | | (2,007,331 | ) |
| | | | | | | | | | | | | | | | |
Total distributions to shareholders | | | | | | | (31,571,071 | ) | | | | | | | (31,409,391 | ) |
| | | | | | | | | | | | | | | | |
| | | | |
Capital share transactions | | | Shares | | | | | | | | Shares | | | | | |
Proceeds from shares sold | | | | | | | | | | | | | | | | |
Class A | | | 29,803,012 | | | | 268,004,154 | | | | 29,777,905 | | | | 268,139,655 | |
Class B | | | 17 | | | | 155 | | | | 464 | | | | 4,204 | |
Class C | | | 3,644,420 | | | | 32,849,534 | | | | 4,088,660 | | | | 36,992,480 | |
Administrator Class | | | 24,016,958 | | | | 215,580,158 | | | | 36,226,756 | | | | 326,687,608 | |
Institutional Class | | | 49,566,722 | | | | 445,463,474 | | | | 40,415,312 | | | | 364,245,212 | |
| | | | | | | | | | | | | | | | |
| | | | | | | 961,897,475 | | | | | | | | 996,069,159 | |
| | | | | | | | | | | | | | | | |
Reinvestment of distributions | | | | | | | | | | | | | | | | |
Class A | | | 1,210,914 | | | | 10,875,081 | | | | 1,269,048 | | | | 11,415,209 | |
Class B | | | 1,056 | | | | 9,452 | | | | 1,639 | | | | 14,702 | |
Class C | | | 154,668 | | | | 1,393,195 | | | | 176,306 | | | | 1,591,626 | |
Administrator Class | | | 1,002,592 | | | | 8,998,639 | | | | 1,252,089 | | | | 11,262,338 | |
Institutional Class | | | 720,101 | | | | 6,471,003 | | | | 418,251 | | | | 3,760,225 | |
| | | | | | | | | | | | | | | | |
| | | | | | | 27,747,370 | | | | | | | | 28,044,100 | |
| | | | | | | | | | | | | | | | |
Payment for shares redeemed | | | | | | | | | | | | | | | | |
Class A | | | (22,262,767 | ) | | | (199,832,447 | ) | | | (32,374,935 | ) | | | (291,426,105 | ) |
Class B | | | (42,405 | ) | | | (380,448 | ) | | | (59,588 | ) | | | (535,517 | ) |
Class C | | | (3,692,094 | ) | | | (33,238,979 | ) | | | (3,311,728 | ) | | | (29,908,893 | ) |
Administrator Class | | | (39,420,096 | ) | | | (353,739,011 | ) | | | (35,139,053 | ) | | | (316,470,287 | ) |
Institutional Class | | | (18,937,647 | ) | | | (169,986,975 | ) | | | (8,239,599 | ) | | | (74,013,710 | ) |
| | | | | | | | | | | | | | | | |
| | | | | | | (757,177,860 | ) | | | | | | | (712,354,512 | ) |
| | | | | | | | | | | | | | | | |
Net increase in net assets resulting from capital share transactions | | | | | | | 232,466,985 | | | | | | | | 311,758,747 | |
| | | | | | | | | | | | | | | | |
Total increase in net assets | | | | | | | 262,428,532 | | | | | | | | 289,037,850 | |
| | | | | | | | | | | | | | | | |
| | |
Net assets | | | | | | | | |
Beginning of period | | | | | | | 1,638,736,338 | | | | | | | | 1,349,698,488 | |
| | | | | | | | | | | | | | | | |
End of period | | | | | | $ | 1,901,164,870 | | | | | | | $ | 1,638,736,338 | |
| | | | | | | | | | | | | | | | |
Overdistributed net investment income | | | | | | $ | (260,322 | ) | | | | | | $ | (87,766 | ) |
| | | | | | | | | | | | | | | | |
The accompanying notes are an integral part of these financial statements.
| | | | | | |
| Financial highlights | | Wells Fargo Strategic Municipal Bond Fund | | | 31 | |
(For a share outstanding throughout each period)
| | | | | | | | | | | | | | | | | | | | |
| | | Year ended June 30 | |
| CLASS A | | 2016 | | | 2015 | | | 2014 | | | 2013 | | | 2012 | |
Net asset value, beginning of period | | | $8.90 | | | | $9.03 | | | | $8.87 | | | | $8.94 | | | | $8.77 | |
Net investment income | | | 0.14 | | | | 0.10 | | | | 0.17 | | | | 0.13 | | | | 0.21 | |
Net realized and unrealized gains (losses) on investments | | | 0.18 | | | | (0.05 | ) | | | 0.21 | | | | 0.01 | | | | 0.18 | |
| | | | | | | | | | | | | | | | | | | | |
Total from investment operations | | | 0.32 | | | | 0.05 | | | | 0.38 | | | | 0.14 | | | | 0.39 | |
Distributions to shareholders from | | | | | | | | | | | | | | | | | | | | |
Net investment income | | | (0.14 | ) | | | (0.10 | ) | | | (0.17 | ) | | | (0.13 | ) | | | (0.21 | ) |
Net realized gains | | | (0.02 | ) | | | (0.08 | ) | | | (0.05 | ) | | | (0.08 | ) | | | (0.01 | ) |
| | | | | | | | | | | | | | | | | | | | |
Total distributions to shareholders | | | (0.16 | ) | | | (0.18 | ) | | | (0.22 | ) | | | (0.21 | ) | | | (0.22 | ) |
Net asset value, end of period | | | $9.06 | | | | $8.90 | | | | $9.03 | | | | $8.87 | | | | $8.94 | |
Total return1 | | | 3.67 | % | | | 0.56 | % | | | 4.41 | % | | | 1.59 | % | | | 4.48 | % |
Ratios to average net assets (annualized) | | | | | | | | | | | | | | | | | | | | |
Gross expenses | | | 0.81 | % | | | 0.81 | % | | | 0.83 | % | | | 0.82 | % | | | 0.83 | % |
Net expenses | | | 0.81 | % | | | 0.81 | % | | | 0.82 | % | | | 0.82 | % | | | 0.83 | % |
Net investment income | | | 1.53 | % | | | 1.16 | % | | | 1.91 | % | | | 1.49 | % | | | 2.31 | % |
Supplemental data | | | | | | | | | | | | | | | | | | | | |
Portfolio turnover rate | | | 53 | % | | | 39 | % | | | 51 | % | | | 49 | % | | | 74 | % |
Net assets, end of period (000s omitted) | | | $726,135 | | | | $635,610 | | | | $656,256 | | | | $609,303 | | | | $549,357 | |
| 1 | Total return calculations do not include any sales charges. |
The accompanying notes are an integral part of these financial statements.
| | | | |
| 32 | | Wells Fargo Strategic Municipal Bond Fund | | Financial highlights |
(For a share outstanding throughout each period)
| | | | | | | | | | | | | | | | | | | | |
| | | Year ended June 30 | |
| CLASS B | | 2016 | | | 2015 | | | 2014 | | | 2013 | | | 2012 | |
Net asset value, beginning of period | | | $8.88 | | | | $9.00 | | | | $8.85 | | | | $8.92 | | | | $8.75 | |
Net investment income | | | 0.07 | 1 | | | 0.04 | 1 | | | 0.10 | 1 | | | 0.07 | 1 | | | 0.15 | 1 |
Net realized and unrealized gains (losses) on investments | | | 0.18 | | | | (0.04 | ) | | | 0.20 | | | | 0.01 | | | | 0.17 | |
| | | | | | | | | | | | | | | | | | | | |
Total from investment operations | | | 0.25 | | | | (0.00 | ) | | | 0.30 | | | | 0.08 | | | | 0.32 | |
Distributions to shareholders from | | | | | | | | | | | | | | | | | | | | |
Net investment income | | | (0.07 | ) | | | (0.04 | ) | | | (0.10 | ) | | | (0.07 | ) | | | (0.14 | ) |
Net realized gains | | | (0.02 | ) | | | (0.08 | ) | | | (0.05 | ) | | | (0.08 | ) | | | (0.01 | ) |
| | | | | | | | | | | | | | | | | | | | |
Total distributions to shareholders | | | (0.09 | ) | | | (0.12 | ) | | | (0.15 | ) | | | (0.15 | ) | | | (0.15 | ) |
Net asset value, end of period | | | $9.04 | | | | $8.88 | | | | $9.00 | | | | $8.85 | | | | $8.92 | |
Total return2 | | | 2.91 | % | | | (0.08 | )% | | | 3.53 | % | | | 0.83 | % | | | 3.71 | % |
Ratios to average net assets (annualized) | | | | | | | | | | | | | | | | | | | | |
Gross expenses | | | 1.56 | % | | | 1.56 | % | | | 1.58 | % | | | 1.57 | % | | | 1.58 | % |
Net expenses | | | 1.56 | % | | | 1.56 | % | | | 1.57 | % | | | 1.57 | % | | | 1.58 | % |
Net investment income | | | 0.79 | % | | | 0.40 | % | | | 1.17 | % | | | 0.77 | % | | | 1.69 | % |
Supplemental data | | | | | | | | | | | | | | | | | | | | |
Portfolio turnover rate | | | 53 | % | | | 39 | % | | | 51 | % | | | 49 | % | | | 74 | % |
Net assets, end of period (000s omitted) | | | $629 | | | | $985 | | | | $1,516 | | | | $2,128 | | | | $3,738 | |
| 1 | Calculated based upon average shares outstanding |
| 2 | Total return calculations do not include any sales charges. |
The accompanying notes are an integral part of these financial statements.
| | | | | | |
| Financial highlights | | Wells Fargo Strategic Municipal Bond Fund | | | 33 | |
(For a share outstanding throughout each period)
| | | | | | | | | | | | | | | | | | | | |
| | | Year ended June 30 | |
| CLASS C | | 2016 | | | 2015 | | | 2014 | | | 2013 | | | 2012 | |
Net asset value, beginning of period | | | $8.94 | | | | $9.06 | | | | $8.90 | | | | $8.97 | | | | $8.80 | |
Net investment income | | | 0.07 | | | | 0.04 | | | | 0.10 | | | | 0.07 | | | | 0.14 | |
Net realized and unrealized gains (losses) on investments | | | 0.17 | | | | (0.04 | ) | | | 0.21 | | | | 0.01 | | | | 0.18 | |
| | | | | | | | | | | | | | | | | | | | |
Total from investment operations | | | 0.24 | | | | 0.00 | | | | 0.31 | | | | 0.08 | | | | 0.32 | |
Distributions to shareholders from | | | | | | | | | | | | | | | | | | | | |
Net investment income | | | (0.07 | ) | | | (0.04 | ) | | | (0.10 | ) | | | (0.07 | ) | | | (0.14 | ) |
Net realized gains | | | (0.02 | ) | | | (0.08 | ) | | | (0.05 | ) | | | (0.08 | ) | | | (0.01 | ) |
| | | | | | | | | | | | | | | | | | | | |
Total distributions to shareholders | | | (0.09 | ) | | | (0.12 | ) | | | (0.15 | ) | | | (0.15 | ) | | | (0.15 | ) |
Net asset value, end of period | | | $9.09 | | | | $8.94 | | | | $9.06 | | | | $8.90 | | | | $8.97 | |
Total return1 | | | 2.78 | % | | | (0.08 | )% | | | 3.63 | % | | | 0.83 | % | | | 3.69 | % |
Ratios to average net assets (annualized) | | | | | | | | | | | | | | | | | | | | |
Gross expenses | | | 1.56 | % | | | 1.56 | % | | | 1.58 | % | | | 1.57 | % | | | 1.58 | % |
Net expenses | | | 1.56 | % | | | 1.56 | % | | | 1.57 | % | | | 1.57 | % | | | 1.58 | % |
Net investment income | | | 0.78 | % | | | 0.40 | % | | | 1.16 | % | | | 0.74 | % | | | 1.59 | % |
Supplemental data | | | | | | | | | | | | | | | | | | | | |
Portfolio turnover rate | | | 53 | % | | | 39 | % | | | 51 | % | | | 49 | % | | | 74 | % |
Net assets, end of period (000s omitted) | | | $156,560 | | | | $152,882 | | | | $146,329 | | | | $152,155 | | | | $147,006 | |
| 1 | Total return calculations do not include any sales charges. |
The accompanying notes are an integral part of these financial statements.
| | | | |
| 34 | | Wells Fargo Strategic Municipal Bond Fund | | Financial highlights |
(For a share outstanding throughout each period)
| | | | | | | | | | | | | | | | | | | | |
| | | Year ended June 30 | |
| ADMINISTRATOR CLASS | | 2016 | | | 2015 | | | 2014 | | | 2013 | | | 2012 | |
Net asset value, beginning of period | | | $8.90 | | | | $9.02 | | | | $8.87 | | | | $8.94 | | | | $8.76 | |
Net investment income | | | 0.15 | | | | 0.12 | | | | 0.18 | | | | 0.15 | | | | 0.22 | |
Net realized and unrealized gains (losses) on investments | | | 0.18 | | | | (0.04 | ) | | | 0.20 | | | | 0.01 | | | | 0.19 | |
| | | | | | | | | | | | | | | | | | | | |
Total from investment operations | | | 0.33 | | | | 0.08 | | | | 0.38 | | | | 0.16 | | | | 0.41 | |
Distributions to shareholders from | | | | | | | | | | | | | | | | | | | | |
Net investment income | | | (0.15 | ) | | | (0.12 | ) | | | (0.18 | ) | | | (0.15 | ) | | | (0.22 | ) |
Net realized gains | | | (0.02 | ) | | | (0.08 | ) | | | (0.05 | ) | | | (0.08 | ) | | | (0.01 | ) |
| | | | | | | | | | | | | | | | | | | | |
Total distributions to shareholders | | | (0.17 | ) | | | (0.20 | ) | | | (0.23 | ) | | | (0.23 | ) | | | (0.23 | ) |
Net asset value, end of period | | | $9.06 | | | | $8.90 | | | | $9.02 | | | | $8.87 | | | | $8.94 | |
Total return | | | 3.80 | % | | | 0.80 | % | | | 4.44 | % | | | 1.73 | % | | | 4.76 | % |
Ratios to average net assets (annualized) | | | | | | | | | | | | | | | | | | | | |
Gross expenses | | | 0.74 | % | | | 0.75 | % | | | 0.77 | % | | | 0.76 | % | | | 0.75 | % |
Net expenses | | | 0.68 | % | | | 0.68 | % | | | 0.68 | % | | | 0.68 | % | | | 0.68 | % |
Net investment income | | | 1.66 | % | | | 1.28 | % | | | 2.05 | % | | | 1.62 | % | | | 2.42 | % |
Supplemental data | | | | | | | | | | | | | | | | | | | | |
Portfolio turnover rate | | | 53 | % | | | 39 | % | | | 51 | % | | | 49 | % | | | 74 | % |
Net assets, end of period (000s omitted) | | | $408,846 | | | | $529,945 | | | | $516,069 | | | | $521,312 | | | | $435,170 | |
The accompanying notes are an integral part of these financial statements.
| | | | | | |
| Financial highlights | | Wells Fargo Strategic Municipal Bond Fund | | | 35 | |
(For a share outstanding throughout each period)
| | | | | | | | | | | | | | | | |
| | | Year ended June 30 | |
| INSTITUTIONAL CLASS | | 2016 | | | 2015 | | | 2014 | | | 20131 | |
Net asset value, beginning of period | | | $8.90 | | | | $9.03 | | | | $8.87 | | | | $9.06 | |
Net investment income | | | 0.17 | | | | 0.13 | | | | 0.20 | | | | 0.08 | 2 |
Net realized and unrealized gains (losses) on investments | | | 0.18 | | | | (0.05 | ) | | | 0.21 | | | | (0.10 | ) |
| | | | | | | | | | | | | | | | |
Total from investment operations | | | 0.35 | | | | 0.08 | | | | 0.41 | | | | (0.02 | ) |
Distributions to shareholders from | | | | | | | | | | | | | | | | |
Net investment income | | | (0.17 | ) | | | (0.13 | ) | | | (0.20 | ) | | | (0.09 | ) |
Net realized gains | | | (0.02 | ) | | | (0.08 | ) | | | (0.05 | ) | | | (0.08 | ) |
| | | | | | | | | | | | | | | | |
Total distributions to shareholders | | | (0.19 | ) | | | (0.21 | ) | | | (0.25 | ) | | | (0.17 | ) |
Net asset value, end of period | | | $9.06 | | | | $8.90 | | | | $9.03 | | | | $8.87 | |
Total return3 | | | 4.02 | % | | | 0.89 | % | | | 4.77 | % | | | (0.28 | )% |
Ratios to average net assets (annualized) | | | | | | | | | | | | | | | | |
Gross expenses | | | 0.48 | % | | | 0.48 | % | | | 0.50 | % | | | 0.50 | % |
Net expenses | | | 0.48 | % | | | 0.48 | % | | | 0.48 | % | | | 0.48 | % |
Net investment income | | | 1.85 | % | | | 1.49 | % | | | 2.27 | % | | | 1.65 | % |
Supplemental data | | | | | | | | | | | | | | | | |
Portfolio turnover rate | | | 53 | % | | | 39 | % | | | 51 | % | | | 49 | % |
Net assets, end of period (000s omitted) | | | $608,995 | | | | $319,313 | | | | $29,528 | | | | $31,868 | |
| 1 | For the period from November 30, 2012 (commencement of class operations) to June 30, 2013 |
| 2 | Calculated based upon average shares outstanding |
| 3 | Returns for periods of less than one year are not annualized. |
The accompanying notes are an integral part of these financial statements.
| | | | |
| 36 | | Wells Fargo Strategic Municipal Bond Fund | | Notes to financial statements |
1. ORGANIZATION
Wells Fargo Funds Trust (the “Trust”), a Delaware statutory trust organized on March 10, 1999, is an open-end management investment company registered under the Investment Company Act of 1940, as amended (the “1940 Act”). As an investment company, the Trust follows the accounting and reporting guidance in Financial Accounting Standards Board (“FASB”) Accounting Standards Codification Topic 946, Financial Services – Investment Companies. These financial statements report on the Wells Fargo Strategic Municipal Bond Fund (the “Fund”) which is a diversified series of the Trust.
2. SIGNIFICANT ACCOUNTING POLICIES
The following significant accounting policies, which are consistently followed in the preparation of the financial statements of the Fund, are in conformity with U.S. generally accepted accounting principles which require management to make estimates and assumptions that affect the reported amounts of assets and liabilities, disclosure of contingent assets and liabilities at the date of the financial statements, and the reported amounts of revenues and expenses during the reporting period. Actual results could differ from those estimates.
Securities valuation
All investments are valued each business day as of the close of regular trading on the New York Stock Exchange (generally 4 p.m. Eastern Time), although a Fund may deviate from this calculation time under unusual or unexpected circumstances.
Debt securities are valued at the evaluated bid price provided by an independent pricing service or, if a reliable price is not available, the quoted bid price from an independent broker-dealer.
Equity securities and futures that are listed on a foreign or domestic exchange or market are valued at the official closing price or, if none, the last sales price. If no sale occurs on the principal exchange or market that day, the prior day’s price will be deemed “stale” and a fair value price will be determined in accordance with the Fund’s Valuation Procedures.
Investments in registered open-end investment companies are valued at net asset value.
Investments which are not valued using any of the methods discussed above are valued at their fair value, as determined in good faith by the Board of Trustees of the Fund. The Board of Trustees has established a Valuation Committee comprised of the Trustees and has delegated to it the authority to take any actions regarding the valuation of portfolio securities that the Valuation Committee deems necessary or appropriate, including determining the fair value of portfolio securities, unless the determination has been delegated to the Management Valuation Team of Wells Fargo Funds Management, LLC (“Funds Management”). The Board of Trustees retains the authority to make or ratify any valuation decisions or approve any changes to the Valuation Procedures as it deems appropriate. On a quarterly basis, the Board of Trustees receives reports on any valuation actions taken by the Valuation Committee or the Management Valuation Team which may include items for ratification.
Valuations of fair valued securities are compared to the next actual sales price when available, or other appropriate market values, to assess the continued appropriateness of the fair valuation methodologies used. These securities are fair valued on a day-to-day basis, taking into consideration changes to appropriate market information and any significant changes to the inputs considered in the valuation process until there is a readily available price provided on an exchange or by an independent pricing service. Valuations received from an independent pricing service or independent broker-dealer quotes are periodically validated by comparisons to most recent trades and valuations provided by other independent pricing services in addition to the review of prices by the manager and/or subadviser. Unobservable inputs used in determining fair valuations are identified based on the type of security, taking into consideration factors utilized by market participants in valuing the investment, knowledge about the issuer and the current market environment.
When-issued transactions
The Fund may purchase securities on a forward commitment or when-issued basis. The Fund records a when-issued transaction on the trade date and will segregate assets in an amount at least equal in value to the Fund’s commitment to purchase when-issued securities. Securities purchased on a when-issued basis are marked-to-market daily and the Fund begins earning interest on the settlement date. Losses may arise due to changes in the market value of the underlying securities or if the counterparty does not perform under the contract.
Futures contracts
The Fund is subject to interest rate risk in the normal course of pursuing its investment objectives. The Fund may buy and sell futures contracts in order to gain exposure to, or protect against, changes in security values and interest rates. The primary risks associated with the use of futures contracts are the imperfect correlation between changes in market values of securities held by the Fund and the prices of futures contracts, and the possibility of an illiquid market.
| | | | | | |
| Notes to financial statements | | Wells Fargo Strategic Municipal Bond Fund | | | 37 | |
The aggregate principal amounts of the contracts are not recorded in the financial statements. Fluctuations in the value of the contracts are recorded in the Statement of Assets and Liabilities as an asset or liability and in the Statement of Operations as unrealized gains or losses until the contracts are closed, at which point they are recorded as net realized gains or losses on futures contracts. With futures contracts, there is minimal counterparty risk to the Fund since futures are exchange traded and the exchange’s clearinghouse, as counterparty to all exchange traded futures, guarantees the futures against default.
Security transactions and income recognition
Securities transactions are recorded on a trade date basis. Realized gains or losses are recorded on the basis of identified cost.
Interest income is accrued daily and bond discounts are accreted and premiums are amortized daily based on the effective interest method. To the extent debt obligations are placed on non-accrual status, any related interest income may be reduced by writing off interest receivables when the collection of all or a portion of interest has become doubtful based on consistently applied procedures. If the issuer subsequently resumes interest payments or when the collectability of interest is reasonably assured, the debt obligation is removed from non-accrual status.
Dividend income is recognized on the ex-dividend date.
Distributions to shareholders
Distributions to shareholders from net investment income are accrued daily and paid monthly. Distributions from net realized gains, if any, are recorded on the ex-dividend date. Such distributions are determined in conformity with federal income tax regulations, which may differ in amount or character from net investment income and realized gains recognized for purposes of U.S. generally accepted accounting principles.
Federal and other taxes
The Fund intends to continue to qualify as a regulated investment company by distributing substantially all of its investment company taxable and tax-exempt income and any net realized capital gains (after reduction for capital loss carryforwards) sufficient to relieve it from all, or substantially all, federal income taxes. Accordingly, no provision for federal income taxes was required.
The Fund’s income and federal excise tax returns and all financial records supporting those returns for the prior three fiscal years are subject to examination by the federal and Delaware revenue authorities. Management has analyzed the Fund’s tax positions taken on federal, state, and foreign tax returns for all open tax years and does not believe that there are any uncertain tax positions that require recognition of a tax liability.
Reclassifications are made to the Fund’s capital accounts for permanent tax differences to reflect income and gains available for distribution (or available capital loss carryforwards) under federal income tax regulations. U.S. generally accepted accounting principles require that certain components of net assets be adjusted to reflect permanent differences between financial and tax reporting. These reclassifications have no effect on net assets or net asset values per share. At June 30, 2016, as a result of permanent book-to-tax differences, the following reclassification adjustments were made on the Statement of Assets and Liabilities:
| | |
Overdistributed net
investment income | | Accumulated net
realized gains on investments |
| $381,355 | | $(381,355) |
As of June 30, 2016, the Fund had current year deferred post-October capital losses consisting of $1,483,657 in long-term losses which will be recognized on the first day of the following fiscal year.
Class allocations
The separate classes of shares offered by the Fund differ principally in applicable sales charges, distribution, shareholder servicing, and administration fees. Class specific expenses are charged directly to that share class. Investment income, common expenses, and realized and unrealized gains (losses) on investments are allocated daily to each class of shares based on the relative proportion of net assets of each class.
| | | | |
| 38 | | Wells Fargo Strategic Municipal Bond Fund | | Notes to financial statements |
3. FAIR VALUATION MEASUREMENTS
Fair value measurements of investments are determined within a framework that has established a fair value hierarchy based upon the various data inputs utilized in determining the value of the Fund’s investments. The three-level hierarchy gives the highest priority to unadjusted quoted prices in active markets for identical assets or liabilities (Level 1) and the lowest priority to significant unobservable inputs (Level 3). The Fund’s investments are classified within the fair value hierarchy based on the lowest level of input that is significant to the fair value measurement. The inputs are summarized into three broad levels as follows:
| n | | Level 1 – quoted prices in active markets for identical securities |
| n | | Level 2 – other significant observable inputs (including quoted prices for similar securities, interest rates, prepayment speeds, credit risk, use of amortized cost, etc.) |
| n | | Level 3 – significant unobservable inputs (including the Fund’s own assumptions in determining the fair value of investments) |
The inputs or methodologies used for valuing investments in securities are not necessarily an indication of the risk associated with investing in those securities.
The following is a summary of the inputs used in valuing the Fund’s assets and liabilities as of June 30, 2016:
| | | | | | | | | | | | | | | | |
| | | Quoted prices
(Level 1) | | | Other significant
observable inputs
(Level 2) | | | Significant
unobservable inputs (Level 3) | | | Total | |
Assets | | | | | | | | | | | | | | | | |
Investments in: | | | | | | | | | | | | | | | | |
| | | | |
Municipal obligations | | $ | 0 | | | $ | 1,805,825,739 | | | $ | 0 | | | $ | 1,805,825,739 | |
| | | | |
Yankee corporate bonds and notes | | | 0 | | | | 10,095,510 | | | | 0 | | | | 10,095,510 | |
| | | | |
Other | | | 0 | | | | 10,616,112 | | | | 0 | | | | 10,616,112 | |
| | | | |
Short-term investments | | | | | | | | | | | | | | | | |
Investment companies | | | 27,442,222 | | | | 0 | | | | 0 | | | | 27,442,222 | |
U.S. Treasury securities | | | 1,649,246 | | | | 0 | | | | 0 | | | | 1,649,246 | |
| | | 29,091,468 | | | | 1,826,537,361 | | | | 0 | | | | 1,855,628,829 | |
Futures contracts | | | 56,651 | | | | 0 | | | | 0 | | | | 56,651 | |
Total assets | | $ | 29,148,119 | | | $ | 1,826,537,361 | | | $ | 0 | | | $ | 1,855,685,480 | |
Liabilities | | | | | | | | | | | | | | | | |
Futures contracts | | $ | 10,703 | | | $ | 0 | | | $ | 0 | | | $ | 10,703 | |
Total liabilities | | $ | 10,703 | | | $ | 0 | | | $ | 0 | | | $ | 10,703 | |
Futures contracts are reported at their variation margin at measurement date, which represents the amount due to/from the Fund at that date.
All other assets and liabilities are reported at their market value at measurement date.
The Fund recognizes transfers between levels within the fair value hierarchy at the end of the reporting period. At June 30, 2016, the Fund did not have any transfers into/out of Level 1. The Fund had no material transfers between Level 2 and Level 3.
4. TRANSACTIONS WITH AFFILIATES
Management fee
Funds Management, an indirect wholly owned subsidiary of Wells Fargo & Company (“Wells Fargo”), is the manager of the Fund and provides advisory and fund-level administrative services under an investment management agreement. Under the investment management agreement, Funds Management is responsible for, among other services, implementing the investment objectives and strategies of the Fund, supervising the subadviser, providing fund-level administrative services in connection with the Fund’s operations, and providing any other fund-level administrative
| | | | | | |
| Notes to financial statements | | Wells Fargo Strategic Municipal Bond Fund | | | 39 | |
services reasonably necessary for the operation of the Fund. As compensation for its services under the investment management agreement, Funds Management is entitled to receive an annual management fee starting at 0.40% and declining to 0.28% as the average daily net assets of the Fund increase. For the year ended June 30, 2016, the management fee was equivalent to an annual rate of 0.37% of the Fund’s average daily net assets.
Funds Management has retained the services of a subadviser to provide daily portfolio management to the Fund. The fee for subadvisory services is borne by Funds Management. Wells Capital Management Incorporated, an affiliate of Funds Management and an indirect wholly owned subsidiary of Wells Fargo, is the subadviser to the Fund and is entitled to receive a fee from Funds Management at an annual rate starting at 0.20% and declining to 0.10% as the average daily net assets of the Fund increase.
Administration fees
Under a class-level administration agreement, Funds Management provides class-level administrative services to the Fund, which includes paying fees and expenses for services provided by the transfer agent, sub-transfer agents, omnibus account servicers and record-keepers. As compensation for its services under the class-level administration agreement, Funds Management receives an annual fee which is calculated based on the average daily net assets of each class as follows:
| | | | |
| | | Class-level
administration fee | |
Class A, Class B, Class C | | | 0.16 | % |
Administrator Class | | | 0.10 | |
Institutional Class | | | 0.08 | |
Funds Management has contractually waived and/or reimbursed management and administration fees to the extent necessary to maintain certain net operating expense ratios for the Fund. Waiver of fees and/or reimbursement of expenses by Funds Management were made first from fund level expenses on a proportionate basis and then from class specific expenses. Funds Management has committed through October 31, 2016 to waive fees and/or reimburse expenses to the extent necessary to cap the Fund’s expenses at 0.82% for Class A shares, 1.57% for Class B shares, 1.57% for Class C shares, 0.68% for Administrator Class shares, and 0.48% for Institutional Class shares. After this time, the cap may be increased or the commitment to maintain the cap may be terminated only with the approval of the Board of Trustees.
Distribution fees
The Trust has adopted a distribution plan for Class B and Class C shares of the Fund pursuant to Rule 12b-1 under the 1940 Act. Distribution fees are charged to Class B and Class C shares and paid to Wells Fargo Funds Distributor, LLC (“Funds Distributor”), the principal underwriter, at an annual rate of 0.75% of the average daily net assets of Class B and Class C shares.
In addition, Funds Distributor is entitled to receive the front-end sales charge from the purchase of Class A shares and a contingent deferred sales charge on the redemption of certain Class A shares. Funds Distributor is also entitled to receive the contingent deferred sales charges from redemptions of Class B and Class C shares. For the year ended June 30, 2016, Funds Distributor received $20,894 from the sale of Class A shares.
Shareholder servicing fees
The Trust has entered into contracts with one or more shareholder servicing agents, whereby Class A, Class B, Class C, and Administrator Class of the Fund are charged a fee at an annual rate of 0.25% of the average daily net assets of each respective class.
A portion of these total shareholder servicing fees were paid to affiliates of Wells Fargo.
5. INVESTMENT PORTFOLIO TRANSACTIONS
Purchases and sales of investments, excluding U.S. government obligations (if any) and short-term securities, for the year ended June 30, 2016 were $716,910,614 and $699,736,260, respectively.
The Fund may purchase or sell investment securities to other Wells Fargo funds under procedures adopted by the Board of Trustees. The procedures have been designed to ensure that these interfund transactions, which generally do not incur broker commissions, are effected at current market prices. Interfund trades are included within the respective purchases and sales amounts shown.
| | | | |
| 40 | | Wells Fargo Strategic Municipal Bond Fund | | Notes to financial statements |
6. DERIVATIVE TRANSACTIONS
During the year ended June 30, 2016, the Fund entered into futures contracts to take advantage of the differences between municipal and treasury yields and to help manage the duration of the portfolio.
As of June 30, 2016, the Fund had short futures contracts outstanding as follows:
| | | | | | | | | | | | | | | | |
| Expiration date | | Counterparty | | Contracts | | Type | | | Contract Value at June 30, 2016 | | | Unrealized losses | |
9-21-2016 | | JPMorgan | | 650 Short | | | 10-Year U.S. Treasury Note | | | $ | 86,439,844 | | | $ | (2,347,394 | ) |
9-30-2016 | | JPMorgan | | 337 Short | | | 5-Year U.S. Treasury Note | | | | 41,169,289 | | | | (301,570 | ) |
The Fund had an average notional amount of $1,626,484 and $70,940,237 in long and short futures contracts, respectively, during the year ended June 30, 2016.
On June 30, 2016, the cumulative unrealized losses on futures contracts in the amount of $2,648,964 are reflected in net unrealized gains on investments on the Statement of Assets and Liabilities. The receivable/payable for daily variation margin on open futures contracts reflected in the Statement of Assets and Liabilities only represents the current day’s variation margin. The realized losses and change in unrealized gains (losses) on futures contracts are reflected in the Statement of Operations.
For certain types of derivative transactions, the Fund has entered into International Swaps and Derivatives Association, Inc. master agreements (“ISDA Master Agreements”) or similar agreements with approved counterparties. The ISDA Master Agreements or similar agreements may have requirements to deliver/deposit securities or cash to/with an exchange or broker-dealer as collateral and allows the Fund to offset, with each counterparty, certain derivative financial instrument’s assets and/or liabilities with collateral held or pledged. Collateral requirements differ by type of derivative. Collateral or margin requirements are set by the broker or exchange clearing house for exchange traded derivatives while collateral terms are contract specific for over-the-counter traded derivatives. Cash collateral that has been pledged to cover obligations of the Fund under ISDA Master Agreements or similar agreements, if any, are reported separately in the Statement of Assets and Liabilities. Securities pledged as collateral, if any, are noted in the Portfolio of Investments. With respect to balance sheet offsetting, absent an event of default by the counterparty or a termination of the agreement, the reported amounts of financial assets and financial liabilities in the Statement of Assets and Liabilities are not offset across transactions between the Fund and the applicable counterparty. A reconciliation of the gross amounts on the Statement of Assets and Liabilities to the net amounts by derivative type, including any collateral exposure, is as follows:
| | | | | | | | | | | | | | | | |
| Derivative type | | Counterparty | | Gross amounts
of assets in the Statement of
Assets and
Liabilities | | Amounts
subject to
netting
agreements | | | Collateral
received | | | Net amount
of assets | |
Futures – variation margin | | JPMorgan | | $56,651 | | $ | (10,703 | ) | | $ | 0 | | | $ | 45,948 | |
| | | | | | | | | | | | | | | | |
| Derivative type | | Counterparty | | Gross amounts
of liabilities in the Statement of Assets and Liabilities | | Amounts
subject to
netting
agreements | | | Collateral
pledged | | | Net amount
of liabilities | |
Futures – variation margin | | JPMorgan | | $10,703 | | $ | (10,703 | ) | | $ | 0 | | | $ | 0 | |
7. BANK BORROWINGS
The Trust (excluding the money market funds and certain other funds) and Wells Fargo Variable Trust are parties to a $200,000,000 revolving credit agreement whereby the Fund is permitted to use bank borrowings for temporary or emergency purposes, such as to fund shareholder redemption requests. Interest under the credit agreement is charged to the Fund based on a borrowing rate equal to the higher of the Federal Funds rate in effect on that day plus 1.25% or the overnight LIBOR rate in effect on that day plus 1.25%. In addition, an annual commitment fee equal to 0.20% of the unused balance is allocated to each participating fund. Prior to September 1, 2015, the revolving credit agreement amount was $150,000,000 and the annual commitment fee was equal to 0.10% of the unused balance which was allocated to each participating fund.
For the year ended June 30, 2016, there were no borrowings by the Fund under the agreement.
| | | | | | |
| Notes to financial statements | | Wells Fargo Strategic Municipal Bond Fund | | | 41 | |
8. DISTRIBUTIONS TO SHAREHOLDERS
The tax character of distributions paid during the years ended June 30, 2016 and June 30, 2015 were as follows:
| | | | | | | | |
| | | Year ended June 30 | |
| | | 2016 | | | 2015 | |
Ordinary income | | $ | 3,379,804 | | | $ | 10,355,544 | |
Tax-exempt income | | | 24,413,314 | | | | 17,846,390 | |
Long-term capital gain | | | 3,777,953 | | | | 3,207,457 | |
As of June 30, 2016, the components of distributable earnings on a tax basis were as follows:
| | | | |
Undistributed ordinary income | | Post-October capital loss deferred | | Unrealized gains |
| $8,354,381 | | $(1,483,657) | | $29,270,398 |
9. INDEMNIFICATION
Under the Trust’s organizational documents, the officers and Trustees have been granted certain indemnification rights against certain liabilities that may arise out of performance of their duties to the Trust. Additionally, in the normal course of business, the Trust may enter into contracts with service providers that contain a variety of indemnification clauses. The Trust’s maximum exposure under these arrangements is dependent on future claims that may be made against the Fund and, therefore, cannot be estimated.
| | | | |
| 42 | | Wells Fargo Strategic Municipal Bond Fund | | Report of independent registered public accounting firm |
BOARD OF TRUSTEES AND SHAREHOLDERS OF WELLS FARGO FUNDS TRUST:
We have audited the accompanying statement of assets and liabilities, including the portfolio of investments, of the Wells Fargo Strategic Municipal Bond Fund (formerly known as Wells Fargo Advantage Strategic Municipal Bond Fund) (the “Fund”), one of the funds constituting the Wells Fargo Funds Trust, as of June 30, 2016, and the related statement of operations for the year then ended, the statements of changes in net assets for each of the years in the two-year period then ended, and the financial highlights for each of the years or periods in the five-year period then ended. These financial statements and financial highlights are the responsibility of the Fund’s management. Our responsibility is to express an opinion on these financial statements and financial highlights based on our audits.
We conducted our audits in accordance with the standards of the Public Company Accounting Oversight Board (United States). Those standards require that we plan and perform the audit to obtain reasonable assurance about whether the financial statements and financial highlights are free of material misstatement. An audit includes examining, on a test basis, evidence supporting the amounts and disclosures in the financial statements. Our procedures included confirmation of securities owned as of June 30, 2016, by correspondence with custodians and brokers, or by other appropriate auditing procedures. An audit also includes assessing the accounting principles used and significant estimates made by management, as well as evaluating the overall financial statement presentation. We believe that our audits provide a reasonable basis for our opinion.
In our opinion, the financial statements and financial highlights referred to above present fairly, in all material respects, the financial position of the Wells Fargo Strategic Municipal Bond Fund as of June 30, 2016, and the results of its operations for the year then ended, the changes in its net assets for each of the years in the two-year period then ended, and the financial highlights for each of the years or periods in the five-year period then ended, in conformity with U.S. generally accepted accounting principles.

Boston, Massachusetts
August 25, 2016
| | | | | | |
| Other information (unaudited) | | Wells Fargo Strategic Municipal Bond Fund | | | 43 | |
TAX INFORMATION
Pursuant to Section 852 of the Internal Revenue Code, $3,777,953 was designated as a 20% rate gain distribution for the fiscal year ended June 30, 2016.
For the fiscal year ended June 30, 2016, $1,702,966 has been designated as interest-related dividends for nonresident alien shareholders pursuant to Section 871 of the Internal Revenue Code.
For the fiscal year ended June 30, 2016, $889,724 has been designated as short-term capital gain dividends for nonresident alien shareholders pursuant to Section 871 of the Internal Revenue Code.
Pursuant to Section 852 of the Internal Revenue Code, 90.87% of distributions paid from net investment income is designated as exempt-interest dividends for the fiscal year ended June 30, 2016.
PROXY VOTING INFORMATION
A description of the policies and procedures that the Fund uses to determine how to vote proxies relating to portfolio securities is available, upon request, by calling 1-800-222-8222, visiting our website at wellsfargofunds.com, or visiting the SEC website at sec.gov. Information regarding how the Fund voted proxies relating to portfolio securities during the most recent 12-month period ended June 30 is available on the Fund’s website at wellsfargofunds.com or by visiting the SEC website at sec.gov.
PORTFOLIO HOLDINGS INFORMATION
The complete portfolio holdings for the Fund are publicly available monthly on the Fund’s website (wellsfargofunds.com), on a one-month delayed basis. In addition, top ten holdings information (excluding derivative positions) for the Fund is publicly available on the Fund’s website on a monthly, seven-day or more delayed basis. The Fund files its complete schedule of portfolio holdings with the SEC for the first and third quarters of each fiscal year on Form N-Q, which is available by visiting the SEC website at sec.gov. In addition, the Fund’s Form N-Q may be reviewed and copied at the SEC’s Public Reference Room in Washington, DC, and at regional offices in New York City, at 233 Broadway, and in Chicago, at 175 West Jackson Boulevard, Suite 900. Information about the Public Reference Room may be obtained by calling 1-800-SEC-0330.
| | | | |
| 44 | | Wells Fargo Strategic Municipal Bond Fund | | Other information (unaudited) |
BOARD OF TRUSTEES AND OFFICERS
Each of the Trustees and Officers1 listed in the table below acts in identical capacities for each fund in the Wells Fargo family of funds, which consists of 142 mutual funds comprising the Wells Fargo Funds Trust, Wells Fargo Variable Trust, Wells Fargo Master Trust and four closed-end funds (collectively the “Fund Complex”). This table should be read in conjunction with the Prospectus and the Statement of Additional Information2. The mailing address of each Trustee and Officer is 525 Market Street, 12th Floor, San Francisco, CA 94105. Each Trustee and Officer serves an indefinite term, however, each Trustee serves such term until reaching the mandatory retirement age established by the Trustees.
Independent Trustees
| | | | | | |
Name and year of birth | | Position held and length of service* | | Principal occupations during past five years or longer | | Current other public company or
investment company
directorships |
William R. Ebsworth
(Born 1957) | | Trustee, since 2015 | | Retired. From 1984 to 2013, equities analyst, portfolio manager, research director and chief financial officer at Fidelity Management and Research Company in Boston, Tokyo, and Hong Kong and retired in 2013 as Chief Investment Officer of Fidelity Strategic Advisers, Inc. where he lead a team of investment professionals managing client assets. Prior thereto, Board member of Hong Kong Securities Clearing Co., Hong Kong Options Clearing Corp., the Thailand International Fund, Ltd., Fidelity Investments Life Insurance Company, and Empire Fidelity Investments Life Insurance Company. Mr. Ebsworth is a CFA® charterholder and an Adjunct Lecturer, Finance, at Babson College. | | Asset Allocation Trust |
Jane A. Freeman
(Born 1953) | | Trustee, since 2015 | | Retired. From 2012 to 2014 and 1999 to 2008, Chief Financial Officer of Scientific Learning Corporation. From 2008 to 2012, Ms. Freeman provided consulting services related to strategic business projects. Prior to 1999, Portfolio Manager at Rockefeller & Co. and Scudder, Stevens & Clark. Board member of the Harding Loevner Funds from 1996 to 2014, serving as both Lead Independent Director and chair of the Audit Committee. Board member of the Russell Exchange Traded Funds Trust from 2011 to 2012 and the chair of the Audit Committee. Ms. Freeman is Chair of Taproot Foundation (non-profit organization), a Board Member of Ruth Bancroft Garden (non-profit organization) and an inactive chartered financial analyst. | | Asset Allocation Trust |
Peter G. Gordon
(Born 1942) | | Trustee, since 1998; Chairman, since 2005 | | Co-Founder, Retired Chairman, President and CEO of Crystal Geyser Water Company. Trustee Emeritus, Colby College. | | Asset Allocation Trust |
Isaiah Harris, Jr.
(Born 1952) | | Trustee, since 2009 | | Retired. Chairman of the Board of CIGNA Corporation since 2009, and Director since 2005. From 2003 to 2011, Director of Deluxe Corporation. Prior thereto, President and CEO of BellSouth Advertising and Publishing Corp. from 2005 to 2007, President and CEO of BellSouth Enterprises from 2004 to 2005 and President of BellSouth Consumer Services from 2000 to 2003. Emeritus member of the Iowa State University Foundation Board of Governors. Emeritus Member of the Advisory Board of Iowa State University School of Business. Advisory Board Member, Palm Harbor Academy (charter school). Advisory Board Member, Child Evangelism Fellowship (non-profit). Mr. Harris is a certified public accountant (inactive status). | | CIGNA Corporation; Asset Allocation Trust |
Judith M. Johnson
(Born 1949) | | Trustee, since 2008;
Audit Committee Chairman, since 2008 | | Retired. Prior thereto, Chief Executive Officer and Chief Investment Officer of Minneapolis Employees Retirement Fund from 1996 to 2008. Ms. Johnson is an attorney, certified public accountant and a certified managerial accountant. | | Asset Allocation Trust |
David F. Larcker
(Born 1950) | | Trustee, since 2009 | | James Irvin Miller Professor of Accounting at the Graduate School of Business, Stanford University, Director of the Corporate Governance Research Initiative and Senior Faculty of The Rock Center for Corporate Governance since 2006. From 2005 to 2008, Professor of Accounting at the Graduate School of Business, Stanford University. Prior thereto, Ernst & Young Professor of Accounting at The Wharton School, University of Pennsylvania from 1985 to 2005. | | Asset Allocation Trust |
| | | | | | |
| Other information (unaudited) | | Wells Fargo Strategic Municipal Bond Fund | | | 45 | |
| | | | | | |
Name and year of birth | | Position held and length of service* | | Principal occupations during past five years or longer | | Current other public company or
investment company
directorships |
Olivia S. Mitchell
(Born 1953) | | Trustee, since 2006 | | International Foundation of Employee Benefit Plans Professor, Wharton School of the University of Pennsylvania since 1993. Director of Wharton’s Pension Research Council and Boettner Center on Pensions & Retirement Research, and Research Associate at the National Bureau of Economic Research. Previously, Cornell University Professor from 1978 to 1993. | | Asset Allocation Trust |
Timothy J. Penny
(Born 1951) | | Trustee, since 1996 | | President and Chief Executive Officer of Southern Minnesota Initiative Foundation, a non-profit organization, since 2007 and Senior Fellow at the Humphrey Institute Policy Forum at the University of Minnesota since 1995. Member of the Board of Trustees of NorthStar Education Finance, Inc., a non-profit organization, since 2007. | | Asset Allocation Trust |
Michael S. Scofield
(Born 1943) | | Trustee, since 2010 | | Served on the Investment Company Institute’s Board of Governors and Executive Committee from 2008-2011 as well the Governing Council of the Independent Directors Council from 2006-2011 and the Independent Directors Council Executive Committee from 2008-2011. Chairman of the IDC from 2008-2010. Institutional Investor (Fund Directions) Trustee of Year in 2007. Trustee of the Evergreen Funds complex (and its predecessors) from 1984 to 2010. Chairman of the Evergreen Funds from 2000-2010. Former Trustee of the Mentor Funds. Retired Attorney, Law Offices of Michael S. Scofield. | | Asset Allocation Trust |
| * | Length of service dates reflect the Trustee’s commencement of service with the Trust’s predecessor entities, where applicable. |
Officers
| | | | | | |
Name and year of birth | | Position held and
length of service | | Principal occupations during past five years or longer | | |
Karla M. Rabusch
(Born 1959) | | President, since 2003 | | Executive Vice President of Wells Fargo Bank, N.A. and President of Wells Fargo Funds Management, LLC since 2003. | | |
Nancy Wiser1
(Born 1967) | | Treasurer, since 2012 | | Executive Vice President of Wells Fargo Funds Management, LLC since 2011. Chief Operating Officer and Chief Compliance Officer at LightBox Capital Management LLC, from 2008 to 2011. | | |
C. David Messman
(Born 1960) | | Secretary, since 2000; Chief Legal Officer, since 2003 | | Senior Vice President and Secretary of Wells Fargo Funds Management, LLC since 2001. Assistant General Counsel of Wells Fargo Bank, N.A. since 2013 and Vice President and Managing Counsel of Wells Fargo Bank, N.A. from 1996 to 2013. | | |
Michael Whitaker
(Born 1967) | | Chief Compliance Officer, since 2016* | | Executive Vice President of Wells Fargo Funds Management, LLC since 2016. Chief Compliance Officer of Fidelity’s Fixed Income Funds and Asset Allocation Funds from 2008 to 2016, Compliance Officer of FMR Co., Inc. from 2014 to 2016, Fidelity Investments Money Management, Inc. from 2014 to 2016, Fidelity Investments from 2007 to 2016. | | |
David Berardi
(Born 1975) | | Assistant Treasurer, since 2009 | | Vice President of Wells Fargo Funds Management, LLC since 2009. Vice President of Evergreen Investment Management Company, LLC from 2008 to 2010. Manager of Fund Reporting and Control for Evergreen Investment Management Company, LLC from 2004 to 2010. | | |
Jeremy DePalma1
(Born 1974) | | Assistant Treasurer, since 2009 | | Senior Vice President of Wells Fargo Funds Management, LLC since 2009. Senior Vice President of Evergreen Investment Management Company, LLC from 2008 to 2010 and head of the Fund Reporting and Control Team within Fund Administration from 2005 to 2010. | | |
| 1 | Nancy Wiser acts as Treasurer of 73 funds in the Fund Complex. Jeremy DePalma acts as Treasurer of 69 funds and Assistant Treasurer of 73 funds in the Fund Complex. |
| 2 | The Statement of Additional Information includes additional information about the Trustees and is available, without charge, upon request, by calling 1-800-222-8222 or by visiting the website at wellsfargofunds.com. |
| * | Michael Whitaker became Chief Compliance Officer effective May 16, 2016. |
| | | | |
| 46 | | Wells Fargo Strategic Municipal Bond Fund | | Other information (unaudited) |
BOARD CONSIDERATION OF INVESTMENT MANAGEMENT AND SUB-ADVISORY AGREEMENTS:
Under the Investment Company Act of 1940 (the “1940 Act”), the Board of Trustees (the “Board”) of Wells Fargo Funds Trust (the “Trust”) must determine annually whether to approve the continuation of the Trust’s investment management and sub-advisory agreements. In this regard, at an in-person meeting held on May 24-25, 2016 (the “Meeting”), the Board, all the members of which have no direct or indirect interest in the investment management and sub-advisory agreements and are not “interested persons” of the Trust, as defined in the 1940 Act (the “Independent Trustees”), reviewed and approved for Wells Fargo Strategic Municipal Bond Fund (the “Fund”): (i) an investment management agreement (the “Management Agreement”) with Wells Fargo Funds Management, LLC (“Funds Management”); and (ii) an investment sub-advisory agreement (the “Sub-Advisory Agreement”) with Wells Capital Management Incorporated (the “Sub-Adviser”), an affiliate of Funds Management. The Management Agreement and the Sub-Advisory Agreement are collectively referred to as the “Advisory Agreements.”
At the Meeting, the Board considered the factors and reached the conclusions described below relating to the selection of Funds Management and the Sub-Adviser and the approval of the Advisory Agreements. Prior to the Meeting, including at an in-person meeting in April 2016, the Trustees conferred extensively among themselves and with representatives of Funds Management about these matters. Also, the Board has adopted a team-based approach, with each team consisting of a sub-set of Trustees, to assist the full Board in the discharge of its duties in reviewing performance and other matters throughout the year. The Independent Trustees were assisted in their evaluation of the Advisory Agreements by independent legal counsel, from whom they received separate legal advice and with whom they met separately.
In providing information to the Board, Funds Management and the Sub-Adviser were guided by a detailed set of requests for information submitted to them by independent legal counsel on behalf of the Independent Trustees at the start of the Board’s annual contract renewal process earlier in 2016. In considering and approving the Advisory Agreements, the Trustees considered the information they believed relevant, including but not limited to the information discussed below. The Board considered not only the specific information presented in connection with the Meeting, but also the knowledge gained over time through interaction with Funds Management and the Sub-Adviser about various topics. In this regard, the Board reviewed reports of Funds Management at each of its quarterly meetings, which included, among other things, portfolio reviews and performance reports. In addition, the Board and the teams mentioned above confer with portfolio managers at various times throughout the year. The Board did not identify any particular information or consideration that was all-important or controlling, and each individual Trustee may have attributed different weights to various factors.
After its deliberations, the Board unanimously approved the continuation of the Advisory Agreements for a one-year term and determined that the compensation payable to Funds Management and the Sub-Adviser under each of the Advisory Agreements was reasonable. The Board considered the approval of the Advisory Agreements for the Fund as part of its consideration of agreements for funds across the complex, but its approvals were made on a fund-by-fund basis. The following summarizes a number of important, but not necessarily all, factors considered by the Board in support of its approvals.
Nature, extent and quality of services
The Board received and considered various information regarding the nature, extent and quality of services provided to the Fund by Funds Management and the Sub-Adviser under the Advisory Agreements. This information included a description of the investment advisory services and Fund-level administrative services covered by the Management Agreement, as well as, among other things, a summary of the background and experience of senior management of Funds Management, and the qualifications, background, tenure and responsibilities of each of the portfolio managers primarily responsible for the day-to-day portfolio management of the Fund.
The Board evaluated the ability of Funds Management and the Sub-Adviser to attract and retain qualified investment professionals, including research, advisory and supervisory personnel. The Board further considered the compliance programs and compliance records of Funds Management and the Sub-Adviser. In addition, the Board took into account the full range of services provided to the Fund by Funds Management and its affiliates.
Fund performance and expenses
The Board considered the performance results for the Fund over various time periods ended December 31, 2015. The Board considered these results in comparison to the performance of funds in a universe that was determined by Broadridge Inc. (“Broadridge”) to be similar to the Fund (the “Universe”), and in comparison to the Fund’s benchmark index and to other comparative data. Broadridge is an independent provider of investment company data. The Board received a description of the methodology used by Broadridge to select the mutual funds in the performance Universe.
| | | | | | |
| Other information (unaudited) | | Wells Fargo Strategic Municipal Bond Fund | | | 47 | |
The Board noted that the performance of the Fund (Administrator Class) was higher than the average performance of the Universe for all periods under review. The Board also noted that the performance of the Fund was higher than its benchmark, the Barclays Short-Intermediate Municipal Bond Index, for all periods under review except the one- and ten-year periods.
The Board also received and considered information regarding the Fund’s net operating expense ratios and their various components, including actual management fees, custodian and other non-management fees, and Rule 12b-1 and non-Rule 12b-1 shareholder service fees. The Board considered these ratios in comparison to the median ratios of funds in class-specific expense groups that were determined by Broadridge to be similar to the Fund (the “Groups”). The Board received a description of the methodology used by Broadridge to select the mutual funds in the expense Groups and an explanation of how funds comprising expense groups and their expense ratios may vary from year-to-year. Based on the Broadridge reports, the Board noted that the net operating expense ratios of the Fund were lower than or in range of the median net operating expense ratios of the expense Groups.
The Board took into account the Fund performance and expense information provided to it among the factors considered in deciding to re-approve the Advisory Agreements.
Investment management and sub-advisory fee rates
The Board reviewed and considered the contractual fee rates payable by the Fund to Funds Management under the Management Agreement, as well as the contractual fee rates payable by the Fund to Funds Management for class-level administrative services under a Class-Level Administration Agreement, which include class-level transfer agency and sub-transfer agency costs (collectively, the “Management Rates”). The Board also reviewed and considered the contractual investment sub-advisory fee rates that are payable by Funds Management to the Sub-Adviser for investment sub-advisory services.
Among other information reviewed by the Board was a comparison of the Fund’s Management Rates with the average contractual investment management fee rates of funds in the expense Groups at a common asset level as well as transfer agency costs of the funds in the expense Groups. The Board noted that the Management Rates of the Fund were lower than or in range of the sum of these average rates for the Fund’s expense Groups for all share classes.
The Board also received and considered information about the portion of the total management fee that was retained by Funds Management after payment of the fee to the Sub-Adviser for sub-advisory services. In assessing the reasonableness of this amount, the Board received and evaluated information about the nature and extent of responsibilities retained and risks assumed by Funds Management and not delegated to or assumed by the Sub-Adviser, and about Funds Management’s on-going oversight services. However, given the affiliation between Funds Management and the Sub-Adviser, the Board ascribed limited relevance to the allocation of fees between them.
The Board also received and considered information about the nature and extent of services offered and fee rates charged by Funds Management and the Sub-Adviser to other types of clients with investment strategies similar to those of the Fund. In this regard, the Board received information about the significantly greater scope of services, and compliance, reporting and other legal burdens and risks of managing mutual funds compared with those associated with managing assets of non-mutual fund clients such as collective funds or institutional separate accounts.
Based on its consideration of the factors and information it deemed relevant, including those described here, the Board determined that the compensation payable to Funds Management under the Management Agreement and to the Sub-Adviser under the Sub-Advisory Agreement was reasonable, in light of the services covered by the Advisory Agreements.
Profitability
The Board received and considered information concerning the profitability of Funds Management, as well as the profitability of Wells Fargo as a whole, from providing services to the Fund and the fund family as a whole. The Board also received and considered information concerning the profitability of the Sub-Adviser from providing services to the fund family as a whole, noting that the Sub-Adviser’s profitability information with respect to providing services to the Fund was subsumed in the Wells Fargo and Funds Management profitability analysis.
Funds Management reported on the methodologies and estimates used in calculating profitability. Among other things, the Board noted that the levels of profitability reported on a fund-by-fund basis varied widely, depending on factors such as the size and type of fund. Based on its review, the Board did not deem the profits reported by Funds Management or Wells Fargo from its services to the Fund to be at a level that would prevent it from approving the continuation of the Advisory Agreements.
| | | | |
| 48 | | Wells Fargo Strategic Municipal Bond Fund | | Other information (unaudited) |
Economies of Scale
With respect to possible economies of scale, the Board noted the existence of breakpoints in the Fund’s management fee structure, which operate generally to reduce the Fund’s expense ratios as the Fund grows in size. It considered that, for a small fund or a fund that shrinks in size, breakpoints conversely can result in higher fee levels. The Board also considered that fee waiver and expense reimbursement arrangements and competitive fee rates at the outset are means of sharing potential economies of scale with shareholders of the Fund and the fund family as a whole. The Board considered Funds Management’s view that any analyses of potential economies of scale in managing a particular fund are inherently limited in light of the joint and common costs and investments that Funds Management incurs across the fund family as a whole.
The Board concluded that the Fund’s fee and expense arrangements, including contractual breakpoints, constituted a reasonable approach to sharing potential economies of scale with the Fund and its shareholders.
Other benefits to Funds Management and the Sub-Adviser
The Board received and considered information regarding potential “fall-out” or ancillary benefits received by Funds Management and its affiliates, including the Sub-Adviser, as a result of their relationships with the Fund. Ancillary benefits could include, among others, benefits directly attributable to other relationships with the Fund and benefits potentially derived from an increase in Funds Management’s and the Sub-Adviser’s business as a result of their relationships with the Fund. The Board noted that various affiliates of Funds Management may receive distribution-related fees, shareholder servicing payments and sub-transfer agency fees in respect of shares sold or held through them and services provided.
The Board also reviewed information about soft dollar credits earned and utilized by the Sub-Adviser, fees earned by Funds Management and the Sub-Adviser from managing a private investment vehicle for the fund family’s securities lending collateral and commissions earned by an affiliated broker from portfolio transactions.
Based on its consideration of the factors and information it deemed relevant, including those described here, the Board did not find that any ancillary benefits received by Funds Management and its affiliates, including the Sub-Adviser, were unreasonable.
Conclusion
At the Meeting, after considering the above-described factors and based on its deliberations and its evaluation of the information described above, the Board unanimously approved the continuation of the Advisory Agreements for a one-year term and determined that the compensation payable to Funds Management and the Sub-Adviser under each of the Advisory Agreements was reasonable.
| | | | | | |
| List of abbreviations | | Wells Fargo Strategic Municipal Bond Fund | | | 49 | |
The following is a list of common abbreviations for terms and entities that may have appeared in this report.
| ACA | — ACA Financial Guaranty Corporation |
| ADR | — American depositary receipt |
| ADS | — American depositary shares |
| AGC | — Assured Guaranty Corporation |
| AGM | — Assured Guaranty Municipal |
| Ambac | — Ambac Financial Group Incorporated |
| AMT | — Alternative minimum tax |
| BAN | — Bond anticipation notes |
| BHAC | — Berkshire Hathaway Assurance Corporation |
| CAB | — Capital appreciation bond |
| CCAB | — Convertible capital appreciation bond |
| CDA | — Community Development Authority |
| CDO | — Collateralized debt obligation |
| DRIVER | — Derivative inverse tax-exempt receipts |
| DW&P | — Department of Water & Power |
| DWR | — Department of Water Resources |
| ECFA | — Educational & Cultural Facilities Authority |
| EDA | — Economic Development Authority |
| EDFA | — Economic Development Finance Authority |
| ETF | — Exchange-traded fund |
| FDIC | — Federal Deposit Insurance Corporation |
| FFCB | — Federal Farm Credit Banks |
| FGIC | — Financial Guaranty Insurance Corporation |
| FHA | — Federal Housing Administration |
| FHLB | — Federal Home Loan Bank |
| FHLMC | — Federal Home Loan Mortgage Corporation |
| FICO | — The Financing Corporation |
| FNMA | — Federal National Mortgage Association |
| GDR | — Global depositary receipt |
| GNMA | — Government National Mortgage Association |
| HCFR | — Healthcare facilities revenue |
| HEFA | — Health & Educational Facilities Authority |
| HEFAR | — Higher education facilities authority revenue |
| HFA | — Housing Finance Authority |
| HFFA | — Health Facilities Financing Authority |
| HUD | — Department of Housing and Urban Development |
| IDA | — Industrial Development Authority |
| IDAG | — Industrial Development Agency |
| KRW | — Republic of Korea won |
| LIBOR | — London Interbank Offered Rate |
| LIFER | — Long Inverse Floating Exempt Receipts |
| LLC | — Limited liability company |
| LLLP | — Limited liability limited partnership |
| LLP | — Limited liability partnership |
| MBIA | — Municipal Bond Insurance Association |
| MFHR | — Multifamily housing revenue |
| MSTR | — Municipal securities trust receipts |
| MUD | — Municipal Utility District |
| National | — National Public Finance Guarantee Corporation |
| PCFA | — Pollution Control Financing Authority |
| PCL | — Public Company Limited |
| PCR | — Pollution control revenue |
| PFA | — Public Finance Authority |
| PFFA | — Public Facilities Financing Authority |
| PFOTER | — Puttable floating option tax-exempt receipts |
| plc | — Public limited company |
| PUTTER | — Puttable tax-exempt receipts |
| R&D | — Research & development |
| Radian | — Radian Asset Assurance |
| RAN | — Revenue anticipation notes |
| RDA | — Redevelopment Authority |
| RDFA | — Redevelopment Finance Authority |
| REIT | — Real estate investment trust |
| ROC | — Reset option certificates |
| SAVRS | — Select auction variable rate securities |
| SBA | — Small Business Authority |
| SDR | — Swedish depositary receipt |
| SFHR | — Single-family housing revenue |
| SFMR | — Single-family mortgage revenue |
| SPA | — Standby purchase agreement |
| SPDR | — Standard & Poor’s Depositary Receipts |
| SPEAR | — Short Puttable Exempt Adjustable Receipts |
| STRIPS | — Separate trading of registered interest and |
| TAN | — Tax anticipation notes |
| TIPS | — Treasury inflation-protected securities |
| TRAN | — Tax revenue anticipation notes |
| TTFA | — Transportation Trust Fund Authority |
| TVA | — Tennessee Valley Authority |
This page is intentionally left blank.
This page is intentionally left blank.
This page is intentionally left blank.

For more information
More information about Wells Fargo Funds is available free upon request. To obtain literature, please write, email, visit the Fund’s website, or call:
Wells Fargo Funds
P.O. Box 8266
Boston, MA 02266-8266
Email: fundservice@wellsfargo.com
Website: wellsfargofunds.com
Individual investors: 1-800-222-8222
Retail investment professionals: 1-888-877-9275
Institutional investment professionals: 1-866-765-0778
This report and the financial statements contained herein are submitted for the general information of the shareholders of the Fund. If this report is used for promotional purposes, distribution of the report must be accompanied or preceded by a current prospectus. Before investing, please consider the investment objectives, risks, charges, and expenses of the investment. For a current prospectus and, if available, a summary prospectus, containing this information, call 1-800-222-8222 or visit the Fund’s website at wellsfargofunds.com. Read the prospectus carefully before you invest or send money.
Wells Fargo Asset Management (WFAM) is a trade name used by the asset management businesses of Wells Fargo & Company. Wells Fargo Funds Management, LLC, a wholly owned subsidiary of Wells Fargo & Company, provides investment advisory and administrative services for Wells Fargo Funds. Other affiliates of Wells Fargo & Company provide subadvisory and other services for the funds. The funds are distributed by Wells Fargo Funds Distributor, LLC, Member FINRA, an affiliate of Wells Fargo & Company.
NOT FDIC INSURED ¡ NO BANK GUARANTEE ¡ MAY LOSE VALUE
© 2016 Wells Fargo Funds Management, LLC. All rights reserved.
| | |
 | | 244411 08-16 A257/AR257 6-16 |
Annual Report
June 30, 2016

Wells Fargo
Ultra Short-Term Municipal Income Fund


Reduce clutter. Save trees.
Sign up for electronic delivery of prospectuses and shareholder reports at wellsfargo.com/advantagedelivery
Contents
| * | A complete schedule of portfolio holdings as of the report date may be obtained, free of charge, by accessing the following website: https://www.wellsfargofunds.com/assets/edocs/regulatory/holdings/ultra-short-term-municipal-income-ann.pdf or by calling Wells Fargo Funds at 1-800-222-8222. This complete schedule, filed on Form N-CSR, is also available on the SEC’s website at sec.gov. |
The views expressed and any forward-looking statements are as of June 30, 2016, unless otherwise noted, and are those of the Fund managers and/or Wells Fargo Funds Management, LLC. Discussions of individual securities, or the markets generally, or any Wells Fargo Fund are not intended as individual recommendations. Future events or results may vary significantly from those expressed in any forward-looking statements. The views expressed are subject to change at any time in response to changing circumstances in the market. Wells Fargo Funds Management, LLC and the Fund disclaim any obligation to publicly update or revise any views expressed or forward-looking statements.
NOT FDIC INSURED ¡ NO BANK GUARANTEE ¡ MAY LOSE VALUE
| | | | |
| 2 | | Wells Fargo Ultra Short-Term Municipal Income Fund | | Letter to shareholders (unaudited) |

Karla M. Rabusch
President
Wells Fargo Funds
In fact, yields on municipal bonds that matured in 10 years or more experienced yield declines of more than 100 basis points (100 basis points equals 1.00%) during the reporting period.
Dear Valued Shareholder:
We are pleased to offer you this annual report for the Wells Fargo Ultra Short-Term Municipal Income Fund for the 12-month period that ended June 30, 2016. The U.S. Federal Reserve (Fed) began normalizing monetary policy, raising the federal funds rate to between 0.25% and 0.50% in December 2015. Short-term municipal bond yields rose, but yields on longer-term bonds declined. In fact, yields on municipal bonds that matured in 10 years or more experienced yield declines of more than 100 basis points (100 basis points equals 1.00%) during the reporting period. The Barclays Municipal Bond Index,1 a broad measure tracking investment-grade municipal bonds, returned 7.65% during the 12-month reporting period.
Monetary policy was accommodative.
The Fed continued an easy monetary policy in order to support the economy and the financial system. However, it raised the federal funds target rate in December because it believed the U.S. economy was strong enough to begin normalizing monetary policy. The European Central Bank cut all three of its short-term rates during the reporting period, increased its asset-purchase program from 60 billion euros per month to 80 billion, expanded the list of eligible securities to include investment-grade nonbank debt, and created a fund-to-lend program where banks could be paid to lend money. In Japan, the Bank of Japan maintained an aggressive monetary program aimed at combating deflation.
Despite accommodative central-bank policies that helped keep interest rates at ultra-low levels, there were periods of volatility. Early in 2016, weakness in certain emerging markets economies and commodities hurt riskier assets and a vote in June 2016 by the U.K. to exit the European Union set off another round of global uncertainty. Municipal bonds benefited because they are perceived as a safe-haven asset. In addition, investor demand for yield helped lower-rated debt outperform. The Barclays High Yield Municipal Bond Index2 returned 12.09% during the 12-month period that ended June 30, 2016.
Strong demand, modest supply, and solid credit fundamentals supported municipals.
Market technicals remained favorable. According to the Investment Company Institute, more than $33 billion was allocated to municipal mutual funds during the first half of 2016, which was more than double the inflows during all of 2015. Further, inflows during the second quarter of 2016 were the largest in nearly seven years. In contrast, less new supply helped make 2015 the fifth calendar year of negative net supply and supply in the first half of 2016 was about 4% less than the same period last year.
Municipal credit quality remained on an uptrend despite a number of high-profile negative credit situations. Idiosyncratic credit risks remain, however. With regard to Puerto Rico, the U.S. enacted legislation that prohibits bondholder lawsuits temporarily and instills a fiscal oversight board for Puerto Rico; Puerto Rico then declared a moratorium on paying its general obligation (GO) bonds and defaulted on $911 million in payments due (most of which were GOs) on July 1, 2016.
| 1 | The Barclays Municipal Bond Index is an unmanaged index composed of long-term tax-exempt bonds with a minimum credit rating of Baa. You cannot invest directly in an index. |
| 2 | The Barclays High Yield Municipal Bond Index measures the non-investment-grade and nonrated U.S. dollar–denominated, fixed-rate, tax-exempt bond market within the 50 United States and four other qualifying regions (Washington, D.C.; Puerto Rico; Guam; and the Virgin Islands). The index allows state and local general obligation, revenue, insured, and prerefunded bonds; however, historically the index has been composed of mostly revenue bonds. You cannot invest directly in an index. |
| | | | | | |
| Letter to shareholders (unaudited) | | Wells Fargo Ultra Short-Term Municipal Income Fund | | | 3 | |
The state of Illinois approved a six-month stopgap budget, a temporary but meaningful step. Under this stopgap budget for the state, the city of Chicago receives authority to raise property taxes for teacher pensions and low-income school districts would receive greater state funding. City of Chicago and school district debt rallied on the news.
Since the end of the financial crisis, structural changes in the fixed-income markets have reduced trading liquidity (the degree to which assets can be bought or sold without affecting the price). New regulations and capital requirements have caused traditional liquidity suppliers (banks and broker/dealers) to be more risk-averse and hold less inventory. Meanwhile, corporate-debt issuance has spiked as companies finance themselves at record-low yields, bond mutual funds hold larger amounts of this new debt supply, trading volumes are lower, and large trades are more difficult to execute. However, fixed-income markets appear to have functioned well over the past year with sufficient liquidity.
Don’t let short-term uncertainty derail long-term investment goals.
Periods of uncertainty can present challenges, but experience has taught us that maintaining long-term investment goals can be an effective way to plan for the future. To help you create a sound strategy based on your personal goals and risk tolerance, Wells Fargo Funds offers more than 100 mutual funds spanning a wide range of asset classes and investment styles. Although diversification cannot guarantee an investment profit or prevent losses, we believe it can be an effective way to manage investment risk and potentially smooth out overall portfolio performance. We encourage investors to know their investments and to understand that appropriate levels of risk-taking may unlock opportunities.
Thank you for choosing to invest in Wells Fargo Funds. We appreciate your confidence in us and remain committed to helping you meet your financial needs.
Sincerely,

Karla M. Rabusch
President
Wells Fargo Funds
Periods of uncertainty can present challenges, but experience has taught us that maintaining long-term investment goals can be an effective way to plan for the future.
For further information about your Fund, contact your investment professional, visit our website at wellsfargofunds.com, or call us directly at 1-800-222-8222. We are available 24 hours a day, 7 days a week.
| | | | |
| 4 | | Wells Fargo Ultra Short-Term Municipal Income Fund | | Performance highlights (unaudited) |
Investment objective
The Fund seeks current income exempt from federal income tax, consistent with capital preservation.
Manager
Wells Fargo Funds Management, LLC
Subadviser
Wells Capital Management Incorporated
Portfolio managers
Wendy Casetta
Lyle J. Fitterer, CFA,® CPA
Average annual total returns (%) as of June 30, 20161
| | | | | | | | | | | | | | | | | | | | | | | | | | | | | | | | | | |
| | | | | Including sales charge | | | Excluding sales charge | | | Expense ratios2 (%) | |
| | | Inception date | | 1 year | | | 5 year | | | 10 year | | | 1 year | | | 5 year | | | 10 year | | | Gross | | | Net3 | |
| Class A (SMAVX) | | 10-2-2000 | | | (1.41 | ) | | | 0.02 | | | | 1.63 | | | | 0.61 | | | | 0.43 | | | | 1.84 | | | | 0.74 | | | | 0.67 | |
| Class C (WFUSX ) | | 3-31-2008 | | | (1.19 | ) | | | (0.30 | ) | | | 1.09 | | | | (0.19 | ) | | | (0.30 | ) | | | 1.09 | | | | 1.49 | | | | 1.42 | |
| Administrator Class (WUSMX) | | 7-30-2010 | | | – | | | | – | | | | – | | | | 0.68 | | | | 0.50 | | | | 1.93 | | | | 0.68 | | | | 0.60 | |
| Institutional Class (SMAIX) | | 7-31-2000 | | | – | | | | – | | | | – | | | | 0.91 | | | | 0.73 | | | | 2.16 | | | | 0.41 | | | | 0.37 | |
| Barclays 1-Year Municipal Bond Index4 | | – | | | – | | | | – | | | | – | | | | 1.05 | | | | 0.81 | | | | 2.07 | | | | – | | | | – | |
Figures quoted represent past performance, which is no guarantee of future results, and do not reflect taxes that a shareholder may pay on fund distributions or the redemption of fund shares. Investment return and principal value of an investment will fluctuate so that an investor’s shares, when redeemed, may be worth more or less than their original cost. Performance shown without sales charges would be lower if sales charges were reflected. Current performance may be lower or higher than the performance data quoted, which assumes the reinvestment of dividends and capital gains. Current month-end performance is available on the Fund’s website, wellsfargofunds.com.
Index returns do not include transaction costs associated with buying and selling securities, any mutual fund fees or expenses, or any taxes. It is not possible to invest directly in an index.
For Class A shares, the maximum front-end sales charge is 2.00%. For Class C shares, the maximum contingent deferred sales charge is 1.00%. Performance including a contingent deferred sales charge assumes the sales charge for the corresponding time period. Administrator Class, and Institutional Class shares are sold without a front-end sales charge or contingent deferred sales charge.
Bond values fluctuate in response to the financial condition of individual issuers, general market and economic conditions, and changes in interest rates. Changes in market conditions and government policies may lead to periods of heightened volatility in the bond market and reduced liquidity for certain bonds held by the Fund. In general, when interest rates rise, bond values fall and investors may lose principal value. Interest-rate changes and their impact on the Fund and its share price can be sudden and unpredictable. The use of derivatives may reduce returns and/or increase volatility. Certain investment strategies tend to increase the total risk of an investment (relative to the broader market). The Fund is exposed to high-yield securities risk and municipal securities risk. Consult the Fund’s prospectus for additional information on these and other risks. A portion of the Fund’s income may be subject to federal, state, and/or local income taxes or the Alternative Minimum Tax (AMT). Any capital gains distributions may be taxable.
Please see footnotes on page 5.
| | | | | | |
| Performance highlights (unaudited) | | Wells Fargo Ultra Short-Term Municipal Income Fund | | | 5 | |
|
| Growth of $10,000 investment as of June 30, 20165 |
|
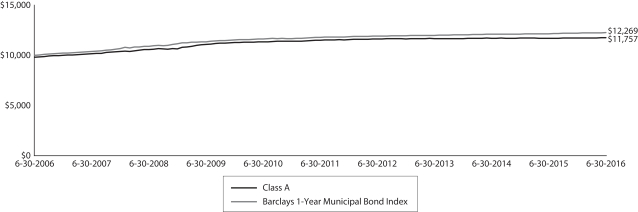 |
| 1 | Historical performance shown for Class C shares prior to their inception reflects the performance of Class A shares, adjusted to reflect the higher expenses applicable to Class C shares. Historical performance shown for Administrator Class shares prior to their inception reflects the performance of Institutional Class shares, adjusted to reflect the higher expenses applicable to Administrator Class shares. |
| 2 | Reflects the expense ratios as stated in the most recent prospectuses. The expense ratios shown are subject to change and may differ from the annualized expense ratios shown in the financial highlights of this report. |
| 3 | The manager has contractually committed through October 31, 2016, to waive fees and/or reimburse expenses to the extent necessary to cap the Fund’s Total Annual Fund Operating Expenses After Fee Waiver at the amounts shown. After this time, the cap may be increased or the commitment to maintain the cap may be terminated only with the approval of the Board of Trustees. Brokerage commissions, stamp duty fees, interest, taxes, acquired fund fees and expenses, and extraordinary expenses are excluded from the expense cap. Without this cap, the Fund’s returns would have been lower. |
| 4 | The Barclays 1-Year Municipal Bond Index is the one-year component of the Barclays Municipal Bond Index, which is an unmanaged index composed of long-term tax-exempt bonds with a minimum credit rating of Baa. You cannot invest directly in an index. |
| 5 | The chart compares the performance of Class A shares for the most recent ten years with the Barclays 1- Year Municipal Bond Index. The chart assumes a hypothetical $10,000 investment in Class A shares and reflects all operating expenses and assumes the maximum initial sales charge of 2.00%. |
| 6 | Amounts are calculated based on the total investments of the Fund. These amounts are subject to change and may have changed since the date specified. |
| 7 | The credit quality distribution of portfolio holdings reflected in the chart is based on ratings from Standard & Poor’s, Moody’s Investors Service, and/or Fitch Ratings Ltd. Credit quality ratings apply to the underlying holdings of the Fund and not to the Fund itself. The percentages of the Fund’s portfolio with the ratings depicted in the chart are calculated based on the total market value of fixed income securities held by the Fund. If a security was rated by all three rating agencies, the middle rating was utilized. If rated by two of three rating agencies, the lower rating was utilized, and if rated by one of the rating agencies, that rating was utilized. Standard & Poor’s rates the creditworthiness of bonds, ranging from AAA (highest) to D (lowest). Ratings from A to CCC may be modified by the addition of a plus (+) or minus (-) sign to show relative standing within the rating categories. Standard & Poor’s rates the creditworthiness of short-term notes from SP-1 (highest) to SP-3 (lowest). Moody’s rates the creditworthiness of bonds, ranging from Aaa (highest) to C (lowest). Ratings Aa to B may be modified by the addition of a number 1 (highest) to 3 (lowest) to show relative standing within the ratings categories. Moody’s rates the creditworthiness of short-term U.S. tax-exempt municipal securities from MIG 1/VMIG 1 (highest) to SG (lowest). Fitch rates the creditworthiness of bonds, ranging from AAA (highest) to D (lowest). Credit quality distribution is subject to change and may have changed since the date specified. |
| | | | |
| 6 | | Wells Fargo Ultra Short-Term Municipal Income Fund | | Performance highlights (unaudited) |
MANAGER’S DISCUSSION
Fund highlights
| n | | The Fund underperformed its benchmark, the Barclays 1-Year Municipal Bond Index, for the 12-month period that ended June 30, 2016. |
| n | | Security selection was the main detractor from performance. The Fund was overweight the outperforming industrial development revenue/pollution control revenue and hospital sectors, but its holdings within those sectors slightly underperformed the index. |
| n | | Duration was significantly shorter than the benchmark’s duration because of the Fund’s ultra-short mandate, which helped results as short-term interest rates rose. Yield-curve positioning contributed to performance. At the front end, variable-rate demand note (VRDN) and floating-rate note (FRN) yields, with either daily or weekly coupon resets, benefited from higher short-term rates. Further out the curve, bond yields in the four- and five-year maturity range decreased, adding to performance. |
| n | | An overweight to A-rated and BBB-rated bonds, combined with an underweight to higher-rated and prerefunded bonds, helped performance. |
In a period of ultralow yields, short-term rates rose and longer-term rates declined.
At the beginning of the period, the base-case projection for an increase in the federal funds target rate was late 2015, which made bonds with shorter-term maturities less attractive due to a potential backup in municipal rates as the U.S. Federal Reserve (Fed) normalized its interest-rate policy. Also, money market reform is scheduled to take effect in October 2016. As a result, demand for municipal-money-market eligible paper declined and yields on the very front end of the yield curve rose. Consequently, the municipal yield curve flattened due to the underperformance of the short end of the curve and the outperformance of the longer end of the curve. Inflows into municipal bond funds remained positive as yields in other parts of the world have drifted into negative territory and investors are looking for alternatives.
|
| Effective maturity distribution as of June 30, 20166 |
|
 |
During the past year, we managed the Fund in a conservative manner from a duration perspective. We held duration short relative to the benchmark by keeping nearly half of the Fund invested in VRDNs and FRNs. We believe both of these structures have the potential to benefit from a rise in interest rates while maintaining fairly stable prices and high levels of liquidity and adding little duration. We like the defensive nature of these structures and intend to maintain an overweight exposure. The balance of the portfolio was invested in securities with maturities in the four- to five-year part of the curve. We believe the steepness of the front-end of the yield curve is likely to provide nice total return opportunities as the securities roll down the yield curve, benefiting from a natural increase in price as maturities shorten while potentially providing higher levels of income.
Please see footnotes on page 5.
| | | | | | |
| Performance highlights (unaudited) | | Wells Fargo Ultra Short-Term Municipal Income Fund | | | 7 | |
|
| Credit quality as of June 30, 20167 |
|
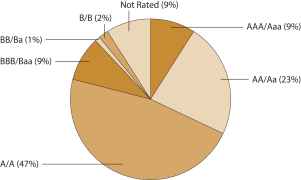 |
Credit-quality allocation helped results.
Lower-rated bonds on the shorter end of the yield curve did well during the past year. We believe lower-rated credits should continue to experience good performance as investors search for income and municipal credit trends improve. Some of our sector tactics included increasing the Fund’s exposure to short-term local general obligation bonds and corporate-backed municipal bonds because we believe near-term fundamentals continue to look favorable and yield spreads are attractive from a longer-term perspective. On the other hand, we have increased our exposure to housing bonds that are backed by an escrow invested in
Treasury bonds. This high-quality structure has provided a nice level of income while it increased the overall credit quality of the Fund.
Political noise and a lack of a state budget caused volatility within the state of Illinois, but the state’s bonds had some of the highest returns. We have been overweight Illinois bonds because we feel that the above-market income is compensating investors for the credit uncertainty. We continue to believe that the state’s economic backdrop and ability to raise revenues, combined with Illinois Governor Bruce Rauner’s focus on cutting expenses, should lead to tighter spreads. New Jersey bonds also performed well as spreads tightened. Finally, short-term insured Puerto Rico debt performed well over the period.
Rates may be lower for longer.
Near the end of the reporting period, the U.K. voted to withdraw from the European Union, prompting considerable uncertainty about future political situations, financial markets, and economic growth. U.S. Treasuries and municipal bonds rallied significantly on the news, and both 10-year and 30-year municipal yields reached record-low levels. It remains to be seen whether the spike down in rates is an overreaction. At this point, we still believe the U.S. economy should grow at about a 2% pace. With inflation close to the target 2% rate and the unemployment rate below 5%, it is clear that central-bank policies are keeping U.S. rates artificially low. Although we now think rates will stay lower for longer, we recognize that an improvement in overseas economies, outflows in mutual funds, or a more hawkish tone from the Fed could lead to an increase in rates.
Please see footnotes on page 5.
| | | | |
| 8 | | Wells Fargo Ultra Short-Term Municipal Income Fund | | Fund expenses (unaudited) |
As a shareholder of the Fund, you incur two types of costs: (1) transaction costs, including sales charges (loads) on purchase payments and contingent deferred sales charges (if any) on redemptions and (2) ongoing costs, including management fees, distribution (12b-1) and/or shareholder servicing fees, and other Fund expenses. This example is intended to help you understand your ongoing costs (in dollars) of investing in the Fund and to compare these costs with the ongoing costs of investing in other mutual funds.
The example is based on an investment of $1,000 invested at the beginning of the six-month period and held for the entire period from January 1, 2016 to June 30, 2016.
Actual expenses
The “Actual” line of the table below provides information about actual account values and actual expenses. You may use the information in this line, together with the amount you invested, to estimate the expenses that you paid over the period. Simply divide your account value by $1,000 (for example, an $8,600 account value divided by $1,000 = 8.6), then multiply the result by the number in the “Actual” line under the heading entitled “Expenses paid during period” for your applicable class of shares to estimate the expenses you paid on your account during this period.
Hypothetical example for comparison purposes
The “Hypothetical” line of the table below provides information about hypothetical account values and hypothetical expenses based on the Fund’s actual expense ratio and an assumed rate of return of 5% per year before expenses, which is not the Fund’s actual return. The hypothetical account values and expenses may not be used to estimate the actual ending account balance or expenses you paid for the period. You may use this information to compare the ongoing costs of investing in the Fund and other funds. To do so, compare this 5% hypothetical example with the 5% hypothetical examples that appear in the shareholder reports of the other funds.
Please note that the expenses shown in the table are meant to highlight your ongoing costs only and do not reflect any transactional costs, such as sales charges (loads) and contingent deferred sales charges. Therefore, the “Hypothetical” line of the table is useful in comparing ongoing costs only and will not help you determine the relative total costs of owning different funds. In addition, if these transactional costs were included, your costs would have been higher.
| | | | | | | | | | | | | | | | |
| | | Beginning
account value
1-1-2016 | | | Ending
account value
6-30-2016 | | | Expenses
paid during
the period¹ | | | Net annualized
expense ratio | |
Class A | | | | | | | | | | | | | | | | |
Actual | | $ | 1,000.00 | | | $ | 1,003.13 | | | $ | 3.34 | | | | 0.67 | % |
Hypothetical (5% return before expenses) | | $ | 1,000.00 | | | $ | 1,021.53 | | | $ | 3.37 | | | | 0.67 | % |
Class C | | | | | | | | | | | | | | | | |
Actual | | $ | 1,000.00 | | | $ | 998.94 | | | $ | 7.06 | | | | 1.42 | % |
Hypothetical (5% return before expenses) | | $ | 1,000.00 | | | $ | 1,017.80 | | | $ | 7.12 | | | | 1.42 | % |
Administrator Class | | | | | | | | | | | | | | | | |
Actual | | $ | 1,000.00 | | | $ | 1,003.48 | | | $ | 2.99 | | | | 0.60 | % |
Hypothetical (5% return before expenses) | | $ | 1,000.00 | | | $ | 1,021.88 | | | $ | 3.02 | | | | 0.60 | % |
Institutional Class | | | | | | | | | | | | | | | | |
Actual | | $ | 1,000.00 | | | $ | 1,004.63 | | | $ | 1.84 | | | | 0.37 | % |
Hypothetical (5% return before expenses) | | $ | 1,000.00 | | | $ | 1,023.02 | | | $ | 1.86 | | | | 0.37 | % |
| 1 | Expenses paid is equal to the annualized expense ratio of each class multiplied by the average account value over the period, multiplied by the number of days in the most recent fiscal half-year divided by the number of days in the fiscal year (to reflect the one-half-year period). |
| | | | | | |
| Summary portfolio of investments—June 30, 2016 | | Wells Fargo Ultra Short-Term Municipal Income Fund | | | 9 | |
The Summary portfolio of investments shows the 50 largest portfolio holdings in unaffiliated issuers and any holdings exceeding 1% of the total net assets as of the report date. The remaining securities held are grouped as “Other securities” in each category.
| | | | | | | | | | | | | | | | | | | | |
| Security name | | Interest rate | | | Maturity date | | | Principal | | | Value | | | Percent of
net assets | |
| | | | | |
Agency Securities: 0.22% | | | | | | | | | | | | | | | | | | | | |
Other securities | | | | | | | | | | | | | | $ | 12,330,750 | | | | 0.22 | % |
| | | | | | | | | | | | | | | | | | | | |
| | | | | |
Total Agency Securities
(Cost $12,744,996) | | | | | | | | | | | | | | | 12,330,750 | | | | 0.22 | |
| | | | | | | | | | | | | | | | | | | | |
| | | | | |
Municipal Obligations: 95.63% | | | | | | | | | | | | | | | | | | | | |
| | | | | |
| Alabama: 2.88% | | | | | | | | | | | | | | | | | | | | |
Chatom AL Industrial Development Board Gulf Opportunity Zone PowerSouth Energy Cooperative Projects Series A (Utilities Revenue, National Rural Utilities Finance Corporation SPA) ± | | | 0.88 | % | | | 11-15-2038 | | | $ | 39,545,000 | | | | 39,557,259 | | | | 0.72 | |
Tender Option Bond Trust Receipts for Alabama Series XM0184 (Utilities Revenue, Morgan Stanley Bank LIQ) ø144A | | | 0.84 | | | | 9-1-2046 | | | | 31,400,000 | | | | 31,400,000 | | | | 0.57 | |
Other securities | | | | | | | | | | | | | | | 88,261,652 | | | | 1.59 | |
| | | | | |
| | | | | | | | | | | | | | | 159,218,911 | | | | 2.88 | |
| | | | | | | | | | | | | | | | | | | | |
| | | | | |
| Alaska: 0.16% | | | | | | | | | | | | | | | | | | | | |
Other securities | | | | | | | | | | | | | | | 8,973,117 | | | | 0.16 | |
| | | | | | | | | | | | | | | | | | | | |
| | | | | |
| Arizona: 1.51% | | | | | | | | | | | | | | | | | | | | |
Phoenix AZ IDA Various Republic Services Incorporated Projects (Industrial Development Revenue) ± | | | 0.90 | | | | 12-1-2035 | | | | 25,000,000 | | | | 25,000,750 | | | | 0.45 | |
Scottsdale AZ IDA Healthcare Series F (Health Revenue, AGM Insured) ±(m) | | | 0.64 | | | | 9-1-2045 | | | | 47,825,000 | | | | 47,825,000 | | | | 0.86 | |
Other securities | | | | | | | | | | | | | | | 10,840,427 | | | | 0.20 | |
| | | | | |
| | | | | | | | | | | | | | | 83,666,177 | | | | 1.51 | |
| | | | | | | | | | | | | | | | | | | | |
| | | | | |
| Arkansas: 0.04% | | | | | | | | | | | | | | | | | | | | |
Other securities | | | | | | | | | | | | | | | 2,247,489 | | | | 0.04 | |
| | | | | | | | | | | | | | | | | | | | |
| | | | | |
| California: 6.46% | | | | | | | | | | | | | | | | | | | | |
Bay Area Toll Authority California San Francisco Bay Area Toll Bridge Series A (Transportation Revenue) ± | | | 1.00 | | | | 4-1-2047 | | | | 28,885,000 | | | | 28,915,618 | | | | 0.52 | |
California Infrastructure & Economic Development Bank The J. Paul Getty Trust Series A-2 (Miscellaneous Revenue) ± | | | 0.67 | | | | 4-1-2038 | | | | 22,920,000 | | | | 22,894,559 | | | | 0.41 | |
California Infrastructure & Economic Development Bank The J. Paul Getty Trust Series A-3 (Miscellaneous Revenue) ± | | | 0.67 | | | | 4-1-2038 | | | | 15,600,000 | | | | 15,582,684 | | | | 0.28 | |
California Infrastructure & Economic Development Bank The J. Paul Getty Trust Series A-4 (Miscellaneous Revenue) ± | | | 0.67 | | | | 4-1-2038 | | | | 32,000,000 | | | | 31,964,480 | | | | 0.58 | |
California Statewide CDA (Various Revenue) µ | | | 0.52-5.00 | | | | 11-15-2016 to 7-1-2040 | | | | 48,660,000 | | | | 48,703,130 | | | | 0.89 | |
California Statewide CDA Health Facilities Catholic Series D (Health Revenue, AGM Insured) ±(m) | | | 0.51 | | | | 7-1-2041 | | | | 29,375,000 | | | | 29,375,000 | | | | 0.53 | |
Other securities | | | | | | | | | | | | | | | 179,760,797 | | | | 3.25 | |
| | | | | |
| | | | | | | | | | | | | | | 357,196,268 | | | | 6.46 | |
| | | | | | | | | | | | | | | | | | | | |
The accompanying notes are an integral part of these financial statements.
| | | | |
| 10 | | Wells Fargo Ultra Short-Term Municipal Income Fund | | Summary portfolio of investments—June 30, 2016 |
| | | | | | | | | | | | | | | | | | | | |
| Security name | | Interest rate | | | Maturity date | | | Principal | | | Value | | | Percent of
net assets | |
| | | | | |
| Colorado: 0.57% | | | | | | | | | | | | | | | | | | | | |
Other securities | | | | | | | | | | | | | | $ | 31,747,110 | | | | 0.57 | % |
| | | | | | | | | | | | | | | | | | | | |
| | | | | |
| Connecticut: 3.39% | | | | | | | | | | | | | | | | | | | | |
Connecticut HEFA Yale University Series T-2 (Education Revenue) ± | | | 0.60 | % | | | 7-1-2029 | | | $ | 34,520,000 | | | | 34,525,523 | | | | 0.62 | |
Connecticut HEFA Yale University Series X-2 (Education Revenue) ± | | | 0.90 | | | | 7-1-2037 | | | | 24,600,000 | | | | 24,663,222 | | | | 0.45 | |
Other securities | | | | | | | | | | | | | | | 128,163,364 | | | | 2.32 | |
| | | | | |
| | | | | | | | | | | | | | | 187,352,109 | | | | 3.39 | |
| | | | | | | | | | | | | | | | | | | | |
| | | | | |
| Delaware: 0.64% | | | | | | | | | | | | | | | | | | | | |
Other securities | | | | | | | | | | | | | | | 35,400,000 | | | | 0.64 | |
| | | | | | | | | | | | | | | | | | | | |
| | | | | |
| District of Columbia: 0.21% | | | | | | | | | | | | | | | | | | | | |
Other securities | | | | | | | | | | | | | | | 11,568,318 | | | | 0.21 | |
| | | | | | | | | | | | | | | | | | | | |
| | | | | |
| Florida: 3.98% | | | | | | | | | | | | | | | | | | | | |
Miami-Dade County FL (Various Revenue) µ | | | 0.61-5.25 | | | | 10-1-2017 to 5-1-2031 | | | | 91,435,000 | | | | 92,358,185 | | | | 1.68 | |
Miami-Dade County FL School Board Certificate of Participation Series 3 (Miscellaneous Revenue, Dexia Credit Local LOC, Ambac Insured, Dexia Credit Local LIQ) ø144A | | | 0.84 | | | | 9-25-2024 | | | | 27,895,000 | | | | 27,895,000 | | | | 0.50 | |
Miami-Dade County FL School Board Certificate of Participation Series 5 (Miscellaneous Revenue, Dexia Credit Local LOC, FGIC Insured, Dexia Credit Local LIQ) ø144A | | | 0.78 | | | | 5-1-2037 | | | | 25,000,000 | | | | 25,000,000 | | | | 0.45 | |
Other securities | | | | | | | | | | | | | | | 75,066,512 | | | | 1.35 | |
| | | | | |
| | | | | | | | | | | | | | | 220,319,697 | | | | 3.98 | |
| | | | | | | | | | | | | | | | | | | | |
| | | | | |
| Georgia: 3.03% | | | | | | | | | | | | | | | | | | | | |
Georgia Series G (GO Revenue) ± | | | 0.81 | | | | 12-1-2026 | | | | 106,305,000 | | | | 106,217,830 | | | | 1.92 | |
Other securities | | | | | | | | | | | | | | | 61,355,201 | | | | 1.11 | |
| | | | | |
| | | | | | | | | | | | | | | 167,573,031 | | | | 3.03 | |
| | | | | | | | | | | | | | | | | | | | |
| | | | | |
| Guam: 0.07% | | | | | | | | | | | | | | | | | | | | |
Other securities | | | | | | | | | | | | | | | 3,766,366 | | | | 0.07 | |
| | | | | | | | | | | | | | | | | | | | |
| | | | | |
| Hawaii: 0.11% | | | | | | | | | | | | | | | | | | | | |
Other securities | | | | | | | | | | | | | | | 6,309,635 | | | | 0.11 | |
| | | | | | | | | | | | | | | | | | | | |
| | | | | |
| Idaho: 0.54% | | | | | | | | | | | | | | | | | | | | |
Other securities | | | | | | | | | | | | | | | 30,110,920 | | | | 0.54 | |
| | | | | | | | | | | | | | | | | | | | |
| | | | | |
| Illinois: 8.99% | | | | | | | | | | | | | | | | | | | | |
Chicago IL Board of Education (GO Revenue) µ | | | 0.00-5.25 | | | | 12-1-2016 to 3-1-2032 | | | | 31,375,000 | | | | 30,642,642 | | | | 0.56 | |
Chicago IL Board of Education Series A2 (GO Revenue) ± | | | 1.14 | | | | 3-1-2035 | | | | 72,320,000 | | | | 68,211,479 | | | | 1.23 | |
Deutsche Bank SPEAR/LIFER Trust Series DBE 1032 (Tax Revenue, Deutsche Bank LIQ) ø144A | | | 0.66 | | | | 12-1-2036 | | | | 31,235,000 | | | | 31,235,000 | | | | 0.57 | |
Illinois (Various Revenue) | | | 2.50-5.00 | | | | 8-1-2016 to 1-1-2021 | | | | 116,110,000 | | | | 120,678,062 | | | | 2.18 | |
The accompanying notes are an integral part of these financial statements.
| | | | | | |
| Summary portfolio of investments—June 30, 2016 | | Wells Fargo Ultra Short-Term Municipal Income Fund | | | 11 | |
| | | | | | | | | | | | | | | | | | | | |
| Security name | | Interest rate | | | Maturity date | | | Principal | | | Value | | | Percent of
net assets | |
| | | | | |
| Illinois (continued) | | | | | | | | | | | | | | | | | | | | |
Regional Transportation Authority Illinois Refunding Bond Series B (Tax Revenue) ± | | | 0.65 | % | | | 6-1-2025 | | | $ | 38,675,000 | | | $ | 38,675,000 | | | | 0.70 | % |
Tender Option Bond Trust Receipts Floaters Series 2016-XG0008 (Health Revenue, AGC Insured, Bank of America NA LIQ) ø144A | | | 0.68 | | | | 8-15-2047 | | | | 23,375,000 | | | | 23,375,000 | | | | 0.42 | |
Other securities | | | | | | | | | | | | | | | 184,229,463 | | | | 3.33 | |
| | | | | |
| | | | | | | | | | | | | | | 497,046,646 | | | | 8.99 | |
| | | | | | | | | | | | | | | | | | | | |
| | | | | |
| Indiana: 1.36% | | | | | | | | | | | | | | | | | | | | |
Gary IN Woodlake-Concord Project (Housing Revenue, FHA Insured) ± | | | 1.00 | | | | 10-1-2017 | | | | 22,715,000 | | | | 22,722,723 | | | | 0.41 | |
Other securities | | | | | | | | | | | | | | | 52,436,799 | | | | 0.95 | |
| | | | | |
| | | | | | | | | | | | | | | 75,159,522 | | | | 1.36 | |
| | | | | | | | | | | | | | | | | | | | |
| | | | | |
| Iowa: 0.62% | | | | | | | | | | | | | | | | | | | | |
Other securities | | | | | | | | | | | | | | | 34,534,515 | | | | 0.62 | |
| | | | | | | | | | | | | | | | | | | | |
| | | | | |
| Kansas: 0.63% | | | | | | | | | | | | | | | | | | | | |
Other securities | | | | | | | | | | | | | | | 34,598,254 | | | | 0.63 | |
| | | | | | | | | | | | | | | | | | | | |
| | | | | |
| Kentucky: 2.57% | | | | | | | | | | | | | | | | | | | | |
Ashland KY Ashland Hospital Corporation Kings Daughters Medical Center Project (Health Revenue) ± | | | 2.14 | | | | 2-1-2040 | | | | 30,700,000 | | | | 30,717,499 | | | | 0.56 | |
Kentucky Public Transportation Infrastructure Authority Tolls Downtown Crossing Project BAN Series A (Transportation Revenue) | | | 5.00 | | | | 7-1-2017 | | | | 50,920,000 | | | | 52,863,616 | | | | 0.96 | |
Other securities | | | | | | | | | | | | | | | 58,375,853 | | | | 1.05 | |
| | | | | |
| | | | | | | | | | | | | | | 141,956,968 | | | | 2.57 | |
| | | | | | | | | | | | | | | | | | | | |
| | | | | |
| Louisiana: 1.39% | | | | | | | | | | | | | | | | | | | | |
East Baton Rouge Parish LA Sewerage Commission Refunding Bond Series A (Water & Sewer Revenue) ± | | | 0.82 | | | | 2-1-2046 | | | | 24,000,000 | | | | 23,772,960 | | | | 0.43 | |
St. James Parish LA Nucor Steel LLC Project Gulf Opportunity Zone Series A-1 (Industrial Development Revenue) ø | | | 0.65 | | | | 11-1-2040 | | | | 35,000,000 | | | | 35,000,000 | | | | 0.63 | |
Other securities | | | | | | | | | | | | | | | 18,189,576 | | | | 0.33 | |
| | | | | |
| | | | | | | | | | | | | | | 76,962,536 | | | | 1.39 | |
| | | | | | | | | | | | | | | | | | | | |
| | | | | |
| Maine: 0.29% | | | | | | | | | | | | | | | | | | | | |
Other securities | | | | | | | | | | | | | | | 15,785,053 | | | | 0.29 | |
| | | | | | | | | | | | | | | | | | | | |
| | | | | |
| Maryland: 1.83% | | | | | | | | | | | | | | | | | | | | |
Maryland CDA (Housing Revenue) µ | | | 0.55-1.40 | | | | 12-15-2016 to 12-1-2017 | | | | 87,350,000 | | | | 87,368,729 | | | | 1.57 | |
Other securities | | | | | | | | | | | | | | | 14,036,696 | | | | 0.26 | |
| | | | | |
| | | | | | | | | | | | | | | 101,405,425 | | | | 1.83 | |
| | | | | | | | | | | | | | | | | | | | |
The accompanying notes are an integral part of these financial statements.
| | | | |
| 12 | | Wells Fargo Ultra Short-Term Municipal Income Fund | | Summary portfolio of investments—June 30, 2016 |
| | | | | | | | | | | | | | | | | | | | |
| Security name | | Interest rate | | | Maturity date | | | Principal | | | Value | | | Percent of
net assets | |
| | | | | |
| Massachusetts: 2.47% | | | | | | | | | | | | | | | | | | | | |
Massachusetts Consolidated Loan Series D-1 (Miscellaneous Revenue) ø | | | 0.59 | % | | | 8-1-2043 | | | $ | 78,750,000 | | | $ | 78,750,000 | | | | 1.43 | % |
Other securities | | | | | | | | | | | | | | | 57,784,352 | | | | 1.04 | |
| | | | | |
| | | | | | | | | | | | | | | 136,534,352 | | | | 2.47 | |
| | | | | | | | | | | | | | | | | | | | |
| | | | | |
| Michigan: 3.83% | | | | | | | | | | | | | | | | | | | | |
Michigan Finance Authority (Water & Sewer Revenue) µ | | | 5.00 | | | | 7-1-2016 to 7-1-2018 | | | | 101,765,000 | | | | 106,532,644 | | | | 1.92 | |
Other securities | | | | | | | | | | | | | | | 105,225,232 | | | | 1.91 | |
| | | | | |
| | | | | | | | | | | | | | | 211,757,876 | | | | 3.83 | |
| | | | | | | | | | | | | | | | | | | | |
| | | | | |
| Minnesota: 0.89% | | | | | | | | | | | | | | | | | | | | |
Other securities | | | | | | | | | | | | | | | 48,953,257 | | | | 0.89 | |
| | | | | | | | | | | | | | | | | | | | |
| | | | | |
| Mississippi: 0.71% | | | | | | | | | | | | | | | | | | | | |
Other securities | | | | | | | | | | | | | | | 39,015,661 | | | | 0.71 | |
| | | | | | | | | | | | | | | | | | | | |
| | | | | |
| Missouri: 0.71% | | | | | | | | | | | | | | | | | | | | |
Other securities | | | | | | | | | | | | | | | 39,408,134 | | | | 0.71 | |
| | | | | | | | | | | | | | | | | | | | |
| | | | | |
| Nebraska: 0.20% | | | | | | | | | | | | | | | | | | | | |
Other securities | | | | | | | | | | | | | | | 11,244,850 | | | | 0.20 | |
| | | | | | | | | | | | | | | | | | | | |
| | | | | |
| Nevada: 0.02% | | | | | | | | | | | | | | | | | | | | |
Other securities | | | | | | | | | | | | | | | 1,062,780 | | | | 0.02 | |
| | | | | | | | | | | | | | | | | | | | |
| | | | | |
| New Jersey: 6.60% | | | | | | | | | | | | | | | | | | | | |
New Jersey EDA (Various Revenue) µ | | | 1.12-5.00 | | | | 12-15-2016 to 6-15-2019 | | | | 68,185,000 | | | | 71,863,356 | | | | 1.30 | |
Other securities | | | | | | | | | | | | | | | 293,265,537 | | | | 5.30 | |
| | | | | |
| | | | | | | | | | | | | | | 365,128,893 | | | | 6.60 | |
| | | | | | | | | | | | | | | | | | | | |
| | | | | |
| New Mexico: 0.73% | | | | | | | | | | | | | | | | | | | | |
New Mexico Municipal Energy Acquisition Authority Gas Supply Sub Series B (Utilities Revenue, Royal Bank of Canada SPA) ± | | | 1.06 | | | | 11-1-2039 | | | | 40,685,000 | | | | 40,368,878 | | | | 0.73 | |
| | | | | | | | | | | | | | | | | | | | |
| | | | | |
| New York: 13.29% | | | | | | | | | | | | | | | | | | | | |
Metropolitan Transportation Authority New York (Various Revenue) | | | 0.25-0.91 | | | | 8-1-2016 to 11-15-2044 | | | | 28,005,000 | | | | 27,831,524 | | | | 0.50 | |
Metropolitan Transportation Authority New York Sub Series 3-3B (Tax Revenue) ± | | | 0.75 | | | | 11-1-2030 | | | | 42,470,000 | | | | 42,423,283 | | | | 0.77 | |
Metropolitan Transportation Authority New York Sub Series D-2A (Transportation Revenue, AGM Insured) ± | | | 0.79 | | | | 11-1-2032 | | | | 36,650,000 | | | | 36,590,627 | | | | 0.66 | |
Nassau County NY TAN Series A (GO Revenue) | | | 2.00 | | | | 9-15-2016 | | | | 30,185,000 | | | | 30,268,311 | | | | 0.55 | |
New York NY (Various Revenue) µ | | | 0.15-0.96 | | | | 8-1-2021 to 6-1-2036 | | | | 39,315,000 | | | | 39,315,659 | | | | 0.71 | |
New York NY Adjusted Fiscal 2008 Sub Series C4 (GO Revenue, AGC Insured) ±(m) | | | 0.55 | | | | 10-1-2027 | | | | 53,500,000 | | | | 53,500,000 | | | | 0.97 | |
New York NY Series A-6 (GO Revenue) ± | | | 0.91 | | | | 8-1-2031 | | | | 39,950,000 | | | | 39,878,490 | | | | 0.72 | |
New York NY Series J Sub Series J-3 (GO Revenue, AGM Insured) ±(m) | | | 0.50 | | | | 6-1-2036 | | | | 25,275,000 | | | | 25,275,000 | | | | 0.46 | |
New York NY Series J-9 (GO Revenue) ± | | | 0.79 | | | | 8-1-2027 | | | | 38,000,000 | | | | 37,968,840 | | | | 0.69 | |
The accompanying notes are an integral part of these financial statements.
| | | | | | |
| Summary portfolio of investments—June 30, 2016 | | Wells Fargo Ultra Short-Term Municipal Income Fund | | | 13 | |
| | | | | | | | | | | | | | | | | | | | |
| Security name | | Interest rate | | | Maturity date | | | Principal | | | Value | | | Percent of
net assets | |
| | | | | |
| New York (continued) | | | | | | | | | | | | | | | | | | | | |
New York NY Transitional Finance Authority NYC Recovery Series 3 (Tax Revenue, Dexia Credit Local SPA) ø | | | 0.64 | % | | | 11-1-2022 | | | $ | 23,375,000 | | | $ | 23,375,000 | | | | 0.42 | % |
New York Urban Development Corporation Certificate of Participation James A Farley Post Office Project (Miscellaneous
Revenue) 144A | | | 4.20 | | | | 2-1-2017 | | | | 37,360,000 | | | | 37,374,944 | | | | 0.68 | |
Suffolk County NY (GO Revenue) | | | 1.50-2.00 | | | | 9-30-2016 to 10-15-2019 | | | | 6,000,000 | | | | 6,042,122 | | | | 0.11 | |
Suffolk County NY TAN (GO Revenue) | | | 2.00 | | | | 7-27-2016 | | | | 29,800,000 | | | | 29,829,204 | | | | 0.54 | |
Suffolk County NY TAN Series I (GO Revenue) | | | 2.00 | | | | 9-30-2016 | | | | 23,000,000 | | | | 23,071,760 | | | | 0.42 | |
Other securities | | | | | | | | | | | | | | | 281,817,659 | | | | 5.09 | |
| | | | | |
| | | | | | | | | | | | | | | 734,562,423 | | | | 13.29 | |
| | | | | | | | | | | | | | | | | | | | |
| | | | | |
| North Carolina: 0.77% | | | | | | | | | | | | | | | | | | | | |
Other securities | | | | | | | | | | | | | | | 42,299,473 | | | | 0.77 | |
| | | | | | | | | | | | | | | | | | | | |
| | | | | |
| North Dakota: 0.30% | | | | | | | | | | | | | | | | | | | | |
Other securities | | | | | | | | | | | | | | | 16,653,145 | | | | 0.30 | |
| | | | | | | | | | | | | | | | | | | | |
| | | | | |
| Ohio: 3.41% | | | | | | | | | | | | | | | | | | | | |
Franklin County OH Hospital Facilities Series B (Health Revenue, Barclays Bank plc SPA) ø | | | 0.42 | | | | 11-15-2041 | | | | 30,000,000 | | | | 30,000,000 | | | | 0.54 | |
Other securities | | | | | | | | | | | | | | | 158,500,139 | | | | 2.87 | |
| | | | | |
| | | | | | | | | | | | | | | 188,500,139 | | | | 3.41 | |
| | | | | | | | | | | | | | | | | | | | |
| | | | | |
| Oklahoma: 0.37% | | | | | | | | | | | | | | | | | | | | |
Other securities | | | | | | | | | | | | | | | 20,551,022 | | | | 0.37 | |
| | | | | | | | | | | | | | | | | | | | |
| | | | | |
| Oregon: 0.63% | | | | | | | | | | | | | | | | | | | | |
Other securities | | | | | | | | | | | | | | | 35,048,419 | | | | 0.63 | |
| | | | | | | | | | | | | | | | | | | | |
| | | | | |
| Pennsylvania: 3.69% | | | | | | | | | | | | | | | | | | | | |
Pennsylvania EDFA Solid Waste Disposal Waste Management Incorporated Project (Resource Recovery Revenue) ± | | | 0.85 | | | | 8-1-2045 | | | | 36,300,000 | | | | 36,296,370 | | | | 0.66 | |
Other securities | | | | | | | | | | | | | | | 167,474,499 | | | | 3.03 | |
| | | | | |
| | | | | | | | | | | | | | | 203,770,869 | | | | 3.69 | |
| | | | | | | | | | | | | | | | | | | | |
| | | | | |
| Puerto Rico: 0.27% | | | | | | | | | | | | | | | | | | | | |
Other securities | | | | | | | | | | | | | | | 15,160,021 | | | | 0.27 | |
| | | | | | | | | | | | | | | | | | | | |
| | | | | |
| Rhode Island: 0.50% | | | | | | | | | | | | | | | | | | | | |
Other securities | | | | | | | | | | | | | | | 27,387,601 | | | | 0.50 | |
| | | | | | | | | | | | | | | | | | | | |
| | | | | |
| South Carolina: 0.35% | | | | | | | | | | | | | | | | | | | | |
Other securities | | | | | | | | | | | | | | | 19,463,282 | | | | 0.35 | |
| | | | | | | | | | | | | | | | | | | | |
| | | | | |
| Tennessee: 1.05% | | | | | | | | | | | | | | | | | | | | |
Other securities | | | | | | | | | | | | | | | 58,120,244 | | | | 1.05 | |
| | | | | | | | | | | | | | | | | | | | |
The accompanying notes are an integral part of these financial statements.
| | | | |
| 14 | | Wells Fargo Ultra Short-Term Municipal Income Fund | | Summary portfolio of investments—June 30, 2016 |
| | | | | | | | | | | | | | | | | | | | |
| Security name | | Interest rate | | | Maturity date | | | Principal | | | Value | | | Percent of
net assets | |
| | | | | |
| Texas: 9.48% | | | | | | | | | | | | | | | | | | | | |
Lamar TX Consolidated Independent School District Schoolhouse Series A (GO Revenue) ± | | | 2.00 | % | | | 8-15-2047 | | | $ | 38,220,000 | | | $ | 38,289,943 | | | | 0.69 | % |
North East TX Independent School District Series A (GO Revenue) ± | | | 2.00 | | | | 8-1-2042 | | | | 26,355,000 | | | | 26,949,832 | | | | 0.49 | |
Northside TX Independent School District Series A (GO Revenue) ± | | | 2.00 | | | | 6-1-2039 | | | | 27,715,000 | | | | 28,538,690 | | | | 0.52 | |
Round Rock TX Independent School District (GO Revenue) ± | | | 1.50 | | | | 8-1-2040 | | | | 34,300,000 | | | | 34,327,097 | | | | 0.62 | |
San Antonio TX Electric & Gas Refunding System Junior Lien Series A (Utilities Revenue) ± | | | 0.67 | | | | 2-1-2033 | | | | 53,000,000 | | | | 52,977,740 | | | | 0.96 | |
San Antonio TX Junior Lien No Reserve Fund Series F (Water & Sewer Revenue) ± | | | 1.09 | | | | 5-1-2043 | | | | 12,320,000 | | | | 12,321,109 | | | | 0.22 | |
Tarrant County TX Cultural Education Facilities Finance Corporation Series 2973 (Health Revenue, Morgan Stanley Bank LIQ) ø144A | | | 0.65 | | | | 11-15-2029 | | | | 30,400,000 | | | | 30,400,000 | | | | 0.55 | |
Texas Municipal Gas Acquisition & Supply Corporation (Utilities Revenue) µ | | | 0.98-5.00 | | | | 12-15-2016 to 12-15-2017 | | | | 21,955,000 | | | | 21,997,996 | | | | 0.40 | |
Texas Municipal Gas Acquisition & Supply Corporation II Series B (Utilities Revenue, JPMorgan Chase & Company Guaranteed) ± | | | 0.88 | | | | 9-15-2017 | | | | 43,265,000 | | | | 43,107,948 | | | | 0.78 | |
Texas Transportation Commission State Highway Fund Floating 1st Tier Series B (Tax Revenue) ± | | | 0.74 | | | | 4-1-2032 | | | | 24,000,000 | | | | 23,980,320 | | | | 0.43 | |
Other securities | | | | | | | | | | | | | | | 211,515,392 | | | | 3.82 | |
| | | | | |
| | | | | | | | | | | | | | | 524,406,067 | | | | 9.48 | |
| | | | | | | | | | | | | | | | | | | | |
| | | | | |
| Vermont: 0.03% | | | | | | | | | | | | | | | | | | | | |
Other securities | | | | | | | | | | | | | | | 1,586,005 | | | | 0.03 | |
| | | | | | | | | | | | | | | | | | | | |
| | | | | |
| Virgin Islands: 0.16% | | | | | | | | | | | | | | | | | | | | |
Other securities | | | | | | | | | | | | | | | 8,976,240 | | | | 0.16 | |
| | | | | | | | | | | | | | | | | | | | |
| | | | | |
| Virginia: 0.91% | | | | | | | | | | | | | | | | | | | | |
Chesapeake VA EDA Electric and Power Company Series 2008A (Utilities Revenue) ± | | | 1.75 | | | | 2-1-2032 | | | | 30,000,000 | | | | 30,582,900 | | | | 0.55 | |
Other securities | | | | | | | | | | | | | | | 19,472,668 | | | | 0.36 | |
| | | | | |
| | | | | | | | | | | | | | | 50,055,568 | | | | 0.91 | |
| | | | | | | | | | | | | | | | | | | | |
| | | | | |
| Washington: 0.27% | | | | | | | | | | | | | | | | | | | | |
Other securities | | | | | | | | | | | | | | | 14,733,084 | | | | 0.27 | |
| | | | | | | | | | | | | | | | | | | | |
| | | | | |
| West Virginia: 0.75% | | | | | | | | | | | | | | | | | | | | |
West Virginia EDA Appalachian Power Company Mountaineer Project Series A (Utilities Revenue) ø | | | 0.72 | | | | 2-1-2036 | | | | 25,000,000 | | | | 25,000,000 | | | | 0.45 | |
Other securities | | | | | | | | | | | | | | | 16,556,128 | | | | 0.30 | |
| | | | | |
| | | | | | | | | | | | | | | 41,556,128 | | | | 0.75 | |
| | | | | | | | | | | | | | | | | | | | |
The accompanying notes are an integral part of these financial statements.
| | | | | | |
| Summary portfolio of investments—June 30, 2016 | | Wells Fargo Ultra Short-Term Municipal Income Fund | | | 15 | |
| | | | | | | | | | | | | | | | | | | | |
| Security name | | Interest rate | | | Maturity date | | | Principal | | | Value | | | Percent of
net assets | |
| | | | | |
| Wisconsin: 1.97% | | | | | | | | | | | | | | | | | | | | |
Residual Interest Bonds Floaters Series 2WE-144A (Miscellaneous Revenue, Barclays Bank plc LOC) ø144A | | | 0.58 | % | | | 5-1-2018 | | | $ | 25,000,000 | | | $ | 25,000,000 | | | | 0.45 | % |
Other securities | | | | | | | | | | | | | | | 83,635,366 | | | | 1.52 | |
| | | | | |
| | | | | | | | | | | | | | | 108,635,366 | | | | 1.97 | |
| | | | | | | | | | | | | | | | | | | | |
| | | | | |
Total Municipal Obligations (Cost $5,282,990,525) | | | | | | | | | | | | | | | 5,287,837,844 | | | | 95.63 | |
| | | | | | | | | | | | | | | | | | | | |
| | | | | |
Other: 2.55% | | | | | | | | | | | | | | | | | | | | |
Nuveen Enhanced Municipal Credit Opportunities Fund Institutional MuniFund Term Preferred Shares ±144A | | | 1.16 | | | | 10-1-2017 | | | | 59,000,000 | | | | 59,152,220 | | | | 1.07 | |
Nuveen Texas Quality Income Municipal Fund Institutional MuniFund Term Preferred Shares ±144A | | | 1.01 | | | | 11-1-2018 | | | | 25,000,000 | | | | 25,137,500 | | | | 0.45 | |
Other securities | | | | | | | | | | | | | | | 56,581,529 | | | | 1.03 | |
| | | | | |
Total Other (Cost $140,375,721) | | | | | | | | | | | | | | | 140,871,249 | | | | 2.55 | |
| | | | | | | | | | | | | | | | | | | | |
| | | | | |
| | | Yield | | | | | | Shares | | | | | | | |
| Short-Term Investments: 1.23% | | | | | | | | | | | | | | | | | | | | |
| | | | | |
| Investment Companies: 1.22% | | | | | | | | | | | | | | | | | | | | |
Wells Fargo Municipal Cash Management Fund Institutional Class (l)(u)## | | | 0.30 | | | | | | | | 67,619,138 | | | | 67,619,138 | | | | 1.22 | |
| | | | | | | | | | | | | | | | | | | | |
| | | | | |
| �� | | | | | | | | Principal | | | | | | | |
| | | | | |
| U.S. Treasury Securities: 0.01% | | | | | | | | | | | | | | | | | | | | |
U.S. Treasury Bill (z)# | | | 0.26 | | | | 9-15-2016 | | | $ | 250,000 | | | | 249,886 | | | | 0.01 | |
| | | | | | | | | | | | | | | | | | | | |
| | | | | |
Total Short-Term Investments (Cost $67,868,998) | | | | | | | | | | | | | | | 67,869,024 | | | | 1.23 | |
| | | | | | | | | | | | | | | | | | | | |
| | | | | |
Total investments in securities
(Cost $5,503,980,240) * | | | | | | | | | | | | | | | 5,508,908,867 | | | | 99.63 | |
Other assets and liabilities, net | | | | | | | | | | | | | | | 20,517,448 | | | | 0.37 | |
| | | | | | | | | | | | | | | | | | | | |
| Total net assets | | | | | | | | | | | | | | $ | 5,529,426,315 | | | | 100.00 | % |
| | | | | | | | | | | | | | | | | | | | |
| ± | Variable rate investment. The rate shown is the rate in effect at period end. |
| ø | Variable rate demand notes are subject to a demand feature which reduces the effective maturity. The maturity date shown represents the final maturity date of the security. The interest rate is determined and reset by the issuer daily, weekly, or monthly depending upon the terms of the security. The rate shown is the rate in effect at period end. |
| 144A | The security may be resold in transactions exempt from registration, normally to qualified institutional buyers, pursuant to Rule 144A under the Securities Act of 1933. |
| (m) | The security is an auction-rate security which has an interest rate that resets at predetermined short-term intervals through a Dutch auction. The rate shown is the rate in effect at period end. |
| µ | All or some of these obligations have credit enhancements or liquidity features that may, under certain circumstances, provide for repayment of principal and interest. |
| (l) | The issuer of the security is an affiliated person of the Fund as defined in the Investment Company Act of 1940. |
| (u) | The rate represents the 7-day annualized yield at period end. |
| ## | All or a portion of this security has been segregated for when-issued securities. |
| (z) | Zero coupon security. The rate represents the current yield to maturity. |
| # | All or a portion of this security is segregated as collateral for investments in derivative instruments. |
| * | Cost for federal income tax purposes is $5,503,970,148 and unrealized gains (losses) consists of: |
| | | | |
Gross unrealized gains | | $ | 12,366,688 | |
Gross unrealized losses | | | (7,427,969 | ) |
| | | | |
Net unrealized gains | | $ | 4,938,719 | |
The accompanying notes are an integral part of these financial statements.
| | | | |
| 16 | | Wells Fargo Ultra Short-Term Municipal Income Fund | | Statement of assets and liabilities—June 30, 2016 |
| | | | |
| | | | |
| |
Assets | | | | |
Investments | | | | |
In unaffiliated securities, at value (cost $5,436,361,102) | | $ | 5,441,289,729 | |
In affiliated securities, at value (cost $67,619,138) | | | 67,619,138 | |
| | | | |
Total investments, at value (cost $5,503,980,240) | | | 5,508,908,867 | |
Receivable for investments sold | | | 77,237,563 | |
Receivable for Fund shares sold | | | 20,447,646 | |
Receivable for interest | | | 26,920,630 | |
Prepaid expenses and other assets | | | 225,913 | |
| | | | |
Total assets | | | 5,633,740,619 | |
| | | | |
| |
Liabilities | | | | |
Dividends payable | | | 991,222 | |
Payable for investments purchased | | | 83,921,488 | |
Payable for Fund shares redeemed | | | 16,452,565 | |
Payable for daily variation margin on open futures contracts | | | 19,531 | |
Due to custodian bank | | | 767,512 | |
Management fee payable | | | 1,224,049 | |
Distribution fee payable | | | 19,746 | |
Administration fees payable | | | 448,301 | |
Accrued expenses and other liabilities | | | 469,890 | |
| | | | |
Total liabilities | | | 104,314,304 | |
| | | | |
Total net assets | | $ | 5,529,426,315 | |
| | | | |
| |
NET ASSETS CONSIST OF | | | | |
Paid-in capital | | $ | 5,524,509,370 | |
Overdistributed net investment income | | | (486,020 | ) |
Accumulated net realized gains on investments | | | 1,035,360 | |
Net unrealized gains on investments | | | 4,367,605 | |
| | | | |
Total net assets | | $ | 5,529,426,315 | |
| | | | |
| |
COMPUTATION OF NET ASSET VALUE AND OFFERING PRICE PER SHARE | | | | |
Net assets – Class A | | $ | 1,209,818,227 | |
Shares outstanding – Class A1 | | | 125,677,876 | |
Net asset value per share – Class A | | | $9.63 | |
Maximum offering price per share – Class A2 | | | $9.83 | |
Net assets – Class C | | $ | 31,836,669 | |
Shares outstanding – Class C1 | | | 3,361,598 | |
Net asset value per share – Class C | | | $9.47 | |
Net assets – Administrator Class | | $ | 226,124,576 | |
Shares outstanding – Administrator Class1 | | | 23,490,536 | |
Net asset value per share – Administrator Class | | | $9.63 | |
Net assets – Institutional Class | | $ | 4,061,646,843 | |
Shares outstanding – Institutional Class1 | | | 421,916,501 | |
Net asset value per share – Institutional Class | | | $9.63 | |
| 1 | The Fund has an unlimited number of authorized shares. |
| 2 | Maximum offering price is computed as 100/98 of net asset value. On investments of $50,000 or more, the offering price is reduced. |
The accompanying notes are an integral part of these financial statements.
| | | | | | |
| Statement of operations—year ended June 30, 2016 | | Wells Fargo Ultra Short-Term Municipal Income Fund | | | 17 | |
| | | | |
| | | | |
| |
Investment income | | | | |
Interest | | $ | 57,980,224 | |
Income from affiliated securities | | | 57,829 | |
| | | | |
Total investment income | | | 58,038,053 | |
| | | | |
| |
Expenses | | | | |
Management fee | | | 18,008,702 | |
Administration fees | |
Class A | | | 1,834,117 | |
Class C | | | 59,076 | |
Administrator Class | | | 267,244 | |
Institutional Class | | | 3,160,521 | |
Investor Class | | | 226,291 | 1 |
Shareholder servicing fees | |
Class A | | | 2,865,808 | |
Class C | | | 92,306 | |
Administrator Class | | | 638,312 | |
Investor Class | | | 293,124 | 1 |
Distribution fee | |
Class C | | | 276,919 | |
Custody and accounting fees | | | 287,888 | |
Professional fees | | | 46,164 | |
Registration fees | | | 224,215 | |
Shareholder report expenses | | | 12,682 | |
Trustees’ fees and expenses | | | 22,890 | |
Other fees and expenses | | | 39,158 | |
| | | | |
Total expenses | | | 28,355,417 | |
Less: Fee waivers and/or expense reimbursements | | | (3,099,113 | ) |
| | | | |
Net expenses | | | 25,256,304 | |
| | | | |
Net investment income | | | 32,781,749 | |
| | | | |
| |
REALIZED AND UNREALIZED GAINS (LOSSES) ON INVESTMENTS | | | | |
|
Net realized gains on: | |
Unaffiliated securities | | | 401,394 | |
Futures transactions | | | 444,593 | |
| | | | |
Net realized gains on investments | | | 845,987 | |
| | | | |
|
Net change in unrealized gains (losses) on: | |
Unaffiliated securities | | | 9,994,664 | |
Futures transactions | | | (372,192 | ) |
| | | | |
Net change in unrealized gains (losses) on investments | | | 9,622,472 | |
| | | | |
Net realized and unrealized gains (losses) on investments | | | 10,468,459 | |
| | | | |
Net increase in net assets resulting from operations | | $ | 43,250,208 | |
| | | | |
| 1 | For the period from July 1, 2015 to October 23, 2015. Effective at the close of business on October 23, 2015, Investor Class shares were converted to Class A shares and are no longer offered by the Fund. |
The accompanying notes are an integral part of these financial statements.
| | | | |
| 18 | | Wells Fargo Ultra Short-Term Municipal Income Fund | | Statement of changes in net assets |
| | | | | | | | | | | | | | | | |
| | | Year ended
June 30, 2016 | | | Year ended
June 30, 2015 | |
| | | | |
Operations | | | | | | | | | | | | | | | | |
Net investment income | | | | | | $ | 32,781,749 | | | | | | | $ | 25,855,118 | |
Net realized gains on investments | | | | | | | 845,987 | | | | | | | | 1,085,510 | |
Net change in unrealized gains (losses) on investments | | | | | | | 9,622,472 | | | | | | | | (21,719,373 | ) |
| | | | |
Net increase in net assets resulting from operations | | | | | | | 43,250,208 | | | | | | | | 5,221,255 | |
| | | | |
| | | | |
Distributions to shareholders from | | | | | | | | | | | | | | | | |
Net investment income | | | | | | | | | | | | | | | | |
Class A | | | | | | | (4,371,917 | ) | | | | | | | (2,749,665 | ) |
Administrator Class | | | | | | | (1,193,229 | ) | | | | | | | (1,130,512 | ) |
Institutional Class | | | | | | | (26,850,434 | ) | | | | | | | (21,082,314 | ) |
Investor Class | | | | | | | (365,755 | )1 | | | | | | | (901,173 | ) |
Net realized gains | | | | | | | | | | | | | | | | |
Class A | | | | | | | (208,960 | ) | | | | | | | (244,521 | ) |
Class C | | | | | | | (6,313 | ) | | | | | | | (11,088 | ) |
Administrator Class | | | | | | | (41,422 | ) | | | | | | | (85,022 | ) |
Institutional Class | | | | | | | (645,494 | ) | | | | | | | (858,240 | ) |
Investor Class | | | | | | | 0 | 1 | | | | | | | (98,683 | ) |
| | | | |
Total distributions to shareholders | | | | | | | (33,683,524 | ) | | | | | | | (27,161,218 | ) |
| | | | |
| | | | |
Capital share transactions | | | Shares | | | | | | | | Shares | | | | | |
Proceeds from shares sold | | | | | | | | | | | | | | | | |
Class A | | | 76,129,489 | | | | 732,473,920 | | | | 111,855,247 | | | | 542,684,333 | |
Class C | | | 206,402 | | | | 1,957,767 | | | | 180,062 | | | | 862,969 | |
Administrator Class | | | 23,903,367 | | | | 229,922,937 | | | | 22,590,699 | | | | 110,907,773 | |
Institutional Class | | | 381,558,709 | | | | 3,670,300,026 | | | | 914,711,014 | | | | 4,491,582,630 | |
Investor Class | | | 1,404,939 | 1 | | | 13,526,753 | 1 | | | 10,840,147 | | | | 53,947,649 | |
| | | | |
| | | | | | | 4,648,181,403 | | | | | | | | 5,199,985,354 | |
| | | | |
Reinvestment of distributions | | | | | | | | | | | | | | | | |
Class A | | | 459,511 | | | | 4,421,270 | | | | 578,030 | | | | 2,925,065 | |
Class C | | | 554 | | | | 5,255 | | | | 1,902 | | | | 9,074 | |
Administrator Class | | | 127,969 | | | | 1,231,259 | | | | 234,725 | | | | 1,187,806 | |
Institutional Class | | | 1,790,146 | | | | 17,224,273 | | | | 2,557,359 | | | | 12,986,750 | |
Investor Class | | | 28,543 | 1 | | | 274,869 | 1 | | | 189,236 | | | | 963,181 | |
| | | | |
| | | | | | | 23,156,926 | | | | | | | | 18,071,876 | |
| | | | |
Payment for shares redeemed | | | | | | | | | | | | | | | | |
Class A | | | (50,965,659 | ) | | | (490,321,000 | ) | | | (340,346,333 | ) | | | (1,162,471,735 | ) |
Class C | | | (1,301,768 | ) | | | (12,342,895 | ) | | | (8,124,877 | ) | | | (17,508,880 | ) |
Administrator Class | | | (34,686,573 | ) | | | (333,645,141 | ) | | | (73,238,026 | ) | | | (190,475,449 | ) |
Institutional Class | | | (370,417,838 | ) | | | (3,562,999,025 | ) | | | (1,213,893,325 | ) | | | (3,962,637,971 | ) |
Investor Class | | | (41,749,601 | )1 | | | (402,219,702 | )1 | | | (76,333,375 | ) | | | (175,481,600 | ) |
| | | | |
| | | | | | | (4,801,527,763 | ) | | | | | | | (5,508,575,635 | ) |
| | | | |
Net decrease in net assets resulting from capital share transactions | | | | | | | (130,189,434 | ) | | | | | | | (290,518,405 | ) |
| | | | |
Total decrease in net assets | | | | | | | (120,622,750 | ) | | | | | | | (312,458,368 | ) |
| | | | |
| | | | |
Net assets | | | | | | | | | | | | | | | | |
Beginning of period | | | | | | | 5,650,049,065 | | | | | | | | 5,962,507,433 | |
| | | | |
End of period | | | | | | $ | 5,529,426,315 | | | | | | | $ | 5,650,049,065 | |
| | | | |
Overdistributed net investment income | | | | | | $ | (486,020 | ) | | | | | | $ | (486,434 | ) |
| | | | |
| 1 | For the period from July 1, 2015 to October 23, 2015. Effective at the close of business on October 23, 2015, Investor Class shares were converted to Class A shares and are no longer offered by the Fund. |
The accompanying notes are an integral part of these financial statements.
| | | | | | |
| Financial highlights | | Wells Fargo Ultra Short-Term Municipal Income Fund | | | 19 | |
(For a share outstanding throughout each period)
| | | | | | | | | | | | | | | | | | | | |
| | | Year ended June 30 | |
| CLASS A | | 2016 | | | 20151 | | | 20141 | | | 20131 | | | 20121 | |
Net asset value, beginning of period | | | $9.61 | | | | $9.64 | | | | $9.64 | | | | $9.64 | | | | $9.64 | |
Net investment income | | | 0.04 | | | | 0.02 | | | | 0.04 | | | | 0.04 | | | | 0.10 | |
Net realized and unrealized gains (losses) on investments | | | 0.02 | | | | (0.03 | ) | | | 0.00 | 2 | | | (0.02 | ) | | | 0.00 | 2 |
| | | | | | | | | | | | | | | | | | | | |
Total from investment operations | | | 0.06 | | | | (0.01 | ) | | | 0.04 | | | | 0.02 | | | | 0.10 | |
Distributions to shareholders from | | | | | | | | | | | | | | | | | | | | |
Net investment income | | | (0.04 | ) | | | (0.02 | ) | | | (0.04 | ) | | | (0.02 | ) | | | (0.10 | ) |
Net realized gains | | | (0.00 | )2 | | | (0.00 | )2 | | | (0.00 | )2 | | | 0.00 | | | | 0.00 | |
| | | | | | | | | | | | | | | | | | | | |
Total distributions to shareholders | | | (0.04 | ) | | | (0.02 | ) | | | (0.04 | ) | | | (0.02 | ) | | | (0.10 | ) |
Net asset value, end of period | | | $9.63 | | | | $9.61 | | | | $9.64 | | | | $9.64 | | | | $9.64 | |
Total return3 | | | 0.61 | % | | | (0.07 | )% | | | 0.35 | % | | | 0.31 | % | | | 0.96 | % |
Ratios to average net assets (annualized) | | | | | | | | | | | | | | | | | | | | |
Gross expenses | | | 0.75 | % | | | 0.75 | % | | | 0.75 | % | | | 0.75 | % | | | 0.76 | % |
Net expenses | | | 0.67 | % | | | 0.67 | % | | | 0.67 | % | | | 0.67 | % | | | 0.67 | % |
Net investment income | | | 0.38 | % | | | 0.23 | % | | | 0.34 | % | | | 0.32 | % | | | 0.95 | % |
Supplemental data | | | | | | | | | | | | | | | | | | | | |
Portfolio turnover rate | | | 41 | %4 | | | 44 | %4 | | | 51 | %4 | | | 65 | %4 | | | 111 | % |
Net assets, end of period (000s omitted) | | | $1,209,818 | | | | $961,485 | | | | $1,582,112 | | | | $1,914,970 | | | | $2,603,618 | |
| 1 | A one-for-two share split took place after the close of business on June 12, 2015 for all classes of the Fund. The per share information has been adjusted to give effect to this transaction. |
| 2 | Amount is less than $0.005. |
| 3 | Total return calculations do not include any sales charges. |
| 4 | Portfolio turnover rate excludes variable rate demand notes which may account for changes from rates reported in prior periods. |
The accompanying notes are an integral part of these financial statements.
| | | | |
| 20 | | Wells Fargo Ultra Short-Term Municipal Income Fund | | Financial highlights |
(For a share outstanding throughout each period)
| | | | | | | | | | | | | | | | | | | | |
| | | Year ended June 30 | |
| CLASS C | | 2016 | | | 20151 | | | 20141 | | | 20131 | | | 20121 | |
Net asset value, beginning of period | | | $9.49 | | | | $9.58 | | | | $9.62 | | | | $9.64 | | | | $9.64 | |
Net investment income (loss) | | | (0.04 | )2 | | | (0.11 | ) | | | (0.04 | )2 | | | (0.06 | ) | | | 0.02 | |
Net realized and unrealized gains (losses) on investments | | | 0.02 | | | | 0.02 | | | | 0.00 | 3 | | | 0.04 | | | | 0.00 | 3 |
| | | | | | | | | | | | | | | | | | | | |
Total from investment operations | | | (0.02 | ) | | | (0.09 | ) | | | (0.04 | ) | | | (0.02 | ) | | | 0.02 | |
Distributions to shareholders from | | | | | | | | | | | | | | | | | | | | |
Net investment income | | | 0.00 | | | | 0.00 | | | | 0.00 | | | | 0.00 | | | | (0.02 | ) |
Net realized gains | | | (0.00 | )3 | | | (0.00 | )3 | | | (0.00 | )3 | | | 0.00 | | | | 0.00 | |
| | | | | | | | | | | | | | | | | | | | |
Total distributions to shareholders | | | (0.00 | )3 | | | (0.00 | )3 | | | (0.00 | )3 | | | 0.00 | | | | (0.02 | ) |
Net asset value, end of period | | | $9.47 | | | | $9.49 | | | | $9.58 | | | | $9.62 | | | | $9.64 | |
Total return4 | | | (0.19 | )% | | | (0.93 | )% | | | (0.40 | )% | | | (0.21 | )% | | | 0.25 | % |
Ratios to average net assets (annualized) | | | | | | | | | | | | | | | | | | | | |
Gross expenses | | | 1.50 | % | | | 1.50 | % | | | 1.50 | % | | | 1.50 | % | | | 1.51 | % |
Net expenses | | | 1.42 | % | | | 1.42 | % | | | 1.42 | % | | | 1.42 | % | | | 1.42 | % |
Net investment income (loss) | | | (0.37 | )% | | | (0.52 | )% | | | (0.41 | )% | | | (0.43 | )% | | | 0.23 | % |
Supplemental data | | | | | | | | | | | | | | | | | | | | |
Portfolio turnover rate | | | 41 | %5 | | | 44 | %5 | | | 51 | %5 | | | 65 | %5 | | | 111 | % |
Net assets, end of period (000s omitted) | | | $31,837 | | | | $42,289 | | | | $59,352 | | | | $89,148 | | | | $148,465 | |
| 1 | A one-for-two share split took place after the close of business on June 12, 2015 for all classes of the Fund. The per share information has been adjusted to give effect to this transaction. |
| 2 | Calculated based upon average shares outstanding |
| 3 | Amount is less than $0.005. |
| 4 | Total return calculations do not include any sales charges. |
| 5 | Portfolio turnover rate excludes variable rate demand notes which may account for changes from rates reported in prior periods. |
The accompanying notes are an integral part of these financial statements.
| | | | | | |
| Financial highlights | | Wells Fargo Ultra Short-Term Municipal Income Fund | | | 21 | |
(For a share outstanding throughout each period)
| | | | | | | | | | | | | | | | | | | | |
| | | Year ended June 30 | |
| ADMINISTRATOR CLASS | | 2016 | | | 20151 | | | 20141 | | | 20131 | | | 20121 | |
Net asset value, beginning of period | | | $9.61 | | | | $9.64 | | | | $9.64 | | | | $9.64 | | | | $9.64 | |
Net investment income | | | 0.04 | | | | 0.03 | | | | 0.04 | | | | 0.04 | | | | 0.10 | |
Net realized and unrealized gains (losses) on investments | | | 0.02 | | | | (0.03 | ) | | | 0.00 | 2 | | | 0.00 | 2 | | | 0.00 | 2 |
| | | | | | | | | | | | | | | | | | | | |
Total from investment operations | | | 0.06 | | | | 0.00 | | | | 0.04 | | | | 0.04 | | | | 0.10 | |
Distributions to shareholders from | | | | | | | | | | | | | | | | | | | | |
Net investment income | | | (0.04 | ) | | | (0.03 | ) | | | (0.04 | ) | | | (0.04 | ) | | | (0.10 | ) |
Net realized gains | | | (0.00 | )2 | | | (0.00 | )2 | | | (0.00 | )2 | | | 0.00 | | | | 0.00 | |
| | | | | | | | | | | | | | | | | | | | |
Total distributions to shareholders | | | (0.04 | ) | | | (0.03 | ) | | | (0.04 | ) | | | (0.04 | ) | | | (0.10 | ) |
Net asset value, end of period | | | $9.63 | | | | $9.61 | | | | $9.64 | | | | $9.64 | | | | $9.64 | |
Total return | | | 0.68 | % | | | 0.00 | % | | | 0.42 | % | | | 0.38 | % | | | 1.03 | % |
Ratios to average net assets (annualized) | | | | | | | | | | | | | | | | | | | | |
Gross expenses | | | 0.68 | % | | | 0.69 | % | | | 0.69 | % | | | 0.69 | % | | | 0.68 | % |
Net expenses | | | 0.60 | % | | | 0.60 | % | | | 0.60 | % | | | 0.60 | % | | | 0.60 | % |
Net investment income | | | 0.45 | % | | | 0.30 | % | | | 0.41 | % | | | 0.39 | % | | | 0.95 | % |
Supplemental data | | | | | | | | | | | | | | | | | | | | |
Portfolio turnover rate | | | 41 | %3 | | | 44 | %3 | | | 51 | %3 | | | 65 | %3 | | | 111 | % |
Net assets, end of period (000s omitted) | | | $226,125 | | | | $328,134 | | | | $407,791 | | | | $482,711 | | | | $597,108 | |
| 1 | A one-for-two share split took place after the close of business on June 12, 2015 for all classes of the Fund. The per share information has been adjusted to give effect to this transaction. |
| 2 | Amount is less than $0.005. |
| 3 | Portfolio turnover rate excludes variable rate demand notes which may account for changes from rates reported in prior periods. |
The accompanying notes are an integral part of these financial statements.
| | | | |
| 22 | | Wells Fargo Ultra Short-Term Municipal Income Fund | | Financial highlights |
(For a share outstanding throughout each period)
| | | | | | | | | | | | | | | | | | | | |
| | | Year ended June 30 | |
| INSTITUTIONAL CLASS | | 2016 | | | 20151 | | | 20141 | | | 20131 | | | 20121 | |
Net asset value, beginning of period | | | $9.61 | | | | $9.64 | | | | $9.64 | | | | $9.64 | | | | $9.64 | |
Net investment income | | | 0.07 | | | | 0.05 | | | | 0.06 | | | | 0.06 | | | | 0.12 | |
Net realized and unrealized gains (losses) on investments | | | 0.02 | | | | (0.03 | ) | | | 0.00 | 2 | | | 0.00 | 2 | | | 0.00 | 2 |
| | | | | | | | | | | | | | | | | | | | |
Total from investment operations | | | 0.09 | | | | 0.02 | | | | 0.06 | | | | 0.06 | | | | 0.12 | |
Distributions to shareholders from | | | | | | | | | | | | | | | | | | | | |
Net investment income | | | (0.07 | ) | | | (0.05 | ) | | | (0.06 | ) | | | (0.06 | ) | | | (0.12 | ) |
Net realized gains | | | (0.00 | )2 | | | (0.00 | )2 | | | (0.00 | )2 | | | 0.00 | | | | 0.00 | |
| | | | | | | | | | | | | | | | | | | | |
Total distributions to shareholders | | | (0.07 | ) | | | (0.05 | ) | | | (0.06 | ) | | | (0.06 | ) | | | (0.12 | ) |
Net asset value, end of period | | | $9.63 | | | | $9.61 | | | | $9.64 | | | | $9.64 | | | | $9.64 | |
Total return | | | 0.91 | % | | | 0.23 | % | | | 0.65 | % | | | 0.61 | % | | | 1.26 | % |
Ratios to average net assets (annualized) | | | | | | | | | | | | | | | | | | | | |
Gross expenses | | | 0.42 | % | | | 0.42 | % | | | 0.42 | % | | | 0.42 | % | | | 0.43 | % |
Net expenses | | | 0.37 | % | | | 0.37 | % | | | 0.37 | % | | | 0.37 | % | | | 0.37 | % |
Net investment income | | | 0.68 | % | | | 0.54 | % | | | 0.64 | % | | | 0.61 | % | | | 1.23 | % |
Supplemental data | | | | | | | | | | | | | | | | | | | | |
Portfolio turnover rate | | | 41 | %3 | | | 44 | %3 | | | 51 | %3 | | | 65 | %3 | | | 111 | % |
Net assets, end of period (000s omitted) | | | $4,061,647 | | | | $3,930,234 | | | | $3,403,244 | | | | $3,085,284 | | | | $3,158,674 | |
| 1 | A one-for-two share split took place after the close of business on June 12, 2015 for all classes of the Fund. The per share information has been adjusted to give effect to this transaction. |
| 2 | Amount is less than $0.005. |
| 3 | Portfolio turnover rate excludes variable rate demand notes which may account for changes from rates reported in prior periods. |
The accompanying notes are an integral part of these financial statements.
| | | | | | |
| Notes to financial statements | | Wells Fargo Ultra Short-Term Municipal Income Fund | | | 23 | |
1. ORGANIZATION
Wells Fargo Funds Trust (the “Trust”), a Delaware statutory trust organized on March 10, 1999, is an open-end management investment company registered under the Investment Company Act of 1940, as amended (the “1940 Act”). As an investment company, the Trust follows the accounting and reporting guidance in Financial Accounting Standards Board (“FASB”) Accounting Standards Codification Topic 946, Financial Services – Investment Companies. These financial statements report on the Wells Fargo Ultra Short-Term Municipal Income Fund (the “Fund”) which is a diversified series of the Trust.
Effective at the close of business on October 23, 2015, Investor Class shares became Class A shares in a tax-free conversion. Shareholders of Investor Class received Class A shares at a value equal to the value of their Investor Class shares immediately prior to the conversion. Investor Class shares are no longer offered by the Fund.
2. SIGNIFICANT ACCOUNTING POLICIES
The following significant accounting policies, which are consistently followed in the preparation of the financial statements of the Fund, are in conformity with U.S. generally accepted accounting principles which require management to make estimates and assumptions that affect the reported amounts of assets and liabilities, disclosure of contingent assets and liabilities at the date of the financial statements, and the reported amounts of revenues and expenses during the reporting period. Actual results could differ from those estimates.
Securities valuation
All investments are valued each business day as of the close of regular trading on the New York Stock Exchange (generally 4 p.m. Eastern Time), although the Fund may deviate from this calculation time under unusual or unexpected circumstances.
Debt securities are valued at the evaluated bid price provided by an independent pricing service or, if a reliable price is not available, the quoted bid price from an independent broker-dealer.
Investments in registered open-end investment companies are valued at net asset value.
Investments which are not valued using any of the methods discussed above are valued at their fair value, as determined in good faith by the Board of Trustees of the Fund. The Board of Trustees has established a Valuation Committee comprised of the Trustees and has delegated to it the authority to take any actions regarding the valuation of portfolio securities that the Valuation Committee deems necessary or appropriate, including determining the fair value of portfolio securities, unless the determination has been delegated to the Management Valuation Team of Wells Fargo Funds Management, LLC (“Funds Management”). The Board of Trustees retains the authority to make or ratify any valuation decisions or approve any changes to the Valuation Procedures as it deems appropriate. On a quarterly basis, the Board of Trustees receives reports on any valuation actions taken by the Valuation Committee or the Management Valuation Team which may include items for ratification.
Valuations of fair valued securities are compared to the next actual sales price when available, or other appropriate market values, to assess the continued appropriateness of the fair valuation methodologies used. These securities are fair valued on a day-to-day basis, taking into consideration changes to appropriate market information and any significant changes to the inputs considered in the valuation process until there is a readily available price provided on an exchange or by an independent pricing service. Valuations received from an independent pricing service or independent broker-dealer quotes are periodically validated by comparisons to most recent trades and valuations provided by other independent pricing services in addition to the review of prices by the manager and/or subadviser. Unobservable inputs used in determining fair valuations are identified based on the type of security, taking into consideration factors utilized by market participants in valuing the investment, knowledge about the issuer and the current market environment.
When-issued transactions
The Fund may purchase securities on a forward commitment or when-issued basis. The Fund records a when-issued transaction on the trade date and will segregate assets in an amount at least equal in value to the Fund’s commitment to purchase when-issued securities. Securities purchased on a when-issued basis are marked-to-market daily and the Fund begins earning interest on the settlement date. Losses may arise due to changes in the market value of the underlying securities or if the counterparty does not perform under the contract.
Futures contracts
The Fund is subject to interest rate risk in the normal course of pursuing its investment objectives. The Fund may buy and sell futures contracts in order to gain exposure to, or protect against, changes in security values and interest rates. The
| | | | |
| 24 | | Wells Fargo Ultra Short-Term Municipal Income Fund | | Notes to financial statements |
primary risks associated with the use of futures contracts are the imperfect correlation between changes in market values of securities held by the Fund and the prices of futures contracts, and the possibility of an illiquid market.
The aggregate principal amounts of the contracts are not recorded in the financial statements. Fluctuations in the value of the contracts are recorded in the Statement of Assets and Liabilities as an asset or liability and in the Statement of Operations as unrealized gains or losses until the contracts are closed, at which point they are recorded as net realized gains or losses on futures contracts. With futures contracts, there is minimal counterparty risk to the Fund since futures are exchange traded and the exchange’s clearinghouse, as counterparty to all exchange traded futures, guarantees the futures against default.
Security transactions and income recognition
Securities transactions are recorded on a trade date basis. Realized gains or losses are recorded on the basis of identified cost.
Interest income is accrued daily and bond discounts are accreted and premiums are amortized daily based on the effective interest method. To the extent debt obligations are placed on non-accrual status, any related interest income may be reduced by writing off interest receivables when the collection of all or a portion of interest has become doubtful based on consistently applied procedures. If the issuer subsequently resumes interest payments or when the collectability of interest is reasonably assured, the debt obligation is removed from non-accrual status.
Distributions to shareholders
Distributions to shareholders from net investment income are accrued daily and paid monthly. Distributions from net realized gains, if any, are recorded on the ex-dividend date. Such distributions are determined in conformity with federal income tax regulations, which may differ in amount or character from net investment income and realized gains recognized for purposes of U.S. generally accepted accounting principles.
Federal and other taxes
The Fund intends to continue to qualify as a regulated investment company by distributing substantially all of its investment company taxable and tax-exempt income and any net realized capital gains (after reduction for capital loss carryforwards) sufficient to relieve it from all, or substantially all, federal income taxes. Accordingly, no provision for federal income taxes was required.
The Fund’s income and federal excise tax returns and all financial records supporting those returns for the prior three fiscal years are subject to examination by the federal and Delaware revenue authorities. Management has analyzed the Fund’s tax positions taken on federal, state, and foreign tax returns for all open tax years and does not believe that there are any uncertain tax positions that require recognition of a tax liability.
Class allocations
The separate classes of shares offered by the Fund differ principally in applicable sales charges, distribution, shareholder servicing, and administration fees. Class specific expenses are charged directly to that share class. Investment income, common expenses, and realized and unrealized gains (losses) on investments are allocated daily to each class of shares based on the relative proportion of net assets of each class.
3. FAIR VALUATION MEASUREMENTS
Fair value measurements of investments are determined within a framework that has established a fair value hierarchy based upon the various data inputs utilized in determining the value of the Fund’s investments. The three-level hierarchy gives the highest priority to unadjusted quoted prices in active markets for identical assets or liabilities (Level 1) and the lowest priority to significant unobservable inputs (Level 3). The Fund’s investments are classified within the fair value hierarchy based on the lowest level of input that is significant to the fair value measurement. The inputs are summarized into three broad levels as follows:
| n | | Level 1 – quoted prices in active markets for identical securities |
| n | | Level 2 – other significant observable inputs (including quoted prices for similar securities, interest rates, prepayment speeds, credit risk, use of amortized cost, etc.) |
| n | | Level 3 – significant unobservable inputs (including the Fund’s own assumptions in determining the fair value of investments) |
The inputs or methodologies used for valuing investments in securities are not necessarily an indication of the risk associated with investing in those securities.
| | | | | | |
| Notes to financial statements | | Wells Fargo Ultra Short-Term Municipal Income Fund | | | 25 | |
The following is a summary of the inputs used in valuing the Fund’s assets and liabilities as of June 30, 2016:
| | | | | | | | | | | | | | | | |
| | | Quoted prices
(Level 1) | | | Other significant
observable inputs
(Level 2) | | | Significant
unobservable inputs (Level 3) | | | Total | |
Assets | | | | | | | | | | | | | | | | |
Investments in: | | | | | | | | | | | | | | | | |
| | | | |
Agency securities | | $ | 0 | | | $ | 0 | | | $ | 12,330,750 | | | $ | 12,330,750 | |
| | | | |
Municipal obligations | | | 0 | | | | 5,287,837,844 | | | | 0 | | | | 5,287,837,844 | |
| | | | |
Other | | | 0 | | | | 140,871,249 | | | | 0 | | | | 140,871,249 | |
| | | | |
Short-term investments | | | | | | | | | | | | | | | | |
Investment companies | | | 67,619,138 | | | | 0 | | | | 0 | | | | 67,619,138 | |
U.S. Treasury securities | | | 249,886 | | | | 0 | | | | 0 | | | | 249,886 | |
Total assets | | $ | 67,869,024 | | | $ | 5,428,709,093 | | | $ | 12,330,750 | | | $ | 5,508,908,867 | |
Liabilities | | | | | | | | | | | | | | | | |
Futures contracts | | $ | 19,531 | | | $ | 0 | | | $ | 0 | | | $ | 19,531 | |
Total liabilities | | $ | 19,531 | | | $ | 0 | | | $ | 0 | | | $ | 19,531 | |
Futures contracts are reported at their variation margin at measurement date, which represents the amount due from the Fund at that date. All other assets and liabilities are reported at their market value at measurement date.
The Fund recognizes transfers between levels within the fair value hierarchy at the end of the reporting period. At June 30, 2016, the Fund did not have any transfers into/out of Level 1. The Fund had no material transfers between Level 2 and Level 3.
4. TRANSACTIONS WITH AFFILIATES
Management fee
Funds Management, an indirect wholly owned subsidiary of Wells Fargo & Company (“Wells Fargo”), is the manager of the Fund and provides advisory and fund-level administrative services under an investment management agreement. Under the investment management agreement, Funds Management is responsible for, among other services, implementing the investment objectives and strategies of the Fund, supervising the subadviser, providing fund-level administrative services in connection with the Fund’s operations, and providing any other fund-level administrative services reasonably necessary for the operation of the Fund. As compensation for its services under the investment management agreement, Funds Management is entitled to receive an annual management fee starting at 0.35% and declining to 0.255% as the average daily net assets of the Fund increase. For the year ended June 30, 2016, the management fee was equivalent to an annual rate of 0.33% of the Fund’s average daily net assets.
Funds Management has retained the services of a subadviser to provide daily portfolio management to the Fund. The fee for subadvisory services is borne by Funds Management. Wells Capital Management Incorporated, an affiliate of Funds Management and an indirect wholly owned subsidiary of Wells Fargo, is the subadviser to the Fund and is entitled to receive a fee from Funds Management at an annual rate starting at 0.15% and declining to 0.05% as the average daily net assets of the Fund increase.
Administration fees
Under a class-level administration agreement, Funds Management provides class-level administrative services to the Fund, which includes paying fees and expenses for services provided by the transfer agent, sub-transfer agents, omnibus account servicers and record-keepers. As compensation for its services under the class-level administration agreement, Funds Management receives an annual fee which is calculated based on the average daily net assets of each class as follows:
| | | | |
| | | Class level
administration fee | |
Class A, Class C | | | 0.16 | % |
Administrator Class | | | 0.10 | |
Institutional Class | | | 0.08 | |
Investor Class | | | 0.19 | |
| | | | |
| 26 | | Wells Fargo Ultra Short-Term Municipal Income Fund | | Notes to financial statements |
Funds Management has contractually waived and/or reimbursed management and administration fees to the extent necessary to maintain certain net operating expense ratios for the Fund. Waiver of fees and/or reimbursement of expenses by Funds Management were made first from fund level expenses on a proportionate basis and then from class specific expenses. Funds Management has committed through October 31, 2016 to waive fees and/or reimburse expenses to the extent necessary to cap the Fund’s expenses at 0.67% for Class A shares, 1.42% for Class C shares, 0.60% for Administrator Class shares, and 0.37% for Institutional Class shares. After this time, the cap may be increased or the commitment to maintain the cap may be terminated only with the approval of the Board of Trustees.
Distribution fee
The Trust has adopted a distribution plan for Class C shares of the Fund pursuant to Rule 12b-1 under the 1940 Act. A distribution fee is charged to Class C shares and paid to Wells Fargo Funds Distributor, LLC (“Funds Distributor”), the principal underwriter, at an annual rate of 0.75% of the average daily net assets of Class C shares.
In addition, Funds Distributor is entitled to receive the front-end sales charge from the purchase of Class A shares and a contingent deferred sales charge on the redemption of certain Class A shares. Funds Distributor is also entitled to receive the contingent deferred sales charges from redemptions of Class C shares. For the year ended June 30, 2016, Funds Distributor received $6,876 from the sale of Class A shares.
Shareholder servicing fees
The Trust has entered into contracts with one or more shareholder servicing agents, whereby Class A, Class C, Administrator Class, and Investor Class of the Fund are charged a fee at an annual rate of 0.25% of the average daily net assets of each respective class.
A portion of these total shareholder servicing fees were paid to affiliates of Wells Fargo.
5. INVESTMENT PORTFOLIO TRANSACTIONS
Purchases and sales of investments, excluding U.S. government obligations (if any) and short-term securities, for the year ended June 30, 2016 were $2,505,639,495 and $1,882,690,313, respectively.
The Fund may purchase or sell investment securities to other Wells Fargo funds under procedures adopted by the Board of Trustees. The procedures have been designed to ensure that these interfund transactions, which generally do not incur broker commissions, are effected at current market prices. Interfund trades are included within the respective purchases and sales amounts shown.
6. DERIVATIVE TRANSACTIONS
During the year ended June 30, 2016, the Fund entered into futures contracts for to take advantage of the differences between municipal and treasury yields and to help manage the duration of the portfolio.
At June 30, 2016, the Fund had short futures contracts outstanding as follows:
| | | | | | | | | | | | | | | | |
| Expiration date | | Counterparty | | Contracts | | Type | | | Contract value at June 30, 2016 | | | Unrealized
losses | |
| 9-30-2016 | | JPMorgan | | 250 Short | | | 5-Year U.S. Treasury Note | | | $ | 30,541,016 | | | $ | (561,022 | ) |
The Fund had an average notional amount of $54,949,534 in short futures contracts during the year ended June 30, 2016.
On June 30, 2016, the cumulative unrealized losses on futures contracts in the amount of $561,022 are reflected in net unrealized gains on investments on the Statement of Assets and Liabilities. The payable for daily variation margin on open futures contracts reflected in the Statement of Assets and Liabilities only represents the current day’s variation margin. The realized gains and change in unrealized gains (losses) on futures contracts are reflected in the Statement of Operations.
For certain types of derivative transactions, the Fund has entered into International Swaps and Derivatives Association, Inc. master agreements (“ISDA Master Agreements”) or similar agreements with approved counterparties. The ISDA Master Agreements or similar agreements may have requirements to deliver/deposit securities or cash to/with an exchange or broker-dealer as collateral and allows the Fund to offset, with each counterparty, certain derivative financial instrument’s assets and/or liabilities with collateral held or pledged. Collateral requirements differ by type of derivative. Collateral or margin requirements are set by the broker or exchange clearing house for exchange traded derivatives while collateral terms are contract specific for over-the-counter traded derivatives. Cash collateral that has been pledged to
| | | | | | |
| Notes to financial statements | | Wells Fargo Ultra Short-Term Municipal Income Fund | | | 27 | |
cover obligations of the Fund under ISDA Master Agreements or similar agreements, if any, will be reported separately in the Statement of Assets and Liabilities. Securities pledged as collateral, if any, for the same purpose are noted in the Portfolio of Investments. With respect to balance sheet offsetting, absent an event of default by the counterparty or a termination of the agreement, the reported amounts of financial assets and financial liabilities in the Statement of Assets and Liabilities are not offset across transactions between the Fund and the applicable counterparty. A reconciliation of the gross amounts on the Statement of Assets and Liabilities to the net amounts by derivative type, including any collateral exposure, is as follows:
| | | | | | | | | | | | | | | | |
| Derivative type | | Counterparty | | Gross amounts of liabilites in the Statement of Assets and Liabilities | | Amounts
subject to
netting
agreements | | | Collateral
pledged1 | | | Net amount
of liabilities | |
Futures – variation margin | | JPMorgan | | $19,531 | | $ | 0 | | | $ | (19,531 | ) | | $ | 0 | |
| | 1 | Collateral pledged within this table is limited to the collateral for the net transaction with the counterparty. | |
7. BANK BORROWINGS
The Trust (excluding the money market funds and certain other funds) and Wells Fargo Variable Trust are parties to a $200,000,000 revolving credit agreement whereby the Fund is permitted to use bank borrowings for temporary or emergency purposes, such as to fund shareholder redemption requests. Interest under the credit agreement is charged to the Fund based on a borrowing rate equal to the higher of the Federal Funds rate in effect on that day plus 1.25% or the overnight LIBOR rate in effect on that day plus 1.25%. In addition, an annual commitment fee equal to 0.20% of the unused balance is allocated to each participating fund. Prior to September 1, 2015, the revolving credit agreement amount was $150,000,000 and the annual commitment fee was equal to 0.10% of the unused balance which was allocated to each participating fund.
For the year ended June 30, 2016, there were no borrowings by the Fund under the agreement.
8. DISTRIBUTIONS TO SHAREHOLDERS
The tax character of distributions paid during the years ended June 30, 2016 and June 30, 2015 were as follows:
| | | | | | | | |
| | | Year ended June 30 | |
| | | 2016 | | | 2015 | |
Ordinary income | | $ | 0 | | | $ | 1,702,543 | |
Tax-exempt income | | | 32,781,335 | | | | 24,436,678 | |
Long-term capital gain | | | 902,189 | | | | 1,021,997 | |
As of June 30, 2016, the components of distributable earnings on a tax basis were as follows:
| | | | | | |
Undistributed
ordinary
income | | Undistributed
tax-exempt
income | | Undistributed
long-term
gain | | Unrealized
gains |
$79,199 | | $505,201 | | $385,048 | | $4,938,719 |
9. INDEMNIFICATION
Under the Trust’s organizational documents, the officers and Trustees have been granted certain indemnification rights against certain liabilities that may arise out of performance of their duties to the Trust. Additionally, in the normal course of business, the Trust may enter into contracts with service providers that contain a variety of indemnification clauses. The Trust’s maximum exposure under these arrangements is dependent on future claims that may be made against the Fund and, therefore, cannot be estimated.
| | | | |
| 28 | | Wells Fargo Ultra Short-Term Municipal Income Fund | | Report of independent registered public accounting firm |
BOARD OF TRUSTEES AND SHAREHOLDERS OF WELLS FARGO FUNDS TRUST:
We have audited the accompanying statement of assets and liabilities, including the summary portfolio of investments, of the Wells Fargo Ultra Short-Term Municipal Income Fund (formerly known as Wells Fargo Advantage Ultra Short-Term Municipal Income Fund) (the “Fund”), one of the funds constituting the Wells Fargo Funds Trust, as of June 30, 2016, and the related statement of operations for the year then ended, the statements of changes in net assets for each of the years in the two-year period then ended, and the financial highlights for each of the years in the five-year period then ended. These financial statements and financial highlights are the responsibility of the Fund’s management. Our responsibility is to express an opinion on these financial statements and financial highlights based on our audits.
We conducted our audits in accordance with the standards of the Public Company Accounting Oversight Board (United States). Those standards require that we plan and perform the audit to obtain reasonable assurance about whether the financial statements and financial highlights are free of material misstatement. An audit includes examining, on a test basis, evidence supporting the amounts and disclosures in the financial statements. Our procedures included confirmation of securities owned as of June 30, 2016, by correspondence with custodians and brokers, or by other appropriate auditing procedures. An audit also includes assessing the accounting principles used and significant estimates made by management, as well as evaluating the overall financial statement presentation. We believe that our audits provide a reasonable basis for our opinion.
In our opinion, the financial statements and financial highlights referred to above present fairly, in all material respects, the financial position of the Wells Fargo Ultra Short-Term Municipal Income Fund as of June 30, 2016, and the results of its operations for the year then ended, the changes in its net assets for each of the years in the two-year period then ended, and the financial highlights for each of the years in the five-year period then ended, in conformity with U.S. generally accepted accounting principles.

Boston, Massachusetts
August 25, 2016
| | | | | | |
| Other information (unaudited) | | Wells Fargo Ultra Short-Term Municipal Income Fund | | | 29 | |
TAX INFORMATION
Pursuant to Section 852 of the Internal Revenue Code, $902,189 was designated as a 20% rate gain distribution for the fiscal year ended June 30, 2016.
Pursuant to Section 852 of the Internal Revenue Code, 100% of distributions paid from net investment income is designated as exempt-interest dividends for the fiscal year ended June 30, 2016.
PROXY VOTING INFORMATION
A description of the policies and procedures that the Fund uses to determine how to vote proxies relating to portfolio securities is available, upon request, by calling 1-800-222-8222, visiting our website at wellsfargofunds.com, or visiting the SEC website at sec.gov. Information regarding how the Fund voted proxies relating to portfolio securities during the most recent 12-month period ended June 30 is available on the Fund’s website at wellsfargofunds.com or by visiting the SEC website at sec.gov.
PORTFOLIO HOLDINGS INFORMATION
The complete portfolio holdings for the Fund are publicly available monthly on the Fund’s website (wellsfargofunds.com), on a one-month delayed basis. In addition, top ten holdings information (excluding derivative positions) for the Fund is publicly available on the Fund’s website on a monthly, seven-day or more delayed basis. The Fund files its complete schedule of portfolio holdings with the SEC for the first and third quarters of each fiscal year on Form N-Q, which is available by visiting the SEC website at sec.gov. In addition, the Fund’s Form N-Q may be reviewed and copied at the SEC’s Public Reference Room in Washington, DC, and at regional offices in New York City, at 233 Broadway, and in Chicago, at 175 West Jackson Boulevard, Suite 900. Information about the Public Reference Room may be obtained by calling 1-800-SEC-0330.
| | | | |
| 30 | | Wells Fargo Ultra Short-Term Municipal Income Fund | | Other information (unaudited) |
BOARD OF TRUSTEES AND OFFICERS
Each of the Trustees and Officers1 listed in the table below acts in identical capacities for each fund in the Wells Fargo family of funds, which consists of 142 mutual funds comprising the Wells Fargo Funds Trust, Wells Fargo Variable Trust, Wells Fargo Master Trust and four closed-end funds (collectively the “Fund Complex”). This table should be read in conjunction with the Prospectus and the Statement of Additional Information2. The mailing address of each Trustee and Officer is 525 Market Street, 12th Floor, San Francisco, CA 94105. Each Trustee and Officer serves an indefinite term, however, each Trustee serves such term until reaching the mandatory retirement age established by the Trustees.
Independent Trustees
| | | | | | |
Name and
year of birth | | Position held and
length of service* | | Principal occupations during past five years or longer | | Current other public
company or investment
company directorships |
| William R. Ebsworth (Born 1957) | | Trustee, since 2015 | | Retired. From 1984 to 2013, equities analyst, portfolio manager, research director and chief financial officer at Fidelity Management and Research Company in Boston, Tokyo, and Hong Kong and retired in 2013 as Chief Investment Officer of Fidelity Strategic Advisers, Inc. where he lead a team of investment professionals managing client assets. Prior thereto, Board member of Hong Kong Securities Clearing Co., Hong Kong Options Clearing Corp., the Thailand International Fund, Ltd., Fidelity Investments Life Insurance Company, and Empire Fidelity Investments Life Insurance Company. Mr. Ebsworth is a CFA® charterholder and an Adjunct Lecturer, Finance, at Babson College. | | Asset Allocation Trust |
| Jane A. Freeman (Born 1953) | | Trustee, since 2015 | | Retired. From 2012 to 2014 and 1999 to 2008, Chief Financial Officer of Scientific Learning Corporation. From 2008 to 2012, Ms. Freeman provided consulting services related to strategic business projects. Prior to 1999, Portfolio Manager at Rockefeller & Co. and Scudder, Stevens & Clark. Board member of the Harding Loevner Funds from 1996 to 2014, serving as both Lead Independent Director and chair of the Audit Committee. Board member of the Russell Exchange Traded Funds Trust from 2011 to 2012 and the chair of the Audit Committee. Ms. Freeman is Chair of Taproot Foundation (non-profit organization), a Board Member of Ruth Bancroft Garden (non-profit organization) and an inactive chartered financial analyst. | | Asset Allocation Trust |
| Peter G. Gordon (Born 1942) | | Trustee, since 1998; Chairman, since 2005 | | Co-Founder, Retired Chairman, President and CEO of Crystal Geyser Water Company. Trustee Emeritus, Colby College. | | Asset Allocation Trust |
| Isaiah Harris, Jr. (Born 1952) | | Trustee, since 2009 | | Retired. Chairman of the Board of CIGNA Corporation since 2009, and Director since 2005. From 2003 to 2011, Director of Deluxe Corporation. Prior thereto, 2007, President and CEO of BellSouth Enterprises from 2004 to 2005 and President of BellSouth Consumer Services from 2000 to 2003. Emeritus member of the Iowa State University Foundation Board of Governors. Emeritus Member of the Advisory Board of Iowa State University School of Business. Advisory Board Member, Palm Harbor Academy (charter school). Advisory Board Member, Child Evangelism Fellowship (non-profit). Mr. Harris is a certified public accountant (inactive status). | | CIGNA Corporation; Asset Allocation Trust |
| Judith M. Johnson (Born 1949) | | Trustee, since 2008; Audit Committee Chairman, since 2008 | | Retired. Prior thereto, Chief Executive Officer and Chief Investment Officer of Minneapolis Employees Retirement Fund from 1996 to 2008. Ms. Johnson is an attorney, certified public accountant and a certified managerial accountant. | | Asset Allocation Trust |
| David F. Larcker (Born 1950) | | Trustee, since 2009 | | James Irvin Miller Professor of Accounting at the Graduate School of Business, Stanford University, Director of the Corporate Governance Research Initiative and Senior Faculty of The Rock Center for Corporate Governance since 2006. From 2005 to 2008, Professor of Accounting at the Graduate School of Business, Stanford University. Prior thereto, Ernst & Young Professor of Accounting at The Wharton School, University of Pennsylvania from 1985 to 2005. | | Asset Allocation Trust |
| | | | | | |
| Other information (unaudited) | | Wells Fargo Ultra Short-Term Municipal Income Fund | | | 31 | |
| | | | | | |
Name and
year of birth | | Position held and
length of service* | | Principal occupations during past five years or longer | | Current other public
company or investment
company directorships |
| Olivia S. Mitchell (Born 1953) | | Trustee, since 2006 | | International Foundation of Employee Benefit Plans Professor, Wharton School of the University of Pennsylvania since 1993. Director of Wharton’s Pension Research Council and Boettner Center on Pensions & Retirement Research, and Research Associate at the National Bureau of Economic Research. Previously, Cornell University Professor from 1978 to 1993. | | Asset Allocation Trust |
| Timothy J. Penny (Born 1951) | | Trustee, since 1996 | | President and Chief Executive Officer of Southern Minnesota Initiative Foundation, a non-profit organization, since 2007 and Senior Fellow at the Humphrey Institute Policy Forum at the University of Minnesota since 1995. Member of the Board of Trustees of NorthStar Education Finance, Inc., a non-profit organization, since 2007. | | Asset Allocation Trust |
| Michael S. Scofield (Born 1943) | | Trustee, since 2010 | | Served on the Investment Company Institute’s Board of Governors and Executive Committee from 2008-2011 as well the Governing Council of the Independent Directors Council from 2006-2011 and the Independent Directors Council Executive Committee from 2008-2011. Chairman of the IDC from 2008-2010. Institutional Investor (Fund Directions) Trustee of Year in 2007. Trustee of the Evergreen Funds complex (and its predecessors) from 1984 to 2010. Chairman of the Evergreen Funds from 2000-2010. Former Trustee of the Mentor Funds. Retired Attorney, Law Offices of Michael S. Scofield. | | Asset Allocation Trust |
| * | Length of service dates reflect the Trustee’s commencement of service with the Trust’s predecessor entities, where applicable. |
Officers
| | | | | | |
Name and
year of birth | | Position held and
length of service | | Principal occupations during past five years or longer | | |
| Karla M. Rabusch (Born 1959) | | President, since 2003 | | Executive Vice President of Wells Fargo Bank, N.A. and President of Wells Fargo Funds Management, LLC since 2003. | | |
| Nancy Wiser1 (Born 1967) | | Treasurer, since 2012 | | Executive Vice President of Wells Fargo Funds Management, LLC since 2011. Chief Operating Officer and Chief Compliance Officer at LightBox Capital Management LLC, from 2008 to 2011. | | |
| C. David Messman (Born 1960) | | Secretary, since 2000; Chief Legal Officer, since 2003 | | Senior Vice President and Secretary of Wells Fargo Funds Management, LLC since 2001. Assistant General Counsel of Wells Fargo Bank, N.A. since 2013 and Vice President and Managing Counsel of Wells Fargo Bank, N.A. from 1996 to 2013. | | |
| Michael Whitaker (Born 1967) | | Chief Compliance Officer, since 2016* | | Executive Vice President of Wells Fargo Funds Management, LLC since 2016. Chief Compliance Officer of Fidelity’s Fixed Income Funds and Asset Allocation Funds from 2008 to 2016, Compliance Officer of FMR Co., Inc. from 2014 to 2016, Fidelity Investments Money Management, Inc. from 2014 to 2016, Fidelity Investments from 2007 to 2016. | | |
| David Berardi (Born 1975) | | Assistant Treasurer, since 2009 | | Vice President of Wells Fargo Funds Management, LLC since 2009. Vice President of Evergreen Investment Management Company, LLC from 2008 to 2010. Manager of Fund Reporting and Control for Evergreen Investment Management Company, LLC from 2004 to 2010. | | |
| Jeremy DePalma1 (Born 1974) | | Assistant Treasurer, since 2009 | | Senior Vice President of Wells Fargo Funds Management, LLC since 2009. Senior Vice President of Evergreen Investment Management Company, LLC from 2008 to 2010 and head of the Fund Reporting and Control Team within Fund Administration from 2005 to 2010. | | |
| 1 | Nancy Wiser acts as Treasurer of 73 funds in the Fund Complex. Jeremy DePalma acts as Treasurer of 69 funds and Assistant Treasurer of 73 funds in the Fund Complex. |
| 2 | The Statement of Additional Information includes additional information about the Trustees and is available, without charge, upon request, by calling 1-800-222-8222 or by visiting the website at wellsfargofunds.com. |
| * | Michael Whitaker became Chief Compliance Officer effective May 16, 2016. |
| | | | |
| 32 | | Wells Fargo Ultra Short-Term Municipal Income Fund | | Other information (unaudited) |
BOARD CONSIDERATION OF INVESTMENT MANAGEMENT AND SUB-ADVISORY AGREEMENTS:
Under the Investment Company Act of 1940 (the “1940 Act”), the Board of Trustees (the “Board”) of Wells Fargo Funds Trust (the “Trust”) must determine annually whether to approve the continuation of the Trust’s investment management and sub-advisory agreements. In this regard, at an in-person meeting held on May 24-25, 2016 (the “Meeting”), the Board, all the members of which have no direct or indirect interest in the investment management and sub-advisory agreements and are not “interested persons” of the Trust, as defined in the 1940 Act (the “Independent Trustees”), reviewed and approved for Wells Fargo Ultra Short-Term Municipal Income Fund (the “Fund”): (i) an investment management agreement (the “Management Agreement”) with Wells Fargo Funds Management, LLC (“Funds Management”); and (ii) an investment sub-advisory agreement (the “Sub-Advisory Agreement”) with Wells Capital Management Incorporated (the “Sub-Adviser”), an affiliate of Funds Management. The Management Agreement and the Sub-Advisory Agreement are collectively referred to as the “Advisory Agreements.”
At the Meeting, the Board considered the factors and reached the conclusions described below relating to the selection of Funds Management and the Sub-Adviser and the approval of the Advisory Agreements. Prior to the Meeting, including at an in-person meeting in April 2016, the Trustees conferred extensively among themselves and with representatives of Funds Management about these matters. Also, the Board has adopted a team-based approach, with each team consisting of a sub-set of Trustees, to assist the full Board in the discharge of its duties in reviewing performance and other matters throughout the year. The Independent Trustees were assisted in their evaluation of the Advisory Agreements by independent legal counsel, from whom they received separate legal advice and with whom they met separately.
In providing information to the Board, Funds Management and the Sub-Adviser were guided by a detailed set of requests for information submitted to them by independent legal counsel on behalf of the Independent Trustees at the start of the Board’s annual contract renewal process earlier in 2016. In considering and approving the Advisory Agreements, the Trustees considered the information they believed relevant, including but not limited to the information discussed below. The Board considered not only the specific information presented in connection with the Meeting, but also the knowledge gained over time through interaction with Funds Management and the Sub-Adviser about various topics. In this regard, the Board reviewed reports of Funds Management at each of its quarterly meetings, which included, among other things, portfolio reviews and performance reports. In addition, the Board and the teams mentioned above confer with portfolio managers at various times throughout the year. The Board did not identify any particular information or consideration that was all-important or controlling, and each individual Trustee may have attributed different weights to various factors.
After its deliberations, the Board unanimously approved the continuation of the Advisory Agreements for a one-year term and determined that the compensation payable to Funds Management and the Sub-Adviser under each of the Advisory Agreements was reasonable. The Board considered the approval of the Advisory Agreements for the Fund as part of its consideration of agreements for funds across the complex, but its approvals were made on a fund-by-fund basis. The following summarizes a number of important, but not necessarily all, factors considered by the Board in support of its approvals.
Nature, extent and quality of services
The Board received and considered various information regarding the nature, extent and quality of services provided to the Fund by Funds Management and the Sub-Adviser under the Advisory Agreements. This information included a description of the investment advisory services and Fund-level administrative services covered by the Management Agreement, as well as, among other things, a summary of the background and experience of senior management of Funds Management, and the qualifications, background, tenure and responsibilities of each of the portfolio managers primarily responsible for the day-to-day portfolio management of the Fund.
The Board evaluated the ability of Funds Management and the Sub-Adviser to attract and retain qualified investment professionals, including research, advisory and supervisory personnel. The Board further considered the compliance programs and compliance records of Funds Management and the Sub-Adviser. In addition, the Board took into account the full range of services provided to the Fund by Funds Management and its affiliates.
Fund performance and expenses
The Board considered the performance results for the Fund over various time periods ended December 31, 2015. The Board considered these results in comparison to the performance of funds in a universe that was determined by Broadridge Inc. (“Broadridge”) to be similar to the Fund (the “Universe”), and in comparison to the Fund’s benchmark index and to other comparative data. Broadridge is an independent provider of investment company data. The Board received a description of the methodology used by Broadridge to select the mutual funds in the performance
| | | | | | |
| Other information (unaudited) | | Wells Fargo Ultra Short-Term Municipal Income Fund | | | 33 | |
Universe. The Board noted that the performance of the Fund (Class A) was lower than the average performance of the Universe for all periods under review except the ten-year period under review. The Board also noted that the performance of the Fund was lower than its benchmark, the Barclays 1 Year Municipal Bond Index (1-2), for all periods under review except for the ten-year period.
The Board received information concerning, and discussed factors contributing to, the underperformance of the Fund relative to the Universe and benchmark for the periods noted above. The Board took note of the explanations for the relative underperformance in these periods, including with respect to market factors and investment decisions that affected the Fund’s performance and of recent outperformance.
The Board also received and considered information regarding the Fund’s net operating expense ratios and their various components, including actual management fees, custodian and other non-management fees, and Rule 12b-1 and non-Rule 12b-1 shareholder service fees. The Board considered these ratios in comparison to the median ratios of funds in class-specific expense groups that were determined by Broadridge to be similar to the Fund (the “Groups”). The Board received a description of the methodology used by Broadridge to select the mutual funds in the expense Groups and an explanation of how funds comprising expense groups and their expense ratios may vary from year-to-year. Based on the Broadridge reports, the Board noted that the net operating expense ratios of the Fund were lower than the median net operating expense ratios of the expense Groups.
The Board took into account the Fund performance and expense information provided to it among the factors considered in deciding to re-approve the Advisory Agreements.
Investment management and sub-advisory fee rates
The Board reviewed and considered the contractual fee rates payable by the Fund to Funds Management under the Management Agreement, as well as the contractual fee rates payable by the Fund to Funds Management for class-level administrative services under a Class-Level Administration Agreement, which include class-level transfer agency and sub-transfer agency costs (collectively, the “Management Rates”). The Board also reviewed and considered the contractual investment sub-advisory fee rates that are payable by Funds Management to the Sub-Adviser for investment sub-advisory services.
Among other information reviewed by the Board was a comparison of the Fund’s Management Rates with the average contractual investment management fee rates of funds in the expense Groups at a common asset level as well as transfer agency costs of the funds in the expense Groups. The Board noted that the Management Rates of the Fund were lower than or in range of the sum of these average rates for the Fund’s expense Groups for all share classes.
The Board also received and considered information about the portion of the total management fee that was retained by Funds Management after payment of the fee to the Sub-Adviser for sub-advisory services.. In assessing the reasonableness of this amount, the Board received and evaluated information about the nature and extent of responsibilities retained and risks assumed by Funds Management and not delegated to or assumed by the Sub-Adviser, and about Funds Management’s on-going oversight services. However, given the affiliation between Funds Management and the Sub-Adviser, the Board ascribed limited relevance to the allocation of fees between them.
The Board also received and considered information about the nature and extent of services offered and fee rates charged by Funds Management and the Sub-Adviser to other types of clients with investment strategies similar to those of the Fund. In this regard, the Board received information about the significantly greater scope of services, and compliance, reporting and other legal burdens and risks of managing mutual funds compared with those associated with managing assets of non-mutual fund clients such as collective funds or institutional separate accounts.
Based on its consideration of the factors and information it deemed relevant, including those described here, the Board determined that the compensation payable to Funds Management under the Management Agreement and to the Sub-Adviser under the Sub-Advisory Agreement was reasonable, in light of the services covered by the Advisory Agreements.
Profitability
The Board received and considered information concerning the profitability of Funds Management, as well as the profitability of Wells Fargo as a whole, from providing services to the Fund and the fund family as a whole. The Board also received and considered information concerning the profitability of the Sub-Adviser from providing services to the fund family as a whole, noting that the Sub-Adviser’s profitability information with respect to providing services to the Fund was subsumed in the Wells Fargo and Funds Management profitability analysis.
| | | | |
| 34 | | Wells Fargo Ultra Short-Term Municipal Income Fund | | Other information (unaudited) |
Funds Management reported on the methodologies and estimates used in calculating profitability. Among other things, the Board noted that the levels of profitability reported on a fund-by-fund basis varied widely, depending on factors such as the size and type of fund. Based on its review, the Board did not deem the profits reported by Funds Management or Wells Fargo from its services to the Fund to be at a level that would prevent it from approving the continuation of the Advisory Agreements.
Economies of scale
With respect to possible economies of scale, the Board noted the existence of breakpoints in the Fund’s management fee structure, which operate generally to reduce the Fund’s expense ratios as the Fund grows in size. It considered that, for a small fund or a fund that shrinks in size, breakpoints conversely can result in higher fee levels. The Board also considered that fee waiver and expense reimbursement arrangements and competitive fee rates at the outset are means of sharing potential economies of scale with shareholders of the Fund and the fund family as a whole. The Board considered Funds Management’s view that any analyses of potential economies of scale in managing a particular fund are inherently limited in light of the joint and common costs and investments that Funds Management incurs across the fund family as a whole.
The Board concluded that the Fund’s fee and expense arrangements, including contractual breakpoints, constituted a reasonable approach to sharing potential economies of scale with the Fund and its shareholders.
Other benefits to Funds Management and the Sub-Adviser
The Board received and considered information regarding potential “fall-out” or ancillary benefits received by Funds Management and its affiliates, including the Sub-Adviser, as a result of their relationships with the Fund. Ancillary benefits could include, among others, benefits directly attributable to other relationships with the Fund and benefits potentially derived from an increase in Funds Management’s and the Sub-Adviser’s business as a result of their relationships with the Fund. The Board noted that various affiliates of Funds Management may receive distribution-related fees, shareholder servicing payments and sub-transfer agency fees in respect of shares sold or held through them and services provided.
The Board also reviewed information about soft dollar credits earned and utilized by the Sub-Adviser, fees earned by Funds Management and the Sub-Adviser from managing a private investment vehicle for the fund family’s securities lending collateral and commissions earned by an affiliated broker from portfolio transactions.
Based on its consideration of the factors and information it deemed relevant, including those described here, the Board did not find that any ancillary benefits received by Funds Management and its affiliates, including the Sub-Adviser, were unreasonable.
Conclusion
At the Meeting, after considering the above-described factors and based on its deliberations and its evaluation of the information described above, the Board unanimously approved the continuation of the Advisory Agreements for a one-year term and determined that the compensation payable to Funds Management and the Sub-Adviser under each of the Advisory Agreements was reasonable.
| | | | | | |
| List of abbreviations | | Wells Fargo Ultra Short-Term Municipal Income Fund | | | 35 | |
The following is a list of common abbreviations for terms and entities that may have appeared in this report.
| ACA | — ACA Financial Guaranty Corporation |
| ADR | — American depositary receipt |
| ADS | — American depositary shares |
| AGC | — Assured Guaranty Corporation |
| AGM | — Assured Guaranty Municipal |
| Ambac | — Ambac Financial Group Incorporated |
| AMT | — Alternative minimum tax |
| BAN | — Bond anticipation notes |
| BHAC | — Berkshire Hathaway Assurance Corporation |
| CAB | — Capital appreciation bond |
| CCAB | — Convertible capital appreciation bond |
| CDA | — Community Development Authority |
| CDO | — Collateralized debt obligation |
| DRIVER | — Derivative inverse tax-exempt receipts |
| DW&P | — Department of Water & Power |
| DWR | — Department of Water Resources |
| ECFA | — Educational & Cultural Facilities Authority |
| EDA | — Economic Development Authority |
| EDFA | — Economic Development Finance Authority |
| ETF | — Exchange-traded fund |
| FDIC | — Federal Deposit Insurance Corporation |
| FFCB | — Federal Farm Credit Banks |
| FGIC | — Financial Guaranty Insurance Corporation |
| FHA | — Federal Housing Administration |
| FHLB | — Federal Home Loan Bank |
| FHLMC | — Federal Home Loan Mortgage Corporation |
| FICO | — The Financing Corporation |
| FNMA | — Federal National Mortgage Association |
| GDR | — Global depositary receipt |
| GNMA | — Government National Mortgage Association |
| HCFR | — Healthcare facilities revenue |
| HEFA | — Health & Educational Facilities Authority |
| HEFAR | — Higher education facilities authority revenue |
| HFA | — Housing Finance Authority |
| HFFA | — Health Facilities Financing Authority |
| HUD | — Department of Housing and Urban Development |
| IDA | — Industrial Development Authority |
| IDAG | — Industrial Development Agency |
| KRW | — Republic of Korea won |
| LIBOR | — London Interbank Offered Rate |
| LIFER | — Long Inverse Floating Exempt Receipts |
| LLC | — Limited liability company |
| LLLP | — Limited liability limited partnership |
| LLP | — Limited liability partnership |
| MBIA | — Municipal Bond Insurance Association |
| MFHR | — Multifamily housing revenue |
| MSTR | — Municipal securities trust receipts |
| MUD | — Municipal Utility District |
| National | — National Public Finance Guarantee Corporation |
| PCFA | — Pollution Control Financing Authority |
| PCL | — Public Company Limited |
| PCR | — Pollution control revenue |
| PFA | — Public Finance Authority |
| PFFA | — Public Facilities Financing Authority |
| PFOTER | — Puttable floating option tax-exempt receipts |
| plc | — Public limited company |
| PUTTER | — Puttable tax-exempt receipts |
| R&D | — Research & development |
| Radian | — Radian Asset Assurance |
| RAN | — Revenue anticipation notes |
| RDA | — Redevelopment Authority |
| RDFA | — Redevelopment Finance Authority |
| REIT | — Real estate investment trust |
| ROC | — Reset option certificates |
| SAVRS | — Select auction variable rate securities |
| SBA | — Small Business Authority |
| SDR | — Swedish depositary receipt |
| SFHR | — Single-family housing revenue |
| SFMR | — Single-family mortgage revenue |
| SPA | — Standby purchase agreement |
| SPDR | — Standard & Poor’s Depositary Receipts |
| SPEAR | — Short Puttable Exempt Adjustable Receipts |
| STRIPS | — Separate trading of registered interest and |
| TAN | — Tax anticipation notes |
| TIPS | — Treasury inflation-protected securities |
| TRAN | — Tax revenue anticipation notes |
| TTFA | — Transportation Trust Fund Authority |
| TVA | — Tennessee Valley Authority |
This page is intentionally left blank.

For more information
More information about Wells Fargo Funds is available free upon request. To obtain literature, please write, email, visit the Fund’s website, or call:
Wells Fargo Funds
P.O. Box 8266
Boston, MA 02266-8266
Email: fundservice@wellsfargo.com
Website: wellsfargofunds.com
Individual investors: 1-800-222-8222
Retail investment professionals: 1-888-877-9275
Institutional investment professionals: 1-866-765-0778
This report and the financial statements contained herein are submitted for the general information of the shareholders of the Fund. If this report is used for promotional purposes, distribution of the report must be accompanied or preceded by a current prospectus. Before investing, please consider the investment objectives, risks, charges, and expenses of the investment. For a current prospectus and, if available, a summary prospectus, containing this information, call
1-800-222-8222 or visit the Fund’s website at wellsfargofunds.com. Read the prospectus carefully before you invest or send money.
Wells Fargo Asset Management (WFAM) is a trade name used by the asset management businesses of Wells Fargo & Company. Wells Fargo Funds Management, LLC, a wholly owned subsidiary of Wells Fargo & Company, provides investment advisory and administrative services for Wells Fargo Funds. Other affiliates of Wells Fargo & Company provide subadvisory and other services for the funds. The funds are distributed by Wells Fargo Funds Distributor, LLC, Member FINRA, an affiliate of Wells Fargo & Company.
NOT FDIC INSURED ¡ NO BANK GUARANTEE ¡ MAY LOSE VALUE
© 2016 Wells Fargo Funds Management, LLC. All rights reserved.
| | |
 | | 244412 08-16 A258/AR258 6-16 |
Annual Report
June 30, 2016

Wells Fargo Wisconsin Tax-Free Fund


Reduce clutter. Save trees.
Sign up for electronic delivery of prospectuses and shareholder reports at wellsfargo.com/advantagedelivery
Contents
The views expressed and any forward-looking statements are as of June 30, 2016, unless otherwise noted, and are those of the Fund managers and/or Wells Fargo Funds Management, LLC. Discussions of individual securities, or the markets generally, or any Wells Fargo Fund are not intended as individual recommendations. Future events or results may vary significantly from those expressed in any forward-looking statements. The views expressed are subject to change at any time in response to changing circumstances in the market. Wells Fargo Funds Management, LLC and the Fund disclaim any obligation to publicly update or revise any views expressed or forward-looking statements.
NOT FDIC INSURED ¡ NO BANK GUARANTEE ¡ MAY LOSE VALUE
| | | | |
| 2 | | Wells Fargo Wisconsin Tax-Free Fund | | Letter to shareholders (unaudited) |

Karla M. Rabusch
President
Wells Fargo Funds
In fact, yields on municipal bonds that matured in 10 years or more experienced yield declines of more than 100 basis points (100 basis points equals 1.00%) during the reporting period.
Dear Valued Shareholder:
We are pleased to offer you this annual report for the Wells Fargo Wisconsin Tax-Free Fund for the 12-month period that ended June 30, 2016. The U.S. Federal Reserve (Fed) began normalizing monetary policy, raising the federal funds rate to between 0.25% and 0.50% in December 2015. Short-term municipal bond yields rose, but yields on longer-term bonds declined. In fact, yields on municipal bonds that matured in 10 years or more experienced yield declines of more than 100 basis points (100 basis points equals 1.00%) during the reporting period. The Barclays Municipal Bond Index,1 a broad measure tracking investment-grade municipal bonds, returned 7.65% during the 12-month reporting period.
Monetary policy was accommodative.
The Fed continued an easy monetary policy in order to support the economy and the financial system. However, it raised the federal funds target rate in December because it believed the U.S. economy was strong enough to begin normalizing monetary policy. The European Central Bank cut all three of its short-term rates during the reporting period, increased its asset-purchase program from 60 billion euros per month to 80 billion, expanded the list of eligible securities to include investment-grade nonbank debt, and created a fund-to-lend program where banks could be paid to lend money. In Japan, the Bank of Japan maintained an aggressive monetary program aimed at combating deflation.
Despite accommodative central-bank policies that helped keep interest rates at ultra-low levels, there were periods of volatility. Early in 2016, weakness in certain emerging markets economies and commodities hurt riskier assets and a vote in June 2016 by the U.K. to exit the European Union set off another round of global uncertainty. Municipal bonds benefited because they are perceived as a safe-haven asset. In addition, investor demand for yield helped lower-rated debt outperform. The Barclays High Yield Municipal Bond Index2 returned 12.09% during the 12-month period that ended June 30, 2016.
Strong demand, modest supply, and solid credit fundamentals supported municipals.
Market technicals remained favorable. According to the Investment Company Institute, more than $33 billion was allocated to municipal mutual funds during the first half of 2016, which was more than double the inflows during all of 2015. Further, inflows during the second quarter of 2016 were the largest in nearly seven years. In contrast, less new supply helped make 2015 the fifth calendar year of negative net supply and supply in the first half of 2016 was about 4% less than the same period last year.
Municipal credit quality remained on an uptrend despite a number of high-profile negative credit situations. Idiosyncratic credit risks remain, however. With regard to Puerto Rico, the U.S. enacted legislation that prohibits bondholder lawsuits temporarily and instills a fiscal oversight board for Puerto Rico; Puerto Rico then declared a moratorium on paying its general obligation (GO) bonds and defaulted on $911 million in payments due (most of which were GOs) on July 1, 2016. The state of Illinois approved a six-month stopgap budget, a temporary but meaningful
| 1 | The Barclays Municipal Bond Index is an unmanaged index composed of long-term tax-exempt bonds with a minimum credit rating of Baa. You cannot invest directly in an index. |
| 2 | The Barclays High Yield Municipal Bond Index measures the non-investment-grade and nonrated U.S. dollar–denominated, fixed-rate, tax-exempt bond market within the 50 United States and four other qualifying regions (Washington, D.C.; Puerto Rico; Guam; and the Virgin Islands). The index allows state and local general obligation, revenue, insured, and prerefunded bonds; however, historically the index has been composed of mostly revenue bonds. You cannot invest directly in an index. |
| | | | | | |
| Letter to shareholders (unaudited) | | Wells Fargo Wisconsin Tax-Free Fund | | | 3 | |
step. Under this stopgap budget for the state, the city of Chicago receives authority to raise property taxes for teacher pensions and low-income school districts would receive greater state funding. City of Chicago and school district debt rallied on the news.
Since the end of the financial crisis, structural changes in the fixed-income markets have reduced trading liquidity (the degree to which assets can be bought or sold without affecting the price). New regulations and capital requirements have caused traditional liquidity suppliers (banks and broker/dealers) to be more risk-averse and hold less inventory. Meanwhile, corporate-debt issuance has spiked as companies finance themselves at record-low yields, bond mutual funds hold larger amounts of this new debt supply, trading volumes are lower, and large trades are more difficult to execute. However, fixed-income markets appear to have functioned well over the past year with sufficient liquidity.
Don’t let short-term uncertainty derail long-term investment goals.
Periods of uncertainty can present challenges, but experience has taught us that maintaining long-term investment goals can be an effective way to plan for the future. To help you create a sound strategy based on your personal goals and risk tolerance, Wells Fargo Funds offers more than 100 mutual funds spanning a wide range of asset classes and investment styles. Although diversification cannot guarantee an investment profit or prevent losses, we believe it can be an effective way to manage investment risk and potentially smooth out overall portfolio performance. We encourage investors to know their investments and to understand that appropriate levels of risk-taking may unlock opportunities.
Thank you for choosing to invest in Wells Fargo Funds. We appreciate your confidence in us and remain committed to helping you meet your financial needs.
Sincerely,

Karla M. Rabusch
President
Wells Fargo Funds
Periods of uncertainty can present challenges, but experience has taught us that maintaining long-term investment goals can be an effective way to plan for the future.
For further information about your Fund, contact your investment professional, visit our website at wellsfargofunds.com, or call us directly at 1-800-222-8222. We are available 24 hours a day, 7 days a week.
| | | | |
| 4 | | Wells Fargo Wisconsin Tax-Free Fund | | Performance highlights (unaudited) |
Investment objective
The Fund seeks current income exempt from federal income tax and Wisconsin individual income tax.
Manager
Wells Fargo Funds Management, LLC
Subadviser
Wells Capital Management Incorporated
Portfolio managers
Lyle J. Fitterer, CFA,® CPA
Thomas Stoeckmann
Average annual total returns (%) as of June 30, 20161
| | | | | | | | | | | | | | | | | | | | | | | | | | | | | | | | | | |
| | | | | Including sales charge | | | Excluding sales charge | | | Expense ratios2 (%) | |
| | | Inception date | | 1 year | | | 5 year | | | 10 year | | | 1 year | | | 5 year | | | 10 year | | | Gross | | | Net3 | |
| Class A (WWTFX) | | 3-31-2008 | | | 0.70 | | | | 3.02 | | | | 3.74 | | | | 5.44 | | | | 3.97 | | | | 4.22 | | | | 0.90 | | | | 0.70 | |
| Class C (WWTCX) | | 12-26-2002 | | | 3.66 | | | | 3.19 | | | | 3.42 | | | | 4.66 | | | | 3.19 | | | | 3.42 | | | | 1.65 | | | | 1.45 | |
| Barclays Municipal Bond Index4 | | – | | | – | | | | – | | | | – | | | | 7.65 | | | | 5.33 | | | | 5.13 | | | | – | | | | – | |
| Barclays Wisconsin Municipal Bond Index5 | | – | | | – | | | | – | | | | – | | | | 6.75 | | | | 4.83 | | | | 5.14 | | | | – | | | | – | |
Figures quoted represent past performance, which is no guarantee of future results, and do not reflect taxes that a shareholder may pay on fund distributions or the redemption of fund shares. Investment return and principal value of an investment will fluctuate so that an investor’s shares, when redeemed, may be worth more or less than their original cost. Performance shown without sales charges would be lower if sales charges were reflected. Current performance may be lower or higher than the performance data quoted, which assumes the reinvestment of dividends and capital gains. Current month-end performance is available on the Fund’s website, wellsfargofunds.com.
Index returns do not include transaction costs associated with buying and selling securities, any mutual fund fees or expenses, or any taxes. It is not possible to invest directly in an index.
For Class A shares, the maximum front-end sales charge is 4.50%. For Class C shares, the maximum contingent deferred sales charge is 1.00%. Performance including a contingent deferred sales charge assumes the sales charge for the corresponding time period.
Bond values fluctuate in response to the financial condition of individual issuers, general market and economic conditions, and changes in interest rates. Changes in market conditions and government policies may lead to periods of heightened volatility in the bond market and reduced liquidity for certain bonds held by the Fund. In general, when interest rates rise, bond values fall and investors may lose principal value. Interest-rate changes and their impact on the Fund and its share price can be sudden and unpredictable. The use of derivatives may reduce returns and/or increase volatility. Certain investment strategies tend to increase the total risk of an investment (relative to the broader market). The Fund is exposed Wisconsin and Puerto Rico municipal securities risk, high-yield securities, and non-diversification risk. Consult the Fund’s prospectus for additional information on these and other risks. A portion of the Fund’s income may be subject to federal, state, and/or local income taxes or the Alternative Minimum Tax (AMT). Any capital gains distributions may be taxable.
Please see footnotes on page 5.
| | | | | | |
| Performance highlights (unaudited) | | Wells Fargo Wisconsin Tax-Free Fund | | | 5 | |
|
| Growth of $10,000 investment as of June 30, 20166 |
|
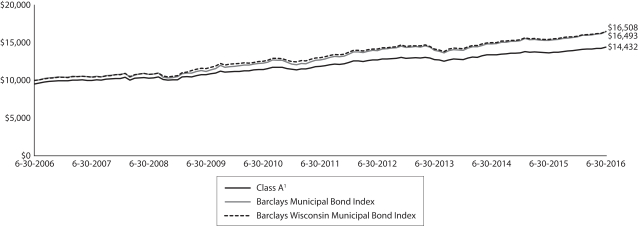 |
| 1 | Historical performance shown for Class A shares prior to their inception reflects the performance of the former Investor Class shares, and includes the higher expenses applicable to the former Investor Class shares (except during those periods in which expenses of Class A shares would have been higher than those of the former Investor Class shares, no such adjustment is reflected). If these expenses had not been included, returns would be higher. |
| 2 | Reflects the expense ratios as stated in the most recent prospectuses. The expense ratios shown are subject to change and may differ from the annualized expense ratios shown in the financial highlights of this report. |
| 3 | The manager has contractually committed through October 31, 2016, to waive fees and/or reimburse expenses to the extent necessary to cap the Fund’s Total Annual Fund Operating Expenses After Fee Waiver at the amounts shown. After this time, the cap may be increased or the commitment to maintain the cap may be terminated only with the approval of the Board of Trustees. Brokerage commissions, stamp duty fees, interest, taxes, acquired fund fees and expenses, and extraordinary expenses are excluded from the expense cap. Without this cap, the Fund’s returns would have been lower. |
| 4 | The Barclays Municipal Bond Index is an unmanaged index composed of long-term tax-exempt bonds with a minimum credit rating of Baa. You cannot invest directly in an index. |
| 5 | The Barclays Wisconsin Municipal Bond Index is the Wisconsin component of the Barclays Municipal Bond Index. You cannot invest directly in an index. |
| 6 | The chart compares the performance of Class A shares for the most recent ten years with the Barclays Municipal Bond Index and the Barclays Wisconsin Municipal Bond Index. The chart assumes a hypothetical $10,000 investment in Class A shares and reflects all operating expenses and assumes the maximum initial sales charge of 4.50%. |
| 7 | The credit quality distribution of portfolio holdings reflected in the chart is based on ratings from Standard & Poor’s, Moody’s Investors Service, and/or Fitch Ratings Ltd. Credit quality ratings apply to the underlying holdings of the Fund and not to the Fund itself. The percentages of the Fund’s portfolio with the ratings depicted in the chart are calculated based on the total market value of fixed income securities held by the Fund. If a security was rated by all three rating agencies, the middle rating was utilized. If rated by two of three rating agencies, the lower rating was utilized, and if rated by one of the rating agencies, that rating was utilized. Standard & Poor’s rates the creditworthiness of bonds, ranging from AAA (highest) to D (lowest). Ratings from A to CCC may be modified by the addition of a plus (+) or minus (-) sign to show relative standing within the rating categories. Standard & Poor’s rates the creditworthiness of short-term notes from SP-1 (highest) to SP-3 (lowest). Moody’s rates the creditworthiness of bonds, ranging from Aaa (highest) to C (lowest). Ratings Aa to B may be modified by the addition of a number 1 (highest) to 3 (lowest) to show relative standing within the ratings categories. Moody’s rates the creditworthiness of short-term U.S. tax-exempt municipal securities from MIG 1/VMIG 1 (highest) to SG (lowest). Fitch rates the creditworthiness of bonds, ranging from AAA (highest) to D (lowest). Credit quality distribution is subject to change and may have changed since the date specified. |
| 8 | Amounts are calculated based on the total investments of the Fund. These amounts are subject to change and may have changed since the date specified. |
| | | | |
| 6 | | Wells Fargo Wisconsin Tax-Free Fund | | Performance highlights (unaudited) |
MANAGER’S DISCUSSION
Fund highlights
| n | | The Fund underperformed its benchmarks, the Barclays Municipal Bond Index and the Barclays Wisconsin Municipal Bond Index, for the 12-month period that ended June 30, 2016. |
| n | | Supply of Wisconsin double-tax-exempt (both national and state exempt) municipal debt was limited during the first half of the period. Therefore, in order to extend duration and also invest some cash, the Fund purchased longer-term national and short-term Virgin Island and Guam municipal issues. (Because the U.S. Virgin Islands and Guam are U.S. territories, their debt is tax exempt.) |
| n | | While we opportunistically extended the Fund’s duration when opportunities presented themselves, the Fund remained short duration and underweight the long end of the curve during the entire period. This detracted from performance as rates moved lower and the curve flattened. |
| n | | As bond yields moved lower, investors continued their search for income. This caused lower-quality bonds to outperform. The Fund’s overweight to these types of bonds (as well as below-investment-grade) had the largest positive impact on relative performance. |
Ultralow yields continued throughout the period.
With the U.S. Federal Reserve (Fed) poised to normalize its interest-rate policy, shorter-term maturities between one and five years appeared less attractive at the beginning of the reporting period due to a potential backup in short-term yields. However, subdued inflation expectations, due in part to low oil prices, combined with a fragile European economy and softening Chinese economy, implied that longer maturities would outperform. The Fed tightened in December 2015 but signaled that the pace of further increases would be gradual.
While the Fed was likely to take its time raising rates, U.S. inflation started to trend higher, unemployment remained below 5%, and economic growth was expected to remain at or above 2%. We initially purchased some longer-dated, national municipal debt to extend the Fund’s duration but later allowed duration to drift lower as the market rallied and U.S. inflation measures started to move higher. Our below-benchmark duration exposure hurt relative performance during the period as U.S. rates moved lower in sympathy with declining global interest rates.
| | |
| Credit quality as of June 30, 20167 |
|
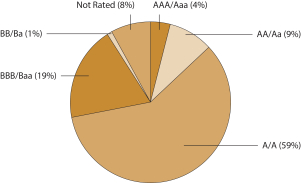 |
Credit-quality allocation helped results.
The Fund’s overweight to A-rated and BBB-rated debt and its out-of-benchmark holdings in high-yield and nonrated debt contributed to results because lower-rated bonds outperformed higher-quality bonds by a wide margin during the period. Our exposure to some lower-quality Wisconsin health care issuers and a local charter school were some of the Fund’s best-performing issues. Other issues that performed well included longer-dated, double-tax-exempt Wisconsin issues and also several of the national issues, such as Chicago Sales Tax, New Jersey Transportation Trust Fund Authority, and Illinois Sports Facilities Authority. While the national municipal bonds
do not generate state-exempt income, they produced some of the Fund’s highest total returns. We sold some of them as we found opportunities to reinvest in double-tax-exempt issues. For example, we bought Wisconsin Center District bonds, which were issued to help finance the new arena for the Milwaukee Bucks and were backed by an appropriation from the state of Wisconsin.
With continued uncertainty surrounding Puerto Rico, our exposure has drifted lower as the shorter-term bonds we own mature. The Fund continues to focus its exposure within Puerto Rico on shorter-term, insured bonds or dedicated revenue bonds. However, we increased our exposure to the Virgin Islands and Guam bonds. Our focus within these two territories is similar to the approach we took in Puerto Rico, buying shorter-insured bonds or bonds backed by dedicated revenue streams.
Please see footnotes on page 5.
| | | | | | |
| Performance highlights (unaudited) | | Wells Fargo Wisconsin Tax-Free Fund | | | 7 | |
Wisconsin’s financial position is expected to remain stable.
Following the significant budgetary improvement resulting in operating surpluses over the prior three years, Wisconsin posted an anticipated deficit during the most recent fiscal year as stagnant revenues were overcome by increasing expenses. Despite the deficit, the budget stabilization fund remained steady and is expected to do so moving forward. Additionally, the remainder of the current biennium budget is expected to be balanced as economic growth drives improved revenue collections. When faced with softening revenues, the state legislature has shown the willingness to make the difficult spending cuts necessary to maintain fiscal balance and stabilize the state’s financial position. Debt levels have been stable, and the pension system continues to be fully funded. From an economic perspective, the state’s economy appears to be performing in line with national averages, economic growth has lagged the rest of the nation as the recovery in manufacturing jobs has been weak, and population growth is roughly half of the national average.
Rates may be lower for longer, making credit allocation and issue selection even more important.
Near the end of the reporting period, the U.K. voted to withdraw from the European Union, prompting considerable uncertainty about future political situations, financial markets, and economic growth. U.S. Treasuries and municipal bonds rallied significantly on the news, and both 10-year and 30-year municipal yields reached record-low levels. Although we think rates may stay lower for longer, we recognize that an improvement in overseas economies, outflows in mutual funds, or a more hawkish tone from the Fed could lead to a spike in rates. However, if the U.S. economy does
|
| Effective maturity distribution as of June 30, 20168 |
|
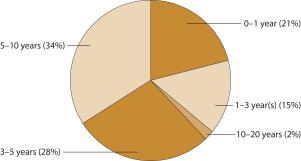 |
weaken materially, this could be the catalyst for us to increase our duration exposure and reduce our credit exposure. In this record-low interest-rate environment, security selection is even more important as breakeven yields (the sell-off that a bond can endure before the total return drops to zero) decrease.
Please see footnotes on page 5.
| | | | |
| 8 | | Wells Fargo Wisconsin Tax-Free Fund | | Fund expenses (unaudited) |
As a shareholder of the Fund, you incur two types of costs: (1) transaction costs, including sales charges (loads) on purchase payments and contingent deferred sales charges (if any) on redemptions and (2) ongoing costs, including management fees, distribution (12b-1) and/or shareholder servicing fees, and other Fund expenses. This example is intended to help you understand your ongoing costs (in dollars) of investing in the Fund and to compare these costs with the ongoing costs of investing in other mutual funds.
The example is based on an investment of $1,000 invested at the beginning of the six-month period and held for the entire period from January 1, 2016 to June 30, 2016.
Actual expenses
The “Actual” line of the table below provides information about actual account values and actual expenses. You may use the information in this line, together with the amount you invested, to estimate the expenses that you paid over the period. Simply divide your account value by $1,000 (for example, an $8,600 account value divided by $1,000 = 8.6), then multiply the result by the number in the “Actual” line under the heading entitled “Expenses paid during period” for your applicable class of shares to estimate the expenses you paid on your account during this period.
Hypothetical example for comparison purposes
The “Hypothetical” line of the table below provides information about hypothetical account values and hypothetical expenses based on the Fund’s actual expense ratio and an assumed rate of return of 5% per year before expenses, which is not the Fund’s actual return. The hypothetical account values and expenses may not be used to estimate the actual ending account balance or expenses you paid for the period. You may use this information to compare the ongoing costs of investing in the Fund and other funds. To do so, compare this 5% hypothetical example with the 5% hypothetical examples that appear in the shareholder reports of the other funds.
Please note that the expenses shown in the table are meant to highlight your ongoing costs only and do not reflect any transactional costs, such as sales charges (loads) and contingent deferred sales charges. Therefore, the “Hypothetical” line of the table is useful in comparing ongoing costs only and will not help you determine the relative total costs of owning different funds. In addition, if these transactional costs were included, your costs would have been higher.
| | | | | | | | | | | | | | | | |
| | | Beginning account value 1-1-2016 | | | Ending account value 6-30-2016 | | | Expenses paid during the period1 | | | Net annualized expense ratio | |
Class A | | | | | | | | | | | | | | | | |
Actual | | $ | 1,000.00 | | | $ | 1,027.65 | | | $ | 3.53 | | | | 0.70 | % |
Hypothetical (5% return before expenses) | | $ | 1,000.00 | | | $ | 1,021.38 | | | $ | 3.52 | | | | 0.70 | % |
Class C | | | | | | | | | | | | | | | | |
Actual | | $ | 1,000.00 | | | $ | 1,023.83 | | | $ | 7.30 | | | | 1.45 | % |
Hypothetical (5% return before expenses) | | $ | 1,000.00 | | | $ | 1,017.65 | | | $ | 7.27 | | | | 1.45 | % |
| 1 | Expenses paid is equal to the annualized expense ratio of each class multiplied by the average account value over the period, multiplied by the number of days in the most recent fiscal half-year divided by the number of days in the fiscal year (to reflect the one-half-year period). |
| | | | | | |
| Portfolio of investments—June 30, 2016 | | Wells Fargo Wisconsin Tax-Free Fund | | | 9 | |
| | | | | | | | | | | | | | | | |
| Security name | | Interest rate | | | Maturity date | | | Principal | | | Value | |
| | | | |
Municipal Obligations: 98.85% | | | | | | | | | | | | | | | | |
| | | | |
| Guam: 10.35% | | | | | | | | | | | | | | | | |
Guam Government Business Privilege Series A (Tax Revenue) | | | 5.25 | % | | | 1-1-2036 | | | $ | 2,000,000 | | | $ | 2,301,100 | |
Guam Government Business Privilege Series B1 (Tax Revenue) | | | 5.00 | | | | 1-1-2042 | | | | 500,000 | | | | 564,440 | |
Guam Government Business Privilege Series D (Tax Revenue) | | | 5.00 | | | | 11-15-2021 | | | | 2,250,000 | | | | 2,636,775 | |
Guam Government Business Privilege Series D (Tax Revenue) | | | 5.00 | | | | 11-15-2022 | | | | 1,500,000 | | | | 1,783,005 | |
Guam Government Hotel Occupancy Tax Series A (Tax Revenue) | | | 5.00 | | | | 11-1-2016 | | | | 500,000 | | | | 507,205 | |
Guam Government Limited Obligation Section 30 Series A (Miscellaneous Revenue) | | | 5.38 | | | | 12-1-2024 | | | | 1,000,000 | | | | 1,138,970 | |
Guam Government Limited Obligation Section 30 Series A (Miscellaneous Revenue) | | | 5.50 | | | | 12-1-2019 | | | | 1,000,000 | | | | 1,139,650 | |
Guam Government Waterworks Authority Water & Wastewater System Project (Water & Sewer Revenue) | | | 5.00 | | | | 7-1-2019 | | | | 650,000 | | | | 720,603 | |
Guam Government Waterworks Authority Water & Wastewater System Project (Water & Sewer Revenue) | | | 5.00 | | | | 7-1-2021 | | | | 300,000 | | | | 348,225 | |
Guam Government Waterworks Authority Water & Wastewater System Project (Water & Sewer Revenue) | | | 5.25 | | | | 7-1-2025 | | | | 740,000 | | | | 894,823 | |
Guam International Airport Authority Series A (Airport Revenue) | | | 5.00 | | | | 10-1-2016 | | | | 100,000 | | | | 101,160 | |
Guam International Airport Authority Series A (Airport Revenue) | | | 5.00 | | | | 10-1-2019 | | | | 100,000 | | | | 112,615 | |
Guam International Airport Authority Series A (Airport Revenue) | | | 5.00 | | | | 10-1-2020 | | | | 100,000 | | | | 115,012 | |
Guam International Airport Authority Series B (Airport Revenue) | | | 5.00 | | | | 10-1-2016 | | | | 150,000 | | | | 151,559 | |
Guam International Airport Authority Series C (Airport Revenue) | | | 5.00 | | | | 10-1-2021 | | | | 2,500,000 | | | | 2,877,525 | |
Guam Power Authority Series A (Utilities Revenue, AGM Insured) | | | 5.00 | | | | 10-1-2019 | | | | 1,575,000 | | | | 1,777,718 | |
Guam Power Authority Series A (Utilities Revenue, AGM Insured) | | | 5.00 | | | | 10-1-2020 | | | | 500,000 | | | | 580,565 | |
| | | | |
| | | | | | | | | | | | | | | 17,750,950 | |
| | | | | | | | | | | | | | | | |
| | | | |
| Illinois: 4.88% | | | | | | | | | | | | | | | | |
Chicago IL Board of Education CAB School Reform Series A (GO Revenue, National Insured) ¤ | | | 0.00 | | | | 12-1-2023 | | | | 1,000,000 | | | | 773,970 | |
Chicago IL Refunding Bond (Tax Revenue) | | | 5.00 | | | | 1-1-2034 | | | | 2,000,000 | | | | 2,200,440 | |
Chicago IL Series A (GO Revenue) | | | 5.00 | | | | 1-1-2027 | | | | 1,700,000 | | | | 1,720,145 | |
Chicago IL Waterworks Second Lien (Water & Sewer Revenue, AGM Insured) | | | 5.00 | | | | 11-1-2020 | | | | 500,000 | | | | 539,495 | |
Illinois (Miscellaneous Revenue) | | | 5.50 | | | | 7-1-2026 | | | | 250,000 | | | | 288,530 | |
Illinois Sports Facilities Authority State Tax Supported CAB (Tax Revenue, Ambac Insured) ¤ | | | 0.00 | | | | 6-15-2024 | | | | 3,500,000 | | | | 2,841,265 | |
| | | | |
| | | | | | | | | | | | | | | 8,363,845 | |
| | | | | | | | | | | | | | | | |
| | | | |
| Michigan: 0.13% | | | | | | | | | | | | | | | | |
Michigan Municipal Bond Authority Local Government Loan Program Series A (Miscellaneous Revenue, Ambac Insured) | | | 4.00 | | | | 11-1-2021 | | | | 215,000 | | | | 216,933 | |
| | | | | | | | | | | | | | | | |
| | | | |
| New Jersey: 1.22% | | | | | | | | | | | | | | | | |
New Jersey EDA Series EE (Miscellaneous Revenue) | | | 5.00 | | | | 9-1-2023 | | | | 935,000 | | | | 1,026,415 | |
New Jersey TTFA CAB Series A (Transportation Revenue) ¤ | | | 0.00 | | | | 12-15-2031 | | | | 2,000,000 | | | | 1,067,980 | |
| | | | |
| | | | | | | | | | | | | | | 2,094,395 | |
| | | | | | | | | | | | | | | | |
| | | | |
| Puerto Rico: 9.57% | | | | | | | | | | | | | | | | |
Puerto Rico Commonwealth Public Improvement Refunding Bond Series A (GO Revenue, AGC Insured) | | | 5.00 | | | | 7-1-2016 | | | | 1,535,000 | | | | 1,535,169 | |
Puerto Rico Commonwealth Public Improvement Refunding Bond Series A (Tax Revenue, National Insured) | | | 5.50 | | | | 7-1-2016 | | | | 985,000 | | | | 985,099 | |
The accompanying notes are an integral part of these financial statements.
| | | | |
| 10 | | Wells Fargo Wisconsin Tax-Free Fund | | Portfolio of investments—June 30, 2016 |
| | | | | | | | | | | | | | | | |
| Security name | | Interest rate | | | Maturity date | | | Principal | | | Value | |
| | | | |
| Puerto Rico (continued) | | | | | | | | | | | | | | | | |
Puerto Rico Electric Power Authority Refunding Bond Series KK (Utilities Revenue, National Insured) | | | 5.50 | % | | | 7-1-2016 | | | $ | 1,000,000 | | | $ | 1,000,100 | |
Puerto Rico Electric Power Authority Refunding Bond Series LL (Utilities Revenue, National Insured) | | | 5.50 | | | | 7-1-2017 | | | | 1,000,000 | | | | 1,035,570 | |
Puerto Rico Electric Power Authority Refunding Bond Series UU (Utilities Revenue, AGM Insured) | | | 5.00 | | | | 7-1-2016 | | | | 2,255,000 | | | | 2,255,180 | |
Puerto Rico HFA Subordinated Capital Fund Modernization Refunding Bond (Housing Revenue, HUD Insured) | | | 5.50 | | | | 12-1-2018 | | | | 600,000 | | | | 654,408 | |
Puerto Rico Highway & Transportation Authority Refunding Bond Series L (Transportation Revenue, AGC Insured) | | | 5.25 | | | | 7-1-2019 | | | | 1,000,000 | | | | 1,042,510 | |
Puerto Rico Highway & Transportation Authority Refunding Bond Series L (Transportation Revenue, BHAC/FGIC Insured) | | | 5.25 | | | | 7-1-2021 | | | | 300,000 | | | | 347,127 | |
Puerto Rico Industrial Tourist Educational Medical & Environmental Control Facilities Financing Authority Hospital Auxilio Mutuo Obligated Group Series A (Health Revenue) | | | 5.00 | | | | 7-1-2018 | | | | 1,375,000 | | | | 1,429,973 | |
Puerto Rico Industrial Tourist Educational Medical & Environmental Control Facilities Financing Authority Hospital Auxilio Mutuo Obligated Group Series A (Health Revenue) | | | 5.00 | | | | 7-1-2019 | | | | 1,500,000 | | | | 1,588,185 | |
Puerto Rico Industrial Tourist Educational Medical & Environmental Control Facilities Financing Authority Hospital De La Concepcion Series A (Health Revenue) | | | 6.50 | | | | 11-15-2020 | | | | 25,000 | | | | 25,489 | |
Puerto Rico Industrial Tourist Educational Medical & Environmental Control Facilities Financing Authority Polytechnic University of Puerto Rico Series A (Education Revenue, ACA Insured) | | | 5.25 | | | | 8-1-2016 | | | | 1,060,000 | | | | 1,062,237 | |
Puerto Rico Municipal Finance Authority Series C (Tobacco Revenue, BHAC/FGIC Insured) | | | 5.50 | | | | 7-1-2020 | | | | 3,000,000 | | | | 3,414,390 | |
Puerto Rico Public Finance Corporation Commonwealth Appropriation Bond Series B (Miscellaneous Revenue, Government Development Bank for Puerto Rico SPA) (s) | | | 5.50 | | | | 8-1-2031 | | | | 250,000 | | | | 28,750 | |
| | | | |
| | | | | | | | | | | | | | | 16,404,187 | |
| | | | | | | | | | | | | | | | |
| | | | |
| Virgin Islands: 9.19% | | | | | | | | | | | | | | | | |
Virgin Islands PFA (Miscellaneous Revenue) 144A | | | 3.00 | | | | 9-1-2016 | | | | 965,000 | | | | 968,513 | |
Virgin Islands PFA (Miscellaneous Revenue) 144A | | | 5.00 | | | | 9-1-2020 | | | | 750,000 | | | | 854,378 | |
Virgin Islands PFA Gross Receipts Series C (Tax Revenue) | | | 5.00 | | | | 10-1-2017 | | | | 2,240,000 | | | | 2,341,181 | |
Virgin Islands PFA Gross Receipts Taxes Loan Notes (Tax Revenue, National Insured) | | | 4.00 | | | | 10-1-2020 | | | | 450,000 | | | | 454,001 | |
Virgin Islands PFA Gross Receipts Taxes Loan Notes (Tax Revenue, AGM Insured) | | | 4.00 | | | | 10-1-2022 | | | | 3,000,000 | | | | 3,202,500 | |
Virgin Islands PFA Gross Receipts Taxes Loan Notes (Tax Revenue, National Insured) | | | 5.00 | | | | 10-1-2016 | | | | 250,000 | | | | 252,440 | |
Virgin Islands PFA Matching Fund Loan Notes Senior Lien Series B (Miscellaneous Revenue, AGM Insured) | | | 5.00 | | | | 10-1-2025 | | | | 2,000,000 | | | | 2,255,380 | |
Virgin Islands PFA Series A (Tax Revenue) | | | 5.00 | | | | 10-1-2018 | | | | 5,165,000 | | | | 5,411,319 | |
Virgin Islands PFA Unrefunded Balance Series A (Miscellaneous Revenue) | | | 7.30 | | | | 10-1-2018 | | | | 10,000 | | | | 10,794 | |
| | | | |
| | | | | | | | | | | | | | | 15,750,506 | |
| | | | | | | | | | | | | | | | |
| | | | |
| Wisconsin: 63.51% | | | | | | | | | | | | | | | | |
Appleton WI RDA Fox Cities Performing Arts Center Project (Tax Revenue) | | | 1.75 | | | | 9-1-2016 | | | | 415,000 | | | | 415,365 | |
Blue Mounds WI CDA Series A (Miscellaneous Revenue) | | | 1.25 | | | | 4-1-2017 | | | | 50,000 | | | | 50,167 | |
Brookfield WI Community Development & Redevelopment Authority Series A (Miscellaneous Revenue) | | | 1.15 | | | | 6-1-2018 | | | | 550,000 | | | | 553,234 | |
Brookfield WI Community Development & Redevelopment Authority Series A (Miscellaneous Revenue) | | | 1.35 | | | | 6-1-2019 | | | | 750,000 | | | | 758,348 | |
Cudahy WI CDA Series A (Miscellaneous Revenue) | | | 1.20 | | | | 6-1-2017 | | | | 170,000 | | | | 170,716 | |
Cudahy WI CDA Series A (Miscellaneous Revenue) | | | 1.50 | | | | 6-1-2018 | | | | 200,000 | | | | 201,176 | |
The accompanying notes are an integral part of these financial statements.
| | | | | | |
| Portfolio of investments—June 30, 2016 | | Wells Fargo Wisconsin Tax-Free Fund | | | 11 | |
| | | | | | | | | | | | | | | | |
| Security name | | Interest rate | | | Maturity date | | | Principal | | | Value | |
| | | | |
| Wisconsin (continued) | | | | | | | | | | | | | | | | |
Cudahy WI CDA Series C (Miscellaneous Revenue) | | | 0.70 | % | | | 6-1-2017 | | | $ | 250,000 | | | $ | 250,208 | |
Cudahy WI CDA Series C (Miscellaneous Revenue) | | | 0.90 | | | | 6-1-2018 | | | | 200,000 | | | | 200,410 | |
Cudahy WI CDA Series C (Miscellaneous Revenue) | | | 1.05 | | | | 6-1-2019 | | | | 125,000 | | | | 125,469 | |
Glendale WI CDA Bayshore Public Parking (Miscellaneous Revenue) | | | 1.50 | | | | 10-1-2019 | | | | 300,000 | | | | 305,271 | |
Glendale WI CDA Series A (Miscellaneous Revenue) | | | 3.50 | | | | 10-1-2017 | | | | 1,635,000 | | | | 1,686,372 | |
Glendale WI CDA Series A (Miscellaneous Revenue) | | | 3.50 | | | | 10-1-2018 | | | | 1,700,000 | | | | 1,792,276 | |
Green Bay WI Housing Authority University Village Housing Incorporated (Education Revenue) | | | 4.38 | | | | 4-1-2022 | | | | 200,000 | | | | 215,144 | |
Green Bay WI Housing Authority University Village Housing Incorporated (Education Revenue) | | | 5.00 | | | | 4-1-2030 | | | | 1,410,000 | | | | 1,567,018 | |
Green Bay WI RDA Bellin Memorial Hospital Incorporated (Health Revenue) | | | 5.50 | | | | 12-1-2023 | | | | 250,000 | | | | 279,090 | |
Green Bay WI RDA Bellin Memorial Hospital Incorporated (Health Revenue) | | | 5.65 | | | | 12-1-2026 | | | | 100,000 | | | | 111,996 | |
Green Bay WI RDA Bellin Memorial Hospital Incorporated (Health Revenue) | | | 6.00 | | | | 12-1-2029 | | | | 260,000 | | | | 293,376 | |
Green Bay WI RDA Bellin Memorial Hospital Incorporated (Health Revenue) | | | 6.15 | | | | 12-1-2032 | | | | 420,000 | | | | 475,427 | |
Greenfield WI CDA Layton Terrace Project (Housing Revenue) ± | | | 4.75 | | | | 9-1-2033 | | | | 500,000 | | | | 500,910 | |
Jackson WI CDA Kettle Moraine Lutheran High School Federation Incorporated (Education Revenue, FHLB LOC) ø | | | 0.44 | | | | 12-31-2036 | | | | 1,210,000 | | | | 1,210,000 | |
Kaukauna WI RDA (Miscellaneous Revenue) | | | 3.75 | | | | 6-1-2032 | | | | 850,000 | | | | 929,059 | |
Kaukauna WI RDA (Miscellaneous Revenue) | | | 4.00 | | | | 6-1-2019 | | | | 50,000 | | | | 54,237 | |
Kaukauna WI RDA (Miscellaneous Revenue) | | | 4.00 | | | | 6-1-2020 | | | | 100,000 | | | | 110,620 | |
Kaukauna WI RDA (Miscellaneous Revenue) | | | 4.00 | | | | 6-1-2021 | | | | 310,000 | | | | 347,529 | |
Kaukauna WI RDA (Miscellaneous Revenue) | | | 4.00 | | | | 6-1-2022 | | | | 235,000 | | | | 266,626 | |
Kaukauna WI RDA (Miscellaneous Revenue) | | | 4.00 | | | | 6-1-2023 | | | | 200,000 | | | | 229,522 | |
Kaukauna WI RDA (Miscellaneous Revenue) | | | 4.00 | | | | 6-1-2025 | | | | 425,000 | | | | 500,833 | |
Kaukauna WI RDA (Miscellaneous Revenue) | | | 4.00 | | | | 6-1-2028 | | | | 425,000 | | | | 489,060 | |
Kaukauna WI RDA (Miscellaneous Revenue) | | | 4.00 | | | | 6-1-2035 | | | | 900,000 | | | | 983,961 | |
Little Chute WI CDA (Miscellaneous Revenue) | | | 4.25 | | | | 3-1-2017 | | | | 200,000 | | | | 200,418 | |
Little Chute WI CDA (Miscellaneous Revenue) | | | 4.35 | | | | 3-1-2018 | | | | 200,000 | | | | 200,428 | |
Madison WI CDA Monticello Apartments (Housing Revenue, BMO Harris Bank NA LOC) ø | | | 0.44 | | | | 4-1-2023 | | | | 730,000 | | | | 730,000 | |
Madison WI CDA Wisconsin Alumni Research Foundation (Education Revenue) | | | 5.00 | | | | 10-1-2023 | | | | 150,000 | | | | 169,553 | |
Madison WI CDA Wisconsin Alumni Research Foundation (Education Revenue) | | | 5.00 | | | | 10-1-2025 | | | | 475,000 | | | | 536,266 | |
Madison WI CDA Wisconsin Alumni Research Foundation (Education Revenue) | | | 5.00 | | | | 10-1-2039 | | | | 5,000,000 | | | | 5,651,350 | |
Milwaukee WI RDA Neighborhood Schools Series A (Miscellaneous Revenue, Ambac Insured) | | | 3.85 | | | | 8-1-2020 | | | | 200,000 | | | | 206,118 | |
Milwaukee WI RDA Neighborhood Schools Series A (Miscellaneous Revenue, Ambac Insured) | | | 3.90 | | | | 8-1-2021 | | | | 405,000 | | | | 416,850 | |
Milwaukee WI RDA Public Schools Series A (Miscellaneous Revenue, Ambac Insured) | | | 4.00 | | | | 8-1-2023 | | | | 300,000 | | | | 308,124 | |
Milwaukee WI RDA Public Schools Series A (Miscellaneous Revenue) | | | 5.00 | | | | 8-1-2019 | | | | 915,000 | | | | 1,024,260 | |
Milwaukee WI RDA Public Schools Series A (Miscellaneous Revenue) | | | 5.00 | | | | 8-1-2020 | | | | 3,100,000 | | | | 3,564,070 | |
Milwaukee WI RDA Public Schools Series A (Miscellaneous Revenue) | | | 5.00 | | | | 8-1-2021 | | | | 3,330,000 | | | | 3,914,382 | |
Milwaukee WI RDA Science Education Consortium Incorporated Project Series A (Education Revenue) | | | 6.25 | | | | 8-1-2043 | | | | 2,100,000 | | | | 2,422,560 | |
Milwaukee WI RDA Summer Festival Project (Miscellaneous Revenue) | | | 3.15 | | | | 8-1-2017 | | | | 50,000 | | | | 51,245 | |
Milwaukee WI RDA Summer Festival Project (Miscellaneous Revenue) | | | 4.60 | | | | 8-1-2024 | | | | 870,000 | | | | 947,543 | |
Milwaukee WI RDA Summer Festival Project (Miscellaneous Revenue) | | | 5.00 | | | | 8-1-2030 | | | | 3,000,000 | | | | 3,330,360 | |
Milwaukee WI RDA University of Wisconsin Kenilworth Project Series 2005 (Education Revenue, U.S. Bank NA LOC) ø | | | 0.44 | | | | 9-1-2040 | | | | 4,000,000 | | | | 4,000,000 | |
Milwaukee WI RDA Wisconsin Housing Preservation Corporation (Housing Revenue, Johnson Bank LOC) ø | | | 1.25 | | | | 12-1-2038 | | | | 2,155,000 | | | | 2,155,000 | |
Milwaukee WI Series B6 (GO Revenue) | | | 2.00 | | | | 4-1-2021 | | | | 175,000 | | | | 182,565 | |
The accompanying notes are an integral part of these financial statements.
| | | | |
| 12 | | Wells Fargo Wisconsin Tax-Free Fund | | Portfolio of investments—June 30, 2016 |
| | | | | | | | | | | | | | | | |
| Security name | | Interest rate | | | Maturity date | | | Principal | | | Value | |
| | | | |
| Wisconsin (continued) | | | | | | | | | | | | | | | | |
Milwaukee WI Series B6 (GO Revenue) | | | 3.00 | % | | | 4-1-2024 | | | $ | 570,000 | | | $ | 635,556 | |
Milwaukee WI Series B6 (GO Revenue) | | | 5.00 | | | | 4-1-2022 | | | | 350,000 | | | | 423,066 | |
Milwaukee WI Series B6 (GO Revenue) | | | 5.00 | | | | 4-1-2023 | | | | 580,000 | | | | 717,356 | |
Milwaukee WI Series B6 (GO Revenue) | | | 5.00 | | | | 4-1-2025 | | | | 550,000 | | | | 706,173 | |
Monroe WI RDA Monroe Clinic Incorporated (Health Revenue) | | | 5.50 | | | | 2-15-2029 | | | | 1,000,000 | | | | 1,101,880 | |
Monroe WI RDA Monroe Clinic Incorporated (Health Revenue) | | | 5.88 | | | | 2-15-2039 | | | | 1,570,000 | | | | 1,733,704 | |
North Fond Du Lac WI CDA (Miscellaneous Revenue) | | | 0.85 | | | | 12-1-2016 | | | | 150,000 | | | | 149,979 | |
North Fond Du Lac WI CDA (Miscellaneous Revenue) | | | 1.30 | | | | 12-1-2017 | | | | 50,000 | | | | 50,165 | |
North Fond Du Lac WI CDA (Miscellaneous Revenue) | | | 1.70 | | | | 12-1-2018 | | | | 50,000 | | | | 50,430 | |
Oostburg WI CDA Series A (Miscellaneous Revenue) | | | 1.75 | | | | 5-1-2018 | | | | 50,000 | | | | 50,541 | |
Pittsville WI CDA Series A (Miscellaneous Revenue) | | | 1.65 | | | | 6-1-2017 | | | | 100,000 | | | | 100,278 | |
Platteville WI RDA University of Wisconsin Platteville Real Estate (Education Revenue) | | | 5.00 | | | | 7-1-2022 | | | | 1,000,000 | | | | 1,116,100 | |
Prairie du Chien WI RDA Series B (Miscellaneous Revenue) | | | 1.65 | | | | 9-1-2020 | | | | 200,000 | | | | 205,366 | |
Racine WI Elderly Housing Authority Wisconsin Housing Preservation Corporation (Housing Revenue, Johnson Bank LOC) ø | | | 1.25 | | | | 10-1-2042 | | | | 1,420,000 | | | | 1,420,000 | |
Residual Interest Bonds Floater Trust Various States Series 2WE (Miscellaneous Revenue, Barclays Bank plc LOC) 144Aø | | | 0.58 | | | | 5-1-2018 | | | | 3,950,000 | | | | 3,950,000 | |
Saukville Village WI CDA Calibre Incorporated Project (Industrial Development Revenue, BMO Harris Bank NA LOC) ø | | | 0.64 | | | | 9-1-2029 | | | | 605,000 | | | | 605,000 | |
Southeast Wisconsin Professional Baseball Park District Series A (Tax Revenue, National Insured) | | | 5.50 | | | | 12-15-2017 | | | | 1,765,000 | | | | 1,885,055 | |
Southeast Wisconsin Professional Baseball Park District Series A (Tax Revenue, National Insured) | | | 5.50 | | | | 12-15-2018 | | | | 380,000 | | | | 424,107 | |
Southeast Wisconsin Professional Baseball Park District Series A (Tax Revenue, National Insured) | | | 5.50 | | | | 12-15-2019 | | | | 100,000 | | | | 115,570 | |
Southeast Wisconsin Professional Baseball Park District Series A (Tax Revenue, National Insured) | | | 5.50 | | | | 12-15-2021 | | | | 2,000,000 | | | | 2,462,760 | |
Southeast Wisconsin Professional Baseball Park District Series A (Tax Revenue, National Insured) | | | 5.50 | | | | 12-15-2023 | | | | 1,600,000 | | | | 2,034,928 | |
Southeast Wisconsin Professional Baseball Park District Series A (Tax Revenue, National Insured) | | | 5.50 | | | | 12-15-2026 | | | | 2,435,000 | | | | 3,107,279 | |
Sturgeon Bay WI Waterfront RDA Series A (Miscellaneous Revenue) | | | 4.35 | | | | 10-1-2018 | | | | 150,000 | | | | 151,161 | |
Sun Prairie WI CDA Tax Incremental #6 & 7 (Miscellaneous Revenue) | | | 3.80 | | | | 2-1-2018 | | | | 300,000 | | | | 304,503 | |
Sun Prairie WI CDA Tax Incremental #6 & 7 (Miscellaneous Revenue) | | | 4.00 | | | | 2-1-2019 | | | | 220,000 | | | | 223,276 | |
Sun Prairie WI CDA Tax Incremental #6 & 7 (Miscellaneous Revenue) | | | 4.50 | | | | 2-1-2022 | | | | 250,000 | | | | 253,773 | |
Verona WI CDA Public Improvements (Miscellaneous Revenue) | | | 5.38 | | | | 12-1-2022 | | | | 830,000 | | | | 832,216 | |
Warrens WI CDA Economic Improvements (Miscellaneous Revenue) | | | 5.10 | | | | 11-1-2020 | | | | 70,000 | | | | 54,445 | |
Warrens WI CDA Interim Workout Extension (Tax Revenue) | | | 3.70 | | | | 11-1-2029 | | | | 214,392 | | | | 109,441 | |
Warrens WI CDA Public Improvements (Miscellaneous Revenue) | | | 5.00 | | | | 11-1-2016 | | | | 70,000 | | | | 68,943 | |
Waukesha WI Housing Authority Preservation Corporation Project (Housing Revenue, Johnson Bank LOC) ø | | | 1.25 | | | | 12-1-2042 | | | | 1,950,000 | | | | 1,950,000 | |
Waukesha WI RDA Welldall Manufacturing Incorporated Project (Industrial Development Revenue, U.S. Bank NA LOC) | | | 2.30 | | | | 12-1-2016 | | | | 135,000 | | | | 135,930 | |
Waukesha WI RDA Welldall Manufacturing Incorporated Project (Industrial Development Revenue, U.S. Bank NA LOC) | | | 2.65 | | | | 12-1-2017 | | | | 335,000 | | | | 343,891 | |
Waukesha WI RDA Welldall Manufacturing Incorporated Project (Industrial Development Revenue, U.S. Bank NA LOC) | | | 4.00 | | | | 12-1-2023 | | | | 150,000 | | | | 160,682 | |
Waukesha WI RDA Welldall Manufacturing Incorporated Project (Industrial Development Revenue, U.S. Bank NA LOC) | | | 4.20 | | | | 12-1-2024 | | | | 150,000 | | | | 161,420 | |
Waukesha WI RDA Welldall Manufacturing Incorporated Project (Industrial Development Revenue, U.S. Bank NA LOC) | | | 4.25 | | | | 12-1-2025 | | | | 250,000 | | | | 268,795 | |
The accompanying notes are an integral part of these financial statements.
| | | | | | |
| Portfolio of investments—June 30, 2016 | | Wells Fargo Wisconsin Tax-Free Fund | | | 13 | |
| | | | | | | | | | | | | | | | |
| Security name | | Interest rate | | | Maturity date | | | Principal | | | Value | |
| | | | |
| Wisconsin (continued) | | | | | | | | | | | | | | | | |
Wauwatosa WI Housing Authority Hart Park Square Project (Health Revenue, BMO Harris Bank NA LOC) ø | | | 0.64 | % | | | 3-1-2034 | | | $ | 260,000 | | | $ | 260,000 | |
Weston WI CDA Series A (Miscellaneous Revenue) | | | 5.25 | | | | 10-1-2020 | | | | 720,000 | | | | 722,225 | |
Wisconsin Center District CAB (Tax Revenue, National Insured) ¤ | | | 0.00 | | | | 12-15-2019 | | | | 175,000 | | | | 166,087 | |
Wisconsin Center District CAB (Tax Revenue, AGM Insured) ¤ | | | 0.00 | | | | 12-15-2030 | | | | 295,000 | | | | 210,739 | |
Wisconsin Center District Junior Dedicated Bond (Tax Revenue, AGM Insured) | | | 5.25 | | | | 12-15-2018 | | | | 65,000 | | | | 71,980 | |
Wisconsin Center District Junior Dedicated Bond (Tax Revenue, AGM Insured) | | | 5.25 | | | | 12-15-2019 | | | | 2,000,000 | | | | 2,292,960 | |
Wisconsin Center District Junior Dedicated Bond (Tax Revenue, AGM Insured) | | | 5.25 | | | | 12-15-2023 | | | | 2,150,000 | | | | 2,603,779 | |
Wisconsin Center District Junior Dedicated Bond (Tax Revenue, AGM Insured) | | | 5.25 | | | | 12-15-2027 | | | | 1,005,000 | | | | 1,248,019 | |
Wisconsin Center District Junior Dedicated Bond Series A (Tax Revenue) | | | 5.00 | | | | 12-15-2022 | | | | 730,000 | | | | 848,297 | |
Wisconsin Center District Junior Dedicated Bond Series A (Tax Revenue) | | | 5.00 | | | | 12-15-2030 | | | | 2,100,000 | | | | 2,437,155 | |
Wisconsin Center District Milwaukee Arena Project (Tax Revenue) | | | 4.00 | | | | 12-15-2032 | | | | 1,100,000 | | | | 1,252,977 | |
Wisconsin Center District Milwaukee Arena Project (Tax Revenue) | | | 4.00 | | | | 12-15-2033 | | | | 920,000 | | | | 1,046,196 | |
Wisconsin Center District Milwaukee Arena Project (Tax Revenue) | | | 4.00 | | | | 12-15-2034 | | | | 2,000,000 | | | | 2,264,880 | |
Wisconsin Dells CDA (Miscellaneous Revenue) | | | 4.60 | | | | 3-1-2025 | | | | 175,000 | | | | 175,385 | |
Wisconsin HEFA Bellin Memorial Hospital Obligated Group (Health Revenue) | | | 3.00 | | | | 12-1-2019 | | | | 1,475,000 | | | | 1,560,358 | |
Wisconsin HEFA Bellin Memorial Hospital Obligated Group (Health Revenue) | | | 4.00 | | | | 12-1-2035 | | | | 1,000,000 | | | | 1,089,140 | |
Wisconsin HEFA Bellin Memorial Hospital Obligated Group (Health Revenue) | | | 5.00 | | | | 12-1-2025 | | | | 1,500,000 | | | | 1,848,525 | |
Wisconsin HEFA Bellin Memorial Hospital Obligated Group (Health Revenue) | | | 5.00 | | | | 12-1-2026 | | | | 1,740,000 | | | | 2,130,038 | |
Wisconsin HEFA Bellin Memorial Hospital Obligated Group (Health Revenue, Ambac Insured) | | | 5.50 | | | | 2-15-2019 | | | | 35,000 | | | | 36,584 | |
Wisconsin HEFA Rogers Memorial Hospital Incorporated Series B (Health Revenue) | | | 5.00 | | | | 7-1-2044 | | | | 3,250,000 | | | | 3,729,310 | |
Wisconsin Housing & EDA (Housing Revenue, FHA Insured) | | | 6.10 | | | | 6-1-2021 | | | | 60,000 | | | | 64,639 | |
Wisconsin Housing & EDA AMT Series A (Housing Revenue) | | | 4.63 | | | | 11-1-2037 | | | | 25,000 | | | | 25,027 | |
Wisconsin Housing & EDA AMT Series A (Housing Revenue) | | | 4.75 | | | | 5-1-2037 | | | | 265,000 | | | | 265,318 | |
Wisconsin Housing & EDA MFHR Series A (Industrial Development Revenue) ± | | | 4.25 | | | | 12-1-2035 | | | | 1,960,000 | | | | 1,964,841 | |
Wisconsin Housing & EDA President House Project (Housing Revenue, Associated Trust Company NA LOC) ø | | | 0.54 | | | | 8-1-2046 | | | | 1,725,000 | | | | 1,725,000 | |
Wisconsin Housing & EDA Series A (Housing Revenue) | | | 0.55 | | | | 12-1-2016 | | | | 50,000 | | | | 49,987 | |
Wisconsin Housing & EDA Series A (Housing Revenue) | | | 0.80 | | | | 6-1-2017 | | | | 50,000 | | | | 50,050 | |
Wisconsin Housing & EDA Series A (Housing Revenue) | | | 0.90 | | | | 12-1-2017 | | | | 50,000 | | | | 50,129 | |
Wisconsin Housing & EDA Series A (Housing Revenue) | | | 1.15 | | | | 6-1-2018 | | | | 55,000 | | | | 55,342 | |
Wisconsin Housing & EDA Series A (Housing Revenue) | | | 1.25 | | | | 12-1-2018 | | | | 55,000 | | | | 55,519 | |
Wisconsin Housing & EDA Series A (Housing Revenue) | | | 1.55 | | | | 12-1-2019 | | | | 55,000 | | | | 56,008 | |
Wisconsin Housing & EDA Series A (Housing Revenue) | | | 1.95 | | | | 12-1-2020 | | | | 55,000 | | | | 56,626 | |
Wisconsin Housing & EDA Series A (Housing Revenue) | | | 3.00 | | | | 5-1-2022 | | | | 100,000 | | | | 106,907 | |
Wisconsin Housing & EDA Series A (Housing Revenue) | | | 3.00 | | | | 11-1-2022 | | | | 125,000 | | | | 134,290 | |
Wisconsin Housing & EDA Series A (Housing Revenue) | | | 4.05 | | | | 12-1-2049 | | | | 800,000 | | | | 859,344 | |
Wisconsin Housing & EDA Series A (Housing Revenue) | | | 5.75 | | | | 11-1-2043 | | | | 3,355,000 | | | | 3,637,390 | |
Wisconsin Oneida Tribe of Indians (Tax Revenue) 144A | | | 5.50 | | | | 2-1-2021 | | | | 515,000 | | | | 572,432 | |
| | | | |
| | | | | | | | | | | | | | | 108,871,764 | |
| | | | | | | | | | | | | | | | |
| |
Total Municipal Obligations (Cost $161,524,719) | | | | 169,452,580 | |
| | | | | | | | | | | | | | | | |
| | | | | | | | |
| Total investments in securities (Cost $161,524,719) * | | | 98.85 | % | | | 169,452,580 | |
Other assets and liabilities, net | | | 1.15 | | | | 1,976,043 | |
| | | | | | | | |
| Total net assets | | | 100.00 | % | | $ | 171,428,623 | |
| | | | | | | | |
The accompanying notes are an integral part of these financial statements.
| | | | |
| 14 | | Wells Fargo Wisconsin Tax-Free Fund | | Portfolio of investments—June 30, 2016 |
| ¤ | The security is issued in zero coupon form with no periodic interest payments. |
| (s) | The security is currently in default with regards to scheduled interest and/or principal payments. The Fund has stopped accruing interest on the security. |
| 144A | The security may be resold in transactions exempt from registration, normally to qualified institutional buyers, pursuant to Rule 144A under the Securities Act of 1933. |
| ± | Variable rate investment. The rate shown is the rate in effect at period end. |
| ø | Variable rate demand notes are subject to a demand feature which reduces the effective maturity. The maturity date shown represents the final maturity date of the security. The interest rate is determined and reset by the issuer daily, weekly, or monthly depending upon the terms of the security. The rate shown is the rate in effect at period end. |
| * | Cost for federal income tax purposes is $161,522,255 and unrealized gains (losses) consists of: |
| | | | |
Gross unrealized gains | | $ | 8,063,628 | |
Gross unrealized losses | |
| (133,303
| )
|
| | | | |
Net unrealized gains | | $ | 7,930,325 | |
The accompanying notes are an integral part of these financial statements.
| | | | | | |
| Statement of assets and liabilities—June 30, 2016 | | Wells Fargo Wisconsin Tax-Free Fund | | | 15 | |
| | | | |
| | | | |
| |
Assets | | | | |
Investments in unaffiliated securities, at value (cost: $161,524,719) | | $ | 169,452,580 | |
Cash | | | 509,216 | |
Receivable for investments sold | | | 50,000 | |
Receivable for Fund shares sold | | | 182,706 | |
Receivable for interest | | | 1,686,491 | |
Prepaid expenses and other assets | | | 21,891 | |
| | | | |
Total assets | | | 171,902,884 | |
| | | | |
| |
Liabilities | | | | |
Dividends payable | | | 29,617 | |
Payable for investments purchased | | | 227,127 | |
Payable for Fund shares redeemed | | | 119,853 | |
Management fee payable | | | 17,776 | |
Distribution fee payable | | | 6,719 | |
Administration fees payable | | | 22,299 | |
Shareholder servicing fees payable | | | 34,842 | |
Accrued expenses and other liabilities | | | 16,028 | |
| | | | |
Total liabilities | | | 474,261 | |
| | | | |
Total net assets | | $ | 171,428,623 | |
| | | | |
| |
NET ASSETS CONSIST OF | | | | |
Paid-in capital | | $ | 163,355,975 | |
Overdistributed net investment income | | | (10,499 | ) |
Accumulated net realized gains on investments | | | 155,286 | |
Net unrealized gains on investments | | | 7,927,861 | |
| | | | |
Total net assets | | $ | 171,428,623 | |
| | | | |
| |
COMPUTATION OF NET ASSET VALUE AND OFFERING PRICE PER SHARE | | | | |
Net assets – Class A | | $ | 160,479,907 | |
Shares outstanding – Class A1 | | | 14,376,402 | |
Net asset value per share – Class A | | | $11.16 | |
Maximum offering price per share – Class A2 | | | $11.69 | |
Net assets – Class C | | $ | 10,948,716 | |
Shares outstanding – Class C1 | | | 980,871 | |
Net asset value per share – Class C | | | $11.16 | |
| 1 | The Fund has an unlimited number of authorized shares. |
| 2 | Maximum offering price is computed as 100/95.50 of net asset value. On investments of $50,000 or more, the offering price is reduced. |
The accompanying notes are an integral part of these financial statements.
| | | | |
| 16 | | Wells Fargo Wisconsin Tax-Free Fund | | Statement of operations—year ended June 30, 2016 |
| | | | |
| | | | |
| |
Investment income | | | | |
Interest | | $ | 4,856,530 | |
| | | | |
| |
Expenses | | | | |
Management fee | | | 653,298 | |
Administration fees | | | | |
Class A | | | 180,289 | |
Class C | | | 17,257 | |
Investor Class | | | 75,732 | 1 |
Shareholder servicing fees | | | | |
Class A | | | 281,156 | |
Class C | | | 26,963 | |
Investor Class | | | 99,647 | 1 |
Distribution fee | | | | |
Class C | | | 80,890 | |
Custody and accounting fees | | | 9,728 | |
Professional fees | | | 45,168 | |
Registration fees | | | 61,380 | |
Shareholder report expenses | | | 45,269 | |
Trustees’ fees and expenses | | | 27,819 | |
Other fees and expenses | | | 7,557 | |
| | | | |
Total expenses | | | 1,612,153 | |
Less: Fee waivers and/or expense reimbursements | | | (376,034 | ) |
| | | | |
Net expenses | | | 1,236,119 | |
| | | | |
Net investment income | | | 3,620,411 | |
| | | | |
| |
REALIZED AND UNREALIZED GAINS (LOSSES) ON INVESTMENTS | | | | |
Net realized gains on investments | | | 196,798 | |
Net change in unrealized gains (losses) on investments | | | 4,774,120 | |
| | | | |
Net realized and unrealized gains (losses) on investments | | | 4,970,918 | |
| | | | |
Net increase in net assets resulting from operations | | $ | 8,591,329 | |
| | | | |
| 1 | For the period from July 1, 2015 to October 23, 2015. Effective at the close of business on October 23, 2015, Investor Class shares were converted to Class A shares and are no longer offered by the Fund. |
The accompanying notes are an integral part of these financial statements.
| | | | | | |
| Statement of changes in net assets | | Wells Fargo Wisconsin Tax-Free Fund | | | 17 | |
| | | | | | | | | | | | | | | | |
| | | Year ended
June 30, 2016 | | | Year ended
June 30, 2015 | |
| | | | |
Operations | | | | | | | | | | | | | | | | |
Net investment income | | | | | | $ | 3,620,411 | | | | | | | $ | 3,238,956 | |
Net realized gains on investments | | | | | | | 196,798 | | | | | | | | 1,138,977 | |
Net change in unrealized gains (losses) on investments | | | | | | | 4,774,120 | | | | | | | | (1,520,636 | ) |
| | | | |
Net increase in net assets resulting from operations | | | | | | | 8,591,329 | | | | | | | | 2,857,297 | |
| | | | |
| | | | |
Distributions to shareholders from | | | | | | | | | | | | | | | | |
Net investment income | | | | | | | | | | | | | | | | |
Class A | | | | | | | (2,546,869 | ) | | | | | | | (476,833 | ) |
Class C | | | | | | | (164,380 | ) | | | | | | | (156,636 | ) |
Investor Class | | | | | | | (909,162 | )1 | | | | | | | (2,605,288 | ) |
Net realized gains | | | | | | | | | | | | | | | | |
Class A | | | | | | | (46,148 | ) | | | | | | | (213,581 | ) |
Class C | | | | | | | (3,206 | ) | | | | | | | (108,604 | ) |
Investor Class | | | | | | | 0 | 1 | | | | | | | (1,168,572 | ) |
| | | | |
Total distributions to shareholders | | | | | | | (3,669,765 | ) | | | | | | | (4,729,514 | ) |
| | | | |
| | | | |
Capital share transactions | | | Shares | | | | | | | | Shares | | | | | |
Proceeds from shares sold | | | | | | | | | | | | | | | | |
Class A | | | 14,703,085 | | | | 160,926,790 | | | | 654,328 | | | | 7,170,002 | |
Class C | | | 130,742 | | | | 1,437,094 | | | | 165,504 | | | | 1,815,037 | |
Investor Class | | | 505,794 | 1 | | | 5,498,632 | 1 | | | 2,709,500 | | | | 29,751,822 | |
| | | | |
| | | | | | | 167,862,516 | | | | | | | | 38,736,861 | |
| | | | |
Reinvestment of distributions | | | | | | | | | | | | | | | | |
Class A | | | 211,387 | | | | 2,330,732 | | | | 56,852 | | | | 622,960 | |
Class C | | | 15,074 | | | | 165,617 | | | | 23,730 | | | | 259,991 | |
Investor Class | | | 59,864 | 1 | | | 650,999 | 1 | | | 316,401 | | | | 3,467,290 | |
| | | | |
| | | | | | | 3,147,348 | | | | | | | | 4,350,241 | |
| | | | |
Payment for shares redeemed | | | | | | | | | | | | | | | | |
Class A | | | (2,737,029 | ) | | | (30,185,352 | ) | | | (321,379 | ) | | | (3,523,390 | ) |
Class C | | | (173,105 | ) | | | (1,899,783 | ) | | | (132,955 | ) | | | (1,456,383 | ) |
Investor Class | | | (12,142,203 | )1 | | | (132,592,719 | )1 | | | (1,737,420 | ) | | | (19,058,958 | ) |
| | | | |
| | | | | | | (164,677,854 | ) | | | | | | | (24,038,731 | ) |
| | | | |
Net increase in net assets resulting from capital share transactions | | | | | | | 6,332,010 | | | | | | | | 19,048,371 | |
| | | | |
Total increase in net assets | | | | | | | 11,253,574 | | | | | | | | 17,176,154 | |
| | | | |
| | | | |
Net assets | | | | | | | | | | | | | | | | |
Beginning of period | | | | | | | 160,175,049 | | | | | | | | 142,998,895 | |
| | | | |
End of period | | | | | | $ | 171,428,623 | | | | | | | $ | 160,175,049 | |
| | | | |
Overdistributed net investment income | | | | | | $ | (10,499 | ) | | | | | | $ | (10,499 | ) |
| | | | |
| 1 | For the period from July 1, 2015 to October 23, 2015. Effective at the close of business on October 23, 2015, Investor Class shares were converted to Class A shares and are no longer offered by the Fund. |
The accompanying notes are an integral part of these financial statements.
| | | | |
| 18 | | Wells Fargo Wisconsin Tax-Free Fund | | Financial highlights |
(For a share outstanding throughout each period)
| | | | | | | | | | | | | | | | | | | | |
| | | Year ended June 30 | |
| CLASS A | | 2016 | | | 2015 | | | 2014 | | | 2013 | | | 2012 | |
Net asset value, beginning of period | | | $10.83 | | | | $10.96 | | | | $10.86 | | | | $11.09 | | | | $10.68 | |
Net investment income | | | 0.25 | | | | 0.24 | | | | 0.33 | | | | 0.27 | | | | 0.34 | |
Net realized and unrealized gains (losses) on investments | | | 0.33 | | | | (0.02 | ) | | | 0.18 | | | | (0.22 | ) | | | 0.42 | |
| | | | | | | | | | | | | | | | | | | | |
Total from investment operations | | | 0.58 | | | | 0.22 | | | | 0.51 | | | | 0.05 | | | | 0.76 | |
Distributions to shareholders from | | | | | | | | | | | | | | | | | | | | |
Net investment income | | | (0.25 | ) | | | (0.24 | ) | | | (0.33 | ) | | | (0.27 | ) | | | (0.34 | ) |
Net realized gains | | | (0.00 | )1 | | | (0.11 | ) | | | (0.08 | ) | | | (0.01 | ) | | | (0.01 | ) |
| | | | | | | | | | | | | | | | | | | | |
Total distributions to shareholders | | | (0.25 | ) | | | (0.35 | ) | | | (0.41 | ) | | | (0.28 | ) | | | (0.35 | ) |
Net asset value, end of period | | | $11.16 | | | | $10.83 | | | | $10.96 | | | | $10.86 | | | | $11.09 | |
Total return2 | | | 5.44 | % | | | 2.07 | % | | | 4.80 | % | | | 0.46 | % | | | 7.19 | % |
Ratios to average net assets (annualized) | | | | | | | | | | | | | | | | | | | | |
Gross expenses | | | 0.94 | % | | | 0.90 | % | | | 0.92 | % | | | 0.90 | % | | | 0.92 | % |
Net expenses | | | 0.70 | % | | | 0.70 | % | | | 0.70 | % | | | 0.70 | % | | | 0.70 | % |
Net investment income | | | 2.26 | % | | | 2.22 | % | | | 3.02 | % | | | 2.44 | % | | | 3.06 | % |
Supplemental data | | | | | | | | | | | | | | | | | | | | |
Portfolio turnover rate | | | 16 | % | | | 28 | % | | | 25 | % | | | 31 | % | | | 14 | % |
Net assets, end of period (000s omitted) | | | $160,480 | | | | $23,824 | | | | $19,825 | | | | $25,641 | | | | $20,844 | |
| 1 | Amount is less than $0.005 per share. |
| 2 | Total return calculations do not include any sales charges. |
The accompanying notes are an integral part of these financial statements.
| | | | | | |
| Financial highlights | | Wells Fargo Wisconsin Tax-Free Fund | | | 19 | |
(For a share outstanding throughout each period)
| | | | | | | | | | | | | | | | | | | | |
| | | Year ended June 30 | |
| CLASS C | | 2016 | | | 2015 | | | 2014 | | | 2013 | | | 2012 | |
Net asset value, beginning of period | | | $10.83 | | | | $10.96 | | | | $10.86 | | | | $11.09 | | | | $10.68 | |
Net investment income | | | 0.17 | | | | 0.16 | | | | 0.25 | | | | 0.19 | | | | 0.26 | |
Net realized and unrealized gains (losses) on investments | | | 0.33 | | | | (0.02 | ) | | | 0.18 | | | | (0.22 | ) | | | 0.42 | |
| | | | | | | | | | | | | | | | | | | | |
Total from investment operations | | | 0.50 | | | | 0.14 | | | | 0.43 | | | | (0.03 | ) | | | 0.68 | |
Distributions to shareholders from | | | | | | | | | | | | | | | | | | | | |
Net investment income | | | (0.17 | ) | | | (0.16 | ) | | | (0.25 | ) | | | (0.19 | ) | | | (0.26 | ) |
Net realized gains | | | (0.00 | )1 | | | (0.11 | ) | | | (0.08 | ) | | | (0.01 | ) | | | (0.01 | ) |
| | | | | | | | | | | | | | | | | | | | |
Total distributions to shareholders | | | (0.17 | ) | | | (0.27 | ) | | | (0.33 | ) | | | (0.20 | ) | | | (0.27 | ) |
Net asset value, end of period | | | $11.16 | | | | $10.83 | | | | $10.96 | | | | $10.86 | | | | $11.09 | |
Total return2 | | | 4.66 | % | | | 1.31 | % | | | 4.02 | % | | | (0.29 | )% | | | 6.40 | % |
Ratios to average net assets (annualized) | | | | | | | | | | | | | | | | | | | | |
Gross expenses | | | 1.68 | % | | | 1.65 | % | | | 1.67 | % | | | 1.65 | % | | | 1.67 | % |
Net expenses | | | 1.45 | % | | | 1.45 | % | | | 1.45 | % | | | 1.45 | % | | | 1.45 | % |
Net investment income | | | 1.52 | % | | | 1.47 | % | | | 2.28 | % | | | 1.69 | % | | | 2.32 | % |
Supplemental data | | | | | | | | | | | | | | | | | | | | |
Portfolio turnover rate | | | 16 | % | | | 28 | % | | | 25 | % | | | 31 | % | | | 14 | % |
Net assets, end of period (000s omitted) | | | $10,949 | | | | $10,923 | | | | $10,431 | | | | $12,094 | | | | $11,393 | |
| 1 | Amount is less than $0.005 per share. |
| 2 | Total return calculations do not include any sales charges. |
The accompanying notes are an integral part of these financial statements.
| | | | |
| 20 | | Wells Fargo Wisconsin Tax-Free Fund | | Notes to financial statements |
1. ORGANIZATION
Wells Fargo Funds Trust (the “Trust”), a Delaware statutory trust organized on March 10, 1999, is an open-end management investment company registered under the Investment Company Act of 1940, as amended (the “1940 Act”). As an investment company, the Trust follows the accounting and reporting guidance in Financial Accounting Standards Board (“FASB”) Accounting Standards Codification Topic 946, Financial Services – Investment Companies. These financial statements report on the Wells Fargo Wisconsin Tax-Free Fund (the “Fund”) which is a non-diversified series of the Trust.
Effective at the close of business on October 23, 2015, Investor Class shares became Class A shares in a tax-free conversion. Shareholders of Investor Class received Class A shares at a value equal to the value of their Investor Class shares immediately prior to the conversion. Investor Class shares are no longer offered by the Fund.
2. SIGNIFICANT ACCOUNTING POLICIES
The following significant accounting policies, which are consistently followed in the preparation of the financial statements of the Fund, are in conformity with U.S. generally accepted accounting principles which require management to make estimates and assumptions that affect the reported amounts of assets and liabilities, disclosure of contingent assets and liabilities at the date of the financial statements, and the reported amounts of revenues and expenses during the reporting period. Actual results could differ from those estimates.
Securities valuation
All investments are valued each business day as of the close of regular trading on the New York Stock Exchange (generally 4 p.m. Eastern Time), although a Fund may deviate from this calculation time under unusual or unexpected circumstances.
Debt securities are valued at the evaluated bid price provided by an independent pricing service or, if a reliable price is not available, the quoted bid price from an independent broker-dealer.
Investments which are not valued using any of the methods discussed above are valued at their fair value, as determined in good faith by the Board of Trustees of the Fund. The Board of Trustees has established a Valuation Committee comprised of the Trustees and has delegated to it the authority to take any actions regarding the valuation of portfolio securities that the Valuation Committee deems necessary or appropriate, including determining the fair value of portfolio securities, unless the determination has been delegated to the Management Valuation Team of Wells Fargo Funds Management, LLC (“Funds Management”). The Board of Trustees retains the authority to make or ratify any valuation decisions or approve any changes to the Valuation Procedures as it deems appropriate. On a quarterly basis, the Board of Trustees receives reports on any valuation actions taken by the Valuation Committee or the Management Valuation Team which may include items for ratification.
Valuations of fair valued securities are compared to the next actual sales price when available, or other appropriate market values, to assess the continued appropriateness of the fair valuation methodologies used. These securities are fair valued on a day-to-day basis, taking into consideration changes to appropriate market information and any significant changes to the inputs considered in the valuation process until there is a readily available price provided on an exchange or by an independent pricing service. Valuations received from an independent pricing service or independent broker-dealer quotes are periodically validated by comparisons to most recent trades and valuations provided by other independent pricing services in addition to the review of prices by the manager and/or subadviser. Unobservable inputs used in determining fair valuations are identified based on the type of security, taking into consideration factors utilized by market participants in valuing the investment, knowledge about the issuer and the current market environment.
When-issued transactions
The Fund may purchase securities on a forward commitment or when-issued basis. The Fund records a when-issued transaction on the trade date and will segregate assets in an amount at least equal in value to the Fund’s commitment to purchase when-issued securities. Securities purchased on a when-issued basis are marked-to-market daily and the Fund begins earning interest on the settlement date. Losses may arise due to changes in the market value of the underlying securities or if the counterparty does not perform under the contract.
Security transactions and income recognition
Securities transactions are recorded on a trade date basis. Realized gains or losses are recorded on the basis of identified cost.
Interest income is accrued daily and bond discounts are accreted and premiums are amortized daily based on the effective interest method. To the extent debt obligations are placed on non-accrual status, any related interest income
| | | | | | |
| Notes to financial statements | | Wells Fargo Wisconsin Tax-Free Fund | | | 21 | |
may be reduced by writing off interest receivables when the collection of all or a portion of interest has become doubtful based on consistently applied procedures. If the issuer subsequently resumes interest payments or when the collectability of interest is reasonably assured, the debt obligation is removed from non-accrual status.
Distributions to shareholders
Distributions to shareholders from net investment income are accrued daily and paid monthly. Distributions from net realized gains, if any, are recorded on the ex-dividend date. Such distributions are determined in conformity with federal income tax regulations, which may differ in amount or character from net investment income and realized gains recognized for purposes of U.S. generally accepted accounting principles.
Federal and other taxes
The Fund intends to continue to qualify as a regulated investment company by distributing substantially all of its investment company taxable and tax-exempt income and any net realized capital gains (after reduction for capital loss carryforwards) sufficient to relieve it from all, or substantially all, federal income taxes. Accordingly, no provision for federal income taxes was required.
The Fund’s income and federal excise tax returns and all financial records supporting those returns for the prior three fiscal years are subject to examination by the federal and Delaware revenue authorities. Management has analyzed the Fund’s tax positions taken on federal, state, and foreign tax returns for all open tax years and does not believe that there are any uncertain tax positions that require recognition of a tax liability.
Class allocations
The separate classes of shares offered by the Fund differ principally in applicable sales charges, distribution, shareholder servicing, and administration fees. Class specific expenses are charged directly to that share class. Investment income, common expenses, and realized and unrealized gains (losses) on investments are allocated daily to each class of shares based on the relative proportion of net assets of each class.
3. FAIR VALUATION MEASUREMENTS
Fair value measurements of investments are determined within a framework that has established a fair value hierarchy based upon the various data inputs utilized in determining the value of the Fund’s investments. The three-level hierarchy gives the highest priority to unadjusted quoted prices in active markets for identical assets or liabilities (Level 1) and the lowest priority to significant unobservable inputs (Level 3). The Fund’s investments are classified within the fair value hierarchy based on the lowest level of input that is significant to the fair value measurement. The inputs are summarized into three broad levels as follows:
| n | | Level 1 – quoted prices in active markets for identical securities |
| n | | Level 2 – other significant observable inputs (including quoted prices for similar securities, interest rates, prepayment speeds, credit risk, use of amortized cost, etc.) |
| n | | Level 3 – significant unobservable inputs (including the Fund’s own assumptions in determining the fair value of investments) |
The inputs or methodologies used for valuing investments in securities are not necessarily an indication of the risk associated with investing in those securities.
The following is a summary of the inputs used in valuing the Fund’s assets and liabilities as of June 30, 2016:
| | | | | | | | | | | | | | | | |
| | | Quoted prices
(Level 1) | | | Other significant
observable inputs
(Level 2) | | | Significant
unobservable inputs (Level 3) | | | Total | |
Assets | | | | | | | | | | | | | | | | |
Investments in: | | | | | | | | | | | | | | | | |
| | | | |
Municipal obligations | | $ | 0 | | | $ | 169,452,580 | | | $ | 0 | | | $ | 169,452,580 | |
The Fund recognizes transfers between levels within the fair value hierarchy at the end of the reporting period. At June 30, 2016, the Fund did not have any transfers into/out of Level 1, Level 2, or Level 3.
| | | | |
| 22 | | Wells Fargo Wisconsin Tax-Free Fund | | Notes to financial statements |
4. TRANSACTIONS WITH AFFILIATES
Management fee
Funds Management, an indirect wholly owned subsidiary of Wells Fargo & Company (“Wells Fargo”), is the manager of the Fund and provides advisory and fund-level administrative services under an investment management agreement. Under the investment management agreement, Funds Management is responsible for, among other services, implementing the investment objectives and strategies of the Fund, supervising the subadviser, providing fund-level administrative services in connection with the Fund’s operations, and providing any other fund-level administrative services reasonably necessary for the operation of the Fund. As compensation for its services under the investment management agreement, Funds Management is entitled to receive an annual management fee starting at 0.40% and declining to 0.28% as the average daily net assets of the Fund increase. For the year ended June 30, 2016, the management fee was equivalent to an annual rate of 0.40% of the Fund’s average daily net assets.
Funds Management has retained the services of a subadviser to provide daily portfolio management to the Fund. The fee for subadvisory services is borne by Funds Management. Wells Capital Management Incorporated, an affiliate of Funds Management and an indirect wholly owned subsidiary of Wells Fargo, is the subadviser to the Fund and is entitled to receive a fee from Funds Management at an annual rate starting at 0.20% and declining to 0.10% as the average daily net assets of the Fund increase.
Administration fees
Under a class-level administration agreement, Funds Management provides class-level administrative services to the Fund, which includes paying fees and expenses for services provided by the transfer agent, sub-transfer agents, omnibus account servicers and record-keepers. As compensation for its services under the class-level administration agreement, Funds Management receives an annual fee which is calculated based on the average daily net assets of each class as follows:
| | | | |
| | | Class-level
administration fee | |
Class A, Class C | | | 0.16 | % |
Investor Class | | | 0.19 | |
Funds Management has contractually waived and/or reimbursed management and administration fees to the extent necessary to maintain certain net operating expense ratios for the Fund. Waiver of fees and/or reimbursement of expenses by Funds Management were made first from fund level expenses on a proportionate basis and then from class specific expenses. Funds Management has committed through October 31, 2016 to waive fees and/or reimburse expenses to the extent necessary to cap the Fund’s expenses at 0.70% for Class A shares and 1.45% for Class C shares. After this time, the cap may be increased or the commitment to maintain the cap may be terminated only with the approval of the Board of Trustees.
Distribution fee
The Trust has adopted a distribution plan for Class C shares of the Fund pursuant to Rule 12b-1 under the 1940 Act. A distribution fee is charged to Class C shares and paid to Wells Fargo Funds Distributor, LLC (“Funds Distributor”), the principal underwriter, at an annual rate of 0.75% of the average daily net assets of Class C shares.
In addition, Funds Distributor is entitled to receive the front-end sales charge from the purchase of Class A shares and a contingent deferred sales charge on the redemption of certain Class A shares. Funds Distributor is also entitled to receive the contingent deferred sales charges from redemptions of Class C shares. For the year ended June 30, 2016, Funds Distributor received $2,810 from the sale of Class A shares and $779 in contingent deferred sales charges from redemptions of Class C shares.
Shareholder servicing fees
The Trust has entered into contracts with one or more shareholder servicing agents, whereby Class A, Class C, and Investor Class of the Fund are charged a fee at an annual rate of 0.25% of the average daily net assets of each respective class.
A portion of these total shareholder servicing fees were paid to affiliates of Wells Fargo.
5. INVESTMENT PORTFOLIO TRANSACTIONS
Purchases and sales of investments, excluding U.S. government obligations (if any) and short-term securities, for the year ended June 30, 2016 were $36,734,371 and $22,891,727, respectively.
| | | | | | |
| Notes to financial statements | | Wells Fargo Wisconsin Tax-Free Fund | | | 23 | |
The Fund may purchase or sell investment securities to other Wells Fargo funds under procedures adopted by the Board of Trustees. The procedures have been designed to ensure that these interfund transactions, which generally do not incur broker commissions, are effected at current market prices. Interfund trades are included within the respective purchases and sales amounts shown.
6. BANK BORROWINGS
The Trust (excluding the money market funds and certain other funds) and Wells Fargo Variable Trust are parties to a $200,000,000 revolving credit agreement whereby the Fund is permitted to use bank borrowings for temporary or emergency purposes, such as to fund shareholder redemption requests. Interest under the credit agreement is charged to the Fund based on a borrowing rate equal to the higher of the Federal Funds rate in effect on that day plus 1.25% or the overnight LIBOR rate in effect on that day plus 1.25%. In addition, an annual commitment fee equal to 0.20% of the unused balance is allocated to each participating fund. Prior to September 1, 2015, the revolving credit agreement amount was $150,000,000 and the annual commitment fee was equal to 0.10% of the unused balance which was allocated to each participating fund.
For the year ended June 30, 2016, there were no borrowings by the Fund under the agreement.
7. DISTRIBUTIONS TO SHAREHOLDERS
The tax character of distributions paid during the years ended June 30, 2016 and June 30, 2015 were as follows:
| | | | | | | | |
| | | Year ended June 30 | |
| | | 2016 | | | 2015 | |
Ordinary income | | $ | 140 | | | $ | 896,413 | |
Tax-exempt income | | | 3,620,411 | | | | 3,238,756 | |
Long-term capital gain | | | 49,214 | | | | 594,345 | |
As of June 30, 2016, the components of distributable earnings on a tax basis were as follows:
| | | | |
Undistributed
ordinary
income | | Undistributed
tax-exempt
income | | Unrealized
gains |
| $152,828 | | $19,112 | | $7,930,325 |
8. CONCENTRATION RISK
The Fund invests a substantial portion of its assets in issuers of municipal debt securities located in a single state or territories of the U.S. Therefore, it may be more affected by economic and political developments in that state or region than would be a comparable general tax-exempt fund.
9. INDEMNIFICATION
Under the Trust’s organizational documents, the officers and Trustees have been granted certain indemnification rights against certain liabilities that may arise out of performance of their duties to the Trust. Additionally, in the normal course of business, the Trust may enter into contracts with service providers that contain a variety of indemnification clauses. The Trust’s maximum exposure under these arrangements is dependent on future claims that may be made against the Fund and, therefore, cannot be estimated.
| | | | |
| 24 | | Wells Fargo Wisconsin Tax-Free Fund | | Report of independent registered public accounting firm |
BOARD OF TRUSTEES AND SHAREHOLDERS OF WELLS FARGO FUNDS TRUST:
We have audited the accompanying statement of assets and liabilities, including the portfolio of investments, of the Wells Fargo Wisconsin Tax-Free Fund (formerly known as Wells Fargo Advantage Wisconsin Tax-Free Fund) (the “Fund”), one of the funds constituting the Wells Fargo Funds Trust, as of June 30, 2016, and the related statement of operations for the year then ended, the statements of changes in net assets for each of the years in the two-year period then ended, and the financial highlights for each of the years in the five-year period then ended. These financial statements and financial highlights are the responsibility of the Fund’s management. Our responsibility is to express an opinion on these financial statements and financial highlights based on our audits.
We conducted our audits in accordance with the standards of the Public Company Accounting Oversight Board (United States). Those standards require that we plan and perform the audit to obtain reasonable assurance about whether the financial statements and financial highlights are free of material misstatement. An audit includes examining, on a test basis, evidence supporting the amounts and disclosures in the financial statements. Our procedures included confirmation of securities owned as of June 30, 2016, by correspondence with custodians and brokers, or by other appropriate auditing procedures. An audit also includes assessing the accounting principles used and significant estimates made by management, as well as evaluating the overall financial statement presentation. We believe that our audits provide a reasonable basis for our opinion.
In our opinion, the financial statements and financial highlights referred to above present fairly, in all material respects, the financial position of the Wells Fargo Wisconsin Tax-Free Fund as of June 30, 2016, and the results of its operations for the year then ended, the changes in its net assets for each of the years in the two-year period then ended, and the financial highlights for each of the years in the five-year period then ended, in conformity with U.S. generally accepted accounting principles.

Boston, Massachusetts
August 25, 2016
| | | | | | |
| Other information (unaudited) | | Wells Fargo Wisconsin Tax-Free Fund | | | 25 | |
TAX INFORMATION
Pursuant to Section 852 of the Internal Revenue Code, $49,214 was designated as a 20% rate gain distribution for the fiscal year ended June 30, 2016.
For the fiscal year ended June 30, 2016, $140 has been designated as short-term capital gain dividends for nonresident alien shareholders pursuant to Section 871 of the Internal Revenue Code.
Pursuant to Section 852 of the Internal Revenue Code, 100% of distributions paid from net investment income is designated as exempt-interest dividends for the fiscal year ended June 30, 2016.
PROXY VOTING INFORMATION
A description of the policies and procedures that the Fund uses to determine how to vote proxies relating to portfolio securities is available, upon request, by calling 1-800-222-8222, visiting our website at wellsfargofunds.com, or visiting the SEC website at sec.gov. Information regarding how the Fund voted proxies relating to portfolio securities during the most recent 12-month period ended June 30 is available on the Fund’s website at wellsfargofunds.com or by visiting the SEC website at sec.gov.
PORTFOLIO HOLDINGS INFORMATION
The complete portfolio holdings for the Fund are publicly available monthly on the Fund’s website (wellsfargofunds.com), on a one-month delayed basis. In addition, top ten holdings information (excluding derivative positions) for the Fund is publicly available on the Fund’s website on a monthly, seven-day or more delayed basis. The Fund files its complete schedule of portfolio holdings with the SEC for the first and third quarters of each fiscal year on Form N-Q, which is available by visiting the SEC website at sec.gov. In addition, the Fund’s Form N-Q may be reviewed and copied at the SEC’s Public Reference Room in Washington, DC, and at regional offices in New York City, at 233 Broadway, and in Chicago, at 175 West Jackson Boulevard, Suite 900. Information about the Public Reference Room may be obtained by calling 1-800-SEC-0330.
| | | | |
| 26 | | Wells Fargo Wisconsin Tax-Free Fund | | Other information (unaudited) |
BOARD OF TRUSTEES AND OFFICERS
Each of the Trustees and Officers1 listed in the table below acts in identical capacities for each fund in the Wells Fargo family of funds, which consists of 142 mutual funds comprising the Wells Fargo Funds Trust, Wells Fargo Variable Trust, Wells Fargo Master Trust and four closed-end funds (collectively the “Fund Complex”). This table should be read in conjunction with the Prospectus and the Statement of Additional Information2. The mailing address of each Trustee and Officer is 525 Market Street, 12th Floor, San Francisco, CA 94105. Each Trustee and Officer serves an indefinite term, however, each Trustee serves such term until reaching the mandatory retirement age established by the Trustees.
Independent Trustees
| | | | | | |
Name and
year of birth | | Position held and
length of service* | | Principal occupations during past five years or longer | | Current other public
company or investment
company directorships |
William R. Ebsworth
(Born 1957) | | Trustee, since 2015 | | Retired. From 1984 to 2013, equities analyst, portfolio manager, research director and chief financial officer at Fidelity Management and Research Company in Boston, Tokyo, and Hong Kong and retired in 2013 as Chief Investment Officer of Fidelity Strategic Advisers, Inc. where he lead a team of investment professionals managing client assets. Prior thereto, Board member of Hong Kong Securities Clearing Co., Hong Kong Options Clearing Corp., the Thailand International Fund, Ltd., Fidelity Investments Life Insurance Company, and Empire Fidelity Investments Life Insurance Company. Mr. Ebsworth is a CFA® charterholder and an Adjunct Lecturer, Finance, at Babson College. | | Asset Allocation Trust |
Jane A. Freeman
(Born 1953) | | Trustee, since 2015 | | Retired. From 2012 to 2014 and 1999 to 2008, Chief Financial Officer of Scientific Learning Corporation. From 2008 to 2012, Ms. Freeman provided consulting services related to strategic business projects. Prior to 1999, Portfolio Manager at Rockefeller & Co. and Scudder, Stevens & Clark. Board member of the Harding Loevner Funds from 1996 to 2014, serving as both Lead Independent Director and chair of the Audit Committee. Board member of the Russell Exchange Traded Funds Trust from 2011 to 2012 and the chair of the Audit Committee. Ms. Freeman is Chair of Taproot Foundation (non-profit organization), a Board Member of Ruth Bancroft Garden (non-profit organization) and an inactive chartered financial analyst. | | Asset Allocation Trust |
Peter G. Gordon (Born 1942) | | Trustee, since 1998; Chairman, since 2005 | | Co-Founder, Retired Chairman, President and CEO of Crystal Geyser Water Company. Trustee Emeritus, Colby College. | | Asset Allocation Trust |
Isaiah Harris, Jr.
(Born 1952) | | Trustee, since 2009 | | Retired. Chairman of the Board of CIGNA Corporation since 2009, and Director since 2005. From 2003 to 2011, Director of Deluxe Corporation. Prior thereto, President and CEO of BellSouth Advertising and Publishing Corp. from 2005 to 2007, President and CEO of BellSouth Enterprises from 2004 to 2005 and President of BellSouth Consumer Services from 2000 to 2003. Emeritus member of the Iowa State University Foundation Board of Governors. Emeritus Member of the Advisory Board of Iowa State University School of Business. Advisory Board Member, Palm Harbor Academy (charter school). Advisory Board Member, Child Evangelism Fellowship (non-profit). Mr. Harris is a certified public accountant (inactive status). | | CIGNA Corporation; Asset Allocation Trust |
Judith M. Johnson
(Born 1949) | | Trustee, since 2008; Audit Committee Chairman, since 2008 | | Retired. Prior thereto, Chief Executive Officer and Chief Investment Officer of Minneapolis Employees Retirement Fund from 1996 to 2008. Ms. Johnson is an attorney, certified public accountant and a certified managerial accountant. | | Asset Allocation Trust |
David F. Larcker
(Born 1950) | | Trustee, since 2009 | | James Irvin Miller Professor of Accounting at the Graduate School of Business, Stanford University, Director of the Corporate Governance Research Initiative and Senior Faculty of The Rock Center for Corporate Governance since 2006. From 2005 to 2008, Professor of Accounting at the Graduate School of Business, Stanford University. Prior thereto, Ernst & Young Professor of Accounting at The Wharton School, University of Pennsylvania from 1985 to 2005. | | Asset Allocation Trust |
| | | | | | |
| Other information (unaudited) | | Wells Fargo Wisconsin Tax-Free Fund | | | 27 | |
| | | | | | |
Name and
year of birth | | Position held and
length of service* | | Principal occupations during past five years or longer | | Current other public
company or investment
company directorships |
Olivia S. Mitchell
(Born 1953) | | Trustee, since 2006 | | International Foundation of Employee Benefit Plans Professor, Wharton School of the University of Pennsylvania since 1993. Director of Wharton’s Pension Research Council and Boettner Center on Pensions & Retirement Research, and Research Associate at the National Bureau of Economic Research. Previously, Cornell University Professor from 1978 to 1993. | | Asset Allocation Trust |
Timothy J. Penny
(Born 1951) | | Trustee, since 1996 | | President and Chief Executive Officer of Southern Minnesota Initiative Foundation, a non-profit organization, since 2007 and Senior Fellow at the Humphrey Institute Policy Forum at the University of Minnesota since 1995. Member of the Board of Trustees of NorthStar Education Finance, Inc., a non-profit organization, since 2007. | | Asset Allocation Trust |
Michael S. Scofield
(Born 1943) | | Trustee, since 2010 | | Served on the Investment Company Institute’s Board of Governors and Executive Committee from 2008-2011 as well the Governing Council of the Independent Directors Council from 2006-2011 and the Independent Directors Council Executive Committee from 2008-2011. Chairman of the IDC from 2008-2010. Institutional Investor (Fund Directions) Trustee of Year in 2007. Trustee of the Evergreen Funds complex (and its predecessors) from 1984 to 2010. Chairman of the Evergreen Funds from 2000-2010. Former Trustee of the Mentor Funds. Retired Attorney, Law Offices of Michael S. Scofield. | | Asset Allocation Trust |
| * | Length of service dates reflect the Trustee’s commencement of service with the Trust’s predecessor entities, where applicable. |
Officers
| | | | | | |
Name and
year of birth | | Position held and
length of service | | Principal occupations during past five years or longer | | |
Karla M. Rabusch
(Born 1959) | | President, since 2003 | | Executive Vice President of Wells Fargo Bank, N.A. and President of Wells Fargo Funds Management, LLC since 2003. | | |
Nancy Wiser1
(Born 1967) | | Treasurer, since 2012 | | Executive Vice President of Wells Fargo Funds Management, LLC since 2011. Chief Operating Officer and Chief Compliance Officer at LightBox Capital Management LLC, from 2008 to 2011. | | |
C. David Messman
(Born 1960) | | Secretary, since 2000; Chief Legal Officer, since 2003 | | Senior Vice President and Secretary of Wells Fargo Funds Management, LLC since 2001. Assistant General Counsel of Wells Fargo Bank, N.A. since 2013 and Vice President and Managing Counsel of Wells Fargo Bank, N.A. from 1996 to 2013. | | |
Michael Whitaker
(Born 1967) | | Chief Compliance Officer, since 2016* | | Executive Vice President of Wells Fargo Funds Management, LLC since 2016. Chief Compliance Officer of Fidelity’s Fixed Income Funds and Asset Allocation Funds from 2008 to 2016, Compliance Officer of FMR Co., Inc. from 2014 to 2016, Fidelity Investments Money Management, Inc. from 2014 to 2016, Fidelity Investments from 2007 to 2016. | | |
David Berardi
(Born 1975) | | Assistant Treasurer, since 2009 | | Vice President of Wells Fargo Funds Management, LLC since 2009. Vice President of Evergreen Investment Management Company, LLC from 2008 to 2010. Manager of Fund Reporting and Control for Evergreen Investment Management Company, LLC from 2004 to 2010. | | |
Jeremy DePalma1
(Born 1974) | | Assistant Treasurer, since 2009 | | Senior Vice President of Wells Fargo Funds Management, LLC since 2009. Senior Vice President of Evergreen Investment Management Company, LLC from 2008 to 2010 and head of the Fund Reporting and Control Team within Fund Administration from 2005 to 2010. | | |
| 1 | Nancy Wiser acts as Treasurer of 73 funds in the Fund Complex. Jeremy DePalma acts as Treasurer of 69 funds and Assistant Treasurer of 73 funds in the Fund Complex. |
| 2 | The Statement of Additional Information includes additional information about the Trustees and is available, without charge, upon request, by calling 1-800-222-8222 or by visiting the website at wellsfargofunds.com. |
| * | Michael Whitaker became Chief Compliance Officer effective May 16, 2016. |
| | | | |
| 28 | | Wells Fargo Wisconsin Tax-Free Fund | | Other information (unaudited) |
BOARD CONSIDERATION OF INVESTMENT MANAGEMENT AND SUB-ADVISORY AGREEMENTS:
Under the Investment Company Act of 1940 (the “1940 Act”), the Board of Trustees (the “Board”) of Wells Fargo Funds Trust (the “Trust”) must determine annually whether to approve the continuation of the Trust’s investment management and sub-advisory agreements. In this regard, at an in-person meeting held on May 24-25, 2016 (the “Meeting”), the Board, all the members of which have no direct or indirect interest in the investment management and sub-advisory agreements and are not “interested persons” of the Trust, as defined in the 1940 Act (the “Independent Trustees”), reviewed and approved for Wells Fargo Wisconsin Tax-Free Fund (the “Fund”): (i) an investment management agreement (the “Management Agreement”) with Wells Fargo Funds Management, LLC (“Funds Management”); and (ii) an investment sub-advisory agreement (the “Sub-Advisory Agreement”) with Wells Capital Management Incorporated (the “Sub-Adviser”), an affiliate of Funds Management. The Management Agreement and the Sub-Advisory Agreement are collectively referred to as the “Advisory Agreements.”
At the Meeting, the Board considered the factors and reached the conclusions described below relating to the selection of Funds Management and the Sub-Adviser and the approval of the Advisory Agreements. Prior to the Meeting, including at an in-person meeting in April 2016, the Trustees conferred extensively among themselves and with representatives of Funds Management about these matters. Also, the Board has adopted a team-based approach, with each team consisting of a sub-set of Trustees, to assist the full Board in the discharge of its duties in reviewing performance and other matters throughout the year. The Independent Trustees were assisted in their evaluation of the Advisory Agreements by independent legal counsel, from whom they received separate legal advice and with whom they met separately.
In providing information to the Board, Funds Management and the Sub-Adviser were guided by a detailed set of requests for information submitted to them by independent legal counsel on behalf of the Independent Trustees at the start of the Board’s annual contract renewal process earlier in 2016. In considering and approving the Advisory Agreements, the Trustees considered the information they believed relevant, including but not limited to the information discussed below. The Board considered not only the specific information presented in connection with the Meeting, but also the knowledge gained over time through interaction with Funds Management and the Sub-Adviser about various topics. In this regard, the Board reviewed reports of Funds Management at each of its quarterly meetings, which included, among other things, portfolio reviews and performance reports. In addition, the Board and the teams mentioned above confer with portfolio managers at various times throughout the year. The Board did not identify any particular information or consideration that was all-important or controlling, and each individual Trustee may have attributed different weights to various factors.
After its deliberations, the Board unanimously approved the continuation of the Advisory Agreements for a one-year term and determined that the compensation payable to Funds Management and the Sub-Adviser under each of the Advisory Agreements was reasonable. The Board considered the approval of the Advisory Agreements for the Fund as part of its consideration of agreements for funds across the complex, but its approvals were made on a fund-by-fund basis. The following summarizes a number of important, but not necessarily all, factors considered by the Board in support of its approvals.
Nature, extent and quality of services
The Board received and considered various information regarding the nature, extent and quality of services provided to the Fund by Funds Management and the Sub-Adviser under the Advisory Agreements. This information included a description of the investment advisory services and Fund-level administrative services covered by the Management Agreement, as well as, among other things, a summary of the background and experience of senior management of Funds Management, and the qualifications, background, tenure and responsibilities of each of the portfolio managers primarily responsible for the day-to-day portfolio management of the Fund.
The Board evaluated the ability of Funds Management and the Sub-Adviser to attract and retain qualified investment professionals, including research, advisory and supervisory personnel. The Board further considered the compliance programs and compliance records of Funds Management and the Sub-Adviser. In addition, the Board took into account the full range of services provided to the Fund by Funds Management and its affiliates.
Fund performance and expenses
The Board considered the performance results for the Fund over various time periods ended December 31, 2015. The Board considered these results in comparison to the performance of funds in a universe that was determined by Broadridge Inc. (“Broadridge”) to be similar to the Fund (the “Universe”), and in comparison to the Fund’s benchmark index and to other comparative data. Broadridge is an independent provider of investment company data. The Board
| | | | | | |
| Other information (unaudited) | | Wells Fargo Wisconsin Tax-Free Fund | | | 29 | |
received a description of the methodology used by Broadridge to select the mutual funds in the performance Universe. The Board noted that the performance of the Fund (Class A) was higher than the average performance of the Universe for all periods under review except the five-year period under review. The Board also noted that the performance of the Fund was lower than its benchmark, the Barclays Municipal Bond Index, for all periods under review.
The Board also received and considered information regarding the Fund’s net operating expense ratios and their various components, including actual management fees, custodian and other non-management fees, and Rule 12b-1 and non-Rule 12b-1 shareholder service fees. The Board considered these ratios in comparison to the median ratios of funds in class-specific expense groups that were determined by Broadridge to be similar to the Fund (the “Groups”). The Board received a description of the methodology used by Broadridge to select the mutual funds in the expense Groups and an explanation of how funds comprising expense groups and their expense ratios may vary from year-to-year. Based on the Broadridge reports, the Board noted that the net operating expense ratios of the Fund were lower than the median net operating expense ratios of the expense Groups.
The Board took into account the Fund performance and expense information provided to it among the factors considered in deciding to re-approve the Advisory Agreements.
Investment management and sub-advisory fee rates
The Board reviewed and considered the contractual fee rates payable by the Fund to Funds Management under the Management Agreement, as well as the contractual fee rates payable by the Fund to Funds Management for class-level administrative services under a Class-Level Administration Agreement, which include class-level transfer agency and sub-transfer agency costs (collectively, the “Management Rates”). The Board also reviewed and considered the contractual investment sub-advisory fee rates that are payable by Funds Management to the Sub-Adviser for investment sub-advisory services.
Among other information reviewed by the Board was a comparison of the Fund’s Management Rates with the average contractual investment management fee rates of funds in the expense Groups at a common asset level as well as transfer agency costs of the funds in the expense Groups. The Board noted that the Management Rates of the Fund were lower than the sum of these average rates for the Fund’s expense Groups for all share classes.
The Board also received and considered information about the portion of the total management fee that was retained by Funds Management after payment of the fee to the Sub-Adviser for sub-advisory services. In assessing the reasonableness of this amount, the Board received and evaluated information about the nature and extent of responsibilities retained and risks assumed by Funds Management and not delegated to or assumed by the Sub-Adviser, and about Funds Management’s on-going oversight services. However, given the affiliation between Funds Management and the Sub-Adviser, the Board ascribed limited relevance to the allocation of fees between them.
The Board also received and considered information about the nature and extent of services offered and fee rates charged by Funds Management and the Sub-Adviser to other types of clients with investment strategies similar to those of the Fund. In this regard, the Board received information about the significantly greater scope of services, and compliance, reporting and other legal burdens and risks of managing mutual funds compared with those associated with managing assets of non-mutual fund clients such as collective funds or institutional separate accounts.
Based on its consideration of the factors and information it deemed relevant, including those described here, the Board determined that the compensation payable to Funds Management under the Management Agreement and to the Sub-Adviser under the Sub-Advisory Agreement was reasonable, in light of the services covered by the Advisory Agreements.
Profitability
The Board received and considered information concerning the profitability of Funds Management, as well as the profitability of Wells Fargo as a whole, from providing services to the Fund and the fund family as a whole. The Board also received and considered information concerning the profitability of the Sub-Adviser from providing services to the fund family as a whole, noting that the Sub-Adviser’s profitability information with respect to providing services to the Fund was subsumed in the Wells Fargo and Funds Management profitability analysis.
Funds Management reported on the methodologies and estimates used in calculating profitability. Among other things, the Board noted that the levels of profitability reported on a fund-by-fund basis varied widely, depending on factors such as the size and type of fund. Based on its review, the Board did not deem the profits reported by Funds Management or Wells Fargo from its services to the Fund to be at a level that would prevent it from approving the continuation of the Advisory Agreements.
| | | | |
| 30 | | Wells Fargo Wisconsin Tax-Free Fund | | Other information (unaudited) |
Economies of scale
With respect to possible economies of scale, the Board noted the existence of breakpoints in the Fund’s management fee structure, which operate generally to reduce the Fund’s expense ratios as the Fund grows in size. It considered that, for a small fund or a fund that shrinks in size, breakpoints conversely can result in higher fee levels. The Board also considered that fee waiver and expense reimbursement arrangements and competitive fee rates at the outset are means of sharing potential economies of scale with shareholders of the Fund and the fund family as a whole. The Board considered Funds Management’s view that any analyses of potential economies of scale in managing a particular fund are inherently limited in light of the joint and common costs and investments that Funds Management incurs across the fund family as a whole.
The Board concluded that the Fund’s fee and expense arrangements, including contractual breakpoints, constituted a reasonable approach to sharing potential economies of scale with the Fund and its shareholders.
Other benefits to Funds Management and the Sub-Adviser
The Board received and considered information regarding potential “fall-out” or ancillary benefits received by Funds Management and its affiliates, including the Sub-Adviser, as a result of their relationships with the Fund. Ancillary benefits could include, among others, benefits directly attributable to other relationships with the Fund and benefits potentially derived from an increase in Funds Management’s and the Sub-Adviser’s business as a result of their relationships with the Fund. The Board noted that various affiliates of Funds Management may receive distribution-related fees, shareholder servicing payments and sub-transfer agency fees in respect of shares sold or held through them and services provided.
The Board also reviewed information about soft dollar credits earned and utilized by the Sub-Adviser, fees earned by Funds Management and the Sub-Adviser from managing a private investment vehicle for the fund family’s securities lending collateral and commissions earned by an affiliated broker from portfolio transactions.
Based on its consideration of the factors and information it deemed relevant, including those described here, the Board did not find that any ancillary benefits received by Funds Management and its affiliates, including the Sub-Adviser, were unreasonable.
Conclusion
At the Meeting, after considering the above-described factors and based on its deliberations and its evaluation of the information described above, the Board unanimously approved the continuation of the Advisory Agreements for a one-year term and determined that the compensation payable to Funds Management and the Sub-Adviser under each of the Advisory Agreements was reasonable.
| | | | | | |
| List of abbreviations | | Wells Fargo Wisconsin Tax-Free Fund | | | 31 | |
The following is a list of common abbreviations for terms and entities that may have appeared in this report.
| ACA | — ACA Financial Guaranty Corporation |
| ADR | — American depositary receipt |
| ADS | — American depositary shares |
| AGC | — Assured Guaranty Corporation |
| AGM | — Assured Guaranty Municipal |
| Ambac | — Ambac Financial Group Incorporated |
| AMT | — Alternative minimum tax |
| BAN | — Bond anticipation notes |
| BHAC | — Berkshire Hathaway Assurance Corporation |
| CAB | — Capital appreciation bond |
| CCAB | — Convertible capital appreciation bond |
| CDA | — Community Development Authority |
| CDO | — Collateralized debt obligation |
| DRIVER | — Derivative inverse tax-exempt receipts |
| DW&P | — Department of Water & Power |
| DWR | — Department of Water Resources |
| ECFA | — Educational & Cultural Facilities Authority |
| EDA | — Economic Development Authority |
| EDFA | — Economic Development Finance Authority |
| ETF | — Exchange-traded fund |
| FDIC | — Federal Deposit Insurance Corporation |
| FFCB | — Federal Farm Credit Banks |
| FGIC | — Financial Guaranty Insurance Corporation |
| FHA | — Federal Housing Administration |
| FHLB | — Federal Home Loan Bank |
| FHLMC | — Federal Home Loan Mortgage Corporation |
| FICO | — The Financing Corporation |
| FNMA | — Federal National Mortgage Association |
| GDR | — Global depositary receipt |
| GNMA | — Government National Mortgage Association |
| HCFR | — Healthcare facilities revenue |
| HEFA | — Health & Educational Facilities Authority |
| HEFAR | — Higher education facilities authority revenue |
| HFA | — Housing Finance Authority |
| HFFA | — Health Facilities Financing Authority |
| HUD | — Department of Housing and Urban Development |
| IDA | — Industrial Development Authority |
| IDAG | — Industrial Development Agency |
| KRW | — Republic of Korea won |
| LIBOR | — London Interbank Offered Rate |
| LIFER | — Long Inverse Floating Exempt Receipts |
| LLC | — Limited liability company |
| LLLP | — Limited liability limited partnership |
| LLP | — Limited liability partnership |
| MBIA | — Municipal Bond Insurance Association |
| MFHR | — Multifamily housing revenue |
| MSTR | — Municipal securities trust receipts |
| MUD | — Municipal Utility District |
| National | — National Public Finance Guarantee Corporation |
| PCFA | — Pollution Control Financing Authority |
| PCL | — Public Company Limited |
| PCR | — Pollution control revenue |
| PFA | — Public Finance Authority |
| PFFA | — Public Facilities Financing Authority |
| PFOTER | — Puttable floating option tax-exempt receipts |
| plc | — Public limited company |
| PUTTER | — Puttable tax-exempt receipts |
| R&D | — Research & development |
| Radian | — Radian Asset Assurance |
| RAN | — Revenue anticipation notes |
| RDA | — Redevelopment Authority |
| RDFA | — Redevelopment Finance Authority |
| REIT | — Real estate investment trust |
| ROC | — Reset option certificates |
| SAVRS | — Select auction variable rate securities |
| SBA | — Small Business Authority |
| SDR | — Swedish depositary receipt |
| SFHR | — Single-family housing revenue |
| SFMR | — Single-family mortgage revenue |
| SPA | — Standby purchase agreement |
| SPDR | — Standard & Poor’s Depositary Receipts |
| SPEAR | — Short Puttable Exempt Adjustable Receipts |
| STRIPS | — Separate trading of registered interest and |
| TAN | — Tax anticipation notes |
| TIPS | — Treasury inflation-protected securities |
| TRAN | — Tax revenue anticipation notes |
| TTFA | — Transportation Trust Fund Authority |
| TVA | — Tennessee Valley Authority |
This page is intentionally left blank.

For more information
More information about Wells Fargo Funds is available free upon request. To obtain literature, please write, email, visit the Fund’s website, or call:
Wells Fargo Funds
P.O. Box 8266
Boston, MA 02266-8266
Email: fundservice@wellsfargo.com
Website: wellsfargofunds.com
Individual investors: 1-800-222-8222
Retail investment professionals: 1-888-877-9275
Institutional investment professionals: 1-866-765-0778
This report and the financial statements contained herein are submitted for the general information of the shareholders of the Fund. If this report is used for promotional purposes, distribution of the report must be accompanied or preceded by a current prospectus. Before investing, please consider the investment objectives, risks, charges, and expenses of the investment. For a current prospectus and, if available, a summary prospectus, containing this information, call 1-800-222-8222 or visit the Fund’s website at wellsfargofunds.com. Read the prospectus carefully before you invest or send money.
Wells Fargo Asset Management (WFAM) is a trade name used by the asset management businesses of Wells Fargo & Company. Wells Fargo Funds Management, LLC, a wholly owned subsidiary of Wells Fargo & Company, provides investment advisory and administrative services for Wells Fargo Funds. Other affiliates of Wells Fargo & Company provide subadvisory and other services for the funds. The funds are distributed by Wells Fargo Funds Distributor, LLC, Member FINRA, an affiliate of Wells Fargo & Company.
NOT FDIC INSURED ¡ NO BANK GUARANTEE ¡ MAY LOSE VALUE
© 2016 Wells Fargo Funds Management, LLC. All rights reserved.
| | |
 | | 244413 08-16 A259/AR259 6-16 |
Annual Report
June 30, 2016

Wells Fargo
Alternative Strategies Fund


Reduce clutter. Save trees.
Sign up for electronic delivery of prospectuses and shareholder reports at wellsfargo.com/advantagedelivery
Contents
The views expressed and any forward-looking statements are as of June 30, 2016, unless otherwise noted, and are those of the Fund managers and/or Wells Fargo Funds Management, LLC. Discussions of individual securities, or the markets generally, or any Wells Fargo Fund are not intended as individual recommendations. Future events or results may vary significantly from those expressed in any forward-looking statements. The views expressed are subject to change at any time in response to changing circumstances in the market. Wells Fargo Funds Management, LLC and the Fund disclaim any obligation to publicly update or revise any views expressed or forward-looking statements.
NOT FDIC INSURED ¡ NO BANK GUARANTEE ¡ MAY LOSE VALUE
| | | | |
| 2 | | Wells Fargo Alternative Strategies Fund | | Letter to shareholders (unaudited) |

Karla M. Rabusch
President
Wells Fargo Funds
During much of the period, global equity, bond, and currency markets were volatile as recessionary pressures and diverging central bank policies concerned investors.
During the fourth quarter of 2015, Japan’s economy contracted, China’s manufacturing sector retrenched, and growth appeared to slow in Europe.
Dear Valued Shareholder:
We are pleased to offer you this annual report for the Wells Fargo Alternative Strategies Fund for the 12-month period that ended June 30, 2016. During much of the period, global equity, bond, and currency markets were volatile as recessionary pressures and diverging central bank policies concerned investors. As the period ended, voters in the U.K. approved a referendum to leave the European Union, injecting new uncertainty into the markets and sending stock prices and bond yields significantly lower. Equity markets soon recovered to varying degrees, but bond prices remained elevated and yields lower as investors sought lower-volatility assets due to short-term fears.
Shifting investor sentiment reflected changing economic and business data.
Early in the period, oil prices declined after a spring 2015 rally, negotiations about Greece’s ability to repay its sovereign debt grew contentious, and the U.S. dollar strengthened. By July 2015, equity markets were declining, led by stocks in China, which endured the largest one-day drop in eight years on July 27, 2015.
The S&P 500 Index,1 a common measure of U.S. stock performance, fell into correction territory—defined as a loss of 10% or more—during August 2015 before recovering somewhat. The index retested its August lows in late September 2015 before recovering most of its year-to-date losses from October through December 2015. As anticipated, the U.S. Federal Reserve (Fed) increased the federal funds rate in December and suggested that it planned to pursue additional increases in 2016. During the first six weeks of 2016, the index suffered the worst loss to open a year on record before trending higher. By the end of the 12-month reporting period, the index recorded a 3.99% gain.
Overseas, the Morgan Stanley Capital International (MSCI) All Country World Index (ACWI) ex USA Index (Net)2 and the MSCI Emerging Markets (EM) Index (Net)3 recorded negative returns. In August 2015, China allowed its currency’s value to decline in an attempt to bolster exports. The U.S. dollar strengthened, which negatively affected investment returns and U.S. corporate profits earned overseas. During the fourth quarter of 2015, Japan’s economy contracted, China’s manufacturing sector retrenched, and growth appeared to slow in Europe.
Global equity markets hit low points before starting to rebound in the middle of February 2016 when business data improved and central bankers reasserted their commitment to initiatives intended to encourage economic activity. The European Central Bank (ECB) pushed the deposit interest-rate further into negative territory. The Bank of Japan (BOJ) followed the ECB’s lead by setting a negative deposit rate. Negative deposit interest rates are intended to encourage banks to lend assets rather than keep them on deposit. The People’s Bank of China (PBOC) reduced reserve ratios, which also was intended to encourage lending. The ECB expanded its bond-buying program, which injects liquidity into the markets and encourages investment.
| 1 | The S&P 500 Index consists of 500 stocks chosen for market size, liquidity, and industry group representation. It is a market-value-weighted index with each stock’s weight in the index proportionate to its market value. You cannot invest directly in an index. |
| 2 | The Morgan Stanley Capital International (MSCI) All Country World Index (ACWI) ex USA Index (Net) is a free-float-adjusted market-capitalization-weighted index that is designed to measure the equity market performance of developed markets, excluding the U.S. and Canada. Source: MSCI. MSCI makes no express or implied warranties or representations and shall have no liability whatsoever with respect to any MSCI data contained herein. The MSCI data may not be further redistributed or used as a basis for other indexes or any securities or financial products. This report is not approved, reviewed, or produced by MSCI. You cannot invest directly in an index. |
| 3 | The MSCI Emerging Markets (EM) Index (Net) is a free-float-adjusted market-capitalization-weighted index that is designed to measure the equity market performance of emerging markets. The MSCI EM Index (Net) consists of the following 23 emerging markets country indexes: Brazil, Chile, China, Colombia, Czech Republic, Egypt, Greece, Hungary, India, Indonesia, Korea, Malaysia, Mexico, Peru, the Philippines, Poland, Qatar, Russia, South Africa, Taiwan, Thailand, Turkey, and United Arab Emirates. You cannot invest directly in an index. |
| | | | | | |
| Letter to shareholders (unaudited) | | Wells Fargo Alternative Strategies Fund | | | 3 | |
For the 12-month reporting period, the MSCI ACWI ex USA Index (Net) and MSCI EM Index (Net) recorded returns of -10.24% and -12.06%, respectively.
A December federal funds rate increase marked divergence of central bank policies.
Bond markets were volatile as well. The Fed’s decision to tighten credit conditions through higher interest rates contrasted with actions by the ECB, the PBOC, and the BOJ. Data released in January 2016 indicated that U.S. corporate profits fell in the fourth quarter of 2015, the second consecutive quarter of decline. The Fed expressed hesitancy about additional credit tightening in the near term, which investors appeared to read as accommodative of business activity. Overall, policy actions of central banks and intermittently positive economic data heartened investors as the period drew to a close.
Bond markets, particularly international bonds, benefited during the period, with the Barclays Global Aggregate ex U.S. Dollar Bond Index4 gaining 11.24% and the Barclays U.S. Aggregate Bond Index5 gaining 6.00%.
Don’t let short-term uncertainty derail long-term investment goals.
Periods of investment uncertainty can present challenges, but experience has taught us that maintaining long-term investment goals can be an effective way to plan for the future. To help you create a sound strategy based on your personal goals and risk tolerance, Wells Fargo Funds offers more than 100 mutual funds spanning a wide range of asset classes and investment styles. Although diversification cannot guarantee an investment profit or prevent losses, we believe it can be an effective way to manage investment risk and potentially smooth out overall portfolio performance. We encourage investors to know their investments and to understand that appropriate levels of risk-taking may unlock opportunities.
Thank you for choosing to invest with Wells Fargo Funds. We appreciate your confidence in us and remain committed to helping you meet your financial needs.
Sincerely,

Karla M. Rabusch
President
Wells Fargo Funds
For further information about your Fund, contact your investment professional, visit our website at wellsfargofunds.com, or call us directly at 1-800-222-8222. We are available 24 hours a day, 7 days a week.
| 4 | The Barclays Global Aggregate ex U.S. Dollar Bond Index tracks an international basket of government, corporate, agency, and mortgage-related bonds. You cannot invest directly in an index. |
| 5 | The Barclays U.S. Aggregate Bond Index is a broad-based benchmark that measures the investment-grade, U.S. dollar–denominated, fixed-rate taxable bond market, including Treasuries, government-related and corporate securities, mortgage-backed securities (agency fixed-rate and hybrid adjustable-rate mortgage pass-throughs), asset-backed securities, and commercial mortgage-backed securities. You cannot invest directly in an index. |
| | | | |
| 4 | | Wells Fargo Alternative Strategies Fund | | Performance highlights (unaudited) |
Investment objective
The Fund seeks long-term capital appreciation.
Manager
Wells Fargo Funds Management, LLC
Subadvisers
The Rock Creep Group, LP
Chilton Investment Company, LLC
Ellington Global Asset Management LLC
Mellon Capital Management Corporation
Passport Capital, LLC
Pine River Capital Management L.P.
River Canyon Fund Management LLC
Sirios Capital Management, L.P.
Wellington Management Company LLP
Portfolio managers
Joseph Bishop
John F. Brennan, Jr.
John Burbank
Richard L. Chilton, Jr.
Vassilis Dagioglu
Robert Kinderman
Sudhir Krisnamurthi
Kenneth LaPlace
Soon Pho
Kent M. Stahl, CFA®
Gregg R. Thomas, CFA®
Ronald van der Wouden
Brian Zied
Aaron Zimmerman
Average annual total returns (%) as of June 30, 2016
| | | | | | | | | | | | | | | | | | | | | | | | | | |
| | | | | Including sales charge | | | Excluding sales charge | | | Expense ratios1 (%) | |
| | | Inception date | | 1 year | | | Since inception | | | 1 year | | | Since inception | | | Gross | | | Net2 | |
| Class A (WALTX) | | 4-30-2014 | | | (9.23 | ) | | | (1.18 | ) | | | (3.65 | ) | | | 1.56 | | | | 3.39 | | | | 2.88 | |
| Class C (WACTX) | | 4-30-2014 | | | (5.46 | ) | | | 0.78 | | | | (4.46 | ) | | | 0.78 | | | | 4.14 | | | | 3.63 | |
| Administrator Class (WADTX) | | 4-30-2014 | | | – | | | | – | | | | (3.55 | ) | | | 1.70 | | | | 3.31 | | | | 2.73 | |
| Institutional Class (WAITX) | | 4-30-2014 | | | – | | | | – | | | | (3.36 | )* | | | 1.84 | | | | 3.06 | | | | 2.63 | |
| Barclays U.S. Aggregate Bond Index3 | | – | | | – | | | | – | | | | 6.00 | | | | 4.17 | | | | – | | | | – | |
| Credit Suisse Liquid Alternatives Beta Index4 | | – | | | – | | | | – | | | | (0.66 | ) | | | 1.33 | | | | – | | | | – | |
| * | | Total return differs from the return in the Financial Highlights in this report. The total return presented is calculated based on the NAV at which shareholder transactions were processed. The NAV and total return presented in the Financial Highlights reflects certain adjustments made to the net assets of the Fund that are necessary under U.S. generally accepted accounting principles. |
Figures quoted represent past performance, which is no guarantee of future results, and do not reflect taxes that a shareholder may pay on fund distributions or the redemption of fund shares. Investment return and principal value of an investment will fluctuate so that an investor’s shares, when redeemed, may be worth more or less than their original cost. Performance shown without sales charges would be lower if sales charges were reflected. Current performance may be lower or higher than the performance data quoted, which assumes the reinvestment of dividends and capital gains. Current month-end performance is available on the Fund’s website, wellsfargofunds.com.
Index returns do not include transaction costs associated with buying and selling securities, any mutual fund fees or expenses, or any taxes. It is not possible to invest directly in an index.
For Class A shares, the maximum front-end sales charge is 5.75%. For Class C shares, the maximum contingent deferred sales charge is 1.00%. Performance including a contingent deferred sales charge assumes the sales charge for the corresponding time period. Administrator Class and Institutional Class shares are sold without a front-end sales charge or contingent deferred sales charge.
The Fund does not invest directly in hedge funds but pursues similar strategies to those typically used by hedge funds. The Fund invests using alternative investment strategies such as equity hedged, event driven, global macro, and relative value, which are speculative and entail a high degree of risk. Stock values fluctuate in response to the activities of individual companies and general market and economic conditions. Bond values fluctuate in response to the financial condition of individual issuers, general market and economic conditions, and changes in interest rates. Changes in market conditions and government policies may lead to periods of heightened volatility in the bond market and reduced liquidity for certain bonds held by the Fund. In general, when interest rates rise, bond values fall and investors may lose principal value. Interest-rate changes and their impact on the Fund and its share price can be sudden and unpredictable. Foreign investments are especially volatile and can rise or fall dramatically due to differences in the political and economic conditions of the host country. These risks are generally intensified in emerging markets. The use of derivatives may reduce returns and/or increase volatility. Borrowing money to purchase securities or cover short positions magnifies losses and incurs expenses. Short selling is generally considered speculative, has the potential for unlimited loss, and may involve leverage. Certain investment strategies tend to increase the total risk of an investment (relative to the broader market). Securities issued by U.S. government agencies or government-sponsored entities may not be guaranteed by the U.S. Treasury. The Fund is exposed to high-yield securities risk, mortgage- and asset-backed securities risk, convertible securities risk, loan risk, regulatory risk, and smaller-company securities risk. Consult a Fund’s prospectus for additional information on these and other risks.
Please see footnotes on page 5.
| | | | | | |
| Performance highlights (unaudited) | | Wells Fargo Alternative Strategies Fund | | | 5 | |
|
| Growth of $10,000 investment as of June 30, 20165 |
|
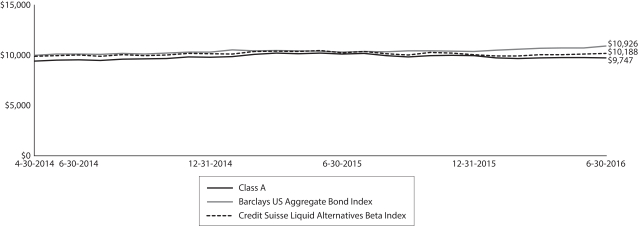 |
| 1 | Reflects the expense ratios as stated in the most recent prospectuses, which include the impact of 0.12% in acquired fund fees and expenses and 0.63% in dividend and interest expenses on securities sold short. The expense ratios shown are subject to change and may differ from the annualized expense ratios shown in the financial highlights of this report, which do not include acquired fund fees and expenses. |
| 2 | The manager has contractually committed through October 31, 2016, to waive fees and/or reimburse expenses to the extent necessary to cap the Fund’s Total Annual Fund Operating Expenses After Fee Waiver at 2.22% for Class A, 2.97% for Class C, 2.07% for Administrator Class, and 1.97% for Institutional Class. After this time, the cap may be increased or the commitment to maintain the cap may be terminated only with the approval of the Board of Trustees. Brokerage commissions, stamp duty fees, interest, taxes, acquired fund fees and expenses, prime broker fees, dividend and interest expenses on securities sold short, and extraordinary expenses are excluded from the expense cap. Acquired fund fees and expenses incurred by investments made by The Rock Creek Group, LP, a subadviser of the Fund, are included in the expense cap. Without this cap, the Fund’s returns would have been lower. |
| 3 | The Barclays U.S. Aggregate Bond Index is a broad-based benchmark that measures the investment-grade, U.S. dollar–denominated, fixed-rate taxable bond market, including Treasuries, government-related and corporate securities, mortgage-based securities (agency fixed-rate and hybrid adjustable-rate mortgage pass-throughs), asset-backed securities, and commercial mortgage-backed securities. You cannot invest directly in an index. |
| 4 | The Credit Suisse Liquid Alternatives Beta Index reflects the returns of a dynamic basket of liquid, investable market factors selected and weighted in accordance with an algorithm that aims to approximate the aggregate returns of the universe of hedge fund managers, as represented by the Credit Suisse Hedge Fund Index. You cannot invest directly in an index. |
| 5 | The chart compares the performance of Class A shares since inception with the Barclays U.S. Aggregate Bond Index and Credit Suisse Liquid Alternatives Beta Index. The chart assumes a hypothetical investment of $10,000 in Class A shares and reflects all operating expenses and assumes the maximum initial sales charge of 5.75%. |
| 6 | The Morgan Stanley Capital International (MSCI) World Index (Net) is a free-float-adjusted market-capitalization-weighted index that is designed to measure the equity market performance of developed markets. The MSCI World Index consists of the following 23 developed markets country indexes: Australia, Austria, Belgium, Canada, Denmark, Finland, France, Germany, Hong Kong, Ireland, Israel, Italy, Japan, the Netherlands, New Zealand, Norway, Portugal, Singapore, Spain, Sweden, Switzerland, the United Kingdom, and the United States. Source: MSCI. MSCI makes no express or implied warranties or representations and shall have no liability whatsoever with respect to any MSCI data contained herein. The MSCI data may not be further redistributed or used as a basis for other indexes or any securities or financial products. This report is not approved, reviewed, or produced by MSCI. You cannot invest directly in an index. |
| 7 | The MSCI EAFE (Europe, Australasia, Far East) Index is a free-float-adjusted market-capitalization-weighted index that is designed to measure the equity market performance of developed markets, excluding the United States and Canada. The MSCI EAFE Index consists of the following 21 developed markets country indexes: Australia, Austria, Belgium, Denmark, Finland, France, Germany, Hong Kong, Ireland, Israel, Italy, Japan, the Netherlands, New Zealand, Norway, Portugal, Singapore, Spain, Sweden, Switzerland, and the United Kingdom. You cannot invest directly in an index. |
| 8 | The MSCI Emerging Markets (EM) Index (Net) is a free-float-adjusted market-capitalization-weighted index that is designed to measure the equity market performance of emerging markets. The MSCI EM Index (Net) consists of the following 23 emerging markets country indexes: Brazil, Chile, China, Colombia, Czech Republic, Egypt, Greece, Hungary, India, Indonesia, Korea, Malaysia, Mexico, Peru, the Philippines, Poland, Qatar, Russia, South Africa, Taiwan, Thailand, Turkey, and United Arab Emirates. You cannot invest directly in an index. |
| 9 | The S&P 500 Index consists of 500 stocks chosen for market size, liquidity, and industry group representation. It is a market-value-weighted index with each stock’s weight in the index proportionate to its market value. You cannot invest directly in an index. |
| 10 | The chart shows the percentage of Fund holdings within a particular sector that was held long (securities owned by the Fund) or sold short (sale of borrowed securities). Gross exposure is the absolute value of the long positions and short positions combined. Net exposure is the percentage of long positions minus the percentage of positions sold short. |
| 11 | Strategy allocation is calculated based on the market value of total investments. Cash shown is the sweep cash position of the Fund, and excludes any cash or cash equivalents that may be pledged as collateral for other investments of the Fund. Strategy allocation is subject to change and may have changed since the date specified. |
| 12 | The ten largest long and short position holdings, excluding cash and cash equivalents, are calculated based on the value of the investments divided by total net assets of the Fund. Holdings are subject to change and may have changed since the date specified. |
| | | | |
| 6 | | Wells Fargo Alternative Strategies Fund | | Performance highlights (unaudited) |
MANAGERS’ DISCUSSION
Fund highlights
| n | | The Fund underperformed its benchmark, the Barclays U.S. Aggregate Bond Index, for the 12-month period that ended June 30, 2016. The Fund also underperformed the Credit Suisse Liquid Alternatives Beta Index. (The Fund invests assets across a number of alternative investment strategies in an effort to achieve relatively low sensitivity and low volatility relative to major equity markets. It thus benchmarks itself against the Barclays U.S. Aggregate Bond Index, despite investing in a number of equity strategies.) |
| n | | A general flight away from volatility benefited the Fund’s fixed-income benchmark but led to losses from the Fund’s two most directional strategies: equity hedged and event driven. |
| n | | The trend-following component within the global macro sleeve, which tends to be least correlated with market direction, was the single largest contributor to Fund performance. |
| n | | The Fund’s underlying subadvisors decreased the market sensitivity of their portfolios in line with our market outlook, but strategy allocations were mostly unchanged. |
Markets were quite volatile over the past 12 months, driven by worries over the Chinese economy; lower commodity prices; negative interest rates; and, most recently, the fallout from the Brexit referendum vote by which voters in the U.K. decided to exit the European Union. The Morgan Stanley Capital International (MSCI) World Index (Net)6 declined 2.8% for the period, with considerable variance across regions. The MSCI Europe, Asia, Far East (EAFE) Index7 was down more than 10% and emerging markets, as measured by the MSCI Emerging Markets (EM) Index (Net),8 were down more than 12%, versus a 4% gain for the S&P 500 Index.9 Commodity markets were volatile, with oil ending lower while the Brexit paved the way for significant weakening in the British pound and strengthened the U.S. dollar and Japanese yen. Meanwhile, fixed-income yields on most sovereign and higher-quality corporate bonds continued to trend lower as investors gravitated toward bonds with relatively low credit risk.
The equity hedged sleeve was the largest detractor from performance for the Fund. The U.S. equity market saw a massive rotation to value as evidenced by strong outperformance of the utilities and telecommunication services sectors, which were underweighted in the Fund. Subadvisors with a growth bias were more negatively affected by this rotation of capital. In particular, financials sector investments saw sharp drawdowns as a result of increasing uncertainty about future interest rates in the U.S., Europe, and Japan. Global equity hedged strategies with a long bias toward Europe and Japan were weighed down by China-related fears throughout the period and by volatility following the Brexit vote. These losses were partially offset by short exposure to energy- and materials-related stocks, as well as emerging markets stocks. Additionally, long positions in U.S. consumer stocks outperformed on the back of lower oil prices and signs of an improving labor market.
| | | | | | | | |
| Sector allocation as of June 30, 201610 | |
| | | Gross
exposure
(%) | | | Net
exposure
(%) | |
Consumer Discretionary | | | 20 | | | | 26 | |
Consumer Staples | | | 11 | | | | 16 | |
Energy | | | 6 | | | | 1 | |
Financials | | | 7 | | | | 9 | |
Health Care | | | 10 | | | | 14 | |
Industrials | | | 7 | | | | 8 | |
Information Technology | | | 12 | | | | 10 | |
Materials | | | 5 | | | | 5 | |
Telecommunication Services | | | 2 | | | | 3 | |
Utilities | | | 1 | | | | 2 | |
Other | | | 19 | | | | 6 | |
| | | | 100 | | | | 100 | |
We continue to have a bias toward equity hedged and relative value strategies that rely on fundamental-based research to identify high- and low-quality companies to go long and sell short. Unfortunately, with ongoing central bank intervention and episodic deleveraging, the past 12-month period did not witness any meaningful outperformance by strong secular growth stocks over those with poorer earnings quality. This market environment affected both the equity hedged and relative value sleeves. However, we believe that the Fund’s equity hedged and relative value sleeves now incorporate significant embedded value and are well-positioned to benefit as prices converge with fundamentals.
We maintained a relatively low weight to the event-driven strategy throughout the period based on a conviction that special situation value equities and credit securities would underperform in an environment of slow and uncertain economic growth. While the event driven
Please see footnotes on page 5.
| | | | | | |
| Performance highlights (unaudited) | | Wells Fargo Alternative Strategies Fund | | | 7 | |
strategy did detract from performance, its impact was contained by the lower allocation. Non-agency residential mortgage-backed securities (RMBS) positioning was profitable in the second half of the period but the strategy was unable to regain the ground lost earlier in the year on corporate credit and deep-value equities. We believe the risk/reward trade-off in corporate credit remains poor, and we have shifted more of the Fund’s exposure to structured credit opportunities. Non-agency RMBS credit fundamentals have improved since 2008 as homeowners have accumulated more equity in their homes. Non-agency RMBS are typically low-duration securities with low sensitivity to interest rates, making them more attractive at this time relative to other fixed-income sectors.
Performance within the global macro sleeve was mixed, with commodity trading advisor (CTA) allocations generating strong results that were offset by losses from valuation-driven models. Losses came predominantly from equity positions, notably long the Japanese TOPIX and German DAX markets and short the S&P 500 Index. The Japanese equity market is currently trading at a discount relative to other developed markets partly because of fatigue Abenomics. Prime Minister Shinzo Abe’s policies intended to spark economic growth and partly because of a strengthening yen that has fueled doubts about the country’s ability to overcome its deflation troubles. Europe was showing signs of economic improvement despite China’s economic slowdown but now has had to contend with uncertainty and fallout of the Brexit vote. On the other hand, CTA models benefited from strong trends that persisted through the year. Early in the year, short positioning in energy-related commodities was profitable but the subsequent upturn in oil prices reversed some of those gains. Contributing to performance were long gold and short emerging markets currency positions. Long yen and short British pound and euro positions were additive at the end of the year.
|
| Strategy allocation as of June 30, 201611 |
|
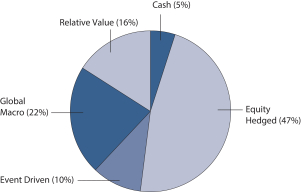 |
The Fund’s subadvisors have maintained conviction in most of their core positions but have tempered conviction by increasing portfolio hedges. As a result, the Fund’s gross exposure has been fairly steady while its net exposure has gradually trended down over the past year. This is consistent with our macro perspective that it is prudent to take less directional exposure because of the headwinds to global growth and unusually high valuations in the U.S. At present, the S&P 500 Index is trading at about a 25 times price/earnings multiple, which is a higher multiple than it has been for 90% of the time in the past eight decades. Easy monetary policy appears to be nearing its limits to inflate the prices of risk assets. We believe the Fund is well-positioned to resume generating strong risk-adjusted returns as the effects of central bank stimulus moderate and markets start reflecting corporate fundamentals.
| | | | |
Ten largest long position holdings (%) as of
June 30, 201612 | |
AQR Managed Futures Strategy Fund Class I | | | 8.11 | |
Allergan plc | | | 1.55 | |
The Sherwin-Williams Company | | | 1.17 | |
Facebook Incorporated Class A | | | 1.13 | |
Constellation Brands Incorporated Class A | | | 1.04 | |
Halliburton Company | | | 1.01 | |
Carrington Mortgage Loan Trust Series 06-NC4 Class A3, 0.61%, 10-25-2036 | | | 0.90 | |
Credit-Based Asset Servicing and Securitization Series 07-CB4 Class A1B, 0.63%, 4-25-2037 | | | 0.87 | |
Charter Communications Incorporated Class A | | | 0.83 | |
Microsoft Corporation | | | 0.83 | |
| | | | |
Ten largest short position holdings (%) as of
June 30, 201612 | |
SPDR S&P 500 ETF | | | (7.03) | |
Consumer Staples Select Sector SPDR Fund ETF | | | (0.75) | |
Occidental Petroleum Corporation | | | (0.69) | |
Electronic Arts Incorporated | | | (0.66) | |
Schlumberger Limited | | | (0.61) | |
International Business Machines Corporation | | | (0.58) | |
Infosys Limited ADR | | | (0.57) | |
Corning Incorporated | | | (0.55) | |
Equinix Incorporated | | | (0.50) | |
National Oilwell Varco Incorporated | | | (0.47) | |
Please see footnotes on page 5.
| | | | |
| 8 | | Wells Fargo Alternative Strategies Fund | | Fund expenses (unaudited) |
As a shareholder of the Fund, you incur two types of costs: (1) transaction costs, including sales charges (loads) on purchase payments and contingent deferred sales charges (if any) on redemptions and (2) ongoing costs, including management fees, distribution (12b-1) and/or shareholder servicing fees, and other Fund expenses. This example is intended to help you understand your ongoing costs (in dollars) of investing in the Fund and to compare these costs with the ongoing costs of investing in other mutual funds.
The example is based on an investment of $1,000 invested at the beginning of the six-month period and held for the entire period from January 1, 2016 to June 30, 2016.
Actual expenses
The “Actual” line of the table below provides information about actual account values and actual expenses. You may use the information in this line, together with the amount you invested, to estimate the expenses that you paid over the period. Simply divide your account value by $1,000 (for example, an $8,600 account value divided by $1,000 = 8.6), then multiply the result by the number in the “Actual” line under the heading entitled “Expenses paid during period” for your applicable class of shares to estimate the expenses you paid on your account during this period.
Hypothetical example for comparison purposes
The “Hypothetical” line of the table below provides information about hypothetical account values and hypothetical expenses based on the Fund’s actual expense ratio and an assumed rate of return of 5% per year before expenses, which is not the Fund’s actual return. The hypothetical account values and expenses may not be used to estimate the actual ending account balance or expenses you paid for the period. You may use this information to compare the ongoing costs of investing in the Fund and other funds. To do so, compare this 5% hypothetical example with the 5% hypothetical examples that appear in the shareholder reports of the other funds.
Please note that the expenses shown in the table are meant to highlight your ongoing costs only and do not reflect any transactional costs, such as sales charges (loads) and contingent deferred sales charges. Therefore, the “Hypothetical” line of the table is useful in comparing ongoing costs only and will not help you determine the relative total costs of owning different funds. In addition, if these transactional costs were included, your costs would have been higher.
| | | | | | | | | | | | | | | | |
| | | Beginning
account value
1-1-2016 | | | Ending
account value
6-30-2016 | | | Expenses
paid during
the period¹ | | | Net annualized
expense ratio | |
Class A | | | | | | | | | | | | | | | | |
Actual | | $ | 1,000.00 | | | $ | 1,025.00 | | | $ | 14.78 | | | | 2.94 | % |
Hypothetical (5% return before expenses) | | $ | 1,000.00 | | | $ | 1,010.26 | | | $ | 14.68 | | | | 2.94 | % |
Class C | | | | | | | | | | | | | | | | |
Actual | | $ | 1,000.00 | | | $ | 1,026.70 | | | $ | 18.55 | | | | 3.68 | % |
Hypothetical (5% return before expenses) | | $ | 1,000.00 | | | $ | 1,006.56 | | | $ | 18.37 | | | | 3.68 | % |
Administrator Class | | | | | | | | | | | | | | | | |
Actual | | $ | 1,000.00 | | | $ | 1,021.40 | | | $ | 14.05 | | | | 2.80 | % |
Hypothetical (5% return before expenses) | | $ | 1,000.00 | | | $ | 1,010.96 | | | $ | 13.98 | | | | 2.80 | % |
Institutional Class | | | | | | | | | | | | | | | | |
Actual | | $ | 1,000.00 | | | $ | 1,020.40 | | | $ | 13.46 | | | | 2.68 | % |
Hypothetical (5% return before expenses) | | $ | 1,000.00 | | | $ | 1,011.54 | | | $ | 13.40 | | | | 2.68 | % |
| 1 | Expenses paid is equal to the annualized expense ratio of each class multiplied by the average account value over the period, multiplied by the number of days in the most recent fiscal half-year divided by the number of days in the fiscal year (to reflect the one-half-year period). |
| | | | | | |
| Portfolio of investments—June 30, 2016 | | Wells Fargo Alternative Strategies Fund | | | 9 | |
| | | | | | | | | | | | | | | | |
| Security name | | | | | | | | Shares | | | Value | |
| | | | |
Common Stocks: 54.52% | | | | | | | | | | | | | | | | |
| | | | |
Consumer Discretionary: 13.31% | | | | | | | | | | | | | | | | |
| | | | |
| Auto Components: 0.83% | | | | | | | | | | | | | | | | |
Delphi Automotive plc | | | | | | | | | | | 14,674 | | | $ | 918,592 | |
Magna International Incorporated | | | | | | | | | | | 28,098 | | | | 985,397 | |
Nissin Kogyo Company Limited | | | | | | | | | | | 1,830 | | | | 23,439 | |
Tachi-S Company Limited | | | | | | | | | | | 1,390 | | | | 20,439 | |
Tokai Rika Company Limited | | | | | | | | | | | 1,085 | | | | 16,027 | |
Toyo Tire & Rubber Company Limited | | | | | | | | | | | 4,268 | | | | 46,527 | |
Toyota Industries Corporation | | | | | | | | | | | 985 | | | | 39,163 | |
TS Tech Company Limited | | | | | | | | | | | 1,140 | | | | 27,934 | |
| | | | |
| | | | | | | | | | | | | | | 2,077,518 | |
| | | | | | | | | | | | | | | | |
| | | | |
| Automobiles: 0.08% | | | | | | | | | | | | | | | | |
Chongqing Changchun Automobile Class B | | | | | | | | | | | 38,880 | | | | 54,462 | |
Fuji Heavy Industries Limited | | | | | | | | | | | 1,150 | | | | 39,529 | |
Isuzu Motors Limited | | | | | | | | | | | 2,790 | | | | 34,364 | |
Mazda Motor Corporation | | | | | | | | | | | 1,165 | | | | 15,417 | |
Peugeot SA † | | | | | | | | | | | 970 | | | | 11,627 | |
Renault SA | | | | | | | | | | | 410 | | | | 30,954 | |
Suzuki Motor Corporation | | | | | | | | | | | 665 | | | | 18,007 | |
| | | | |
| | | | | | | | | | | | | | | 204,360 | |
| | | | | | | | | | | | | | | | |
| | | | |
| Diversified Consumer Services: 0.11% | | | | | | | | | | | | | | | | |
Kroton Educacional SA | | | | | | | | | | | 14,048 | | | | 59,475 | |
New Oriental Education & Technology Group Incorporated | | | | | | | | | | | 1,867 | | | | 78,190 | |
Service Corporation International | | | | | | | | | | | 5,452 | | | | 147,422 | |
| | | | |
| | | | | | | | | | | | | | | 285,087 | |
| | | | | | | | | | | | | | | | |
| | | | |
| Hotels, Restaurants & Leisure: 2.59% | | | | | | | | | | | | | | | | |
Caesars Acquisition Company Class A † | | | | | | | | | | | 1,887 | | | | 21,172 | |
Caesars Entertainment Corporation † | | | | | | | | | | | 3,485 | | | | 26,800 | |
Chipotle Mexican Grill Incorporated † | | | | | | | | | | | 317 | | | | 127,675 | |
ClubCorp Holdings Incorporated | | | | | | | | | | | 5,171 | | | | 67,223 | |
Compass Group plc | | | | | | | | | | | 3,209 | | | | 61,052 | |
Domino’s Pizza Incorporated | | | | | | | | | | | 7,108 | | | | 933,849 | |
Fuji Kyuko Company Limited | | | | | | | | | | | 1,370 | | | | 19,156 | |
Genting Singapore plc | | | | | | | | | | | 40,010 | | | | 21,704 | |
H.I.S. Company Limited | | | | | | | | | | | 795 | | | | 25,675 | |
Hilton Worldwide Holdings Incorporated | | | | | | | | | | | 49,171 | | | | 1,107,823 | |
Las Vegas Sands Corporation | | | | | | | | | | | 2,928 | | | | 127,339 | |
Mandarin Oriental International Limited | | | | | | | | | | | 22,600 | | | | 30,623 | |
McDonald’s Corporation (b) | | | | | | | | | | | 4,425 | | | | 532,505 | |
MGM Resorts International †(b) | | | | | | | | | | | 32,607 | | | | 737,896 | |
Norwegian Cruise Line Holdings Limited † | | | | | | | | | | | 371 | | | | 14,781 | |
OPAP SA | | | | | | | | | | | 8,484 | | | | 59,129 | |
Panera Bread Company Class A † | | | | | | | | | | | 324 | | | | 68,669 | |
Royal Caribbean Cruises Limited | | | | | | | | | | | 8,029 | | | | 539,147 | |
Sands China Limited | | | | | | | | | | | 17,280 | | | | 58,474 | |
The accompanying notes are an integral part of these financial statements.
| | | | |
| 10 | | Wells Fargo Alternative Strategies Fund | | Portfolio of investments—June 30, 2016 |
| | | | | | | | | | | | | | | | |
| Security name | | | | | | | | Shares | | | Value | |
| | | | |
| Hotels, Restaurants & Leisure (continued) | | | | | | | | | | | | | | | | |
Sonic Corporation | | | | | | | | | | | 45,747 | | | $ | 1,237,456 | |
Starbucks Corporation (b) | | | | | | | | | | | 11,198 | | | | 639,630 | |
TUI AG | | | | | | | | | | | 3,912 | | | | 44,437 | |
| | | | |
| | | | | | | | | | | | | | | 6,502,215 | |
| | | | | | | | | | | | | | | | |
| | | | |
| Household Durables: 0.07% | | | | | | | | | | | | | | | | |
Alpine Electronics Incorporated | | | | | | | | | | | 1,715 | | | | 16,807 | |
Cairn Homes plc † | | | | | | | | | | | 110,464 | | | | 117,684 | |
Panahome Corporation | | | | | | | | | | | 2,320 | | | | 18,365 | |
Zojirushi Corporation | | | | | | | | | | | 617 | | | | 11,724 | |
| | | | |
| | | | | | | | | | | | | | | 164,580 | |
| | | | | | | | | | | | | | | | |
| | | | |
| Internet & Catalog Retail: 1.95% | | | | | | | | | | | | | | | | |
Amazon.com Incorporated † | | | | | | | | | | | 2,009 | | | | 1,437,681 | |
Expedia Incorporated | | | | | | | | | | | 309 | | | | 32,847 | |
Home Retail Group plc | | | | | | | | | | | 13,580 | | | | 27,810 | |
Netflix Incorporated † | | | | | | | | | | | 5,669 | | | | 518,600 | |
Qliro Group AB † | | | | | | | | | | | 12,748 | | | | 14,013 | |
Rakuten Incorporated | | | | | | | | | | | 2,300 | | | | 24,736 | |
Start Today Company Limited | | | | | | | | | | | 359 | | | | 18,976 | |
The Priceline Group Incorporated † | | | | | | | | | | | 1,599 | | | | 1,996,208 | |
Wayfair Incorporated Class A † | | | | | | | | | | | 21,393 | | | | 834,327 | |
| | | | |
| | | | | | | | | | | | | | | 4,905,198 | |
| | | | | | | | | | | | | | | | |
| | | | |
| Leisure Products: 0.03% | | | | | | | | | | | | | | | | |
Bandai Namco Holdings Incorporated | | | | | | | | | | | 1,680 | | | | 43,355 | |
Sankyo Company Limited | | | | | | | | | | | 495 | | | | 18,559 | |
Yamaha Corporation | | | | | | | | | | | 419 | | | | 11,293 | |
| | | | |
| | | | | | | | | | | | | | | 73,207 | |
| | | | | | | | | | | | | | | | |
| | | | |
| Media: 4.18% | | | | | | | | | | | | | | | | |
Charter Communications Incorporated Class A † | | | | | | | | | | | 9,150 | | | | 2,092,056 | |
Clear Channel Outdoor Holdings Incorporated Class A | | | | | | | | | | | 4,337 | | | | 26,976 | |
Comcast Corporation Class A (b) | | | | | | | | | | | 17,691 | | | | 1,153,277 | |
Daiichikosho Company Limited | | | | | | | | | | | 450 | | | | 18,865 | |
Discovery Communications Incorporated Class A †(b) | | | | | | | | | | | 11,498 | | | | 290,095 | |
DISH Network Corporation Class A †(b) | | | | | | | | | | | 32,281 | | | | 1,691,525 | |
JC Decaux SA | | | | | | | | | | | 26,221 | | | | 884,089 | |
Liberty Latin America and Caribbean Group Class A † | | | | | | | | | | | 3,006 | | | | 96,974 | |
M6 Metropole Television SA | | | | | | | | | | | 1,721 | | | | 28,613 | |
Nippon Television Network Corporation | | | | | | | | | | | 2,645 | | | | 43,670 | |
SES SA | | | | | | | | | | | 6,175 | | | | 132,192 | |
Sky plc | | | | | | | | | | | 12,219 | | | | 138,850 | |
The Walt Disney Company | | | | | | | | | | | 10,789 | | | | 1,055,380 | |
Time Warner Incorporated | | | | | | | | | | | 26,490 | | | | 1,948,075 | |
TV Asahi Corporation | | | | | | | | | | | 2,005 | | | | 32,647 | |
Twenty-First Century Fox Incorporated Class A (b) | | | | | | | | | | | 20,524 | | | | 555,174 | |
Viacom Incorporated Class B | | | | | | | | | | | 4,748 | | | | 196,900 | |
The accompanying notes are an integral part of these financial statements.
| | | | | | |
| Portfolio of investments—June 30, 2016 | | Wells Fargo Alternative Strategies Fund | | | 11 | |
| | | | | | | | | | | | | | | | |
| Security name | | | | | | | | Shares | | | Value | |
| | | | |
| Media (continued) | | | | | | | | | | | | | | | | |
Wolters Kluwer NV | | | | | | | | | | | 2,526 | | | $ | 102,281 | |
| | | | |
| | | | | | | | | | | | | | | 10,487,639 | |
| | | | | | | | | | | | | | | | |
| | | | |
| Multiline Retail: 0.27% | | | | | | | | | | | | | | | | |
Dollar Tree Incorporated †(b) | | | | | | | | | | | 6,916 | | | | 651,764 | |
Seria Company Limited | | | | | | | | | | | 196 | | | | 16,222 | |
| | | | |
| | | | | | | | | | | | | | | 667,986 | |
| | | | | | | | | | | | | | | | |
| | | | |
| Specialty Retail: 2.65% | | | | | | | | | | | | | | | | |
Adastria Company Limited | | | | | | | | | | | 627 | | | | 24,846 | |
Advance Auto Parts Incorporated | | | | | | | | | | | 418 | | | | 67,561 | |
Aoyama Trading Company Limited | | | | | | | | | | | 865 | | | | 31,898 | |
AutoNation Incorporated † | | | | | | | | | | | 33,200 | | | | 1,559,736 | |
AutoZone Incorporated † | | | | | | | | | | | 1,956 | | | | 1,552,751 | |
Gulliver International Company Limited | | | | | | | | | | | 1,541 | | | | 12,649 | |
Hornbach Holding AG & Company KGaA | | | | | | | | | | | 776 | | | | 52,619 | |
Jumbo SA † | | | | | | | | | | | 1,107 | | | | 14,563 | |
Lowe’s Companies Incorporated | | | | | | | | | | | 448 | | | | 35,468 | |
Luk Fook Holdings International Limited | | | | | | | | | | | 3,795 | | | | 8,389 | |
O’Reilly Automotive Incorporated † | | | | | | | | | | | 1,767 | | | | 479,034 | |
Pal Company Limited | | | | | | | | | | | 850 | | | | 20,040 | |
Shimamura Company Limited | | | | | | | | | | | 243 | | | | 36,155 | |
The Home Depot Incorporated | | | | | | | | | | | 14,167 | | | | 1,808,984 | |
The TJX Companies Incorporated (b) | | | | | | | | | | | 10,620 | | | | 820,183 | |
Vitamin Shoppe Incorporated † | | | | | | | | | | | 3,392 | | | | 103,693 | |
Yamada Denki Company Limited | | | | | | | | | | | 3,472 | | | | 18,328 | |
| | | | |
| | | | | | | | | | | | | | | 6,646,897 | |
| | | | | | | | | | | | | | | | |
| | | | |
| Textiles, Apparel & Luxury Goods: 0.55% | | | | | | | | | | | | | | | | |
Brunello Cucinelli SpA | | | | | | | | | | | 1,640 | | | | 29,411 | |
Crocs Incorporated † | | | | | | | | | | | 5,635 | | | | 63,563 | |
Global Brands Group Holding Limited † | | | | | | | | | | | 227,495 | | | | 20,015 | |
Nike Incorporated Class B | | | | | | | | | | | 20,462 | | | | 1,129,503 | |
Pandora AS | | | | | | | | | | | 169 | | | | 23,018 | |
Ralph Lauren Corporation | | | | | | | | | | | 314 | | | | 28,141 | |
Samsonite International SA | | | | | | | | | | | 14,000 | | | | 38,764 | |
VF Corporation | | | | | | | | | | | 894 | | | | 54,972 | |
| | | | |
| | | | | | | | | | | | | | | 1,387,387 | |
| | | | | | | | | | | | | | | | |
| | | | |
Consumer Staples: 7.62% | | | | | | | | | | | | | | | | |
| | | | |
| Beverages: 4.13% | | | | | | | | | | | | | | | | |
Anheuser-Busch InBev NV ADR | | | | | | | | | | | 6,106 | | | | 804,038 | |
Asahi Breweries Limited | | | | | | | | | | | 1,005 | | | | 32,496 | |
Brown-Forman Corporation Class B | | | | | | | | | | | 8,510 | | | | 848,958 | |
C&C Group plc | | | | | | | | | | | 14,884 | | | | 58,376 | |
Coca-Cola HBC AG | | | | | | | | | | | 1,816 | | | | 36,746 | |
Constellation Brands Incorporated Class A (b) | | | | | | | | | | | 15,741 | | | | 2,603,561 | |
Diageo plc | | | | | | | | | | | 3,120 | | | | 87,159 | |
Heineken Malaysia Bhd | | | | | | | | | | | 7,950 | | | | 29,827 | |
The accompanying notes are an integral part of these financial statements.
| | | | |
| 12 | | Wells Fargo Alternative Strategies Fund | | Portfolio of investments—June 30, 2016 |
| | | | | | | | | | | | | | | | |
| Security name | | | | | | | | Shares | | | Value | |
| | | | |
| Beverages (continued) | | | | | | | | | | | | | | | | |
Heineken NV | | | | | | | | | | | 10,123 | | | $ | 928,500 | |
Molson Coors Brewing Company Class B (b) | | | | | | | | | | | 19,505 | | | | 1,972,540 | |
Monster Beverage Corporation † | | | | | | | | | | | 10,981 | | | | 1,764,757 | |
PepsiCo Incorporated | | | | | | | | | | | 621 | | | | 65,789 | |
Sapporo Holdings Limited | | | | | | | | | | | 1,030 | | | | 29,775 | |
The Coca-Cola Company | | | | | | | | | | | 23,304 | | | | 1,056,371 | |
Vina Concha y Toro SA | | | | | | | | | | | 11,707 | | | | 18,484 | |
Yantai Changyu Pioneer Wine Company Limited Class B | | | | | | | | | | | 14,405 | | | | 43,638 | |
| | | | |
| | | | | | | | | | | | | | | 10,381,015 | |
| | | | | | | | | | | | | | | | |
| | | | |
| Food & Staples Retailing: 1.35% | | | | | | | | | | | | | | | | |
Ain Holdings Incorporated | | | | | | | | | | | 254 | | | | 19,702 | |
Alimentation Couche-Tard Incorporated Class B | | | | | | | | | | | 491 | | | | 21,085 | |
Belc Company Limited | | | | | | | | | | | 199 | | | | 8,296 | |
Casey’s General Stores Incorporated | | | | | | | | | | | 7,810 | | | | 1,027,093 | |
Cocokara Fine Incorporated | | | | | | | | | | | 371 | | | | 19,228 | |
Costco Wholesale Corporation (b) | | | | | | | | | | | 12,549 | | | | 1,970,695 | |
Create SD Holdings Company Limited | | | | | | | | | | | 716 | | | | 20,311 | |
J Sainsbury plc | | | | | | | | | | | 18,818 | | | | 58,622 | |
Metro AG | | | | | | | | | | | 1,981 | | | | 60,928 | |
Sundrug Company Limited | | | | | | | | | | | 755 | | | | 70,891 | |
Tsuruha Holdings Incorporated | | | | | | | | | | | 388 | | | | 46,982 | |
Walgreens Boots Alliance Incorporated | | | | | | | | | | | 816 | | | | 67,948 | |
| | | | |
| | | | | | | | | | | | | | | 3,391,781 | |
| | | | | | | | | | | | | | | | |
| | | | |
| Food Products: 1.55% | | | | | | | | | | | | | | | | |
Ariake Japan Company Limited | | | | | | | | | | | 443 | | | | 26,374 | |
Chocoladefabriken Lindt & Sprungli AG | | | | | | | | | | | 22 | | | | 1,572,194 | |
ConAgra Foods Incorporated | | | | | | | | | | | 5,555 | | | | 262,868 | |
Greencore Group plc | | | | | | | | | | | 26,517 | | | | 109,127 | |
Kikkoman Corporation | | | | | | | | | | | 578 | | | | 21,328 | |
Meiji Holdings Company Limited | | | | | | | | | | | 808 | | | | 83,026 | |
Mondelez International Incorporated Class A (b) | | | | | | | | | | | 15,912 | | | | 724,155 | |
Morinaga & Company Limited | | | | | | | | | | | 2,402 | | | | 15,145 | |
Nestle SA | | | | | | | | | | | 1,044 | | | | 80,887 | |
Nippon Flour Mills Company Limited | | | | | | | | | | | 1,595 | | | | 12,464 | |
Nisshin Seifun Group Incorporated | | | | | | | | | | | 611 | | | | 9,822 | |
Post Holdings Incorporated † | | | | | | | | | | | 1,492 | | | | 123,373 | |
Suedzucker AG | | | | | | | | | | | 1,786 | | | | 39,338 | |
The J.M. Smucker Company | | | | | | | | | | | 950 | | | | 144,790 | |
The Kraft Heinz Company (b) | | | | | | | | | | | 7,273 | | | | 643,515 | |
Yamazaki Baking Company Limited | | | | | | | | | | | 545 | | | | 15,215 | |
| | | | |
| | | | | | | | | | | | | | | 3,883,621 | |
| | | | | | | | | | | | | | | | |
| | | | |
| Household Products: 0.16% | | | | | | | | | | | | | | | | |
Colgate-Palmolive Company | | | | | | | | | | | 2,553 | | | | 186,880 | |
Lion Corporation | | | | | | | | | | | 1,993 | | | | 32,883 | |
Reckitt Benckiser Group plc | | | | | | | | | | | 1,270 | | | | 127,345 | |
The Procter & Gamble Company | | | | | | | | | | | 522 | | | | 44,198 | |
| | | | |
| | | | | | | | | | | | | | | 391,306 | |
| | | | | | | | | | | | | | | | |
The accompanying notes are an integral part of these financial statements.
| | | | | | |
| Portfolio of investments—June 30, 2016 | | Wells Fargo Alternative Strategies Fund | | | 13 | |
| | | | | | | | | | | | | | | | |
| Security name | | | | | | | | Shares | | | Value | |
| | | | |
| Personal Products: 0.15% | | | | | | | | | | | | | | | | |
Beiersdorf AG | | | | | | | | | | | 287 | | | $ | 27,172 | |
Coty Incorporated | | | | | | | | | | | 954 | | | | 24,794 | |
Hypermarcas SA | | | | | | | | | | | 3,700 | | | | 26,664 | |
Kao Corporation | | | | | | | | | | | 232 | | | | 13,512 | |
Kose Corporation | | | | | | | | | | | 129 | | | | 10,931 | |
LG Household & Health Care Limited H Shares | | | | | | | | | | | 54 | | | | 52,734 | |
Natura Cosmeticos SA | | | | | | | | | | | 2,790 | | | | 22,148 | |
Oriflame Holding AG † | | | | | | | | | | | 2,123 | | | | 54,143 | |
Pola Orbis Holdings Incorporated | | | | | | | | | | | 181 | | | | 17,034 | |
The Estee Lauder Companies Incorporated Class A | | | | | | | | | | | 541 | | | | 49,242 | |
Unilever NV ADR | | | | | | | | | | | 1,863 | | | | 87,449 | |
| | | | |
| | | | | | | | | | | | | | | 385,823 | |
| | | | | | | | | | | | | | | | |
| | | | |
| Tobacco: 0.28% | | | | | | | | | | | | | | | | |
British American Tobacco plc | | | | | | | | | | | 10,478 | | | | 679,279 | |
Japan Tobacco Incorporated | | | | | | | | | | | 535 | | | | 21,562 | |
| | | | |
| | | | | | | | | | | | | | | 700,841 | |
| | | | | | | | | | | | | | | | |
| | | | |
Energy: 4.31% | | | | | | | | | | | | | | | | |
| | | | |
| Energy Equipment & Services: 1.17% | | | | | | | | | | | | | | | | |
Halliburton Company (b) | | | | | | | | | | | 56,144 | | | | 2,542,762 | |
Helmerich & Payne Incorporated | | | | | | | | | | | 535 | | | | 35,915 | |
Hilong Holding Limited | | | | | | | | | | | 105,180 | | | | 11,519 | |
Schlumberger Limited (b) | | | | | | | | | | | 4,380 | | | | 346,371 | |
Trican Well Service Limited † | | | | | | | | | | | 4,095 | | | | 7,829 | |
| | | | |
| | | | | | | | | | | | | | | 2,944,396 | |
| | | | | | | | | | | | | | | | |
| | | | |
| Oil, Gas & Consumable Fuels: 3.14% | | | | | | | | | | | | | | | | |
Anadarko Petroleum Corporation | | | | | | | | | | | 19,501 | | | | 1,038,428 | |
Apache Corporation | | | | | | | | | | | 1,014 | | | | 56,449 | |
BP plc | | | | | | | | | | | 32,718 | | | | 191,515 | |
Cabot Oil & Gas Corporation | | | | | | | | | | | 1,165 | | | | 29,987 | |
Canadian Natural Resources Limited | | | | | | | | | | | 1,624 | | | | 50,068 | |
Cobalt International Energy Incorporated † | | | | | | | | | | | 3,128 | | | | 4,192 | |
Concho Resources Incorporated †(b) | | | | | | | | | | | 5,748 | | | | 685,564 | |
Diamondback Energy Incorporated † | | | | | | | | | | | 365 | | | | 33,292 | |
Eni SpA | | | | | | | | | | | 7,584 | | | | 122,157 | |
EOG Resources Incorporated | | | | | | | | | | | 697 | | | | 58,144 | |
EQT Corporation | | | | | | | | | | | 5,954 | | | | 461,018 | |
Exxon Mobil Corporation (b) | | | | | | | | | | | 3,315 | | | | 310,748 | |
Hess Corporation | | | | | | | | | | | 6,100 | | | | 366,610 | |
Imperial Oil Limited | | | | | | | | | | | 2,020 | | | | 63,917 | |
Japan Petroleum Exploration Company | | | | | | | | | | | 1,220 | | | | 24,592 | |
Kinder Morgan Incorporated | | | | | | | | | | | 7,761 | | | | 145,286 | |
Marathon Oil Corporation | | | | | | | | | | | 2,085 | | | | 31,296 | |
Newfield Exploration Company † | | | | | | | | | | | 148 | | | | 6,539 | |
Noble Energy Incorporated (b) | | | | | | | | | | | 47,767 | | | | 1,713,402 | |
Petroleo Brasileiro SA ADR † | | | | | | | | | | | 5,122 | | | | 36,674 | |
Pioneer Natural Resources Company (b) | | | | | | | | | | | 5,007 | | | | 757,109 | |
The accompanying notes are an integral part of these financial statements.
| | | | |
| 14 | | Wells Fargo Alternative Strategies Fund | | Portfolio of investments—June 30, 2016 |
| | | | | | | | | | | | | | | | |
| Security name | | | | | | | | Shares | | | Value | |
| | | | |
| Oil, Gas & Consumable Fuels (continued) | | | | | | | | | | | | | | | | |
PrairieSky Royalty Limited | | | | | | | | | | | 33 | | | $ | 626 | |
QEP Resources Incorporated | | | | | | | | | | | 259 | | | | 4,566 | |
Royal Dutch Shell plc Class B | | | | | | | | | | | 3,934 | | | | 108,691 | |
Southwestern Energy Company † | | | | | | | | | | | 2,310 | | | | 29,060 | |
Statoil ASA | | | | | | | | | | | 1,921 | | | | 33,192 | |
Total SA | | | | | | | | | | | 3,081 | | | | 147,752 | |
TransCanada Corporation | | | | | | | | | | | 270 | | | | 12,217 | |
TransCanada Corporation-Subscription Receipt | | | | | | | | | | | 500 | | | | 22,571 | |
Valero Energy Corporation (b) | | | | | | | | | | | 25,937 | | | | 1,322,787 | |
WPX Energy Incorporated † | | | | | | | | | | | 973 | | | | 9,059 | |
| | | | |
| | | | | | | | | | | | | | | 7,877,508 | |
| | | | | | | | | | | | | | | | |
| | | | |
Financials: 4.63% | | | | | | | | | | | | | | | | |
| | | | |
| Banks: 1.50% | | | | | | | | | | | | | | | | |
Alpha Bank AE † | | | | | | | | | | | 13,393 | | | | 25,095 | |
Banca Popolare dell’Emilia Romagna Scarl | | | | | | | | | | | 11,296 | | | | 41,472 | |
Banco Macro SA | | | | | | | | | | | 440 | | | | 32,657 | |
Banco Popular Espanol SA | | | | | | | | | | | 35,603 | | | | 46,268 | |
Bank of America Corporation (b) | | | | | | | | | | | 77,460 | | | | 1,027,894 | |
Bank of Ireland † | | | | | | | | | | | 103,901 | | | | 21,419 | |
Bank of Nova Scotia | | | | | | | | | | | 765 | | | | 37,493 | |
Bank of the Ozarks Incorporated (b) | | | | | | | | | | | 13,731 | | | | 515,187 | |
BNP Paribas SA | | | | | | | | | | | 4,057 | | | | 177,922 | |
CaixaBank SA | | | | | | | | | | | 17,600 | | | | 38,790 | |
Citigroup Incorporated | | | | | | | | | | | 2,887 | | | | 122,380 | |
Citizens Financial Group Incorporated | | | | | | | | | | | 1,300 | | | | 25,974 | |
Eurobank Ergasias SA † | | | | | | | | | | | 48,324 | | | | 30,590 | |
HDFC Bank Limited ADR | | | | | | | | | | | 729 | | | | 48,369 | |
HSBC Holdings plc | | | | | | | | | | | 22,160 | | | | 137,293 | |
ICICI Bank Limited ADR | | | | | | | | | | | 7,013 | | | | 50,353 | |
ING Groep NV | | | | | | | | | | | 6,294 | | | | 65,117 | |
Itau Unibanco Holding SA ADR | | | | | | | | | | | 4,372 | | | | 41,272 | |
Japan Post Bank Company Limited | | | | | | | | | | | 1,535 | | | | 18,050 | |
JPMorgan Chase & Company | | | | | | | | | | | 599 | | | | 37,222 | |
M&T Bank Corporation | | | | | | | | | | | 209 | | | | 24,710 | |
Mitsubishi UFJ Financial Group Incorporated | | | | | | | | | | | 17,212 | | | | 77,159 | |
PNC Financial Services Group Incorporated | | | | | | | | | | | 1,894 | | | | 154,153 | |
Sberbank of Russia (a) | | | | | | | | | | | 20,340 | | | | 42,288 | |
Signature Bank † | | | | | | | | | | | 1,668 | | | | 208,367 | |
Societe Generale SA | | | | | | | | | | | 2,353 | | | | 73,616 | |
Standard Chartered plc | | | | | | | | | | | 9,532 | | | | 72,319 | |
Sumitomo Mitsui Financial Group Incorporated | | | | | | | | | | | 1,320 | | | | 38,115 | |
The San-in Godo Bank Limited | | | | | | | | | | | 2,870 | | | | 18,739 | |
UniCredit SpA | | | | | | | | | | | 15,167 | | | | 33,356 | |
Western Alliance Bancorp †(b) | | | | | | | | | | | 14,778 | | | | 482,502 | |
| | | | |
| | | | | | | | | | | | | | | 3,766,141 | |
| | | | | | | | | | | | | | | | |
| | | | |
| Capital Markets: 1.02% | | | | | | | | | | | | | | | | |
Affiliated Managers Group Incorporated †(b) | | | | | | | | | | | 3,927 | | | | 552,804 | |
The accompanying notes are an integral part of these financial statements.
| | | | | | |
| Portfolio of investments—June 30, 2016 | | Wells Fargo Alternative Strategies Fund | | | 15 | |
| | | | | | | | | | | | | | | | |
| Security name | | | | | | | | Shares | | | Value | |
| | | | |
| Capital Markets (continued) | | | | | | | | | | | | | | | | |
Aizawa Securities Company Limited | | | | | | | | | | | 2,550 | | | $ | 12,916 | |
ANIMA Holding SpA 144A | | | | | | | | | | | 9,477 | | | | 44,680 | |
EFG International AG | | | | | | | | | | | 2,019 | | | | 7,650 | |
Ichiyoshi Securities Company Limited | | | | | | | | | | | 4,625 | | | | 33,348 | |
Invesco Limited | | | | | | | | | | | 12,125 | | | | 309,673 | |
Julius Baer Group Limited | | | | | | | | | | | 2,163 | | | | 87,057 | |
Nihon M&A Center Incorporated | | | | | | | | | | | 337 | | | | 21,888 | |
OM Asset Management plc | | | | | | | | | | | 11,755 | | | | 156,929 | |
Raymond James Financial Incorporated | | | | | | | | | | | 1,108 | | | | 54,624 | |
SEI Investments Company | | | | | | | | | | | 22,954 | | | | 1,104,317 | |
UBS Group AG | | | | | | | | | | | 13,574 | | | | 176,131 | |
| | | | |
| | | | | | | | | | | | | | | 2,562,017 | |
| | | | | | | | | | | | | | | | |
| | | | |
| Consumer Finance: 0.14% | | | | | | | | | | | | | | | | |
Ally Financial Incorporated † | | | | | | | | | | | 12,337 | | | | 210,593 | |
Navient Corporation | | | | | | | | | | | 7,135 | | | | 85,263 | |
Santander Consumer USA Holdings Incorporated † | | | | | | | | | | | 5,460 | | | | 56,402 | |
| | | | |
| | | | | | | | | | | | | | | 352,258 | |
| | | | | | | | | | | | | | | | |
| | | | |
| Diversified Financial Services: 0.57% | | | | | | | | | | | | | | | | |
Amundi SA | | | | | | | | | | | 1,795 | | | | 74,583 | |
Hellenic Exchanges SA Holding | | | | | | | | | | | 7,274 | | | | 34,882 | |
Intercontinental Exchange Incorporated | | | | | | | | | | | 744 | | | | 190,434 | |
MarketAxess Holdings Incorporated | | | | | | | | | | | 371 | | | | 53,943 | |
Markit Limited † | | | | | | | | | | | 2,562 | | | | 83,521 | |
Moody’s Corporation | | | | | | | | | | | 8,555 | | | | 801,689 | |
MSCI Incorporated | | | | | | | | | | | 874 | | | | 67,403 | |
Rescap Liquidating Trust † | | | | | | | | | | | 5,781 | | | | 52,029 | |
S&P Global Incorporated | | | | | | | | | | | 741 | | | | 79,480 | |
| | | | |
| | | | | | | | | | | | | | | 1,437,964 | |
| | | | | | | | | | | | | | | | |
| | | | |
| Insurance: 0.60% | | | | | | | | | | | | | | | | |
Ageas NV | | | | | | | | | | | 2,268 | | | | 78,834 | |
Ambac Financial Group Incorporated †(b) | | | | | | | | | | | 3,037 | | | | 49,989 | |
American International Group Incorporated | | | | | | | | | | | 3,018 | | | | 159,622 | |
Assicurazioni Generali SpA | | | | | | | | | | | 4,015 | | | | 47,346 | |
Chubb Limited | | | | | | | | | | | 662 | | | | 86,530 | |
Coface SA | | | | | | | | | | | 4,873 | | | | 32,965 | |
Delta Lloyd NV | | | | | | | | | | | 6,739 | | | | 23,679 | |
Fairfax Financial Holdings Limited | | | | | | | | | | | 94 | | | | 50,627 | |
MetLife Incorporated | | | | | | | | | | | 1,900 | | | | 75,677 | |
MS&AD Insurance Group Holdings Incorporated | | | | | | | | | | | 2,315 | | | | 59,982 | |
PICC Property & Casualty Company Limited H Shares | | | | | | | | | | | 17,400 | | | | 27,434 | |
Principal Financial Group Incorporated | | | | | | | | | | | 1,050 | | | | 43,166 | |
Saga plc | | | | | | | | | | | 26,014 | | | | 66,912 | |
Sony Financial Holdings Incorporated | | | | | | | | | | | 1,860 | | | | 21,031 | |
Storebrand ASA † | | | | | | | | | | | 13,643 | | | | 51,754 | |
T&D Holdings Incorporated | | | | | | | | | | | 6,084 | | | | 51,665 | |
Tokio Marine Holdings Incorporated | | | | | | | | | | | 1,370 | | | | 45,609 | |
The accompanying notes are an integral part of these financial statements.
| | | | |
| 16 | | Wells Fargo Alternative Strategies Fund | | Portfolio of investments—June 30, 2016 |
| | | | | | | | | | | | | | | | |
| Security name | | | | | | | | Shares | | | Value | |
| | | | |
| Insurance (continued) | | | | | | | | | | | | | | | | |
Torchmark Corporation | | | | | | | | | | | 468 | | | $ | 28,932 | |
Unum Group | | | | | | | | | | | 1,079 | | | | 34,301 | |
W.R. Berkley Corporation | | | | | | | | | | | 6,906 | | | | 413,808 | |
Zurich Insurance Group AG | | | | | | | | | | | 244 | | | | 60,361 | |
| | | | |
| | | | | | | | | | | | | | | 1,510,224 | |
| | | | | | | | | | | | | | | | |
| | | | |
| Real Estate Management & Development: 0.22% | | | | | | | | | | | | | | | | |
BR Malls Participacoes SA | | | | | | | | | | | 16,250 | | | | 65,004 | |
Corporacion Inmobiliaria Vesta SAB de CV | | | | | | | | | | | 17,280 | | | | 26,795 | |
Daito Trust Construction Company Limited | | | | | | | | | | | 245 | | | | 39,779 | |
Deutsche Wohnen AG | | | | | | | | | | | 1,536 | | | | 52,298 | |
Grand City Properties SA | | | | | | | | | | | 7,959 | | | | 163,778 | |
LEG Immobilien AG | | | | | | | | | | | 550 | | | | 51,463 | |
Leopalace21 Corporation | | | | | | | | | | | 3,450 | | | | 24,233 | |
Relo Holdings Incorporated | | | | | | | | | | | 414 | | | | 73,275 | |
Sumitomo Real Estate Sales Company Limited | | | | | | | | | | | 2,865 | | | | 56,325 | |
| | | | |
| | | | | | | | | | | | | | | 552,950 | |
| | | | | | | | | | | | | | | | |
| | | | |
| REITs: 0.57% | | | | | | | | | | | | | | | | |
American Tower Corporation | | | | | | | | | | | 1,240 | | | | 140,876 | |
Columbia Property Trust Incorporated | | | | | | | | | | | 1,003 | | | | 21,464 | |
Equinix Incorporated | | | | | | | | | | | 307 | | | | 119,033 | |
GLP J-REIT | | | | | | | | | | | 16 | | | | 20,196 | |
Grivalia Properties Real Estate Investment Company | | | | | | | | | | | 9,739 | | | | 76,400 | |
Hibernia REIT plc | | | | | | | | | | | 72,651 | | | | 108,037 | |
Host Hotels & Resorts Incorporated | | | | | | | | | | | 1,784 | | | | 28,919 | |
Intu Properties plc | | | | | | | | | | | 20,493 | | | | 79,672 | |
Irish Residential Properties REIT plc | | | | | | | | | | | 73,818 | | | | 90,931 | |
Kennedy Wilson Europe Real Estate plc | | | | | | | | | | | 5,779 | | | | 74,207 | |
LaSalle Logiport REIT | | | | | | | | | | | 41 | | | | 41,733 | |
National Retail Properties Incorporated | | | | | | | | | | | 6,172 | | | | 319,216 | |
National Storage REIT † | | | | | | | | | | | 7,037 | | | | 8,292 | |
National Storage REIT NPV | | | | | | | | | | | 21,648 | | | | 27,003 | |
Public Storage Incorporated (b) | | | | | | | | | | | 1,034 | | | | 264,280 | |
| | | | |
| | | | | | | | | | | | | | | 1,420,259 | |
| | | | | | | | | | | | | | | | |
| | | | |
| Thrifts & Mortgage Finance: 0.01% | | | | | | | | | | | | | | | | |
Genworth Mortgage Insurance | | | | | | | | | | | 9,054 | | | | 18,764 | |
| | | | | | | | | | | | | | | | |
| | | | |
Health Care: 6.57% | | | | | | | | | | | | | | | | |
| | | | |
| Biotechnology: 0.68% | | | | | | | | | | | | | | | | |
Alder Biopharmaceuticals Incorporated † | | | | | | | | | | | 812 | | | | 20,276 | |
Biogen Incorporated † | | | | | | | | | | | 1,885 | | | | 455,830 | |
Cepheid Incorporated † | | | | | | | | | | | 760 | | | | 23,370 | |
Gilead Sciences Incorporated (b) | | | | | | | | | | | 12,456 | | | | 1,039,079 | |
PeptiDream Incorporated † | | | | | | | | | | | 195 | | | | 11,663 | |
Regeneron Pharmaceuticals Incorporated † | | | | | | | | | | | 172 | | | | 60,068 | |
Tesaro Incorporated † | | | | | | | | | | | 463 | | | | 38,915 | |
The accompanying notes are an integral part of these financial statements.
| | | | | | |
| Portfolio of investments—June 30, 2016 | | Wells Fargo Alternative Strategies Fund | | | 17 | |
| | | | | | | | | | | | | | | | |
| Security name | | | | | | | | Shares | | | Value | |
| | | | |
| Biotechnology (continued) | | | | | | | | | | | | | | | | |
Vertex Pharmaceuticals Incorporated † | | | | | | | | | | | 751 | | | $ | 64,601 | |
| | | | |
| | | | | | | | | | | | | | | 1,713,802 | |
| | | | | | | | | | | | | | | | |
| | | | |
| Health Care Equipment & Supplies: 1.91% | | | | | | | | | | | | | | | | |
Align Technology Incorporated † | | | | | | | | | | | 354 | | | | 28,515 | |
Asahi Intecc Company Limited | | | | | | | | | | | 401 | | | | 19,595 | |
Becton Dickinson & Company (b) | | | | | | | | | | | 8,616 | | | | 1,461,187 | |
BioMerieux | | | | | | | | | | | 195 | | | | 26,422 | |
Boston Scientific Corporation † | | | | | | | | | | | 1,388 | | | | 32,438 | |
Danaher Corporation | | | | | | | | | | | 4,434 | | | | 447,834 | |
Dexcom Incorporated † | | | | | | | | | | | 558 | | | | 44,266 | |
Edwards Lifesciences Corporation † | | | | | | | | | | | 544 | | | | 54,253 | |
Hologic Incorporated † | | | | | | | | | | | 1,294 | | | | 44,772 | |
IDEXX Laboratories Incorporated † | | | | | | | | | | | 10,346 | | | | 960,730 | |
Intuitive Surgical Incorporated † | | | | | | | | | | | 51 | | | | 33,732 | |
Medtronic plc | | | | | | | | | | | 953 | | | | 82,692 | |
Paramount Bed Holdings Company Limited | | | | | | | | | | | 508 | | | | 25,786 | |
St. Jude Medical Incorporated | | | | | | | | | | | 18,810 | | | | 1,467,180 | |
Sysmex Corporation | | | | | | | | | | | 402 | | | | 27,681 | |
Terumo Corporation | | | | | | | | | | | 682 | | | | 29,105 | |
| | | | |
| | | | | | | | | | | | | | | 4,786,188 | |
| | | | | | | | | | | | | | | | |
| | | | |
| Health Care Providers & Services: 0.68% | | | | | | | | | | | | | | | | |
Acadia Healthcare Company Incorporated †(b) | | | | | | | | | | | 7,532 | | | | 417,272 | |
Brookdale Senior Living Incorporated † | | | | | | | | | | | 731 | | | | 11,287 | |
Cardinal Health Incorporated | | | | | | | | | | | 804 | | | | 62,720 | |
Envision Healthcare Holdings Incorporated † | | | | | | | | | | | 1,038 | | | | 26,334 | |
HCA Holdings Incorporated †(b) | | | | | | | | | | | 4,184 | | | | 322,210 | |
McKesson Corporation | | | | | | | | | | | 256 | | | | 47,782 | |
UnitedHealth Group Incorporated | | | | | | | | | | | 582 | | | | 82,178 | |
Universal Health Services Incorporated Class B (b) | | | | | | | | | | | 5,441 | | | | 729,638 | |
| | | | |
| | | | | | | | | | | | | | | 1,699,421 | |
| | | | | | | | | | | | | | | | |
| | | | |
| Health Care Technology: 0.01% | | | | | | | | | | | | | | | | |
Agfa-Gevaert NV † | | | | | | | | | | | 7,174 | | | | 23,289 | |
M3 Incorporated | | | | | | | | | | | 443 | | | | 15,461 | |
| | | | |
| | | | | | | | | | | | | | | 38,750 | |
| | | | | | | | | | | | | | | | |
| | | | |
| Life Sciences Tools & Services: 0.39% | | | | | | | | | | | | | | | | |
Thermo Fisher Scientific Incorporated | | | | | | | | | | | 6,589 | | | | 973,591 | |
| | | | | | | | | | | | | | | | |
| | | | |
| Pharmaceuticals: 2.90% | | | | | | | | | | | | | | | | |
Allergan plc † | | | | | | | | | | | 16,805 | | | | 3,883,468 | |
Almirall SA | | | | | | | | | | | 2,675 | | | | 40,219 | |
Astellas Pharma Incorporated | | | | | | | | | | | 2,220 | | | | 34,815 | |
AstraZeneca plc | | | | | | | | | | | 4,837 | | | | 289,173 | |
AstraZeneca plc ADR | | | | | | | | | | | 3,103 | | | | 93,680 | |
Bristol-Myers Squibb Company (b) | | | | | | | | | | | 13,465 | | | | 990,350 | |
Eisai Company Limited | | | | | | | | | | | 1,054 | | | | 58,851 | |
The accompanying notes are an integral part of these financial statements.
| | | | |
| 18 | | Wells Fargo Alternative Strategies Fund | | Portfolio of investments—June 30, 2016 |
| | | | | | | | | | | | | | | | |
| Security name | | | | | | | | Shares | | | Value | |
| | | | |
| Pharmaceuticals (continued) | | | | | | | | | | | | | | | | |
H. Lundbeck AS † | | | | | | | | | | | 1,643 | | | $ | 61,592 | |
Johnson & Johnson | | | | | | | | | | | 697 | | | | 84,546 | |
Merck & Company Incorporated | | | | | | | | | | | 2,333 | | | | 134,404 | |
Mylan NV † | | | | | | | | | | | 2,164 | | | | 93,571 | |
Novartis AG | | | | | | | | | | | 618 | | | | 51,009 | |
Ono Pharmaceutical Company Limited | | | | | | | | | | | 4,410 | | | | 192,104 | |
Otsuka Holdings Company Limited | | | | | | | | | | | 294 | | | | 13,548 | |
Pfizer Incorporated (b) | | | | | | | | | | | 30,414 | | | | 1,070,877 | |
Roche Holding AG | | | | | | | | | | | 156 | | | | 41,165 | |
Shionogi & Company Limited | | | | | | | | | | | 1,336 | | | | 73,034 | |
Sosei Group Corporation † | | | | | | | | | | | 117 | | | | 21,790 | |
Teva Pharmaceutical Industries Limited ADR | | | | | | | | | | | 710 | | | | 35,663 | |
UCB SA | | | | | | | | | | | 432 | | | | 32,438 | |
| | | | |
| | | | | | | | | | | | | | | 7,296,297 | |
| | | | | | | | | | | | | | | | |
| | | | |
Industrials: 4.40% | | | | | | | | | | | | | | | | |
| | | | |
| Aerospace & Defense: 1.49% | | | | | | | | | | | | | | | | |
Airbus Group NV | | | | | | | | | | | 1,078 | | | | 61,791 | |
Cobham plc | | | | | | | | | | | 60,921 | | | | 128,350 | |
Honeywell International Incorporated | | | | | | | | | | | 341 | | | | 39,665 | |
Leonardo-Finmeccanica SpA † | | | | | | | | | | | 4,955 | | | | 50,108 | �� |
Lockheed Martin Corporation (b) | | | | | | | | | | | 2,732 | | | | 678,000 | |
Northrop Grumman Corporation | | | | | | | | | | | 2,051 | | | | 455,896 | |
Qinetiq Group plc | | | | | | | | | | | 16,510 | | | | 49,010 | |
Raytheon Company (b) | | | | | | | | | | | 15,068 | | | | 2,048,495 | |
Thales SA | | | | | | | | | | | 596 | | | | 49,494 | |
TransDigm Group Incorporated † | | | | | | | | | | | 256 | | | | 67,505 | |
Ultra Electronics Holdings plc | | | | | | | | | | | 2,018 | | | | 46,957 | |
United Technologies Corporation | | | | | | | | | | | 620 | | | | 63,581 | |
| | | | |
| | | | | | | | | | | | | | | 3,738,852 | |
| | | | | | | | | | | | | | | | |
| | | | |
| Air Freight & Logistics: 0.75% | | | | | | | | | | | | | | | | |
FedEx Corporation (b) | | | | | | | | | | | 11,193 | | | | 1,698,874 | |
PostNL † | | | | | | | | | | | 21,606 | | | | 88,137 | |
United Parcel Service Incorporated Class B | | | | | | | | | | | 880 | | | | 94,794 | |
| | | | |
| | | | | | | | | | | | | | | 1,881,805 | |
| | | | | | | | | | | | | | | | |
| | | | |
| Airlines: 0.14% | | | | | | | | | | | | | | | | |
Deutsche Lufthansa AG | | | | | | | | | | | 5,831 | | | | 68,558 | |
Japan Airlines Company Limited | | | | | | | | | | | 895 | | | | 28,794 | |
Southwest Airlines Company | | | | | | | | | | | 6,209 | | | | 243,455 | |
| | | | |
| | | | | | | | | | | | | | | 340,807 | |
| | | | | | | | | | | | | | | | |
| | | | |
| Building Products: 0.16% | | | | | | | | | | | | | | | | |
Compagnie de Saint-Gobain SA | | | | | | | | | | | 6,595 | | | | 249,987 | |
Fortune Brands Home & Security Incorporated | | | | | | | | | | | 708 | | | | 41,043 | |
Owens Corning Incorporated | | | | | | | | | | | 416 | | | | 21,432 | |
The accompanying notes are an integral part of these financial statements.
| | | | | | |
| Portfolio of investments—June 30, 2016 | | Wells Fargo Alternative Strategies Fund | | | 19 | |
| | | | | | | | | | | | | | | | |
| Security name | | | | | | | | Shares | | | Value | |
| | | | |
| Building Products (continued) | | | | | | | | | | | | | | | | |
Sanwa Holdings Corporation | | | | | | | | | | | 9,880 | | | $ | 89,809 | |
| | | | |
| | | | | | | | | | | | | | | 402,271 | |
| | | | | | | | | | | | | | | | |
| | | | |
| Commercial Services & Supplies: 0.08% | | | | | | | | | | | | | | | | |
Aeon Delight Company Limited | | | | | | | | | | | 1,018 | | | | 27,729 | |
Atento SA † | | | | | | | | | | | 2,850 | | | | 25,394 | |
Nippon Kanzai Company Limited | | | | | | | | | | | 2,080 | | | | 32,995 | |
Spotless Group Holdings Limited | | | | | | | | | | | 64,587 | | | | 54,661 | |
Waste Connections Incorporated | | | | | | | | | | | 929 | | | | 66,934 | |
| | | | |
| | | | | | | | | | | | | | | 207,713 | |
| | | | | | | | | | | | | | | | |
| | | | |
| Construction & Engineering: 0.14% | | | | | | | | | | | | | | | | |
Balfour Beatty plc † | | | | | | | | | | | 25,774 | | | | 74,083 | |
Ellaktor SA † | | | | | | | | | | | 4,350 | | | | 6,449 | |
GEK Terna Holding Real Estate Construction SA † | | | | | | | | | | | 6,300 | | | | 12,432 | |
Hazama Ando Corporation | | | | | | | | | | | 6,790 | | | | 37,715 | |
JGC Corporation | | | | | | | | | | | 1,740 | | | | 24,909 | |
Kinden Corporation | | | | | | | | | | | 3,510 | | | | 37,995 | |
Kyudenko Corporation | | | | | | | | | | | 939 | | | | 27,794 | |
Nippo Corporation | | | | | | | | | | | 1,790 | | | | 30,449 | |
Obayashi Corporation | | | | | | | | | | | 1,968 | | | | 20,953 | |
Taisei Corporation | | | | | | | | | | | 1,710 | | | | 14,051 | |
Vinci SA | | | | | | | | | | | 1,025 | | | | 72,331 | |
| | | | |
| | | | | | | | | | | | | | | 359,161 | |
| | | | | | | | | | | | | | | | |
| | | | |
| Electrical Equipment: 0.11% | | | | | | | | | | | | | | | | |
Denyo Company Limited | | | | | | | | | | | 1,780 | | | | 18,420 | |
Eaton Corporation plc | | | | | | | | | | | 377 | | | | 22,518 | |
Generac Holdings Incorporated † | | | | | | | | | | | 689 | | | | 24,087 | |
Legrand SA | | | | | | | | | | | 1,701 | | | | 87,076 | |
Nissin Electric Company Limited | | | | | | | | | | | 1,521 | | | | 22,513 | |
Schneider Electric SE | | | | | | | | | | | 841 | | | | 49,064 | |
Ushio Incorporated | | | | | | | | | | | 2,055 | | | | 24,143 | |
Zumtobel Group AG | | | | | | | | | | | 2,872 | | | | 34,959 | |
| | | | |
| | | | | | | | | | | | | | | 282,780 | |
| | | | | | | | | | | | | | | | |
| | | | |
| Industrial Conglomerates: 0.58% | | | | | | | | | | | | | | | | |
Beijing Enterprises Holdings Limited | | | | | | | | | | | 6,945 | | | | 39,372 | |
General Electric Company (b) | | | | | | | | | | | 39,576 | | | | 1,245,852 | |
Koninklijke Philips NV | | | | | | | | | | | 1,655 | | | | 41,104 | |
Rheinmetall AG | | | | | | | | | | | 2,207 | | | | 131,270 | |
| | | | |
| | | | | | | | | | | | | | | 1,457,598 | |
| | | | | | | | | | | | | | | | |
| | | | |
| Machinery: 0.14% | | | | | | | | | | | | | | | | |
Atlas Copco AB Class A | | | | | | | | | | | 1,333 | | | | 34,621 | |
Hino Motors Limited | | | | | | | | | | | 1,925 | | | | 19,173 | |
IDEX Corporation | | | | | | | | | | | 301 | | | | 24,712 | |
IHI Corporation | | | | | | | | | | | 11,100 | | | | 29,920 | |
Mitsubishi Heavy Industries Limited | | | | | | | | | | | 9,440 | | | | 37,960 | |
The accompanying notes are an integral part of these financial statements.
| | | | |
| 20 | | Wells Fargo Alternative Strategies Fund | | Portfolio of investments—June 30, 2016 |
| | | | | | | | | | | | | | | | |
| Security name | | | | | | | | Shares | | | Value | |
| | | | |
| Machinery (continued) | | | | | | | | | | | | | | | | |
Miura Company Limited | | | | | | | | | | | 1,116 | | | $ | 24,946 | |
Namura Shipbuilding Company Limited | | | | | | | | | | | 1,540 | | | | 8,519 | |
Sandvik AB | | | | | | | | | | | 2,555 | | | | 25,580 | |
Sulzer AG | | | | | | | | | | | 185 | | | | 16,054 | |
Takuma Company Limited | | | | | | | | | | | 3,275 | | | | 29,060 | |
The Middleby Corporation † | | | | | | | | | | | 767 | | | | 88,397 | |
Toshiba Machine Company Limited | | | | | | | | | | | 6,680 | | | | 20,206 | |
| | | | |
| | | | | | | | | | | | | | | 359,148 | |
| | | | | | | | | | | | | | | | |
| | | | |
| Marine: 0.04% | | | | | | | | | | | | | | | | |
DS Norden AS † | | | | | | | | | | | 1,999 | | | | 27,912 | |
Irish Continental Group plc | | | | | | | | | | | 6,996 | | | | 32,608 | |
Kuehne & Nagel International AG | | | | | | | | | | | 224 | | | | 31,385 | |
| | | | |
| | | | | | | | | | | | | | | 91,905 | |
| | | | | | | | | | | | | | | | |
| | | | |
| Professional Services: 0.09% | | | | | | | | | | | | | | | | |
Adecco SA | | | | | | | | | | | 858 | | | | 43,276 | |
Experian Group Limited | | | | | | | | | | | 3,724 | | | | 70,652 | |
Hays plc | | | | | | | | | | | 32,233 | | | | 42,116 | |
Recruit Holdings Company Limited | | | | | | | | | | | 1,065 | | | | 38,909 | |
TechnoPro Holdings Incorporated | | | | | | | | | | | 826 | | | | 25,720 | |
| | | | |
| | | | | | | | | | | | | | | 220,673 | |
| | | | | | | | | | | | | | | | |
| | | | |
| Road & Rail: 0.58% | | | | | | | | | | | | | | | | |
Avis Budget Group Incorporated †(b) | | | | | | | | | | | 5,135 | | | | 165,501 | |
Canadian National Railway Company | | | | | | | | | | | 1,425 | | | | 84,147 | |
CSX Corporation | | | | | | | | | | | 1,688 | | | | 44,023 | |
DSV AS | | | | | | | | | | | 1,406 | | | | 59,120 | |
Genesee & Wyoming Incorporated Class A † | | | | | | | | | | | 810 | | | | 47,750 | |
Hitachi Transport System Limited | | | | | | | | | | | 770 | | | | 12,667 | |
Old Dominion Freight Line Incorporated † | | | | | | | | | | | 4,742 | | | | 285,990 | |
Union Pacific Corporation | | | | | | | | | | | 8,526 | | | | 743,894 | |
| | | | |
| | | | | | | | | | | | | | | 1,443,092 | |
| | | | | | | | | | | | | | | | |
| | | | |
| Trading Companies & Distributors: 0.07% | | | | | | | | | | | | | | | | |
Itochu Corporation | | | | | | | | | | | 3,350 | | | | 40,981 | |
Kuroda Electric Company Limited | | | | | | | | | | | 1,480 | | | | 25,420 | |
MonotaRO Company Limited | | | | | | | | | | | 468 | | | | 15,473 | |
Rexel SA | | | | | | | | | | | 4,297 | | | | 54,024 | |
SIG plc | | | | | | | | | | | 28,253 | | | | 42,406 | |
| | | | |
| | | | | | | | | | | | | | | 178,304 | |
| | | | | | | | | | | | | | | | |
| | | | |
| Transportation Infrastructure: 0.03% | | | | | | | | | | | | | | | | |
Groupe Eurotunnel SE | | | | | | | | | | | 5,453 | | | | 57,598 | |
Hamburger Hafen Und Logistik AG | | | | | | | | | | | 1,376 | | | | 20,597 | |
| | | | |
| | | | | | | | | | | | | | | 78,195 | |
| | | | | | | | | | | | | | | | |
The accompanying notes are an integral part of these financial statements.
| | | | | | |
| Portfolio of investments—June 30, 2016 | | Wells Fargo Alternative Strategies Fund | | | 21 | |
| | | | | | | | | | | | | | | | |
| Security name | | | | | | | | Shares | | | Value | |
| | | | |
Information Technology: 8.19% | | | | | | | | | | | | | | | | |
| | | | |
| Communications Equipment: 0.45% | | | | | | | | | | | | | | | | |
ARRIS International plc † | | | | | | | | | | | 1,400 | | | $ | 29,344 | |
Cisco Systems Incorporated | | | | | | | | | | | 22,043 | | | | 632,414 | |
Motorola Solutions Incorporated | | | | | | | | | | | 1,002 | | | | 66,102 | |
Palo Alto Networks Incorporated † | | | | | | | | | | | 2,229 | | | | 273,365 | |
Radware Limited † | | | | | | | | | | | 11,165 | | | | 125,718 | |
| | | | |
| | | | | | | | | | | | | | | 1,126,943 | |
| | | | | | | | | | | | | | | | |
| | | | |
| Electronic Equipment, Instruments & Components: 0.16% | | | | | | | | | | | | | | | | |
Amano Corporation | | | | | | | | | | | 1,215 | | | | 21,165 | |
Flextronics International Limited † | | | | | | | | | | | 23,366 | | | | 275,719 | |
Hitachi High Technologies Corporation | | | | | | | | | | | 830 | | | | 22,715 | |
Hosiden Corporation | | | | | | | | | | | 2,590 | | | | 16,102 | |
Largan Precision Company Limited | | | | | | | | | | | 205 | | | | 18,959 | |
Nichicon Corporation | | | | | | | | | | | 1,250 | | | | 8,122 | |
Spectris plc | | | | | | | | | | | 782 | | | | 19,035 | |
WPG Holdings Company Limited | | | | | | | | | | | 25,350 | | | | 29,606 | |
| | | | |
| | | | | | | | | | | | | | | 411,423 | |
| | | | | | | | | | | | | | | | |
| | | | |
| Internet Software & Services: 3.74% | | | | | | | | | | | | | | | | |
Alibaba Group Holding Limited ADR † | | | | | | | | | | | 1,418 | | | | 112,774 | |
Alphabet Incorporated Class A † | | | | | | | | | | | 431 | | | | 303,221 | |
Alphabet Incorporated Class C †(b) | | | | | | | | | | | 2,560 | | | | 1,771,776 | |
Baidu Incorporated ADR † | | | | | | | | | | | 797 | | | | 131,625 | |
ChinaCache International Holdings Limited ADR † | | | | | | | | | | | 890 | | | | 5,767 | |
CoStar Group Incorporated † | | | | | | | | | | | 413 | | | | 90,307 | |
Dena Company Limited | | | | | | | | | | | 1,090 | | | | 25,499 | |
Dip Corporation | | | | | | | | | | | 816 | | | | 22,015 | |
Envestnet Incorporated † | | | | | | | | | | | 720 | | | | 23,983 | |
Facebook Incorporated Class A †(b) | | | | | | | | | | | 24,880 | | | | 2,843,286 | |
LinkedIn Corporation Class A † | | | | | | | | | | | 5,006 | | | | 947,386 | |
Naver Corporation | | | | | | | | | | | 63 | | | | 39,029 | |
Rackspace Hosting Incorporated † | | | | | | | | | | | 7,674 | | | | 160,080 | |
Tencent Holdings Limited H Shares | | | | | | | | | | | 57,594 | | | | 1,321,187 | |
United Internet AG | | | | | | | | | | | 1,137 | | | | 47,264 | |
Yahoo! Incorporated † | | | | | | | | | | | 38,315 | | | | 1,439,111 | |
Yandex NV Class A † | | | | | | | | | | | 5,253 | | | | 114,768 | |
| | | | |
| | | | | | | | | | | | | | | 9,399,078 | |
| | | | | | | | | | | | | | | | |
| | | | |
| IT Services: 0.92% | | | | | | | | | | | | | | | | |
Accenture plc Class A | | | | | | | | | | | 901 | | | | 102,074 | |
Alliance Data Systems Corporation † | | | | | | | | | | | 174 | | | | 34,090 | |
ALTEN SA | | | | | | | | | | | 352 | | | | 20,663 | |
Automatic Data Processing Incorporated | | | | | | | | | | | 702 | | | | 64,493 | |
Cerved Information Solutions SpA | | | | | | | | | | | 10,694 | | | | 84,251 | |
Cognizant Technology Solutions Corporation Class A †(b) | | | | | | | | | | | 14,545 | | | | 832,556 | |
CSRA Incorporated | | | | | | | | | | | 5,826 | | | | 136,503 | |
Devoteam SA | | | | | | | | | | | 269 | | | | 12,836 | |
Global Payments Incorporated | | | | | | | | | | | 927 | | | | 66,169 | |
The accompanying notes are an integral part of these financial statements.
| | | | |
| 22 | | Wells Fargo Alternative Strategies Fund | | Portfolio of investments—June 30, 2016 |
| | | | | | | | | | | | | | | | |
| Security name | | | | | | | | Shares | | | Value | |
| | | | |
| IT Services (continued) | | | | | | | | | | | | | | | | |
MasterCard Incorporated Class A | | | | | | | | | | | 7,851 | | | $ | 691,359 | |
OBIC Company Limited | | | | | | | | | | | 601 | | | | 33,083 | |
Sopra Steria Group | | | | | | | | | | | 442 | | | | 45,558 | |
Visa Incorporated Class A | | | | | | | | | | | 2,449 | | | | 181,642 | |
| | | | |
| | | | | | | | | | | | | | | 2,305,277 | |
| | | | | | | | | | | | | | | | |
| | | | |
| Semiconductors & Semiconductor Equipment: 0.31% | | | | | | | | | | | | | | | | |
Applied Materials Incorporated | | | | | | | | | | | 1,677 | | | | 40,198 | |
Globalwafers Company Limited | | | | | | | | | | | 8,063 | | | | 17,958 | |
Kontron AG † | | | | | | | | | | | 3,778 | | | | 11,714 | |
Lam Research Corporation | | | | | | | | | | | 309 | | | | 25,975 | |
Silicon Motion Technology Corporation | | | | | | | | | | | 383 | | | | 18,307 | |
STMicroelectronics NV | | | | | | | | | | | 11,002 | | | | 64,611 | |
Synaptics Incorporated † | | | | | | | | | | | 224 | | | | 12,040 | |
Taiwan Semiconductor Manufacturing Company Limited ADR | | | | | | | | | | | 21,093 | | | | 553,269 | |
Tokyo Seimitsu Company Limited | | | | | | | | | | | 1,130 | | | | 26,314 | |
| | | | |
| | | | | | | | | | | | | | | 770,386 | |
| | | | | | | | | | | | | | | | |
| | | | |
| Software: 1.71% | | | | | | | | | | | | | | | | |
Adobe Systems Incorporated † | | | | | | | | | | | 727 | | | | 69,639 | |
Autodesk Incorporated † | | | | | | | | | | | 597 | | | | 32,322 | |
Cadence Design Systems Incorporated † | | | | | | | | | | | 2,710 | | | | 65,853 | |
CommVault Systems Incorporated † | | | | | | | | | | | 3,696 | | | | 159,630 | |
Konami Holdings Corporation | | | | | | | | | | | 347 | | | | 13,238 | |
Microsoft Corporation (b) | | | | | | | | | | | 40,744 | | | | 2,084,870 | |
Nintendo Company Limited | | | | | | | | | | | 333 | | | | 47,852 | |
Nippon System Development Company Limited | | | | | | | | | | | 1,200 | | | | 19,120 | |
Oracle Corporation (b) | | | | | | | | | | | 15,711 | | | | 643,051 | |
PTC Incorporated † | | | | | | | | | | | 7,571 | | | | 284,518 | |
SS&C Technologies Holdings Incorporated | | | | | | | | | | | 1,464 | | | | 41,109 | |
The Descartes Systems Group Incorporated † | | | | | | | | | | | 1,490 | | | | 28,498 | |
Verint Systems Incorporated †(b) | | | | | | | | | | | 10,850 | | | | 359,461 | |
VMware Incorporated Class A †(b) | | | | | | | | | | | 5,696 | | | | 325,925 | |
Workday Incorporated Class A † | | | | | | | | | | | 1,281 | | | | 95,652 | |
Xura Incorporated † | | | | | | | | | | | 706 | | | | 17,248 | |
| | | | |
| | | | | | | | | | | | | | | 4,287,986 | |
| | | | | | | | | | | | | | | | |
| | | | |
| Technology Hardware, Storage & Peripherals: 0.90% | | | | | | | | | | | | | | | | |
Apple Incorporated | | | | | | | | | | | 165 | | | | 15,774 | |
Canon Incorporated | | | | | | | | | | | 765 | | | | 21,841 | |
Catcher Technology Company Limited | | | | | | | | | | | 2,840 | | | | 21,176 | |
EMC Corporation | | | | | | | | | | | 9,468 | | | | 257,246 | |
Hewlett Packard Enterprise Company | | | | | | | | | | | 10,827 | | | | 197,809 | |
HP Incorporated (b) | | | | | | | | | | | 42,233 | | | | 530,024 | |
NetApp Incorporated | | | | | | | | | | | 21,916 | | | | 538,914 | |
Samsung Electronics Company Limited | | | | | | | | | | | 93 | | | | 115,818 | |
Western Digital Corporation | | | | | | | | | | | 11,650 | | | | 550,579 | |
| | | | |
| | | | | | | | | | | | | | | 2,249,181 | |
| | | | | | | | | | | | | | | | |
The accompanying notes are an integral part of these financial statements.
| | | | | | |
| Portfolio of investments—June 30, 2016 | | Wells Fargo Alternative Strategies Fund | | | 23 | |
| | | | | | | | | | | | | | | | |
| Security name | | | | | | | | Shares | | | Value | |
| | | | |
Materials: 3.29% | | | | | | | | | | | | | | | | |
| | | | |
| Chemicals: 2.01% | | | | | | | | | | | | | | | | |
Akzo Nobel NV | | | | | | | | | | | 1,131 | | | $ | 70,259 | |
Axalta Coating Systems Limited † | | | | | | | | | | | 6,373 | | | | 169,076 | |
Celanese Corporation Series A | | | | | | | | | | | 660 | | | | 43,197 | |
CF Industries Holdings Incorporated | | | | | | | | | | | 44,143 | | | | 1,063,846 | |
Platform Specialty Products Corporation † | | | | | | | | | | | 5,088 | | | | 45,181 | |
Praxair Incorporated | | | | | | | | | | | 692 | | | | 77,774 | |
Shin-Etsu Chemical Company Limited | | | | | | | | | | | 1,280 | | | | 74,993 | |
The Sherwin-Williams Company | | | | | | | | | | | 9,979 | | | | 2,930,533 | |
Tokyo Ohka Kogyo Company Limited | | | | | | | | | | | 770 | | | | 18,999 | |
W.R. Grace & Company | | | | | | | | | | | 7,475 | | | | 547,245 | |
| | | | |
| | | | | | | | | | | | | | | 5,041,103 | |
| | | | | | | | | | | | | | | | |
| | | | |
| Construction Materials: 0.60% | | | | | | | | | | | | | | | | |
BRAAS Monier Building Group SA | | | | | | | | | | | 3,585 | | | | 84,026 | |
Buzzi Unicem SpA | | | | | | | | | | | 6,728 | | | | 117,902 | |
Cemex Holdings Philippines Incorporated †144A | | | | | | | | | | | 26,000 | | | | 6,000 | |
CRH plc | | | | | | | | | | | 3,524 | | | | 102,691 | |
CRH plc – London Exchange | | | | | | | | | | | 4,215 | | | | 123,599 | |
LafargeHolcim Limited | | | | | | | | | | | 6,126 | | | | 256,297 | |
Martin Marietta Materials Incorporated | | | | | | | | | | | 3,455 | | | | 663,360 | |
Sumitomo Osaka Cement Company Limited | | | | | | | | | | | 8,200 | | | | 35,186 | |
Taiheiyo Cement Corporation | | | | | | | | | | | 9,585 | | | | 22,703 | |
Vicat SA | | | | | | | | | | | 681 | | | | 38,350 | |
Wienerberger AG | | | | | | | | | | | 3,921 | | | | 54,945 | |
| | | | |
| | | | | | | | | | | | | | | 1,505,059 | |
| | | | | | | | | | | | | | | | |
| | | | |
| Containers & Packaging: 0.12% | | | | | | | | | | | | | | | | |
Berry Plastics Group Incorporated †(b) | | | | | | | | | | | 6,660 | | | | 258,741 | |
Smurfit Kappa Group plc | | | | | | | | | | | 2,869 | | | | 63,171 | |
| | | | |
| | | | | | | | | | | | | | | 321,912 | |
| | | | | | | | | | | | | | | | |
| | | | |
| Metals & Mining: 0.56% | | | | | | | | | | | | | | | | |
Anglo American plc | | | | | | | | | | | 5,325 | | | | 52,197 | |
AngloGold Ashanti Limited ADR † | | | | | | | | | | | 17,258 | | | | 311,679 | |
BHP Billiton Limited ADR | | | | | | | | | | | 671 | | | | 19,164 | |
Constellium NV Class A † | | | | | | | | | | | 1,920 | | | | 9,005 | |
Franco-Nevada Corporation | | | | | | | | | | | 221 | | | | 16,809 | |
Franco-Nevada Corporation – Toronto Exchange | | | | | | | | | | | 765 | | | | 58,171 | |
Freeport-McMoRan Incorporated | | | | | | | | | | | 13,120 | | | | 146,157 | |
Goldcorp Incorporated | | | | | | | | | | | 875 | | | | 16,739 | |
Lonmin plc † | | | | | | | | | | | 3,775 | | | | 9,687 | |
Reliance Steel & Aluminum Company | | | | | | | | | | | 601 | | | | 46,217 | |
Rio Tinto plc ADR | | | | | | | | | | | 415 | | | | 12,990 | |
Salzgitter AG | | | | | | | | | | | 1,488 | | | | 39,343 | |
Silver Wheaton Corporation | | | | | | | | | | | 27,102 | | | | 637,710 | |
Yamato Kogyo Company Limited | | | | | | | | | | | 1,265 | | | | 28,714 | |
| | | | |
| | | | | | | | | | | | | | | 1,404,582 | |
| | | | | | | | | | | | | | | | |
The accompanying notes are an integral part of these financial statements.
| | | | |
| 24 | | Wells Fargo Alternative Strategies Fund | | Portfolio of investments—June 30, 2016 |
| | | | | | | | | | | | | | | | |
| Security name | | | | | | | | Shares | | | Value | |
| | | | |
Telecommunication Services: 1.34% | | | | | | | | | | | | | | | | |
| | | | |
| Diversified Telecommunication Services: 0.84% | | | | | | | | | | | | | | | | |
Cellnex Telecom SAU | | | | | | | | | | | 11,678 | | | $ | 183,258 | |
Hellenic Telecommunications Organization SA | | | | | | | | | | | 8,967 | | | | 81,929 | |
Nippon Telegraph & Telephone Corporation | | | | | | | | | | | 2,091 | | | | 98,057 | |
Sunrise Communications Group AG 144A | | | | | | | | | | | 4,363 | | | | 278,961 | |
Telecom Italia SpA † | | | | | | | | | | | 26,776 | | | | 21,991 | |
Telefonica SA | | | | | | | | | | | 5,393 | | | | 51,200 | |
Verizon Communications Incorporated (b) | | | | | | | | | | | 24,950 | | | | 1,393,208 | |
| | | | |
| | | | | | | | | | | | | | | 2,108,604 | |
| | | | | | | | | | | | | | | | |
| | | | |
| Wireless Telecommunication Services: 0.50% | | | | | | | | | | | | | | | | |
China Mobile Limited | | | | | | | | | | | 38,249 | | | | 441,937 | |
KDDI Corporation | | | | | | | | | | | 1,330 | | | | 40,445 | |
NTT DOCOMO Incorporated | | | | | | | | | | | 4,015 | | | | 108,279 | |
Orange Belgium SA † | | | | | | | | | | | 1,896 | | | | 43,829 | |
SoftBank Group Corporation | | | | | | | | | | | 10,841 | | | | 613,081 | |
| | | | |
| | | | | | | | | | | | | | | 1,247,571 | |
| | | | | | | | | | | | | | | | |
| | | | |
Utilities: 0.86% | | | | | | | | | | | | | | | | |
| | | | |
| Electric Utilities: 0.05% | | | | | | | | | | | | | | | | |
Avangrid Incorporated | | | | | | | | | | | 1,901 | | | | 87,560 | |
Power Assets Holdings Limited | | | | | | | | | | | 4,945 | | | | 45,467 | |
| | | | |
| | | | | | | | | | | | | | | 133,027 | |
| | | | | | | | | | | | | | | | |
| | | | |
| Gas Utilities: 0.04% | | | | | | | | | | | | | | | | |
China Resources Gas Group Limited | | | | | | | | | | | 4,521 | | | | 13,749 | |
ENN Energy Holdings Limited | | | | | | | | | | | 5,500 | | | | 27,241 | |
Toho Gas Company Limited | | | | | | | | | | | 1,316 | | | | 10,768 | |
UGI Corporation | | | | | | | | | | | 769 | | | | 34,797 | |
| | | | |
| | | | | | | | | | | | | | | 86,555 | |
| | | | | | | | | | | | | | | | |
| | | | |
| Independent Power & Renewable Electricity Producers: 0.01% | | | | | | | | | | | | | | | | |
Huadian Fuxin Energy Corporation Limited H Shares | | | | | | | | | | | 28,261 | | | | 6,239 | |
Huaneng Renewables Corporation Limited H Shares | | | | | | | | | | | 79,370 | | | | 26,565 | |
| | | | |
| | | | | | | | | | | | | | | 32,804 | |
| | | | | | | | | | | | | | | | |
| | | | |
| Multi-Utilities: 0.74% | | | | | | | | | | | | | | | | |
E.ON SE | | | | | | | | | | | 7,092 | | | | 71,592 | |
Engie SA | | | | | | | | | | | 4,206 | | | | 67,534 | |
National Grid plc | | | | | | | | | | | 4,400 | | | | 64,703 | |
RWE AG † | | | | | | | | | | | 2,587 | | | | 41,199 | |
Sempra Energy (b) | | | | | | | | | | | 13,703 | | | | 1,562,416 | |
Veolia Environnement SA | | | | | | | | | | | 2,304 | | | | 49,754 | |
| | | | |
| | | | | | | | | | | | | | | 1,857,198 | |
| | | | | | | | | | | | | | | | |
| | | | |
| Water Utilities: 0.02% | | | | | | | | | | | | | | | | |
Guangdong Investment Limited | | | | | | | | | | | 29,656 | | | | 45,272 | |
| | | | | | | | | | | | | | | | |
| | | | |
Total Common Stocks (Cost $128,979,212) | | | | | | | | | | | | | | | 136,863,256 | |
| | | | | | | | | | | | | | | | |
The accompanying notes are an integral part of these financial statements.
| | | | | | |
| Portfolio of investments—June 30, 2016 | | Wells Fargo Alternative Strategies Fund | | | 25 | |
| | | | | | | | | | | | | | | | |
| Security name | | Interest rate | | | Maturity date | | | Principal | | | Value | |
| | | | |
Corporate Bonds and Notes: 0.89% | | | | | | | | | | | | | | | | |
| | | | |
Consumer Discretionary: 0.54% | | | | | | | | | | | | | | | | |
| | | | |
| Hotels, Restaurants & Leisure: 0.07% | | | | | | | | | | | | | | | | |
Caesars Entertainment Operating Company Incorporated (s) | | | 9.00 | % | | | 2-15-2020 | | | $ | 85,000 | | | $ | 78,413 | |
Caesars Entertainment Operating Company Incorporated (s) | | | 10.00 | | | | 12-15-2018 | | | | 35,000 | | | | 13,913 | |
Caesars Entertainment Operating Company Incorporated (s) | | | 11.25 | | | | 6-1-2017 | | | | 50,000 | | | | 46,125 | |
Yum! Brands Incorporated | | | 6.88 | | | | 11-15-2037 | | | | 40,000 | | | | 39,600 | |
| | | | |
| | | | | | | | | | | | | | | 178,051 | |
| | | | | | | | | | | | | | | | |
| | | | |
| Multiline Retail: 0.04% | | | | | | | | | | | | | | | | |
Neiman Marcus Group Limited 144A | | | 8.00 | | | | 10-15-2021 | | | | 100,000 | | | | 81,500 | |
Neiman Marcus Group Limited (PIK at 9.50%) 144A¥ | | | 8.75 | | | | 10-15-2021 | | | | 15,000 | | | | 11,400 | |
| | | | |
| | | | | | | | | | | | | | | 92,900 | |
| | | | | | | | | | | | | | | | |
| | | | |
| Specialty Retail: 0.43% | | | | | | | | | | | | | | | | |
Guitar Center Incorporated 144A | | | 6.50 | | | | 4-15-2019 | | | | 220,000 | | | | 189,200 | |
New Albertsons Incorporated (i) | | | 6.52 | | | | 4-10-2028 | | | | 100,000 | | | | 74,250 | |
New Albertsons Incorporated (i) | | | 6.57 | | | | 2-23-2028 | | | | 545,000 | | | | 433,275 | |
New Albertsons Incorporated | | | 6.63 | | | | 6-1-2028 | | | | 20,000 | | | | 17,800 | |
New Albertsons Incorporated (i) | | | 7.15 | | | | 7-23-2027 | | | | 15,000 | | | | 11,700 | |
New Albertsons Incorporated | | | 7.45 | | | | 8-1-2029 | | | | 80,000 | | | | 77,600 | |
New Albertsons Incorporated | | | 7.75 | | | | 6-15-2026 | | | | 25,000 | | | | 24,375 | |
New Albertsons Incorporated | | | 8.00 | | | | 5-1-2031 | | | | 230,000 | | | | 227,700 | |
New Albertsons Incorporated | | | 8.70 | | | | 5-1-2030 | | | | 25,000 | | | | 25,000 | |
| | | | |
| | | | | | | | | | | | | | | 1,080,900 | |
| | | | | | | | | | | | | | | | |
| | | | |
Financials: 0.21% | | | | | | | | | | | | | | | | |
| | | | |
| Insurance: 0.21% | | | | | | | | | | | | | | | | |
Ambac Assurance Corporation 144A | | | 5.10 | | | | 6-7-2020 | | | | 470,772 | | | | 528,441 | |
| | | | | | | | | | | | | | | | |
| | | | |
Industrials: 0.14% | | | | | | | | | | | | | | | | |
| | | | |
| Aerospace & Defense: 0.14% | | | | | | | | | | | | | | | | |
DynCorp International Incorporated | | | 11.88 | | | | 11-30-2020 | | | | 414,660 | | | | 346,241 | |
| | | | | | | | | | | | | | | | |
| | | | |
Total Corporate Bonds and Notes (Cost $2,266,542) | | | | | | | | | | | | | | | 2,226,533 | |
| | | | | | | | | | | | | | | | |
| | | | |
| | | | | | | | | Shares | | | | |
| Exchange-Traded Funds: 0.01% | | | | | | | | | | | | | | | | |
TOPIX ETF | | | | | | | | | | | 1,440 | | | | 18,349 | |
| | | | | | | | | | | | | | | | |
| | | | |
Total Exchange-Traded Funds (Cost $17,404) | | | | | | | | | | | | | | | 18,349 | |
| | | | | | | | | | | | | | | | |
| | | | |
| | | | | | | | | Principal | | | | |
| Foreign Corporate Bonds and Notes @: 0.03% | | | | | | | | | | | | | | | | |
| | | | |
Consumer Discretionary: 0.03% | | | | | | | | | | | | | | | | |
| | | | |
| Textiles, Apparel & Luxury Goods: 0.03% | | | | | | | | | | | | | | | | |
Boardriders SA (EUR) | | | 9.50 | | | | 12-15-2020 | | | | 93,000 | | | | 77,402 | |
| | | | | | | | | | | | | | | | |
| | | | |
Total Foreign Corporate Bonds and Notes (Cost $96,639) | | | | | | | | | | | | | | | 77,402 | |
| | | | | | | | | | | | | | | | |
The accompanying notes are an integral part of these financial statements.
| | | | |
| 26 | | Wells Fargo Alternative Strategies Fund | | Portfolio of investments—June 30, 2016 |
| | | | | | | | | | | | | | | | |
| Security name | | Interest rate | | | Maturity date | | | Shares | | | Value | |
| | | | |
Investment Companies: 8.11% | | | | | | | | | | | | | | | | |
| | | | |
| Alternative Investment Funds: 8.11% | | | | | | | | | | | | | | | | |
AQR Managed Futures Strategy Fund Class I | | | | | | | | | | | 1,956,842 | | | $ | 20,351,161 | |
| | | | | | | | | | | | | | | | |
| | | | |
Total Investment Companies (Cost $20,580,408) | | | | | | | | | | | | | | | 20,351,161 | |
| | | | | | | | | | | | | | | | |
| | | | |
| | | | | | | | | Principal | | | | |
| Municipal Obligations: 0.28% | | | | | | | | | | | | | | | | |
| | | | |
| Puerto Rico: 0.28% | | | | | | | | | | | | | | | | |
Puerto Rico Commonwealth Public Improvement Series A (GO Revenue) (i) | | | 5.75 | % | | | 7-1-2041 | | | $ | 5,000 | | | | 3,263 | |
Puerto Rico Commonwealth Refunding Bond Public Improvement Series A (GO Revenue) (i) | | | 5.00 | | | | 7-1-2041 | | | | 10,000 | | | | 6,489 | |
Puerto Rico Commonwealth Refunding Bond Public Improvement Series A (GO Revenue) (i) | | | 5.13 | | | | 7-1-2037 | | | | 95,000 | | | | 61,644 | |
Puerto Rico Commonwealth Unrefunded Balance Bond Public Improvement Series A (GO Revenue) (i) | | | 5.00 | | | | 7-1-2033 | | | | 80,000 | | | | 51,934 | |
Puerto Rico Commonwealth Unrefunded Balance Bond Public Improvement Series A (GO Revenue) (i) | | | 5.00 | | | | 7-1-2034 | | | | 10,000 | | | | 6,491 | |
Puerto Rico Commonwealth Unrefunded Balance Bond Public Improvement Series A (Tax Revenue) (i) | | | 5.13 | | | | 7-1-2031 | | | | 10,000 | | | | 6,513 | |
Puerto Rico Commonwealth Unrefunded Balance Bond Public Improvement Series B (GO Revenue) (i) | | | 5.25 | | | | 7-1-2032 | | | | 5,000 | | | | 3,262 | |
Puerto Rico Public Buildings Authority Government Facilities Series T (Miscellaneous Revenue) (i) | | | 5.60 | | | | 7-1-2030 | | | | 650,000 | | | | 364,163 | |
Puerto Rico Sales Tax Financing Corporation Series B (Tax Revenue) (i) | | | 6.05 | | | | 8-1-2036 | | | | 110,000 | | | | 74,953 | |
Puerto Rico Sales Tax Financing Corporation Series B (Tax Revenue) (i) | | | 6.05 | | | | 8-1-2037 | | | | 90,000 | | | | 61,320 | |
Puerto Rico Sales Tax Financing Corporation Series B (Tax Revenue) (i) | | | 6.05 | | | | 8-1-2038 | | | | 65,000 | | | | 44,288 | |
Puerto Rico Sales Tax Financing Corporation Series B (Tax Revenue) (i) | | | 6.05 | | | | 8-1-2039 | | | | 15,000 | | | | 10,221 | |
Puerto Rico Sales Tax Financing Corporation Series C (Tax Revenue) (i) | | | 6.00 | | | | 8-1-2038 | | | | 10,000 | | | | 6,813 | |
| | | | |
Total Municipal Obligations (Cost $808,855) | | | | | | | | | | | | | | | 701,354 | |
| | | | | | | | | | | | | | | | |
| | | | |
| Non-Agency Mortgage-Backed Securities: 4.05% | | | | | | | | | | | | | | | | |
American Home Mortgage Investment Corporation Series 2006-1 Class A2 ± | | | 0.83 | | | | 3-25-2046 | | | | 2,918,173 | | | | 1,164,627 | |
Bear Stearns Alternative A-paper Trust Series 2006-3 Class 34A1 ± | | | 3.06 | | | | 5-25-2036 | | | | 1,908,316 | | | | 1,154,319 | |
Carrington Mortgage Loan Trust Series 06-NC4 Class A3 ± | | | 0.61 | | | | 10-25-2036 | | | | 3,250,000 | | | | 2,260,180 | |
Citi Held for Asset Issuance Series 16-MP1 Class A 144A | | | 4.65 | | | | 4-15-2025 | | | | 1,150,749 | | | | 1,164,178 | |
Citi Held for Asset Issuance Series 16-MP1 Class B 144A | | | 7.67 | | | | 4-15-2025 | | | | 915,000 | | | | 962,737 | |
Credit-Based Asset Servicing and Securitization LLC Series 07-CB4 Class A1B ± | | | 0.63 | | | | 4-25-2037 | | | | 8,000,000 | | | | 2,179,078 | |
Merrill Lynch Alternative Note Series 2007-OAR2 Class A2 ± | | | 0.66 | | | | 4-25-2037 | | | | 2,382,377 | | | | 1,285,550 | |
| | | | |
Total Non-Agency Mortgage-Backed Securities (Cost $9,966,099) | | | | | | | | | | | | | | | 10,170,669 | |
| | | | | | | | | | | | | | | | |
| | | | |
| | | Dividend yield | | | | | | Shares | | | | |
| Preferred Stocks: 0.25% | | | | | | | | | | | | | | | | |
| | | | |
Financials: 0.01% | | | | | | | | | | | | | | | | |
| | | | |
| Thrifts & Mortgage Finance: 0.01% | | | | | | | | | | | | | | | | |
FHLMC † | | | 0.00 | | | | | | | | 700 | | | | 3,115 | |
FHLMC † | | | 0.00 | | | | | | | | 294 | | | | 1,014 | |
FHLMC † | | | 0.00 | | | | | | | | 493 | | | | 1,696 | |
FNMA † | | | 0.00 | | | | | | | | 850 | | | | 3,808 | |
FNMA † | | | 0.00 | | | | | | | | 559 | | | | 2,119 | |
| | | | |
| | | | | | | | | | | | | | | 11,752 | |
| | | | | | | | | | | | | | | | |
The accompanying notes are an integral part of these financial statements.
| | | | | | |
| Portfolio of investments—June 30, 2016 | | Wells Fargo Alternative Strategies Fund | | | 27 | |
| | | | | | | | | | | | | | | | |
| Security name | | Dividend yield | | | | | | Shares | | | Value | |
| | | | |
Health Care: 0.22% | | | | | | | | | | | | | | | | |
| | | | |
| Pharmaceuticals: 0.22% | | | | | | | | | | | | | | | | |
Allergan plc ± | | | 6.60 | % | | | | | | | 661 | | | $ | 551,023 | |
| | | | | | | | | | | | | | | | |
| | | | |
Industrials: 0.02% | | | | | | | | | | | | | | | | |
| | | | |
| Transportation Infrastructure: 0.02% | | | | | | | | | | | | | | | | |
Uber Technologies Incorporated †(a)(i) | | | 0.00 | | | | | | | | 1,216 | | | | 59,307 | |
| | | | | | | | | | | | | | | | |
| | | | |
Total Preferred Stocks (Cost $696,982) | | | | | | | | | | | | | | | 622,082 | |
| | | | | | | | | | | | | | | | |
| | | | |
| | | Strike price | | | Expiration date | | | Contracts | | | | |
| Purchased Put Options: 0.21% | | | | | | | | | | | | | | | | |
Hormel Foods Corporation (a) | | $ | 38 | | | | 9-16-2016 | | | | 8,200 | | | | 18,981 | |
Hormel Foods Corporation (a) | | | 40 | | | | 9-16-2016 | | | | 8,200 | | | | 33,313 | |
S&P 500 Index | | | 1,850 | | | | 12-16-2016 | | | | 5,200 | | | | 184,080 | |
S&P 500 Index | | | 1,875 | | | | 3-17-2017 | | | | 2,100 | | | | 130,200 | |
S&P 500 Index | | | 1,875 | | | | 6-16-2017 | | | | 2,100 | | | | 174,300 | |
| | | | |
Total Purchased Put Options (Cost $827,818) | | | | | | | | | | | | | | | 540,874 | |
| | | | | | | | | | | | | | | | |
| | | | |
| | | | | | | | | Shares | | | | |
| Warrants: 0.12% | | | | | | | | | | | | | | | | |
| | | | |
Financials: 0.11% | | | | | | | | | | | | | | | | |
| | | | |
| Capital Markets: 0.11% | | | | | | | | | | | | | | | | |
Deutsche Bank AG † | | | | | | | 9-27-2016 | | | | 82,851 | | | | 288,462 | |
| | | | | | | | | | | | | | | | |
| | | | |
Industrials: 0.01% | | | | | | | | | | | | | | | | |
| | | | |
| Trading Companies & Distributors: 0.01% | | | | | | | | | | | | | | | | |
Nexeo Solutions Incorporated † | | | | | | | 6-9-2021 | | | | 28,954 | | | | 19,978 | |
| | | | | | | | | | | | | | | | |
| | | | |
Total Warrants (Cost $313,001) | | | | | | | | | | | | | | | 308,440 | |
| | | | | | | | | | | | | | | | |
| | | | |
| | | Yield | | | | | | | | | | |
| Short-Term Investments: 21.80% | | | | | | | | | | | | | | | | |
| | | | |
| Investment Companies: 20.34% | | | | | | | | | | | | | | | | |
Wells Fargo Government Money Market Fund Select Class (l)(u) | | | 0.31 | % | | | | | | | 51,055,553 | | | | 51,055,553 | |
| | | | | | | | | | | | | | | | |
| | | | |
| | | | | | Maturity date | | | Principal | | | | |
| U.S. Treasury Securities: 1.46% | | | | | | | | | | | | | | | | |
Treasury Bill #(z) | | | 0.23 | | | | 9-15-2016 | | | $ | 3,660,000 | | | | 3,658,327 | |
| | | | | | | | | | | | | | | | |
| | | | |
Total Short-Term Investments (Cost $54,713,733) | | | | | | | | | | | | | | | 54,713,880 | |
| | | | | | | | | | | | | | | | |
| | | | |
Securities Sold Short: (23.76%) | | | | | | | | | | | | | | | | |
| | | | |
Common Stocks: (13.87%) | | | | | | | | | | | | | | | | |
| | | | |
Consumer Discretionary: (2.14%) | | | | | | | | | | | | | | | | |
| | | | |
| Automobiles: (0.55%) | | | | | | | | | | | | | | | | |
Ford Motor Company | | | | | | | | | | | (85,461 | ) | | | (1,074,245 | ) |
Toyota Motor Corporation ADR | | | | | | | | | | | (3,408 | ) | | | (340,766 | ) |
| | | | |
| | | | | | | | | | | | | | | (1,415,011 | ) |
| | | | | | | | | | | | | | | | |
The accompanying notes are an integral part of these financial statements.
| | | | |
| 28 | | Wells Fargo Alternative Strategies Fund | | Portfolio of investments—June 30, 2016 |
| | | | | | | | | | | | | | | | |
| Security name | | | | | | | | Shares | | | Value | |
| | | | |
| Hotels, Restaurants & Leisure: (0.10%) | | | | | | | | | | | | | | | | |
Domino’s Pizza Incorporated | | | | | | | | | | | (74 | ) | | $ | (9,722 | ) |
Panera Bread Company Class A † | | | | | | | | | | | (51 | ) | | | (10,809 | ) |
Starbucks Corporation | | | | | | | | | | | (3,973 | ) | | | (226,938 | ) |
Texas Roadhouse Incorporated | | | | | | | | | | | (188 | ) | | | (8,573 | ) |
| | | | |
| | | | | | | | | | | | | | | (256,042 | ) |
| | | | | | | | | | | | | | | | |
| | | | |
| Household Durables: (0.12%) | | | | | | | | | | | | | | | | |
Newell Brands Incorporated | | | | | | | | | | | (6,052 | ) | | | (293,946 | ) |
| | | | | | | | | | | | | | | | |
| | | | |
| Media: (0.41%) | | | | | | | | | | | | | | | | |
Omnicom Group Incorporated | | | | | | | | | | | (3,911 | ) | | | (318,707 | ) |
The Walt Disney Company | | | | | | | | | | | (7,184 | ) | | | (702,739 | ) |
| | | | |
| | | | | | | | | | | | | | | (1,021,446 | ) |
| | | | | | | | | | | | | | | | |
| | | | |
| Multiline Retail: (0.42%) | | | | | | | | | | | | | | | | |
Dollar Tree Incorporated † | | | | | | | | | | | (7,353 | ) | | | (692,946 | ) |
Target Corporation | | | | | | | | | | | (5,356 | ) | | | (373,956 | ) |
| | | | |
| | | | | | | | | | | | | | | (1,066,902 | ) |
| | | | | | | | | | | | | | | | |
| | | | |
| Specialty Retail: (0.02%) | | | | | | | | | | | | | | | | |
Burlington Stores Incorporated † | | | | | | | | | | | (185 | ) | | | (12,341 | ) |
Ross Stores Incorporated | | | | | | | | | | | (251 | ) | | | (14,229 | ) |
The Michaels Companies Incorporated † | | | | | | | | | | | (125 | ) | | | (3,555 | ) |
The TJX Companies Incorporated | | | | | | | | | | | (128 | ) | | | (9,885 | ) |
| | | | |
| | | | | | | | | | | | | | | (40,010 | ) |
| | | | | | | | | | | | | | | | |
| | | | |
| Textiles, Apparel & Luxury Goods: (0.52%) | | | | | | | | | | | | | | | | |
Compagnie Financière Richemont SA | | | | | | | | | | | (4,933 | ) | | | (288,752 | ) |
The Swatch Group AG | | | | | | | | | | | (986 | ) | | | (286,928 | ) |
Under Armour Incorporated Class A | | | | | | | | | | | (11,002 | ) | | | (441,510 | ) |
VF Corporation | | | | | | | | | | | (4,710 | ) | | | (289,618 | ) |
| | | | |
| | | | | | | | | | | | | | | (1,306,808 | ) |
| | | | | | | | | | | | | | | | |
| | | | |
Consumer Staples: (0.55%) | | | | | | | | | | | | | | | | |
| | | | |
| Food & Staples Retailing: (0.54%) | | | | | | | | | | | | | | | | |
Costco Wholesale Corporation | | | | | | | | | | | (3,317 | ) | | | (520,902 | ) |
The Kroger Company | | | | | | | | | | | (12,454 | ) | | | (458,183 | ) |
Wal-Mart Stores Incorporated | | | | | | | | | | | (2,413 | ) | | | (176,197 | ) |
Woolworths Limited | | | | | | | | | | | (12,666 | ) | | | (199,218 | ) |
| | | | |
| | | | | | | | | | | | | | | (1,354,500 | ) |
| | | | | | | | | | | | | | | | |
| | | | |
| Food Products: (0.01%) | | | | | | | | | | | | | | | | |
Hormel Foods Corporation | | | | | | | | | | | (561 | ) | | | (20,533 | ) |
| | | | | | | | | | | | | | | | |
| | | | |
Energy: (3.68%) | | | | | | | | | | | | | | | | |
| | | | |
| Energy Equipment & Services: (1.17%) | | | | | | | | | | | | | | | | |
Helmerich & Payne Incorporated | | | | | | | | | | | (3,435 | ) | | | (230,592 | ) |
National Oilwell Varco Incorporated | | | | | | | | | | | (34,962 | ) | | | (1,176,471 | ) |
The accompanying notes are an integral part of these financial statements.
| | | | | | |
| Portfolio of investments—June 30, 2016 | | Wells Fargo Alternative Strategies Fund | | | 29 | |
| | | | | | | | | | | | | | | | |
| Security name | | | | | | | | Shares | | | Value | |
| | | | |
| Energy Equipment & Services (continued) | | | | | | | | | | | | | | | | |
Schlumberger Limited | | | | | | | | | | | (19,411 | ) | | $ | (1,535,022 | ) |
| | | | |
| | | | | | | | | | | | | | | (2,942,085 | ) |
| | | | | | | | | | | | | | | | |
| | | | |
| Oil, Gas & Consumable Fuels: (2.51%) | | | | | | | | | | | | | | | | |
Apache Corporation | | | | | | | | | | | (17,981 | ) | | | (1,001,002 | ) |
BP plc ADR | | | | | | | | | | | (18,327 | ) | | | (650,792 | ) |
Chevron Corporation | | | | | | | | | | | (2,974 | ) | | | (311,764 | ) |
Conocophillips | | | | | | | | | | | (24,797 | ) | | | (1,081,149 | ) |
EOG Resources Incorporated | | | | | | | | | | | (10,732 | ) | | | (895,263 | ) |
Hess Corporation | | | | | | | | | | | (6,886 | ) | | | (413,849 | ) |
Murphy Oil Corporation | | | | | | | | | | | (6,208 | ) | | | (197,104 | ) |
Occidental Petroleum Corporation | | | | | | | | | | | (22,994 | ) | | | (1,737,427 | ) |
| | | | |
| | | | | | | | | | | | | | | (6,288,350 | ) |
| | | | | | | | | | | | | | | | |
| | | | |
Financials: (1.09%) | | | | | | | | | | | | | | | | |
| | | | |
| Banks: (0.17%) | | | | | | | | | | | | | | | | |
DBS Group Holdings Limited | | | | | | | | | | | (24,507 | ) | | | (288,960 | ) |
HSBC Holdings plc ADR | | | | | | | | | | | (4,390 | ) | | | (137,451 | ) |
| | | | |
| | | | | | | | | | | | | | | (426,411 | ) |
| | | | | | | | | | | | | | | | |
| | | | |
| Capital Markets: (0.13%) | | | | | | | | | | | | | | | | |
Credit Suisse Group AG | | | | | | | | | | | (11,168 | ) | | | (118,966 | ) |
Deutsche Bank AG † | | | | | | | | | | | (4,493 | ) | | | (62,107 | ) |
Goldman Sachs Group Incorporated | | | | | | | | | | | (912 | ) | | | (135,505 | ) |
| | | | |
| | | | | | | | | | | | | | | (316,578 | ) |
| | | | | | | | | | | | | | | | |
| | | | |
| REITs: (0.79%) | | | | | | | | | | | | | | | | |
Crown Castle International Corporation | | | | | | | | | | | (7,399 | ) | | | (750,481 | ) |
Equinix Incorporated | | | | | | | | | | | (3,212 | ) | | | (1,245,389 | ) |
| | | | |
| | | | | | | | | | | | | | | (1,995,870 | ) |
| | | | | | | | | | | | | | | | |
| | | | |
Health Care: (0.49%) | | | | | | | | | | | | | | | | |
| | | | |
| Health Care Equipment & Supplies: (0.26%) | | | | | | | | | | | | | | | | |
Abbott Laboratories | | | | | | | | | | | (16,381 | ) | | | (643,937 | ) |
| | | | | | | | | | | | | | | | |
| | | | |
| Life Sciences Tools & Services: (0.23%) | | | | | | | | | | | | | | | | |
Illumina Incorporated † | | | | | | | | | | | (4,206 | ) | | | (590,438 | ) |
| | | | | | | | | | | | | | | | |
| | | | |
Industrials: (0.94%) | | | | | | | | | | | | | | | | |
| | | | |
| Aerospace & Defense: (0.11%) | | | | | | | | | | | | | | | | |
The Boeing Company | | | | | | | | | | | (2,130 | ) | | | (276,623 | ) |
| | | | | | | | | | | | | | | | |
| | | | |
| Air Freight & Logistics: (0.03%) | | | | | | | | | | | | | | | | |
United Parcel Service Incorporated Class B | | | | | | | | | | | (744 | ) | | | (80,144 | ) |
| | | | | | | | | | | | | | | | |
| | | | |
| Machinery: (0.53%) | | | | | | | | | | | | | | | | |
Caterpillar Incorporated | | | | | | | | | | | (4,007 | ) | | | (303,771 | ) |
Deere & Company | | | | | | | | | | | (770 | ) | | | (62,401 | ) |
The accompanying notes are an integral part of these financial statements.
| | | | |
| 30 | | Wells Fargo Alternative Strategies Fund | | Portfolio of investments—June 30, 2016 |
| | | | | | | | | | | | | | | | |
| Security name | | | | | | | | Shares | | | Value | |
| | | | |
| Machinery (continued) | | | | | | | | | | | | | | | | |
Parker-Hannifin Corporation | | | | | | | | | | | (8,932 | ) | | $ | (965,103 | ) |
| | | | |
| | | | | | | | | | | | | | | (1,331,275 | ) |
| | | | | | | | | | | | | | | | |
| | | | |
| Professional Services: (0.15%) | | | | | | | | | | | | | | | | |
Nielsen Holdings plc | | | | | | | | | | | (7,289 | ) | | | (378,809 | ) |
| | | | | | | | | | | | | | | | |
| | | | |
| Trading Companies & Distributors: (0.12%) | | | | | | | | | | | | | | | | |
Fastenal Company | | | | | | | | | | | (3,158 | ) | | | (140,184 | ) |
W.W. Grainger Incorporated | | | | | | | | | | | (637 | ) | | | (144,758 | ) |
| | | | |
| | | | | | | | | | | | | | | (284,942 | ) |
| | | | | | | | | | | | | | | | |
| | | | |
| Information Technology: (3.78%) | | | | | | | | | | | | | | | | |
| | | | |
| Electronic Equipment, Instruments & Components: (0.58%) | | | | | | | | | | | | | | | | |
Amphenol Corporation Class A | | | | | | | | | | | (1,317 | ) | | | (75,504 | ) |
Corning Incorporated | | | | | | | | | | | (67,942 | ) | | | (1,391,452 | ) |
| | | | |
| | | | | | | | | | | | | | | (1,466,956 | ) |
| | | | | | | | | | | | | | | | |
| | | | |
| Internet Software & Services: (0.33%) | | | | | | | | | | | | | | | | |
Baidu Incorporated ADR † | | | | | | | | | | | (1,733 | ) | | | (286,205 | ) |
Netease Incorporated ADR | | | | | | | | | | | (1,750 | ) | | | (338,135 | ) |
Zillow Group Incorporated Class C † | | | | | | | | | | | (5,900 | ) | | | (214,052 | ) |
| | | | |
| | | | | | | | | | | | | | | (838,392 | ) |
| | | | | | | | | | | | | | | | |
| | | | |
| IT Services: (1.36%) | | | | | | | | | | | | | | | | |
Accenture plc Class A | | | | | | | | | | | (3,392 | ) | | | (384,280 | ) |
Infosys Limited ADR | | | | | | | | | | | (80,752 | ) | | | (1,441,423 | ) |
International Business Machines Corporation | | | | | | | | | | | (9,565 | ) | | | (1,451,776 | ) |
Paypal Holdings Incorporated † | | | | | | | | | | | (3,663 | ) | | | (133,736 | ) |
| | | | |
| | | | | | | | | | | | | | | (3,411,215 | ) |
| | | | | | | | | | | | | | | | |
| | | | |
| Semiconductors & Semiconductor Equipment: (0.11%) | | | | | | | | | | | | | | | | |
Skyworks Solutions Incorporated | | | | | | | | | | | (4,355 | ) | | | (275,584 | ) |
| | | | | | | | | | | | | | | | |
| | | | |
| Software: (1.27%) | | | | | | | | | | | | | | | | |
Activision Blizzard Incorporated | | | | | | | | | | | (7,245 | ) | | | (287,119 | ) |
Adobe Systems Incorporated † | | | | | | | | | | | (3,434 | ) | | | (328,943 | ) |
Electronic Arts Incorporated † | | | | | | | | | | | (21,852 | ) | | | (1,655,508 | ) |
Mobileye NV † | | | | | | | | | | | (9,674 | ) | | | (446,358 | ) |
Workday Incorporated Class A † | | | | | | | | | | | (6,272 | ) | | | (468,330 | ) |
| | | | |
| | | | | | | | | | | | | | | (3,186,258 | ) |
| | | | | | | | | | | | | | | | |
| | | | |
| Technology Hardware, Storage & Peripherals: (0.13%) | | | | | | | | | | | | | | | | |
Apple Incorporated | | | | | | | | | | | (3,312 | ) | | | (316,627 | ) |
| | | | | | | | | | | | | | | | |
| | | | |
Materials: (1.17%) | | | | | | | | | | | | | | | | |
| | | | |
| Chemicals: (0.89%) | | | | | | | | | | | | | | | | |
LyondellBasell Industries NV Class A | | | | | | | | | | | (9,205 | ) | | | (685,036 | ) |
Potash Corporation of Saskatchewan Incorporated | | | | | | | | | | | (26,706 | ) | | | (433,705 | ) |
The accompanying notes are an integral part of these financial statements.
| | | | | | |
| Portfolio of investments—June 30, 2016 | | Wells Fargo Alternative Strategies Fund | | | 31 | |
| | | | | | | | | | | | | | | | |
| Security name | | | | | | | | Shares | | | Value | |
| | | | |
| Chemicals (continued) | | | | | | | | | | | | | | | | |
Praxair Incorporated | | | | | | | | | | | (5,868 | ) | | $ | (659,505 | ) |
The Mosaic Company | | | | | | | | | | | (17,285 | ) | | | (452,521 | ) |
| | | | |
| | | | | | | | | | | | | | | (2,230,767 | ) |
| | | | | | | | | | | | | | | | |
| | | | |
| Metals & Mining: (0.28%) | | | | | | | | | | | | | | | | |
First Quantum Minerals Limited | | | | | | | | | | | (43,847 | ) | | | (307,823 | ) |
Teck Resources Limited Class B | | | | | | | | | | | (30,191 | ) | | | (397,615 | ) |
| | | | |
| | | | | | | | | | | | | | | (705,438 | ) |
| | | | | | | | | | | | | | | | |
| | | | |
Telecommunication Services: (0.03%) | | | | | | | | | | | | | | | | |
| | | | |
| Diversified Telecommunication Services: (0.03%) | | | | | | | | | | | | | | | | |
AT&T Incorporated | | | | | | | | | | | (1,874 | ) | | | (80,976 | ) |
| | | | | | | | | | | | | | | | |
| | | | |
Total Common Stocks – Securities Sold Short (Proceeds $(34,746,770)) | | | | | | | | | | | | | | | (34,842,873 | ) |
| | | | | | | | | | | | | | | | |
| | | | |
Exchange-Traded Funds: (9.89%) | | | | | | | | | | | | | | | | |
Consumer Discretionary Select Sector SPDR Fund ETF | | | | | | | | | | | (11,669 | ) | | | (910,765 | ) |
Consumer Staples Select Sector SPDR Fund ETF | | | | | | | | | | | (33,986 | ) | | | (1,874,328 | ) |
Health Care Select Sector SPDR Fund ETF | | | | | | | | | | | (2,926 | ) | | | (209,853 | ) |
Industrial Select Sector SPDR Fund ETF | | | | | | | | | | | (9,240 | ) | | | (517,070 | ) |
iShares MSCI Brazil Capped ETF | | | | | | | | | | | (34,285 | ) | | | (1,033,007 | ) |
Materials Select Sector SPDR ETF | | | | | | | | | | | (5,647 | ) | | | (261,682 | ) |
SPDR S&P 500 ETF | | | | | | | | | | | (84,202 | ) | | | (17,642,845 | ) |
SPDR S&P Regional Banking ETF | | | | | | | | | | | (10,343 | ) | | | (396,654 | ) |
SPDR S&P Retail ETF | | | | | | | | | | | (15,310 | ) | | | (642,408 | ) |
Technology Select Sector SPDR Fund ETF | | | | | | | | | | | (20,353 | ) | | | (882,506 | ) |
VanEck Vectors Semiconductor ETF | | | | | | | | | | | (7,664 | ) | | | (440,373 | ) |
| | | | |
Total Exchange-Traded Funds – Securities Sold Short (Proceeds $(24,373,322)) | | | | | | | | | | | | | | | (24,811,491 | ) |
| | | | | | | | | | | | | | | | |
| | | | |
Total Securities Sold Short (Proceeds $(59,120,092)) | | | | | | | | | | | | | | | (59,654,364 | ) |
| | | | | | | | | | | | | | | | |
| | | | | | | | |
| Total investments in securities (excluding securities sold short) (Cost $219,266,693) * | | | 90.27 | % | | | 226,594,000 | |
Total securities sold short (Proceeds $(59,120,092)) | | | (23.76 | ) | | | (59,654,364 | ) |
Other assets and liabilities, net | | | 33.49 | | | | 84,069,966 | |
| | | | | | | | |
| Total net assets | | | 100.00 | % | | $ | 251,009,602 | |
| | | | | | | | |
The accompanying notes are an integral part of these financial statements.
| | | | |
| 32 | | Wells Fargo Alternative Strategies Fund | | Portfolio of investments—June 30, 2016 |
| † | Non-income-earning security |
| (b) | All or a portion of this security is segregated as collateral for securities sold short. |
| (a) | The security is fair valued in accordance with procedures approved by the Board of Trustees. |
| 144A | The security may be resold in transactions exempt from registration, normally to qualified institutional buyers, pursuant to Rule 144A under the Securities Act of 1933. |
| (s) | The security is currently in default with regards to scheduled interest and/or principal payments. The Fund has stopped accruing interest on the security. |
| ¥ | A payment-in-kind (PIK) security is a security in which the issuer may make interest or dividend payments in cash or additional securities. These additional securities generally have the same terms as the original holdings. |
| (i) | Illiquid security for which the designation as illiquid is unaudited. |
| @ | Foreign bond principal is denominated in the local currency of the issuer. |
| ± | Variable rate investment. The rate shown is the rate in effect at period end. |
| (l) | The issuer of the security is an affiliated person of the Fund as defined in the Investment Company Act of 1940. |
| (u) | The rate represents the 7-day annualized yield at period end. |
| # | All or a portion of this security is segregated as collateral for investments in derivative instruments. |
| (z) | Zero coupon security. The rate represents the current yield to maturity. |
| * | Cost for federal income tax purposes is $227,069,220 and unrealized gains (losses) consists of: |
| | | | |
Gross unrealized gains | | $ | 12,729,488 | |
Gross unrealized losses | | | (13,204,708 | ) |
| | | | |
Net unrealized losses | | $ | (475,220 | ) |
The accompanying notes are an integral part of these financial statements.
| | | | | | |
| Statement of assets and liabilities—June 30, 2016 | | Wells Fargo Alternative Strategies Fund | | | 33 | |
| | | | |
| | | | |
| |
Assets | | | | |
Investments | | | | |
In unaffiliated securities, at value (cost $168,211,140) | | $ | 175,538,447 | |
In affiliated securities, at value (cost $51,055,553) | | | 51,055,553 | |
| | | | |
Total investments, at value (cost $219,266,693) | | | 226,594,000 | |
Cash | | | 41 | |
Cash at prime broker for securities sold short | | | 64,142,005 | |
Cash at prime broker for derivatives | | | 1,261,925 | |
Foreign currency, at value (cost $21,371,957) | | | 21,682,701 | |
Receivable for investments sold | | | 5,575,698 | |
Receivable for Fund shares sold | | | 441,511 | |
Receivable for dividends and interest | | | 264,631 | |
Receivable for daily variation margin on open futures contracts | | | 277,283 | |
Unrealized gains on credit default swap transactions | | | 385 | |
Unrealized gains on forward foreign currency contracts | | | 197,949 | |
Unrealized gains on total return swap transactions | | | 60,345 | |
Prepaid expenses and other assets | | | 55,648 | |
| | | | |
Total assets | | | 320,554,122 | |
| | | | |
| |
Liabilities | | | | |
Dividends payable on securities sold short | | | 116,901 | |
Payable for investments purchased | | | 6,178,949 | |
Payable for Fund shares redeemed | | | 2,216,409 | |
Unrealized losses on total return swap transactions | | | 186,601 | |
Unrealized losses on forward foreign currency contracts | | | 91,182 | |
Premiums received on credit default swap transactions | | | 1,032 | |
Payable for daily variation margin on open futures contracts | | | 330,756 | |
Written options, at value (premiums received $357,900) | | | 253,328 | |
Payable for securities sold short, at value (proceeds $59,120,092) | | | 59,654,364 | |
Management fee payable | | | 284,932 | |
Distribution fee payable | | | 8,025 | |
Administration fees payable | | | 29,477 | |
Accrued expenses and other liabilities | | | 192,564 | |
| | | | |
Total liabilities | | | 69,544,520 | |
| | | | |
Total net assets | | $ | 251,009,602 | |
| | | | |
| |
NET ASSETS CONSIST OF | | | | |
Paid-in capital | | $ | 254,401,970 | |
Accumulated net investment loss | | | (1,278,703 | ) |
Accumulated net realized losses on investments | | | (10,111,253 | ) |
Net unrealized gains on investments | | | 7,997,588 | |
| | | | |
Total net assets | | $ | 251,009,602 | |
| | | | |
| |
COMPUTATION OF NET ASSET VALUE AND OFFERING PRICE PER SHARE | | | | |
Net assets – Class A | | $ | 17,616,337 | |
Shares outstanding – Class A1 | | | 1,760,048 | |
Net asset value per share – Class A | | | $10.01 | |
Maximum offering price per share – Class A2 | | | $10.62 | |
Net assets – Class C | | $ | 12,669,840 | |
Shares outstanding – Class C1 | | | 1,287,060 | |
Net asset value per share – Class C | | | $9.84 | |
Net assets – Administrator Class | | $ | 35,188,522 | |
Shares outstanding – Administrator Class1 | | | 3,503,598 | |
Net asset value per share – Administrator Class | | | $10.04 | |
Net assets – Institutional Class | | $ | 185,534,903 | |
Shares outstanding – Institutional Class1 | | | 18,435,057 | |
Net asset value per share – Institutional Class | | | $10.06 | |
| 1 | The Fund has an unlimited number of authorized shares. |
| 2 | Maximum offering price is computed as 100/94.25 of net asset value. On investments of $50,000 or more, the offering price is reduced. |
The accompanying notes are an integral part of these financial statements.
| | | | |
| 34 | | Wells Fargo Alternative Strategies Fund | | Statement of operations—year ended June 30, 2016 |
| | | | |
| | | | |
| |
Investment income | | | | |
Dividends (net of foreign withholding taxes of $52,057) | | $ | 2,800,075 | |
Interest | | | 1,312,805 | |
Income from affiliated securities | | | 153,672 | |
| | | | |
Total investment income | | | 4,266,552 | |
| | | | |
| |
Expenses | | | | |
Management fee | | | 3,799,825 | |
Administration fees | | | | |
Class A | | | 27,023 | |
Class C | | | 21,280 | |
Administrator Class | | | 34,856 | |
Institutional Class | | | 217,514 | |
Shareholder servicing fees | | | | |
Class A | | | 32,171 | |
Class C | | | 25,333 | |
Administrator Class | | | 66,807 | |
Distribution fee | | | | |
Class C | | | 76,000 | |
Custody and accounting fees | | | 395,838 | |
Professional fees | | | 62,396 | |
Registration fees | | | 81,334 | |
Shareholder report expenses | | | 67,077 | |
Trustees’ fees and expenses | | | 22,515 | |
Dividends and interest expense on securities sold short | | | 1,205,082 | |
Prime broker fees | | | 562,195 | |
Other fees and expenses | | | 49,388 | |
| | | | |
Total expenses | | | 6,746,634 | |
Less: Fee waivers and/or expense reimbursements | | | (746,639 | ) |
| | | | |
Net expenses | | | 5,999,995 | |
| | | | |
Net investment loss | | | (1,733,443 | ) |
| | | | |
| |
REALIZED AND UNREALIZED GAINS (LOSSES) ON INVESTMENTS | | | | |
| |
Net realized gains (losses) on: | | | | |
Unaffiliated securities | | | (9,796,984 | ) |
Securities sold short | | | 2,973,367 | |
Futures transactions | | | (1,126,149 | ) |
Forward foreign currency contract transactions | | | (385,533 | ) |
Foreign currency and foreign currency translations | | | 118,420 | |
Written options | | | 327,817 | |
Credit default swap transactions | | | 277 | |
Total return swap transactions | | | 122,106 | |
Capital gain distributions from investment companies | | | 347,587 | |
| | | | |
Net realized losses on investments | | | (7,419,092 | ) |
| | | | |
| |
Net change in unrealized gains (losses) on: | | | | |
Unaffiliated securities | | | 2,950,315 | |
Securities sold short | | | (1,728,596 | ) |
Futures transactions | | | 828,277 | |
Forward foreign currency contract transactions | | | 120,340 | |
Foreign currency and foreign currency translations | | | 831,997 | |
Written options | | | 129,020 | |
Credit default swap transactions | | | 385 | |
Total return swap transactions | | | (175,246 | ) |
| | | | |
Net change in unrealized gains (losses) on investments | | | 2,956,492 | |
| | | | |
Net realized and unrealized gains (losses) on investments | | | (4,462,600 | ) |
| | | | |
Net decrease in net assets resulting from operations | | $ | (6,196,043 | ) |
| | | | |
The accompanying notes are an integral part of these financial statements.
| | | | | | |
| Statement of changes in net assets | | Wells Fargo Alternative Strategies Fund | | | 35 | |
| | | | | | | | | | | | | | | | | | | | | | | | |
| | | Year ended
June 30, 2016 | | | Year ended
June 30, 20151 | | | Year ended
July 31, 20142 | |
| | | | | | |
Operations | | | | | | | | | | | | | | | | | | | | | | | | |
Net investment loss | | | | | | $ | (1,733,443 | ) | | | | | | $ | (409,829 | ) | | | | | | $ | (372,313 | ) |
Net realized gains (losses) on investments | | | | | | | (7,419,092 | ) | | | | | | | 3,562,413 | | | | | | | | (48,598 | ) |
Net change in unrealized gains (losses) on investments | | | | | | | 2,956,492 | | | | | | | | 3,759,246 | | | | | | | | 1,281,850 | |
| | | | |
Net increase (decrease) in net assets resulting from operations | | | | | | | (6,196,043 | ) | | | | | | | 6,911,830 | | | | | | | | 860,939 | |
| | | | |
| | | | | | |
Distributions to shareholders from | | | | | | | | | | | | | | | | | | | | | | | | |
Net realized gains | | | | | | | | | | | | | | | | | | | | | | | | |
Class A | | | | | | | (223,836 | ) | | | | | | | (25,783 | ) | | | | | | | 0 | |
Class C | | | | | | | (188,485 | ) | | | | | | | (18,175 | ) | | | | | | | 0 | |
Administrator Class | | | | | | | (361,883 | ) | | | | | | | (17,178 | ) | | | | | | | 0 | |
Institutional Class | | | | | | | (3,490,785 | ) | | | | | | | (1,497,363 | ) | | | | | | | 0 | |
| | | | |
Total distributions to shareholders | | | | | | | (4,264,989 | ) | | | | | | | (1,558,499 | ) | | | | | | | 0 | |
| | | | |
| | | | | | |
Capital share transactions | | | Shares | | | | | | | | Shares | | | | | | | | Shares | | | | | |
Proceeds from shares sold | | | | | | | | | | | | | | | | | | | | | | | | |
Class A | | | 1,817,481 | | | | 18,623,286 | | | | 235,618 | | | | 2,508,255 | | | | 156,226 | | | | 1,567,098 | |
Class C | | | 1,350,979 | | | | 13,802,561 | | | | 123,694 | | | | 1,304,534 | | | | 112,656 | | | | 1,127,500 | |
Administrator Class | | | 6,586,679 | | | | 67,641,035 | | | | 486,882 | | | | 5,203,407 | | | | 111,014 | | | | 1,110,000 | |
Institutional Class | | | 16,461,170 | | | | 170,134,081 | | | | 5,333,055 | | | | 56,672,360 | | | | 9,700,000 | | | | 97,000,000 | |
| | | | |
| | | | | | | 270,200,963 | | | | | | | | 65,688,556 | | | | | | | | 100,804,598 | |
| | | | |
Reinvestment of distributions | | | | | | | | | | | | | | | | | | | | | | | | |
Class A | | | 22,001 | | | | 223,789 | | | | 2,510 | | | | 25,746 | | | | 0 | | | | 0 | |
Class C | | | 18,330 | | | | 184,236 | | | | 1,540 | | | | 15,733 | | | | 0 | | | | 0 | |
Administrator Class | | | 35,306 | | | | 360,174 | | | | 1,673 | | | | 17,178 | | | | 0 | | | | 0 | |
Institutional Class | | | 238,285 | | | | 2,433,253 | | | | 140,736 | | | | 1,446,167 | | | | 0 | | | | 0 | |
| | | | |
| | | | | | | 3,201,452 | | | | | | | | 1,504,824 | | | | | | | | 0 | |
| | | | |
Payment for shares redeemed | | | | | | | | | | | | | | | | | | | | | | | | |
Class A | | | (470,113 | ) | | | (4,738,024 | ) | | | (3,289 | ) | | | (34,930 | ) | | | (386 | ) | | | (3,912 | ) |
Class C | | | (310,737 | ) | | | (3,077,186 | ) | | | (9,402 | ) | | | (95,074 | ) | | | 0 | | | | 0 | |
Administrator Class | | | (3,715,198 | ) | | | (38,113,736 | ) | | | (2,758 | ) | | | (29,382 | ) | | | 0 | | | | 0 | |
Institutional Class | | | (10,183,562 | ) | | | (105,316,859 | ) | | | (3,254,627 | ) | | | (34,734,926 | ) | | | 0 | | | | 0 | |
| | | | |
| | | | | | | (151,245,805 | ) | | | | | | | (34,894,312 | ) | | | | | | | (3,912 | ) |
| | | | |
Net increase in net assets resulting from capital share transactions | | | | | | | 122,156,610 | | | | | | | | 32,299,068 | | | | | | | | 100,800,686 | |
| | | | |
Total increase in net assets | | | | | | | 111,695,578 | | | | | | | | 37,652,399 | | | | | | | | 101,661,625 | |
| | | | |
| | | | | | |
Net assets | | | | | | | | | | | | | | | | | | | | | | | | |
Beginning of period | | | | | | | 139,314,024 | | | | | | | | 101,661,625 | | | | | | | | 0 | |
| | | | |
End of period | | | | | | $ | 251,009,602 | | | | | | | $ | 139,314,024 | | | | | | | $ | 101,661,625 | |
| | | | |
Accumulated net investment loss | | | | | | $ | (1,278,703 | ) | | | | | | $ | (50,634 | ) | | | | | | $ | (24,113 | ) |
| | | | |
| 1 | For the eleven months ended June 30, 2015. The Fund changed its fiscal year end from July 31 to June 30, effective June 30, 2015. |
| 2 | For the period from April 30, 2014 (commencement of operations) to July 31, 2014 |
The accompanying notes are an integral part of these financial statements.
| | | | |
| 36 | | Wells Fargo Alternative Strategies Fund | | Financial highlights |
(For a share outstanding throughout each period)
| | | | | | | | | | | | |
| | | Year ended June 30 | | | Year ended
July 31, 20142 | |
| CLASS A | | 2016 | | | 20151 | | |
Net asset value, beginning of period | | | $10.58 | | | | $10.08 | | | | $10.00 | |
Net investment loss | | | (0.10 | )3 | | | (0.06 | )3 | | | (0.04 | ) |
Net realized and unrealized gains (losses) on investments | | | (0.28 | ) | | | 0.71 | | | | 0.12 | |
| | | | | | | | | | | | |
Total from investment operations | | | (0.38 | ) | | | 0.65 | | | | 0.08 | |
Distributions to shareholders from | | | | | | | | | | | | |
Net realized gains | | | (0.19 | ) | | | (0.15 | ) | | | 0.00 | |
Net asset value, end of period | | | $10.01 | | | | $10.58 | | | | $10.08 | |
Total return4 | | | (3.65 | )% | | | 6.49 | % | | | 0.80 | % |
Ratios to average net assets (annualized) | | | | | | | | | | | | |
Gross expenses5 | | | 3.36 | % | | | 3.40 | % | | | 3.77 | % |
Net expenses5 | | | 2.95 | % | | | 2.93 | % | | | 3.00 | % |
Net investment loss | | | (0.96 | )% | | | (0.64 | )% | | | (1.70 | )% |
Supplemental data | | | | | | | | | | | | |
Portfolio turnover rate | | | 284 | % | | | 237 | % | | | 92 | % |
Net assets, end of period (000s omitted) | | | $17,616 | | | | $4,133 | | | | $1,571 | |
| 1 | For the eleven months ended June 30, 2015. The Fund changed its fiscal year end from July 31 to June 30, effective June 30, 2015. |
| 2 | For the period from April 30, 2014 (commencement of class operations) to July 31, 2014 |
| 3 | Calculated based upon average shares outstanding |
| 4 | Total return calculations do not include any sales charges. Returns for periods of less than one year are not annualized. |
| 5 | Ratios include prime broker fees and dividend and interest expense on securities sold short as follows: |
| | | | |
Year ended June 30, 2016 | | | 0.83 | % |
Year ended June 30, 20151 | | | 0.64 | % |
Year ended July 31, 20142 | | | 0.58 | % |
The accompanying notes are an integral part of these financial statements.
| | | | | | |
| Financial highlights | | Wells Fargo Alternative Strategies Fund | | | 37 | |
(For a share outstanding throughout each period)
| | | | | | | | | | | | |
| | | Year ended June 30 | | | Year ended
July 31, 20142 | |
| CLASS C | | 2016 | | | 20151 | | |
Net asset value, beginning of period | | | $10.49 | | | | $10.06 | | | | $10.00 | |
Net investment loss | | | (0.17 | )3 | | | (0.13 | )3 | | | (0.06 | ) |
Net realized and unrealized gains (losses) on investments | | | (0.29 | ) | | | 0.71 | | | | 0.12 | |
| | | | | | | | | | | | |
Total from investment operations | | | (0.46 | ) | | | 0.58 | | | | 0.06 | |
Distributions to shareholders from | | | | | | | | | | | | |
Net realized gains | | | (0.19 | ) | | | (0.15 | ) | | | 0.00 | |
Net asset value, end of period | | | $9.84 | | | | $10.49 | | | | $10.06 | |
Total return4 | | | (4.46 | )% | | | 5.80 | % | | | 0.60 | % |
Ratios to average net assets (annualized) | | | | | | | | | | | | |
Gross expenses5 | | | 4.10 | % | | | 4.14 | % | | | 4.49 | % |
Net expenses5 | | | 3.70 | % | | | 3.70 | % | | | 3.75 | % |
Net investment loss | | | (1.73 | )% | | | (1.35 | )% | | | (2.45 | )% |
Supplemental data | | | | | | | | | | | | |
Portfolio turnover rate | | | 284 | % | | | 237 | % | | | 92 | % |
Net assets, end of period (000s omitted) | | $ | 12,670 | | | $ | 2,396 | | | $ | 1,133 | |
| 1 | For the eleven months ended June 30, 2015. The Fund changed its fiscal year end from July 31 to June 30, effective June 30, 2015. |
| 2 | For the period from April 30, 2014 (commencement of class operations) to July 31, 2014 |
| 3 | Calculated based upon average shares outstanding |
| 4 | Total return calculations do not include any sales charges. Returns for periods of less than one year are not annualized. |
| 5 | Ratios include prime broker fees and dividend and interest expense on securities sold short as follows: |
| | | | |
Year ended June 30, 2016 | | | 0.83 | % |
Year ended June 30, 20151 | | | 0.64 | % |
Year ended July 31, 20142 | | | 0.58 | % |
The accompanying notes are an integral part of these financial statements.
| | | | |
| 38 | | Wells Fargo Alternative Strategies Fund | | Financial highlights |
(For a share outstanding throughout each period)
| | | | | | | | | | | | |
| | | Year ended June 30 | | | Year ended
July 31, 20142 | |
| ADMINISTRATOR CLASS | | 2016 | | | 20151 | | |
Net asset value, beginning of period | | | $10.60 | | | | $10.08 | | | | $10.00 | |
Net investment loss | | | (0.09 | )3 | | | (0.05 | )3 | | | (0.04 | ) |
Net realized and unrealized gains (losses) on investments | | | (0.28 | ) | | | 0.72 | | | | 0.12 | |
| | | | | | | | | | | | |
Total from investment operations | | | (0.37 | ) | | | 0.67 | | | | 0.08 | |
Distributions to shareholders from | | | | | | | | | | | | |
Net realized gains | | | (0.19 | ) | | | (0.15 | ) | | | 0.00 | |
Net asset value, end of period | | | $10.04 | | | | $10.60 | | | | $10.08 | |
Total return4 | | | (3.55 | )% | | | 6.58 | % | | | 0.90 | % |
Ratios to average net assets (annualized) | | | | | | | | | | | | |
Gross expenses5 | | | 3.28 | % | | | 3.25 | % | | | 3.57 | % |
Net expenses5 | | | 2.79 | % | | | 2.78 | % | | | 2.84 | % |
Net investment loss | | | (0.85 | )% | | | (0.51 | )% | | | (1.54 | )% |
Supplemental data | | | | | | | | | | | | |
Portfolio turnover rate | | | 284 | % | | | 237 | % | | | 92 | % |
Net assets, end of period (000s omitted) | | $ | 35,189 | | | $ | 6,326 | | | $ | 1,119 | |
| 1 | For the eleven months ended June 30, 2015. The Fund changed its fiscal year end from July 31 to June 30, effective June 30, 2015. |
| 2 | For the period from April 30, 2014 (commencement of class operations) to July 31, 2014 |
| 3 | Calculated based upon average shares outstanding |
| 4 | Returns for periods of less than one year are not annualized. |
| 5 | Ratios include prime broker fees and dividend and interest expense on securities sold short as follows: |
| | | | |
Year ended June 30, 2016 | | | 0.81 | % |
Year ended June 30, 20151 | | | 0.66 | % |
Year ended July 31, 20142 | | | 0.58 | % |
The accompanying notes are an integral part of these financial statements.
| | | | | | |
| Financial highlights | | Wells Fargo Alternative Strategies Fund | | | 39 | |
(For a share outstanding throughout each period)
| | | | | | | | | | | | |
| | | Year ended June 30 | | | Year ended
July 31, 20142 | |
| INSTITUTIONAL CLASS | | 2016 | | | 20151 | | |
Net asset value, beginning of period | | | $10.61 | | | | $10.09 | | | | $10.00 | |
Net investment loss | | | (0.06 | ) | | | (0.03 | ) | | | (0.04 | ) |
Net realized and unrealized gains (losses) on investments | | | (0.30 | ) | | | 0.70 | | | | 0.13 | |
| | | | | | | | | | | | |
Total from investment operations | | | (0.36 | ) | | | 0.67 | | | | 0.09 | |
Distributions to shareholders from | | | | | | | | | | | | |
Net realized gains | | | (0.19 | ) | | | (0.15 | ) | | | 0.00 | |
Net asset value, end of period | | | $10.06 | | | | $10.61 | | | | $10.09 | |
Total return3 | | | (3.45 | )% | | | 6.68 | % | | | 0.90 | % |
Ratios to average net assets (annualized) | | | | | | | | | | | | |
Gross expenses4 | | | 3.00 | % | | | 2.95 | % | | | 3.29 | % |
Net expenses4 | | | 2.69 | % | | | 2.69 | % | | | 2.74 | % |
Net investment loss | | | (0.72 | )% | | | (0.36 | )% | | | (1.44 | )% |
Supplemental data | | | | | | | | | | | | |
Portfolio turnover rate | | | 284 | % | | | 237 | % | | | 92 | % |
Net assets, end of period (000s omitted) | | $ | 185,535 | | | $ | 126,459 | | | $ | 97,838 | |
| 1 | For the eleven months ended June 30, 2015. The Fund changed its fiscal year end from July 31 to June 30, effective June 30, 2015. |
| 2 | For the period from April 30, 2014 (commencement of class operations) to July 31, 2014 |
| 3 | Returns for periods of less than one year are not annualized. |
| 4 | Ratios include prime broker fees and dividend and interest expense on securities sold short as follows: |
| | | | |
Year ended June 30, 2016 | | | 0.81 | % |
Year ended June 30, 20151 | | | 0.62 | % |
Year ended July 31, 20142 | | | 0.58 | % |
The accompanying notes are an integral part of these financial statements.
| | | | |
| 40 | | Wells Fargo Alternative Strategies Fund | | Notes to financial statements |
1. ORGANIZATION
Wells Fargo Funds Trust (the “Trust”), a Delaware statutory trust organized on March 10, 1999, is an open-end management investment company registered under the Investment Company Act of 1940, as amended (the “1940 Act”). As an investment company, the Trust follows the accounting and reporting guidance in Financial Accounting Standards Board (“FASB”) Accounting Standards Codification Topic 946, Financial Services – Investment Companies. These financial statements report on the Wells Fargo Alternative Strategies Fund (the “Fund”) which is a diversified series of the Trust.
2. SIGNIFICANT ACCOUNTING POLICIES
The following significant accounting policies, which are consistently followed in the preparation of the financial statements of the Fund, are in conformity with U.S. generally accepted accounting principles which require management to make estimates and assumptions that affect the reported amounts of assets and liabilities, disclosure of contingent assets and liabilities at the date of the financial statements, and the reported amounts of revenues and expenses during the reporting period. Actual results could differ from those estimates.
Securities valuation
All investments are valued each business day as of the close of regular trading on the New York Stock Exchange (generally 4 p.m. Eastern Time), although the Fund may deviate from this calculation time under unusual or unexpected circumstances.
Equity securities, options and futures that are listed on a foreign or domestic exchange or market are valued at the official closing price or, if none, the last sales price. If no sale occurs on the principal exchange or market that day, the prior day’s price will be deemed “stale” and a fair value price will be determined in accordance with the Fund’s Valuation Procedures.
Non-listed options, swaps and exotics (i.e. caps, floors, etc.) are valued at the evaluated price provided by an independent pricing service or, if a reliable price is not available, the quoted bid price from an independent broker-dealer.
The values of securities denominated in foreign currencies are translated into U.S. dollars at rates provided by an independent foreign currency pricing source at a time each business day specified by the Management Valuation Team of Wells Fargo Funds Management, LLC (“Funds Management”).
Many securities markets and exchanges outside the U.S. close prior to the close of the New York Stock Exchange and therefore may not fully reflect trading or events that occur after the close of the principal exchange in which the foreign securities are traded, but before the close of the New York Stock Exchange. If such trading or events are expected to materially affect the value of such securities, then fair value pricing procedures approved by the Board of Trustees of the Fund are applied. These procedures take into account multiple factors including movements in U.S. securities markets after foreign exchanges close. Foreign securities that are fair valued under these procedures are categorized as Level 2 and the application of these procedures may result in transfers between Level 1 and Level 2. Depending on market activity, such fair valuations may be frequent. Such fair value pricing may result in net asset values that are higher or lower than net asset values based on the last reported sales price or latest quoted bid price. On June 30, 2016, such fair value pricing was used in pricing foreign securities.
Debt securities are valued at the evaluated bid price provided by an independent pricing service or, if a reliable price is not available, the quoted bid price from an independent broker-dealer.
Investments in registered open-end investment companies are valued at net asset value.
Investments which are not valued using any of the methods discussed above are valued at their fair value, as determined in good faith by the Board of Trustees of the Fund. The Board of Trustees has established a Valuation Committee comprised of the Trustees and has delegated to it the authority to take any actions regarding the valuation of portfolio securities that the Valuation Committee deems necessary or appropriate, including determining the fair value of portfolio securities, unless the determination has been delegated to the Management Valuation Team. The Board of Trustees retains the authority to make or ratify any valuation decisions or approve any changes to the Valuation Procedures as it deems appropriate. On a quarterly basis, the Board of Trustees receives reports on any valuation actions taken by the Valuation Committee or the Management Valuation Team which may include items for ratification.
| | | | | | |
| Notes to financial statements | | Wells Fargo Alternative Strategies Fund | | | 41 | |
Valuations of fair valued securities are compared to the next actual sales price when available, or other appropriate market values, to assess the continued appropriateness of the fair valuation methodologies used. These securities are fair valued on a day-to-day basis, taking into consideration changes to appropriate market information and any significant changes to the inputs considered in the valuation process until there is a readily available price provided on an exchange or by an independent pricing service. Valuations received from an independent pricing service or independent broker-dealer quotes are periodically validated by comparisons to most recent trades and valuations provided by other independent pricing services in addition to the review of prices by the manager and/or subadvisers. Unobservable inputs used in determining fair valuations are identified based on the type of security, taking into consideration factors utilized by market participants in valuing the investment, knowledge about the issuer and the current market environment.
Foreign currency translation
The accounting records of the Fund are maintained in U.S. dollars. The values of other assets and liabilities denominated in foreign currencies are translated into U.S. dollars at rates provided by an independent foreign currency pricing source at a time each business day specified by the Management Valuation Team. Purchases and sales of securities, and income and expenses are converted at the rate of exchange on the respective dates of such transactions. Net realized foreign exchange gains or losses arise from sales of foreign currencies, currency gains or losses realized between the trade and settlement dates on securities transactions, and the difference between the amounts of dividends, interest and foreign withholding taxes recorded and the U.S. dollar equivalent of the amounts actually paid or received. Net unrealized foreign exchange gains and losses arise from changes in the fair value of assets and liabilities other than investments in securities resulting from changes in exchange rates. The changes in net assets arising from changes in exchange rates and the changes in net assets resulting from changes in market prices of securities are not separately presented. Such changes are included in net realized and unrealized gains or losses from investments.
Forward foreign currency contracts
The Fund is subject to foreign currency exchange rate risk in the normal course of pursuing its investment objectives. A forward foreign currency contract is an agreement between two parties to purchase or sell a specific currency for an agreed-upon price at a future date. The Fund enters into forward foreign currency contracts to facilitate transactions in foreign-denominated securities and to attempt to minimize the risk to the Fund from adverse changes in the relationship between currencies. Forward foreign currency contracts are recorded at the forward rate and marked-to-market daily. When the contracts are closed, realized gains and losses arising from such transactions are recorded as realized gains or losses on forward foreign currency contract transactions. The Fund could be exposed to risks if the counterparties to the contracts are unable to meet the terms of their contracts or if the value of the foreign currency changes unfavorably. The Fund’s maximum risk of loss from counterparty credit risk is the unrealized gains on the contracts. This risk may be mitigated if there is a master netting arrangement between the Fund and the counterparty.
When-issued transactions
The Fund may purchase securities on a forward commitment or when-issued basis. The Fund records a when-issued transaction on the trade date and will segregate assets in an amount at least equal in value to the Fund’s commitment to purchase when-issued securities. Securities purchased on a when-issued basis are marked-to-market daily and the Fund begins earning interest on the settlement date. Losses may arise due to changes in the market value of the underlying securities or if the counterparty does not perform under the contract.
Futures contracts
The Fund is subject to interest rate risk, equity price risk and foreign currency exchange rate risk in the normal course of pursuing its investment objectives. The Fund may buy and sell futures contracts in order to gain exposure to, or protect against, changes in security values and interest rates. The primary risks associated with the use of futures contracts are the imperfect correlation between changes in market values of securities held by the Fund and the prices of futures contracts, and the possibility of an illiquid market.
The aggregate principal amounts of the contracts are not recorded in the financial statements. Fluctuations in the value of the contracts are recorded in the Statement of Assets and Liabilities as an asset or liability and in the Statement of Operations as unrealized gains or losses until the contracts are closed, at which point they are recorded as net realized gains or losses on futures contracts. With futures contracts, there is minimal counterparty risk to the Fund since futures are exchange traded and the exchange’s clearinghouse, as counterparty to all exchange traded futures, guarantees the futures against default.
Options
The Fund is subject to equity price risk in the normal course of pursuing its investment objectives. The Fund may write covered call options or secured put options on individual securities and/or indexes. When the Fund writes an option, an
| | | | |
| 42 | | Wells Fargo Alternative Strategies Fund | | Notes to financial statements |
amount equal to the premium received is recorded as a liability and is subsequently adjusted to the current market value of the written option. Premiums received from written options that expire unexercised are recognized as realized gains on the expiration date. For exercised options, the difference between the premium received and the amount paid on effecting a closing purchase transaction, including brokerage commissions, is treated as a realized gain or loss. If a call option is exercised, the premium is added to the proceeds from the sale of the underlying security in calculating the realized gain or loss on the sale. If a put option is exercised, the premium reduces the cost of the security purchased. The Fund, as a writer of an option, bears the market risk of an unfavorable change in the price of the security and/or index underlying the written option.
The Fund may also purchase call or put options. The premium is included in the Statement of Assets and Liabilities as an investment, the value of which is subsequently adjusted based on the current market value of the option. Premiums paid for purchased options that expire are recognized as realized losses on the expiration date. Premiums paid for purchased options that are exercised or closed are added to the amount paid or offset against the proceeds received for the underlying security to determine the realized gain or loss. The risk of loss associated with purchased options is limited to the premium paid.
Options traded on an exchange are regulated and terms of the options are standardized. Purchased options traded over-the-counter expose the Fund to counterparty risk in the event the counterparty does not perform. This risk can be mitigated by having a master netting arrangement between the Fund and the counterparty and by having the counterparty post collateral to cover the Fund’s exposure to the counterparty.
Short sales
The Fund may sell a security it does not own in anticipation of a decline in the market value of that security (short sale). When the Fund makes a short sale, it must borrow the security sold short and deliver it to the buyer. The Fund is then obligated to replace the security borrowed by purchasing the security at the market price at the time of replacement.
The Fund records the proceeds as a liability which is marked-to-market daily based upon quotations from an independent pricing service or an independent broker-dealer and any change in value is recorded as an unrealized gain or loss. Any interest or dividends accrued on such borrowed securities during the period of the loan are recorded as an expense on the Statement of Operations. To borrow the security, the Fund may be required to pay a premium, which would decrease the proceeds of the security sold. A gain, limited to the price at which the Fund sold the security short, or a loss, unlimited in size, will be recognized upon the closing of a short sale if the market price at the closing is less than or greater than, respectively, the proceeds originally received. Until the short sale is closed or the borrowed security is replaced, the Fund maintains a segregated account of cash or liquid securities, the dollar value of which is at least equal to the market value of the security at the time of the short sale.
Credit default swaps
The Fund is subject to credit risk in the normal course of pursuing its investment objectives. The Fund may enter into credit default swap contracts for hedging or speculative purposes to provide or receive a measure of protection against default on a referenced entity, obligation or index or for investment gains. Credit default swaps involve an exchange of a stream of payments for protection against the loss in value of an underlying security or index. Under the terms of the swap, one party acts as a guarantor (referred to as the seller of protection) and receives a periodic stream of payments, provided that there is no credit event, from another party (referred to as the buyer of protection) that is a fixed percentage applied to a notional principal amount over the term of the swap. An index credit default swap references all the names in the index, and if a credit event is triggered, the credit event is settled based on that name’s weight in the index. A credit event includes bankruptcy, failure to pay, obligation default, obligation acceleration, repudiation/moratorium, and restructuring. The Fund may enter into credit default swaps as either the seller of protection or the buyer of protection. As the seller of protection, the Fund is subject to investment exposure on the notional amount of the swap and has assumed the risk of default of the underlying security or index. As the buyer of protection, the Fund could be exposed to risks if the seller of the protection defaults on its obligation to perform, or if there are unfavorable changes in the fluctuation of interest rates. The maximum potential amount of future payments (undiscounted) that the Fund as the seller of protection could be required to make under the credit default swap contract would be an amount equal to the notional amount of the swap contract. The Fund’s maximum risk of loss from counterparty risk, either as the protection seller or as the protection buyer, is the fair value of the contract. This risk is mitigated by having a master netting arrangement between the Fund and the counterparty and by having the counterparty post collateral to cover the Fund’s exposure to the counterparty.
If the Fund is the seller of protection and a credit event occurs, as defined under the terms of that particular swap agreement, the Fund will pay to the buyer of protection the notional amount of the swap and take delivery of the
| | | | | | |
| Notes to financial statements | | Wells Fargo Alternative Strategies Fund | | | 43 | |
referenced obligation or underlying securities comprising the referenced index. If the Fund is the buyer of protection and a credit event occurs, as defined under the terms of that particular swap agreement, the Fund will receive from the seller of protection the notional amount of the swap and deliver the referenced obligation or underlying securities comprising the referenced index.
Any premiums paid or received on the transactions are recorded as an asset or liability on the Statement of Assets and Liabilities and amortized. The value of the swap contract is marked-to-market daily based on quotations from an independent pricing service or an independent broker-dealer and any change in value is recorded as an unrealized gain or loss. Periodic payments made or received are recorded as realized gains or losses. In addition, payments received or made as a result of a credit event or termination of the contract are recognized as realized gains or losses.
Certain credit default swap contracts entered into by the Fund provide for conditions that result in events of default or termination that enable the counterparty to the agreement to cause an early termination of the transactions under those agreements. Any election by the counterparty to terminate early may impact the amounts reported on the financial statements.
Total return swaps
The Fund is subject to interest rate risk in the normal course of pursuing its investment objectives. The Fund may enter into total return swap contracts for hedging or speculative purposes. Total return swaps involve commitments to pay interest in exchange for a market-linked return, both based on notional amounts. To the extent the total return of the security or index underlying the transaction exceeds or falls short of the offsetting interest rate obligation, the Fund will receive a payment from, or make a payment to, the counterparty.
The value of the swap contract is marked-to-market daily based upon quotations from an independent pricing service or an independent broker-dealer and any change in value is recorded as an unrealized gain or loss. Periodic payments made or received are recorded as realized gains or losses. The Fund could be exposed to risks if the counterparty defaults on its obligation to perform, or if there are unfavorable changes in the fluctuation of interest rates or in the price of the underlying security or index. The Fund’s maximum risk of loss from counterparty risk is the fair value of the contract. This risk is mitigated by having a master netting arrangement between the Fund and the counterparty and by having the counterparty post collateral to cover the Fund’s exposure to the counterparty.
Certain total return swap contracts entered into by the Fund provide for conditions that result in events of default or termination that enable the counterparty to the agreement to cause an early termination of the transactions under those agreements. Any election by the counterparty to terminate early may impact the amounts reported on the financial statements.
Security transactions and income recognition
Securities transactions are recorded on a trade date basis. Realized gains or losses are recorded on the basis of identified cost.
Dividend income is recognized on the ex-dividend date, except for certain dividends from foreign securities, which are recorded as soon as the custodian verifies the ex-dividend date. Dividend income from foreign securities is recorded net of foreign taxes withheld where recovery of such taxes is not assured.
Interest income is accrued daily and bond discounts are accreted and premiums are amortized daily based on the effective interest method. To the extent debt obligations are placed on non-accrual status, any related interest income may be reduced by writing off interest receivables when the collection of all or a portion of interest has become doubtful based on consistently applied procedures. If the issuer subsequently resumes interest payments or when the collectability of interest is reasonably assured, the debt obligation is removed from non-accrual status.
Distributions to shareholders
Distributions to shareholders from net investment income and net realized gains, if any, are recorded on the ex-dividend date. Such distributions are determined in conformity with federal income tax regulations, which may differ in amount or character from net investment income and realized gains recognized for purposes of U.S. generally accepted accounting principles.
Federal and other taxes
The Fund intends to continue to qualify as a regulated investment company by distributing substantially all of its investment company taxable income and any net realized capital gains (after reduction for capital loss carryforwards) sufficient to relieve it from all, or substantially all, federal income taxes. Accordingly, no provision for federal income taxes was required.
| | | | |
| 44 | | Wells Fargo Alternative Strategies Fund | | Notes to financial statements |
The Fund’s income and federal excise tax returns and all financial records supporting those returns for the prior three fiscal years are subject to examination by the federal and Delaware revenue authorities. Management has analyzed the Fund’s tax positions taken on federal, state, and foreign tax returns for all open tax years and does not believe that there are any uncertain tax positions that require recognition of a tax liability.
Reclassifications are made to the Fund’s capital accounts for permanent tax differences to reflect income and gains available for distribution (or available capital loss carryforwards) under federal income tax regulations. U.S. generally accepted accounting principles require that certain components of net assets be adjusted to reflect permanent differences between financial and tax reporting. These reclassifications have no effect on net assets or net asset values per share. The primary permanent differences causing such reclassifications are due to certain distributions paid, dividends from certain securities, foreign currency transactions, net operating losses, and securities sold short. At June 30, 2016, as a result of permanent book-to-tax differences, the following reclassification adjustments were made on the Statement of Assets and Liabilities:
| | | | |
| Paid-in capital | | Accumulated net
investment loss | | Accumulated net
realized losses
on investments |
| $(852,321) | | $505,374 | | $346,947 |
As of June 30, 2016, the Fund had current year deferred post-October capital losses and a qualified late-year ordinary loss which will both be recognized on the first day of the following fiscal year in the following amounts:
| | | | |
Deferred post-October capital losses | | Late-year
ordinary losses
deferred |
| Short-term | | Long-term | |
| $(1,239,705) | | $(621,036) | | $(1,283,264) |
Class allocations
The separate classes of shares offered by the Fund differ principally in applicable sales charges, distribution, shareholder servicing, and administration fees. Class specific expenses are charged directly to that share class. Investment income, common expenses, and realized and unrealized gains (losses) on investments are allocated daily to each class of shares based on the relative proportion of net assets of each class.
3. FAIR VALUATION MEASUREMENTS
Fair value measurements of investments are determined within a framework that has established a fair value hierarchy based upon the various data inputs utilized in determining the value of the Fund’s investments. The three-level hierarchy gives the highest priority to unadjusted quoted prices in active markets for identical assets or liabilities (Level 1) and the lowest priority to significant unobservable inputs (Level 3). The Fund’s investments are classified within the fair value hierarchy based on the lowest level of input that is significant to the fair value measurement. The inputs are summarized into three broad levels as follows:
| n | | Level 1 – quoted prices in active markets for identical securities |
| n | | Level 2 – other significant observable inputs (including quoted prices for similar securities, interest rates, prepayment speeds, credit risk, use of amortized cost, etc.) |
| n | | Level 3 – significant unobservable inputs (including the Fund’s own assumptions in determining the fair value of investments) |
The inputs or methodologies used for valuing investments in securities are not necessarily an indication of the risk associated with investing in those securities.
| | | | | | |
| Notes to financial statements | | Wells Fargo Alternative Strategies Fund | | | 45 | |
The following is a summary of the inputs used in valuing the Fund’s assets and liabilities as of June 30, 2016:
| | | | | | | | | | | | | | | | |
| | | Quoted prices
(Level 1) | | | Other significant
observable inputs
(Level 2) | | | Significant
unobservable inputs (Level 3) | | | Total | |
Assets | | | | | | | | | | | | | | | | |
Investments in: | | | | | | | | | | | | | | | | |
| | | | |
Common stocks | | | | | | | | | | | | | | | | |
Consumer discretionary | | $ | 30,844,220 | | | $ | 2,557,854 | | | $ | 0 | | | $ | 33,402,074 | |
Consumer staples | | | 14,561,395 | | | | 4,572,992 | | | | 0 | | | | 19,134,387 | |
Energy | | | 10,182,486 | | | | 639,418 | | | | 0 | | | | 10,821,904 | |
Financials | | | 8,810,786 | | | | 2,809,791 | | | | 0 | | | | 11,620,577 | |
Health care | | | 15,419,309 | | | | 1,088,740 | | | | 0 | | | | 16,508,049 | |
Industrials | | | 8,354,547 | | | | 2,687,757 | | | | 0 | | | | 11,042,304 | |
Information technology | | | 18,428,093 | | | | 2,122,181 | | | | 0 | | | | 20,550,274 | |
Materials | | | 7,079,594 | | | | 1,193,062 | | | | 0 | | | | 8,272,656 | |
Telecommunication services | | | 1,393,208 | | | | 1,962,967 | | | | 0 | | | | 3,356,175 | |
Utilities | | | 1,684,773 | | | | 470,083 | | | | 0 | | | | 2,154,856 | |
| | | | |
Corporate bonds and notes | | | 0 | | | | 2,226,533 | | | | 0 | | | | 2,226,533 | |
| | | | |
Exchange-traded funds | | | 0 | | | | 18,349 | | | | 0 | | | | 18,349 | |
| | | | |
Foreign corporate bonds and notes | | | 0 | | | | 77,402 | | | | 0 | | | | 77,402 | |
| | | | |
Investment companies | | | 20,351,161 | | | | 0 | | | | 0 | | | | 20,351,161 | |
| | | | |
Municipal obligations | | | 0 | | | | 701,354 | | | | 0 | | | | 701,354 | |
| | | | |
Non-agency mortgage-backed securities | | | 0 | | | | 10,170,669 | | | | 0 | | | | 10,170,669 | |
| | | | |
Preferred stocks | | | | | | | | | | | | | | | | |
Financials | | | 0 | | | | 11,752 | | | | 0 | | | | 11,752 | |
Health care | | | 551,023 | | | | 0 | | | | 0 | | | | 551,023 | |
Industrials | | | 0 | | | | 0 | | | | 59,307 | | | | 59,307 | |
| | | | |
Purchased put options | | | 0 | | | | 540,874 | | | | 0 | | | | 540,874 | |
| | | | |
Warrants | | | | | | | | | | | | | | | | |
Financials | | | 0 | | | | 288,462 | | | | 0 | | | | 288,462 | |
Industrials | | | 0 | | | | 19,978 | | | | 0 | | | | 19,978 | |
| | | | |
Short-term investments | | | | | | | | | | | | | | | | |
Investment companies | | | 51,055,553 | | | | 0 | | | | 0 | | | | 51,055,553 | |
U.S. Treasury securities | | | 3,658,327 | | | | 0 | | | | 0 | | | | 3,658,327 | |
| | | 192,374,475 | | | | 34,160,218 | | | | 59,307 | | | | 226,594,000 | |
| | | | |
Forward foreign currency contracts | | | 0 | | | | 197,949 | | | | 0 | | | | 197,949 | |
Futures contracts | | | 277,283 | | | | 0 | | | | 0 | | | | 277,283 | |
Total return swap contracts | | | 0 | | | | 60,345 | | | | 0 | | | | 60,345 | |
Total assets | | $ | 192,651,758 | | | $ | 34,418,512 | | | $ | 59,307 | | | $ | 227,129,577 | |
Liabilities | | | | | | | | | | | | | | | | |
Securities sold short | | | | | | | | | | | | | | | | |
| | | | |
Common stocks | | | | | | | | | | | | | | | | |
Consumer discretionary | | $ | 4,824,485 | | | $ | 575,680 | | | $ | 0 | | | $ | 5,400,165 | |
Consumer staples | | | 1,175,815 | | | | 199,218 | | | | 0 | | | | 1,375,033 | |
Energy | | | 9,230,435 | | | | 0 | | | | 0 | | | | 9,230,435 | |
Financials | | | 2,268,826 | | | | 470,033 | | | | 0 | | | | 2,738,859 | |
Health care | | | 1,234,375 | | | | 0 | | | | 0 | | | | 1,234,375 | |
Industrials | | | 2,351,793 | | | | 0 | | | | 0 | | | | 2,351,793 | |
Information technology | | | 9,495,032 | | | | 0 | | | | 0 | | | | 9,495,032 | |
Materials | | | 2,936,205 | | | | 0 | | | | 0 | | | | 2,936,205 | |
Telecommunication services | | | 80,976 | | | | 0 | | | | 0 | | | | 80,976 | |
| | | | |
Exchange-traded funds | | | 24,811,491 | | | | 0 | | | | 0 | | | | 24,811,491 | |
| | | 58,409,433 | | | | 1,244,931 | | | | 0 | | | | 59,654,364 | |
| | | | |
Credit default swap contracts | | | 0 | | | | 647 | | | | 0 | | | | 647 | |
| | | | |
Forward foreign currency contracts | | | 0 | | | | 91,182 | | | | 0 | | | | 91,182 | |
| | | | |
Futures contracts | | | 330,756 | | | | 0 | | | | 0 | | | | 330,756 | |
Total return swap contracts | | | 0 | | | | 186,601 | | | | 0 | | | | 186,601 | |
| | | | |
Written options | | | 0 | | | | 253,328 | | | | 0 | | | | 253,328 | |
Total liabilities | | $ | 58,740,189 | | | $ | 1,776,689 | | | $ | 0 | | | $ | 60,516,878 | |
| | | | |
| 46 | | Wells Fargo Alternative Strategies Fund | | Notes to financial statements |
Forward foreign currency contracts are reported at their unrealized gains (losses) at measurement date, which represents the change in the contract’s value from trade date. Futures contracts are reported at their variation margin at measurement date, which represents the amount due to/from the Fund at that date. Swap contracts consists of unrealized gains (losses) and premiums paid or received on swap contracts, which represents the change in the contract’s value from trade date. All other assets and liabilities are reported at their market value at measurement date.
The Fund recognizes transfers between levels within the fair value hierarchy at the end of the reporting period. At June 30, 2016, fair value pricing was used in pricing certain foreign securities and securities in long positions valued at $13,374,984 were transferred from Level 1 to Level 2 within the fair value hierarchy. The Fund did not have any transfers into/out of Level 3.
4. TRANSACTIONS WITH AFFILIATES AND OTHER EXPENSES
Management fee
Funds Management, an indirect wholly owned subsidiary of Wells Fargo & Company (“Wells Fargo”), is the manager of the Fund and provides advisory and fund-level administrative services under an investment management agreement. Under the investment management agreement, Funds Management is responsible for, among other services, implementing the investment objectives and strategies of the Fund, supervising the applicable subadvisers, providing fund-level administrative services in connection with the Fund’s operations, and providing any other fund-level administrative services reasonably necessary for the operation of the Fund. As compensation for its services under the investment management agreement, Funds Management is entitled to receive an annual management fee starting at 1.75% and declining to 1.63% as the average daily net assets of the Fund increase. For the year ended June 30, 2016, the management fee was equivalent to an annual rate of 1.75% of the Fund’s average daily net assets.
Funds Management has engaged The Rock Creek Group, LP, Chilton Investment Company, LLC, Ellington Global Asset Management LLC, Mellon Capital Management Corporation, Passport Capital, LLC, Pine River Capital Management L.P., River Canyon Fund Management LLC, Sirios Capital Management, L.P. and Wellington Management Company, LLP (“WMC”) to serve as sub-advisers to the Fund. The fee for subadvisory services is borne by Funds Management. The subadvisers are each entitled to receive from Funds Management an annual subadvisory fee.
The Rock Creek Group, LP, an indirect majority owned subsidiary of Wells Fargo and an affiliate of Funds Management, is entitled to receive a fee at an annual rate starting at 0.60% and declining to 0.55% as the average daily net assets of the Fund increase. For the year ended June 30, 2016, the subadvisory fees paid to the remaining unaffiliated subadvisors was equivalent to an annual rate of 0.98% of the Fund’s average daily net assets.
Administration fees
Under a class-level administration agreement, Funds Management provides class-level administrative services to the Fund, which includes paying fees and expenses for services provided by the transfer agent, sub-transfer agents, omnibus account servicers and record-keepers. As compensation for its services under the class-level administration agreement, Funds Management receives an annual fee which is calculated based on the average daily net assets of each class as follows:
| | | | |
| | | Class-level
administration fee | |
Class A, Class C | | | 0.21 | % |
Administrator Class, Institutional Class | | | 0.13 | |
Funds Management has contractually waived and/or reimbursed advisory and administration fees to the extent necessary to maintain certain net operating expense ratios for the Fund. Waiver of fees and/or reimbursement of expenses by Funds Management were made first from fund level expenses on a proportionate basis and then from class specific expenses. Funds Management has committed through October 31, 2016 to waive fees and/or reimburse expenses to the extent necessary to cap the Fund’s expenses at 2.22% for Class A shares, 2.97% for Class C shares, 2.07% for Administrator Class shares, and 1.97% for Institutional Class shares. After this time, the cap may be increased or the commitment to maintain the cap may be terminated only with the approval of the Board of Trustees. Prime broker fees and dividend and interest expense on securities sold short are excluded from the expense caps.
| | | | | | |
| Notes to financial statements | | Wells Fargo Alternative Strategies Fund | | | 47 | |
Distribution fee
The Trust has adopted a distribution plan for Class C shares of the Fund pursuant to Rule 12b-1 under the 1940 Act. A distribution fee is charged to Class C shares and paid to Wells Fargo Funds Distributor, LLC (“Funds Distributor”), the principal underwriter, at an annual rate of 0.75% of the average daily net assets of Class C shares.
In addition, Funds Distributor is entitled to receive the front-end sales charge from the purchase of Class A shares and a contingent deferred sales charge on the redemption of certain Class A shares. Funds Distributor is also entitled to receive the contingent deferred sales charges from redemptions of Class C shares. For the year ended June 30, 2016, Funds Distributor received $24,920 from the sale of Class A shares and $138 in contingent deferred sales charges from redemptions of Class C shares.
Shareholder servicing fees
The Trust has entered into contracts with one or more shareholder servicing agents, whereby Class A, Class C, and Administrator Class of the Fund are charged a fee at an annual rate of 0.25% of the average daily net assets of each respective class.
A portion of these total shareholder servicing fees were paid to affiliates of Wells Fargo.
5. INVESTMENT PORTFOLIO TRANSACTIONS
Purchases and sales of investments, excluding U.S. government obligations (if any) and short-term securities, for the year ended June 30, 2016 were $603,585,990 and $546,474,673, respectively.
The Fund may purchase or sell investment securities to other Wells Fargo funds under procedures adopted by the Board of Trustees. The procedures have been designed to ensure that these interfund transactions, which generally do not incur broker commissions, are effected at current market prices. Interfund trades are included within the respective purchases and sales amounts shown.
| | | | |
| 48 | | Wells Fargo Alternative Strategies Fund | | Notes to financial statements |
6. DERIVATIVE TRANSACTIONS
During the year ended June 30, 2016, the Fund entered into futures contracts for speculative purposes.
At June 30, 2016, the Fund had long and short futures contracts outstanding as follows:
| | | | | | | | | | | | | | |
| Expiration date | | Contracts | | Counterparty | | Type | | Contract value at June 30, 2016 | | | Unrealized gains
(losses) | |
7-15-2016 | | 2 Short | | Morgan Stanley | | Amsterdam Index | | $ | 193,230 | | | $ | (7,523 | ) |
7-15-2016 | | 30 Long | | Morgan Stanley | | CAC 40 Index | | | 1,409,604 | | | | 24,913 | |
7-15-2016 | | 13 Long | | Morgan Stanley | | IBEX 35 Index | | | 1,172,505 | | | | (8,358 | ) |
7-28-2016 | | 2 Long | | Morgan Stanley | | Hang Seng Index | | | 270,002 | | | | 10,273 | |
9-8-2016 | | 136 Short | | Morgan Stanley | | Euro-Bund Futures | | | 25,222,749 | | | | (475,623 | ) |
9-8-2016 | | 19 Long | | Morgan Stanley | | TOPIX Index | | | 2,291,628 | | | | (157,223 | ) |
9-8-2016 | | 9 Short | | Morgan Stanley | | TOPIX Index | | | 1,085,508 | | | | 83,713 | |
9-15-2016 | | 110 Long | | Morgan Stanley | | 10-Year Australian Treasury Bonds | | | 11,173,539 | | | | 84,923 | |
9-15-2016 | | 18 Short | | Morgan Stanley | | S&P/TSX 60 Index | | | 2,273,494 | | | | (16,083 | ) |
9-15-2016 | | 8 Short | | Morgan Stanley | | SPI 200 Index | | | 772,052 | | | | (8,835 | ) |
9-16-2016 | | 11 Long | | Morgan Stanley | | DAX Index | | | 2,950,644 | | | | 12,364 | |
9-16-2016 | | 111 Short | | Morgan Stanley | | Euro STOXX 50 Index | | | 3,516,853 | | | | (51,952 | ) |
9-16-2016 | | 31 Short | | Morgan Stanley | | FTSE 100 Index | | | 2,650,484 | | | | (229,504 | ) |
9-16-2016 | | 20 Short | | Morgan Stanley | | FTSE 100 Index | | | 1,709,990 | | | | (136,090 | ) |
9-16-2016 | | 26 Long | | Morgan Stanley | | FTSE MIB Index | | | 2,335,835 | | | | 57,981 | |
9-16-2016 | | 20 Short | | Morgan Stanley | | MSCI EAFE Index | | | 1,615,200 | | | | (20,645 | ) |
9-16-2016 | | 10 Short | | Morgan Stanley | | MSCI Emerging Markets Index | | | 417,350 | | | | (18,923 | ) |
9-16-2016 | | 11 Short | | Morgan Stanley | | Russell 2000 Index | | | 1,262,140 | | | | (7,156 | ) |
9-16-2016 | | 43 Short | | Morgan Stanley | | S&P 500 E-Mini Index | | | 4,493,930 | | | | 7,795 | |
9-16-2016 | | 8 Short | | Morgan Stanley | | S&P 500 E-Mini Index | | | 836,080 | | | | (8,076 | ) |
9-19-2016 | | 87 Short | | Morgan Stanley | | British Pound Futures | | | 7,203,600 | | | | 347,155 | |
9-19-2016 | | 160 Short | | Morgan Stanley | | Euro FX Futures | | | 22,215,000 | | | | 475,073 | |
9-19-2016 | | 8 Short | | Morgan Stanley | | Swedish Krona Futures | | | 1,892,480 | | | | 84,776 | |
9-19-2016 | | 1 Long | | Morgan Stanley | | Swiss Franc Futures | | | 128,300 | | | | (1,878 | ) |
9-21-2016 | | 6 Long | | Morgan Stanley | | 10-Year Canadian Treasury Bonds | | | 687,519 | | | | 3,111 | |
9-21-2016 | | 221 Long | | Morgan Stanley | | 10-Year U.S. Treasury Notes | | | 29,389,547 | | | | 760,940 | |
9-28-2016 | | 25 Short | | Morgan Stanley | | Long Gilt Bonds | | | 4,276,306 | | | | (12,875 | ) |
The Fund had an average notional amount of $43,362,119 in long and $71,940,209 in short futures contracts during the year ended June 30, 2016. As of June 30, 2016, in addition to securities held as collateral, the Fund had $801,183 on deposit at the prime broker for open futures contracts.
| | | | | | |
| Notes to financial statements | | Wells Fargo Alternative Strategies Fund | | | 49 | |
During the year ended June 30, 2016, the Fund entered into forward foreign currency contracts for speculative purposes.
At June 30, 2016, the Fund had forward foreign currency contracts outstanding as follows:
Forward foreign currency contracts to buy:
| | | | | | | | | | | | | | | | | | |
| Exchange date | | Counterparty | | Contracts to receive | | | U.S. value at June 30, 2016 | | | In exchange for U.S. $ | | | Unrealized
gains
(losses) | |
| 7-15-2016 | | Morgan Stanley | | | 169,000 | EUR | | $ | 187,613 | | | $ | 186,694 | | | $ | 919 | |
| 7-15-2016 | | Morgan Stanley | | | 37,000 | EUR | | | 41,075 | | | | 41,544 | | | | (469 | ) |
| 7-15-2016 | | Morgan Stanley | | | 39,000 | EUR | | | 43,295 | | | | 44,038 | | | | (743 | ) |
| 7-15-2016 | | Morgan Stanley | | | 29,000 | EUR | | | 32,194 | | | | 32,919 | | | | (725 | ) |
| 7-15-2016 | | Morgan Stanley | | | 22,000 | EUR | | | 24,423 | | | | 24,908 | | | | (485 | ) |
| 7-15-2016 | | Morgan Stanley | | | 24,000 | EUR | | | 26,643 | | | | 27,542 | | | | (899 | ) |
| 7-15-2016 | | Morgan Stanley | | | 15,000 | CHF | | | 15,371 | | | | 15,697 | | | | (326 | ) |
| 7-15-2016 | | Morgan Stanley | | | 70,000 | EUR | | | 77,709 | | | | 80,179 | | | | (2,470 | ) |
| 9-21-2016 | | Morgan Stanley | | | 98,049 | CHF | | | 100,857 | | | | 100,608 | | | | 249 | |
| 9-21-2016 | | Morgan Stanley | | | 81,048 | CHF | | | 83,369 | | | | 84,447 | | | | (1,078 | ) |
| 9-21-2016 | | Morgan Stanley | | | 111,328 | CHF | | | 114,516 | | | | 116,311 | | | | (1,795 | ) |
| 9-21-2016 | | Morgan Stanley | | | 24,000 | EUR | | | 26,709 | | | | 26,631 | | | | 78 | |
Forward foreign currency contracts to sell:
| | | | | | | | | | | | | | | | | | |
| Exchange date | | Counterparty | | Contracts to deliver | | | U.S. value at June 30, 2016 | | | In exchange for U.S. $ | | | Unrealized
gains
(losses) | |
| 7-15-2016 | | Morgan Stanley | | | 57,000 | EUR | | $ | 63,278 | | | $ | 62,779 | | | $ | (499 | ) |
| 7-15-2016 | | Morgan Stanley | | | 89,000 | EUR | | | 98,802 | | | | 99,428 | | | | 626 | |
| 7-15-2016 | | Morgan Stanley | | | 17,000 | EUR | | | 18,872 | | | | 19,348 | | | | 476 | |
| 7-15-2016 | | Morgan Stanley | | | 638,000 | EUR | | | 708,266 | | | | 728,596 | | | | 20,330 | |
| 7-15-2016 | | Morgan Stanley | | | 24,000 | CHF | | | 24,593 | | | | 25,237 | | | | 644 | |
| 7-15-2016 | | Morgan Stanley | | | 76,000 | CHF | | | 77,879 | | | | 79,916 | | | | 2,037 | |
| 7-15-2016 | | Morgan Stanley | | | 496,000 | EUR | | | 550,627 | | | | 566,432 | | | | 15,805 | |
| 7-15-2016 | | Morgan Stanley | | | 189,000 | CHF | | | 193,672 | | | | 198,738 | | | | 5,066 | |
| 7-15-2016 | | Morgan Stanley | | | 26,000 | EUR | | | 28,864 | | | | 29,665 | | | | 801 | |
| 7-15-2016 | | Morgan Stanley | | | 49,000 | EUR | | | 54,397 | | | | 54,637 | | | | 240 | |
| 7-15-2016 | | Morgan Stanley | | | 34,000 | EUR | | | 37,745 | | | | 38,509 | | | | 764 | |
| 9-21-2016 | | Bank of America | | | 463,000 | GBP | | | 616,826 | | | | 650,809 | | | | 33,983 | |
| 9-21-2016 | | JPMorgan Chase Bank | | | 286,757,000 | JPY | | | 2,784,196 | | | | 2,702,578 | | | | (81,618 | ) |
| 9-21-2016 | | Morgan Stanley | | | 1,606,448 | CHF | | | 1,652,451 | | | | 1,674,883 | | | | 22,432 | |
| 9-21-2016 | | Morgan Stanley | | | 73,914 | EUR | | | 82,259 | | | | 82,184 | | | | (75 | ) |
| 9-21-2016 | | Morgan Stanley | | | 691,394 | EUR | | | 769,447 | | | | 783,537 | | | | 14,090 | |
| 9-21-2016 | | Morgan Stanley | | | 72,270 | EUR | | | 80,429 | | | | 80,472 | | | | 43 | |
| 9-21-2016 | | Morgan Stanley | | | 10,505 | EUR | | | 11,691 | | | | 11,891 | | | | 200 | |
| 9-21-2016 | | Morgan Stanley | | | 179,656 | CHF | | | 184,801 | | | | 188,189 | | | | 3,388 | |
| 9-21-2016 | | UBS | | | 3,342,000 | EUR | | | 3,719,286 | | | | 3,795,064 | | | | 75,778 | |
The Fund had average contract amounts of $1,337,953 and $9,250,469 in forward foreign currency contracts to buy and forward foreign currency contracts to sell, respectively, during the year ended June 30, 2016.
During the year ended June 30, 2016, the Fund entered into written options for speculative purposes.
| | | | |
| 50 | | Wells Fargo Alternative Strategies Fund | | Notes to financial statements |
During the year ended June 30, 2016, the Fund had written option activities as follows:
| | | | | | | | | | | | | | | | |
| | | Call options | | | Put options | |
| | | Number of contracts | | | Premiums
received | | | Number of
contracts | | | Premiums
received | |
Options outstanding at June 30, 2015 | | | 5 | | | $ | 957 | | | | 46 | | | $ | 193,061 | |
Options written | | | 48 | | | | 8,178 | | | | 131 | | | | 593,183 | |
Options expired | | | (26 | ) | | | (4,352 | ) | | | (43 | ) | | | (156,969 | ) |
Options closed | | | (2 | ) | | | (329 | ) | | | (66 | ) | | | (275,201 | ) |
Options exercised | | | (3 | ) | | | (628 | ) | | | 0 | | | | 0 | |
Options outstanding at June 30, 2016 | | | 22 | | | $ | 3,826 | | | | 68 | | | $ | 354,074 | |
Open put/call options written at June 30, 2016 were as follows:
| | | | | | | | | | | | | | | | | | | | |
| Expiration date | | Counterparty | | Description | | Number of
contracts | | | Call/Put | | | Strike
price | | | Value | |
7-15-2016 | | Morgan Stanley | | EMC Corporation | | | 1 | | | | Call | | | $ | 28 | | | $ | (13 | ) |
8-19-2016 | | Morgan Stanley | | Avis Budget Group
Incorporated | | | 5 | | | | Call | | | | 33 | | | | (1,145 | ) |
11-18-2016 | | Morgan Stanley | | Avis Budget Group
Incorporated | | | 3 | | | | Call | | | | 33 | | | | (1,080 | ) |
11-18-2016 | | Morgan Stanley | | Avis Budget Group
Incorporated | | | 3 | | | | Call | | | | 32 | | | | (1,260 | ) |
12-16-2016 | | Morgan Stanley | | S&P 500 Index | | | 26 | | | | Put | | | | 1,700 | | | | (50,440 | ) |
1-20-2017 | | Morgan Stanley | | Avis Budget Group
Incorporated | | | 5 | | | | Call | | | | 40 | | | | (1,084 | ) |
1-20-2017 | | Morgan Stanley | | Avis Budget Group
Incorporated | | | 5 | | | | Call | | | | 38 | | | | (1,357 | ) |
3-17-2017 | | Morgan Stanley | | S&P 500 Index | | | 21 | | | | Put | | | | 1,725 | | | | (80,010 | ) |
6-16-2017 | | Morgan Stanley | | S&P 500 Index | | | 21 | | | | Put | | | | 1,725 | | | | (116,939 | ) |
The Fund had an average of 10 written call options and 72 written put options during the year ended June 30, 2016. As of June 30, 2016, the Fund had $293,195 on deposit at the prime broker for written options.
During the year ended June 30, 2016, the Fund entered into purchased option contracts for speculative purposes and had an average of 106 purchased call options and 258 purchased put options.
During the year ended June 30, 2016, the Fund entered into total return swap contracts for speculative purposes. At June 30, 2016, the Fund had the following total return swap contracts outstanding:
| | | | | | | | | | |
| Expiration | | Notional amount | | Counterparty | | Swap description | | Unrealized gains
(losses) | |
| 10-20-2016 | | $41,426 | | Morgan Stanley | | In an agreement dated 10-17-2014, the Fund makes monthly payments of 1 Month USD LIBOR +50. At expiration, the Fund will receive the positive return or pay the negative return of the referenced entity Ally Financial Incorporated. | | $ | (8,703 | ) |
| 10-20-2016 | | 278,098 | | Morgan Stanley | | In an agreement dated 10-17-2014, the Fund makes monthly payments of 1 Month USD LIBOR +50. At expiration, the Fund will receive the positive return or pay the negative return of the referenced entity Brookdale Senior Living Incorporated. | | | (141,439 | ) |
| 10-20-2016 | | 119,199 | | Morgan Stanley | | In an agreement dated 10-17-2014, the Fund makes monthly payments of 1 Month USD LIBOR +50. At expiration, the Fund will receive the positive return or pay the negative return of the referenced entity Comcast Corporation Class A. | | | 34,128 | |
| 2-10-2017 | | 162,755 | | Morgan Stanley | | In an agreement dated 5-16-2016, the Fund makes monthly payments of 1 Month EUR LIBOR +60 basis points. At expiration, the Fund will receive the positive return or pay the negative return of the referenced entity Ryanair Holdings plc. | | | (36,459 | ) |
| 6-1-2018 | | (142,011) | | Morgan Stanley | | In an agreement dated 6-1-2016, the Fund receives monthly payments of 1 Month USD LIBOR -50. At expiration, the Fund will receive the negative return or pay the positive return of the referenced entity Banco Santander SA. | | | 26,217 | |
| | | | | | |
| Notes to financial statements | | Wells Fargo Alternative Strategies Fund | | | 51 | |
During the year ended June 30, 2016, the Fund had an average notional balance on total return swaps of $3,926,100. As of June 30, 2016, the Fund had $167,547 on deposit at the prime broker for total return swaps.
The Fund enters into credit default swap contracts as a substitute for taking a position in the underlying security or basket of securities or to potentially enhance the Fund’s total return. At June 30, 2016, the Fund had the following credit default swap contracts outstanding:
Credit default swaps on debt obligations– Sell protection
| | | | | | | | | | | | | | | | | | | | | | | | | | | | |
| Expiration | |
Counterparty | | Reference
debt obligation | | Rating of
reference
debt
obligation* | | | Notional amount | | | Fixed
payments
received | | | Value | | | Premiums received | | | Unrealized gains | |
| 12-21-2020 | | Morgan Stanley | | Yum! Brands Incorporated, 6.25%, 3-15-18 | | | AAA | | | $ | 15,000 | | | | 1.00 | % | | $ | (647 | ) | | $ | (1,032 | ) | | $ | 385 | |
| * | Reflects the ratings of a nationally recognized ratings agency at period end. The credit rating serves as indicator of the current status of the payment/performance risk of the credit derivative. A rating of D would most likely indicate a trigger event of default has occurred although circumstances including bankruptcy, failure to pay, obligation default, obligation acceleration, repudiation/moratorium and restructuring may also cause a credit event to take place. |
The Fund had an average notional balance on credit default swaps of $43,667 during the year ended June 30, 2016.
The Fund’s credit default swap transactions may contain provisions for early termination in the event the net assets of the Fund declines below specific levels identified by the counterparty. If these levels are triggered, the counterparty may terminate the transaction and seek payment or request full collateralization of the derivative transactions in net liability positions.
A summary of derivative instruments by primary risk exposure is outlined in the following tables.
The fair value of derivative instruments as of June 30, 2016 was as follows for the Fund:
| | | | | | | | | | | | |
| | | Asset derivatives | | | Liability derivatives | |
| | | Statement of Assets and Liabilities location | | Fair value | | | Statement of Assets and
Liabilities location | | Fair value | |
Equity risk | | Investments in unaffiliated securities, at value | | $ | 540,874 | * | | Payable for written options | | $ | 253,328 | |
| | Receivable for daily variation margin on open futures contracts | | | 95,033 | ** | | Payable for daily variation margin on open futures contracts | | | 270,506 | ** |
Foreign currency risk | | Unrealized gains on forward foreign currency | | | 197,949 | | | Unrealized losses on forward foreign currency contracts | | | 91,182 | |
| | Receivable for daily variation margin on open futures contracts | | | 162,543 | ** | | Payable for daily variation margin on open futures contracts | | | 0 | |
Interest rate risk | | Receivable for daily variation margin on open futures contracts | | | 19,707 | ** | | Payable for daily variation margin on open futures contracts | | | 60,250 | ** |
| | Unrealized gains on total return swap transactions | | | 60,345 | | | Unrealized losses on total return swap transactions | | | 186,601 | |
Credit contracts | | Unrealized gains on credit default swap transactions | | | 385 | | | Premiums received on credit default swap transactions | | | 1,032 | |
| | | | | $ | 1,076,836 | | | | | $ | 862,899 | |
| * | Amount relates to purchased options |
| ** | Only the current day’s variation margin as of June 30, 2016, is reported separately on the Statement of Assets and Liabilities. |
| | | | |
| 52 | | Wells Fargo Alternative Strategies Fund | | Notes to financial statements |
The effect of derivative instruments on the Statement of Operations for the year ended June 30, 2016 was as follows for the Fund:
| | | | | | | | | | | | | | | | | | | | | | | | | | | | |
| | | Amount of realized gains (losses) on derivatives | |
| | | Unaffiliated
securities* | | | Futures contracts | | | Forward
foreign currency
contracts | | | Written options | | | Credit
default
swaps | | | Total
return
Swaps | | | Total | |
Interest rate risk | | $ | 0 | | | $ | (459,911 | ) | | $ | 0 | | | $ | 0 | | | $ | 0 | | | $ | 122,106 | | | $ | (337,805 | ) |
Equity contracts | | | (448,538 | ) | | | (1,416,367 | ) | | | 0 | | | | 327,817 | | | | 0 | | | | 0 | | | | (1,537,088 | ) |
Foreign currency risk | | | 0 | | | | 750,129 | | | | (385,533 | ) | | | 0 | | | | 0 | | | | 0 | | | | 364,596 | |
Credit contracts | | | 0 | | | | 0 | | | | 0 | | | | 0 | | | | 277 | | | | 0 | | | | 277 | |
| | | $ | (448,538 | ) | | $ | (1,126,149 | ) | | $ | (385,533 | ) | | $ | 327,817 | | | $ | 277 | | | $ | 122,106 | | | $ | (1,510,020 | ) |
| |
| | | Change in unrealized gains (losses) on derivatives | |
| | | Unaffiliated
securities* | | | Futures contracts | | | Forward foreign currency
contracts | | | Written
options | | | Credit
default
swaps | | | Total
return
Swaps | | | Total | |
Interest rate risk | | $ | 0 | | | $ | 569,406 | | | $ | 0 | | | $ | 0 | | | $ | 0 | | | $ | (175,246 | ) | | $ | 394,160 | |
Equity contracts | | | (585,306 | ) | | | (581,368 | ) | | | 0 | | | | 129,020 | | | | 0 | | | | 0 | | | | (1,037,654 | ) |
Foreign currency risk | | | 0 | | | | 840,239 | | | | 120,340 | | | | 0 | | | | 0 | | | | 0 | | | | 960,579 | |
Credit contracts | | | 0 | | | | 0 | | | | 0 | | | | 0 | | | | 385 | | | | 0 | | | | 385 | |
| | | $ | (585,306 | ) | | $ | 828,277 | | | $ | 120,340 | | | $ | 129,020 | | | $ | 385 | | | $ | (175,246 | ) | | $ | 317,470 | |
| * | Amount relates to purchased options |
For certain types of derivative transactions, the Fund has entered into International Swaps and Derivatives Association, Inc. master agreements (“ISDA Master Agreements”) or similar agreements with approved counterparties. The ISDA Master Agreements or similar agreements may have requirements to deliver/deposit securities or cash to/with an exchange or broker-dealer as collateral and allows the Fund to offset, with each counterparty, certain derivative financial instrument’s assets and/or liabilities with collateral held or pledged. Collateral requirements differ by type of derivative. Collateral or margin requirements are set by the broker or exchange clearing house for exchange traded derivatives while collateral terms are contract specific for over-the-counter traded derivatives. Cash collateral that has been pledged to cover obligations of the Fund under ISDA Master Agreements or similar agreements, if any, are reported separately in the Statement of Assets and Liabilities. Securities pledged as collateral, if any, are noted in the Portfolio of Investments. With respect to balance sheet offsetting, absent an event of default by the counterparty or a termination of the agreement, the reported amounts of financial assets and financial liabilities in the Statement of Assets and Liabilities are not offset across transactions between the Fund and the applicable counterparty. A reconciliation of the gross amounts on the Statement of Assets and Liabilities to the net amounts by derivative type, including any collateral exposure, is as follows:
| | | | | | | | | | | | | | | | |
| Derivative type | | Counterparty | | Gross amounts
of assets in the
Statement of
Assets and
Liabilities | | Amounts
subject
to netting
agreements | | | Collateral
received | | | Net amount
of assets | |
Futures – variation margin | | Morgan Stanley | | $277,283 | | $ | (277,283 | ) | | $ | 0 | | | $ | 0 | |
Forward foreign currency contracts | | Bank of America | | 33,983* | | | 0 | | | | 0 | | | | 33,983 | |
Forward foreign currency contracts | | Morgan Stanley | | 88,188* | | | (9,564 | ) | | | 0 | | | | 78,624 | |
Forward foreign currency contracts | | UBS | | 75,778* | | | 0 | | | | 0 | | | | 75,778 | |
Total return swaps | | Morgan Stanley | | 60,345* | | | (60,345 | ) | | | 0 | | | | 0 | |
| * | Amount represents net unrealized gains. |
| | | | | | |
| Notes to financial statements | | Wells Fargo Alternative Strategies Fund | | | 53 | |
| | | | | | | | | | | | | | | | |
| Derivative type | | Counterparty | | Gross amounts
of liabilities in the
Statement of
Assets and
Liabilities | | Amounts
subject to
netting
agreements | | | Collateral
pledged1 | | | Net amount
of liabilities | |
Futures – variation margin | | Morgan Stanley | | $330,756 | | $ | (277,283 | ) | | $ | (53,473 | ) | | $ | 0 | |
Forward foreign currency contracts | | JPMorgan Chase Bank | | 81,618* | | | 0 | | | | 0 | | | | 81,618 | |
Forward foreign currency contracts | | Morgan Stanley | | 9,564* | | | (9,564 | ) | | | 0 | | | | 0 | |
Written options | | Morgan Stanley | | 253,328 | | | 0 | | | | (253,328 | ) | | | 0 | |
Total return swaps | | Morgan Stanley | | 186,601* | | | (60,345 | ) | | | (126,256 | ) | | | 0 | |
Credit default swaps | | Morgan Stanley | | 647** | | | 0 | | | | 0 | | | | 647 | |
| 1 | Collateral pledged within this table is limited to the collateral for the net transaction with the counterparty by derivative type. |
| * | Amount represents net unrealized losses. |
| ** | The value of swap contracts consists of unrealized losses and premiums received on swap contracts as reflected on the Statement of Assets and Liabilities. |
7. BANK BORROWINGS
The Trust (excluding the money market funds and certain other funds) and Wells Fargo Variable Trust are parties to a $200,000,000 revolving credit agreement whereby the Fund is permitted to use bank borrowings for temporary or emergency purposes, such as to fund shareholder redemption requests. Interest under the credit agreement is charged to the Fund based on a borrowing rate equal to the higher of the Federal Funds rate in effect on that day plus 1.25% or the overnight LIBOR rate in effect on that day plus 1.25%. In addition, an annual commitment fee equal to 0.20% of the unused balance is allocated to each participating fund. Prior to September 1, 2015, the revolving credit agreement amount was $150,000,000 and the annual commitment fee was equal to 0.10% of the unused balance which was allocated to each participating fund.
The Fund also had a committed credit facility to provide leverage for investment purposes. The credit facility had a commitment amount of $10 million which expired on March 2, 2016. During the year ended June 30, 2016, the Fund did not borrow under the credit facility but paid a commitment fee at an annual rate equal to 0.25% on the unutilized portion of the credit facility.
During the year ended June 30, 2016, the Fund did not borrow under either credit facility.
8. DISTRIBUTIONS TO SHAREHOLDERS
The tax character of distributions paid during the years ended June 30, 2016 and June 30, 2015 were as follows:
| | | | | | | | | | | | |
| | | Year ended
June 30 | | | Year ended July 31, 2014** | |
| | | 2016 | | | 2015* | | |
Ordinary income | | $ | 3,032,012 | | | $ | 1,057,252 | | | $ | 0 | |
Long-term capital gain | | | 1,232,977 | | | | 501,247 | | | | 0 | |
| * | For the eleven months ended June 30, 2015. The Fund changed its fiscal year end from July 31 to June 30, effective June 30, 2015. |
| ** | For the period from April 30, 2014 (commencement of operations) to July 31, 2014 |
As of June 30, 2016, the components of distributable earnings on a tax basis were as follows:
| | | | |
Unrealized losses | | Late-year ordinary losses
deferred | | Post-October
capital losses
deferred |
| $(248,363) | | $(1,283,264) | | $(1,860,741) |
9. INDEMNIFICATION
Under the Trust’s organizational documents, the officers and Trustees have been granted certain indemnification rights against certain liabilities that may arise out of performance of their duties to the Trust. Additionally, in the normal course of business, the Trust may enter into contracts with service providers that contain a variety of indemnification clauses. The Trust’s maximum exposure under these arrangements is dependent on future claims that may be made against the Fund and, therefore, cannot be estimated.
| | | | |
| 54 | | Wells Fargo Alternative Strategies Fund | | Report of independent registered public accounting firm |
BOARD OF TRUSTEES AND SHAREHOLDERS OF WELLS FARGO FUNDS TRUST:
We have audited the accompanying statement of assets and liabilities, including the portfolio of investments, of the Wells Fargo Alternative Strategies Fund (formerly known as Wells Fargo Advantage Alternative Strategies Fund) (the “Fund”), one of the funds constituting the Wells Fargo Funds Trust, as of June 30, 2016, and the related statement of operations for the year end, and the statements of changes in net assets and financial highlights for the year then ended, the period from August 1, 2014 through June 30, 2015, and the period from April 30, 2014 (commencement of operations) through July 31, 2014. These financial statements and financial highlights are the responsibility of the Fund’s management. Our responsibility is to express an opinion on these financial statements and financial highlights based on our audits.
We conducted our audits in accordance with the standards of the Public Company Accounting Oversight Board (United States). Those standards require that we plan and perform the audit to obtain reasonable assurance about whether the financial statements and financial highlights are free of material misstatement. An audit includes examining, on a test basis, evidence supporting the amounts and disclosures in the financial statements. Our procedures included confirmation of securities owned as of June 30, 2016, by correspondence with custodians and brokers, or by other appropriate auditing procedures. An audit also includes assessing the accounting principles used and significant estimates made by management, as well as evaluating the overall financial statement presentation. We believe that our audits provide a reasonable basis for our opinion.
In our opinion, the financial statements and financial highlights referred to above present fairly, in all material respects, the financial position of the Wells Fargo Alternative Strategies Fund as of June 30, 2016, the results of its operations for the year then ended, and the changes in its net assets and the financial highlights for the year then ended, the period from August 1, 2014 through June 30, 2015, and the period from April 30, 2014 (commencement of operations) through July 31, 2014, in conformity with U.S. generally accepted accounting principles.

Boston, Massachusetts
August 25, 2016
| | | | | | |
| Other information (unaudited) | | Wells Fargo Alternative Strategies Fund | | | 55 | |
TAX INFORMATION
For corporate shareholders, pursuant to Section 854 of the Internal Revenue Code, 11.43% of ordinary income dividends qualify for the corporate dividends-received deduction for the fiscal year ended June 30, 2016.
Pursuant to Section 852 of the Internal Revenue Code, $1,232,977 was designated as a 20% rate gain distribution for the fiscal year ended June 30, 2016.
Pursuant to Section 854 of the Internal Revenue Code, $491,429 of income dividends paid during the fiscal year ended June 30, 2016 has been designated as qualified dividend income (QDI).
For the fiscal year ended June 30, 2016, $2,944,802 has been designated as short-term capital gain dividends for nonresident alien shareholders pursuant to Section 871 of the Internal Revenue Code.
PROXY VOTING INFORMATION
A description of the policies and procedures that the Fund uses to determine how to vote proxies relating to portfolio securities is available, upon request, by calling 1-800-222-8222, visiting our website at wellsfargofunds.com, or visiting the SEC website at sec.gov. Information regarding how the Fund voted proxies relating to portfolio securities during the most recent 12-month period ended June 30 is available on the Fund’s website at wellsfargofunds.com or by visiting the SEC website at sec.gov.
PORTFOLIO HOLDINGS INFORMATION
The complete portfolio holdings for the Fund are publicly available at each fiscal quarter end on the Fund’s website (wellsfargofunds.com), on a one-month delayed basis. As of each month end other than a month end that coincides with a fiscal quarter end, the Fund makes publicly available on the Fund’s website, on a one-month delayed basis (i) all portfolio holdings held long other than any put options on equity securities; (ii) portfolio holdings held short other than short positions in equity securities of single issuers; and (iii) the aggregate dollar value of equity securities of single issuers held short, and any put options on equity securities held long. In addition, top ten holdings information (excluding derivative positions and short positions) for the Fund is publicly available on the Fund’s website on a monthly, seven-day or more delayed basis. The Fund files its complete schedule of portfolio holdings with the SEC for the first and third quarters of each fiscal year on Form N-Q, which is available by visiting the SEC website at sec.gov. In addition, the Fund’s Form N-Q may be reviewed and copied at the SEC’s Public Reference Room in Washington, DC, and at regional offices in New York City, at 233 Broadway, and in Chicago, at 175 West Jackson Boulevard, Suite 900. Information about the Public Reference Room may be obtained by calling 1-800-SEC-0330.
| | | | |
| 56 | | Wells Fargo Alternative Strategies Fund | | Other information (unaudited) |
BOARD OF TRUSTEES AND OFFICERS
Each of the Trustees and Officers1 listed in the table below acts in identical capacities for each fund in the Wells Fargo family of funds, which consists of 142 mutual funds comprising the Wells Fargo Funds Trust, Wells Fargo Variable Trust, Wells Fargo Master Trust and four closed-end funds (collectively the “Fund Complex”). This table should be read in conjunction with the Prospectus and the Statement of Additional Information2. The mailing address of each Trustee and Officer is 525 Market Street, 12th Floor, San Francisco, CA 94105. Each Trustee and Officer serves an indefinite term, however, each Trustee serves such term until reaching the mandatory retirement age established by the Trustees.
Independent Trustees
| | | | | | |
Name and year of birth | | Position held and length of service* | | Principal occupations during past five years or longer | | Current other public company or
investment company
directorships |
William R. Ebsworth (Born 1957) | | Trustee, since 2015 | | Retired. From 1984 to 2013, equities analyst, portfolio manager, research director and chief financial officer at Fidelity Management and Research Company in Boston, Tokyo, and Hong Kong and retired in 2013 as Chief Investment Officer of Fidelity Strategic Advisers, Inc. where he lead a team of investment professionals managing client assets. Prior thereto, Board member of Hong Kong Securities Clearing Co., Hong Kong Options Clearing Corp., the Thailand International Fund, Ltd., Fidelity Investments Life Insurance Company, and Empire Fidelity Investments Life Insurance Company. Mr. Ebsworth is a CFA® charterholder and an Adjunct Lecturer, Finance, at Babson College. | | Asset Allocation Trust |
| Jane A. Freeman (Born 1953) | | Trustee, since 2015 | | Retired. From 2012 to 2014 and 1999 to 2008, Chief Financial Officer of Scientific Learning Corporation. From 2008 to 2012, Ms. Freeman provided consulting services related to strategic business projects. Prior to 1999, Portfolio Manager at Rockefeller & Co. and Scudder, Stevens & Clark. Board member of the Harding Loevner Funds from 1996 to 2014, serving as both Lead Independent Director and chair of the Audit Committee. Board member of the Russell Exchange Traded Funds Trust from 2011 to 2012 and the chair of the Audit Committee. Ms. Freeman is Chair of Taproot Foundation (non-profit organization), a Board Member of Ruth Bancroft Garden (non-profit organization) and an inactive chartered financial analyst. | | Asset Allocation Trust |
| Peter G. Gordon (Born 1942) | | Trustee, since 1998; Chairman, since 2005 | | Co-Founder, Retired Chairman, President and CEO of Crystal Geyser Water Company. Trustee Emeritus, Colby College. | | Asset Allocation Trust |
| Isaiah Harris, Jr. (Born 1952) | | Trustee, since 2009 | | Retired. Chairman of the Board of CIGNA Corporation since 2009, and Director since 2005. From 2003 to 2011, Director of Deluxe Corporation. Prior thereto, President and CEO of BellSouth Advertising and Publishing Corp. from 2005 to 2007, President and CEO of BellSouth Enterprises from 2004 to 2005 and President of BellSouth Consumer Services from 2000 to 2003. Emeritus member of the Iowa State University Foundation Board of Governors. Emeritus Member of the Advisory Board of Iowa State University School of Business. Advisory Board Member, Palm Harbor Academy (charter school). Advisory Board Member, Child Evangelism Fellowship (non-profit). Mr. Harris is a certified public accountant (inactive status). | | CIGNA Corporation; Asset Allocation Trust |
| Judith M. Johnson (Born 1949) | | Trustee, since 2008; Audit Committee Chairman, since 2008 | | Retired. Prior thereto, Chief Executive Officer and Chief Investment Officer of Minneapolis Employees Retirement Fund from 1996 to 2008. Ms. Johnson is an attorney, certified public accountant and a certified managerial accountant. | | Asset Allocation Trust |
| David F. Larcker (Born 1950) | | Trustee, since 2009 | | James Irvin Miller Professor of Accounting at the Graduate School of Business, Stanford University, Director of the Corporate Governance Research Initiative and Senior Faculty of The Rock Center for Corporate Governance since 2006. From 2005 to 2008, Professor of Accounting at the Graduate School of Business, Stanford University. Prior thereto, Ernst & Young Professor of Accounting at The Wharton School, University of Pennsylvania from 1985 to 2005. | | Asset Allocation Trust |
| | | | | | |
| Other information (unaudited) | | Wells Fargo Alternative Strategies Fund | | | 57 | |
| | | | | | |
Name and year of birth | | Position held and length of service* | | Principal occupations during past five years or longer | | Current other public company or
investment company
directorships |
Olivia S. Mitchell
(Born 1953) | | Trustee, since 2006 | | International Foundation of Employee Benefit Plans Professor, Wharton School of the University of Pennsylvania since 1993. Director of Wharton’s Pension Research Council and Boettner Center on Pensions & Retirement Research, and Research Associate at the National Bureau of Economic Research. Previously, Cornell University Professor from 1978 to 1993. | | Asset Allocation Trust |
Timothy J. Penny
(Born 1951) | | Trustee, since 1996 | | President and Chief Executive Officer of Southern Minnesota Initiative Foundation, a non-profit organization, since 2007 and Senior Fellow at the Humphrey Institute Policy Forum at the University of Minnesota since 1995. Member of the Board of Trustees of NorthStar Education Finance, Inc., a non-profit organization, since 2007. | | Asset Allocation Trust |
Michael S. Scofield
(Born 1943) | | Trustee, since 2010 | | Served on the Investment Company Institute’s Board of Governors and Executive Committee from 2008-2011 as well the Governing Council of the Independent Directors Council from 2006-2011 and the Independent Directors Council Executive Committee from 2008-2011. Chairman of the IDC from 2008-2010. Institutional Investor (Fund Directions) Trustee of Year in 2007. Trustee of the Evergreen Funds complex (and its predecessors) from 1984 to 2010. Chairman of the Evergreen Funds from 2000-2010. Former Trustee of the Mentor Funds. Retired Attorney, Law Offices of Michael S. Scofield. | | Asset Allocation Trust |
| * | Length of service dates reflect the Trustee’s commencement of service with the Trust’s predecessor entities, where applicable. |
Officers
| | | | | | |
Name and year of birth | | Position held and length of service | | Principal occupations during past five years or longer | | |
Karla M. Rabusch
(Born 1959) | | President, since 2003 | | Executive Vice President of Wells Fargo Bank, N.A. and President of Wells Fargo Funds Management, LLC since 2003. | | |
Jeremy DePalma1
(Born 1974) | | Treasurer, since 2012 | | Senior Vice President of Wells Fargo Funds Management, LLC since 2009. Senior Vice President of Evergreen Investment Management Company, LLC from 2008 to 2010 and head of the Fund Reporting and Control Team within Fund Administration from 2005 to 2010. | | |
C. David Messman
(Born 1960) | | Secretary, since 2000; Chief Legal Officer, since 2003 | | Senior Vice President and Secretary of Wells Fargo Funds Management, LLC since 2001. Assistant General Counsel of Wells Fargo Bank, N.A. since 2013 and Vice President and Managing Counsel of Wells Fargo Bank, N.A. from 1996 to 2013. | | |
Michael Whitaker
(Born 1967) | | Chief Compliance Officer, since 2016* | | Executive Vice President of Wells Fargo Funds Management, LLC since 2016. Chief Compliance Officer of Fidelity’s Fixed Income Funds and Asset Allocation Funds from 2008 to 2016, Compliance Officer of FMR Co., Inc. from 2014 to 2016, Fidelity Investments Money Management, Inc. from 2014 to 2016, Fidelity Investments from 2007 to 2016. | | |
David Berardi
(Born 1975) | | Assistant Treasurer, since 2009 | | Vice President of Wells Fargo Funds Management, LLC since 2009. Vice President of Evergreen Investment Management Company, LLC from 2008 to 2010. Manager of Fund Reporting and Control for Evergreen Investment Management Company, LLC from 2004 to 2010. | | |
| 1 | Jeremy DePalma acts as Treasurer of 69 funds and Assistant Treasurer of 73 funds in the Fund Complex. |
| 2 | The Statement of Additional Information includes additional information about the Trustees and is available, without charge, upon request, by calling 1-800-222-8222 or by visiting the website at wellsfargofunds.com. |
| * | Michael Whitaker became Chief Compliance Officer effective May 16, 2016. |
| | | | |
| 58 | | Wells Fargo Alternative Strategies Fund | | Other information (unaudited) |
BOARD CONSIDERATION OF INVESTMENT MANAGEMENT AND SUB-ADVISORY AGREEMENTS:
Under the Investment Company Act of 1940 (the “1940 Act”), the Board of Trustees (the “Board”) of Wells Fargo Funds Trust (the “Trust”) must determine annually whether to approve the continuation of the Trust’s investment management and sub-advisory agreements. In this regard, at an in-person meeting held on May 24-25, 2016 (the “Meeting”), the Board, all the members of which have no direct or indirect interest in the investment management and sub-advisory agreements and are not “interested persons” of the Trust, as defined in the 1940 Act (the “Independent Trustees”), reviewed and approved for Wells Fargo Alternative Strategies Fund (the “Fund”): (i) an investment management agreement (the “Management Agreement”) with Wells Fargo Funds Management, LLC (“Funds Management”); (ii) an investment sub-advisory agreement with The Rock Creek Group LP (“Rock Creek”), an affiliate of Funds Management; (iii) an investment sub-advisory agreement with Rock Creek and Chilton Investment Company, LLC (“Chilton”); (iv) an investment sub-advisory agreement with Rock Creek and Mellon Capital Management Corporation (“Mellon”); (v) an investment sub-advisory agreement with Rock Creek and Passport Capital, LLC (“Passport”); (vi) an investment sub-advisory agreement with Rock Creek and Pine River Capital Management L.P. (“Pine River”); (vii) an investment sub-advisory agreement with Rock Creek and River Canyon Fund Management LLC (“River Canyon”); (viii) an investment sub-advisory agreement with Rock Creek and Sirios Capital Management, L.P. (“Sirios”); and (ix) an investment sub-advisory agreement with Rock Creek and Wellington Management Company, LLC (“Wellington”). The sub-advisory agreements with Rock Creek, Chilton, Mellon, Passport, Pine River, River Canyon, Sirios, and Wellington (the “Sub-Advisers”) are collectively referred to as the “Sub-Advisory Agreements,” and the Management Agreement and the Sub-Advisory Agreement are collectively referred to as the “Advisory Agreements.”
At the Meeting, the Board considered the factors and reached the conclusions described below relating to the selection of Funds Management and the Sub-Advisers and the approval of the Advisory Agreements. Prior to the Meeting, including at an in-person meeting in April 2016, the Trustees conferred extensively among themselves and with representatives of Funds Management about these matters. Also, the Board has adopted a team-based approach, with each team consisting of a sub-set of Trustees, to assist the full Board in the discharge of its duties in reviewing performance and other matters throughout the year. The Independent Trustees were assisted in their evaluation of the Advisory Agreements by independent legal counsel, from whom they received separate legal advice and with whom they met separately.
In providing information to the Board, Funds Management and the Sub-Advisers were guided by a detailed set of requests for information submitted to them by independent legal counsel on behalf of the Independent Trustees at the start of the Board’s annual contract renewal process earlier in 2016. In considering and approving the Advisory Agreements, the Trustees considered the information they believed relevant, including but not limited to the information discussed below. The Board considered not only the specific information presented in connection with the Meeting, but also the knowledge gained over time through interaction with Funds Management and the Sub-Advisers about various topics. In this regard, the Board reviewed reports of Funds Management at each of its quarterly meetings, which included, among other things, portfolio reviews and performance reports. In addition, the Board and the teams mentioned above confer with portfolio managers at various times throughout the year. The Board did not identify any particular information or consideration that was all-important or controlling, and each individual Trustee may have attributed different weights to various factors.
After its deliberations, the Board unanimously approved the continuation of the Advisory Agreements for a one-year term and determined that the compensation payable to Funds Management and the Sub-Advisers under each of the Advisory Agreements was reasonable. The Board considered the approval of the Advisory Agreements for the Fund as part of its consideration of agreements for funds across the complex, but its approvals were made on a fund-by-fund basis. The following summarizes a number of important, but not necessarily all, factors considered by the Board in support of its approvals.
Nature, extent and quality of services
The Board received and considered various information regarding the nature, extent and quality of services provided to the Fund by Funds Management and the Sub-Advisers under the Advisory Agreements. This information included a description of the investment advisory services and Fund-level administrative services covered by the Management Agreement, as well as, among other things, a summary of the background and experience of senior management of Funds Management, and the qualifications, background, tenure and responsibilities of each of the portfolio managers primarily responsible for the day-to-day portfolio management of the Fund.
| | | | | | |
| Other information (unaudited) | | Wells Fargo Alternative Strategies Fund | | | 59 | |
The Board evaluated the ability of Funds Management and the Sub-Advisers to attract and retain qualified investment professionals, including research, advisory and supervisory personnel. The Board further considered the compliance programs and compliance records of Funds Management and the Sub-Advisers. In addition, the Board took into account the full range of services provided to the Fund by Funds Management and its affiliates.
Fund performance and expenses
The Board considered the performance results for the Fund over various time periods ended December 31, 2015. The Board considered these results in comparison to the performance of funds in a universe that was determined by Broadridge Inc. (“Broadridge”) to be similar to the Fund (the “Universe”), and in comparison to the Fund’s benchmark index and to other comparative data. Broadridge is an independent provider of investment company data. The Board received a description of the methodology used by Broadridge to select the mutual funds in the performance Universe. The Board noted that the performance of the Fund (Administrator Class) was higher than the average performance of the Universe for all periods under review. The Board also noted that the performance of the Fund was higher than its benchmark, the Barclays U.S. Aggregate Bond Index, for all periods under review. The Board noted the short performance history of the Fund.
The Board also received and considered information regarding the Fund’s net operating expense ratios and their various components, including actual management fees, custodian and other non-management fees, and Rule 12b-1 and non-Rule 12b-1 shareholder service fees. The Board considered these ratios in comparison to the median ratios of funds in class-specific expense groups that were determined by Broadridge to be similar to the Fund (the “Groups”). The Board received a description of the methodology used by Broadridge to select the mutual funds in the expense Groups and an explanation of how funds comprising expense groups and their expense ratios may vary from year-to-year. Based on the Broadridge reports, the Board noted that the net operating expense ratios of the Fund were lower than, equal to, or in range of the median net operating expense ratios of the expense Groups.
The Board took into account the Fund performance and expense information provided to it among the factors considered in deciding to re-approve the Advisory Agreements.
Investment management and sub-advisory fee rates
The Board reviewed and considered the contractual fee rates payable by the Fund to Funds Management under the Management Agreement, as well as the contractual fee rates payable by the Fund to Funds Management for class-level administrative services under a Class-Level Administration Agreement, which include class-level transfer agency and sub-transfer agency costs (collectively, the “Management Rates”). The Board also reviewed and considered the contractual investment sub-advisory fee rates that are payable by Funds Management to each of the Sub-Advisers for investment sub-advisory services.
Among other information reviewed by the Board was a comparison of the Fund’s Management Rates with the average contractual investment management fee rates of funds in the expense Groups at a common asset level as well as transfer agency costs of the funds in the expense Groups. The Board noted that the Management Rates of the Fund were higher than the sum of these average rates for the Fund’s expense Groups for all share classes. The Board noted that the net operating expense ratios of the Fund were lower than, equal to, or in range of the median net operating expense ratios of the expense Groups for all share classes.
The Board also received and considered information about the portion of the total management fee that was retained by Funds Management after payment of the fee to the Sub-Advisers for sub-advisory services. The Board considered this amount in comparison to the median amount retained by advisers to funds in a sub-advised expense universe that was determined by Broadridge to be similar to the Fund. In assessing the reasonableness of this amount, the Board received and evaluated information about the nature and extent of responsibilities retained and risks assumed by Funds Management and not delegated to or assumed by the Sub-Advisers, and about Funds Management’s on-going oversight services. However, given the affiliation between Funds Management and Rock Creek, the Board ascribed limited relevance to the allocation of fees between them. The Board also considered that the sub-advisory fees paid to Chilton, Mellon, Passport, Pine River, River Canyon, Sirios and Wellington had been negotiated by Funds Management on an arm’s length basis.
The Board also received and considered information about the nature and extent of services offered and fee rates charged by Funds Management and the Sub-Advisers to other types of clients with investment strategies similar to those of the Fund. In this regard, the Board received information about the significantly greater scope of services, and compliance, reporting and other legal burdens and risks of managing mutual funds compared with those associated with managing assets of non-mutual fund clients such as collective funds or institutional separate accounts.
| | | | |
| 60 | | Wells Fargo Alternative Strategies Fund | | Other information (unaudited) |
Based on its consideration of the factors and information it deemed relevant, including those described here, the Board determined that the compensation payable to Funds Management under the Management Agreement and to the Sub-Advisers under the Sub-Advisory Agreements was reasonable, in light of the services covered by the Advisory Agreements.
Profitability
The Board received and considered information concerning the profitability of Funds Management, as well as the profitability of Wells Fargo as a whole, from providing services to the Fund and the fund family as a whole. The Board also received and considered information concerning the profitability of Rock Creek from providing services to the fund family as a whole, noting that Rock Creek’s profitability information with respect to providing services to the Fund was subsumed in the Wells Fargo and Funds Management profitability analysis. The Board did not receive or consider profitability information with respect to Chilton, Mellon, Passport, Pine River, River Canyon, Sirios and Wellington, as the sub-advisory fees paid to them had been negotiated by Funds Management on an arm’s-length basis.
Funds Management reported on the methodologies and estimates used in calculating profitability. Among other things, the Board noted that the levels of profitability reported on a fund-by-fund basis varied widely, depending on factors such as the size and type of fund. Based on its review, the Board did not deem the profits reported by Funds Management or Wells Fargo from its services to the Fund to be at a level that would prevent it from approving the continuation of the Advisory Agreements.
Economies of scale
With respect to possible economies of scale, the Board noted the existence of breakpoints in the Fund’s management fee structure, which operate generally to reduce the Fund’s expense ratios as the Fund grows in size. It considered that, for a small fund or a fund that shrinks in size, breakpoints conversely can result in higher fee levels. The Board also considered that fee waiver and expense reimbursement arrangements and competitive fee rates at the outset are means of sharing potential economies of scale with shareholders of the Fund and the fund family as a whole. The Board considered Funds Management’s view that any analyses of potential economies of scale in managing a particular fund are inherently limited in light of the joint and common costs and investments that Funds Management incurs across the fund family as a whole.
The Board concluded that the Fund’s fee and expense arrangements, including contractual breakpoints, constituted a reasonable approach to sharing potential economies of scale with the Fund and its shareholders.
Other benefits to Funds Management and the Sub-Advisers
The Board received and considered information regarding potential “fall-out” or ancillary benefits received by Funds Management, the Sub-Advisers, and their affiliates as a result of their relationships with the Fund. Ancillary benefits could include, among others, benefits directly attributable to other relationships with the Fund and benefits potentially derived from an increase in Funds Management’s and the Sub-Advisers’ business as a result of their relationships with the Fund. The Board noted that various affiliates of Funds Management may receive distribution-related fees, shareholder servicing payments and sub-transfer agency fees in respect of shares sold or held through them and services provided.
The Board also reviewed information about soft dollar credits earned and utilized by Chilton, Passport, Pine River, River Canyon, Sirios and Wellington, fees earned by Funds Management and its affiliate from managing a private investment vehicle for the fund family’s securities lending collateral and commissions earned by an affiliated broker from portfolio transactions.
Based on its consideration of the factors and information it deemed relevant, including those described here, the Board did not find that any ancillary benefits received by Funds Management, the Sub-Advisers, and their affiliates were unreasonable.
Conclusion
At the Meeting, after considering the above-described factors and based on its deliberations and its evaluation of the information described above, the Board unanimously approved the continuation of the Advisory Agreements for a one-year term and determined that the compensation payable to Funds Management and the Sub-Advisers under each of the Advisory Agreements was reasonable.
| | | | | | |
| List of abbreviations | | Wells Fargo Alternative Strategies Fund | | | 61 | |
The following is a list of common abbreviations for terms and entities that may have appeared in this report.
| ACA | — ACA Financial Guaranty Corporation |
| ADR | — American depositary receipt |
| ADS | — American depositary shares |
| AGC | — Assured Guaranty Corporation |
| AGM | — Assured Guaranty Municipal |
| Ambac | — Ambac Financial Group Incorporated |
| AMT | — Alternative minimum tax |
| BAN | — Bond anticipation notes |
| BHAC | — Berkshire Hathaway Assurance Corporation |
| CAB | — Capital appreciation bond |
| CCAB | — Convertible capital appreciation bond |
| CDA | — Community Development Authority |
| CDO | — Collateralized debt obligation |
| DRIVER | — Derivative inverse tax-exempt receipts |
| DW&P | — Department of Water & Power |
| DWR | — Department of Water Resources |
| ECFA | — Educational & Cultural Facilities Authority |
| EDA | — Economic Development Authority |
| EDFA | — Economic Development Finance Authority |
| ETF | — Exchange-traded fund |
| FDIC | — Federal Deposit Insurance Corporation |
| FFCB | — Federal Farm Credit Banks |
| FGIC | — Financial Guaranty Insurance Corporation |
| FHA | — Federal Housing Administration |
| FHLB | — Federal Home Loan Bank |
| FHLMC | — Federal Home Loan Mortgage Corporation |
| FICO | — The Financing Corporation |
| FNMA | — Federal National Mortgage Association |
| GDR | — Global depositary receipt |
| GNMA | — Government National Mortgage Association |
| HCFR | — Healthcare facilities revenue |
| HEFA | — Health & Educational Facilities Authority |
| HEFAR | — Higher education facilities authority revenue |
| HFA | — Housing Finance Authority |
| HFFA | — Health Facilities Financing Authority |
| HUD | — Department of Housing and Urban Development |
| IDA | — Industrial Development Authority |
| IDAG | — Industrial Development Agency |
| KRW | — Republic of Korea won |
| LIBOR | — London Interbank Offered Rate |
| LIFER | — Long Inverse Floating Exempt Receipts |
| LLC | — Limited liability company |
| LLLP | — Limited liability limited partnership |
| LLP | — Limited liability partnership |
| MBIA | — Municipal Bond Insurance Association |
| MFHR | — Multifamily housing revenue |
| MSTR | — Municipal securities trust receipts |
| MUD | — Municipal Utility District |
| National | — National Public Finance Guarantee Corporation |
| PCFA | — Pollution Control Financing Authority |
| PCL | — Public Company Limited |
| PCR | — Pollution control revenue |
| PFA | — Public Finance Authority |
| PFFA | — Public Facilities Financing Authority |
| PFOTER | — Puttable floating option tax-exempt receipts |
| plc | — Public limited company |
| PUTTER | — Puttable tax-exempt receipts |
| R&D | — Research & development |
| Radian | — Radian Asset Assurance |
| RAN | — Revenue anticipation notes |
| RDA | — Redevelopment Authority |
| RDFA | — Redevelopment Finance Authority |
| REIT | — Real estate investment trust |
| ROC | — Reset option certificates |
| SAVRS | — Select auction variable rate securities |
| SBA | — Small Business Authority |
| SDR | — Swedish depositary receipt |
| SFHR | — Single-family housing revenue |
| SFMR | — Single-family mortgage revenue |
| SPA | — Standby purchase agreement |
| SPDR | — Standard & Poor’s Depositary Receipts |
| SPEAR | — Short Puttable Exempt Adjustable Receipts |
| STRIPS | — Separate trading of registered interest and |
| TAN | — Tax anticipation notes |
| TIPS | — Treasury inflation-protected securities |
| TRAN | — Tax revenue anticipation notes |
| TTFA | — Transportation Trust Fund Authority |
| TVA | — Tennessee Valley Authority |
This page is intentionally left blank.
This page is intentionally left blank.
This page is intentionally left blank.

For more information
More information about Wells Fargo Funds is available free upon request. To obtain literature, please write, email, visit the Fund’s website, or call:
Wells Fargo Funds
P.O. Box 8266
Boston, MA 02266-8266
Email: fundservice@wellsfargo.com
Website: wellsfargofunds.com
Individual investors: 1-800-222-8222
Retail investment professionals: 1-888-877-9275
Institutional investment professionals: 1-866-765-0778
This report and the financial statements contained herein are submitted for the general information of the shareholders of the Fund. If this report is used for promotional purposes, distribution of the report must be accompanied or preceded by a current prospectus. Before investing, please consider the investment objectives, risks, charges, and expenses of the investment. For a current prospectus and, if available, a summary prospectus, containing this information, call 1-800-222-8222 or visit the Fund’s website at wellsfargofunds.com. Read the prospectus carefully before you invest or send money.
Wells Fargo Asset Management (WFAM) is a trade name used by the asset management businesses of Wells Fargo & Company. Wells Fargo Funds Management, LLC, a wholly owned subsidiary of Wells Fargo & Company, provides investment advisory and administrative services for Wells Fargo Funds. Other affiliates of Wells Fargo & Company provide subadvisory and other services for the funds. The funds are distributed by Wells Fargo Funds Distributor, LLC, Member FINRA, an affiliate of Wells Fargo & Company.
NOT FDIC INSURED ¡ NO BANK GUARANTEE ¡ MAY LOSE VALUE
© 2016 Wells Fargo Funds Management, LLC. All rights reserved.
| | |
 | | 244414 08-16 A267/AR267 6-16 |
Annual Report
June 30, 2016

Wells Fargo Global Long/Short Fund


Reduce clutter. Save trees.
Sign up for electronic delivery of prospectuses and shareholder reports at wellsfargo.com/advantagedelivery
Contents
The views expressed and any forward-looking statements are as of June 30, 2016, unless otherwise noted, and are those of the Fund managers and/or Wells Fargo Funds Management, LLC. Discussions of individual securities, or the markets generally, or any Wells Fargo Fund are not intended as individual recommendations. Future events or results may vary significantly from those expressed in any forward-looking statements. The views expressed are subject to change at any time in response to changing circumstances in the market. Wells Fargo Funds Management, LLC and the Fund disclaim any obligation to publicly update or revise any views expressed or forward-looking statements.
NOT FDIC INSURED ¡ NO BANK GUARANTEE ¡ MAY LOSE VALUE
| | | | |
| 2 | | Wells Fargo Global Long/Short Fund | | Letter to shareholders (unaudited) |

Karla M. Rabusch
President
Wells Fargo Funds
During much of the period, global equity, bond, and currency markets were volatile as recessionary pressures and diverging central bank policies concerned investors.
During the fourth quarter of 2015, Japan’s economy contracted, China’s manufacturing sector retrenched, and growth appeared to slow in Europe.
Dear Valued Shareholder:
We are pleased to offer you this annual report for the Wells Fargo Global Long/Short Fund for the 12-month period that ended June 30, 2016. During much of the period, global equity, bond, and currency markets were volatile as recessionary pressures and diverging central bank policies concerned investors. As the period ended, voters in the U.K. approved a referendum to leave the European Union, injecting new uncertainty into the markets and sending stock prices and bond yields significantly lower. Equity markets soon recovered to varying degrees, but bond prices remained elevated and yields lower as investors sought lower-volatility assets due to short-term fears.
Shifting investor sentiment reflected changing economic and business data.
Early in the period, oil prices declined after a spring 2015 rally, negotiations about Greece’s ability to repay its sovereign debt grew contentious, and the U.S. dollar strengthened. By July 2015, equity markets were declining, led by stocks in China, which endured the largest one-day drop in eight years on July 27, 2015.
The S&P 500 Index,1 a common measure of U.S. stock performance, fell into correction territory—defined as a loss of 10% or more—during August 2015 before recovering somewhat. The index retested its August lows in late September 2015 before recovering most of its year-to-date losses from October through December 2015. As anticipated, the U.S. Federal Reserve (Fed) increased the federal funds rate in December and suggested that it planned to pursue additional increases in 2016. During the first six weeks of 2016, the index suffered the worst loss to open a year on record before trending higher. By the end of the 12-month reporting period, the index recorded a 3.99% gain.
Overseas, the Morgan Stanley Capital International (MSCI) All Country World Index (ACWI) ex USA Index (Net)2 and the MSCI Emerging Markets (EM) Index (Net)3 recorded negative returns. In August 2015, China allowed its currency’s value to decline in an attempt to bolster exports. The U.S. dollar strengthened, which negatively affected investment returns and U.S. corporate profits earned overseas. During the fourth quarter of 2015, Japan’s economy contracted, China’s manufacturing sector retrenched, and growth appeared to slow in Europe.
Global equity markets hit low points before starting to rebound in the middle of February 2016 when business data improved and central bankers reasserted their commitment to initiatives intended to encourage economic activity. The European Central Bank (ECB) pushed the deposit interest-rate further into negative territory. The Bank of Japan (BOJ) followed the ECB’s lead by setting a negative deposit rate. Negative deposit interest rates are intended to encourage banks to lend assets rather than keep them on deposit. The People’s Bank of China (PBOC) reduced reserve ratios, which also was intended to encourage lending. The ECB expanded its bond-buying program, which injects liquidity into the markets and encourages investment.
| 1 | The S&P 500 Index consists of 500 stocks chosen for market size, liquidity, and industry group representation. It is a market-value-weighted index with each stock’s weight in the index proportionate to its market value. You cannot invest directly in an index. |
| 2 | The Morgan Stanley Capital International (MSCI) All Country World Index (ACWI) ex USA Index (Net) is a free-float-adjusted market-capitalization-weighted index that is designed to measure the equity market performance of developed markets, excluding the United States and Canada. Source: MSCI. MSCI makes no express or implied warranties or representations and shall have no liability whatsoever with respect to any MSCI data contained herein. The MSCI data may not be further redistributed or used as a basis for other indexes or any securities or financial products. This report is not approved, reviewed, or produced by MSCI. You cannot invest directly in an index. |
| 3 | The MSCI Emerging Markets (EM) Index (Net) is a free-float-adjusted market-capitalization-weighted index that is designed to measure the equity market performance of emerging markets. The MSCI EM Index (Net) consists of the following 23 emerging markets country indexes: Brazil, Chile, China, Colombia, Czech Republic, Egypt, Greece, Hungary, India, Indonesia, Korea, Malaysia, Mexico, Peru, the Philippines, Poland, Qatar, Russia, South Africa, Taiwan, Thailand, Turkey, and United Arab Emirates. You cannot invest directly in an index. |
| | | | | | |
| Letter to shareholders (unaudited) | | Wells Fargo Global Long/Short Fund | | | 3 | |
For the 12-month reporting period, the MSCI ACWI ex USA Index (Net) and MSCI EM Index (Net) recorded returns of -10.24% and -12.06%, respectively.
A December federal funds rate increase marked divergence of central bank policies.
Bond markets were volatile as well. The Fed’s decision to tighten credit conditions through higher interest rates contrasted with actions by the ECB, the PBOC, and the BOJ. Data released in January 2016 indicated that U.S. corporate profits fell in the fourth quarter of 2015, the second consecutive quarter of decline. The Fed expressed hesitancy about additional credit tightening in the near term, which investors appeared to read as accommodative of business activity. Overall, policy actions of central banks and intermittently positive economic data heartened investors as the period drew to a close.
Bond markets, particularly international bonds, benefited during the period, with the Barclays Global Aggregate ex U.S. Dollar Bond Index4 gaining 11.24% and the Barclays U.S. Aggregate Bond Index5 gaining 6.00%.
Don’t let short-term uncertainty derail long-term investment goals.
Periods of investment uncertainty can present challenges, but experience has taught us that maintaining long-term investment goals can be an effective way to plan for the future. To help you create a sound strategy based on your personal goals and risk tolerance, Wells Fargo Funds offers more than 100 mutual funds spanning a wide range of asset classes and investment styles. Although diversification cannot guarantee an investment profit or prevent losses, we believe it can be an effective way to manage investment risk and potentially smooth out overall portfolio performance. We encourage investors to know their investments and to understand that appropriate levels of risk-taking may unlock opportunities.
Thank you for choosing to invest with Wells Fargo Funds. We appreciate your confidence in us and remain committed to helping you meet your financial needs.
Sincerely,

Karla M. Rabusch
President
Wells Fargo Funds
For further information about your Fund, contact your investment professional, visit our website at wellsfargofunds.com, or call us directly at 1-800-222-8222. We are available 24 hours a day, 7 days a week.
| 4 | The Barclays Global Aggregate ex U.S. Dollar Bond Index tracks an international basket of government, corporate, agency, and mortgage-related bonds. You cannot invest directly in an index. |
| 5 | The Barclays U.S. Aggregate Bond Index is a broad-based benchmark that measures the investment-grade, U.S. dollar–denominated, fixed-rate taxable bond market, including Treasuries, government-related and corporate securities, mortgage-backed securities (agency fixed-rate and hybrid adjustable-rate mortgage pass-throughs), asset-backed securities, and commercial mortgage-backed securities. You cannot invest directly in an index. |
| | | | |
| 4 | | Wells Fargo Global Long/Short Fund | | Performance highlights (unaudited) |
Investment objective
The Fund seeks long-term capital appreciation.
Manager
Wells Fargo Funds Management, LLC
Subadviser
Wells Capital Management Incorporated
Portfolio manager
Dale A. Winner, CFA®
Average annual total returns (%) as of June 30, 2016
| | | | | | | | | | | | | | | | | | | | | | | | | | |
| | | | | Including sales charge | | | Excluding sales charge | | | Expense ratios1 (%) | |
| | | Inception date | | 1 year | | | Since inception | | | 1 year | | | Since inception | | | Gross | | | Net2 | |
| Class A (WGLAX) | | 11-28-2014 | | | (15.57 | ) | | | (8.15 | ) | | | (10.43 | ) | | | (4.66 | ) | | | 5.38 | | | | 2.85 | |
| Class C (WGLCX) | | 11-28-2014 | | | (12.18 | ) | | | (5.40 | ) | | | (11.18 | ) | | | (5.40 | ) | | | 6.13 | | | | 3.60 | |
| Administrator Class (WGLDX) | | 11-28-2014 | | | – | | | | – | | | | (10.38 | ) | | | (4.57 | ) | | | 5.30 | | | | 2.75 | |
| Institutional Class (WGLSX) | | 11-28-2014 | | | – | | | | – | | | | (10.12 | ) | | | (4.34 | ) | | | 5.05 | | | | 2.55 | |
| Global Long/Short Composite Index3 | | – | | | – | | | | – | | | | (1.55 | ) | | | (0.72 | ) | | | – | | | | – | |
| Barclays U.S. 1-3 Month Treasury Bill Index4 | | – | | | – | | | | – | | | | 0.14 | | | | 0.09 | | | | – | | | | – | |
| MSCI ACWI Index (Net)5 | | – | | | – | | | | – | | | | (3.73 | ) | | | (1.95 | ) | | | – | | | | – | |
Figures quoted represent past performance, which is no guarantee of future results, and do not reflect taxes that a shareholder may pay on fund distributions or the redemption of fund shares. Investment return and principal value of an investment will fluctuate so that an investor’s shares, when redeemed, may be worth more or less than their original cost. Performance shown without sales charges would be lower if sales charges were reflected. Current performance may be lower or higher than the performance data quoted, which assumes the reinvestment of dividends and capital gains. Current month-end performance is available on the Fund’s website, wellsfargofunds.com.
Index returns do not include transaction costs associated with buying and selling securities, any mutual fund fees or expenses, or any taxes. It is not possible to invest directly in an index.
For Class A shares, the maximum front-end sales charge is 5.75%. For Class C shares, the maximum contingent deferred sales charge is 1.00%. Performance including a contingent deferred sales charge assumes the sales charge for the corresponding time period. Administrator Class and Institutional Class shares are sold without a front-end sales charge or contingent deferred sales charge.
Stock values fluctuate in response to the activities of individual companies and general market and economic conditions. Foreign investments are especially volatile and can rise or fall dramatically due to differences in the political and economic conditions of the host country. These risks are generally intensified in emerging markets. The use of derivatives may reduce returns and/or increase volatility. There are numerous risks associated with transactions in options on securities. Borrowing money to purchase securities or cover short positions magnifies losses and incurs expenses. Short selling is generally considered speculative, has the potential for unlimited loss, and may involve leverage. Certain investment strategies tend to increase the total risk of an investment (relative to the broader market). The Fund is exposed to regulatory and smaller-company securities risk. Consult the Fund’s prospectus for additional information on these and other risks.
Please see footnotes on page 5.
| | | | | | |
| Performance highlights (unaudited) | | Wells Fargo Global Long/Short Fund | | | 5 | |
|
| Growth of $10,000 investment as of June 30, 20166 |
|
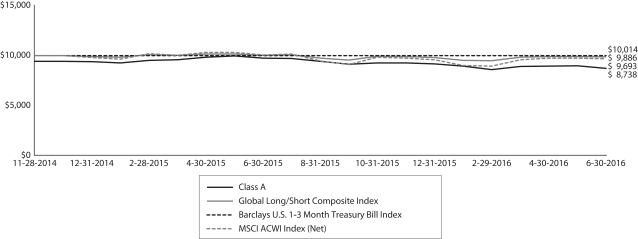 |
| 1 | Reflects the expense ratios as stated in the most recent prospectuses, which include the impact of 0.05% in acquired fund fees and expenses and 1.05% in dividend and interest expenses on securities sold short. The expense ratios shown are subject to change and may differ from the annualized expense ratios shown in the financial highlights of this report, which do not include acquired fund fees and expenses. |
| 2 | The manager has contractually committed through October 31, 2016, to waive fees and/or reimburse expenses to the extent necessary to cap the Fund’s Total Annual Fund Operating Expenses After Fee Waiver at 1.75% for Class A, 2.50% for Class C, 1.65% for Administrator Class, and 1.45% for Institutional Class. After this time, the cap may be increased or the commitment to maintain the cap may be terminated only with the approval of the Board of Trustees. Brokerage commissions, stamp duty fees, interest, taxes, acquired fund fees and expenses, prime broker fees, dividend and interest expenses on securities sold short, and extraordinary expenses are excluded from the expense cap. Without this cap, the Fund’s returns would have been lower. |
| 3 | Source: Wells Fargo Funds Management, LLC. The Global Long/Short Composite Index is weighted 50% in the MSCI ACWI Index (Net) (measures the equity market performance of developed and emerging markets) and 50% in the Barclays U.S. 1-3 Month Treasury Bill Index (tracks the performance and attributes of recently issued 1-3 month U.S. Treasury bills using Barclays’ monthly rebalancing conventions). You cannot invest directly in an index. |
| 4 | The Barclays U.S. 1-3 Month Treasury Bill Index includes all publicly issued zero-coupon U.S. Treasury bills that have a remaining maturity of less than 3 months and more than 1 month, are rated investment grade, and have $250 million or more of outstanding face value. You cannot invest directly in an index. |
| 5 | The Morgan Stanley Capital International (MSCI) All Country World Index (ACWI) Index (Net) is a free-float-adjusted market-capitalization-weighted index that is designed to measure the equity market performance of developed markets, excluding the United States and Canada. Source: MSCI. MSCI makes no express or implied warranties or representations and shall have no liability whatsoever with respect to any MSCI data contained herein. The MSCI data may not be further redistributed or used as a basis for other indexes or any securities or financial products. This report is not approved, reviewed, or produced by MSCI. You cannot invest directly in an index. |
| 6 | The chart compares the performance of Class A shares since inception with the Global Long/Short Composite Index, Barclays U.S. 1-3 Month Treasury Bill Index, and the MSCI ACWI Index (Net). The chart assumes a hypothetical investment of $10,000 in Class A shares and reflects all operating expenses and assumes the maximum initial sales charge of 5.75%. |
| 7 | The ten largest long and short position holdings, excluding cash and cash equivalents, are calculated based on the value of the investments divided by total net assets of the Fund. Holdings are subject to change and may have changed since the date specified. |
| 8 | The chart shows the percentage of Fund holdings within a particular sector or country that was held long (securities owned by the Fund) or sold short (sale of borrowed securities). Gross exposure is the absolute value of the long positions and short positions combined. Net exposure is the percentage of long positions minus the percentage of positions sold short. Short positions are represented by negative numbers. |
| | | | |
| 6 | | Wells Fargo Global Long/Short Fund | | Performance highlights (unaudited) |
MANAGERS’ DISCUSSION
Fund highlights
| n | | The Fund underperformed its benchmark the Global Long/Short Composite Index for the 12-month period that ended June 30, 2016. (The Fund’s securities were either held long, as in securities owned by the fund, or sold short, as in the sale of borrowed securities.) The Fund’s underperformance was due primarily to notable stock-specific losses in each region globally during an unusually volatile period for global equities characterized by persistent momentum trading rather than a focus on fundamental value. |
| n | | Overall attribution gains primarily from long and short positions in the U.K. and China, as well as regional equity hedges globally and hedges of European and Japanese currency risk, were more than offset by losses in stock positions primarily in Japan, Germany, the Netherlands, and Italy, as well as underweights in U.S. equities. |
| n | | Notable gains were generated among consumer durables and producer manufacturing industries, but they were more than offset by stock positions in finance, consumer nondurables, and technology services. |
| n | | We continue to find fundamental long and short stock investment ideas as overall macroeconomic volatility persists, primarily across Asia and Europe. |
While the Fund underperformed its benchmark during this period, we believe that our fundamental research-driven long and short positions will accrue value as global equity markets begin to normalize, rewarding fundamental valuations more than momentum. Results were derived from our research and risk management processes as we focused on fundamentals among nonconsensus ideas and sought low valuations underpinned by well-researched risk management.
Overall, Fund net exposures have concentrated across developed markets—notably Japan, the U.K., Hong Kong, Germany, Italy, and the Netherlands—with lower exposures across emerging markets other than China and South Korea. As we look globally, we continue to find compelling values internationally as the impacts of self-help restructuring, targeted regional reforms, and reflationary efforts allow select companies to engage in differentiated actions to potentially generate shareholder value, while others remain mired in unsustainable and uncompetitive business models more vulnerable to adverse volatility. At the same time, we recognize that a transition to more normalized monetary policy in the U.S. relative to expanding monetary and credit easing in Europe and the U.K., in particular, places pressures on domestic currencies. This contributes to our partial hedges of foreign-exchange risk of net long exposures in European and British currency-denominated net equity exposures. We covered our Japanese yen hedges early in 2016 based on a determination of diminishing returns from Japanese efforts to deflate its local currency.
| | | | |
| Ten largest long position holdings (%) as of June 30, 20167 | |
Vodafone Group plc | | | 2.58 | |
Compagnie de Saint-Gobain SA | | | 2.45 | |
Mitsubishi UFJ Financial Group Incorporated | | | 2.26 | |
Akzo Nobel NV | | | 2.02 | |
Alphabet Incorporated Class C | | | 2.01 | |
Lundin Mining Corporation | | | 1.98 | |
Smiths Group plc | | | 1.97 | |
SAP SE | | | 1.96 | |
American International Group Incorporated | | | 1.80 | |
Coca-Cola East Japan Company Limited | | | 1.79 | |
| | | | |
| Ten largest short position holdings (%) as of June 30, 20167 | |
iShares MSCI EAFE ETF | | | (1.90) | |
Nestle SA | | | (1.60) | |
Unilever NV | | | (1.19) | |
iShares MSCI Switzerland Capped ETF | | | (1.12) | |
Wisdomtree Japan Hedged Equity ETF | | | (1.11) | |
Schindler Holding AG | | | (1.04) | |
iShares MSCI Thailand Capped ETF | | | (1.01) | |
Ashmore Group plc | | | (1.00) | |
iShares MSCI Philippines ETF | | | (0.73) | |
Peugeot SA | | | (0.68) | |
Strong performance from international equity markets in the U.K. and China and hedges in Japan, non-Japan Asia, Europe, and Canada helped add to overall returns. Performance of those positions was notably enhanced by net long exposure in individual stocks that are consumption and financial reform beneficiaries as well as self-help restructuring-oriented developments. Top-performing long positions included Rheinmetall AG in Germany; Alphabet Incorporated in the U.S.; Daiwa House Industry Company, Limited, Coca-Cola East Japan Company, Limited, in Japan; and Xinyi Glass Holdings Limited in China. Top-performing stock shorts included a French automaker, a Swedish consumer discretionary
Please see footnotes on page 5.
| | | | | | |
| Performance highlights (unaudited) | | Wells Fargo Global Long/Short Fund | | | 7 | |
investment, a Japanese department store, and an unrelated trading company, as well as a U.S. asset manager. These gains were more than offset by losses from longs in Nomura Holdings, Incorporated; Mitsubishi UFJ Financial Group, Incorporated; Volkswagen AG; Hitachi, Limited; and China Everbright Limited, while losses from shorts were limited, largely composed of diversified shorts in expensive and vulnerable European and Japanese staples stocks.
Difficult performance during the past two quarters was exacerbated by extreme liquidations of Japanese equities during the first quarter of 2016 as investors grappled with the implications of negative interest rates for financial services industry profitability and a surprise U.K. referendum voting in favor of exiting the European Union (E.U.) during the second quarter of 2016. We expect this volatility to create long and short opportunities for us globally.
| | | | | | | | |
| Sector allocation as of June 30, 20168 | |
| | | Gross exposure(%) | | | Net exposure(%) | |
Consumer Discretionary | | | 8 | | | | 7 | |
Consumer Staples | | | 18 | | | | 17 | |
Energy | | | 4 | | | | 5 | |
Financials | | | 25 | | | | 30 | |
Health Care | | | 3 | | | | 4 | |
Industrials | | | 19 | | | | 22 | |
Information Technology | | | 11 | | | | 14 | |
Materials | | | 6 | | | | 8 | |
Telecommunication Services | | | 6 | | | | 8 | |
Other | | | 0 | | | | (15) | |
| | | | 100 | | | | 100 | |
| | | | | | | | |
| Country allocation as of June 30, 20168 | |
| | | Gross
exposure(%) | | | Net
exposure(%) | |
Canada | | | 4 | | | | 6 | |
China | | | 9 | | | | 12 | |
France | | | 4 | | | | 4 | |
Germany | | | 10 | | | | 13 | |
Hong Kong | | | 1 | | | | 2 | |
Italy | | | 6 | | | | 8 | |
Japan | | | 18 | | | | 21 | |
Netherlands | | | 7 | | | | 6 | |
Philippines | | | 0 | | | | (1) | |
South Korea | | | 2 | | | | 3 | |
Switzerland | | | 3 | | | | (1) | |
Thailand | | | 0 | | | | (1) | |
United Kingdom | | | 12 | | | | 13 | |
United States | | | 24 | | | | 15 | |
| | | | 100 | | | | 100 | |
Divergences in economies and markets create equity investment opportunities.
As we look forward at risks and opportunities, we continue to witness wide divergences in regional and national economies and policymaker actions as well as corporate prospects in an environment of increased differentiation between public equities within sectors and regions. In the U.K., Europe, China/Hong Kong, and Japan markets, there is a growing gulf separating reform-minded and shareholder-sensitive companies from other companies that we view as being in secular decline. In developed markets, a number of firms continue to stand out positively for their self-imposed restructurings and efforts to enhance profitability, while others are more challenged, unable to confront adverse headwinds from more competitive markets and/or moderating business trends.
We expect sustained volatility attributable to instability in the E.U.’s efforts to manage the economic and monetary union, China’s ability to gradually experiment with and progress toward a more market-oriented financial market, and Japan’s efforts to reflate its domestic economy to create additional long and short opportunities. In our view, a ready European Central Bank focused on helping contain credit risks arising from apparently intractable negotiations between Greece and its creditors; Chinese central authorities committed to easing the strains of deleveraging by promoting domestic consumption and financial reforms; and Japanese officials coordinating monetary, fiscal, and structural reform efforts to positively stimulate local investor sentiment all will provide the macro backdrop for continued market volatility that may reward fundamental stock pickers who can distinguish between fair market values and true micro fundamentals.
Please see footnotes on page 5.
| | | | |
| 8 | | Wells Fargo Global Long/Short Fund | | Fund expenses (unaudited) |
As a shareholder of the Fund, you incur two types of costs: (1) transaction costs, including sales charges (loads) on purchase payments and contingent deferred sales charges (if any) on redemptions and (2) ongoing costs, including management fees, distribution (12b-1) and/or shareholder servicing fees, and other Fund expenses. This example is intended to help you understand your ongoing costs (in dollars) of investing in the Fund and to compare these costs with the ongoing costs of investing in other mutual funds.
The example is based on an investment of $1,000 invested at the beginning of the six-month period and held for the entire period from January 1, 2016 to June 30, 2016.
Actual expenses
The “Actual” line of the table below provides information about actual account values and actual expenses. You may use the information in this line, together with the amount you invested, to estimate the expenses that you paid over the period. Simply divide your account value by $1,000 (for example, an $8,600 account value divided by $1,000 = 8.6), then multiply the result by the number in the “Actual” line under the heading entitled “Expenses paid during period” for your applicable class of shares to estimate the expenses you paid on your account during this period.
Hypothetical example for comparison purposes
The “Hypothetical” line of the table below provides information about hypothetical account values and hypothetical expenses based on the Fund’s actual expense ratio and an assumed rate of return of 5% per year before expenses, which is not the Fund’s actual return. The hypothetical account values and expenses may not be used to estimate the actual ending account balance or expenses you paid for the period. You may use this information to compare the ongoing costs of investing in the Fund and other funds. To do so, compare this 5% hypothetical example with the 5% hypothetical examples that appear in the shareholder reports of the other funds.
Please note that the expenses shown in the table are meant to highlight your ongoing costs only and do not reflect any transactional costs, such as sales charges (loads) and contingent deferred sales charges. Therefore, the “Hypothetical” line of the table is useful in comparing ongoing costs only and will not help you determine the relative total costs of owning different funds. In addition, if these transactional costs were included, your costs would have been higher.
| | | | | | | | | | | | | | | | |
| | | Beginning
account value
1-1-2016 | | | Ending
account value
6-30-2016 | | | Expenses
paid during
the period¹ | | | Net annualized
expense ratio | |
Class A | | | | | | | | | | | | | | | | |
Actual | | $ | 1,000.00 | | | $ | 953.17 | | | $ | 12.57 | | | | 2.59 | % |
Hypothetical (5% return before expenses) | | $ | 1,000.00 | | | $ | 1,011.99 | | | $ | 12.95 | | | | 2.59 | % |
Class C | | | | | | | | | | | | | | | | |
Actual | | $ | 1,000.00 | | | $ | 949.69 | | | $ | 16.13 | | | | 3.33 | % |
Hypothetical (5% return before expenses) | | $ | 1,000.00 | | | $ | 1,008.31 | | | $ | 16.62 | | | | 3.33 | % |
Administrator Class | | | | | | | | | | | | | | | | |
Actual | | $ | 1,000.00 | | | $ | 953.27 | | | $ | 12.09 | | | | 2.49 | % |
Hypothetical (5% return before expenses) | | $ | 1,000.00 | | | $ | 1,012.49 | | | $ | 12.46 | | | | 2.49 | % |
Institutional Class | | | | | | | | | | | | | | | | |
Actual | | $ | 1,000.00 | | | $ | 955.35 | | | $ | 11.13 | | | | 2.29 | % |
Hypothetical (5% return before expenses) | | $ | 1,000.00 | | | $ | 1,013.48 | | | $ | 11.46 | | | | 2.29 | % |
| 1 | Expenses paid is equal to the annualized expense ratio of each class multiplied by the average account value over the period, multiplied by the number of days in the most recent fiscal half-year divided by the number of days in the fiscal year (to reflect the one-half-year period). |
| | | | | | |
| Portfolio of investments—June 30, 2016 | | Wells Fargo Global Long/Short Fund | | | 9 | |
| | | | | | | | | | | | | | | | |
| Security name | | | | | | | | Shares | | | Value | |
| | | | |
Common Stocks: 57.24% | | | | | | | | | | | | | | | | |
| | | | |
| Brazil: 0.09% | | | | | | | | | | | | | | | | |
Cosan Limited Class A (Energy, Oil, Gas & Consumable Fuels) | | | | | | | | | | | 1,386 | | | $ | 9,023 | |
| | | | | | | | | | | | | | | | |
| | | | |
| Canada: 2.82% | | | | | | | | | | | | | | | | |
Cameco Corporation (Energy, Oil, Gas & Consumable Fuels) | | | | | | | | | | | 7,366 | | | | 80,805 | |
Lundin Mining Corporation (Materials, Metals & Mining) † | | | | | | | | | | | 56,477 | | | | 190,595 | |
| | | | |
| | | | | | | | | | | | | | | 271,400 | |
| | | | | | | | | | | | | | | | |
| | | | |
| China: 5.23% | | | | | | | | | | | | | | | | |
China Everbright Limited (Financials, Capital Markets) | | | | | | | | | | | 40,000 | | | | 77,613 | |
China Mobile Limited (Telecommunication Services, Wireless Telecommunication Services) | | | | | | | | | | | 12,500 | | | | 144,428 | |
Dongfeng Motor Group Company Limited H Shares (Consumer Discretionary, Automobiles) | | | | | | | | | | | 80,000 | | | | 84,324 | |
Industrial & Commercial Bank of China Limited H Shares (Financials, Banks) | | | | | | | | | | | 163,000 | | | | 90,900 | |
Shanghai Pharmaceuticals Holding Company Limited H Shares (Health Care, Health Care Providers & Services) | | | | | | | | | | | 26,700 | | | | 59,204 | |
YY Incorporated (Information Technology, Internet Software & Services) † | | | | | | | | | | | 1,377 | | | | 46,639 | |
| | | | |
| | | | | | | | | | | | | | | 503,108 | |
| | | | | | | | | | | | | | | | |
| | | | |
| France: 2.45% | | | | | | | | | | | | | | | | |
Compagnie de Saint-Gobain SA (Industrials, Building Products) | | | | | | | | | | | 6,224 | | | | 235,924 | |
| | | | | | | | | | | | | | | | |
| | | | |
| German : 6.54% | | | | | | | | | | | | | | | | |
Metro AG (Consumer Staples, Food & Staples Retailing) | | | | | | | | | | | 4,629 | | | | 142,370 | |
Rheinmetall AG (Industrials, Industrial Conglomerates) | | | | | | | | | | | 2,155 | | | | 128,177 | |
SAP SE (Information Technology, Software) | | | | | | | | | | | 2,512 | | | | 188,664 | |
Siemens AG (Industrials, Industrial Conglomerates) | | | | | | | | | | | 1,655 | | | | 169,838 | |
| | | | |
| | | | | | | | | | | | | | | 629,049 | |
| | | | | | | | | | | | | | | | |
| | | | |
| Hong Kong: 0.83% | | | | | | | | | | | | | | | | |
Xinyi Glass Holdings Limited (Consumer Discretionary, Auto Components) | | | | | | | | | | | 102,000 | | | | 75,449 | |
Xinyi Automobile Glass Hong Kong Enterprises Incorporated (Consumer Discretionary, Auto Components) †(a) | | | | | | | | | | | 12,750 | | | | 4,593 | |
| | | | |
| | | | | | | | | | | | | | | 80,042 | |
| | | | | | | | | | | | | | | | |
| | | | |
| Italy: 4.14% | | | | | | | | | | | | | | | | |
ANIMA Holding SpA (Financials, Capital Markets) 144A | | | | | | | | | | | 16,981 | | | | 80,058 | |
Eni SpA (Energy, Oil, Gas & Consumable Fuels) | | | | | | | | | | | 10,356 | | | | 166,806 | |
Prysmian SpA (Industrials, Electrical Equipment) | | | | | | | | | | | 6,920 | | | | 151,888 | |
| | | | |
| | | | | | | | | | | | | | | 398,752 | |
| | | | | | | | | | | | | | | | |
| | | | |
| Japan: 12.04% | | | | | | | | | | | | | | | | |
Coca-Cola East Japan Company Limited (Consumer Staples, Beverages) | | | | | | | | | | | 9,000 | | | | 172,256 | |
Daiwa House Industry Company Limited (Financials, Real Estate Management & Development) | | | | | | | | | | | 4,000 | | | | 117,468 | |
Daiwa Securities Group Incorporated (Financials, Capital Markets) | | | | | | | | | | | 28,000 | | | | 147,514 | |
Hitachi Limited (Information Technology, Electronic Equipment, Instruments & Components) | | | | | | | | | | | 41,000 | | | | 171,784 | |
Mitsubishi UFJ Financial Group Incorporated (Financials, Banks) | | | | | | | | | | | 48,500 | | | | 217,418 | |
Mitsui Fudosan Company Limited (Financials, Real Estate Management & Development) | | | | | | | | | | | 7,000 | | | | 160,655 | |
Nomura Holdings Incorporated (Financials, Capital Markets) | | | | | | | | | | | 42,100 | | | | 149,731 | |
West Holdings Corporation (Consumer Discretionary, Household Durables) | | | | | | | | | | | 3,600 | | | | 21,904 | |
| | | | |
| | | | | | | | | | | | | | | 1,158,730 | |
| | | | | | | | | | | | | | | | |
The accompanying notes are an integral part of these financial statements.
| | | | |
| 10 | | Wells Fargo Global Long/Short Fund | | Portfolio of investments—June 30, 2016 |
| | | | | | | | | | | | | | | | |
| Security name | | | | | | | | Shares | | | Value | |
| | | | |
| Netherlands: 4.35% | | | | | | | | | | | | | | | | |
Akzo Nobel NV (Materials, Chemicals) | | | | | | | | | | | 3,128 | | | $ | 194,314 | |
Koninklijke Philips NV (Industrials, Industrial Conglomerates) | | | | | | | | | | | 3,847 | | | | 95,545 | |
NN Group NV (Financials, Insurance) | | | | | | | | | | | 4,690 | | | | 129,108 | |
| | | | |
| | | | | | | | | | | | | | | 418,967 | |
| | | | | | | | | | | | | | | | |
| | | | |
| South Korea: 1.42% | | | | | | | | | | | | | | | | |
Hana Financial Group Incorporated (Financials, Banks) | | | | | | | | | | | 6,726 | | | | 136,745 | |
| | | | | | | | | | | | | | | | |
| | | | |
| Switzerland: 1.94% | | | | | | | | | | | | | | | | |
ABB Limited (Industrials, Electrical Equipment) | | | | | | | | | | | 4,672 | | | | 92,644 | |
Zurich Insurance Group AG (Financials, Insurance) | | | | | | | | | | | 382 | | | | 94,500 | |
| | | | |
| | | | | | | | | | | | | | | 187,144 | |
| | | | | | | | | | | | | | | | |
| | | | |
| United Kingdom: 7.52% | | | | | | | | | | | | | | | | |
Capita plc (Industrials, Professional Services) | | | | | | | | | | | 5,471 | | | | 70,497 | |
Smiths Group plc (Industrials, Industrial Conglomerates) | | | | | | | | | | | 12,262 | | | | 189,487 | |
United Business Media plc (Consumer Discretionary, Media) | | | | 17,915 | | | | 153,641 | |
Vodafone Group plc (Telecommunication Services, Wireless Telecommunication Services) | | | | 81,543 | | | | 248,613 | |
Wolseley plc (Industrials, Trading Companies & Distributors) | | | | 1,181 | | | | 61,156 | |
| | | | |
| | | | | | | | | | | | | | | 723,394 | |
| | | | | | | | | | | | | | | | |
|
| United States: 7.87% | |
Agilent Technologies Incorporated (Health Care, Life Sciences Tools & Services) | | | | 1,574 | | | | 69,823 | |
Alphabet Incorporated Class C (Information Technology, Internet Software & Services) † | | | | 279 | | | | 193,096 | |
American International Group Incorporated (Financials, Insurance) | | | | 3,278 | | | | 173,373 | |
Apple Incorporated (Information Technology, Technology Hardware, Storage & Peripherals) | | | | 971 | | | | 92,828 | |
Coach Incorporated (Consumer Discretionary, Textiles, Apparel & Luxury Goods) | | | | 3,364 | | | | 137,049 | |
Mead Johnson Nutrition Company (Consumer Staples, Food Products) | | | | 314 | | | | 28,496 | |
Merck & Company Incorporated (Health Care, Pharmaceuticals) | | | | 1,087 | | | | 62,622 | |
| | | | |
| | | | | | | | | | | | | | | 757,287 | |
| | | | | | | | | | | | | | | | |
| |
Total Common Stocks (Cost $6,185,967) | | | | 5,509,565 | |
| | | | | | | | | | | | | | | | |
| | | |
| | | | Expiration date | | | | | | | |
| Participation Notes: 0.95% | |
|
| China: 0.95% | |
HSBC Bank plc (Kweichow Moutai Company Limited Class A) (Consumer Staples, Beverages) † | | | | | | | 12/4/2024 | | | | 2,090 | | | | 91,835 | |
| | | | | | | | | | | | | | | | |
| |
Total Participation Notes (Cost $53,236) | | | | 91,835 | |
| | | | | | | | | | | | | | | | |
| | | | |
| | | Yield | | | | | | | | | | |
| Short-Term Investments: 39.23% | |
|
| Investment Companies: 39.23% | |
Wells Fargo Government Money Market Fund Select Class (l)(u) | | | 0.31 | % | | | | | | | 3,775,913 | | | | 3,775,913 | |
| | | | | | | | | | | | | | | | |
| |
Total Short-Term Investments (Cost $3,775,913) | | | | 3,775,913 | |
| | | | | | | | | | | | | | | | |
|
Securities Sold Short: (15.72%) | |
|
Common Stocks: (8.28%) | |
|
| France: (0.68%) | |
Peugeot SA (Consumer Discretionary, Automobiles) | | | | (5,489 | ) | | | (65,792 | ) |
| | | | | | | | | | | | | | | | |
The accompanying notes are an integral part of these financial statements.
| | | | | | |
| Portfolio of investments—June 30, 2016 | | Wells Fargo Global Long/Short Fund | | | 11 | |
| | | | | | | | | | | | | | | | |
| Security name | | | | | | | | Shares | | | Value | |
|
| Japan: (1.74%) | |
Isetan Mitsukoshi Holdings Limited (Consumer Discretionary, Multiline Retail) | | | | | | | | | | | (1,200 | ) | | $ | (10,681 | ) |
Lawson Incorporated (Consumer Staples, Food & Staples Retailing) | | | | | | | | | | | (750 | ) | | | (59,876 | ) |
Marubeni Corporation (Industrials, Industrial Conglomerates) | | | | | | | | | | | (5,500 | ) | | | (24,848 | ) |
McDonalds Holdings Company (Consumer Discretionary, Hotels, Restaurants & Leisure) | | | | | | | | | | | (1,000 | ) | | | (27,163 | ) |
Odakyu Electric Railway Company (Industrials, Road & Rail) | | | | | | | | | | | (2,000 | ) | | | (23,452 | ) |
Takashimaya Company Limited (Consumer Discretionary, Multiline Retail) | | | | | | | | | | | (3,000 | ) | | | (21,488 | ) |
| |
| | | | (167,508 | ) |
| | | | | | | | | | | | | | | | |
|
| Netherlands: (1.19%) | |
Unilever NV (Consumer Staples, Household Products) | | | | | | | | | | | (2,453 | ) | | | (114,088 | ) |
| | | | | | | | | | | | | | | | |
|
| Philippines: (0.27%) | |
Philippine Long Distance Telephone Company SP ADR (Telecommunication Services, Diversified Telecommunication Services) | | | | | | | | | | | (580 | ) | | | (25,851 | ) |
| | | | | | | | | | | | | | | | |
|
| Switzerland: (2.64%) | |
Nestle SA (Consumer Staples, Food Products) | | | | | | | | | | | (1,986 | ) | | | (153,872 | ) |
Schindler Holding AG (Industrials, Machinery) | | | | | | | | | | | (553 | ) | | | (100,119 | ) |
| |
| | | | (253,991 | ) |
| | | | | | | | | | | | | | | | |
|
| Thailand: (0.32%) | |
Charoen Pokphand Foods PCL (Consumer Staples, Food & Staples Retailing) | | | | | | | | | | | (37,300 | ) | | | (30,517 | ) |
| | | | | | | | | | | | | | | | |
|
| United Kingdom: (1.00%) | |
Ashmore Group plc (Financials, Diversified Financial Services) | | | | | | | | | | | (24,122 | ) | | | (96,046 | ) |
| | | | | | | | | | | | | | | | |
|
| United States: (0.45%) | |
Eaton Vance Corporation (Financials, Diversified Financial Services) | | | | | | | | | | | (1,018 | ) | | | (35,976 | ) |
Franklin Resources Incorporated (Financials, Capital Markets) | | | | | | | | | | | (208 | ) | | | (6,941 | ) |
| |
| | | | (42,917 | ) |
| | | | | | | | | | | | | | | | |
|
Exchange-Traded Funds: (7.44%) | |
|
| United States: (7.44%) | |
iShares Europe ETF | | | | | | | | | | | (1,470 | ) | | | (55,551 | ) |
iShares MSCI EAFE ETF | | | | | | | | | | | (3,282 | ) | | | (183,168 | ) |
iShares MSCI EMU ETF | | | | | | | | | | | (1,426 | ) | | | (46,017 | ) |
iShares MSCI Philippines ETF | | | | | | | | | | | (1,782 | ) | | | (69,801 | ) |
iShares MSCI Singapore ETF | | | | | | | | | | | (4,502 | ) | | | (48,937 | ) |
iShares MSCI Switzerland Capped ETF | | | | | | | | | | | (3,633 | ) | | | (107,718 | ) |
iShares MSCI Thailand Capped ETF | | | | | | | | | | | (1,414 | ) | | | (97,439 | ) |
Wisdomtree Japan Hedged Equity ETF | | | | | | | | | | | (2,762 | ) | | | (107,110 | ) |
| |
| | | | (715,741 | ) |
| | | | | | | | | | | | | | | | |
| |
Total Securities Sold Short (Proceeds $(1,637,253)) | | | | (1,512,451 | ) |
| | | | | | | | | | | | | | | | |
| | | | | | | | |
| Total investments in securities (excluding securities sold short) (Cost $10,015,116) * | | | 97.42 | % | | | 9,377,313 | |
Total securities sold short (Proceeds ($1,637,253)) | | | (15.71 | ) | | | (1,512,451 | ) |
Other assets and liabilities, net | | | 18.29 | | | | 1,760,929 | |
| | | | | | | | |
| Total net assets | | | 100.00 | % | | $ | 9,625,791 | |
| | | | | | | | |
The accompanying notes are an integral part of these financial statements.
| | | | |
| 12 | | Wells Fargo Global Long/Short Fund | | Portfolio of investments—June 30, 2016 |
| † | Non-income-earning security |
| (a) | The security is fair valued in accordance with procedures approved by the Board of Trustees. |
| (l) | The issuer of the security is an affiliated person of the Fund as defined in the Investment Company Act of 1940. |
| (u) | The rate represents the 7-day annualized yield at period end. |
| * | Cost for federal income tax purposes is $10,015,659 and unrealized gains (losses) consists of: |
| | | | |
Gross unrealized gains | | $ | 214,356 | |
Gross unrealized losses | | | (852,702 | ) |
| | | | |
Net unrealized losses | | $ | (638,346 | ) |
The accompanying notes are an integral part of these financial statements.
| | | | | | |
| Statement of assets and liabilities—June 30, 2016 | | Wells Fargo Global Long/Short Fund | | | 13 | |
| | | | |
| | | | |
| |
Assets | | | | |
Investments | | | | |
In unaffiliated securities, at value (cost $6,239,203) | | $ | 5,601,400 | |
In affiliated securities, at value (cost $3,775,913) | | | 3,775,913 | |
| | | | |
Total investments, at value (cost $10,015,116) | | | 9,377,313 | |
Cash | | | 5,069 | |
Segregated cash for securities sold short | | | 1,678,113 | |
Foreign currency, at value (cost $11,661) | | | 11,629 | |
Receivable for investments sold | | | 3,010 | |
Receivable for dividends | | | 42,340 | |
Unrealized gains on forward foreign currency contracts | | | 32,590 | |
Receivable from manager | | | 7,097 | |
Prepaid expenses and other assets | | | 25,634 | |
| | | | |
Total assets | | | 11,182,795 | |
| | | | |
| |
Liabilities | | | | |
Dividends payable on securities sold short | | | 37 | |
Payable for Fund shares redeemed | | | 23,145 | |
Payable for securities sold short, at value (proceeds $1,637,253) | | | 1,512,451 | |
Distribution fee payable | | | 84 | |
Administration fees payable | | | 1,077 | |
Accrued expenses and other liabilities | | | 20,210 | |
| | | | |
Total liabilities | | | 1,557,004 | |
| | | | |
Total net assets | | $ | 9,625,791 | |
| | | | |
| |
NET ASSETS CONSIST OF | | | | |
Paid-in capital | | $ | 10,472,887 | |
Accumulated net investment loss | | | (32,929 | ) |
Accumulated net realized losses on investments | | | (333,197 | ) |
Net unrealized losses on investments | | | (480,970 | ) |
| | | | |
Total net assets | | $ | 9,625,791 | |
| | | | |
| |
COMPUTATION OF NET ASSET VALUE AND OFFERING PRICE PER SHARE | | | | |
Net assets – Class A | | $ | 354,979 | |
Shares outstanding – Class A1 | | | 38,741 | |
Net asset value per share – Class A | | | $9.16 | |
Maximum offering price per share – Class A2 | | | $9.72 | |
Net assets – Class C | | $ | 135,004 | |
Shares outstanding – Class C1 | | | 14,905 | |
Net asset value per share – Class C | | | $9.06 | |
Net assets – Administrator Class | | $ | 92,880 | |
Shares outstanding – Administrator Class1 | | | 10,114 | |
Net asset value per share – Administrator Class | | | $9.18 | |
Net assets – Institutional Class | | $ | 9,042,928 | |
Shares outstanding – Institutional Class1 | | | 983,181 | |
Net asset value per share – Institutional Class | | | $9.20 | |
| 1 | The Fund has an unlimited number of authorized shares. |
| 2 | Maximum offering price is computed as 100/94.25 of net asset value. On investments of $50,000 or more, the offering price is reduced. |
The accompanying notes are an integral part of these financial statements.
| | | | |
| 14 | | Wells Fargo Global Long/Short Fund | | Statement of operations—year ended June 30, 2016 |
| | | | |
| | | | |
| |
Investment income | | | | |
Dividends (net of foreign withholding taxes of $12,997) | | $ | 178,812 | |
Income from affiliated securities | | | 11,466 | |
| | | | |
Total investment income | | | 190,278 | |
| | | | |
| |
Expenses | | | | |
Management fee | | | 130,120 | |
Administration fees | |
Class A | | | 722 | |
Class C | | | 296 | |
Administrator Class | | | 126 | |
Institutional Class | | | 12,256 | |
Shareholder servicing fees | |
Class A | | | 860 | |
Class C | | | 353 | |
Administrator Class | | | 242 | |
Distribution fee | |
Class C | | | 1,058 | |
Custody and accounting fees | | | 23,273 | |
Professional fees | | | 56,940 | |
Registration fees | | | 81,196 | |
Shareholder report expenses | | | 32,415 | |
Trustees’ fees and expenses | | | 20,658 | |
Dividends on securities sold short | | | 47,375 | |
Prime broker fees | | | 23,191 | |
Other fees and expenses | | | 14,642 | |
| | | | |
Total expenses | | | 445,723 | |
Less: Fee waivers and/or expense reimbursements | | | (227,317 | ) |
| | | | |
Net expenses | | | 218,406 | |
| | | | |
Net investment loss | | | (28,128 | ) |
| | | | |
| |
REALIZED AND UNREALIZED GAINS (LOSSES) ON INVESTMENTS | | | | |
Net realized gains (losses) on: | |
Unaffiliated securities | | | (403,981 | ) |
Securities sold short | | | 100,925 | |
Forward foreign currency contract transactions | | | (35,630 | ) |
Written options | | | (25,240 | ) |
| | | | |
| |
Net realized losses on investments | | | (363,926 | ) |
| | | | |
|
Net change in unrealized gains (losses) on: | |
Unaffiliated securities | | | (920,900 | ) |
Securities sold short | | | 165,154 | |
Forward foreign currency contract transactions | | | 61,402 | |
| | | | |
Net change in unrealized gains (losses) on investments | | | (694,344 | ) |
| | | | |
Net realized and unrealized gains (losses) on investments | | | (1,058,270 | ) |
| | | | |
Net decrease in net assets resulting from operations | | $ | (1,086,398 | ) |
| | | | |
The accompanying notes are an integral part of these financial statements.
| | | | | | |
| Statement of changes in net assets | | Wells Fargo Global Long/Short Fund | | | 15 | |
| | | | | | | | | | | | | | | | |
| | | Year ended
June 30, 2016 | | | Year ended
June 30, 20151 | |
| | | | |
Operations | | | | | | | | | | | | | | | | |
Net investment loss | | | | | | $ | (28,128 | ) | | | | | | $ | (38,262 | ) |
Net realized gains (losses) on investments | | | | | | | (363,926 | ) | | | | | | | 192,602 | |
Net change in unrealized gains (losses) on investments | | | | | | | (694,344 | ) | | | | | | | 213,374 | |
| | | | |
Net increase (decrease) in net assets resulting from operations | | | | | | | (1,086,398 | ) | | | | | | | 367,714 | |
| | | | |
| | | | |
Distributions to shareholders from | | | | | | | | | | | | | | | | |
Net investment income | | | | | | | | | | | | | | | | |
Class A | | | | | | | (499 | ) | | | | | | | 0 | |
Administrator Class | | | | | | | (76 | ) | | | | | | | 0 | |
Institutional Class | | | | | | | (23,095 | ) | | | | | | | 0 | |
Net realized gains | | | | | | | | | | | | | | | | |
Class A | | | | | | | (3,385 | ) | | | | | | | 0 | |
Class C | | | | | | | (1,461 | ) | | | | | | | 0 | |
Administrator Class | | | | | | | (1,017 | ) | | | | | | | 0 | |
Institutional Class | | | | | | | (98,879 | ) | | | | | | | 0 | |
| | | | |
Total distributions to shareholders | | | | | | | (128,412 | ) | | | | | | | 0 | |
| | | | |
| | | | |
Capital share transactions | | | Shares | | | | | | | | Shares | | | | | |
Proceeds from shares sold | | | | | | | | | | | | | | | | |
Class A | | | 14,706 | | | | 143,822 | | | | 29,360 | | | | 299,099 | |
Class C | | | 3,035 | | | | 28,407 | | | | 14,590 | | | | 147,995 | |
Administrator Class | | | 0 | | | | 0 | | | | 10,965 | | | | 110,000 | |
Institutional Class | | | 0 | | | | 0 | | | | 972,067 | | | | 9,721,435 | |
| | | | |
| | | | | | | 172,229 | | | | | | | | 10,278,529 | |
| | | | |
Reinvestment of distributions | | | | | | | | | | | | | | | | |
Class A | | | 406 | | | | 3,884 | | | | 0 | | | | 0 | |
Class C | | | 154 | | | | 1,461 | | | | 0 | | | | 0 | |
Administrator Class | | | 114 | | | | 1,093 | | | | 0 | | | | 0 | |
Institutional Class | | | 12,710 | | | | 121,974 | | | | 0 | | | | 0 | |
| | | | |
| | | | | | | 128,412 | | | | | | | | 0 | |
| | | | |
Payment for shares redeemed | | | | | | | | | | | | | | | | |
Class A | | | (4,908 | ) | | | (46,365 | ) | | | (823 | ) | | | (8,482 | ) |
Class C | | | (2,874 | ) | | | (26,632 | ) | | | 0 | | | | 0 | |
Administrator Class | | | 0 | | | | 0 | | | | (965 | ) | | | (10,106 | ) |
Institutional Class | | | (1,596 | ) | | | (14,698 | ) | | | 0 | | | | 0 | |
| | | | |
| | | | | | | (87,695 | ) | | | | | | | (18,588 | ) |
| | | | |
Net increase in net assets resulting from capital share transactions | | | | | | | 212,946 | | | | | | | | 10,259,941 | |
| | | | |
Total increase (decrease) in net assets | | | | | | | (1,001,864 | ) | | | | | | | 10,627,655 | |
| | | | |
| | | | |
Net assets | | | | | | | | | | | | | | | | |
Beginning of period | | | | | | | 10,627,655 | | | | | | | | 0 | |
| | | | |
End of period | | | | | | $ | 9,625,791 | | | | | | | $ | 10,627,655 | |
| | | | |
Undistributed (accumulated) net investment income (loss) | | | | | | $ | (32,929 | ) | | | | | | $ | 56,021 | |
| | | | |
| 1 | For the period from November 28, 2014 (commencement of operations) to June 30, 2015 |
The accompanying notes are an integral part of these financial statements.
| | | | |
| 16 | | Wells Fargo Global Long/Short Fund | | Financial highlights |
(For a share outstanding throughout each period)
| | | | | | | | |
| | | Year ended June 30 | |
| CLASS A | | 2016 | | | 20151 | |
Net asset value, beginning of period | | | $10.35 | | | | $10.00 | |
Net investment loss | | | (0.04 | ) | | | (0.04 | )2 |
Net realized and unrealized gains (losses) on investments | | | (1.04 | ) | | | 0.39 | |
| | | | | | | | |
Total from investment operations | | | (1.08 | ) | | | 0.35 | |
Distributions to shareholders from | | | | | | | | |
Net investment income | | | (0.01 | ) | | | 0.00 | |
Net realized gains | | | (0.10 | ) | | | 0.00 | |
| | | | | | | | |
Total distributions to shareholders | | | (0.11 | ) | | | 0.00 | |
Net asset value, end of period | | | $9.16 | | | | $10.35 | |
Total return3 | | | (10.43 | )% | | | 3.50 | % |
Ratios to average net assets (annualized) | | | | | | | | |
Gross expenses | | | 4.77 | %4 | | | 5.40 | %4 |
Net expenses | | | 2.47 | %4 | | | 2.96 | %4 |
Net investment loss | | | (0.41 | )% | | | (0.59 | )% |
Supplemental data | | | | | | | | |
Portfolio turnover rate | | | 37 | % | | | 62 | % |
Net assets, end of period (000s omitted) | | | $355 | | | | $295 | |
| 1 | For the period from November 28, 2014 (commencement of class operations) to June 30, 2015. |
| 2 | Calculated based upon average shares outstanding. |
| 3 | Total return calculations do not include any sales charges. Returns for periods of less than one year are not annualized. |
| 4 | Ratios include fees for the prime broker and expense from dividends on securities sold short as follows: |
| | | | |
Year ended June 30, 2016 | | | 0.72 | % |
Year ended June 30, 20151 | | | 1.21 | % |
The accompanying notes are an integral part of these financial statements.
| | | | | | |
| Financial highlights | | Wells Fargo Global Long/Short Fund | | | 17 | |
(For a share outstanding throughout each period)
| | | | | | | | |
| | | Year ended June 30 | |
| CLASS C | | 2016 | | | 20151 | |
Net asset value, beginning of period | | | $10.31 | | | | $10.00 | |
Net investment loss | | | (0.12 | ) | | | (0.07 | ) |
Net realized and unrealized gains (losses) on investments | | | (1.03 | ) | | | 0.38 | |
| | | | | | | | |
Total from investment operations | | | (1.15 | ) | | | 0.31 | |
Distributions to shareholders from | | | | | | | | |
Net realized gains | | | (0.10 | ) | | | 0.00 | |
Net asset value, end of period | | | $9.06 | | | | $10.31 | |
Total return2 | | | (11.18 | )% | | | 3.10 | % |
Ratios to average net assets (annualized) | | | | | | | | |
Gross expenses | | | 5.50 | %3 | | | 6.12 | %3 |
Net expenses | | | 3.20 | %3 | | | 3.54 | %3 |
Net investment loss | | | (1.24 | )% | | | (1.64 | )% |
Supplemental data | | | | | | | | |
Portfolio turnover rate | | | 37 | % | | | 62 | % |
Net assets, end of period (000s omitted) | | | $135 | | | | $150 | |
| 1 | For the period from November 28, 2014 (commencement of class operations) to June 30, 2015. |
| 2 | Total return calculations do not include any sales charges. Returns for periods of less than one year are not annualized. |
| 3 | Ratios include fees for the prime broker and expense from dividends on securities sold short as follows: |
| | | | |
Year ended June 30, 2016 | | | 0.70 | % |
Year ended June 30, 20151 | | | 1.04 | % |
The accompanying notes are an integral part of these financial statements.
| | | | |
| 18 | | Wells Fargo Global Long/Short Fund | | Financial highlights |
(For a share outstanding throughout each period)
| | | | | | | | |
| | | Year ended June 30 | |
| ADMINISTRATOR CLASS | | 2016 | | | 20151 | |
Net asset value, beginning of period | | | $10.36 | | | | $10.00 | |
Net investment loss | | | (0.04 | ) | | | (0.05 | ) |
Net realized and unrealized gains (losses) on investments | | | (1.03 | ) | | | 0.41 | |
| | | | | | | | |
Total from investment operations | | | (1.07 | ) | | | 0.36 | |
Distributions to shareholders from | | | | | | | | |
Net investment income | | | (0.01 | ) | | | 0.00 | |
Net realized gains | | | (0.10 | ) | | | 0.00 | |
| | | | | | | | |
Total distributions to shareholders | | | (0.11 | ) | | | 0.00 | |
Net asset value, end of period | | | $9.18 | | | | $10.36 | |
Total return2 | | | (10.38 | )% | | | 3.60 | % |
Ratios to average net assets (annualized) | | | | | | | | |
Gross expenses | | | 4.68 | %3 | | | 5.22 | %3 |
Net expenses | | | 2.35 | %3 | | | 2.70 | %3 |
Net investment loss | | | (0.40 | )% | | | (0.83 | )% |
Supplemental data | | | | | | | | |
Portfolio turnover rate | | | 37 | % | | | 62 | % |
Net assets, end of period (000s omitted) | | | $93 | | | | $104 | |
| 1 | For the period from November 28, 2014 (commencement of class operations) to June 30, 2015. |
| 2 | Total return calculations do not include any sales charges. Returns for periods of less than one year are not annualized. |
| 3 | Ratios include fees for the prime broker and expense from dividends on securities sold short as follows: |
| | | | |
Year ended June 30, 2016 | | | 0.70 | % |
Year ended June 30, 20151 | | | 1.05 | % |
The accompanying notes are an integral part of these financial statements.
| | | | | | |
| Financial highlights | | Wells Fargo Global Long/Short Fund | | | 19 | |
(For a share outstanding throughout each period)
| | | | | | | | |
| | | Year ended June 30 | |
| INSTITUTIONAL CLASS | | 2016 | | | 20151 | |
Net asset value, beginning of period | | | $10.37 | | | | $10.00 | |
Net investment loss | | | (0.02 | ) | | | (0.04 | ) |
Net realized and unrealized gains (losses) on investments | | | (1.03 | ) | | | 0.41 | |
| | | | | | | | |
Total from investment operations | | | (1.05 | ) | | | 0.37 | |
Distributions to shareholders from | | | | | | | | |
Net investment income | | | (0.02 | ) | | | 0.00 | |
Net realized gains | | | (0.10 | ) | | | 0.00 | |
| | | | | | | | |
Total distributions to shareholders | | | (0.12 | ) | | | 0.00 | |
Net asset value, end of period | | | $9.20 | | | | $10.37 | |
Total return2 | | | (10.12 | )% | | | 3.70 | % |
Ratios to average net assets (annualized) | | | | | | | | |
Gross expenses | | | 4.42 | %3 | | | 4.95 | %3 |
Net expenses | | | 2.15 | %3 | | | 2.49 | %3 |
Net investment loss | | | (0.20 | )% | | | (0.63 | )% |
Supplemental data | | | | | | | | |
Portfolio turnover rate | | | 37 | % | | | 62 | % |
Net assets, end of period (000s omitted) | | | $9,043 | | | | $10,078 | |
| 1 | For the period from November 28, 2014 (commencement of class operations) to June 30, 2015. |
| 2 | Total return calculations do not include any sales charges. Returns for periods of less than one year are not annualized. |
| 3 | Ratios include fees for the prime broker and expense from dividends on securities sold short as follows: |
| | | | |
Year ended June 30, 2016 | | | 0.70 | % |
Year ended June 30, 20151 | | | 1.04 | % |
The accompanying notes are an integral part of these financial statements.
| | | | |
| 20 | | Wells Fargo Global Long/Short Fund | | Notes to financial statements |
1. ORGANIZATION
Wells Fargo Funds Trust (the “Trust”), a Delaware statutory trust organized on March 10, 1999, is an open-end management investment company registered under the Investment Company Act of 1940, as amended (the “1940 Act”). As an investment company, the Trust follows the accounting and reporting guidance in Financial Accounting Standards Board (“FASB”) Accounting Standards Codification Topic 946, Financial Services – Investment Companies. These financial statements report on the Wells Fargo Global Long/Short Fund (the “Fund”) which is a diversified series of the Trust.
2. SIGNIFICANT ACCOUNTING POLICIES
The following significant accounting policies, which are consistently followed in the preparation of the financial statements of the Fund, are in conformity with U.S. generally accepted accounting principles which require management to make estimates and assumptions that affect the reported amounts of assets and liabilities, disclosure of contingent assets and liabilities at the date of the financial statements, and the reported amounts of revenues and expenses during the reporting period. Actual results could differ from those estimates.
Securities valuation
All investments are valued each business day as of the close of regular trading on the New York Stock Exchange (generally 4 p.m. Eastern Time), although a Fund may deviate from this calculation time under unusual or unexpected circumstances.
Equity securities and options that are listed on a foreign or domestic exchange or market are valued at the official closing price or, if none, the last sales price. If no sale occurs on the principal exchange or market that day, the prior day’s price will be deemed “stale” and a fair value price will be determined in accordance with the Fund’s Valuation Procedures.
Non-listed options are valued at the evaluated price provided by an independent pricing service or, if a reliable price is not available, the quoted bid price from an independent broker-dealer.
The values of securities denominated in foreign currencies are translated into U.S. dollars at rates provided by an independent foreign currency pricing source at a time each business day specified by the Management Valuation Team of Wells Fargo Funds Management, LLC (“Funds Management”).
Many securities markets and exchanges outside the U.S. close prior to the close of the New York Stock Exchange and therefore may not fully reflect trading or events that occur after the close of the principal exchange in which the foreign securities are traded, but before the close of the New York Stock Exchange. If such trading or events are expected to materially affect the value of such securities, then fair value pricing procedures approved by the Board of Trustees of the Fund are applied. These procedures take into account multiple factors including movements in U.S. securities markets after foreign exchanges close. Foreign securities that are fair valued under these procedures are categorized as Level 2 and the application of these procedures may result in transfers between Level 1 and Level 2. Depending on market activity, such fair valuations may be frequent. Such fair value pricing may result in net asset values that are higher or lower than net asset values based on the last reported sales price or latest quoted bid price. On June 30, 2016, such fair value pricing was used in pricing foreign securities.
Investments in registered open-end investment companies are valued at net asset value.
Investments which are not valued using any of the methods discussed above are valued at their fair value, as determined in good faith by the Board of Trustees of the Fund. The Board of Trustees has established a Valuation Committee comprised of the Trustees and has delegated to it the authority to take any actions regarding the valuation of portfolio securities that the Valuation Committee deems necessary or appropriate, including determining the fair value of portfolio securities, unless the determination has been delegated to the Management Valuation Team. The Board of Trustees retains the authority to make or ratify any valuation decisions or approve any changes to the Valuation Procedures as it deems appropriate. On a quarterly basis, the Board of Trustees receives reports on any valuation actions taken by the Valuation Committee or the Management Valuation Team which may include items for ratification.
Valuations of fair valued securities are compared to the next actual sales price when available, or other appropriate market values, to assess the continued appropriateness of the fair valuation methodologies used. These securities are fair valued on a day-to-day basis, taking into consideration changes to appropriate market information and any significant changes to the inputs considered in the valuation process until there is a readily available price provided on an exchange or by an independent pricing service. Valuations received from an independent pricing service or independent broker-dealer quotes are periodically validated by comparisons to most recent trades and valuations provided by other independent pricing services in addition to the review of prices by the manager and/or subadviser. Unobservable inputs
| | | | | | |
| Notes to financial statements | | Wells Fargo Global Long/Short Fund | | | 21 | |
used in determining fair valuations are identified based on the type of security, taking into consideration factors utilized by market participants in valuing the investment, knowledge about the issuer and the current market environment.
Foreign currency translation
The accounting records of the Fund are maintained in U.S. dollars. The values of other assets and liabilities denominated in foreign currencies are translated into U.S. dollars at rates provided by an independent foreign currency pricing source at a time each business day specified by the Management Valuation Team. Purchases and sales of securities, and income and expenses are converted at the rate of exchange on the respective dates of such transactions. Net realized foreign exchange gains or losses arise from sales of foreign currencies, currency gains or losses realized between the trade and settlement dates on securities transactions, and the difference between the amounts of dividends, interest and foreign withholding taxes recorded and the U.S. dollar equivalent of the amounts actually paid or received. Net unrealized foreign exchange gains and losses arise from changes in the fair value of assets and liabilities other than investments in securities resulting from changes in exchange rates. The changes in net assets arising from changes in exchange rates and the changes in net assets resulting from changes in market prices of securities are not separately presented. Such changes are included in net realized and unrealized gains or losses from investments.
Forward foreign currency contracts
The Fund is subject to foreign currency exchange rate risk in the normal course of pursuing its investment objectives. A forward foreign currency contract is an agreement between two parties to purchase or sell a specific currency for an agreed-upon price at a future date. The Fund enters into forward foreign currency contracts to facilitate transactions in foreign-denominated securities and to attempt to minimize the risk to the Fund from adverse changes in the relationship between currencies. Forward foreign currency contracts are recorded at the forward rate and marked-to-market daily. When the contracts are closed, realized gains and losses arising from such transactions are recorded as realized gains or losses on forward foreign currency contract transactions. The Fund could be exposed to risks if the counterparties to the contracts are unable to meet the terms of their contracts or if the value of the foreign currency changes unfavorably. The Fund’s maximum risk of loss from counterparty credit risk is the unrealized gains on the contracts. This risk may be mitigated if there is a master netting arrangement between the Fund and the counterparty.
Options
The Fund is subject to equity price risk in the normal course of pursuing its investment objectives. The Fund may write covered call options or secured put options on individual securities and/or indexes. When the Fund writes an option, an amount equal to the premium received is recorded as a liability and is subsequently adjusted to the current market value of the written option. Premiums received from written options that expire unexercised are recognized as realized gains on the expiration date. For exercised options, the difference between the premium received and the amount paid on effecting a closing purchase transaction, including brokerage commissions, is treated as a realized gain or loss. If a call option is exercised, the premium is added to the proceeds from the sale of the underlying security in calculating the realized gain or loss on the sale. If a put option is exercised, the premium reduces the cost of the security purchased. The Fund, as a writer of an option, bears the market risk of an unfavorable change in the price of the security and/or index underlying the written option.
The Fund may also purchase call or put options. The premium is included in the Statement of Assets and Liabilities as an investment, the value of which is subsequently adjusted based on the current market value of the option. Premiums paid for purchased options that expire are recognized as realized losses on the expiration date. Premiums paid for purchased options that are exercised or closed are added to the amount paid or offset against the proceeds received for the underlying security to determine the realized gain or loss. The risk of loss associated with purchased options is limited to the premium paid.
Options traded on an exchange are regulated and terms of the options are standardized. Purchased options traded over-the-counter expose the Fund to counterparty risk in the event the counterparty does not perform. This risk can be mitigated by having a master netting arrangement between the Fund and the counterparty and by having the counterparty post collateral to cover the Fund’s exposure to the counterparty.
Short sales
The Fund may sell a security it does not own in anticipation of a decline in the market value of that security (short sale). When the Fund makes a short sale, it must borrow the security sold short and deliver it to the buyer. The Fund is then obligated to replace the security borrowed by purchasing the security at the market price at the time of replacement.
The Fund records the proceeds as a liability which is marked-to-market daily based upon quotations from an independent pricing service or from brokers, which use prices provided by market makers, and any change in value is
| | | | |
| 22 | | Wells Fargo Global Long/Short Fund | | Notes to financial statements |
recorded as an unrealized gain or loss. Any interest or dividends accrued on such borrowed securities during the period of the loan are recorded as an expense on the Statement of Operations. To borrow the security, the Fund may be required to pay a premium, which would decrease the proceeds of the security sold. A gain, limited to the price at which the Fund sold the security short, or a loss, unlimited in size, will be recognized upon the closing of a short sale if the market price at the closing is less than or greater than, respectively, the proceeds originally received. Until the short sale is closed or the borrowed security is replaced, the Fund maintains a segregated account of cash or liquid securities, the dollar value of which is at least equal to the market value of the security at the time of the short sale.
Security transactions and income recognition
Securities transactions are recorded on a trade date basis. Realized gains or losses are recorded on the basis of identified cost.
Dividend income is recognized on the ex-dividend date, except for certain dividends from foreign securities, which are recorded as soon as the custodian verifies the ex-dividend date. Dividend income from foreign securities is recorded net of foreign taxes withheld where recovery of such taxes is not assured.
Distributions to shareholders
Distributions to shareholders from net investment income and net realized gains, if any, are recorded on the ex-dividend date. Such distributions are determined in conformity with federal income tax regulations, which may differ in amount or character from net investment income and realized gains recognized for purposes of U.S. generally accepted accounting principles.
Federal and other taxes
The Fund intends to qualify as a regulated investment company by distributing substantially all of its investment company taxable income and any net realized capital gains (after reduction for capital loss carryforwards) sufficient to relieve it from all, or substantially all, federal income taxes. Accordingly, no provision for federal income taxes was required.
The Fund’s income and federal excise tax returns and all financial records supporting those returns for the fiscal years since commencement of operations will be subject to examination by the federal and Delaware revenue authorities. The Fund is not subject to examination by federal and state tax authorities for tax years before 2014, the year the Fund commenced operations.
Reclassifications are made to the Fund’s capital accounts for permanent tax differences to reflect income and gains available for distribution (or available capital loss carryforwards) under federal income tax regulations. U.S. generally accepted accounting principles require that certain components of net assets be adjusted to reflect permanent differences between financial and tax reporting. These reclassifications have no effect on net assets or net asset values per share. The primary permanent differences causing such reclassifications are due to foreign currency transactions and recognition of partnership income. At June 30, 2016, as a result of permanent book-to-tax differences, the following reclassification adjustments were made on the Statement of Assets and Liabilities:
| | |
Accumulated net
investment loss | | Accumulated net
realized losses
on investments |
| $(37,152) | | $37,152 |
As of June 30, 2016, the Fund had capital loss carryforwards which consist of $97,711 in short-term capital losses and $234,944 in long-term capital losses.
As of June 30, 2016, the Fund had a qualified late-year ordinary loss of $325 which will be recognized on the first day of the following fiscal year.
Class allocations
The separate classes of shares offered by the Fund differ principally in applicable sales charges, distribution, shareholder servicing, and administration fees. Class specific expenses are charged directly to that share class. Investment income, common expenses, and realized and unrealized gains (losses) on investments are allocated daily to each class of shares based on the relative proportion of net assets of each class.
3. FAIR VALUATION MEASUREMENTS
Fair value measurements of investments are determined within a framework that has established a fair value hierarchy based upon the various data inputs utilized in determining the value of the Fund’s investments. The three-level hierarchy
| | | | | | |
| Notes to financial statements | | Wells Fargo Global Long/Short Fund | | | 23 | |
gives the highest priority to unadjusted quoted prices in active markets for identical assets or liabilities (Level 1) and the lowest priority to significant unobservable inputs (Level 3). The Fund’s investments are classified within the fair value hierarchy based on the lowest level of input that is significant to the fair value measurement. The inputs are summarized into three broad levels as follows:
| n | | Level 1 – quoted prices in active markets for identical securities |
| n | | Level 2 – other significant observable inputs (including quoted prices for similar securities, interest rates, prepayment speeds, credit risk, use of amortized cost, etc.) |
| n | | Level 3 – significant unobservable inputs (including the Fund’s own assumptions in determining the fair value of investments) |
The inputs or methodologies used for valuing investments in securities are not necessarily an indication of the risk associated with investing in those securities.
The following is a summary of the inputs used in valuing the Fund’s assets and liabilities as of June 30, 2016:
| | | | | | | | | | | | | | | | |
| | | Quoted prices
(Level 1) | | | Other significant observable inputs
(Level 2) | | | Significant
unobservable inputs (Level 3) | | | Total | |
Assets | | | | | | | | | | | | | | | | |
Investments in: | | | | | | | | | | | | | | | | |
| | | | |
Common stocks | | | | | | | | | | | | | | | | |
Brazil | | $ | 9,023 | | | $ | 0 | | | $ | 0 | | | $ | 9,023 | |
Canada | | | 271,400 | | | | 0 | | | | 0 | | | | 271,400 | |
China | | | 46,639 | | | | 456,469 | | | | 0 | | | | 503,108 | |
France | | | 0 | | | | 235,924 | | | | 0 | | | | 235,924 | |
Germany | | | 0 | | | | 629,049 | | | | 0 | | | | 629,049 | |
Hong Kong | | | 0 | | | | 80,042 | | | | 0 | | | | 80,042 | |
Italy | | | 0 | | | | 398,752 | | | | 0 | | | | 398,752 | |
Japan | | | 0 | | | | 1,158,730 | | | | 0 | | | | 1,158,730 | |
Netherlands | | | 0 | | | | 418,967 | | | | 0 | | | | 418,967 | |
South Korea | | | 0 | | | | 136,745 | | | | 0 | | | | 136,745 | |
Switzerland | | | 0 | | | | 187,144 | | | | 0 | | | | 187,144 | |
United Kingdom | | | 0 | | | | 723,394 | | | | 0 | | | | 723,394 | |
United States | | | 757,287 | | | | 0 | | | | 0 | | | | 757,287 | |
| | | | |
Participation Notes | | | | | | | | | | | | | | | | |
China | | | 0 | | | | 91,835 | | | | 0 | | | | 91,835 | |
| | | | |
Short-term investments | | | | | | | | | | | | | | | | |
Investment companies | | | 3,775,913 | | | | 0 | | | | 0 | | | | 3,775,913 | |
| | | 4,860,262 | | | | 4,517,051 | | | | 0 | | | | 9,377,313 | |
Forward foreign currency contracts | | | 0 | | | | 32,590 | | | | 0 | | | | 32,590 | |
Total assets | | $ | 4,860,262 | | | $ | 4,549,641 | | | $ | 0 | | | $ | 9,409,903 | |
Liabilities | | | | | | | | | | | | | | | | |
Securities sold short | | | | | | | | | | | | | | | | |
| | | | |
Common stocks | | | | | | | | | | | | | | | | |
France | | $ | 0 | | | $ | 65,792 | | | $ | 0 | | | $ | 65,792 | |
Japan | | | 0 | | | | 167,508 | | | | 0 | | | | 167,508 | |
Netherlands | | | 114,088 | | | | 0 | | | | 0 | | | | 114,088 | |
Philippines | | | 25,851 | | | | 0 | | | | 0 | | | | 25,851 | |
Switzerland | | | 0 | | | | 253,991 | | | | 0 | | | | 253,991 | |
Thailand | | | 30,517 | | | | 0 | | | | 0 | | | | 30,517 | |
United Kingdom | | | 0 | | | | 96,046 | | | | 0 | | | | 96,046 | |
United States | | | 42,917 | | | | 0 | | | | 0 | | | | 42,917 | |
| | | | |
Exchange-traded funds | | | | | | | | | | | | | | | | |
United States | | | 715,741 | | | | 0 | | | | 0 | | | | 715,741 | |
Total liabilities | | $ | 929,114 | | | $ | 583,337 | | | $ | 0 | | | $ | 1,512,451 | |
| | | | |
| 24 | | Wells Fargo Global Long/Short Fund | | Notes to financial statements |
Forward foreign currency contracts are reported at their unrealized gains (losses) at measurement date, which represents the change in the contract’s value from trade date. All other assets and liabilities are reported at their market value at measurement date.
The Fund recognizes transfers between levels within the fair value hierarchy at the end of the reporting period. At June 30, 2016, fair value pricing was used in pricing certain foreign securities in long positions valued at $3,719,012 and securities in short positions valued at $487,291 were transferred from Level 1 to Level 2 within the fair value hierarchy. The Fund did not have any transfers into/out of Level 3.
4. TRANSACTIONS WITH AFFILIATES
Management fee
Funds Management, an indirect wholly owned subsidiary of Wells Fargo & Company (“Wells Fargo”), is the manager of the Fund and provides advisory and fund-level administrative services under an investment management agreement. Under the investment management agreement, Funds Management is responsible for, among other services, implementing the investment objectives and strategies of the Fund, supervising the subadviser, providing fund-level administrative services in connection with the Fund’s operations, and providing any other fund-level administrative services reasonably necessary for the operation of the Fund. As compensation for its services under the investment management agreement, Funds Management is entitled to receive an annual management fee starting at 1.30% and declining to 1.13% as the average daily net assets of the Fund increase. For the year ended June 30, 2016, the management fee was equivalent to an annual rate of 1.30% of the Fund’s average daily net assets.
Funds Management has retained the services of a subadviser to provide daily portfolio management to the Fund. The fee for subadvisory services is borne by Funds Management. Wells Capital Management Incorporated, an affiliate of Funds Management and an indirect wholly owned subsidiary of Wells Fargo, is the subadviser to the Fund and is entitled to receive a fee from Funds Management at an annual rate starting at 1.00% and declining to 0.90% as the average daily net assets of the Fund increase.
Administration fees
Under a class-level administration agreement, Funds Management provides class-level administrative services to the Fund, which includes paying fees and expenses for services provided by the transfer agent, sub-transfer agents, omnibus account servicers and record-keepers. As compensation for its services under the class-level administration agreement, Funds Management receives an annual fee which is calculated based on the average daily net assets of each class as follows:
| | | | |
| | | Class-level
administration fee | |
Class A, Class C | | | 0.21 | % |
Administrator Class, Institutional Class | | | 0.13 | |
Funds Management has contractually waived and/or reimbursed management and administration fees to the extent necessary to maintain certain net operating expense ratios for the Fund. Waiver of fees and/or reimbursement of expenses by Funds Management were made first from fund level expenses on a proportionate basis and then from class specific expenses. Funds Management has committed through October 31, 2016 to waive fees and/or reimburse expenses to the extent necessary to cap the Fund’s expenses at 1.75% for Class A shares, 2.50% for Class C shares, 1.65% for Administrator Class shares and 1.45% for Institutional Class shares. After this time, the cap may be increased or the commitment to maintain the cap may be terminated only with the approval of the Board of Trustees. Prime broker fees and dividend expense on securities sold short are excluded from the expense caps.
Distribution fee
The Trust has adopted a distribution plan for Class C shares of the Fund pursuant to Rule 12b-1 under the 1940 Act. A distribution fee is charged to Class C shares and paid to Wells Fargo Funds Distributor, LLC (“Funds Distributor”), the principal underwriter, at an annual rate of 0.75% of the average daily net assets of Class C shares.
In addition, Funds Distributor is entitled to receive the front-end sales charge from the purchase of Class A shares and a contingent deferred sales charge on the redemption of certain Class A shares. Funds Distributor is also entitled to receive the contingent deferred sales charges from redemptions of Class C shares. For the year ended June 30, 2016, Funds Distributor received $72 from the sale of Class A shares.
| | | | | | |
| Notes to financial statements | | Wells Fargo Global Long/Short Fund | | | 25 | |
Shareholder servicing fees
The Trust has entered into contracts with one or more shareholder servicing agents, whereby Class A, Class C and Administrator Class of the Fund are charged a fee at an annual rate of 0.25% of the average daily net assets of each respective class.
A portion of these total shareholder servicing fees were paid to affiliates of Wells Fargo.
5. INVESTMENT PORTFOLIO TRANSACTIONS
Purchases and sales of investments, excluding U.S. government obligations (if any) and short-term securities, for the year ended June 30, 2016 were $3,743,067 and $2,811,857, respectively.
The Fund may purchase or sell investment securities to other Wells Fargo funds under procedures adopted by the Board of Trustees. The procedures have been designed to ensure that these interfund transactions, which generally do not incur broker commissions, are effected at current market prices. Interfund trades are included within the respective purchases and sales amounts shown.
6. DERIVATIVE TRANSACTIONS
During the year ended June 30, 2016, the Fund entered into forward foreign currency contracts for economic hedging purposes.
At June 30, 2016, the Fund had forward foreign currency contracts outstanding as follows:
Forward foreign currency contracts to sell:
| | | | | | | | | | | | | | | | | | |
| Exchange date | | Counterparty | | Contracts to
deliver | | | U.S. value at
June 30, 2016 | | | In exchange
for U.S. $ | | | Unrealized
gains | |
| 7-25-2016 | | Morgan Stanley | | | 11,900 GBP | | | $ | 15,844 | | | $ | 17,497 | | | $ | 1,653 | |
| 7-25-2016 | | Morgan Stanley | | | 11,900 GBP | | | | 15,844 | | | | 17,378 | | | | 1,534 | |
| 7-25-2016 | | Morgan Stanley | | | 11,900 GBP | | | | 15,844 | | | | 17,259 | | | | 1,415 | |
| 7-25-2016 | | Morgan Stanley | | | 11,900 GBP | | | | 15,844 | | | | 17,140 | | | | 1,296 | |
| 8-31-2016 | | Morgan Stanley | | | 269,000 EUR | | | | 299,124 | | | | 301,143 | | | | 2,019 | |
| 9-15-2016 | | Credit Suisse | | | 100,300 EUR | | | | 111,596 | | | | 113,563 | | | | 1,967 | |
| 9-22-2016 | | Morgan Stanley | | | 165,600 GBP | | | | 220,621 | | | | 243,327 | | | | 22,706 | |
The Fund had average contract amounts of $361,247 and $1,246,653 in forward foreign currency contracts to buy and forward foreign currency contracts to sell, respectively, during the year ended June 30, 2016.
During the year ended June 30, 2016, the Fund entered into written options for economic hedging purposes.
During the year ended June 30, 2016, the Fund had written call option activities as follows:
| | | | | | | | |
| | | Number of
contracts | | | Premiums
received | |
Options outstanding at June 30, 2015 | | | 0 | | | $ | 0 | |
Options written | | | 20 | | | | 4,391 | |
Options expired | | | (20 | ) | | | (4,391 | ) |
Options terminated in closing purchase transactions | | | 0 | | | | 0 | |
Options exercised | | | 0 | | | | 0 | |
Options outstanding at June 30, 2016 | | | 0 | | | $ | 0 | |
As of June 30, 2016, the Fund did not have any open written options. The Fund had an average of 6 written option contracts during the year ended June 30, 2016.
During the year ended June 30, 2016, the Fund entered into purchased options contracts for speculative purposes and had an average of 12 purchased options contracts.
The fair value, realized gains or losses and change in unrealized gains or losses, if any, on derivative instruments are reflected in the appropriate financial statements.
| | | | |
| 26 | | Wells Fargo Global Long/Short Fund | | Notes to financial statements |
For certain types of derivative transactions, the Fund has entered into International Swaps and Derivatives Association, Inc. master agreements (“ISDA Master Agreements”) or similar agreements with approved counterparties. The ISDA Master Agreements or similar agreements may have requirements to deliver/deposit securities or cash to/with an exchange or broker-dealer as collateral and allows the Fund to offset, with each counterparty, certain derivative financial instrument’s assets and/or liabilities with collateral held or pledged. Collateral requirements differ by type of derivative. Collateral or margin requirements are set by the broker or exchange clearing house for exchange traded derivatives while collateral terms are contract specific for over-the-counter traded derivatives. Cash collateral that has been pledged to cover obligations of the Fund under ISDA Master Agreements or similar agreements, if any, are reported separately in the Statement of Assets and Liabilities. Securities pledged as collateral, if any, are noted in the Portfolio of Investments. With respect to balance sheet offsetting, absent an event of default by the counterparty or a termination of the agreement, the reported amounts of financial assets and financial liabilities in the Statement of Assets and Liabilities are not offset across transactions between the Fund and the applicable counterparty. A reconciliation of the gross amounts on the Statement of Assets and Liabilities to the net amounts by derivative type, including any collateral exposure, is as follows:
| | | | | | | | | | | | | | | | | | |
| Derivative type | | Counterparty | | Gross amounts
of assets in the
Statement of
Assets and
Liabilities | | | Amounts
subject to
netting
agreements | | | Collateral
received | | | Net amount
of assets | |
Forward foreign currency contracts | | Morgan Stanley | | $ | 30,623 | * | | $ | 0 | | | $ | 0 | | | $ | 30,623 | |
| | Credit Suisse | | | 1,967 | * | | | 0 | | | | 0 | | | | 1,967 | |
| | * | Amount represents net unrealized gains. | |
7. BANK BORROWINGS
The Fund has an uncommitted credit facility to provide leverage for investment purposes or to meet unanticipated redemptions. The Fund’s borrowings under the Facility are charged at a rate to be determined at the time of the borrowing.
For the year ended June 30, 2016, there were no borrowings by the Fund under the agreement.
8. DISTRIBUTIONS TO SHAREHOLDERS
The tax character of distributions paid for the year ended June 30, 2016 was $128,412 of ordinary income. For the year ended June 30, 2015, the Fund did not pay any distributions to shareholders.
As of June 30, 2016, the components of distributable earnings on a tax basis were as follows:
| | | | |
Unrealized
losses | | Late-year
ordinary losses
deferred | | Capital loss
carryforward |
| $(514,116) | | $(325) | | $(332,655) |
9. INDEMNIFICATION
Under the Trust’s organizational documents, the officers and Trustees have been granted certain indemnification rights against certain liabilities that may arise out of performance of their duties to the Trust. Additionally, in the normal course of business, the Trust may enter into contracts with service providers that contain a variety of indemnification clauses. The Trust’s maximum exposure under these arrangements is dependent on future claims that may be made against the Fund and, therefore, cannot be estimated.
| | | | | | |
| Report of independent registered public accounting firm | | Wells Fargo Global Long/Short Fund | | | 27 | |
BOARD OF TRUSTEES AND SHAREHOLDERS OF WELLS FARGO FUNDS TRUST:
We have audited the accompanying statement of assets and liabilities, including the portfolio of investments, of the Wells Fargo Global Long/Short Fund (formerly known as Wells Fargo Advantage Global Long/Short Fund) (the “Fund”), one of the funds constituting the Wells Fargo Funds Trust, as of June 30, 2016, and the related statement of operations for the year then ended and the statements of changes in net assets and financial highlights for the year then ended and the period from November 28, 2014 (commencement of operations) to June 30, 2015. These financial statements and financial highlights are the responsibility of the Fund’s management. Our responsibility is to express an opinion on these financial statements and financial highlights based on our audits.
We conducted our audits in accordance with the standards of the Public Company Accounting Oversight Board (United States). Those standards require that we plan and perform the audit to obtain reasonable assurance about whether the financial statements and financial highlights are free of material misstatement. An audit includes examining, on a test basis, evidence supporting the amounts and disclosures in the financial statements. Our procedures included confirmation of securities owned as of June 30, 2016, by correspondence with custodians and brokers, or by other appropriate auditing procedures. An audit also includes assessing the accounting principles used and significant estimates made by management, as well as evaluating the overall financial statement presentation. We believe that our audits provide a reasonable basis for our opinion.
In our opinion, the financial statements and financial highlights referred to above present fairly, in all material respects, the financial position of the Wells Fargo Global Long/Short Fund as of June 30, 2016, and the results of its operations for the year then ended and the changes in its net assets and the financial highlights for the year then ended and the period from November 28, 2014 (commencement of operations) to June 30, 2015, in conformity with U.S. generally accepted accounting principles.

Boston, Massachusetts
August 25, 2016
| | | | |
| 28 | | Wells Fargo Global Long/Short Fund | | Other information (unaudited) |
TAX INFORMATION
Pursuant to Section 854 of the Internal Revenue Code, $100,755 of income dividends paid during the fiscal year ended June 30, 2016 has been designated as qualified dividend income (QDI).
For the fiscal year ended June 30, 2016, $285 has been designated as interest-related dividends for nonresident alien shareholders pursuant to Section 871 of the Internal Revenue Code.
For the fiscal year ended June 30, 2016, $104,739 has been designated as short-term capital gain dividends for nonresident alien shareholders pursuant to Section 871 of the Internal Revenue Code.
PROXY VOTING INFORMATION
A description of the policies and procedures that the Fund uses to determine how to vote proxies relating to portfolio securities is available, upon request, by calling 1-800-222-8222, visiting our website at wellsfargofunds.com, or visiting the SEC website at sec.gov. Information regarding how the Fund voted proxies relating to portfolio securities during the most recent 12-month period ended June 30 is available on the Fund’s website at wellsfargofunds.com or by visiting the SEC website at sec.gov.
PORTFOLIO HOLDINGS INFORMATION
The complete portfolio holdings for the Fund are publicly available monthly on the Fund’s website (wellsfargofunds.com), on a one-month delayed basis. In addition, top ten holdings information (excluding derivative positions) for the Fund is publicly available on the Fund’s website on a monthly, seven-day or more delayed basis. The Fund files its complete schedule of portfolio holdings with the SEC for the first and third quarters of each fiscal year on Form N-Q, which is available by visiting the SEC website at sec.gov. In addition, the Fund’s Form N-Q may be reviewed and copied at the SEC’s Public Reference Room in Washington, DC, and at regional offices in New York City, at 233 Broadway, and in Chicago, at 175 West Jackson Boulevard, Suite 900. Information about the Public Reference Room may be obtained by calling 1-800-SEC-0330.
| | | | | | |
| Other information (unaudited) | | Wells Fargo Global Long/Short Fund | | | 29 | |
BOARD OF TRUSTEES AND OFFICERS
Each of the Trustees and Officers1 listed in the table below acts in identical capacities for each fund in the Wells Fargo family of funds, which consists of 142 mutual funds comprising the Wells Fargo Funds Trust, Wells Fargo Variable Trust, Wells Fargo Master Trust and four closed-end funds (collectively the “Fund Complex”). This table should be read in conjunction with the Prospectus and the Statement of Additional Information2. The mailing address of each Trustee and Officer is 525 Market Street, 12th Floor, San Francisco, CA 94105. Each Trustee and Officer serves an indefinite term, however, each Trustee serves such term until reaching the mandatory retirement age established by the Trustees.
Independent Trustees
| | | | | | |
Name and year of birth | | Position held and length of service* | | Principal occupations during past five years or longer | | Current other public
company or investment
company directorships |
William R. Ebsworth
(Born 1957) | | Trustee, since 2015 | | Retired. From 1984 to 2013, equities analyst, portfolio manager, research director and chief financial officer at Fidelity Management and Research Company in Boston, Tokyo, and Hong Kong and retired in 2013 as Chief Investment Officer of Fidelity Strategic Advisers, Inc. where he lead a team of investment professionals managing client assets. Prior thereto, Board member of Hong Kong Securities Clearing Co., Hong Kong Options Clearing Corp., the Thailand International Fund, Ltd., Fidelity Investments Life Insurance Company, and Empire Fidelity Investments Life Insurance Company. Mr. Ebsworth is a CFA® charterholder and an Adjunct Lecturer, Finance, at Babson College. | | Asset Allocation Trust |
| Jane A. Freeman (Born 1953) | | Trustee, since 2015 | | Retired. From 2012 to 2014 and 1999 to 2008, Chief Financial Officer of Scientific Learning Corporation. From 2008 to 2012, Ms. Freeman provided consulting services related to strategic business projects. Prior to 1999, Portfolio Manager at Rockefeller & Co. and Scudder, Stevens & Clark. Board member of the Harding Loevner Funds from 1996 to 2014, serving as both Lead Independent Director and chair of the Audit Committee. Board member of the Russell Exchange Traded Funds Trust from 2011 to 2012 and the chair of the Audit Committee. Ms. Freeman is Chair of Taproot Foundation (non-profit organization), a Board Member of Ruth Bancroft Garden (non-profit organization) and an inactive chartered financial analyst. | | Asset Allocation Trust |
| Peter G. Gordon (Born 1942) | | Trustee, since 1998; Chairman, since 2005 | | Co-Founder, Retired Chairman, President and CEO of Crystal Geyser Water Company. Trustee Emeritus, Colby College. | | Asset Allocation Trust |
| Isaiah Harris, Jr. (Born 1952) | | Trustee, since 2009 | | Retired. Chairman of the Board of CIGNA Corporation since 2009, and Director since 2005. From 2003 to 2011, Director of Deluxe Corporation. Prior thereto, President and CEO of BellSouth Advertising and Publishing Corp. from 2005 to 2007, President and CEO of BellSouth Enterprises from 2004 to 2005 and President of BellSouth Consumer Services from 2000 to 2003. Emeritus member of the Iowa State University Foundation Board of Governors. Emeritus Member of the Advisory Board of Iowa State University School of Business. Advisory Board Member, Palm Harbor Academy (charter school). Advisory Board Member, Child Evangelism Fellowship (non-profit). Mr. Harris is a certified public accountant (inactive status). | | CIGNA Corporation; Asset Allocation Trust |
| Judith M. Johnson (Born 1949) | | Trustee, since 2008; Audit Committee Chairman, since 2008 | | Retired. Prior thereto, Chief Executive Officer and Chief Investment Officer of Minneapolis Employees Retirement Fund from 1996 to 2008. Ms. Johnson is an attorney, certified public accountant and a certified managerial accountant. | | Asset Allocation Trust |
| David F. Larcker (Born 1950) | | Trustee, since 2009 | | James Irvin Miller Professor of Accounting at the Graduate School of Business, Stanford University, Director of the Corporate Governance Research Initiative and Senior Faculty of The Rock Center for Corporate Governance since 2006. From 2005 to 2008, Professor of Accounting at the Graduate School of Business, Stanford University. Prior thereto, Ernst & Young Professor of Accounting at The Wharton School, University of Pennsylvania from 1985 to 2005. | | Asset Allocation Trust |
| | | | |
| 30 | | Wells Fargo Global Long/Short Fund | | Other information (unaudited) |
| | | | | | |
Name and year of birth | | Position held and length of service* | | Principal occupations during past five years or longer | | Current other public
company or investment
company directorships |
| Olivia S. Mitchell (Born 1953) | | Trustee, since 2006 | | International Foundation of Employee Benefit Plans Professor, Wharton School of the University of Pennsylvania since 1993. Director of Wharton’s Pension Research Council and Boettner Center on Pensions & Retirement Research, and Research Associate at the National Bureau of Economic Research. Previously, Cornell University Professor from 1978 to 1993. | | Asset Allocation Trust |
| Timothy J. Penny (Born 1951) | | Trustee, since 1996 | | President and Chief Executive Officer of Southern Minnesota Initiative Foundation, a non-profit organization, since 2007 and Senior Fellow at the Humphrey Institute Policy Forum at the University of Minnesota since 1995. Member of the Board of Trustees of NorthStar Education Finance, Inc., a non-profit organization, since 2007. | | Asset Allocation Trust |
| Michael S. Scofield (Born 1943) | | Trustee, since 2010 | | Served on the Investment Company Institute’s Board of Governors and Executive Committee from 2008-2011 as well the Governing Council of the Independent Directors Council from 2006-2011 and the Independent Directors Council Executive Committee from 2008-2011. Chairman of the IDC from 2008-2010. Institutional Investor (Fund Directions) Trustee of Year in 2007. Trustee of the Evergreen Funds complex (and its predecessors) from 1984 to 2010. Chairman of the Evergreen Funds from 2000-2010. Former Trustee of the Mentor Funds. Retired Attorney, Law Offices of Michael S. Scofield. | | Asset Allocation Trust |
| * | Length of service dates reflect the Trustee’s commencement of service with the Trust’s predecessor entities, where applicable. |
Officers
| | | | | | |
Name and year of birth | | Position held and length of service | | Principal occupations during past five years or longer | | |
Karla M. Rabusch
(Born 1959) | | President, since 2003 | | Executive Vice President of Wells Fargo Bank, N.A. and President of Wells Fargo Funds Management, LLC since 2003. | | |
Jeremy DePalma1
(Born 1974) | | Treasurer, since 2012 | | Senior Vice President of Wells Fargo Funds Management, LLC since 2009. Senior Vice President of Evergreen Investment Management Company, LLC from 2008 to 2010 and head of the Fund Reporting and Control Team within Fund Administration from 2005 to 2010. | | |
C. David Messman
(Born 1960) | | Secretary, since 2000; Chief Legal Officer, since 2003 | | Senior Vice President and Secretary of Wells Fargo Funds Management, LLC since 2001. Assistant General Counsel of Wells Fargo Bank, N.A. since 2013 and Vice President and Managing Counsel of Wells Fargo Bank, N.A. from 1996 to 2013. | | |
Michael Whitaker
(Born 1967) | | Chief Compliance Officer, since 2016* | | Executive Vice President of Wells Fargo Funds Management, LLC since 2016. Chief Compliance Officer of Fidelity’s Fixed Income Funds and Asset Allocation Funds from 2008 to 2016, Compliance Officer of FMR Co., Inc. from 2014 to 2016, Fidelity Investments Money Management, Inc. from 2014 to 2016, Fidelity Investments from 2007 to 2016. | | |
David Berardi
(Born 1975) | | Assistant Treasurer, since 2009 | | Vice President of Wells Fargo Funds Management, LLC since 2009. Vice President of Evergreen Investment Management Company, LLC from 2008 to 2010. Manager of Fund Reporting and Control for Evergreen Investment Management Company, LLC from 2004 to 2010. | | |
| 1 | Jeremy DePalma acts as Treasurer of 69 funds and Assistant Treasurer of 73 funds in the Fund Complex. |
| 2 | The Statement of Additional Information includes additional information about the Trustees and is available, without charge, upon request, by calling 1-800-222-8222 or by visiting the website at wellsfargofunds.com. |
| * | Michael Whitaker became Chief Compliance Officer effective May 16, 2016. |
| | | | | | |
| Other information (unaudited) | | Wells Fargo Global Long/Short Fund | | | 31 | |
BOARD CONSIDERATION OF INVESTMENT MANAGEMENT AND SUB-ADVISORY AGREEMENTS:
Under the Investment Company Act of 1940 (the “1940 Act”), the Board of Trustees (the “Board”) of Wells Fargo Funds Trust (the “Trust”) must determine annually whether to approve the continuation of the Trust’s investment management and sub-advisory agreements. In this regard, at an in-person meeting held on May 24-25, 2016 (the “Meeting”), the Board, all the members of which have no direct or indirect interest in the investment management and sub-advisory agreements and are not “interested persons” of the Trust, as defined in the 1940 Act (the “Independent Trustees”), reviewed and approved for Wells Fargo Global Long/Short Fund (the “Fund”): (i) an investment management agreement (the “Management Agreement”) with Wells Fargo Funds Management, LLC (“Funds Management”); and (ii) an investment sub-advisory agreement (the “Sub-Advisory Agreement”) with Wells Capital Management Incorporated (the “Sub-Adviser”), an affiliate of Funds Management. The Management Agreement and the Sub-Advisory Agreement are collectively referred to as the “Advisory Agreements.”
At the Meeting, the Board considered the factors and reached the conclusions described below relating to the selection of Funds Management and the Sub-Adviser and the approval of the Advisory Agreements. Prior to the Meeting, including at an in-person meeting in April 2016, the Trustees conferred extensively among themselves and with representatives of Funds Management about these matters. Also, the Board has adopted a team-based approach, with each team consisting of a sub-set of Trustees, to assist the full Board in the discharge of its duties in reviewing performance and other matters throughout the year. The Independent Trustees were assisted in their evaluation of the Advisory Agreements by independent legal counsel, from whom they received separate legal advice and with whom they met separately.
In providing information to the Board, Funds Management and the Sub-Adviser were guided by a detailed set of requests for information submitted to them by independent legal counsel on behalf of the Independent Trustees at the start of the Board’s annual contract renewal process earlier in 2016. In considering and approving the Advisory Agreements, the Trustees considered the information they believed relevant, including but not limited to the information discussed below. The Board considered not only the specific information presented in connection with the Meeting, but also the knowledge gained over time through interaction with Funds Management and the Sub-Adviser about various topics. In this regard, the Board reviewed reports of Funds Management at each of its quarterly meetings, which included, among other things, portfolio reviews and performance reports. In addition, the Board and the teams mentioned above confer with portfolio managers at various times throughout the year. The Board did not identify any particular information or consideration that was all-important or controlling, and each individual Trustee may have attributed different weights to various factors.
After its deliberations, the Board unanimously approved the continuation of the Advisory Agreements for a one-year term and determined that the compensation payable to Funds Management and the Sub-Adviser under each of the Advisory Agreements was reasonable. The Board considered the approval of the Advisory Agreements for the Fund as part of its consideration of agreements for funds across the complex, but its approvals were made on a fund-by-fund basis. The following summarizes a number of important, but not necessarily all, factors considered by the Board in support of its approvals.
Nature, extent and quality of services
The Board received and considered various information regarding the nature, extent and quality of services provided to the Fund by Funds Management and the Sub-Adviser under the Advisory Agreements. This information included a description of the investment advisory services and Fund-level administrative services covered by the Management Agreement, as well as, among other things, a summary of the background and experience of senior management of Funds Management, and the qualifications, background, tenure and responsibilities of each of the portfolio managers primarily responsible for the day-to-day portfolio management of the Fund.
The Board evaluated the ability of Funds Management and the Sub-Adviser to attract and retain qualified investment professionals, including research, advisory and supervisory personnel. The Board further considered the compliance programs and compliance records of Funds Management and the Sub-Adviser. In addition, the Board took into account the full range of services provided to the Fund by Funds Management and its affiliates.
Fund performance and expenses
The Board considered the performance results for the Fund over various time periods ended December 31, 2015. The Board considered these results in comparison to the performance of funds in a universe that was determined by Broadridge Inc. (“Broadridge”) to be similar to the Fund (the “Universe”), and in comparison to the Fund’s benchmark index and to other comparative data. Broadridge is an independent provider of investment company data. The Board received a description of the methodology used by Broadridge to select the mutual funds in the performance Universe.
| | | | |
| 32 | | Wells Fargo Global Long/Short Fund | | Other information (unaudited) |
The Board noted that the performance of the Fund (Administrator Class A) was lower than the average performance of the Universe for all periods under review. The Board also noted that the performance of the Fund was lower than its benchmark, the Global Long/Short Composite Index, for all periods under review. The Board noted the short performance history of the Fund.
The Board also received and considered information regarding the Fund’s net operating expense ratios and their various components, including actual management fees, custodian and other non-management fees, and Rule 12b-1 and non-Rule 12b-1 shareholder service fees. The Board considered these ratios in comparison to the median ratios of funds in class-specific expense groups that were determined by Broadridge to be similar to the Fund (the “Groups”). The Board received a description of the methodology used by Broadridge to select the mutual funds in the expense Groups and an explanation of how funds comprising expense groups and their expense ratios may vary from year-to-year. Based on the Broadridge reports, the Board noted that the net operating expense ratios of the Fund were lower than or equal to the median net operating expense ratios of the expense Groups.
The Board took into account the Fund performance and expense information provided to it among the factors considered in deciding to re-approve the Advisory Agreements.
Investment management and sub-advisory fee rates
The Board reviewed and considered the contractual fee rates payable by the Fund to Funds Management under the Management Agreement, as well as the contractual fee rates payable by the Fund to Funds Management for class-level administrative services under a Class-Level Administration Agreement, which include class-level transfer agency and sub-transfer agency costs (collectively, the “Management Rates”). The Board also reviewed and considered the contractual investment sub-advisory fee rates that are payable by Funds Management to the Sub-Adviser for investment sub-advisory services.
Among other information reviewed by the Board was a comparison of the Fund’s Management Rates with the average contractual investment management fee rates of funds in the expense Groups at a common asset level as well as transfer agency costs of the funds in the expense Groups. The Board noted that the Management Rates of the Fund were higher than the sum of these average rates for the Fund’s expense Groups for all share classes except Institutional Class. The Board noted that the net operating expense ratios of the Fund were lower than or equal to the median net operating expense ratios of the expense Groups.
The Board also received and considered information about the portion of the total management fee that was retained by Funds Management after payment of the fee to the Sub-Adviser for sub-advisory services. In assessing the reasonableness of this amount, the Board received and evaluated information about the nature and extent of responsibilities retained and risks assumed by Funds Management and not delegated to or assumed by the Sub-Adviser, and about Funds Management’s on-going oversight services. However, given the affiliation between Funds Management and the Sub-Adviser, the Board ascribed limited relevance to the allocation of fees between them.
The Board also received and considered information about the nature and extent of services offered and fee rates charged by Funds Management and the Sub-Adviser to other types of clients with investment strategies similar to those of the Fund. In this regard, the Board received information about the significantly greater scope of services, and compliance, reporting and other legal burdens and risks of managing mutual funds compared with those associated with managing assets of non-mutual fund clients such as collective funds or institutional separate accounts.
Based on its consideration of the factors and information it deemed relevant, including those described here, the Board determined that the compensation payable to Funds Management under the Management Agreement and to the Sub-Adviser under the Sub-Advisory Agreement was reasonable, in light of the services covered by the Advisory Agreements.
Profitability
The Board received and considered information concerning the profitability of Funds Management, as well as the profitability of Wells Fargo as a whole, from providing services to the Fund and the fund family as a whole. The Board also received and considered information concerning the profitability of the Sub-Adviser from providing services to the fund family as a whole, noting that the Sub-Adviser’s profitability information with respect to providing services to the Fund was subsumed in the Wells Fargo and Funds Management profitability analysis.
Funds Management reported on the methodologies and estimates used in calculating profitability. Among other things, the Board noted that the levels of profitability reported on a fund-by-fund basis varied widely, depending on factors such as the size and type of fund. Based on its review, the Board did not deem the profits reported by Funds Management or Wells Fargo from its services to the Fund to be at a level that would prevent it from approving the continuation of the Advisory Agreements.
| | | | | | |
| Other information (unaudited) | | Wells Fargo Global Long/Short Fund | | | 33 | |
Economies of scale
With respect to possible economies of scale, the Board noted the existence of breakpoints in the Fund’s management fee structure, which operate generally to reduce the Fund’s expense ratios as the Fund grows in size. It considered that, for a small fund or a fund that shrinks in size, breakpoints conversely can result in higher fee levels. The Board also considered that fee waiver and expense reimbursement arrangements and competitive fee rates at the outset are means of sharing potential economies of scale with shareholders of the Fund and the fund family as a whole. The Board considered Funds Management’s view that any analyses of potential economies of scale in managing a particular fund are inherently limited in light of the joint and common costs and investments that Funds Management incurs across the fund family as a whole.
The Board concluded that the Fund’s fee and expense arrangements, including contractual breakpoints, constituted a reasonable approach to sharing potential economies of scale with the Fund and its shareholders.
Other benefits to Funds Management and the Sub-Adviser
The Board received and considered information regarding potential “fall-out” or ancillary benefits received by Funds Management and its affiliates, including the Sub-Adviser, as a result of their relationships with the Fund. Ancillary benefits could include, among others, benefits directly attributable to other relationships with the Fund and benefits potentially derived from an increase in Funds Management’s and the Sub-Adviser’s business as a result of their relationships with the Fund. The Board noted that various affiliates of Funds Management may receive distribution-related fees, shareholder servicing payments and sub-transfer agency fees in respect of shares sold or held through them and services provided.
The Board also reviewed information about soft dollar credits earned and utilized by the Sub-Adviser, fees earned by Funds Management and the Sub-Adviser from managing a private investment vehicle for the fund family’s securities lending collateral and commissions earned by an affiliated broker from portfolio transactions.
Based on its consideration of the factors and information it deemed relevant, including those described here, the Board did not find that any ancillary benefits received by Funds Management and its affiliates, including the Sub-Adviser, were unreasonable.
Conclusion
At the Meeting, after considering the above-described factors and based on its deliberations and its evaluation of the information described above, the Board unanimously approved the continuation of the Advisory Agreements for a one-year term and determined that the compensation payable to Funds Management and the Sub-Adviser under each of the Advisory Agreements was reasonable.
| | | | |
| 34 | | Wells Fargo Global Long/Short Fund | | List of abbreviations |
The following is a list of common abbreviations for terms and entities that may have appeared in this report.
| ACA | — ACA Financial Guaranty Corporation |
| ADR | — American depositary receipt |
| ADS | — American depositary shares |
| AGC | — Assured Guaranty Corporation |
| AGM | — Assured Guaranty Municipal |
| Ambac | — Ambac Financial Group Incorporated |
| AMT | — Alternative minimum tax |
| BAN | — Bond anticipation notes |
| BHAC | — Berkshire Hathaway Assurance Corporation |
| CAB | — Capital appreciation bond |
| CCAB | — Convertible capital appreciation bond |
| CDA | — Community Development Authority |
| CDO | — Collateralized debt obligation |
| DRIVER | — Derivative inverse tax-exempt receipts |
| DW&P | — Department of Water & Power |
| DWR | — Department of Water Resources |
| ECFA | — Educational & Cultural Facilities Authority |
| EDA | — Economic Development Authority |
| EDFA | — Economic Development Finance Authority |
| ETF | — Exchange-traded fund |
| FDIC | — Federal Deposit Insurance Corporation |
| FFCB | — Federal Farm Credit Banks |
| FGIC | — Financial Guaranty Insurance Corporation |
| FHA | — Federal Housing Administration |
| FHLB | — Federal Home Loan Bank |
| FHLMC | — Federal Home Loan Mortgage Corporation |
| FICO | — The Financing Corporation |
| FNMA | — Federal National Mortgage Association |
| GDR | — Global depositary receipt |
| GNMA | — Government National Mortgage Association |
| HCFR | — Healthcare facilities revenue |
| HEFA | — Health & Educational Facilities Authority |
| HEFAR | — Higher education facilities authority revenue |
| HFA | — Housing Finance Authority |
| HFFA | — Health Facilities Financing Authority |
| HUD | — Department of Housing and Urban Development |
| IDA | — Industrial Development Authority |
| IDAG | — Industrial Development Agency |
| KRW | — Republic of Korea won |
| LIBOR | — London Interbank Offered Rate |
| LIFER | — Long Inverse Floating Exempt Receipts |
| LLC | — Limited liability company |
| LLLP | — Limited liability limited partnership |
| LLP | — Limited liability partnership |
| MBIA | — Municipal Bond Insurance Association |
| MFHR | — Multifamily housing revenue |
| MSTR | — Municipal securities trust receipts |
| MUD | — Municipal Utility District |
| National | — National Public Finance Guarantee Corporation |
| PCFA | — Pollution Control Financing Authority |
| PCL | — Public Company Limited |
| PCR | — Pollution control revenue |
| PFA | — Public Finance Authority |
| PFFA | — Public Facilities Financing Authority |
| PFOTER | — Puttable floating option tax-exempt receipts |
| plc | — Public limited company |
| PUTTER | — Puttable tax-exempt receipts |
| R&D | — Research & development |
| Radian | — Radian Asset Assurance |
| RAN | — Revenue anticipation notes |
| RDA | — Redevelopment Authority |
| RDFA | — Redevelopment Finance Authority |
| REIT | — Real estate investment trust |
| ROC | — Reset option certificates |
| SAVRS | — Select auction variable rate securities |
| SBA | — Small Business Authority |
| SDR | — Swedish depositary receipt |
| SFHR | — Single-family housing revenue |
| SFMR | — Single-family mortgage revenue |
| SPA | — Standby purchase agreement |
| SPDR | — Standard & Poor’s Depositary Receipts |
| SPEAR | — Short Puttable Exempt Adjustable Receipts |
| STRIPS | — Separate trading of registered interest and |
| TAN | — Tax anticipation notes |
| TIPS | — Treasury inflation-protected securities |
| TRAN | — Tax revenue anticipation notes |
| TTFA | — Transportation Trust Fund Authority |
| TVA | — Tennessee Valley Authority |
This page is intentionally left blank.
This page is intentionally left blank.

For more information
More information about Wells Fargo Funds is available free upon request. To obtain literature, please write, email, visit the Fund’s website, or call:
Wells Fargo Funds
P.O. Box 8266
Boston, MA 02266-8266
Email: fundservice@wellsfargo.com
Website: wellsfargofunds.com
Individual investors: 1-800-222-8222
Retail investment professionals: 1-888-877-9275
Institutional investment professionals: 1-866-765-0778
This report and the financial statements contained herein are submitted for the general information of the shareholders of the Fund. If this report is used for promotional purposes, distribution of the report must be accompanied or preceded by a current prospectus. Before investing, please consider the investment objectives, risks, charges, and expenses of the investment. For a current prospectus and, if available, a summary prospectus, containing this information, call 1-800-222-8222 or visit the Fund’s website at wellsfargofunds.com. Read the prospectus carefully before you invest or send money.
Wells Fargo Asset Management (WFAM) is a trade name used by the asset management businesses of Wells Fargo & Company. Wells Fargo Funds Management, LLC, a wholly owned subsidiary of Wells Fargo & Company, provides investment advisory and administrative services for Wells Fargo Funds. Other affiliates of Wells Fargo & Company provide subadvisory and other services for the funds. The funds are distributed by Wells Fargo Funds Distributor, LLC, Member FINRA, an affiliate of Wells Fargo & Company.
NOT FDIC INSURED ¡ NO BANK GUARANTEE ¡ MAY LOSE VALUE
© 2016 Wells Fargo Funds Management, LLC. All rights reserved.
| | |
 | | 244415 08-16 A268/AR268 6-16 |
(a) As of the end of the period covered by the report, Wells Fargo Funds Trust has adopted a code of ethics that applies to its President and Treasurer. A copy of the code of ethics is filed as an exhibit to this Form N-CSR.
(c) During the period covered by this report, there were no amendments to the provisions of the code of ethics adopted in Item 2(a) above.
(d) During the period covered by this report, there were no implicit or explicit waivers to the provisions of the code of ethics adopted in Item 2(a) above.
| ITEM 3. | AUDIT COMMITTEE FINANCIAL EXPERT |
The Board of Trustees of Wells Fargo Funds Trust has determined that Judith Johnson is an audit committee financial expert, as defined in Item 3 of Form N-CSR. Mrs. Johnson is independent for purposes of Item 3 of Form N-CSR.
| ITEM 4. | PRINCIPAL ACCOUNTANT FEES AND SERVICES |
(a), (b), (c), (d) The following table presents aggregate fees billed in each of the last two fiscal years for services rendered to the Registrant by the Registrant’s principal accountant. These fees were billed to the registrant and were approved by the Registrant’s audit committee.
| | | | | | | | |
| | | Fiscal | | | Fiscal | |
| | | year ended | | | year ended | |
| | | June 30, 2016 | | | June 30, 2015 | |
Audit fees | | $ | 619,678 | | | $ | 531,370 | |
Audit-related fees | | | — | | | | — | |
Tax fees (1) | | | 37,755 | | | | 31,680 | |
All other fees | | | — | | | | — | |
| | | | | | | | |
| | $ | 657,433 | | | $ | 563,050 | |
| | | | | | | | |
| (1) | Tax fees consist of fees for tax compliance, tax advice, tax planning and excise tax. |
(e) The Chairman of the Audit Committees is authorized to pre-approve: (1) audit services for the mutual funds of Wells Fargo Funds Trust; (2) non-audit tax or compliance consulting or training services provided to the Funds by the independent auditors (“Auditors”) if the fees for any particular engagement are not anticipated to exceed $50,000; and (3) non-audit tax or compliance consulting or training services provided by the Auditors to a Fund’s investment adviser and its controlling entities (where pre-approval is required because the engagement relates directly to the operations and financial reporting of the Fund) if the fee to the Auditors for any particular engagement is not anticipated to exceed $50,000. For any such pre-approval sought from the Chairman, Management shall prepare a brief description of the proposed services. If the Chairman approves of such service, he or she shall sign the statement prepared by Management. Such written statement shall be presented to the full Committees at their next regularly scheduled meetings.
(f) Not applicable
(g) Not applicable
(h) Not applicable
| ITEM 5. | AUDIT COMMITTEE OF LISTED REGISTRANTS |
Not applicable.
Wells Fargo Intermediate Tax/AMT-Free Fund, Wells Fargo Municipal Bond Fund, and Wells Fargo Ultra Short-Term Municipal Income Fund included a Summary Portfolio of Investments under Item 1. A Portfolio of Investments for each of Wells Fargo Intermediate Tax/AMT-Free Fund, Wells Fargo Municipal Bond Fund, and Wells Fargo Ultra Short-Term Municipal Income Fund are filed under this Item.
| | | | | | |
| Portfolio of investments—June 30, 2016 | | Wells Fargo Intermediate Tax/AMT-Free Fund | | | 1 | |
| | | | | | | | | | | | | | | | |
| Security name | | Interest rate | | | Maturity date | | | Principal | | | Value | |
| | | | |
Municipal Obligations: 101.06% | | | | | | | | | | | | | | | | |
| | | | |
| Alabama: 0.24% | | | | | | | | | | | | | | | | |
Alabama Public School & College Authority Capital Improvement (Tax Revenue) | | | 5.00 | % | | | 12-1-2017 | | | $ | 2,640,000 | | | $ | 2,802,809 | |
Jefferson County AL Series A (GO Revenue) | | | 4.90 | | | | 4-1-2021 | | | | 3,325,000 | | | | 3,557,916 | |
| | | | |
| | | | | | | | | | | | | | | 6,360,725 | |
| | | | | | | | | | | | | | | | |
| | | | |
| Alaska: 0.17% | | | | | | | | | | | | | | | | |
Alaska Railroad Corporation Series A (Miscellaneous Revenue, National Insured) | | | 5.00 | | | | 8-1-2020 | | | | 3,245,000 | | | | 3,399,332 | |
Valdez AK Marine Terminal BP Pipelines Project Series 2003B (Industrial Development Revenue) | | | 5.00 | | | | 1-1-2021 | | | | 1,000,000 | | | | 1,146,670 | |
| | | | |
| | | | | | | | | | | | | | | 4,546,002 | |
| | | | | | | | | | | | | | | | |
| | | | |
| Arizona: 1.50% | | | | | | | | | | | | | | | | |
Arizona Refunding Certificate of Participation (Miscellaneous Revenue) | | | 5.00 | | | | 9-1-2027 | | | | 3,040,000 | | | | 3,852,926 | |
Arizona Sports & Tourism Authority Series A (Tax Revenue) | | | 4.00 | | | | 7-1-2020 | | | | 1,365,000 | | | | 1,490,416 | |
Arizona Sports & Tourism Authority Series A (Tax Revenue) | | | 5.00 | | | | 7-1-2021 | | | | 795,000 | | | | 917,009 | |
Arizona Sports & Tourism Authority Series A (Tax Revenue) | | | 5.00 | | | | 7-1-2022 | | | | 1,000,000 | | | | 1,174,170 | |
Greater Arizona Development Authority Infrastructure Pinal County Road Project Series 1 (Miscellaneous Revenue, National Insured) | | | 4.50 | | | | 8-1-2023 | | | | 2,755,000 | | | | 2,764,450 | |
Maricopa County AZ Elementary School District #28 Kyrene Elementary School Project 2010 Series B (GO Revenue) | | | 4.50 | | | | 7-1-2024 | | | | 1,575,000 | | | | 1,895,544 | |
Maricopa County AZ Elementary School District #28 Kyrene Elementary School Project 2010 Series B (GO Revenue) | | | 4.50 | | | | 7-1-2025 | | | | 1,270,000 | | | | 1,520,990 | |
Maricopa County AZ Elementary School District #28 Kyrene Elementary School Project 2010 Series B (GO Revenue) | | | 5.00 | | | | 7-1-2027 | | | | 420,000 | | | | 522,585 | |
Maricopa County AZ Elementary School District #28 Kyrene Elementary School Project 2010 Series B (GO Revenue) | | | 5.50 | | | | 7-1-2029 | | | | 960,000 | | | | 1,234,243 | |
McAllister AZ Arizona State University Hassayampa Academic Village Project (Education Revenue) %% | | | 5.00 | | | | 7-1-2025 | | | | 750,000 | | | | 957,195 | |
Mohave County AZ Kingman Unified School District #20 (GO Revenue, Build America Mutual Assurance Company Insured) %% | | | 5.00 | | | | 7-1-2024 | | | | 4,000,000 | | | | 4,900,840 | |
Mohave County AZ Kingman Unified School District #20 (GO Revenue, Build America Mutual Assurance Company Insured) %% | | | 5.00 | | | | 7-1-2026 | | | | 1,175,000 | | | | 1,470,936 | |
Phoenix AZ Civic Improvement Corporation Series A (Airport Revenue) | | | 5.00 | | | | 7-1-2029 | | | | 5,000,000 | | | | 5,711,950 | |
Pima County AZ IDA New Plan Learning Project Series A (Education Revenue) | | | 7.00 | | | | 7-1-2021 | | | | 775,000 | | | | 769,219 | |
Pima County AZ IDA New Plan Learning Project Series A (Education Revenue) | | | 7.75 | | | | 7-1-2035 | | | | 5,000,000 | | | | 5,012,250 | |
San Luis AZ Pledged Excise Tax Series A (Tax Revenue, Build America Mutual Assurance Company Insured) | | | 5.00 | | | | 7-1-2027 | | | | 450,000 | | | | 556,128 | |
San Luis AZ Pledged Excise Tax Series A (Tax Revenue, Build America Mutual Assurance Company Insured) | | | 5.00 | | | | 7-1-2028 | | | | 700,000 | | | | 862,449 | |
San Luis AZ Pledged Excise Tax Series A (Tax Revenue, Build America Mutual Assurance Company Insured) | | | 5.00 | | | | 7-1-2034 | | | | 3,680,000 | | | | 4,447,317 | |
| | | | |
| | | | | | | | | | | | | | | 40,060,617 | |
| | | | | | | | | | | | | | | | |
| | | | |
| California: 10.03% | | | | | | | | | | | | | | | | |
Acalanes CA Union High School District Refunding Bonds (GO Revenue) | | | 5.00 | | | | 8-1-2017 | | | | 2,070,000 | | | | 2,169,567 | |
Alameda CA Corridor Transportation Authority CAB Sub Lien Series A (Transportation Revenue, Ambac Insured) ¤ | | | 0.00 | | | | 10-1-2018 | | | | 4,220,000 | | | | 4,141,086 | |
Alameda CA Corridor Transportation Authority CAB Sub Lien Series A (Transportation Revenue, Ambac Insured) ¤ | | | 0.00 | | | | 10-1-2018 | | | | 1,350,000 | | | | 1,310,864 | |
Anaheim CA PFA Convention Center Expansion Project Series A (Miscellaneous Revenue) | | | 5.00 | | | | 5-1-2039 | | | | 2,500,000 | | | | 3,053,575 | |
| | | | |
| 2 | | Wells Fargo Intermediate Tax/AMT-Free Fund | | Portfolio of investments—June 30, 2016 |
| | | | | | | | | | | | | | | | |
| Security name | | Interest rate | | | Maturity date | | | Principal | | | Value | |
| | | | |
| California (continued) | | | | | | | | | | | | | | | | |
Bay Area CA Toll Authority Series A (Transportation Revenue) ± | | | 1.66 | % | | | 4-1-2036 | | | $ | 20,000,000 | | | $ | 19,757,800 | |
California (GO Revenue) | | | 5.25 | | | | 3-1-2024 | | | | 5,000,000 | | | | 5,816,750 | |
California (GO Revenue) | | | 5.25 | | | | 3-1-2030 | | | | 1,440,000 | | | | 1,673,525 | |
California (GO Revenue) | | | 6.00 | | | | 3-1-2033 | | | | 2,510,000 | | | | 2,979,998 | |
California Municipal Finance Authority (Utilities Revenue) | | | 5.00 | | | | 10-1-2025 | | | | 1,500,000 | | | | 1,970,115 | |
California PFOTER Series DCL-009 (GO Revenue, Dexia Credit Local LOC, AGM Insured) 144Aø | | | 0.59 | | | | 8-1-2027 | | | | 14,975,000 | | | | 14,975,000 | |
California PFOTER Series DCL-010 (GO Revenue, Dexia Credit Local LOC, AGM Insured) 144Aø | | | 0.59 | | | | 8-1-2027 | | | | 7,825,000 | | | | 7,825,000 | |
California PFOTER Series DCL-011 (GO Revenue, Dexia Credit Local LOC, AGM Insured) 144Aø | | | 0.59 | | | | 8-1-2027 | | | | 5,975,000 | | | | 5,975,000 | |
California Public Works Board Department of Corrections Project Series A (Miscellaneous Revenue, Ambac Insured) | | | 5.00 | | | | 12-1-2019 | | | | 1,990,000 | | | | 2,142,971 | |
California Public Works Board Department of General Services Buildings 8 & 9A (Miscellaneous Revenue) | | | 6.25 | | | | 4-1-2034 | | | | 2,750,000 | | | | 3,192,035 | |
California Public Works Board Various Judicial Council Project Series D (Miscellaneous Revenue) | | | 5.25 | | | | 12-1-2026 | | | | 1,000,000 | | | | 1,211,880 | |
California Public Works University of California Board of Regents Series G (Miscellaneous Revenue) | | | 5.00 | | | | 12-1-2030 | | | | 12,110,000 | | | | 14,668,480 | |
California Statewide CDA Series A (Education Revenue) | | | 6.90 | | | | 8-1-2031 | | | | 1,915,000 | | | | 2,221,477 | |
California Statewide CDA Series C (Health Revenue) | | | 5.25 | | | | 8-15-2031 | | | | 3,000,000 | | | | 3,582,360 | |
California Various Purposes (GO Revenue) | | | 6.00 | | | | 4-1-2038 | | | | 8,055,000 | | | | 9,189,547 | |
Cerritos CA Community College District Series D (GO Revenue) ¤ | | | 0.00 | | | | 8-1-2025 | | | | 1,800,000 | | | | 1,482,804 | |
Chino Basin CA Desalter Authority Series A (Water & Sewer Revenue) %% | | | 4.00 | | | | 6-1-2028 | | | | 2,000,000 | | | | 2,375,380 | |
Compton CA Community College District Election of 2002 CAB Series C (GO Revenue) ¤ | | | 0.00 | | | | 8-1-2029 | | | | 1,565,000 | | | | 1,022,508 | |
Compton CA Community College District Election of 2002 CAB Series C (GO Revenue) ¤ | | | 0.00 | | | | 8-1-2031 | | | | 2,400,000 | | | | 1,417,728 | |
El Monte CA Union High School District (GO Revenue) | | | 5.00 | | | | 6-1-2019 | | | | 1,490,000 | | | | 1,671,363 | |
El Monte CA Union High School District (GO Revenue) | | | 5.00 | | | | 6-1-2020 | | | | 2,000,000 | | | | 2,314,580 | |
Emery CA Unified School District Election of 2010 Series A (GO Revenue, AGM Insured) | | | 6.25 | | | | 8-1-2031 | | | | 4,500,000 | | | | 5,605,560 | |
M-S-R California Energy Authority Gas Series B (Utilities Revenue) | | | 7.00 | | | | 11-1-2034 | | | | 2,000,000 | | | | 3,118,100 | |
M-S-R California Energy Authority Gas Series C (Utilities Revenue) | | | 7.00 | | | | 11-1-2034 | | | | 3,000,000 | | | | 4,677,150 | |
New Haven CA Unified School District CAB Project (GO Revenue, AGC Insured) ¤ | | | 0.00 | | | | 8-1-2033 | | | | 5,590,000 | | | | 3,424,546 | |
Northern California Gas Authority #1 LIBOR Series B (Utilities Revenue) ± | | | 1.14 | | | | 7-1-2027 | | | | 10,000,000 | | | | 9,123,100 | |
Northern California Power Agency Series A (Utilities Revenue) | | | 5.25 | | | | 8-1-2023 | | | | 5,150,000 | | | | 5,931,873 | |
Northern Humboldt CA High School District Election of 2010 Series A (GO Revenue) | | | 6.50 | | | | 8-1-2034 | | | | 1,145,000 | | | | 1,439,025 | |
Oakland CA Unified School District Alameda County Election of 2006 Series A (GO Revenue) | | | 6.50 | | | | 8-1-2020 | | | | 1,730,000 | | | | 1,998,859 | |
Oakland CA Unified School District Alameda County Election of 2009 Series A (GO Revenue) | | | 6.25 | | | | 8-1-2019 | | | | 1,285,000 | | | | 1,468,871 | |
Oakland CA Unified School District Alameda County Election of 2012 (GO Revenue) | | | 6.25 | | | | 8-1-2028 | | | | 2,000,000 | | | | 2,451,860 | |
Oakland CA Unified School District Alameda County Election of 2012 (GO Revenue) | | | 6.25 | | | | 8-1-2030 | | | | 2,000,000 | | | | 2,435,120 | |
Oxnard CA School District Series A (GO Revenue, National Insured) | | | 5.75 | | | | 8-1-2030 | | | | 1,825,000 | | | | 2,287,583 | |
Pasadena CA PFA Rose Bowl Renovation Series A (Miscellaneous Revenue) | | | 5.00 | | | | 3-1-2021 | | | | 1,655,000 | | | | 1,940,322 | |
Patterson CA Unified School District CAB Election of 2008 Project Series B (GO Revenue, AGM Insured) ¤ | | | 0.00 | | | | 8-1-2033 | | | | 3,000,000 | | | | 1,788,570 | |
Peralta CA Community College District Alameda County (GO Revenue) | | | 5.00 | | | | 8-1-2023 | | | | 3,045,000 | | | | 3,782,255 | |
Peralta CA Community College District Alameda County (GO Revenue) | | | 5.00 | | | | 8-1-2024 | | | | 3,000,000 | | | | 3,712,980 | |
Richmond CA Joint Powers Financing Authority Point Potrero Series A (Miscellaneous Revenue) | | | 6.25 | | | | 7-1-2024 | | | | 2,700,000 | | | | 3,094,929 | |
| | | | | | |
| Portfolio of investments—June 30, 2016 | | Wells Fargo Intermediate Tax/AMT-Free Fund | | | 3 | |
| | | | | | | | | | | | | | | | |
| Security name | | Interest rate | | | Maturity date | | | Principal | | | Value | |
| | | | |
| California (continued) | | | | | | | | | | | | | | | | |
Rio Hondo CA Community College District (GO Revenue) ¤ | | | 0.00 | % | | | 8-1-2030 | | | $ | 2,315,000 | | | $ | 1,547,462 | |
Sacramento CA Airport Systems (Airport Revenue) | | | 5.00 | | | | 7-1-2025 | | | | 2,000,000 | | | | 2,290,240 | |
Sacramento CA Municipal Utility District Series B (Utilities Revenue) | | | 5.00 | | | | 8-15-2030 | | | | 1,075,000 | | | | 1,331,613 | |
San Diego CA Community College District Election of 2012 (GO Revenue) | | | 5.00 | | | | 8-1-2032 | | | | 3,095,000 | | | | 3,839,378 | |
San Diego CA PFFA Capital Improvement Projects Series B (Miscellaneous Revenue) | | | 5.00 | | | | 10-15-2027 | | | | 500,000 | | | | 638,420 | |
San Diego CA PFFA Capital Improvement Projects Series B (Miscellaneous Revenue) | | | 5.00 | | | | 10-15-2028 | | | | 1,000,000 | | | | 1,272,490 | |
San Diego CA Unified School District Election of 1998 Series E-2 (GO Revenue, AGM Insured) | | | 5.50 | | | | 7-1-2027 | | | | 5,000,000 | | | | 6,857,250 | |
San Gorgonio CA Memorial Healthcare District (GO Revenue) | | | 7.00 | | | | 8-1-2029 | | | | 2,000,000 | | | | 2,140,620 | |
San Jose CA Libraries & Parks Project (GO Revenue) | | | 5.13 | | | | 9-1-2031 | | | | 6,110,000 | | | | 6,134,746 | |
San Jose CA MFHR Casa Del Pueblo Apartments Project Series D (Housing Revenue) ± | | | 0.95 | | | | 12-1-2017 | | | | 10,000,000 | | | | 10,003,100 | |
San Jose CA Redevelopment Agency Series A-1 (Tax Revenue) | | | 5.50 | | | | 8-1-2030 | | | | 1,355,000 | | | | 1,560,052 | |
Santa Ana CA Financing Authority Police Administration and Holding Facilities Prerefunded Balance (Miscellaneous Revenue, National Insured) | | | 6.25 | | | | 7-1-2019 | | | | 500,000 | | | | 579,075 | |
Santa Ana CA Financing Authority Police Administration and Holding Facilities Unrefunded Balance (Miscellaneous Revenue, National Insured) | | | 6.25 | | | | 7-1-2019 | | | | 500,000 | | | | 574,730 | |
Southern California Public Power Authority Milford Wind Corridor Project #1 (Utilities Revenue) | | | 5.00 | | | | 7-1-2024 | | | | 5,000,000 | | | | 5,698,800 | |
Southern California Public Power Authority Southern Transmission Project Series S (Utilities Revenue) | | | 5.75 | | | | 7-1-2024 | | | | 2,000,000 | | | | 2,205,600 | |
Sylvan CA Unified School District CAB Election of 2006 (GO Revenue, AGM Insured) ¤ | | | 0.00 | | | | 8-1-2031 | | | | 2,590,000 | | | | 1,672,518 | |
Sylvan CA Unified School District CAB Election of 2006 (GO Revenue, AGM Insured) ¤ | | | 0.00 | | | | 8-1-2032 | | | | 2,800,000 | | | | 1,756,468 | |
Tustin CA Unified School District #88-1 Election of 2008 Series B (GO Revenue) | | | 6.00 | | | | 8-1-2036 | | | | 1,500,000 | | | | 1,878,330 | |
University of California Limited Project Series G (Education Revenue) | | | 5.00 | | | | 5-15-2037 | | | | 10,390,000 | | | | 12,274,019 | |
University of California Medical Center Series J (Health Revenue) | | | 5.25 | | | | 5-15-2030 | | | | 15,000,000 | | | | 18,427,800 | |
University of California Prerefunded Series Q (Education Revenue) | | | 5.25 | | | | 5-15-2024 | | | | 2,090,000 | | | | 2,197,029 | |
University of California Unrefunded Series Q (Education Revenue) | | | 5.25 | | | | 5-15-2024 | | | | 65,000 | | | | 68,347 | |
Washington Township CA Health Care District Series A (Health Revenue) | | | 5.00 | | | | 7-1-2016 | | | | 300,000 | | | | 300,036 | |
Washington Township CA Health Care District Series A (Health Revenue) | | | 5.00 | | | | 7-1-2018 | | | | 445,000 | | | | 478,273 | |
Washington Township CA Health Care District Series A (Health Revenue) | | | 5.00 | | | | 7-1-2019 | | | | 905,000 | | | | 1,003,012 | |
Washington Township CA Health Care District Series A (Health Revenue) | | | 5.00 | | | | 7-1-2020 | | | | 1,300,000 | | | | 1,350,960 | |
Washington Township CA Health Care District Series A (Health Revenue) | | | 5.13 | | | | 7-1-2017 | | | | 260,000 | | | | 270,356 | |
West Contra Costa California Unified School District Election of 2005 Series C-1 (GO Revenue, AGC Insured) ¤ | | | 0.00 | | | | 8-1-2026 | | | | 4,620,000 | | | | 3,660,149 | |
| | | | |
| | | | | | | | | | | | | | | 268,432,969 | |
| | | | | | | | | | | | | | | | |
| | | | |
| Colorado: 0.80% | | | | | | | | | | | | | | | | |
Adams County CO Refunding & Improvement Certificate of Participation (Miscellaneous Revenue) | | | 4.00 | | | | 12-1-2018 | | | | 500,000 | | | | 537,820 | |
Adams County CO Refunding & Improvement Certificate of Participation (Miscellaneous Revenue) | | | 5.00 | | | | 12-1-2021 | | | | 830,000 | | | | 993,552 | |
Colorado ECFA Charter School Monument Academy Project Series A (Education Revenue) | | | 5.50 | | | | 10-1-2017 | | | | 400,000 | | | | 412,732 | |
Colorado ECFA University of Denver Project (Education Revenue, National Insured) | | | 5.25 | | | | 3-1-2025 | | | | 1,110,000 | | | | 1,399,688 | |
Colorado Springs CO Utilities System Sub Lien Improvement Series B (Utilities Revenue, Bayerische Landesbank SPA) ø | | | 0.56 | | | | 11-1-2036 | | | | 12,000,000 | | | | 12,000,000 | |
Regents of the University of Colorado Certificate of Participation Series 2013A (Education Revenue) | | | 5.00 | | | | 11-1-2028 | | | | 5,000,000 | | | | 6,109,550 | |
| | | | |
| | | | | | | | | | | | | | | 21,453,342 | |
| | | | | | | | | | | | | | | | |
| | | | |
| 4 | | Wells Fargo Intermediate Tax/AMT-Free Fund | | Portfolio of investments—June 30, 2016 |
| | | | | | | | | | | | | | | | |
| Security name | | Interest rate | | | Maturity date | | | Principal | | | Value | |
| | | | |
| Connecticut: 3.00% | | | | | | | | | | | | | | | | |
Connecticut Health & HEFAR Yale University Issue Series A (Education Revenue) ± | | | 1.38 | % | | | 7-1-2035 | | | $ | 10,000,000 | | | $ | 10,119,300 | |
Connecticut HEFA Yale University Series A (Education Revenue) ±%% | | | 1.00 | | | | 7-1-2042 | | | | 25,000,000 | | | | 25,072,500 | |
Connecticut Series A (Miscellaneous Revenue) ± | | | 1.26 | | | | 3-1-2022 | | | | 3,000,000 | | | | 2,967,060 | |
Connecticut Series A (Miscellaneous Revenue) ± | | | 1.31 | | | | 3-1-2023 | | | | 3,000,000 | | | | 2,952,840 | |
Connecticut Series A (Miscellaneous Revenue) ± | | | 1.36 | | | | 3-1-2024 | | | | 5,640,000 | | | | 5,520,094 | |
Connecticut Series A (Miscellaneous Revenue) ± | | | 1.51 | | | | 4-15-2019 | | | | 2,300,000 | | | | 2,313,662 | |
Connecticut Series A (Miscellaneous Revenue) ± | | | 1.66 | | | | 4-15-2020 | | | | 3,300,000 | | | | 3,333,759 | |
Connecticut Special Tax Obligation Bonds Transportation Infrastructure Purposes Series A (Tax Revenue) | | | 5.00 | | | | 8-1-2028 | | | | 2,000,000 | | | | 2,526,240 | |
Connecticut Special Tax Obligation Bonds Transportation Infrastructure Purposes Series A (Tax Revenue) | | | 5.00 | | | | 8-1-2030 | | | | 1,000,000 | | | | 1,253,770 | |
Hamden CT (GO Revenue) | | | 4.00 | | | | 8-15-2020 | | | | 1,235,000 | | | | 1,346,792 | |
Hamden CT (GO Revenue) | | | 4.00 | | | | 8-15-2021 | | | | 1,235,000 | | | | 1,362,662 | |
Hamden CT (GO Revenue, AGM Insured) | | | 5.00 | | | | 8-15-2021 | | | | 1,000,000 | | | | 1,171,760 | |
Hamden CT (GO Revenue, AGM Insured) | | | 5.00 | | | | 8-15-2022 | | | | 1,000,000 | | | | 1,194,640 | |
Hartford CT Series A (GO Revenue, AGM Insured) | | | 5.00 | | | | 4-1-2022 | | | | 3,010,000 | | | | 3,539,068 | |
Hartford CT Series A (GO Revenue, AGM Insured) | | | 5.00 | | | | 7-1-2026 | | | | 1,000,000 | | | | 1,228,950 | |
Hartford CT Series A (GO Revenue, AGM Insured) | | | 5.00 | | | | 7-1-2028 | | | | 1,265,000 | | | | 1,557,506 | |
Hartford CT Series C (GO Revenue, AGM Insured) | | | 5.00 | | | | 7-15-2022 | | | | 2,320,000 | | | | 2,743,446 | |
University of Connecticut Series A (Education Revenue) | | | 5.00 | | | | 3-15-2027 | | | | 1,000,000 | | | | 1,264,700 | |
University of Connecticut Series A (Education Revenue) | | | 5.00 | | | | 3-15-2028 | | | | 2,000,000 | | | | 2,516,120 | |
University of Connecticut Series A (Education Revenue) | | | 5.00 | | | | 3-15-2031 | | | | 3,000,000 | | | | 3,739,500 | |
University of Connecticut Series A (Education Revenue) | | | 5.00 | | | | 3-15-2032 | | | | 2,000,000 | | | | 2,481,140 | |
| | | | |
| | | | | | | | | | | | | | | 80,205,509 | |
| | | | | | | | | | | | | | | | |
| | | | |
| Delaware: 0.08% | | | | | | | | | | | | | | | | |
Delaware EDA Odyssey Charter School Project Series B (Education Revenue) 144A | | | 6.75 | | | | 9-1-2035 | | | | 2,000,000 | | | | 2,069,980 | |
| | | | | | | | | | | | | | | | |
| | | | |
| District of Columbia: 0.56% | | | | | | | | | | | | | | | | |
District of Columbia Federal Highway Grant Anticipation Bonds (Miscellaneous Revenue) | | | 5.00 | | | | 12-1-2023 | | | | 1,000,000 | | | | 1,211,210 | |
District of Columbia Federal Highway Grant Anticipation Bonds (Miscellaneous Revenue) | | | 5.00 | | | | 12-1-2025 | | | | 3,520,000 | | | | 4,279,475 | |
District of Columbia Federal Highway Grant Anticipation Bonds (Miscellaneous Revenue) | | | 5.25 | | | | 12-1-2025 | | | | 2,630,000 | | | | 3,094,563 | |
District of Columbia Howard University Series A (Education Revenue) | | | 5.75 | | | | 10-1-2026 | | | | 2,510,000 | | | | 2,671,418 | |
District of Columbia Medical Association of Colleges Series B (Miscellaneous Revenue) | | | 5.00 | | | | 10-1-2024 | | | | 3,095,000 | | | | 3,606,077 | |
| | | | |
| | | | | | | | | | | | | | | 14,862,743 | |
| | | | | | | | | | | | | | | | |
| | | | |
| Florida: 4.85% | | | | | | | | | | | | | | | | |
Boynton Beach FL Utilities Systems (Water & Sewer Revenue, National Insured) | | | 5.50 | | | | 11-1-2016 | | | | 1,500,000 | | | | 1,523,340 | |
Broward County FL School Board Certificate of Participation Series A (Miscellaneous Revenue) | | | 5.00 | | | | 7-1-2024 | | | | 5,000,000 | | | | 6,259,500 | |
Cityplace Florida Community Development District Special Assessment (Miscellaneous Revenue) | | | 5.00 | | | | 5-1-2021 | | | | 2,945,000 | | | | 3,323,698 | |
Daytona Beach FL Utility System (Water & Sewer Revenue, AGM Insured) | | | 5.00 | | | | 11-1-2022 | | | | 2,205,000 | | | | 2,691,599 | |
Duval County FL School Board Certificate of Participation Series B (Miscellaneous Revenue) | | | 5.00 | | | | 7-1-2028 | | | | 2,500,000 | | | | 3,111,625 | |
Duval County FL School Board Certificate of Participation Series B (Miscellaneous Revenue) | | | 5.00 | | | | 7-1-2029 | | | | 5,000,000 | | | | 6,197,700 | |
| | | | | | |
| Portfolio of investments—June 30, 2016 | | Wells Fargo Intermediate Tax/AMT-Free Fund | | | 5 | |
| | | | | | | | | | | | | | | | |
| Security name | | Interest rate | | | Maturity date | | | Principal | | | Value | |
| | | | |
| Florida (continued) | | | | | | | | | | | | | | | | |
Florida Department of Transportation Turnpike System Series A (Transportation Revenue) | | | 5.00 | % | | | 7-1-2023 | | | $ | 3,910,000 | | | $ | 4,873,932 | |
Florida Department of Transportation Turnpike System Series A (Transportation Revenue) | | | 5.00 | | | | 7-1-2025 | | | | 4,950,000 | | | | 6,372,729 | |
Florida Development Finance Corporation Renaissance Charter School Series A (Education Revenue) | | | 5.00 | | | | 9-15-2020 | | | | 1,855,000 | | | | 1,950,291 | |
Florida HEFAR (Education Revenue) | | | 4.00 | | | | 4-1-2021 | | | | 1,000,000 | | | | 1,115,480 | |
Florida Mid-Bay Bridge Authority Series A (Transportation Revenue) | | | 5.00 | | | | 10-1-2025 | | | | 1,250,000 | | | | 1,556,625 | |
Gulf Breeze FL Capital Funding Loan Program Series A (Miscellaneous Revenue, AGM Insured) | | | 5.00 | | | | 10-1-2017 | | | | 1,665,000 | | | | 1,751,330 | |
Gulf Breeze FL Capital Funding Loan Program Series B (Miscellaneous Revenue, AGM Insured) | | | 4.00 | | | | 10-1-2016 | | | | 1,000,000 | | | | 1,008,510 | |
Gulf Breeze FL Capital Funding Loan Program Series B (Miscellaneous Revenue, AGM Insured) | | | 4.00 | | | | 10-1-2017 | | | | 1,000,000 | | | | 1,039,410 | |
Gulf Breeze FL Local Government Loan Series J (Water & Sewer Revenue) ± | | | 4.10 | | | | 12-1-2020 | | | | 3,000,000 | | | | 3,042,090 | |
Gulf Breeze FL Local Government Loan Series J (Water & Sewer Revenue) ± | | | 4.20 | | | | 12-1-2020 | | | | 3,290,000 | | | | 3,441,735 | |
Hernando County FL School Board Florida Master Lease Program Certificate of Participation Series A (Miscellaneous Revenue, AGM Insured) | | | 5.00 | | | | 7-1-2025 | | | | 2,065,000 | | | | 2,610,986 | |
Miami-Dade County FL Public Services (Tax Revenue, AGM Insured) | | | 4.00 | | | | 10-1-2019 | | | | 3,440,000 | | | | 3,772,338 | |
Miami-Dade County FL Public Services (Tax Revenue, AGM Insured) | | | 4.00 | | | | 10-1-2020 | | | | 3,600,000 | | | | 4,021,380 | |
Miami-Dade County FL Public Services (Tax Revenue, AGM Insured) | | | 4.00 | | | | 4-1-2021 | | | | 2,485,000 | | | | 2,788,965 | |
Miami-Dade County FL School Board Certificate of Participation Series 4 (Miscellaneous Revenue, Dexia Credit Local LOC, Dexia Credit Local LIQ) 144Aø | | | 0.79 | | | | 9-25-2024 | | | | 12,705,000 | | | | 12,705,000 | |
Miami-Dade County FL School Board Certificate of Participation Series A (Miscellaneous Revenue) ± | | | 5.00 | | | | 5-1-2031 | | | | 3,000,000 | | | | 3,692,100 | |
Miami-Dade County FL School Board Certificate of Participation Series D (Miscellaneous Revenue) | | | 5.00 | | | | 11-1-2027 | | | | 6,600,000 | | | | 8,143,476 | |
Miami-Dade County FL Special Obligation Series A (Tax Revenue) | | | 5.00 | | | | 10-1-2023 | | | | 700,000 | | | | 848,953 | |
Miami-Dade County FL Water & Sewer Refunding Bond Series C (Water & Sewer Revenue, BHAC Insured) | | | 5.00 | | | | 10-1-2024 | | | | 2,950,000 | | | | 3,233,348 | |
Miami-Dade County FL Water & Sewer Refunding Bond Series C (Water & Sewer Revenue) | | | 5.25 | | | | 10-1-2022 | | | | 3,000,000 | | | | 3,304,890 | |
Orange County FL Health Facilities Authority Lakeside Health Facility (Health Revenue, SunTrust Bank LOC) ø | | | 0.48 | | | | 7-1-2027 | | | | 7,235,000 | | | | 7,235,000 | |
Orange County FL School Board Certificates Partner Series A (Miscellaneous Revenue, National Insured) | | | 5.00 | | | | 8-1-2016 | | | | 1,000,000 | | | | 1,003,920 | |
Putnam County FL Development Authority PCR Seminole Project Series A (Utilities Revenue, Ambac Insured) ± | | | 5.35 | | | | 3-15-2042 | | | | 5,260,000 | | | | 5,660,865 | |
Reedy Creek FL Improvement District Series A (GO Revenue) %% | | | 5.00 | | | | 6-1-2027 | | | | 2,800,000 | | | | 3,613,568 | |
Reedy Creek FL Improvement District Series A (GO Revenue) %% | | | 5.00 | | | | 6-1-2035 | | | | 4,675,000 | | | | 5,824,302 | |
Seminole Tribe of Florida Special Obligation Series A (Miscellaneous Revenue) 144A | | | 5.50 | | | | 10-1-2024 | | | | 2,500,000 | | | | 2,607,650 | |
South Lake County FL Hospital District South Lake Hospital Incorporated (Health Revenue) | | | 5.00 | | | | 10-1-2016 | | | | 1,015,000 | | | | 1,025,008 | |
South Lake County FL Hospital District South Lake Hospital Incorporated (Health Revenue) | | | 5.00 | | | | 10-1-2017 | | | | 900,000 | | | | 939,789 | |
Tampa FL Sports Authority Stadium Project (Tax Revenue) | | | 5.00 | | | | 1-1-2025 | | | | 3,395,000 | | | | 4,352,730 | |
University of South Florida Financing Corporation Certificate of Participation Master Lease Program Series A (Education Revenue) | | | 5.00 | | | | 7-1-2022 | | | | 1,730,000 | | | | 2,061,589 | |
University of South Florida Financing Corporation Certificate of Participation Master Lease Program Series A (Education Revenue) | | | 5.00 | | | | 7-1-2023 | | | | 815,000 | | | | 988,571 | |
| | | | |
| | | | | | | | | | | | | | | 129,694,022 | |
| | | | | | | | | | | | | | | | |
| | | | |
| 6 | | Wells Fargo Intermediate Tax/AMT-Free Fund | | Portfolio of investments—June 30, 2016 |
| | | | | | | | | | | | | | | | |
| Security name | | Interest rate | | | Maturity date | | | Principal | | | Value | |
| | | | |
| Georgia: 0.94% | | | | | | | | | | | | | | | | |
Columbus GA Refunding Bond (Water & Sewer Revenue) | | | 5.00 | % | | | 5-1-2033 | | | $ | 950,000 | | | $ | 1,213,055 | |
Columbus GA Refunding Bond (Water & Sewer Revenue) | | | 5.00 | | | | 5-1-2035 | | | | 1,200,000 | | | | 1,521,192 | |
Floyd County GA PCR Georgia Power Company Plant Hammond Project (Utilities Revenue) ± | | | 2.35 | | | | 7-1-2022 | | | | 1,000,000 | | | | 1,041,550 | |
Georgia Public Gas Partners Incorporated Series A (Utilities Revenue) | | | 5.00 | | | | 10-1-2017 | | | | 2,500,000 | | | | 2,634,300 | |
Georgia Public Gas Partners Incorporated Series A (Utilities Revenue) | | | 5.00 | | | | 10-1-2019 | | | | 5,000,000 | | | | 5,653,000 | |
Main Street Natural Gas Incorporated Georgia Gas Project Series A (Utilities Revenue) | | | 5.50 | | | | 9-15-2022 | | | | 1,000,000 | | | | 1,198,830 | |
Monroe County GA PCR Georgia Power Company Plant Scherer Project (Industrial Development Revenue) ± | | | 2.35 | | | | 10-1-2048 | | | | 2,000,000 | | | | 2,083,100 | |
Private Colleges & Universities Authority of Georgia Series A (Education Revenue) | | | 5.00 | | | | 10-1-2021 | | | | 3,330,000 | | | | 3,878,051 | |
Savannah GA MFHR Wessels/Blackshear Home Project (Housing Revenue) ± | | | 1.15 | | | | 7-1-2019 | | | | 6,000,000 | | | | 5,996,460 | |
| | | | |
| | | | | | | | | | | | | | | 25,219,538 | |
| | | | | | | | | | | | | | | | |
| | | | |
| Guam: 0.42% | | | | | | | | | | | | | | | | |
Guam Education Financing Foundation Certificate of Participation Guam Public School Facilities Project Series A (Miscellaneous Revenue) | | | 5.00 | | | | 10-1-2017 | | | | 2,195,000 | | | | 2,215,787 | |
Guam Government Business Privilege Tax Bond Series A (Tax Revenue) | | | 5.00 | | | | 1-1-2020 | | | | 1,215,000 | | | | 1,372,014 | |
Guam Government Waterworks Authority (Water & Sewer Revenue) | | | 5.00 | | | | 7-1-2028 | | | | 1,000,000 | | | | 1,179,390 | |
Guam Government Waterworks Authority (Water & Sewer Revenue) | | | 5.25 | | | | 7-1-2020 | | | | 350,000 | | | | 401,100 | |
Guam Government Waterworks Authority (Water & Sewer Revenue) | | | 5.25 | | | | 7-1-2033 | | | | 2,500,000 | | | | 2,969,175 | |
Guam International Airport Authority (Airport Revenue) | | | 5.00 | | | | 10-1-2022 | | | | 1,000,000 | | | | 1,192,330 | |
Guam International Airport Authority (Airport Revenue) | | | 5.00 | | | | 10-1-2023 | | | | 1,500,000 | | | | 1,809,105 | |
| | | | |
| | | | | | | | | | | | | | | 11,138,901 | |
| | | | | | | | | | | | | | | | |
| | | | |
| Illinois: 16.32% | | | | | | | | | | | | | | | | |
Bolingbrook, Will & DuPage Counties IL Series A (GO Revenue, AGM Insured) | | | 5.00 | | | | 1-1-2023 | | | | 650,000 | | | | 777,101 | |
Champaign & Coles Counties IL Community College District #505 Series A (GO Revenue) | | | 4.00 | | | | 12-1-2018 | | | | 1,015,000 | | | | 1,087,684 | |
Chicago IL Board of Education CAB School Reform Series B-1 (GO Revenue, National Insured) ¤ | | | 0.00 | | | | 12-1-2021 | | | | 1,000,000 | | | | 840,140 | |
Chicago IL Board of Education CAB School Reform Series B-1 (GO Revenue, National Insured) ¤ | | | 0.00 | | | | 12-1-2025 | | | | 3,380,000 | | | | 2,394,460 | |
Chicago IL Board of Education CAB School Reform Series B-1 (GO Revenue, National Insured) ¤ | | | 0.00 | | | | 12-1-2026 | | | | 4,030,000 | | | | 2,718,960 | |
Chicago IL Board of Education School Reform Series A (GO Revenue, National/FGIC Insured) | | | 5.25 | | | | 12-1-2023 | | | | 5,125,000 | | | | 5,777,771 | |
Chicago IL Board of Education Series A3 (GO Revenue) ± | | | 1.23 | | | | 3-1-2036 | | | | 10,000,000 | | | | 8,762,200 | |
Chicago IL Board of Education Series B (GO Revenue, Ambac Insured) | | | 5.00 | | | | 12-1-2021 | | | | 7,760,000 | | | | 7,778,779 | |
Chicago IL Board of Education Series C (GO Revenue) | | | 5.00 | | | | 12-1-2021 | | | | 2,500,000 | | | | 2,349,975 | |
Chicago IL Board of Education Series C (GO Revenue) | | | 5.00 | | | | 12-1-2029 | | | | 3,000,000 | | | | 2,697,870 | |
Chicago IL Board of Education Series C (GO Revenue) | | | 5.25 | | | | 12-1-2025 | | | | 5,000,000 | | | | 4,599,950 | |
Chicago IL Board of Education Series F (GO Revenue) | | | 5.00 | | | | 12-1-2020 | | | | 2,375,000 | | | | 2,256,226 | |
Chicago IL CAB Series A (GO Revenue, National Insured) | | | 5.44 | | | | 1-1-2018 | | | | 1,725,000 | | | | 1,748,736 | |
Chicago IL Metropolitan Reclamation Series B (GO Revenue) | | | 5.00 | | | | 12-1-2025 | | | | 2,500,000 | | | | 2,945,450 | |
Chicago IL O’Hare International Airport Senior Lien (Airport Revenue, AGM Insured) | | | 5.13 | | | | 1-1-2030 | | | | 2,610,000 | | | | 3,142,962 | |
Chicago IL O’Hare International Airport Senior Lien (Airport Revenue, AGM Insured) | | | 5.13 | | | | 1-1-2031 | | | | 3,335,000 | | | | 4,006,936 | |
Chicago IL O’Hare International Airport Senior Lien (Airport Revenue) | | | 5.25 | | | | 1-1-2032 | | | | 8,755,000 | | | | 10,588,822 | |
Chicago IL O’Hare International Airport Senior Lien Series B (Airport Revenue) | | | 5.00 | | | | 1-1-2030 | | | | 8,000,000 | | | | 9,825,920 | |
Chicago IL O’Hare International Airport Third Lien Series A (Airport Revenue, AGM Insured) | | | 5.00 | | | | 1-1-2033 | | | | 1,000,000 | | | | 1,055,040 | |
| | | | | | |
| Portfolio of investments—June 30, 2016 | | Wells Fargo Intermediate Tax/AMT-Free Fund | | | 7 | |
| | | | | | | | | | | | | | | | |
| Security name | | Interest rate | | | Maturity date | | | Principal | | | Value | |
| | | | |
| Illinois (continued) | | | | | | | | | | | | | | | | |
Chicago IL O’Hare International Airport Third Lien Series C (Airport Revenue, AGC Insured) | | | 5.25 | % | | | 1-1-2025 | | | $ | 4,075,000 | | | $ | 4,619,950 | |
Chicago IL O’Hare International Airport Third Lien Series F (Airport Revenue) | | | 4.25 | | | | 1-1-2021 | | | | 735,000 | | | | 810,874 | |
Chicago IL Park District Series A (GO Revenue) | | | 5.00 | | | | 1-1-2036 | | | | 2,150,000 | | | | 2,354,057 | |
Chicago IL Park District Series B (GO Revenue) | | | 5.00 | | | | 1-1-2021 | | | | 3,765,000 | | | | 4,273,388 | |
Chicago IL Park District Series C (GO Revenue) | | | 5.00 | | | | 1-1-2022 | | | | 1,515,000 | | | | 1,743,038 | |
Chicago IL Public Building Commission School Reform (Miscellaneous Revenue, National Insured) | | | 5.25 | | | | 12-1-2017 | | | | 3,555,000 | | | | 3,679,318 | |
Chicago IL Sales Tax Refunding Bond (Tax Revenue) | | | 5.00 | | | | 1-1-2025 | | | | 615,000 | | | | 657,933 | |
Chicago IL Sales Tax Refunding Bond (Tax Revenue) | | | 5.00 | | | | 1-1-2026 | | | | 5,140,000 | | | | 5,923,130 | |
Chicago IL Sales Tax Refunding Bond (Tax Revenue) | | | 5.00 | | | | 1-1-2027 | | | | 3,000,000 | | | | 3,440,070 | |
Chicago IL Sales Tax Refunding Bond (Tax Revenue) | | | 5.00 | | | | 1-1-2030 | | | | 2,075,000 | | | | 2,310,264 | |
Chicago IL Second Lien (Water & Sewer Revenue) | | | 5.00 | | | | 11-1-2022 | | | | 1,730,000 | | | | 2,031,920 | |
Chicago IL Second Lien (Water & Sewer Revenue) | | | 5.00 | | | | 11-1-2023 | | | | 1,155,000 | | | | 1,351,708 | |
Chicago IL Second Lien (Water & Sewer Revenue) | | | 5.00 | | | | 11-1-2025 | | | | 500,000 | | | | 582,415 | |
Chicago IL Second Lien (Water & Sewer Revenue) | | | 5.00 | | | | 11-1-2026 | | | | 2,000,000 | | | | 2,325,800 | |
Chicago IL Second Lien (Water & Sewer Revenue) | | | 5.00 | | | | 11-1-2028 | | | | 3,000,000 | | | | 3,455,820 | |
Chicago IL Second Lien (Water & Sewer Revenue) | | | 5.00 | | | | 11-1-2029 | | | | 1,490,000 | | | | 1,713,247 | |
Chicago IL Second Lien (Water & Sewer Revenue) | | | 5.00 | | | | 11-1-2033 | | | | 1,000,000 | | | | 1,171,440 | |
Chicago IL Second Lien Series A (Water & Sewer Revenue, Ambac Insured) | | | 5.00 | | | | 11-1-2032 | | | | 10,000,000 | | | | 10,138,500 | |
Chicago IL Series A (GO Revenue, Ambac Insured) | | | 5.00 | | | | 1-1-2019 | | | | 2,500,000 | | | | 2,540,500 | |
Chicago IL Series A (GO Revenue) | | | 5.00 | | | | 1-1-2025 | | | | 750,000 | | | | 764,565 | |
Chicago IL Series A (GO Revenue) | | | 5.00 | | | | 1-1-2027 | | | | 1,000,000 | | | | 1,011,850 | |
Chicago IL Series A (GO Revenue) | | | 5.25 | | | | 1-1-2022 | | | | 4,020,000 | | | | 4,104,380 | |
Chicago IL Series A (GO Revenue) | | | 5.25 | | | | 1-1-2023 | | | | 4,475,000 | | | | 4,562,352 | |
Chicago IL Series A (GO Revenue) | | | 5.25 | | | | 1-1-2028 | | | | 1,750,000 | | | | 1,758,768 | |
Chicago IL Series A (GO Revenue, Build America Mutual Assurance Company Insured) | | | 5.25 | | | | 1-1-2037 | | | | 4,750,000 | | | | 4,927,935 | |
Chicago IL Series C (GO Revenue) ¤ | | | 0.00 | | | | 1-1-2023 | | | | 2,500,000 | | | | 1,781,400 | |
Chicago IL Series C (GO Revenue) | | | 4.00 | | | | 1-1-2020 | | | | 1,505,000 | | | | 1,519,704 | |
Chicago IL Series C (GO Revenue) | | | 5.00 | | | | 1-1-2024 | | | | 3,695,000 | | | | 3,761,880 | |
Chicago IL Series C (GO Revenue) | | | 5.00 | | | | 1-1-2026 | | | | 5,000,000 | | | | 5,121,600 | |
Chicago IL Series G (GO Revenue, Ambac Insured) | | | 5.00 | | | | 12-1-2024 | | | | 16,865,000 | | | | 17,158,788 | |
Chicago IL Series J (GO Revenue, Ambac Insured) | | | 5.00 | | | | 12-1-2023 | | | | 365,000 | | | | 371,358 | |
Chicago IL Transit Authority Capital Grant Federal Transit Administration Section 5307-A (Transportation Revenue, AGC Insured) | | | 5.25 | | | | 6-1-2022 | | | | 500,000 | | | | 531,775 | |
Chicago IL Transit Authority Capital Grant Federal Transit Administration Section 5309-A (Transportation Revenue, AGC Insured) | | | 6.00 | | | | 6-1-2024 | | | | 2,000,000 | | | | 2,254,020 | |
Chicago IL Transit Authority Sales Tax Receipts (Tax Revenue) | | | 5.25 | | | | 12-1-2027 | | | | 2,600,000 | | | | 2,969,538 | |
Chicago IL Unrefunded Balance (GO Revenue, AGM Insured) | | | 5.00 | | | | 1-1-2024 | | | | 35,000 | | | | 35,323 | |
Chicago IL Waste Water Transmission Second Lien (Water & Sewer Revenue) | | | 5.00 | | | | 1-1-2022 | | | | 1,340,000 | | | | 1,540,196 | |
Chicago IL Waste Water Transmission Second Lien (Water & Sewer Revenue) | | | 5.00 | | | | 1-1-2023 | | | | 1,935,000 | | | | 2,213,272 | |
Chicago IL Waste Water Transmission Second Lien (Water & Sewer Revenue) | | | 5.00 | | | | 1-1-2024 | | | | 2,000,000 | | | | 2,276,500 | |
Chicago IL Waste Water Transmission Second Lien (Water & Sewer Revenue) | | | 5.00 | | | | 1-1-2032 | | | | 1,000,000 | | | | 1,145,040 | |
Chicago IL Waste Water Transmission Second Lien (Water & Sewer Revenue) | | | 5.00 | | | | 1-1-2033 | | | | 1,000,000 | | | | 1,141,410 | |
Chicago IL Waste Water Transmission Second Lien (Water & Sewer Revenue) | | | 5.00 | | | | 1-1-2034 | | | | 1,000,000 | | | | 1,139,960 | |
Chicago IL Waste Water Transmission Second Lien Series B (Water & Sewer Revenue, National Insured) | | | 5.00 | | | | 1-1-2030 | | | | 2,000,000 | | | | 2,031,380 | |
Cook County IL Community College District #508 (GO Revenue) | | | 5.25 | | | | 12-1-2025 | | | | 1,250,000 | | | | 1,498,688 | |
Cook County IL Community College District #508 (GO Revenue) | | | 5.25 | | | | 12-1-2027 | | | | 1,295,000 | | | | 1,537,256 | |
| | | | |
| 8 | | Wells Fargo Intermediate Tax/AMT-Free Fund | | Portfolio of investments—June 30, 2016 |
| | | | | | | | | | | | | | | | |
| Security name | | Interest rate | | | Maturity date | | | Principal | | | Value | |
| | | | |
| Illinois (continued) | | | | | | | | | | | | | | | | |
Cook County IL Community College District #508 (GO Revenue) | | | 5.25 | % | | | 12-1-2028 | | | $ | 1,250,000 | | | $ | 1,477,263 | |
Cook County IL Community College District #508 (GO Revenue) | | | 5.25 | | | | 12-1-2030 | | | | 3,000,000 | | | | 3,533,250 | |
Cook County IL Community College District #508 (GO Revenue) | | | 5.25 | | | | 12-1-2031 | | | | 3,200,000 | | | | 3,749,952 | |
Cook County IL Series A (GO Revenue) | | | 5.25 | | | | 11-15-2022 | | | | 7,240,000 | | | | 8,204,223 | |
Cook County IL Series A (GO Revenue) | | | 5.25 | | | | 11-15-2023 | | | | 7,680,000 | | | | 8,680,013 | |
Cook County IL Series A (GO Revenue) | | | 5.25 | | | | 11-15-2024 | | | | 2,200,000 | | | | 2,538,360 | |
Cook County IL Series B (GO Revenue) | | | 5.00 | | | | 11-15-2023 | | | | 600,000 | | | | 698,958 | |
Cook County IL Series C (GO Revenue) | | | 5.00 | | | | 11-15-2021 | | | | 1,340,000 | | | | 1,554,628 | |
Cook County IL Series C (GO Revenue) | | | 5.00 | | | | 11-15-2024 | | | | 2,175,000 | | | | 2,529,743 | |
Cook County IL Series C (GO Revenue) | | | 5.00 | | | | 11-15-2025 | | | | 2,450,000 | | | | 2,830,289 | |
DuPage County IL High School District (GO Revenue, AGM Insured) | | | 5.00 | | | | 1-1-2021 | | | | 1,000,000 | | | | 1,021,700 | |
DuPage, Cook & Will Counties IL Community College District #502 Series A (GO Revenue) | | | 5.00 | | | | 6-1-2022 | | | | 2,650,000 | | | | 3,167,943 | |
Homer, Glen, Will & Cook Village Counties IL Series A (GO Revenue) | | | 4.00 | | | | 12-1-2019 | | | | 1,000,000 | | | | 1,094,460 | |
Homer, Glen, Will & Cook Village Counties IL Series A (GO Revenue) | | | 5.00 | | | | 12-1-2021 | | | | 1,015,000 | | | | 1,138,048 | |
Huntley IL Special Service Area #9 (Tax Revenue, AGC Insured) | | | 4.60 | | | | 3-1-2017 | | | | 325,000 | | | | 329,059 | |
Illinois (Miscellaneous Revenue) | | | 5.50 | | | | 7-1-2026 | | | | 2,300,000 | | | | 2,654,476 | |
Illinois (GO Revenue) | | | 4.75 | | | | 4-1-2020 | | | | 2,650,000 | | | | 2,761,751 | |
Illinois (GO Revenue, AGM Insured) | | | 5.00 | | | | 9-1-2016 | | | | 585,000 | | | | 587,305 | |
Illinois (GO Revenue, AGM Insured) | | | 5.00 | | | | 1-1-2023 | | | | 2,450,000 | | | | 2,673,122 | |
Illinois (Tax Revenue) | | | 5.00 | | | | 6-15-2023 | | | | 16,050,000 | | | | 19,563,345 | |
Illinois (Miscellaneous Revenue) | | | 5.00 | | | | 7-1-2023 | | | | 5,000,000 | | | | 5,651,050 | |
Illinois (Miscellaneous Revenue) | | | 5.00 | | | | 8-1-2025 | | | | 1,000,000 | | | | 1,101,660 | |
Illinois (GO Revenue, AGM Insured) | | | 5.00 | | | | 4-1-2026 | | | | 5,000,000 | | | | 5,851,900 | |
Illinois (Tax Revenue) | | | 5.00 | | | | 6-15-2029 | | | | 1,000,000 | | | | 1,142,230 | |
Illinois Education Facilities Authority (Miscellaneous Revenue) ± | | | 3.40 | | | | 11-1-2036 | | | | 1,275,000 | | | | 1,305,141 | |
Illinois Education Facilities Authority Field Museum (Miscellaneous Revenue) ± | | | 4.13 | | | | 11-1-2036 | | | | 4,560,000 | | | | 4,711,301 | |
Illinois Finance Authority OSF Healthcare System Series F (Health Revenue, Barclays Bank plc LOC) ø## | | | 0.42 | | | | 11-15-2037 | | | | 20,000,000 | | | | 20,000,000 | |
Illinois Finance Authority Student Housing Illinois State University Project (Education Revenue) | | | 5.50 | | | | 4-1-2021 | | | | 3,920,000 | | | | 4,262,098 | |
Illinois Finance Authority Wesleyan University (Education Revenue) %% | | | 5.00 | | | | 9-1-2026 | | | | 680,000 | | | | 827,247 | |
Illinois HFA Evanston Hospital Corporation (Health Revenue, JPMorgan Chase & Company SPA) ø | | | 0.46 | | | | 8-15-2035 | | | | 10,000,000 | | | | 10,000,000 | |
Illinois Municipal Electric Agency Power Supply (Utilities Revenue, National Insured) | | | 5.25 | | | | 2-1-2024 | | | | 2,500,000 | | | | 2,568,625 | |
Illinois Municipal Electric Agency Power Supply Series A (Utilities Revenue, National/FGIC Insured) | | | 5.25 | | | | 2-1-2023 | | | | 1,100,000 | | | | 1,130,195 | |
Illinois Regional Transportation Authority (Tax Revenue, AGM Insured) | | | 5.75 | | | | 6-1-2018 | | | | 6,790,000 | | | | 7,435,254 | |
Illinois Regional Transportation Authority (Tax Revenue, National Insured) | | | 6.50 | | | | 7-1-2026 | | | | 7,815,000 | | | | 10,693,421 | |
Illinois Series A (Tax Revenue) | | | 5.00 | | | | 6-1-2022 | | | | 485,000 | | | | 487,173 | |
Illinois Series A (GO Revenue) | | | 5.00 | | | | 4-1-2023 | | | | 4,500,000 | | | | 5,072,670 | |
Illinois Series A (GO Revenue, AGM Insured) | | | 5.00 | | | | 4-1-2024 | | | | 2,500,000 | | | | 2,906,275 | |
Illinois Series A (Tax Revenue) | | | 5.00 | | | | 1-1-2027 | | | | 10,625,000 | | | | 11,516,013 | |
Illinois Series B (Tax Revenue) | | | 5.00 | | | | 6-15-2018 | | | | 175,000 | | | | 189,768 | |
Illinois Sports Facilities Authority (Tax Revenue, AGM Insured) | | | 5.00 | | | | 6-15-2028 | | | | 2,500,000 | | | | 2,907,675 | |
Illinois Sports Facilities Authority (Tax Revenue, AGM Insured) | | | 5.25 | | | | 6-15-2030 | | | | 4,000,000 | | | | 4,702,680 | |
Illinois Sports Facilities Authority (Tax Revenue, AGM Insured) | | | 5.25 | | | | 6-15-2032 | | | | 3,000,000 | | | | 3,495,450 | |
Illinois Toll Highway Authority Series A-1 (Transportation Revenue, AGM Insured) | | | 5.00 | | | | 1-1-2024 | | | | 4,650,000 | | | | 4,650,558 | |
Illinois Toll Highway Authority Series A-1 (Transportation Revenue) | | | 5.25 | | | | 1-1-2026 | | | | 3,500,000 | | | | 3,957,765 | |
Illinois Unrefunded Balance Series A (Miscellaneous Revenue) | | | 5.00 | | | | 10-1-2016 | | | | 3,200,000 | | | | 3,210,560 | |
Illinois Unrefunded Balance Series B (Tax Revenue) | | | 5.00 | | | | 6-15-2018 | | | | 825,000 | | | | 891,413 | |
| | | | | | |
| Portfolio of investments—June 30, 2016 | | Wells Fargo Intermediate Tax/AMT-Free Fund | | | 9 | |
| | | | | | | | | | | | | | | | |
| Security name | | Interest rate | | | Maturity date | | | Principal | | | Value | |
| | | | |
| Illinois (continued) | | | | | | | | | | | | | | | | |
Kane, Cook & DuPage Counties IL School District #46 Prerefunded Balance Series B (GO Revenue) | | | 4.50 | % | | | 1-1-2024 | | | $ | 1,170,000 | | | $ | 1,386,649 | |
Kane, Cook & DuPage Counties IL School District #46 Unrefunded Balance Series B (GO Revenue) | | | 4.50 | | | | 1-1-2024 | | | | 3,100,000 | | | | 3,585,894 | |
Kane, McHenry, Cook & DeKalb Counties IL Unified School District (GO Revenue, Ambac Insured) | | | 5.00 | | | | 1-1-2024 | | | | 2,000,000 | | | | 2,044,620 | |
Kendall, Kane & Will Counties IL Unified School District Series A (GO Revenue) | | | 5.00 | | | | 2-1-2023 | | | | 1,000,000 | | | | 1,160,400 | |
McHenry & Kane Counties IL Community Consolidated School District #158 (GO Revenue) | | | 5.63 | | | | 1-15-2031 | | | | 2,000,000 | | | | 2,410,520 | |
McHenry & Lake Counties IL Community Consolidated School District #26 (GO Revenue, AGM Insured) | | | 5.00 | | | | 2-1-2020 | | | | 1,455,000 | | | | 1,636,089 | |
Northern IIlinois Municipal Power Agency Prairie State Project Series A (Utilities Revenue, National Insured) | | | 5.00 | | | | 1-1-2021 | | | | 2,740,000 | | | | 2,897,577 | |
Northern Illinois University Board of Trustees (Education Revenue, AGM Insured) | | | 5.00 | | | | 4-1-2019 | | | | 1,000,000 | | | | 1,096,300 | |
Northern Illinois University Board of Trustees Certificate of Participation (Education Revenue, AGM Insured) | | | 5.00 | | | | 9-1-2022 | | | | 1,325,000 | | | | 1,548,170 | |
Northern Illinois University Board of Trustees Certificate of Participation (Education Revenue, AGM Insured) | | | 5.00 | | | | 9-1-2024 | | | | 1,000,000 | | | | 1,202,760 | |
Southwestern Illinois Development Authority Local Government Program Collinsville Limited (Tax Revenue) | | | 5.00 | | | | 3-1-2025 | | | | 1,975,000 | | | | 1,692,338 | |
Springfield IL Senior Lien (Utilities Revenue, National Insured) | | | 5.00 | | | | 3-1-2022 | | | | 3,600,000 | | | | 3,704,832 | |
Springfield IL Senior Lien (Utilities Revenue, National Insured) | | | 5.00 | | | | 3-1-2023 | | | | 1,560,000 | | | | 1,605,427 | |
Tazewell County IL School District #51 (GO Revenue, National Insured) | | | 9.00 | | | | 12-1-2017 | | | | 455,000 | | | | 503,994 | |
Tazewell County IL School District #51 (GO Revenue, National Insured) | | | 9.00 | | | | 12-1-2018 | | | | 535,000 | | | | 631,172 | |
University of Illinois Auxiliary Facilities Systems (Education Revenue) ¤ | | | 0.00 | | | | 4-1-2020 | | | | 8,270,000 | | | | 7,740,803 | |
University of Illinois Auxiliary Facilities Systems Series A (Education Revenue, Ambac Insured) | | | 5.50 | | | | 4-1-2024 | | | | 1,000,000 | | | | 1,275,740 | |
University of Illinois Board of Trustees Series B (Miscellaneous Revenue, AGM Insured) | | | 5.00 | | | | 10-1-2020 | | | | 2,000,000 | | | | 2,104,020 | |
Will County IL Community Unified School District CAB (GO Revenue, National Insured) ¤ | | | 0.00 | | | | 11-1-2018 | | | | 9,730,000 | | | | 9,365,028 | |
| | | | |
| | | | | | | | | | | | | | | 436,685,635 | |
| | | | | | | | | | | | | | | | |
| | | | |
| Indiana: 2.39% | | | | | | | | | | | | | | | | |
Indiana Bond Bank Hendricks Regional Health Series A (Miscellaneous Revenue) | | | 4.00 | | | | 8-1-2017 | | | | 1,000,000 | | | | 1,034,050 | |
Indiana Bond Bank Hendricks Regional Health Series A (Miscellaneous Revenue) | | | 5.00 | | | | 8-1-2016 | | | | 1,340,000 | | | | 1,345,065 | |
Indiana Bond Bank Special Program Series A (Utilities Revenue) | | | 5.00 | | | | 10-15-2017 | | | | 5,410,000 | | | | 5,680,500 | |
Indiana Bond Bank Special Program Series A (Miscellaneous Revenue, AGM Insured) | | | 5.00 | | | | 9-1-2022 | | | | 1,545,000 | | | | 1,840,280 | |
Indiana Bond Bank Special Program Series A (Utilities Revenue) | | | 5.25 | | | | 10-15-2016 | | | | 600,000 | | | | 607,968 | |
Indiana Finance Authority Clean Water Act Project Series A (Water & Sewer Revenue) | | | 5.00 | | | | 10-1-2031 | | | | 1,035,000 | | | | 1,268,341 | |
Indiana Finance Authority CWA Authority Project Series A (Water & Sewer Revenue) | | | 5.00 | | | | 10-1-2030 | | | | 2,315,000 | | | | 2,848,770 | |
Indiana Finance Authority Parkview Health System Series A (Health Revenue) | | | 5.50 | | | | 5-1-2024 | | | | 4,500,000 | | | | 5,098,680 | |
Indiana Finance Authority Southern Indiana Gas & Electric Company Project Series D (Utilities Revenue) ± | | | 1.95 | | | | 3-1-2024 | | | | 4,000,000 | | | | 4,054,840 | |
Indiana Finance Authority Stadium Project Series A (Miscellaneous Revenue) | | | 5.25 | | | | 2-1-2028 | | | | 2,000,000 | | | | 2,565,620 | |
Indiana HEFA Ascension Health Series B3 (Health Revenue) ± | | | 1.26 | | | | 11-15-2031 | | | | 15,000,000 | | | | 15,000,150 | |
Indianapolis IN Local Public Improvement Bond Bank Series E (Miscellaneous Revenue) | | | 5.00 | | | | 1-1-2027 | | | | 760,000 | | | | 979,214 | |
Indianapolis IN Local Public Improvement Bond Bank Series E (Miscellaneous Revenue) | | | 5.00 | | | | 1-1-2028 | | | | 1,000,000 | | | | 1,281,370 | |
| | | | |
| 10 | | Wells Fargo Intermediate Tax/AMT-Free Fund | | Portfolio of investments—June 30, 2016 |
| | | | | | | | | | | | | | | | |
| Security name | | Interest rate | | | Maturity date | | | Principal | | | Value | |
| | | | |
| Indiana (continued) | | | | | | | | | | | | | | | | |
Indianapolis IN Local Public Improvement Bond Bank Series E (Miscellaneous Revenue) | | | 5.00 | % | | | 1-1-2029 | | | $ | 735,000 | | | $ | 938,852 | |
Indianapolis IN Local Public Improvement Bond Bank Series E (Miscellaneous Revenue) | | | 5.00 | | | | 1-1-2030 | | | | 1,375,000 | | | | 1,739,898 | |
Indianapolis IN Local Public Improvement Bond Bank Series E (Miscellaneous Revenue) | | | 5.00 | | | | 1-1-2031 | | | | 1,000,000 | | | | 1,260,430 | |
Indianapolis IN Local Public Improvement Bond Bank Series E (Miscellaneous Revenue) | | | 5.00 | | | | 1-1-2033 | | | | 1,545,000 | | | | 1,932,177 | |
Indianapolis IN Local Public Improvement Bond Bank Series E (Miscellaneous Revenue) | | | 5.00 | | | | 1-1-2034 | | | | 2,000,000 | | | | 2,491,440 | |
Jasper County IN PCR Northern Series A (Industrial Development Revenue, National Insured) | | | 5.60 | | | | 11-1-2016 | | | | 5,900,000 | | | | 5,993,751 | |
Jeffersonville IN Building Corporation First Mortgage Series C (Miscellaneous Revenue) | | | 4.25 | | | | 8-15-2017 | | | | 315,000 | | | | 322,236 | |
Knox County IN EDA Series A (Health Revenue) | | | 5.00 | | | | 4-1-2022 | | | | 925,000 | | | | 1,072,353 | |
Knox County IN EDA Series A (Health Revenue) | | | 5.00 | | | | 4-1-2023 | | | | 665,000 | | | | 752,694 | |
Knox County IN EDA Series A (Health Revenue) | | | 5.00 | | | | 4-1-2026 | | | | 750,000 | | | | 838,358 | |
Mount Vernon IN School Building Corporation Prerefunded Balance First Mortgage (Miscellaneous Revenue, AGM Insured) | | | 5.00 | | | | 7-15-2019 | | | | 265,000 | | | | 282,978 | |
Mount Vernon IN School Building Corporation Unrefunded Balance First Mortgage (Miscellaneous Revenue, AGM Insured) | | | 5.00 | | | | 7-15-2019 | | | | 735,000 | | | | 781,717 | |
University of Southern Indiana Student Fee Series J (Education Revenue, AGC Insured) | | | 5.00 | | | | 10-1-2019 | | | | 1,000,000 | | | | 1,124,940 | |
Valparaiso IN Multi-Schools Building Corporation (Miscellaneous Revenue) | | | 5.00 | | | | 7-15-2024 | | | | 750,000 | | | | 942,795 | |
| | | | |
| | | | | | | | | | | | | | | 64,079,467 | |
| | | | | | | | | | | | | | | | |
| | | | |
| Iowa: 0.44% | | | | | | | | | | | | | | | | |
Altoona IA Annual Appropriation Urban Renewal Refunding Bond (GO Revenue) %% | | | 5.00 | | | | 6-1-2027 | | | | 2,310,000 | | | | 2,864,816 | |
Iowa Student Loan Liquidity Corporation Series 1 (Education Revenue) | | | 5.25 | | | | 12-1-2017 | | | | 3,000,000 | | | | 3,165,780 | |
Iowa Student Loan Liquidity Corporation Series 1 (Education Revenue) | | | 5.25 | | | | 12-1-2018 | | | | 5,285,000 | | | | 5,763,980 | |
| | | | |
| | | | | | | | | | | | | | | 11,794,576 | |
| | | | | | | | | | | | | | | | |
| | | | |
| Kansas: 0.23% | | | | | | | | | | | | | | | | |
Kansas Development Finance Authority Agro-Defense Facility Series G (Miscellaneous Revenue) | | | 5.00 | | | | 4-1-2030 | | | | 2,650,000 | | | | 3,171,971 | |
Kansas Development Finance Authority Health Facilities Series F (Health Revenue) | | | 5.00 | | | | 11-15-2021 | | | | 1,300,000 | | | | 1,544,452 | |
Wyandotte County & Kansas City KS Sales Tax Special Obligation Vacation Village Project Area 4 - Major Multi-Sport Athletic Complex Project CAB Series 2015 (Tax Revenue) 144A¤ | | | 0.00 | | | | 9-1-2034 | | | | 4,180,000 | | | | 1,518,887 | |
| | | | |
| | | | | | | | | | | | | | | 6,235,310 | |
| | | | | | | | | | | | | | | | |
| | | | |
| Kentucky: 0.46% | | | | | | | | | | | | | | | | |
Kentucky EDFA Series B2 (Health Revenue) ± | | | 1.21 | | | | 2-1-2046 | | | | 1,250,000 | | | | 1,234,888 | |
Kentucky Public Transportation Infrastructure Authority Downtown Crossing Project CAB Series B (Transportation Revenue) ¤ | | | 0.00 | | | | 7-1-2020 | | | | 1,000,000 | | | | 896,260 | |
Kentucky Public Transportation Infrastructure Authority Downtown Crossing Project CAB Series B (Transportation Revenue) ¤ | | | 0.00 | | | | 7-1-2021 | | | | 2,750,000 | | | | 2,376,963 | |
Kentucky Public Transportation Infrastructure Authority Downtown Crossing Project CAB Series B (Transportation Revenue) ¤ | | | 0.00 | | | | 7-1-2022 | | | | 4,320,000 | | | | 3,584,174 | |
Kentucky Public Transportation Infrastructure Authority Downtown Crossing Project CAB Series B (Transportation Revenue) ¤ | | | 0.00 | | | | 7-1-2025 | | | | 1,020,000 | | | | 723,588 | |
| | | | | | |
| Portfolio of investments—June 30, 2016 | | Wells Fargo Intermediate Tax/AMT-Free Fund | | | 11 | |
| | | | | | | | | | | | | | | | |
| Security name | | Interest rate | | | Maturity date | | | Principal | | | Value | |
| | | | |
| Kentucky (continued) | | | | | | | | | | | | | | | | |
Kentucky Public Transportation Infrastructure Authority Downtown Crossing Project CAB Series B (Transportation Revenue) ¤ | | | 0.00 | % | | | 7-1-2029 | | | $ | 1,400,000 | | | $ | 856,310 | |
University of Kentucky Certificate of Participation Master Street Lease #4 (Miscellaneous Revenue) | | | 4.45 | | | | 6-18-2018 | | | | 2,438,396 | | | | 2,541,345 | |
| | | | |
| | | | | | | | | | | | | | | 12,213,528 | |
| | | | | | | | | | | | | | | | |
| | | | |
| Louisiana: 2.02% | | | | | | | | | | | | | | | | |
Bossier City LA (Water & Sewer Revenue) | | | 5.00 | | | | 10-1-2037 | | | | 2,000,000 | | | | 2,407,060 | |
Lafayette LA Communications System (Miscellaneous Revenue, AGM Insured) | | | 5.00 | | | | 11-1-2025 | | | | 1,500,000 | | | | 1,886,040 | |
Louisiana Correctional Facilities Corporation (Miscellaneous Revenue, Ambac Insured) | | | 5.00 | | | | 9-1-2019 | | | | 1,000,000 | | | | 1,121,350 | |
Louisiana Local Government Environmental Facilities & CDA East Baton Rouge Series A (Water & Sewer Revenue) | | | 5.00 | | | | 2-1-2030 | | | | 1,000,000 | | | | 1,213,310 | |
Louisiana Public Facilities Authority Archdiocese of New Orleans Project (Miscellaneous Revenue, CIFG Insured) | | | 5.00 | | | | 7-1-2016 | | | | 100,000 | | | | 100,011 | |
Louisiana Public Facilities Authority Archdiocese of New Orleans Project (Miscellaneous Revenue, CIFG Insured) | | | 5.00 | | | | 7-1-2017 | | | | 150,000 | | | | 155,528 | |
Louisiana Public Facilities Authority Black & Gold Facilities Project Series A (Housing Revenue, AGC Insured) | | | 4.25 | | | | 7-1-2017 | | | | 55,000 | | | | 56,667 | |
Louisiana Unclaimed Property Special Bond 1-49 South Project (Miscellaneous Revenue) | | | 5.00 | | | | 9-1-2026 | | | | 2,000,000 | | | | 2,499,060 | |
Louisiana Unclaimed Property Special Bond 1-49 South Project (Miscellaneous Revenue) | | | 5.00 | | | | 9-1-2027 | | | | 2,700,000 | | | | 3,354,129 | |
Louisiana Unclaimed Property Special Bond 1-49 South Project (Miscellaneous Revenue) | | | 5.00 | | | | 9-1-2028 | | | | 2,405,000 | | | | 2,968,059 | |
Louisiana Unclaimed Property Special Bond 1-49 South Project (Miscellaneous Revenue) | | | 5.00 | | | | 9-1-2029 | | | | 2,695,000 | | | | 3,319,270 | |
Louisiana Unclaimed Property Special Bond 1-49 South Project (Miscellaneous Revenue) | | | 5.00 | | | | 9-1-2030 | | | | 2,700,000 | | | | 3,312,846 | |
New Orleans LA Public Improvement Series A (GO Revenue, AGC Insured) | | | 5.00 | | | | 12-1-2016 | | | | 1,365,000 | | | | 1,389,611 | |
New Orleans LA Sewer Service (GO Revenue, FGIC Insured) | | | 5.50 | | | | 12-1-2016 | | | | 1,350,000 | | | | 1,377,162 | |
St. Bernard Parish LA Sales & Use Tax (Tax Revenue) | | | 4.00 | | | | 3-1-2023 | | | | 3,405,000 | | | | 3,864,266 | |
St. James Parish LA Nucor Steel LLC Project Gulf Opportunity Zone Series B-1 (Industrial Development Revenue) ø## | | | 0.70 | | | | 11-1-2040 | | | | 25,000,000 | | | | 25,000,000 | |
| | | | |
| | | | | | | | | | | | | | | 54,024,369 | |
| | | | | | | | | | | | | | | | |
| | | | |
| Maryland: 1.53% | | | | | | | | | | | | | | | | |
Maryland Department of Housing & Community Development Calvin Mowbray & Stephen Camper Park Project Series E (Housing Revenue) 144A | | | 1.35 | | | | 1-1-2019 | | | | 5,000,000 | | | | 5,010,850 | |
Maryland Economic Development Corporation Salisbury University Project (Education Revenue) | | | 5.00 | | | | 6-1-2027 | | | | 500,000 | | | | 562,805 | |
Maryland Health & HEFAR John Hopkins Health System Series D (Health Revenue) ± | | | 1.12 | | | | 5-15-2038 | | | | 3,870,000 | | | | 3,868,259 | |
Maryland Series B (GO Revenue) | | | 4.00 | | | | 8-1-2023 | | | | 5,000,000 | | | | 5,966,750 | |
Maryland Series B (GO Revenue) | | | 4.00 | | | | 8-1-2024 | | | | 15,000,000 | | | | 18,141,600 | |
Maryland Series C (GO Revenue) | | | 5.00 | | | | 8-1-2022 | | | | 2,975,000 | | | | 3,667,550 | |
Maryland Stadium Authority Baltimore City Public Schools Construction & Revitalization Program (Miscellaneous Revenue) | | | 5.00 | | | | 5-1-2033 | | | | 3,000,000 | | | | 3,784,650 | |
| | | | |
| | | | | | | | | | | | | | | 41,002,464 | |
| | | | | | | | | | | | | | | | |
| | | | |
| 12 | | Wells Fargo Intermediate Tax/AMT-Free Fund | | Portfolio of investments—June 30, 2016 |
| | | | | | | | | | | | | | | | |
| Security name | | Interest rate | | | Maturity date | | | Principal | | | Value | |
| | | | |
| Massachusetts: 2.23% | | | | | | | | | | | | | | | | |
Boston MA Series A (GO Revenue) | | | 5.00 | % | | | 4-1-2026 | | | $ | 5,790,000 | | | $ | 7,526,421 | |
Massachusetts Consolidated Loan Series C (Tax Revenue, AGM Insured) | | | 5.25 | | | | 8-1-2025 | | | | 5,000,000 | | | | 5,253,000 | |
Massachusetts Consolidated Loan Series D-1 (Miscellaneous Revenue) ø | | | 1.05 | | | | 8-1-2043 | | | | 10,000,000 | | | | 10,000,000 | |
Massachusetts Development Finance Agency Lasell College (Education Revenue) | | | 5.00 | | | | 7-1-2021 | | | | 2,820,000 | | | | 3,244,043 | |
Massachusetts Development Finance Agency Merrimack College Series A (Education Revenue) | | | 5.00 | | | | 7-1-2021 | | | | 1,035,000 | | | | 1,174,197 | |
Massachusetts Development Finance Agency MFHR RTH Restoration Housing Limited Partnership (Housing Revenue, Bank of America NA LOC) | | | 1.05 | | | | 11-1-2017 | | | | 2,300,000 | | | | 2,301,058 | |
Massachusetts Development Finance Agency Sabis International Charter Series A (Education Revenue) | | | 6.55 | | | | 4-15-2020 | | | | 615,000 | | | | 730,866 | |
Massachusetts Educational Financing Authority Issue I (Education Revenue) | | | 5.50 | | | | 1-1-2018 | | | | 2,000,000 | | | | 2,136,700 | |
Massachusetts Educational Financing Authority Issue I Series A (Education Revenue) | | | 5.50 | | | | 1-1-2017 | | | | 2,000,000 | | | | 2,047,080 | |
Massachusetts HEFA Harvard University Series A (Education Revenue) | | | 5.00 | | | | 12-15-2029 | | | | 1,890,000 | | | | 2,167,414 | |
Massachusetts HEFA Various Partners Healthcare Series G-6 (Health Revenue) ± | | | 1.29 | | | | 7-1-2038 | | | | 14,000,000 | | | | 13,998,740 | |
Massachusetts Housing Finance Agency Multifamily Conduit Wood Ridge Homes Project Series A (Housing Revenue) ± | | | 1.05 | | | | 12-1-2017 | | | | 9,000,000 | | | | 9,011,160 | |
| | | | |
| | | | | | | | | | | | | | | 59,590,679 | |
| | | | | | | | | | | | | | | | |
| | | | |
| Michigan: 3.69% | | | | | | | | | | | | | �� | | | |
Clinton MI Township Building Authority (Miscellaneous Revenue, Ambac Insured) | | | 5.50 | | | | 11-1-2017 | | | | 2,755,000 | | | | 2,825,445 | |
Detroit MI Distributable State Aid (GO Revenue) | | | 5.00 | | | | 11-1-2018 | | | | 3,000,000 | | | | 3,238,170 | |
Detroit MI Distributable State Aid (GO Revenue) | | | 5.00 | | | | 11-1-2019 | | | | 1,500,000 | | | | 1,660,860 | |
Detroit MI Distributable State Aid (GO Revenue) | | | 5.00 | | | | 11-1-2020 | | | | 2,700,000 | | | | 3,051,891 | |
Eaton Rapids MI Public Schools (GO Revenue, Qualified School Board Loan Fund Insured) | | | 5.00 | | | | 5-1-2022 | | | | 1,785,000 | | | | 2,150,568 | |
Flint MI International Academy (Education Revenue) | | | 5.38 | | | | 10-1-2022 | | | | 2,270,000 | | | | 2,303,029 | |
Flint MI International Academy (Education Revenue) | | | 5.50 | | | | 10-1-2027 | | | | 1,985,000 | | | | 2,006,835 | |
Flint MI International Academy Public School Project (Education Revenue) | | | 5.00 | | | | 10-1-2017 | | | | 190,000 | | | | 192,497 | |
Hazel Park MI School District (GO Revenue, AGM/Qualified School Board Loan Fund Insured) | | | 5.00 | | | | 5-1-2020 | | | | 1,160,000 | | | | 1,337,352 | |
Kent County MI (GO Revenue) | | | 5.00 | | | | 1-1-2025 | | | | 1,000,000 | | | | 1,097,320 | |
Kent County MI Limited Tax Capital Improvement Bond (GO Revenue) | | | 5.00 | | | | 6-1-2030 | | | | 1,040,000 | | | | 1,337,804 | |
Kent County MI Limited Tax Capital Improvement Bond (GO Revenue) | | | 5.00 | | | | 6-1-2035 | | | | 520,000 | | | | 655,455 | |
Macomb MI Interceptor Drainage (Miscellaneous Revenue) | | | 5.00 | | | | 5-1-2024 | | | | 1,750,000 | | | | 1,991,273 | |
Macomb MI Interceptor Drainage (Miscellaneous Revenue) | | | 5.00 | | | | 5-1-2025 | | | | 1,750,000 | | | | 1,991,273 | |
Macomb MI Interceptor Drainage (Miscellaneous Revenue) | | | 5.00 | | | | 5-1-2026 | | | | 1,930,000 | | | | 2,190,917 | |
Michigan Comprehensive Transportation Program (Tax Revenue) | | | 5.25 | | | | 5-15-2017 | | | | 2,750,000 | | | | 2,854,143 | |
Michigan Finance Authority (Miscellaneous Revenue) | | | 5.00 | | | | 6-1-2020 | | | | 1,400,000 | | | | 1,448,104 | |
Michigan Finance Authority (Health Revenue) | | | 5.00 | | | | 11-15-2023 | | | | 400,000 | | | | 482,680 | |
Michigan Finance Authority (Health Revenue) | | | 5.00 | | | | 11-15-2026 | | | | 800,000 | | | | 944,544 | |
Michigan Finance Authority Limited Obligation Public School Academy Cesar Chavez Academy Project (Education Revenue) | | | 5.00 | | | | 2-1-2022 | | | | 2,540,000 | | | | 2,566,822 | |
Michigan Finance Authority Local Government Loan Program Series C (Health Revenue) | | | 5.00 | | | | 11-1-2022 | | | | 2,070,000 | | | | 2,297,824 | |
Michigan Finance Authority Local Government Loan Program Series D (Water & Sewer Revenue, National Insured) | | | 5.00 | | | | 7-1-2025 | | | | 1,000,000 | | | | 1,221,680 | |
Michigan Finance Authority Local Government Loan Program Series D (Water & Sewer Revenue) | | | 5.00 | | | | 7-1-2030 | | | | 12,000,000 | | | �� | 14,269,080 | |
Michigan Finance Authority Local Government Loan Program Series D (Water & Sewer Revenue, AGM Insured) | | | 5.00 | | | | 7-1-2035 | | | | 2,750,000 | | | | 3,241,480 | |
| | | | | | |
| Portfolio of investments—June 30, 2016 | | Wells Fargo Intermediate Tax/AMT-Free Fund | | | 13 | |
| | | | | | | | | | | | | | | | |
| Security name | | Interest rate | | | Maturity date | | | Principal | | | Value | |
| | | | |
| Michigan (continued) | | | | | | | | | | | | | | | | |
Michigan Finance Authority Local Government Loan Program Series D (Water & Sewer Revenue, AGM Insured) | | | 5.00 | % | | | 7-1-2037 | | | $ | 2,000,000 | | | $ | 2,344,780 | |
Michigan Finance Authority Local Government Loan Program Series F (Tax Revenue) | | | 4.00 | | | | 10-1-2024 | | | | 3,000,000 | | | | 3,343,080 | |
Michigan Housing Development Authority Limited Greenwood Villa Project (Housing Revenue, AGM Insured) | | | 4.75 | | | | 9-15-2017 | | | | 710,000 | | | | 721,339 | |
Michigan Municipal Bond Authority Local Government Loan Program Series B Group A (Miscellaneous Revenue, Ambac Insured) | | | 5.00 | | | | 12-1-2018 | | | | 1,075,000 | | | | 1,100,198 | |
Michigan Public Educational Facilities Authority Limited Obligation Chandler Park Academy (Miscellaneous Revenue) | | | 5.60 | | | | 11-1-2018 | | | | 605,000 | | | | 606,077 | |
Michigan Public Educational Facilities Authority Limited Obligation Nataki Talibah (Miscellaneous Revenue) (i)(s) | | | 6.25 | | | | 10-1-2023 | | | | 815,000 | | | | 244,476 | |
Michigan Strategic Fund Limited Obligation Cadillac Place Office Building Project (Miscellaneous Revenue) | | | 5.25 | | | | 10-15-2025 | | | | 4,165,000 | | | | 4,982,881 | |
Michigan Strategic Fund Limited Obligation Events Center Project Series A (Tax Revenue) ± | | | 4.13 | | | | 7-1-2045 | | | | 11,500,000 | | | | 11,808,545 | |
Pinckney MI Community School District (GO Revenue, Qualified School Board Loan Fund Insured) | | | 5.00 | | | | 5-1-2025 | | | | 2,040,000 | | | | 2,522,399 | |
Pinckney MI Community School District (GO Revenue, Qualified School Board Loan Fund Insured) | | | 5.00 | | | | 5-1-2026 | | | | 2,505,000 | | | | 3,071,330 | |
Southfield MI 2015 Street Improvement (GO Revenue) | | | 4.00 | | | | 5-1-2025 | | | | 1,490,000 | | | | 1,750,929 | |
Southfield MI Public Schools (GO Revenue, National/Qualified School Board Loan Fund Insured) | | | 4.38 | | | | 5-1-2025 | | | | 4,000,000 | | | | 4,112,760 | |
Western Michigan University Board of Trustees (Education Revenue) | | | 5.25 | | | | 11-15-2027 | | | | 600,000 | | | | 743,232 | |
Western Michigan University Board of Trustees (Education Revenue) | | | 5.25 | | | | 11-15-2029 | | | | 1,000,000 | | | | 1,226,030 | |
Western Michigan University Board of Trustees (Education Revenue, AGM Insured) | | | 5.25 | | | | 11-15-2033 | | | | 750,000 | | | | 912,330 | |
Western Townships MI Utilities Authority (GO Revenue) | | | 5.00 | | | | 1-1-2017 | | | | 1,500,000 | | | | 1,531,860 | |
Wyandotte MI Series A (Utilities Revenue, AGC Insured) | | | 4.00 | | | | 10-1-2016 | | | | 500,000 | | | | 504,405 | |
| | | | |
| | | | | | | | | | | | | | | 98,883,697 | |
| | | | | | | | | | | | | | | | |
| | | | |
| Minnesota: 0.28% | | | | | | | | | | | | | | | | |
Minneapolis & St. Paul MN Metropolitan Airports Commission Sub Series B (Airport Revenue, National Insured) | | | 5.00 | | | | 1-1-2018 | | | | 4,555,000 | | | | 4,658,034 | |
St. Louis Park MN Nicollett Health Services Series C (Health Revenue) | | | 5.50 | | | | 7-1-2023 | | | | 2,500,000 | | | | 2,742,450 | |
St. Paul MN Housing & RDA Hmong Academy Project Series A (Education Revenue) | | | 5.50 | | | | 9-1-2018 | | | | 200,000 | | | | 200,600 | |
| | | | |
| | | | | | | | | | | | | | | 7,601,084 | |
| | | | | | | | | | | | | | | | |
| | | | |
| Mississippi: 0.54% | | | | | | | | | | | | | | | | |
Mississippi Development Bank Special Obligation Jackson Public School District Project Series A (Miscellaneous Revenue) | | | 5.00 | | | | 4-1-2020 | | | | 1,000,000 | | | | 1,139,210 | |
Mississippi Development Bank Special Obligation Jackson Water & Sewer System Project (Water & Sewer Revenue, AGM Insured) | | | 6.00 | | | | 12-1-2023 | | | | 1,145,000 | | | | 1,513,656 | |
Mississippi Development Bank Special Obligation Jackson Water & Sewer System Project Series A (Water & Sewer Revenue, AGM Insured) | | | 5.00 | | | | 9-1-2030 | | | | 10,000,000 | | | | 11,918,300 | |
| | | | |
| | | | | | | | | | | | | | | 14,571,166 | |
| | | | | | | | | | | | | | | | |
| | | | |
| Missouri: 0.29% | | | | | | | | | | | | | | | | |
Kansas City MO Municipal Assistance Corporation Series B-1 (Miscellaneous Revenue, Ambac Insured) ¤ | | | 0.00 | | | | 4-15-2022 | | | | 3,640,000 | | | | 3,194,464 | |
Manchester MO Highway 141 Manchester Road Project (Tax Revenue) | | | 6.00 | | | | 11-1-2025 | | | | 475,000 | | | | 505,020 | |
Maryland Heights MO South Heights Redevelopment Project A (Tax Revenue) | | | 5.50 | | | | 9-1-2018 | | | | 465,000 | | | | 481,247 | |
| | | | |
| 14 | | Wells Fargo Intermediate Tax/AMT-Free Fund | | Portfolio of investments—June 30, 2016 |
| | | | | | | | | | | | | | | | |
| Security name | | Interest rate | | | Maturity date | | | Principal | | | Value | |
| | | | |
| Missouri (continued) | | | | | | | | | | | | | | | | |
Poplar Bluff MO School District (Miscellaneous Revenue, AGM Insured) | | | 5.00 | % | | | 3-1-2032 | | | $ | 1,500,000 | | | $ | 1,811,340 | |
Poplar Bluff MO School District (Miscellaneous Revenue, AGM Insured) | | | 5.00 | | | | 3-1-2034 | | | | 1,000,000 | | | | 1,200,490 | |
St. Louis MO Lambert St. Louis International Airport Series A-1 (Airport Revenue) | | | 6.00 | | | | 7-1-2019 | | | | 415,000 | | | | 475,432 | |
| | | | |
| | | | | | | | | | | | | | | 7,667,993 | |
| | | | | | | | | | | | | | | | |
| | | | |
| Nebraska: 0.12% | | | | | | | | | | | | | | | | |
Lincoln County NE Hospital Authority Great Plains Regional Medical Center (Health Revenue) | | | 5.00 | | | | 11-1-2024 | | | | 1,000,000 | | | | 1,168,370 | |
Municipal Energy Agency of Nebraska Series A (Utilities Revenue, BHAC Insured) | | | 5.00 | | | | 4-1-2019 | | | | 500,000 | | | | 557,060 | |
Nebraska Central Plains Energy Project #3 (Utilities Revenue) | | | 5.00 | | | | 9-1-2027 | | | | 1,290,000 | | | | 1,504,566 | |
| | | | |
| | | | | | | | | | | | | | | 3,229,996 | |
| | | | | | | | | | | | | | | | |
| | | | |
| Nevada: 1.32% | | | | | | | | | | | | | | | | |
Clark County NV Airport Series C (Airport Revenue, AGM Insured) | | | 5.00 | | | | 7-1-2023 | | | | 5,600,000 | | | | 6,262,816 | |
Clark County NV Airport Series D (Airport Revenue) | | | 5.00 | | | | 7-1-2024 | | | | 2,750,000 | | | | 3,121,608 | |
Clark County NV Las Vegas McCarran International Airport Series A (Airport Revenue) | | | 5.00 | | | | 7-1-2016 | | | | 3,000,000 | | | | 3,000,390 | |
Clark County NV Water Reclamation District (GO Revenue) | | | 5.00 | | | | 7-1-2027 | | | | 4,155,000 | | | | 5,287,196 | |
Clark County NV Water Reclamation District Series A (GO Revenue) | | | 5.25 | | | | 7-1-2038 | | | | 2,880,000 | | | | 3,237,552 | |
Las Vegas NV New Convention & Visitors Authority Series E (Tax Revenue, AGM Insured) | | | 4.20 | | | | 7-1-2021 | | | | 500,000 | | | | 555,550 | |
Las Vegas NV Series A (GO Revenue) | | | 5.00 | | | | 5-1-2031 | | | | 1,985,000 | | | | 2,453,797 | |
Las Vegas NV Series C (GO Revenue) | | | 5.00 | | | | 9-1-2030 | | | | 1,000,000 | | | | 1,270,600 | |
Las Vegas NV Special Improvement District #607 (Miscellaneous Revenue) | | | 4.00 | | | | 6-1-2019 | | | | 735,000 | | | | 771,353 | |
Las Vegas NV Special Improvement District #607 (Miscellaneous Revenue) | | | 4.00 | | | | 6-1-2020 | | | | 615,000 | | | | 654,674 | |
Las Vegas NV Special Improvement District #607 (Miscellaneous Revenue) | | | 4.00 | | | | 6-1-2021 | | | | 800,000 | | | | 862,520 | |
Las Vegas NV Special Improvement District #607 (Miscellaneous Revenue) | | | 4.25 | | | | 6-1-2024 | | | | 200,000 | | | | 215,746 | |
Las Vegas NV Valley Water District Series B (GO Revenue) | | | 5.00 | | | | 6-1-2030 | | | | 3,945,000 | | | | 5,037,647 | |
Reno NV Sparks Indian Governmental Colony (Miscellaneous Revenue, U.S. Bank NA LOC) | | | 5.00 | | | | 6-1-2021 | | | | 2,580,000 | | | | 2,588,901 | |
| | | | |
| | | | | | | | | | | | | | | 35,320,350 | |
| | | | | | | | | | | | | | | | |
| | | | |
| New Hampshire: 0.08% | | | | | | | | | | | | | | | | |
New Hampshire HFA Single Family Mortgage Acquisition Series E & F (Housing Revenue) | | | 4.80 | | | | 7-1-2028 | | | | 2,030,000 | | | | 2,229,752 | |
| | | | | | | | | | | | | | | | |
| | | | |
| New Jersey: 4.07% | | | | | | | | | | | | | | | | |
Essex County NJ Import Authority Series A (Miscellaneous Revenue) | | | 6.00 | | | | 11-1-2025 | | | | 5,000,000 | | | | 5,404,900 | |
Garden NJ Open Space & Farmland Preservation Refunding Bonds Series A (Tax Revenue) | | | 4.00 | | | | 11-1-2017 | | | | 930,000 | | | | 965,907 | |
New Jersey EDA Cigarette Tax Refunding Bonds (Tobacco Revenue) | | | 5.00 | | | | 6-15-2021 | | | | 2,500,000 | | | | 2,815,125 | |
New Jersey EDA Motor Vehicle Surcharges Series A (Miscellaneous Revenue, National Insured) | | | 5.25 | | | | 7-1-2026 | | | | 2,860,000 | | | | 3,506,846 | |
New Jersey EDA School Facilities Construction Project Series I (Miscellaneous Revenue) ± | | | 2.01 | | | | 3-1-2028 | | | | 5,000,000 | | | | 4,485,850 | |
New Jersey EDA School Facilities Construction Refunding Bond Series NN (Miscellaneous Revenue) | | | 5.00 | | | | 3-1-2021 | | | | 15,035,000 | | | | 16,649,158 | |
New Jersey EDA School Facilities Construction Refunding Bond Series PP (Miscellaneous Revenue) | | | 5.00 | | | | 6-15-2026 | | | | 8,380,000 | | | | 9,450,629 | |
New Jersey Educational Facilities Authority (Miscellaneous Revenue) | | | 5.00 | | | | 6-15-2026 | | | | 3,015,000 | | | | 3,400,196 | |
| | | | | | |
| Portfolio of investments—June 30, 2016 | | Wells Fargo Intermediate Tax/AMT-Free Fund | | | 15 | |
| | | | | | | | | | | | | | | | |
| Security name | | Interest rate | | | Maturity date | | | Principal | | | Value | |
| | | | |
| New Jersey (continued) | | | | | | | | | | | | | | | | |
New Jersey HEFAR Student Assistance Authority Series A (Education Revenue) | | | 5.00 | % | | | 12-1-2016 | | | $ | 2,100,000 | | | $ | 2,138,367 | |
New Jersey HEFAR Student Assistance Authority Series A (Education Revenue) | | | 5.00 | | | | 6-1-2017 | | | | 2,000,000 | | | | 2,068,480 | |
New Jersey HEFAR Student Assistance Authority Series A (Education Revenue) | | | 5.00 | | | | 6-1-2019 | | | | 9,860,000 | | | | 10,842,549 | |
New Jersey Housing & Mortgage Finance Agency (Housing Revenue) | | | 5.25 | | | | 10-1-2016 | | | | 160,000 | | | | 161,110 | |
New Jersey Sports & Exposition Authority (Miscellaneous Revenue, National Insured) | | | 5.50 | | | | 3-1-2022 | | | | 1,755,000 | | | | 2,186,870 | |
New Jersey TTFA Series A (Miscellaneous Revenue) | | | 5.00 | | | | 6-15-2020 | | | | 4,000,000 | | | | 4,405,880 | |
New Jersey TTFA Series A (Transportation Revenue) | | | 5.25 | | | | 12-15-2020 | | | | 1,305,000 | | | | 1,461,809 | |
New Jersey TTFA Series A (Miscellaneous Revenue) | | | 5.25 | | | | 6-15-2024 | | | | 1,695,000 | | | | 1,893,400 | |
New Jersey TTFA Series C (Transportation Revenue) | | | 5.25 | | | | 6-15-2032 | | | | 2,500,000 | | | | 2,865,150 | |
New Jersey TTFA Series DC8033 (Transportation Revenue, Dexia Credit Local LOC, AGM Insured, Dexia Credit Local LIQ) 144Aø | | | 0.59 | | | | 12-15-2022 | | | | 19,850,000 | | | | 19,850,000 | |
New Jersey TTFA Unrefunded Balance (Transportation Revenue, National Insured) | | | 5.25 | | | | 12-15-2021 | | | | 6,000,000 | | | | 6,911,400 | |
Trenton City NJ (GO Revenue, Build America Mutual Assurance Company Insured) | | | 5.00 | | | | 12-1-2022 | | | | 1,630,000 | | | | 1,910,947 | |
Trenton City NJ (GO Revenue, Build America Mutual Assurance Company Insured) | | | 5.00 | | | | 12-1-2024 | | | | 1,775,000 | | | | 2,143,792 | |
Trenton City NJ (GO Revenue, Build America Mutual Assurance Company Insured) | | | 5.00 | | | | 12-1-2025 | | | | 1,860,000 | | | | 2,275,152 | |
Trenton City NJ (GO Revenue, Build America Mutual Assurance Company Insured) | | | 5.00 | | | | 12-1-2026 | | | | 1,000,000 | | | | 1,217,380 | |
| | | | |
| | | | | | | | | | | | | | | 109,010,897 | |
| | | | | | | | | | | | | | | | |
| | | | |
| New Mexico: 0.65% | | | | | | | | | | | | | | | | |
Albuquerque Bernalillo County NM Water Utility Authority Series B (Water & Sewer Revenue) | | | 5.00 | | | | 7-1-2024 | | | | 1,000,000 | | | | 1,264,320 | |
Clayton NM Jail Project Improvement & Refunding Bonds (Miscellaneous Revenue, National Insured) | | | 5.00 | | | | 11-1-2028 | | | | 9,265,000 | | | | 11,199,717 | |
Clayton NM Jail Project Improvement & Refunding Bonds (Miscellaneous Revenue, National Insured) | | | 5.00 | | | | 11-1-2029 | | | | 1,000,000 | | | | 1,206,520 | |
New Mexico Mortgage Finance Authority SFMR Class I Series A (Housing Revenue, GNMA/FNMA/FHLMC Insured) | | | 4.63 | | | | 9-1-2025 | | | | 1,240,000 | | | | 1,281,751 | |
New Mexico Mortgage Finance Authority SFMR Class I Series B (Housing Revenue, GNMA/FNMA/FHLMC Insured) | | | 5.00 | | | | 3-1-2028 | | | | 475,000 | | | | 509,979 | |
New Mexico Municipal Energy Acquisition Authority Gas Supply Sub Series B (Utilities Revenue, Royal Bank of Canada SPA) ± | | | 1.06 | | | | 11-1-2039 | | | | 2,000,000 | | | | 1,984,460 | |
| | | | |
| | | | | | | | | | | | | | | 17,446,747 | |
| | | | | | | | | | | | | | | | |
| | | | |
| New York: 10.92% | | | | | | | | | | | | | | | | |
Hempstead NY Local Development Corporation The Academy Charter School Project Series A (Education Revenue) | | | 7.65 | | | | 2-1-2044 | | | | 2,720,000 | | | | 3,117,746 | |
Liberty Development Corporation New York Series 1251 (Miscellaneous Revenue, Morgan Stanley Bank LIQ) 144Aø | | | 0.55 | | | | 10-1-2035 | | | | 7,914,000 | | | | 7,914,000 | |
Metropolitan Transportation Authority New York Dedicated Tax Fund Series A (Tax Revenue) | | | 5.00 | | | | 11-15-2024 | | | | 6,010,000 | | | | 7,379,559 | |
Metropolitan Transportation Authority New York Series A (Transportation Revenue) | | | 5.00 | | | | 11-15-2030 | | | | 4,010,000 | | | | 4,860,200 | |
Metropolitan Transportation Authority New York Series C (Transportation Revenue) | | | 5.25 | | | | 11-15-2028 | | | | 5,000,000 | | | | 6,505,100 | |
Metropolitan Transportation Authority New York Series C (Transportation Revenue) | | | 5.25 | | | | 11-15-2029 | | | | 11,100,000 | | | | 14,417,568 | |
Metropolitan Transportation Authority New York Series C (Transportation Revenue) | | | 5.25 | | | | 11-15-2030 | | | | 8,350,000 | | | | 10,824,773 | |
Metropolitan Transportation Authority New York Series C (Transportation Revenue) | | | 5.25 | | | | 11-15-2031 | | | | 4,500,000 | | | | 5,820,210 | |
| | | | |
| 16 | | Wells Fargo Intermediate Tax/AMT-Free Fund | | Portfolio of investments—June 30, 2016 |
| | | | | | | | | | | | | | | | |
| Security name | | Interest rate | | | Maturity date | | | Principal | | | Value | |
| | | | |
| New York (continued) | | | | | | | | | | | | | | | | |
Metropolitan Transportation Authority New York Series D (Transportation Revenue) | | | 5.00 | % | | | 11-15-2027 | | | $ | 2,000,000 | | | $ | 2,456,900 | |
Metropolitan Transportation Authority New York Series F (Transportation Revenue) | | | 5.00 | | | | 11-15-2025 | | | | 2,490,000 | | | | 3,219,595 | |
Metropolitan Transportation Authority New York Series F (Transportation Revenue) | | | 5.00 | | | | 11-15-2028 | | | | 2,450,000 | | | | 2,973,810 | |
Monroe County NY Industrial Development Corporation Revenue Monroe Community College Project Series A (Education Revenue, AGM Insured) | | | 5.00 | | | | 1-15-2022 | | | | 790,000 | | | | 911,818 | |
Monroe County NY Industrial Development Corporation Revenue Monroe Community College Project Series A (Education Revenue, AGM Insured) | | | 5.00 | | | | 1-15-2023 | | | | 645,000 | | | | 757,327 | |
Monroe County NY Industrial Development Corporation Revenue Monroe Community College Project Series A (Education Revenue, AGM Insured) | | | 5.00 | | | | 1-15-2024 | | | | 905,000 | | | | 1,078,624 | |
Monroe County NY Industrial Development Corporation St. John Fisher College Project Series A (Education Revenue) | | | 5.00 | | | | 6-1-2020 | | | | 2,125,000 | | | | 2,404,140 | |
Nassau County NY TAN Series A (GO Revenue) | | | 2.00 | | | | 9-15-2016 | | | | 5,000,000 | | | | 5,013,800 | |
Nassau NY Water Authority Series A (Water & Sewer Revenue) | | | 5.00 | | | | 4-1-2027 | | | | 350,000 | | | | 438,550 | |
Nassau NY Water Authority Series A (Water & Sewer Revenue) | | | 5.00 | | | | 4-1-2028 | | | | 300,000 | | | | 374,385 | |
Nassau NY Water Authority Series B (Water & Sewer Revenue) | | | 5.00 | | | | 4-1-2024 | | | | 400,000 | | | | 500,104 | |
Nassau NY Water Authority Series B (Water & Sewer Revenue) | | | 5.00 | | | | 4-1-2026 | | | | 755,000 | | | | 953,150 | |
New York Convention Center Development Corporation (Tax Revenue) | | | 5.00 | | | | 11-15-2028 | | | | 8,000,000 | | | | 10,219,040 | |
New York Dormitory Authority Interagency Council Pooled Loan Series A-1 (Miscellaneous Revenue) | | | 4.00 | | | | 7-1-2019 | | | | 740,000 | | | | 798,652 | |
New York Dormitory Authority Mount Sinai School of Medicine (Education Revenue) | | | 5.50 | | | | 7-1-2022 | | | | 2,000,000 | | | | 2,277,060 | |
New York Dormitory Authority North Shore-Long Island Jewish Obligated Group Series B (Health Revenue) ± | | | 1.16 | | | | 5-1-2018 | | | | 800,000 | | | | 798,944 | |
New York Dormitory Authority Series A (Tax Revenue) | | | 5.00 | | | | 3-15-2028 | | | | 5,000,000 | | | | 6,368,200 | |
New York Dormitory Authority Series B (Tax Revenue, Ambac Insured) | | | 5.50 | | | | 3-15-2025 | | | | 3,885,000 | | | | 5,199,296 | |
New York Dormitory Authority State University Educational Facilities Series A (Miscellaneous Revenue) | | | 5.50 | | | | 5-15-2019 | | | | 3,675,000 | | | | 4,036,804 | |
New York Dormitory Authority United Health Hospitals (Health Revenue, FHA Insured) | | | 4.50 | | | | 8-1-2018 | | | | 1,500,000 | | | | 1,584,645 | |
New York NY Municipal Water Finance Authority Series AA-2 (Water & Sewer Revenue, Dexia Credit Local SPA) ø | | | 0.50 | | | | 6-15-2032 | | | | 15,475,000 | | | | 15,475,000 | |
New York NY Municipal Water Finance Authority Series GG (Water & Sewer Revenue) | | | 5.00 | | | | 6-15-2029 | | | | 1,645,000 | | | | 2,091,469 | |
New York NY Series C (GO Revenue) | | | 5.00 | | | | 8-1-2031 | | | | 5,000,000 | | | | 6,231,500 | |
New York NY Series C & D (GO Revenue) | | | 5.00 | | | | 8-1-2028 | | | | 3,000,000 | | | | 3,843,750 | |
New York NY Series J-4 (GO Revenue) ± | | | 0.96 | | | | 8-1-2025 | | | | 10,000,000 | | | | 10,000,300 | |
New York NY Sub Series H-5 (GO Revenue, Dexia Credit Local LOC) ø | | | 0.60 | | | | 3-1-2034 | | | | 16,660,000 | | | | 16,660,000 | |
New York NY Transitional Finance Authority Prerefunded Balance Series A (Tax Revenue) | | | 5.00 | | | | 5-1-2023 | | | | 2,875,000 | | | | 3,221,265 | |
New York NY Transitional Finance Authority Series 3 Sub Series 3C (Tax Revenue, Dexia Credit Local SPA) ø | | | 0.64 | | | | 11-1-2022 | | | | 6,000,000 | | | | 6,000,000 | |
New York NY Transitional Finance Authority Series B (Tax Revenue) | | | 5.00 | | | | 8-1-2027 | | | | 1,115,000 | | | | 1,420,778 | |
New York NY Transitional Finance Authority Series C (Tax Revenue) | | | 5.00 | | | | 11-1-2027 | | | | 5,000,000 | | | | 6,405,700 | |
New York NY Transitional Finance Authority Sub Series 2-B (Tax Revenue, Dexia Credit Local SPA) ø## | | | 0.56 | | | | 11-1-2022 | | | | 23,400,000 | | | | 23,400,000 | |
New York NY Transitional Finance Authority Sub Series 2-A (Tax Revenue, Dexia Credit Local LIQ) ø | | | 0.60 | | | | 11-1-2022 | | | | 2,500,000 | | | | 2,500,000 | |
New York NY Transitional Finance Authority Sub Series B-1 (Tax Revenue) | | | 5.00 | | | | 11-1-2028 | | | | 1,000,000 | | | | 1,291,400 | |
New York NY Trust for Cultural Resources Series A-1 (Miscellaneous Revenue) | | | 5.00 | | | | 7-1-2031 | | | | 2,475,000 | | | | 2,864,837 | |
| | | | | | |
| Portfolio of investments—June 30, 2016 | | Wells Fargo Intermediate Tax/AMT-Free Fund | | | 17 | |
| | | | | | | | | | | | | | | | |
| Security name | | Interest rate | | | Maturity date | | | Principal | | | Value | |
| | | | |
| New York (continued) | | | | | | | | | | | | | | | | |
New York Urban Development Corporation Certificate of Participation James A Farley Post Office Project (Miscellaneous Revenue) 144A | | | 4.20 | % | | | 2-1-2017 | | | $ | 14,940,000 | | | $ | 14,945,976 | |
New York Urban Development Corporation Personal Income Tax Series A (Tax Revenue) | | | 5.00 | | | | 3-15-2031 | | | | 3,815,000 | | | | 4,730,180 | |
New York Urban Development Corporation Personal Income Tax Series A (Tax Revenue) | | | 5.00 | | | | 3-15-2029 | | | | 7,500,000 | | | | 9,692,175 | |
New York Urban Development Corporation Personal income Tax Series A (Tax Revenue) | | | 5.00 | | | | 3-15-2032 | | | | 5,000,000 | | | | 6,378,300 | |
New York Urban Development Corporation Series D (Miscellaneous Revenue, AGC Insured) | | | 5.50 | | | | 1-1-2019 | | | | 3,000,000 | | | | 3,354,240 | |
Niagara NY Area Development Corporation (Education Revenue) | | | 5.00 | | | | 5-1-2020 | | | | 1,160,000 | | | | 1,310,011 | |
Niagara NY Area Development Corporation (Education Revenue) | | | 5.00 | | | | 5-1-2022 | | | | 1,350,000 | | | | 1,586,129 | |
Oyster Bay NY RAN (GO Revenue) | | | 3.75 | | | | 3-31-2017 | | | | 2,000,000 | | | | 2,018,320 | |
Port Authority New York & New Jersey Special Obligation (Airport Revenue) | | | 5.00 | | | | 12-1-2020 | | | | 5,000,000 | | | | 5,732,850 | |
Suffolk County NY TAN (GO Revenue) ## | | | 2.00 | | | | 7-27-2016 | | | | 20,855,000 | | | | 20,875,438 | |
Suffolk NY Public Improvement Serial Bond Series A (GO Revenue, AGM Insured) | | | 3.00 | | | | 6-1-2019 | | | | 1,180,000 | | | | 1,249,714 | |
Suffolk NY Tobacco Asset Securitization Corporation Tobacco Settlement Series B (Tobacco Revenue) | | | 4.00 | | | | 6-1-2022 | | | | 420,000 | | | | 471,723 | |
Suffolk NY Tobacco Asset Securitization Corporation Tobacco Settlement Series B (Tobacco Revenue) | | | 5.00 | | | | 6-1-2023 | | | | 500,000 | | | | 587,510 | |
Troy NY Capital Resource Corporation Rensselaer Polytechnic Series B (Education Revenue) | | | 5.00 | | | | 9-1-2020 | | | | 1,430,000 | | | | 1,649,462 | |
Upper Mohawk Valley NY Regional Water Finance Authority Series A (Water & Sewer Revenue, AGC Insured) | | | 5.00 | | | | 4-1-2018 | | | | 435,000 | | | | 453,836 | |
Utility Debt Securitization Authority New York (Utilities Revenue) | | | 5.00 | | | | 12-15-2032 | | | | 1,250,000 | | | | 1,552,638 | |
Yonkers NY Series A (GO Revenue, AGM Insured) | | | 5.00 | | | | 10-1-2024 | | | | 1,000,000 | | | | 1,171,300 | |
| | | | |
| | | | | | | | | | | | | | | 292,369,801 | |
| | | | | | | | | | | | | | | | |
| | | | |
| North Carolina: 0.60% | | | | | | | | | | | | | | | | |
Craven County NC Certificate of Participation (Miscellaneous Revenue, National Insured) | | | 5.00 | | | | 6-1-2023 | | | | 4,400,000 | | | | 4,578,552 | |
New Hanover County NC Regional Medical Center (Health Revenue) | | | 5.00 | | | | 10-1-2020 | | | | 3,400,000 | | | | 3,927,170 | |
New Hanover County NC Regional Medical Center (Health Revenue) | | | 5.00 | | | | 10-1-2022 | | | | 250,000 | | | | 301,040 | |
New Hanover County NC Regional Medical Center (Health Revenue) | | | 5.00 | | | | 10-1-2023 | | | | 1,000,000 | | | | 1,225,210 | |
North Carolina Grant Anticipation Vehicle Bond (Miscellaneous Revenue) | | | 5.00 | | | | 3-1-2029 | | | | 2,470,000 | | | | 3,062,973 | |
Onslow County NC Limited Obligation Series A (Miscellaneous Revenue) | | | 4.00 | | | | 6-1-2022 | | | | 90,000 | | | | 103,626 | |
Pitt County NC Certificate of Participation School Facilities Project Prerefunded Balance (Miscellaneous Revenue, National Insured) | | | 5.00 | | | | 4-1-2023 | | | | 1,185,000 | | | | 1,224,318 | |
Pitt County NC Certificate of Participation School Facilities Project Unrefunded Balance (Miscellaneous Revenue, National Insured) | | | 5.00 | | | | 4-1-2023 | | | | 1,570,000 | | | | 1,621,669 | |
| | | | |
| | | | | | | | | | | | | | | 16,044,558 | |
| | | | | | | | | | | | | | | | |
| | | | |
| North Dakota: 0.18% | | | | | | | | | | | | | | | | |
Hazen ND Sakakawea Medical Center Project BAN (Health Revenue) | | | 2.50 | | | | 7-1-2017 | | | | 4,000,000 | | | | 4,008,360 | |
North Dakota Housing Finance Agency Series D (Housing Revenue) | | | 4.50 | | | | 1-1-2029 | | | | 665,000 | | | | 703,317 | |
| | | | |
| | | | | | | | | | | | | | | 4,711,677 | |
| | | | | | | | | | | | | | | | |
| | | | |
| Ohio: 2.43% | | | | | | | | | | | | | | | | |
Cincinnati OH City School District Improvement Project Certificate of Participation (Miscellaneous Revenue) | | | 5.00 | | | | 12-15-2024 | | | | 4,815,000 | | | | 5,977,293 | |
| | | | |
| 18 | | Wells Fargo Intermediate Tax/AMT-Free Fund | | Portfolio of investments—June 30, 2016 |
| | | | | | | | | | | | | | | | |
| Security name | | Interest rate | | | Maturity date | | | Principal | | | Value | |
| | | | |
| Ohio (continued) | | | | | | | | | | | | | | | | |
Cincinnati OH City School District Improvement Project Certificate of Participation (Miscellaneous Revenue) | | | 5.00 | % | | | 12-15-2025 | | | $ | 2,095,000 | | | $ | 2,595,265 | |
Clermont County OH Port Authority West Clermont Local School District Project (Miscellaneous Revenue, Build America Mutual Assurance Company Insured) | | | 5.00 | | | | 12-1-2025 | | | | 500,000 | | | | 627,985 | |
Clermont County OH Port Authority West Clermont Local School District Project (Miscellaneous Revenue, Build America Mutual Assurance Company Insured) | | | 5.00 | | | | 12-1-2026 | | | | 600,000 | | | | 748,908 | |
Clermont County OH Port Authority West Clermont Local School District Project (Miscellaneous Revenue, Build America Mutual Assurance Company Insured) | | | 5.00 | | | | 12-1-2028 | | | | 1,250,000 | | | | 1,538,500 | |
JobsOhio Beverage System Statewide Liquor Profits Senior Lien Series A (Miscellaneous Revenue) | | | 5.00 | | | | 1-1-2022 | | | | 2,500,000 | | | | 2,989,700 | |
Kent University Ohio General Receipts Series B (Education Revenue, AGC Insured) | | | 5.00 | | | | 5-1-2018 | | | | 1,165,000 | | | | 1,256,150 | |
Ohio Air Quality Development Authority Series A (Utilities Revenue) ± | | | 3.75 | | | | 12-1-2023 | | | | 2,000,000 | | | | 2,054,640 | |
Ohio Air Quality Development Authority Series B (Industrial Development Revenue) ± | | | 3.63 | | | | 10-1-2033 | | | | 1,750,000 | | | | 1,789,113 | |
Ohio Air Quality Development Authority Series B (Industrial Development Revenue) ± | | | 3.63 | | | | 12-1-2033 | | | | 2,500,000 | | | | 2,558,250 | |
Ohio Building Authority Series A (Miscellaneous Revenue) | | | 5.00 | | | | 10-1-2024 | | | | 1,000,000 | | | | 1,175,170 | |
Ohio Turnpike Commission Junior Lien Infrastructure Projects Series A-1 (Transportation Revenue) | | | 5.25 | | | | 2-15-2029 | | | | 1,000,000 | | | | 1,234,570 | |
Ohio University Hospital Health Systems Series B (Health Revenue) ø | | | 0.72 | | | | 1-15-2033 | | | | 9,500,000 | | | | 9,500,000 | |
Ohio Water Development Authority Pollution Control First Energy Nuclear Generation Project Series A (Water & Sewer Revenue) ± | | | 3.75 | | | | 6-1-2033 | | | | 10,000,000 | | | | 10,278,900 | |
Ohio Water Development Authority Pollution Control First Energy Nuclear Generation Project Series B (Industrial Development Revenue) ± | | | 3.63 | | | | 10-1-2033 | | | | 3,150,000 | | | | 3,220,403 | |
Ohio Water Development Authority Series A (Industrial Development Revenue) ± | | | 3.75 | | | | 7-1-2033 | | | | 15,000,000 | | | | 15,427,050 | |
RiverSouth Authority Ohio Lazarus Building Redevelopment Series A (Miscellaneous Revenue) | | | 5.75 | | | | 12-1-2027 | | | | 950,000 | | | | 1,000,540 | |
Summit County OH Port Authority University of Akron Student Housing Project (Education Revenue) | | | 5.25 | | | | 1-1-2024 | | | | 315,000 | | | | 365,501 | |
Summit County OH Port Authority University of Akron Student Housing Project (Education Revenue) | | | 5.25 | | | | 1-1-2024 | | | | 685,000 | | | | 814,534 | |
| | | | |
| | | | | | | | | | | | | | | 65,152,472 | |
| | | | | | | | | | | | | | | | |
| | | | |
| Oklahoma: 1.88% | | | | | | | | | | | | | | | | |
Carter County OK Public Facilities Authority Educational Facilities Plainview Public School Project (Miscellaneous Revenue) | | | 5.00 | | | | 12-1-2026 | | | | 1,000,000 | | | | 1,271,800 | |
Carter County OK Public Facilities Authority Educational Facilities Plainview Public School Project (Miscellaneous Revenue) | | | 5.00 | | | | 12-1-2027 | | | | 1,000,000 | | | | 1,266,530 | |
Carter County OK Public Facilities Authority Educational Facilities Plainview Public School Project (Miscellaneous Revenue) | | | 5.00 | | | | 12-1-2028 | | | | 1,285,000 | | | | 1,620,411 | |
Claremore OK Public Works Authority (Utilities Revenue) | | | 4.00 | | | | 6-1-2019 | | | | 1,325,000 | | | | 1,431,967 | |
Claremore OK Public Works Authority (Utilities Revenue) | | | 4.00 | | | | 6-1-2022 | | | | 2,595,000 | | | | 2,934,841 | |
Claremore OK Public Works Authority (Utilities Revenue) | | | 4.00 | | | | 6-1-2023 | | | | 1,010,000 | | | | 1,137,412 | |
Cleveland County OK Educational Facilities Authority Moore Public Schools Project (Miscellaneous Revenue) | | | 5.00 | | | | 6-1-2023 | | | | 2,445,000 | | | | 2,961,164 | |
Creek County OK Educational Facilities Sapulpa Public Schools Project (Miscellaneous Revenue) | | | 5.00 | | | | 9-1-2023 | | | | 3,000,000 | | | | 3,655,680 | |
Cushing OK Educational Facilities Authority (Miscellaneous Revenue) | | | 5.00 | | | | 9-1-2022 | | | | 2,210,000 | | | | 2,681,039 | |
Garvin County OK Educational Facilities Authority Lindsay Public Schools Project (Miscellaneous Revenue) | | | 5.00 | | | | 9-1-2018 | | | | 820,000 | | | | 887,863 | |
Garvin County OK Educational Facilities Authority Lindsay Public Schools Project (Miscellaneous Revenue) | | | 5.00 | | | | 9-1-2019 | | | | 860,000 | | | | 959,975 | |
| | | | | | |
| Portfolio of investments—June 30, 2016 | | Wells Fargo Intermediate Tax/AMT-Free Fund | | | 19 | |
| | | | | | | | | | | | | | | | |
| Security name | | Interest rate | | | Maturity date | | | Principal | | | Value | |
| | | | |
| Oklahoma (continued) | | | | | | | | | | | | | | | | |
Garvin County OK Educational Facilities Authority Lindsay Public Schools Project (Miscellaneous Revenue) | | | 5.00 | % | | | 9-1-2020 | | | $ | 455,000 | | | $ | 519,246 | |
Garvin County OK Educational Facilities Authority Lindsay Public Schools Project (Miscellaneous Revenue) | | | 5.00 | | | | 9-1-2026 | | | | 1,000,000 | | | | 1,232,570 | |
Garvin County OK Educational Facilities Authority Lindsay Public Schools Project (Miscellaneous Revenue) | | | 5.00 | | | | 9-1-2027 | | | | 500,000 | | | | 613,180 | |
Grady County OK Educational FacilitiesTuttle Public Schools Project (Miscellaneous Revenue) | | | 5.00 | | | | 9-1-2023 | | | | 1,000,000 | | | | 1,220,820 | |
Grady County OK Educational FacilitiesTuttle Public Schools Project (Miscellaneous Revenue) | | | 5.00 | | | | 9-1-2024 | | | | 1,075,000 | | | | 1,332,764 | |
Grady County OK Educational FacilitiesTuttle Public Schools Project (Miscellaneous Revenue) | | | 5.00 | | | | 9-1-2025 | | | | 500,000 | | | | 627,145 | |
Grady County OK Educational FacilitiesTuttle Public Schools Project (Miscellaneous Revenue) | | | 5.00 | | | | 9-1-2028 | | | | 1,160,000 | | | | 1,428,331 | |
McGee Creek OK Authority (Water & Sewer Revenue, National Insured) | | | 6.00 | | | | 1-1-2023 | | | | 1,490,000 | | | | 1,688,334 | |
Muskogee OK Industrial Trust Educational Facilities (Miscellaneous Revenue) | | | 5.00 | | | | 9-1-2020 | | | | 1,000,000 | | | | 1,131,670 | |
Muskogee OK Industrial Trust Educational Facilities (Miscellaneous Revenue) | | | 5.00 | | | | 9-1-2021 | | | | 1,000,000 | | | | 1,150,310 | |
Muskogee OK Industrial Trust Educational Facilities (Miscellaneous Revenue) | | | 5.00 | | | | 9-1-2022 | | | | 1,000,000 | | | | 1,165,910 | |
Oklahoma City OK Public Property Authority (Tax Revenue) | | | 5.00 | | | | 10-1-2026 | | | | 1,495,000 | | | | 1,873,175 | |
Oklahoma City OK Public Property Authority (Tax Revenue) | | | 5.00 | | | | 10-1-2027 | | | | 1,140,000 | | | | 1,419,642 | |
Oklahoma City OK Public Property Authority (Tax Revenue) | | | 5.00 | | | | 10-1-2028 | | | | 1,265,000 | | | | 1,569,296 | |
Oklahoma Development Finance Authority (Miscellaneous Revenue) | | | 4.00 | | | | 6-1-2023 | | | | 1,270,000 | | | | 1,477,632 | |
Oklahoma Development Finance Authority (Miscellaneous Revenue) | | | 5.00 | | | | 6-1-2023 | | | | 1,230,000 | | | | 1,506,209 | |
Oklahoma Development Finance Authority Higher Education Master Real Property Series B (Miscellaneous Revenue) | | | 4.00 | | | | 6-1-2024 | | | | 1,270,000 | | | | 1,495,514 | |
Tulsa OK Airports Improvement Trust Series D (Airport Revenue, Build America Mutual Assurance Company Insured) | | | 5.00 | | | | 6-1-2019 | | | | 1,500,000 | | | | 1,659,225 | |
Tulsa OK Airports Improvement Trust Series D (Airport Revenue, Build America Mutual Assurance Company Insured) | | | 5.00 | | | | 6-1-2021 | | | | 1,185,000 | | | | 1,338,825 | |
Tulsa OK Airports Improvement Trust Series D (Airport Revenue, Build America Mutual Assurance Company Insured) | | | 5.00 | | | | 6-1-2022 | | | | 520,000 | | | | 588,229 | |
Tulsa OK Airports Improvement Trust Series D (Airport Revenue, Build America Mutual Assurance Company Insured) | | | 5.00 | | | | 6-1-2025 | | | | 1,200,000 | | | | 1,353,864 | |
Tulsa OK Airports Improvement Trust Series D (Airport Revenue, Build America Mutual Assurance Company Insured) | | | 5.00 | | | | 6-1-2026 | | | | 1,250,000 | | | | 1,406,300 | |
Tulsa OK Airports Improvement Trust Series D (Airport Revenue, Build America Mutual Assurance Company Insured) | | | 5.00 | | | | 6-1-2027 | | | | 1,000,000 | | | | 1,120,600 | |
Tulsa OK Airports Improvement Trust Series D (Airport Revenue, Build America Mutual Assurance Company Insured) | | | 5.00 | | | | 6-1-2028 | | | | 500,000 | | | | 559,310 | |
| | | | |
| | | | | | | | | | | | | | | 50,286,783 | |
| | | | | | | | | | | | | | | | |
| | | | |
| Oregon: 0.05% | | | | | | | | | | | | | | | | |
Medford OR Hospital Facilities Authority (Health Revenue) | | | 5.00 | | | | 10-1-2020 | | | | 1,155,000 | | | | 1,312,992 | |
| | | | | | | | | | | | | | | | |
| | | | |
| Pennsylvania: 8.19% | | | | | | | | | | | | | | | | |
Adams County PA IDA Gettysburg College Project (Education Revenue) | | | 5.00 | | | | 8-15-2024 | | | | 1,500,000 | | | | 1,703,895 | |
Adams County PA IDA Gettysburg College Project (Education Revenue) | | | 5.00 | | | | 8-15-2025 | | | | 1,500,000 | | | | 1,699,410 | |
Allegheny County PA Hospital Development Authority Series B (Health Revenue, National Insured) | | | 6.00 | | | | 7-1-2025 | | | | 2,605,000 | | | | 3,495,233 | |
Allegheny County PA Moon Area School District Series A (GO Revenue) | | | 5.00 | | | | 11-15-2024 | | | | 3,400,000 | | | | 4,268,972 | |
Allegheny County PA Series 72 (GO Revenue) | | | 5.25 | | | | 12-1-2033 | | | | 4,000,000 | | | | 4,938,760 | |
| | | | |
| 20 | | Wells Fargo Intermediate Tax/AMT-Free Fund | | Portfolio of investments—June 30, 2016 |
| | | | | | | | | | | | | | | | |
| Security name | | Interest rate | | | Maturity date | | | Principal | | | Value | |
| | | | |
| Pennsylvania (continued) | | | | | | | | | | | | | | | | |
Allegheny County PA Series 75 (GO Revenue) %% | | | 5.00 | % | | | 11-1-2026 | | | $ | 2,500,000 | | | $ | 3,231,900 | |
Beaver County PA IDA FirstEnergy Generation Series B (Industrial Development Revenue) ± | | | 3.50 | | | | 12-1-2035 | | | | 5,000,000 | | | | 5,093,550 | |
Berks County PA Municipal Authority Reading Hospital & Medical Center Project Series B (Health Revenue) ± | | | 1.93 | | | | 11-1-2039 | | | | 10,000,000 | | | | 10,079,100 | |
Bucks County PA Water & Sewer Authority Water System (Water & Sewer Revenue, AGM Insured) | | | 5.00 | | | | 12-1-2026 | | | | 2,400,000 | | | | 2,841,240 | |
Central Dauphin PA School District (GO Revenue) | | | 5.00 | | | | 2-1-2029 | | | | 825,000 | | | | 1,045,580 | |
Central Dauphin PA School District (GO Revenue) | | | 5.00 | | | | 2-1-2030 | | | | 1,110,000 | | | | 1,400,054 | |
Central Greene PA School District Series B (GO Revenue, Build America Mutual Assurance Company Insured) | | | 5.00 | | | | 2-15-2019 | | | | 865,000 | | | | 952,512 | |
Chester County PA IDA Avon Grove Charter School Project Series A (Education Revenue) | | | 5.65 | | | | 12-15-2017 | | | | 250,000 | | | | 257,653 | |
Cumberland County PA Diakon Lutheran Social Ministries Project (Health Revenue) | | | 5.00 | | | | 1-1-2025 | | | | 1,340,000 | | | | 1,638,820 | |
Cumberland County PA Diakon Lutheran Social Ministries Project (Health Revenue) | | | 5.00 | | | | 1-1-2026 | | | | 1,370,000 | | | | 1,664,810 | |
Cumberland County PA Diakon Lutheran Social Ministries Project (Health Revenue) | | | 5.00 | | | | 1-1-2027 | | | | 1,225,000 | | | | 1,474,925 | |
Delaware County PA Vocational & Technical School Authority (Miscellaneous Revenue, Build America Mutual Assurance Company Insured) | | | 5.25 | | | | 11-1-2033 | | | | 2,000,000 | | | | 2,412,620 | |
Delaware Valley PA Regional Finance Authority Series 2182 (Miscellaneous Revenue, Morgan Stanley Bank LIQ) 144Aø | | | 0.64 | | | | 7-1-2017 | | | | 7,500,000 | | | | 7,500,000 | |
Delaware Valley PA Regional Finance Authority Series B (Miscellaneous Revenue, Bayerische Landesbank LOC) ø | | | 0.54 | | | | 6-1-2042 | | | | 8,400,000 | | | | 8,400,000 | |
Johnstown PA School District (GO Revenue, AGM Insured) | | | 5.00 | | | | 8-1-2024 | | | | 2,730,000 | | | | 3,190,961 | |
Lancaster County PA Solid Waste Management Authority Series A (Resource Recovery Revenue) | | | 5.25 | | | | 12-15-2028 | | | | 5,665,000 | | | | 6,926,935 | |
Lycoming County PA Authority Pennsylvania College of Technology (Education Revenue) | | | 5.50 | | | | 7-1-2026 | | | | 4,000,000 | | | | 4,769,440 | |
Millcreek Richland Joint Authority Pennsylvania Series B (Water & Sewer Revenue, AGC Insured) | | | 4.70 | | | | 8-1-2017 | | | | 195,000 | | | | 200,405 | |
Moon Area PA School District Series A (GO Revenue) | | | 5.00 | | | | 11-15-2029 | | | | 1,000,000 | | | | 1,220,350 | |
Northampton County PA General Purpose Hospital Authority St. Luke’s Hospital Project Series C (Health Revenue) ± | | | 4.50 | | | | 8-15-2032 | | | | 1,170,000 | | | | 1,174,926 | |
Northeastern Pennsylvania Hospital & Education Authority Series A (Education Revenue) | | | 5.00 | | | | 3-1-2026 | | | | 515,000 | | | | 635,098 | |
Northeastern Pennsylvania Hospital & Education Authority Series A (Education Revenue) | | | 5.00 | | | | 3-1-2028 | | | | 660,000 | | | | 804,738 | |
Pennsylvania HEFAR Series AQ (Education Revenue) | | | 5.00 | | | | 6-15-2023 | | | | 6,090,000 | | | | 7,458,971 | |
Pennsylvania HEFAR Series AR (Education Revenue) | | | 5.00 | | | | 6-15-2025 | | | | 1,000,000 | | | | 1,261,600 | |
Pennsylvania HEFAR Series AS (Education Revenue) | | | 5.00 | | | | 6-15-2024 | | | | 1,530,000 | | | | 1,904,085 | |
Pennsylvania HEFAR Series AS (Education Revenue) | | | 5.00 | | | | 6-15-2025 | | | | 1,575,000 | | | | 1,987,020 | |
Pennsylvania HEFAR Series AS (Education Revenue) | | | 5.00 | | | | 6-15-2027 | | | | 1,790,000 | | | | 2,261,289 | |
Pennsylvania HEFAR Series LL1 (Education Revenue) | | | 5.00 | | | | 11-1-2019 | | | | 880,000 | | | | 941,222 | |
Pennsylvania HEFAR Series LL1 (Education Revenue) | | | 5.00 | | | | 11-1-2020 | | | | 590,000 | | | | 638,870 | |
Pennsylvania HEFAR Series LL1 (Education Revenue) | | | 5.00 | | | | 11-1-2022 | | | | 1,310,000 | | | | 1,440,266 | |
Pennsylvania Hills PA School District (GO Revenue, Build America Mutual Assurance Company Insured) | | | 4.00 | | | | 10-1-2021 | | | | 1,460,000 | | | | 1,588,130 | |
Pennsylvania Public School Building Authority (Miscellaneous Revenue) | | | 5.00 | | | | 4-1-2024 | | | | 2,000,000 | | | | 2,245,200 | |
Pennsylvania Public School Building Authority (Miscellaneous Revenue, Build America Mutual Assurance Company Insured) | | | 4.00 | | | | 5-15-2021 | | | | 500,000 | | | | 557,370 | |
Pennsylvania Public School Building Authority (Miscellaneous Revenue, Build America Mutual Assurance Company Insured) | | | 4.00 | | | | 5-15-2022 | | | | 1,000,000 | | | | 1,107,310 | |
Pennsylvania Public School Building Authority (Miscellaneous Revenue) | | | 5.00 | | | | 4-1-2020 | | | | 5,600,000 | | | | 6,200,040 | |
Pennsylvania Public School Building Authority (Education Revenue) | | | 5.00 | | | | 5-1-2023 | | | | 2,185,000 | | | | 2,642,736 | |
| | | | | | |
| Portfolio of investments—June 30, 2016 | | Wells Fargo Intermediate Tax/AMT-Free Fund | | | 21 | |
| | | | | | | | | | | | | | | | |
| Security name | | Interest rate | | | Maturity date | | | Principal | | | Value | |
| | | | |
| Pennsylvania (continued) | | | | | | | | | | | | | | | | |
Pennsylvania Public School Building Authority (Education Revenue) | | | 5.00 | % | | | 6-15-2025 | | | $ | 2,265,000 | | | $ | 2,775,667 | |
Pennsylvania Public School Building Authority (Miscellaneous Revenue) | | | 5.00 | | | | 4-1-2029 | | | | 1,000,000 | | | | 1,092,200 | |
Pennsylvania Public School Building Authority Series A (Miscellaneous Revenue, AGM Insured) %% | | | 5.00 | | | | 12-1-2030 | | | | 8,300,000 | | | | 10,243,694 | |
Pennsylvania Public School Building Authority Series B (Miscellaneous Revenue, AGM Insured) | | | 5.00 | | | | 6-1-2029 | | | | 2,000,000 | | | | 2,438,580 | |
Pennsylvania Public School Building Authority Series B-2 (Miscellaneous Revenue, Build America Mutual Assurance Company Insured) | | | 5.00 | | | | 12-1-2024 | | | | 1,250,000 | | | | 1,549,700 | |
Pennsylvania Public School Building Authority Series B-2 (Miscellaneous Revenue, Build America Mutual Assurance Company Insured) | | | 5.00 | | | | 12-1-2025 | | | | 1,250,000 | | | | 1,570,900 | |
Pennsylvania Public School Building Authority Series B-2 (Miscellaneous Revenue, Build America Mutual Assurance Company Insured) | | | 5.00 | | | | 12-1-2026 | | | | 1,250,000 | | | | 1,564,225 | |
Pennsylvania Public School Building Authority Series B-2 (Miscellaneous Revenue, Build America Mutual Assurance Company Insured) | | | 5.00 | | | | 12-1-2027 | | | | 1,010,000 | | | | 1,257,420 | |
Pennsylvania Series 2 (GO Revenue) | | | 5.00 | | | | 4-15-2023 | | | | 2,000,000 | | | | 2,222,020 | |
Pennsylvania Turnpike Commission Sub Series B (Transportation Revenue) | | | 5.00 | | | | 6-1-2029 | | | | 10,000,000 | | | | 12,276,200 | |
Pennsylvania Turnpike Commission Sub Series C (Transportation Revenue, AGM Insured) | | | 6.25 | | | | 6-1-2033 | | | | 1,350,000 | | | | 1,830,519 | |
Pennsylvania Turnpike Commission Sub Series E (Transportation Revenue) ¤ | | | 0.00 | | | | 12-1-2038 | | | | 2,000,000 | | | | 2,537,080 | |
Philadelphia PA Authority for Industrial Development (Education Revenue) | | | 5.88 | | | | 6-15-2022 | | | | 1,000,000 | | | | 1,102,690 | |
Philadelphia PA Authority for Industrial Development (Education Revenue) | | | 6.13 | | | | 6-15-2023 | | | | 1,305,000 | | | | 1,457,698 | |
Philadelphia PA Authority for Industrial Development (Education Revenue) | | | 7.00 | | | | 5-1-2026 | | | | 740,000 | | | | 797,875 | |
Philadelphia PA Gas Works 8th General Ordinance Series A (Utilities Revenue) | | | 5.00 | | | | 8-1-2016 | | | | 1,000,000 | | | | 1,003,840 | |
Philadelphia PA Hospital & HEFAR Refunding Bond Temple University Health System Series B (Health Revenue) | | | 6.25 | | | | 7-1-2023 | | | | 1,475,000 | | | | 1,536,021 | |
Philadelphia PA IDA Master Charter School (Education Revenue) | | | 5.00 | | | | 8-1-2020 | | | | 510,000 | | | | 542,951 | |
Philadelphia PA IDA West Philadelphia Achievement Charter Elementary School Project (Education Revenue) | | | 6.25 | | | | 5-1-2021 | | | | 285,000 | | | | 301,744 | |
Philadelphia PA School District Refunding Bond Series C (GO Revenue) | | | 5.00 | | | | 9-1-2018 | | | | 8,065,000 | | | | 8,627,534 | |
Philadelphia PA School District Refunding Bond Series C (GO Revenue) | | | 5.00 | | | | 9-1-2021 | | | | 2,200,000 | | | | 2,477,552 | |
Philadelphia PA School District Refunding Bond Series D (GO Revenue) | | | 5.00 | | | | 9-1-2022 | | | | 3,750,000 | | | | 4,236,225 | |
Philadelphia PA School District Refunding Bond Series E (GO Revenue) | | | 5.25 | | | | 9-1-2021 | | | | 1,490,000 | | | | 1,654,332 | |
Philadelphia PA Series A (GO Revenue) | | | 5.00 | | | | 9-15-2021 | | | | 7,000,000 | | | | 8,298,150 | |
Philadelphia PA Series A (GO Revenue) | | | 5.00 | | | | 8-1-2024 | | | | 1,000,000 | | | | 1,235,970 | |
Philadelphia PA Series A (GO Revenue) | | | 5.00 | | | | 7-15-2026 | | | | 3,000,000 | | | | 3,649,860 | |
Philadelphia PA Series A (GO Revenue) | | | 5.25 | | | | 7-15-2028 | | | | 2,590,000 | | | | 3,196,630 | |
Philadelphia PA Series A (GO Revenue) | | | 5.25 | | | | 7-15-2029 | | | | 4,410,000 | | | | 5,432,459 | |
Philadelphia PA Series A (GO Revenue) | | | 5.25 | | | | 7-15-2032 | | | | 4,380,000 | | | | 5,344,476 | |
Pittsburgh PA Series A (GO Revenue) | | | 4.00 | | | | 9-1-2022 | | | | 1,000,000 | | | | 1,156,550 | |
Pittsburgh PA Series A (GO Revenue) | | | 5.00 | | | | 9-1-2022 | | | | 2,060,000 | | | | 2,504,054 | |
Pittsburgh PA Series A (GO Revenue) | | | 5.00 | | | | 9-1-2023 | | | | 3,810,000 | | | | 4,612,043 | |
Reading PA School District (GO Revenue) | | | 5.00 | | | | 4-1-2021 | | | | 3,120,000 | | | | 3,524,882 | |
| | | | |
| | | | | | | | | | | | | | | 219,307,737 | |
| | | | | | | | | | | | | | | | |
| | | | |
| Puerto Rico: 0.05% | | | | | | | | | | | | | | | | |
Puerto Rico Public Improvement Refunding Bond Series A (Tax Revenue, National Insured) | | | 5.50 | | | | 7-1-2016 | | | | 1,350,000 | | | | 1,350,135 | |
| | | | | | | | | | | | | | | | |
| | | | |
| Rhode Island: 0.18% | | | | | | | | | | | | | | | | |
Providence RI Series A (GO Revenue, AGM Insured) | | | 4.00 | | | | 1-15-2018 | | | | 2,115,000 | | | | 2,205,437 | |
Rhode Island Health & Educational Building Corporation Providence Public Schools Financing Program Series A (Miscellaneous Revenue, AGM Insured) | | | 5.00 | | | | 5-15-2022 | | | | 2,425,000 | | | | 2,516,932 | |
| | | | |
| | | | | | | | | | | | | | | 4,722,369 | |
| | | | | | | | | | | | | | | | |
| | | | |
| 22 | | Wells Fargo Intermediate Tax/AMT-Free Fund | | Portfolio of investments—June 30, 2016 |
| | | | | | | | | | | | | | | | |
| Security name | | Interest rate | | | Maturity date | | | Principal | | | Value | |
| | | | |
| South Carolina: 1.36% | | | | | | | | | | | | | | | | |
Connector 2000 Association Incorporated CAB Series A (Transportation Revenue) ¤ | | | 0.00 | % | | | 1-1-2017 | | | $ | 35,996 | | | $ | 32,576 | |
Connector 2000 Association Incorporated CAB Series A (Transportation Revenue) ¤ | | | 0.00 | | | | 1-1-2018 | | | | 39,781 | | | | 29,835 | |
Laurens County SC Education Assistance for District #55 (Miscellaneous Revenue) | | | 5.00 | | | | 12-1-2021 | | | | 1,000,000 | | | | 1,176,940 | |
Laurens County SC Education Assistance for District #55 (Miscellaneous Revenue) | | | 5.00 | | | | 12-1-2022 | | | | 1,250,000 | | | | 1,495,500 | |
Laurens County SC Education Assistance for District #55 (Miscellaneous Revenue) | | | 5.00 | | | | 12-1-2025 | | | | 1,000,000 | | | | 1,252,070 | |
Lee County SC School Facilities Incorporated Series 2006 (Miscellaneous Revenue, AGC Insured) | | | 6.00 | | | | 12-1-2016 | | | | 590,000 | | | | 602,956 | |
Piedmont SC Municipal Power Agency Series A-3 (Utilities Revenue) | | | 5.25 | | | | 1-1-2019 | | | | 3,500,000 | | | | 3,727,850 | |
Scago SC Educational Facilities Corporation For Sumter County School District 17 (Miscellaneous Revenue) | | | 4.00 | | | | 12-1-2019 | | | | 1,000,000 | | | | 1,084,990 | |
Scago SC Educational Facilities Corporation For Sumter County School District 17 (Miscellaneous Revenue) | | | 5.00 | | | | 12-1-2022 | | | | 1,720,000 | | | | 2,034,777 | |
South Carolina Education Assistance Authority Student Loan Series I (Education Revenue) | | | 5.00 | | | | 10-1-2024 | | | | 2,675,000 | | | | 2,906,816 | |
South Carolina Jobs EDA Furman University Project (Education Revenue) | | | 5.00 | | | | 10-1-2028 | | | | 700,000 | | | | 875,889 | |
South Carolina Jobs EDA Furman University Project (Education Revenue) | | | 5.00 | | | | 10-1-2030 | | | | 1,885,000 | | | | 2,331,745 | |
South Carolina Jobs EDA Furman University Project (Education Revenue) | | | 5.00 | | | | 10-1-2031 | | | | 2,155,000 | | | | 2,653,538 | |
South Carolina Jobs EDA York Preparatory Academy Project Series A (Education Revenue) | | | 7.00 | | | | 11-1-2033 | | | | 1,000,000 | | | | 1,128,350 | |
South Carolina Public Service Authority Series A (Utilities Revenue) | | | 5.00 | | | | 12-1-2037 | | | | 12,215,000 | | | | 15,015,380 | |
| | | | |
| | | | | | | | | | | | | | | 36,349,212 | |
| | | | | | | | | | | | | | | | |
| | | | |
| South Dakota: 0.04% | | | | | | | | | | | | | | | | |
Rapid City SD Airport Project (Airport Revenue) | | | 6.25 | | | | 12-1-2026 | | | | 920,000 | | | | 1,035,083 | |
| | | | | | | | | | | | | | | | |
| | | | |
| Tennessee: 0.34% | | | | | | | | | | | | | | | | |
Chattanooga TN Health Educational & Housing Facilities University of Tennessee at Chattanooga Project (Housing Revenue) | | | 5.00 | | | | 10-1-2023 | | | | 750,000 | | | | 905,115 | |
Franklin County TN HEFA (Education Revenue) | | | 4.00 | | | | 9-1-2024 | | | | 250,000 | | | | 285,583 | |
Franklin County TN HEFA (Education Revenue) | | | 5.00 | | | | 9-1-2030 | | | | 560,000 | | | | 667,425 | |
Shelby County TN Health Educational & Housing Facilities Board Le Bonheur Children’s Medical Center Series D (Health Revenue, National Insured) | | | 5.50 | | | | 8-15-2019 | | | | 445,000 | | | | 476,720 | |
Tennessee Energy Acquisition Corporation Series A (Utilities Revenue) | | | 5.00 | | | | 9-1-2016 | | | | 500,000 | | | | 503,510 | |
Tennessee Energy Acquisition Corporation Series A (Utilities Revenue) | | | 5.25 | | | | 9-1-2017 | | | | 2,140,000 | | | | 2,240,494 | |
Tennessee Energy Acquisition Corporation Series A (Utilities Revenue) | | | 5.25 | | | | 9-1-2018 | | | | 1,400,000 | | | | 1,519,784 | |
Tennessee Energy Acquisition Corporation Series C (Utilities Revenue) | | | 5.00 | | | | 2-1-2027 | | | | 2,000,000 | | | | 2,464,580 | |
| | | | |
| | | | | | | | | | | | | | | 9,063,211 | |
| | | | | | | | | | | | | | | | |
| | | | |
| Texas: 9.69% | | | | | | | | | | | | | | | | |
Austin TX Independent School District Series B (GO Revenue) | | | 5.00 | | | | 8-1-2023 | | | | 3,805,000 | | | | 4,742,704 | |
Austin TX Independent School District Series B (GO Revenue) | | | 5.00 | | | | 8-1-2024 | | | | 3,970,000 | | | | 5,043,647 | |
Austin TX Independent School District Series B (GO Revenue) | | | 5.00 | | | | 8-1-2025 | | | | 2,050,000 | | | | 2,653,438 | |
Austin TX Independent School District Series B (GO Revenue) | | | 5.00 | | | | 8-1-2026 | | | | 1,450,000 | | | | 1,872,922 | |
Austin TX Refunding Bond (Water & Sewer Revenue) | | | 5.00 | | | | 11-15-2030 | | | | 2,000,000 | | | | 2,590,020 | |
Austin TX Refunding Bond (Utilities Revenue, National Insured) | | | 5.25 | | | | 5-15-2025 | | | | 1,400,000 | | | | 1,752,520 | |
Bexar County TX Combination Tax Certificate of Obligation (GO Revenue) | | | 5.00 | | | | 6-15-2024 | | | | 1,000,000 | | | | 1,266,770 | |
Bexar County TX Limited Tax Refunding Bond (GO Revenue) %% | | | 4.00 | | | | 6-15-2032 | | | | 2,000,000 | | | | 2,303,540 | |
Bexar County TX Limited Tax Refunding Bond (GO Revenue) %% | | | 5.00 | | | | 6-15-2026 | | | | 2,140,000 | | | | 2,743,694 | |
Bexar County TX Limited Tax Refunding Bond (GO Revenue) %% | | | 5.00 | | | | 6-15-2027 | | | | 3,205,000 | | | | 4,071,824 | |
Brownsville TX Utilities System Refunding Bond (Utilities Revenue) | | | 5.00 | | | | 9-1-2026 | | | | 2,190,000 | | | | 2,767,175 | |
| | | | | | |
| Portfolio of investments—June 30, 2016 | | Wells Fargo Intermediate Tax/AMT-Free Fund | | | 23 | |
| | | | | | | | | | | | | | | | |
| Security name | | Interest rate | | | Maturity date | | | Principal | | | Value | |
| | | | |
| Texas (continued) | | | | | | | | | | | | | | | | |
Brownsville TX Utilities System Refunding Bond (Utilities Revenue) | | | 5.00 | % | | | 9-1-2029 | | | $ | 1,500,000 | | | $ | 1,867,185 | |
Brownsville TX Utilities System Refunding Bond (Utilities Revenue) | | | 5.00 | | | | 9-1-2030 | | | | 2,500,000 | | | | 3,094,700 | |
Central Texas Regional Mobility Authority Prerefunded Senior Lien (Transportation Revenue) | | | 5.75 | | | | 1-1-2019 | | | | 985,000 | | | | 1,106,362 | |
Central Texas Regional Mobility Authority Series B (Transportation Revenue) ± | | | 5.00 | | | | 1-1-2045 | | | | 8,000,000 | | | | 9,047,600 | |
Central Texas Regional Mobility Authority Unrefunded Senior Lien (Transportation Revenue) | | | 5.75 | | | | 1-1-2019 | | | | 325,000 | | | | 362,720 | |
Collin County TX Unlimited Tax Road & Refunding Bond (GO Revenue) | | | 5.00 | | | | 2-15-2023 | | | | 1,350,000 | | | | 1,674,905 | |
Collin County TX Unlimited Tax Road & Refunding Bond (GO Revenue) | | | 5.00 | | | | 2-15-2026 | | | | 1,000,000 | | | | 1,286,600 | |
Collin County TX Unlimited Tax Road & Refunding Bond (GO Revenue) | | | 5.00 | | | | 2-15-2027 | | | | 1,300,000 | | | | 1,650,116 | |
Crane County TX Water District Unlimited Tax Bond (GO Revenue) | | | 5.00 | | | | 2-15-2022 | | | | 1,515,000 | | | | 1,769,687 | |
Crane County TX Water District Unlimited Tax Bond (GO Revenue) | | | 5.00 | | | | 2-15-2023 | | | | 1,395,000 | | | | 1,662,993 | |
Crane County TX Water District Unlimited Tax Bond (GO Revenue) | | | 5.00 | | | | 2-15-2026 | | | | 1,000,000 | | | | 1,223,370 | |
Crane County TX Water District Unlimited Tax Bond (GO Revenue) | | | 5.00 | | | | 2-15-2030 | | | | 1,130,000 | | | | 1,344,067 | |
Crane County TX Water District Unlimited Tax Bond (GO Revenue) | | | 5.00 | | | | 2-15-2031 | | | | 1,000,000 | | | | 1,182,640 | |
Cypress-Fairbanks TX Independent School District Series B-2 (GO Revenue) ± | | | 3.00 | | | | 2-15-2040 | | | | 11,010,000 | | | | 11,493,779 | |
Del Rio TX Refunding Bond (GO Revenue, Build America Mutual Assurance Company Insured) | | | 4.00 | | | | 6-1-2023 | | | | 720,000 | | | | 827,503 | |
Del Rio TX Refunding Bond (GO Revenue, Build America Mutual Assurance Company Insured) | | | 4.00 | | | | 6-1-2024 | | | | 745,000 | | | | 864,319 | |
Denton County TX Permanent Improvement & Refunding Bond (GO Revenue) | | | 5.00 | | | | 7-15-2023 | | | | 1,990,000 | | | | 2,473,590 | |
Denton County TX Permanent Improvement & Refunding Bond (GO Revenue) | | | 5.00 | | | | 7-15-2024 | | | | 1,145,000 | | | | 1,450,589 | |
Denton County TX Permanent Improvement & Refunding Bond (GO Revenue) | | | 5.00 | | | | 7-15-2025 | | | | 1,000,000 | | | | 1,260,170 | |
Denton County TX Permanent Improvement & Refunding Bond (GO Revenue) | | | 5.00 | | | | 7-15-2030 | | | | 1,000,000 | | | | 1,258,170 | |
El Paso County TX Hospital District (GO Revenue) | | | 5.00 | | | | 8-15-2028 | | | | 2,045,000 | | | | 2,409,399 | |
El Paso County TX Refunding Bond Series A (GO Revenue) | | | 5.00 | | | | 2-15-2031 | | | | 2,000,000 | | | | 2,495,120 | |
El Paso County TX Refunding Bond Series A (GO Revenue) | | | 5.00 | | | | 2-15-2032 | | | | 2,120,000 | | | | 2,634,397 | |
Flower Mound, Denton & Tarrant Counties TX Refunding Bond (GO Revenue) | | | 4.00 | | | | 3-1-2026 | | | | 755,000 | | | | 893,550 | |
Flower Mound, Denton & Tarrant Counties TX Refunding Bond (GO Revenue) | | | 5.00 | | | | 3-1-2020 | | | | 650,000 | | | | 745,388 | |
Flower Mound, Denton & Tarrant Counties TX Refunding Bond (GO Revenue) | | | 5.00 | | | | 3-1-2021 | | | | 510,000 | | | | 600,296 | |
Flower Mound, Denton & Tarrant Counties TX Refunding Bond (GO Revenue) | | | 5.00 | | | | 3-1-2022 | | | | 1,000,000 | | | | 1,204,430 | |
Flower Mound, Denton & Tarrant Counties TX Refunding Bond (GO Revenue) | | | 5.00 | | | | 3-1-2023 | | | | 620,000 | | | | 764,547 | |
Flower Mound, Denton & Tarrant Counties TX Refunding Bond (GO Revenue) | | | 5.00 | | | | 3-1-2024 | | | | 1,660,000 | | | | 2,090,621 | |
Fort Bend TX Independent School District Various School Building Series A (GO Revenue) ± | | | 0.66 | | | | 8-1-2040 | | | | 1,220,000 | | | | 1,220,098 | |
Galveston TX Wharves & Terminal (Airport Revenue) | | | 5.00 | | | | 2-1-2026 | | | | 2,000,000 | | | | 2,243,360 | |
Georgetown TX Independent School District (GO Revenue) ± | | | 2.00 | | | | 8-1-2034 | | | | 1,630,000 | | | | 1,662,030 | |
Harris County TX Flood Control District Series A (GO Revenue) | | | 5.00 | | | | 10-1-2025 | | | | 1,500,000 | | | | 1,914,420 | |
Harris County TX Road Refunding Bond Series A (GO Revenue) | | | 5.00 | | | | 10-1-2025 | | | | 4,215,000 | | | | 5,490,290 | |
Harris County TX Road Refunding Bond Series A (GO Revenue) | | | 5.00 | | | | 10-1-2025 | | | | 8,445,000 | | | | 10,763,068 | |
Harris County TX Toll Road Project Series C (GO Revenue, AGM Insured) | | | 5.25 | | | | 8-15-2027 | | | | 4,000,000 | | | | 5,357,080 | |
Hays County TX Refunding Bond (GO Revenue) | | | 5.00 | | | | 2-15-2023 | | | | 1,750,000 | | | | 2,147,110 | |
Houston TX Airport Senior Lien Series A (Airport Revenue) | | | 5.00 | | | | 7-1-2025 | | | | 1,000,000 | | | | 1,082,660 | |
Houston TX Higher Education Finance Corporation Series A (Education Revenue) | | | 4.00 | | | | 2-15-2022 | | | | 740,000 | | | | 789,476 | |
Houston TX Independent School District Limited Tax (GO Revenue) | | | 4.25 | | | | 2-15-2021 | | | | 5,000,000 | | | | 5,113,600 | |
Houston TX Utilities Systems Series A (Water & Sewer Revenue) | | | 5.25 | | | | 11-15-2031 | | | | 3,000,000 | | | | 3,528,060 | |
Lower Colorado River TX Authority (Utilities Revenue) | | | 5.50 | | | | 5-15-2031 | | | | 2,500,000 | | | | 3,097,425 | |
Midland County TX PFFA Compass Pointe Apartments (Housing Revenue) | | | 1.25 | | | | 3-1-2018 | | | | 2,500,000 | | | | 2,507,150 | |
Midtown TX RDA (Tax Revenue, Build America Mutual Assurance Company Insured) | | | 5.25 | | | | 1-1-2027 | | | | 1,880,000 | | | | 2,263,539 | |
Midtown TX RDA (Tax Revenue, Build America Mutual Assurance Company Insured) | | | 5.25 | | | | 1-1-2029 | | | | 2,390,000 | | | | 2,816,735 | |
| | | | |
| 24 | | Wells Fargo Intermediate Tax/AMT-Free Fund | | Portfolio of investments—June 30, 2016 |
| | | | | | | | | | | | | | | | |
| Security name | | Interest rate | | | Maturity date | | | Principal | | | Value | |
| | | | |
| Texas (continued) | | | | | | | | | | | | | | | | |
Midtown TX RDA (Tax Revenue, Build America Mutual Assurance Company Insured) | | | 5.25 | % | | | 1-1-2030 | | | $ | 1,500,000 | | | $ | 1,789,830 | |
Midtown TX RDA (Tax Revenue, Build America Mutual Assurance Company Insured) | | | 5.25 | | | | 1-1-2031 | | | | 1,000,000 | | | | 1,189,200 | |
North Harris County TX Regional Water Authority Senior Lien (Water & Sewer Revenue, Build America Mutual Assurance Company Insured) | | | 5.00 | | | | 12-15-2029 | | | | 1,215,000 | | | | 1,496,916 | |
North Texas Health Facilities Development Corporation United Regional Health Care System (Health Revenue, AGM Insured) | | | 5.00 | | | | 9-1-2016 | | | | 1,135,000 | | | | 1,143,251 | |
North Texas Higher Education Authority Incoming Student Loan Series A-2 (Education Revenue) ± | | | 1.53 | | | | 7-1-2030 | | | | 7,185,000 | | | | 7,185,790 | |
Northside TX Independent School District Refunding Bond (GO Revenue) ± | | | 1.20 | | | | 8-1-2040 | | | | 605,000 | | | | 607,644 | |
Northwest TX Independent School District Refunding Bond (GO Revenue) | | | 5.00 | | | | 2-15-2030 | | | | 4,000,000 | | | | 5,014,640 | |
Nueces River TX Water Supply Facility Corpus Christi Lake Texana Project (Water & Sewer Revenue) | | | 5.00 | | | | 7-15-2026 | | | | 1,000,000 | | | | 1,289,730 | |
Nueces River TX Water Supply Facility Corpus Christi Lake Texana Project (Water & Sewer Revenue) | | | 5.00 | | | | 7-15-2027 | | | | 1,250,000 | | | | 1,598,913 | |
Port Arthur TX Navigation District Jefferson County Environmental Facilities Motiva Enterprises LLC Project Series B (Resource Recovery Revenue) ø | | | 0.54 | | | | 12-1-2039 | | | | 15,000,000 | | | | 15,000,000 | |
Port Arthur TX Navigation District Jefferson County Environmental Facilities Motiva Enterprises LLC Project Series C (Resource Recovery Revenue) ø | | | 0.54 | | | | 12-1-2039 | | | | 14,600,000 | | | | 14,600,000 | |
San Antonio TX Junior Lien Series B (Utilities Revenue) ± | | | 1.75 | | | | 12-1-2027 | | | | 5,000,000 | | | | 5,079,150 | |
Texas Independent School District Refunding Bond (GO Revenue) | | | 5.00 | | | | 8-15-2025 | | | | 2,260,000 | | | | 2,941,752 | |
Texas Municipal Gas Acquisition & Supply Corporation II Series B (Utilities Revenue, JPMorgan Chase & Company Guaranteed) ± | | | 0.88 | | | | 9-15-2017 | | �� | | 3,505,000 | | | | 3,492,277 | |
Texas Municipal Gas Acquisition & Supply Corporation III Series 2012 (Utilities Revenue) | | | 5.00 | | | | 12-15-2021 | | | | 3,945,000 | | | | 4,638,847 | |
Texas Municipal Gas Acquisition & Supply Corporation Series B (Utilities Revenue) | | | 5.00 | | | | 12-15-2022 | | | | 5,000,000 | | | | 5,995,000 | |
Texas Private Activity Surface Transportation Corporation Project (Transportation Revenue) | | | 7.50 | | | | 6-30-2032 | | | | 2,000,000 | | | | 2,457,200 | |
Texas Private Activity Surface Transportation Corporation Project (Transportation Revenue) | | | 7.50 | | | | 6-30-2033 | | | | 2,000,000 | | | | 2,457,200 | |
Texas Private Activity Surface Transportation Corporation Project Senior Lien Note (Transportation Revenue) | | | 7.50 | | | | 12-31-2031 | | | | 3,745,000 | | | | 4,510,104 | |
Texas SA Energy Acquisition Public Facility Corporation Gas Supply (Utilities Revenue) | | | 5.25 | | | | 8-1-2016 | | | | 5,660,000 | | | | 5,681,451 | |
Texas SA Energy Acquisition Public Facility Corporation Gas Supply (Utilities Revenue) | | | 5.50 | | | | 8-1-2019 | | | | 1,465,000 | | | | 1,653,370 | |
Texas Transportation Commission State Highway Fund Floating 1st Tier Series B (Transportation Revenue, Banco Bilboa Vizcaya SPA) ø | | | 0.65 | | | | 4-1-2026 | | | | 10,000,000 | | | | 10,000,000 | |
Texas Woman’s University Financing System (Education Revenue) | | | 4.00 | | | | 7-1-2020 | | | | 1,000,000 | | | | 1,116,590 | |
University of Houston Texas (Education Revenue) | | | 5.00 | | | | 2-15-2024 | | | | 2,700,000 | | | | 2,988,117 | |
University of Houston Texas Series B (Education Revenue) | | | 5.25 | | | | 7-1-2026 | | | | 4,225,000 | | | | 5,647,642 | |
University of Texas Board of Regents Series D (Education Revenue) %% | | | 5.00 | | | | 8-15-2026 | | | | 2,000,000 | | | | 2,661,260 | |
Waco TX Health Facilities Development Corporation Hillcrest System Project Series A (Health Revenue, National/FHA Insured) | | | 5.00 | | | | 8-1-2016 | | | | 920,000 | | | | 923,560 | |
Weatherford TX Utility System Refunding & Improvement Bond (Utilities Revenue, AGM Insured) | | | 5.00 | | | | 9-1-2025 | | | | 1,000,000 | | | | 1,261,950 | |
Weatherford TX Utility System Refunding & Improvement Bond (Utilities Revenue, AGM Insured) | | | 5.00 | | | | 9-1-2026 | | | | 375,000 | | | | 469,999 | |
| | | | |
| | | | | | | | | | | | | | | 259,434,551 | |
| | | | | | | | | | | | | | | | |
| | | | | | |
| Portfolio of investments—June 30, 2016 | | Wells Fargo Intermediate Tax/AMT-Free Fund | | | 25 | |
| | | | | | | | | | | | | | | | |
| Security name | | Interest rate | | | Maturity date | | | Principal | | | Value | |
| | | | |
| Utah: 0.17% | | | | | | | | | | | | | | | | |
Canyons UT Board of Education Utah School Bond Guaranty Program (GO Revenue, AGM Insured) | | | 5.00 | % | | | 6-15-2022 | | | $ | 1,860,000 | | | $ | 2,272,883 | |
Utah Charter School Finance Authority Refunding Bond (Education Revenue, CSCE Insured) | | | 4.00 | | | | 4-15-2020 | | | | 250,000 | | | | 274,815 | |
Utah Charter School Finance Authority Refunding Bond (Education Revenue, CSCE Insured) | | | 4.00 | | | | 4-15-2021 | | | | 400,000 | | | | 446,480 | |
Utah Charter School Finance Authority Refunding Bond (Education Revenue, CSCE Insured) | | | 4.00 | | | | 4-15-2022 | | | | 400,000 | | | | 451,576 | |
Utah Charter School Finance Authority Refunding Bond (Education Revenue, CSCE Insured) | | | 4.00 | | | | 4-15-2023 | | | | 400,000 | | | | 456,680 | |
Utah Charter School Finance Authority Refunding Bond (Education Revenue, CSCE Insured) | | | 4.00 | | | | 4-15-2024 | | | | 450,000 | | | | 519,989 | |
| | | | |
| | | | | | | | | | | | | | | 4,422,423 | |
| | | | | | | | | | | | | | | | |
| | | | |
| Virgin Islands: 0.29% | | | | | | | | | | | | | | | | |
Virgin Islands PFA (Miscellaneous Revenue) | | | 6.75 | | | | 10-1-2019 | | | | 2,480,000 | | | | 2,694,396 | |
Virgin Islands PFA Sub Lien Series C (Miscellaneous Revenue) | | | 5.00 | | | | 10-1-2017 | | | | 5,000,000 | | | | 5,195,300 | |
| | | | |
| | | | | | | | | | | | | | | 7,889,696 | |
| | | | | | | | | | | | | | | | |
| | | | |
| Virginia: 1.63% | | | | | | | | | | | | | | | | |
Greater Richmond VA Convention Center (Tax Revenue) | | | 5.00 | | | | 6-15-2025 | | | | 1,000,000 | | | | 1,278,270 | |
Marquis VA CDA CAB Series C (Tax Revenue) (i)¤ | | | 0.00 | | | | 9-1-2041 | | | | 1,772,000 | | | | 247,584 | |
Marquis VA CDA Convertible CAB (Tax Revenue) 144A¤ | | | 0.00 | | | | 9-1-2045 | | | | 386,000 | | | | 254,911 | |
Marquis VA CDA Series B (Tax Revenue) (i) | | | 5.63 | | | | 9-1-2041 | | | | 1,274,000 | | | | 1,038,501 | |
Virginia College Building Authority Educational Facilities Series A (Education Revenue) %% | | | 3.00 | | | | 9-1-2025 | | | | 13,630,000 | | | | 15,303,219 | |
Virginia Public School Authority Special Obligation Financing & Refunding Bond (Miscellaneous Revenue) | | | 5.00 | | | | 8-1-2026 | | | | 10,000,000 | | | | 13,332,800 | |
Virginia Resources Authority Pooled Financing Program Series A (Miscellaneous Revenue) | | | 4.00 | | | | 11-1-2025 | | | | 2,370,000 | | | | 2,893,178 | |
Virginia Resources Authority Pooled Financing Program Series A (Miscellaneous Revenue) | | | 5.00 | | | | 11-1-2027 | | | | 1,320,000 | | | | 1,742,506 | |
Virginia Small Business Financing Authority (Education Revenue) | | | 5.25 | | | | 10-1-2029 | | | | 3,000,000 | | | | 3,722,790 | |
Virginia Transportation Board Capital Projects Bond (Miscellaneous Revenue) | | | 5.00 | | | | 5-15-2026 | | | | 2,505,000 | | | | 3,312,437 | |
Watkins Centre VA CDA (Miscellaneous Revenue) | | | 5.40 | | | | 3-1-2020 | | | | 582,000 | | | | 583,310 | |
| | | | |
| | | | | | | | | | | | | | | 43,709,506 | |
| | | | | | | | | | | | | | | | |
| | | | |
| Washington: 2.85% | | | | | | | | | | | | | | | | |
Energy Northwest Washington Wind Project (Utilities Revenue) | | | 5.00 | | | | 7-1-2022 | | | | 1,185,000 | | | | 1,418,872 | |
Kent WA Limited Tax Refunding Bond (GO Revenue) | | | 5.00 | | | | 12-1-2031 | | | | 1,000,000 | | | | 1,265,610 | |
Kent WA Limited Tax Refunding Bond (GO Revenue) | | | 5.00 | | | | 12-1-2032 | | | | 2,000,000 | | | | 2,520,980 | |
King County WA Federal Way School District #210 (GO Revenue, AGM Insured) | | | 4.00 | | | | 12-1-2023 | | | | 4,085,000 | | | | 4,830,145 | |
Lewis County WA Public Utility District Refunding (Utilities Revenue) | | | 5.25 | | | | 4-1-2032 | | | | 6,115,000 | | | | 7,628,034 | |
Seattle WA Refunding Bond Series A (GO Revenue) | | | 5.00 | | | | 6-1-2024 | | | | 6,345,000 | | | | 8,092,032 | |
Tacoma WA Solid Waste Refunding Bond Series B (Resource Recovery Revenue) %% | | | 5.00 | | | | 12-1-2027 | | | | 620,000 | | | | 777,573 | |
Tacoma WA Solid Waste Refunding Bond Series B (Resource Recovery Revenue) %% | | | 5.00 | | | | 12-1-2028 | | | | 1,455,000 | | | | 1,819,739 | |
Tacoma WA Solid Waste Refunding Bond Series B (Resource Recovery Revenue) %% | | | 5.00 | | | | 12-1-2029 | | | | 1,525,000 | | | | 1,900,760 | |
| | | | |
| 26 | | Wells Fargo Intermediate Tax/AMT-Free Fund | | Portfolio of investments—June 30, 2016 |
| | | | | | | | | | | | | | | | |
| Security name | | Interest rate | | | Maturity date | | | Principal | | | Value | |
| | | | |
| Washington (continued) | | | | | | | | | | | | | | | | |
Tumwater Office Properties Washington Office Buildings (Miscellaneous Revenue) | | | 5.00 | % | | | 7-1-2026 | | | $ | 2,750,000 | | | $ | 3,418,250 | |
Washington EDFA (Education Revenue) | | | 5.00 | | | | 6-1-2028 | | | | 1,000,000 | | | | 1,240,120 | |
Washington HCFR Fred Hutchinson Cancer Research Center (Health Revenue) | | | 5.00 | | | | 1-1-2023 | | | | 4,000,000 | | | | 4,798,480 | |
Washington HCFR Fred Hutchinson Cancer Research Center (Health Revenue) | | | 5.00 | | | | 1-1-2026 | | | | 2,250,000 | | | | 2,801,498 | |
Washington HCFR Fred Hutchinson Cancer Research Center (Health Revenue) | | | 5.00 | | | | 1-1-2027 | | | | 1,050,000 | | | | 1,288,928 | |
Washington HCFR Fred Hutchinson Cancer Research Center (Health Revenue) | | | 5.00 | | | | 1-1-2028 | | | | 1,350,000 | | | | 1,644,881 | |
Washington Motor Vehicle Fuel Tax Refunding Bond Series D (Miscellaneous Revenue) | | | 5.00 | | | | 7-1-2031 | | | | 5,830,000 | | | | 7,263,539 | |
Washington TES Properties (Miscellaneous Revenue) | | | 5.50 | | | | 12-1-2029 | | | | 1,400,000 | | | | 1,592,906 | |
Washington Various Purpose Refunding Bond Series A (Miscellaneous Revenue) %% | | | 5.00 | | | | 8-1-2027 | | | | 4,000,000 | | | | 5,200,120 | |
Washington Various Purpose Refunding Bond Series B (GO Revenue) | | | 5.00 | | | | 7-1-2025 | | | | 8,000,000 | | | | 10,338,160 | |
Washington Various Purpose Refunding Bond Series B (GO Revenue) | | | 5.00 | | | | 7-1-2028 | | | | 3,130,000 | | | | 4,013,849 | |
Washington Various Purpose Refunding Bond Series B (GO Revenue) | | | 5.00 | | | | 7-1-2030 | | | | 2,000,000 | | | | 2,544,700 | |
| | | | |
| | | | | | | | | | | | | | | 76,399,176 | |
| | | | | | | | | | | | | | | | |
| | | | |
| West Virginia: 0.28% | | | | | | | | | | | | | | | | |
West Virginia School Building Authority (Miscellaneous Revenue) | | | 5.25 | | | | 7-1-2020 | | | | 1,100,000 | | | | 1,200,980 | |
West Virginia School Building Authority Series A (Miscellaneous Revenue) | | | 5.00 | | | | 7-1-2026 | | | | 1,520,000 | | | | 1,941,496 | |
West Virginia School Building Authority Series A (Miscellaneous Revenue) | | | 5.00 | | | | 7-1-2027 | | | | 1,595,000 | | | | 2,028,872 | |
West Virginia School Building Authority Series A (Miscellaneous Revenue) | | | 5.00 | | | | 7-1-2029 | | | | 1,755,000 | | | | 2,213,195 | |
| | | | |
| | | | | | | | | | | | | | | 7,384,543 | |
| | | | | | | | | | | | | | | | |
| | | | |
| Wisconsin: 0.68% | | | | | | | | | | | | | | | | |
Wisconsin HEFA Bellin Memorial Hospital Obligated Group (Health Revenue, Ambac Insured) | | | 5.50 | | | | 2-15-2019 | | | | 600,000 | | | | 627,162 | |
Wisconsin HEFA Mercy Alliance Incorporated Project Series A (Health Revenue) | | | 5.00 | | | | 6-1-2019 | | | | 1,050,000 | | | | 1,100,148 | |
Wisconsin HEFA Series A (Health Revenue) | | | 5.00 | | | | 7-15-2021 | | | | 3,500,000 | | | | 4,127,515 | |
Wisconsin HEFA Series A (Health Revenue) | | | 5.00 | | | | 11-15-2023 | | | | 3,500,000 | | | | 4,352,215 | |
Wisconsin HEFA Series M (Health Revenue, National Insured) ±(m)(n) | | | 0.74 | | | | 6-1-2019 | | | | 1,000,000 | | | | 968,750 | |
Wisconsin PFA Central District Development Project (Education Revenue) | | | 5.00 | | | | 3-1-2036 | | | | 4,500,000 | | | | 5,392,440 | |
Wisconsin PFA Charter School Voyager Foundation Incorporate Project Series A (Education Revenue) | | | 6.00 | | | | 10-1-2032 | | | | 1,475,000 | | | | 1,631,512 | |
| | | | |
| | | | | | | | | | | | | | | 18,199,742 | |
| | | | | | | | | | | | | | | | |
| | | | |
Total Municipal Obligations (Cost $2,552,799,827) | | | | | | | | | | | | | | | 2,704,777,725 | |
| | | | | | | | | | | | | | | | |
| | | | |
| | | Yield | | | | | | Shares | | | | |
| | | | |
Short-Term Investments: 0.76% | | | | | | | | | | | | | | | | |
| | | | |
| Investment Companies: 0.74% | | | | | | | | | | | | | | | | |
Wells Fargo National Tax-Free Money Market Fund Premier Class ##(l)(u) | | | 0.27 | | | | | | | | 19,871,388 | | | | 19,871,388 | |
| | | | | | | | | | | | | | | | |
| | | | |
| | | | | | | | | Principal | | | | |
| | | | |
| U.S. Treasury Securities: 0.02% | | | | | | | | | | | | | | | | |
U.S. Treasury Bill (z)# | | | 0.22 | | | | 9-15-2016 | | | $ | 500,000 | | | | 499,772 | |
| | | | | | | | | | | | | | | | |
| | | | |
Total Short-Term Investments (Cost $20,371,151) | | | | | | | | | | | | | | | 20,371,160 | |
| | | | | | | | | | | | | | | | |
| | | | | | | | |
| Total investments in securities (Cost $2,573,170,978) * | | | 101.82 | % | | | 2,725,148,885 | |
Other assets and liabilities, net | | | (1.82 | ) | | | (48,712,056 | ) |
| | | | | | | | |
| Total net assets | | | 100.00 | % | | $ | 2,676,436,829 | |
| | | | | | | | |
| | | | | | |
| Portfolio of investments—June 30, 2016 | | Wells Fargo Intermediate Tax/AMT-Free Fund | | | 27 | |
| %% | The security is issued on a when-issued basis. |
| ¤ | The security is issued in zero coupon form with no periodic interest payments. |
| ± | Variable rate investment. The rate shown is the rate in effect at period end. |
| 144A | The security may be resold in transactions exempt from registration, normally to qualified institutional buyers, pursuant to Rule 144A under the Securities Act of 1933. |
| ø | Variable rate demand notes are subject to a demand feature which reduces the effective maturity. The maturity date shown represents the final maturity date of the security. The interest rate is determined and reset by the issuer daily, weekly, or monthly depending upon the terms of the security. The rate shown is the rate in effect at period end. |
| ## | All or a portion of this security is segregated for when-issued securities. |
| (i) | Illiquid security for which the designation as illiquid is unaudited. |
| (s) | The security is currently in default with regards to scheduled interest and/or principal payments. The Fund has stopped accruing interest on the security. |
| (m) | The security is an auction-rate security which has an interest rate that resets at predetermined short-term intervals through a Dutch auction. The rate shown is the rate in effect at period end. |
| (n) | The auction to set the interest rate on the security failed at period end due to insufficient investor interest. A failed auction does not itself cause a default. |
| (l) | The issuer of the security is an affiliated person of the Fund as defined in the Investment Company Act of 1940. |
| (u) | The rate represents the 7-day annualized yield at period end. |
| (z) | Zero coupon security. The rate represents the current yield to maturity. |
| # | All or a portion of this security is segregated as collateral for investments in derivative instruments. |
| * | Cost for federal income tax purposes is $2,573,233,309 and unrealized gains (losses) consists of: |
| | | | |
Gross unrealized gains | | $ | 156,105,295 | |
Gross unrealized losses | | | (4,189,719 | ) |
| | | | |
Net unrealized gains | | $ | 151,915,576 | |
| | | | | | |
| Portfolio of investments—June 30, 2016 | | Wells Fargo Municipal Bond Fund | | | 1 | |
| | | | | | | | | | | | | | | | |
| Security name | | Interest rate | | | Maturity date | | | Principal | | | Value | |
| | | |
Corporate Bonds and Notes: 0.50% | | | | | | | | | | | | | |
| | | | |
Consumer Discretionary: 0.50% | | | | | | | | | | | | | | | | |
| | | |
| Diversified Consumer Services: 0.50% | | | | | | | | | | | | | |
Toll Road Investors Partnership II 144A ¤ | | | 0.00 | % | | | 2-15-2028 | | | $ | 30,780,000 | | | $ | 14,660,083 | |
| | | | | | | | | | | | | | | | |
| | | |
Total Corporate Bonds and Notes (Cost $15,367,850) | | | | | | | | | | | | 14,660,083 | |
| | | | | | | | | | | | | | | | |
| | | | |
Municipal Obligations: 98.14% | | | | | | | | | | | | | | | | |
| | | | |
| Alabama: 1.07% | | | | | | | | | | | | | | | | |
Alabama State University General Tuition and Fee Revenue Bonds (Education Revenue, Syncora Guarantee Incorporated Insured) | | | 5.25 | | | | 8-1-2032 | | | | 10,520,000 | | | | 10,522,735 | |
Birmingham AL CAB Series A1 (GO Revenue) ± | | | 0.00 | | | | 3-1-2045 | | | | 3,000,000 | | | | 3,170,700 | |
Jefferson County AL CAB Series B (Water & Sewer Revenue, AGM Insured) ¤ | | | 0.00 | | | | 10-1-2026 | | | | 3,000,000 | | | | 2,076,300 | |
Jefferson County AL Limited Obligation School District Series A (Tax Revenue, AGM Insured) | | | 5.25 | | | | 1-1-2018 | | | | 775,000 | | | | 779,526 | |
Jefferson County AL Limited Obligation School District Series A (Tax Revenue) | | | 5.25 | | | | 1-1-2020 | | | | 3,000,000 | | | | 3,017,520 | |
Jefferson County AL Series A (GO Revenue) | | | 4.90 | | | | 4-1-2021 | | | | 5,495,000 | | | | 5,879,925 | |
Jefferson County AL Sewer Revenue Warrants CAB Series B (Water & Sewer Revenue, AGM Insured) ¤ | | | 0.00 | | | | 10-1-2025 | | | | 710,000 | | | | 523,057 | |
Jefferson County AL Sewer Revenue Warrants CAB Series B (Water & Sewer Revenue, AGM Insured) ¤ | | | 0.00 | | | | 10-1-2029 | | | | 4,115,000 | | | | 2,317,239 | |
Jefferson County AL Warrants Series C (GO Revenue) | | | 4.90 | | | | 4-1-2021 | | | | 3,170,000 | | | | 3,383,436 | |
| | | | |
| | | | | | | | | | | | | | | 31,670,438 | |
| | | | | | | | | | | | | | | | |
| | | | |
| Alaska: 0.45% | | | | | | | | | | | | | | | | |
Alaska International Airports System Series B (Airport Revenue) %% | | | 5.00 | | | | 10-1-2033 | | | | 3,080,000 | | | | 3,797,147 | |
Alaska International Airports System Series B (Airport Revenue) %% | | | 5.00 | | | | 10-1-2034 | | | | 3,225,000 | | | | 3,969,846 | |
Valdez AK Marine Terminal (Transportation Revenue) ø | | | 0.58 | | | | 5-1-2031 | | | | 5,500,000 | | | | 5,500,000 | |
| | | | |
| | | | | | | | | | | | | | | 13,266,993 | |
| | | | | | | | | | | | | | | | |
| | | | |
| Arizona: 0.80% | | | | | | | | | | | | | | | | |
Phoenix AZ IDA Legacy Traditional Schools Project Series A (Education Revenue) 144A | | | 6.50 | | | | 7-1-2034 | | | | 2,000,000 | | | | 2,387,900 | |
Pima County AZ IDA Acclaim Charter School Project (Education Revenue) | | | 5.60 | | | | 12-1-2016 | | | | 125,000 | | | | 125,566 | |
Pima County AZ IDA New Plan Learning Project Series A (Education Revenue) | | | 7.75 | | | | 7-1-2035 | | | | 7,510,000 | | | | 7,528,400 | |
Pima County AZ IDA New Plan Learning Project Series A (Education Revenue) | | | 8.13 | | | | 7-1-2041 | | | | 6,495,000 | | | | 6,514,680 | |
Pima County AZ IDA Noah Webster Schools-PIMA Project (Education Revenue) | | | 7.00 | | | | 12-15-2043 | | | | 3,225,000 | | | | 3,750,901 | |
Tempe AZ IDA Friendship Village Project Series A (Health Revenue) | | | 5.25 | | | | 12-1-2020 | | | | 1,000,000 | | | | 1,127,760 | |
Tempe AZ IDA Friendship Village Project Series A (Health Revenue) | | | 5.38 | | | | 12-1-2021 | | | | 1,000,000 | | | | 1,147,310 | |
Tempe AZ IDA Friendship Village Project Series A (Health Revenue) | | | 5.50 | | | | 12-1-2022 | | | | 1,000,000 | | | | 1,142,970 | |
| | | | |
| | | | | | | | | | | | | | | 23,725,487 | |
| | | | | | | | | | | | | | | | |
| | | | |
| California: 10.30% | | | | | | | | | | | | | | | | |
Alameda County CA Certificate of Participation (Miscellaneous Revenue, National Insured) ¤ | | | 0.00 | | | | 6-15-2019 | | | | 1,400,000 | | | | 1,327,466 | |
Alhambra CA Unified School District CAB Election of 2008 Series B (GO Revenue, AGM Insured) ¤ | | | 0.00 | | | | 8-1-2031 | | | | 2,175,000 | | | | 1,436,218 | |
Alhambra CA Unified School District CAB Election of 2008 Series B (GO Revenue, AGM Insured) ¤ | | | 0.00 | | | | 8-1-2032 | | | | 3,795,000 | | | | 2,412,747 | |
| | | | |
| 2 | | Wells Fargo Municipal Bond Fund | | Portfolio of investments—June 30, 2016 |
| | | | | | | | | | | | | | | | |
| Security name | | Interest rate | | | Maturity date | | | Principal | | | Value | |
|
| California (continued) | |
Alhambra CA Unified School District CAB Election of 2008 Series B (GO Revenue, AGM Insured) ¤ | | | 0.00 | % | | | 8-1-2034 | | | $ | 5,000,000 | | | $ | 2,900,300 | |
Alhambra CA Unified School District CAB Election of 2008 Series B (GO Revenue, AGM Insured) ¤ | | | 0.00 | | | | 8-1-2035 | | | | 6,700,000 | | | | 3,729,086 | |
Alhambra CA Unified School District CAB Series B (GO Revenue, AGC Insured) ¤ | | | 0.00 | | | | 8-1-2031 | | | | 7,500,000 | | | | 4,923,075 | |
Anaheim CA PFA Convention Center Expansion Project Series A (Miscellaneous Revenue) | | | 5.00 | | | | 5-1-2046 | | | | 8,500,000 | | | | 10,292,735 | |
Bass Lake CA Unified Elementary School District CAB (GO Revenue, AGM Insured) ¤ | | | 0.00 | | | | 8-1-2037 | | | | 1,305,000 | | | | 689,301 | |
Bass Lake CA Unified Elementary School District CAB (GO Revenue, AGM Insured) ¤ | | | 0.00 | | | | 8-1-2038 | | | | 1,900,000 | | | | 982,167 | |
Bass Lake CA Unified Elementary School District CAB (GO Revenue, AGM Insured) ¤ | | | 0.00 | | | | 8-1-2039 | | | | 2,005,000 | | | | 1,003,663 | |
Bay Area CA Toll Authority Toll Bridge Revenue Series A (Transportation Revenue) ± | | | 1.66 | | | | 4-1-2036 | | | | 28,000,000 | | | | 27,660,920 | |
Bay Area CA Toll Authority Toll Bridge Revenue Series G-1 (Transportation Revenue, U.S. Bank NA LOC) ø | | | 0.39 | | | | 4-1-2047 | | | | 10,300,000 | | | | 10,300,000 | |
California HFFA Children’s Hospital of Orange County Series C (Health Revenue, U.S. Bank NA LOC) ø | | | 0.39 | | | | 11-1-2038 | | | | 14,900,000 | | | | 14,900,000 | |
California HFFA Unrefunded Bond Providence Health Services Series C (Health Revenue) (h) | | | 6.50 | | | | 10-1-2038 | | | | 10,050,000 | | | | 11,373,484 | |
California Municipal Finance Authority Charter School Revenue Albert Einstein Academies Project Series A (Miscellaneous Revenue) | | | 7.13 | | | | 8-1-2043 | | | | 2,230,000 | | | | 2,584,637 | |
California Public Works Board Department of General Services Buildings 8 & 9A (Miscellaneous Revenue) | | | 6.25 | | | | 4-1-2034 | | | | 4,000,000 | | | | 4,642,960 | |
California Public Works Board Judicial Council Project Series A (Miscellaneous Revenue) | | | 5.00 | | | | 3-1-2031 | | | | 3,260,000 | | | | 3,935,537 | |
California Series B-3 (GO Revenue, Bank of America NA LOC) ø | | | 0.39 | | | | 5-1-2033 | | | | 10,000,000 | | | | 10,000,000 | |
California Statewide CDA (Health Revenue) ø | | | 0.40 | | | | 4-1-2038 | | | | 11,650,000 | | | | 11,650,000 | |
California Statewide CDA School Facility Aspire Public Schools (Education Revenue) | | | 5.00 | | | | 7-1-2020 | | | | 525,000 | | | | 554,715 | |
California Statewide CDA Sutter Health Series A (Health Revenue) | | | 6.00 | | | | 8-15-2042 | | | | 4,900,000 | | | | 5,956,293 | |
Cerritos CA Community College District CAB Election of 2004 Series D (GO Revenue) ¤ | | | 0.00 | | | | 8-1-2027 | | | | 1,000,000 | | | | 774,790 | |
Cerritos CA Community College District CAB Election of 2004 Series D (GO Revenue) ¤ | | | 0.00 | | | | 8-1-2028 | | | | 1,040,000 | | | | 775,081 | |
Colton CA Unified School District CAB Series B (GO Revenue, AGM Insured) ¤ | | | 0.00 | | | | 8-1-2031 | | | | 1,000,000 | | | | 656,410 | |
Colton CA Unified School District CAB Series B (GO Revenue, AGM Insured) ¤ | | | 0.00 | | | | 8-1-2032 | | | | 1,000,000 | | | | 634,310 | |
Colton CA Unified School District CAB Series B (GO Revenue, AGM Insured) ¤ | | | 0.00 | | | | 8-1-2033 | | | | 1,000,000 | | | | 611,440 | |
Compton CA Community College District CAB Election of 2002 Series C (GO Revenue) ¤ | | | 0.00 | | | | 8-1-2032 | | | | 2,515,000 | | | | 1,412,223 | |
Compton CA Community College District CAB Election of 2002 Series C (GO Revenue) ¤ | | | 0.00 | | | | 8-1-2033 | | | | 2,000,000 | | | | 1,067,220 | |
Compton CA Community College District CAB Election of 2002 Series C (GO Revenue) ¤ | | | 0.00 | | | | 8-1-2036 | | | | 510,000 | | | | 242,286 | |
El Monte CA Union High School District CAB Election of 2008 (GO Revenue, AGM Insured) ¤ | | | 0.00 | | | | 6-1-2028 | | | | 1,165,000 | | | | 837,903 | |
El Monte CA Union High School District CAB Election of 2008 (GO Revenue, AGM Insured) ¤ | | | 0.00 | | | | 6-1-2029 | | | | 1,500,000 | | | | 1,034,505 | |
El Monte CA Union High School District CAB Election of 2008 (GO Revenue, AGM Insured) ¤ | | | 0.00 | | | | 6-1-2030 | | | | 2,000,000 | | | | 1,318,500 | |
El Monte CA Union High School District CAB Election of 2008 (GO Revenue, AGM Insured) ¤ | | | 0.00 | | | | 6-1-2031 | | | | 2,000,000 | | | | 1,263,880 | |
El Monte CA Union High School District CAB Election of 2008 (GO Revenue, AGM Insured) ¤ | | | 0.00 | | | | 6-1-2032 | | | | 1,660,000 | | | | 1,009,313 | |
| | | | | | |
| Portfolio of investments—June 30, 2016 | | Wells Fargo Municipal Bond Fund | | | 3 | |
| | | | | | | | | | | | | | | | |
| Security name | | Interest rate | | | Maturity date | | | Principal | | | Value | |
|
| California (continued) | |
El Monte CA Union High School District CAB Election of 2008 (GO Revenue, AGM Insured) ¤ | | | 0.00 | % | | | 6-1-2033 | | | $ | 1,230,000 | | | $ | 722,441 | |
El Monte CA Union High School District CAB Election of 2008 (GO Revenue, AGM Insured) ¤ | | | 0.00 | | | | 6-1-2034 | | | | 1,615,000 | | | | 915,963 | |
Gilroy CA Unified School District Prerefunded CAB Election of 2008 Series A (GO Revenue, AGC Insured) ¤ | | | 0.00 | | | | 8-1-2032 | | | | 6,470,000 | | | | 4,803,587 | |
Gilroy CA Unified School District Unrefunded CAB Election of 2008 Series A (GO Revenue, AGC Insured) ¤ | | | 0.00 | | | | 8-1-2032 | | | | 3,330,000 | | | | 2,097,167 | |
Golden State Tobacco Securitization Corporation California Tobacco Settlement Series A (Miscellaneous Revenue) | | | 5.00 | | | | 6-1-2030 | | | | 970,000 | | | | 1,176,707 | |
M-S-R California Energy Authority Gas Series B (Utilities Revenue) | | | 6.13 | | | | 11-1-2029 | | | | 15,925,000 | | | | 21,528,689 | |
Montebello CA Unified School District CAB Election of 1998 (GO Revenue, National Insured) ¤ | | | 0.00 | | | | 8-1-2024 | | | | 1,130,000 | | | | 941,098 | |
Montebello CA Unified School District CAB Election of 1998 (GO Revenue, National Insured) ¤ | | | 0.00 | | | | 8-1-2027 | | | | 2,775,000 | | | | 2,086,439 | |
Morongo Band of Mission Indians California Enterprise Casino Series B (Miscellaneous Revenue) 144A | | | 6.50 | | | | 3-1-2028 | | | | 2,000,000 | | | | 2,165,740 | |
Northern California Gas Authority #1 LIBOR Series B (Utilities Revenue) ± | | | 1.14 | | | | 7-1-2027 | | | | 27,660,000 | | | | 25,234,495 | |
Ontario Montclair CA School District CAB (GO Revenue, AGC Insured) ¤ | | | 0.00 | | | | 8-1-2028 | | | | 1,500,000 | | | | 1,097,295 | |
Ontario Montclair CA School District CAB (GO Revenue, AGC Insured) ¤ | | | 0.00 | | | | 8-1-2030 | | | | 2,000,000 | | | | 1,369,180 | |
Pasadena CA PFA CAB Rose Bowl Series A (Miscellaneous Revenue) ¤ | | | 0.00 | | | | 3-1-2027 | | | | 2,095,000 | | | | 1,568,736 | |
Pasadena CA PFA CAB Rose Bowl Series A (Miscellaneous Revenue) ¤ | | | 0.00 | | | | 3-1-2028 | | | | 4,450,000 | | | | 3,218,819 | |
Pasadena CA PFA CAB Rose Bowl Series A (Miscellaneous Revenue) ¤ | | | 0.00 | | | | 3-1-2029 | | | | 4,520,000 | | | | 3,156,226 | |
Pasadena CA PFA CAB Rose Bowl Series A (Miscellaneous Revenue) ¤ | | | 0.00 | | | | 3-1-2030 | | | | 6,725,000 | | | | 4,380,934 | |
Pasadena CA PFA CAB Rose Bowl Series A (Miscellaneous Revenue) ¤ | | | 0.00 | | | | 3-1-2031 | | | | 2,185,000 | | | | 1,373,491 | |
Pasadena CA PFA CAB Rose Bowl Series A (Miscellaneous Revenue) ¤ | | | 0.00 | | | | 3-1-2032 | | | | 2,000,000 | | | | 1,232,620 | |
Pasadena CA PFA CAB Rose Bowl Series A (Miscellaneous Revenue) ¤ | | | 0.00 | | | | 3-1-2033 | | | | 4,295,000 | | | | 2,525,932 | |
Richmond CA Joint Powers Financing Authority Civic Center Project Series A (Miscellaneous Revenue, AGC Insured) | | | 5.88 | | | | 8-1-2037 | | | | 25,000 | | | | 28,298 | |
Richmond CA Joint Powers Financing Authority Point Potrero Series A (Miscellaneous Revenue) | | | 6.25 | | | | 7-1-2024 | | | | 5,420,000 | | | | 6,212,783 | |
San Bernardino CA Unified School District Election of 2012 Series A (GO Revenue, AGM Insured) | | | 5.00 | | | | 8-1-2031 | | | | 1,100,000 | | | | 1,320,220 | |
San Bernardino CA Unified School District Series A (GO Revenue, AGM Insured) | | | 5.00 | | | | 8-1-2026 | | | | 1,100,000 | | | | 1,353,187 | |
San Bernardino CA Unified School District Series A (GO Revenue, AGM Insured) | | | 5.00 | | | | 8-1-2028 | | | | 1,250,000 | | | | 1,523,025 | |
San Buenaventura CA Community Mental Health System (Health Revenue) | | | 6.00 | | | | 12-1-2019 | | | | 1,040,000 | | | | 1,175,210 | |
San Buenaventura CA Community Mental Health System (Health Revenue) | | | 6.25 | | | | 12-1-2020 | | | | 2,000,000 | | | | 2,345,280 | |
San Diego CA PFFA Capital Improvement Project Series A (Miscellaneous Revenue) | | | 5.00 | | | | 10-15-2033 | | | | 1,000,000 | | | | 1,247,440 | |
San Diego CA PFFA Capital Improvement Project Series A (Miscellaneous Revenue) | | | 5.00 | | | | 10-15-2034 | | | | 1,080,000 | | | | 1,342,073 | |
San Diego CA PFFA Capital Improvement Project Series A (Miscellaneous Revenue) | | | 5.00 | | | | 10-15-2035 | | | | 1,000,000 | | | | 1,237,900 | |
San Diego CA Unified School District CAB Series C (GO Revenue) ¤ | | | 0.00 | | | | 7-1-2031 | | | | 2,000,000 | | | | 1,321,740 | |
San Diego CA Unified School District CAB Series C (GO Revenue) ¤ | | | 0.00 | | | | 7-1-2032 | | | | 1,500,000 | | | | 953,715 | |
San Diego CA Unified School District CAB Series C (GO Revenue) ¤ | | | 0.00 | | | | 7-1-2033 | | | | 1,000,000 | | | | 612,910 | |
San Diego CA Unified School District CAB Series C (GO Revenue) ¤ | | | 0.00 | | | | 7-1-2034 | | | | 2,000,000 | | | | 1,172,160 | |
San Diego CA Unified School District CAB Series C (GO Revenue) ¤ | | | 0.00 | | | | 7-1-2035 | | | | 1,500,000 | | | | 855,015 | |
Sylvan CA Unified School District CAB (GO Revenue, AGM Insured) ¤ | | | 0.00 | | | | 8-1-2037 | | | | 1,085,000 | | | | 573,097 | |
Tender Option Bond Trust Receipts for Los Angeles CA Series ZF0183 (Miscellaneous Revenue, JPMorgan Chase & Company LIQ) 144Aø | | | 0.56 | | | | 12-1-2022 | | | | 8,925,000 | | | | 8,925,000 | |
Tender Option Bond Trust Receipts for Palomar CA Pomerado Health Series XG0017 (GO Revenue, Bank of America NA LIQ) 144Aø | | | 0.69 | | | | 8-1-2037 | | | | 31,250,000 | | | | 31,250,000 | |
| | | | |
| 4 | | Wells Fargo Municipal Bond Fund | | Portfolio of investments—June 30, 2016 |
| | | | | | | | | | | | | | | | |
| Security name | | Interest rate | | | Maturity date | | | Principal | | | Value | |
|
| California (continued) | |
Tender Option Bond Trust Receipts for San Jose CA Series B (Airport Revenue, Ambac/AGM Insured, JPMorgan Chase & Company LIQ) 144Aø | | | 0.61 | % | | | 9-1-2030 | | | $ | 8,900,000 | | | $ | 8,900,000 | |
West Contra Costa CA Unified School District CAB Series C (GO Revenue, AGM Insured) ¤ | | | 0.00 | | | | 8-1-2029 | | | | 3,000,000 | | | | 2,142,960 | |
West Contra Costa CA Unified School District Election of 2005 Series C-1 (GO Revenue, AGC Insured) ¤ | | | 0.00 | | | | 8-1-2029 | | | | 1,690,000 | | | | 1,208,756 | |
Wiseburn CA School District CAB Election of 2010 Series B (GO Revenue, AGM Insured) ¤ | | | 0.00 | | | | 8-1-2034 | | | | 2,530,000 | | | | 1,456,749 | |
| | | | |
| | | | | | | | | | | | | | | 303,646,242 | |
| | | | | | | | | | | | | | | | |
|
| Colorado: 1.78% | |
Colorado E-470 Public Highway Authority CAB Series B (Transportation Revenue, National Insured) ¤ | | | 0.00 | | | | 9-1-2020 | | | | 9,385,000 | | | | 8,762,211 | |
Colorado E-470 Public Highway Authority CAB Series B (Transportation Revenue, National Insured) ¤ | | | 0.00 | | | | 9-1-2022 | | | | 4,600,000 | | | | 4,108,490 | |
Colorado ECFA Charter School American Academy Project (Education Revenue) | | | 7.13 | | | | 12-1-2033 | | | | 2,200,000 | | | | 2,572,108 | |
Colorado ECFA Charter School Banning Lewis Ranch Academy Project (Education Revenue) 144A | | | 6.13 | | | | 12-15-2035 | | | | 3,940,000 | | | | 3,957,848 | |
Colorado ECFA Charter School Community Leadership (Education Revenue) | | | 5.75 | | | | 7-1-2019 | | | | 555,000 | | | | 575,790 | |
Colorado ECFA Charter School Monument Academy Project Series A (Education Revenue) | | | 5.50 | | | | 10-1-2017 | | | | 115,000 | | | | 118,660 | |
Colorado ECFA Charter School Monument Academy Project Series A (Education Revenue) | | | 7.25 | | | | 10-1-2039 | | | | 500,000 | | | | 572,880 | |
Colorado ECFA Community Leadership Academy Incorporated Second Campus Project (Education Revenue) | | | 7.00 | | | | 8-1-2033 | | | | 1,330,000 | | | | 1,589,430 | |
Colorado ECFA Rocky Mountain Classical Academy Project Series A (Education Revenue) | | | 7.50 | | | | 9-1-2033 | | | | 5,015,000 | | | | 5,265,951 | |
Colorado ECFA Rocky Mountain Classical Academy Project Series A (Education Revenue) | | | 8.00 | | | | 9-1-2043 | | | | 5,930,000 | | | | 6,358,917 | |
Colorado ECFA Rocky Mountain Classical Academy Project Series A (Education Revenue) | | | 8.13 | | | | 9-1-2048 | | | | 3,795,000 | | | | 4,084,938 | |
Colorado ECFA Twin Peaks Charter Academy (Miscellaneous Revenue) | | | 6.50 | | | | 3-15-2043 | | | | 1,290,000 | | | | 1,450,166 | |
Colorado Health Facilities Authority Catholic Health Initiatives Series D1 (Health Revenue) | | | 6.25 | | | | 10-1-2033 | | | | 4,000,000 | | | | 4,486,160 | |
Colorado High Performance Transportation Enterprise U.S. 36 and I-25 Managed Lanes (Transportation Revenue) | | | 5.75 | | | | 1-1-2044 | | | | 2,160,000 | | | | 2,371,961 | |
Colorado PFA Charter School Highline Academy Project (Education Revenue) | | | 6.25 | | | | 12-15-2020 | | | | 335,000 | | | | 359,274 | |
Colorado PFA Charter School Highline Academy Project (Education Revenue) | | | 6.75 | | | | 12-15-2025 | | | | 455,000 | | | | 494,112 | |
Colorado PFA Charter School Highline Academy Project (Education Revenue) | | | 7.38 | | | | 12-15-2040 | | | | 4,010,000 | | | | 4,437,667 | |
Eagle County CO Airport Terminal Corporation Airport Terminal Improvement Project Series A (Airport Revenue) | | | 5.15 | | | | 5-1-2017 | | | | 35,000 | | | | 35,084 | |
Eagle County CO Airport Terminal Corporation Airport Terminal Improvement Project Series B (Airport Revenue) | | | 5.25 | | | | 5-1-2020 | | | | 750,000 | | | | 751,823 | |
| | | | |
| | | | | | | | | | | | | | | 52,353,470 | |
| | | | | | | | | | | | | | | | |
|
| Connecticut: 0.44% | |
Connecticut HEFA Eastern Connecticut Health Network Series A (Health Revenue, AGC Insured) | | | 6.38 | | | | 7-1-2016 | | | | 250,000 | | | | 250,043 | |
Connecticut HFA Special Needs Housing Series 2 (Health Revenue, Ambac Insured) | | | 5.25 | | | | 6-15-2022 | | | | 1,315,000 | | | | 1,320,168 | |
Connecticut Series A (Miscellaneous Revenue) ± | | | 1.51 | | | | 4-15-2019 | | | | 4,050,000 | | | | 4,074,057 | |
Connecticut Series A (Miscellaneous Revenue) ± | | | 1.66 | | | | 4-15-2020 | | | | 5,900,000 | | | | 5,960,357 | |
Hamden CT BAN (GO Revenue) | | | 5.00 | | | | 8-15-2026 | | | | 1,235,000 | | | | 1,448,062 | |
| | | | |
| | | | | | | | | | | | | | | 13,052,687 | |
| | | | | | | | | | | | | | | | |
| | | | | | |
| Portfolio of investments—June 30, 2016 | | Wells Fargo Municipal Bond Fund | | | 5 | |
| | | | | | | | | | | | | | | | |
| Security name | | Interest rate | | | Maturity date | | | Principal | | | Value | |
|
| Delaware: 0.86% | |
Delaware EDA Delmarva Power and Light Company Series A (Utilities Revenue) ø | | | 0.50 | % | | | 7-1-2024 | | | $ | 10,000,000 | | | $ | 10,000,000 | |
Delaware EDA Odyssey Charter School Incorporated Project Series A (Education Revenue) 144A | | | 7.00 | | | | 9-1-2045 | | | | 7,500,000 | | | | 7,784,850 | |
Kent County DE Charter School Incorporated Project (Education Revenue) | | | 7.38 | | | | 5-1-2037 | | | | 2,110,000 | | | | 2,475,853 | |
New Castle County DE Series ZF2088 (GO Revenue, Morgan Stanley Bank LIQ) 144Aø | | | 0.45 | | | | 10-1-2045 | | | | 5,000,000 | | | | 5,000,000 | |
| | | | |
| | | | | | | | | | | | | | | 25,260,703 | |
| | | | | | | | | | | | | | | | |
|
| District of Columbia: 0.59% | |
District of Columbia Cesar Chavez Public Charter School (Education Revenue) | | | 6.50 | | | | 11-15-2021 | | | | 4,125,000 | | | | 4,592,651 | |
District of Columbia Population Services International (Miscellaneous Revenue, SunTrust Bank LOC) ø | | | 0.48 | | | | 11-1-2042 | | | | 10,500,000 | | | | 10,500,000 | |
District of Columbia Water & Sewer Authority Public Utilities Series A (Water & Sewer Revenue) | | | 6.00 | | | | 10-1-2035 | | | | 2,000,000 | | | | 2,237,680 | |
| | | | |
| | | | | | | | | | | | | | | 17,330,331 | |
| | | | | | | | | | | | | | | | |
|
| Florida: 3.31% | |
Championsgate FL Community Development District Capital Improvement Series A (Miscellaneous Revenue) | | | 6.25 | | | | 5-1-2020 | | | | 1,060,000 | | | | 1,060,159 | |
CityPlace Florida Community Development District (Miscellaneous Revenue) | | | 5.00 | | | | 5-1-2022 | | | | 1,000,000 | | | | 1,143,520 | |
Collier County FL School Board Refunding Certificate of Participation (Miscellaneous Revenue, AGM Insured) | | | 5.25 | | | | 2-15-2021 | | | | 1,000,000 | | | | 1,183,900 | |
Crossings At Fleming Island Florida Community Development District Refunding Bond Senior Lien Series A-1 (Miscellaneous Revenue) | | | 4.00 | | | | 5-1-2024 | | | | 1,025,000 | | | | 1,070,551 | |
Crossings At Fleming Island Florida Community Development District Refunding Senior Lien Series A-1 (Miscellaneous Revenue) | | | 2.25 | | | | 5-1-2018 | | | | 1,260,000 | | | | 1,274,981 | |
Crossings At Fleming Island Florida Community Development District Refunding Senior Lien Series A-1 (Miscellaneous Revenue) | | | 2.63 | | | | 5-1-2019 | | | | 1,295,000 | | | | 1,316,109 | |
Daytona Beach FL Refunding & Improvement Project (Water & Sewer Revenue, AGM Insured) | | | 5.00 | | | | 11-1-2031 | | | | 1,155,000 | | | | 1,391,475 | |
Daytona Beach FL Refunding & Improvement Project (Water & Sewer Revenue, AGM Insured) | | | 5.00 | | | | 11-1-2032 | | | | 1,465,000 | | | | 1,760,051 | |
Florida Development Finance Corporation Educational Facilities Renaissance Charter School Project Series A (Education Revenue) | | | 8.50 | | | | 6-15-2044 | | | | 13,290,000 | | | | 15,771,642 | |
Florida Housing Finance Corporation Journet Place Apartments Series 1 (Housing Revenue) | | | 7.60 | | | | 12-15-2047 | | | | 810,000 | | | | 1,050,465 | |
Florida Housing Finance Corporation Villa Capri Phase III (Housing Revenue) | | | 7.60 | | | | 12-15-2042 | | | | 2,720,000 | | | | 3,087,880 | |
Heritage Harbor Florida Community Development District (Miscellaneous Revenue) | | | 7.75 | | | | 5-1-2023 | | | | 380,000 | | | | 379,962 | |
Holmes County FL Hospital Corporation Doctors Memorial Hospital Project (Health Revenue) | | | 6.00 | | | | 11-1-2038 | | | | 2,500,000 | | | | 2,506,775 | |
Indigo FL Community Development District Series C (Miscellaneous Revenue) (i)(s) | | | 1.40 | | | | 5-1-2030 | | | | 2,536,248 | | | | 1,283,113 | |
Lakeland FL Educational Facilities Authority Florida Southern College Project Series A (Education Revenue) | | | 5.00 | | | | 9-1-2025 | | | | 530,000 | | | | 624,308 | |
Lakeland FL Educational Facilities Authority Florida Southern College Project Series A (Education Revenue) | | | 5.00 | | | | 9-1-2028 | | | | 1,195,000 | | | | 1,394,505 | |
Lakeside Plantation FL Community Development District Series A (Miscellaneous Revenue) | | | 6.95 | | | | 5-1-2031 | | | | 1,186,000 | | | | 1,187,352 | |
Marshall Creek Florida Community Development District (Miscellaneous Revenue) | | | 6.32 | | | | 5-1-2045 | | | | 135,000 | | | | 137,959 | |
Marshall Creek Florida Community Development District (Miscellaneous Revenue) | | | 6.63 | | | | 5-1-2032 | | | | 2,110,000 | | | | 2,067,695 | |
| | | | |
| 6 | | Wells Fargo Municipal Bond Fund | | Portfolio of investments—June 30, 2016 |
| | | | | | | | | | | | | | | | |
| Security name | | Interest rate | | | Maturity date | | | Principal | | | Value | |
|
| Florida (continued) | |
Miami-Dade County FL School Board Certificate of Participation Series 4 (Miscellaneous Revenue, Dexia Credit Local LOC, Dexia Credit Local LIQ) 144Aø | | | 0.78 | % | | | 9-25-2024 | | | $ | 15,000,000 | | | $ | 15,000,000 | |
Miami-Dade County FL Seaport Revenue Bond Series B (Airport Revenue) | | | 6.00 | | | | 10-1-2033 | | | | 500,000 | | | | 634,385 | |
Midtown Miami FL Community Development District Parking Garage Project Series A (Miscellaneous Revenue) | | | 5.00 | | | | 5-1-2029 | | | | 2,500,000 | | | | 2,730,900 | |
Orlando FL Capital Improvement Special Revenue Series B (Miscellaneous Revenue) | | | 5.00 | | | | 10-1-2033 | | | | 1,525,000 | | | | 1,872,715 | |
Orlando FL Capital Improvement Special Revenue Series B (Miscellaneous Revenue) | | | 5.00 | | | | 10-1-2035 | | | | 1,680,000 | | | | 2,051,616 | |
Orlando FL Capital Improvement Special Revenue Series B (Miscellaneous Revenue) | | | 5.00 | | | | 10-1-2036 | | | | 1,765,000 | | | | 2,146,452 | |
Palm Beach County FL Public Improvement Series 2 (Miscellaneous Revenue) | | | 5.38 | | | | 11-1-2028 | | | | 2,000,000 | | | | 2,219,200 | |
Saint Petersburg FL Health Facilities Authority All Children’s Project Series A (Health Revenue) | | | 6.50 | | | | 11-15-2039 | | | | 5,500,000 | | | | 6,530,150 | |
Seminole County FL IDA Choices in Learning Series A (Education Revenue) | | | 6.20 | | | | 11-15-2026 | | | | 1,940,000 | | | | 2,156,504 | |
Seminole County FL IDA Choices in Learning Series A (Education Revenue) | | | 7.38 | | | | 11-15-2041 | | | | 3,525,000 | | | | 4,072,115 | |
South Miami FL Health Facilities Baptist Health (Health Revenue) | | | 5.00 | | | | 8-15-2023 | �� | | | 2,810,000 | | | | 2,944,515 | |
St. Johns County FL IDA Refunding Glenmoor Project Series A (Health Revenue) ±(s) | | | 5.38 | | | | 1-1-2049 | | | | 750,000 | | | | 509,993 | |
St. Johns County FL IDA Refunding Subordinated Glenmoor Project Series B (Health Revenue) (s)(t) | | | 2.50 | | | | 1-1-2049 | | | | 277,527 | | | | 3 | |
Tender Option Bond Trust Receipts for Seminole County FL Series ZF0444 (Tax Revenue, National Insured, JPMorgan Chase & Company LIQ) 144Aø | | | 0.49 | | | | 4-1-2027 | | | | 5,250,000 | | | | 5,250,000 | |
Trout Creek Florida Community Development District (Miscellaneous Revenue) | | | 4.88 | | | | 5-1-2025 | | | | 2,545,000 | | | | 2,638,223 | |
Viera East FL Community Development District Water Management Project (Water & Sewer Revenue, National Insured) | | | 5.75 | | | | 5-1-2020 | | | | 2,020,000 | | | | 2,187,539 | |
Viera East FL Community Development District Water Management Project (Water & Sewer Revenue, National Insured) | | | 5.75 | | | | 5-1-2021 | | | | 2,140,000 | | | | 2,353,401 | |
Viera East FL Community Development District Water Management Project (Water & Sewer Revenue, National Insured) | | | 5.75 | | | | 5-1-2022 | | | | 2,265,000 | | | | 2,511,613 | |
| | | | |
| | | | | | | | | | | | | | | 97,501,726 | |
| | | | | | | | | | | | | | | | |
|
| Georgia: 0.76% | |
Cobb County GA Development Authority Charter Learning Center Foundation Central Project Series A (Education Revenue) | | | 6.38 | | | | 7-1-2025 | | | | 1,920,000 | | | | 1,918,042 | |
Georgia Municipal Association Certificate of Participation City Court Atlanta Project (Miscellaneous Revenue, Ambac Insured) | | | 5.50 | | | | 12-1-2016 | | | | 2,175,000 | | | | 2,175,305 | |
Georgia Municipal Association Certificate of Participation City Court Atlanta Project (Miscellaneous Revenue, Ambac Insured) | | | 5.50 | | | | 12-1-2017 | | | | 2,220,000 | | | | 2,220,311 | |
Georgia Municipal Association Certificate of Participation City Court Atlanta Project (Miscellaneous Revenue, Ambac Insured) | | | 5.50 | | | | 12-1-2018 | | | | 2,500,000 | | | | 2,500,350 | |
Georgia Municipal Electric Authority Power Series EE (Utilities Revenue, Ambac Insured) | | | 7.25 | | | | 1-1-2024 | | | | 400,000 | | | | 558,152 | |
Georgia Private Colleges & Universities Authority Series A (Education Revenue) | | | 5.25 | | | | 10-1-2027 | | | | 2,000,000 | | | | 2,345,120 | |
Georgia Road & Tollway Authority Toll Revenue CAB I-75 South Expressway Lanes Project Series A (Transportation Revenue) 144A¤ | | | 0.00 | | | | 6-1-2034 | | | | 3,750,000 | | | | 1,288,725 | |
Georgia Road & Tollway Authority Toll Revenue Convertible CAB I-75 South Expressway Lanes Project Series B (Transportation Revenue) 144A± | | | 0.00 | | | | 6-1-2049 | | | | 5,600,000 | | | | 3,444,000 | |
Tender Option Bond Trust Receipts Series ZF0210 (Health Revenue, JPMorgan Chase & Company LIQ) 144Aø | | | 0.56 | | | | 2-2-2023 | | | | 5,900,000 | | | | 5,900,000 | |
| | | | |
| | | | | | | | | | | | | | | 22,350,005 | |
| | | | | | | | | | | | | | | | |
| | | | | | |
| Portfolio of investments—June 30, 2016 | | Wells Fargo Municipal Bond Fund | | | 7 | |
| | | | | | | | | | | | | | | | |
| Security name | | Interest rate | | | Maturity date | | | Principal | | | Value | |
|
| Guam: 0.14% | |
Guam Government Limited Obligation Section 30 Series A (Miscellaneous Revenue) | | | 5.38 | % | | | 12-1-2024 | | | $ | 3,195,000 | | | $ | 3,639,009 | |
Guam Government Waterworks Authority Water & Wastewater System Project (Water & Sewer Revenue) | | | 5.00 | | | | 7-1-2019 | | | | 450,000 | | | | 498,879 | |
Guam Housing Corporation Guaranteed Mortgage-Backed Securities Series A (Housing Revenue, FHLMC Insured) | | | 5.75 | | | | 9-1-2031 | | | | 60,000 | | | | 65,426 | |
| | | | |
| | | | | | | | | | | | | | | 4,203,314 | |
| | | | | | | | | | | | | | | | |
|
| Hawaii: 0.11% | |
Hawaii Series DZ (GO Revenue) | | | 5.00 | | | | 12-1-2031 | | | | 2,700,000 | | | | 3,203,091 | |
| | | | | | | | | | | | | | | | |
|
| Idaho: 0.63% | |
Boise-Kuna ID Irrigation District Arrowrock Hydroelectric Project (Utilities Revenue) | | | 7.38 | | | | 6-1-2040 | | | | 6,300,000 | | | | 7,101,423 | |
Idaho Health Facilities Authority Trinity Health Credit Group Series B (Health Revenue) | | | 6.25 | | | | 12-1-2033 | | | | 3,000,000 | | | | 3,396,780 | |
Idaho Housing & Finance Association Idaho Arts Charter School Incorporated Project Series A (Education Revenue) | | | 5.75 | | | | 12-1-2032 | | | | 500,000 | | | | 562,940 | |
Idaho Housing & Finance Association Idaho Arts Charter School Incorporated Project Series A (Education Revenue) | | | 6.50 | | | | 12-1-2038 | | | | 1,405,000 | | | | 1,498,545 | |
Idaho Housing & Finance Association Legacy Public Charter School Incorporated Project Series A (Education Revenue) | | | 5.85 | | | | 5-1-2033 | | | | 730,000 | | | | 782,246 | |
Idaho Housing & Finance Association Legacy Public Charter School Incorporated Project Series A (Education Revenue) | | | 6.25 | | | | 5-1-2043 | | | | 1,365,000 | | | | 1,496,559 | |
Idaho Housing & Finance Association Liberty Charter School Series A (Education Revenue) | | | 6.00 | | | | 6-1-2038 | | | | 500,000 | | | | 521,765 | |
Idaho Housing & Finance Association Nonprofit Facilities Revenue CAB North Star Charter School Series A (Education Revenue) | | | 6.75 | | | | 7-1-2048 | | | | 1,322,876 | | | | 1,363,263 | |
Idaho Housing & Finance Association Nonprofit Facilities Revenue CAB North Star Charter School Series B (Education Revenue) 144A¤ | | | 0.00 | | | | 7-1-2049 | | | | 1,276,564 | | | | 135,635 | |
Idaho Housing & Finance Association Series A (Education Revenue) | | | 6.13 | | | | 7-1-2038 | | | | 1,500,000 | | | | 1,573,155 | |
| | | | |
| | | | | | | | | | | | | | | 18,432,311 | |
| | | | | | | | | | | | | | | | |
|
| Illinois: 19.21% | |
Chicago IL (Tax Revenue) | | | 5.00 | | | | 1-1-2028 | | | | 4,430,000 | | | | 5,054,896 | |
Chicago IL (Tax Revenue) | | | 5.00 | | | | 1-1-2029 | | | | 1,500,000 | | | | 1,678,275 | |
Chicago IL Board of Education CAB City Colleges (GO Revenue, National Insured) ¤ | | | 0.00 | | | | 1-1-2025 | | | | 9,935,000 | | | | 7,347,429 | |
Chicago IL Board of Education CAB School Reform Series A (GO Revenue, National Insured) ¤ | | | 0.00 | | | | 12-1-2023 | | | | 9,455,000 | | | | 7,317,886 | |
Chicago IL Board of Education CAB School Reform Series A (GO Revenue, National Insured) ¤ | | | 0.00 | | | | 12-1-2029 | | | | 7,885,000 | | | | 4,562,340 | |
Chicago IL Board of Education CAB School Reform Series A (GO Revenue, National Insured) ¤ | | | 0.00 | | | | 12-1-2020 | | | | 1,000,000 | | | | 874,020 | |
Chicago IL Board of Education CAB School Reform Series A (GO Revenue, National Insured) ¤ | | | 0.00 | | | | 12-1-2031 | | | | 2,705,000 | | | | 1,405,302 | |
Chicago IL Board of Education CAB School Reform Series B-1 (GO Revenue, National Insured) ¤ | | | 0.00 | | | | 12-1-2023 | | | | 1,430,000 | | | | 1,106,777 | |
Chicago IL Board of Education CAB School Reform Series B-1 (GO Revenue, National Insured) ¤ | | | 0.00 | | | | 12-1-2026 | | | | 4,000,000 | | | | 2,698,720 | |
Chicago IL Board of Education CAB School Reform Series B-1 (GO Revenue, National Insured) ¤ | | | 0.00 | | | | 12-1-2028 | | | | 24,270,000 | | | | 14,819,505 | |
| | | | |
| 8 | | Wells Fargo Municipal Bond Fund | | Portfolio of investments—June 30, 2016 |
| | | | | | | | | | | | | | | | |
| Security name | | Interest rate | | | Maturity date | | | Principal | | | Value | |
|
| Illinois (continued) | |
Chicago IL Board of Education CAB School Reform Series B-1 (GO Revenue, National Insured) ¤ | | | 0.00 | % | | | 12-1-2030 | | | $ | 4,550,000 | | | $ | 2,492,581 | |
Chicago IL Board of Education CAB School Reform Series B-1 (GO Revenue, National Insured) ¤ | | | 0.00 | | | | 12-1-2031 | | | | 10,000,000 | | | | 5,183,300 | |
Chicago IL Board of Education Series A (GO Revenue, National Insured) ¤ | | | 0.00 | | | | 12-1-2027 | | | | 4,040,000 | | | | 2,592,064 | |
Chicago IL Board of Education Series C (GO Revenue, AGM Insured) | | | 5.25 | | | | 12-1-2023 | | | | 1,500,000 | | | | 1,589,700 | |
Chicago IL Board of Education Series D (GO Revenue, AGM Insured) | | | 5.00 | | | | 12-1-2025 | | | | 1,430,000 | | | | 1,477,090 | |
Chicago IL CAB City Colleges (GO Revenue, National Insured) ¤ | | | 0.00 | | | | 1-1-2030 | | | | 5,745,000 | | | | 3,387,769 | |
Chicago IL CAB Project & Refunding Series A (GO Revenue, National Insured) ± | | | 5.56 | | | | 1-1-2021 | | | | 3,520,000 | | | | 3,568,928 | |
Chicago IL CAB Project & Refunding Series C (GO Revenue, AGM Insured) ¤ | | | 0.00 | | | | 1-1-2026 | | | | 7,360,000 | | | | 5,233,770 | |
Chicago IL CAB Series C (GO Revenue) ¤ | | | 0.00 | | | | 1-1-2031 | | | | 4,945,000 | | | | 2,167,146 | |
Chicago IL Motor Fuel Tax Revenue Refunding (Tax Revenue) | | | 5.00 | | | | 1-1-2025 | | | | 2,595,000 | | | | 2,844,509 | |
Chicago IL Motor Fuel Tax Revenue Refunding (Tax Revenue) | | | 5.00 | | | | 1-1-2026 | | | | 3,000,000 | | | | 3,269,880 | |
Chicago IL Motor Fuel Tax Revenue Refunding (Tax Revenue) | | | 5.00 | | | | 1-1-2028 | | | | 1,000,000 | | | | 1,076,350 | |
Chicago IL Neighborhoods Alive 21 Program Series B (GO Revenue) | | | 5.50 | | | | 1-1-2034 | | | | 1,500,000 | | | | 1,537,860 | |
Chicago IL O’Hare International Airport (Airport Revenue, AGM Insured) | | | 5.50 | | | | 1-1-2043 | | | | 4,530,000 | | | | 5,379,828 | |
Chicago IL O’Hare International Airport (Airport Revenue) | | | 5.75 | | | | 1-1-2038 | | | | 7,500,000 | | | | 9,049,500 | |
Chicago IL O’Hare International Airport AMT Passenger Facility Charge Series B (Airport Revenue) | | | 5.00 | | | | 1-1-2026 | | | | 5,000,000 | | | | 5,800,550 | |
Chicago IL O’Hare International Airport AMT Senior Lien Series A (Airport Revenue) | | | 5.00 | | | | 1-1-2025 | | | | 2,000,000 | | | | 2,322,500 | |
Chicago IL O’Hare International Airport AMT Senior Lien Series C (Airport Revenue) | | | 5.50 | | | | 1-1-2044 | | | | 4,000,000 | | | | 4,739,800 | |
Chicago IL O’Hare International Airport Customer Facility Charge Senior Lien Series D (Airport Revenue) | | | 5.75 | | | | 1-1-2043 | | | | 4,500,000 | | | | 5,420,655 | |
Chicago IL O’Hare International Airport Third Lien Series A (Airport Revenue) | | | 5.75 | | | | 1-1-2039 | | | | 2,760,000 | | | | 3,243,883 | |
Chicago IL Public Building Commission Transit Authority (Transportation Revenue, Ambac Insured) | | | 5.25 | | | | 3-1-2025 | | | | 2,960,000 | | | | 3,464,650 | |
Chicago IL Public Building Commission Transit Authority (Transportation Revenue, Ambac Insured) | | | 5.25 | | | | 3-1-2027 | | | | 3,400,000 | | | | 4,038,724 | |
Chicago IL Series A (GO Revenue, AGM Insured) | | | 5.00 | | | | 1-1-2028 | | | | 9,550,000 | | | | 10,366,048 | |
Chicago IL Series A (GO Revenue, National Insured) | | | 5.00 | | | | 1-1-2029 | | | | 4,000,000 | | | | 4,056,280 | |
Chicago IL Series A (Tax Revenue) | | | 5.25 | | | | 1-1-2038 | | | | 6,000,000 | | | | 6,540,240 | |
Chicago IL Series A (GO Revenue) | | | 5.50 | | | | 1-1-2033 | | | | 12,730,000 | | | | 13,060,089 | |
Chicago IL Series A (GO Revenue) | | | 5.50 | | | | 1-1-2034 | | | | 7,175,000 | | | | 7,356,097 | |
Chicago IL Series A (GO Revenue) | | | 5.50 | | | | 1-1-2035 | | | | 920,000 | | | | 941,942 | |
Chicago IL Series B (GO Revenue) | | | 5.50 | | | | 1-1-2032 | | | | 1,285,000 | | | | 1,319,207 | |
Chicago IL Transit Authority Sales Tax Receipts Revenue Bonds (Tax Revenue, AGM Insured) | | | 5.00 | | | | 12-1-2044 | | | | 4,000,000 | | | | 4,728,280 | |
Chicago IL Waste Water Transmission Second Lien Series B (Water & Sewer Revenue, National Insured) | | | 5.00 | | | | 1-1-2030 | | | | 2,500,000 | | | | 2,539,225 | |
Chicago IL Wastewater Second Lien Transmission (Water & Sewer Revenue) | | | 5.00 | | | | 1-1-2027 | | | | 4,000,000 | | | | 4,513,320 | |
Chicago IL Water Revenue Second Lien (Water & Sewer Revenue) | | | 5.00 | | | | 11-1-2029 | | | | 4,600,000 | | | | 5,289,218 | |
Chicago IL Water Revenue Second Lien (Water & Sewer Revenue) | | | 5.00 | | | | 11-1-2030 | | | | 5,000,000 | | | | 5,737,600 | |
Cook County IL Series A (GO Revenue) | | | 5.25 | | | | 11-15-2022 | | | | 3,000,000 | | | | 3,399,540 | |
Cook County IL Series C (GO Revenue, AGM Insured) | | | 5.00 | | | | 11-15-2024 | | | | 4,240,000 | | | | 4,964,489 | |
Cook County IL Series C (GO Revenue) | | | 5.00 | | | | 11-15-2025 | | | | 2,140,000 | | | | 2,472,171 | |
Cook County IL Series C (GO Revenue) | | | 5.00 | | | | 11-15-2027 | | | | 325,000 | | | | 373,812 | |
Cook County IL Series G (GO Revenue) | | | 5.00 | | | | 11-15-2028 | | | | 27,000,000 | | | | 29,765,610 | |
DeKalb-Kane-Lasalle Counties IL Kishwaukee Community College District #523 Series B (GO Revenue) ¤ | | | 0.00 | | | | 2-1-2019 | | | | 725,000 | | | | 697,900 | |
| | | | | | |
| Portfolio of investments—June 30, 2016 | | Wells Fargo Municipal Bond Fund | | | 9 | |
| | | | | | | | | | | | | | | | |
| Security name | | Interest rate | | | Maturity date | | | Principal | | | Value | |
|
| Illinois (continued) | |
Illinois (GO Revenue) | | | 5.00 | % | | | 1-1-2023 | | | $ | 1,245,000 | | | $ | 1,250,578 | |
Illinois (GO Revenue, Ambac Insured) | | | 5.00 | | | | 4-1-2024 | | | | 1,830,000 | | | | 1,844,768 | |
Illinois (Miscellaneous Revenue) | | | 5.00 | | | | 8-1-2024 | | | | 2,610,000 | | | | 2,887,756 | |
Illinois (Miscellaneous Revenue) | | | 5.00 | | | | 8-1-2025 | | | | 5,685,000 | | | | 6,262,937 | |
Illinois (GO Revenue, AGM Insured) | | | 5.00 | | | | 4-1-2026 | | | | 3,000,000 | | | | 3,511,140 | |
Illinois (GO Revenue, Ambac Insured) | | | 5.00 | | | | 4-1-2027 | | | | 7,585,000 | | | | 7,646,211 | |
Illinois (GO Revenue, Ambac Insured) | | | 5.00 | | | | 4-1-2028 | | | | 6,705,000 | | | | 6,759,109 | |
Illinois (Miscellaneous Revenue) | | | 5.25 | | | | 7-1-2030 | | | | 2,500,000 | | | | 2,804,250 | |
Illinois (Miscellaneous Revenue) | | | 5.50 | | | | 7-1-2025 | | | | 6,000,000 | | | | 6,941,100 | |
Illinois (Miscellaneous Revenue) | | | 5.50 | | | | 7-1-2026 | | | | 4,450,000 | | | | 5,135,834 | |
Illinois (GO Revenue) | | | 5.50 | | | | 1-1-2030 | | | | 2,900,000 | | | | 3,526,864 | |
Illinois (Miscellaneous Revenue) | | | 5.50 | | | | 7-1-2038 | | | | 4,000,000 | | | | 4,493,040 | |
Illinois Finance Authority Advocate Healthcare Network Series D (Health Revenue) | | | 6.50 | | | | 11-1-2038 | | | | 5,415,000 | | | | 6,147,704 | |
Illinois Finance Authority Carle Foundation Obligated Group Series C (Health Revenue, Northern Trust Company LOC) ø | | | 0.42 | | | | 2-15-2033 | | | | 10,000,000 | | | | 10,000,000 | |
Illinois Finance Authority Centegra Health System Project (Health Revenue) | | | 5.00 | | | | 9-1-2018 | | | | 1,325,000 | | | | 1,416,147 | |
Illinois Finance Authority Centegra Health System Project (Health Revenue) | | | 5.00 | | | | 9-1-2020 | | | | 1,465,000 | | | | 1,649,942 | |
Illinois Finance Authority Charter School Refunding Bond Series A (Education Revenue) | | | 6.88 | | | | 10-1-2031 | | | | 1,865,000 | | | | 2,070,001 | |
Illinois Finance Authority Charter Schools Series A (Education Revenue) | | | 6.25 | | | | 9-1-2039 | | | | 7,955,000 | | | | 9,464,302 | |
Illinois Finance Authority Charter Schools Series A (Education Revenue) | | | 7.13 | | | | 10-1-2041 | | | | 3,800,000 | | | | 4,252,238 | |
Illinois Finance Authority Medical District Commission Project A (Health Revenue, AGC Insured) | | | 4.13 | | | | 9-1-2018 | | | | 515,000 | | | | 517,297 | |
Illinois Finance Authority Northwest Community Hospital Series B (Health Revenue, JPMorgan Chase & Company LOC) ø | | | 0.42 | | | | 7-1-2032 | | | | 10,005,000 | | | | 10,005,000 | |
Illinois Finance Authority Northwestern Memorial Hospital Project Series A (Health Revenue) | | | 6.00 | | | | 8-15-2039 | | | | 5,000,000 | | | | 5,836,300 | |
Illinois Finance Authority OSF Healthcare System Series F (Health Revenue, Barclays Bank plc LOC) ø | | | 0.42 | | | | 11-15-2037 | | | | 10,000,000 | | | | 10,000,000 | |
Illinois Finance Authority Student Housing Illinois State University (Education Revenue) | | | 6.75 | | | | 4-1-2031 | | | | 8,000,000 | | | | 9,208,160 | |
Illinois Finance Authority University of Chicago Series B (Education Revenue) | | | 6.25 | | | | 7-1-2038 | | | | 3,115,000 | | | | 3,462,198 | |
Illinois Finance Authority YMCA of Metropolitan Chicago Project (Miscellaneous Revenue, Harris NA LOC) ø | | | 0.46 | | | | 6-1-2034 | | | | 5,000,000 | | | | 5,000,000 | |
Illinois Municipal Electric Agency Power Supply System Series A (Utilities Revenue) | | | 5.00 | | | | 2-1-2030 | | | | 7,000,000 | | | | 8,606,080 | |
Illinois Municipal Electric Agency Power Supply System Series A (Utilities Revenue) | | | 5.00 | | | | 2-1-2031 | | | | 8,000,000 | | | | 9,791,200 | |
Illinois Series 1 (GO Revenue, National Insured) | | | 6.00 | | | | 11-1-2026 | | | | 3,200,000 | | | | 3,907,552 | |
Illinois Series 2013 (Miscellaneous Revenue) | | | 5.00 | | | | 7-1-2022 | | | | 6,750,000 | | | | 7,547,513 | |
Illinois Series A (GO Revenue) | | | 5.00 | | | | 4-1-2021 | | | | 6,675,000 | | | | 7,364,661 | |
Illinois Series A (GO Revenue, AGM Insured) | | | 5.00 | | | | 4-1-2024 | | | | 3,000,000 | | | | 3,487,530 | |
Illinois Sports Facilities Authority (Tax Revenue, AGM Insured) | | | 5.00 | | | | 6-15-2028 | | | | 4,030,000 | | | | 4,687,172 | |
Illinois Sports Facilities Authority (Tax Revenue, AGM Insured) | | | 5.25 | | | | 6-15-2032 | | | | 3,500,000 | | | | 4,078,025 | |
Illinois Sports Facilities Authority State Tax Supported CAB (Tax Revenue, Ambac Insured) ¤ | | | 0.00 | | | | 6-15-2021 | | | | 7,595,000 | | | | 6,752,107 | |
Illinois Sports Facilities Authority State Tax Supported CAB (Tax Revenue, Ambac Insured) ¤ | | | 0.00 | | | | 6-15-2024 | | | | 17,510,000 | | | | 14,214,443 | |
Illinois Sports Facilities Authority State Tax Supported CAB (Tax Revenue, Ambac Insured) ¤ | | | 0.00 | | | | 6-15-2025 | | | | 1,040,000 | | | | 814,736 | |
Illinois Sports Facilities Authority State Tax Supported Refunding Bonds (Tax Revenue, AGM Insured) | | | 5.00 | | | | 6-15-2025 | | | | 3,745,000 | | | | 4,413,370 | |
Illinois Sports Facilities Authority State Tax Supported Refunding Bonds (Tax Revenue, AGM Insured) | | | 5.00 | | | | 6-15-2026 | | | | 4,775,000 | | | | 5,602,221 | |
| | | | |
| 10 | | Wells Fargo Municipal Bond Fund | | Portfolio of investments—June 30, 2016 |
| | | | | | | | | | | | | | | | |
| Security name | | Interest rate | | | Maturity date | | | Principal | | | Value | |
|
| Illinois (continued) | |
Illinois Sports Facilities Authority State Tax Supported Refunding Bonds (Tax Revenue, AGM Insured) | | | 5.00 | % | | | 6-15-2027 | | | $ | 8,355,000 | | | $ | 9,747,695 | |
Illinois Toll Highway Authority Series B (Transportation Revenue) | | | 5.00 | | | | 1-1-2039 | | | | 1,500,000 | | | | 1,786,740 | |
Kane-Cook-DuPage Counties IL School District #46 CAB Series B (GO Revenue, Ambac Insured) ¤ | | | 0.00 | | | | 1-1-2023 | | | | 8,225,000 | | | | 7,477,759 | |
Kane-Cook-DuPage Counties IL School District #46 CAB Series B (GO Revenue, Ambac Insured) ¤ | | | 0.00 | | | | 1-1-2023 | | | | 15,025,000 | | | | 12,750,666 | |
Kendall-Kane-Will Counties IL CAB School District #308 (GO Revenue, AGM Insured) ¤ | | | 0.00 | | | | 2-1-2025 | | | | 1,710,000 | | | | 1,366,068 | |
Kendall-Kane-Will Counties IL CAB School District #308 (GO Revenue, AGM Insured) ¤ | | �� | 0.00 | | | | 2-1-2026 | | | | 5,050,000 | | | | 3,869,260 | |
Kendall-Kane-Will Counties IL CAB School District #308 (GO Revenue, AGM Insured) ¤ | | | 0.00 | | | | 2-1-2027 | | | | 12,050,000 | | | | 8,805,658 | |
Lake County IL School District #24 Millburn CAB (GO Revenue, National Insured) ¤ | | | 0.00 | | | | 1-1-2024 | | | | 2,000,000 | | | | 1,612,640 | |
Lake County IL School District #38 Big Hollow CAB (GO Revenue, Ambac Insured) ¤ | | | 0.00 | | | | 2-1-2018 | | | | 3,800,000 | | | | 3,666,544 | |
Lake County IL School District #38 Big Hollow CAB (GO Revenue, Ambac Insured) ¤ | | | 0.00 | | | | 2-1-2019 | | | | 675,000 | | | | 632,880 | |
Lake County IL School District #38 Big Hollow CAB (GO Revenue, Ambac Insured) ¤ | | | 0.00 | | | | 2-1-2020 | | | | 1,250,000 | | | | 1,138,425 | |
Lake County IL School District #38 Big Hollow CAB (GO Revenue, Ambac Insured) ¤ | | | 0.00 | | | | 2-1-2021 | | | | 1,175,000 | | | | 1,037,913 | |
Lake County IL School District #38 Big Hollow CAB (GO Revenue, Ambac Insured) ¤ | | | 0.00 | | | | 2-1-2024 | | | | 5,385,000 | | | | 4,313,816 | |
Lake County IL Township High School District #126 Zion-Benton CAB (GO Revenue, National Insured) ¤ | | | 0.00 | | | | 2-1-2020 | | | | 910,000 | | | | 852,497 | |
McHenry-Kane Counties IL Community Consolidated School District #158 (GO Revenue) | | | 5.63 | | | | 1-15-2032 | | | | 2,500,000 | | | | 3,006,575 | |
McHenry-Kane Counties IL Community Consolidated School District #158 CAB (GO Revenue, National Insured) ¤ | | | 0.00 | | | | 1-1-2019 | | | | 765,000 | | | | 745,584 | |
McHenry-Kane Counties IL Community Consolidated School District #158 CAB (GO Revenue, National Insured) ¤ | | | 0.00 | | | | 1-1-2021 | | | | 6,250,000 | | | | 5,625,938 | |
McHenry-Kane Counties IL Community Consolidated School District #158 CAB (GO Revenue, AGM/FGIC Insured) ¤ | | | 0.00 | | | | 1-1-2023 | | | | 1,805,000 | | | | 1,547,607 | |
Metropolitan Pier & Exposition Authority Illinois CAB McCormick Place Expansion Project Series A (Tax Revenue, National Insured) ¤ | | | 0.00 | | | | 12-15-2026 | | | | 11,435,000 | | | | 8,308,214 | |
Metropolitan Pier & Exposition Authority Illinois
Series 2015-XM0036 (Airport Revenue, Morgan Stanley Bank LIQ) 144Aø | | | 1.00 | | | | 6-15-2050 | | | | 12,640,000 | | | | 12,640,000 | |
Regional Transportation Authority Illinois (Tax Revenue, AGM Insured) | | | 5.75 | | | | 6-1-2023 | | | | 400,000 | | | | 493,684 | |
Sangamon County IL School District #186 Certificate of Participation Hay-Edwards Elementary School Project Series A (Miscellaneous Revenue, ACA Insured) | | | 5.88 | | | | 8-15-2018 | | | | 1,815,000 | | | | 1,784,127 | |
Southwestern Illinois Development Authority Local Government Program Collinsville Limited (Tax Revenue) | | | 5.00 | | | | 3-1-2025 | | | | 2,525,000 | | | | 2,163,622 | |
Springfield IL Senior Lien Notes (Utilities Revenue, National Insured) | | | 5.00 | | | | 3-1-2024 | | | | 1,425,000 | | | | 1,466,496 | |
Tazewell County IL School District #51 (GO Revenue, National Insured) | | | 9.00 | | | | 12-1-2023 | | | | 350,000 | | | | 518,039 | |
University of Illinois Auxiliary Facilities Systems Series A (Education Revenue, National Insured) ¤ | | | 0.00 | | | | 4-1-2026 | | | | 2,355,000 | | | | 1,826,609 | |
University of Illinois Auxiliary Facilities Systems Series A (Education Revenue, National Insured) ¤ | | | 0.00 | | | | 4-1-2027 | | | | 2,435,000 | | | | 1,816,315 | |
University of Illinois Auxiliary Facilities Systems Series A (Education Revenue) | | | 5.75 | | | | 4-1-2038 | | | | 14,000,000 | | | | 15,893,220 | |
Will County IL Community Unified School District #201 U Crete-Monee CAB (GO Revenue, National Insured) ¤ | | | 0.00 | | | | 11-1-2023 | | | | 1,500,000 | | | | 1,244,190 | |
| | | | |
| | | | | | | | | | | | | | | 566,365,522 | |
| | | | | | | | | | | | | | | | |
| | | | | | |
| Portfolio of investments—June 30, 2016 | | Wells Fargo Municipal Bond Fund | | | 11 | |
| | | | | | | | | | | | | | | | |
| Security name | | Interest rate | | | Maturity date | | | Principal | | | Value | |
|
| Indiana: 1.37% | |
Indiana Finance Authority AMT-I-69 Development Partners LLC (Miscellaneous Revenue) | | | 5.25 | % | | | 9-1-2034 | | | $ | 5,000,000 | | | $ | 5,696,800 | |
Indiana Finance Authority Ohio River Bridges East End Crossing Project Series A (Industrial Development Revenue) | | | 5.00 | | | | 7-1-2035 | | | | 9,970,000 | | | | 11,444,762 | |
Indiana Finance Authority Ohio River Bridges East End Crossing Project Series A (Industrial Development Revenue) | | | 5.00 | | | | 7-1-2040 | | | | 2,470,000 | | | | 2,810,020 | |
Indianapolis IN Local Public Improvement Bond Bank Airport Authority Project Series F (Miscellaneous Revenue, Ambac Insured) | | | 5.00 | | | | 1-1-2023 | | | | 2,750,000 | | | | 2,750,330 | |
Rockport IN AEP Generating Company Project (Industrial Development Revenue, Bank of Tokyo-Mitsubishi LOC) ø | | | 0.43 | | | | 7-1-2025 | | | | 16,200,000 | | | | 16,200,000 | |
Valparaiso IN Pratt Paper LLC Project (Industrial Development Revenue) | | | 5.88 | | | | 1-1-2024 | | | | 1,270,000 | | | | 1,499,654 | |
| | | | |
| | | | | | | | | | | | | | | 40,401,566 | |
| | | | | | | | | | | | | | | | |
|
| Iowa: 0.17% | |
Altoona IA Annual Appropriation Urban Renewal Series C (GO Revenue) %% | | | 5.00 | | | | 6-1-2031 | | | | 1,805,000 | | | | 2,202,660 | |
Coralville IA Certificate of Participation Series D (Miscellaneous Revenue) | | | 5.25 | | | | 6-1-2026 | | | | 2,695,000 | | | | 2,696,590 | |
| | | | |
| | | | | | | | | | | | | | | 4,899,250 | |
| | | | | | | | | | | | | | | | |
|
| Kansas: 1.20% | |
Sedgwick & Shawnee Counties KS Mortgage-Backed Securities Series A2 (Housing Revenue, GNMA Insured) | | | 6.70 | | | | 6-1-2029 | | | | 70,000 | | | | 70,610 | |
Wyandotte County & Kansas City KS Sales Tax Special Obligation Vacation Village Project Area 4 - Major Multi-Sport Athletic Complex Project CAB Series 2015 (Tax Revenue) 144A¤ | | | 0.00 | | | | 9-1-2034 | | | | 97,000,000 | | | | 35,246,890 | |
Wyandotte County & Kansas City KS Unified Government Special Obligation Second Lien CAB Series B (Tax Revenue) ¤ | | | 0.00 | | | | 6-1-2021 | | | | 45,000 | | | | 34,244 | |
| | | | |
| | | | | | | | | | | | | | | 35,351,744 | |
| | | | | | | | | | | | | | | | |
|
| Kentucky: 1.69% | |
Kentucky EDFA Balance Norton Series B (Health Revenue, National Insured) ¤ | | | 0.00 | | | | 10-1-2028 | | | | 4,845,000 | | | | 3,393,438 | |
Kentucky EDFA Catholic Health Initiatives Series B (Health Revenue) ± | | | 1.79 | | | | 2-1-2046 | | | | 22,715,000 | | | | 22,343,610 | |
Kentucky EDFA Norton Healthcare Incorporated Series B (Health Revenue, National Insured) ¤ | | | 0.00 | | | | 10-1-2024 | | | | 9,260,000 | | | | 7,479,024 | |
Kentucky EDFA Series 2980 (Health Revenue, Morgan Stanley Bank LIQ) 144Aø | | | 0.73 | | | | 8-15-2024 | | | | 10,500,000 | | | | 10,500,000 | |
Kentucky Public Transportation Infrastructure Authority Downtown Crossing Project CAB Series C (Transportation Revenue) ± | | | 0.00 | | | | 7-1-2033 | | | | 1,000,000 | | | | 882,430 | |
Kentucky Public Transportation Infrastructure Authority Downtown Crossing Project CAB Series C (Transportation Revenue) ± | | | 0.00 | | | | 7-1-2034 | | | | 1,505,000 | | | | 1,323,136 | |
Kentucky Public Transportation Infrastructure Authority Downtown Crossing Project Series B (Transportation Revenue) ¤ | | | 0.00 | | | | 7-1-2030 | | | | 2,000,000 | | | | 1,144,080 | |
Kentucky Public Transportation Infrastructure Authority Downtown Crossing Project Series B (Transportation Revenue) ¤ | | | 0.00 | | | | 7-1-2031 | | | | 2,780,000 | | | | 1,485,632 | |
Kentucky Public Transportation Infrastructure Authority Downtown Crossing Project Series B (Transportation Revenue) ¤ | | | 0.00 | | | | 7-1-2032 | | | | 2,500,000 | | | | 1,246,650 | |
| | | | |
| | | | | | | | | | | | | | | 49,798,000 | |
| | | | | | | | | | | | | | | | |
|
| Louisiana: 0.78% | |
Louisiana Local Government Environmental Facilities (Miscellaneous Revenue, Ambac Insured) | | | 5.25 | | | | 12-1-2018 | | | | 2,085,000 | | | | 2,165,001 | |
Louisiana Tobacco Settlement Financing Corporation Revenue Bonds Series A (Tobacco Revenue) | | | 5.00 | | | | 5-15-2025 | | | | 2,410,000 | | | | 2,416,242 | |
| | | | |
| 12 | | Wells Fargo Municipal Bond Fund | | Portfolio of investments—June 30, 2016 |
| | | | | | | | | | | | | | | | |
| Security name | | Interest rate | | | Maturity date | | | Principal | | | Value | |
|
| Louisiana (continued) | |
New Orleans LA (GO Revenue, FGIC Insured) | | | 5.50 | % | | | 12-1-2021 | | | $ | 2,050,000 | | | $ | 2,324,003 | |
New Orleans LA Aviation Board AMT Series B (Airport Revenue, AGM Insured) | | | 5.00 | | | | 1-1-2033 | | | | 3,000,000 | | | | 3,583,980 | |
New Orleans LA Aviation Board AMT Series B (Airport Revenue) | | | 5.00 | | | | 1-1-2034 | | | | 4,500,000 | | | | 5,311,620 | |
New Orleans LA Aviation Board Gulf Opportunity Zone Consolidated Rental Car Series A (Airport Revenue) | | | 6.50 | | | | 1-1-2040 | | | | 6,500,000 | | | | 7,290,270 | |
| | | | |
| | | | | | | | | | | | | | | 23,091,116 | |
| | | | | | | | | | | | | | | | |
|
| Maine: 0.08% | |
Maine Educational Loan Authority Student Loan Series A-3 Class A (Education Revenue, AGC Insured) | | | 5.88 | | | | 12-1-2039 | | | | 2,015,000 | | | | 2,241,385 | |
| | | | | | | | | | | | | | | | |
|
| Maryland: 0.31% | |
Howard County MD Certificate of Participation Agricultural Land Preservation #90-23 Series A (Miscellaneous Revenue) | | | 8.00 | | | | 8-15-2020 | | | | 296,000 | | | | 366,587 | |
Prince Georges County MD Charter School Chesapeake Lighthouse Obligated Group Series A (Education Revenue) 144A | | | 6.90 | | | | 8-1-2041 | | | | 8,480,000 | | | | 8,888,906 | |
| | | | |
| | | | | | | | | | | | | | | 9,255,493 | |
| | | | | | | | | | | | | | | | |
|
| Massachusetts: 0.73% | |
Massachusetts Development Finance Agency Sabis International Charter Series A (Education Revenue) | | | 8.00 | | | | 4-15-2031 | | | | 2,150,000 | | | | 2,655,465 | |
Massachusetts Development Finance Agency Sabis International Charter Series A (Education Revenue) | | | 8.00 | | | | 4-15-2039 | | | | 3,900,000 | | | | 4,816,890 | |
Massachusetts Educational Finance Authority Series B (Education Revenue) | | | 5.38 | | | | 1-1-2020 | | | | 1,780,000 | | | | 1,927,900 | |
Massachusetts Educational Finance Authority Series I (Education Revenue) | | | 6.00 | | | | 1-1-2028 | | | | 1,790,000 | | | | 1,906,493 | |
Massachusetts Educational Finance Authority Series J (Education Revenue) | | | 5.00 | | | | 7-1-2020 | | | | 6,000,000 | | | | 6,733,380 | |
Massachusetts Educational Finance Authority Series J (Education Revenue) | | | 5.00 | | | | 7-1-2021 | | | | 3,000,000 | | | | 3,406,530 | |
| | | | |
| | | | | | | | | | | | | | | 21,446,658 | |
| | | | | | | | | | | | | | | | |
|
| Michigan: 5.74% | |
Detroit MI Distribution of State Aid (GO Revenue) | | | 5.00 | | | | 11-1-2030 | | | | 2,330,000 | | | | 2,552,818 | |
Detroit MI Downtown Development Authority CAB (Tax Revenue) ¤ | | | 0.00 | | | | 7-1-2018 | | | | 3,050,000 | | | | 2,826,496 | |
Detroit MI Downtown Development Authority CAB (Tax Revenue) ¤ | | | 0.00 | | | | 7-1-2019 | | | | 3,050,000 | | | | 2,717,276 | |
Detroit MI Downtown Development Authority CAB (Tax Revenue) ¤ | | | 0.00 | | | | 7-1-2020 | | | | 2,070,000 | | | | 1,740,125 | |
Detroit MI Water Supply System Second Lien Series B (Water & Sewer Revenue, AGM Insured) | | | 7.00 | | | | 7-1-2036 | | | | 9,675,000 | | | | 10,999,121 | |
Livonia MI Public Schools School District Building & Site Series I (GO Revenue) | | | 5.00 | | | | 5-1-2026 | | | | 1,075,000 | | | | 1,279,078 | |
Livonia MI Public Schools School District Building & Site Series I (GO Revenue) | | | 5.00 | | | | 5-1-2028 | | | | 1,450,000 | | | | 1,708,361 | |
Livonia MI Public Schools School District Building & Site Series I (GO Revenue) | | | 5.00 | | | | 5-1-2029 | | | | 1,350,000 | | | | 1,563,462 | |
Livonia MI Public Schools School District Building & Site Series I (GO Revenue) | | | 5.00 | | | | 5-1-2030 | | | | 1,775,000 | | | | 2,074,886 | |
Livonia MI Public Schools School District Building & Site Series I (GO Revenue) | | | 5.00 | | | | 5-1-2031 | | | | 1,425,000 | | | | 1,660,196 | |
Michigan Finance Authority Limited Obligation Holly Academy (Education Revenue) | | | 6.50 | | | | 10-1-2020 | | | | 155,000 | | | | 166,306 | |
Michigan Finance Authority Limited Obligation Holly Academy (Education Revenue) | | | 8.00 | | | | 10-1-2040 | | | | 1,350,000 | | | | 1,563,935 | |
Michigan Finance Authority Limited Obligation Series A (Miscellaneous Revenue) | | | 7.50 | | | | 12-1-2020 | | | | 310,000 | | | | 340,888 | |
Michigan Finance Authority Limited Obligation Series A (Miscellaneous Revenue) | | | 8.00 | | | | 12-1-2030 | | | | 1,135,000 | | | | 1,291,573 | |
Michigan Finance Authority Limited Obligation Series A (Miscellaneous Revenue) | | | 8.25 | | | | 12-1-2039 | | | | 2,220,000 | | | | 2,553,044 | |
Michigan Finance Authority Public School Academy University Learning (Education Revenue) | | | 6.25 | | | | 11-1-2020 | | | | 440,000 | | | | 469,660 | |
Michigan Finance Authority Refunding Bond Local Government Loan Program City of Detroit Financial Recovery Series F (Tax Revenue) | | | 4.50 | | | | 10-1-2029 | | | | 3,000,000 | | | | 3,361,380 | |
| | | | | | |
| Portfolio of investments—June 30, 2016 | | Wells Fargo Municipal Bond Fund | | | 13 | |
| | | | | | | | | | | | | | | | |
| Security name | | Interest rate | | | Maturity date | | | Principal | | | Value | |
|
| Michigan (continued) | |
Michigan Finance Authority Refunding Bond Local Government Loan Program Detroit Water & Sewer Series D4 (Water & Sewer Revenue) | | | 5.00 | % | | | 7-1-2031 | | | $ | 6,500,000 | | | $ | 7,703,085 | |
Michigan Finance Authority Refunding Bond Local Government Loan Program Detroit Water & Sewer Series D6 (Water & Sewer Revenue, National Insured) | | | 5.00 | | | | 7-1-2036 | | | | 3,250,000 | | | | 3,802,598 | |
Michigan Finance Authority Refunding Notes Local Government Loan Program Public Lighting Authority Series B (Tax Revenue) | | | 5.00 | | | | 7-1-2044 | | | | 12,625,000 | | | | 14,496,656 | |
Michigan Finance Authority Revenue Local Government Loan Program Series C (Water & Sewer Revenue, National Insured) | | | 5.00 | | | | 7-1-2025 | | | | 2,000,000 | | | | 2,443,360 | |
Michigan Finance Authority Revenue Local Government Loan Program Series C (Water & Sewer Revenue, National Insured) | | | 5.00 | | | | 7-1-2026 | | | | 1,945,000 | | | | 2,360,938 | |
Michigan Finance Authority Revenue Local Government Loan Program Series C (Water & Sewer Revenue, National Insured) | | | 5.00 | | | | 7-1-2027 | | | | 2,260,000 | | | | 2,724,814 | |
Michigan Finance Authority Revenue Local Government Loan Program Series C (Water & Sewer Revenue, National Insured) | | | 5.00 | | | | 7-1-2028 | | | | 3,480,000 | | | | 4,180,141 | |
Michigan Finance Authority Revenue Local Government Loan Program Series C (Water & Sewer Revenue, National Insured) | | | 5.00 | | | | 7-1-2032 | | | | 5,750,000 | | | | 6,814,268 | |
Michigan Finance Authority Revenue Local Government Loan Program Series D (Water & Sewer Revenue, National Insured) | | | 5.00 | | | | 7-1-2027 | | | | 1,000,000 | | | | 1,205,670 | |
Michigan Finance Authority Revenue Series H-1 (Tax Revenue) | | | 5.00 | | | | 10-1-2031 | | | | 1,340,000 | | | | 1,602,707 | |
Michigan Finance Authority Revenue Series H-1 (Tax Revenue) | | | 5.00 | | | | 10-1-2032 | | | | 2,000,000 | | | | 2,387,140 | |
Michigan Finance Authority Revenue Series H-1 (Tax Revenue) | | | 5.00 | | | | 10-1-2033 | | | | 2,975,000 | | | | 3,538,614 | |
Michigan Finance Authority Revenue Series H-1 (Tax Revenue) | | | 5.00 | | | | 10-1-2034 | | | | 3,670,000 | | | | 4,353,244 | |
Michigan Finance Authority Revenue Series H-1 (Tax Revenue) | | | 5.00 | | | | 10-1-2039 | | | | 7,955,000 | | | | 9,325,806 | |
Michigan Hospital Finance Authority Hospice of Michigan (Miscellaneous Revenue, Fifth Third Bank LOC) ø | | | 0.52 | | | | 9-1-2027 | | | | 1,000,000 | | | | 1,000,000 | |
Michigan Municipal Bond Authority Local Government Loan Program CAB Series G (Miscellaneous Revenue, Ambac Insured) ¤ | | | 0.00 | | | | 5-1-2017 | | | | 365,000 | | | | 357,722 | |
Michigan Municipal Bond Authority Local Government Loan Program Series A (Miscellaneous Revenue, Ambac Insured) | | | 4.00 | | | | 11-1-2021 | | | | 150,000 | | | | 151,349 | |
Michigan Municipal Bond Authority Local Government Loan Program Series A (Miscellaneous Revenue, Ambac Insured) | | | 5.00 | | | | 5-1-2017 | | | | 550,000 | | | | 562,859 | |
Michigan Municipal Bond Authority Local Government Loan Program Series B Group A (Miscellaneous Revenue, Ambac Insured) | | | 4.25 | | | | 12-1-2016 | | | | 2,770,000 | | | | 2,795,955 | |
Michigan Municipal Bond Authority Local Government Loan Program Series B Group A (Miscellaneous Revenue, Ambac Insured) | | | 5.00 | | | | 12-1-2017 | | | | 2,475,000 | | | | 2,535,464 | |
Michigan Municipal Bond Authority Local Government Loan Program Series B Group A (Miscellaneous Revenue, Ambac Insured) | | | 5.25 | | | | 12-1-2023 | | | | 1,185,000 | | | | 1,204,991 | |
Michigan Municipal Bond Authority Local Government Loan Program Series C (Miscellaneous Revenue, Ambac Insured) | | | 3.75 | | | | 5-1-2017 | | | | 450,000 | | | | 455,400 | |
Michigan Municipal Bond Authority Local Government Loan Program Series C (Miscellaneous Revenue, Ambac Insured) | | | 4.00 | | | | 5-1-2019 | | | | 100,000 | | | | 101,217 | |
Michigan Municipal Bond Authority Local Government Loan Program Series C (Miscellaneous Revenue, Ambac Insured) | | | 4.75 | | | | 5-1-2027 | | | | 4,610,000 | | | | 4,667,671 | |
Michigan Municipal Bond Authority Local Government Loan Program Series G (Miscellaneous Revenue, Ambac Insured) ¤ | | | 0.00 | | | | 5-1-2019 | | | | 75,000 | | | | 69,514 | |
Michigan Municipal Bond Authority Local Government Loan Program Series G (Miscellaneous Revenue, Ambac Insured) ¤ | | | 0.00 | | | | 5-1-2020 | | | | 205,000 | | | | 184,352 | |
Michigan Public Educational Facilities Authority Bradford Academy Project (Education Revenue) | | | 8.75 | | | | 9-1-2039 | | | | 3,500,000 | | | | 2,800,070 | |
Michigan Public Educational Facilities Authority Limited Obligation Bradford Academy Project (Education Revenue) 144A | | | 6.50 | | | | 9-1-2037 | | | | 3,745,000 | | | | 2,996,075 | |
| | | | |
| 14 | | Wells Fargo Municipal Bond Fund | | Portfolio of investments—June 30, 2016 |
| | | | | | | | | | | | | | | | |
| Security name | | Interest rate | | | Maturity date | | | Principal | | | Value | |
|
| Michigan (continued) | |
Michigan Public Educational Facilities Authority Limited Obligation Bradford Academy Project (Education Revenue) | | | 8.50 | % | | | 9-1-2029 | | | $ | 1,500,000 | | | $ | 1,200,030 | |
Michigan Public Educational Facilities Authority Limited Obligation Crescent Academy (Education Revenue) | | | 7.00 | | | | 10-1-2036 | | | | 1,195,000 | | | | 1,267,154 | |
Michigan Public Educational Facilities Authority Limited Obligation Nataki Talibah (Miscellaneous Revenue) (i)(s)(t) | | | 6.25 | | | | 10-1-2023 | | | | 800,000 | | | | 239,976 | |
Michigan Public Educational Facilities Authority Madison Academy Project (Education Revenue) | | | 8.38 | | | | 12-1-2030 | | | | 2,085,000 | | | | 2,403,609 | |
Michigan Public Educational Facilities Authority Madison Academy Project (Education Revenue) | | | 8.63 | | | | 12-1-2039 | | | | 4,170,000 | | | | 4,857,633 | |
Michigan Strategic Fund Limited Obligation Detroit Edison Company Exempt Facilities Project Series KT (Utilities Revenue) | | | 5.63 | | | | 7-1-2020 | | | | 1,200,000 | | | | 1,398,732 | |
Michigan Strategic Fund Limited Obligation Events Center Project Series A (Tax Revenue) ± | | | 4.13 | | | | 7-1-2045 | | | | 15,500,000 | | | | 15,915,865 | |
Oakland County MI Economic Development Corporation The Academy of The Sacred Heart Project Series A (Education Revenue) | | | 6.50 | | | | 12-15-2036 | | | | 4,505,000 | | | | 4,578,251 | |
Star International Academy Michigan (Miscellaneous Revenue) | | | 3.40 | | | | 3-1-2017 | | | | 100,000 | | | | 100,618 | |
Tender Option Bond Trust Receipts for Michigan Housing Development Authority Series XF0385 (Housing Revenue, AGM Insured, Bank of America NA LIQ) 144Aø | | | 0.72 | | | | 10-1-2042 | | | | 1,000,000 | | | | 1,000,000 | |
Wayne Charter County MI Airport Authority Junior Lien (Airport Revenue, National Insured) | | | 5.00 | | | | 12-1-2016 | | | | 1,115,000 | | | | 1,133,476 | |
Wayne County MI Building Improvement Series A (GO Revenue) | | | 6.75 | | | | 11-1-2039 | | | | 8,910,000 | | | | 9,511,069 | |
| | | | |
| | | | | | | | | | | | | | | 169,296,698 | |
| | | | | | | | | | | | | | | | |
|
| Minnesota: 0.03% | |
Baytown Township MN St. Croix Preparatory Academy Series A (Education Revenue) | | | 7.00 | | | | 8-1-2038 | | | | 750,000 | | | | 766,755 | |
| | | | | | | | | | | | | | | | |
|
| Mississippi: 1.01% | |
Mississippi Development Bank Special Obligation Jackson Water & Sewer System Project Series A (Water & Sewer Revenue, AGM Insured) | | | 5.00 | | | | 9-1-2030 | | | | 8,155,000 | | | | 9,719,374 | |
Perry County MS PCR Leaf River Forest Products Incorporated Project (Industrial Development Revenue, Georgia-Pacific LLC LOC) 144Aø | | | 0.60 | | | | 2-1-2022 | | | | 20,000,000 | | | | 20,000,000 | |
| | | | |
| | | | | | | | | | | | | | | 29,719,374 | |
| | | | | | | | | | | | | | | | |
|
| Missouri: 0.59% | |
Blue Springs MO Special Obligation Tax Refunding & Improvement Adams Farm Project Series A (Tax Revenue) | | | 4.00 | | | | 6-1-2026 | | | | 10,875,000 | | | | 11,365,245 | |
Manchester MO Highway 141 Manchester Road Project (Tax Revenue) | | | 6.00 | | | | 11-1-2025 | | | | 1,430,000 | | | | 1,520,376 | |
St. Louis MO IDA Convention Center Hotel (Miscellaneous Revenue, Ambac Insured) ¤ | | | 0.00 | | | | 7-15-2019 | | | | 2,475,000 | | | | 2,354,542 | |
St. Louis MO Lambert St. Louis International Airport Series A-1 (Airport Revenue) | | | 6.25 | | | | 7-1-2029 | | | | 2,000,000 | | | | 2,267,200 | |
| | | | |
| | | | | | | | | | | | | | | 17,507,363 | |
| | | | | | | | | | | | | | | | |
|
| Nebraska: 0.04% | |
Nebraska Central Plains Energy Project #3 (Utilities Revenue) | | | 5.00 | | | | 9-1-2027 | | | | 1,020,000 | | | | 1,189,657 | |
| | | | | | | | | | | | | | | | |
|
| Nevada: 0.67% | |
Las Vegas NV Special Improvement District #60 Local Improvement (Miscellaneous Revenue) | | | 5.00 | | | | 6-1-2022 | | | | 490,000 | | | | 549,270 | |
Las Vegas NV Special Improvement District #60 Local Improvement (Miscellaneous Revenue) | | | 5.00 | | | | 6-1-2023 | | | | 385,000 | | | | 436,717 | |
| | | | | | |
| Portfolio of investments—June 30, 2016 | | Wells Fargo Municipal Bond Fund | | | 15 | |
| | | | | | | | | | | | | | | | |
| Security name | | Interest rate | | | Maturity date | | | Principal | | | Value | |
|
| Nevada (continued) | |
Las Vegas NV Special Improvement District #60 Local Improvement (Miscellaneous Revenue) | | | 5.00 | % | | | 6-1-2024 | | | $ | 260,000 | | | $ | 296,013 | |
Tender Option Bond Trust Receipts for Las Vegas Valley NV Water District (GO Revenue, JPMorgan Chase & Company LIQ) 144Aø | | | 0.61 | | | | 6-1-2020 | | | | 5,000,000 | | | | 5,000,000 | |
Washoe County NV Series 2011-001 (GO Revenue, Dexia Credit Local LIQ) 144Aø | | | 0.76 | | | | 12-9-2030 | | | | 13,555,000 | | | | 13,555,000 | |
| | | | |
| | | | | | | | | | | | | | | 19,837,000 | |
| | | | | | | | | | | | | | | | |
|
| New Jersey: 5.44% | |
Bayonne NJ School Refunding Bonds (GO Revenue, AGM Insured) | | | 5.00 | | | | 7-15-2023 | | | | 2,505,000 | | | | 3,031,401 | |
New Jersey EDA Natural Gas Company Project Series C (Utilities Revenue, National Insured) ± | | | 4.90 | | | | 10-1-2040 | | | | 5,680,000 | | | | 5,701,754 | |
New Jersey EDA School Facilities Construction Project Series I (Miscellaneous Revenue) ± | | | 1.64 | | | | 9-1-2025 | | | | 1,315,000 | | | | 1,183,789 | |
New Jersey EDA School Facilities Construction Project Series I (Miscellaneous Revenue) ± | | | 1.96 | | | | 9-1-2027 | | | | 22,245,000 | | | | 19,992,916 | |
New Jersey EDA School Facilities Construction Project Series I (Miscellaneous Revenue) ± | | | 2.01 | | | | 3-1-2028 | | | | 7,200,000 | | | | 6,459,624 | |
New Jersey EDA School Facilities Construction Project Series II (Miscellaneous Revenue) | | | 5.00 | | | | 3-1-2026 | | | | 4,000,000 | | | | 4,419,640 | |
New Jersey EDA School Facilities Construction Project Series NN (Miscellaneous Revenue) | | | 5.00 | | | | 3-1-2026 | | | | 15,000,000 | | | | 16,738,500 | |
New Jersey TTFA (Transportation Revenue) | | | 6.00 | | | | 12-15-2038 | | | | 10,425,000 | | | | 11,574,461 | |
New Jersey TTFA CAB Series A (Transportation Revenue) ¤ | | | 0.00 | | | | 12-15-2029 | | | | 7,500,000 | | | | 4,407,825 | |
New Jersey TTFA CAB Series A (Transportation Revenue) ¤ | | | 0.00 | | | | 12-15-2030 | | | | 4,375,000 | | | | 2,450,263 | |
New Jersey TTFA CAB Series A (Transportation Revenue) ¤ | | | 0.00 | | | | 12-15-2031 | | | | 4,500,000 | | | | 2,402,955 | |
New Jersey TTFA CAB Series A (Transportation Revenue) ¤ | | | 0.00 | | | | 12-15-2026 | | | | 1,300,000 | | | | 883,610 | |
New Jersey TTFA Series A (Miscellaneous Revenue) | | | 5.00 | | | | 6-15-2042 | | | | 5,540,000 | | | | 6,073,834 | |
New Jersey TTFA Series A (Miscellaneous Revenue, National Insured) | | | 5.75 | | | | 6-15-2023 | | | | 2,000,000 | | | | 2,428,820 | |
New Jersey TTFA Series A (Miscellaneous Revenue, National Insured) | | | 5.75 | | | | 6-15-2025 | | | | 10,000,000 | | | | 12,550,800 | |
New Jersey TTFA Series AA (Miscellaneous Revenue) | | | 5.00 | | | | 6-15-2044 | | | | 1,000,000 | | | | 1,110,730 | |
New Jersey TTFA Series AA (Transportation Revenue) | | | 5.25 | | | | 6-15-2033 | | | | 10,000,000 | | | | 11,249,700 | |
New Jersey TTFA Series B (Transportation Revenue) | | | 5.25 | | | | 6-15-2036 | | | | 5,575,000 | | | | 6,186,801 | |
New Jersey TTFA Series C (Transportation Revenue) | | | 5.25 | | | | 6-15-2032 | | | | 8,000,000 | | | | 9,168,480 | |
Newark NJ Housing Authority Port Newark Marine Terminal Rental (Miscellaneous Revenue, National Insured) | | | 5.00 | | | | 1-1-2032 | | | | 7,620,000 | | | | 9,650,425 | |
Newark NJ Qualified General Improvement Series A (GO Revenue) | | | 5.00 | | | | 7-15-2025 | | | | 5,000,000 | | | | 5,738,550 | |
Newark NJ Qualified General Improvement Series A (GO Revenue) | | | 5.00 | | | | 7-15-2026 | | | | 2,205,000 | | | | 2,512,928 | |
Newark NJ Qualified General Improvement Series A (GO Revenue) | | | 5.00 | | | | 7-15-2027 | | | | 6,035,000 | | | | 6,822,507 | |
Newark NJ Qualified General Improvement Series A (GO Revenue) | | | 5.25 | | | | 7-15-2024 | | | | 1,325,000 | | | | 1,530,150 | |
Newark NJ Qualified General Improvement Series B (GO Revenue) | | | 5.00 | | | | 7-15-2025 | | | | 385,000 | | | | 441,868 | |
Newark NJ Qualified General Improvement Series B (GO Revenue) | | | 5.00 | | | | 7-15-2026 | | | | 395,000 | | | | 450,162 | |
Newark NJ Qualified General Improvement Series B (GO Revenue) | | | 5.00 | | | | 7-15-2027 | | | | 405,000 | | | | 457,848 | |
Newark NJ Qualified General Improvement Series B (GO Revenue) | | | 5.25 | | | | 7-15-2024 | | | | 375,000 | | | | 433,061 | |
Rutgers NJ State University Series L (Education Revenue) | | | 5.00 | | | | 5-1-2033 | | | | 3,560,000 | | | | 4,279,440 | |
| | | | |
| | | | | | | | | | | | | | | 160,332,842 | |
| | | | | | | | | | | | | | | | |
|
| New Mexico: 0.36% | |
New Mexico Mortgage Finance Authority SFMR Class I (Housing Revenue, GNMA/FNMA/FHLMC Insured) | | | 5.35 | | | | 3-1-2030 | | | | 725,000 | | | | 796,181 | |
New Mexico Municipal Energy Acquisition Authority Gas Supply Sub Series B (Utilities Revenue, Royal Bank of Canada SPA) ± | | | 1.06 | | | | 11-1-2039 | | | | 10,000,000 | | | | 9,922,300 | |
| | | | |
| | | | | | | | | | | | | | | 10,718,481 | |
| | | | | | | | | | | | | | | | |
| | | | |
| 16 | | Wells Fargo Municipal Bond Fund | | Portfolio of investments—June 30, 2016 |
| | | | | | | | | | | | | | | | |
| Security name | | Interest rate | | | Maturity date | | | Principal | | | Value | |
|
| New York: 11.77% | |
Hempstead Town NY Local Development Corporation The Academy Charter School Project Series A (Education Revenue) | | | 7.65 | % | | | 2-1-2044 | | | $ | 3,500,000 | | | $ | 4,011,805 | |
Hempstead Town NY Local Development Corporation The Academy Charter School Project Series A (Education Revenue) | | | 8.25 | | | | 2-1-2041 | | | | 9,790,000 | | | | 11,490,229 | |
Metropolitan Transportation Authority New York Series C (Transportation Revenue) | | | 6.50 | | | | 11-15-2028 | | | | 5,970,000 | | | | 6,782,219 | |
Metropolitan Transportation Authority New York Series C (Transportation Revenue) | | | 6.50 | | | | 11-15-2028 | | | | 2,030,000 | | | | 2,312,251 | |
Metropolitan Transportation Authority New York Services Contract Series 7 (Miscellaneous Revenue) | | | 5.63 | | | | 7-1-2016 | | | | 790,000 | | | | 790,111 | |
Metropolitan Transportation Authority New York Subseries E-2 (Transportation Revenue, Bank of Tokyo-Mitsubishi LOC) ø | | | 0.40 | | | | 11-15-2050 | | | | 15,000,000 | | | | 15,000,000 | |
Monroe County NY Industrial Development Agency Continuing Development Services Project (Industrial Development Revenue, Citizens Bank LOC) ø | | | 0.65 | | | | 7-1-2027 | | | | 1,250,000 | | | | 1,250,000 | |
New York Dormitory Authority North Shore-Long Island Jewish Obligated Group Series B (Health Revenue) ± | | | 1.16 | | | | 5-1-2018 | | | | 1,520,000 | | | | 1,517,994 | |
New York Dormitory Authority Series B (Tax Revenue) | | | 5.75 | | | | 3-15-2036 | | | | 10,000,000 | | | | 11,361,000 | |
New York NY Municipal Water Finance Authority 2nd General Resolution Series AA (Water & Sewer Revenue) | | | 5.00 | | | | 6-15-2044 | | | | 17,400,000 | | | | 20,342,514 | |
New York NY Municipal Water Finance Authority 2nd General Resolution Series BB (Water & Sewer Revenue) | | | 5.00 | | | | 6-15-2044 | | | | 30,265,000 | | | | 35,834,971 | |
New York NY Municipal Water Finance Authority 2nd General Resolution Series BB (Water & Sewer Revenue) | | | 5.25 | | | | 6-15-2044 | | | | 9,800,000 | | | | 11,800,082 | |
New York NY Municipal Water Finance Authority 2nd General Resolution Series DD (Water & Sewer Revenue, JPMorgan Chase & Company SPA) ø | | | 0.37 | | | | 6-15-2043 | | | | 10,000,000 | | | | 10,000,000 | |
New York NY Municipal Water Finance Authority 2nd General Resolution Series DD (Water & Sewer Revenue) | | | 6.00 | | | | 6-15-2040 | | | | 11,625,000 | | | | 12,815,749 | |
New York NY Municipal Water Finance Authority Water & Sewer System Series A (Water & Sewer Revenue) | | | 5.00 | | | | 6-15-2038 | | | | 36,650,000 | | | | 38,150,818 | |
New York NY Municipal Water Finance Authority Water & Sewer System Series A (Water & Sewer Revenue) | | | 5.75 | | | | 6-15-2040 | | | | 1,150,000 | | | | 1,263,574 | |
New York NY Municipal Water Finance Authority Water & Sewer System Series DD (Water & Sewer Revenue) | | | 5.00 | | | | 6-15-2026 | | | | 3,255,000 | | | | 3,872,083 | |
New York NY Municipal Water Finance Authority Water & Sewer System Unrefunded Balance (Water & Sewer Revenue) | | | 5.75 | | | | 6-15-2040 | | | | 3,850,000 | | | | 4,233,614 | |
New York NY Series A-6 (GO Revenue, AGM Insured, Dexia Credit Local SPA) ø | | | 0.60 | | | | 11-1-2026 | | | | 10,150,000 | | | | 10,150,000 | |
New York NY Series F-1 (GO Revenue) | | | 5.00 | | | | 3-1-2032 | | | | 3,000,000 | | | | 3,646,980 | |
New York NY Series I Subseries I-7 (GO Revenue, Bank of America NA LOC) ø | | | 0.39 | | | | 4-1-2036 | | | | 11,900,000 | | | | 11,900,000 | |
New York NY Transitional Finance Authority Building Aid Fiscal Year 2009 Series S-4 (Miscellaneous Revenue) | | | 5.75 | | | | 1-15-2039 | | | | 2,500,000 | | | | 2,819,925 | |
New York NY Transitional Finance Authority Future Tax Secured Bonds Fiscal 2007 Series A (Tax Revenue, Dexia Credit Local SPA) ø | | | 0.60 | | | | 8-1-2022 | | | | 20,500,000 | | | | 20,500,000 | |
New York NY Transitional Finance Authority Future Tax Secured Revenue Series I (Tax Revenue) | | | 5.00 | | | | 5-1-2033 | | | | 5,395,000 | | | | 6,597,761 | |
New York NY Transitional Finance Authority Future Tax Secured Subordinate Bonds Series A (Tax Revenue) | | | 5.00 | | | | 8-1-2031 | | | | 17,075,000 | | | | 21,432,369 | |
New York NY Transitional Finance Authority NYC Recovery Series 3 (Tax Revenue, Dexia Credit Local SPA) ø | | | 0.64 | | | | 11-1-2022 | | | | 10,000,000 | | | | 10,000,000 | |
New York NY Transitional Finance Authority Series 3 Sub Series 3C (Tax Revenue, Dexia Credit Local SPA) ø | | | 0.64 | | | | 11-1-2022 | | | | 6,135,000 | | | | 6,135,000 | |
New York NY Transitional Finance Authority Sub Series C3 (Tax Revenue, Dexia Credit Local SPA) ø | | | 0.56 | | | | 8-1-2031 | | | | 24,200,000 | | | | 24,200,000 | |
| | | | | | |
| Portfolio of investments—June 30, 2016 | | Wells Fargo Municipal Bond Fund | | | 17 | |
| | | | | | | | | | | | | | | | |
| Security name | | Interest rate | | | Maturity date | | | Principal | | | Value | |
|
| New York (continued) | |
New York Urban Development Corporation Certificate of Participation James A Farley Post Office Project (Miscellaneous Revenue) 144A | | | 4.20 | % | | | 2-1-2017 | | | $ | 20,920,000 | | | $ | 20,928,368 | |
Oyster Bay NY BAN Series C (GO Revenue) | | | 4.00 | | | | 6-1-2018 | | | | 3,000,000 | | | | 3,040,080 | |
Suffolk NY Tobacco Securitization Corporation Series B (Tobacco Revenue) | | | 4.50 | | | | 6-1-2026 | | | | 520,000 | | | | 588,401 | |
Suffolk NY Tobacco Securitization Corporation Series B (Tobacco Revenue) | | | 5.00 | | | | 6-1-2025 | | | | 500,000 | | | | 582,455 | |
Tender Option Bond Trust Receipts (Housing Revenue, Bank of America NA LIQ) 144Aø | | | 0.70 | | | | 11-1-2038 | | | | 4,600,000 | | | | 4,600,000 | |
Westchester County NY Local Development Corporation Pace University Series A (Education Revenue) | | | 5.00 | | | | 5-1-2034 | | | | 1,750,000 | | | | 2,007,075 | |
Westchester County NY Local Development Pace University Series B (Education Revenue) ø | | | 0.95 | | | | 5-1-2044 | | | | 5,000,000 | | | | 5,000,000 | |
| | | | |
| | | | | | | | | | | | | | | 346,957,428 | |
| | | | | | | | | | | | | | | | |
|
| North Carolina: 0.64% | |
North Carolina Eastern Municipal Power Agency Series A (Utilities Revenue) | | | 5.50 | | | | 1-1-2026 | | | | 1,250,000 | | | | 1,397,600 | |
North Carolina Eastern Municipal Power Agency Series C (Utilities Revenue) | | | 6.75 | | | | 1-1-2024 | | | | 2,000,000 | | | | 2,298,060 | |
North Carolina Medical Care Commission University Health Systems of Eastern Carolina Series D (Health Revenue) | | | 6.00 | | | | 12-1-2029 | | | | 5,000,000 | | | | 5,637,850 | |
North Carolina Medical Care Commission University Health Systems of Eastern Carolina Series D (Health Revenue) | | | 6.25 | | | | 12-1-2033 | | | | 8,500,000 | | | | 9,635,260 | |
| | | | |
| | | | | | | | | | | | | | | 18,968,770 | |
| | | | | | | | | | | | | | | | |
|
| Ohio: 2.73% | |
Akron OH Sewer System (Water & Sewer Revenue, Ambac Insured) | | | 5.00 | | | | 12-1-2016 | | | | 1,500,000 | | | | 1,525,965 | |
Allen County OH Catholic Healthcare Series B (Health Revenue) | | | 5.25 | | | | 9-1-2027 | | | | 3,825,000 | | | | 4,446,869 | |
Cleveland OH Airport System Revenue Series A (Airport Revenue) | | | 5.00 | | | | 1-1-2025 | | | | 4,015,000 | | | | 4,692,130 | |
Cleveland OH Airport System Revenue Series A (Airport Revenue, AGM Insured) | | | 5.00 | | | | 1-1-2031 | | | | 3,600,000 | | | | 4,164,192 | |
Kings OH Local School District (GO Revenue, National/FGIC Insured) | | | 7.50 | | | | 12-1-2016 | | | | 235,000 | | | | 241,911 | |
Montgomery County OH Hospital Kettering Medical Center (Health Revenue, National Insured) | | | 6.25 | | | | 4-1-2020 | | | | 2,500,000 | | | | 2,725,950 | |
Ohio Private Activity Bond AMT Portsmouth Bypass Project (Industrial Development Revenue, AGM Insured) | | | 5.00 | | | | 12-31-2026 | | | | 1,500,000 | | | | 1,835,745 | |
Ohio Private Activity Bond AMT Portsmouth Bypass Project (Industrial Development Revenue, AGM Insured) | | | 5.00 | | | | 12-31-2028 | | | | 1,600,000 | | | | 1,937,808 | |
Ohio Private Activity Bond AMT Portsmouth Bypass Project (Industrial Development Revenue, AGM Insured) | | | 5.00 | | | | 12-31-2030 | | | | 2,250,000 | | | | 2,702,835 | |
Ohio Private Activity Bond AMT Portsmouth Bypass Project (Industrial Development Revenue, AGM Insured) | | | 5.00 | | | | 12-31-2035 | | | | 12,000,000 | | | | 14,202,720 | |
Ohio Private Activity Bond AMT Portsmouth Bypass Project (Industrial Development Revenue, AGM Insured) | | | 5.00 | | | | 12-31-2039 | | | | 2,500,000 | | | | 2,943,600 | |
Ohio Turnpike Commission CAB Series A-4 (Transportation Revenue) ± | | | 0.00 | | | | 2-15-2034 | | | | 8,500,000 | | | | 8,643,140 | |
Ohio Water Development Authority Pollution Control AMT Series C (Industrial Development Revenue) ± | | | 3.95 | | | | 11-1-2032 | | | | 8,000,000 | | | | 8,188,560 | |
Ohio Water Development Authority Series A (Industrial Development Revenue) ± | | | 3.75 | | | | 7-1-2033 | | | | 18,000,000 | | | | 18,512,460 | |
RiverSouth Authority Ohio Lazarus Building Redevelopment Series A (Miscellaneous Revenue) | | | 5.75 | | | | 12-1-2027 | | | | 1,900,000 | | | | 2,001,080 | |
Toledo OH Enterprise Bond Series 2A (Industrial Development Revenue) | | | 5.50 | | | | 12-1-2019 | | | | 1,475,000 | | | | 1,577,424 | |
| | | | |
| | | | | | | | | | | | | | | 80,342,389 | |
| | | | | | | | | | | | | | | | |
| | | | |
| 18 | | Wells Fargo Municipal Bond Fund | | Portfolio of investments—June 30, 2016 |
| | | | | | | | | | | | | | | | |
| Security name | | Interest rate | | | Maturity date | | | Principal | | | Value | |
|
| Oklahoma: 0.40% | |
Garfield County OK Educational Facilities Authority Enid Public Schools Project Series A (Miscellaneous Revenue) | | | 5.00 | % | | | 9-1-2026 | | | $ | 1,810,000 | | | $ | 2,296,564 | |
Garfield County OK Educational Facilities Authority Enid Public Schools Project Series A (Miscellaneous Revenue) | | | 5.00 | | | | 9-1-2030 | | | | 2,000,000 | | | | 2,489,160 | |
Garfield County OK Educational Facilities Authority Enid Public Schools Project Series A (Miscellaneous Revenue) | | | 5.00 | | | | 9-1-2031 | | | | 1,145,000 | | | | 1,419,182 | |
McGee Creek Authority Oklahoma Water Revenue (Water & Sewer Revenue, National Insured) | | | 6.00 | | | | 1-1-2023 | | | | 3,795,000 | | | | 4,300,152 | |
Tulsa OK Airports Improvement Trust AMT Series A (Airport Revenue, Build America Mutual Assurance Company Insured) | | | 5.00 | | | | 6-1-2035 | | | | 1,055,000 | | | | 1,206,720 | |
| | | | |
| | | | | | | | | | | | | | | 11,711,778 | |
| | | | | | | | | | | | | | | | |
|
| Oregon: 0.18% | |
Deschutes County OR Hospital Facilities Authority Cascade Healthcare Community Incorporated Project (Health Revenue) | | | 8.25 | | | | 1-1-2038 | | | | 4,500,000 | | | | 5,338,980 | |
| | | | | | | | | | | | | | | | |
|
| Pennsylvania: 7.66% | |
Allegheny County PA Hospital Development Authority University of Pittsburgh Medical Center Series A (Health Revenue) | | | 5.63 | | | | 8-15-2039 | | | | 5,130,000 | | | | 5,837,684 | |
Berks County PA Municipal Authority Reading Hospital & Medical Center Project Series B (Health Revenue) | | | 1.93 | | | | 11-1-2039 | | | | 20,000,000 | | | | 20,158,200 | |
Bristol Township PA School District Series 27W Residual Interest Bonds Trust (GO Revenue, Barclays Bank plc LIQ) 144Aø | | | 0.78 | | | | 6-1-2031 | | | | 12,790,000 | | | | 12,790,000 | |
Chester County PA IDA Avon Grove Charter School Project Series A (Education Revenue) | | | 6.25 | | | | 12-15-2027 | | | | 2,000,000 | | | | 2,104,060 | |
Delaware County PA IDA Resource Recovery Facility Series A (Resource Recovery Revenue) | | | 6.20 | | | | 7-1-2019 | | | | 1,115,000 | | | | 1,119,460 | |
Delaware Valley PA Regional Finance Authority Local Government Public Improvements Project (Miscellaneous Revenue) | | | 5.75 | | | | 7-1-2032 | | | | 5,000,000 | | | | 6,806,400 | |
Delaware Valley PA Regional Finance Authority Local Government Series C (Miscellaneous Revenue, Ambac Insured) | | | 7.75 | | | | 7-1-2027 | | | | 3,975,000 | | | | 5,954,590 | |
Delaware Valley PA Regional Finance Authority Series A (Miscellaneous Revenue, Ambac Insured) | | | 5.50 | | | | 8-1-2028 | | | | 16,420,000 | | | | 21,281,634 | |
Luzerne County PA Series E (GO Revenue, AGM Insured) | | | 8.00 | | | | 11-1-2027 | | | | 135,000 | | | | 154,707 | |
Montgomery County PA Higher Education & Health Authority Arcadia University (Education Revenue) | | | 5.00 | | | | 4-1-2024 | | | | 1,540,000 | | | | 1,832,769 | |
Montgomery County PA Higher Education & Health Authority Arcadia University (Education Revenue) | | | 5.00 | | | | 4-1-2025 | | | | 1,625,000 | | | | 1,959,214 | |
Montgomery County PA IDA Exelon Generation Company LLC Project Series A (Industrial Development Revenue) ± | | | 2.55 | | | | 12-1-2029 | | | | 15,530,000 | | | | 15,967,014 | |
Montgomery County PA IDA Peco Energy Company Project Series A (Industrial Development Revenue) ± | | | 2.50 | | | | 10-1-2030 | | | | 10,625,000 | | | | 10,839,200 | |
Penn Hills Municipality PA Series B (GO Revenue, Ambac Insured) ¤ | | | 0.00 | | | | 12-1-2017 | | | | 1,000,000 | | | | 981,560 | |
Pennsylvania EDFA Bridges Finco LP (Industrial Development Revenue) | | | 5.00 | | | | 12-31-2034 | | | | 7,700,000 | | | | 9,176,013 | |
Pennsylvania Finance Authority Penn Hills Project Series B (Miscellaneous Revenue, National Insured) ¤ | | | 0.00 | | | | 12-1-2025 | | | | 3,440,000 | | | | 2,700,125 | |
Pennsylvania HEFAR (Education Revenue) ø | | | 0.75 | | | | 9-1-2045 | | | | 12,075,000 | | | | 12,075,000 | |
Pennsylvania HFA Single Family Mortgage Revenue Bonds AMT Series A (Housing Revenue) | | | 4.70 | | | | 10-1-2037 | | | | 3,655,000 | | | | 3,668,962 | |
Pennsylvania Public School Building Authority (Miscellaneous Revenue) | | | 5.00 | | | | 4-1-2024 | | | | 3,960,000 | | | | 4,445,496 | |
Pennsylvania Public School Building Authority Series DCL-016 (Miscellaneous Revenue, Dexia Credit Local LOC, AGM Insured) 144Aø | | | 0.88 | | | | 6-1-2023 | | | | 15,710,000 | | | | 15,710,000 | |
| | | | | | |
| Portfolio of investments—June 30, 2016 | | Wells Fargo Municipal Bond Fund | | | 19 | |
| | | | | | | | | | | | | | | | |
| Security name | | Interest rate | | | Maturity date | | | Principal | | | Value | |
|
| Pennsylvania (continued) | |
Pennsylvania Turnpike Commission Motor License Series B1 (Transportation Revenue) | | | 5.00 | % | | | 12-1-2040 | | | $ | 12,410,000 | | | $ | 14,050,478 | |
Philadelphia PA Airport Revenue Bonds AMT Series A (Airport Revenue, AGM Insured) | | | 5.00 | | | | 6-15-2032 | | | | 5,000,000 | | | | 5,179,300 | |
Philadelphia PA Airport Revenue Bonds AMT Series A (Airport Revenue, AGM Insured) | | | 5.00 | | | | 6-15-2037 | | | | 10,000,000 | | | | 10,327,400 | |
Philadelphia PA IDA 1st Philadelphia Preparatory Charter School Project Series A (Education Revenue) | | | 7.00 | | | | 6-15-2033 | | | | 2,000,000 | | | | 2,393,420 | |
Philadelphia PA IDA New Foundations Charter School Project (Education Revenue) | | | 6.00 | | | | 12-15-2027 | | | | 285,000 | | | | 321,822 | |
Philadelphia PA School District Series A (GO Revenue) | | | 5.00 | | | | 9-1-2024 | | | | 2,075,000 | | | | 2,393,098 | |
Philadelphia PA Series B (GO Revenue, Barclays Bank plc LOC) ø | | | 0.42 | | | | 8-1-2031 | | | | 15,000,000 | | | | 15,000,000 | |
Philadelphia PA Water & Wastewater Bonds Series A (Water & Sewer Revenue) | | | 5.00 | | | | 7-1-2033 | | | | 8,000,000 | | | | 9,791,120 | |
State Public School Building Authority Pennsylvania Philadelphia School District Project (Miscellaneous Revenue) | | | 5.00 | | | | 4-1-2022 | | | | 2,635,000 | | | | 2,984,348 | |
State Public School Building Authority Pennsylvania Philadelphia School District Project Series A (Miscellaneous Revenue) | | | 5.00 | | | | 6-1-2024 | | | | 2,250,000 | | | | 2,588,153 | |
Wilkes-Barre PA Finance Authority (Education Revenue) | | | 5.00 | | | | 3-1-2022 | | | | 955,000 | | | | 982,934 | |
Wilkes-Barre PA Finance Authority (Education Revenue) | | | 5.00 | | | | 3-1-2022 | | | | 645,000 | | | | 661,480 | |
York County PA IDA Philadelphia Electric Company Project Series A (Industrial Development Revenue) ± | | | 2.55 | | | | 6-1-2036 | | | | 3,390,000 | | | | 3,467,665 | |
| | | | |
| | | | | | | | | | | | | | | 225,703,306 | |
| | | | | | | | | | | | | | | | |
|
| Puerto Rico: 0.39% | |
Puerto Rico Electric Power Authority Refunding Bond Series KK (Utilities Revenue, National Insured) | | | 5.50 | | | | 7-1-2016 | | | | 7,100,000 | | | | 7,100,710 | |
Puerto Rico Electric Power Authority Refunding Bond Series MM (Utilities Revenue, National Insured) | | | 5.00 | | | | 7-1-2017 | | | | 150,000 | | | | 154,595 | |
Puerto Rico Highway & Transportation Authority Series AA (Transportation Revenue, National Insured) | | | 5.50 | | | | 7-1-2020 | | | | 3,015,000 | | | | 3,151,248 | |
Puerto Rico Public Finance Corporation Commonwealth Appropriation Bond Series B (Miscellaneous Revenue, Government Development Bank for Puerto Rico SPA) (s)(t) | | | 5.50 | | | | 8-1-2031 | | | | 3,300,000 | | | | 379,500 | |
Puerto Rico Public Finance Corporation Commonwealth Appropriation Bond Series B (Tax Revenue, Government Development Bank for Puerto Rico SPA) (s)(t) | | | 6.00 | | | | 8-1-2024 | | | | 7,000,000 | | | | 805,000 | |
| | | | |
| | | | | | | | | | | | | | | 11,591,053 | |
| | | | | | | | | | | | | | | | |
|
| Rhode Island: 0.19% | |
Rhode Island Clean Water Finance Agency Cranston Wastewater Treatment System (Miscellaneous Revenue, National Insured) | | | 5.80 | | | | 9-1-2022 | | | | 3,335,000 | | | | 3,342,037 | |
Rhode Island Commerce Corporation Series D (Airport Revenue) %% | | | 5.00 | | | | 7-1-2033 | | | | 1,415,000 | | | | 1,713,735 | |
Rhode Island Commerce Corporation Series D (Airport Revenue) %% | | | 5.00 | | | | 7-1-2036 | | | | 500,000 | | | | 599,710 | |
| | | | |
| | | | | | | | | | | | | | | 5,655,482 | |
| | | | | | | | | | | | | | | | |
|
| South Carolina: 0.63% | |
Calhoun County SC Solid Waste Disposal Facilities Eastman Kodak Company Project (Industrial Development Revenue) | | | 6.75 | | | | 5-1-2017 | | | | 400,000 | | | | 419,764 | |
Connector 2000 Association Incorporated CAB Series A (Transportation Revenue) ¤ | | | 0.00 | | | | 1-1-2017 | | | | 164,621 | | | | 148,980 | |
Connector 2000 Association Incorporated CAB Series A (Transportation Revenue) ¤ | | | 0.00 | | | | 1-1-2018 | | | | 181,929 | | | | 136,445 | |
Kershaw County SC Public Schools Kershaw County School District Project (Miscellaneous Revenue, AGC Insured) | | | 5.00 | | | | 12-1-2021 | | | | 2,870,000 | | | | 2,924,013 | |
| | | | |
| 20 | | Wells Fargo Municipal Bond Fund | | Portfolio of investments—June 30, 2016 |
| | | | | | | | | | | | | | | | |
| Security name | | Interest rate | | | Maturity date | | | Principal | | | Value | |
|
| South Carolina (continued) | |
Kershaw County SC Public Schools Kershaw County School District Project (Miscellaneous Revenue, AGC Insured) | | | 5.00 | % | | | 12-1-2022 | | | $ | 905,000 | | | $ | 922,032 | |
Kershaw County SC Public Schools Kershaw County School District Project (Miscellaneous Revenue, AGC Insured) | | | 5.00 | | | | 12-1-2023 | | | | 6,950,000 | | | | 7,080,799 | |
Lee County SC School Facilities Incorporated Series 2006 (Miscellaneous Revenue, AGC Insured) | | | 6.00 | | | | 12-1-2031 | | | | 2,890,000 | | | | 3,101,982 | |
Piedmont SC Municipal Power Agency (Utilities Revenue, FGIC Insured) | | | 6.75 | | | | 1-1-2019 | | | | 210,000 | | | | 241,183 | |
South Carolina Education Assistance Authority Student Loan Series I (Education Revenue) | | | 5.10 | | | | 10-1-2029 | | | | 1,770,000 | | | | 1,901,210 | |
South Carolina Jobs EDA York Preparatory Academy Project Series A (Education Revenue) | | | 7.25 | | | | 11-1-2045 | | | | 1,500,000 | | | | 1,707,900 | |
| | | | |
| | | | | | | | | | | | | | | 18,584,308 | |
| | | | | | | | | | | | | | | | |
|
| South Dakota: 0.26% | |
Rapid City SD Series A (Airport Revenue) | | | 6.75 | | | | 12-1-2031 | | | | 1,020,000 | | | | 1,178,977 | |
Rapid City SD Series A (Airport Revenue) | | | 7.00 | | | | 12-1-2035 | | | | 750,000 | | | | 853,590 | |
South Dakota HEFA Sanford Health Project (Health Revenue) | | | 5.50 | | | | 11-1-2040 | | | | 5,000,000 | | | | 5,653,550 | |
| | | | |
| | | | | | | | | | | | | | | 7,686,117 | |
| | | | | | | | | | | | | | | | |
|
| Tennessee: 0.49% | |
Memphis-Shelby County TN Industrial Development Board Boys & Girls Club Series A (Miscellaneous Revenue, SunTrust Bank LOC) ø | | | 0.48 | | | | 1-1-2028 | | | | 4,530,000 | | | | 4,530,000 | |
Shelby County TN Health Educational & Housing Facilities Board Methodist Le Bonheur Series B (Health Revenue, AGM Insured, U.S. Bank NA SPA) ø | | | 0.42 | | | | 6-1-2042 | | | | 10,000,000 | | | | 10,000,000 | |
| | | | |
| | | | | | | | | | | | | | | 14,530,000 | |
| | | | | | | | | | | | | | | | |
|
| Texas: 7.66% | |
Austin TX Airport System AMT (Airport Revenue) | | | 5.00 | | | | 11-15-2039 | | | | 8,000,000 | | | | 9,357,680 | |
Austin TX Airport System AMT (Airport Revenue) | | | 5.00 | | | | 11-15-2044 | | | | 3,500,000 | | | | 4,076,870 | |
Beasley TX Higher Education Finance Corporation Focus Learning Academy Series A (Education Revenue) | | | 7.75 | | | | 8-15-2041 | | | | 2,000,000 | | | | 2,046,200 | |
Central Texas Regional Mobility Authority Senior Lien (Transportation Revenue) | | | 5.75 | | | | 1-1-2025 | | | | 2,000,000 | | | | 2,336,000 | |
Central Texas Regional Mobility Authority Senior Lien Series A (Transportation Revenue) | | | 5.00 | | | | 1-1-2033 | | | | 3,740,000 | | | | 4,334,436 | |
Clifton TX Higher Educational Finance Corporation Series A (Education Revenue) | | | 5.75 | | | | 8-15-2038 | | | | 2,000,000 | | | | 2,210,500 | |
Dallas TX Independent School District School Building (GO Revenue, Permanent School Fund Insured) | | | 6.38 | | | | 2-15-2034 | | | | 10,000,000 | | | | 10,935,400 | |
Grand Parkway Transportation Corporation TX CAB Series B (Transportation Revenue) ± | | | 0.00 | | | | 10-1-2029 | | | | 1,015,000 | | | | 942,478 | |
Grand Parkway Transportation Corporation TX CAB Series B (Transportation Revenue) ± | | | 0.00 | | | | 10-1-2030 | | | | 2,000,000 | | | | 1,856,240 | |
Gulf Coast TX IDA (Industrial Development Revenue, BNP Paribas LOC) ø | | | 0.70 | | | | 11-1-2019 | | | | 4,850,000 | | | | 4,850,000 | |
Houston TX Housing Finance Corporation Cullen Park Apartments Series A (Housing Revenue, FNMA LIQ) | | | 5.70 | | | | 12-1-2033 | | | | 965,000 | | | | 972,556 | |
La Vernia TX Higher Education Finance Corporation Lifeschool of Dallas Series A (Education Revenue) | | | 6.25 | | | | 8-15-2021 | | | | 3,660,000 | | | | 4,258,007 | |
La Vernia TX Higher Education Finance Corporation Lifeschool of Dallas Series A (Education Revenue) | | | 7.50 | | | | 8-15-2041 | | | | 6,500,000 | | | | 7,811,700 | |
La Vernia TX Higher Education Finance Corporation Series A (Education Revenue) | | | 6.25 | | | | 2-15-2017 | | | | 170,000 | | | | 174,865 | |
Lewisville TX Combination Contract Castle Hills Public Improvement Bonds Project #5 (Miscellaneous Revenue) 144A | | | 6.50 | | | | 9-1-2034 | | | | 4,495,000 | | | | 4,739,034 | |
| | | | | | |
| Portfolio of investments—June 30, 2016 | | Wells Fargo Municipal Bond Fund | | | 21 | |
| | | | | | | | | | | | | | | | |
| Security name | | Interest rate | | | Maturity date | | | Principal | | | Value | |
|
| Texas (continued) | |
Lewisville TX Combination Contract Castle Hills Public Improvement Bonds Project #5 (Miscellaneous Revenue) 144A | | | 6.50 | % | | | 9-1-2034 | | | $ | 2,255,000 | | | $ | 2,377,424 | |
Lewisville TX Combination Contract Castle Hills Public Improvement Bonds Project #5 (Miscellaneous Revenue) | | | 6.75 | | | | 10-1-2032 | | | | 1,940,000 | | | | 2,055,314 | |
Lower Colorado TX River Authority Series A (Utilities Revenue) | | | 5.00 | | | | 5-15-2033 | | | | 2,475,000 | | | | 2,946,166 | |
Newark TX ECFA A.W. Brown-Fellowship Leadership Academy Project Series A (Education Revenue) | | | 6.00 | | | | 8-15-2032 | | | | 1,750,000 | | | | 1,790,075 | |
Newark TX ECFA A.W. Brown-Fellowship Leadership Academy Project Series A (Education Revenue) | | | 6.00 | | | | 8-15-2042 | | | | 2,330,000 | | | | 2,383,287 | |
North Texas Tollway Authority Second Tier Revenue Series A (Transportation Revenue) | | | 5.00 | | | | 1-1-2035 | | | | 4,000,000 | | | | 4,826,360 | |
North Texas Tollway Authority Series A (Transportation Revenue) | | | 5.00 | | | | 1-1-2033 | | | | 3,600,000 | | | | 4,371,588 | |
Port Arthur TX Navigation District Jefferson County Environmental Facilities Motiva Enterprises LLC Project Series D (Resource Recovery Revenue) ø## | | | 0.54 | | | | 11-1-2040 | | | | 25,000,000 | | | | 25,000,000 | |
Port Houston TX Authority Series D-1 (GO Revenue) | | | 5.00 | | | | 10-1-2035 | | | | 10,000,000 | | | | 11,626,000 | |
San Leanna TX Education Facilities Corporation Street Edwards University Project (Education Revenue) | | | 5.13 | | | | 6-1-2022 | | | | 1,735,000 | | | | 1,788,837 | |
San Leanna TX Education Facilities Corporation Street Edwards University Project (Education Revenue) | | | 5.13 | | | | 6-1-2023 | | | | 1,000,000 | | | | 1,030,290 | |
San Leanna TX Education Facilities Corporation Street Edwards University Project (Education Revenue) | | | 5.13 | | | | 6-1-2024 | | | | 750,000 | | | | 772,380 | |
Tarrant County TX Cultural Education Facilities Buckingham Senior Living Community Incorporated (Health Revenue) | | | 3.88 | | | | 11-15-2020 | | | | 2,000,000 | | | | 2,025,780 | |
Tarrant County TX Cultural Education Facilities Finance Corporation Air Force Village Obligation Group (Health Revenue) | | | 5.00 | | | | 5-15-2017 | | | | 1,400,000 | | | | 1,431,052 | |
Tarrant County TX Cultural Education Facilities Finance Corporation Series B (Health Revenue) | | | 5.00 | | | | 11-15-2030 | | | | 4,000,000 | | | | 4,631,720 | |
Tarrant County TX Cultural Education Facilities Finance Corporation Texas Health Resources Series A (Health Revenue) | | | 5.00 | | | | 2-15-2023 | | | | 9,900,000 | | | | 10,171,260 | |
Texas Municipal Gas Acquisition & Supply Corporation II Series B (Utilities Revenue, JPMorgan Chase & Company Guaranteed) ± | | | 0.88 | | | | 9-15-2017 | | | | 8,405,000 | | | | 8,374,490 | |
Texas Municipal Gas Acquisition & Supply Corporation Sub Lien Series C (Utilities Revenue) ± | | | 1.88 | | | | 12-15-2026 | | | | 28,780,000 | | | | 26,458,030 | |
Texas Private Activity Bond Surface Transportation Corporation Project NTE Mobility Partners Segments LLC (Transportation Revenue) | | | 6.75 | | | | 6-30-2043 | | | | 4,000,000 | | | | 5,007,880 | |
Texas Private Activity Bond Surface Transportation Corporation Project NTE Mobility Partners Segments LLC (Transportation Revenue) | | | 7.00 | | | | 12-31-2038 | | | | 12,500,000 | | | | 15,916,125 | |
Texas Transportation Commission Highway Improvement (Miscellaneous Revenue) | | | 5.00 | | | | 4-1-2028 | | | | 7,280,000 | | | | 9,129,047 | |
Texas Transportation Commission State Highway Fund Floating 1st Tier Series B (Transportation Revenue, Banco Bilboa Vizcaya SPA) ø | | | 0.65 | | | | 4-1-2026 | | | | 20,650,000 | | | | 20,650,000 | |
| | | | |
| | | | | | | | | | | | | | | 225,665,071 | |
| | | | | | | | | | | | | | | | |
|
| Utah: 0.52% | |
Spanish Fork UT Charter School American Leadership Academy (Education Revenue) 144A | | | 5.55 | | | | 11-15-2021 | | | | 1,030,000 | | | | 1,048,272 | |
Utah County UT Charter School Ronald Wilson Reagan Series A (Education Revenue) | | | 5.75 | | | | 2-15-2022 | | | | 570,000 | | | | 588,417 | |
Utah State Charter School Finance Authority Early Light Academy Project (Education Revenue) | | | 8.50 | | | | 7-15-2046 | | | | 6,480,000 | | | | 7,281,770 | |
| | | | |
| 22 | | Wells Fargo Municipal Bond Fund | | Portfolio of investments—June 30, 2016 |
| | | | | | | | | | | | | | | | |
| Security name | | Interest rate | | | Maturity date | | | Principal | | | Value | |
|
| Utah (continued) | |
Utah State Charter School Finance Authority Oquirrh Mountain Charter School Project (Education Revenue) | | | 8.00 | % | | | 7-15-2030 | | | $ | 1,940,000 | | | $ | 2,124,416 | |
Utah State Charter School Finance Authority Oquirrh Mountain Charter School Project (Education Revenue) | | | 8.00 | | | | 7-15-2041 | | | | 3,910,000 | | | | 4,281,685 | |
| | | | |
| | | | | | | | | | | | | | | 15,324,560 | |
| | | | | | | | | | | | | | | | |
|
| Vermont: 1.38% | |
Vermont Student Assistance Corporation Series B Class A2 (Education Revenue) ± | | | 3.68 | | | | 12-3-2035 | | | | 16,800,000 | | | | 17,451,000 | |
Vermont Student Assistance Corporation Series B Class B (Education Revenue) ± | | | 1.46 | | | | 6-2-2042 | | | | 23,782,086 | | | | 23,353,533 | |
| | | | |
| | | | | | | | | | | | | | | 40,804,533 | |
| | | | | | | | | | | | | | | | |
|
| Virgin Islands: 0.32% | |
Virgin Islands PFA Series C (Miscellaneous Revenue) | | | 5.00 | | | | 10-1-2018 | | | | 8,860,000 | | | | 9,455,481 | |
| | | | | | | | | | | | | | | | |
|
| Virginia: 0.22% | |
Fairfax County VA Redevelopment & Housing Authority Housing for the Elderly Series A (Housing Revenue, FHA Insured) | | | 6.00 | | | | 9-1-2016 | | | | 105,000 | | | | 105,410 | |
Marquis VA CDA CAB Series C (Tax Revenue) (i)¤ | | | 0.00 | | | | 9-1-2041 | | | | 1,824,000 | | | | 254,849 | |
Marquis VA CDA Convertible CAB (Tax Revenue) 144A± | | | 0.00 | | | | 9-1-2045 | | | | 397,000 | | | | 262,175 | |
Marquis VA CDA Series B (Tax Revenue) (i) | | | 5.63 | | | | 9-1-2041 | | | | 1,310,000 | | | | 1,067,847 | |
Riverside VA Regional Jail Authority (Miscellaneous Revenue) | | | 5.00 | | | | 7-1-2025 | | | | 3,435,000 | | | | 4,198,223 | |
Watkins Centre VA CDA (Miscellaneous Revenue) | | | 5.40 | | | | 3-1-2020 | | | | 609,000 | | | | 610,370 | |
| | | | |
| | | | | | | | | | | | | | | 6,498,874 | |
| | | | | | | | | | | | | | | | |
|
| Washington: 0.26% | |
Spokane WA Housing Finance Commission Riverview Retirement Community Project (Health Revenue) | | | 5.00 | | | | 1-1-2023 | | | | 1,545,000 | | | | 1,738,926 | |
Washington Health Care Facilities Authority Central Washington (Health Revenue) | | | 7.00 | | | | 7-1-2039 | | | | 5,000,000 | | | | 5,932,750 | |
| | | | |
| | | | | | | | | | | | | | | 7,671,676 | |
| | | | | | | | | | | | | | | | |
|
| West Virginia: 0.43% | |
West Virginia EDA Solid Waste Disposal Appalachian Power Company (Utilities Revenue, Mizuho Corporate Bank LOC) ø | | | 0.72 | | | | 2-1-2036 | | | | 10,000,000 | | | | 10,000,000 | |
West Virginia Hospital Finance Authority Improvement Series D (Health Revenue, AGM Insured) | | | 5.50 | | | | 6-1-2033 | | | | 2,305,000 | | | | 2,570,836 | |
| | | | |
| | | | | | | | | | | | | | | 12,570,836 | |
| | | | | | | | | | | | | | | | |
|
| Wisconsin: 0.56% | |
Milwaukee WI RDA Science Education Consortium Incorporated Project Series A (Education Revenue) | | | 6.00 | | | | 8-1-2033 | | | | 2,120,000 | | | | 2,414,341 | |
Milwaukee WI RDA Science Education Consortium Incorporated Project Series A (Education Revenue) | | | 6.25 | | | | 8-1-2043 | | | | 4,650,000 | | | | 5,364,240 | |
Wisconsin HEFA Aurora Health Care Incorporated Series A (Health Revenue) | | | 5.25 | | | | 4-15-2024 | | | | 1,025,000 | | | | 1,166,020 | |
Wisconsin HEFA Series M (Health Revenue, National Insured) ±(m)(n) | | | 0.74 | | | | 6-1-2019 | | | | 2,700,000 | | | | 2,615,625 | |
Wisconsin PFA Carolina International School Series A (Education Revenue) 144A | | | 6.00 | | | | 8-1-2023 | | | | 470,000 | | | | 517,738 | |
Wisconsin PFA Carolina International School Series A (Education Revenue) 144A | | | 6.75 | | | | 8-1-2033 | | | | 1,430,000 | | | | 1,629,342 | |
Wisconsin PFA Carolina International School Series A (Education Revenue) 144A | | | 7.00 | | | | 8-1-2043 | | | | 1,575,000 | | | | 1,819,834 | |
Wisconsin PFA Carolina International School Series A (Education Revenue) 144A | | | 7.20 | | | | 8-1-2048 | | | | 940,000 | | | | 1,092,713 | |
| | | | |
| | | | | | | | | | | | | | | 16,619,853 | |
| | | | | | | | | | | | | | | | |
| | | | | | |
| Portfolio of investments—June 30, 2016 | | Wells Fargo Municipal Bond Fund | | | 23 | |
| | | | | | | | | | | | | | | | |
| Security name | | Interest rate | | | Maturity date | | | Principal | | | Value | |
|
| Wyoming: 0.79% | |
Sweetwater County WY PCR Refunding PacifiCorp Project Series A (Industrial Development Revenue) ø | | | 0.52 | % | | | 1-1-2017 | | | $ | 21,000,000 | | | $ | 21,000,000 | |
West Park Hospital District Wyoming Series B (Health Revenue) | | | 6.50 | | | | 6-1-2027 | | | | 500,000 | | | | 594,045 | |
Wyoming CDA (Education Revenue) | | | 6.50 | | | | 7-1-2043 | | | | 1,600,000 | | | | 1,835,936 | |
| | | | |
| | | | | | | | | | | | | | | 23,429,981 | |
| | | | | | | | | | | | | | | | |
| | | | |
Total Municipal Obligations (Cost $2,679,389,675) | | | | | | | | | | | | | | | 2,893,326,178 | |
| | | | | | | | | | | | | | | | |
| | | | |
| | | Yield | | | | | | Shares | | | | |
| Short-Term Investments: 0.19% | |
|
| Investment Companies: 0.08% | |
Wells Fargo Municipal Cash Management Fund Institutional Class (l)(u)## | | | 0.30 | | | | | | | | 2,204,064 | | | | 2,204,064 | |
| | | | | | | | | | | | | | | | |
| | | | |
| | | | | | | | | Principal | | | | |
| U.S. Treasury Securities: 0.11% | |
U.S. Treasury Bill (z)# | | | 0.26 | | | | 9-15-2016 | | | $ | 3,325,000 | | | | 3,323,480 | |
| | | | | | | | | | | | | | | | |
| |
Total Short-Term Investments (Cost $5,527,197) | | | | 5,527,544 | |
| | | | | | | | | | | | | | | | |
| | | | | | | | |
| Total investments in securities (Cost $2,700,284,722) * | | | 98.83 | % | | | 2,913,513,805 | |
Other assets and liabilities, net | | | 1.17 | | | | 34,457,016 | |
| | | | | | | | |
| Total net assets | | | 100.00 | % | | $ | 2,947,970,821 | |
| | | | | | | | |
| 144A | The security may be resold in transactions exempt from registration, normally to qualified institutional buyers, pursuant to Rule 144A under the Securities Act of 1933. |
| ¤ | The security is issued in zero coupon form with no periodic interest payments. |
| ± | Variable rate investment. The rate shown is the rate in effect at period end. |
| %% | The security is issued on a when-issued basis. |
| ø | Variable rate demand notes are subject to a demand feature which reduces the effective maturity. The maturity date shown represents the final maturity date of the security. The interest rate is determined and reset by the issuer daily, weekly, or monthly depending upon the terms of the security. The rate shown is the rate in effect at period end. |
| (h) | Underlying security in an inverse floater structure |
| (s) | The security is currently in default with regards to scheduled interest and/or principal payments. |
| (t) | The Fund has stopped accruing interest on the security. |
| (i) | Illiquid security for which the designation as illiquid is unaudited. |
| (n) | The auction to set the interest rate on the security failed at period end due to insufficient investor interest. A failed auction does not itself cause a default. |
| (m) | The security is an auction-rate security which has an interest rate that resets at predetermined short-term intervals through a Dutch auction. The rate shown is the rate in effect at period end. |
| (l) | The issuer of the security is an affiliated person of the Fund as defined in the Investment Company Act of 1940. |
| (u) | The rate represents the 7-day annualized yield at period end. |
| ## | All or a portion of this security is segregated for when-issued securities. |
| (z) | Zero coupon security. The rate represents the current yield to maturity. |
| # | All or a portion of this security is segregated as collateral for investments in derivative instruments. |
| | | | | | | | |
* | | Cost for federal income tax purposes is $2,701,438,187 and unrealized gains (losses) consists of: |
| | Gross unrealized gains | | $ | 221,205,311 | | | |
| | Gross unrealized losses | | | (9,129,693 | ) | | |
| | | | | | | | |
| | Net unrealized gains | | $ | 212,075,618 | | | |
| | | | | | |
| Portfolio of investments—June 30, 2016 | | Wells Fargo Ultra Short-Term Municipal Income Fund | | | 1 | |
| | | | | | | | | | | | | | | | |
| Security name | | Interest rate | | | Maturity date | | | Principal | | | Value | |
| | | | |
Agency Securities: 0.22% | | | | | | | | | | | | | | | | |
FHLMC Multifamily Variable Rate Demand Certificates Series M012 Class A1A | | | 5.50 | % | | | 8-15-2051 | | | $ | 7,000,000 | | | $ | 7,017,500 | |
FHLMC Multifamily Variable Rate Demand Certificates Series M012 Class A1A2 | | | 5.50 | | | | 8-15-2051 | | | | 5,300,000 | | | | 5,313,250 | |
| | | | |
Total Agency Securities (Cost $12,744,996) | | | | | | | | | | | | | | | 12,330,750 | |
| | | | | | | | | | | | | | | | |
| | | | |
Municipal Obligations: 95.63% | | | | | | | | | | | | | | | | |
| | | | |
| Alabama: 2.88% | | | | | | | | | | | | | | | | |
Alabama Health Care Authority for Baptist Health Series B (Health Revenue, AGC Insured) ±(m) | | | 0.80 | | | | 11-15-2037 | | | | 9,575,000 | | | | 9,575,000 | |
Alabama Health Care Authority for Baptist Health Series B (Health Revenue) ø | | | 0.80 | | | | 11-1-2042 | | | | 17,000,000 | | | | 17,000,000 | |
Alabama HFA MFHR The Plaza Centennial Hill Phase 2 Series C (Housing Revenue) ± | | | 0.55 | | | | 6-15-2017 | | | | 13,500,000 | | | | 13,500,135 | |
Alabama Port Authority Docks Facilities AMT Series A (Airport Revenue, National Insured) | | | 5.00 | | | | 10-1-2017 | | | | 2,000,000 | | | | 2,019,720 | |
Chatom AL Industrial Development Board Alabama Electric Series A (Utilities Revenue, National Rural Utilities Cooperative Finance Corporation SPA) ± | | | 1.00 | | | | 8-1-2037 | | | | 12,911,000 | | | | 12,910,225 | |
Chatom AL Industrial Development Board Gulf Opportunity Zone PowerSouth Energy Cooperative Projects Series A (Utilities Revenue, National Rural Utilities Finance Corporation SPA) ± | | | 0.88 | | | | 11-15-2038 | | | | 39,545,000 | | | | 39,557,259 | |
Jefferson County AL Series A (GO Revenue) | | | 4.90 | | | | 4-1-2021 | | | | 16,645,000 | | | | 17,810,982 | |
Jefferson County AL Sewer Sub Lien Series D (Water & Sewer Revenue) | | | 5.00 | | | | 10-1-2016 | | | | 1,000,000 | | | | 1,010,820 | |
Jefferson County AL Sewer Sub Lien Series D (Water & Sewer Revenue) | | | 5.00 | | | | 10-1-2017 | | | | 1,750,000 | | | | 1,834,770 | |
Tender Option Bond Trust Receipts for Alabama Series XM0184 (Utilities Revenue, Morgan Stanley Bank LIQ) ø144A | | | 0.84 | | | | 9-1-2046 | | | | 31,400,000 | | | | 31,400,000 | |
Tuscaloosa County AL IDA (Industrial Development Revenue) ø | | | 0.70 | | | | 9-1-2020 | | | | 12,600,000 | | | | 12,600,000 | |
| | | | |
| | | | | | | | | | | | | | | 159,218,911 | |
| | | | | | | | | | | | | | | | |
| | | | |
| Alaska: 0.16% | | | | | | | | | | | | | | | | |
Alaska Industrial Development and Export Authority Snettisham Hydroelectric Project Series 2015 (Utilities Revenue) | | | 5.00 | | | | 1-1-2017 | | | | 765,000 | | | | 779,604 | |
North Slope Borough AK Water & Wastewater Facilities Service (Water & Sewer Revenue) | | | 4.00 | | | | 6-30-2018 | | | | 1,125,000 | | | | 1,193,513 | |
Valdez AK Marine Terminal (Transportation Revenue) ø | | | 0.58 | | | | 5-1-2031 | | | | 7,000,000 | | | | 7,000,000 | |
| | | | |
| | | | | | | | | | | | | | | 8,973,117 | |
| | | | | | | | | | | | | | | | |
| | | | |
| Arizona: 1.51% | | | | | | | | | | | | | | | | |
Maricopa County AZ Gilbert Unified School District No. 41 (GO Revenue, Build America Mutual Assurance Company Insured) | | | 3.00 | | | | 7-1-2019 | | | | 3,845,000 | | | | 4,078,968 | |
Phoenix AZ IDA Various Republic Services Incorporated Projects (Industrial Development Revenue) ± | | | 0.90 | | | | 12-1-2035 | | | | 25,000,000 | | | | 25,000,750 | |
Pima County AZ IDA Charter Schools Project Series K (Miscellaneous Revenue) | | | 6.38 | | | | 7-1-2031 | | | | 895,000 | | | | 895,143 | |
Pima County AZ IDA Charter Schools Project Series O (Education Revenue) | | | 5.00 | | | | 7-1-2026 | | | | 915,000 | | | | 915,110 | |
Scottsdale AZ IDA Healthcare Series A (Health Revenue) | | | 5.00 | | | | 9-1-2016 | | | | 3,655,000 | | | | 3,682,010 | |
Scottsdale AZ IDA Healthcare Series F (Health Revenue, AGM Insured) ±(m) | | | 0.64 | | | | 9-1-2045 | | | | 47,825,000 | | | | 47,825,000 | |
University of Arizona Medical Center Corporation (Health Revenue) | | | 5.00 | | | | 7-1-2016 | | | | 700,000 | | | | 700,091 | |
University of Arizona Medical Center Corporation (Health Revenue) | | | 5.00 | | | | 7-1-2017 | | | | 545,000 | | | | 569,105 | |
| | | | |
| | | | | | | | | | | | | | | 83,666,177 | |
| | | | | | | | | | | | | | | | |
| | | | |
| Arkansas: 0.04% | | | | | | | | | | | | | | | | |
Arkansas Development Finance Authority Police Headquarters & Wireless Data Equipment Project (Miscellaneous Revenue, AGM Insured) | | | 4.00 | | | | 6-1-2017 | | | | 850,000 | | | | 874,599 | |
| | | | |
| 2 | | Wells Fargo Ultra Short-Term Municipal Income Fund | | Portfolio of investments—June 30, 2016 |
| | | | | | | | | | | | | | | | |
| Security name | | Interest rate | | | Maturity date | | | Principal | | | Value | |
| | | | |
| Arkansas (continued) | | | | | | | | | | | | | | | | |
Arkansas Development Finance Authority Police Headquarters & Wireless Data Equipment Project (Miscellaneous Revenue, AGM Insured) | | | 4.00 | % | | | 6-1-2018 | | | $ | 500,000 | | | $ | 528,900 | |
Springdale AR Sales & Use Tax Refunding & Improvement (Tax Revenue) | | | 2.00 | | | | 11-1-2016 | | | | 840,000 | | | | 843,990 | |
| | | | |
| | | | | | | | | | | | | | | 2,247,489 | |
| | | | | | | | | | | | | | | | |
| | | | |
| California: 6.46% | | | | | | | | | | | | | | | | |
Acalanes CA Union High School District BAN (GO Revenue) | | | 5.00 | | | | 8-1-2017 | | | | 4,500,000 | | | | 4,710,240 | |
Bay Area Toll Authority California San Francisco Bay Area Toll Bridge Series A (Transportation Revenue) ± | | | 1.00 | | | | 4-1-2047 | | | | 28,885,000 | | | | 28,915,618 | |
Bay Area Toll Authority California San Francisco Bay Area Toll Bridge Series C (Transportation Revenue) ± | | | 1.22 | | | | 4-1-2045 | | | | 1,500,000 | | | | 1,500,720 | |
California (GO Revenue) ± | | | 0.94 | | | | 12-1-2028 | | | | 9,000,000 | | | | 9,000,090 | |
California (GO Revenue) ± | | | 4.00 | | | | 12-1-2027 | | | | 4,800,000 | | | | 4,950,528 | |
California Administrative Services Sacramento Unified School District (Miscellaneous Revenue, Ambac Insured) ± | | | 1.46 | | | | 1-1-2017 | | | | 615,000 | | | | 614,631 | |
California Association of Bay Area Governments Financing Authority Series A (Health Revenue, Bank of America NA LOC) ø | | | 0.39 | | | | 8-1-2024 | | | | 9,170,000 | | | | 9,170,000 | |
California HFFA San Diego Hospital Series A (Health Revenue, National Insured) ±(m)(n) | | | 0.59 | | | | 7-15-2018 | | | | 2,800,000 | | | | 2,747,500 | |
California Infrastructure & Economic Development Bank The J. Paul Getty Trust Series A-2 (Miscellaneous Revenue) ± | | | 0.67 | | | | 4-1-2038 | | | | 22,920,000 | | | | 22,894,559 | |
California Infrastructure & Economic Development Bank The J. Paul Getty Trust Series A-3 (Miscellaneous Revenue) ± | | | 0.67 | | | | 4-1-2038 | | | | 15,600,000 | | | | 15,582,684 | |
California Infrastructure & Economic Development Bank The J. Paul Getty Trust Series A-4 (Miscellaneous Revenue) ± | | | 0.67 | | | | 4-1-2038 | | | | 32,000,000 | | | | 31,964,480 | |
California Municipal Financing Authority Northbay Healthcare Series A (Health Revenue) ± | | | 2.49 | | | | 11-1-2027 | | | | 9,000,000 | | | | 9,003,330 | |
California Pollution Control Financing Authority Series A (Resource Recovery Revenue) ±144A | | | 0.90 | | | | 8-1-2023 | | | | 1,200,000 | | | | 1,200,024 | |
California Public Works Board Department of Corrections Project Series A (Miscellaneous Revenue, Ambac Insured) | | | 5.00 | | | | 12-1-2019 | | | | 1,125,000 | | | | 1,211,479 | |
California Series B-3 (GO Revenue, Bank of America NA LOC) ø | | | 0.39 | | | | 5-1-2033 | | | | 20,000,000 | | | | 20,000,000 | |
California Statewide CDA Buck Institute for Research (Miscellaneous Revenue) | | | 3.00 | | | | 11-15-2016 | | | | 250,000 | | | | 252,205 | |
California Statewide CDA Buck Institute for Research (Miscellaneous Revenue) | | | 4.00 | | | | 11-15-2017 | | | | 260,000 | | | | 271,453 | |
California Statewide CDA Buck Institute for Research (Miscellaneous Revenue) | | | 5.00 | | | | 11-15-2018 | | | | 275,000 | | | | 301,040 | |
California Statewide CDA Health Facilities Catholic Series D (Health Revenue, AGM Insured) ±(m) | | | 0.51 | | | | 7-1-2041 | | | | 29,375,000 | | | | 29,375,000 | |
California Statewide CDA Health Facilities Catholic Series E (Health Revenue, AGM Insured) ±(m) | | | 0.55 | | | | 7-1-2040 | | | | 22,475,000 | | | | 22,475,000 | |
California Statewide CDA Health Facilities Catholic Series F (Health Revenue, AGM Insured) ±(m) | | | 0.52 | | | | 7-1-2040 | | | | 4,350,000 | | | | 4,350,000 | |
California Statewide CDA Samoa Avenue Apartments Series V (Housing Revenue) ± | | | 0.95 | | | | 12-1-2017 | | | | 10,000,000 | | | | 10,003,100 | |
California Statewide CDA Stoneman Village Series I (Housing Revenue) ± | | | 0.67 | | | | 6-1-2018 | | | | 11,050,000 | | | | 11,050,332 | |
El Monte CA Union High School District Refunding Bond (GO Revenue) | | | 4.00 | | | | 6-1-2017 | | | | 5,365,000 | | | | 5,531,798 | |
Hemet CA Unified School District Certificate of Participation (Miscellaneous Revenue) ± | | | 1.06 | | | | 10-1-2036 | | | | 3,335,000 | | | | 3,334,867 | |
Los Angeles County CA Metropolitan Transportation Authority Series A (Tax Revenue) | | | 5.00 | | | | 7-1-2016 | | | | 3,280,000 | | | | 3,280,426 | |
Northern California Gas Authority #1 LIBOR Series B (Utilities Revenue) ± | | | 1.02 | | | | 7-1-2017 | | | | 17,900,000 | | | | 17,902,148 | |
Oxnard CA Harbor District Series A (Airport Revenue) | | | 5.00 | | | | 8-1-2016 | | | | 1,150,000 | | | | 1,154,175 | |
Palomar Pomerado CA Health Care District Certificate of Participation Series A (Health Revenue, AGM Insured) ±(m) | | | 1.45 | | | | 11-1-2036 | | | | 19,925,000 | | | | 19,925,000 | |
| | | | | | |
| Portfolio of investments—June 30, 2016 | | Wells Fargo Ultra Short-Term Municipal Income Fund | | | 3 | |
| | | | | | | | | | | | | | | | |
| Security name | | Interest rate | | | Maturity date | | | Principal | | | Value | |
| | | | |
| California (continued) | | | | | | | | | | | | | | | | |
Palomar Pomerado CA Health Care District Certificate of Participation Series B (Health Revenue, AGM Insured) ±(m) | | | 1.45 | % | | | 11-1-2036 | | | $ | 19,800,000 | | | $ | 19,800,000 | |
Palomar Pomerado CA Health Care District ROC RR-11872 (GO Revenue, National Insured, Citibank NA LIQ) ø144A | | | 0.59 | | | | 4-13-2017 | | | | 6,000,000 | | | | 6,000,000 | |
Sacramento County CA Airport System AMT Senior Series B (Airport Revenue, AGM Insured) | | | 5.50 | | | | 7-1-2018 | | | | 4,450,000 | | | | 4,577,938 | |
Sacramento County CA Airport System Refunding AMT Subordinated & PFC Series E (Airport Revenue, AGM Insured) | | | 5.50 | | | | 7-1-2018 | | | | 5,345,000 | | | | 5,498,669 | |
Santa Clara CA PFOTER Series 4713 (GO Revenue, Ambac Insured, Dexia Credit Local LIQ) ø144A | | | 0.70 | | | | 12-15-2021 | | | | 22,550,000 | | | | 22,550,000 | |
Tender Option Bond Trust Receipts Floaters Series 2016-XG0227 (Miscellaneous Revenue, Bank of America NA LIQ) ø144A | | | 0.63 | | | | 5-15-2036 | | | | 5,000,000 | | | | 5,000,000 | |
Windsor CA Redevelopment Successor Refunding Agency Windsor Redevelopment Project (Tax Revenue) | | | 2.00 | | | | 9-1-2016 | | | | 1,095,000 | | | | 1,097,234 | |
| | | | |
| | | | | | | | | | | | | | | 357,196,268 | |
| | | | | | | | | | | | | | | | |
| | | | |
| Colorado: 0.57% | | | | | | | | | | | | | | | | |
Colorado HEFA Covenant Retirement Community Series A (Health Revenue) | | | 3.00 | | | | 12-1-2017 | | | | 1,400,000 | | | | 1,434,048 | |
Colorado HEFA Covenant Retirement Community Series A (Health Revenue) | | | 4.00 | | | | 12-1-2018 | | | | 1,150,000 | | | | 1,217,103 | |
Colorado HEFA Montbello Senior Housing Project Series I (Housing Revenue, FHA Insured) | | | 1.05 | | | | 8-1-2018 | | | | 2,755,000 | | | | 2,761,529 | |
Denver CO City & County Airport Sub Series A (Airport Revenue) | | | 4.00 | | | | 11-15-2016 | | | | 450,000 | | | | 455,846 | |
Denver CO City & County Airport Sub Series A (Airport Revenue) | | | 5.00 | | | | 11-15-2016 | | | | 250,000 | | | | 254,095 | |
Denver CO City & County Airport Sub Series A (Airport Revenue) | | | 5.00 | | | | 11-15-2017 | | | | 400,000 | | | | 422,696 | |
Denver CO City & County Airport Sub Series A (Airport Revenue) | | | 5.00 | | | | 11-15-2018 | | | | 500,000 | | | | 546,355 | |
Denver CO City & County Airport Sub Series B (Airport Revenue) | | | 5.00 | | | | 11-15-2017 | | | | 600,000 | | | | 635,088 | |
Denver CO City & County Airport Sub Series B (Airport Revenue) | | | 5.00 | | | | 11-15-2018 | | | | 600,000 | | | | 659,388 | |
Denver CO City & County Airport Sub Series F2 (Airport Revenue, AGC Insured) ±(m) | | | 0.52 | | | | 11-15-2025 | | | | 9,375,000 | | | | 9,375,000 | |
Denver CO City & County 2300 Welton Project (Housing Revenue) | | | 0.65 | | | | 4-1-2017 | | | | 2,290,000 | | | | 2,286,405 | |
E-470 Colorado Public Highway Authority Senior Index Series A (Transportation Revenue) ± | | | 1.57 | | | | 9-1-2039 | | | | 11,725,000 | | | | 11,699,557 | |
| | | | |
| | | | | | | | | | | | | | | 31,747,110 | |
| | | | | | | | | | | | | | | | |
| | | | |
| Connecticut: 3.39% | | | | | | | | | | | | | | | | |
Bridgeport CT Series C (GO Revenue, National Insured) | | | 5.25 | | | | 8-15-2016 | | | | 2,000,000 | | | | 2,011,440 | |
Connecticut Economic Recovery Notes Series A-3 (GO Revenue) ± | | | 0.65 | | | | 7-1-2017 | | | | 20,000,000 | | | | 20,000,000 | |
Connecticut HEFA Lawrence & Memorial Hospital Series F (Health Revenue) | | | 4.00 | | | | 7-1-2017 | | | | 1,880,000 | | | | 1,937,096 | |
Connecticut HEFA Quinnipiac University Series H (Education Revenue, Ambac Insured) | | | 5.00 | | | | 7-1-2036 | | | | 3,500,000 | | | | 3,500,420 | |
Connecticut HEFA Yale New Haven Hospital Series C (Health Revenue, JPMorgan Chase & Company LOC) ± | | | 0.45 | | | | 7-1-2025 | | | | 9,100,000 | | | | 9,100,000 | |
Connecticut HEFA Yale University Series A (Education Revenue) ± | | | 0.80 | | | | 7-1-2048 | | | | 5,000,000 | | | | 5,005,500 | |
Connecticut HEFA Yale University Series A (Education Revenue) ±%% | | | 1.00 | | | | 7-1-2042 | | | | 15,000,000 | | | | 15,043,500 | |
Connecticut HEFA Yale University Series T-2 (Education Revenue) ± | | | 0.60 | | | | 7-1-2029 | | | | 34,520,000 | | | | 34,525,523 | |
Connecticut HEFA Yale University Series X-2 (Education Revenue) ± | | | 0.90 | | | | 7-1-2037 | | | | 24,600,000 | | | | 24,663,222 | |
Connecticut Series A (Miscellaneous Revenue) ± | | | 0.81 | | | | 3-1-2018 | | | | 2,875,000 | | | | 2,864,190 | |
Connecticut Series A (Miscellaneous Revenue) ± | | | 1.31 | | | | 5-15-2018 | | | | 7,000,000 | | | | 7,015,190 | |
Connecticut Series D (Miscellaneous Revenue) ± | | | 1.08 | | | | 8-15-2017 | | | | 14,855,000 | | | | 14,885,750 | |
Connecticut Series D (Miscellaneous Revenue) ± | | | 1.27 | | | | 8-15-2018 | | | | 6,000,000 | | | | 6,005,880 | |
Groton CT BAN (GO Revenue) | | | 2.00 | | | | 10-5-2016 | | | | 6,500,000 | | | | 6,519,305 | |
Hamden CT Refunding (GO Revenue) | | | 2.00 | | | | 8-15-2016 | | | | 1,000,000 | | | | 1,000,820 | |
| | | | |
| 4 | | Wells Fargo Ultra Short-Term Municipal Income Fund | | Portfolio of investments—June 30, 2016 |
| | | | | | | | | | | | | | | | |
| Security name | | Interest rate | | | Maturity date | | | Principal | | | Value | |
| | | | |
| Connecticut (continued) | | | | | | | | | | | | | | | | |
Hartford CT EDA Series B (Transportation Revenue, Bank of America NA SPA) ø | | | 0.53 | % | | | 6-15-2034 | | | $ | 17,350,000 | | | $ | 17,350,000 | |
New Britain CT (GO Revenue, Ambac Insured) | | | 5.00 | | | | 4-15-2017 | | | | 1,165,000 | | | | 1,205,740 | |
New Haven CT (GO Revenue, Ambac Insured) | | | 5.00 | | | | 11-1-2016 | | | | 6,250,000 | | | | 6,339,750 | |
New Haven CT Series A (GO Revenue) | | | 5.00 | | | | 8-1-2016 | | | | 5,680,000 | | | | 5,701,868 | |
Waterbury CT (GO Revenue) | | | 5.00 | | | | 2-1-2017 | | | | 1,350,000 | | | | 1,383,426 | |
Waterbury CT (GO Revenue) | | | 5.00 | | | | 2-1-2018 | | | | 1,215,000 | | | | 1,293,489 | |
| | | | |
| | | | | | | | | | | | | | | 187,352,109 | |
| | | | | | | | | | | | | | | | |
| | | | |
| Delaware: 0.64% | | | | | | | | | | | | | | | | |
Delaware EDA Delmarva Power and Light Company Series A (Industrial Development Revenue) ø | | | 0.55 | | | | 10-1-2017 | | | | 6,400,000 | | | | 6,400,000 | |
Delaware EDA Delmarva Power and Light Company Series B (Industrial Development Revenue) ø | | | 0.55 | | | | 10-1-2017 | | | | 18,000,000 | | | | 18,000,000 | |
Delaware EDA Delmarva Power and Light Company Series B (Utilities Revenue) ø | | | 0.60 | | | | 7-1-2024 | | | | 11,000,000 | | | | 11,000,000 | |
| | | | |
| | | | | | | | | | | | | | | 35,400,000 | |
| | | | | | | | | | | | | | | | |
| | | | |
| District of Columbia: 0.21% | | | | | | | | | | | | | | | | |
District of Columbia HFA Edgewood Terrace (Housing Revenue) ± | | | 0.65 | | | | 6-1-2017 | | | | 6,070,000 | | | | 6,070,243 | |
District of Columbia HFA MFHR Channing Phillips Project (Housing Revenue) ± | | | 0.55 | | | | 9-1-2017 | | | | 5,500,000 | | | | 5,498,075 | |
| | | | |
| | | | | | | | | | | | | | | 11,568,318 | |
| | | | | | | | | | | | | | | | |
| | | | |
| Florida: 3.98% | | | | | | | | | | | | | | | | |
Florida Housing Finance Corporation Hilltop Landings Apartments Project Series A (Housing Revenue) | | | 0.75 | | | | 3-1-2017 | | | | 1,500,000 | | | | 1,500,030 | |
Florida Housing Finance Corporation Housing Georgia Arms Apartments Series D (Housing Revenue) | | | 0.55 | | | | 10-1-2016 | | | | 1,800,000 | | | | 1,800,000 | |
Florida Hurricane Catastrophe Fund Finance Corporation Series A (Miscellaneous Revenue) | | | 5.00 | | | | 7-1-2016 | | | | 65,000 | | | | 65,008 | |
Florida Mid-Bay Bridge Authority 2nd Senior Lien Series C (Transportation Revenue) | | | 5.00 | | | | 10-1-2016 | | | | 255,000 | | | | 257,514 | |
Florida Mid-Bay Bridge Authority 2nd Senior Lien Series C (Transportation Revenue) | | | 5.00 | | | | 10-1-2017 | | | | 225,000 | | | | 235,193 | |
Florida Mid-Bay Bridge Authority 2nd Senior Lien Series C (Transportation Revenue) | | | 5.00 | | | | 10-1-2018 | | | | 300,000 | | | | 323,790 | |
Hernando County FL Criminal Justice Complex Financing (Miscellaneous Revenue, National Insured) | | | 7.65 | | | | 7-1-2016 | | | | 16,175,000 | | | | 16,178,073 | |
Hillsborough County FL Tampa International Airport Aviation Authority Series A (Airport Revenue) | | | 5.00 | | | | 10-1-2016 | | | | 1,200,000 | | | | 1,213,476 | |
Lakeland FL Energy System (Utilities Revenue) ± | | | 1.16 | | | | 10-1-2017 | | | | 5,220,000 | | | | 5,223,289 | |
Lee County FL Solid Waste System Series A (Resource Recovery Revenue, Ambac Insured) | | | 5.00 | | | | 10-1-2016 | | | | 4,535,000 | | | | 4,578,037 | |
Miami-Dade County FL Aviation Series B (Airport Revenue) | | | 5.00 | | | | 10-1-2017 | | | | 300,000 | | | | 315,825 | |
Miami-Dade County FL Expressway Authority Toll System (Transportation Revenue, AGC Insured, Citibank NA LIQ) ø144A | | | 0.61 | | | | 7-1-2018 | | | | 1,000,000 | | | | 1,000,000 | |
Miami-Dade County FL Expressway Authority Toll System (Transportation Revenue, Dexia Credit Local LOC, Ambac Insured, Dexia Credit Local LIQ) ±144A | | | 0.86 | | | | 8-1-2028 | | | | 16,505,000 | | | | 16,505,000 | |
Miami-Dade County FL Expressway Authority Toll System (Transportation Revenue, Dexia Credit Local LOC, Dexia Credit Local LIQ) ±144A | | | 0.91 | | | | 10-13-2023 | | | | 9,655,000 | | | | 9,655,000 | |
Miami-Dade County FL Expressway Authority Toll System (Transportation Revenue, Dexia Credit Local LOC, Ambac Insured, Dexia Credit Local LIQ) ±144A | | | 0.91 | | | | 3-8-2030 | | | | 11,130,000 | | | | 11,130,000 | |
Miami-Dade County FL Expressway Authority Toll System Series DCL-2012-003 (Transportation Revenue, Dexia Credit Local LOC, Ambac Insured, Dexia Credit Local LIQ) ±144A | | | 0.91 | | | | 3-8-2026 | | | | 16,860,000 | | | | 16,860,000 | |
| | | | | | |
| Portfolio of investments—June 30, 2016 | | Wells Fargo Ultra Short-Term Municipal Income Fund | | | 5 | |
| | | | | | | | | | | | | | | | |
| Security name | | Interest rate | | | Maturity date | | | Principal | | | Value | |
| | | | |
| Florida (continued) | | | | | | | | | | | | | | | | |
Miami-Dade County FL HFA Miami Children’s Hospital Project Series A (Health Revenue) | | | 5.25 | % | | | 8-1-2021 | | | $ | 1,000,000 | | | $ | 1,107,130 | |
Miami-Dade County FL International Airport Series C (Airport Revenue, AGM Insured) | | | 5.25 | | | | 10-1-2019 | | | | 16,775,000 | | | | 17,682,360 | |
Miami-Dade County FL School Board Certificate of Participation Series 3 (Miscellaneous Revenue, Dexia Credit Local LOC, Ambac Insured, Dexia Credit Local LIQ) ø144A | | | 0.84 | | | | 9-25-2024 | | | | 27,895,000 | | | | 27,895,000 | |
Miami-Dade County FL School Board Certificate of Participation Series 5 (Miscellaneous Revenue, Dexia Credit Local LOC, FGIC Insured, Dexia Credit Local LIQ) ø144A | | | 0.78 | | | | 5-1-2037 | | | | 25,000,000 | | | | 25,000,000 | |
Miami-Dade County FL School Board Foundation Incorporated (Miscellaneous Revenue, Dexia Credit Local LOC, National Insured, Dexia Credit Local LIQ) ø144A | | | 0.78 | | | | 5-1-2031 | | | | 19,210,000 | | | | 19,210,000 | |
Okeechobee County FL Disposal Waste Management Landfill Series A (Resource Recovery Revenue) ± | | | 2.25 | | | | 7-1-2039 | | | | 2,360,000 | | | | 2,360,094 | |
Orange County FL Health Facilities Unrefunded Balance Series A (Health Revenue, National Insured) | | | 6.25 | | | | 10-1-2016 | | | | 440,000 | | | | 446,534 | |
Palm Beach County FL Health Facilities Authority Lifespace Communities Series C (Health Revenue) | | | 3.00 | | | | 5-15-2017 | | | | 1,065,000 | | | | 1,084,042 | |
Palm Beach County FL Health Facilities Authority Lifespace Communities Series C (Health Revenue) | | | 4.00 | | | | 5-15-2018 | | | | 500,000 | | | | 526,740 | |
Palm Beach County FL Health Facilities Authority Lifespace Communities Series C (Health Revenue) | | | 4.00 | | | | 5-15-2019 | | | | 780,000 | | | | 839,179 | |
Palm Beach County FL HFA Retirement Life Communities Project (Housing Revenue) %% | | | 4.00 | | | | 11-15-2019 | | | | 2,675,000 | | | | 2,918,158 | |
Palm Beach County FL School Board Series A (Miscellaneous Revenue) ± | | | 5.00 | | | | 8-1-2032 | | | | 5,300,000 | | | | 5,320,829 | |
Pasco County FL School Board Certificates Series B (Miscellaneous Revenue, Ambac Insured) ±(m) | | | 0.85 | | | | 8-1-2030 | | | | 11,900,000 | | | | 11,900,000 | |
Pasco County FL School District (Tax Revenue) | | | 3.00 | | | | 10-1-2016 | | | | 1,260,000 | | | | 1,267,774 | |
Pineallas County FL HFA Series A (Health Revenue) | | | 5.65 | | | | 5-1-2037 | | | | 3,380,000 | | | | 3,521,622 | |
Tender Option Bond Trust Receipts Floaters Series 2016-XG0010 (Airport Revenue, AGC Insured, Bank of America NA LIQ) ø144A | | | 0.85 | | | | 10-1-2038 | | | | 12,400,000 | | | | 12,400,000 | |
| | | | |
| | | | | | | | | | | | | | | 220,319,697 | |
| | | | | | | | | | | | | | | | |
| | | | |
| Georgia: 3.03% | | | | | | | | | | | | | | | | |
Athens GA Housing Authority Pinewood Apartments Project Series 2015 (Housing Revenue) | | | 0.60 | | | | 10-1-2016 | | | | 2,000,000 | | | | 1,999,480 | |
Atlanta GA Urban Residential Finance Authority The Remington Apartments Project (Housing Revenue) ± | | | 1.05 | | | | 6-1-2019 | | | | 10,250,000 | | | | 10,261,070 | |
Burke County GA Development Authority Georgia Power Company Plant Vogtle Project First Series 2012 (Utilities Revenue) ± | | | 1.75 | | | | 12-1-2049 | | | | 4,600,000 | | | | 4,635,374 | |
Burke County GA Development Authority Georgia Power Company Vogtle Plant Project Second Series 2012 (Utilities Revenue) ± | | | 1.75 | | | | 12-1-2049 | | | | 5,135,000 | | | | 5,177,312 | |
Burke County GA Development Authority Georgia Transmission Corporation (Industrial Development Revenue) ± | | | 1.30 | | | | 1-1-2052 | | | | 14,000,000 | | | | 14,066,220 | |
Cedartown GA Housing Authority Cherokee Springs Apartments Project (Housing Revenue) ± | | | 1.00 | | | | 4-1-2019 | | | | 5,000,000 | | | | 5,002,500 | |
Cedartown GA Housing Authority Grayfield Apartments Project (Housing Revenue) ± | | | 1.00 | | | | 1-1-2019 | | | | 3,800,000 | | | | 3,800,380 | |
Georgia Private Colleges & Universities Authority Mercer University Series A (Education Revenue) | | | 4.00 | | | | 10-1-2016 | | | | 1,500,000 | | | | 1,512,525 | |
Georgia Series G (GO Revenue) ± | | | 0.81 | | | | 12-1-2026 | | | | 106,305,000 | | | | 106,217,830 | |
| | | | |
| 6 | | Wells Fargo Ultra Short-Term Municipal Income Fund | | Portfolio of investments—June 30, 2016 |
| | | | | | | | | | | | | | | | |
| Security name | | Interest rate | | | Maturity date | | | Principal | | | Value | |
| | | | |
| Georgia (continued) | | | | | | | | | | | | | | | | |
Savannah GA EDA Exempt Facilities Home Depot Project Series B (Industrial Development Revenue, SunTrust Bank LOC) ± | | | 0.50 | % | | | 8-1-2025 | | | $ | 6,400,000 | | | $ | 6,400,000 | |
Union City GA Housing Authority Providence at Parkway Village Apartments Project (Housing Revenue) ± | | | 0.70 | | | | 5-1-2017 | | | | 8,500,000 | | | | 8,500,340 | |
| | | | |
| | | | | | | | | | | | | | | 167,573,031 | |
| | | | | | | | | | | | | | | | |
| | | | |
| Guam: 0.07% | | | | | | | | | | | | | | | | |
Guam International Airport Authority Series A (Airport Revenue) | | | 5.00 | | | | 10-1-2017 | | | | 850,000 | | | | 896,053 | |
Guam International Airport Authority Series C (Airport Revenue) | | | 5.00 | | | | 10-1-2017 | | | | 2,750,000 | | | | 2,870,313 | |
| | | | |
| | | | | | | | | | | | | | | 3,766,366 | |
| | | | | | | | | | | | | | | | |
| | | | |
| Hawaii: 0.11% | | | | | | | | | | | | | | | | |
Hawaii Department of Budget and Finance Queens Health System Series B (Health Revenue) ± | | | 0.84 | | | | 7-1-2039 | | | | 3,055,000 | | | | 3,055,000 | |
Hawaii Department of Transportation Airports Division Lease AMT (Miscellaneous Revenue) | | | 4.00 | | | | 8-1-2018 | | | | 1,000,000 | | | | 1,060,600 | |
Hawaii Department of Transportation Airports Division Lease AMT (Miscellaneous Revenue) | | | 5.00 | | | | 8-1-2017 | | | | 425,000 | | | | 443,930 | |
Hawaii Housing Finance & Development Corporation Kalani Gardens Series A (Housing Revenue) | | | 0.70 | | | | 4-1-2017 | | | | 1,750,000 | | | | 1,750,105 | |
| | | | |
| | | | | | | | | | | | | | | 6,309,635 | |
| | | | | | | | | | | | | | | | |
| | | | |
| Idaho: 0.54% | | | | | | | | | | | | | | | | |
Idaho HFFA LPN Series A (Health Revenue) | | | 2.50 | | | | 5-1-2017 | | | | 6,500,000 | | | | 6,500,520 | |
Idaho Housing & Finance Association Series A (Housing Revenue, FNMA LOC) ø | | | 0.64 | | | | 1-1-2038 | | | | 18,545,000 | | | | 18,545,000 | |
Idaho TAN (GO Revenue) %% | | | 2.00 | | | | 6-30-2017 | | | | 5,000,000 | | | | 5,065,400 | |
| | | | |
| | | | | | | | | | | | | | | 30,110,920 | |
| | | | | | | | | | | | | | | | |
| | | | |
| Illinois: 8.99% | | | | | | | | | | | | | | | | |
Chicago Housing Authority Capital Program (Housing Revenue, AGM Insured) | | | 5.00 | | | | 7-1-2020 | | | | 6,350,000 | | | | 6,350,762 | |
Chicago Housing Authority Capital Program (Housing Revenue, AGM Insured) | | | 5.00 | | | | 7-1-2022 | | | | 2,745,000 | | | | 2,745,329 | |
Chicago IL (GO Revenue) | | | 5.00 | | | | 1-1-2020 | | | | 1,285,000 | | | | 1,339,407 | |
Chicago IL (GO Revenue) | | | 5.00 | | | | 1-1-2021 | | | | 2,000,000 | | | | 2,093,420 | |
Chicago IL (GO Revenue, National Insured) | | | 5.25 | | | | 1-1-2017 | | | | 500,000 | | | | 506,475 | |
Chicago IL Board of Education Refunding Bond Series A (GO Revenue) ± | | | 4.39 | | | | 3-1-2032 | | | | 15,000,000 | | | | 14,706,150 | |
Chicago IL Board of Education Series A (GO Revenue, Ambac Insured) ¤ | | | 0.00 | | | | 12-1-2016 | | | | 6,845,000 | | | | 6,733,290 | |
Chicago IL Board of Education Series A (GO Revenue, National Insured) ¤ | | | 0.00 | | | | 12-1-2018 | | | | 5,265,000 | | | | 4,918,352 | |
Chicago IL Board of Education Series A (GO Revenue, National Insured) | | | 5.25 | | | | 12-1-2017 | | | | 1,645,000 | | | | 1,712,116 | |
Chicago IL Board of Education Series A2 (GO Revenue) ± | | | 1.14 | | | | 3-1-2035 | | | | 72,320,000 | | | | 68,211,479 | |
Chicago IL Board of Education Series C (GO Revenue) | | | 5.00 | | | | 12-1-2017 | | | | 1,620,000 | | | | 1,579,014 | |
Chicago IL Board of Education Series F (GO Revenue) | | | 5.00 | | | | 12-1-2016 | | | | 1,000,000 | | | | 993,720 | |
Chicago IL Modern Schools Across Illinois Series B (GO Revenue, Ambac Insured) | | | 5.00 | | | | 12-1-2016 | | | | 1,000,000 | | | | 1,011,090 | |
Chicago IL Neighborhoods Alive 21 Program Series B (GO Revenue) | | | 5.00 | | | | 1-1-2019 | | | | 1,925,000 | | | | 1,994,550 | |
Chicago IL Park District Limited Tax Series D (GO Revenue) | | | 4.00 | | | | 1-1-2017 | | | | 1,000,000 | | | | 1,014,250 | |
Chicago IL Park District Limited Tax Series D (GO Revenue) | | | 4.00 | | | | 1-1-2018 | | | | 2,760,000 | | | | 2,871,808 | |
Chicago IL Prerefunded Neighborhoods Alive 21 Program Series B (GO Revenue) | | | 5.00 | | | | 1-1-2017 | | | | 305,000 | | | | 308,633 | |
Chicago IL Prerefunded Series B (GO Revenue) | | | 5.00 | | | | 1-1-2017 | | | | 565,000 | | | | 577,114 | |
Chicago IL Refunding Emergency System (GO Revenue, AGM/FGIC Insured) | | | 5.50 | | | | 1-1-2019 | | | | 3,000,000 | | | | 3,213,270 | |
Chicago IL Refunding Project Series B (GO Revenue) | | | 5.00 | | | | 1-1-2019 | | | | 3,205,000 | | | | 3,320,797 | |
| | | | | | |
| Portfolio of investments—June 30, 2016 | | Wells Fargo Ultra Short-Term Municipal Income Fund | | | 7 | |
| | | | | | | | | | | | | | | | |
| Security name | | Interest rate | | | Maturity date | | | Principal | | | Value | |
| | | | |
| Illinois (continued) | | | | | | | | | | | | | | | | |
Chicago IL Refunding Project Series B (GO Revenue) | | | 5.00 | % | | | 1-1-2020 | | | $ | 3,270,000 | | | $ | 3,408,452 | |
Chicago IL Refunding Series A (GO Revenue) | | | 4.00 | | | | 1-1-2019 | | | | 1,250,000 | | | | 1,265,450 | |
Chicago IL Series A (GO Revenue) | | | 4.00 | | | | 1-1-2019 | | | | 1,335,000 | | | | 1,351,501 | |
Chicago IL Series A (GO Revenue, AGM Insured) | | | 5.00 | | | | 1-1-2018 | | | | 10,000,000 | | | | 10,088,400 | |
Chicago IL Series A (GO Revenue) | | | 5.00 | | | | 12-1-2019 | | | | 1,000,000 | | | | 1,047,260 | |
Chicago IL Series A (GO Revenue, AGM Insured) | | | 5.25 | | | | 1-1-2017 | | | | 735,000 | | | | 737,117 | |
Chicago IL Series A2 (GO Revenue, Ambac Insured) | | | 5.50 | | | | 1-1-2018 | | | | 3,135,000 | | | | 3,232,969 | |
Chicago IL Series B (GO Revenue, Ambac Insured) | | | 5.00 | | | | 12-1-2018 | | | | 2,540,000 | | | | 2,583,586 | |
Chicago IL Series C (Water & Sewer Revenue) | | | 4.00 | | | | 1-1-2017 | | | | 1,980,000 | | | | 2,006,710 | |
Chicago IL Series C (GO Revenue, National Insured) | | | 5.00 | | | | 1-1-2018 | | | | 5,350,000 | | | | 5,526,818 | |
Chicago IL Series D (GO Revenue, AGM/FGIC Insured) | | | 5.25 | | | | 1-1-2017 | | | | 1,210,000 | | | | 1,227,194 | |
Chicago IL Transit Authority Capital Grant Unrefunded Balance Federal Transit Administration (Miscellaneous Revenue, Ambac Insured) | | | 5.00 | | | | 6-1-2018 | | | | 1,500,000 | | | | 1,527,705 | |
Chicago IL Unrefunded Neighborhoods Alive 21 Program Series B (GO Revenue) | | | 5.00 | | | | 1-1-2017 | | | | 245,000 | | | | 250,253 | |
Chicago IL Unrefunded Series B (GO Revenue) | | | 5.00 | | | | 1-1-2017 | | | | 710,000 | | | | 718,456 | |
Cook County IL Bedford Park Village Refunding Bond (Tax Revenue) | | | 2.05 | | | | 12-30-2016 | | | | 1,280,000 | | | | 1,283,302 | |
Cook County IL Bedford Park Village Refunding Bond (Tax Revenue) | | | 3.00 | | | | 12-30-2017 | | | | 1,340,000 | | | | 1,367,095 | |
Cook County IL Bedford Park Village Refunding Bond (Tax Revenue) | | | 3.00 | | | | 12-30-2018 | | | | 880,000 | | | | 900,486 | |
Cook County IL Refunding Series A (GO Revenue) | | | 4.00 | | | | 11-15-2018 | | | | 300,000 | | | | 318,825 | |
Cook County IL Refunding Series A (GO Revenue, Ambac Insured) | | | 5.00 | | | | 11-15-2019 | | | | 1,000,000 | | | | 1,001,890 | |
Cook County IL Refunding Series C (GO Revenue) | | | 4.25 | | | | 11-15-2018 | | | | 100,000 | | | | 106,858 | |
Cook County IL School District No. 087 Refunding School Series A (GO Revenue) | | | 2.00 | | | | 12-1-2016 | | | | 1,175,000 | | | | 1,178,408 | |
Deutsche Bank SPEAR/LIFER Trust Series DBE 1032 (Tax Revenue, Deutsche Bank LIQ) ø144A | | | 0.66 | | | | 12-1-2036 | | | | 31,235,000 | | | | 31,235,000 | |
Grundy Kendall & Will Counties IL Community School District #201 (GO Revenue, AGC Insured) | | | 5.75 | | | | 10-15-2019 | | | | 540,000 | | | | 597,866 | |
Illinois (Miscellaneous Revenue) | | | 2.50 | | | | 7-1-2017 | | | | 3,000,000 | | | | 3,034,860 | |
Illinois (GO Revenue) | | | 3.00 | | | | 2-1-2017 | | | | 8,740,000 | | | | 8,833,780 | |
Illinois (GO Revenue) | | | 4.00 | | | | 2-1-2018 | | | | 5,550,000 | | | | 5,761,233 | |
Illinois (Miscellaneous Revenue) | | | 4.00 | | | | 7-1-2018 | | | | 13,610,000 | | | | 14,248,581 | |
Illinois (GO Revenue) | | | 5.00 | | | | 3-1-2017 | | | | 5,000,000 | | | | 5,126,600 | |
Illinois (Miscellaneous Revenue) | | | 5.00 | | | | 5-1-2017 | | | | 5,070,000 | | | | 5,227,170 | |
Illinois (Miscellaneous Revenue) | | | 5.00 | | | | 7-1-2017 | | | | 10,000,000 | | | | 10,364,400 | |
Illinois (GO Revenue, AGM Insured) | | | 5.00 | | | | 9-1-2017 | | | | 3,200,000 | | | | 3,225,824 | |
Illinois (GO Revenue) | | | 5.00 | | | | 1-1-2018 | | | | 21,700,000 | | | | 22,505,080 | |
Illinois (GO Revenue) | | | 5.00 | | | | 3-1-2018 | | | | 2,000,000 | | | | 2,112,580 | |
Illinois (Miscellaneous Revenue) | | | 5.00 | | | | 5-1-2019 | | | | 10,500,000 | | | | 11,372,130 | |
Illinois (Miscellaneous Revenue) | | | 5.00 | | | | 8-1-2019 | | | | 10,335,000 | | | | 11,256,572 | |
Illinois (GO Revenue) | | | 5.00 | | | | 1-1-2021 | | | | 2,500,000 | | | | 2,748,925 | |
Illinois Educational Authority University of Chicago Series B-1 (Education Revenue) ± | | | 1.10 | | | | 7-1-2036 | | | | 6,485,000 | | | | 6,510,032 | |
Illinois Finance Authority Carle Foundation Series A (Health Revenue) | | | 5.00 | | | | 8-15-2016 | | | | 2,200,000 | | | | 2,212,430 | |
Illinois Finance Authority DePaul University (Education Revenue) | | | 5.00 | | | | 10-1-2016 | | | | 1,850,000 | | | | 1,870,850 | |
Illinois Finance Authority Little Company of Mark Hospital Series B (Health Revenue, Barclays Bank plc LOC) ø | | | 0.42 | | | | 8-15-2035 | | | | 20,000,000 | | | | 20,000,000 | |
Illinois Finance Authority Presbyterian Homes Obligated Group Series A (Health Revenue) | | | 4.00 | | | | 5-1-2019 | | | | 500,000 | | | | 538,480 | |
Illinois Finance Authority Presbyterian Homes Obligated Group Series A (Health Revenue) | | | 4.00 | | | | 11-1-2019 | | | | 500,000 | | | | 543,925 | |
Illinois Finance Authority Presbyterian Homes Obligated Group Series B (Health Revenue) ± | | | 1.67 | | | | 5-1-2036 | | | | 5,000,000 | | | | 4,995,100 | |
| | | | |
| 8 | | Wells Fargo Ultra Short-Term Municipal Income Fund | | Portfolio of investments—June 30, 2016 |
| | | | | | | | | | | | | | | | |
| Security name | | Interest rate | | | Maturity date | | | Principal | | | Value | |
| | | | |
| Illinois (continued) | | | | | | | | | | | | | | | | |
Illinois HFA Evanston Hospital Corporation (Health Revenue, JPMorgan Chase & Company SPA) ø | | | 0.46 | % | | | 8-15-2035 | | | $ | 10,000,000 | | | $ | 10,000,000 | |
Illinois Housing Development Authority Lafayette Terrace Apartments (Housing Revenue) | | | 0.80 | | | | 12-1-2016 | | | | 7,650,000 | | | | 7,650,000 | |
Illinois Housing Development Authority Multi-Housing Township Village Apartments Project Series A (Housing Revenue) ± | | | 1.25 | | | | 5-1-2019 | | | | 5,300,000 | | | | 5,305,300 | |
Illinois Metropolitan Pier & Exposition Authority Prefunded CAB (Tax Revenue, National Insured) ¤ | | | 0.00 | | | | 6-15-2017 | | | | 450,000 | | | | 446,535 | |
Illinois Metropolitan Pier & Exposition Authority Unrefunded CAB (Tax Revenue, National Insured) ¤ | | | 0.00 | | | | 6-15-2017 | | | | 1,780,000 | | | | 1,758,106 | |
Illinois Refunding Bond (GO Revenue) ## | | | 5.00 | | | | 1-1-2018 | | | | 8,685,000 | | | | 9,128,369 | |
Illinois Refunding Bond (Miscellaneous Revenue) | | | 5.00 | | | | 8-1-2016 | | | | 1,125,000 | | | | 1,129,005 | |
Illinois Refunding Bond (Miscellaneous Revenue) | | | 5.00 | | | | 8-1-2017 | | | | 1,425,000 | | | | 1,480,874 | |
Illinois Refunding Bond (Miscellaneous Revenue) | | | 5.00 | | | | 8-1-2018 | | | | 1,520,000 | | | | 1,624,606 | |
Illinois Series A (GO Revenue) | | | 5.00 | | | | 4-1-2017 | | | | 6,840,000 | | | | 7,032,820 | |
Illinois Series A (Tax Revenue) | | | 5.00 | | | | 6-1-2017 | | | | 250,000 | | | | 258,435 | |
Illinois Sports Authority (Tax Revenue) | | | 5.00 | | | | 6-15-2017 | | | | 760,000 | | | | 780,474 | |
Illinois Toll Highway Authority Series A-2A (Transportation Revenue, Royal Bank of Canada LOC) ø | | | 0.41 | | | | 7-1-2030 | | | | 20,800,000 | | | | 20,800,000 | |
Illinois University of Illinois Auxiliary Facilities (Education Revenue, JPMorgan Chase & Company SPA) ø | | | 0.88 | | | | 4-1-2038 | | | | 10,000,000 | | | | 10,000,000 | |
Illinois Unrefunded Balance Series A (Miscellaneous Revenue) | | | 5.00 | | | | 10-1-2016 | | | | 5,560,000 | | | | 5,578,348 | |
Kane County IL School District #129 Aurora West Series B (GO Revenue) | | | 2.00 | | | | 2-1-2017 | | | | 2,190,000 | | | | 2,205,111 | |
Kane County IL School District #129 West Side Series B (GO Revenue) | | | 2.00 | | | | 2-1-2018 | | | | 2,430,000 | | | | 2,468,248 | |
Kendall, Kane & Will Counties IL Community Unit School District #308 (GO Revenue) | | | 4.00 | | | | 10-1-2018 | | | | 2,000,000 | | | | 2,143,520 | |
Lake County IL School District #38 Big Hollow CAB (GO Revenue, Ambac Insured) ¤ | | | 0.00 | | | | 2-1-2017 | | | | 500,000 | | | | 494,550 | |
Minooka IL Special Assessment Refunding & Improvement (Miscellaneous Revenue, AGM Insured) | | | 2.00 | | | | 12-1-2016 | | | | 240,000 | | | | 240,912 | |
Minooka IL Special Assessment Refunding & Improvement (Miscellaneous Revenue, AGM Insured) | | | 3.00 | | | | 12-1-2017 | | | | 415,000 | | | | 424,246 | |
Minooka IL Special Assessment Refunding & Improvement (Miscellaneous Revenue, AGM Insured) | | | 3.50 | | | | 12-1-2018 | | | | 400,000 | | | | 418,708 | |
Minooka IL Special Assessment Refunding & Improvement (Miscellaneous Revenue, AGM Insured) | | | 3.50 | | | | 12-1-2019 | | | | 565,000 | | | | 597,092 | |
Regional Transportation Authority Illinois Refunding Bond Series B (Tax Revenue) ± | | | 0.65 | | | | 6-1-2025 | | | | 38,675,000 | | | | 38,675,000 | |
Tender Option Bond Trust Receipts Floaters Series 2016-XG0008 (Health Revenue, AGC Insured, Bank of America NA LIQ) ø144A | | | 0.68 | | | | 8-15-2047 | | | | 23,375,000 | | | | 23,375,000 | |
Western Illinois University Board of Trustees Certificate of Participation (Miscellaneous Revenue, AGM Insured) | | | 3.00 | | | | 10-1-2016 | | | | 350,000 | | | | 351,768 | |
Western Illinois University Board of Trustees Certificate of Participation (Miscellaneous Revenue, AGM Insured) | | | 3.00 | | | | 10-1-2017 | | | | 500,000 | | | | 510,430 | |
Western Illinois University Board of Trustees Certificate of Participation (Miscellaneous Revenue, AGM Insured) | | | 3.00 | | | | 10-1-2018 | | | | 500,000 | | | | 518,010 | |
| | | | |
| | | | | | | | | | | | | | | 497,046,646 | |
| | | | | | | | | | | | | | | | |
| | | | |
| Indiana: 1.36% | | | | | | | | | | | | | | | | |
Gary IN Woodlake-Concord Project (Housing Revenue, FHA Insured) ± | | | 1.00 | | | | 10-1-2017 | | | | 22,715,000 | | | | 22,722,723 | |
Indiana Finance Authority I-69 Section 5 Project (Miscellaneous Revenue) | | | 4.00 | | | | 3-1-2017 | | | | 2,115,000 | | | | 2,136,594 | |
Indiana Finance Authority Ohio River Bridges East End Crossing Project Series B (Industrial Development Revenue) | | | 5.00 | | | | 1-1-2019 | | | | 4,610,000 | | | | 4,705,888 | |
| | | | | | |
| Portfolio of investments—June 30, 2016 | | Wells Fargo Ultra Short-Term Municipal Income Fund | | | 9 | |
| | | | | | | | | | | | | | | | |
| Security name | | Interest rate | | | Maturity date | | | Principal | | | Value | |
| | | | |
| Indiana (continued) | | | | | | | | | | | | | | | | |
Indiana Housing and Community Development Authority River Run Apartments Project (Housing Revenue, FHA Insured) | | | 0.75 | % | | | 1-1-2017 | | | $ | 4,900,000 | | | $ | 4,900,294 | |
Indiana Housing and Community Development Authority Series A-2 (Housing Revenue, GNMA/FNMA/FHLMC Insured) ± | | | 0.86 | | | | 7-1-2039 | | | | 9,465,000 | | | | 9,465,000 | |
Indiana Porter Township High School BAN (Miscellaneous Revenue) | | | 1.00 | | | | 12-31-2016 | | | | 6,500,000 | | | | 6,500,845 | |
Indiana Transportation Finance Authority Series A (Miscellaneous Revenue) | | | 6.80 | | | | 12-1-2016 | | | | 1,165,000 | | | | 1,192,133 | |
Jasper County IN Pollution Control Northern Indiana Public Services Company Series C (Industrial Development Revenue, National Insured) | | | 5.60 | | | | 11-1-2016 | | | | 1,450,000 | | | | 1,473,041 | |
Mount Vernon IN Waterworks BAN (Water & Sewer Revenue) | | | 1.00 | | | | 7-1-2016 | | | | 5,350,000 | | | | 5,350,054 | |
Posey County IN EDA Midwest Fertilizer Company LLC Project (Industrial Development Revenue) ± | | | 0.35 | | | | 7-1-2046 | | | | 13,500,000 | | | | 13,494,870 | |
Rockport IN PCR Indiana-Michigan Power Company Series B (Utilities Revenue) ± | | | 1.75 | | | | 6-1-2025 | | | | 2,000,000 | | | | 2,018,080 | |
Tender Option Bond Trust Receipts Floaters Series 2015-XF0115 (Utilities Revenue, JPMorgan Chase & Company LIQ) ø144A | | | 0.75 | | | | 4-15-2018 | | | | 1,200,000 | | | | 1,200,000 | |
| | | | |
| | | | | | | | | | | | | | | 75,159,522 | |
| | | | | | | | | | | | | | | | |
| | | | |
| Iowa: 0.62% | | | | | | | | | | | | | | | | |
Buchanan County IA People’s Memorial Hospital (Health Revenue) | | | 1.50 | | | | 12-1-2018 | | | | 2,500,000 | | | | 2,501,625 | |
Iowa Finance Authority BAN Shenandoah Medical Center Project (Health Revenue) | | | 1.75 | | | | 6-1-2018 | | | | 7,000,000 | | | | 7,027,790 | |
Iowa Finance Authority UnityPoint Health Project Series B-1 (Health Revenue, Union Bank NA LOC) ± | | | 0.46 | | | | 2-15-2039 | | | | 15,000,000 | | | | 15,000,000 | |
Randall IA Healthcare BAN Bethany Manor Incorporated (Health Revenue) | | | 1.25 | | | | 8-1-2016 | | | | 10,000,000 | | | | 10,005,100 | |
| | | | |
| | | | | | | | | | | | | | | 34,534,515 | |
| | | | | | | | | | | | | | | | |
| | | | |
| Kansas: 0.63% | | | | | | | | | | | | | | | | |
Kansas Department of Transportation Highway Libor Index Series B-2 (Tax Revenue) ± | | | 0.50 | | | | 9-1-2016 | | | | 10,000,000 | | | | 10,001,700 | |
Kansas Department of Transportation Highway Libor Index Series B-3 (Tax Revenue) ± | | | 0.55 | | | | 9-1-2017 | | | | 4,500,000 | | | | 4,484,115 | |
Kansas Department of Transportation Highway Libor Index Series B-4 (Tax Revenue) ± | | | 0.63 | | | | 9-1-2018 | | | | 7,000,000 | | | | 6,951,140 | |
Kansas Department of Transportation Highway Libor Index Series B-5 (Tax Revenue) ± | | | 0.71 | | | | 9-1-2019 | | | | 6,000,000 | | | | 5,947,200 | |
Kansas Development Finance Authority Series A (GO Revenue) | | | 5.00 | | | | 5-1-2018 | | | | 5,710,000 | | | | 6,149,099 | |
Lawrence KS Series A (Industrial Development Revenue, U.S. Bank NA LOC) ø | | | 0.67 | | | | 12-1-2018 | | | | 1,065,000 | | | | 1,065,000 | |
| | | | |
| | | | | | | | | | | | | | | 34,598,254 | |
| | | | | | | | | | | | | | | | |
| | | | |
| Kentucky: 2.57% | | | | | | | | | | | | | | | | |
Ashland KY Ashland Hospital Corporation Kings Daughters Medical Center Project (Health Revenue) ± | | | 2.14 | | | | 2-1-2040 | | | | 30,700,000 | | | | 30,717,499 | |
Ashland KY Medical Center Ashland Hospital Corporation Series B (Health Revenue) | | | 5.00 | | | | 2-1-2018 | | | | 900,000 | | | | 944,919 | |
Harrison KY Harrison Memorial Hospital Project BAN (Health Revenue) | | | 1.50 | | | | 5-1-2017 | | | | 9,065,000 | | | | 9,068,626 | |
Kentucky EDA Republic Services Incorporated Project Series A (Resource Recovery Revenue) ø | | | 0.80 | | | | 4-1-2031 | | | | 3,000,000 | | | | 3,000,000 | |
Kentucky Public Transportation Infrastructure Authority Tolls Downtown Crossing Project BAN Series A (Transportation Revenue) | | | 5.00 | | | | 7-1-2017 | | | | 50,920,000 | | | | 52,863,616 | |
Louisville & Jefferson Counties KY Louisville Gas & Electric Company Project (Utilities Revenue) ± | | | 1.65 | | | | 10-1-2033 | | | | 2,000,000 | | | | 2,009,560 | |
Louisville & Jefferson Counties KY PCR Louisville Gas & Electric Company Project Series B (Utilities Revenue) ± | | | 1.35 | | | | 11-1-2027 | | | | 16,000,000 | | | | 16,056,480 | |
| | | | |
| 10 | | Wells Fargo Ultra Short-Term Municipal Income Fund | | Portfolio of investments—June 30, 2016 |
| | | | | | | | | | | | | | | | |
| Security name | | Interest rate | | | Maturity date | | | Principal | | | Value | |
| | | | |
| Kentucky (continued) | | | | | | | | | | | | | | | | |
Louisville County KY Metropolitan District Sewer and Drainage System BAN (Water & Sewer Revenue) | | | 5.00 | % | | | 11-22-2016 | | | $ | 13,000,000 | | | $ | 13,222,950 | |
Pikeville KY University of Pikeville College of Optometry BAN (Education Revenue, USDA Insured) | | | 3.00 | | | | 8-1-2017 | | | | 13,950,000 | | | | 14,073,318 | |
| | | | |
| | | | | | | | | | | | | | | 141,956,968 | |
| | | | | | | | | | | | | | | | |
| | | | |
| Louisiana: 1.39% | | | | | | | | | | | | | | | | |
East Baton Rouge Parish LA Sewerage Commission Refunding Bond Series A (Water & Sewer Revenue) ± | | | 0.82 | | | | 2-1-2046 | | | | 24,000,000 | | | | 23,772,960 | |
Louisiana Gas & Fuel Tax 2nd Lien Series A (Tax Revenue) ± | | | 0.79 | | | | 5-1-2043 | | | | 11,200,000 | | | | 11,178,944 | |
Louisiana Offshore Terminal Authority Deepwater Loop LLC Project Series B-1 (Airport Revenue) ± | | | 2.20 | | | | 10-1-2040 | | | | 750,000 | | | | 758,678 | |
Louisiana Offshore Terminal Authority Deepwater Loop LLC Project Series B-1A1 (Airport Revenue) ± | | | 1.38 | | | | 10-1-2037 | | | | 3,115,000 | | | | 3,117,554 | |
Shreveport LA Water & Sewer Refunding Series A (Water & Sewer Revenue, Build America Mutual Assurance Company Insured) | | | 4.00 | | | | 12-1-2017 | | | | 3,000,000 | | | | 3,134,400 | |
St. James Parish LA Nucor Steel LLC Project Gulf Opportunity Zone Series A-1 (Industrial Development Revenue) ø | | | 0.65 | | | | 11-1-2040 | | | | 35,000,000 | | | | 35,000,000 | |
| | | | |
| | | | | | | | | | | | | | | 76,962,536 | |
| | | | | | | | | | | | | | | | |
| | | | |
| Maine: 0.29% | | | | | | | | | | | | | | | | |
Maine HEFA Series B (Health Revenue) | | | 4.00 | | | | 7-1-2016 | | | | 525,000 | | | | 525,053 | |
Old Town ME Georgia Pacific Corporation Project (Resource Recovery Revenue) ø | | | 0.60 | | | | 12-1-2024 | | | | 15,260,000 | | | | 15,260,000 | |
| | | | |
| | | | | | | | | | | | | | | 15,785,053 | |
| | | | | | | | | | | | | | | | |
| | | | |
| Maryland: 1.83% | | | | | | | | | | | | | | | | |
Maryland CDA Allendale Apartments Series I (Housing Revenue) | | | 1.02 | | | | 5-1-2017 | | | | 10,000,000 | | | | 9,998,300 | |
Maryland CDA Bascilica Place Apartments Series 2015E (Housing Revenue) | | | 1.10 | | | | 3-1-2017 | | | | 6,900,000 | | | | 6,901,863 | |
Maryland CDA Commons of Avalon Series 2015C (Housing Revenue) | | | 1.00 | | | | 1-1-2017 | | | | 12,850,000 | | | | 12,857,710 | |
Maryland CDA Department of Housing & Community Development Marlborough Apartment Series I (Housing Revenue, FNMA Insured) | | | 0.55 | | | | 12-15-2016 | | | | 2,050,000 | | | | 2,049,139 | |
Maryland CDA Department of Housing & Community Development Windsor Valley Apartments I & II Series G (Housing Revenue) | | | 1.00 | | | | 6-1-2017 | | | | 16,500,000 | | | | 16,501,155 | |
Maryland CDA Hollins House (Housing Revenue) | | | 1.27 | | | | 11-1-2017 | | | | 12,000,000 | | | | 11,999,160 | |
Maryland CDA Multifamily Development Conifer Village (Housing Revenue) | | | 0.80 | | | | 4-1-2017 | | | | 13,000,000 | | | | 13,007,540 | |
Maryland CDA Tabco Towers Series K (Housing Revenue) | | | 1.40 | | | | 12-1-2017 | | | | 7,150,000 | | | | 7,159,796 | |
Maryland Department of Housing and Community Development Series A (Housing Revenue) | | | 1.25 | | | | 10-1-2017 | | | | 6,900,000 | | | | 6,894,066 | |
Maryland HEFA Suburban Hospital Series A (Health Revenue, National/FHA Insured) | | | 4.75 | | | | 7-1-2036 | | | | 13,620,000 | | | | 13,621,634 | |
Maryland HEFA Suburban Hospital Series A (Health Revenue) | | | 5.50 | | | | 7-1-2016 | | | | 415,000 | | | | 415,062 | |
| | | | |
| | | | | | | | | | | | | | | 101,405,425 | |
| | | | | | | | | | | | | | | | |
| | | | |
| Massachusetts: 2.47% | | | | | | | | | | | | | | | | |
Massachusetts Bay Transportation Authority Series A-2 (Transportation Revenue, Bank of Tokyo-Mitsubishi SPA) ± | | | 0.40 | | | | 3-1-2030 | | | | 5,000,000 | | | | 5,000,000 | |
Massachusetts Consolidated Loan Series D-1 (Miscellaneous Revenue) ø | | | 0.59 | | | | 8-1-2043 | | | | 78,750,000 | | | | 78,750,000 | |
Massachusetts Development Finance Agency Boston University Series U-6E (Education Revenue) ± | | | 0.94 | | | | 10-1-2042 | | | | 14,000,000 | | | | 14,002,240 | |
Massachusetts HEFA Partners Healthcare Series G-2 (Health Revenue, AGM Insured) ±(m) | | | 0.49 | | | | 7-1-2042 | | | | 17,810,000 | | | | 17,810,000 | |
| | | | | | |
| Portfolio of investments—June 30, 2016 | | Wells Fargo Ultra Short-Term Municipal Income Fund | | | 11 | |
| | | | | | | | | | | | | | | | |
| Security name | | Interest rate | | | Maturity date | | | Principal | | | Value | |
| | | | |
| Massachusetts (continued) | | | | | | | | | | | | | | | | |
Springfield MA (GO Revenue) | | | 2.00 | % | | | 8-1-2016 | | | $ | 4,920,000 | | | $ | 4,926,396 | |
Tender Option Bond Trust Receipts Floaters Series 2016-XF2306 (Education Revenue, Morgan Stanley Bank LIQ) ø144A | | | 0.70 | | | | 7-1-2033 | | | | 14,000,000 | | | | 14,000,000 | |
Uxbridge MA BAN (GO Revenue) | | | 1.00 | | | | 8-19-2016 | | | | 2,045,000 | | | | 2,045,716 | |
| | | | |
| | | | | | | | | | | | | | | 136,534,352 | |
| | | | | | | | | | | | | | | | |
| | | | |
| Michigan: 3.83% | | | | | | | | | | | | | | | | |
Birmingham MI Public Schools (GO Revenue) | | | 5.00 | | | | 11-1-2016 | | | | 4,855,000 | | | | 4,929,087 | |
Birmingham MI Public Schools (GO Revenue) | | | 5.00 | | | | 11-1-2017 | | | | 4,955,000 | | | | 5,244,174 | |
Charlotte MI Public School District (GO Revenue, Qualified School Board Loan Fund Insured) | | | 4.00 | | | | 5-1-2017 | | | | 685,000 | | | | 703,906 | |
Charlotte MI Public School District (GO Revenue, Qualified School Board Loan Fund Insured) | | | 5.00 | | | | 5-1-2019 | | | | 1,515,000 | | | | 1,687,786 | |
Detroit MI (GO Revenue) | | | 5.00 | | | | 11-1-2017 | | | | 7,485,000 | | | | 7,831,780 | |
Detroit MI Water Supply System Senior Lien Series B (Water & Sewer Revenue, National Insured) | | | 5.00 | | | | 7-1-2016 | | | | 125,000 | | | | 125,015 | |
Forest Hills MI Public Schools (GO Revenue) | | | 4.00 | | | | 5-1-2017 | | | | 2,150,000 | | | | 2,210,265 | |
Genesee County MI Limited Tax Water Supply System (GO Revenue, Build America Mutual Assurance Company Insured) | | | 3.00 | | | | 11-1-2016 | | | | 425,000 | | | | 428,298 | |
Genesee County MI Limited Tax Water Supply System (GO Revenue, Build America Mutual Assurance Company Insured) | | | 4.00 | | | | 11-1-2017 | | | | 225,000 | | | | 234,281 | |
Genesee County MI Limited Tax Water Supply System (GO Revenue, Build America Mutual Assurance Company Insured) | | | 4.00 | | | | 11-1-2018 | | | | 220,000 | | | | 235,464 | |
Genesee County MI Limited Tax Water Supply System (GO Revenue, Build America Mutual Assurance Company Insured) | | | 5.00 | | | | 11-1-2019 | | | | 240,000 | | | | 270,710 | |
Grand Ledge MI Public School District (GO Revenue, Qualified School Board Loan Fund Insured) | | | 5.00 | | | | 5-1-2017 | | | | 1,235,000 | | | | 1,279,361 | |
Kent MI Hospital Finance Authority Spectrum Health Series C (Health Revenue, Bank of New York Mellon LOC) ø | | | 0.41 | | | | 1-15-2026 | | | | 13,645,000 | | | | 13,645,000 | |
Lake Orion MI Community School District (GO Revenue, Qualified School Board Loan Fund Insured) | | | 4.00 | | | | 5-1-2017 | | | | 2,325,000 | | | | 2,389,170 | |
Lake Orion MI Community School District (GO Revenue, Qualified School Board Loan Fund Insured) | | | 5.00 | | | | 5-1-2018 | | | | 4,650,000 | | | | 5,004,330 | |
Mattawan MI Consolidated School District (GO Revenue, Qualified School Board Loan Fund Insured) | | | 4.00 | | | | 5-1-2017 | | | | 875,000 | | | | 899,150 | |
Mattawan MI Consolidated School District (GO Revenue, Qualified School Board Loan Fund Insured) | | | 5.00 | | | | 5-1-2018 | | | | 855,000 | | | | 920,151 | |
Michigan Central University Series A (Education Revenue, JPMorgan Chase & Company LOC) ø | | | 0.46 | | | | 10-1-2032 | | | | 2,100,000 | | | | 2,100,000 | |
Michigan Finance Authority Local Government Loan Program Detroit Water & Sewer Series C (Water & Sewer Revenue) | | | 5.00 | | | | 11-1-2017 | | | | 2,000,000 | | | | 2,101,400 | |
Michigan Finance Authority Local Government Loan Program Detroit Water & Sewer Series D-1 (Water & Sewer Revenue, AGM Insured) | | | 5.00 | | | | 7-1-2016 | | | | 2,400,000 | | | | 2,400,288 | |
Michigan Finance Authority Local Government Loan Program Detroit Water & Sewer Series D-1 (Water & Sewer Revenue, AGM Insured) | | | 5.00 | | | | 7-1-2017 | | | | 7,065,000 | | | | 7,357,844 | |
Michigan Finance Authority Local Government Loan Program Detroit Water & Sewer Series D-3 (Water & Sewer Revenue, National Insured) | | | 5.00 | | | | 7-1-2018 | | | | 20,000,000 | | | | 21,586,600 | |
Michigan Finance Authority Local Government Loan Program Detroit Water & Sewer Series D-4 (Water & Sewer Revenue) | | | 5.00 | | | | 7-1-2016 | | | | 13,740,000 | | | | 13,741,511 | |
Michigan Finance Authority Local Government Loan Program Detroit Water & Sewer Series D-4 (Water & Sewer Revenue) | | | 5.00 | | | | 7-1-2017 | | | | 15,000,000 | | | | 15,609,450 | |
Michigan Finance Authority Local Government Loan Program Detroit Water & Sewer Series D-7 (Water & Sewer Revenue) | | | 5.00 | | | | 7-1-2017 | | | | 1,630,000 | | | | 1,693,391 | |
| | | | |
| 12 | | Wells Fargo Ultra Short-Term Municipal Income Fund | | Portfolio of investments—June 30, 2016 |
| | | | | | | | | | | | | | | | |
| Security name | | Interest rate | | | Maturity date | | | Principal | | | Value | |
| | | | |
| Michigan (continued) | | | | | | | | | | | | | | | | |
Michigan Finance Authority Senior Lien Detroit Water & Sewer Series C-5 (Water & Sewer Revenue, National Insured) | | | 5.00 | % | | | 7-1-2017 | | | $ | 10,000,000 | | | $ | 10,417,600 | |
Michigan Finance Authority Senior Lien Detroit Water & Sewer Series C-5 (Water & Sewer Revenue, National Insured) | | | 5.00 | | | | 7-1-2018 | | | | 17,500,000 | | | | 18,888,275 | |
Michigan Finance Authority Senior Lien Detroit Water & Sewer Series C-6 (Water & Sewer Revenue) | | | 5.00 | | | | 7-1-2016 | | | | 8,300,000 | | | | 8,300,913 | |
Michigan Finance Authority Senior Lien Detroit Water & Sewer Series C-6 (Water & Sewer Revenue) | | | 5.00 | | | | 7-1-2018 | | | | 4,130,000 | | | | 4,435,372 | |
Michigan Grant Anticipation Bonds (Miscellaneous Revenue, AGM Insured) | | | 5.25 | | | | 9-15-2018 | | | | 1,500,000 | | | | 1,582,740 | |
Michigan Hospital Finance Authority Ascension Health Credit Group Series B-3 (Health Revenue) ± | | | 0.95 | | | | 11-15-2033 | | | | 2,000,000 | | | | 2,000,760 | |
Michigan Hospital Finance Authority Ascension Health Group Project Series A-2 (Health Revenue) ± | | | 1.50 | | | | 11-1-2027 | | | | 2,000,000 | | | | 2,019,920 | |
Michigan Hospital Finance Authority Ascension Health Group Project Series E-1 (Health Revenue) ± | | | 1.10 | | | | 11-15-2046 | | | | 4,000,000 | | | | 4,012,520 | |
Michigan Hospital Finance Authority Ascension Health Series A-3 (Health Revenue) ± | | | 1.87 | | | | 11-1-2027 | | | | 7,025,000 | | | | 7,141,475 | |
Michigan Hospital Finance Authority Ascension Health Series F-3 (Health Revenue) ± | | | 1.40 | | | | 11-15-2047 | | | | 9,250,000 | | | | 9,326,775 | |
Michigan Hospital Finance Authority Refunding Ascension Health Senior Credit Group (Health Revenue) ± | | | 1.50 | | | | 11-15-2047 | | | | 1,360,000 | | | | 1,366,854 | |
Michigan Strategic Fund Limited Obligation Events Center Project Series A (Tax Revenue) ± | | | 4.13 | | | | 7-1-2045 | | | | 16,000,000 | | | | 16,429,280 | |
Pinckney MI Community Schools (GO Revenue, Qualified School Board Loan Fund Insured) | | | 4.00 | | | | 5-1-2017 | | | | 645,000 | | | | 662,415 | |
Pinckney MI Community Schools (GO Revenue, Qualified School Board Loan Fund Insured) | | | 5.00 | | | | 5-1-2018 | | | | 1,035,000 | | | | 1,112,553 | |
Rockford MI Public School District (GO Revenue, Qualified School Board Loan Fund Insured) | | | 5.00 | | | | 5-1-2017 | | | | 1,000,000 | | | | 1,035,320 | |
Rockford MI Public School District (GO Revenue, Qualified School Board Loan Fund Insured) | | | 5.00 | | | | 5-1-2018 | | | | 750,000 | | | | 806,198 | |
Rockford MI Public School District (GO Revenue, Qualified School Board Loan Fund Insured) | | | 5.00 | | | | 5-1-2019 | | | | 1,000,000 | | | | 1,111,770 | |
Walled Lake MI Consolidated School District (GO Revenue, Qualified School Board Loan Fund Insured) | | | 5.00 | | | | 5-1-2018 | | | | 6,020,000 | | | | 6,478,724 | |
| | | | |
| | | | | | | | | | | | | | | 211,757,876 | |
| | | | | | | | | | | | | | | | |
| | | | |
| Minnesota: 0.89% | | | | | | | | | | | | | | | | |
Minneapolis & St. Paul MN Housing & RDA HealthSpan Series B (Health Revenue, Ambac Insured) ±(m)(n) | | | 0.59 | | | | 11-15-2017 | | | | 6,500,000 | | | | 6,435,000 | |
Minneapolis MN Housing Broadway Flats Apartments Project (Housing Revenue) | | | 0.55 | | | | 12-1-2016 | | | | 13,000,000 | | | | 12,997,660 | |
Minneapolis MN Plymouth Stevens House Project Series A (Housing Revenue) | | | 1.00 | | | | 12-1-2017 | | | | 2,400,000 | | | | 2,401,344 | |
Minneapolis MN Seward Towers Apartments Project Series A (Housing Revenue) | | | 1.10 | | | | 1-1-2018 | | | | 11,700,000 | | | | 11,719,773 | |
Minnesota Housing Finance Agency Multifamily Housing Project (Housing Revenue) ± | | | 0.55 | | | | 2-1-2017 | | | | 13,500,000 | | | | 13,498,245 | |
Pipestone County MN Medical Center BAN (Health Revenue) | | | 0.85 | | | | 5-1-2017 | | | | 1,900,000 | | | | 1,901,235 | |
| | | | |
| | | | | | | | | | | | | | | 48,953,257 | |
| | | | | | | | | | | | | | | | |
| | | | |
| Mississippi: 0.71% | | | | | | | | | | | | | | | | |
Mississippi Business Finance Corporation Coast Electric Power Association (Utilities Revenue) ± | | | 0.75 | | | | 5-1-2037 | | | | 1,312,000 | | | | 1,312,210 | |
| | | | | | |
| Portfolio of investments—June 30, 2016 | | Wells Fargo Ultra Short-Term Municipal Income Fund | | | 13 | |
| | | | | | | | | | | | | | | | |
| Security name | | Interest rate | | | Maturity date | | | Principal | | | Value | |
| | | | |
| Mississippi (continued) | | | | | | | | | | | | | | | | |
Mississippi Business Finance Corporation Gulf Power Company Project (Industrial Development Revenue) ± | | | 0.44 | % | | | 11-1-2042 | | | $ | 7,100,000 | | | $ | 7,100,000 | |
Mississippi Business Finance Corporation Mississippi Power Company Project (Industrial Development Revenue) ± | | | 0.50 | | | | 12-1-2027 | | | | 9,400,000 | | | | 9,400,000 | |
Mississippi Business Finance Corporation Waste Management Incorporated Project (Resource Recovery Revenue) ± | | | 1.38 | | | | 3-1-2027 | | | | 800,000 | | | | 802,568 | |
Mississippi Development Bank Magnolia Regional Health Center Series 2011A (Health Revenue) | | | 5.00 | | | | 10-1-2016 | | | | 535,000 | | | | 539,938 | |
Mississippi Development Bank Magnolia Regional Health Center Series 2011A (Health Revenue) | | | 5.50 | | | | 10-1-2017 | | | | 565,000 | | | | 591,521 | |
Mississippi Development Bank Magnolia Regional Health Center Series 2011A (Health Revenue) | | | 5.50 | | | | 10-1-2018 | | | | 595,000 | | | | 643,368 | |
Mississippi Development Bank Special Obligation Refunding Biloxi Mississippi Project Series A (Miscellaneous Revenue, Ambac Insured) | | | 4.50 | | | | 11-1-2018 | | | | 1,810,000 | | | | 1,833,983 | |
Mississippi Hospital Equipment & Facilities Authority Baptist Memorial Health Series B2 (Health Revenue) ±144A | | | 0.75 | | | | 9-1-2022 | | | | 8,500,000 | | | | 8,500,000 | |
Mississippi Hospital Equipment & Facilities Authority Mississippi Baptist Health System Incorporated Series A (Health Revenue) | | | 5.00 | | | | 8-15-2018 | | | | 4,110,000 | | | | 4,292,073 | |
Perry County MS PCR Leaf River Forest Products Incorporated Project (Industrial Development Revenue, Georgia-Pacific LLC LOC) ø144A | | | 0.60 | | | | 2-1-2022 | | | | 4,000,000 | | | | 4,000,000 | |
| | | | |
| | | | | | | | | | | | | | | 39,015,661 | |
| | | | | | | | | | | | | | | | |
| | | | |
| Missouri: 0.71% | | | | | | | | | | | | | | | | |
Missouri HEFA Saint Louis University Series B-1 (Education Revenue, Barclays Bank plc LOC) ø | | | 0.33 | | | | 10-1-2035 | | | | 6,140,000 | | | | 6,140,000 | |
Springfield MO Public Utility Refunding (Utilities Revenue) | | | 5.00 | | | | 8-1-2016 | | | | 6,660,000 | | | | 6,686,307 | |
Springfield MO Public Utility Refunding (Utilities Revenue) | | | 5.00 | | | | 8-1-2017 | | | | 14,835,000 | | | | 15,551,827 | |
St. Louis MO Series 004 (Airport Revenue, Dexia Credit Local LOC, AGM Insured, Dexia Credit Local LIQ) ø144A | | | 0.59 | | | | 7-1-2026 | | | | 11,030,000 | | | | 11,030,000 | |
| | | | |
| | | | | | | | | | | | | | | 39,408,134 | |
| | | | | | | | | | | | | | | | |
| | | | |
| Nebraska: 0.20% | | | | | | | | | | | | | | | | |
Hall County NE Airport Authority BAN Series A (GO Revenue) | | | 1.50 | | | | 8-15-2016 | | | | 3,745,000 | | | | 3,744,850 | |
Tender Option Bond Trust Receipts for Nebraska Series XM0184 (Airport Revenue, AGC Insured, Bank of America NA LIQ) ø144A | | | 0.76 | | | | 10-1-2033 | | | | 7,500,000 | | | | 7,500,000 | |
| | | | |
| | | | | | | | | | | | | | | 11,244,850 | |
| | | | | | | | | | | | | | | | |
| | | | |
| Nevada: 0.02% | | | | | | | | | | | | | | | | |
Clark County NV School District (GO Revenue) | | | 5.00 | | | | 6-15-2018 | | | | 1,000,000 | | | | 1,062,780 | |
| | | | | | | | | | | | | | | | |
| | | | |
| New Jersey: 6.60% | | | | | | | | | | | | | | | | |
Atlantic County NJ BAN (GO Revenue) | | | 2.00 | | | | 6-22-2017 | | | | 19,566,000 | | | | 19,782,596 | |
Beach Haven NJ BAN (GO Revenue) | | | 2.00 | | | | 5-12-2017 | | | | 5,085,000 | | | | 5,125,985 | |
Burlington County NJ Governmental Leasing Program Series A (Miscellaneous Revenue) | | | 2.00 | | | | 4-26-2017 | | | | 3,130,000 | | | | 3,161,331 | |
Burlington County NJ Governmental Leasing Program Series B (Miscellaneous Revenue) | | | 2.00 | | | | 4-26-2017 | | | | 10,370,000 | | | | 10,473,804 | |
Clinton NJ BAN (GO Revenue) | | | 1.50 | | | | 1-25-2017 | | | | 2,909,000 | | | | 2,917,960 | |
East Brunswick NJ BAN (GO Revenue) | | | 2.00 | | | | 3-17-2017 | | | | 15,000,000 | | | | 15,132,000 | |
East Orange NJ Capital Improvement Series A (GO Revenue, AGM Insured) | | | 3.00 | | | | 6-1-2017 | | | | 1,420,000 | | | | 1,446,156 | |
East Orange NJ Capital Improvement Series A (GO Revenue, AGM Insured) | | | 4.00 | | | | 6-1-2018 | | | | 650,000 | | | | 686,296 | |
| | | | |
| 14 | | Wells Fargo Ultra Short-Term Municipal Income Fund | | Portfolio of investments—June 30, 2016 |
| | | | | | | | | | | | | | | | |
| Security name | | Interest rate | | | Maturity date | | | Principal | | | Value | |
| | | | |
| New Jersey (continued) | | | | | | | | | | | | | | | | |
Essex County NJ BAN (GO Revenue) | | | 2.00 | % | | | 12-14-2016 | | | $ | 1,090,480 | | | $ | 1,094,547 | |
Franklin NJ BAN Series A (GO Revenue) | | | 2.00 | | | | 4-12-2017 | | | | 5,226,250 | | | | 5,267,851 | |
Glassboro NJ School District Refunding (GO Revenue, National Insured) | | | 4.00 | | | | 8-15-2017 | | | | 1,355,000 | | | | 1,360,406 | |
Hackensack NJ (GO Revenue) | | | 1.50 | | | | 11-9-2016 | | | | 14,000,000 | | | | 14,040,040 | |
Hammonton NJ BAN (GO Revenue) | | | 1.75 | | | | 11-29-2016 | | | | 2,741,851 | | | | 2,753,668 | |
Hawthorne NJ BAN (GO Revenue) | | | 2.00 | | | | 10-28-2016 | | | | 7,526,600 | | | | 7,557,309 | |
Hightstown NJ BAN (GO Revenue) | | | 2.00 | | | | 2-1-2017 | | | | 3,809,000 | | | | 3,832,806 | |
Linden NJ BAN (GO Revenue) | | | 2.00 | | | | 4-11-2017 | | | | 4,339,208 | | | | 4,374,312 | |
Maple Shade NJ BAN (GO Revenue) | | | 2.00 | | | | 6-29-2017 | | | | 8,572,449 | | | | 8,634,942 | |
New Jersey Building Authority Series A (Miscellaneous Revenue) | | | 4.00 | | | | 6-15-2017 | | | | 1,065,000 | | | | 1,094,437 | |
New Jersey Building Authority Series A (Miscellaneous Revenue) | | | 5.00 | | | | 6-15-2017 | | | | 5,595,000 | | | | 5,802,854 | |
New Jersey Building Authority Series A (Miscellaneous Revenue) | | | 5.00 | | | | 6-15-2019 | | | | 1,100,000 | | | | 1,190,904 | |
New Jersey Certificate of Participation Equipment Lease Purchase Series A (Miscellaneous Revenue) | | | 5.00 | | | | 6-15-2017 | | | | 1,000,000 | | | | 1,037,450 | |
New Jersey EDA Prerefunded School Facilities Construction Series DD1 (Miscellaneous Revenue) | | | 5.00 | | | | 12-15-2016 | | | | 765,000 | | | | 779,130 | |
New Jersey EDA Refunded School Facilities Construction Series DD1 (Miscellaneous Revenue) | | | 5.00 | | | | 12-15-2017 | | | | 7,785,000 | | | | 8,270,161 | |
New Jersey EDA Refunding Transportation Project Sublease Series A (Transportation Revenue) | | | 5.00 | | | | 5-1-2018 | | | | 5,170,000 | | | | 5,473,841 | |
New Jersey EDA School Facilities Construction Notes Series DD1 (Miscellaneous Revenue) | | | 5.00 | | | | 12-15-2018 | | | | 2,220,000 | | | | 2,386,100 | |
New Jersey EDA School Facilities Construction Notes Series K (Miscellaneous Revenue) ± | | | 1.12 | | | | 2-1-2017 | | | | 9,800,000 | | | | 9,777,166 | |
New Jersey EDA School Facilities Construction Series C (Miscellaneous Revenue) ± | | | 2.21 | | | | 2-1-2018 | | | | 2,000,000 | | | | 1,991,640 | |
New Jersey EDA School Facilities Construction Series PP (Miscellaneous Revenue) | | | 5.00 | | | | 6-15-2019 | | | | 12,710,000 | | | | 13,779,419 | |
New Jersey EDA School Facilities Construction Series XX (Miscellaneous Revenue) | | | 5.00 | | | | 6-15-2019 | | | | 15,000,000 | | | | 16,262,100 | |
New Jersey EDA Transportation Project Series A (Transportation Revenue) | | | 5.00 | | | | 5-1-2017 | | | | 11,175,000 | | | | 11,542,322 | |
New Jersey EDA Unrefunded School Facilities Construction Series DD1 (Miscellaneous Revenue) | | | 5.00 | | | | 12-15-2016 | | | | 1,245,000 | | | | 1,270,286 | |
New Jersey EDA Unrefunded School Facilities Construction Series DD1 (Miscellaneous Revenue) | | | 5.00 | | | | 12-15-2017 | | | | 315,000 | | | | 331,191 | |
New Jersey HEFAR Student Loan Assistance Series 1 (Education Revenue) | | | 5.00 | | | | 12-1-2017 | | | | 600,000 | | | | 630,900 | |
New Jersey HFA NCC Manor Project Series 2015K (Housing Revenue) ± | | | 1.05 | | | | 2-1-2018 | | | | 20,500,000 | | | | 20,512,095 | |
New Jersey HFA Prospect Park Apartments Project Series 2015R (Housing Revenue) ± | | | 0.88 | | | | 10-1-2017 | | | | 8,145,000 | | | | 8,147,851 | |
New Jersey Higher Education Assistance Authority Senior Series 1A (Education Revenue) | | | 5.00 | | | | 12-1-2017 | | | | 1,740,000 | | | | 1,832,220 | |
New Jersey Higher Education Student Assistance Authority Series 1 (Education Revenue) | | | 5.00 | | | | 12-1-2016 | | | | 2,950,000 | | | | 2,999,678 | |
New Jersey Higher Education Student Assistance Authority Series 1A (Education Revenue) | | | 5.00 | | | | 12-1-2017 | | | | 2,000,000 | | | | 2,105,120 | |
New Jersey Housing and Mortgage Finance Agency Oakwood Towers Project Series U (Housing Revenue) ± | | | 0.80 | | | | 11-1-2017 | | | | 3,000,000 | | | | 2,996,100 | |
New Jersey Housing and Mortgage Finance Agency Series B (Housing Revenue) | | | 0.55 | | | | 11-1-2016 | | | | 3,135,000 | | | | 3,134,373 | |
New Jersey Housing and Mortgage Finance Agency Series B (Housing Revenue) | | | 1.05 | | | | 5-1-2018 | | | | 2,000,000 | | | | 2,001,200 | |
New Jersey Housing and Mortgage Finance Agency Series F (Housing Revenue) ± | | | 0.95 | | | | 3-1-2018 | | | | 8,450,000 | | | | 8,454,310 | |
New Jersey Housing and Mortgage Finance Agency Trent Center West Senior Apartments Project Series FF (Housing Revenue) | | | 1.10 | | | | 12-1-2017 | | | | 6,000,000 | | | | 6,004,620 | |
New Jersey Transportation Program Series B (Miscellaneous Revenue, National Insured) | | | 5.50 | | | | 12-15-2016 | | | | 4,625,000 | | | | 4,725,871 | |
New Jersey Transportation Trust Fund Series A (Miscellaneous Revenue) | | | 5.00 | | | | 12-15-2016 | | | | 8,845,000 | | | | 9,008,721 | |
| | | | | | |
| Portfolio of investments—June 30, 2016 | | Wells Fargo Ultra Short-Term Municipal Income Fund | | | 15 | |
| | | | | | | | | | | | | | | | |
| Security name | | Interest rate | | | Maturity date | | | Principal | | | Value | |
| | | | |
| New Jersey (continued) | | | | | | | | | | | | | | | | |
New Jersey Transportation Trust Fund Series A (Miscellaneous Revenue) | | | 5.00 | % | | | 12-15-2019 | | | $ | 4,405,000 | | | $ | 4,817,528 | |
New Jersey Transportation Trust Fund Series A (Miscellaneous Revenue, Ambac Insured) | | | 5.75 | | | | 6-15-2017 | | | | 1,700,000 | | | | 1,775,786 | |
New Jersey Transportation Trust Fund Series AA (Miscellaneous Revenue) | | | 5.00 | | | | 6-15-2017 | | | | 695,000 | | | | 721,028 | |
New Jersey Transportation Trust Fund Series AA (Miscellaneous Revenue) | | | 5.00 | | | | 6-15-2020 | | | | 1,600,000 | | | | 1,762,352 | |
New Jersey Transportation Trust Fund Series B (Miscellaneous Revenue) | | | 5.00 | | | | 6-15-2017 | | | | 3,135,000 | | | | 3,252,406 | |
New Jersey Transportation Trust Fund Series B (Miscellaneous Revenue, National Insured) | | | 5.50 | | | | 12-15-2017 | | | | 2,505,000 | | | | 2,658,156 | |
New Jersey Transportation Trust Fund Series B-1 (Transportation Revenue) | | | 5.00 | | | | 12-15-2017 | | | | 2,125,000 | | | | 2,237,965 | |
New Jersey Transportation Trust Fund Series B-2 (Transportation Revenue, Syncora Guarantee Incorporated Insured) | | | 5.00 | | | | 12-15-2016 | | | | 14,515,000 | | | | 14,783,673 | |
New Jersey TTFA Series DC8033 (Transportation Revenue, Dexia Credit Local LOC, AGM Insured, Dexia Credit Local LIQ) ø144A | | | 0.59 | | | | 12-15-2022 | | | | 12,305,000 | | | | 12,305,000 | |
New Jersey Turnpike Authority Series C (Transportation Revenue) ± | | | 0.89 | | | | 1-1-2017 | | | | 13,000,000 | | | | 13,002,730 | |
Newark NJ Refunding General Improvement Series A (GO Revenue) | | | 4.00 | | | | 10-1-2016 | | | | 3,710,000 | | | | 3,732,557 | |
Newark NJ TAN Series A (GO Revenue) | | | 2.50 | | | | 2-15-2017 | | | | 4,500,000 | | | | 4,525,695 | |
Sussex County NJ Municipal Utilities Authority BAN (Water & Sewer Revenue) | | | 2.00 | | | | 12-1-2016 | | | | 6,000,000 | | | | 6,033,240 | |
Tender Option Bond Trust Receipts Floaters Series 2016-XG0047 (Health Revenue, AGC Insured, Deutsche Bank LIQ) ø144A | | | 0.40 | | | | 7-1-2038 | | | | 21,805,285 | | | | 21,805,285 | |
Union County NJ BAN (GO Revenue) | | | 1.25 | | | | 3-3-2017 | | | | 6,979,670 | | | | 6,991,954 | |
Union County NJ BAN (GO Revenue) | | | 1.50 | | | | 3-22-2017 | | | | 3,526,000 | | | | 3,539,469 | |
| | | | |
| | | | | | | | | | | | | | | 365,128,893 | |
| | | | | | | | | | | | | | | | |
| | | | |
| New Mexico: 0.73% | | | | | | | | | | | | | | | | |
New Mexico Municipal Energy Acquisition Authority Gas Supply Sub Series B (Utilities Revenue, Royal Bank of Canada SPA) ± | | | 1.06 | | | | 11-1-2039 | | | | 40,685,000 | | | | 40,368,878 | |
| | | | | | | | | | | | | | | | |
| | | | |
| New York: 13.29% | | | | | | | | | | | | | | | | |
Babylon NY IDA Covanta Babylon Series A (Industrial Development Revenue) | | | 5.00 | | | | 1-1-2018 | | | | 2,500,000 | | | | 2,651,500 | |
Binghamton NY City School District TAN (GO Revenue) | | | 1.50 | | | | 1-31-2017 | | | | 3,000,000 | | | | 3,010,770 | |
Broome County NY BAN (GO Revenue) | | | 2.00 | | | | 5-5-2017 | | | | 19,620,000 | | | | 19,824,833 | |
Chautauqua County NY Ripley Central School District BAN Series A (GO Revenue) | | | 2.00 | | | | 11-22-2016 | | | | 1,605,500 | | | | 1,612,885 | |
Cicero NY BAN (GO Revenue) | | | 2.00 | | | | 3-31-2017 | | | | 3,660,549 | | | | 3,685,075 | |
Cold Spring NY BAN (GO Revenue) | | | 2.00 | | | | 5-12-2017 | | | | 3,040,000 | | | | 3,064,715 | |
Concord NY BAN (GO Revenue) | | | 2.00 | | | | 2-23-2017 | | | | 2,664,000 | | | | 2,679,105 | |
Cortland NY Cincinnatus Central School District BAN (GO Revenue) | | | 1.50 | | | | 8-19-2016 | | | | 2,500,000 | | | | 2,502,700 | |
Franklin County NY Salmon River Central School District BAN (GO Revenue) | | | 1.50 | | | | 7-22-2016 | | | | 2,000,000 | | | | 2,000,780 | |
Freeport NY BAN Series C (GO Revenue) | | | 2.00 | | | | 5-3-2017 | | | | 11,360,000 | | | | 11,468,261 | |
Fulton NY City School District BAN (GO Revenue) | | | 2.00 | | | | 6-29-2017 | | | | 12,575,000 | | | | 12,719,361 | |
Hamburg NY BAN (GO Revenue) %% | | | 2.00 | | | | 7-6-2017 | | | | 6,580,000 | | | | 6,664,882 | |
Hancock NY Central School District BAN (GO Revenue) %% | | | 2.00 | | | | 7-6-2017 | | | | 4,950,000 | | | | 5,003,411 | |
Hempstead NY Budget Notes (GO Revenue) | | | 2.00 | | | | 12-16-2016 | | | | 13,400,000 | | | | 13,467,670 | |
Long Beach NY BAN (GO Revenue) | | | 1.50 | | | | 2-16-2017 | | | | 3,575,000 | | | | 3,585,618 | |
Long Island NY Power Authority Electric System Series C (Utilities Revenue) ± | | | 1.20 | | | | 5-1-2033 | | | | 10,000,000 | | | | 9,981,100 | |
Metropolitan Transportation Authority New York BAN Series B-1 (Transportation Revenue) | | | 0.25 | | | | 8-1-2016 | | | | 2,000,000 | | | | 1,999,320 | |
Metropolitan Transportation Authority New York Refunding Series 2008A-2A (Tax Revenue) ± | | | 0.79 | | | | 11-1-2026 | | | | 6,905,000 | | | | 6,878,899 | |
Metropolitan Transportation Authority New York Refunding Sub Series B-3A (Tax Revenue) ± | | | 0.78 | | | | 11-1-2028 | | | | 3,000,000 | | | | 2,965,260 | |
| | | | |
| 16 | | Wells Fargo Ultra Short-Term Municipal Income Fund | | Portfolio of investments—June 30, 2016 |
| | | | | | | | | | | | | | | | |
| Security name | | Interest rate | | | Maturity date | | | Principal | | | Value | |
| | | | |
| New York (continued) | | | | | | | | | | | | | | | | |
Metropolitan Transportation Authority New York Series A3 (Transportation Revenue) ± | | | 0.91 | % | | | 11-15-2042 | | | $ | 10,000,000 | | | $ | 9,897,500 | |
Metropolitan Transportation Authority New York Series D-2 (Transportation Revenue) ± | | | 0.75 | | | | 11-15-2044 | | | | 6,100,000 | | | | 6,090,545 | |
Metropolitan Transportation Authority New York Sub Series 3-3B (Tax Revenue) ± | | | 0.75 | | | | 11-1-2030 | | | | 42,470,000 | | | | 42,423,283 | |
Metropolitan Transportation Authority New York Sub Series D-2A (Transportation Revenue, AGM Insured) ± | | | 0.79 | | | | 11-1-2032 | | | | 36,650,000 | | | | 36,590,627 | |
Nassau County NY TAN Series A (GO Revenue) | | | 2.00 | | | | 9-15-2016 | | | | 30,185,000 | | | | 30,268,311 | |
Nassau NY Health Care Corporation Series D-1 (Health Revenue, JPMorgan Chase & Company LOC) ø | | | 0.42 | | | | 8-1-2029 | | | | 12,380,000 | | | | 12,380,000 | |
New York Akron Central School District BAN (GO Revenue) %% | | | 2.00 | | | | 6-22-2017 | | | | 6,423,907 | | | | 6,507,354 | |
New York Energy R&D Authority PCR Keyspan Generation Series A (Industrial Development Revenue, Ambac Insured) ±(m) | | | 0.25 | | | | 10-1-2028 | | | | 2,100,000 | | | | 2,100,000 | |
New York Energy R&D Authority Rochester Gas and Electric Company Project Series A (Resource Recovery Revenue, National Insured) ± | | | 4.75 | | | | 5-15-2032 | | | | 1,650,000 | | | | 1,650,198 | |
New York Energy R&D Authority Rochester Gas and Electric Company Project Series C (Industrial Development Revenue, National Insured) ± | | | 5.00 | | | | 8-1-2032 | | | | 4,250,000 | | | | 4,264,195 | |
New York Environmental Facilities Corporation Waste Management Incorporated Project Series A (Resource Recovery Revenue) | | | 2.75 | | | | 7-1-2017 | | | | 1,650,000 | | | | 1,682,736 | |
New York Local Government Assistance Corporation Refinance Sub Lien Series A-10V (Tax Revenue, AGM Insured) ±(m)(n) | | | 0.45 | | | | 4-1-2017 | | | | 6,400,000 | | | | 6,384,000 | |
New York Local Government Refunding Series C (Tax Revenue) | | | 5.50 | | | | 4-1-2017 | | | | 1,420,000 | | | | 1,465,596 | |
New York Nassau Health Care Corporation RAN (Health Revenue) | | | 2.00 | | | | 1-17-2017 | | | | 8,000,000 | | | | 8,034,560 | |
New York NY Adjusted Fiscal 2008 Sub Series A-3 (GO Revenue, AGM Insured) ±(m) | | | 0.55 | | | | 8-1-2026 | | | | 1,300,000 | | | | 1,300,000 | |
New York NY Adjusted Fiscal 2008 Sub Series C4 (GO Revenue, AGC Insured) ±(m) | | | 0.55 | | | | 10-1-2027 | | | | 53,500,000 | | | | 53,500,000 | |
New York NY Adjusted Fiscal 2008 Sub Series J7 (GO Revenue) ± | | | 0.88 | | | | 8-1-2021 | | | | 8,325,000 | | | | 8,325,333 | |
New York NY Adjusted Fiscal 2015 Sub Series F-4 (GO Revenue, Bank of Tokyo-Mitsubishi LOC) ± | | | 0.42 | | | | 6-1-2044 | | | | 8,500,000 | | | | 8,500,000 | |
New York NY Housing Development Corporation Series E-1A (Housing Revenue) | | | 0.75 | | | | 11-1-2016 | | | | 1,705,000 | | | | 1,705,136 | |
New York NY Series A-6 (GO Revenue) ± | | | 0.91 | | | | 8-1-2031 | | | | 39,950,000 | | | | 39,878,490 | |
New York NY Series J Sub Series J-2 (GO Revenue, AGM Insured) ±(m) | | | 0.55 | | | | 6-1-2036 | | | | 17,800,000 | | | | 17,800,000 | |
New York NY Series J Sub Series J-3 (GO Revenue, AGM Insured) ±(m) | | | 0.50 | | | | 6-1-2036 | | | | 25,275,000 | | | | 25,275,000 | |
New York NY Series J-4 (GO Revenue) ± | | | 0.96 | | | | 8-1-2025 | | | | 10,865,000 | | | | 10,865,326 | |
New York NY Series J-9 (GO Revenue) ± | | | 0.79 | | | | 8-1-2027 | | | | 38,000,000 | | | | 37,968,840 | |
New York NY Sub Series C-4 (GO Revenue, AGM Insured) ±(m) | | | 0.15 | | | | 1-1-2032 | | | | 1,025,000 | | | | 1,025,000 | |
New York NY Transitional Finance Authority Future Tax Secured Bonds Fiscal 2007 Series A (Tax Revenue, Dexia Credit Local SPA) ø | | | 0.55 | | | | 8-1-2022 | | | | 1,200,000 | | | | 1,200,000 | |
New York NY Transitional Finance Authority NYC Recovery Series 3 (Tax Revenue, Dexia Credit Local SPA) ø | | | 0.64 | | | | 11-1-2022 | | | | 23,375,000 | | | | 23,375,000 | |
New York Transportation Development Corporation American Airlines Incorporated John F. Kennedy International Airport Project (Airport Revenue) | | | 5.00 | | | | 8-1-2017 | | | | 12,500,000 | | | | 12,947,375 | |
New York Transportation Development Corporation American Airlines Incorporated John F. Kennedy International Airport Project (Airport Revenue) | | | 5.00 | | | | 8-1-2018 | | | | 10,000,000 | | | | 10,628,800 | |
New York Urban Development Corporation Certificate of Participation James A Farley Post Office Project (Miscellaneous Revenue) 144A | | | 4.20 | | | | 2-1-2017 | | | | 37,360,000 | | | | 37,374,944 | |
Norwood NY Central School District BAN (GO Revenue) | | | 2.00 | | | | 8-5-2016 | | | | 2,000,000 | | | | 2,002,040 | |
Orange County NY Board of Cooperative Educational Services RAN (Miscellaneous Revenue) | | | 1.50 | | | | 7-28-2016 | | | | 11,000,000 | | | | 11,005,060 | |
Oyster Bay NY BAN Series A (GO Revenue) | | | 2.75 | | | | 2-3-2017 | | | | 11,000,000 | | | | 11,055,770 | |
Oyster Bay NY Public Improvement (GO Revenue) | | | 3.00 | | | | 8-15-2017 | | | | 780,000 | | | | 784,508 | |
Rome NY BAN (GO Revenue) | | | 1.25 | | | | 9-30-2016 | | | | 14,100,000 | | | | 14,108,601 | |
Rome NY BAN (GO Revenue) | | | 1.38 | | | | 9-30-2016 | | | | 2,250,000 | | | | 2,251,710 | |
| | | | | | |
| Portfolio of investments—June 30, 2016 | | Wells Fargo Ultra Short-Term Municipal Income Fund | | | 17 | |
| | | | | | | | | | | | | | | | |
| Security name | | Interest rate | | | Maturity date | | | Principal | | | Value | |
| | | | |
| New York (continued) | | | | | | | | | | | | | | | | |
Sackets Harbor NY BAN (GO Revenue) | | | 2.00 | % | | | 6-16-2017 | | | $ | 2,750,000 | | | $ | 2,776,565 | |
Saltaire NY RAN (GO Revenue) | | | 2.00 | | | | 10-21-2016 | | | | 5,000,000 | | | | 5,018,800 | |
Sleepy Hollow NY BAN Series B (GO Revenue) | | | 1.25 | | | | 11-23-2016 | | | | 5,315,000 | | | | 5,318,242 | |
Steuben County NY BAN (GO Revenue) | | | 1.38 | | | | 8-26-2016 | | | | 3,750,000 | | | | 3,751,875 | |
Suffolk County NY Public Improvement Serial Bonds Series B (GO Revenue) | | | 2.00 | | | | 10-15-2016 | | | | 1,000,000 | | | | 1,003,530 | |
Suffolk County NY Public Improvement Serial Bonds Series B (GO Revenue, Build America Mutual Assurance Company Insured) | | | 2.00 | | | | 10-15-2019 | | | | 880,000 | | | | 909,198 | |
Suffolk County NY TAN (GO Revenue) | | | 2.00 | | | | 7-27-2016 | | | | 29,800,000 | | | | 29,829,204 | |
Suffolk County NY TAN Series I (GO Revenue) | | | 1.50 | | | | 9-30-2016 | | | | 4,120,000 | | | | 4,129,394 | |
Suffolk County NY TAN Series I (GO Revenue) | | | 2.00 | | | | 9-30-2016 | | | | 23,000,000 | | | | 23,071,760 | |
Triborough Bridge & Tunnel Authority New York Refunding Bond General Sub Series B-4 (Transportation Revenue) ± | | | 0.83 | | | | 1-1-2029 | | | | 4,500,000 | | | | 4,499,280 | |
Ulster County NY BAN (GO Revenue) | | | 2.00 | | | | 7-28-2016 | | | | 3,325,036 | | | | 3,327,995 | |
Utica NY School District (GO Revenue) | | | 2.00 | | | | 7-22-2016 | | | | 1,000,000 | | | | 1,000,440 | |
Utica NY School District (GO Revenue) | | | 3.00 | | | | 7-1-2016 | | | | 960,000 | | | | 960,048 | |
Utica NY School District (GO Revenue) | | | 3.00 | | | | 7-1-2017 | | | | 1,320,000 | | | | 1,341,622 | |
Vestal NY BAN (GO Revenue) | | | 2.00 | | | | 5-12-2017 | | | | 4,350,000 | | | | 4,388,367 | |
Watertown NY BAN (GO Revenue) | | | 2.00 | | | | 4-20-2017 | | | | 5,850,000 | | | | 5,885,627 | |
Westchester County NY Hudson Project (Health Revenue) | | | 3.00 | | | | 1-1-2017 | | | | 500,000 | | | | 504,395 | |
Yonkers NY Series A (GO Revenue) | | | 4.00 | | | | 7-1-2016 | | | | 2,835,000 | | | | 2,835,284 | |
Yonkers NY Series B (GO Revenue) | | | 3.00 | | | | 7-1-2016 | | | | 1,290,000 | | | | 1,290,090 | |
Yonkers NY Series C (GO Revenue) | | | 4.00 | | | | 8-15-2016 | | | | 2,085,000 | | | | 2,093,986 | |
Yonkers NY Series D (GO Revenue) | | | 2.00 | | | | 8-1-2016 | | | | 3,325,000 | | | | 3,329,223 | |
Yonkers NY Series D (GO Revenue) | | | 3.00 | | | | 8-15-2016 | | | | 660,000 | | | | 662,059 | |
Yonkers NY Series D (GO Revenue) | | | 3.00 | | | | 8-1-2017 | | | | 2,045,000 | | | | 2,092,424 | |
Yonkers NY Series D (GO Revenue) | | | 4.00 | | | | 8-1-2018 | | | | 3,135,000 | | | | 3,328,868 | |
Yonkers NY Series E (GO Revenue) | | | 3.25 | | | | 9-1-2017 | | | | 790,000 | | | | 811,915 | |
Yonkers NY Series E (GO Revenue) | | | 4.00 | | | | 9-1-2018 | | | | 1,225,000 | | | | 1,304,931 | |
Yonkers NY Series F (GO Revenue) | | | 2.00 | | | | 9-1-2017 | | | | 345,000 | | | | 349,564 | |
Yonkers NY Series F (GO Revenue) | | | 3.00 | | | | 9-1-2018 | | | | 350,000 | | | | 365,754 | |
| | | | |
| | | | | | | | | | | | | | | 734,562,423 | |
| | | | | | | | | | | | | | | | |
| | | | |
| North Carolina: 0.77% | | | | | | | | | | | | | | | | |
Ashville NC Housing Authority Spruce Hill Apartments (Housing Revenue) ± | | | 0.95 | | | | 8-1-2019 | | | | 10,000,000 | | | | 9,997,100 | |
Charlotte NC Housing Authority MFHR Boulevard Phase III Project (Housing Revenue) ± | | | 0.75 | | | | 8-1-2017 | | | | 10,500,000 | | | | 10,501,365 | |
Greensboro NC Housing Authority Claremont Courts Project (Housing Revenue) ± | | | 0.95 | | | | 11-1-2017 | | | | 4,800,000 | | | | 4,801,008 | |
Hertford County NC IDA Nucor Corporation Project (Industrial Development Revenue) ± | | | 0.73 | | | | 11-1-2033 | | | | 5,000,000 | | | | 5,000,000 | |
North Carolina Capital Finance Republic Services Incorporated Project Series 2013 (Resource Recovery Revenue) ± | | | 0.80 | | | | 6-1-2038 | | | | 12,000,000 | | | | 12,000,000 | |
| | | | |
| | | | | | | | | | | | | | | 42,299,473 | |
| | | | | | | | | | | | | | | | |
| | | | |
| North Dakota: 0.30% | | | | | | | | | | | | | | | | |
Burleigh County ND (Tax Revenue, AGM Insured) | | | 5.00 | | | | 11-1-2016 | | | | 600,000 | | | | 608,598 | |
Dickinson ND Series A (Tax Revenue) | | | 3.00 | | | | 10-1-2017 | | | | 1,100,000 | | | | 1,128,699 | |
Hazen ND Sakakawea Medical Center Project BAN (Health Revenue) | | | 2.50 | | | | 7-1-2017 | | | | 3,000,000 | | | | 3,006,270 | |
North Dakota HFA Meadowlark Heights Apartments Project (Housing Revenue) | | | 0.40 | | | | 9-1-2016 | | | | 8,000,000 | | | | 7,997,920 | |
Williston ND Series A (Tax Revenue, AGM Insured) | | | 3.00 | | | | 5-1-2017 | | | | 3,875,000 | | | | 3,911,658 | |
| | | | |
| | | | | | | | | | | | | | | 16,653,145 | |
| | | | | | | | | | | | | | | | |
| | | | |
| 18 | | Wells Fargo Ultra Short-Term Municipal Income Fund | | Portfolio of investments—June 30, 2016 |
| | | | | | | | | | | | | | | | |
| Security name | | Interest rate | | | Maturity date | | | Principal | | | Value | |
| | | | |
| Ohio: 3.41% | | | | | | | | | | | | | | | | |
Cleveland OH Airport System Series A (Airport Revenue, Ambac Insured) | | | 5.25 | % | | | 1-1-2017 | | | $ | 2,315,000 | | | $ | 2,363,870 | |
Cleveland OH Airport System Series C (Airport Revenue, AGC Insured) | | | 5.00 | | | | 1-1-2017 | | | | 2,895,000 | | | | 2,956,490 | |
Crawford County OH Avita Health System Obligated Group Project (Health Revenue) | | | 1.43 | | | | 11-1-2017 | | | | 15,000,000 | | | | 15,053,100 | |
Cuyahoga OH Metropolitan Housing Authority Bohn Tower Apartments Project (Housing Revenue) | | | 0.70 | | | | 3-1-2017 | | | | 12,700,000 | | | | 12,701,143 | |
Franklin County OH Hospital Facilities Series B (Health Revenue, Barclays Bank plc SPA) ø | | | 0.42 | | | | 11-15-2041 | | | | 30,000,000 | | | | 30,000,000 | |
Franklin County OH Poindexter Phase IIA Project (Housing Revenue) ± | | | 1.10 | | | | 12-1-2018 | | | | 3,000,000 | | | | 3,004,140 | |
Lancaster OH Port Authority (Utilities Revenue) ± | | | 0.71 | | | | 2-1-2017 | | | | 3,895,000 | | | | 3,893,598 | |
Lancaster OH Port Authority (Utilities Revenue) ± | | | 0.76 | | | | 8-1-2017 | | | | 3,240,000 | | | | 3,240,227 | |
Lancaster OH Port Authority (Utilities Revenue) ± | | | 0.81 | | | | 2-1-2018 | | | | 7,225,000 | | | | 7,210,333 | |
Lancaster OH Port Authority (Utilities Revenue) ± | | | 0.86 | | | | 8-1-2018 | | | | 4,000,000 | | | | 3,993,840 | |
Marietta OH BAN (GO Revenue) | | | 1.50 | | | | 5-12-2017 | | | | 3,475,000 | | | | 3,491,750 | |
Medina County OH Manor Apartments Project (Housing Revenue) ± | | | 1.00 | | | | 12-1-2017 | | | | 3,000,000 | | | | 3,003,270 | |
Ohio Air Quality Development Authority AMT Refunding Bond Pollution Control 1st Energy Series C (Industrial Development Revenue) ± | | | 3.95 | | | | 11-1-2032 | | | | 450,000 | | | | 460,607 | |
Ohio Air Quality Development Authority FirstEnergy Generation Series 2009-A (Utilities Revenue) | | | 5.70 | | | | 8-1-2020 | | | | 16,790,000 | | | | 18,561,513 | |
Ohio American Municipal Power Incorporated BAN (Utilities Revenue) | | | 1.00 | | | | 10-21-2016 | | | | 4,500,000 | | | | 4,502,520 | |
Ohio HFA Coopermill Manor Project (Housing Revenue) | | | 0.85 | | | | 8-1-2017 | | | | 15,850,000 | | | | 15,849,049 | |
Ohio HFA MFHR Walnut Court Senior Apartments (Housing Revenue) | | | 0.50 | | | | 8-1-2016 | | | | 3,900,000 | | | | 3,899,844 | |
Ohio Higher Educational Facility John Carroll University Project (Education Revenue) ± | | | 2.25 | | | | 9-1-2033 | | | | 1,790,000 | | | | 1,828,557 | |
Ohio Housing Finance Agency Northland Village Apartments Project (Housing Revenue) ± | | | 1.00 | | | | 5-1-2019 | | | | 14,000,000 | | | | 14,006,020 | |
Ohio Major New State Infrastructure Project Series 3 (Miscellaneous Revenue) | | | 5.00 | | | | 12-15-2016 | | | | 1,960,000 | | | | 2,000,474 | |
Ohio University Hospital Health System Series B (Health Revenue) ø | | | 0.72 | | | | 1-15-2033 | | | | 12,720,000 | | | | 12,720,000 | |
Ohio University Hospital Health System Series B (Health Revenue) ø | | | 0.72 | | | | 1-15-2045 | | | | 13,000,000 | | | | 13,000,000 | |
Ohio Water Development Authority Waste Management Project (Resource Recovery Revenue) | | | 2.25 | | | | 7-1-2021 | | | | 1,250,000 | | | | 1,250,050 | |
Seven Hills OH BAN (GO Revenue) | | | 1.13 | | | | 7-7-2016 | | | | 2,020,000 | | | | 2,020,101 | |
Warren County OH Health Care Facilities Otterbein Homes Series A (Health Revenue) | | | 4.00 | | | | 7-1-2016 | | | | 1,760,000 | | | | 1,760,176 | |
Warren County OH Health Care Facilities Otterbein Homes Series A (Health Revenue) | | | 4.00 | | | | 7-1-2017 | | | | 4,375,000 | | | | 4,507,869 | |
Warrensville Heights OH BAN (GO Revenue) | | | 2.13 | | | | 8-11-2016 | | | | 1,220,000 | | | | 1,221,598 | |
| | | | |
| | | | | | | | | | | | | | | 188,500,139 | |
| | | | | | | | | | | | | | | | |
| | | | |
| Oklahoma: 0.37% | | | | | | | | | | | | | | | | |
Cleveland County OK Detention Facilities Project (Tax Revenue) | | | 3.00 | | | | 3-1-2018 | | | | 1,000,000 | | | | 1,033,980 | |
Cleveland County OK Detention Facilities Project (Tax Revenue) | | | 3.00 | | | | 3-1-2019 | | | | 1,505,000 | | | | 1,582,056 | |
Cleveland County OK Educational Facilities Moore Public Schools Project (Miscellaneous Revenue) | | | 5.00 | | | | 6-1-2017 | | | | 4,825,000 | | | | 5,009,798 | |
Comanche County OK Hospital Authority Refunding (Health Revenue) | | | 5.00 | | | | 7-1-2017 | | | | 2,855,000 | | | | 2,939,337 | |
Oklahoma Capitol Improvement Authority Higher Education Projects Series A (Miscellaneous Revenue) | | | 5.00 | | | | 7-1-2018 | | | | 2,225,000 | | | | 2,414,481 | |
Oklahoma County OK Independent School District #52 Series B (GO Revenue) | | | 2.00 | | | | 3-1-2017 | | | | 2,550,000 | | | | 2,572,670 | |
Oklahoma Housing Finance Agency Cherokee Terrace Apartments (Housing Revenue, GNMA Insured) ± | | | 0.70 | | | | 12-1-2017 | | | | 5,000,000 | | | | 4,998,700 | |
| | | | |
| | | | | | | | | | | | | | | 20,551,022 | |
| | | | | | | | | | | | | | | | |
| | | | | | |
| Portfolio of investments—June 30, 2016 | | Wells Fargo Ultra Short-Term Municipal Income Fund | | | 19 | |
| | | | | | | | | | | | | | | | |
| Security name | | Interest rate | | | Maturity date | | | Principal | | | Value | |
| | | | |
| Oregon: 0.63% | | | | | | | | | | | | | | | | |
Oregon Facilities Authority Peace Health Hospitals Series A (Health Revenue, U.S. Bank NA LOC) ø | | | 0.40 | % | | | 8-1-2034 | | | $ | 14,000,000 | | | $ | 14,000,000 | |
Oregon Facilities Authority Providence Health & Services Series C (Health Revenue) ± | | | 1.27 | | | | 10-1-2020 | | | | 14,650,000 | | | | 14,650,147 | |
Oregon Housing Development Holiday Garden Apartments Series 2015D (Housing Revenue) ± | | | 0.80 | | | | 8-1-2018 | | | | 6,400,000 | | | | 6,398,272 | |
| | | | |
| | | | | | | | | | | | | | | 35,048,419 | |
| | | | | | | | | | | | | | | | |
| | | | |
| Pennsylvania: 3.69% | | | | | | | | | | | | | | | | |
Allentown PA Hospital Authority Sacred Heart Hospital (Health Revenue) | | | 6.00 | | | | 11-15-2016 | | | | 115,000 | | | | 117,359 | |
Beaver County PA IDA FirstEnergy Generation Series A (Utilities Revenue) | | | 2.15 | | | | 3-1-2017 | | | | 3,300,000 | | | | 3,311,781 | |
Beaver County PA IDA FirstEnergy Generation Series A (Miscellaneous Revenue) ± | | | 2.20 | | | | 1-1-2035 | | | | 3,000,000 | | | | 3,000,060 | |
Beaver County PA IDA FirstEnergy Generation Series B (Utilities Revenue) ± | | | 2.50 | | | | 12-1-2041 | | | | 4,000,000 | | | | 4,036,360 | |
Beaver County PA IDA FirstEnergy Generation Series B (Industrial Development Revenue) ± | | | 3.50 | | | | 12-1-2035 | | | | 3,000,000 | | | | 3,056,130 | |
Bethlehem PA Area School District Authority (Miscellaneous Revenue) ± | | | 0.75 | | | | 1-1-2030 | | | | 8,115,000 | | | | 8,099,582 | |
Chester County PA IDA University Student Housing Project Series C-1 (Housing Revenue) | | | 0.65 | | | | 2-1-2017 | | | | 1,900,000 | | | | 1,899,696 | |
Clarion County PA IDA Clarion University Housing Project Series D (Housing Revenue) | | | 3.00 | | | | 7-1-2016 | | | | 435,000 | | | | 435,022 | |
Clarion County PA IDA Clarion University Housing Project Series D (Housing Revenue) | | | 3.00 | | | | 7-1-2017 | | | | 900,000 | | | | 913,113 | |
Greater Latrobe PA School District (Miscellaneous Revenue) | | | 3.00 | | | | 10-1-2016 | | | | 4,580,000 | | | | 4,607,159 | |
Leigh County PA IDA PPL Corporation Series A (Industrial Development Revenue) ± | | | 0.90 | | | | 9-1-2029 | | | | 12,500,000 | | | | 12,510,250 | |
Lycoming County PA Authority Association of Independent Colleges & Universities of Pennsylvania Financing Program (Education Revenue) ± | | | 3.00 | | | | 11-1-2035 | | | | 4,000,000 | | | | 4,023,400 | |
Montgomery County PA IDA Acts Retirement Community Series B (Health Revenue) | | | 5.00 | | | | 11-15-2017 | | | | 2,300,000 | | | | 2,335,075 | |
Montgomery County PA IDA Refunding Peco Energy Company Project Series A (Industrial Development Revenue) ± | | | 2.55 | | | | 6-1-2029 | | | | 12,910,000 | | | | 13,273,287 | |
North Pennsylvania Water Authority (Water & Sewer Revenue) ± | | | 0.66 | | | | 11-1-2018 | | | | 700,000 | | | | 694,918 | |
North Pennsylvania Water Authority (Water & Sewer Revenue) ± | | | 0.72 | | | | 11-1-2019 | | | | 1,000,000 | | | | 989,150 | |
North Pennsylvania Water Authority (Water & Sewer Revenue) ± | | | 0.81 | | | | 11-1-2024 | | | | 5,000,000 | | | | 4,960,450 | |
Northampton County PA General Purpose Hospital Authority St. Luke’s Hospital Project Series C (Health Revenue) ± | | | 4.50 | | | | 8-15-2032 | | | | 2,500,000 | | | | 2,510,525 | |
Pennsylvania EDFA Solid Waste Disposal Republic Services Incorporated Project Series A (Resource Recovery Revenue) ± | | | 0.90 | | | | 4-1-2019 | | | | 10,750,000 | | | | 10,750,000 | |
Pennsylvania EDFA Solid Waste Disposal Waste Management Incorporated Project (Resource Recovery Revenue) ± | | | 0.85 | | | | 8-1-2045 | | | | 36,300,000 | | | | 36,296,370 | |
Pennsylvania HEFA AICUP Financing Program York College of Pennsylvania Project Series T-2 (Education Revenue) ± | | | 1.35 | | | | 5-1-2034 | | | | 2,565,000 | | | | 2,569,874 | |
Pennsylvania HEFA Wilkes University Project Series A (Education Revenue) | | | 4.00 | | | | 3-1-2020 | | | | 735,000 | | | | 800,275 | |
Pennsylvania HEFA Wilkes University Project Series A (Education Revenue) | | | 5.00 | | | | 3-1-2021 | | | | 500,000 | | | | 573,845 | |
Pennsylvania HEFAR Associated Independent Colleges Series 13 (Education Revenue) ± | | | 1.20 | | | | 11-1-2031 | | | | 225,000 | | | | 225,245 | |
Pennsylvania HEFAR Association of Independent Colleges and Universities of Pennsylvania Financing Program Mount Aloysius College Project Series R1 (Education Revenue) ± | | | 1.25 | | | | 11-1-2041 | | | | 1,500,000 | | | | 1,502,040 | |
Pennsylvania HEFA Independent Colleges Series I4 (Education Revenue) ± | | | 1.50 | | | | 11-1-2031 | | | | 5,800,000 | | | | 5,843,790 | |
Pennsylvania Public School Building Authority The School District of Pennsylvania Project (Miscellaneous Revenue) | | | 5.00 | | | | 4-1-2017 | | | | 3,500,000 | | | | 3,591,000 | |
Pennsylvania Series 2 (GO Revenue) | | | 5.00 | | | | 4-15-2017 | | | | 1,250,000 | | | | 1,293,375 | |
| | | | |
| 20 | | Wells Fargo Ultra Short-Term Municipal Income Fund | | Portfolio of investments—June 30, 2016 |
| | | | | | | | | | | | | | | | |
| Security name | | Interest rate | | | Maturity date | | | Principal | | | Value | |
| | | | |
| Pennsylvania (continued) | | | | | | | | | | | | | | | | |
Pennsylvania Turnpike Commission Series B-1 (Transportation Revenue) ± | | | 1.01 | % | | | 12-1-2018 | | | $ | 19,000,000 | | | $ | 18,929,320 | |
Philadelphia PA School District (GO Revenue) | | | 3.00 | | | | 9-1-2016 | | | | 1,450,000 | | | | 1,455,046 | |
Philadelphia PA School District Refunding Bond Series C (GO Revenue) | | | 5.00 | | | | 9-1-2018 | | | | 1,880,000 | | | | 2,011,130 | |
Philadelphia PA School District Series B (GO Revenue) | | | 5.00 | | | | 9-1-2016 | | | | 3,500,000 | | | | 3,523,975 | |
Philadelphia PA School District Series C (GO Revenue) | | | 5.00 | | | | 9-1-2018 | | | | 250,000 | | | | 267,438 | |
Philadelphia PA School District Series D (GO Revenue) | | | 4.00 | | | | 9-1-2016 | | | | 240,000 | | | | 241,272 | |
Philadelphia PA School District Series D (GO Revenue) | | | 5.00 | | | | 9-1-2016 | | | | 4,360,000 | | | | 4,391,087 | |
Philadelphia PA School District Series D (GO Revenue) | | | 5.00 | | | | 9-1-2017 | | | | 6,050,000 | | | | 6,306,218 | |
Philadelphia PA School District Series E (GO Revenue) | | | 5.00 | | | | 9-1-2018 | | | | 145,000 | | | | 155,114 | |
Philadelphia PA School District Series F (GO Revenue, BHAC Insured) | | | 5.00 | | | | 9-1-2016 | | | | 450,000 | | | | 453,195 | |
Pine-Richland PA School District (GO Revenue, AGM Insured) | | | 4.50 | | | | 7-15-2030 | | | | 1,000,000 | | | | 1,001,700 | |
Tunkhannock PA School District (GO Revenue, Build America Mutual Assurance Company Insured) | | | 2.00 | | | | 7-15-2016 | | | | 1,240,000 | | | | 1,240,694 | |
University Area Joint Authority Pennsylvania Refunding Bond (Water & Sewer Revenue) ± | | | 0.79 | | | | 11-1-2028 | | | | 3,300,000 | | | | 3,294,885 | |
Upper Darby PA School District (GO Revenue) | | | 3.00 | | | | 5-1-2017 | | | | 500,000 | | | | 508,990 | |
Upper Darby PA School District (GO Revenue) | | | 4.00 | | | | 5-1-2018 | | | | 700,000 | | | | 738,591 | |
Warwick PA School District (GO Revenue) | | | 3.00 | | | | 2-15-2017 | | | | 1,000,000 | | | | 1,014,730 | |
Warwick PA School District (GO Revenue) | | | 4.00 | | | | 2-15-2018 | | | | 1,250,000 | | | | 1,314,863 | |
Warwick PA School District (GO Revenue) | | | 4.00 | | | | 2-15-2019 | | | | 1,025,000 | | | | 1,108,353 | |
Washington County PA Hospital Authority Series A (Health Revenue, PNC Bank NA LOC) ± | | | 0.50 | | | | 7-1-2037 | | | | 3,310,000 | | | | 3,310,000 | |
Washington County PA Hospital Authority Series B (Health Revenue, PNC Bank NA LOC) ± | | | 0.50 | | | | 7-1-2031 | | | | 3,235,000 | | | | 3,235,000 | |
Washington County PA Washington Hospital Project (Health Revenue) | | | 4.00 | | | | 7-1-2016 | | | | 1,080,000 | | | | 1,080,086 | |
Washington County PA Washington Hospital Project (Health Revenue) | | | 4.00 | | | | 7-1-2017 | | | | 1,085,000 | | | | 1,111,572 | |
Westmoreland County PA IDA Excela Health Project (Health Revenue) | | | 4.00 | | | | 7-1-2017 | | | | 1,650,000 | | | | 1,686,911 | |
Westmoreland County PA IDA Excela Health Project (Health Revenue) | | | 5.00 | | | | 7-1-2018 | | | | 1,650,000 | | | | 1,752,069 | |
York County PA Refunding Bond (GO Revenue) ± | | | 0.61 | | | | 6-1-2033 | | | | 9,445,000 | | | | 9,419,499 | |
| | | | |
| | | | | | | | | | | | | | | 203,770,869 | |
| | | | | | | | | | | | | | | | |
| | | | |
| Puerto Rico: 0.27% | | | | | | | | | | | | | | | | |
Puerto Rico Electric Power Authority Series L (Utilities Revenue, National Insured) | | | 5.50 | | | | 7-1-2016 | | | | 2,000,000 | | | | 2,000,200 | |
Puerto Rico Electric Power Authority Series SS (Utilities Revenue, National Insured) | | | 5.00 | | | | 7-1-2016 | | | | 725,000 | | | | 725,065 | |
Puerto Rico Electric Power Authority Series TT (Utilities Revenue, AGM Insured) | | | 5.00 | | | | 7-1-2017 | | | | 550,000 | | | | 561,281 | |
Puerto Rico Highway & Transportation Authority Series E (Transportation Revenue, AGM Insured) | | | 5.50 | | | | 7-1-2017 | | | | 575,000 | | | | 597,805 | |
Puerto Rico Municipal Finance Agency Series C (Miscellaneous Revenue, AGM Insured) | | | 5.00 | | | | 8-1-2016 | | | | 4,935,000 | | | | 4,951,680 | |
Puerto Rico Public Improvement Series A (GO Revenue, AGC Insured) | | | 5.00 | | | | 7-1-2017 | | | | 250,000 | | | | 258,323 | |
Puerto Rico Series A (GO Revenue, AGC Insured) | | | 5.00 | | | | 7-1-2016 | | | | 6,065,000 | | | | 6,065,667 | |
| | | | |
| | | | | | | | | | | | | | | 15,160,021 | |
| | | | | | | | | | | | | | | | |
| | | | |
| Rhode Island: 0.50% | | | | | | | | | | | | | | | | |
East Providence RI TAN (GO Revenue) | | | 1.50 | | | | 7-28-2016 | | | | 6,700,000 | | | | 6,703,417 | |
Providence RI Redevelopment Agency Public Safety Building Project Series A (Miscellaneous Revenue) | | | 4.00 | | | | 4-1-2018 | | | | 3,025,000 | | | | 3,167,387 | |
Providence RI Series A (GO Revenue) | | | 5.00 | | | | 7-15-2017 | | | | 1,400,000 | | | | 1,456,364 | |
Rhode Island HEFA (Health Revenue, AGM Insured) | | | 5.00 | | | | 5-15-2017 | | | | 7,370,000 | | | | 7,395,500 | |
Rhode Island HEFA Refunding Bond Providence Financing Program (Education Revenue, AGM Insured) | | | 3.00 | | | | 5-15-2017 | | | | 1,815,000 | | | | 1,847,743 | |
| | | | | | |
| Portfolio of investments—June 30, 2016 | | Wells Fargo Ultra Short-Term Municipal Income Fund | | | 21 | |
| | | | | | | | | | | | | | | | |
| Security name | | Interest rate | | | Maturity date | | | Principal | | | Value | |
| | | | |
| Rhode Island (continued) | | | | | | | | | | | | | | | | |
Rhode Island HEFA Refunding Bond Providence Financing Program (Education Revenue, AGM Insured) | | | 3.00 | % | | | 5-15-2018 | | | $ | 1,535,000 | | | $ | 1,591,304 | |
Rhode Island Housing and Mortgage Finance Corporation Series 66-B (Housing Revenue) ± | | | 1.09 | | | | 10-1-2045 | | | | 4,400,000 | | | | 4,395,336 | |
Rhode Island Student Loan Authority AMT Program Senior Series A (Education Revenue) | | | 5.00 | | | | 12-1-2019 | | | | 750,000 | | | | 830,550 | |
| | | | |
| | | | | | | | | | | | | | | 27,387,601 | |
| | | | | | | | | | | | | | | | |
| | | | |
| South Carolina: 0.35% | | | | | | | | | | | | | | | | |
Berkeley County SC IDA Nucor Corporation Project (Industrial Development Revenue) ø | | | 0.70 | | | | 4-1-2030 | | | | 5,000,000 | | | | 5,000,000 | |
Jasper County SC Jasper County School Project (Miscellaneous Revenue) | | | 3.00 | | | | 4-1-2017 | | | | 600,000 | | | | 606,390 | |
Jasper County SC Jasper County School Project (Miscellaneous Revenue) | | | 3.00 | | | | 4-1-2018 | | | | 500,000 | | | | 506,660 | |
Jasper County SC Jasper County School Project (Miscellaneous Revenue) | | | 4.00 | | | | 4-1-2019 | | | | 500,000 | | | | 524,515 | |
South Carolina HFA West Greenville Project (Housing Revenue) ± | | | 1.00 | | | | 4-1-2019 | | | | 7,600,000 | | | | 7,604,028 | |
South Carolina Housing Finance & Development Authority Spartanburg 7 Project Series A (Housing Revenue) ± | | | 1.05 | | | | 1-1-2019 | | | | 3,175,000 | | | | 3,175,953 | |
Woodruff SC BAN (Water & Sewer Revenue) | | | 1.05 | | | | 4-1-2017 | | | | 2,045,000 | | | | 2,045,736 | |
| | | | |
| | | | | | | | | | | | | | | 19,463,282 | |
| | | | | | | | | | | | | | | | |
| | | | |
| Tennessee: 1.05% | | | | | | | | | | | | | | | | |
Clarksville TN Natural Gas Acquisition Corporation (Utilities Revenue) | | | 5.00 | | | | 12-15-2016 | | | | 2,740,000 | | | | 2,791,813 | |
Knoxville TN Industrial Development Board Collateralized Housing Golden Age Retirement Village Project (Housing Revenue, GNMA Insured) | | | 0.85 | | | | 12-1-2017 | | | | 5,900,000 | | | | 5,911,092 | |
Memphis TN HEFA Ashland Lakes II Apartments Project Series A (Housing Revenue, U.S. Bank NA LOC) ø | | | 0.43 | | | | 5-1-2043 | | | | 11,500,000 | | | | 11,500,000 | |
Metropolitan Government Nashville & Davidson Counties TN Health & Education Facilities Meharry Medical College (Health Revenue, Ambac Insured) | | | 6.00 | | | | 12-1-2016 | | | | 560,000 | | | | 567,140 | |
Nashville TN DWR (Water & Sewer Revenue) | | | 0.68 | | | | 7-27-2016 | | | | 15,000,000 | | | | 15,000,000 | |
Nashville TN HEFA The Paddock at Grandview Apartments Project (Housing Revenue) | | | 0.95 | | | | 5-1-2018 | | | | 16,500,000 | | | | 16,507,755 | |
Tennessee Energy Acquisition Corporation Series A (Utilities Revenue) | | | 5.00 | | | | 9-1-2016 | | | | 4,315,000 | | | | 4,345,291 | |
Tennessee Energy Acquisition Corporation Series A (Utilities Revenue) | | | 5.25 | | | | 9-1-2017 | | | | 1,430,000 | | | | 1,497,153 | |
| | | | |
| | | | | | | | | | | | | | | 58,120,244 | |
| | | | | | | | | | | | | | | | |
| | | | |
| Texas: 9.48% | | | | | | | | | | | | | | | | |
Alamito TX Public Facilities Corporation HACEP RAD Conversion Program (Housing Revenue) ± | | | 1.00 | | | | 10-1-2018 | | | | 9,500,000 | | | | 9,499,335 | |
Clear Creek TX Independent School District (GO Revenue) ± | | | 3.00 | | | | 2-15-2035 | | | | 4,310,000 | | | | 4,419,733 | |
Dallas TX Independent High School District (GO Revenue) ± | | | 1.50 | | | | 2-15-2034 | | | | 4,000,000 | | | | 4,054,840 | |
Fort Bend TX Independent School District Various School Building Series A (GO Revenue) ± | | | 0.66 | | | | 8-1-2040 | | | | 6,675,000 | | | | 6,675,534 | |
Galveston TX Dickinson Independent High School District (GO Revenue) ± | | | 1.05 | | | | 8-1-2037 | | | | 4,000,000 | | | | 4,007,560 | |
Galveston TX Hotel Occupancy Series B (Tax Revenue, AGM Insured) | | | 4.00 | | | | 9-1-2016 | | | | 420,000 | | | | 422,272 | |
Harris County TX (Transportation Revenue) ± | | | 1.03 | | | | 8-15-2021 | | | | 3,500,000 | | | | 3,500,140 | |
Harris County TX Cypress-Fairbanks Independent High School Series 2014B-2 (GO Revenue) ± | | | 3.00 | | | | 2-15-2040 | | | | 960,000 | | | | 983,846 | |
Harris County TX Cypress-Fairbanks Independent High School Series 2014B-3 (GO Revenue) ± | | | 1.05 | | | | 2-15-2044 | | | | 12,000,000 | | | | 12,006,600 | |
Harris County TX Houston Independent School District Series B (GO Revenue) ± | | | 0.95 | | | | 6-1-2035 | | | | 9,150,000 | | | | 9,165,372 | |
| | | | |
| 22 | | Wells Fargo Ultra Short-Term Municipal Income Fund | | Portfolio of investments—June 30, 2016 |
| | | | | | | | | | | | | | | | |
| Security name | | Interest rate | | | Maturity date | | | Principal | | | Value | |
| | | | |
| Texas (continued) | | | | | | | | | | | | | | | | |
Houston TX Hotel Occupancy Prerefunded Series B (Tax Revenue) | | | 5.00 | % | | | 9-1-2018 | | | $ | 1,735,000 | | | $ | 1,748,203 | |
Houston TX Hotel Occupancy Unrefunded Series B (Tax Revenue) | | | 5.00 | | | | 9-1-2018 | | | | 285,000 | | | | 287,180 | |
Lamar TX Consolidated Independent School District Schoolhouse Series A (GO Revenue) ± | | | 2.00 | | | | 8-15-2047 | | | | 38,220,000 | | | | 38,289,943 | |
Midland County TX PFFA Compass Pointe Apartments (Housing Revenue) | | | 1.25 | | | | 3-1-2018 | | | | 7,000,000 | | | | 7,020,020 | |
North East TX Independent School District Series A (GO Revenue) ± | | | 2.00 | | | | 8-1-2042 | | | | 26,355,000 | | | | 26,949,832 | |
Northside TX Independent School District Building Project (GO Revenue) ± | | | 2.13 | | | | 8-1-2040 | | | | 1,960,000 | | | | 1,962,019 | |
Northside TX Independent School District Building Project (GO Revenue) ± | | | 2.00 | | | | 8-1-2044 | | | | 2,610,000 | | | | 2,691,406 | |
Northside TX Independent School District Series A (GO Revenue) ± | | | 2.00 | | | | 6-1-2039 | | | | 27,715,000 | | | | 28,538,690 | |
Port Arthur TX Navigation District Jefferson County Environmental Facilities Motiva Enterprises LLC Project Series B (Resource Recovery Revenue) ø | | | 0.53 | | | | 12-1-2039 | | | | 10,000,000 | | | | 10,000,000 | |
Port Arthur TX Navigation District Jefferson County Environmental Facilities Motiva Enterprises LLC Project Series D (Resource Recovery Revenue) ± | | | 0.52 | | | | 11-1-2040 | | | | 21,600,000 | | | | 21,600,000 | |
Port Arthur TX Navigation District Jefferson County Environmental Facilities Motiva Enterprises LLC Project Series D (Resource Recovery Revenue) ø | | | 0.53 | | | | 11-1-2040 | | | | 3,500,000 | | | | 3,500,000 | |
Richardson TX Independent School District Series A (GO Revenue) | | | 5.00 | | | | 2-15-2017 | | | | 3,835,000 | | | | 3,943,339 | |
Round Rock TX Independent School District (GO Revenue) ± | | | 1.50 | | | | 8-1-2040 | | | | 34,300,000 | | | | 34,327,097 | |
San Antonio TX Electric & Gas Refunding System Junior Lien Series A (Utilities Revenue) ± | | | 0.67 | | | | 2-1-2033 | | | | 53,000,000 | | | | 52,977,740 | |
San Antonio TX Housing Trust Finance Corporation Freedom Hills Ranch Apartments Project (Housing Revenue) | | | 1.00 | | | | 1-1-2018 | | | | 12,650,000 | | | | 12,651,265 | |
San Antonio TX Housing Trust Finance Corporation MFHR Masters Ranch Apartments Project (Housing Revenue) | | | 0.50 | | | | 9-1-2016 | | | | 15,500,000 | | | | 15,499,845 | |
San Antonio TX Junior Lien No Reserve Fund Series F (Water & Sewer Revenue) ± | | | 1.09 | | | | 5-1-2043 | | | | 12,320,000 | | | | 12,321,109 | |
Tarrant County TX Cultural Education Facilities Finance Corporation Edgemere Project Refunding Series A (Health Revenue) | | | 2.00 | | | | 11-15-2016 | | | | 400,000 | | | | 401,208 | |
Tarrant County TX Cultural Education Facilities Finance Corporation Edgemere Project Refunding Series A (Health Revenue) | | | 3.00 | | | | 11-15-2017 | | | | 485,000 | | | | 494,909 | |
Tarrant County TX Cultural Education Facilities Finance Corporation Edgemere Project Refunding Series A (Health Revenue) | | | 4.00 | | | | 11-15-2018 | | | | 500,000 | | | | 527,370 | |
Tarrant County TX Cultural Education Facilities Finance Corporation Edgemere Project Refunding Series A (Health Revenue) | | | 4.00 | | | | 11-15-2019 | | | | 510,000 | | | | 546,185 | |
Tarrant County TX Cultural Education Facilities Finance Corporation Edgemere Project Series B (Health Revenue) | | | 3.00 | | | | 11-15-2017 | | | | 500,000 | | | | 510,630 | |
Tarrant County TX Cultural Education Facilities Finance Corporation Edgemere Project Series B (Health Revenue) | | | 4.00 | | | | 11-15-2018 | | | | 500,000 | | | | 528,090 | |
Tarrant County TX Cultural Education Facilities Finance Corporation Edgemere Project Series B (Health Revenue) | | | 4.00 | | | | 11-15-2019 | | | | 710,000 | | | | 761,582 | |
Tarrant County TX Cultural Education Facilities Finance Corporation Hendrick Medical Center (Health Revenue) | | | 4.00 | | | | 9-1-2017 | | | | 550,000 | | | | 568,475 | |
Tarrant County TX Cultural Education Facilities Finance Corporation Series 2973 (Health Revenue, Morgan Stanley Bank LIQ) ø144A | | | 0.65 | | | | 11-15-2029 | | | | 30,400,000 | | | | 30,400,000 | |
Tender Option Bond Trust Receipts Floaters Series 2016-XG0058 (Health Revenue, Deutsche Bank LIQ) ø144A | | | 0.62 | | | | 8-15-2027 | | | | 4,985,000 | | | | 4,985,000 | |
Tennessee Energy Acquisition Corporation Series C (Utilities Revenue) | | | 5.00 | | | | 2-1-2017 | | | | 6,925,000 | | | | 7,090,992 | |
Texas Affordable Housing Corporation Woodside Village Project (Housing Revenue) ± | | | 1.00 | | | | 12-1-2018 | | | | 5,750,000 | | | | 5,752,070 | |
Texas Department of Housing and Community Affairs Good Samaritan Towers (Housing Revenue) | | | 0.95 | | | | 9-1-2017 | | | | 5,620,000 | | | | 5,623,372 | |
Texas Lower Neches Valley Authority Chevron USA Incorporated Project (Industrial Development Revenue) ± | | | 0.20 | | | | 2-15-2017 | | | | 18,000,000 | | | | 17,987,760 | |
Texas Municipal Gas Acquisition & Supply Corporation II Series A (Utilities Revenue, JPMorgan Chase & Company Guaranteed) ± | | | 1.13 | | | | 9-15-2017 | | | | 16,480,000 | | | | 16,480,989 | |
| | | | | | |
| Portfolio of investments—June 30, 2016 | | Wells Fargo Ultra Short-Term Municipal Income Fund | | | 23 | |
| | | | | | | | | | | | | | | | |
| Security name | | Interest rate | | | Maturity date | | | Principal | | | Value | |
| | | | |
| Texas (continued) | | | | | | | | | | | | | | | | |
Texas Municipal Gas Acquisition & Supply Corporation II Series B (Utilities Revenue, JPMorgan Chase & Company Guaranteed) ± | | | 0.88 | % | | | 9-15-2017 | | | $ | 43,265,000 | | | $ | 43,107,948 | |
Texas Municipal Gas Acquisition & Supply Corporation III (Utilities Revenue) | | | 5.00 | | | | 12-15-2016 | | | | 2,500,000 | | | | 2,549,325 | |
Texas Municipal Gas Acquisition & Supply Corporation Senior Lien Series B (Utilities Revenue) ± | | | 0.98 | | | | 12-15-2017 | | | | 2,975,000 | | | | 2,967,682 | |
Texas Public Finance Authority Southern University Financing System (Education Revenue, Build America Mutual Assurance Company Insured) | | | 5.00 | | | | 11-1-2016 | | | | 2,080,000 | | | | 2,107,976 | |
Texas Public Finance Authority Unemployment Compensation Series B (Miscellaneous Revenue) | | | 4.00 | | | | 7-1-2017 | | | | 11,500,000 | | | | 11,710,680 | |
Texas Tollway Authority Series C (Transportation Revenue) ± | | | 1.95 | | | | 1-1-2038 | | | | 1,535,000 | | | | 1,563,904 | |
Texas Tollway Authortiy Series D (Transportation Revenue, Royal Bank of Canada LOC) ø | | | 0.41 | | | | 1-1-2049 | | | | 500,000 | | | | 500,000 | |
Texas Transportation Commission State Highway Fund Floating 1st Tier Series B (Transportation Revenue, Banco Bilboa Vizcaya SPA) ø | | | 0.65 | | | | 4-1-2026 | | | | 6,500,000 | | | | 6,500,000 | |
Texas Transportation Commission State Highway Fund Floating 1st Tier Series B (Tax Revenue) ± | | | 0.74 | | | | 4-1-2032 | | | | 24,000,000 | | | | 23,980,320 | |
Texas Turnpike Authority Central Texas Turnpike System Prerefunded Capital Appreciation 1st Tier Series A (Transportation Revenue, Ambac Insured) ¤ | | | 0.00 | | | | 8-15-2016 | | | | 4,755,000 | | | | 4,751,909 | |
Texas Turnpike Authority Central Texas Turnpike System Unrefunded Balance Capital Appreciation 1st Tier Series A (Transportation Revenue, Ambac Insured) ¤ | | | 0.00 | | | | 8-15-2016 | | | | 340,000 | | | | 339,759 | |
Williamson County TX (GO Revenue) ± | | | 1.45 | | | | 8-15-2034 | | | | 2,600,000 | | | | 2,625,012 | |
| | | | |
| | | | | | | | | | | | | | | 524,406,067 | |
| | | | | | | | | | | | | | | | |
| | | | |
| Vermont: 0.03% | | | | | | | | | | | | | | | | |
Burlington VT Airport Refunding Series 2012B (Airport Revenue) | | | 3.50 | | | | 7-1-2018 | | | | 1,560,000 | | | | 1,586,005 | |
| | | | | | | | | | | | | | | | |
| | | | |
| Virgin Islands: 0.16% | | | | | | | | | | | | | | | | |
Virgin Islands PFA Senior Lien Matching Fund Loan Series A (Miscellaneous Revenue) | | | 4.00 | | | | 10-1-2016 | | | | 1,700,000 | | | | 1,712,308 | |
Virgin Islands PFA Senior Lien Matching Fund Loan Series B (Miscellaneous Revenue) | | | 5.00 | | | | 10-1-2017 | | | | 6,950,000 | | | | 7,263,932 | |
| | | | |
| | | | | | | | | | | | | | | 8,976,240 | |
| | | | | | | | | | | | | | | | |
| | | | |
| Virginia: 0.91% | | | | | | | | | | | | | | | | |
Bedford VA American Municipal Power Incorporated (Utilities Revenue) | | | 1.25 | | | | 3-28-2017 | | | | 4,385,000 | | | | 4,394,121 | |
Chesapeake VA EDA Electric and Power Company Series 2008A (Utilities Revenue) ± | | | 1.75 | | | | 2-1-2032 | | | | 30,000,000 | | | | 30,582,900 | |
Fredericksburg VA EDA Mary Washington Healthcare Group Series A (Health Revenue) ± | | | 2.29 | | | | 8-1-2038 | | | | 4,265,000 | | | | 4,283,510 | |
Greater Richmond VA Convention Center Authority (Tax Revenue) | | | 5.00 | | | | 6-15-2017 | | | | 1,250,000 | | | | 1,301,700 | |
Greater Richmond VA Convention Center Authority (Tax Revenue) | | | 5.00 | | | | 6-15-2018 | | | | 1,500,000 | | | | 1,623,495 | |
Louisa VA IDA Virginia Electric & Power Company Series C (Utilities Revenue) ± | | | 0.70 | | | | 11-1-2035 | | | | 6,400,000 | | | | 6,401,216 | |
Virginia Housing Development Authority Series B (Housing Revenue) | | | 2.25 | | | | 9-1-2017 | | | | 500,000 | | | | 508,125 | |
Virginia Small Business Financing Authority Hampton University (Education Revenue) | | | 3.00 | | | | 10-1-2016 | | | | 955,000 | | | | 960,501 | |
| | | | |
| | | | | | | | | | | | | | | 50,055,568 | |
| | | | | | | | | | | | | | | | |
| | | | |
| Washington: 0.27% | | | | | | | | | | | | | | | | |
Grant County WA Public Utility District #2 Series K (Utilities Revenue) ± | | | 0.71 | | | | 1-1-2044 | | | | 4,000,000 | | | | 3,983,920 | |
Kent WA (GO Revenue) | | | 3.00 | | | | 12-1-2016 | | | | 500,000 | | | | 505,030 | |
| | | | |
| 24 | | Wells Fargo Ultra Short-Term Municipal Income Fund | | Portfolio of investments—June 30, 2016 |
| | | | | | | | | | | | | | | | |
| Security name | | Interest rate | | | Maturity date | | | Principal | | | Value | |
| | | | |
| Washington (continued) | | | | | | | | | | | | | | | | |
Skagit County WA Public Hospital District No. 1 (GO Revenue, National Insured) | | | 5.13 | % | | | 12-1-2016 | | | $ | 1,070,000 | | | $ | 1,089,014 | |
Washington Energy Northwest Prerefunded (Utilities Revenue) | | | 5.00 | | | | 7-1-2023 | | | | 1,000,000 | | | | 1,000,120 | |
Washington HCFR Series XF2035 (Health Revenue, Morgan Stanley Bank LIQ) ø144A | | | 0.76 | | | | 10-1-2036 | | | | 7,655,000 | | | | 7,655,000 | |
Washington HFA Multicare Health System Series D (Health Revenue, Barclays Bank plc LOC) ± | | | 0.37 | | | | 8-15-2041 | | | | 500,000 | | | | 500,000 | |
| | | | |
| | | | | | | | | | | | | | | 14,733,084 | |
| | | | | | | | | | | | | | | | |
| | | | |
| West Virginia: 0.75% | | | | | | | | | | | | | | | | |
Mason County WV PCR Appalachian Power Company Series L (Industrial Development Revenue) ± | | | 1.63 | | | | 10-1-2022 | | | | 16,400,000 | | | | 16,556,128 | |
West Virginia EDA Appalachian Power Company Mountaineer Project Series A (Utilities Revenue) ø | | | 0.72 | | | | 2-1-2036 | | | | 25,000,000 | | | | 25,000,000 | |
| | | | |
| | | | | | | | | | | | | | | 41,556,128 | |
| | | | | | | | | | | | | | | | |
| | | | |
| Wisconsin: 1.97% | | | | | | | | | | | | | | | | |
Algoma Kewaunee County WI School District BAN (Miscellaneous Revenue) | | | 2.50 | | | | 11-15-2016 | | | | 4,860,000 | | | | 4,871,761 | |
Argyle Green County WI School District BAN (Miscellaneous Revenue) %% | | | 2.00 | | | | 9-19-2016 | | | | 6,475,000 | | | | 6,486,202 | |
Delavan WI School District Anticipation Notes (GO Revenue) | | | 2.00 | | | | 9-1-2016 | | | | 8,450,000 | | | | 8,471,463 | |
Dodgeville WI School District BAN (Miscellaneous
Revenue) %% | | | 2.00 | | | | 9-6-2016 | | | | 5,945,000 | | | | 5,955,998 | |
Ellsworth WI Community School District (Miscellaneous Revenue) | | | 2.00 | | | | 10-1-2017 | | | | 4,235,000 | | | | 4,248,594 | |
Ellsworth WI Community School District BAN (Miscellaneous Revenue) %% | | | 2.00 | | | | 9-7-2016 | | | | 11,640,000 | | | | 11,660,486 | |
Milwaukee County WI Series A (Airport Revenue) | | | 5.00 | | | | 12-1-2016 | | | | 345,000 | | | | 351,258 | |
Milwaukee County WI Series B (Airport Revenue) | | | 4.00 | | | | 12-1-2016 | | | | 385,000 | | | | 390,375 | |
Milwaukee County WI Series B (Airport Revenue) | | | 4.00 | | | | 12-1-2017 | | | | 385,000 | | | | 401,736 | |
Mishicot WI School District BAN (Miscellaneous Revenue) | | | 2.00 | | | | 8-8-2016 | | | | 8,900,000 | | | | 8,914,151 | |
Mukwonago WI School District BAN (Miscellaneous Revenue) %% | | | 2.00 | | | | 9-14-2016 | | | | 9,500,000 | | | | 9,518,810 | |
Residual Interest Bonds Floaters Series 2WE-144A (Miscellaneous Revenue, Barclays Bank plc LOC) ø144A | | | 0.58 | | | | 5-1-2018 | | | | 25,000,000 | | | | 25,000,000 | |
Stratford WI BAN (Miscellaneous Revenue) | | | 2.00 | | | | 8-9-2016 | | | | 4,000,000 | | | | 4,006,520 | |
Tender Option Bond Trust Receipts Floaters Series 2015-XF0127 (Health Revenue, JPMorgan Chase & Company LIQ) ø144A | | | 0.61 | | | | 10-1-2020 | | | | 4,875,000 | | | | 4,875,000 | |
Waukesha WI Housing Preservation Corporation (Housing Revenue, Johnson Bank LOC) ø | | | 1.25 | | | | 12-1-2042 | | | | 3,800,000 | | | | 3,800,000 | |
Wisconsin HEFA Aspirus Incorporate Obligation Group Series A (Health Revenue) | | | 3.00 | | | | 8-15-2016 | | | | 420,000 | | | | 421,252 | |
Wisconsin HEFA Aurora Health Care Incorporated Series B (Health Revenue) ± | | | 5.13 | | | | 8-15-2027 | | | | 3,500,000 | | | | 3,518,515 | |
Wisconsin HEFA Aurora Health Care Series B-1 (Health Revenue) ± | | | 1.25 | | | | 8-15-2025 | | | | 3,540,000 | | | | 3,550,974 | |
Wisconsin HEFA Bellin Memorial Hospital Incorporated (Health Revenue) | | | 2.00 | | | | 12-1-2016 | | | | 1,455,000 | | | | 1,463,075 | |
Wisconsin HEFA Bellin Memorial Hospital Incorporated (Health Revenue) | | | 3.00 | | | | 12-1-2017 | | | | 200,000 | | | | 205,866 | |
Wisconsin HEFA Bellin Memorial Hospital Incorporated (Health Revenue) | | | 3.00 | | | | 12-1-2018 | | | | 500,000 | | | | 523,330 | |
| | | | |
| | | | | | | | | | | | | | | 108,635,366 | |
| | | | | | | | | | | | | | | | |
| | | | |
Total Municipal Obligations (Cost $5,282,990,525) | | | | | | | | | | | | | | | 5,287,837,844 | |
| | | | | | | | | | | | | | | | |
| | | | |
Other: 2.55% | | | | | | | | | | | | | | | | |
Eaton Vance California Municipal Income Trust Preferred shares ±144A§ | | | 1.91 | | | | 9-1-2019 | | | | 16,975,000 | | | | 17,000,802 | |
Eaton Vance Massachusetts Municipal Bond Fund Institutional MuniFund Term Preferred Shares ±144A§ | | | 1.39 | | | | 7-1-2019 | | | | 6,475,000 | | | | 6,519,160 | |
Eaton Vance Municipal Bond Fund 2 Institutional MuniFund Term Preferred Shares ±144A | | | 1.44 | | | | 7-1-2019 | | | | 9,950,000 | | | | 10,004,327 | |
| | | | | | |
| Portfolio of investments—June 30, 2016 | | Wells Fargo Ultra Short-Term Municipal Income Fund | | | 25 | |
| | | | | | | | | | | | | | | | |
| Security name | | Interest rate | | | Maturity date | | | Principal | | | Value | |
| | | | |
Other (continued) | | | | | | | | | | | | | | | | |
Eaton Vance Pennsylvania Municipal Bond Fund Institutional MuniFund Term Preferred Shares ±144A | | | 1.39 | % | | | 7-1-2019 | | | $ | 6,000,000 | | | $ | 6,040,920 | |
Nuveen Enhanced Municipal Credit Opportunities Fund Institutional MuniFund Term Preferred Shares ±144A | | | 1.16 | | | | 10-1-2017 | | | | 59,000,000 | | | | 59,152,220 | |
Nuveen New York AMT-Free Municipal Income Fund Institutional MuniFund Term Preferred Shares ±144A§ | | | 1.03 | | | | 10-1-2017 | | | | 17,000,000 | | | | 17,016,320 | |
Nuveen Texas Quality Income Municipal Fund Institutional MuniFund Term Preferred Shares ±144A | | | 1.01 | | | | 11-1-2018 | | | | 25,000,000 | | | | 25,137,500 | |
| | | | |
Total Other (Cost $140,375,721) | | | | | | | | | | | | | | | 140,871,249 | |
| | | | | | | | | | | | | | | | |
| | | | |
| | | Yield | | | | | | Shares | | | | |
| | | | |
Short-Term Investments: 1.23% | | | | | | | | | | | | | | | | |
| | | | |
| Investment Companies: 1.22% | | | | | | | | | | | | | | | | |
Wells Fargo Municipal Cash Management Fund Institutional Class (l)(u)## | | | 0.30 | | | | | | | | 67,619,138 | | | | 67,619,138 | |
| | | | | | | | | | | | | | | | |
| | | | |
| | | | | | | | | Principal | | | | |
| | | | |
| U.S. Treasury Securities: 0.01% | | | | | | | | | | | | | | | | |
U.S. Treasury Bill (z)# | | | 0.26 | | | | 9-15-2016 | | | $ | 250,000 | | | | 249,886 | |
| | | | | | | | | | | | | | | | |
| | | | |
Total Short-Term Investments (Cost $67,868,998) | | | | | | | | | | | | | | | 67,869,024 | |
| | | | | | | | | | | | | | | | |
| | | | | | | | |
| Total investments in securities (Cost $5,503,980,240) * | | | 99.63 | % | | | 5,508,908,867 | |
Other assets and liabilities, net | | | 0.37 | | | | 20,517,448 | |
| | | | | | | | |
| Total net assets | | | 100.00 | % | | $ | 5,529,426,315 | |
| | | | | | | | |
| ± | Variable rate investment. The rate shown is the rate in effect at period end. |
| (m) | The security is an auction-rate security which has an interest rate that resets at predetermined short-term intervals through a Dutch auction. The rate shown is the rate in effect at period end. |
| ø | Variable rate demand notes are subject to a demand feature which reduces the effective maturity. The maturity date shown represents the final maturity date of the security. The interest rate is determined and reset by the issuer daily, weekly, or monthly depending upon the terms of the security. The rate shown is the rate in effect at period end. |
| 144A | The security may be resold in transactions exempt from registration, normally to qualified institutional buyers, pursuant to Rule 144A under the Securities Act of 1933. |
| (n) | The auction to set the interest rate on the security failed at period end due to insufficient investor interest. A failed auction does not itself cause a default. |
| %% | The security is issued on a when-issued basis. |
| ¤ | The security is issued in zero coupon form with no periodic interest payments. |
| § | The security is subject to a demand feature which reduces the effective maturity. |
| (l) | The issuer of the security is an affiliated person of the Fund as defined in the Investment Company Act of 1940. |
| (u) | The rate represents the 7-day annualized yield at period end. |
| ## | All or a portion of this security is segregated for when-issued securities. |
| (z) | Zero coupon security. The rate represents the current yield to maturity. |
| # | All or a portion of this security is segregated as collateral for investments in derivative instruments. |
| * | Cost for federal income tax purposes is $5,503,970,148 and unrealized gains (losses) consists of: |
| | | | |
Gross unrealized gains | | $ | 12,366,688 | |
Gross unrealized losses | | | (7,427,969 | ) |
| | | | |
Net unrealized gains | | $ | 4,938,719 | |
Report of Independent Registered Public Accounting Firm
Board of Trustees and Shareholders of
Wells Fargo Funds Trust:
We have audited the accompanying statement of assets and liabilities, including the summary portfolio of investments, of the Wells Fargo Intermediate Tax/AMT-Free Fund (formerly known as Wells Fargo Advantage Intermediate Tax/AMT-Free Fund) (the “Fund”), one of the funds constituting the Wells Fargo Funds Trust, as of June 30, 2016, and the related statement of operations for the year then ended, the statements of changes in net assets for each of the years in the two-year period then ended (collectively, the “financial statements”), the financial highlights for each of the years in the five-year period then ended (the financial statements and financial highlights are included in Item 1 of this Form N-CSR), and the portfolio of investments as of June 30, 2016 (included in Item 6 of this Form N-CSR). These financial statements, financial highlights and portfolio of investments are the responsibility of the Fund’s management. Our responsibility is to express an opinion on these financial statements, financial highlights and portfolio of investments based on our audits.
We conducted our audits in accordance with the standards of the Public Company Accounting Oversight Board (United States). Those standards require that we plan and perform the audit to obtain reasonable assurance about whether the financial statements, financial highlights, and portfolio of investments are free of material misstatement. An audit includes examining, on a test basis, evidence supporting the amounts and disclosures in the financial statements and portfolio of investments. Our procedures included confirmation of securities owned as of June 30, 2016, by correspondence with the custodian and brokers, or by other appropriate auditing procedures when replies from brokers were not received. An audit also includes assessing the accounting principles used and significant estimates made by management, as well as evaluating the overall financial statement presentation. We believe that our audits provide a reasonable basis for our opinion.
In our opinion, the financial statements, financial highlights, and portfolio of investments referred to above present fairly, in all material respects, the financial position of the Wells Fargo Intermediate Tax/AMT-Free Fund (formerly known as Wells Fargo Advantage Intermediate Tax/AMT-Free Fund), as of June 30, 2016, and the results of its operations for the year then ended, the changes in its net assets for each of the years in the two-year period then ended, and the financial highlights for each of the years in the five-year period then ended, in conformity with U.S. generally accepted accounting principles.

Boston, Massachusetts
August 25, 2016
Report of Independent Registered Public Accounting Firm
Board of Trustees and Shareholders of
Wells Fargo Funds Trust:
We have audited the accompanying statement of assets and liabilities, including the summary portfolio of investments, of the Wells Fargo Municipal Bond Fund (formerly known as Wells Fargo Advantage Municipal Bond Fund) (the “Fund”), one of the funds constituting the Wells Fargo Funds Trust, as of June 30, 2016, and the related statement of operations for the year then ended, the statements of changes in net assets for each of the years in the two-year period then ended (collectively, the “financial statements”), the financial highlights for each of the years in the five-year period then ended (the financial statements and financial highlights are included in Item 1 of this Form N-CSR), and the portfolio of investments as of June 30, 2016 (included in Item 6 of this Form N-CSR). These financial statements, financial highlights and portfolio of investments are the responsibility of the Fund’s management. Our responsibility is to express an opinion on these financial statements, financial highlights and portfolio of investments based on our audits.
We conducted our audits in accordance with the standards of the Public Company Accounting Oversight Board (United States). Those standards require that we plan and perform the audit to obtain reasonable assurance about whether the financial statements, financial highlights, and portfolio of investments are free of material misstatement. An audit includes examining, on a test basis, evidence supporting the amounts and disclosures in the financial statements and portfolio of investments. Our procedures included confirmation of securities owned as of June 30, 2016, by correspondence with the custodian and brokers, or by other appropriate auditing procedures when replies from brokers were not received. An audit also includes assessing the accounting principles used and significant estimates made by management, as well as evaluating the overall financial statement presentation. We believe that our audits provide a reasonable basis for our opinion.
In our opinion, the financial statements, financial highlights, and portfolio of investments referred to above present fairly, in all material respects, the financial position of the Wells Fargo Municipal Bond Fund (formerly known as Wells Fargo Advantage Municipal Bond Fund), as of June 30, 2016, and the results of its operations for the year then ended, the changes in its net assets for each of the years in the two-year period then ended, and the financial highlights for each of the years in the five-year period then ended, in conformity with U.S. generally accepted accounting principles.
Boston, Massachusetts
August 25, 2016
Report of Independent Registered Public Accounting Firm
Board of Trustees and Shareholders of
Wells Fargo Funds Trust:
We have audited the accompanying statement of assets and liabilities, including the summary portfolio of investments, of the Wells Fargo Ultra Short-Term Municipal Income Fund (formerly known as Wells Fargo Advantage Ultra Short-Term Municipal Income Fund) (the “Fund”), one of the funds constituting the Wells Fargo Funds Trust, as of June 30, 2016, and the related statement of operations for the year then ended, the statements of changes in net assets for each of the years in the two-year period then ended (collectively, the “financial statements”), the financial highlights for each of the years in the five-year period then ended (the financial statements and financial highlights are included in Item 1 of this Form N-CSR), and the portfolio of investments as of June 30, 2016 (included in Item 6 of this Form N-CSR). These financial statements, financial highlights and portfolio of investments are the responsibility of the Fund’s management. Our responsibility is to express an opinion on these financial statements, financial highlights and portfolio of investments based on our audits.
We conducted our audits in accordance with the standards of the Public Company Accounting Oversight Board (United States). Those standards require that we plan and perform the audit to obtain reasonable assurance about whether the financial statements, financial highlights, and portfolio of investments are free of material misstatement. An audit includes examining, on a test basis, evidence supporting the amounts and disclosures in the financial statements and portfolio of investments. Our procedures included confirmation of securities owned as of June 30, 2016, by correspondence with the custodian and brokers, or by other appropriate auditing procedures when replies from brokers were not received. An audit also includes assessing the accounting principles used and significant estimates made by management, as well as evaluating the overall financial statement presentation. We believe that our audits provide a reasonable basis for our opinion.
In our opinion, the financial statements, financial highlights, and portfolio of investments referred to above present fairly, in all material respects, the financial position of the Wells Fargo Ultra Short-Term Municipal Income Fund (formerly known as Wells Fargo Advantage Ultra Short-Term Municipal Income Fund), as of June 30, 2016, and the results of its operations for the year then ended, the changes in its net assets for each of the years in the two-year period then ended, and the financial highlights for each of the years in the five-year period then ended, in conformity with U.S. generally accepted accounting principles.
Boston, Massachusetts
August 25, 2016
| ITEM 7. | DISCLOSURE OF PROXY VOTING POLICIES AND PROCEDURES FOR CLOSED-END MANAGEMENT INVESTMENT COMPANIES |
Not applicable.
| ITEM 8. | PORTFOLIO MANAGERS OF CLOSED-END MANAGEMENT INVESTMENT COMPANIES |
Not applicable.
| ITEM 9. | PURCHASES OF EQUITY SECURITIES BY CLOSED-END MANAGEMENT INVESTMENT COMPANY AND AFFILIATED PURCHASERS |
Not applicable.
| ITEM 10. | SUBMISSION OF MATTERS TO A VOTE OF SECURITY HOLDERS |
There have been no material changes to the procedures by which shareholders may recommend nominees to the registrant’s Board of Trustees that have been implemented since the registrant’s last provided disclosure in response to the requirements of this Item.
| ITEM 11. | CONTROLS AND PROCEDURES |
(a) The President and Treasurer have concluded that the Wells Fargo Funds Trust (the “Trust”) disclosure controls and procedures (as defined in Rule 30a-3(c) under the Investment Company Act of 1940) provide reasonable assurances that material information relating to the Trust is made known to them by the appropriate persons based on their evaluation of these controls and procedures as of a date within 90 days of the filing of this report.
(b) There were no significant changes in the Trust’s internal controls over financial reporting (as defined in Rule 30a-3(d) under the Investment Company Act of 1940) that occurred during the second fiscal quarter of the period covered by this report that materially affected, or is reasonably likely to materially affect, the registrant’s internal control over financial reporting.
(a)(1) Code of Ethics pursuant to Item 2 of Form N-CSR is filed and attached hereto as Exhibit COE.
(a)(2) Certification pursuant to Rule 30a-2(a) under the Investment Company Act of 1940 (17 CFR 270.30a-2(a)) is filed and attached hereto as Exhibit 99.CERT.
(a)(3) Not applicable.
(b) Certification pursuant to Rule 30a-2(b) under the Investment Company Act of 1940 (17 CFR 270.30a-2(b)) is filed and attached hereto as Exhibit 99.906CERT.
SIGNATURES
Pursuant to the requirements of the Securities Exchange Act of 1934 and the Investment Company Act of 1940, the registrant has duly caused this report to be signed on its behalf by the undersigned, thereunto duly authorized.
| | |
| Wells Fargo Funds Trust |
| |
| By: | | /s/ Karla M. Rabusch |
| |
| | Karla M. Rabusch |
| | President |
| |
| Date: | | August 25, 2016 |
Pursuant to the requirements of the Securities Exchange Act of 1934 and the Investment Company Act of 1940, this report has been signed below by the following persons on behalf of the registrant and in the capacities and on the date indicated.
| | |
| Wells Fargo Funds Trust |
| |
| By: | | /s/ Karla M. Rabusch |
| |
| | Karla M. Rabusch |
| | President |
| |
| Date: | | August 25, 2016 |
| |
| By: | | /s/ Nancy Wiser |
| |
| | Nancy Wiser |
| | Treasurer |
| |
| Date: | | August 25, 2016 |
| |
| By: | | /s/ Jeremy DePalma |
| |
| | Jeremy DePalma |
| | Treasurer |
| |
| Date: | | August 25, 2016 |