
UNITED STATES
SECURITIES AND EXCHANGE COMMISSION
Washington, D.C. 20549
FORM N-CSR
CERTIFIED SHAREHOLDER REPORT OF REGISTERED
MANAGEMENT INVESTMENT COMPANIES
Investment Company Act file number: 811-09253
Wells Fargo Funds Trust
(Exact name of registrant as specified in charter)
525 Market St., San Francisco, CA 94105
(Address of principal executive offices) (Zip code)
C. David Messman
Wells Fargo Funds Management, LLC
525 Market St., San Francisco, CA 94105
(Name and address of agent for service)
Registrant’s telephone number, including area code: 800-222-8222
Date of fiscal year end: May 31
Registrant is making a filing for 28 of its series:
Wells Fargo Growth Balanced Fund, Wells Fargo Moderate Balanced Fund, Wells Fargo Dynamic Target Today Fund, Wells Fargo Dynamic Target 2015 Fund, Wells Fargo Dynamic Target 2020 Fund, Wells Fargo Dynamic Target 2025 Fund, Wells Fargo Dynamic Target 2030 Fund, Wells Fargo Dynamic Target 2035 Fund, Wells Fargo Dynamic Target 2040 Fund, Wells Fargo Dynamic Target 2045 Fund, Wells Fargo Dynamic Target 2050 Fund, Wells Fargo Dynamic Target 2055 Fund, Wells Fargo Dynamic Target 2060 Fund, Wells Fargo C&B Large Cap Value Fund, Wells Fargo Diversified Equity Fund, Wells Fargo Emerging Growth Fund, Wells Fargo Index Fund, Wells Fargo International Value Fund, Wells Fargo Small Company Growth Fund, Wells Fargo Small Company Value Fund, Wells Fargo Core Bond Fund, Wells Fargo Real Return Fund, Wells Fargo WealthBuilder Conservative Allocation Portfolio, Wells Fargo WealthBuilder Moderate Balanced Portfolio, Wells Fargo WealthBuilder Growth Balanced Portfolio, Wells Fargo WealthBuilder Growth Allocation Portfolio, Wells Fargo WealthBuilder Equity Portfolio, and Wells Fargo WealthBuilder Tactical Equity Portfolio.
Date of reporting period: May 31, 2016
ITEM 1. REPORT TO STOCKHOLDERS
Annual Report
May 31, 2016

Allocation Funds

| n | | Wells Fargo Growth Balanced Fund |
| n | | Wells Fargo Moderate Balanced Fund |

Reduce clutter. Save trees.
Sign up for electronic delivery of prospectuses and shareholder reports at wellsfargo.com/advantagedelivery
Contents
| * | A complete schedule of portfolio holdings as of the report date may be obtained, free of charge, by accessing the following website: https://www.wellsfargofunds.com/assets/edocs/regulatory/holdings/index-ann.pdf or by calling Wells Fargo Funds at 1-800-222-8222. This complete schedule, filed on Form N-CSR, is also available on the SEC’s website at sec.gov. |
| ** | A complete schedule of portfolio holdings as of the report date may be obtained, free of charge, by accessing the following website: https://www.wellsfargofunds.com/assets/edocs/regulatory/holdings/core-bond-ann.pdf or by calling Wells Fargo Funds at 1-800-222-8222. This complete schedule, filed on Form N-CSR, is also available on the SEC’s website at sec.gov. |
The views expressed and any forward-looking statements are as of May 31, 2016, unless otherwise noted, and are those of the Fund managers and/or Wells Fargo Funds Management, LLC. Discussions of individual securities, or the markets generally, or any Wells Fargo Fund are not intended as individual recommendations. Future events or results may vary significantly from those expressed in any forward-looking statements. The views expressed are subject to change at any time in response to changing circumstances in the market. Wells Fargo Funds Management, LLC and the Fund disclaim any obligation to publicly update or revise any views expressed or forward-looking statements.
NOT FDIC INSURED ¡ NO BANK GUARANTEE ¡ MAY LOSE VALUE
| | | | |
| 2 | | Wells Fargo Allocation Funds | | Letter to shareholders (unaudited) |

Karla M. Rabusch
President
Wells Fargo Funds
During much of the period, global equity, bond, and currency markets were volatile as recessionary pressures and diverging central bank policies concerned investors.
During the fourth quarter of 2015, Japan’s economy contracted, China’s manufacturing sector retrenched, and growth appeared to slow in Europe.
Dear Valued Shareholder:
We are pleased to offer you this annual report for the Wells Fargo Allocation Funds for the 12-month period that ended May 31, 2016. During much of the period, global equity, bond, and currency markets were volatile as recessionary pressures and diverging central bank policies concerned investors. As the period closed, investor confidence appeared to improve based on favorable economic data in key markets and central bank monetary policies that were intended to support increased business activity.
Shifting investor sentiment reflected changing economic and business data.
Early in the period, oil prices declined after a spring rally, negotiations about Greece’s ability to repay its sovereign debt grew contentious, and the U.S. dollar strengthened. By July 2015, equity markets were declining, led by stocks in China, which endured the largest one-day loss since 2007 on July 27, 2015.
The S&P 500 Index,1 a common measure of U.S. stock performance, fell into correction territory—defined as a loss of 10% or more—during August 2015 before recovering somewhat. The index retested the August lows in late September before recovering most of its year-to-date-2015 losses from October through December. As anticipated, the U.S. Federal Reserve (Fed) increased the federal funds rate in December and suggested it planned to pursue additional increases in 2016. During the first six weeks of 2016, the index suffered the worst loss to open a year on record before trending higher. By the end of the 12-month reporting period, the index recorded a 1.72% gain.
Overseas, the Morgan Stanley Capital International (MSCI) All Country World Index (ACWI) ex USA Index (Net)2 and the MSCI Emerging Markets (EM) Index (Net)3 recorded negative returns. In August 2015, China allowed its currency’s value to decline in an attempt to bolster exports. The U.S. dollar strengthened, which negatively affected investment returns and U.S. corporate profits earned overseas. During the fourth quarter of 2015, Japan’s economy contracted, China’s manufacturing sector retrenched, and growth appeared to slow in Europe.
Global equity markets hit low points before starting to rebound in the middle of February 2016 when business data improved and central bankers reasserted their commitment to initiatives intended to encourage economic activity. The European Central Bank (ECB) pushed the deposit interest rate further into negative territory. The Bank of Japan (BOJ) followed the ECB’s lead by setting a negative deposit rate. Negative deposit interest rates are intended to encourage banks to lend assets rather than keep them on deposit. The People’s Bank of China (PBOC) reduced reserve ratios, which also was intended to encourage lending. The ECB expanded its bond-buying program, which injects liquidity into the markets and encourages investment.
For the 12-month reporting period, the MSCI ACWI ex USA Index (Net) and MSCI EM Index (Net) recorded returns of -11.39% and -17.63%, respectively.
| 1 | The S&P 500 Index consists of 500 stocks chosen for market size, liquidity, and industry group representation. It is a market-value-weighted index with each stock’s weight in the index proportionate to its market value. You cannot invest directly in an index. |
| 2 | The Morgan Stanley Capital International (MSCI) All Country World Index (ACWI) ex USA Index (Net) is a free-float-adjusted market-capitalization-weighted index that is designed to measure the equity market performance of developed markets, excluding the U.S. and Canada. Source: MSCI. MSCI makes no express or implied warranties or representations and shall have no liability whatsoever with respect to any MSCI data contained herein. The MSCI data may not be further redistributed or used as a basis for other indexes or any securities or financial products. This report is not approved, reviewed, or produced by MSCI. You cannot invest directly in an index. |
| 3 | The MSCI Emerging Markets (EM) Index (Net) is a free-float-adjusted market-capitalization-weighted index that is designed to measure the equity market performance of emerging markets. The MSCI EM Index (Net) consists of the following 23 emerging markets country indexes: Brazil, Chile, China, Colombia, Czech Republic, Egypt, Greece, Hungary, India, Indonesia, Korea, Malaysia, Mexico, Peru, the Philippines, Poland, Qatar, Russia, South Africa, Taiwan, Thailand, Turkey, and United Arab Emirates. You cannot invest directly in an index. |
| | | | | | |
| Letter to shareholders (unaudited) | | Wells Fargo Allocation Funds | | | 3 | |
A December federal funds rate increase marked divergence of central bank policies.
Bond markets were volatile as well. The Fed’s decision to tighten credit conditions through higher interest rates contrasted with actions by the ECB, the PBOC, and the BOJ. In January 2016, amid falling stock markets, U.S. corporate profits declined for the second consecutive quarter. The Fed expressed hesitancy about additional credit tightening in the near term, which investors appeared to read as accommodative of business activity. Overall, policy actions of central banks and intermittently positive economic data heartened investors as the period drew to a close.
Bond markets benefited during the period, with the Barclays Global Aggregate ex U.S. Dollar Bond Index4 gaining 7.25%, the Barclays U.S. Aggregate Bond Index5 gaining 2.99%, and the Barclays U.S. Treasury Index6 adding 3.01% during the period.
Don’t let short-term uncertainty derail long-term investment goals.
Periods of investment uncertainty can present challenges, but experience has taught us that maintaining long-term investment goals can be an effective way to plan for the future. To help you create a sound strategy based on your personal goals and risk tolerance, Wells Fargo Funds offers more than 100 mutual funds spanning a wide range of asset classes and investment styles. Although diversification cannot guarantee an investment profit or prevent losses, we believe it can be an effective way to manage investment risk and potentially smooth out overall portfolio performance. We encourage investors to know their investments and to understand that appropriate levels of risk-taking may unlock opportunities.
Thank you for choosing to invest with Wells Fargo Funds. We appreciate your confidence in us and remain committed to helping you meet your financial needs.
Sincerely,

Karla M. Rabusch
President
Wells Fargo Funds
Notice to shareholders
British Exit from European Union (“Brexit”)
On June 23, 2016, the United Kingdom (UK) voted to leave the European Union (EU). It is expected that the UK’s exit from the EU will take place within two years after giving formal notice to the EU of its intention to withdraw; however, the exact timeframe is unknown. There is considerable uncertainty about how the UK exit from the EU will be conducted, how negotiations of necessary treaties and trade agreements will proceed or how the financial markets will react. In addition, it is not yet known whether Brexit will increase the likelihood of other countries seeking to depart the EU. Immediately following the vote, markets in the UK, Europe and the world were negatively impacted. In light of the uncertainties surrounding the impact of Brexit on the broader global economy, the negative impact could be significant, potentially resulting in increased volatility and illiquidity and lower economic growth for companies that rely significantly on Europe for their business activities and revenues. Any further exits from the EU, or the possibility of such exits, would likely cause additional market disruption globally and introduce new legal and regulatory uncertainties.
For further information about your Fund, contact your investment professional, visit our website at wellsfargofunds.com, or call us directly at 1-800-222-8222. We are available 24 hours a day, 7 days a week.
| 4 | The Barclays Global Aggregate ex U.S. Dollar Bond Index tracks an international basket of government, corporate, agency, and mortgage-related bonds. You cannot invest directly in an index. |
| 5 | The Barclays U.S. Aggregate Bond Index is a broad-based benchmark that measures the investment-grade, U.S. dollar–denominated, fixed-rate taxable bond market, including Treasuries, government-related and corporate securities, mortgage-based securities (agency fixed-rate and hybrid adjustable-rate mortgage pass-throughs), asset-backed securities, and commercial mortgage-backed securities. You cannot invest directly in an index. |
| 6 | The Barclays U.S. Treasury Index is an unmanaged index of prices of U.S. Treasury bonds with maturities of 1 to 30 years. You cannot invest directly in an index. |
| | | | |
| 4 | | Wells Fargo Allocation Funds | | Performance highlights (unaudited) |
Wells Fargo Growth Balanced Fund1
Investment objective
The Fund seeks total return, consisting of capital appreciation and current income.
Manager
Wells Fargo Funds Management, LLC
Subadviser
Wells Capital Management Incorporated
Subadvisers for the affiliated master portfolios
Artisan Partners Limited Partnership
Cooke & Bieler, L.P.
Galliard Capital Management, Inc.
Golden Capital Management, LLC
LSV Asset Management
Peregrine Capital Management, Inc.
Phocas Financial Corporation
Wells Capital Management Incorporated
Portfolio managers
Kandarp Acharya, CFA®, FRM
Thomas C. Biwer, CFA®
Aldo Ceccarelli, CFA®
Christian Chan, CFA®
Erik Sens, CFA®
Average annual total returns (%) as of May 31, 2016
| | | | | | | | | | | | | | | | | | | | | | | | | | | | | | | | | | |
| | | | | Including sales charge | | | Excluding sales charge | | | Expense ratios2 (%) | |
| | | Inception date | | 1 year | | | 5 year | | | 10 year | | | 1 year | | | 5 year | | | 10 year | | | Gross | | | Net3 | |
| Class A (WFGBX) | | 10-14-1998 | | | (6.82 | ) | | | 6.09 | | | | 4.72 | | | | (1.14 | ) | | | 7.36 | | | | 5.34 | | | | 1.35 | | | | 1.20 | |
| Class B (NVGRX)* | | 10-1-1998 | | | (6.87 | ) | | | 6.23 | | | | 4.78 | | | | (1.87 | ) | | | 6.55 | | | | 4.78 | | | | 2.10 | | | | 1.95 | |
| Class C (WFGWX) | | 10-1-1998 | | | (2.88 | ) | | | 6.55 | | | | 4.55 | | | | (1.88 | ) | | | 6.55 | | | | 4.55 | | | | 2.10 | | | | 1.95 | |
| Administrator Class (NVGBX) | | 11-11-1994 | | | – | | | | – | | | | – | | | | (0.86 | ) | | | 7.62 | | | | 5.60 | | | | 1.27 | | | | 0.95 | |
| Growth Balanced Composite Index4 | | – | | | – | | | | – | | | | – | | | | 0.45 | | | | 7.68 | | | | 6.33 | | | | – | | | | – | |
| Barclays U.S. Aggregate Bond Index5 | | – | | | – | | | | – | | | | – | | | | 2.99 | | | | 3.33 | | | | 4.97 | | | | – | | | | – | |
| MSCI EAFE Index (Net)6 | | – | | | – | | | | – | | | | – | | | | (9.68 | ) | | | 2.12 | | | | 1.92 | | | | – | | | | – | |
| Russell 1000® Growth Index7 | | – | | | – | | | | – | | | | – | | | | 1.61 | | | | 12.11 | | | | 8.78 | | | | – | | | | – | |
| Russell 1000® Value Index8 | | – | | | – | | | | – | | | | – | | | | (0.06 | ) | | | 10.70 | | | | 6.11 | | | | – | | | | – | |
| Russell 2000® Index9 | | – | | | – | | | | – | | | | – | | | | (5.97 | ) | | | 7.86 | | | | 6.27 | | | | – | | | | – | |
| S&P 500 Index10 | | – | | | – | | | | – | | | | – | | | | 1.72 | | | | 11.67 | | | | 7.41 | | | | – | | | | – | |
| * | | Class B shares are closed to investment, except in connection with the reinvestment of any distributions and permitted exchanges. |
Figures quoted represent past performance, which is no guarantee of future results, and do not reflect taxes that a shareholder may pay on fund distributions or the redemption of fund shares. Investment return and principal value of an investment will fluctuate so that an investor’s shares, when redeemed, may be worth more or less than their original cost. Performance shown without sales charges would be lower if sales charges were reflected. Current performance may be lower or higher than the performance data quoted, which assumes the reinvestment of dividends and capital gains. Current month-end performance is available on the Fund’s website, wellsfargofunds.com.
Index returns do not include transaction costs associated with buying and selling securities, any mutual fund fees or expenses, or any taxes. It is not possible to invest directly in an index.
For Class A shares, the maximum front-end sales charge is 5.75%. For Class B shares, the maximum contingent deferred sales charge is 5.00%. For Class C shares, the maximum contingent deferred sales charge is 1.00%. Performance including a contingent deferred sales charge assumes the sales charge for the corresponding time period. Administrator Class shares are sold without a front-end sales charge or contingent deferred sales charge.
Please see footnotes on page 6.
| | | | | | |
| Performance highlights (unaudited) | | Wells Fargo Allocation Funds | | | 5 | |
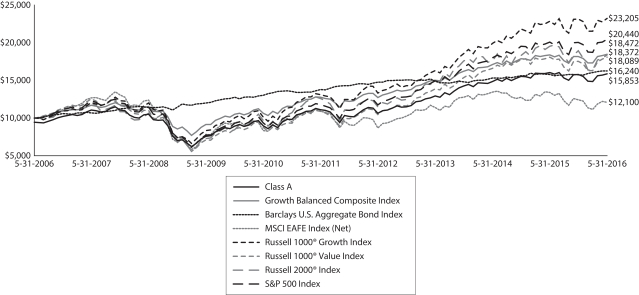
Wells Fargo Growth Balanced Fund (continued)
|
| Growth of $10,000 investment as of May 31, 201611 |
|
 |
Balanced funds may invest in stocks and bonds. Stock values fluctuate in response to the activities of individual companies and general market and economic conditions. Bond values fluctuate in response to the financial condition of individual issuers, general market and economic conditions, and changes in interest rates. Changes in market conditions and government policies may lead to periods of heightened volatility in the bond market and reduced liquidity for certain bonds held by the Fund. In general, when interest rates rise, bond values fall and investors may lose principal value. Interest-rate changes and their impact on the Fund and its share price can be sudden and unpredictable. The use of derivatives may reduce returns and/or increase volatility. Certain investment strategies tend to increase the total risk of an investment (relative to the broader market). The Fund is exposed to foreign investment risk, mortgage- and asset-backed securities risk, and smaller-company securities risk. Consult the Fund’s prospectus for additional information on these and other risks.
Please see footnotes on page 6.
| | | | |
| 6 | | Wells Fargo Allocation Funds | | Performance highlights (unaudited) |
Wells Fargo Growth Balanced Fund (continued)
| 1 | The Fund is a gateway blended fund that invests all of its assets in two or more affiliated master portfolios of Wells Fargo Master Trust in varying proportions. References to the investment activities of the Fund are intended to refer to the investment activities of the affiliated master portfolios in which it invests. |
| 2 | Reflects the expense ratios as stated in the most recent prospectuses, which include the impact of 0.51% in net expenses from affiliated master portfolios. The expense ratios shown are subject to change and may differ from the annualized expense ratios shown in the financial highlights of this report. |
| 3 | The manager has contractually committed through September 30, 2016, to waive fees and/or reimburse expenses to the extent necessary to cap the Fund’s Total Annual Fund Operating Expenses After Fee Waiver at the amounts shown. After this time, the cap may be increased or the commitment to maintain the cap may be terminated only with the approval of the Board of Trustees. Brokerage commissions, stamp duty fees, interest, taxes, acquired fund fees and expenses, and extraordinary expenses are excluded from the expense cap. Net expenses from the affiliated master portfolios are included in the expense cap. Without this cap, the Fund’s returns would have been lower. |
| 4 | Source: Wells Fargo Funds Management, LLC. The Growth Balanced Composite Index is weighted 35% in the Barclays U.S. Aggregate Bond Index, 9.75% in the MSCI EAFE Index (Net), 16.25% in the Russell 1000® Growth Index, 16.25% in the Russell 1000® Value Index, 6.50% in the Russell 2000® Index and 16.25% in the S&P 500 Index. You cannot invest directly in an index. |
| 5 | The Barclays U.S. Aggregate Bond Index is a broad-based benchmark that measures the investment-grade, U.S. dollar–denominated, fixed-rate taxable bond market, including Treasuries, government-related and corporate securities, mortgage-backed securities (agency fixed-rate and hybrid adjustable-rate mortgage pass-throughs), asset-backed securities, and commercial mortgage-backed securities. You cannot invest directly in an index. |
| 6 | The Morgan Stanley Capital International (MSCI) Europe, Australasia, Far East (EAFE) Index (Net) is a free-float-adjusted market-capitalization-weighted index that is designed to measure the equity market performance of developed markets, excluding the U.S. and Canada. The MSCI EAFE Index (Net) consists of the following 21 developed markets country indexes: Australia, Austria, Belgium, Denmark, Finland, France, Germany, Hong Kong, Ireland, Israel, Italy, Japan, the Netherlands, New Zealand, Norway, Portugal, Singapore, Spain, Sweden, Switzerland, and the United Kingdom. Source: MSCI. MSCI makes no representations and shall have no liability whatsoever with respect to any MSCI data contained herein. The MSCI data may not be further redistributed or used as a basis for other indexes or any securities or financial products. This report is not approved, reviewed, or produced by MSCI. You cannot invest directly in an index. |
| 7 | The Russell 1000® Growth Index measures the performance of those Russell 1000 companies with higher price-to-book ratios and higher forecasted growth values. You cannot invest directly in an index. |
| 8 | The Russell 1000® Value Index measures the performance of those Russell 1000 companies with lower price-to-book ratios and lower forecasted growth values. You cannot invest directly in an index. |
| 9 | The Russell 2000® Index measures the performance of the 2,000 smallest companies in the Russell 3000® Index, which represents approximately 8% of the total market capitalization of the Russell 3000® Index. You cannot invest directly in an index. |
| 10 | The S&P 500 Index consists of 500 stocks chosen for market size, liquidity, and industry group representation. It is a market-value-weighted index with each stock’s weight in the index proportionate to its market value. You cannot invest directly in an index. |
| 11 | The chart compares the performance of Class A shares for the most recent ten years with the Growth Balanced Composite Index, the Barclays U.S. Aggregate Bond Index, the MSCI EAFE Index (Net), the Russell 1000® Growth Index, the Russell 1000® Value Index, the Russell 2000® Index, and the S&P 500 Index. The chart assumes a hypothetical $10,000 investment in Class A and reflects all operating expenses and assumes the maximum initial sales charge of 5.75%. |
| 12 | The MSCI All Country World Index (ACWI) ex USA Index (Net) is a free-float-adjusted market capitalization weighted index that is designed to measure the equity market performance of developed markets, excluding the U.S. and Canada. You cannot invest directly in an index. |
| 13 | The MSCI Emerging Markets (EM) Index (Net) is a free-float-adjusted market-capitalization-weighted index that is designed to measure the equity market performance of emerging markets. The MSCI EM Index (Net) consists of the following 23 emerging markets country indexes: Brazil, Chile, China, Colombia, Czech Republic, Egypt, Greece, Hungary, India, Indonesia, Korea, Malaysia, Mexico, Peru, the Philippines, Poland, Qatar, Russia, South Africa, Taiwan, Thailand, Turkey, and United Arab Emirates. You cannot invest directly in an index. |
| 14 | The ten largest holdings, excluding cash and cash equivalents, are calculated based on the value of the securities of the affiliated master portfolios allocable to the Fund divided by the total net assets of the Fund. Holdings are subject to change and may have changed since the date specified. |
| 15 | Current target allocation includes the effect of any tactical futures overlay that may be in place. These amounts are subject to change and may have changed since the date specified. |
| | | | | | |
| Performance highlights (unaudited) | | Wells Fargo Allocation Funds | | | 7 | |
Wells Fargo Growth Balanced Fund (continued)
MANAGER’S DISCUSSION
Fund highlights
| n | | The Fund underperformed the Growth Balanced Composite Index for the 12-month period that ended May 31, 2016. |
| n | | Two equity market corrections, defined as a loss of 10% or more, during the 12-month period proved to be a challenging environment for the underlying managers. The Fund’s equity investments overall underperformed their benchmarks. The two market corrections served to discourage equity investors and stock prices suffered as a result. While rallies subsequent to each correction benefited stock prices, overall equity prices in global markets, particularly outside of the U.S., suffered. |
| n | | Tactical asset allocation added to performance through the period. During market corrections in August 2015 and January 2016, the portfolio management team tactically shifted the portfolio’s allocation during periods of depressed equity prices, which added value. |
| n | | The Fund’s bond investments added value on an absolute basis but underperformed relative to the benchmark. |
Equity markets experienced two corrections during the previous 12 months.
Global equity markets experienced two corrections during the previous 12 months. Amid fears of contagion from international markets, investors sold U.S. equities heavily during August 2015 and January 2016. In August, the contraction was fueled by fears of collapsing growth in China. In January, in addition to renewed fears of lower output in China and softer domestic economic data, oil prices dropped below $30 a barrel.
The second correction, which followed the first hike in the federal funds interest rate in a decade, raised concerns that the U.S. Federal Reserve acted too hastily. U.S. investors feared a contracting global economy coupled with the currency and business effects of a rate hike would drive down international demand for U.S. goods. Despite the headwinds, the S&P 500 Index ended the 12-month period up 1.72%.
The European Central Bank (ECB) and the Bank of Japan (BOJ) increased monetary stimulus programs that were intended to bolster their local economies. Brazil’s business and political woes continued and China reduced its economic growth forecasts, which tended to restrain investor enthusiasm for international investments.
U.S. bonds, as measured by the Barclays U.S. Aggregate Bond Index5 rose 2.99%, outperforming large-cap stocks. Small-cap stocks, as measured by the Russell 2000® Index9 returned -5.97%. International stocks returned -11.39%, as measured by the MSCI All Country World Index (ACWI) ex USA Index (Net).12 Within international stocks, emerging markets stocks fell the most at -17.63%, as measured by the MSCI Emerging Markets (EM) Index (Net).13
Please see footnotes on page 6.
| | | | |
| 8 | | Wells Fargo Allocation Funds | | Performance highlights (unaudited) |
Wells Fargo Growth Balanced Fund (continued)
| | | | |
| Ten largest holdings (%) as of May 31, 201614 | |
Facebook Incorporated Class A | | | 1.04 | |
Apple Incorporated | | | 1.02 | |
Amazon.com Incorporated | | | 0.98 | |
Alphabet Incorporated Class A | | | 0.92 | |
Exxon Mobil Corporation | | | 0.81 | |
JPMorgan Chase & Company | | | 0.67 | |
Medtronic plc | | | 0.66 | |
Alphabet Incorporated Class C | | | 0.65 | |
Visa Incorporated Class A | | | 0.65 | |
Microsoft Corporation | | | 0.62 | |
The Fund seeks to enhance returns by using a combination of inputs from multiple quantitative and qualitative factors in order to alter the effective allocation between stocks and bonds.
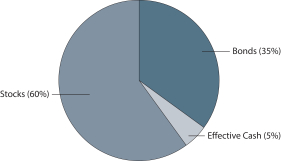
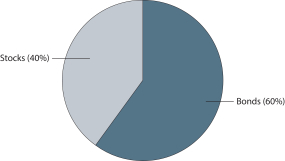
The Fund’s neutral allocation is 60% stocks and 40% bonds. During the period, the portfolio management team took tactical advantage of equity price movements. Through our overlays, we tactically increased equity exposures through the first correction in August 2015, increasing equity holdings as Chinese and U.S. markets declined. As the market correction reversed in the following months, the overlay added value to the Fund’s performance. Again in January and February 2016, we saw a similar correction and used our overlays to overweight equities. Through effective execution of our hedging strategy, the team again added to the Fund’s returns.
|
| Current target allocation as of May 31, 201615 |
|
 |
|
| Neutral target allocation |
|
 |
We remain cautiously optimistic about the longer-term outlook for stocks.
Bond yields continue to be depressed. The potential for future interest-rate hikes may be a headwind to overall increases in output in the general U.S. economy. Especially with yields at historical lows, there continues to be a duration risk in bonds.
Internationally, the accommodative policies of the ECB and BOJ are intended to bolster their local economies. We believe these central banks will continue to support growth in their economies, which should be supportive of asset prices. In addition to developed, international economies, emerging markets stocks are at low valuation levels not seen in years. Finally, domestic stocks and the U.S. economy have shown resilience in the past year. We look to market signals and economic releases to help inform the changing state of U.S. markets.
Please see footnotes on page 6.
This page is intentionally left blank.
| | | | |
| 10 | | Wells Fargo Allocation Funds | | Performance highlights (unaudited) |
Wells Fargo Moderate Balanced Fund1
Investment objective
The Fund seeks total return, consisting of current income and capital appreciation.
Manager
Wells Fargo Funds Management, LLC
Subadviser
Wells Capital Management Incorporated
Subadvisers for the affiliated master portfolios
Artisan Partners Limited Partnership
Cooke & Bieler, L.P.
Galliard Capital Management, Inc.
Golden Capital Management, LLC
LSV Asset Management
Peregrine Capital Management, Inc.
Phocas Financial Corporation
Wells Capital Management Incorporated
Portfolio managers
Kandarp Acharya, CFA®, FRM
Thomas C. Biwer, CFA®
Aldo Ceccarelli, CFA®
Christian Chan, CFA®
Erik Sens, CFA®
Average annual total returns (%) as of May 31, 2016
| | | | | | | | | | | | | | | | | | | | | | | | | | | | | | | | | | |
| | | | | Including sales charge | | | Excluding sales charge | | | Expense ratios2 (%) | |
| | | Inception date | | 1 year | | | 5 year | | | 10 year | | | 1 year | | | 5 year | | | 10 year | | | Gross | | | Net3 | |
| Class A (WFMAX) | | 1-30-2004 | | | (5.43 | ) | | | 4.55 | | | | 4.29 | | | | 0.34 | | | | 5.80 | | | | 4.91 | | | | 1.32 | | | | 1.15 | |
| Class B (WMOBX)* | | 1-30-2004 | | | (5.43 | ) | | | 4.67 | | | | 4.35 | | | | (0.43 | ) | | | 5.00 | | | | 4.35 | | | | 2.07 | | | | 1.90 | |
| Class C (WFBCX) | | 1-30-2004 | | | (1.44 | ) | | | 4.99 | | | | 4.12 | | | | (0.44 | ) | | | 4.99 | | | | 4.12 | | | | 2.07 | | | | 1.90 | |
| Administrator Class (NVMBX) | | 11-11-1994 | | | – | | | | – | | | | – | | | | 0.59 | | | | 6.05 | | | | 5.16 | | | | 1.24 | | | | 0.90 | |
| Moderate Balanced Composite Index4 | | – | | | – | | | | – | | | | – | | | | 1.14 | | | | 5.61 | | | | 5.44 | | | | – | | | | – | |
| Barclays U.S. Aggregate Bond Index5 | | – | | | – | | | | – | | | | – | | | | 2.99 | | | | 3.33 | | | | 4.97 | | | | – | | | | – | |
| Barclays U.S. Short Treasury 9–12 Months Index6 | | – | | | – | | | | – | | | | – | | | | 0.41 | | | | 0.29 | | | | 1.65 | | | | – | | | | – | |
| MSCI EAFE Index (Net)7 | | – | | | – | | | | – | | | | – | | | | (9.68 | ) | | | 2.12 | | | | 1.92 | | | | – | | | | – | |
| Russell 1000® Growth Index8 | | – | | | – | | | | – | | | | – | | | | 1.61 | | | | 12.11 | | | | 8.78 | | | | – | | | | – | |
| Russell 1000® Value Index9 | | – | | | – | | | | – | | | | – | | | | (0.06 | ) | | | 10.70 | | | | 6.11 | | | | – | | | | – | |
| Russell 2000® Index10 | | – | | | – | | | | – | | | | – | | | | (5.97 | ) | | | 7.86 | | | | 6.27 | | | | – | | | | – | |
| S&P 500 Index11 | | – | | | – | | | | – | | | | – | | | | 1.72 | | | | 11.67 | | | | 7.41 | | | | – | | | | – | |
| * | | Class B shares are closed to investment, except in connection with the reinvestment of any distributions and permitted exchanges. |
Figures quoted represent past performance, which is no guarantee of future results, and do not reflect taxes that a shareholder may pay on fund distributions or the redemption of fund shares. Investment return and principal value of an investment will fluctuate so that an investor’s shares, when redeemed, may be worth more or less than their original cost. Performance shown without sales charges would be lower if sales charges were reflected. Current performance may be lower or higher than the performance data quoted, which assumes the reinvestment of dividends and capital gains. Current month-end performance is available on the Fund’s website, wellsfargofunds.com.
Index returns do not include transaction costs associated with buying and selling securities, any mutual fund fees or expenses, or any taxes. It is not possible to invest directly in an index.
For Class A shares, the maximum front-end sales charge is 5.75%. For Class B shares, the maximum contingent deferred sales charge is 5.00%. For Class C shares, the maximum contingent deferred sales charge is 1.00%. Performance including a contingent deferred sales charge assumes the sales charge for the corresponding time period. Administrator Class shares are sold without a front-end sales charge or contingent deferred sales charge.
Please see footnotes on page 12.
| | | | | | |
| Performance highlights (unaudited) | | Wells Fargo Allocation Funds | | | 11 | |
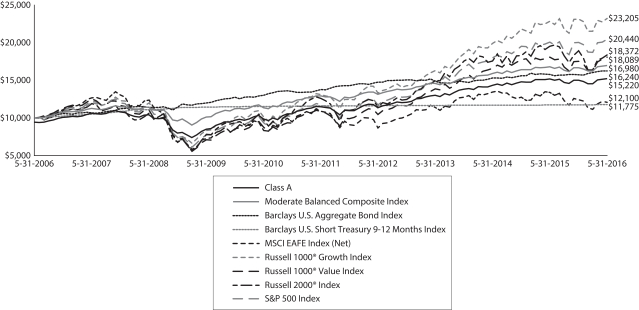
Wells Fargo Moderate Balanced Fund (continued)
|
| Growth of $10,000 investment as of May 31, 201612 |
|
 |
Balanced funds may invest in stocks and bonds. Stock values fluctuate in response to the activities of individual companies and general market and economic conditions. Bond values fluctuate in response to the financial condition of individual issuers, general market and economic conditions, and changes in interest rates. Changes in market conditions and government policies may lead to periods of heightened volatility in the bond market and reduced liquidity for certain bonds held by the Fund. In general, when interest rates rise, bond values fall and investors may lose principal value. Interest-rate changes and their impact on the Fund and its share price can be sudden and unpredictable. The use of derivatives may reduce returns and/or increase volatility. Certain investment strategies tend to increase the total risk of an investment (relative to the broader market). The Fund is exposed to mortgage- and asset-backed securities risk. Consult the Fund’s prospectus for additional information on these and other risks.
Please see footnotes on page 12.
| | | | |
| 12 | | Wells Fargo Allocation Funds | | Performance highlights (unaudited) |
Wells Fargo Moderate Balanced Fund (continued)
| 1 | The Fund is a gateway blended fund that invests all of its assets in two or more affiliated master portfolios of Wells Fargo Master Trust in varying proportions. References to the investment activities of the Fund are intended to refer to the investment activities of the affiliated master portfolios in which it invests. |
| 2 | Reflects the expense ratios as stated in the most recent prospectuses, which include the impact of 0.47% in net expenses from affiliated master portfolios. The expense ratios shown are subject to change and may differ from the annualized expense ratios shown in the financial highlights of this report. |
| 3 | The manager has contractually committed through September 30, 2016, to waive fees and/or reimburse expenses to the extent necessary to cap the Fund’s Total Annual Fund Operating Expenses After Fee Waiver at the amounts shown. After this time, the cap may be increased or the commitment to maintain the cap may be terminated only with the approval of the Board of Trustees. Brokerage commissions, stamp duty fees, interest, taxes, acquired fund fees and expenses, and extraordinary expenses are excluded from the expense cap. Net expenses from the affiliated master portfolios are included in the expense cap. Without this cap, the Fund’s returns would have been lower. |
| 4 | Source: Wells Fargo Funds Management, LLC. The Moderate Balanced Composite Index is weighted 45% in the Barclays U.S. Aggregate Bond Index, 15% in the Barclays U.S. Short Treasury 9-12 Months Index, 6% in the MSCI EAFE Index (Net), 10% in the Russell 1000® Growth Index, 10% in the Russell 1000® Value Index, 4% in the Russell 2000® Index and 10% in the S&P 500 Index. You cannot invest directly in an index. |
| 5 | The Barclays U.S. Aggregate Bond Index is a broad-based benchmark that measures the investment-grade, U.S. dollar–denominated, fixed-rate taxable bond market, including Treasuries, government-related and corporate securities, mortgage-backed securities (agency fixed-rate and hybrid adjustable-rate mortgage pass-throughs), asset-backed securities, and commercial mortgage-backed securities. You cannot invest directly in an index. |
| 6 | The Barclays U.S. Short Treasury 9–12 Months Index is an unmanaged index that includes aged U.S. Treasury bills, notes, and bonds with a remaining maturity from 9 up to (but not including) 12 months. It excludes zero-coupon STRIPS. You cannot invest directly in an index. |
| 7 | The Morgan Stanley Capital International (MSCI) Europe, Australasia, Far East (EAFE) Index (Net) is a free-float-adjusted market-capitalization-weighted index that is designed to measure the equity market performance of developed markets, excluding the U.S. and Canada. The MSCI EAFE Index (Net) consists of the following 21 developed markets country indexes: Australia, Austria, Belgium, Denmark, Finland, France, Germany, Hong Kong, Ireland, Israel, Italy, Japan, the Netherlands, New Zealand, Norway, Portugal, Singapore, Spain, Sweden, Switzerland, and the United Kingdom. Source: MSCI. MSCI makes no representations and shall have no liability whatsoever with respect to any MSCI data contained herein. The MSCI data may not be further redistributed or used as a basis for other indexes or any securities or financial products. This report is not approved, reviewed, or produced by MSCI. You cannot invest directly in an index. |
| 8 | The Russell 1000® Growth Index measures the performance of those Russell 1000 companies with higher price-to-book ratios and higher forecasted growth values. You cannot invest directly in an index. |
| 9 | The Russell 1000® Value Index measures the performance of those Russell 1000 companies with lower price-to-book ratios and lower forecasted growth values. You cannot invest directly in an index. |
| 10 | The Russell 2000® Index measures the performance of the 2,000 smallest companies in the Russell 3000® Index, which represents approximately 8% of the total market capitalization of the Russell 3000® Index. You cannot invest directly in an index. |
| 11 | The S&P 500 Index consists of 500 stocks chosen for market size, liquidity, and industry group representation. It is a market-value-weighted index with each stock’s weight in the index proportionate to its market value. You cannot invest directly in an index. |
| 12 | The chart compares the performance of Class A shares for the most recent ten years with the Moderate Balanced Composite Index, the Barclays U.S. Aggregate Bond Index, Barclays U.S. Short Treasury 9–12 Months Index, the MSCI EAFE Index (Net), the Russell 1000® Growth Index, the Russell 1000® Value Index, the Russell 2000® Index, and the S&P 500 Index. The chart assumes a hypothetical $10,000 investment in Class A and reflects all operating expenses and assumes the maximum initial sales charge of 5.75%. |
| 13 | The MSCI All Country World Index (ACWI) ex USA Index (Net) is a free-float-adjusted market capitalization weighted index that is designed to measure the equity market performance of developed markets, excluding the U.S. and Canada. You cannot invest directly in an index. |
| 14 | The MSCI Emerging Markets (EM) Index (Net) is a free-float-adjusted market-capitalization-weighted index that is designed to measure the equity market performance of emerging markets. The MSCI EM Index (Net) consists of the following 23 emerging markets country indexes: Brazil, Chile, China, Colombia, Czech Republic, Egypt, Greece, Hungary, India, Indonesia, Korea, Malaysia, Mexico, Peru, the Philippines, Poland, Qatar, Russia, South Africa, Taiwan, Thailand, Turkey, and United Arab Emirates. You cannot invest directly in an index. |
| 15 | The ten largest holdings, excluding cash and cash equivalents, are calculated based on the value of the securities of the affiliated master portfolios allocable to the Fund divided by total net assets of the Fund. Holdings are subject to change and may have changed since the date specified. |
| 16 | Current target allocation includes the effect of any tactical futures overlay that may be in place. The amounts are subject to change and may have changed since the date specified. |
| | | | | | |
| Performance highlights (unaudited) | | Wells Fargo Allocation Funds | | | 13 | |
Wells Fargo Moderate Balanced Fund (continued)
MANAGER’S DISCUSSION
Fund highlights
| n | | The Fund underperformed the Moderate Balanced Composite Index for the 12-month period that ended May 31, 2016. |
| n | | Two equity market corrections, defined as a loss of 10% or more, during the 12-month period proved to be a challenging environment for the underlying managers. The Fund’s equity investments overall underperformed their benchmarks. The two market corrections served to discourage equity investors and stock prices suffered as a result. While rallies subsequent to each correction benefited stock prices, overall equity prices in global markets, particularly outside of the U.S., suffered. |
| n | | Tactical asset allocation added to performance through the period. During market corrections in August 2015 and January 2016, the portfolio management team tactically shifted the portfolio allocation during periods of depressed equity prices, which added value. |
| n | | The Fund’s bond investments added value on an absolute basis but underperformed relative to the benchmark. |
Equity markets experienced two corrections during the previous 12 months.
Global equity markets experienced two corrections during the previous 12 months. Amid fears of contagion from international markets, investors sold U.S. equities heavily during August 2015 and January 2016. In August, the contraction was fueled by fears of collapsing growth in China. In January, in addition to renewed fears of lower output in China and softer domestic economic data, oil prices dropped below $30 a barrel.
The second correction, which followed the first hike in the federal funds interest rate in a decade, raised concerns that the U.S. Federal Reserve acted too hastily. U.S. investors feared a contracting global economy coupled with the currency and business effects of a rate hike would drive down international demand for U.S. goods. Despite the potential headwinds, the S&P 500 Index ended the period up 1.72%.
The European Central Bank (ECB) and the Bank of Japan (BOJ) increased monetary stimulus programs that were intended to bolster their local economies. Brazil’s business and political woes continued and China reduced its economic growth forecasts, which tended to restrain investor enthusiasm for international investments.
U.S. bonds, as measured by the Barclays U.S. Aggregate Bond Index,5 rose 2.99%, outperforming large-cap stocks. Small-cap stocks, as measured by the Russell 2000® Index,10 returned -5.97%. International stocks returned -11.39%, as measured by the Morgan Stanley Capital International (MSCI) All Country World Index (ACWI) ex USA Index (Net).13 Within international stocks, emerging markets stocks fell the most at -17.63%, as measured by the MSCI Emerging Markets (EM) Index (Net).14
Please see footnotes on page 12.
| | | | |
| 14 | | Wells Fargo Allocation Funds | | Performance highlights (unaudited) |
Wells Fargo Moderate Balanced Fund (continued)
| | | | |
| Ten largest holdings (%) as of May 31, 201615 | |
FHLMC Structured Pass-Through Securities Series T-58 Class 4A, 7.50%, 9-25-2043 | | | 0.69 | |
U.S. Treasury Note, 0.88%, 7-15-2017 | | | 0.68 | |
U.S. Treasury Note, 0.63%, 9-30-2017 | | | 0.65 | |
Facebook Incorporated Class A | | | 0.64 | |
Apple Incorporated | | | 0.63 | |
Amazon.com Incorporated | | | 0.61 | |
Alphabet Incorporated Class A | | | 0.57 | |
FNMA Series 2002-W4 Class A4, 6.25%, 5-25-2042 | | | 0.55 | |
U.S Treasury Bond, 2.50%, 2-15-2046 | | | 0.53 | |
Exxon Mobil Corporation | | | 0.50 | |
The Fund seeks to enhance returns by using a combination of inputs from multiple quantitative and qualitative factors to alter allocations among stocks and bonds.
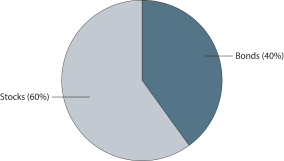
The Fund’s neutral allocation is 40% stocks and 60% bonds. During the period, the portfolio management team took tactical advantage of equity price movements. Through our overlays, we tactically increased equity exposures through the first correction in August 2015, increasing equity holdings as Chinese and U.S. markets declined. As the market correction reversed in the following months, the overlay added value to the Fund’s performance. Again in January and February 2016, we saw a similar correction and used our overlays to overweight equities. Through effective execution of our hedging strategy, the team again added to the Fund’s returns.
|
| Current target allocation as of May 31, 201616 |
|
 |
|
| Neutral target allocation |
|
 |
We remain cautiously optimistic about the longer-term outlook for stocks.
Bond yields continued to be depressed. The potential for future interest-rate hikes may be a headwind to overall increases in output in the general U.S. economy. With yields at historical lows, there continues to be a duration risk in bonds.
Internationally, the accommodative policies of the ECB and BOJ are intended to bolster their local economies. We believe these central banks will continue to support growth in their economies, which should be supportive of asset prices. In addition to developed, international economies, emerging markets stocks are at low valuation levels not seen in years. Finally, domestic stocks and the U.S. economy have shown resilience in the past year. We look to market signals and economic releases to help inform the changing state of U.S. markets.
Please see footnotes on page 12.
| | | | | | |
| Fund expenses (unaudited) | | Wells Fargo Allocation Funds | | | 15 | |
As a shareholder of the Fund, you incur two types of costs: (1) transaction costs, including sales charges (loads) on purchase payments and contingent deferred sales charges (if any) on redemptions and (2) ongoing costs, including management fees, distribution (12b-1) and/or shareholder servicing fees, and other Fund expenses. This example is intended to help you understand your ongoing costs (in dollars) of investing in the Fund and to compare these costs with the ongoing costs of investing in other mutual funds.
The example is based on an investment of $1,000 invested at the beginning of the six-month period and held for the entire period from December 1, 2015 to May 31, 2016.
Actual expenses
The “Actual” line of the table below provides information about actual account values and actual expenses. You may use the information in this line, together with the amount you invested, to estimate the expenses that you paid over the period. Simply divide your account value by $1,000 (for example, an $8,600 account value divided by $1,000 = 8.6), then multiply the result by the number in the “Actual” line under the heading entitled “Expenses paid during period” for your applicable class of shares to estimate the expenses you paid on your account during this period.
Hypothetical example for comparison purposes
The “Hypothetical” line of the table below provides information about hypothetical account values and hypothetical expenses based on the Fund’s actual expense ratio and an assumed rate of return of 5% per year before expenses, which is not the Fund’s actual return. The hypothetical account values and expenses may not be used to estimate the actual ending account balance or expenses you paid for the period. You may use this information to compare the ongoing costs of investing in the Fund and other funds. To do so, compare this 5% hypothetical example with the 5% hypothetical examples that appear in the shareholder reports of the other funds.
Please note that the expenses shown in the table are meant to highlight your ongoing costs only and do not reflect any transactional costs, such as sales charges (loads) and contingent deferred sales charges. Therefore, the “Hypothetical” line of the table is useful in comparing ongoing costs only and will not help you determine the relative total costs of owning different funds. In addition, if these transactional costs were included, your costs would have been higher.
| | | | | | | | | | | | | | | | |
| Wells Fargo Growth Balanced Fund | | Beginning
account value
12-1-2015 | | | Ending
account value
5-31-2016 | | | Expenses
paid during
the period¹ | | | Net annualized
expense ratio | |
Class A | | | | | | | | | | | | | | | | |
Actual | | $ | 1,000.00 | | | $ | 1,004.12 | | | $ | 6.01 | | | | 1.20 | % |
Hypothetical (5% return before expenses) | | $ | 1,000.00 | | | $ | 1,019.00 | | | $ | 6.06 | | | | 1.20 | % |
Class B | | | | | | | | | | | | | | | | |
Actual | | $ | 1,000.00 | | | $ | 1,000.56 | | | $ | 9.75 | | | | 1.95 | % |
Hypothetical (5% return before expenses) | | $ | 1,000.00 | | | $ | 1,015.25 | | | $ | 9.82 | | | | 1.95 | % |
Class C | | | | | | | | | | | | | | | | |
Actual | | $ | 1,000.00 | | | $ | 1,000.28 | | | $ | 9.75 | | | | 1.95 | % |
Hypothetical (5% return before expenses) | | $ | 1,000.00 | | | $ | 1,015.25 | | | $ | 9.82 | | | | 1.95 | % |
Administrator Class | | | | | | | | | | | | | | | | |
Actual | | $ | 1,000.00 | | | $ | 1,005.73 | | | $ | 4.76 | | | | 0.95 | % |
Hypothetical (5% return before expenses) | | $ | 1,000.00 | | | $ | 1,020.25 | | | $ | 4.80 | | | | 0.95 | % |
| Wells Fargo Moderate Balanced Fund | | | | | | | | | | | | |
Class A | | | | | | | | | | | | | | | | |
Actual | | $ | 1,000.00 | | | $ | 1,012.38 | | | $ | 5.79 | | | | 1.15 | % |
Hypothetical (5% return before expenses) | | $ | 1,000.00 | | | $ | 1,019.25 | | | $ | 5.81 | | | | 1.15 | % |
Class B | | | | | | | | | | | | | | | | |
Actual | | $ | 1,000.00 | | | $ | 1,008.36 | | | $ | 9.54 | | | | 1.90 | % |
Hypothetical (5% return before expenses) | | $ | 1,000.00 | | | $ | 1,015.50 | | | $ | 9.57 | | | | 1.90 | % |
Class C | | | | | | | | | | | | | | | | |
Actual | | $ | 1,000.00 | | | $ | 1,008.20 | | | $ | 9.54 | | | | 1.90 | % |
Hypothetical (5% return before expenses) | | $ | 1,000.00 | | | $ | 1,015.50 | | | $ | 9.57 | | | | 1.90 | % |
Administrator Class | | | | | | | | | | | | | | | | |
Actual | | $ | 1,000.00 | | | $ | 1,013.62 | | | $ | 4.53 | | | | 0.90 | % |
Hypothetical (5% return before expenses) | | $ | 1,000.00 | | | $ | 1,020.50 | | | $ | 4.55 | | | | 0.90 | % |
| 1 | Expenses paid is equal to the annualized expense ratio of each class multiplied by the average account value over the period, multiplied by the number of days in the most recent fiscal half-year divided by the number of days in the fiscal year (to reflect the one-half-year period). |
| | | | |
| 16 | | Wells Fargo Allocation Funds | | Portfolio of investments—May 31, 2016 |
GROWTH BALANCED FUND
| | | | | | | | | | | | | | | | |
| Security name | | | | | | | | | | | Value | |
| | | | |
Investment Companies: 100.00% | | | | | | | | | | | | | | | | |
| | | | |
| Affiliated Master Portfolios: 100.00% | | | | | | | | | | | | | | | | |
Wells Fargo C&B Large Cap Value Portfolio | | | | | | | | | | | | | | $ | 14,011,685 | |
Wells Fargo Core Bond Portfolio | | | | | | | | | | | | | | | 17,956,255 | |
Wells Fargo Diversified Large Cap Growth Portfolio | | | | | | | | | | | | | | | 42,013,810 | |
Wells Fargo Emerging Growth Portfolio | | | | | | | | | | | | | | | 4,242,640 | |
Wells Fargo Index Portfolio | | | | | | | | | | | | | | | 42,084,098 | |
Wells Fargo International Growth Portfolio | | | | | | | | | | | | | | | 12,434,299 | |
Wells Fargo International Value Portfolio | | | | | | | | | | | | | | | 12,598,838 | |
Wells Fargo Large Company Value Portfolio | | | | | | | | | | | | | | | 28,095,347 | |
Wells Fargo Managed Fixed Income Portfolio | | | | | | | | | | | | | | | 62,870,419 | |
Wells Fargo Real Return Portfolio | | | | | | | | | | | | | | | 8,949,465 | |
Wells Fargo Small Company Growth Portfolio | | | | | | | | | | | | | | | 4,251,967 | |
Wells Fargo Small Company Value Portfolio | | | | | | | | | | | | | | | 8,469,960 | |
| | | | |
Total Investment Companies (Cost $231,910,236) | | | | | | | | | | | | | | | 257,978,783 | |
| | | | | | | | | | | | | | | | |
| | | | |
| | | Yield | | | Maturity date | | | Principal | | | | |
| Short-Term Investments: 0.06% | | | | | | | | | | | | | | | | |
| | | | |
| U.S. Treasury Securities: 0.06% | | | | | | | | | | | | | | | | |
U.S. Treasury Bill #(z) | | | 0.13 | % | | | 6-9-2016 | | | $ | 137,000 | | | | 136,995 | |
| | | | | | | | | | | | | | | | |
| |
Total Short-Term Investments (Cost $136,995) | | | | 136,995 | |
| | | | | | | | | | | | | | | | |
| | | | | | | | |
| Total investments in securities (Cost $232,047,231) * | | | 100.06 | % | | | 258,115,778 | |
Other assets and liabilities, net | | | (0.06 | ) | | | (142,466 | ) |
| | | | | | | | |
| Total net assets | | | 100.00 | % | | $ | 257,973,312 | |
| | | | | | | | |
| # | All or a portion of this security is segregated as collateral for investments in derivative instruments. |
| (z) | Zero coupon security. The rate represents the current yield to maturity. |
| * | Cost for federal income tax purposes is $233,050,542 and unrealized gains (losses) consists of: |
| | | | |
Gross unrealized gains | | $ | 25,065,236 | |
Gross unrealized losses | | | 0 | |
| | | | |
| | | | |
Net unrealized gains | | $ | 25,065,236 | |
The accompanying notes are an integral part of these financial statements.
| | | | | | |
| Portfolio of investments—May 31, 2016 | | Wells Fargo Allocation Funds | | | 17 | |
MODERATE BALANCED FUND
| | | | | | | | | | | | | | | | |
| Security name | | | | | | | | | | | Value | |
| | | | |
Investment Companies: 99.49% | | | | | | | | | | | | | | | | |
| | | | |
| Affiliated Master Portfolios: 99.49% | | | | | | | | | | | | | | | | |
Wells Fargo C&B Large Cap Value Portfolio | | | | | | | | | | | | | | $ | 6,861,334 | |
Wells Fargo Core Bond Portfolio | | | | | | | | | | | | | | | 18,251,208 | |
Wells Fargo Diversified Large Cap Growth Portfolio | | | | | | | | | | | | | | | 20,733,107 | |
Wells Fargo Emerging Growth Portfolio | | | | | | | | | | | | | | | 2,120,752 | |
Wells Fargo Index Portfolio | | | | | | | | | | | | | | | 20,661,580 | |
Wells Fargo International Growth Portfolio | | | | | | | | | | | | | | | 6,168,946 | |
Wells Fargo International Value Portfolio | | | | | | | | | | | | | | | 6,191,994 | |
Wells Fargo Large Company Value Portfolio | | | | | | | | | | | | | | | 13,788,426 | |
Wells Fargo Managed Fixed Income Portfolio | | | | | | | | | | | | | | | 63,883,311 | |
Wells Fargo Real Return Portfolio | | | | | | | | | | | | | | | 9,126,974 | |
Wells Fargo Small Company Growth Portfolio | | | | | | | | | | | | | | | 2,118,666 | |
Wells Fargo Small Company Value Portfolio | | | | | | | | | | | | | | | 4,210,419 | |
Wells Fargo Stable Income Portfolio | | | | | | | | | | | | | | | 30,392,418 | |
| | | | |
Total Investment Companies (Cost $193,283,811) | | | | | | | | | | | | | | | 204,509,135 | |
| | | | | | | | | | | | | | | | |
| | | | |
| | | Yield | | | Maturity date | | | Principal | | | | |
| Short-Term Investments: 0.05% | | | | | | | | | | | | | | | | |
| | | | |
| U.S. Treasury Securities: 0.05% | | | | | | | | | | | | | | | | |
U.S. Treasury Bill #(z) | | | 0.13 | % | | | 6-9-2016 | | | $ | 106,000 | | | | 105,997 | |
| | | | | | | | | | | | | | | | |
| |
Total Short-Term Investments (Cost $105,997) | | | | 105,997 | |
| | | | | | | | | | | | | | | | |
| | | | | | | | |
| Total investments in securities (Cost $193,389,808) * | | | 99.54 | % | | | 204,615,132 | |
Other assets and liabilities, net | | | 0.46 | | | | 946,936 | |
| | | | | | | | |
| Total net assets | | | 100.00 | % | | $ | 205,562,068 | |
| | | | | | | | |
| # | All or a portion of this security is segregated as collateral for investments in derivative instruments. |
| (z) | Zero coupon security. The rate represents the current yield to maturity. |
| * | Cost for federal income tax purposes is $192,582,891 and unrealized gains (losses) consists of: |
| | | | |
Gross unrealized gains | | $ | 12,032,241 | |
Gross unrealized losses | | | 0 | |
| | | | |
Net unrealized gains | | $ | 12,032,241 | |
The accompanying notes are an integral part of these financial statements.
| | | | |
| 18 | | Wells Fargo Allocation Funds | | Statements of assets and liabilities—May 31, 2016 |
| | | | | | | | |
| | | Growth Balanced Fund | | | Moderate
Balanced Fund | |
| | |
Assets | | | | | | | | |
Investments | | | | | | | | |
In affiliated Master Portfolios, at value (see cost below) | | $ | 257,978,783 | | | $ | 204,509,135 | |
In unaffiliated securities, at value (see cost below) | | | 136,995 | | | | 105,997 | |
| | | | |
Total investments, at value (see cost below) | | | 258,115,778 | | | | 204,615,132 | |
Receivable for Fund shares sold | | | 211,129 | | | | 1,088,582 | |
Receivable for daily variation margin on open futures contracts | | | 1,500 | | | | 1,156 | |
Receivable from manager | | | 0 | | | | 842 | |
Prepaid expenses and other assets | | | 26,060 | | | | 22,415 | |
| | | | |
Total assets | | | 258,354,467 | | | | 205,728,127 | |
| | | | |
| | |
Liabilities | | | | | | | | |
Payable for Fund shares redeemed | | | 251,258 | | | | 78,673 | |
Management fee payable | | | 6,567 | | | | 0 | |
Distribution fees payable | | | 10,314 | | | | 7,888 | |
Administration fees payable | | | 33,645 | | | | 25,500 | |
Shareholder report expenses payable | | | 17,226 | | | | 8,475 | |
Shareholder servicing fees payable | | | 54,132 | | | | 42,836 | |
Accrued expenses and other liabilities | | | 8,013 | | | | 2,687 | |
| | | | |
Total liabilities | | | 381,155 | | | | 166,059 | |
| | | | |
Total net assets | | $ | 257,973,312 | | | $ | 205,562,068 | |
| | | | |
| | |
NET ASSETS CONSIST OF | | | | | | | | |
Paid-in capital | | | 368,576,793 | | |
| 192,014,976
|
|
Undistributed net investment income | | | 2,724,712 | | | | 1,036,706 | |
Accumulated net realized gains (losses) on investments | |
| (139,366,465
| )
| | | 1,308,399 | |
Net unrealized gains on investments | | | 26,038,272 | | | | 11,201,987 | |
| | | | |
Total net assets | | $ | 257,973,312 | | | $ | 205,562,068 | |
| | | | |
| | |
COMPUTATION OF NET ASSET VALUE AND OFFERING PRICE PER SHARE | | | | | | | | |
Net assets – Class A | | $ | 65,865,889 | | | $ | 35,993,111 | |
Shares outstanding – Class A1 | | | 1,646,970 | | | | 1,599,121 | |
Net asset value per share – Class A | | | $39.99 | | | | $22.51 | |
Maximum offering price per share – Class A2 | | | $42.43 | | | | $23.88 | |
Net assets – Class B | | $ | 167,317 | | | $ | 152,707 | |
Shares outstanding – Class B1 | | | 4,686 | | | | 6,694 | |
Net asset value per share – Class B | | | $35.71 | | | | $22.81 | |
Net assets – Class C | | $ | 16,224,626 | | | $ | 12,501,071 | |
Shares outstanding – Class C1 | | | 465,894 | | | | 566,882 | |
Net asset value per share – Class C | | | $34.82 | | | | $22.05 | |
Net assets – Administrator Class | | $ | 175,715,480 | | | $ | 156,915,179 | |
Shares outstanding – Administrator Class1 | | | 4,911,362 | | | | 6,912,881 | |
Net asset value per share – Administrator Class | | | $35.78 | | | | $22.70 | |
| | |
Investments in affiliated Master Portfolios, at cost | | $ | 231,910,236 | | | $ | 193,283,811 | |
| | | | |
Investments in unaffiliated securities, at cost | | $ | 136,995 | | | $ | 105,997 | |
| | | | |
Total investments, at cost | | $ | 232,047,231 | | | $ | 193,389,808 | |
| | | | |
| 1 | Each Fund has an unlimited number of authorized shares. |
| 2 | Maximum offering price is computed as 100/94.25 of net asset value. On investments of $50,000 or more, the offering price is reduced. |
The accompanying notes are an integral part of these financial statements.
| | | | | | |
| Statements of operations—year ended May 31, 2016 | | Wells Fargo Allocation Funds | | | 19 | |
| | | | | | | | |
| | | Growth Balanced Fund | | | Moderate
Balanced Fund | |
| | |
Investment income | | | | | | | | |
Dividends allocated from affiliated Master Portfolios* | | $ | 2,990,116 | | | $ | 1,379,958 | |
Interest allocated from affiliated Master Portfolios | | | 2,715,088 | | | | 2,990,498 | |
Affiliated income allocated from affiliated Master Portfolios | | | 34,109 | | | | 21,886 | |
Securities lending income allocated from affiliated Master Portfolios | | | 80,288 | | | | 39,609 | |
Interest | | | 665 | | | | 491 | |
Expenses allocated from affiliated Master Portfolios | | | (1,426,946 | ) | | | (1,018,450 | ) |
Waivers allocated from affiliated Master Portfolios | | | 126,528 | | | | 150,388 | |
| | | | |
Total investment income | | | 4,519,848 | | | | 3,564,380 | |
| | | | |
| | |
Expenses | | | | | | | | |
Management fee | | | 758,796 | | | | 556,747 | |
Administration fees | | | | | | | | |
Class A | | | 135,701 | | | | 55,075 | |
Class B | | | 391 | | | | 350 | |
Class C | | | 32,432 | | | | 18,954 | |
Administrator Class | | | 222,030 | | | | 192,134 | |
Shareholder servicing fees | | | | | | | | |
Class A | | | 158,374 | | | | 64,542 | |
Class B | | | 458 | | | | 407 | |
Class C | | | 37,900 | | | | 22,265 | |
Administrator Class | | | 435,599 | | | | 376,742 | |
Distribution fees | | | | | | | | |
Class B | | | 1,373 | | | | 1,221 | |
Class C | | | 113,699 | | | | 66,794 | |
Custody and accounting fees | | | 10,964 | | | | 8,573 | |
Professional fees | | | 29,495 | | | | 31,120 | |
Registration fees | | | 61,099 | | | | 52,410 | |
Shareholder report expenses | | | 65,408 | | | | 41,974 | |
Trustees’ fees and expenses | | | 15,157 | | | | 16,701 | |
Other fees and expenses | | | 10,365 | | | | 10,869 | |
| | | | |
Total expenses | | | 2,089,241 | | | | 1,516,878 | |
Less: Fee waivers and/or expense reimbursements | | | (675,001 | ) | | | (559,469 | ) |
| | | | |
Net expenses | | | 1,414,240 | | | | 957,409 | |
| | | | |
Net investment income | | | 3,105,608 | | | | 2,606,971 | |
| | | | |
| | |
REALIZED AND UNREALIZED GAINS (LOSSES) ON INVESTMENTS | | | | | | | | |
| | |
Net realized gains on: | | | | | | | | |
Securities transactions allocated from affiliated Master Portfolios | |
| 4,345,913
|
| | | 2,055,479 | |
Unaffiliated securities | | | 88 | | | | 66 | |
Futures transactions | | | 1,283,075 | | | | 975,301 | |
| | | | |
Net realized gains on investments | | | 5,629,076 | | | | 3,030,846 | |
| | | | |
| | |
Net change in unrealized gains (losses) on: | | | | | | | | |
Securities transactions allocated from affiliated Master Portfolios | | | (11,494,357 | ) | | | (4,328,549 | ) |
Unaffiliated securities | | | (73 | ) | | | (53 | ) |
Futures transactions | | | 102,220 | | | | 68,811 | |
| | | | |
Net change in unrealized gains (losses) on investments | | | (11,392,210 | ) | | | (4,259,791 | ) |
| | | | |
Net realized and unrealized gains (losses) on investments | | | (5,763,134 | ) | | | (1,228,945 | ) |
| | | | |
Net increase (decrease) in net assets resulting from operations | | $ | (2,657,526 | ) | | $ | 1,378,026 | |
| | | | |
| | |
* Net of foreign dividend withholding taxes allocated from affiliated Master Portfolios in the amount of | | | $79,298 | | | | $38,325 | |
The accompanying notes are an integral part of these financial statements.
| | | | |
| 20 | | Wells Fargo Allocation Funds | | Statements of changes in net assets |
| | | | | | | | | | | | | | | | |
| | | Growth Balanced Fund | |
| | | Year ended
May 31, 2016 | | | Year ended
May 31, 2015 | |
| | | |
Operations | | | | | | | | | | | | |
Net investment income | | | | | | $ | 3,105,608 | | | | | | | $ | 2,789,281 | |
Net realized gains on investments | | | | | | | 5,629,076 | | | | | | | | 15,701,271 | |
Net change in unrealized gains (losses) on investments | | | | | | | (11,392,210 | ) | | | | | | | 1,114,605 | |
| | | | |
Net increase (decrease) in net assets resulting from operations | | | | | | | (2,657,526 | ) | | | | | | | 19,605,157 | |
| | | | |
| | | |
Distributions to shareholders from | | | | | | | | | | | | |
Net investment income | | | | | | | | | | | | | | | | |
Class A | | | | | | | (542,593 | ) | | | | | | | (268,805 | ) |
Class C | | | | | | | (61,467 | ) | | | | | | | (29,178 | ) |
Administrator Class | | | | | | | (2,115,400 | ) | | | | | | | (1,028,262 | ) |
| | | | |
Total distributions to shareholders | | | | | | | (2,719,460 | ) | | | | | | | (1,326,245 | ) |
| | | | |
| | | | |
Capital share transactions | | | Shares | | | | | | | | Shares | | | | | |
Proceeds from shares sold | | | | | | | | | | | | | | | | |
Class A | | | 302,429 | | | | 11,925,156 | | | | 185,450 | | | | 7,274,394 | |
Class B | | | 6,666 | | | | 229,343 | | | | 1,558 | | | | 53,483 | |
Class C | | | 129,397 | | | | 4,455,113 | | | | 72,213 | | | | 2,489,920 | |
Administrator Class | | | 668,947 | | | | 23,470,005 | | | | 635,039 | | | | 22,455,940 | |
| | | | |
| | | | | | | 40,079,617 | | | | | | | | 32,273,737 | |
| | | | |
Reinvestment of distributions | | | | | | | | | | | | | | | | |
Class A | | | 13,763 | | | | 533,044 | | | | 6,633 | | | | 261,859 | |
Class C | | | 1,662 | | | | 56,244 | | | | 788 | | | | 27,266 | |
Administrator Class | | | 60,923 | | | | 2,108,567 | | | | 28,932 | | | | 1,022,158 | |
| | | | |
| | | | | | | 2,697,855 | | | | | | | | 1,311,283 | |
| | | | |
Payment for shares redeemed | | | | | | | | | | | | | | | | |
Class A | | | (243,456 | ) | | | (9,569,788 | ) | | | (227,744 | ) | | | (8,991,283 | ) |
Class B | | | (6,490 | ) | | | (227,822 | ) | | | (11,057 | ) | | | (384,245 | ) |
Class C | | | (67,904 | ) | | | (2,314,573 | ) | | | (49,378 | ) | | | (1,697,172 | ) |
Administrator Class | | | (809,000 | ) | | | (28,424,055 | ) | | | (826,937 | ) | | | (29,006,446 | ) |
| | | | |
| | | | | | | (40,536,238 | ) | | | | | | | (40,079,146 | ) |
| | | | |
Net increase (decrease) in net assets resulting from capital share transactions | | | | | | | 2,241,234 | | | | | | | | (6,494,126 | ) |
| | | | |
Total increase (decrease) in net assets | | | | | | | (3,135,752 | ) | | | | | | | 11,784,786 | |
| | | | |
| | |
Net assets | | | | | | | | |
Beginning of period | | | | | | | 261,109,064 | | | | | | | | 249,324,278 | |
| | | | |
End of period | | | | | | $ | 257,973,312 | | | | | | | $ | 261,109,064 | |
| | | | |
Undistributed net investment income | | | | | | $ | 2,724,712 | | | | | | | $ | 2,484,235 | |
| | | | |
The accompanying notes are an integral part of these financial statements.
| | | | | | |
| Statements of changes in net assets | | Wells Fargo Allocation Funds | | | 21 | |
| | | | | | | | | | | | | | | | |
| | | Moderate Balanced Fund | |
| | | Year ended
May 31, 2016 | | | Year ended
May 31, 2015 | |
| | | |
Operations | | | | | | | | | | | | |
Net investment income | | | | | | $ | 2,606,971 | | | | | | | $ | 2,299,319 | |
Net realized gains on investments | | | | | | | 3,030,846 | | | | | | | | 7,901,060 | |
Net change in unrealized gains (losses) on investments | | | | | | | (4,259,791 | ) | | | | | | | (22,765 | ) |
| | | | |
Net increase in net assets resulting from operations | | | | | | | 1,378,026 | | | | | | | | 10,177,614 | |
| | | | |
| | | |
Distributions to shareholders from | | | | | | | | | | | | |
Net investment income | | | | | | | | | | | | | | | | |
Class A | | | | | | | (297,818 | ) | | | | | | | (376,425 | ) |
Class B | | | | | | | (182 | ) | | | | | | | 0 | |
Class C | | | | | | | (67,037 | ) | | | | | | | (52,862 | ) |
Administrator Class | | | | | | | (2,056,183 | ) | | | | | | | (3,267,946 | ) |
Net realized gains | | | | | | | | | | | | | | | | |
Class A | | | | | | | (935,192 | ) | | | | | | | (415,324 | ) |
Class B | | | | | | | (5,343 | ) | | | | | | | (4,805 | ) |
Class C | | | | | | | (325,466 | ) | | | | | | | (111,625 | ) |
Administrator Class | | | | | | | (5,453,616 | ) | | | | | | | (3,128,190 | ) |
| | | | |
Total distributions to shareholders | | | | | | | (9,140,837 | ) | | | | | | | (7,357,177 | ) |
| | | | |
| | | | |
Capital share transactions | | | Shares | | | | | | | | Shares | | | | | |
Proceeds from shares sold | | | | | | | | | | | | | | | | |
Class A | | | 1,014,195 | | | | 22,691,852 | | | | 255,117 | | | | 5,957,581 | |
Class B | | | 5,573 | | | | 125,768 | | | | 1,624 | | | | 38,050 | |
Class C | | | 408,018 | | | | 8,992,522 | | | | 97,255 | | | | 2,232,984 | |
Administrator Class | | | 1,214,117 | | | | 27,655,326 | | | | 731,005 | | | | 17,208,011 | |
| | | | |
| | | | | | | 59,465,468 | | | | | | | | 25,436,626 | |
| | | | |
Reinvestment of distributions | | | | | | | | | | | | | | | | |
Class A | | | 53,460 | | | | 1,186,272 | | | | 32,909 | | | | 762,939 | |
Class B | | | 203 | | | | 4,571 | | | | 156 | | | | 3,620 | |
Class C | | | 15,738 | | | | 342,627 | | | | 6,451 | | | | 147,103 | |
Administrator Class | | | 327,107 | | | | 7,317,656 | | | | 270,522 | | | | 6,320,119 | |
| | | | |
| | | | | | | 8,851,126 | | | | | | | | 7,233,781 | |
| | | | |
Payment for shares redeemed | | | | | | | | | | | | | | | | |
Class A | | | (350,307 | ) | | | (7,888,089 | ) | | | (189,830 | ) | | | (4,466,077 | ) |
Class B | | | (7,820 | ) | | | (179,801 | ) | | | (9,450 | ) | | | (221,598 | ) |
Class C | | | (117,584 | ) | | | (2,583,589 | ) | | | (39,148 | ) | | | (899,068 | ) |
Administrator Class | | | (1,089,111 | ) | | | (24,830,085 | ) | | | (709,375 | ) | | | (16,680,708 | ) |
| | | | |
| | | | | | | (35,481,564 | ) | | | | | | | (22,267,451 | ) |
| | | | |
Net increase in net assets resulting from capital share transactions | | | | | | | 32,835,030 | | | | | | | | 10,402,956 | |
| | | | |
Total increase in net assets | | | | | | | 25,072,219 | | | | | | | | 13,223,393 | |
| | | | |
| | | | |
Net assets | | | | | | | | | | | | | | | | |
Beginning of period | | | | | | | 180,489,849 | | | | | | | | 167,266,456 | |
| | | | |
End of period | | | | | | $ | 205,562,068 | | | | | | | $ | 180,489,849 | |
| | | | |
Undistributed net investment income | | | | | | $ | 1,036,706 | | | | | | | $ | 915,734 | |
| | | | |
The accompanying notes are an integral part of these financial statements.
| | | | |
| 22 | | Wells Fargo Allocation Funds | | Financial highlights |
| | | | | | | | | | | | | | | | | | | | |
| Growth Balanced Fund | | Beginning
net asset
value per
share | | | Net
investment
income | | | Net realized
and unrealized
gains (losses)
on investments | | | Distributions
from net
investment
income | | | Ending
net asset
value per
share | |
Class A | | | | | | | | | | | | | | | | | | | | |
Year ended May 31, 2016 | | $ | 40.80 | | | | 0.46 | | | | (0.94 | ) | | | (0.33 | ) | | $ | 39.99 | |
Year ended May 31, 2015 | | $ | 37.96 | | | | 0.36 | | | | 2.65 | | | | (0.17 | ) | | $ | 40.80 | |
Year ended May 31, 2014 | | $ | 33.35 | | | | 0.35 | | | | 4.60 | | | | (0.34 | ) | | $ | 37.96 | |
Year ended May 31, 2013 | | $ | 27.77 | | | | 0.32 | | | | 5.70 | | | | (0.44 | ) | | $ | 33.35 | |
Year ended May 31, 2012 | | $ | 29.34 | | | | 0.39 | 4 | | | (1.73 | ) | | | (0.23 | ) | | $ | 27.77 | |
Class B | | | | | | | | | | | | | | | | | | | | |
Year ended May 31, 2016 | | $ | 36.39 | | | | 0.13 | 4 | | | (0.81 | ) | | | 0.00 | | | $ | 35.71 | |
Year ended May 31, 2015 | | $ | 33.97 | | | | 0.06 | 4 | | | 2.36 | | | | 0.00 | | | $ | 36.39 | |
Year ended May 31, 2014 | | $ | 29.84 | | | | 0.08 | 4 | | | 4.10 | | | | (0.05 | ) | | $ | 33.97 | |
Year ended May 31, 2013 | | $ | 24.80 | | | | 0.12 | 4 | | | 5.05 | | | | (0.13 | ) | | $ | 29.84 | |
Year ended May 31, 2012 | | $ | 26.17 | | | | 0.15 | 4 | | | (1.52 | ) | | | 0.00 | | | $ | 24.80 | |
Class C | | | | | | | | | | | | | | | | | | | | |
Year ended May 31, 2016 | | $ | 35.63 | | | | 0.12 | 4 | | | (0.79 | ) | | | (0.14 | ) | | $ | 34.82 | |
Year ended May 31, 2015 | | $ | 33.33 | | | | 0.08 | 4 | | | 2.30 | | | | (0.08 | ) | | $ | 35.63 | |
Year ended May 31, 2014 | | $ | 29.38 | | | | 0.10 | 4 | | | 4.00 | | | | (0.15 | ) | | $ | 33.33 | |
Year ended May 31, 2013 | | $ | 24.52 | | | | 0.13 | 4 | | | 4.98 | | | | (0.25 | ) | | $ | 29.38 | |
Year ended May 31, 2012 | | $ | 25.94 | | | | 0.16 | 4 | | | (1.53 | ) | | | (0.05 | ) | | $ | 24.52 | |
Administrator Class | | | | | | | | | | | | | | | | | | | | |
Year ended May 31, 2016 | | $ | 36.54 | | | | 0.49 | | | | (0.82 | ) | | | (0.43 | ) | | $ | 35.78 | |
Year ended May 31, 2015 | | $ | 33.98 | | | | 0.45 | | | | 2.32 | | | | (0.21 | ) | | $ | 36.54 | |
Year ended May 31, 2014 | | $ | 29.89 | | | | 0.41 | 4 | | | 4.10 | | | | (0.42 | ) | | $ | 33.98 | |
Year ended May 31, 2013 | | $ | 24.93 | | | | 0.65 | 4 | | | 4.82 | | | | (0.51 | ) | | $ | 29.89 | |
Year ended May 31, 2012 | | $ | 26.39 | | | | 0.41 | 4 | | | (1.57 | ) | | | (0.30 | ) | | $ | 24.93 | |
| 1 | Ratios include net expenses allocated from the affiliated Master Portfolios which were as follows: |
| | | | | | | | | | | | | | | | | | | | |
| | | Year ended May 31 | |
| | | 2016 | | | 2015 | | | 2014 | | | 2013 | | | 2012 | |
Class A | | | 0.51 | % | | | 0.51 | % | | | 0.51 | % | | | 0.50 | % | | | 0.49 | % |
Class B | | | 0.50 | | | | 0.51 | | | | 0.51 | | | | 0.50 | | | | 0.49 | |
Class C | | | 0.50 | | | | 0.51 | | | | 0.51 | | | | 0.50 | | | | 0.49 | |
Administrator Class | | | 0.50 | | | | 0.51 | | | | 0.51 | | | | 0.50 | | | | 0.49 | |
| 2 | Total return calculations do not include any sales charges. |
| 3 | Portfolio turnover rate is calculated by aggregating the results of multiplying the Fund’s investment percentage in the respective affiliated Master Portfolio by the corresponding affiliated Master Portfolio’s portfolio turnover rate. |
| 4 | Calculated based upon average shares outstanding |
The accompanying notes are an integral part of these financial statements.
| | | | | | |
| Financial highlights | | Wells Fargo Allocation Funds | | | 23 | |
| | | | | | | | | | | | | | | | | | | | | | |
| Ratio to average net assets (annualized) | | | | | | Portfolio turnover
rate3 | | | Net assets at
end of period
(000s omitted) | |
Net investment
income | | | Gross
expenses1 | | | Net
expenses1 | | | Total
return2 | | | |
| | | | | | | | | | | | | | | | | | | | | | |
| | 1.10 | % | | | 1.35 | % | | | 1.20 | % | | | (1.14 | )% | | | 79 | % | | $ | 65,866 | |
| | 0.97 | % | | | 1.40 | % | | | 1.20 | % | | | 7.94 | % | | | 75 | % | | $ | 64,223 | |
| | 1.05 | % | | | 1.39 | % | | | 1.20 | % | | | 14.87 | % | | | 77 | % | | $ | 61,117 | |
| | 1.23 | % | | | 1.39 | % | | | 1.20 | % | | | 21.85 | % | | | 80 | % | | $ | 55,777 | |
| | 1.40 | % | | | 1.36 | % | | | 1.20 | % | | | (4.53 | )% | | | 107 | % | | $ | 49,403 | |
| | | | | | | | | | | | | | | | | | | | | | |
| | 0.36 | % | | | 2.09 | % | | | 1.95 | % | | | (1.87 | )% | | | 79 | % | | $ | 167 | |
| | 0.18 | % | | | 2.14 | % | | | 1.95 | % | | | 7.12 | % | | | 75 | % | | $ | 164 | |
| | 0.25 | % | | | 2.14 | % | | | 1.95 | % | | | 14.00 | % | | | 77 | % | | $ | 476 | |
| | 0.45 | % | | | 2.12 | % | | | 1.95 | % | | | 20.91 | % | | | 80 | % | | $ | 970 | |
| | 0.61 | % | | | 2.10 | % | | | 1.95 | % | | | (5.23 | )% | | | 107 | % | | $ | 1,704 | |
| | | | | | | | | | | | | | | | | | | | | | |
| | 0.36 | % | | | 2.10 | % | | | 1.95 | % | | | (1.88 | )% | | | 79 | % | | $ | 16,225 | |
| | 0.22 | % | | | 2.15 | % | | | 1.95 | % | | | 7.13 | % | | | 75 | % | | $ | 14,349 | |
| | 0.31 | % | | | 2.14 | % | | | 1.95 | % | | | 13.99 | % | | | 77 | % | | $ | 12,637 | |
| | 0.48 | % | | | 2.14 | % | | | 1.95 | % | | | 20.97 | % | | | 80 | % | | $ | 9,326 | |
| | 0.65 | % | | | 2.11 | % | | | 1.95 | % | | | (5.26 | )% | | | 107 | % | | $ | 7,656 | |
| | | | | | | | | | | | | | | | | | | | | | |
| | 1.35 | % | | | 1.27 | % | | | 0.95 | % | | | (0.86 | )% | | | 79 | % | | $ | 175,715 | |
| | 1.22 | % | | | 1.24 | % | | | 0.95 | % | | | 8.16 | % | | | 75 | % | | $ | 182,373 | |
| | 1.29 | % | | | 1.23 | % | | | 0.95 | % | | | 15.16 | % | | | 77 | % | | $ | 175,094 | |
| | 1.47 | % | | | 1.22 | % | | | 0.95 | % | | | 22.18 | % | | | 80 | % | | $ | 175,142 | |
| | 1.64 | % | | | 1.20 | % | | | 0.95 | % | | | (4.30 | )% | | | 107 | % | | $ | 220,021 | |
The accompanying notes are an integral part of these financial statements.
| | | | |
| 24 | | Wells Fargo Allocation Funds | | Financial highlights |
| | | | | | | | | | | | | | | | | | | | | | | | |
| Moderate Balanced Fund | | Beginning
net asset
value per
share | | | Net
investment
income | | | Net realized
and unrealized
gains (losses)
on investments | | | Distributions
from net
investment
income | | | Distributions
from net
realized gains | | | Ending
net asset
value per
share | |
Class A | | | | | | | | | | | | | | | | | | | | | | | | |
Year ended May 31, 2016 | | $ | 23.57 | | | | 0.28 | 4 | | | (0.23 | ) | | | (0.26 | ) | | | (0.85 | ) | | $ | 22.51 | |
Year ended May 31, 2015 | | $ | 23.19 | | | | 0.32 | | | | 1.01 | | | | (0.44 | ) | | | (0.51 | ) | | $ | 23.57 | |
Year ended May 31, 2014 | | $ | 21.21 | | | | 0.29 | 4 | | | 1.82 | | | | (0.13 | ) | | | 0.00 | | | $ | 23.19 | |
Year ended May 31, 2013 | | $ | 18.84 | | | | 0.21 | | | | 2.50 | | | | (0.34 | ) | | | 0.00 | | | $ | 21.21 | |
Year ended May 31, 2012 | | $ | 19.64 | | | | 0.32 | | | | (0.54 | ) | | | (0.58 | ) | | | 0.00 | | | $ | 18.84 | |
Class B | | | | | | | | | | | | | | | | | | | | | | | | |
Year ended May 31, 2016 | | $ | 23.81 | | | | 0.11 | 4 | | | (0.23 | ) | | | (0.03 | ) | | | (0.85 | ) | | $ | 22.81 | |
Year ended May 31, 2015 | | $ | 23.16 | | | | 0.09 | 4 | | | 1.07 | | | | 0.00 | | | | (0.51 | ) | | $ | 23.81 | |
Year ended May 31, 2014 | | $ | 21.25 | | | | 0.11 | 4 | | | 1.83 | | | | (0.03 | ) | | | 0.00 | | | $ | 23.16 | |
Year ended May 31, 2013 | | $ | 18.86 | | | | 0.13 | 4 | | | 2.43 | | | | (0.17 | ) | | | 0.00 | | | $ | 21.25 | |
Year ended May 31, 2012 | | $ | 19.58 | | | | 0.18 | 4 | | | (0.53 | ) | | | (0.37 | ) | | | 0.00 | | | $ | 18.86 | |
Class C | | | | | | | | | | | | | | | | | | | | | | | | |
Year ended May 31, 2016 | | $ | 23.18 | | | | 0.11 | 4 | | | (0.23 | ) | | | (0.16 | ) | | | (0.85 | ) | | $ | 22.05 | |
Year ended May 31, 2015 | | $ | 22.79 | | | | 0.09 | 4 | | | 1.04 | | | | (0.23 | ) | | | (0.51 | ) | | $ | 23.18 | |
Year ended May 31, 2014 | | $ | 20.96 | | | | 0.12 | 4 | | | 1.80 | | | | (0.09 | ) | | | 0.00 | | | $ | 22.79 | |
Year ended May 31, 2013 | | $ | 18.63 | | | | 0.11 | | | | 2.42 | | | | (0.20 | ) | | | 0.00 | | | $ | 20.96 | |
Year ended May 31, 2012 | | $ | 19.45 | | | | 0.18 | 4 | | | (0.53 | ) | | | (0.47 | ) | | | 0.00 | | | $ | 18.63 | |
Administrator Class | | | | | | | | | | | | | | | | | | | | | | | | |
Year ended May 31, 2016 | | $ | 23.75 | | | | 0.32 | | | | (0.21 | ) | | | (0.31 | ) | | | (0.85 | ) | | $ | 22.70 | |
Year ended May 31, 2015 | | $ | 23.38 | | | | 0.33 | 4 | | | 1.07 | | | | (0.52 | ) | | | (0.51 | ) | | $ | 23.75 | |
Year ended May 31, 2014 | | $ | 21.36 | | | | 0.38 | | | | 1.79 | | | | (0.15 | ) | | | 0.00 | | | $ | 23.38 | |
Year ended May 31, 2013 | | $ | 18.96 | | | | 0.41 | | | | 2.38 | | | | (0.39 | ) | | | 0.00 | | | $ | 21.36 | |
Year ended May 31, 2012 | | $ | 19.77 | | | | 0.40 | | | | (0.58 | ) | | | (0.63 | ) | | | 0.00 | | | $ | 18.96 | |
| 1 | Ratios include net expenses allocated from the affiliated Master Portfolios which were as follows: |
| | | | | | | | | | | | | | | | | | | | |
| | | Year ended May 31 | |
| | | 2016 | | | 2015 | | | 2014 | | | 2013 | | | 2012 | |
Class A | | | 0.47 | % | | | 0.47 | % | | | 0.46 | % | | | 0.46 | % | | | 0.45 | % |
Class B | | | 0.46 | | | | 0.47 | | | | 0.46 | | | | 0.46 | | | | 0.45 | |
Class C | | | 0.47 | | | | 0.47 | | | | 0.46 | | | | 0.46 | | | | 0.45 | |
Administrator Class | | | 0.47 | | | | 0.47 | | | | 0.46 | | | | 0.46 | | | | 0.45 | |
| 2 | Total return calculations do not include any sales charges. |
| 3 | Portfolio turnover rate is calculated by aggregating the results of multiplying the Fund’s investment percentage in the respective affiliated Master Portfolio by the corresponding affiliated Master Portfolio’s portfolio turnover rate. |
| 4 | Calculated based upon average shares outstanding |
The accompanying notes are an integral part of these financial statements.
| | | | | | |
| Financial highlights | | Wells Fargo Allocation Funds | | | 25 | |
| | | | | | | | | | | | | | | | | | | | | | |
| Ratio to average net assets (annualized) | | | | | | Portfolio
turnover
rate3 | | | Net assets at
end of period
(000s omitted) | |
Net investment
income | | | Gross
expenses1 | | | Net expenses1 | | | Total
return2 | | | |
| | | | | | | | | | | | | | | | | | | | | | |
| | 1.26 | % | | | 1.32 | % | | | 1.15 | % | | | 0.34 | % | | | 87 | % | | $ | 35,993 | |
| | 1.14 | % | | | 1.36 | % | | | 1.15 | % | | | 5.87 | % | | | 84 | % | | $ | 20,782 | |
| | 1.29 | % | | | 1.36 | % | | | 1.15 | % | | | 9.94 | % | | | 89 | % | | $ | 18,169 | |
| | 1.41 | % | | | 1.36 | % | | | 1.15 | % | | | 14.57 | % | | | 86 | % | | $ | 10,344 | |
| | 1.68 | % | | | 1.33 | % | | | 1.15 | % | | | (0.93 | )% | | | 115 | % | | $ | 9,935 | |
| | | | | | | | | | | | | | | | | | | | | | |
| | 0.48 | % | | | 2.06 | % | | | 1.90 | % | | | (0.43 | )% | | | 87 | % | | $ | 153 | |
| | 0.38 | % | | | 2.10 | % | | | 1.90 | % | | | 5.07 | % | | | 84 | % | | $ | 208 | |
| | 0.50 | % | | | 2.11 | % | | | 1.90 | % | | | 9.15 | % | | | 89 | % | | $ | 380 | |
| | 0.65 | % | | | 2.11 | % | | | 1.90 | % | | | 13.65 | % | | | 86 | % | | $ | 613 | |
| | 0.94 | % | | | 2.08 | % | | | 1.90 | % | | | (1.66 | )% | | | 115 | % | | $ | 807 | |
| | | | | | | | | | | | | | | | | | | | | | |
| | 0.51 | % | | | 2.07 | % | | | 1.90 | % | | | (0.44 | )% | | | 87 | % | | $ | 12,501 | |
| | 0.40 | % | | | 2.11 | % | | | 1.90 | % | | | 5.06 | % | | | 84 | % | | $ | 6,042 | |
| | 0.54 | % | | | 2.11 | % | | | 1.90 | % | | | 9.15 | % | | | 89 | % | | $ | 4,469 | |
| | 0.66 | % | | | 2.11 | % | | | 1.90 | % | | | 13.65 | % | | | 86 | % | | $ | 2,576 | |
| | 0.92 | % | | | 2.08 | % | | | 1.90 | % | | | (1.67 | )% | | | 115 | % | | $ | 2,319 | |
| | | | | | | | | | | | | | | | | | | | | | |
| | 1.48 | % | | | 1.23 | % | | | 0.90 | % | | | 0.59 | % | | | 87 | % | | $ | 156,915 | |
| | 1.39 | % | | | 1.20 | % | | | 0.90 | % | | | 6.13 | % | | | 84 | % | | $ | 153,457 | |
| | 1.52 | % | | | 1.20 | % | | | 0.90 | % | | | 10.18 | % | | | 89 | % | | $ | 144,248 | |
| | 1.66 | % | | | 1.20 | % | | | 0.90 | % | | | 14.81 | % | | | 86 | % | | $ | 146,729 | |
| | 1.92 | % | | | 1.17 | % | | | 0.90 | % | | | (0.66 | )% | | | 115 | % | | $ | 172,587 | |
The accompanying notes are an integral part of these financial statements.
| | | | |
| 26 | | Wells Fargo Allocation Funds | | Notes to financial statements |
1. ORGANIZATION
Wells Fargo Funds Trust (the “Trust”), a Delaware statutory trust organized on March 10, 1999, is an open-end management investment company registered under the Investment Company Act of 1940, as amended (the “1940 Act”). As an investment company, the Trust follows the accounting and reporting guidance in Financial Accounting Standards Board (“FASB”) Accounting Standards Codification Topic 946, Financial Services – Investment Companies. These financial statements report on the following funds: Wells Fargo Growth Balanced Fund (“Growth Balanced Fund”) and Wells Fargo Moderate Balanced Fund (“Moderate Balanced Fund”) (each, a “Fund”, collectively, the “Funds”). Each Fund is a diversified series of the Trust.
Each Fund seeks to achieve its investment objective by investing all investable assets in separate diversified portfolios (each, an “affiliated Master Portfolio”, collectively, the “affiliated Master Portfolios”) of Wells Fargo Master Trust, a registered open-end management investment company. Each affiliated Master Portfolio directly acquires portfolio securities, and a Fund investing in an affiliated Master Portfolio acquires an indirect interest in those securities. Each Fund accounts for its investment in the affiliated Master Portfolios as partnership investments and records on a daily basis its share of the affiliated Master Portfolio’s income, expense and realized and unrealized gains and losses. The financial statements of the affiliated Master Portfolios for the year ended May 31, 2016 are included in this report and should be read in conjunction with each Fund’s financial statements. As of May 31, 2016, the Funds own the following percentages of the affiliated Master Portfolios:
| | | | | | | | |
| | | Growth
Balanced
Fund | | | Moderate
Balanced
Fund | |
Wells Fargo C&B Large Cap Value Portfolio | | | 5 | % | | | 2 | % |
Wells Fargo Core Bond Portfolio | | | 0 | * | | | 0 | * |
Wells Fargo Diversified Large Cap Growth Portfolio | | | 36 | | | | 18 | |
Wells Fargo Emerging Growth Portfolio | | | 0 | * | | | 0 | * |
Wells Fargo Index Portfolio | | | 2 | | | | 1 | |
Wells Fargo International Growth Portfolio | | | 8 | | | | 4 | |
Wells Fargo International Value Portfolio | | | 2 | | | | 1 | |
Wells Fargo Large Company Value Portfolio | | | 36 | | | | 17 | |
Wells Fargo Managed Fixed Income Portfolio | | | 50 | | | | 50 | |
Wells Fargo Real Return Portfolio | | | 14 | | | | 14 | |
Wells Fargo Small Company Growth Portfolio | | | 0 | * | | | 0 | * |
Wells Fargo Small Company Value Portfolio | | | 4 | | | | 2 | |
Wells Fargo Stable Income Portfolio | | | N/A | | | | 100 | |
| * | The amount owned is less than 1%. |
2. SIGNIFICANT ACCOUNTING POLICIES
The following significant accounting policies, which are consistently followed in the preparation of the financial statements of each Fund, are in conformity with U.S. generally accepted accounting principles which require management to make estimates and assumptions that affect the reported amounts of assets and liabilities, disclosure of contingent assets and liabilities at the date of the financial statements, and the reported amounts of revenues and expenses during the reporting period. Actual results could differ from those estimates.
Securities valuation
All investments are valued each business day as of the close of regular trading on the New York Stock Exchange (generally 4 p.m. Eastern Time), although the Fund may deviate from this calculation time under unusual or unexpected circumstances.
Investments in the affiliated Master Portfolios are valued daily based on each Fund’s proportionate share of each affiliated Master Portfolio’s net assets, which are also valued daily. Securities held in the affiliated Master Portfolios are valued as discussed in the Notes to Financial Statements of the affiliated Master Portfolios, which are included elsewhere in this report.
| | | | | | |
| Notes to financial statements | | Wells Fargo Allocation Funds | | | 27 | |
Futures that are listed on a foreign or domestic exchange or market are valued at the official closing price or, if none, the last sales price.
Debt securities are valued at the evaluated bid price provided by an independent pricing service or, if a reliable price is not available, the quoted bid price from an independent broker-dealer.
Investments which are not valued using any of the methods discussed above are valued at their fair value, as determined in good faith by the Board of Trustees of the Funds. The Board of Trustees has established a Valuation Committee comprised of the Trustees and has delegated to it the authority to take any actions regarding the valuation of portfolio securities that the Valuation Committee deems necessary or appropriate, including determining the fair value of portfolio securities, unless the determination has been delegated to the Management Valuation Team of Wells Fargo Funds Management, LLC (“Funds Management”). The Board of Trustees retains the authority to make or ratify any valuation decisions or approve any changes to the Valuation Procedures as it deems appropriate. On a quarterly basis, the Board of Trustees receives reports on any valuation actions taken by the Valuation Committee or the Management Valuation Team which may include items for ratification.
Valuations of fair valued securities are compared to the next actual sales price when available, or other appropriate market values, to assess the continued appropriateness of the fair valuation methodologies used. These securities are fair valued on a day-to-day basis, taking into consideration changes to appropriate market information and any significant changes to the inputs considered in the valuation process until there is a readily available price provided on an exchange or by an independent pricing service. Valuations received from an independent pricing service or independent broker-dealer quotes are periodically validated by comparisons to most recent trades and valuations provided by other independent pricing services in addition to the review of prices by the manager and/or subadviser. Unobservable inputs used in determining fair valuations are identified based on the type of security, taking into consideration factors utilized by market participants in valuing the investment, knowledge about the issuer and the current market environment.
Futures contracts
Each Fund is subject to interest rate risk, equity price risk, and foreign exchange rate risk in the normal course of pursuing its investment objectives. The Fund may buy and sell futures contracts in order to gain exposure to, or protect against, changes in security values and interest rates. The primary risks associated with the use of futures contracts are the imperfect correlation between changes in market values of securities held by the Fund and the prices of futures contracts, and the possibility of an illiquid market.
The aggregate principal amounts of the contracts are not recorded in the financial statements. Fluctuations in the value of the contracts are recorded in the Statements of Assets and Liabilities as an asset or liability and in the Statements of Operations as unrealized gains or losses until the contracts are closed, at which point they are recorded as net realized gains or losses on futures contracts. With futures contracts, there is minimal counterparty risk to the Fund since futures are exchange traded and the exchange’s clearinghouse, as counterparty to all exchange traded futures, guarantees the futures against default.
Security transactions and income recognition
Securities transactions are recorded on a trade date basis in each Fund and each affiliated Master Portfolio. Realized gains or losses in each Fund and each affiliated Master Portfolio are recorded on the basis of identified cost.
Interest income is accrued daily and bond discounts are accreted and premiums are amortized daily based on the effective interest method by each affiliated Master Portfolio. To the extent debt obligations are placed on non-accrual status, any related interest income may be reduced by writing off interest receivables when the collection of all or a portion of interest has become doubtful based on consistently applied procedures. If the issuer subsequently resumes interest payments or when the collectability of interest is reasonably assured, the debt obligation is removed from non-accrual status.
Dividend income in each affiliated Master Portfolio is recognized on the ex-dividend date, except for certain dividends from foreign securities which are recorded as soon as the custodian verifies the ex-dividend date.
Income from foreign securities in each affiliated Master Portfolio is recorded net of foreign taxes withheld where recovery of such taxes is not assured.
Each Fund records daily its proportionate share of each affiliated Master Portfolio’s interest and dividend income and realized and unrealized gains or losses.
| | | | |
| 28 | | Wells Fargo Allocation Funds | | Notes to financial statements |
Distributions to shareholders
Distributions to shareholders from net investment income and net realized gains, if any, are recorded on the ex-dividend date. Such distributions are determined in conformity with federal income tax regulations, which may differ in amount or character from net investment income and realized gains recognized for purposes of U.S. generally accepted accounting principles.
Federal and other taxes
Each Fund is treated as a separate entity for federal income tax purposes. Each Fund intends to continue to qualify as a regulated investment company by distributing substantially all of its investment company taxable income and any net realized capital gains (after reduction for capital loss carryforwards) sufficient to relieve it from all, or substantially all, federal income taxes. Accordingly, no provision for federal income taxes was required.
Each Fund’s income and federal excise tax returns and all financial records supporting those returns for the prior three fiscal years are subject to examination by the federal and Delaware revenue authorities. Management has analyzed each Fund’s tax positions taken on federal, state, and foreign tax returns for all open tax years and does not believe that there are any uncertain tax positions that require recognition of a tax liability.
Reclassifications are made to each Fund’s capital accounts for permanent tax differences to reflect income and gains available for distribution (or available capital loss carryforwards) under federal income tax regulations. U.S. generally accepted accounting principles require that certain components of net assets be adjusted to reflect permanent differences between financial and tax reporting. These reclassifications have no effect on net assets or net asset values per share. At May 31, 2016, as a result of permanent book-to-tax differences, the following reclassification adjustments were made on the Statements of Assets and Liabilities:
| | | | | | | | | | | | |
| | | Paid-in
capital | | | Undistributed
net investment
income | | | Accumulated
net realized
gains (losses) on
investments | |
Growth Balanced Fund | | $ | 142,554 | | | $ | (145,671 | ) | | $ | 3,117 | |
Moderate Balanced Fund | | | 66,958 | | | | (64,779 | ) | | | (2,179 | ) |
As of May 31, 2016, Growth Balanced Fund had capital loss carryforwards that are available to offset future net realized capital gains in the amount of $137,481,627 with $54,903,400 expiring in 2017 and $82,578,227 expiring in 2018.
As of May 31, 2016, Growth Balanced Fund had current year deferred post-October capital losses of $1,137,602, which will be recognized on the first day of the following fiscal year.
Class allocations
The separate classes of shares offered by each Fund differ principally in applicable sales charges, distribution, shareholder servicing, and administration fees. Class specific expenses are charged directly to that share class. Investment income, common expenses, and realized and unrealized gains (losses) on investments are allocated daily to each class of shares based on the relative proportion of net assets of each class.
3. FAIR VALUATION MEASUREMENTS
Fair value measurements of investments are determined within a framework that has established a fair value hierarchy based upon the various data inputs utilized in determining the value of each Fund’s investments. The three-level hierarchy gives the highest priority to unadjusted quoted prices in active markets for identical assets or liabilities (Level 1) and the lowest priority to significant unobservable inputs (Level 3). Each Fund’s investments are classified within the fair value hierarchy based on the lowest level of input that is significant to the fair value measurement. The inputs are summarized into three broad levels as follows:
| n | | Level 1 – quoted prices in active markets for identical securities |
| n | | Level 2 – other significant observable inputs (including quoted prices for similar securities, interest rates, prepayment speeds, credit risk, use of amortized cost, etc.) |
| n | | Level 3 – significant unobservable inputs (including the Fund’s own assumptions in determining the fair value of investments) |
| | | | | | |
| Notes to financial statements | | Wells Fargo Allocation Funds | | | 29 | |
The inputs or methodologies used for valuing investments in securities are not necessarily an indication of the risk associated with investing in those securities.
The following is a summary of the inputs used in valuing each Fund’s assets and liabilities as of May 31, 2016:
| | | | | | | | | | | | | | | | |
| Growth Balanced Fund | | Quoted prices
(Level 1) | | | Other significant
observable inputs
(Level 2) | | | Significant
unobservable inputs (Level 3) | | | Total | |
Assets | | | | | | | | | | | | | | | | |
Investments in: | | | | | | | | | | | | | | | | |
| | | | |
Short-term investments | | | | | | | | | | | | | | | | |
U.S. Treasury securities | | $ | 136,995 | | | $ | 0 | | | $ | 0 | | | $ | 136,995 | |
Investments measured at net asset value* | | | | | | | | | | | | | | | 257,978,783 | |
| | | 136,995 | | | | 0 | | | | 0 | | | | 258,115,778 | |
Futures contracts | | | 1,500 | | | | 0 | | | | 0 | | | | 1,500 | |
Total assets | | $ | 138,495 | | | $ | 0 | | | $ | 0 | | | $ | 258,117,278 | |
| * | Investments that are measured at fair value using the net asset value per share (or its equivalent) as a practical expedient have not been categorized in the fair value hierarchy. At May 31, 2016, the aggregated affiliated Master Portfolios measured at fair value using the net asset value per share (or its equivalent) were valued at $257,978,783. Each affiliated Master Portfolio does not have a redemption period notice, can be redeemed daily and does not have any unfunded commitments. |
| | | | | | | | | | | | | | | | |
| Moderate Balanced Fund | | Quoted prices
(Level 1) | | | Other significant
observable inputs
(Level 2) | | | Significant
unobservable inputs (Level 3) | | | Total | |
Assets | | | | | | | | | | | | | | | | |
Investments in: | | | | | | | | | | | | | | | | |
| | | | |
Short-term investments | | | | | | | | | | | | | | | | |
U.S. Treasury securities | | $ | 105,997 | | | $ | 0 | | | $ | 0 | | | $ | 105,997 | |
Investments measured at net asset value* | | | | | | | | | | | | | | | 204,509,135 | |
| | | 105,997 | | | | 0 | | | | 0 | | | | 204,615,132 | |
Futures contracts | | | 1,156 | | | | 0 | | | | 0 | | | | 1,156 | |
Total assets | | $ | 107,153 | | | $ | 0 | | | $ | 0 | | | $ | 204,616,288 | |
| * | Investments that are measured at fair value using the net asset value per share (or its equivalent) as a practical expedient have not been categorized in the fair value hierarchy. At May 31, 2016, the aggregated affiliated Master Portfolios measured at fair value using the net asset value per share (or its equivalent) were valued at $204,509,135. Each affiliated Master Portfolio does not have a redemption period notice, can be redeemed daily and does not have any unfunded commitments. |
Futures contracts are reported at their variation margin at measurement date, which represents the amount due to the Fund at that date. All other assets and liabilities are reported at their market value at measurement date.
The Funds recognize transfers between levels within the fair value hierarchy at the end of the reporting period. At May 31, 2016, the Funds did not have any transfers into/out of Level 1, Level 2, or Level 3.
| | | | |
| 30 | | Wells Fargo Allocation Funds | | Notes to financial statements |
The investment objective of each affiliated Master Portfolio is as follows:
| | |
| Affiliated Master Portfolio | | Investment objective |
Wells Fargo C&B Large Cap Value Portfolio | | Seeks maximum long-term total return (current income and capital appreciation), consistent with minimizing risk to principal |
Wells Fargo Core Bond Portfolio | | Seeks total return, consisting of income and capital appreciation |
Wells Fargo Diversified Large Cap Growth Portfolio | | Seeks long-term capital appreciation |
Wells Fargo Emerging Growth Portfolio | | Seeks long-term capital appreciation |
Wells Fargo Index Portfolio | | Seeks to replicate the total return of the S&P 500 Index, before expenses |
Wells Fargo International Growth Portfolio | | Seeks long-term capital appreciation |
Wells Fargo International Value Portfolio | | Seeks long-term capital appreciation |
Wells Fargo Large Company Value Portfolio | | Seeks long-term capital appreciation |
Wells Fargo Managed Fixed Income Portfolio | | Seeks consistent fixed-income returns |
Wells Fargo Real Return Portfolio | | Seeks returns that exceed the rate of inflation over the long-term |
Wells Fargo Small Company Growth Portfolio | | Seeks long-term capital appreciation |
Wells Fargo Small Company Value Portfolio | | Seeks long-term capital appreciation |
Wells Fargo Stable Income Portfolio | | Seeks current income consistent with capital preservation |
4. TRANSACTIONS WITH AFFILIATES
Management fee
Funds Management, an indirect wholly owned subsidiary of Wells Fargo & Company (“Wells Fargo”), is the manager of each Fund and provides advisory and fund-level administrative services under an investment management agreement. Under the investment management agreement, Funds Management is responsible for, among other services, implementing the investment objectives and strategies of each Fund, supervising the applicable subadvisers, providing fund-level administrative services in connection with each Fund’s operations, and providing any other fund-level administrative services reasonably necessary for the operation of each Fund. As compensation for its services under the investment management agreement, Funds Management is entitled to receive an annual management fee starting at 0.30% and declining to 0.22% as the average daily net assets of each Fund increase.
Prior to July 1, 2015, Funds Management provided advisory services pursuant to an investment advisory agreement and was entitled to receive an annual fee which started at 0.25% and declined to 0.19% as the average daily net assets of each Fund increased. In addition, fund-level administrative services were provided by Funds Management under a separate administration agreement at an annual fee which started at 0.05% and declined to 0.03% as the average daily net assets of each Fund increased. For financial statement purposes, the advisory fee and fund-level administration fee for the year ended May 31, 2016 have been included in management fee on the Statements of Operations.
For the year ended May 31, 2016, the management fee was equivalent to an annual rate of 0.30% of each Fund’s average daily net assets.
Funds Management also serves as the adviser to each affiliated Master Portfolio and is entitled to receive a fee from each affiliated Master Portfolio for those services.
| | | | | | |
| Notes to financial statements | | Wells Fargo Allocation Funds | | | 31 | |
Administration fees
Under a class-level administration agreement, Funds Management provides class-level administrative services to the Funds, which includes paying fees and expenses for services provided by the transfer agent, sub-transfer agents, omnibus account servicers and record-keepers. As compensation for its services under the class-level administration agreement, Funds Management receives an annual fee which is calculated based on the average daily net assets of each class as follows:
| | | | | | | | |
| | | Class-level
administration fee | |
| | | Current rate | | | Rate prior to
July 1, 2015 | |
Class A, Class B, Class C | | | 0.21 | % | | | 0.26 | % |
Administrator Class | | | 0.13 | | | | 0.10 | |
Funds Management has contractually waived and/or reimbursed management and administration fees to the extent necessary to maintain certain net operating expense ratios for the Funds. Waiver of fees and/or reimbursement of expenses by Funds Management were made first from fund level expenses on a proportionate basis and then from class specific expenses. Funds Management has committed through September 30, 2016 to waive fees and/or reimburse expenses to the extent necessary to cap each Fund’s expenses as follows:
| | | | | | | | | | | | | | | | |
| | | Class A | | | Class B | | | Class C | | | Administrator
Class | |
Growth Balanced Fund | | | 1.20 | % | | | 1.95 | % | | | 1.95 | % | | | 0.95 | % |
Moderate Balanced Fund | | | 1.15 | | | | 1.90 | | | | 1.90 | | | | 0.90 | |
Net expenses from affiliated Master Portfolios are included in the expense caps. After the expiration date, each expense cap may be increased or the commitment to maintain the cap may be terminated only with the approval of the Board of Trustees.
Distribution fees
The Trust has adopted a Distribution Plan for Class B and Class C shares of the applicable Funds pursuant to Rule 12b-1 under the 1940 Act. Distribution fees are charged to the Class B and Class C shares and paid to Wells Fargo Funds Distributor, LLC (“Funds Distributor”), the principal underwriter of each Fund, at an annual rate of 0.75% of the average daily net assets of Class B and Class C shares.
In addition, Funds Distributor is entitled to receive the front-end sales charge from the purchase of Class A shares and a contingent deferred sales charge on the redemption of certain Class A shares. Funds Distributor is also entitled to receive the contingent deferred sales charges from redemptions of Class B and Class C shares. For the year ended May 31, 2016, Funds Distributor received the following amounts in front-end sales charges:
| | | | |
| | | Class A | |
Growth Balanced Fund | | $ | 21,867 | |
Moderate Balanced Fund | | | 25,046 | |
Shareholder servicing fees
The Trust has entered into contracts with one or more shareholder servicing agents, whereby Class A, Class B, Class C, and Administrator Class of each applicable Fund are charged a fee at an annual rate of 0.25% of the average daily net assets of each respective class.
A portion of these total shareholder servicing fees were paid to affiliates of Wells Fargo.
| | | | |
| 32 | | Wells Fargo Allocation Funds | | Notes to financial statements |
5. INVESTMENT PORTFOLIO TRANSACTIONS
Purchases and sales of investments, excluding short-term securities, for the year ended May 31, 2016 were as follows:
| | | | | | | | | | | | |
| | | Purchases at cost* | | | Sales proceeds* | |
| | | U.S.
government | | Non-U.S.
government | | | U.S.
government | | Non-U.S.
government | |
Growth Balanced Fund | | $112,986,422 | | $ | 96,623,264 | | | $109,571,069 | | $ | 91,674,902 | |
Moderate Balanced Fund | | 119,566,934 | | | 73,969,025 | | | 112,172,162 | | | 59,693,981 | |
| * | The Funds seek to achieve their investment objective by investing substantially all of their investable assets in affiliated Master Portfolios. Purchases and sales related to these investments have been calculated by aggregating the results of multiplying each Fund’s ownership percentage of the respective affiliated Master Portfolio by the corresponding affiliated Master Portfolio’s purchases and sales. Purchases and sales of unaffiliated securities in which the Funds invest are actual purchases and sale of those securities. |
6. DERIVATIVE TRANSACTIONS
During the year ended May 31, 2016, the Funds entered into futures contracts to gain market exposure to certain asset classes consistent with an active asset allocation strategy.
At May 31, 2016, the Funds had short futures contracts outstanding as follows:
| | | | | | | | | | | | | | | | | | |
| | | Expiration date | | Counterparty | | Contracts | | Type | | | Contract
value at
May 31, 2016 | | | Unrealized
losses | |
Growth Balanced Fund | | 9-21-2016 | | Goldman Sachs | | 96 Short | | | 10-Year U.S. Treasury Note | | | $ | 12,450,000 | | | $ | (30,275 | ) |
Moderate Balanced Fund | | 9-21-2016 | | Goldman Sachs | | 74 Short | | | 10-Year U.S. Treasury Note | | | | 9,596,875 | | | | (23,337 | ) |
The Funds had an average notional amounts in futures contracts during the year ended May 31, 2016 as follows:
| | | | | | | | |
| | | Long contracts | | | Short contracts | |
Growth Balanced Fund | | $ | 4,081,257 | | | $ | 7,858,548 | |
Moderate Balanced Fund | | | 3,008,717 | | | | 5,852,332 | |
A summary of derivative instruments by primary risk exposure is outlined in the following tables.
The fair value of derivative instruments as of May 31, 2016 was as follows for Growth Balanced Fund:
| | | | | | | | | | | | |
| | | Asset derivatives | | | Liability derivatives | |
| | | Statements of Assets and
Liabilities location | | Fair value | | | Statements of Assets and
Liabilities location | | Fair value | |
Interest rate contracts | | Receivable for daily variation margin on open futures contracts | | $ | 1,500 | * | | Payable for daily variation margin on open futures contracts | | $ | 0 | |
| * | Only the current day’s variation margin as of May 31, 2016 is reported separately on the Statements of Assets and Liabilities. |
The effect of derivative instruments on the Statements of Operations for the year ended May 31, 2016 was as follows for Growth Balanced Fund:
| | | | | | | | |
| | | Amount of realized
gains (losses) on
derivatives | | | Change in unrealized
gains on derivatives | |
Interest rate contracts | | $ | 74,830 | | | $ | 8,873 | |
Equity contracts | | | (253,223 | ) | | | 56,282 | |
Foreign exchange contracts | | | 1,461,468 | | | | 37,065 | |
| | | $ | 1,283,075 | | | $ | 102,220 | |
| | | | | | |
| Notes to financial statements | | Wells Fargo Allocation Funds | | | 33 | |
The fair value of derivative instruments as of May 31, 2016 was as follows for Moderate Balanced Fund:
| | | | | | | | | | | | |
| | | Asset derivatives | | | Liability derivatives | |
| | | Statements of Assets and
Liabilities location | | Fair value | | | Statements of Assets and
Liabilities location | | Fair value | |
Interest rate contracts | | Receivable for daily variation margin on open futures contracts | | $ | 1,156 | * | | Payable for daily variation margin on open futures contracts | | $ | 0 | |
| * | Only the current day’s variation margin as of May 31, 2016 is reported separately on the Statements of Assets and Liabilities. |
The effect of derivative instruments on the Statements of Operations for the year ended May 31, 2016 was as follows for Moderate Balanced Fund:
| | | | | | | | |
| | | Amount of realized
gains (losses) on
derivatives | | | Change in unrealized
gains on
derivatives | |
Interest rate contracts | | $ | 36,313 | | | $ | 3,694 | |
Equity contracts | | | 1,113,069 | | | | 38,815 | |
Foreign exchange contracts | | | (174,081 | ) | | | 26,302 | |
| | | $ | 975,301 | | | $ | 68,811 | |
For certain types of derivative transactions, the Funds have entered into International Swaps and Derivatives Association, Inc. master agreements (“ISDA Master Agreements”) or similar agreements with approved counterparties. The ISDA Master Agreements or similar agreements may have requirements to deliver/deposit securities or cash to/with an exchange or broker-dealer as collateral and allow the Funds to offset, with each counterparty, certain derivative financial instrument’s assets and/or liabilities with collateral held or pledged. Collateral requirements differ by type of derivative. Collateral or margin requirements are set by the broker or exchange clearing house for exchange traded derivatives while collateral terms are contract specific for over-the-counter traded derivatives. Cash collateral that has been pledged to cover obligations of the Funds under ISDA Master Agreements or similar agreements, if any, are reported separately in the Statements of Assets and Liabilities. Securities pledged as collateral, if any, are noted in the Portfolio of Investments. With respect to balance sheet offsetting, absent an event of default by the counterparty or a termination of the agreement, the reported amounts of financial assets and financial liabilities in the Statements of Assets and Liabilities are not offset across transactions between each Fund and the applicable counterparty. A reconciliation of the gross amounts on the Statements of Assets and Liabilities to the net amounts by derivative type, including any collateral exposure, is as follows:
| | | | | | | | | | | | | | | | | | | | |
| | | Derivative type | | Counterparty | | Gross amounts
of assets in the
Statements of
Assets and
Liabilities | | | Amounts
subject to
netting
agreements | | | Collateral
received | | | Net amount of
assets | |
| Growth Balanced Fund | | Futures – variation margin | | Goldman Sachs | | $ | 1,500 | | | $ | 0 | | | $ | 0 | | | $ | 1,500 | |
| Moderate Balanced Fund | | Futures – variation margin | | Goldman Sachs | | | 1,156 | | | | 0 | | | | 0 | | | | 1,156 | |
7. BANK BORROWINGS
The Trust (excluding the money market funds and certain other funds) and Wells Fargo Variable Trust are parties to a $200,000,000 revolving credit agreement whereby each Fund is permitted to use bank borrowings for temporary or emergency purposes, such as to fund shareholder redemption requests. Interest under the credit agreement is charged to each Fund based on a borrowing rate equal to the higher of the Federal Funds rate in effect on that day plus 1.25% or the overnight LIBOR rate in effect on that day plus 1.25%. In addition, an annual commitment fee equal to 0.20% of the unused balance is allocated to each participating fund. Prior to September 1, 2015, the revolving credit agreement amount was $25,000,000 with annual commitment fee of 0.15% of the unused balance which was allocated to each participating fund.
For the year ended May 31, 2016, there were no borrowings by Funds under the agreement.
| | | | |
| 34 | | Wells Fargo Allocation Funds | | Notes to financial statements |
8. DISTRIBUTIONS TO SHAREHOLDERS
The tax character of distributions paid during the years ended May 31, 2016 and May 31, 2015 were as follows:
| | | | | | | | | | | | | | | | |
| | | Ordinary income | | | Long-term capital gain | |
| | | 2016 | | | 2015 | | | 2016 | | | 2015 | |
Growth Balanced Fund | | $ | 2,719,460 | | | $ | 1,326,245 | | | $ | 0 | | | $ | 0 | |
Moderate Balanced Fund | | | 2,856,780 | | | | 4,508,014 | | | | 6,284,057 | | | | 2,849,163 | |
As of May 31, 2016, the components of distributable earnings on a tax basis were as follows:
| | | | | | | | | | | | | | | | | | | | |
| | | Undistributed
ordinary
income | | | Undistributed
long-term
gain | | | Unrealized
gains | | | Post-October
capital losses
deferred | | | Capital loss
carryforward | |
Growth Balanced Fund | | $ | 2,950,512 | | | $ | 0 | | | $ | 25,065,236 | | | $ | (1,137,602 | ) | | $ | (137,481,627 | ) |
Moderate Balanced Fund | | | 1,104,352 | | | | 410,499 | | | | 12,032,241 | | | | 0 | | | | 0 | |
9. INDEMNIFICATION
Under the Trust’s organizational documents, the officers and Trustees have been granted certain indemnification rights against certain liabilities that may arise out of performance of their duties to the Trust. Additionally, in the normal course of business, the Trust may enter into contracts with service providers that contain a variety of indemnification clauses. The Trust’s maximum exposure under these arrangements is dependent on future claims that may be made against the Funds and, therefore, cannot be estimated.
| | | | | | |
| Report of independent registered public accounting firm | | Wells Fargo Allocation Funds | | | 35 | |
BOARD OF TRUSTEES AND SHAREHOLDERS OF WELLS FARGO FUNDS TRUST:
We have audited the accompanying statements of assets and liabilities, including the portfolios of investments, of the Wells Fargo Growth Balanced Fund, and Wells Fargo Moderate Balanced Fund (formerly known as Wells Fargo Advantage Growth Balanced Fund, and Wells Fargo Advantage Moderate Balanced Fund, respectively) (the “Funds”), two of the funds constituting the Wells Fargo Funds Trust , as of May 31, 2016, and the related statements of operations for the year then ended, the statements of changes in net assets for each of the years in the two-year period then ended, and the financial highlights for each of the years in the five-year period then ended. These financial statements and financial highlights are the responsibility of the Funds’ management. Our responsibility is to express an opinion on these financial statements and financial highlights based on our audits.
We conducted our audits in accordance with the standards of the Public Company Accounting Oversight Board (United States). Those standards require that we plan and perform the audit to obtain reasonable assurance about whether the financial statements and financial highlights are free of material misstatement. An audit includes examining, on a test basis, evidence supporting the amounts and disclosures in the financial statements. Our procedures included confirmation of investments owned as of May 31, 2016 with the custodian and brokers, by correspondence with the transfer agent or by other appropriate audit procedures. An audit also includes assessing the accounting principles used and significant estimates made by management, as well as evaluating the overall financial statement presentation. We believe that our audits provide a reasonable basis for our opinion.
In our opinion, the financial statements and financial highlights referred to above present fairly, in all material respects, the financial position of each of the aforementioned funds of Wells Fargo Funds Trust as of May 31, 2016, the results of their operations for the year then ended, changes in their net assets for each of the years in the two-year period then ended, and the financial highlights for each of the years in the five year period then ended, in conformity with U.S. generally accepted accounting principles.

Boston, Massachusetts
July 27, 2016
| | | | |
| 36 | | Wells Fargo Allocation Funds | | Portfolio of investments—May 31, 2016 |
C&B LARGE CAP VALUE PORTFOLIO
| | | | | | | | | | | | |
| Security name | | | | | | Shares | | | Value | |
| | | | |
Common Stocks: 95.04% | | | | | | | | | | | | |
| | | | |
Consumer Discretionary: 13.41% | | | | | | | | | | | | |
| | | | |
| Hotels, Restaurants & Leisure: 3.02% | | | | | | | | | | | | |
Brinker International Incorporated | | | | | | | 78,307 | | | $ | 3,521,466 | |
Carnival Corporation | | | | | | | 111,500 | | | | 5,323,010 | |
| |
| | | | 8,844,476 | |
| | | | | |
| | | | |
| Household Durables: 1.22% | | | | | | | | | | | | |
Whirlpool Corporation | | | | | | | 20,400 | | | | 3,562,248 | |
| | | | | |
| | | | |
| Media: 5.77% | | | | | | | | | | | | |
Omnicom Group Incorporated | | | | | | | 102,600 | | | | 8,549,658 | |
Twenty-First Century Fox Incorporated Class A | | | | | | | 289,400 | | | | 8,357,872 | |
| |
| | | | 16,907,530 | |
| | | | | |
| | | | |
| Multiline Retail: 1.03% | | | | | | | | | | | | |
Kohl’s Corporation | | | | | | | 84,200 | | | | 3,034,568 | |
| | | | | |
| | | | |
| Textiles, Apparel & Luxury Goods: 2.37% | | | | | | | | | | | | |
Gildan Activewear Incorporated | | | | | | | 232,500 | | | | 6,935,475 | |
| | | | | |
| | | | |
Consumer Staples: 6.52% | | | | | | | | | | | | |
| | | | |
| Beverages: 1.68% | | | | | | | | | | | | |
Diageo plc ADR « | | | | | | | 45,120 | | | | 4,923,946 | |
| | | | | |
| | | | |
| Household Products: 1.67% | | | | | | | | | | | | |
The Procter & Gamble Company | | | | | | | 60,390 | | | | 4,894,006 | |
| | | | | |
| | | | |
| Personal Products: 1.48% | | | | | | | | | | | | |
Unilever NV ADR | | | | | | | 96,500 | | | | 4,319,340 | |
| | | | | |
| | | | |
| Tobacco: 1.69% | | | | | | | | | | | | |
Philip Morris International | | | | | | | 50,300 | | | | 4,963,604 | |
| | | | | |
| | | | |
Energy: 6.06% | | | | | | | | | | | | |
| | | | |
| Oil, Gas & Consumable Fuels: 6.06% | | | | | | | | | | | | |
Chevron Corporation | | | | | | | 30,900 | | | | 3,120,900 | |
Devon Energy Corporation | | | | | | | 40,100 | | | | 1,447,209 | |
Exxon Mobil Corporation | | | | | | | 82,000 | | | | 7,299,640 | |
Noble Energy Incorporated | | | | | | | 19,870 | | | | 710,353 | |
World Fuel Services Corporation | | | | | | | 112,700 | | | | 5,180,819 | |
| |
| | | | 17,758,921 | |
| | | | | |
| | | | |
Financials: 26.02% | | | | | | | | | | | | |
| | | | |
| Banks: 8.11% | | | | | | | | | | | | |
Bank of America Corporation | | | | | | | 468,700 | | | | 6,932,073 | |
JPMorgan Chase & Company | | | | | | | 143,470 | | | | 9,364,287 | |
PNC Financial Services Group Incorporated | | | | | | | 83,000 | | | | 7,448,420 | |
| |
| | | | 23,744,780 | |
| | | | | |
The accompanying notes are an integral part of these financial statements.
| | | | | | |
| Portfolio of investments—May 31, 2016 | | Wells Fargo Allocation Funds | | | 37 | |
C&B LARGE CAP VALUE PORTFOLIO
| | | | | | | | | | | | |
| Security name | | | | | | Shares | | | Value | |
| | | | |
| Capital Markets: 3.24% | | | | | | | | | | | | |
State Street Corporation | | | | | | | 150,600 | | | $ | 9,496,836 | |
| | | | | |
| | | | |
| Consumer Finance: 2.15% | | | | | | | | | | | | |
American Express Company | | | | | | | 95,700 | | | | 6,293,232 | |
| | | | | |
| | | | |
| Diversified Financial Services: 2.26% | | | | | | | | | | | | |
Berkshire Hathaway Incorporated Class B † | | | | | | | 47,200 | | | | 6,633,488 | |
| | | | | |
| | | | |
| Insurance: 10.26% | | | | | | | | | | | | |
Chubb Limited | | | | | | | 49,600 | | | | 6,279,856 | |
FNF Group | | | | | | | 202,900 | | | | 7,091,355 | |
RenaissanceRe Holdings Limited | | | | | | | 72,200 | | | | 8,339,822 | |
The Progressive Corporation | | | | | | | 251,100 | | | | 8,361,630 | |
| |
| | | | 30,072,663 | |
| | | | | |
| | | | |
Health Care: 15.08% | | | | | | | | | | | | |
| | | | |
| Health Care Equipment & Supplies: 4.06% | | | | | | | | | | | | |
Abbott Laboratories | | | | | | | 138,800 | | | | 5,500,644 | |
Becton Dickinson & Company | | | | | | | 38,400 | | | | 6,391,680 | |
| |
| | | | 11,892,324 | |
| | | | | |
| | | | |
| Health Care Providers & Services: 8.59% | | | | | | | | | | | | |
Cardinal Health Incorporated | | | | | | | 85,740 | | | | 6,769,173 | |
Laboratory Corporation of America Holdings † | | | | | | | 77,160 | | | | 9,872,622 | |
UnitedHealth Group Incorporated | | | | | | | 63,690 | | | | 8,513,442 | |
| |
| | | | 25,155,237 | |
| | | | | |
| | | | |
| Pharmaceuticals: 2.43% | | | | | | | | | | | | |
Johnson & Johnson | | | | | | | 63,300 | | | | 7,133,277 | |
| | | | | |
| | | | |
Industrials: 18.35% | | | | | | | | | | | | |
| | | | |
| Aerospace & Defense: 1.48% | | | | | | | | | | | | |
Rockwell Collins Incorporated | | | | | | | 49,100 | | | | 4,340,440 | |
| | | | | |
| | | | |
| Air Freight & Logistics: 2.34% | | | | | | | | | | | | |
United Parcel Service Incorporated Class B | | | | | | | 66,600 | | | | 6,865,794 | |
| | | | | |
| | | | |
| Electrical Equipment: 2.58% | | | | | | | | | | | | |
Eaton Corporation plc | | | | | | | 122,800 | | | | 7,568,164 | |
| | | | | |
| | | | |
| Industrial Conglomerates: 1.70% | | | | | | | | | | | | |
3M Company | | | | | | | 29,500 | | | | 4,965,440 | |
| | | | | |
| | | | |
| Machinery: 4.77% | | | | | | | | | | | | |
Donaldson Company Incorporated | | | | | | | 190,200 | | | | 6,373,602 | |
Parker-Hannifin Corporation | | | | | | | 66,100 | | | | 7,590,924 | |
| |
| | | | 13,964,526 | |
| | | | | |
The accompanying notes are an integral part of these financial statements.
| | | | |
| 38 | | Wells Fargo Allocation Funds | | Portfolio of investments—May 31, 2016 |
C&B LARGE CAP VALUE PORTFOLIO
| | | | | | | | | | | | | | |
| Security name | | | | | | | Shares | | | Value | |
| | | | |
| Trading Companies & Distributors: 5.48% | | | | | | | | | | | | | | |
AerCap Holdings NV † | | | | | | | | | 196,700 | | | $ | 7,689,003 | |
W.W. Grainger Incorporated « | | | | | | | | | 19,500 | | | | 4,452,825 | |
WESCO International Incorporated †« | | | | | | | | | 67,200 | | | | 3,919,776 | |
| | | | |
| | | | | | | | | | | | | 16,061,604 | |
| | | | | | | | | | | | | | |
| | | | |
Information Technology: 4.81% | | | | | | | | | | | | | | |
| | | | |
| IT Services: 2.87% | | | | | | | | | | | | | | |
Alliance Data Systems Corporation † | | | | | | | | | 22,100 | | | | 4,910,399 | |
The Western Union Company | | | | | | | | | 179,800 | | | | 3,497,110 | |
| | | | |
| | | | | | | | | | | | | 8,407,509 | |
| | | | | | | | | | | | | | |
| | | | |
| Semiconductors & Semiconductor Equipment: 1.94% | | | | | | | | | | | | | | |
Linear Technology Corporation | | | | | | | | | 119,800 | | | | 5,668,936 | |
| | | | | | | | | | | | | | |
| | | | |
Materials: 4.79% | | | | | | | | | | | | | | |
| | | | |
| Chemicals: 1.07% | | | | | | | | | | | | | | |
Axalta Coating Systems Limited † | | | | | | | | | 111,500 | | | | 3,138,725 | |
| | | | | | | | | | | | | | |
| | | | |
| Containers & Packaging: 3.72% | | | | | | | | | | | | | | |
Ball Corporation | | | | | | | | | 42,600 | | | | 3,079,980 | |
Crown Holdings Incorporated † | | | | | | | | | 149,700 | | | | 7,809,847 | |
| | | | |
| | | | | | | | | | | | | 10,889,827 | |
| | | | | | | | | | | | | | |
| | | | |
Total Common Stocks (Cost $210,754,976) | | | | | | | | | | | | | 278,436,916 | |
| | | | | | | | | | | | | | |
| | | | |
| | | Yield | | | | | | | | | |
| Short-Term Investments: 8.98% | | | | | | | | | | | | | | |
| | | | |
| Investment Companies: 8.98% | | | | | | | | | | | | | | |
Securities Lending Cash Investments LLC (l)(r)(u) | | | 0.45 | % | | | | | 12,454,900 | | | | 12,454,900 | |
Wells Fargo Cash Investment Money Market Fund Select Class (l)(u) | | | 0.41 | | | | | | 13,862,559 | | | | 13,862,559 | |
| | | | |
Total Short-Term Investments (Cost $26,317,459) | | | | | | | | | | | | | 26,317,459 | |
| | | | | | | | | | | | | | |
| | | | | | | | |
| Total investments in securities (Cost $237,072,435) * | | | 104.02 | % | | | 304,754,375 | |
Other assets and liabilities, net | | | (4.02 | ) | | | (11,790,086 | ) |
| | | | | | | | |
| Total net assets | | | 100.00 | % | | $ | 292,964,289 | |
| | | | | | | | |
| « | All or a portion of this security is on loan. |
| † | Non-income-earning security |
| (l) | The issuer of the security is an affiliated person of the Portfolio as defined in the Investment Company Act of 1940. |
| (r) | The investment is a non-registered investment vehicle purchased with cash collateral received from securities on loan. |
| (u) | The rate represents the 7-day annualized yield at period end. |
| * | Cost for federal income tax purposes is $245,961,339 and unrealized gains (losses) consists of: |
| | | | |
Gross unrealized gains | | $ | 70,742,300 | |
Gross unrealized losses | | | (11,949,264 | ) |
| | | | |
Net unrealized gains | | $ | 58,793,036 | |
The accompanying notes are an integral part of these financial statements.
| | | | | | |
| Portfolio of investments—May 31, 2016 | | Wells Fargo Allocation Funds | | | 39 | |
DIVERSIFIED LARGE CAP GROWTH PORTFOLIO
| | | | | | | | | | | | |
| Security name | | | | | | Shares | | | Value | |
| | | | |
Common Stocks: 97.83% | | | | | | | | | | | | |
| | | | |
Consumer Discretionary: 25.49% | | | | | | | | | | | | |
| | | | |
| Auto Components: 0.42% | | | | | | | | | | | | |
Delphi Automotive plc | | | | | | | 7,120 | | | $ | 483,875 | |
| | | | | | | | | | | | |
| | | | |
| Distributors: 0.63% | | | | | | | | | | | | |
LKQ Corporation † | | | | | | | 21,990 | | | | 727,209 | |
| | | | | | | | | | | | |
| | | | |
| Hotels, Restaurants & Leisure: 4.41% | | | | | | | | | | | | |
Hilton Worldwide Holdings Incorporated | | | | | | | 13,168 | | | | 273,631 | |
Marriott International Incorporated Class A « | | | | | | | 8,000 | | | | 528,320 | |
McDonald’s Corporation | | | | | | | 7,210 | | | | 880,053 | |
Starbucks Corporation | | | | | | | 45,878 | | | | 2,518,243 | |
Yum! Brands Incorporated | | | | | | | 11,080 | | | | 909,557 | |
| | | | |
| | | | | | | | | | | 5,109,804 | |
| | | | | | | | | | | | |
| | | | |
| Internet & Catalog Retail: 5.12% | | | | | | | | | | | | |
Amazon.com Incorporated † | | | | | | | 6,810 | | | | 4,922,200 | |
Netflix Incorporated † | | | | | | | 6,460 | | | | 662,602 | |
The Priceline Group Incorporated † | | | | | | | 270 | | | | 341,369 | |
| | | | |
| | | | | | | | | | | 5,926,171 | |
| | | | | | | | | | | | |
| | | | |
| Media: 1.04% | | | | | | | | | | | | |
Charter Communications Incorporated Class A † | | | | | | | 11 | | | | 2,408 | |
The Walt Disney Company | | | | | | | 12,090 | | | | 1,199,570 | |
| | | | |
| | | | | | | | | | | 1,201,978 | |
| | | | | | | | | | | | |
| | | | |
| Multiline Retail: 3.42% | | | | | | | | | | | | |
Dollar General Corporation | | | | | | | 16,210 | | | | 1,457,279 | |
Dollar Tree Incorporated † | | | | | | | 27,690 | | | | 2,507,053 | |
| | | | |
| | | | | | | | | | | 3,964,332 | |
| | | | | | | | | | | | |
| | | | |
| Specialty Retail: 7.49% | | | | | | | | | | | | |
CarMax Incorporated Ǡ | | | | | | | 17,730 | | | | 951,392 | |
O’Reilly Automotive Incorporated † | | | | | | | 5,550 | | | | 1,467,587 | |
The Home Depot Incorporated | | | | | | | 23,570 | | | | 3,114,068 | |
The TJX Companies Incorporated | | | | | | | 18,600 | | | | 1,415,832 | |
Tractor Supply Company | | | | | | | 15,550 | | | | 1,494,355 | |
ULTA Salon, Cosmetics and Fragrance Incorporated † | | | | | | | 960 | | | | 223,690 | |
| | | | |
| | | | | | | | | | | 8,666,924 | |
| | | | | | | | | | | | |
| | | | |
| Textiles, Apparel & Luxury Goods: 2.96% | | | | | | | | | | | | |
Coach Incorporated | | | | | | | 12,480 | | | | 491,962 | |
Nike Incorporated Class B | | | | | | | 26,160 | | | | 1,444,555 | |
Under Armour Incorporated Class A « | | | | | | | 11,690 | | | | 441,064 | |
Under Armour Incorporated Class C † | | | | | | | 5,230 | | | | 182,893 | |
VF Corporation | | | | | | | 13,840 | | | | 862,509 | |
| | | | |
| | | | | | | | | | | 3,422,983 | |
| | | | | | | | | | | | |
The accompanying notes are an integral part of these financial statements.
| | | | |
| 40 | | Wells Fargo Allocation Funds | | Portfolio of investments—May 31, 2016 |
DIVERSIFIED LARGE CAP GROWTH PORTFOLIO
| | | | | | | | | | | | |
| Security name | | | | | | Shares | | | Value | |
| | | | |
Consumer Staples: 7.89% | | | | | | | | | | | | |
| | | | |
| Beverages: 3.15% | | | | | | | | | | | | |
Constellation Brands Incorporated Class A | | | | | | | 7,780 | | | $ | 1,191,507 | |
Dr Pepper Snapple Group Incorporated | | | | | | | 11,210 | | | | 1,024,594 | |
Monster Beverage Corporation † | | | | | | | 6,390 | | | | 958,500 | |
The Coca-Cola Company | | | | | | | 10,670 | | | | 475,882 | |
| | | | |
| | | | | | | | | | | 3,650,483 | |
| | | | | | | | | | | | |
| | | | |
| Food & Staples Retailing: 2.64% | | | | | | | | | | | | |
Costco Wholesale Corporation | | | | | | | 10,720 | | | | 1,594,814 | |
CVS Health Corporation | | | | | | | 12,330 | | | | 1,189,229 | |
Sprouts Farmers Market Incorporated † | | | | | | | 11,038 | | | | 273,301 | |
| | | | |
| | | | | | | | | | | 3,057,344 | |
| | | | | | | | | | | | |
| | | | |
| Household Products: 0.44% | | | | | | | | | | | | |
Colgate-Palmolive Company | | | | | | | 7,190 | | | | 506,248 | |
| | | | | | | | | | | | |
| | | | |
| Personal Products: 0.79% | | | | | | | | | | | | |
The Estee Lauder Companies Incorporated Class A | | | | | | | 9,910 | | | | 909,540 | |
| | | | | | | | | | | | |
| | | | |
| Tobacco: 0.87% | | | | | | | | | | | | |
Reynolds American Incorporated | | | | | | | 20,360 | | | | 1,011,892 | |
| | | | | | | | | | | | |
| | | | |
Energy: 1.19% | | | | | | | | | | | | |
| | | | |
| Energy Equipment & Services: 0.21% | | | | | | | | | | | | |
Schlumberger Limited | | | | | | | 3,250 | | | | 247,975 | |
| | | | | | | | | | | | |
| | | | |
| Oil, Gas & Consumable Fuels: 0.98% | | | | | | | | | | | | |
Concho Resources Incorporated † | | | | | | | 8,480 | | | | 1,028,963 | |
EOG Resources Incorporated | | | | | | | 1,260 | | | | 102,514 | |
| | | | |
| | | | | | | | | | | 1,131,477 | |
| | | | | | | | | | | | |
| | | | |
Financials: 2.21% | | | | | | | | | | | | |
| | | | |
| Capital Markets: 0.68% | | | | | | | | | | | | |
SEI Investments Company | | | | | | | 350 | | | | 18,011 | |
TD Ameritrade Holding Corporation | | | | | | | 23,610 | | | | 771,339 | |
| | | | |
| | | | | | | | | | | 789,350 | |
| | | | | | | | | | | | |
| | | | |
| Diversified Financial Services: 1.28% | | | | | | | | | | | | |
Intercontinental Exchange Incorporated | | | | | | | 2,820 | | | | 764,558 | |
S&P Global Incorporated | | | | | | | 6,370 | | | | 712,230 | |
| | | | |
| | | | | | | | | | | 1,476,788 | |
| | | | | | | | | | | | |
| | | | |
| REITs: 0.25% | | | | | | | | | | | | |
American Tower Corporation | | | | | | | 2,770 | | | | 293,011 | |
| | | | | | | | | | | | |
|
Health Care: 14.23% | |
| | | | |
| Biotechnology: 6.39% | | | | | | | | | | | | |
Alexion Pharmaceuticals Incorporated † | | | | | | | 16,270 | | | | 2,455,143 | |
Biogen Incorporated † | | | | | | | 2,470 | | | | 715,633 | |
The accompanying notes are an integral part of these financial statements.
| | | | | | |
| Portfolio of investments—May 31, 2016 | | Wells Fargo Allocation Funds | | | 41 | |
DIVERSIFIED LARGE CAP GROWTH PORTFOLIO
| | | | | | | | | | | | |
| Security name | | | | | | Shares | | | Value | |
| | | | |
| Biotechnology (continued) | | | | | | | | | | | | |
BioMarin Pharmaceutical Incorporated † | | | | | | | 10,910 | | | $ | 978,082 | |
Celgene Corporation † | | | | | | | 15,120 | | | | 1,595,462 | |
Incyte Corporation † | | | | | | | 2,640 | | | | 222,842 | |
Regeneron Pharmaceuticals Incorporated † | | | | | | | 2,390 | | | | 953,443 | |
Vertex Pharmaceuticals Incorporated † | | | | | | | 5,190 | | | | 483,449 | |
| |
| | | | 7,404,054 | |
| | | | | |
| | | | |
| Health Care Equipment & Supplies: 2.04% | | | | | | | | | | | | |
Intuitive Surgical Incorporated † | | | | | | | 1,440 | | | | 913,982 | |
Medtronic plc | | | | | | | 17,995 | | | | 1,448,238 | |
| |
| | | | 2,362,220 | |
| | | | | |
| | | | |
| Health Care Providers & Services: 1.30% | | | | | | | | | | | | |
AmerisourceBergen Corporation | | | | | | | 1,600 | | | | 119,968 | |
UnitedHealth Group Incorporated | | | | | | | 10,350 | | | | 1,383,485 | |
| |
| | | | 1,503,453 | |
| | | | | |
| | | | |
| Health Care Technology: 0.84% | | | | | | | | | | | | |
Cerner Corporation † | | | | | | | 17,441 | | | | 969,894 | |
| | | | | | | | | | | | |
| | | | |
| Life Sciences Tools & Services: 0.54% | | | | | | | | | | | | |
Quintiles Transnational Holdings Incorporated † | | | | | | | 9,264 | | | | 628,933 | |
| | | | | | | | | | | | |
| | | | |
| Pharmaceuticals: 3.12% | | | | | | | | | | | | |
Allergan plc † | | | | | | | 142 | | | | 33,477 | |
Bristol-Myers Squibb Company | | | | | | | 35,360 | | | | 2,535,312 | |
Novo Nordisk A/S ADR | | | | | | | 9,650 | | | | 540,786 | |
Zoetis Incorporated | | | | | | | 10,492 | | | | 497,531 | |
| |
| | | | 3,607,106 | |
| | | | | |
| | | | |
Industrials: 6.73% | | | | | | | | | | | | |
| | | | |
| Aerospace & Defense: 0.71% | | | | | | | | | | | | |
Honeywell International Incorporated | | | | | | | 2,150 | | | | 244,735 | |
The Boeing Company | | | | | | | 4,540 | | | | 572,721 | |
| |
| | | | 817,456 | |
| | | | | |
| | | | |
| Air Freight & Logistics: 0.35% | | | | | | | | | | | | |
United Parcel Service Incorporated Class B | | | | | | | 3,950 | | | | 407,206 | |
| | | | | | | | | | | | |
| | | | |
| Airlines: 1.70% | | | | | | | | | | | | |
Delta Air Lines Incorporated | | | | | | | 14,950 | | | | 649,727 | |
Southwest Airlines Company | | | | | | | 30,910 | | | | 1,313,057 | |
| |
| | | | 1,962,784 | |
| | | | | |
| | | | |
| Electrical Equipment: 0.17% | | | | | | | | | | | | |
Rockwell Automation Incorporated | | | | | | | 1,750 | | | | 203,088 | |
| | | | | | | | | | | | |
| | | | |
| Industrial Conglomerates: 1.17% | | | | | | | | | | | | |
3M Company | | | | | | | 3,500 | | | | 589,120 | |
The accompanying notes are an integral part of these financial statements.
| | | | |
| 42 | | Wells Fargo Allocation Funds | | Portfolio of investments—May 31, 2016 |
DIVERSIFIED LARGE CAP GROWTH PORTFOLIO
| | | | | | | | | | | | |
| Security name | | | | | | Shares | | | Value | |
| | | | |
| Industrial Conglomerates (continued) | | | | | | | | | | | | |
Danaher Corporation | | | | | | | 7,780 | | | $ | 765,241 | |
| | | | |
| | | | | | | | | | | 1,354,361 | |
| | | | | | | | | | | | |
| | | | |
| Professional Services: 0.46% | | | | | | | | | | | | |
Verisk Analytics Incorporated † | | | | | | | 6,680 | | | | 530,325 | |
| | | | | | | | | | | | |
| | | | |
| Road & Rail: 2.17% | | | | | | | | | | | | |
Canadian Pacific Railway Limited | | | | | | | 1,030 | | | | 133,478 | |
Kansas City Southern | | | | | | | 9,460 | | | | 880,726 | |
Union Pacific Corporation | | | | | | | 17,810 | | | | 1,499,424 | |
| | | | |
| | | | | | | | | | | 2,513,628 | |
| | | | | | | | | | | | |
| | | | |
Information Technology: 37.17% | | | | | | | | | | | | |
| | | | |
| Communications Equipment: 1.31% | | | | | | | | | | | | |
Harris Corporation | | | | | | | 9,390 | | | | 739,650 | |
Palo Alto Networks Incorporated † | | | | | | | 5,940 | | | | 774,932 | |
| | | | |
| | | | | | | | | | | 1,514,582 | |
| | | | | | | | | | | | |
| | | | |
| Internet Software & Services: 12.01% | | | | | | | | | | | | |
Alphabet Incorporated Class A † | | | | | | | 7,004 | | | | 5,244,945 | |
Alphabet Incorporated Class C † | | | | | | | 2,984 | | | | 2,195,388 | |
Facebook Incorporated Class A † | | | | | | | 48,180 | | | | 5,724,266 | |
Tencent Holdings Limited ADR | | | | | | | 32,810 | | | | 731,663 | |
| | | | |
| | | | | | | | | | | 13,896,262 | |
| | | | | | | | | | | | |
| | | | |
| IT Services: 8.90% | | | | | | | | | | | | |
Accenture plc Class A | | | | | | | 7,720 | | | | 918,448 | |
Alliance Data Systems Corporation † | | | | | | | 1,370 | | | | 304,400 | |
Cognizant Technology Solutions Corporation Class A † | | | | | | | 15,200 | | | | 933,888 | |
Fidelity National Information Services Incorporated | | | | | | | 12,440 | | | | 923,919 | |
MasterCard Incorporated Class A | | | | | | | 20,110 | | | | 1,928,549 | |
PayPal Holdings Incorporated † | | | | | | | 42,670 | | | | 1,612,499 | |
Visa Incorporated Class A | | | | | | | 46,630 | | | | 3,680,972 | |
| | | | |
| | | | | | | | | | | 10,302,675 | |
| | | | | | | | | | | | |
| | | | |
| Semiconductors & Semiconductor Equipment: 3.82% | | | | | | | | | | | | |
ARM Holdings plc ADR | | | | | | | 298 | | | | 12,844 | |
Broadcom Limited | | | | | | | 8,411 | | | | 1,298,322 | |
Microchip Technology Incorporated « | | | | | | | 36,529 | | | | 1,887,819 | |
Texas Instruments Incorporated | | | | | | | 20,220 | | | | 1,225,332 | |
| | | | |
| | | | | | | | | | | 4,424,317 | |
| | | | | | | | | | | | |
| | | | |
| Software: 8.44% | | | | | | | | | | | | |
Adobe Systems Incorporated † | | | | | | | 18,800 | | | | 1,870,036 | |
Electronic Arts Incorporated † | | | | | | | 10,590 | | | | 812,783 | |
Fortinet Incorporated † | | | | | | | 17,780 | | | | 608,254 | |
Microsoft Corporation | | | | | | | 34,800 | | | | 1,844,400 | |
Red Hat Incorporated † | | | | | | | 9,000 | | | | 697,140 | |
The accompanying notes are an integral part of these financial statements.
| | | | | | |
| Portfolio of investments—May 31, 2016 | | Wells Fargo Allocation Funds | | | 43 | |
DIVERSIFIED LARGE CAP GROWTH PORTFOLIO
| | | | | | | | | | | | | | | | |
| Security name | | | | | | | | Shares | | | Value | |
| | | | |
| Software (continued) | | | | | | | | | | | | | | | | |
Salesforce.com Incorporated † | | | | | | | | | | | 22,154 | | | $ | 1,854,511 | |
ServiceNow Incorporated † | | | | | | | | | | | 17,254 | | | | 1,235,904 | |
Splunk Incorporated † | | | | | | | | | | | 13,100 | | | | 752,595 | |
Tableau Software Incorporated Class A † | | | | | | | | | | | 1,930 | | | | 99,279 | |
| | | | |
| | | | | | | | | | | | | | | 9,774,902 | |
| | | | | | | | | | | | | | | | |
| | | | |
| Technology Hardware, Storage & Peripherals: 2.69% | | | | | | | | | | | | | | | | |
Apple Incorporated | | | | | | | | | | | 31,227 | | | | 3,118,328 | |
| | | | | | | | | | | | | | | | |
| | | | |
Materials: 2.92% | | | | | | | | | | | | | | | | |
| | | | |
| Chemicals: 2.92% | | | | | | | | | | | | | | | | |
Ecolab Incorporated | | | | | | | | | | | 13,320 | | | | 1,561,637 | |
Praxair Incorporated | | | | | | | | | | | 8,140 | | | | 894,260 | |
The Sherwin-Williams Company | | | | | | | | | | | 3,170 | | | | 922,752 | |
| | | | |
| | | | | | | | | | | | | | | 3,378,649 | |
| | | | | | | | | | | | | | | | |
| | | | |
Total Common Stocks (Cost $76,805,738) | | | | | | | | | | | | | | | 113,251,607 | |
| | | | | | | | | | | | | | | | |
| | | | |
| | | Yield | | | | | | | | | | |
| Short-Term Investments: 4.52% | | | | | | | | | | | | | | | | |
| | | | |
| Investment Companies: 4.52% | | | | | | | | | | | | | | | | |
Securities Lending Cash Investments LLC (l)(r)(u) | | | 0.45 | % | | | | | | | 3,113,406 | | | | 3,113,406 | |
Wells Fargo Cash Investment Money Market Fund Select Class (l)(u) | | | 0.41 | | | | | | | | 2,118,196 | | | | 2,118,196 | |
| | | | |
Total Short-Term Investments (Cost $5,231,602) | | | | | | | | | | | | | | | 5,231,602 | |
| | | | | | | | | | | | | | | | |
| | | | | | | | |
| Total investments in securities (Cost $82,037,340) * | | | 102.35 | % | | | 118,483,209 | |
Other assets and liabilities, net | | | (2.35 | ) | | | (2,724,733 | ) |
| | | | | | | | |
| Total net assets | | | 100.00 | % | | $ | 115,758,476 | |
| | | | | | | | |
| † | Non-income-earning security |
| « | All or a portion of this security is on loan. |
| (l) | The issuer of the security is an affiliated person of the Portfolio as defined in the Investment Company Act of 1940. |
| (r) | The investment is a non-registered investment vehicle purchased with cash collateral received from securities on loan. |
| (u) | The rate represents the 7-day annualized yield at period end. |
| * | Cost for federal income tax purposes is $82,417,127 and unrealized gains (losses) consists of: |
| | | | |
Gross unrealized gains | | $ | 37,113,069 | |
Gross unrealized losses | | | (1,046,987 | ) |
| | | | |
Net unrealized gains | | $ | 36,066,082 | |
The accompanying notes are an integral part of these financial statements.
| | | | |
| 44 | | Wells Fargo Allocation Funds | | Portfolio of investments—May 31, 2016 |
EMERGING GROWTH PORTFOLIO
| | | | | | | | | | | | |
| Security name | | | | | | Shares | | | Value | |
| | | | |
Common Stocks: 98.14% | | | | | | | | | | | | |
| | | | |
Consumer Discretionary: 12.15% | | | | | | | | | | | | |
| | | | |
| Auto Components: 1.67% | | | | | | | | | | | | |
Gentherm Incorporated † | | | | | | | 90,670 | | | $ | 3,316,709 | |
Motorcar Parts of America Incorporated † | | | | | | | 389,542 | | | | 11,670,678 | |
| |
| | | | 14,987,387 | |
| | | | | | | | | | | | |
| | | | |
| Diversified Consumer Services: 0.93% | | | | | | | | | | | | |
Grand Canyon Education Incorporated † | | | | | | | 200,830 | | | | 8,386,661 | |
| | | | | | | | | | | | |
| | | | |
| Hotels, Restaurants & Leisure: 3.79% | | | | | | | | | | | | |
Fiesta Restaurant Group Incorporated † | | | | | | | 100,565 | | | | 2,527,198 | |
Jack in the Box Incorporated | | | | | | | 58,340 | | | | 4,970,568 | |
Planet Fitness Incorporated Class A Ǡ | | | | | | | 233,881 | | | | 4,177,115 | |
The Habit Restaurants Incorporated Class A Ǡ | | | | | | | 636,258 | | | | 11,382,656 | |
Wingstop Incorporated Ǡ | | | | | | | 269,058 | | | | 7,506,718 | |
Zoe’s Kitchen Incorporated «† | | | | | | | 93,210 | | | | 3,441,313 | |
| |
| | | | 34,005,568 | |
| | | | | | | | | | | | |
| | | | |
| Household Durables: 0.33% | | | | | | | | | | | | |
Universal Electronics Incorporated † | | | | | | | 45,300 | | | | 2,941,329 | |
| | | | | | | | | | | | |
| | | | |
| Leisure Products: 0.48% | | | | | | | | | | | | |
MCBC Holdings Incorporated † | | | | | | | 279,012 | | | | 4,291,205 | |
| | | | | | | | | | | | |
| | | | |
| Media: 1.31% | | | | | | | | | | | | |
IMAX Corporation † | | | | | | | 352,460 | | | | 11,751,016 | |
| | | | | | | | | | | | |
| | | | |
| Specialty Retail: 2.67% | | | | | | | | | | | | |
Five Below Incorporated † | | | | | | | 76,207 | | | | 3,190,025 | |
Lithia Motors Incorporated Class A | | | | | | | 132,820 | | | | 10,936,399 | |
Monro Muffler Brake Incorporated | | | | | | | 41,437 | | | | 2,608,459 | |
Sportsman’s Warehouse Holdings Incorporated † | | | | | | | 843,623 | | | | 7,288,903 | |
| |
| | | | 24,023,786 | |
| | | | | | | | | | | | |
| | | | |
| Textiles, Apparel & Luxury Goods: 0.97% | | | | | | | | | | | | |
G-III Apparel Group Limited † | | | | | | | 223,680 | | | | 8,750,362 | |
| | | | | | | | | | | | |
| | | | |
Energy: 2.84% | | | | | | | | | | | | |
| | | | |
| Oil, Gas & Consumable Fuels: 2.84% | | | | | | | | | | | | |
Matador Resources Company † | | | | | | | 211,056 | | | | 4,795,192 | |
PDC Energy Incorporated † | | | | | | | 145,970 | | | | 8,473,559 | |
RSP Permian Incorporated † | | | | | | | 372,758 | | | | 12,274,921 | |
| |
| | | | 25,543,672 | |
| | | | | | | | | | | | |
| | | | |
Financials: 5.35% | | | | | | | | | | | | |
| | | | |
| Capital Markets: 0.30% | | | | | | | | | | | | |
Financial Engines Incorporated « | | | | | | | 97,090 | | | | 2,683,568 | |
| | | | | |
The accompanying notes are an integral part of these financial statements.
| | | | | | |
| Portfolio of investments—May 31, 2016 | | Wells Fargo Allocation Funds | | | 45 | |
EMERGING GROWTH PORTFOLIO
| | | | | | | | | | | | |
| Security name | | | | | | Shares | | | Value | |
| | | | |
| Diversified Financial Services: 3.61% | | | | | | | | | | | | |
MarketAxess Holdings Incorporated | | | | | | | 232,241 | | | $ | 32,499,806 | |
| | | | | |
| | | | |
| Thrifts & Mortgage Finance: 1.44% | | | | | | | | | | | | |
LendingTree Incorporated Ǡ | | | | | | | 155,312 | | | | 12,929,724 | |
| | | | | |
| | | | |
Health Care: 32.24% | | | | | | | | | | | | |
| | | | |
| Biotechnology: 4.62% | | | | | | | | | | | | |
Alder Biopharmaceuticals Incorporated † | | | | | | | 109,100 | | | | 3,280,637 | |
Ligand Pharmaceuticals Incorporated Ǡ | | | | | | | 151,180 | | | | 18,079,616 | |
Radius Health Incorporated Ǡ | | | | | | | 138,345 | | | | 5,016,390 | |
Repligen Corporation † | | | | | | | 345,720 | | | | 8,283,451 | |
Ultragenyx Pharmaceutical Incorporated † | | | | | | | 93,134 | | | | 6,808,095 | |
| |
| | | | 41,468,189 | |
| | | | | |
| | | | |
| Health Care Equipment & Supplies: 14.19% | | | | | | | | | | | | |
Abiomed Incorporated † | | | | | | | 99,730 | | | | 9,904,186 | |
Cerus Corporation Ǡ | | | | | | | 765,578 | | | | 4,256,614 | |
Cynosure Incorporated Class A † | | | | | | | 350,398 | | | | 16,738,512 | |
Entellus Medical Incorporated Ǡ | | | | | | | 285,455 | | | | 5,121,063 | |
Glaukos Corporation † | | | | | | | 291,082 | | | | 7,087,847 | |
Inogen Incorporated † | | | | | | | 289,670 | | | | 13,828,846 | |
Integra LifeSciences Holdings Corporation | | | | | | | 36,100 | | | | 2,697,031 | |
Natus Medical Incorporated † | | | | | | | 229,400 | | | | 7,416,502 | |
Nevro Corporation Ǡ | | | | | | | 247,965 | | | | 17,288,120 | |
NxStage Medical Incorporated † | | | | | | | 931,950 | | | | 17,613,855 | |
The Spectranetics Corporation † | | | | | | | 885,169 | | | | 16,216,296 | |
Zeltiq Aesthetics Incorporated Ǡ | | | | | | | 328,200 | | | | 9,340,572 | |
| |
| | | | 127,509,444 | |
| | | | | |
| | | | |
| Health Care Providers & Services: 9.55% | | | | | | | | | | | | |
AAC Holdings Incorporated Ǡ | | | | | | | 141,639 | | | | 3,046,655 | |
Acadia Healthcare Company Incorporated † | | | | | | | 523,230 | | | | 30,802,550 | |
Adeptus Health Incorporated Class A Ǡ | | | | | | | 79,987 | | | | 5,719,071 | |
Diplomat Pharmacy Incorporated Ǡ | | | | | | | 285,406 | | | | 9,298,527 | |
ExamWorks Group Incorporated † | | | | | | | 482,658 | | | | 16,849,591 | |
HealthEquity Incorporated † | | | | | | | 602,042 | | | | 15,538,704 | |
Teladoc Incorporated Ǡ | | | | | | | 401,259 | | | | 4,586,390 | |
| |
| | | | 85,841,488 | |
| | | | | |
| | | | |
| Health Care Technology: 0.80% | | | | | | | | | | | | |
Veeva Systems Incorporated Class A † | | | | | | | 217,920 | | | | 7,180,464 | |
| | | | | |
| | | | |
| Life Sciences Tools & Services: 1.99% | | | | | | | | | | | | |
ICON plc ADR † | | | | | | | 107,780 | | | | 7,592,023 | |
INC Research Holdings Incorporated Class A † | | | | | | | 235,945 | | | | 10,265,967 | |
| |
| | | | 17,857,990 | |
| | | | | |
| | | | |
| Pharmaceuticals: 1.09% | | | | | | | | | | | | |
Intersect ENT Incorporated † | | | | | | | 117,220 | | | | 1,539,099 | |
The accompanying notes are an integral part of these financial statements.
| | | | |
| 46 | | Wells Fargo Allocation Funds | | Portfolio of investments—May 31, 2016 |
EMERGING GROWTH PORTFOLIO
| | | | | | | | | | | | |
| Security name | | | | | | Shares | | | Value | |
| | | | |
| Pharmaceuticals (continued) | | | | | | | | | | | | |
Pacira Pharmaceuticals Incorporated Ǡ | | | | | | | 177,990 | | | $ | 8,278,315 | |
| | | | |
| | | | | | | | | | | 9,817,414 | |
| | | | | | | | | | | | |
| | | | |
Industrials: 11.52% | | | | | | | | | | | | |
| | | | |
| Aerospace & Defense: 0.62% | | | | | | | | | | | | |
HEICO Corporation | | | | | | | 83,300 | | | | 5,543,615 | |
| | | | | |
| | | | |
| Airlines: 0.63% | | | | | | | | | | | | |
SkyWest Incorporated | | | | | | | 241,600 | | | | 5,701,760 | |
| | | | | |
| | | | |
| Building Products: 0.98% | | | | | | | | | | | | |
Apogee Enterprises Incorporated | | | | | | | 194,950 | | | | 8,815,639 | |
| | | | | |
| | | | |
| Commercial Services & Supplies: 0.82% | | | | | | | | | | | | |
G&K Services Incorporated Class A | | | | | | | 49,560 | | | | 3,715,018 | |
Multi-Color Corporation | | | | | | | 59,400 | | | | 3,703,590 | |
| |
| | | | 7,418,608 | |
| | | | | | | | | | | | |
| | | | |
| Construction & Engineering: 1.39% | | | | | | | | | | | | |
Dycom Industries Incorporated † | | | | | | | 125,470 | | | | 10,651,148 | |
Granite Construction Incorporated | | | | | | | 42,200 | | | | 1,811,646 | |
| |
| | | | 12,462,794 | |
| | | | | | | | | | | | |
| | | | |
| Machinery: 2.36% | | | | | | | | | | | | |
John Bean Technologies Corporation | | | | | | | 154,160 | | | | 9,354,429 | |
Milacron Holdings Corporation Ǡ | | | | | | | 454,708 | | | | 7,457,211 | |
Mueller Water Products Incorporated Class A | | | | | | | 397,700 | | | | 4,378,677 | |
| | | | |
| | | | | | | | | | | 21,190,317 | |
| | | | | | | | | | | | |
| | | | |
| Professional Services: 4.72% | | | | | | | | | | | | |
CEB Incorporated | | | | | | | 62,476 | | | | 3,983,470 | |
On Assignment Incorporated † | | | | | | | 510,813 | | | | 19,242,326 | |
Wageworks Incorporated † | | | | | | | 341,866 | | | | 19,161,589 | |
| | | | |
| | | | | | | | | | | 42,387,385 | |
| | | | | | | | | | | | |
| | | | |
Information Technology: 34.04% | | | | | | | | | | | | |
| | | | |
| Communications Equipment: 0.77% | | | | | | | | | | | | |
Infinera Corporation † | | | | | | | 528,153 | | | | 6,924,086 | |
| | | | | |
| | | | |
| Internet Software & Services: 11.18% | | | | | | | | | | | | |
2U Incorporated Ǡ | | | | | | | 208,810 | | | | 5,813,270 | |
Demandware Incorporated † | | | | | | | 216,450 | | | | 10,387,436 | |
Envestnet Incorporated † | | | | | | | 607,642 | | | | 20,532,223 | |
LogMeIn Incorporated † | | | | | | | 136,600 | | | | 8,369,482 | |
Q2 Holdings Incorporated † | | | | | | | 794,743 | | | | 19,852,680 | |
SPS Commerce Incorporated † | | | | | | | 446,298 | | | | 24,323,241 | |
Stamps.com Incorporated † | | | | | | | 61,150 | | | | 5,564,039 | |
Xactly Corporation † | | | | | | | 569,901 | | | | 5,619,224 | |
| |
| | | | 100,461,595 | |
| | | | | | | | | | | | |
The accompanying notes are an integral part of these financial statements.
| | | | | | |
| Portfolio of investments—May 31, 2016 | | Wells Fargo Allocation Funds | | | 47 | |
EMERGING GROWTH PORTFOLIO
| | | | | | | | | | | | | | |
| Security name | | | | | | | Shares | | | Value | |
| | | | |
| IT Services: 3.02% | | | | | | | | | | | | | | |
InterXion Holding NV † | | | | | | | | | 635,870 | | | $ | 23,819,690 | |
Maximus Incorporated | | | | | | | | | 56,560 | | | | 3,260,684 | |
| | | | | | | | | | | | | 27,080,374 | |
| | | | | | | | | | | | | | |
| | | | |
| Semiconductors & Semiconductor Equipment: 2.48% | | | | | | | | | | | | | | |
Cavium Incorporated † | | | | | | | | | 117,580 | | | | 5,849,605 | |
Microsemi Corporation † | | | | | | | | | 232,060 | | | | 7,850,590 | |
Monolithic Power Systems Incorporated | | | | | | | | | 126,090 | | | | 8,615,730 | |
| | | | |
| | | | | | | | | | | | | 22,315,925 | |
| | | | | | | | | | | | | | |
| | | | |
| Software: 16.59% | | | | | | | | | | | | | | |
Callidus Software Incorporated † | | | | | | | | | 730,162 | | | | 13,551,802 | |
CommVault Systems Incorporated † | | | | | | | | | 80,300 | | | | 3,635,984 | |
CyberArk Software Limited Ǡ | | | | | | | | | 234,750 | | | | 10,662,345 | |
Fleetmatics Group plc † | | | | | | | | | 253,480 | | | | 10,367,332 | |
Guidewire Software Incorporated † | | | | | | | | | 71,181 | | | | 4,178,325 | |
HubSpot Incorporated † | | | | | | | | | 236,266 | | | | 11,284,064 | |
Paycom Software Incorporated † | | | | | | | | | 386,950 | | | | 15,648,258 | |
Paylocity Holding Corporation † | | | | | | | | | 211,353 | | | | 7,758,769 | |
Proofpoint Incorporated † | | | | | | | | | 564,560 | | | | 33,094,507 | |
Qlik Technologies Incorporated † | | | | | | | | | 425,270 | | | | 12,205,249 | |
Rapid7 Incorporated Ǡ | | | | | | | | | 256,669 | | | | 3,298,197 | |
Ringcentral Incorporated Class A † | | | | | | | | | 524,240 | | | | 10,348,498 | |
Synchronoss Technologies Incorporated † | | | | | | | | | 241,051 | | | | 8,501,869 | |
Tyler Technologies Incorporated † | | | | | | | | | 29,335 | | | | 4,496,762 | |
| | | | |
| | | | | | | | | | | | | 149,031,961 | |
| | | | | | | | | | | | | | |
| | | |
Total Common Stocks (Cost $694,969,727) | | | | | | | | | | 881,803,132 | |
| | | | | | | | | | | | | | |
| | | | |
| | | Yield | | | | | | | | | |
| Short-Term Investments: 12.00% | | | | | | | | | | | | | | |
| | | | |
| Investment Companies: 12.00% | | | | | | | | | | | | | | |
Securities Lending Cash Investments LLC (l)(r)(u) | | | 0.45 | % | | | | | 92,823,723 | | | | 92,823,723 | |
Wells Fargo Cash Investment Money Market Fund Select Class (l)(u) | | | 0.41 | | | | | | 14,978,235 | | | | 14,978,235 | |
| | | | |
Total Short-Term Investments (Cost $107,801,958) | | | | | | | | | | | | | 107,801,958 | |
| | | | | | | | | | | | | | |
| | | | | | | | |
| Total investments in securities (Cost $802,771,685) * | | | 110.14 | % | | | 989,605,090 | |
Other assets and liabilities, net | | | (10.14 | ) | | | (91,117,425 | ) |
| | | | | | | | |
| Total net assets | | | 100.00 | % | | $ | 898,487,665 | |
| | | | | | | | |
| † | Non-income-earning security |
| « | All or a portion of this security is on loan. |
| (l) | The issuer of the security is an affiliated person of the Portfolio as defined in the Investment Company Act of 1940. |
| (r) | The investment is a non-registered investment vehicle purchased with cash collateral received from securities on loan. |
| (u) | The rate represents the 7-day annualized yield at period end. |
| * | Cost for federal income tax purposes is $810,183,984 and unrealized gains (losses) consists of: |
| | | | |
Gross unrealized gains | | $ | 221,478,685 | |
Gross unrealized losses | | | (42,057,579 | ) |
| | | | |
Net unrealized gains | | $ | 179,421,106 | |
The accompanying notes are an integral part of these financial statements.
| | | | |
| 48 | | Wells Fargo Allocation Funds | | Summary portfolio of investments—May 31, 2016 |
INDEX PORTFOLIO
The Summary portfolio of investments shows the 50 largest portfolio holdings in unaffiliated issuers and any holdings exceeding 1% of the total net assets as of the report date. The remaining securities held are grouped as “Other securities” in each category.
| | | | | | | | | | | | | | | | |
| Security name | | | | | | Shares | | | Value | | | Percent of
net assets | |
| | | | | |
Common Stocks: 98.62% | | | | | | | | | | | | | | | | |
| | | | | |
Consumer Discretionary: 12.38% | | | | | | | | | | | | | | | | |
| | | | | |
| Auto Components: 0.34% | | | | | | | | | | | | | | | | |
Other securities | | | | | | | | | | $ | 7,886,248 | | | | 0.34 | % |
| | | | | | | | | | | | | | | | |
| | | | | |
| Automobiles: 0.57% | | | | | | | | | | | | | | | | |
Other securities | | | | | | | | | | | 13,284,003 | | | | 0.57 | |
| | | | | | | | | | | | | | | | |
| | | | | |
| Distributors: 0.13% | | | | | | | | | | | | | | | | |
Other securities | | | | | | | | | | | 3,111,665 | | | | 0.13 | |
| | | | | | | | | | | | | | | | |
| | | | | |
| Diversified Consumer Services: 0.03% | | | | | | | | | | | | | | | | |
Other securities | | | | | | | | | | | 637,041 | | | | 0.03 | |
| | | | | | | | | | | | | | | | |
| | | | | |
| Hotels, Restaurants & Leisure: 1.73% | | | | | | | | | | | | | | | | |
McDonald’s Corporation | | | | | | | 113,965 | | | | 13,910,568 | | | | 0.59 | |
Starbucks Corporation | | | | | | | 186,834 | | | | 10,255,318 | | | | 0.44 | |
Other securities | | | | | | | | | | | 16,388,522 | | | | 0.70 | |
| | | | | |
| | | | | | | | | | | 40,554,408 | | | | 1.73 | |
| | | | | | | | | | | | | | | | |
| | | | | |
| Household Durables: 0.48% | | | | | | | | | | | | | | | | |
Other securities | | | | | | | | | | | 11,299,293 | | | | 0.48 | |
| | | | | | | | | | | | | | | | |
| | | | | |
| Internet & Catalog Retail: 2.20% | | | | | | | | | | | | | | | | |
Amazon.com Incorporated † | | | | | | | 48,803 | | | | 35,274,320 | | | | 1.51 | |
Other securities | | | | | | | | | | | 16,121,438 | | | | 0.69 | |
| | | | | |
| | | | | | | | | | | 51,395,758 | | | | 2.20 | |
| | | | | | | | | | | | | | | | |
| | | | | |
| Leisure Products: 0.11% | | | | | | | | | | | | | | | | |
Other securities | | | | | | | | | | | 2,609,363 | | | | 0.11 | |
| | | | | | | | | | | | | | | | |
| | | | | |
| Media: 2.76% | | | | | | | | | | | | | | | | |
Comcast Corporation Class A | | | | | | | 307,530 | | | | 19,466,649 | | | | 0.83 | |
The Walt Disney Company | | | | | | | 189,735 | | | | 18,825,507 | | | | 0.80 | |
Other securities | | | | | | | | | | | 26,322,549 | | | | 1.13 | |
| | | | | |
| | | | | | | | | | | 64,614,705 | | | | 2.76 | |
| | | | | | | | | | | | | | | | |
| | | | | |
| Multiline Retail: 0.60% | | | | | | | | | | | | | | | | |
Other securities | | | | | | | | | | | 14,012,634 | | | | 0.60 | |
| | | | | | | | | | | | | | | | |
| | | | | |
| Specialty Retail: 2.61% | | | | | | | | | | | | | | | | |
The Home Depot Incorporated | | | | | | | 160,262 | | | | 21,173,815 | | | | 0.90 | |
Other securities | | | | | | | | | | | 39,991,483 | | | | 1.71 | |
| | | | | |
| | | | | | | | | | | 61,165,298 | | | | 2.61 | |
| | | | | | | | | | | | | | | | |
| | | | | |
Textiles, Apparel & Luxury Goods: 0.82% | | | | | | | | | | | | | | | | |
Other securities | | | | | | | | | | | 19,123,892 | | | | 0.82 | |
| | | | | | | | | | | | | | | | |
The accompanying notes are an integral part of these financial statements.
| | | | | | |
| Summary portfolio of investments—May 31, 2016 | | Wells Fargo Allocation Funds | | | 49 | |
INDEX PORTFOLIO
| | | | | | | | | | | | | | | | |
| Security name | | | | | | Shares | | | Value | | | Percent of
net assets | |
| | | | | |
Consumer Staples: 9.94% | | | | | | | | | | | | | | | | |
| | | | | |
| Beverages: 2.24% | | | | | | | | | | | | | | | | |
PepsiCo Incorporated | | | | | | | 182,703 | | | $ | 18,484,063 | | | | 0.79 | % |
The Coca-Cola Company | | | | | | | 492,530 | | | | 21,966,838 | | | | 0.94 | |
Other securities | | | | | | | | | | | 11,966,753 | | | | 0.51 | |
| | | | | |
| | | | | | | | | | | 52,417,654 | | | | 2.24 | |
| | | | | | | | | | | | | | | | |
| | | | | |
| Food & Staples Retailing: 2.27% | | | | | | | | | | | | | | | | |
CVS Health Corporation | | | | | | | 138,851 | | | | 13,392,179 | | | | 0.57 | |
Wal-Mart Stores Incorporated | | | | | | | 198,315 | | | | 14,036,736 | | | | 0.60 | |
Other securities | | | | | | | | | | | 25,639,454 | | | | 1.10 | |
| | | | | |
| | | | | | | | | | | 53,068,369 | | | | 2.27 | |
| | | | | | | | | | | | | | | | |
| | | | | |
| Food Products: 1.70% | | | | | | | | | | | | | | | | |
Other securities | | | | | | | | | | | 39,787,489 | | | | 1.70 | |
| | | | | | | | | | | | | | | | |
| | | | | |
| Household Products: 1.90% | | | | | | | | | | | | | | | | |
The Procter & Gamble Company | | | | | | | 335,289 | | | | 27,171,821 | | | | 1.16 | |
Other securities | | | | | | | | | | | 17,458,605 | | | | 0.74 | |
| | | | | |
| | | | | | | | | | | 44,630,426 | | | | 1.90 | |
| | | | | | | | | | | | | | | | |
| | | | | |
| Personal Products: 0.11% | | | | | | | | | | | | | | | | |
Other securities | | | | | | | | | | | 2,574,521 | | | | 0.11 | |
| | | | | | | | | | | | | | | | |
| | | | | |
| Tobacco: 1.72% | | | | | | | | | | | | | | | | |
Altria Group Incorporated | | | | | | | 247,486 | | | | 15,750,009 | | | | 0.67 | |
Philip Morris International | | | | | | | 195,840 | | | | 19,325,491 | | | | 0.83 | |
Other securities | | | | | | | | | | | 5,200,757 | | | | 0.22 | |
| | | | | |
| | | | | | | | | | | 40,276,257 | | | | 1.72 | |
| | | | | | | | | | | | | | | | |
| | | | | |
Energy: 7.03% | | | | | | | | | | | | | | | | |
| | | | | |
| Energy Equipment & Services: 1.04% | | | | | | | | | | | | | | | | |
Schlumberger Limited | | | | | | | 175,750 | | | | 13,409,725 | | | | 0.57 | |
Other securities | | | | | | | | | | | 10,958,290 | | | | 0.47 | |
| | | | | |
| | | | | | | | | | | 24,368,015 | | | | 1.04 | |
| | | | | | | | | | | | | | | | |
| | | | | |
| Oil, Gas & Consumable Fuels: 5.99% | | | | | | | | | | | | | | | | |
Chevron Corporation | | | | | | | 238,034 | | | | 24,041,434 | | | | 1.03 | |
Exxon Mobil Corporation | | | | | | | 524,916 | | | | 46,728,022 | | | | 2.00 | |
Other securities | | | | | | | | | | | 69,443,032 | | | | 2.96 | |
| | | | | |
| | | | | | | | | | | 140,212,488 | | | | 5.99 | |
| | | | | | | | | | | | | | | | |
| | | | | |
Financials: 16.07% | | | | | | | | | | | | | | | | |
| | | | | |
| Banks: 5.55% | | | | | | | | | | | | | | | | |
Bank of America Corporation | | | | | | | 1,305,178 | | | | 19,303,583 | | | | 0.82 | |
Citigroup Incorporated | | | | | | | 372,647 | | | | 17,354,171 | | | | 0.74 | |
JPMorgan Chase & Company | | | | | | | 463,928 | | | | 30,280,581 | | | | 1.29 | |
The accompanying notes are an integral part of these financial statements.
| | | | |
| 50 | | Wells Fargo Allocation Funds | | Summary portfolio of investments—May 31, 2016 |
INDEX PORTFOLIO
| | | | | | | | | | | | | | | | |
| Security name | | | | | | Shares | | | Value | | | Percent of
net assets | |
| | | | | |
| Banks (continued) | | | | | | | | | | | | | | | | |
Wells Fargo & Company (l) | | | | | | | 583,952 | | | $ | 29,618,045 | | | | 1.27 | % |
Other securities | | | | | | | | | | | 33,288,574 | | | | 1.43 | |
| | | | | |
| | | | | | | | | | | 129,844,954 | | | | 5.55 | |
| | | | | | | | | | | | | | | | |
| | | | | |
| Capital Markets: 1.93% | | | | | | | | | | | | | | | | |
Other securities | | | | | | | | | | | 45,232,634 | | | | 1.93 | |
| | | | | | | | | | | | | | | | |
| | | | | |
| Consumer Finance: 0.79% | | | | | | | | | | | | | | | | |
Other securities | | | | | | | | | | | 18,550,439 | | | | 0.79 | |
| | | | | | | | | | | | | | | | |
| | | | | |
| Diversified Financial Services: 2.10% | | | | | | | | | | | | | | | | |
Berkshire Hathaway Incorporated Class B † | | | | | | | 236,820 | | | | 33,282,683 | | | | 1.42 | |
Other securities | | | | | | | | | | | 15,844,996 | | | | 0.68 | |
| | | | | |
| | | | | | | | | | | 49,127,679 | | | | 2.10 | |
| | | | | | | | | | | | | | | | |
| | | | | |
| Insurance: 2.71% | | | | | | | | | | | | | | | | |
Other securities | | | | | | | | | | | 63,425,299 | | | | 2.71 | |
| | | | | | | | | | | | | | | | |
| | | | | |
| Real Estate Management & Development: 0.05% | | | | | | | | | | | | | | | | |
Other securities | | | | | | | | | | | 1,097,167 | | | | 0.05 | |
| | | | | | | | | | | | | | | | |
| | | | | |
| REITs: 2.94% | | | | | | | | | | | | | | | | |
Other securities | | | | | | | | | | | 68,932,148 | | | | 2.94 | |
| | | | | | | | | | | | | | | | |
| | | | | |
Health Care: 14.50% | | | | | | | | | | | | | | | | |
| | | | | |
| Biotechnology: 3.26% | | | | | | | | | | | | | | | | |
AbbVie Incorporated | | | | | | | 203,663 | | | | 12,816,513 | | | | 0.55 | |
Amgen Incorporated | | | | | | | 95,066 | | | | 15,015,675 | | | | 0.64 | |
Celgene Corporation † | | | | | | | 98,804 | | | | 10,425,798 | | | | 0.45 | |
Gilead Sciences Incorporated | | | | | | | 172,772 | | | | 15,041,530 | | | | 0.64 | |
Other securities | | | | | | | | | | | 23,038,465 | | | | 0.98 | |
| | | | | |
| | | | | | | | | | | 76,337,981 | | | | 3.26 | |
| | | | | | | | | | | | | | | | |
| | | | | |
| Health Care Equipment & Supplies: 2.34% | | | | | | | | | | | | | | | | |
Medtronic plc | | | | | | | 177,741 | | | | 14,304,596 | | | | 0.61 | |
Other securities | | | | | | | | | | | 40,350,847 | | | | 1.73 | |
| | | | | |
| | | | | | | | | | | 54,655,443 | | | | 2.34 | |
| | | | | | | | | | | | | | | | |
| | | | | |
| Health Care Providers & Services: 2.65% | | | | | | | | | | | | | | | | |
UnitedHealth Group Incorporated | | | | | | | 120,167 | | | | 16,062,723 | | | | 0.68 | |
Other securities | | | | | | | | | | | 46,048,368 | | | | 1.97 | |
| | | | | |
| | | | | | | | | | | 62,111,091 | | | | 2.65 | |
| | | | | | | | | | | | | | | | |
| | | | | |
| Health Care Technology: 0.09% | | | | | | | | | | | | | | | | |
Other securities | | | | | | | | | | | 2,127,138 | | | | 0.09 | |
| | | | | | | | | | | | | | | | |
| | | | | |
| Life Sciences Tools & Services: 0.61% | | | | | | | | | | | | | | | | |
Other securities | | | | | | | | | | | 14,366,808 | | | | 0.61 | |
| | | | | | | | | | | | | | | | |
The accompanying notes are an integral part of these financial statements.
| | | | | | |
| Summary portfolio of investments—May 31, 2016 | | Wells Fargo Allocation Funds | | | 51 | |
INDEX PORTFOLIO
| | | | | | | | | | | | | | | | |
| Security name | | | | | | Shares | | | Value | | | Percent of
net assets | |
| | | | | |
| Pharmaceuticals: 5.55% | | | | | | | | | | | | | | | | |
Allergan plc † | | | | | | | 49,889 | | | $ | 11,761,332 | | | | 0.50 | % |
Bristol-Myers Squibb Company | | | | | | | 211,023 | | | | 15,130,349 | | | | 0.65 | |
Johnson & Johnson | | | | | | | 348,788 | | | | 39,304,920 | | | | 1.68 | |
Merck & Company Incorporated | | | | | | | 350,798 | | | | 19,735,895 | | | | 0.84 | |
Pfizer Incorporated | | | | | | | 764,495 | | | | 26,527,977 | | | | 1.13 | |
Other securities | | | | | | | | | | | 17,309,257 | | | | 0.75 | |
| | | | | |
| | | | | | | | | | | 129,769,730 | | | | 5.55 | |
| | | | | | | | | | | | | | | | |
| | | | | |
Industrials: 9.89% | | | | | | | | | | | | | | | | |
| | | | | |
| Aerospace & Defense: 2.47% | | | | | | | | | | | | | | | | |
Honeywell International Incorporated | | | | | | | 97,244 | | | | 11,069,285 | | | | 0.47 | |
The Boeing Company | | | | | | | 78,717 | | | | 9,930,150 | | | | 0.42 | |
Other securities | | | | | | | | | | | 36,863,920 | | | | 1.58 | |
| | | | | |
| | | | | | | | | | | 57,863,355 | | | | 2.47 | |
| | | | | | | | | | | | | | | | |
| | | | | |
| Air Freight & Logistics: 0.72% | | | | | | | | | | | | | | | | |
Other securities | | | | | | | | | | | 16,813,712 | | | | 0.72 | |
| | | | | | | | | | | | | | | | |
| | | | | |
| Airlines: 0.56% | | | | | | | | | | | | | | | | |
Other securities | | | | | | | | | | | 13,101,665 | | | | 0.56 | |
| | | | | | | | | | | | | | | | |
| | | | | |
| Building Products: 0.09% | | | | | | | | | | | | | | | | |
Other securities | | | | | | | | | | | 2,199,357 | | | | 0.09 | |
| | | | | | | | | | | | | | | | |
| | | | | |
| Commercial Services & Supplies: 0.41% | | | | | | | | | | | | | | | | |
Other securities | | | | | | | | | | | 9,486,053 | | | | 0.41 | |
| | | | | | | | | | | | | | | | |
| | | | | |
| Construction & Engineering: 0.09% | | | | | | | | | | | | | | | | |
Other securities | | | | | | | | | | | 2,170,658 | | | | 0.09 | |
| | | | | | | | | | | | | | | | |
| | | | | |
| Electrical Equipment: 0.54% | | | | | | | | | | | | | | | | |
Other securities | | | | | | | | | | | 12,588,715 | | | | 0.54 | |
| | | | | | | | | | | | | | | | |
| | | | | |
| Industrial Conglomerates: 2.48% | | | | | | | | | | | | | | | | |
3M Company | | | | | | | 76,478 | | | | 12,872,777 | | | | 0.55 | |
General Electric Company | | | | | | | 1,179,405 | | | | 35,653,413 | | | | 1.52 | |
Other securities | | | | | | | | | | | 9,618,219 | | | | 0.41 | |
| | | | | |
| | | | | | | | | | | 58,144,409 | | | | 2.48 | |
| | | | | | | | | | | | | | | | |
| | | | | |
| Machinery: 1.27% | | | | | | | | | | | | | | | | |
Other securities | | | | | | | | | | | 29,656,290 | | | | 1.27 | |
| | | | | | | | | | | | | | | | |
| | | | | |
| Professional Services: 0.31% | | | | | | | | | | | | | | | | |
Other securities | | | | | | | | | | | 7,149,770 | | | | 0.31 | |
| | | | | | | | | | | | | | | | |
| | | | | |
| Road & Rail: 0.77% | | | | | | | | | | | | | | | | |
Other securities | | | | | | | | | | | 18,072,541 | | | | 0.77 | |
| | | | | | | | | | | | | | | | |
The accompanying notes are an integral part of these financial statements.
| | | | |
| 52 | | Wells Fargo Allocation Funds | | Summary portfolio of investments—May 31, 2016 |
INDEX PORTFOLIO
| | | | | | | | | | | | | | | | |
| Security name | | | | | | Shares | | | Value | | | Percent of
net assets | |
| | | | | |
| Trading Companies & Distributors: 0.18% | | | | | | | | | | | | | | | | |
Other securities | | | | | | | | | | $ | 4,118,945 | | | | 0.18 | % |
| | | | | | | | | | | | | | | | |
| | | | | |
Information Technology: 20.09% | | | | | | | | | | | | | | | | |
| | | | | |
| Communications Equipment: 0.99% | | | | | | | | | | | | | | | | |
Cisco Systems Incorporated | | | | | | | 636,069 | | | | 18,477,804 | | | | 0.79 | |
Other securities | | | | | | | | | | | 4,629,500 | | | | 0.20 | |
| | | | | |
| | | | | | | | | | | 23,107,304 | | | | 0.99 | |
| | | | | | | | | | | | | | | | |
| | | | | |
| Electronic Equipment, Instruments & Components: 0.36% | | | | | | | | | | | | | | | | |
Other securities | | | | | | | | | | | 8,570,189 | | | | 0.36 | |
| | | | | | | | | | | | | | | | |
| | | | | |
| Internet Software & Services: 4.25% | | | | | | | | | | | | | | | | |
Alphabet Incorporated Class A † | | | | | | | 36,983 | | | | 27,694,720 | | | | 1.18 | |
Alphabet Incorporated Class C † | | | | | | | 37,562 | | | | 27,635,115 | | | | 1.18 | |
Facebook Incorporated Class A † | | | | | | | 290,084 | | | | 34,464,880 | | | | 1.47 | |
Other securities | | | | | | | | | | | 9,790,121 | | | | 0.42 | |
| | | | | |
| | | | | | | | | | | 99,584,836 | | | | 4.25 | |
| | | | | | | | | | | | | | | | |
| | | | | |
| IT Services: 3.77% | | | | | | | | | | | | | | | | |
International Business Machines Corporation | | | | | | | 111,740 | | | | 17,178,908 | | | | 0.73 | |
MasterCard Incorporated Class A | | | | | | | 123,941 | | | | 11,885,942 | | | | 0.51 | |
Visa Incorporated Class A | | | | | | | 242,581 | | | | 19,149,344 | | | | 0.82 | |
Other securities | | | | | | | | | | | 39,987,166 | | | | 1.71 | |
| | | | | |
| | | | | | | | | | | 88,201,360 | | | | 3.77 | |
| | | | | | | | | | | | | | | | |
| | | | | |
| Semiconductors & Semiconductor Equipment: 2.78% | | | | | | | | | | | | | | | | |
Intel Corporation | | | | | | | 597,122 | | | | 18,863,084 | | | | 0.81 | |
QUALCOMM Incorporated | | | | | | | 188,956 | | | | 10,377,464 | | | | 0.44 | |
Other securities | | | | | | | | | | | 35,787,470 | | | | 1.53 | |
| | | | | |
| | | | | | | | | | | 65,028,018 | | | | 2.78 | |
| | | | | | | | | | | | | | | | |
| | | | | |
| Software: 4.21% | | | | | | | | | | | | | | | | |
Microsoft Corporation | | | | | | | 999,750 | | | | 52,986,750 | | | | 2.26 | |
Oracle Corporation | | | | | | | 398,281 | | | | 16,010,896 | | | | 0.68 | |
Other securities | | | | | | | | | | | 29,566,155 | | | | 1.27 | |
| | | | | |
| | | | | | | | | | | 98,563,801 | | | | 4.21 | |
| | | | | | | | | | | | | | | | |
| | | | | |
| Technology Hardware, Storage & Peripherals: 3.73% | | | | | | | | | | | | | | | | |
Apple Incorporated | | | | | | | 700,845 | | | | 69,986,382 | | | | 2.99 | |
Other securities | | | | | | | | | | | 17,236,347 | | | | 0.74 | |
| | | | | |
| | | | | | | | | | | 87,222,729 | | | | 3.73 | |
| | | | | | | | | | | | | | | | |
| | | | | |
Materials: 2.81% | | | | | | | | | | | | | | | | |
| | | | | |
| Chemicals: 2.03% | | | | | | | | | | | | | | | | |
Other securities | | | | | | | | | | | 47,609,352 | | | | 2.03 | |
| | | | | | | | | | | | | | | | |
The accompanying notes are an integral part of these financial statements.
| | | | | | |
| Summary portfolio of investments—May 31, 2016 | | Wells Fargo Allocation Funds | | | 53 | |
INDEX PORTFOLIO
| | | | | | | | | | | | | | | | | | | | |
| Security name | | | | | | | | Shares | | | Value | | | Percent of
net assets | |
| | | | | |
| Construction Materials: 0.15% | | | | | | | | | | | | | | | | | | | | |
Other securities | | | | | | | | | | | | | | $ | 3,502,643 | | | | 0.15 | % |
| | | | | | | | | | | | | | | | | | | | |
| | | | | |
| Containers & Packaging: 0.31% | | | | | | | | | | | | | | | | | | | | |
Other securities | | | | | | | | | | | | | | | 7,133,000 | | | | 0.31 | |
| | | | | | | | | | | | | | | | | | | | |
| | | | | |
| Metals & Mining: 0.32% | | | | | | | | | | | | | | | | | | | | |
Other securities | | | | | | | | | | | | | | | 7,411,248 | | | | 0.32 | |
| | | | | | | | | | | | | | | | | | | | |
| | | | | |
Telecommunication Services: 2.62% | | | | | | | | | | | | | | | | | | | | |
| | | | | |
| Diversified Telecommunication Services: 2.62% | | | | | | | | | | | | | | | | | | | | |
AT&T Incorporated | | | | | | | | | | | 777,524 | | | | 30,440,065 | | | | 1.30 | |
Verizon Communications Incorporated | | | | | | | | | | | 514,941 | | | | 26,210,497 | | | | 1.12 | |
Other securities | | | | | | | | | | | | | | | 4,598,802 | | | | 0.20 | |
| | | | | |
| | | | | | | | | | | | | | | 61,249,364 | | | | 2.62 | |
| | | | | | | | | | | | | | | | | | | | |
| | | | | |
Utilities: 3.29% | | | | | | | | | | | | | | | | | | | | |
| | | | | |
| Electric Utilities: 2.00% | | | | | | | | | | | | | | | | | | | | |
Other securities | | | | | | | | | | | | | | | 46,854,436 | | | | 2.00 | |
| | | | | | | | | | | | | | | | | | | | |
| | | | | |
| Gas Utilities: 0.04% | | | | | | | | | | | | | | | | | | | | |
Other securities | | | | | | | | | | | | | | | 1,001,279 | | | | 0.04 | |
| | | | | | | | | | | | | | | | | | | | |
| | | | | |
| Independent Power & Renewable Electricity Producers: 0.07% | | | | | | | | | | | | | | | | | | | | |
Other securities | | | | | | | | | | | | | | | 1,576,779 | | | | 0.07 | |
| | | | | | | | | | | | | | | | | | | | |
| | | | | |
| Multi-Utilities: 1.11% | | | | | | | | | | | | | | | | | | | | |
Other securities | | | | | | | | | | | | | | | 25,936,618 | | | | 1.11 | |
| | | | | | | | | | | | | | | | | | | | |
| | | | | |
| Water Utilities: 0.07% | | | | | | | | | | | | | | | | | | | | |
Other securities | | | | | | | | | | | | | | | 1,667,324 | | | | 0.07 | |
| | | | | | | | | | | | | | | | | | | | |
| | | | |
Total Common Stocks (Cost $1,106,723,098) | | | | | | | | | | | | 2,308,193,788 | | | | 98.62 | |
| | | | | | | | | | | | | | | | | | | | |
| | | | | |
| | | Yield | | | | | | | | | | | | | |
| Short-Term Investments: 1.69% | | | | | | | | | | | | | | | | | | | | |
| | | | | |
| Investment Companies: 1.61% | | | | | | | | | | | | | | | | | | | | |
Securities Lending Cash Investments LLC (l)(r)(u) | | | 0.45 | % | | | | | | | 12,693,253 | | | | 12,693,253 | | | | 0.54 | |
Wells Fargo Cash Investment Money Market Fund Select Class (l)(u) | | | 0.41 | | | | | | | | 24,960,298 | | | | 24,960,298 | | | | 1.07 | |
| | | | | |
| | | | | | | | | | | | | | | 37,653,551 | | | | 1.61 | |
| | | | | | | | | | | | | | | | | | | | |
| | | | | |
| | | | | | Maturity date | | | Principal | | | | | | | |
| U.S. Treasury Securities: 0.08% | | | | | | | | | | | | | | | | | | | | |
U.S. Treasury Bill #(z) | | | 0.12 | | | | 6-9-2016 | | | $ | 160,000 | | | | 159,995 | | | | 0.01 | |
U.S. Treasury Bill #(z) | | | 0.25 | | | | 7-21-2016 | | | | 255,000 | | | | 254,911 | | | | 0.01 | |
U.S. Treasury Bill #(z) | | | 0.29 | | | | 8-18-2016 | | | | 410,000 | | | | 409,740 | | | | 0.02 | |
U.S. Treasury Bill #(z) | | | 0.33 | | | | 9-1-2016 | | | | 183,000 | | | | 182,841 | | | | 0.01 | |
The accompanying notes are an integral part of these financial statements.
| | | | |
| 54 | | Wells Fargo Allocation Funds | | Summary portfolio of investments—May 31, 2016 |
INDEX PORTFOLIO
| | | | | | | | | | | | | | | | | | | | |
| Security name | | Yield | | | Maturity date | | | Principal | | | Value | | | Percent of
net assets | |
| | | | | |
| U.S. Treasury Securities (continued) | | | | | | | | | | | | | | | | | | | | |
U.S. Treasury Bill #(z) | | | 0.37 | % | | | 10-6-2016 | | | $ | 800,000 | | | $ | 798,948 | | | | 0.03 | % |
| | | | | |
| | | | | | | | | | | | | | | 1,806,435 | | | | 0.08 | |
| | | | | | | | | | | | | | | | | | | | |
| | | | |
Total Short-Term Investments (Cost $39,460,647) | | | | | | | | | | | | 39,459,986 | | | | 1.69 | |
| | | | | | | | | | | | | | | | | | | | |
| | | | | |
| Total investments in securities (Cost $1,146,183,745) * | | | | | | | | | | | | | | | 2,347,653,774 | | | | 100.31 | |
Other assets and liabilities, net | | | | | | | | | | | | | | | (7,241,316 | ) | | | (0.31 | ) |
| | | | | | | | | | | | | | | | | | | | |
| Total net assets | | | | | | | | | | | | | | $ | 2,340,412,458 | | | | 100.00 | % |
| | | | | | | | | | | | | | | | | | | | |
| † | Non-income-earning security |
| (l) | The issuer of the security is an affiliated person of the Portfolio as defined in the Investment Company Act of 1940. |
| (r) | The investment is a non-registered investment vehicle purchased with cash collateral received from securities on loan. |
| (u) | The rate represents the 7-day annualized yield at period end. |
| (z) | Zero coupon security. The rate represents the current yield to maturity. |
| # | All or a portion of this security is segregated as collateral for investments in derivative instruments. |
| * | Cost for federal income tax purposes is $1,208,116,279 and unrealized gains (losses) consists of: |
| | | | |
Gross unrealized gains | | $ | 1,232,363,587 | |
Gross unrealized losses | | | (92,826,092 | ) |
| | | | |
Net unrealized gains | | $ | 1,139,537,495 | |
The accompanying notes are an integral part of these financial statements.
| | | | | | |
| Portfolio of investments—May 31, 2016 | | Wells Fargo Allocation Funds | | | 55 | |
INTERNATIONAL GROWTH PORTFOLIO
| | | | | | | | | | | | |
| Security name | | | | | | Shares | | | Value | |
| | | | |
Common Stocks: 90.91% | | | | | | | | | | | | |
| | | | |
| Belgium: 1.98% | | | | | | | | | | | | |
Anheuser-Busch InBev NV (Consumer Staples, Beverages) | | | | | | | 7,001 | | | $ | 886,853 | |
Telenet Group Holding NV (Consumer Discretionary, Media)† | | | | | | | 22,809 | | | | 1,085,943 | |
UCB SA (Health Care, Pharmaceuticals) | | | | | | | 13,359 | | | | 965,410 | |
| | | | |
| | | | | | | | | | | 2,938,206 | |
| | | | | | | | | | | | |
| | | | |
| Canada: 1.52% | | | | | | | | | | | | |
Canadian Pacific Railway Limited (Industrials, Road & Rail) | | | | | | | 17,365 | | | | 2,250,330 | |
| | | | | | | | | | | | |
| | | | |
| China: 1.71% | | | | | | | | | | | | |
Baidu Incorporated ADR (Information Technology, Internet Software & Services)† | | | | | | | 11,187 | | | | 1,997,327 | |
Tencent Holdings Limited (Information Technology, Internet Software & Services) | | | | | | | 24,400 | | | | 544,159 | |
| | | | |
| | | | | | | | | | | 2,541,486 | |
| | | | | | | | | | | | |
| | | | |
| Denmark: 0.26% | | | | | | | | | | | | |
ISS A/S (Industrials, Commercial Services & Supplies) | | | | | | | 9,457 | | | | 381,268 | |
| | | | | | | | | | | | |
| | | | |
| France: 8.62% | | | | | | | | | | | | |
Groupe Danone SA (Consumer Staples, Food Products) | | | | | | | 55,591 | | | | 3,901,709 | |
L’Oreal SA (Consumer Staples, Personal Products) | | | | | | | 8,570 | | | | 1,610,531 | |
LVMH Moet Hennessy Louis Vuitton SA (Consumer Discretionary, Textiles, Apparel & Luxury Goods) | | | | | | | 6,978 | | | | 1,118,415 | |
Orange SA (Telecommunication Services, Diversified Telecommunication Services) | | | | | | | 97,060 | | | | 1,686,324 | |
Pernod-Ricard SA (Consumer Staples, Beverages) | | | | | | | 13,944 | | | | 1,519,054 | |
Zodiac Aerospace SA (Industrials, Aerospace & Defense) | | | | | | | 126,809 | | | | 2,961,565 | |
| | | | |
| | | | | | | | | | | 12,797,598 | |
| | | | | | | | | | | | |
| | | | |
| Germany: 13.70% | | | | | | | | | | | | |
Allianz AG (Financials, Insurance) | | | | | | | 11,863 | | | | 1,936,348 | |
Bayer AG (Health Care, Pharmaceuticals) | | | | | | | 33,356 | | | | 3,178,034 | |
Beiersdorf AG (Consumer Staples, Personal Products) | | | | | | | 27,765 | | | | 2,523,319 | |
Deutsche Boerse AG (Financials, Diversified Financial Services) | | | | | | | 47,920 | | | | 4,198,808 | |
Linde AG (Materials, Chemicals) | | | | | | | 27,933 | | | | 4,180,214 | |
Vonovia SE (Financials, Real Estate Management & Development) | | | | | | | 51,955 | | | | 1,780,768 | |
Wirecard AG (Information Technology, IT Services)« | | | | | | | 56,945 | | | | 2,531,860 | |
| | | | |
| | | | | | | | | | | 20,329,351 | |
| | | | | | | | | | | | |
| | | | |
| Hong Kong: 3.16% | | | | | | | | | | | | |
AIA Group Limited (Financials, Insurance) | | | | | | | 801,200 | | | | 4,686,104 | |
| | | | | | | | | | | | |
| | | | |
| Ireland: 5.33% | | | | | | | | | | | | |
Allegion plc (Industrials, Building Products) | | | | | | | 2,032 | | | | 137,444 | |
Medtronic plc (Health Care, Health Care Equipment & Supplies) | | | | | | | 96,515 | | | | 7,767,527 | |
| | | | |
| | | | | | | | | | | 7,904,971 | |
| | | | | | | | | | | | |
| | | | |
| Japan: 12.80% | | | | | | | | | | | | |
Japan Tobacco Incorporated (Consumer Staples, Tobacco) | | | | | | | 137,154 | | | | 5,452,223 | |
KDDI Corporation (Telecommunication Services, Wireless Telecommunication Services) | | | | | | | 53,700 | | | | 1,569,756 | |
NGK Insulators Limited (Industrials, Machinery) | | | | | | | 93,000 | | | | 2,048,377 | |
Nippon Telegraph and Telephone Corporation (Telecommunication Services, Diversified Telecommunication Services) | | | | | | | 31,500 | | | | 1,381,067 | |
The accompanying notes are an integral part of these financial statements.
| | | | |
| 56 | | Wells Fargo Allocation Funds | | Portfolio of investments—May 31, 2016 |
INTERNATIONAL GROWTH PORTFOLIO
| | | | | | | | | | | | | | | | |
| Security name | | | | | | | | Shares | | | Value | |
| | | | |
| Japan (continued) | | | | | | | | | | | | | | | | |
NTT DOCOMO Incorporated (Telecommunication Services, Wireless Telecommunication Services) | | | | | | | | | | | 140,893 | | | $ | 3,535,844 | |
Olympus Corporation (Health Care, Health Care Equipment & Supplies) | | | | | | | | | | | 54,600 | | | | 2,314,959 | |
Ono Pharmaceutical Company Limited (Health Care, Pharmaceuticals) | | | | | | | | | | | 22,600 | | | | 1,004,943 | |
Toyota Motor Corporation (Consumer Discretionary, Automobiles) | | | | | | | | | | | 32,300 | | | | 1,686,828 | |
| | | | |
| | | | | | | | | | | | | | | 18,993,997 | |
| | | | | | | | | | | | | | | | |
| | | | |
| Mexico: 0.84% | | | | | | | | | | | | | | | | |
Grupo Televisa SAB ADR (Consumer Discretionary, Media) | | | | | | | | | | | 46,625 | | | | 1,246,753 | |
| | | | | | | | | | | | | | | | |
| | | | |
| South Korea: 0.01% | | | | | | | | | | | | | | | | |
Orion Corporation (Consumer Staples, Food Products) | | | | | | | | | | | 18 | | | | 14,650 | |
| | | | | | | | | | | | | | | | |
| | | | |
| Spain: 1.68% | | | | | | | | | | | | | | | | |
Grifols SA (Health Care, Biotechnology) | | | | | | | | | | | 43,240 | | | | 979,780 | |
Grifols SA ADR (Health Care, Biotechnology) | | | | | | | | | | | 91,232 | | | | 1,508,065 | |
| | | | |
| | | | | | | | | | | | | | | 2,487,845 | |
| | | | | | | | | | | | | | | | |
| | | | |
| Sweden: 0.96% | | | | | | | | | | | | | | | | |
Swedbank AB Class A (Financials, Banks) | | | | | | | | | | | 65,125 | | | | 1,433,455 | |
| | | | | | | | | | | | | | | | |
| | | | |
| Switzerland: 8.53% | | | | | | | | | | | | | | | | |
Actelion Limited (Health Care, Biotechnology) | | | | | | | | | | | 15,960 | | | | 2,618,789 | |
Nestle SA (Consumer Staples, Food Products) | | | | | | | | | | | 94,160 | | | | 6,953,062 | |
Roche Holding AG (Health Care, Pharmaceuticals) | | | | | | | | | | | 9,081 | | | | 2,383,534 | |
Syngenta AG (Materials, Chemicals) | | | | | | | | | | | 1,775 | | | | 697,321 | |
| | | | |
| | | | | | | | | | | | | | | 12,652,706 | |
| | | | | | | | | | | | | | | | |
| | | | |
| Taiwan: 1.20% | | | | | | | | | | | | | | | | |
Taiwan Semiconductor Manufacturing Company Limited (Information Technology, Semiconductors & Semiconductor Equipment) | | | | | | | | | | | 372,000 | | | | 1,785,144 | |
| | | | | | | | | | | | | | | | |
| | | | |
| United Kingdom: 22.59% | | | | | | | | | | | | | | | | |
Aon plc (Financials, Insurance) | | | | | | | | | | | 37,385 | | | | 4,085,059 | |
Babcock International Group plc (Industrials, Commercial Services & Supplies) | | | | | | | | | | | 57,838 | | | | 868,691 | |
British American Tobacco plc (Consumer Staples, Tobacco) | | | | | | | | | | | 25,042 | | | | 1,522,597 | |
Coca Cola European Partners plc (Consumer Staples, Beverages) | | | | | | | | | | | 34,108 | | | | 1,323,731 | |
Croda International plc (Materials, Chemicals) | | | | | | | | | | | 11,912 | | | | 507,231 | |
Delphi Automotive plc (Consumer Discretionary, Auto Components) | | | | | | | | | | | 37,027 | | | | 2,516,355 | |
Diageo plc (Consumer Staples, Beverages) | | | | | | | | | | | 25,404 | | | | 688,229 | |
Imperial Tobacco Group plc (Consumer Staples, Tobacco) | | | | | | | | | | | 46,968 | | | | 2,558,461 | |
Intercontinental Hotels Group plc (Consumer Discretionary, Hotels, Restaurants & Leisure) | | | | | | | | | | | 31,658 | | | | 1,220,118 | |
International Consolidated Airlines Group SA (Industrials, Airlines) | | | | | | | | | | | 283,379 | | | | 2,197,863 | |
Johnson Matthey plc (Materials, Chemicals) | | | | | | | | | �� | | 24,446 | | | | 1,021,119 | |
Liberty Global plc Class A (Consumer Discretionary, Media) † | | | | | | | | | | | 73,803 | | | | 2,756,542 | |
Liberty Global plc Class C (Consumer Discretionary, Media) † | | | | | | | | | | | 112,794 | | | | 4,075,249 | |
Lloyds Banking Group plc (Financials, Banks) | | | | | | | | | | | 2,149,990 | | | | 2,242,658 | |
Unilever plc (Consumer Staples, Personal Products) | | | | | | | | | | | 81,147 | | | | 3,697,470 | |
WPP plc (Consumer Discretionary, Media) | | | | | | | | | | | 96,877 | | | | 2,233,763 | |
| | | | |
| | | | | | | | | | | | | | | 33,515,136 | |
| | | | | | | | | | | | | | | | |
The accompanying notes are an integral part of these financial statements.
| | | | | | |
| Portfolio of investments—May 31, 2016 | | Wells Fargo Allocation Funds | | | 57 | |
INTERNATIONAL GROWTH PORTFOLIO
| | | | | | | | | | | | | | | | |
| Security name | | | | | | | | Shares | | | Value | |
| | | | |
| United States: 6.02% | | | | | | | | | | | | | | | | |
Amazon.com Incorporated (Consumer Discretionary, Internet & Catalog Retail)† | | | | | | | | | | | 2,170 | | | $ | 1,568,454 | |
Cognizant Technology Solutions Corporation Class A (Information Technology, IT Services)† | | | | | | | | | | | 72,405 | | | | 4,448,563 | |
WABCO Holdings Incorporated (Industrials, Machinery) † | | | | | | | | | | | 11,026 | | | | 1,189,705 | |
Willis Towers Watson plc (Financials, Insurance) | | | | | | | | | | | 13,503 | | | | 1,728,654 | |
| | | | |
| | | | | | | | | | | | | | | 8,935,376 | |
| | | | | | | | | | | | | | | | |
| | | | |
Total Common Stocks (Cost $120,591,514) | | | | | | | | | | | | | | | 134,894,376 | |
| | | | | | | | | | | | | | | | |
| | | | |
| | | | | | Expiration date | | | | | | | |
| Participation Notes: 1.63% | | | | | | | | | | | | | | | | |
| | | | |
| Ireland: 1.63% | | | | | | | | | | | | | | | | |
HSBC Bank plc (Ryanair Holdings plc) (Industrials, Airlines) | | | | | | | 10-29-2018 | | | | 155,215 | | | | 2,418,886 | |
| | | | | | | | | | | | | | | | |
| | | | |
Total Participation Notes (Cost $1,623,518) | | | | | | | | | | | | | | | 2,418,886 | |
| | | | | | | | | | | | | | | | |
| | | | |
| | | Dividend yield | | | | | | | | | | |
| Preferred Stocks: 1.19% | | | | | | | | | | | | | | | | |
| | | | |
| Germany: 1.19% | | | | | | | | | | | | | | | | |
Henkel AG & Company KGaA (Consumer Staples, Household Products) ± | | | 1.43 | % | | | | | | | 15,169 | | | | 1,767,949 | |
| | | | | | | | | | | | | | | | |
| | | | |
Total Preferred Stocks (Cost $1,218,585) | | | | | | | | | | | | | | | 1,767,949 | |
| | | | | | | | | | | | | | | | |
| | | Yield | | | | | | | | | | |
| Short-Term Investments: 8.34% | | | | | | | | | | | | | | | | |
| | | | |
| Investment Companies: 8.34% | | | | | | | | | | | | | | | | |
Securities Lending Cash Investments LLC (l)(r)(u) | | | 0.45 | | | | | | | | 2,506,158 | | | | 2,506,158 | |
Wells Fargo Cash Investment Money Market Fund Select Class (l)(u) | | | 0.41 | | | | | | | | 9,867,059 | | | | 9,867,059 | |
| | | | |
Total Short-Term Investments (Cost $12,373,217) | | | | | | | | | | | | | | | 12,373,217 | |
| | | | | | | | | | | | | | | | |
| | | | | | | | |
| Total investments in securities (Cost $135,806,834) * | | | 102.07 | % | | | 151,454,428 | |
Other assets and liabilities, net | | | (2.07 | ) | | | (3,077,813 | ) |
| | | | | | | | |
| Total net assets | | | 100.00 | % | | $ | 148,376,615 | |
| | | | | | | | |
The accompanying notes are an integral part of these financial statements.
| | | | |
| 58 | | Wells Fargo Allocation Funds | | Portfolio of investments—May 31, 2016 |
INTERNATIONAL GROWTH PORTFOLIO
| † | Non-income-earning security |
| « | All or a portion of this security is on loan. |
| ± | Variable rate investment. The rate shown is the rate in effect at period end. |
| (l) | The issuer of the security is an affiliated person of the Portfolio as defined in the Investment Company Act of 1940. |
| (r) | The investment is a non-registered investment vehicle purchased with cash collateral received from securities on loan. |
| (u) | The rate represents the 7-day annualized yield at period end. |
| * | Cost for federal income tax purposes is $135,907,466 and unrealized gains (losses) consists of: |
| | | | |
Gross unrealized gains | | $ | 17,425,961 | |
Gross unrealized losses | | | (1,878,999 | ) |
| | | | |
Net unrealized gains | | $ | 15,546,962 | |
The following table shows the percent of total long-term investments by sector as of May 31, 2016:
| | | | |
Consumer Staples | | | 24.75 | % |
Health Care | | | 16.34 | |
Financials | | | 15.88 | |
Consumer Discretionary | | | 14.03 | |
Industrials | | | 10.39 | |
Information Technology | | | 8.13 | |
Telecommunication Services | | | 5.88 | |
Materials | | | 4.60 | |
| | | | |
| | | 100.00 | % |
| | | | |
The accompanying notes are an integral part of these financial statements.
| | | | | | |
| Portfolio of investments—May 31, 2016 | | Wells Fargo Allocation Funds | | | 59 | |
INTERNATIONAL VALUE PORTFOLIO
| | | | | | | | | | | | |
| Security name | | | | | | Shares | | | Value | |
| | | | |
Common Stocks: 96.91% | | | | | | | | | | | | |
| | | | |
| Australia: 5.60% | | | | | | | | | | | | |
AGL Energy Limited (Utilities, Multi-Utilities) | | | | | | | 131,500 | | | $ | 1,766,830 | |
Arrium Limited (Materials, Metals & Mining) †(a) | | | | | | | 3,063,400 | | | | 48,710 | |
Asaleo Care Limited (Consumer Staples, Personal Products) | | | | | | | 1,262,800 | | | | 1,861,885 | |
Automotive Holdings Group Limited (Consumer Discretionary, Specialty Retail) | | | | | | | 410,016 | | | | 1,155,723 | |
Bendigo Bank Limited (Financials, Banks) | | | | | | | 272,500 | | | | 2,016,762 | |
Boart Longyear Limited (Industrials, Construction & Engineering) † | | | | | | | 199,991 | | | | 14,454 | |
Cabcharge Australia Limited (Industrials, Commercial Services & Supplies) « | | | | | | | 207,386 | | | | 491,634 | |
Challenger Financial Services Group Limited (Financials, Diversified Financial Services) | | | | | | | 475,400 | | | | 3,288,208 | |
CSR Limited (Materials, Construction Materials) | | | | | | | 754,900 | | | | 1,958,719 | |
Downer EDI Limited (Industrials, Commercial Services & Supplies) | | | | | | | 518,900 | | | | 1,466,387 | |
Lendlease Corporation Limited (Financials, Real Estate Management & Development) | | | | | | | 350,500 | | | | 3,402,140 | |
McMillan Shakespeare Limited (Industrials, Professional Services) | | | | | | | 158,800 | | | | 1,719,295 | |
Metcash Limited (Consumer Staples, Food & Staples Retailing) † | | | | | | | 1,164,200 | | | | 1,724,923 | |
Mincor Resources NL (Materials, Metals & Mining) †(i) | | | | | | | 570,994 | | | | 119,679 | |
Mineral Resources Limited (Industrials, Commercial Services & Supplies) « | | | | | | | 144,300 | | | | 857,287 | |
Myer Holdings Limited (Consumer Discretionary, Multiline Retail) « | | | | | | | 1,059,500 | | | | 857,644 | |
Panoramic Resources Limited (Materials, Metals & Mining) † | | | | | | | 368,800 | | | | 31,986 | |
Primary Health Care Limited (Health Care, Health Care Providers & Services) | | | | | | | 339,000 | | | | 950,648 | |
Qantas Airways Limited (Industrials, Airlines) | | | | | | | 821,700 | | | | 1,829,162 | |
Rio Tinto Limited (Materials, Metals & Mining) | | | | | | | 58,300 | | | | 1,883,073 | |
Seven Group Holdings Limited (Industrials, Trading Companies & Distributors) | | | | | | | 165,800 | | | | 659,076 | |
UGL Limited (Industrials, Construction & Engineering) † | | | | | | | 152,800 | | | | 378,796 | |
| | | | |
| | | | | | | | | | | 28,483,021 | |
| | | | | | | | | | | | |
| | | | |
| Austria: 1.13% | | | | | | | | | | | | |
OMV AG (Energy, Oil, Gas & Consumable Fuels) « | | | | | | | 62,900 | | | | 1,753,142 | |
Raiffeisen Bank International AG (Financials, Banks) † | | | | | | | 81,200 | | | | 1,086,425 | |
RHI AG (Materials, Construction Materials) « | | | | | | | 64,721 | | | | 1,272,809 | |
Voestalpine AG (Materials, Metals & Mining) | | | | | | | 47,700 | | | | 1,633,865 | |
| | | | |
| | | | | | | | | | | 5,746,241 | |
| | | | | | | | | | | | |
| | | | |
| Belgium: 0.81% | | | | | | | | | | | | |
Delhaize Group SA (Consumer Staples, Food & Staples Retailing) | | | | | | | 39,400 | | | | 4,130,894 | |
| | | | | | | | | | | | |
| | | | |
| Brazil: 0.82% | | | | | | | | | | | | |
Banco do Brasil SA (Financials, Banks) | | | | | | | 309,500 | | | | 1,410,633 | |
Companhia de Saneamento de Minas Gerais SA (Utilities, Water Utilities) | | | | | | | 72,400 | | | | 510,503 | |
JBS SA (Consumer Staples, Food Products) | | | | | | | 805,600 | | | | 2,229,356 | |
| | | | |
| | | | | | | | | | | 4,150,492 | |
| | | | | | | | | | | | |
| | | | |
| Canada: 1.54% | | | | | | | | | | | | |
Magna International Incorporated (Consumer Discretionary, Auto Components) | | | | | | | 131,600 | | | | 5,343,882 | |
Metro Incorporated (Consumer Staples, Food & Staples Retailing) | | | | | | | 9,500 | | | | 321,871 | |
WestJet Airlines Limited (Industrials, Airlines) | | | | | | | 120,000 | | | | 2,154,116 | |
| | | | |
| | | | | | | | | | | 7,819,869 | |
| | | | | | | | | | | | |
The accompanying notes are an integral part of these financial statements.
| | | | |
| 60 | | Wells Fargo Allocation Funds | | Portfolio of investments—May 31, 2016 |
INTERNATIONAL VALUE PORTFOLIO
| | | | | | | | | | | | |
| Security name | | | | | | Shares | | | Value | |
| | | | |
| China: 2.77% | | | | | | | | | | | | |
China BlueChemical Limited H Shares (Materials, Chemicals) | | | | | | | 1,984,000 | | | $ | 439,144 | |
China Communications Services Corporation Limited H Shares (Telecommunication Services, Diversified Telecommunication Services) | | | | | | | 2,836,000 | | | | 1,332,098 | |
China Petroleum & Chemical Corporation H Shares (Energy, Oil, Gas & Consumable Fuels) | | | | | | | 2,970,000 | | | | 2,025,673 | |
China Railway Construction Corporation Limited H Shares (Industrials, Construction & Engineering) | | | | | | | 1,747,500 | | | | 2,183,602 | |
Dongfeng Motor Group Company Limited H Shares (Consumer Discretionary, Automobiles) | | | | | | | 1,730,000 | | | | 1,927,973 | |
PICC Property & Casualty Company Limited H Shares (Financials, Insurance) | | | | | | | 1,225,000 | | | | 2,235,370 | |
Shanghai Pharmaceuticals Holding Company Limited H Shares (Health Care, Health Care Providers & Services) | | | | | | | 823,400 | | | | 1,778,033 | |
Shenzhen International Holdings Limited H Shares (Industrials, Transportation Infrastructure) | | | | | | | 731,500 | | | | 1,110,794 | |
TCL Communication Technology Holdings Limited H Shares (Information Technology, Technology Hardware, Storage & Peripherals) « | | | | | | | 1,586,000 | | | | 1,069,477 | |
| | | | |
| | | | | | | | | | | 14,102,164 | |
| | | | | | | | | | | | |
| | | | |
| Czech Republic: 0.21% | | | | | | | | | | | | |
CEZ AS (Utilities, Electric Utilities) | | | | | | | 57,500 | | | | 1,044,370 | |
| | | | | | | | | | | | |
| | | | |
| Denmark: 0.24% | | | | | | | | | | | | |
Sydbank AS (Financials, Banks) | | | | | | | 43,000 | | | | 1,226,054 | |
| | | | | | | | | | | | |
| | | | |
| Finland: 0.39% | | | | | | | | | | | | |
Tieto Oyj (Information Technology, IT Services) | | | | | | | 72,000 | | | | 1,974,732 | |
| | | | | | | | | | | | |
| | | | |
| France: 8.90% | | | | | | | | | | | | |
Alstom SA (Industrials, Machinery) † | | | | | | | 83,800 | | | | 2,104,429 | |
AXA SA (Financials, Insurance) | | | | | | | 132,200 | | | | 3,321,346 | |
BNP Paribas SA (Financials, Banks) | | | | | | | 49,100 | | | | 2,718,718 | |
Cie Generale des Establissements Michelin (Consumer Discretionary, Auto Components) | | | | | | | 32,700 | | | | 3,323,284 | |
Credit Agricole SA (Financials, Banks) « | | | | | | | 219,328 | | | | 2,202,419 | |
Electricite de France SA (Utilities, Electric Utilities) « | | | | | | | 148,600 | | | | 1,979,944 | |
Engie SA (Utilities, Multi-Utilities) | | | | | | | 171,900 | | | | 2,648,058 | |
Orange SA (Telecommunication Services, Diversified Telecommunication Services) | | | | | | | 181,900 | | | | 3,160,337 | |
Renault SA (Consumer Discretionary, Automobiles) | | | | | | | 40,500 | | | | 3,800,557 | |
Sanofi SA (Health Care, Pharmaceuticals) | | | | | | | 100,200 | | | | 8,215,518 | |
SCOR SE (Financials, Insurance) | | | | | | | 109,700 | | | | 3,667,835 | |
Societe Generale SA (Financials, Banks) « | | | | | | | 39,000 | | | | 1,605,120 | |
Thales SA (Industrials, Aerospace & Defense) | | | | | | | 22,200 | | | | 1,923,207 | |
Total SA (Energy, Oil, Gas & Consumable Fuels) | | | | | | | 93,700 | | | | 4,553,352 | |
| | | | |
| | | | | | | | | | | 45,224,124 | |
| | | | | | | | | | | | |
| | | | |
| Germany: 9.44% | | | | | | | | | | | | |
Allianz AG (Financials, Insurance) | | | | | | | 35,700 | | | | 5,827,161 | |
Aurubis AG (Materials, Metals & Mining) | | | | | | | 25,900 | | | | 1,353,132 | |
BASF SE (Materials, Chemicals) | | | | | | | 46,500 | | | | 3,592,186 | |
Bayer AG (Health Care, Pharmaceuticals) | | | | | | | 51,400 | | | | 4,897,199 | |
Bayerische Motoren Werke AG (Consumer Discretionary, Automobiles) | | | | | | | 31,200 | | | | 2,634,498 | |
Daimler AG (Consumer Discretionary, Automobiles) | | | | | | | 75,700 | | | | 5,170,734 | |
Deutsche Bank AG (Financials, Capital Markets) | | | | | | | 130,100 | | | | 2,324,054 | |
E.ON SE (Utilities, Multi-Utilities) | | | | | | | 87,200 | | | | 857,199 | |
Hannover Rueck SE (Financials, Insurance) | | | | | | | 16,300 | | | | 1,838,104 | |
Metro AG (Consumer Staples, Food & Staples Retailing) | | | | | | | 108,100 | | | | 3,551,794 | |
Muenchener Rueckversicherungs Gesellschaft AG (Financials, Insurance) | | | | | | | 23,200 | | | | 4,358,607 | |
The accompanying notes are an integral part of these financial statements.
| | | | | | |
| Portfolio of investments—May 31, 2016 | | Wells Fargo Allocation Funds | | | 61 | |
INTERNATIONAL VALUE PORTFOLIO
| | | | | | | | | | | | |
| Security name | | | | | | Shares | | | Value | |
| | | | |
| Germany (continued) | | | | | | | | | | | | |
Siemens AG (Industrials, Industrial Conglomerates) | | | | | | | 33,900 | | | $ | 3,650,807 | |
Stada Arzneimittel AG (Health Care, Pharmaceuticals) | | | | | | | 56,900 | | | | 3,030,007 | |
Volkswagen AG (Consumer Discretionary, Automobiles) | | | | | | | 22,600 | | | | 3,488,993 | |
Wincor Nixdorf AG (Information Technology, Technology Hardware, Storage & Peripherals) † | | | | | | | 26,600 | | | | 1,420,928 | |
| | | | |
| | | | | | | | | | | 47,995,403 | |
| | | | | | | | | | | | |
| | | | |
| Hong Kong: 1.96% | | | | | | | | | | | | |
China Resources Cement Holdings Limited (Materials, Construction Materials) | | | | | | | 3,186,000 | | | | 1,045,498 | |
Kingboard Laminates Holdings Limited (Information Technology, Electronic Equipment, Instruments
& Components) (i) | | | | | | | 2,204,000 | | | | 1,162,874 | |
Lee & Man Paper Manufacturing Limited (Materials, Paper & Forest Products) | | | | | | | 2,338,000 | | | | 1,546,481 | |
Skyworth Digital Holdings Limited (Consumer Discretionary, Household Durables) | | | | | | | 3,680,000 | | | | 2,221,047 | |
Wheelock & Company Limited (Financials, Real Estate Management & Development) | | | | | | | 379,000 | | | | 1,707,042 | |
Yue Yuen Industrial Holdings Limited (Consumer Discretionary, Textiles, Apparel & Luxury Goods) | | | | | | | 611,500 | | | | 2,305,691 | |
| | | | |
| | | | | | | | | | | 9,988,633 | |
| | | | | | | | | | | | |
| | | | |
| Hungary: 0.23% | | | | | | | | | | | | |
Richter Gedeon (Health Care, Pharmaceuticals) | | | | | | | 59,700 | | | | 1,196,850 | |
| | | | | | | | | | | | |
| | | | |
| India: 0.56% | | | | | | | | | | | | |
Gail India Limited GDR (Utilities, Gas Utilities) | | | | | | | 1,800 | | | | 58,860 | |
Tata Motors Limited ADR (Consumer Discretionary, Automobiles) | | | | | | | 83,800 | | | | 2,806,462 | |
| | | | |
| | | | | | | | | | | 2,865,322 | |
| | | | | | | | | | | | |
| | | | |
| Ireland: 0.92% | | | | | | | | | | | | |
C&C Group plc (Consumer Staples, Beverages) | | | | | | | 240,000 | | | | 1,103,660 | |
Smurfit Kappa Group plc (Materials, Containers & Packaging) | | | | | | | 130,200 | | | | 3,552,140 | |
| | | | |
| | | | | | | | | | | 4,655,800 | |
| | | | | | | | | | | | |
| | | | |
| Israel: 1.08% | | | | | | | | | | | | |
Bank Hapoalim Limited (Financials, Banks) | | | | | | | 542,900 | | | | 2,804,192 | |
Teva Pharmaceutical Industries Limited (Health Care, Pharmaceuticals) | | | | | | | 51,404 | | | | 2,669,801 | |
| | | | |
| | | | | | | | | | | 5,473,993 | |
| | | | | | | | | | | | |
| | | | |
| Italy: 1.11% | | | | | | | | | | | | |
Enel SpA (Utilities, Electric Utilities) | | | | | | | 688,400 | | | | 3,120,474 | |
Mediobanca SpA (Financials, Capital Markets) | | | | | | | 324,800 | | | | 2,518,880 | |
| | | | |
| | | | | | | | | | | 5,639,354 | |
| | | | | | | | | | | | |
| | | | |
| Japan: 21.62% | | | | | | | | | | | | |
Adeka Corporation (Materials, Chemicals) | | | | | | | 155,300 | | | | 2,128,915 | |
Aisin Seiki Company Limited (Consumer Discretionary, Auto Components) | | | | | | | 46,400 | | | | 1,917,009 | |
Anritsu Corporation (Information Technology, Electronic Equipment, Instruments & Components) | | | | | | | 206,300 | | | | 1,173,694 | |
Aoyama Trading Company Limited (Consumer Discretionary, Specialty Retail) | | | | | | | 24,800 | | | | 886,874 | |
Aozora Bank Limited (Financials, Banks) | | | | | | | 588,000 | | | | 2,001,860 | |
Calsonic Kansei Corporation (Consumer Discretionary, Auto Components) | | | | | | | 326,000 | | | | 2,543,586 | |
Central Glass Company Limited (Industrials, Building Products) | | | | | | | 444,000 | | | | 2,193,236 | |
CKD Corporation (Industrials, Machinery) | | | | | | | 171,200 | | | | 1,501,198 | |
DCM Holdings Company Limited (Consumer Discretionary, Specialty Retail) | | | | | | | 143,100 | | | | 1,046,742 | |
The accompanying notes are an integral part of these financial statements.
| | | | |
| 62 | | Wells Fargo Allocation Funds | | Portfolio of investments—May 31, 2016 |
INTERNATIONAL VALUE PORTFOLIO
| | | | | | | | | | | | |
| Security name | | | | | | Shares | | | Value | |
| | | | |
| Japan (continued) | | | | | | | | | | | | |
Denka Company Limited (Materials, Chemicals) | | | | | | | 682,000 | | | $ | 2,993,200 | |
DIC Incorporated (Materials, Chemicals) | | | | | | | 808,700 | | | | 1,920,694 | |
Eizo Corporation (Information Technology, Technology Hardware, Storage & Peripherals) | | | | | | | 63,300 | | | | 1,792,076 | |
Fujikura Limited (Industrials, Electrical Equipment) | | | | | | | 348,000 | | | | 1,816,445 | |
Geo Holdings Corporation (Consumer Discretionary, Specialty Retail) | | | | | | | 91,700 | | | | 1,263,685 | |
Hitachi Limited (Information Technology, Electronic Equipment, Instruments & Components) | | | | | | | 327,800 | | | | 1,515,633 | |
Isuzu Motors Limited (Consumer Discretionary, Automobiles) | | | | | | | 221,400 | | | | 2,671,155 | |
Itochu Corporation (Industrials, Trading Companies & Distributors) | | | | | | | 200,700 | | | | 2,522,003 | |
Japan Airlines Company Limited (Industrials, Airlines) | | | | | | | 80,700 | | | | 2,770,043 | |
JFE Holdings Incorporated (Materials, Metals & Mining) | | | | | | | 70,000 | | | | 942,837 | |
KDDI Corporation (Telecommunication Services, Wireless Telecommunication Services) | | | | | | | 102,800 | | | | 3,005,044 | |
Kureha Corporation (Materials, Chemicals) | | | | | | | 271,000 | | | | 1,010,728 | |
Kyorin Company Limited (Health Care, Pharmaceuticals) | | | | | | | 99,000 | | | | 1,917,686 | |
Maeda Road Construction Company Limited (Industrials, Construction & Engineering) | | | | | | | 148,000 | | | | 2,665,029 | |
Makino Milling Machine Company Limited (Industrials, Machinery) | | | | | | | 232,000 | | | | 1,474,945 | |
Marubeni Corporation (Industrials, Trading Companies & Distributors) | | | | | | | 516,000 | | | | 2,483,193 | |
Matsumotokiyoshi Holdings Company Limited (Consumer Staples, Food & Staples Retailing) | | | | | | | 60,500 | | | | 3,310,877 | |
Miraca Holdings Incorporated (Health Care, Health Care Providers & Services) | | | | | | | 25,100 | | | | 1,061,936 | |
Mitsubishi Corporation (Industrials, Trading Companies & Distributors) | | | | | | | 35,500 | | | | 630,591 | |
Mitsubishi Gas Chemical Company Incorporated (Materials, Chemicals) | | | | | | | 556,400 | | | | 3,160,479 | |
Mitsubishi UFJ Financial Group Incorporated (Financials, Banks) | | | | | | | 657,100 | | | | 3,286,242 | |
Mizuho Financial Group Incorporated (Financials, Banks) | | | | | | | 2,244,400 | | | | 3,534,775 | |
Namura Shipbuilding Company Limited (Industrials, Machinery) | | | | | | | 108,800 | | | | 695,628 | |
Nippon Telegraph & Telephone Corporation (Telecommunication Services, Diversified Telecommunication Services) | | | | | | | 234,000 | | | | 10,259,358 | |
Nissan Motor Company Limited (Consumer Discretionary, Automobiles) | | | | | | | 419,800 | | | | 4,264,912 | |
Nisshinbo Holdings Incorporated (Industrials, Industrial Conglomerates) | | | | | | | 147,200 | | | | 1,516,731 | |
NTT DOCOMO Incorporated (Telecommunication Services, Wireless Telecommunication Services) | | | | | | | 98,600 | | | | 2,474,461 | |
Resona Holdings Incorporated (Financials, Banks) | | | | | | | 1,013,300 | | | | 3,856,094 | |
Ricoh Company Limited (Information Technology, Technology Hardware, Storage & Peripherals) | | | | | | | 166,000 | | | | 1,448,106 | |
Sankyu Incorporated (Industrials, Road & Rail) | | | | | | | 370,000 | | | | 1,984,738 | |
Sojitz Corporation (Industrials, Trading Companies & Distributors) | | | | | | | 1,160,700 | | | | 2,599,482 | |
Sumitomo Corporation (Industrials, Trading Companies & Distributors) | | | | | | | 285,000 | | | | 2,927,597 | |
Sumitomo Metal Mining Company Limited (Materials, Metals & Mining) | | | | | | | 108,000 | | | | 1,114,769 | |
Sumitomo Mitsui Financial Group Incorporated (Financials, Banks) | | | | | | | 100,400 | | | | 3,279,422 | |
The Keiyo Bank Limited (Financials, Banks) | | | | | | | 62,000 | | | | 231,797 | |
Toho Holdings Company Limited (Health Care, Health Care Providers & Services) | | | | | | | 63,000 | | | | 1,549,185 | |
Toyo Ink SC Holding Company Limited (Materials, Chemicals) | | | | | | | 375,000 | | | | 1,608,570 | |
Toyo Tire & Rubber Company Limited (Consumer Discretionary, Auto Components) | | | | | | | 95,400 | | | | 1,163,908 | |
Tsumura & Company (Health Care, Pharmaceuticals) | | | | | | | 83,700 | | | | 1,976,570 | |
UBE Industries Limited (Materials, Chemicals) | | | | | | | 809,000 | | | | 1,519,592 | |
Yokohama Rubber Company Limited (Consumer Discretionary, Auto Components) | | | | | | | 148,500 | | | | 2,283,790 | |
| | | | |
| | | | | | | | | | | 109,897,120 | |
| | | | | | | | | | | | |
| | | | |
| Liechtenstein: 0.12% | | | | | | | | | | | | |
VP Bank AG (Financials, Capital Markets) | | | | | | | 6,558 | | | | 599,721 | |
| | | | | | | | | | | | |
| | | | |
| Netherlands: 1.36% | | | | | | | | | | | | |
Aegon NV (Financials, Insurance) « | | | | | | | 334,000 | | | | 1,716,908 | |
ING Groep NV (Financials, Banks) | | | | | | | 237,100 | | | | 2,953,346 | |
Koninklijke Ahold NV (Consumer Staples, Food & Staples Retailing) | | | | | | | 100,600 | | | | 2,228,578 | |
| | | | |
| | | | | | | | | | | 6,898,832 | |
| | | | | | | | | | | | |
The accompanying notes are an integral part of these financial statements.
| | | | | | |
| Portfolio of investments—May 31, 2016 | | Wells Fargo Allocation Funds | | | 63 | |
INTERNATIONAL VALUE PORTFOLIO
| | | | | | | | | | | | |
| Security name | | | | | | Shares | | | Value | |
| | | | |
| Norway: 1.23% | | | | | | | | | | | | |
Atea ASA (Information Technology, IT Services) (i) | | | | | | | 84,900 | | | $ | 761,153 | |
DNB Nor ASA (Financials, Banks) | | | | | | | 148,800 | | | | 1,908,559 | |
Marine Harvest ASA (Consumer Staples, Food Products) | | | | | | | 97,500 | | | | 1,628,186 | |
Yara International ASA (Materials, Chemicals) | | | | | | | 53,600 | | | | 1,933,050 | |
| | | | |
| | | | | | | | | | | 6,230,948 | |
| | | | | | | | | | | | |
| | | | |
| Poland: 0.39% | | | | | | | | | | | | |
Asseco Poland SA (Information Technology, Software) | | | | | | | 101,800 | | | | 1,424,673 | |
KGHM Polska Miedz SA (Materials, Metals & Mining) | | | | | | | 36,500 | | | | 558,199 | |
| | | | |
| | | | | | | | | | | 1,982,872 | |
| | | | | | | | | | | | |
| | | | |
| Portugal: 0.28% | | | | | | | | | | | | |
Sonae SGPS SA (Consumer Staples, Food & Staples Retailing) | | | | | | | 1,362,100 | | | | 1,401,875 | |
| | | | | | | | | | | | |
| | | | |
| Russia: 0.82% | | | | | | | | | | | | |
Gazprom Neft Sponsored ADR (Energy, Oil, Gas & Consumable Fuels) (i) | | | | | | | 150,014 | | | | 1,860,174 | |
Gazprom Neft Sponsored ADR (Energy, Oil, Gas & Consumable Fuels) | | | | | | | 886 | | | | 10,694 | |
LUKOIL OAO ADR (Energy, Oil, Gas & Consumable Fuels) | | | | | | | 60,400 | | | | 2,323,588 | |
| | | | |
| | | | | | | | | | | 4,194,456 | |
| | | | | | | | | | | | |
| | | | |
| Singapore: 0.80% | | | | | | | | | | | | |
DBS Group Holdings Limited (Financials, Banks) | | | | | | | 227,000 | | | | 2,555,007 | |
United Overseas Bank Limited (Financials, Banks) | | | | | | | 113,000 | | | | 1,495,069 | |
| | | | |
| | | | | | | | | | | 4,050,076 | |
| | | | | | | | | | | | |
| | | | |
| South Africa: 0.37% | | | | | | | | | | | | |
Barclays Africa Group Limited (Financials, Banks) | | | | | | | 200,300 | | | | 1,860,099 | |
| | | | | | | | | | | | |
| | | | |
| South Korea: 2.42% | | | | | | | | | | | | |
BNK Financial Group Incorporated (Financials, Banks) | | | | | | | 13,188 | | | | 96,824 | |
E-MART Limited (Consumer Staples, Food & Staples Retailing) | | | | | | | 8,500 | | | | 1,298,037 | |
Industrial Bank of Korea (Financials, Banks) | | | | | | | 192,500 | | | | 1,841,332 | |
KT&G Corporation (Consumer Staples, Tobacco) | | | | | | | 31,300 | | | | 3,348,506 | |
Kwangju Bank (Financials, Banks) | | | | | | | 13,510 | | | | 103,156 | |
SK Telecom Company Limited (Telecommunication Services, Wireless Telecommunication Services) | | | | | | | 22,300 | | | | 4,153,885 | |
Woori Bank (Financials, Banks) | | | | | | | 178,044 | | | | 1,486,439 | |
| | | | |
| | | | | | | | | | | 12,328,179 | |
| | | | | | | | | | | | |
| | | | |
| Spain: 1.74% | | | | | | | | | | | | |
Banco Santander Central Hispano SA (Financials, Banks) | | | | | | | 429,681 | | | | 2,051,461 | |
Distribuidora Internacional SA (Consumer Staples, Food & Staples Retailing) | | | | | | | 248,800 | | | | 1,487,947 | |
Gas Natural SDG SA (Utilities, Gas Utilities) | | | | | | | 268,500 | | | | 5,314,702 | |
| | | | |
| | | | | | | | | | | 8,854,110 | |
| | | | | | | | | | | | |
| | | | |
| Sweden: 2.05% | | | | | | | | | | | | |
Boliden AB (Materials, Metals & Mining) | | | | | | | 169,300 | | | | 2,995,760 | |
Nordea Bank AB (Financials, Banks) | | | | | | | 177,300 | | | | 1,720,637 | |
Skandinaviska Enskilda Banken AB Class A (Financials, Banks) | | | | | | | 144,900 | | | | 1,388,835 | |
Telefonaktiebolaget LM Ericsson Class B (Information Technology, Communications Equipment) | | | | | | | 304,500 | | | | 2,347,264 | |
The accompanying notes are an integral part of these financial statements.
| | | | |
| 64 | | Wells Fargo Allocation Funds | | Portfolio of investments—May 31, 2016 |
INTERNATIONAL VALUE PORTFOLIO
| | | | | | | | | | | | |
| Security name | | | | | | Shares | | | Value | |
| | | | |
| Sweden (continued) | | | | | | | | | | | | |
Telia Company AB (Telecommunication Services, Diversified Telecommunication Services) | | | | | | | 417,000 | | | $ | 1,954,184 | |
| | | | |
| | | | | | | | | | | 10,406,680 | |
| | | | | | | | | | | | |
| | | | |
| Switzerland: 6.12% | | | | | | | | | | | | |
Aryzta AG (Consumer Staples, Food Products) | | | | | | | 42,100 | | | | 1,675,529 | |
Baloise Holding AG (Financials, Insurance) | | | | | | | 28,800 | | | | 3,557,988 | |
Credit Suisse Group AG (Financials, Capital Markets) « | | | | | | | 273,395 | | | | 3,746,117 | |
Georg Fischer AG (Industrials, Machinery) | | | | | | | 3,000 | | | | 2,394,869 | |
Swiss Life Holding AG (Financials, Insurance) | | | | | | | 15,100 | | | | 3,914,759 | |
Swiss Reinsurance AG (Financials, Insurance) | | | | | | | 75,700 | | | | 6,800,815 | |
UBS Group AG (Financials, Capital Markets) | | | | | | | 158,900 | | | | 2,455,437 | |
Valiant Holding AG (Financials, Banks) | | | | | | | 22,700 | | | | 2,427,575 | |
Zurich Insurance Group AG (Financials, Insurance) | | | | | | | 17,100 | | | | 4,137,374 | |
| | | | |
| | | | | | | | | | | 31,110,463 | |
| | | | | | | | | | | | |
| | | | |
| Taiwan: 0.42% | | | | | | | | | | | | |
Pegatron Corporation (Information Technology, Technology Hardware, Storage & Peripherals) | | | | | | | 1,035,000 | | | | 2,154,895 | |
| | | | | | | | | | | | |
| | | | |
| Thailand: 0.99% | | | | | | | | | | | | |
Bangchak Petroleum PCL (Energy, Oil, Gas & Consumable Fuels) | | | | | | | 2,188,900 | | | | 1,853,442 | |
Thai Oil PCL (Energy, Oil, Gas & Consumable Fuels) | | | | | | | 1,003,900 | | | | 1,784,399 | |
Thanachart Capital PCL (Financials, Banks) | | | | | | | 1,481,500 | | | | 1,409,965 | |
| | | | |
| | | | | | | | | | | 5,047,806 | |
| | | | | | | | | | | | |
| | | | |
| United Kingdom: 18.47% | | | | | | | | | | | | |
3i Group plc (Financials, Capital Markets) | | | | | | | 409,100 | | | | 3,326,999 | |
AMEC Foster Wheeler plc (Energy, Energy Equipment & Services) | | | | | | | 83,300 | | | | 526,988 | |
AstraZeneca plc (Health Care, Pharmaceuticals) | | | | | | | 60,300 | | | | 3,517,873 | |
Aviva plc (Financials, Insurance) | | | | | | | 314,900 | | | | 2,051,472 | |
BAE Systems plc (Industrials, Aerospace & Defense) | | | | | | | 939,800 | | | | 6,582,565 | |
Barclays plc (Financials, Banks) | | | | | | | 715,000 | | | | 1,888,880 | |
Barratt Developments plc (Consumer Discretionary, Household Durables) | | | | | | | 318,600 | | | | 2,731,750 | |
Bellway plc (Consumer Discretionary, Household Durables) | | | | | | | 51,700 | | | | 2,046,462 | |
Berkeley Group Holdings plc (Consumer Discretionary, Household Durables) | | | | | | | 58,800 | | | | 2,789,087 | |
Bovis Homes Group plc (Consumer Discretionary, Household Durables) | | | | | | | 108,600 | | | | 1,588,637 | |
BP plc (Energy, Oil, Gas & Consumable Fuels) | | | | | | | 1,298,500 | | | | 6,718,737 | |
BT Group plc (Telecommunication Services, Diversified Telecommunication Services) | | | | | | | 252,200 | | | | 1,617,432 | |
Carillion plc (Industrials, Construction & Engineering) « | | | | | | | 496,300 | | | | 1,993,277 | |
Centrica plc (Utilities, Multi-Utilities) | | | | | | | 898,500 | | | | 2,652,135 | |
Chemring Group plc (Industrials, Aerospace & Defense) | | | | | | | 341,066 | | | | 681,696 | |
Crest Nicholson Holdings plc (Consumer Discretionary, Household Durables) | | | | | | | 264,876 | | | | 2,255,762 | |
Darty plc (Consumer Discretionary, Specialty Retail) | | | | | | | 226,400 | | | | 551,211 | |
Debenhams plc (Consumer Discretionary, Multiline Retail) | | | | | | | 1,238,200 | | | | 1,326,180 | |
easyJet plc (Industrials, Airlines) | | | | | | | 103,400 | | | | 2,295,811 | |
Firstgroup plc (Industrials, Road & Rail) † | | | | | | | 952,400 | | | | 1,491,140 | |
GlaxoSmithKline plc (Health Care, Pharmaceuticals) | | | | | | | 110,500 | | | | 2,312,616 | |
Home Retail Group plc (Consumer Discretionary, Internet & Catalog Retail) | | | | | | | 164,100 | | | | 392,875 | |
International Consolidated Airlines Group SA (Industrials, Airlines) | | | | | | | 182,900 | | | | 1,418,556 | |
J Sainsbury plc (Consumer Staples, Food & Staples Retailing) | | | | | | | 1,211,800 | | | | 4,712,471 | |
Lloyds Banking Group plc (Financials, Banks) | | | | | | | 2,460,500 | | | | 2,566,551 | |
The accompanying notes are an integral part of these financial statements.
| | | | | | |
| Portfolio of investments—May 31, 2016 | | Wells Fargo Allocation Funds | | | 65 | |
INTERNATIONAL VALUE PORTFOLIO
| | | | | | | | | | | | | | | | |
| Security name | | | | | | | | Shares | | | Value | |
| | | | |
| United Kingdom (continued) | | | | | | | | | | | | | | | | |
Marks & Spencer Group plc (Consumer Discretionary, Multiline Retail) | | | | | | | | | | | 379,900 | | | $ | 2,089,216 | |
Marston’s plc (Consumer Discretionary, Hotels, Restaurants & Leisure) | | | | | | | | | | | 558,800 | | | | 1,235,859 | |
Meggitt plc (Industrials, Aerospace & Defense) | | | | | | | | | | | 392,800 | | | | 2,207,378 | |
Mitchells & Butlers plc (Consumer Discretionary, Hotels, Restaurants & Leisure) | | | | | | | | | | | 236,800 | | | | 995,640 | |
Mitie Group plc (Industrials, Commercial Services & Supplies) « | | | | | | | | | | | 539,300 | | | | 2,200,345 | |
Mondi plc (Materials, Paper & Forest Products) | | | | | | | | | | | 142,300 | | | | 2,774,108 | |
Old Mutual plc (Financials, Insurance) | | | | | | | | | | | 982,800 | | | | 2,535,143 | |
Paragon Group of Companies plc (Financials, Thrifts & Mortgage Finance) | | | | | | | | | | | 328,000 | | | | 1,468,881 | |
Premier Foods plc (Consumer Staples, Food Products) † | | | | | | | | | | | 73,926 | | | | 45,505 | |
Redrow plc (Consumer Discretionary, Household Durables) | | | | | | | | | | | 388,600 | �� | | | 2,368,383 | |
Royal Dutch Shell plc Class B (Energy, Oil, Gas & Consumable Fuels) | | | | | | | | | | | 287,900 | | | | 6,923,951 | |
Royal Mail plc (Industrials, Air Freight & Logistics) | | | | | | | | | | | 290,000 | | | | 2,272,316 | |
Smiths Group plc (Industrials, Industrial Conglomerates) | | | | | | | | | | | 46,300 | | | | 752,397 | |
Standard Chartered plc (Financials, Banks) | | | | | | | | | | | 253,000 | | | | 1,939,527 | |
Tullett Prebon plc (Financials, Capital Markets) | | | | | | | | | | | 279,500 | | | | 1,360,174 | |
Vesuvius plc (Industrials, Machinery) | | | | | | | | | | | 145,400 | | | | 726,114 | |
William Morrison Supermarkets plc (Consumer Staples, Food & Staples Retailing) | | | | | | | | | | | 679,700 | | | | 1,951,167 | |
| | | | |
| | | | | | | | | | | | | | | 93,883,267 | |
| | | | | | | | | | | | | | | | |
| | | | |
Total Common Stocks (Cost $547,156,375) | | | | | | | | | | | | | | | 492,618,715 | |
| | | | | | | | | | | | | | | | |
| | | | |
| | | Dividend yield | | | | | | | | | | |
| Preferred Stocks: 0.19% | | | | | | | | | | | | | | | | |
| | | | |
| Brazil: 0.19% | | | | | | | | | | | | | | | | |
Banco do Estado do Rio Grande do Sul SA (Financials, Banks) ± | | | 8.95 | % | | | | | | | 349,800 | | | | 808,288 | |
Companhia Energetica de Minas Gerais SA (Utilities, Water Utilities) ± | | | 8.48 | | | | | | | | 109,056 | | | | 169,910 | |
| | | | |
Total Preferred Stocks (Cost $3,545,600) | | | | | | | | | | | | | | | 978,198 | |
| | | | | | | | | | | | | | | | |
| | | | |
| | | | | | Expiration date | | | | | | | |
| Rights: 0.00% | | | | | | | | | | | | | | | | |
| | | | |
| Brazil: 0.00% | | | | | | | | | | | | | | | | |
Companhia de Saneamento de Minas Gerais (Utilities, Electric Utilities) †(a) | | | | | | | 6-20-2016 | | | | 3,288 | | | | 6,779 | |
| | | | | | | | | | | | | | | | |
| | | | |
Total Rights (Cost $0) | | | | | | | | | | | | | | | 6,779 | |
| | | | | | | | | | | | | | | | |
| | | | |
| | | Yield | | | | | | | | | | |
| Short-Term Investments: 3.32% | | | | | | | | | | | | | | | | |
| | | | |
| Investment Companies: 3.32% | | | | | | | | | | | | | | | | |
Securities Lending Cash Investments LLC (l)(r)(u) | | | 0.45 | | | | | | | | 14,316,539 | | | | 14,316,539 | |
Wells Fargo Cash Investment Money Market Fund Select Class (l)(u) | | | 0.41 | | | | | | | | 2,530,851 | | | | 2,530,851 | |
| | | | |
Total Short-Term Investments (Cost $16,847,390) | | | | | | | | | | | | | | | 16,847,390 | |
| | | | | | | | | | | | | | | | |
| | | | | | | | |
| Total investments in securities (Cost $567,549,365)* | | | 100.42 | % | | | 510,451,082 | |
Other assets and liabilities, net | | | (0.42 | ) | | | (2,132,112 | ) |
| | | | | | | | |
| Total net assets | | | 100.00 | % | | $ | 508,318,970 | |
| | | | | | | | |
The accompanying notes are an integral part of these financial statements.
| | | | |
| 66 | | Wells Fargo Allocation Funds | | Portfolio of investments—May 31, 2016 |
INTERNATIONAL VALUE PORTFOLIO
| † | Non-income-earning security |
| (a) | The security is fair valued in accordance with procedures approved by the Board of Trustees. |
| « | All or a portion of this security is on loan. |
| (i) | Illiquid security for which the designation as illiquid is unaudited. |
| ± | Variable rate investment. The rate shown is the rate in effect at period end. |
| (l) | The issuer of the security is an affiliated person of the Portfolio as defined in the Investment Company Act of 1940. |
| (r) | The investment is a non-registered investment vehicle purchased with cash collateral received from securities on loan. |
| (u) | The rate represents the 7-day annualized yield at period end. |
| * | Cost for federal income tax purposes is $568,923,013 and unrealized gains (losses) consists of: |
| | | | |
Gross unrealized gains | | $ | 53,695,416 | |
Gross unrealized losses | | | (112,167,347 | ) |
| | | | |
Net unrealized losses | | $ | (58,471,931 | ) |
The following table shows the percent of total long-term investments by sector as of May 31, 2016:
| | | | |
Financials | | | 27.13 | % |
Consumer Discretionary | | | 14.88 | |
Industrials | | | 14.85 | |
Materials | | | 8.74 | |
Consumer Staples | | | 7.70 | |
Health Care | | | 7.11 | |
Energy | | | 6.15 | |
Telecommunication Services | | | 5.66 | |
Utilities | | | 4.08 | |
Information Technology | | | 3.70 | |
| | | | |
| | | 100.00 | % |
| | | | |
The accompanying notes are an integral part of these financial statements.
| | | | | | |
| Portfolio of investments—May 31, 2016 | | Wells Fargo Allocation Funds | | | 67 | |
LARGE COMPANY VALUE PORTFOLIO
| | | | | | | | | | | | |
| Security name | | | | | | Shares | | | Value | |
| | | |
Common Stocks: 98.50% | | | | | | | | | | |
| | | |
Consumer Discretionary: 7.57% | | | | | | | | | | |
| | | |
| Hotels, Restaurants & Leisure: 1.48% | | | | | | | | | | |
Norwegian Cruise Line Holdings Limited † | | | | | | | 25,250 | | | $ | 1,171,850 | |
| | | | | | | | | | | | |
| | | |
| Household Durables: 2.04% | | | | | | | | | | |
Harman International Industries Incorporated | | | | | | | 11,707 | | | | 915,956 | |
Newell Rubbermaid Incorporated | | | | | | | 14,635 | | | | 697,943 | |
| | | | |
| | | | | | | | | | | 1,613,899 | |
| | | | | | | | | | | | |
| | | |
| Leisure Products: 1.26% | | | | | | | | | | |
Mattel Incorporated | | | | | | | 31,393 | | | | 1,000,809 | |
| | | | | | | | | | | | |
| | | |
| Media: 1.21% | | | | | | | | | | |
Scripps Networks Interactive Incorporated Class A | | | | | | | 14,827 | | | | 953,969 | |
| | | | | | | | | | | | |
| | | |
| Multiline Retail: 0.63% | | | | | | | | | | |
JCPenny Company Incorporated †« | | | | | | | 64,446 | | | | 502,034 | |
| | | | | | | | | | | | |
| | | |
| Textiles, Apparel & Luxury Goods: 0.95% | | | | | | | | | | |
Skechers U.S.A. Incorporated Class A † | | | | | | | 24,055 | | | | 749,794 | |
| | | | | | | | | | | | |
| | | |
Consumer Staples: 6.63% | | | | | | | | | | |
| | | |
| Food & Staples Retailing: 2.68% | | | | | | | | | | |
CVS Health Corporation | | | | | | | 22,018 | | | | 2,123,636 | |
| | | | | | | | | | | | |
| | | |
| Food Products: 2.16% | | | | | | | | | | |
ConAgra Foods Incorporated | | | | | | | 17,627 | | | | 805,554 | |
TreeHouse Foods Incorporated † | | | | | | | 9,540 | | | | 903,438 | |
| | | | |
| | | | | | | | | | | 1,708,992 | |
| | | | | | | | | | | | |
| | | |
| Household Products: 1.26% | | | | | | | | | | |
The Procter & Gamble Company | | | | | | | 12,296 | | | | 996,468 | |
| | | | | | | | | | | | |
| | | |
| Personal Products: 0.53% | | | | | | | | | | |
Herbalife Limited †« | | | | | | | 7,190 | | | | 416,229 | |
| | | | | | | | | | | | |
| | | |
Energy: 11.08% | | | | | | | | | | |
| | | |
| Energy Equipment & Services: 0.79% | | | | | | | | | | |
Baker Hughes Incorporated | | | | | | | 7,892 | | | | 366,031 | |
Noble Corporation plc « | | | | | | | 30,604 | | | | 255,237 | |
| | | | |
| | | | | | | | | | | 621,268 | |
| | | | | | | | | | | | |
| | | |
| Oil, Gas & Consumable Fuels: 10.29% | | | | | | | | | | |
Chevron Corporation | | | | | | | 11,430 | | | | 1,154,430 | |
ConocoPhillips | | | | | | | 19,177 | | | | 839,761 | |
Exxon Mobil Corporation | | | | | | | 29,377 | | | | 2,615,141 | |
Kinder Morgan Incorporated | | | | | | | 69,137 | | | | 1,249,997 | |
Noble Energy Incorporated | | | | | | | 35,551 | | | | 1,270,948 | |
The accompanying notes are an integral part of these financial statements.
| | | | |
| 68 | | Wells Fargo Allocation Funds | | Portfolio of investments—May 31, 2016 |
LARGE COMPANY VALUE PORTFOLIO
| | | | | | | | | | | | |
| Security name | | | | | | Shares | | | Value | |
| | | |
| Oil, Gas & Consumable Fuels (continued) | | | | | | | | | | |
Valero Energy Corporation | | | | | | | 18,516 | | | $ | 1,012,825 | |
| | | | |
| | | | | | | | | | | 8,143,102 | |
| | | | | | | | | | | | |
| | | |
Financials: 28.83% | | | | | | | | | | |
| | | |
| Banks: 10.71% | | | | | | | | | | |
Bank of America Corporation | | | | | | | 98,811 | | | | 1,461,415 | |
BOK Financial Corporation « | | | | | | | 20,150 | | | | 1,284,361 | |
Citigroup Incorporated | | | | | | | 31,329 | | | | 1,458,992 | |
First Republic Bank | | | | | | | 11,924 | | | | 863,417 | |
JPMorgan Chase & Company | | | | | | | 32,086 | | | | 2,094,253 | |
KeyCorp | | | | | | | 31,683 | | | | 406,176 | |
SunTrust Banks Incorporated | | | | | | | 20,655 | | | | 905,102 | |
| | | | |
| | | | | | | | | | | 8,473,716 | |
| | | | | | | | | | | | |
| | | |
| Capital Markets: 4.62% | | | | | | | | | | |
Affiliated Managers Group Incorporated † | | | | | | | 5,309 | | | | 921,218 | |
Ameriprise Financial Incorporated | | | | | | | 16,468 | | | | 1,674,302 | |
Goldman Sachs Group Incorporated | | | | | | | 6,635 | | | | 1,058,150 | |
| | | | |
| | | | | | | | | | | 3,653,670 | |
| | | | | | | | | | | | |
| | | |
| Insurance: 7.43% | | | | | | | | | | |
American International Group Incorporated | | | | | | | 28,858 | | | | 1,670,301 | |
Arthur J. Gallagher & Company | | | | | | | 21,660 | | | | 1,046,828 | |
Chubb Limited | | | | | | | 7,121 | | | | 901,590 | |
Endurance Specialty Holdings Limited | | | | | | | 11,667 | | | | 792,423 | |
MetLife Incorporated | | | | | | | 32,223 | | | | 1,467,758 | |
| | | | |
| | | | | | | | | | | 5,878,900 | |
| | | | | | | | | | | | |
| | | |
| REITs: 6.07% | | | | | | | | | | |
Alexandria Real Estate Equities Incorporated | | | | | | | 18,859 | | | | 1,827,437 | |
Equity Residential | | | | | | | 8,391 | | | | 580,741 | |
Pebblebrook Hotel Trust | | | | | | | 23,015 | | | | 580,438 | |
Prologis Incorporated | | | | | | | 18,228 | | | | 866,377 | |
VEREIT Incorporated | | | | | | | 98,744 | | | | 946,955 | |
| | | | |
| | | | | | | | | | | 4,801,948 | |
| | | | | | | | | | | | |
| | | |
Health Care: 12.74% | | | | | | | | | | |
| | | |
| Biotechnology: 3.40% | | | | | | | | | | |
AbbVie Incorporated | | | | | | | 10,500 | | | | 660,765 | |
Baxalta Incorporated | | | | | | | 33,576 | | | | 1,518,642 | |
Gilead Sciences Incorporated | | | | | | | 5,874 | | | | 511,390 | |
| | | | |
| | | | | | | | | | | 2,690,797 | |
| | | | | | | | | | | | |
| | | |
| Health Care Equipment & Supplies: 1.05% | | | | | | | | | | |
Medtronic plc | | | | | | | 10,277 | | | | 827,093 | |
| | | | | | | | | | | | |
The accompanying notes are an integral part of these financial statements.
| | | | | | |
| Portfolio of investments—May 31, 2016 | | Wells Fargo Allocation Funds | | | 69 | |
LARGE COMPANY VALUE PORTFOLIO
| | | | | | | | | | | | |
| Security name | | | | | | Shares | | | Value | |
| | | |
| Health Care Providers & Services: 1.81% | | | | | | | | | | |
Cigna Corporation | | | | | | | 5,586 | | | $ | 715,622 | |
HCA Holdings Incorporated † | | | | | | | 9,201 | | | | 717,862 | |
| | | | |
| | | | | | | | | | | 1,433,484 | |
| | | | | | | | | | | | |
| | | |
| Pharmaceuticals: 6.48% | | | | | | | | | | |
Allergan plc † | | | | | | | 4,409 | | | | 1,039,422 | |
Johnson & Johnson | | | | | | | 7,673 | | | | 864,670 | |
Mallinckrodt plc † | | | | | | | 12,316 | | | | 780,342 | |
Merck & Company Incorporated | | | | | | | 16,634 | | | | 935,829 | |
Pfizer Incorporated | | | | | | | 43,334 | | | | 1,503,690 | |
| | | | |
| | | | | | | | | | | 5,123,953 | |
| | | | | | | | | | | | |
| | | |
Industrials: 10.72% | | | | | | | | | | |
| | | |
| Aerospace & Defense: 2.19% | | | | | | | | | | |
Curtiss-Wright Corporation | | | | | | | 11,704 | | | | 974,007 | |
Raytheon Company | | | | | | | 5,865 | | | | 760,515 | |
| | | |
| | | | | | | | | 1,734,522 | |
| | | | | | | | | | | | |
| | | |
| Airlines: 0.57% | | | | | | | | | | |
United Continental Holdings Incorporated † | | | | | | | 9,972 | | | | 449,637 | |
| | | | | | | | | | | | |
| | | |
| Electrical Equipment: 0.93% | | | | | | | | | | |
Eaton Corporation plc | | | | | | | 11,922 | | | | 734,753 | |
| | | | | | | | | | | | |
| | | |
| Industrial Conglomerates: 1.66% | | | | | | | | | | |
General Electric Company | | | | | | | 43,387 | | | | 1,311,589 | |
| | | | | | | | | | | | |
| | | |
| Machinery: 1.67% | | | | | | | | | | |
Stanley Black & Decker Incorporated | | | | | | | 11,659 | | | | 1,319,566 | |
| | | | | | | | | | | | |
| | | |
| Professional Services: 1.01% | | | | | | | | | | |
Robert Half International Incorporated | | | | | | | 19,238 | | | | 796,799 | |
| | | | | | | | | | | | |
| | | |
| Road & Rail: 1.65% | | | | | | | | | | |
Hertz Global Holdings Incorporated † | | | | | | | 51,571 | | | | 499,723 | |
Norfolk Southern Corporation | | | | | | | 9,605 | | | | 807,396 | |
| | | |
| | | | | | | | | 1,307,119 | |
| | | | | | | | | | | | |
| | | |
| Trading Companies & Distributors: 1.04% | | | | | | | | | | |
HD Supply Holdings Incorporated † | | | | | | | 23,467 | | | | 828,385 | |
| | | | | | | | | | | | |
| | | |
Information Technology: 11.06% | | | | | | | | | | |
| | | |
| Electronic Equipment, Instruments & Components: 2.54% | | | | | | | | | | |
Synnex Corporation | | | | | | | 14,052 | | | | 1,280,137 | |
TE Connectivity Limited | | | | | | | 12,197 | | | | 731,820 | |
| | | |
| | | | | | | | | 2,011,957 | |
| | | | | | | | | | | | |
The accompanying notes are an integral part of these financial statements.
| | | | |
| 70 | | Wells Fargo Allocation Funds | | Portfolio of investments—May 31, 2016 |
LARGE COMPANY VALUE PORTFOLIO
| | | | | | | | | | | | |
| Security name | | | | | | Shares | | | Value | |
| | | |
| Internet Software & Services: 1.41% | | | | | | | | | | |
Alphabet Incorporated Class C † | | | | | | | 1,511 | | | $ | 1,111,673 | |
| | | | | | | | | | | | |
| | | |
| IT Services: 1.04% | | | | | | | | | | |
Alliance Data Systems Corporation † | | | | | | | 3,690 | | | | 819,881 | |
| | | | | | | | | | | | |
| | | |
| Semiconductors & Semiconductor Equipment: 2.68% | | | | | | | | | | |
NXP Semiconductors NV † | | | | | | | 14,944 | | | | 1,412,059 | |
Skyworks Solutions Incorporated | | | | | | | 10,610 | | | | 708,324 | |
| | | |
| | | | | | | | | 2,120,383 | |
| | | | | | | | | | | | |
| | | |
| Software: 0.58% | | | | | | | | | | |
Citrix Systems Incorporated † | | | | | | | 5,365 | �� | | | 455,596 | |
| | | | | | | | | | | | |
| | | |
| Technology Hardware, Storage & Peripherals: 2.81% | | | | | | | | | | |
Apple Incorporated | | | | | | | 7,084 | | | | 707,408 | |
NCR Corporation † | | | | | | | 49,182 | | | | 1,518,740 | |
| | | |
| | | | | | | | | 2,226,148 | |
| | | | | | | | | | | | |
| | | |
Materials: 3.37% | | | | | | | | | | |
| | | |
| Chemicals: 1.88% | | | | | | | | | | |
Cabot Corporation | | | | | | | 11,987 | | | | 547,926 | |
FMC Corporation | | | | | | | 19,782 | | | | 939,447 | |
| | | |
| | | | | | | | | 1,487,373 | |
| | | | | | | | | | | | |
| | | |
| Containers & Packaging: 1.49% | | | | | | | | | | |
Crown Holdings Incorporated † | | | | | | | 17,198 | | | | 897,220 | |
WestRock Company | | | | | | | 7,162 | | | | 283,687 | |
| | | |
| | | | | | | | | 1,180,907 | |
| | | | | | | | | | | | |
| | | |
Telecommunication Services: 2.27% | | | | | | | | | | |
| | | |
| Diversified Telecommunication Services: 2.27% | | | | | | | | | | |
AT&T Incorporated | | | | | | | 22,762 | | | | 891,132 | |
Verizon Communications Incorporated | | | | | | | 17,752 | | | | 903,577 | |
| | | |
| | | | | | | | | 1,794,709 | |
| | | | | | | | | | | | |
| | | |
Utilities: 4.23% | | | | | | | | | | |
| | | |
| Electric Utilities: 3.13% | | | | | | | | | | |
Duke Energy Corporation | | | | | | | 15,256 | | | | 1,193,477 | |
The Southern Company | | | | | | | 25,977 | | | | 1,284,303 | |
| | | |
| | | | | | | | | 2,477,780 | |
| | | | | | | | | | | | |
| | | |
| Gas Utilities: 1.10% | | | | | | | | | | |
Atmos Energy Corporation | | | | | | | 11,944 | | | | 870,718 | |
| | | | | | | | | | | | |
| | | | |
Total Common Stocks (Cost $66,303,876) | | | | | | | | | | | 77,925,106 | |
| | | | | | | | | | | | |
The accompanying notes are an integral part of these financial statements.
| | | | | | |
| Portfolio of investments—May 31, 2016 | | Wells Fargo Allocation Funds | | | 71 | |
LARGE COMPANY VALUE PORTFOLIO
| | | | | | | | | | | | | | | | |
| Security name | | Yield | | | | | | Shares | | | Value | |
| | | | |
Short-Term Investments: 3.64% | | | | | | | | | | | | | | | | |
| | | | |
| Investment Companies: 3.64% | | | | | | | | | | | | | | | | |
Securities Lending Cash Investments LLC (l)(r)(u) | | | 0.45 | % | | | | | | | 1,759,295 | | | $ | 1,759,295 | |
Wells Fargo Cash Investment Money Market Fund Select Class (l)(u) | | | 0.41 | | | | | | | | 1,123,879 | | | | 1,123,879 | |
| | | | |
Total Short-Term Investments (Cost $2,883,174) | | | | | | | | | | | | | | | 2,883,174 | |
| | | | | | | | | | | | | | | | |
| | | | | | | | |
| Total investments in securities (Cost $69,187,050) * | | | 102.14 | % | | | 80,808,280 | |
Other assets and liabilities, net | | | (2.14 | ) | | | (1,693,450 | ) |
| | | | | | | | |
| Total net assets | | | 100.00 | % | | $ | 79,114,830 | |
| | | | | | | | |
| † | Non-income-earning security |
| « | All or a portion of this security is on loan. |
| (l) | The issuer of the security is an affiliated person of the Portfolio as defined in the Investment Company Act of 1940. |
| (r) | The investment is a non-registered investment vehicle purchased with cash collateral received from securities on loan. |
| (u) | The rate represents the 7-day annualized yield at period end. |
| * | Cost for federal income tax purposes is $70,181,391 and unrealized gains (losses) consists of: |
| | | | |
| Gross unrealized gains | | $ | 13,775,938 | |
Gross unrealized losses | | | (3,149,049 | ) |
| | | | |
Net unrealized gains | | $ | 10,626,889 | |
The accompanying notes are an integral part of these financial statements.
| | | | |
| 72 | | Wells Fargo Allocation Funds | | Portfolio of investments—May 31, 2016 |
SMALL COMPANY GROWTH PORTFOLIO
| | | | | | | | | | | | |
| Security name | | | | | | Shares | | | Value | |
| | | |
Common Stocks: 97.39% | | | | | | | | | | |
| | | | |
Consumer Discretionary: 14.01% | | | | | | | | | | | | |
| | | |
| Auto Components: 1.32% | | | | | | | | | | |
Gentherm Incorporated † | | | | | | | 324,905 | | | $ | 11,885,025 | |
Tower International Incorporated | | | | | | | 178,475 | | | | 3,867,553 | |
| | | | |
| | | | | | | | | | | 15,752,578 | |
| | | | | | | | | | | | |
| | | |
| Diversified Consumer Services: 1.01% | | | | | | | | | | |
Houghton Mifflin Harcourt Company † | | | | | | | 703,180 | | | | 12,094,696 | |
| | | | | | | | | | | | |
| | | |
| Hotels, Restaurants & Leisure: 3.44% | | | | | | | | | | |
Del Taco Restaurants Incorporated † | | | | | | | 660,890 | | | | 6,172,713 | |
Extended Stay America Incorporated | | | | | | | 681,120 | | | | 9,712,771 | |
Krispy Kreme Doughnuts Incorporated † | | | | | | | 537,600 | | | | 11,493,888 | |
SeaWorld Entertainment Incorporated « | | | | | | | 313,480 | | | | 5,473,361 | |
Zoe’s Kitchen Incorporated †« | | | | | | | 226,470 | | | | 8,361,272 | |
| | | | |
| | | | | | | | | | | 41,214,005 | |
| | | | | | | | | | | | |
| | | |
| Household Durables: 0.99% | | | | | | | | | | |
Tempur-Pedic International Incorporated † | | | | | | | 96,410 | | | | 5,612,990 | |
William Lyon Homes Class A †« | | | | | | | 388,969 | | | | 6,309,077 | |
| | | | |
| | | | | | | | | | | 11,922,067 | |
| | | | | | | | | | | | |
| | | |
| Leisure Products: 0.30% | | | | | | | | | | |
Malibu Boats Incorporated Class A † | | | | | | | 262,490 | | | | 3,569,864 | |
| | | | | | | | | | | | |
| | | |
| Media: 2.44% | | | | | | | | | | |
IMAX Corporation † | | | | | | | 481,153 | | | | 16,041,641 | |
Lions Gate Entertainment Corporation « | | | | | | | 357,164 | | | | 7,964,757 | |
Media General Incorporated † | | | | | | | 289,410 | | | | 5,163,074 | |
| | | | |
| | | | | | | | | | | 29,169,472 | |
| | | | | | | | | | | | |
| | | |
| Specialty Retail: 3.80% | | | | | | | | | | |
Burlington Stores Incorporated † | | | | | | | 188,080 | | | | 11,352,509 | |
Chico’s FAS Incorporated | | | | | | | 525,617 | | | | 5,702,944 | |
Dick’s Sporting Goods Incorporated | | | | | | | 241,689 | | | | 10,368,458 | |
Monro Muffler Brake Incorporated | | | | | | | 124,471 | | | | 7,835,449 | |
Party City Holdco Incorporated † | | | | | | | 730,240 | | | | 10,179,546 | |
| | | | |
| | | | | | | | | | | 45,438,906 | |
| | | | | | | | | | | | |
| | | |
| Textiles, Apparel & Luxury Goods: 0.71% | | | | | | | | | | |
Kate Spade & Company † | | | | | | | 388,780 | | | | 8,498,731 | |
| | | | | | | | | | | | |
| | | |
Consumer Staples: 2.60% | | | | | | | | | | |
| | | |
| Food Products: 1.78% | | | | | | | | | | |
Amplify Snack Brands Incorporated †« | | | | | | | 723,199 | | | | 9,437,747 | |
WhiteWave Foods Company † | | | | | | | 265,936 | | | | 11,874,042 | |
| | | | |
| | | | | | | | | | | 21,311,789 | |
| | | | | | | | | | | | |
The accompanying notes are an integral part of these financial statements.
| | | | | | |
| Portfolio of investments—May 31, 2016 | | Wells Fargo Allocation Funds | | | 73 | |
SMALL COMPANY GROWTH PORTFOLIO
| | | | | | | | | | | | |
| Security name | | | | | | Shares | | | Value | |
| | | |
| Household Products: 0.82% | | | | | | | | | | |
Central Garden & Pet Company † | | | | | | | 60,890 | | | $ | 1,137,425 | |
Central Garden & Pet Company Class A † | | | | | | | 475,575 | | | | 8,669,732 | |
| | | |
| | | | | | | | | 9,807,157 | |
| | | | | | | | | | | | |
| | | |
Energy: 2.69% | | | | | | | | | | |
| | | |
| Oil, Gas & Consumable Fuels: 2.69% | | | | | | | | | | |
Diamondback Energy Incorporated † | | | | | | | 110,139 | | | | 10,017,142 | |
GasLog Limited « | | | | | | | 483,053 | | | | 6,014,010 | |
Memorial Resource Development Corporation † | | | | | | | 354,153 | | | | 5,595,617 | |
QEP Resources Incorporated | | | | | | | 568,950 | | | | 10,599,539 | |
| | | | |
| | | | | | | | | | | 32,226,308 | |
| | | | | | | | | | | | |
| | | |
Financials: 9.41% | | | | | | | | | | |
| | | |
| Banks: 2.55% | | | | | | | | | | |
ServisFirst Bancshares Incorporated « | | | | | | | 165,480 | | | | 8,611,579 | |
Signature Bank † | | | | | | | 69,675 | | | | 9,406,125 | |
SVB Financial Group † | | | | | | | 113,342 | | | | 12,490,288 | |
| | | | |
| | | | | | | | | | | 30,507,992 | |
| | | | | | | | | | | | |
| | | |
| Capital Markets: 3.25% | | | | | | | | | | |
Evercore Partners Incorporated Class A | | | | | | | 301,814 | | | | 15,694,328 | |
Stifel Financial Corporation † | | | | | | | 258,781 | | | | 9,776,746 | |
Virtu Financial Incorporated Class A | | | | | | | 436,538 | | | | 7,774,742 | |
Virtus Investment Partners Incorporated | | | | | | | 69,078 | | | | 5,623,640 | |
| | | | |
| | | | | | | | | | | 38,869,456 | |
| | | | | | | | | | | | |
| | | |
| Insurance: 1.17% | | | | | | | | | | |
Argo Group International Holdings Limited | | | | | | | 265,607 | | | | 13,984,214 | |
| | | | | | | | | | | | |
| | | |
| REITs: 1.19% | | | | | | | | | | |
QTS Realty Trust Incorporated Class A | | | | | | | 275,695 | | | | 14,245,161 | |
| | | | | | | | | | | | |
| | | |
| Thrifts & Mortgage Finance: 1.25% | | | | | | | | | | |
Essent Group Limited † | | | | | | | 684,644 | | | | 14,966,318 | |
| | | | | | | | | | | | |
| | | |
Health Care: 23.15% | | | | | | | | | | |
| | | |
| Biotechnology: 3.91% | | | | | | | | | | |
Alder Biopharmaceuticals Incorporated †« | | | | | | | 180,740 | | | | 5,434,852 | |
Alnylam Pharmaceuticals Incorporated † | | | | | | | 100,665 | | | | 7,219,694 | |
Cepheid Incorporated † | | | | | | | 330,687 | | | | 9,262,543 | |
Flexion Therapeutics Incorporated † | | | | | | | 379,627 | | | | 6,620,695 | |
Intrexon Corporation « | | | | | | | 148,882 | | | | 4,576,633 | |
Portola Pharmaceuticals Incorporated † | | | | | | | 214,134 | | | | 5,884,402 | |
Radius Health Incorporated †« | | | | | | | 112,560 | | | | 4,081,426 | |
Tesaro Incorporated †« | | | | | | | 80,082 | | | | 3,707,797 | |
| | | | |
| | | | | | | | | | | 46,788,042 | |
| | | | | | | | | | | | |
The accompanying notes are an integral part of these financial statements.
| | | | |
| 74 | | Wells Fargo Allocation Funds | | Portfolio of investments—May 31, 2016 |
SMALL COMPANY GROWTH PORTFOLIO
| | | | | | | | | | | | |
| Security name | | | | | | Shares | | | Value | |
| | | |
| Health Care Equipment & Supplies: 8.29% | | | | | | | | | | |
Accuray Incorporated †« | | | | | | | 1,254,478 | | | $ | 6,836,905 | |
Analogic Corporation | | | | | | | 128,080 | | | | 10,502,560 | |
Atricure Incorporated † | | | | | | | 452,413 | | | | 6,555,464 | |
Cerus Corporation †« | | | | | | | 1,721,148 | | | | 9,569,583 | |
Dexcom Incorporated † | | | | | | | 154,016 | | | | 9,932,492 | |
Inogen Incorporated † | | | | | | | 260,165 | | | | 12,420,277 | |
LDR Holding Corporation † | | | | | | | 411,724 | | | | 8,658,556 | |
Nevro Corporation †« | | | | | | | 177,490 | | | | 12,374,603 | |
Novocure Limited †« | | | | | | | 412,470 | | | | 4,590,791 | |
The Spectranetics Corporation †« | | | | | | | 491,654 | | | | 9,007,101 | |
Wright Medical Group NV † | | | | | | | 452,394 | | | | 8,749,300 | |
| | | | |
| | | | | | | | | | | 99,197,632 | |
| | | | | | | | | | | | |
| | | |
| Health Care Providers & Services: 6.49% | | | | | | | | | | |
Adeptus Health Incorporated Class A †« | | | | | | | 160,667 | | | | 11,487,691 | |
AMN Healthcare Services Incorporated † | | | | | | | 333,325 | | | | 12,446,356 | |
Capital Senior Living Corporation † | | | | | | | 536,030 | | | | 9,803,989 | |
HealthEquity Incorporated † | | | | | | | 538,630 | | | | 13,902,040 | |
LifePoint Hospitals Incorporated † | | | | | | | 146,046 | | | | 9,681,389 | |
Surgery Partners Incorporated † | | | | | | | 555,680 | | | | 7,643,378 | |
Teladoc Incorporated †« | | | | | | | 376,900 | | | | 4,307,967 | |
The Ensign Group Incorporated | | | | | | | 420,510 | | | | 8,347,124 | |
| | | | |
| | | | | | | | | | | 77,619,934 | |
| | | | | | | | | | | | |
| | | |
| Health Care Technology: 1.80% | | | | | | | | | | |
Cotiviti Holdings Incorporated † | | | | | | | 260,329 | | | | 4,753,608 | |
Evolent Health Incorporated Class A †« | | | | | | | 602,380 | | | | 9,228,462 | |
Medidata Solutions Incorporated † | | | | | | | 165,162 | | | | 7,587,542 | |
| | | | |
| | | | | | | | | | | 21,569,612 | |
| | | | | | | | | | | | |
| | | |
| Life Sciences Tools & Services: 1.51% | | | | | | | | | | |
ICON plc ADR † | | | | | | | 256,392 | | | | 18,060,252 | |
| | | | | | | | | | | | |
| | | |
| Pharmaceuticals: 1.15% | | | | | | | | | | |
Cempra Holdings Incorporated †« | | | | | | | 268,840 | | | | 5,051,504 | |
Pacira Pharmaceuticals Incorporated †« | | | | | | | 188,200 | | | | 8,753,182 | |
| | | | |
| | | | | | | | | | | 13,804,686 | |
| | | | | | | | | | | | |
| | | |
Industrials: 16.42% | | | | | | | | | | |
| | | |
| Air Freight & Logistics: 1.30% | | | | | | | | | | |
Hub Group Incorporated Class A † | | | | | | | 388,019 | | | | 15,528,520 | |
| | | | | | | | | | | | |
| | | |
| Building Products: 5.00% | | | | | | | | | | |
A.O. Smith Corporation | | | | | | | 177,204 | | | | 14,583,889 | |
Apogee Enterprises Incorporated | | | | | | | 314,635 | | | | 14,227,795 | |
Masonite International Corporation † | | | | | | | 130,680 | | | | 9,125,384 | |
NCI Building Systems Incorporated † | | | | | | | 779,634 | | | | 12,552,107 | |
PGT Incorporated † | | | | | | | 870,941 | | | | 9,336,488 | |
| | | | |
| | | | | | | | | | | 59,825,663 | |
| | | | | | | | | | | | |
The accompanying notes are an integral part of these financial statements.
| | | | | | |
| Portfolio of investments—May 31, 2016 | | Wells Fargo Allocation Funds | | | 75 | |
SMALL COMPANY GROWTH PORTFOLIO
| | | | | | | | | | | | |
| Security name | | | | | | Shares | | | Value | |
| | | |
| Commercial Services & Supplies: 3.82% | | | | | | | | | | |
Copart Incorporated † | | | | | | | 333,795 | | | $ | 16,526,190 | |
KAR Auction Services Incorporated | | | | | | | 259,840 | | | | 10,663,834 | |
Mobile Mini Incorporated | | | | | | | 279,215 | | | | 9,618,957 | |
West Corporation | | | | | | | 423,880 | | | | 8,943,868 | |
| | | | |
| | | | | | | | | | | 45,752,849 | |
| | | | | | | | | | | | |
| | | |
| Construction & Engineering: 1.69% | | | | | | | | | | |
Chicago Bridge & Iron Company NV | | | | | | | 254,619 | | | | 9,736,631 | |
Granite Construction Incorporated | | | | | | | 243,290 | | | | 10,444,440 | |
| | | | |
| | | | | | | | | | | 20,181,071 | |
| | | | | | | | | | | | |
| | | |
| Machinery: 0.91% | | | | | | | | | | |
Wabash National Corporation † | | | | | | | 770,303 | | | | 10,922,897 | |
| | | | | | | | | | | | |
| | | |
| Professional Services: 1.98% | | | | | | | | | | |
On Assignment Incorporated † | | | | | | | 341,274 | | | | 12,855,792 | |
RPX Corporation † | | | | | | | 437,894 | | | | 4,400,835 | |
TrueBlue Incorporated † | | | | | | | 325,860 | | �� | | 6,455,287 | |
| | | | |
| | | | | | | | | | | 23,711,914 | |
| | | | | | | | | | | | |
| | | |
| Road & Rail: 1.49% | | | | | | | | | | |
Genesee & Wyoming Incorporated Class A † | | | | | | | 166,147 | | | | 9,980,450 | |
Swift Transportation Company †« | | | | | | | 502,826 | | | | 7,834,029 | |
| | | | |
| | | | | | | | | | | 17,814,479 | |
| | | | | | | | | | | | |
| | | |
| Trading Companies & Distributors: 0.23% | | | | | | | | | | |
Siteone Landscape Supply Incorporated † | | | | | | | 99,688 | | | | 2,804,223 | |
| | | | | | | | | | | | |
| | | |
Information Technology: 27.06% | | | | | | | | | | |
| | | |
| Communications Equipment: 1.35% | | | | | | | | | | |
Ciena Corporation † | | | | | | | 420,890 | | | | 7,348,739 | |
Infinera Corporation † | | | | | | | 673,912 | | | | 8,834,986 | |
| | | | |
| | | | | | | | | | | 16,183,725 | |
| | | | | | | | | | | | |
| | | |
| Electronic Equipment, Instruments & Components: 0.74% | | | | | | | | | | |
OSI Systems Incorporated † | | | | | | | 165,436 | | | | 8,814,430 | |
| | | | | | | | | | | | |
| | | |
| Internet Software & Services: 6.27% | | | | | | | | | | |
2U Incorporated †« | | | | | | | 431,071 | | | | 12,001,017 | |
Benefitfocus Incorporated †« | | | | | | | 273,850 | | | | 10,053,034 | |
Cornerstone OnDemand Incorporated † | | | | | | | 366,620 | | | | 14,668,466 | |
Hortonworks Incorporated †« | | | | | | | 592,020 | | | | 6,914,794 | |
Marketo Incorporated † | | | | | | | 429,220 | | | | 15,121,421 | |
Pandora Media Incorporated †« | | | | | | | 528,370 | | | | 6,229,482 | |
Shopify Incorporated Class A †« | | | | | | | 344,870 | | | | 10,101,242 | |
| | | | |
| | | | | | | | | | | 75,089,456 | |
| | | | | | | | | | | | |
The accompanying notes are an integral part of these financial statements.
| | | | |
| 76 | | Wells Fargo Allocation Funds | | Portfolio of investments—May 31, 2016 |
SMALL COMPANY GROWTH PORTFOLIO
| | | | | | | | | | | | | | |
| Security name | | | | | | | Shares | | | Value | |
| | | |
| IT Services: 2.88% | | | | | | | | | | | |
Acxiom Corporation † | | | | | | | | | 605,560 | | | $ | 12,825,761 | |
Maximus Incorporated | | | | | | | | | 190,500 | | | | 10,982,325 | |
Vantiv Incorporated Class A † | | | | | | | | | 197,360 | | | | 10,612,047 | |
| | | | |
| | | | | | | | | | | | | 34,420,133 | |
| | | | | | | | | | | | | | |
| | | |
| Semiconductors & Semiconductor Equipment: 6.17% | | | | | | | | | | | |
Applied Micro Circuits Corporation † | | | | | | | | | 1,207,237 | | | | 7,943,619 | |
Cypress Semiconductor Corporation | | | | | | | | | 1,143,754 | | | | 12,158,105 | |
FormFactor Incorporated † | | | | | | | | | 1,103,995 | | | | 7,915,644 | |
Microsemi Corporation † | | | | | | | | | 394,190 | | | | 13,335,448 | |
Nanometrics Incorporated † | | | | | | | | | 324,399 | | | | 6,040,309 | |
Silicon Motion Technology Corporation « | | | | | | | | | 246,514 | | | | 10,957,547 | |
Teradyne Incorporated | | | | | | | | | 780,857 | | | | 15,468,777 | |
| | | | |
| | | | | | | | | | | | | 73,819,449 | |
| | | | | | | | | | | | | | |
| | | |
| Software: 9.65% | | | | | | | | | | | |
Cadence Design Systems Incorporated † | | | | | | | | | 614,135 | | | | 15,181,417 | |
CyberArk Software Limited †« | | | | | | | | | 239,950 | | | | 10,898,529 | |
PTC Incorporated † | | | | | | | | | 414,545 | | | | 14,815,838 | |
Qlik Technologies Incorporated † | | | | | | | | | 530,453 | | | | 15,224,001 | |
Secureworks Corporation Class A †« | | | | | | | | | 273,420 | | | | 3,777,297 | |
SS&C Technologies Holdings Incorporated | | | | | | | | | 349,948 | | | | 21,553,297 | |
Synchronoss Technologies Incorporated † | | | | | | | | | 220,910 | | | | 7,791,496 | |
The Rubicon Project Incorporated † | | | | | | | | | 652,224 | | | | 9,555,082 | |
Ultimate Software Group Incorporated † | | | | | | | | | 45,881 | | | | 9,381,747 | |
Zendesk Incorporated † | | | | | | | | | 296,733 | | | | 7,266,991 | |
| | | | |
| | | | | | | | | | | | | 115,445,695 | |
| | | | | | | | | | | | | | |
| | | |
Materials: 2.05% | | | | | | | | | | | |
| | | |
| Chemicals: 0.17% | | | | | | | | | | | |
Calgon Carbon Corporation | | | | | | | | | 133,782 | | | | 1,990,676 | |
| | | | | | | | | | | | | | |
| | | |
| Metals & Mining: 0.91% | | | | | | | | | | | |
Steel Dynamics Incorporated | | | | | | | | | 440,383 | | | | 10,873,056 | |
| | | | | | | | | | | | | | |
| | | |
| Paper & Forest Products: 0.97% | | | | | | | | | | | |
Boise Cascade Company † | | | | | | | | | 507,067 | | | | 11,642,258 | |
| | | | | | | | | | | | | | |
| | | | |
Total Common Stocks (Cost $1,086,280,944) | | | | | | | | | | | | | 1,165,439,366 | |
| | | | | | | | | | | | | | |
| | | Yield | | | | | | | | | |
| Short-Term Investments: 16.01% | | | | | | | | | | | | | | |
| | | | |
| Investment Companies: 16.01% | | | | | | | | | | | | | | |
Securities Lending Cash Investments LLC (l)(r)(u) | | | 0.45 | % | | | | | 151,177,536 | | | | 151,177,536 | |
Wells Fargo Cash Investment Money Market Fund Select Class (l)(u) | | | 0.41 | | | | | | 40,370,488 | | | | 40,370,488 | |
| | | | |
Total Short-Term Investments (Cost $191,548,024) | | | | | | | | | | | | | 191,548,024 | |
| | | | | | | | | | | | | | |
| | | | | | | | |
| Total investments in securities (Cost $1,277,828,968) * | | | 113.40 | % | | | 1,356,987,390 | |
Other assets and liabilities, net | | | (13.40 | ) | | | (160,390,950 | ) |
| | | | | | | | |
| Total net assets | | | 100.00 | % | | $ | 1,196,596,440 | |
| | | | | | | | |
The accompanying notes are an integral part of these financial statements.
| | | | | | |
| Portfolio of investments—May 31, 2016 | | Wells Fargo Allocation Funds | | | 77 | |
SMALL COMPANY GROWTH PORTFOLIO
| † | Non-income-earning security |
| « | All or a portion of this security is on loan. |
| (l) | The issuer of the security is an affiliated person of the Portfolio as defined in the Investment Company Act of 1940. |
| (r) | The investment is a non-registered investment vehicle purchased with cash collateral received from securities on loan. |
| (u) | The rate represents the 7-day annualized yield at period end. |
| * | Cost for federal income tax purposes is $1,301,744,639 and unrealized gains (losses) consists of: |
| | | | |
Gross unrealized gains | | $ | 153,262,207 | |
Gross unrealized losses | | | (98,019,456 | ) |
| | | | |
Net unrealized gains | | $ | 55,242,751 | |
The accompanying notes are an integral part of these financial statements.
| | | | |
| 78 | | Wells Fargo Allocation Funds | | Portfolio of investments—May 31, 2016 |
SMALL COMPANY VALUE PORTFOLIO
| | | | | | | | | | | | |
| Security name | | | | | | Shares | | | Value | |
| | | | |
Common Stocks: 98.11% | | | | | | | | | | | | |
| | | | |
Consumer Discretionary: 14.49% | | | | | | | | | | | | |
| | | | |
| Auto Components: 1.80% | | | | | | | | | | | | |
American Axle & Manufacturing Holdings Incorporated † | | | | | | | 135,919 | | | $ | 2,265,764 | |
Metaldyne Performance Group Incorporated | | | | | | | 101,000 | | | | 1,646,300 | |
| |
| | | | 3,912,064 | |
| | | | | | | | | | | | |
| | | | |
| Automobiles: 1.16% | | | | | | | | | | | | |
Thor Industries Incorporated | | | | | | | 38,950 | | | | 2,531,750 | |
| | | | | | | | | | | | |
| | | | |
| Hotels, Restaurants & Leisure: 0.66% | | | | | | | | | | | | |
ClubCorp Holdings Incorporated | | | | | | | 119,494 | | | | 1,442,293 | |
| | | | | | | | | | | | |
| | | | |
| Household Durables: 1.25% | | | | | | | | | | | | |
Beazer Homes Incorporated † | | | | | | | 153,160 | | | | 1,202,306 | |
WCI Communities Incorporated † | | | | | | | 87,500 | | | | 1,505,875 | |
| |
| | | | 2,708,181 | |
| | | | | | | | | | | | |
| | | | |
| Media: 2.72% | | | | | | | | | | | | |
Lions Gate Entertainment Corporation | | | | | | | 128,600 | | | | 2,867,780 | |
Scholastic Corporation | | | | | | | 78,023 | | | | 3,046,798 | |
| |
| | | | 5,914,578 | |
| | | | | | | | | | | | |
| | | | |
| Specialty Retail: 4.92% | | | | | | | | | | | | |
Asbury Automotive Group Incorporated † | | | | | | | 32,109 | | | | 1,801,315 | |
Ascena Retail Group Incorporated † | | | | | | | 196,620 | | | | 1,419,596 | |
GNC Holdings Incorporated Class A | | | | | | | 61,770 | | | | 1,609,109 | |
Outerwall Incorporated « | | | | | | | 54,010 | | | | 2,227,913 | |
Rent-A-Center Incorporated | | | | | | | 116,600 | | | | 1,535,622 | |
Urban Outfitters Incorporated † | | | | | | | 74,250 | | | | 2,118,353 | |
| |
| | | | 10,711,908 | |
| | | | | | | | | | | | |
| | | | |
| Textiles, Apparel & Luxury Goods: 1.98% | | | | | | | | | | | | |
G-III Apparel Group Limited † | | | | | | | 53,900 | | | | 2,108,568 | |
Oxford Industries Incorporated | | | | | | | 34,700 | | | | 2,198,939 | |
| |
| | | | 4,307,507 | |
| | | | | | | | | | | | |
| | | | |
Consumer Staples: 2.42% | | | | | | | | | | | | |
| | | | |
| Food & Staples Retailing: 1.17% | | | | | | | | | | | | |
SUPERVALU Incorporated † | | | | | | | 247,150 | | | | 1,144,305 | |
United Natural Foods Incorporated † | | | | | | | 38,020 | | | | 1,416,625 | |
| |
| | | | 2,560,930 | |
| | | | | | | | | | | | |
| | | | |
| Food Products: 1.25% | | | | | | | | | | | | |
Darling Ingredients Incorporated † | | | | | | | 176,810 | | | | 2,714,034 | |
| | | | | | | | | | | | |
| | | | |
Energy: 6.42% | | | | | | | | | | | | |
| | | | |
| Energy Equipment & Services: 1.09% | | | | | | | | | | | | |
RPC Incorporated « | | | | | | | 160,300 | | | | 2,364,425 | |
| | | | | | | | | | | | |
The accompanying notes are an integral part of these financial statements.
| | | | | | |
| Portfolio of investments—May 31, 2016 | | Wells Fargo Allocation Funds | | | 79 | |
SMALL COMPANY VALUE PORTFOLIO
| | | | | | | | | | | | |
| Security name | | | | | | Shares | | | Value | |
| | | | |
| Oil, Gas & Consumable Fuels: 5.33% | | | | | | | | | | | | |
Callon Petroleum Company † | | | | | | | 187,300 | | | $ | 2,133,347 | |
Carrizo Oil & Gas Incorporated † | | | | | | | 50,600 | | | | 1,948,100 | |
Delek US Holdings Incorporated | | | | | | | 122,500 | | | | 1,688,050 | |
Parsley Energy Incorporated Class A † | | | | | | | 75,800 | | | | 1,976,106 | |
RSP Permian Incorporated † | | | | | | | 58,540 | | | | 1,927,722 | |
Scorpio Tankers Incorporated | | | | | | | 327,000 | | | | 1,922,760 | |
| | | | |
| | | | | | | | | | | 11,596,085 | |
| | | | | | | | | | | | |
| | | | |
Financials: 39.49% | | | | | | | | | | | | |
| | | | |
| Banks: 18.42% | | | | | | | | | | | | |
BancorpSouth Incorporated | | | | | | | 103,592 | | | | 2,474,813 | |
BankUnited Incorporated | | | | | | | 72,150 | | | | 2,388,165 | |
Cathay General Bancorp | | | | | | | 73,000 | | | | 2,249,860 | |
ConnectOne Bancorp Incorporated | | | | | | | 81,120 | | | | 1,284,941 | |
Customers Bancorp Incorporated † | | | | | | | 59,400 | | | | 1,597,266 | |
FCB Financial Holdings Class A † | | | | | | | 63,600 | | | | 2,351,292 | |
Great Western Bancorp Incorporated | | | | | | | 100,940 | | | | 3,433,979 | |
Pinnacle Financial Partners Incorporated | | | | | | | 44,960 | | | | 2,211,133 | |
PrivateBancorp Incorporated | | | | | | | 67,597 | | | | 2,997,927 | |
Renasant Corporation | | | | | | | 75,600 | | | | 2,601,396 | |
Sterling BanCorp | | | | | | | 163,800 | | | | 2,696,148 | |
Talmer Bancorp Incorporated Class A | | | | | | | 155,400 | | | | 3,098,676 | |
Umpqua Holdings Corporation | | | | | | | 130,600 | | | | 2,088,294 | |
Webster Financial Corporation | | | | | | | 70,437 | | | | 2,758,313 | |
Western Alliance Bancorp † | | | | | | | 89,978 | | | | 3,392,171 | |
Wintrust Financial Corporation | | | | | | | 45,977 | | | | 2,449,195 | |
| | | | |
| | | | | | | | | | | 40,073,569 | |
| | | | | | | | | | | | |
| | | | |
| Capital Markets: 2.15% | | | | | | | | | | | | |
HFF Incorporated Class A | | | | | | | 66,400 | | | | 2,138,080 | |
Stifel Financial Corporation † | | | | | | | 67,193 | | | | 2,538,552 | |
| | | | |
| | | | | | | | | | | 4,676,632 | |
| | | | | | | | | | | | |
| | | | |
| Consumer Finance: 0.86% | | | | | | | | | | | | |
PRA Incorporated † | | | | | | | 67,770 | | | | 1,864,353 | |
| | | | | | | | | | | | |
| | | | |
| Insurance: 5.28% | | | | | | | | | | | | |
American Equity Investment Life Holding Company | | | | | | | 101,108 | | | | 1,638,961 | |
Employers Holdings Incorporated | | | | | | | 39,034 | | | | 1,165,165 | |
Horace Mann Educators Corporation | | | | | | | 71,710 | | | | 2,442,443 | |
Kemper Corporation | | | | | | | 50,310 | | | | 1,625,516 | |
OneBeacon Insurance Group Limited Class A | | | | | | | 103,456 | | | | 1,346,997 | |
Primerica Incorporated « | | | | | | | 58,063 | | | | 3,257,915 | |
| | | | |
| | | | | | | | | | | 11,476,997 | |
| | | | | | | | | | | | |
| | | | |
| Real Estate Management & Development: 0.75% | | | | | | | | | | | | |
Alexander & Baldwin Incorporated | | | | | | | 43,581 | | | | 1,641,260 | |
| | | | | | | | | | | | |
The accompanying notes are an integral part of these financial statements.
| | | | |
| 80 | | Wells Fargo Allocation Funds | | Portfolio of investments—May 31, 2016 |
SMALL COMPANY VALUE PORTFOLIO
| | | | | | | | | | | | |
| Security name | | | | | | Shares | | | Value | |
| | | | |
| REITs: 12.03% | | | | | | | | | | | | |
Brandywine Realty Trust | | | | | | | 162,900 | | | $ | 2,572,191 | |
Corporate Office Properties Trust | | | | | | | 100,500 | | | | 2,716,515 | |
Equity Commonwealth † | | | | | | | 106,100 | | | | 3,065,229 | |
Four Corners Property Trust Incorporated | | | | | | | 122,100 | | | | 2,373,624 | |
Highwoods Properties Incorporated | | | | | | | 54,100 | | | | 2,632,506 | |
Kite Realty Group Trust | | | | | | | 79,200 | | | | 2,128,104 | |
National Health Investors Incorporated | | | | | | | 32,400 | | | | 2,262,492 | |
Parkway Properties Incorporated | | | | | | | 130,297 | | | | 2,273,683 | |
Ramco-Gershenson Properties Trust | | | | | | | 150,221 | | | | 2,705,480 | |
Sabra Health Care REIT Incorporated | | | | | | | 82,600 | | | | 1,729,644 | |
Sunstone Hotel Investors Incorporated | | | | | | | 143,180 | | | | 1,723,887 | |
| | | | |
| | | | | | | | | | | 26,183,355 | |
| | | | | | | | | | | | |
| | | | |
Health Care: 3.82% | | | | | | | | | | | | |
| | | | |
| Health Care Equipment & Supplies: 0.71% | | | | | | | | | | | | |
Merit Medical Systems Incorporated † | | | | | | | 82,810 | | | | 1,554,344 | |
| | | | | | | | | | | | |
| | | | |
| Health Care Providers & Services: 3.11% | | | | | | | | | | | | |
Kindred Healthcare Incorporated | | | | | | | 155,700 | | | | 1,848,159 | |
Molina Healthcare Incorporated † | | | | | | | 57,260 | | | | 2,773,102 | |
Select Medical Holdings Corporation † | | | | | | | 168,420 | | | | 2,133,881 | |
| | | | |
| | | | | | | | | | | 6,755,142 | |
| | | | | | | | | | | | |
| | | | |
Industrials: 7.78% | | | | | | | | | | | | |
| | | | |
| Commercial Services & Supplies: 1.03% | | | | | | | | | | | | |
Quad Graphics Incorporated | | | | | | | 116,460 | | | | 2,237,197 | |
| | | | | | | | | | | | |
| | | | |
| Construction & Engineering: 2.82% | | | | | | | | | | | | |
Argan Incorporated | | | | | | | 62,300 | | | | 2,161,810 | |
KBR Incorporated | | | | | | | 116,490 | | | | 1,694,930 | |
Tutor Perini Corporation † | | | | | | | 100,795 | | | | 2,279,983 | |
| | | | |
| | | | | | | | | | | 6,136,723 | |
| | | | | | | | | | | | |
| | | | |
| Electrical Equipment: 1.29% | | | | | | | | | | | | |
Generac Holdings Incorporated † | | | | | | | 74,060 | | | | 2,807,615 | |
| | | | | | | | | | | | |
| | | | |
| Machinery: 1.51% | | | | | | | | | | | | |
Chart Industries Incorporated † | | | | | | | 83,380 | | | | 2,164,545 | |
NN Incorporated « | | | | | | | 67,190 | | | | 1,119,385 | |
| | | | |
| | | | | | | | | | | 3,283,930 | |
| | | | | | | | | | | | |
| | | | |
| Trading Companies & Distributors: 1.13% | | | | | | | | | | | | |
Air Lease Corporation | | | | | | | 81,800 | | | | 2,458,090 | |
| | | | | | | | | | | | |
| | | | |
Information Technology: 14.87% | | | | | | | | | | | | |
| | | | |
| Communications Equipment: 1.85% | | | | | | | | | | | | |
ARRIS International plc † | | | | | | | 92,313 | | | | 2,224,743 | |
NetScout Systems Incorporated † | | | | | | | 73,530 | | | | 1,788,830 | |
| | | | |
| | | | | | | | | | | 4,013,573 | |
| | | | | | | | | | | | |
The accompanying notes are an integral part of these financial statements.
| | | | | | |
| Portfolio of investments—May 31, 2016 | | Wells Fargo Allocation Funds | | | 81 | |
SMALL COMPANY VALUE PORTFOLIO
| | | | | | | | | | | | |
| Security name | | | | | | Shares | | | Value | |
| | | | |
| Electronic Equipment, Instruments & Components: 3.75% | | | | | | | | | | | | |
Anixter International Incorporated † | | | | | | | 28,320 | | | $ | 1,704,864 | |
Belden Incorporated | | | | | | | 35,040 | | | | 2,266,037 | |
Jabil Circuit Incorporated | | | | | | | 113,640 | | | | 2,168,251 | |
VeriFone Systems Incorporated † | | | | | | | 76,800 | | | | 2,027,520 | |
| |
| | | | 8,166,672 | |
| | | | | | | | | | | | |
| | | | |
| Internet Software & Services: 1.73% | | | | | | | | | | | | |
Blucora Incorporated † | | | | | | | 195,660 | | | | 1,757,027 | |
IAC/InterActive Corp | | | | | | | 35,940 | | | | 2,008,327 | |
| |
| | | | 3,765,354 | |
| | | | | | | | | | | | |
| | | | |
| IT Services: 1.01% | | | | | | | | | | | | |
Cardtronics Incorporated † | | | | | | | 56,110 | | | | 2,204,562 | |
| | | | | | | | | | | | |
| | | | |
| Semiconductors & Semiconductor Equipment: 3.76% | | | | | | | | | | | | |
Cirrus Logic Incorporated † | | | | | | | 65,270 | | | | 2,349,720 | |
Integrated Device Technology Incorporated † | | | | | | | 92,580 | | | | 2,161,743 | |
Veeco Instruments Incorporated † | | | | | | | 73,530 | | | | 1,308,099 | |
Xcerra Corporation † | | | | | | | 362,971 | | | | 2,370,201 | |
| |
| | | | 8,189,763 | |
| | | | | | | | | | | | |
| | | | |
| Software: 1.09% | | | | | | | | | | | | |
EPIQ Systems Incorporated | | | | | | | 42,760 | | | | 651,235 | |
Mentor Graphics Corporation | | | | | | | 79,807 | | | | 1,711,062 | |
| |
| | | | 2,362,297 | |
| | | | | | | | | | | | |
| | | | |
| Technology Hardware, Storage & Peripherals: 1.68% | | | | | | | | | | | | |
Avid Technology Incorporated † | | | | | | | 219,320 | | | | 1,304,954 | |
Super Micro Computer Incorporated † | | | | | | | 89,220 | | | | 2,341,133 | |
| |
| | | | 3,646,087 | |
| | | | | | | | | | | | |
| | | | |
Materials: 3.98% | | | | | | | | | | | | |
| | | | |
| Chemicals: 2.96% | | | | | | | | | | | | |
A. Schulman Incorporated | | | | | | | 84,600 | | | | 2,141,226 | |
Cabot Corporation | | | | | | | 42,400 | | | | 1,938,104 | |
Chemtura Corporation † | | | | | | | 88,513 | | | | 2,361,527 | |
| |
| | | | 6,440,857 | |
| | | | | | | | | | | | |
| | | | |
| Metals & Mining: 1.02% | | | | | | | | | | | | |
Ferroglobe plc | | | | | | | 243,240 | | | | 2,218,349 | |
| | | | | | | | | | | | |
| | | | |
Utilities: 4.84% | | | | | | | | | | | | |
| | | | |
| Electric Utilities: 2.86% | | | | | | | | | | | | |
El Paso Electric Company | | | | | | | 44,141 | | | | 1,971,337 | |
PNM Resources Incorporated | | | | | | | 60,087 | | | | 1,973,257 | |
Portland General Electric Company | | | | | | | 55,124 | | | | 2,270,006 | |
| |
| | | | 6,214,600 | |
| | | | | | | | | | | | |
The accompanying notes are an integral part of these financial statements.
| | | | |
| 82 | | Wells Fargo Allocation Funds | | Portfolio of investments—May 31, 2016 |
SMALL COMPANY VALUE PORTFOLIO
| | | | | | | | | | | | | | | | |
| Security name | | | | | | | | Shares | | | Value | |
| | | | |
| Gas Utilities: 0.51% | | | | | | | | | | | | | | | | |
Southwest Gas Corporation | | | | | | | | | | | 16,060 | | | $ | 1,115,046 | |
| | | | | | | | | | | | | | | | |
| | | | |
| Multi-Utilities: 1.47% | | | | | | | | | | | | | | | | |
Avista Corporation | | | | | | | | | | | 79,710 | | | | 3,205,936 | |
| | | | | | | | | | | | | | | | |
| |
Total Common Stocks (Cost $191,380,274) | | | | 213,456,058 | |
| | | | | | | | | | | | | | | | |
| | | | |
| | | | | | Expiration date | | | | | | | |
| Warrants: 0.00% | | | | | | | | | | | | | | | | |
| | | | |
Health Care: 0.00% | | | | | | | | | | | | | | | | |
| | | | |
| Health Care Equipment & Supplies: 0.00% | | | | | | | | | | | | | | | | |
EnteroMedics Incorporated †(a) | | | | | | | 6-13-2016 | | | | 9,104 | | | | 0 | |
| | | | | | | | | | | | | | | | |
| | | | |
Total Warrants (Cost $0) | | | | | | | | | | | | | | | 0 | |
| | | | | | | | | | | | | | | | |
| | | | |
| | | Yield | | | | | | | | | | |
| Short-Term Investments: 4.98% | | | | | | | | | | | | | | | | |
| | | | |
| Investment Companies: 4.98% | | | | | | | | | | | | | | | | |
Securities Lending Cash Investments LLC (l)(r)(u) | | | 0.45 | % | | | | | | | 5,965,825 | | | | 5,965,825 | |
Wells Fargo Cash Investment Money Market Fund Select Class (l)(u) | | | 0.41 | | | | | | | | 4,875,803 | | | | 4,875,803 | |
| | | | |
Total Short-Term Investments (Cost $10,841,628) | | | | | | | | | | | | | | | 10,841,628 | |
| | | | | | | | | | | | | | | | |
| | | | | | | | |
| Total investments in securities (Cost $202,221,902) * | | | 103.09 | % | | | 224,297,686 | |
Other assets and liabilities, net | | | (3.09 | ) | | | (6,727,916 | ) |
| | | | | | | | |
| Total net assets | | | 100.00 | % | | $ | 217,569,770 | |
| | | | | | | | |
| † | Non-income-earning security |
| « | All or a portion of this security is on loan. |
| (a) | The security is fair valued in accordance with procedures approved by the Board of Trustees. |
| (l) | The issuer of the security is an affiliated person of the Portfolio as defined in the Investment Company Act of 1940. |
| (r) | The investment is a non-registered investment vehicle purchased with cash collateral received from securities on loan. |
| (u) | The rate represents the 7-day annualized yield at period end. |
| * | Cost for federal income tax purposes is $202,899,156 and unrealized gains (losses) consists of: |
| | | | |
Gross unrealized gains | | $ | 34,100,284 | |
Gross unrealized losses | | | (12,701,754 | ) |
| | | | |
Net unrealized gains | | $ | 21,398,530 | |
The accompanying notes are an integral part of these financial statements.
| | | | | | |
| Summary portfolio of investments—May 31, 2016 | | Wells Fargo Allocation Funds | | | 83 | |
CORE BOND PORTFOLIO
The Summary portfolio of investments shows the 50 largest portfolio holdings in unaffiliated issuers and any holdings exceeding 1% of the total net assets as of the report date. The remaining securities held are grouped as “Other securities” in each category.
| | | | | | | | | | | | | | | | | | | | |
| Security name | | Interest rate | | | Maturity date | | | Principal | | | Value | | | Percent of
net assets | |
| | | | | |
Agency Securities: 30.53% | | | | | | | | | | | | | | | | | | | | |
FHLMC | | | 3.00 | % | | | 2-15-2045 | | | $ | 19,734,107 | | | $ | 20,112,137 | | | | 0.46 | % |
FHLMC | | | 1.13-7.00 | | | | 8-1-2017 to 4-1-2046 | | | | 181,825,901 | | | | 193,227,923 | | | | 4.47 | |
FHLMC | | | 3.50 | | | | 7-1-2032 | | | | 15,970,400 | | | | 16,975,238 | | | | 0.39 | |
FHLMC | | | 3.50 | | | | 4-1-2044 | | | | 16,257,869 | | | | 17,198,235 | | | | 0.40 | |
FHLMC | | | 3.50 | | | | 12-1-2045 | | | | 14,237,054 | | | | 14,991,659 | | | | 0.35 | |
FHLMC | | | 3.50 | | | | 2-1-2046 | | | | 15,782,716 | | | | 16,620,139 | | | | 0.38 | |
FHLMC %% | | | 3.50 | | | | 8-16-2046 | | | | 67,700,000 | | | | 70,571,956 | | | | 1.63 | |
FHLMC | | | 4.00 | | | | 8-1-2044 | | | | 20,216,471 | | | | 21,888,997 | | | | 0.50 | |
FHLMC | | | 4.00 | | | | 10-1-2045 | | | | 14,278,557 | | | | 15,358,973 | | | | 0.35 | |
FHLMC %% | | | 4.00 | | | | 7-14-2046 | | | | 22,600,000 | | | | 24,070,270 | | | | 0.55 | |
FHLMC Series 300 Class 300 | | | 3.00 | | | | 1-15-2043 | | | | 18,852,363 | | | | 19,215,529 | | | | 0.44 | |
FNMA | | | 0.00-8.16 | | | | 4-1-2017 to 6-13-2046 | | | | 381,070,503 | | | | 404,080,072 | | | | 9.30 | |
FNMA | | | 3.00 | | | | 10-25-2042 | | | | 17,620,845 | | | | 17,947,513 | | | | 0.41 | |
FNMA | | | 3.00 | | | | 6-1-2043 | | | | 14,511,441 | | | | 14,929,579 | | | | 0.34 | |
FNMA | | | 3.50 | | | | 5-1-2031 | | | | 12,277,838 | | | | 13,123,375 | | | | 0.30 | |
FNMA | | | 3.50 | | | | 11-1-2035 | | | | 11,089,398 | | | | 11,759,608 | | | | 0.27 | |
FNMA | | | 3.50 | | | | 6-1-2045 | | | | 18,189,829 | | | | 19,162,602 | | | | 0.44 | |
FNMA | | | 3.50 | | | | 8-1-2045 | | | | 11,133,388 | | | | 11,728,810 | | | | 0.27 | |
FNMA | | | 3.50 | | | | 4-1-2046 | | | | 18,707,016 | | | | 19,752,827 | | | | 0.46 | |
FNMA %% | | | 3.50 | | | | 8-16-2046 | | | | 25,300,000 | | | | 26,402,922 | | | | 0.61 | |
FNMA | | | 4.00 | | | | 9-1-2043 | | | | 11,153,542 | | | | 12,034,251 | | | | 0.28 | |
FNMA | | | 4.00 | | | | 12-1-2044 | | | | 12,945,627 | | | | 14,049,558 | | | | 0.32 | |
FNMA | | | 4.00 | | | | 6-1-2045 | | | | 13,076,370 | | | | 14,191,462 | | | | 0.33 | |
FNMA | | | 4.50 | | | | 2-1-2044 | | | | 14,393,935 | | | | 15,894,690 | | | | 0.37 | |
GNMA | | | 3.00-5.00 | | | | 3-15-2041 to 6-21-2046 | | | | 66,418,696 | | | | 71,336,967 | | | | 1.64 | |
GNMA | | | 3.00 | | | | 8-23-2046 | | | | 75,600,000 | | | | 77,918,180 | | | | 1.80 | |
GNMA %% | | | 3.50 | | | | 8-23-2046 | | | | 96,100,000 | | | | 101,149,046 | | | | 2.33 | |
GNMA %% | | | 4.00 | | | | 2-20-2046 | | | | 32,980,001 | | | | 35,208,766 | | | | 0.81 | |
Other securities | | | | | | | | | | | | | | | 14,591,330 | | | | 0.33 | |
| | | | | |
Total Agency Securities (Cost $1,319,170,583) | | | | | | | | | | | | | | | 1,325,492,614 | | | | 30.53 | |
| | | | | | | | | | | | | | | | | | | | |
| | | | | |
Asset-Backed Securities: 13.21% | | | | | | | | | | | | | | | | | | | | |
Ally Master Owner Trust Series 2012-5 Class A | | | 1.54 | | | | 9-15-2019 | | | | 13,065,000 | | | | 13,080,442 | | | | 0.30 | |
Capital Auto Receivables Asset Trust | | | 1.39-2.01 | | | | 2-20-2018 to 10-20-2020 | | | | 74,929,605 | | | | 75,085,096 | | | | 1.72 | |
Capital One Multi Asset Execution Trust 2016-A1 Class A1 ± | | | 0.90 | | | | 2-15-2022 | | | | 17,837,000 | | | | 17,898,939 | | | | 0.41 | |
Discover Card Execution Note Series 2016-A2 Class A2 ± | | | 0.97 | | | | 9-15-2021 | | | | 16,036,000 | | | | 16,130,398 | | | | 0.37 | |
Ford Credit Auto Owner Trust | | | 0.57-2.44 | | | | 10-15-2017 to 1-15-2027 | | | | 29,620,260 | | | | 29,897,230 | | | | 0.68 | |
Ford Credit Auto Owner Trust Series 2016-1 Class A | | | 2.31 | | | | 8-15-2027 | | | | 14,875,000 | | | | 15,006,009 | �� | | | 0.35 | |
SLM Student Loan Trust | | | 0.68-4.37 | | | | 4-25-2019 to 1-25-2072 | | | | 133,292,178 | | | | 128,674,193 | | | | 2.96 | |
SMB Private Education Loan Trust | | | 1.03-2.98 | | | | 7-15-2022 to 5-15-2031 | | | | 64,510,684 | | | | 64,383,276 | | | | 1.49 | |
Synchrony Credit Card Master Note Trust Series 2016-2 Class A | | | 2.21 | | | | 5-15-2024 | | | | 12,411,000 | | | | 12,410,516 | | | | 0.29 | |
Other securities | | | | | | | | | | | | | | | 201,066,440 | | | | 4.64 | |
| | | | | |
Total Asset-Backed Securities (Cost $575,588,312) | | | | | | | | | | | | | | | 573,632,539 | | | | 13.21 | |
| | | | | | | | | | | | | | | | | | | | |
The accompanying notes are an integral part of these financial statements.
| | | | |
| 84 | | Wells Fargo Allocation Funds | | Summary portfolio of investments—May 31, 2016 |
CORE BOND PORTFOLIO
| | | | | | | | | | | | | | | | | | | | |
| Security name | | Interest rate | | | Maturity date | | | Principal | | | Value | | | Percent of
net assets | |
| | | | | |
Corporate Bonds and Notes: 18.68% | | | | | | | | | | | | | | | | | | | | |
| | | | | |
Consumer Discretionary: 1.47% | | | | | | | | | | | | | | | | | | | | |
| | | | | |
| Automobiles: 0.39% | | | | | | | | | | | | | | | | | | | | |
Other securities | | | | | | | | | | | | | | $ | 16,790,759 | | | | 0.39 | % |
| | | | | | | | | | | | | | | | | | | | |
| | | | | |
| Hotels, Restaurants & Leisure: 0.21% | | | | | | | | | | | | | | | | | | | | |
Other securities | | | | | | | | | | | | | | | 9,333,120 | | | | 0.21 | |
| | | | | | | | | | | | | | | | | | | | |
| | | | | |
| Household Durables: 0.12% | | | | | | | | | | | | | | | | | | | | |
Other securities | | | | | | | | | | | | | | | 5,323,211 | | | | 0.12 | |
| | | | | | | | | | | | | | | | | | | | |
| | | | | |
| Media: 0.75% | | | | | | | | | | | | | | | | | | | | |
Other securities | | | | | | | | | | | | | | | 32,431,634 | | | | 0.75 | |
| | | | | | | | | | | | | | | | | | | | |
| | | | | |
Consumer Staples: 1.79% | | | | | | | | | | | | | | | | | | | | |
| | | | | |
| Beverages: 0.55% | | | | | | | | | | | | | | | | | | | | |
Anheuser-Busch InBev Finance Company | | | 3.65 | % | | | 2-1-2026 | | | $ | 11,459,000 | | | | 11,908,136 | | | | 0.27 | |
Other securities | | | | | | | | | | | | | | | 12,195,876 | | | | 0.28 | |
| | |
| | | | 24,104,012 | | | | 0.55 | |
| | | | | | | | | | | | | | | | | | | | |
| | | | | |
| Food & Staples Retailing: 0.22% | | | | | | | | | | | | | | | | | | | | |
Other securities | | | | | | | | | | | | | | | 9,490,939 | | | | 0.22 | |
| | | | | | | | | | | | | | | | | | | | |
| | | | | |
| Food Products: 0.64% | | | | | | | | | | | | | | | | | | | | |
Other securities | | | | | | | | | | | | | | | 27,665,603 | | | | 0.64 | |
| | | | | | | | | | | | | | | | | | | | |
| | | | | |
| Tobacco: 0.38% | | | | | | | | | | | | | | | | | | | | |
Other securities | | | | | | | | | | | | | | | 16,495,109 | | | | 0.38 | |
| | | | | | | | | | | | | | | | | | | | |
| | | | | |
Energy: 2.19% | | | | | | | | | | | | | | | | | | | | |
| | | | | |
| Energy Equipment & Services: 0.12% | | | | | | | | | | | | | | | | | | | | |
Other securities | | | | | | | | | | | | | | | 5,100,096 | | | | 0.12 | |
| | | | | | | | | | | | | | | | | | | | |
| | | | | |
| Oil, Gas & Consumable Fuels: 2.07% | | | | | | | | | | | | | | | | | | | | |
Other securities | | | | | | | | | | | | | | | 89,794,938 | | | | 2.07 | |
| | | | | | | | | | | | | | | | | | | | |
| | | | | |
Financials: 6.62% | | | | | | | | | | | | | | | | | | | | |
| | | | | |
| Banks: 1.96% | | | | | | | | | | | | | | | | | | | | |
Other securities | | | | | | | | | | | | | | | 84,870,363 | | | | 1.96 | |
| | | | | | | | | | | | | | | | | | | | |
| | | | | |
| Capital Markets: 1.47% | | | | | | | | | | | | | | | | | | | | |
Morgan Stanley | | | 4.00 | | | | 7-23-2025 | | | | 14,175,000 | | | | 14,883,509 | | | | 0.34 | |
Other securities | | | | | | | | | | | | | | | 48,796,760 | | | | 1.13 | |
| | |
| | | | 63,680,269 | | | | 1.47 | |
| | | | | | | | | | | | | | | | | | | | |
| | | | | |
| Consumer Finance: 1.26% | | | | | | | | | | | | | | | | | | | | |
Other securities | | | | | | | | | | | | | | | 54,689,470 | | | | 1.26 | |
| | | | | | | | | | | | | | | | | | | | |
| | | | | |
| Diversified Financial Services: 0.41% | | | | | | | | | | | | | | | | | | | | |
Other securities | | | | | | | | | | | | | | | 18,004,368 | | | | 0.41 | |
| | | | | | | | | | | | | | | | | | | | |
The accompanying notes are an integral part of these financial statements.
| | | | | | |
| Summary portfolio of investments—May 31, 2016 | | Wells Fargo Allocation Funds | | | 85 | |
CORE BOND PORTFOLIO
| | | | | | | | | | | | | | | | | | | | |
| Security name | | | | | | | | | | | Value | | | Percent of
net assets | |
| | | | | |
| Insurance: 0.56% | | | | | | | | | | | | | | | | | | | | |
Other securities | | | | | | | | | | | | | | $ | 24,416,968 | | | | 0.56 | % |
| | | | | | | | | | | | | | | | | | | | |
| | | | | |
| IT Services: 0.08% | | | | | | | | | | | | | | | | | | | | |
Other securities | | | | | | | | | | | | | | | 3,627,502 | | | | 0.08 | |
| | | | | | | | | | | | | | | | | | | | |
| | | | | |
| REITs: 0.81% | | | | | | | | | | | | | | | | | | | | |
Other securities | | | | | | | | | | | | | | | 34,986,918 | | | | 0.81 | |
| | | | | | | | | | | | | | | | | | | | |
| | | | | |
Health Care: 1.26% | | | | | | | | | | | | | | | | | | | | |
| | | | | |
| Biotechnology: 0.62% | | | | | | | | | | | | | | | | | | | | |
Other securities | | | | | | | | | | | | | | | 27,065,449 | | | | 0.62 | |
| | | | | | | | | | | | | | | | | | | | |
| | | | | |
| Health Care Providers & Services: 0.24% | | | | | | | | | | | | | | | | | | | | |
Other securities | | | | | | | | | | | | | | | 10,330,033 | | | | 0.24 | |
| | | | | | | | | | | | | | | | | | | | |
| | | | | |
| Pharmaceuticals: 0.40% | | | | | | | | | | | | | | | | | | | | |
Other securities | | | | | | | | | | | | | | | 17,152,759 | | | | 0.40 | |
| | | | | | | | | | | | | | | | | | | | |
| | | | | |
Industrials: 0.90% | | | | | | | | | | | | | | | | | | | | |
| | | | | |
| Aerospace & Defense: 0.39% | | | | | | | | | | | | | | | | | | | | |
Other securities | | | | | | | | | | | | | | | 16,878,061 | | | | 0.39 | |
| | | | | | | | | | | | | | | | | | | | |
| | | | | |
| Air Freight & Logistics: 0.07% | | | | | | | | | | | | | | | | | | | | |
Other securities | | | | | | | | | | | | | | | 3,042,489 | | | | 0.07 | |
| | | | | | | | | | | | | | | | | | | | |
| | | | | |
| Construction & Engineering: 0.05% | | | | | | | | | | | | | | | | | | | | |
Other securities | | | | | | | | | | | | | | | 2,051,187 | | | | 0.05 | |
| | | | | | | | | | | | | | | | | | | | |
| | | | | |
| Road & Rail: 0.33% | | | | | | | | | | | | | | | | | | | | |
Other securities | | | | | | | | | | | | | | | 14,331,886 | | | | 0.33 | |
| | | | | | | | | | | | | | | | | | | | |
| | | | | |
| Transportation Infrastructure: 0.06% | | | | | | | | | | | | | | | | | | | | |
Other securities | | | | | | | | | | | | | | | 2,872,293 | | | | 0.06 | |
| | | | | | | | | | | | | | | | | | | | |
| | | | | |
Information Technology: 1.12% | | | | | | | | | | | | | | | | | | | | |
| | | | | |
| IT Services: 0.39% | | | | | | | | | | | | | | | | | | | | |
Other securities | | | | | | | | | | | | | | | 17,009,696 | | | | 0.39 | |
| | | | | | | | | | | | | | | | | | | | |
| | | | | |
| Semiconductors & Semiconductor Equipment: 0.19% | | | | | | | | | | | | | | | | | | | | |
Other securities | | | | | | | | | | | | | | | 8,081,238 | | | | 0.19 | |
| | | | | | | | | | | | | | | | | | | | |
| | | | | |
| Technology Hardware, Storage & Peripherals: 0.54% | | | | | | | | | | | | | | | | | | | | |
Other securities | | | | | | | | | | | | | | | 23,380,313 | | | | 0.54 | |
| | | | | | | | | | | | | | | | | | | | |
| | | | | |
Materials: 0.24% | | | | | | | | | | | | | | | | | | | | |
| | | | | |
| Chemicals: 0.08% | | | | | | | | | | | | | | | | | | | | |
Other securities | | | | | | | | | | | | | | | 3,409,272 | | | | 0.08 | |
| | | | | | | | | | | | | | | | | | | | |
| | | | | |
| Containers & Packaging: 0.09% | | | | | | | | | | | | | | | | | | | | |
Other securities | | | | | | | | | | | | | | | 3,845,910 | | | | 0.09 | |
| | | | | | | | | | | | | | | | | | | | |
The accompanying notes are an integral part of these financial statements.
| | | | |
| 86 | | Wells Fargo Allocation Funds | | Summary portfolio of investments—May 31, 2016 |
CORE BOND PORTFOLIO
| | | | | | | | | | | | | | | | | | | | |
| Security name | | Interest rate | | | Maturity date | | | Principal | | | Value | | | Percent of
net assets | |
| | | | | |
| Metals & Mining: 0.07% | | | | | | | | | | | | | | | | | | | | |
Other securities | | | | | | | | | | | | | | $ | 3,177,317 | | | | 0.07 | % |
| | | | | | | | | | | | | | | | | | | | |
| | | | | |
Telecommunication Services: 1.57% | | | | | | | | | | | | | | | | | | | | |
| | | | | |
| Diversified Telecommunication Services: 1.57% | | | | | | | | | | | | | | | | | | | | |
AT&T Incorporated | | | 2.80-4.80 | % | | | 2-17-2021 to 6-15-2044 | | | $ | 48,304,000 | | | | 49,578,672 | | | | 1.14 | |
Other securities | | | | | | | | | | | | | | | 18,544,041 | | | | 0.43 | |
| | | | | |
| | | | | | | | | | | | | | | 68,122,713 | | | | 1.57 | |
| | | | | | | | | | | | | | | | | | | | |
| | | | | |
Utilities: 1.59% | | | | | | | | | | | | | | | | | | | | |
| | | | | |
| Electric Utilities: 1.03% | | | | | | | | | | | | | | | | | | | | |
Other securities | | | | | | | | | | | | | | | 44,726,698 | | | | 1.03 | |
| | | | | | | | | | | | | | | | | | | | |
| | | | | |
| Gas Utilities: 0.11% | | | | | | | | | | | | | | | | | | | | |
Other securities | | | | | | | | | | | | | | | 4,745,775 | | | | 0.11 | |
| | | | | | | | | | | | | | | | | | | | |
| | | | | |
| Multi-Utilities: 0.45% | | | | | | | | | | | | | | | | | | | | |
Other securities | | | | | | | | | | | | | | | 19,639,222 | | | | 0.45 | |
| | | | | | | | | | | | | | | | | | | | |
| | | | | |
Total Corporate Bonds and Notes (Cost $793,938,757) | | | | | | | | | | | | | | | 810,667,590 | | | | 18.68 | |
| | | | | | | | | | | | | | | | | | | | |
| | | | | |
Municipal Obligations: 0.92% | | | | | | | | | | | | | | | | | | | | |
| | | | | |
| California: 0.27% | | | | | | | | | | | | | | | | | | | | |
Other securities | | | | | | | | | | | | | | | 11,581,748 | | | | 0.27 | |
| | | | | | | | | | | | | | | | | | | | |
| | | | | |
| Nevada: 0.19% | | | | | | | | | | | | | | | | | | | | |
Other securities | | | | | | | | | | | | | | | 8,326,483 | | | | 0.19 | |
| | | | | | | | | | | | | | | | | | | | |
| | | | | |
| New Jersey: 0.16% | | | | | | | | | | | | | | | | | | | | |
Other securities | | | | | | | | | | | | | | | 6,984,507 | | | | 0.16 | |
| | | | | | | | | | | | | | | | | | | | |
| | | | | |
| New York: 0.12% | | | | | | | | | | | | | | | | | | | | |
Other securities | | | | | | | | | | | | | | | 5,337,684 | | | | 0.12 | |
| | | | | | | | | | | | | | | | | | | | |
| | | | | |
| Ohio: 0.03% | | | | | | | | | | | | | | | | | | | | |
Other securities | | | | | | | | | | | | | | | 1,465,329 | | | | 0.03 | |
| | | | | | | | | | | | | | | | | | | | |
| | | | | |
| Texas: 0.15% | | | | | | | | | | | | | | | | | | | | |
Other securities | | | | | | | | | | | | | | | 6,258,708 | | | | 0.15 | |
| | | | | | | | | | | | | | | | | | | | |
| | | | | |
Total Municipal Obligations (Cost $32,423,389) | | | | | | | | | | | | | | | 39,954,459 | | | | 0.92 | |
| | | | | | | | | | | | | | | | | | | | |
| | | | | |
Non-Agency Mortgage-Backed Securities: 3.10% | | | | | | | | | | | | | | | | | | | | |
Other securities | | | | | | | | | | | | | | | 134,383,718 | | | | 3.10 | |
| | | | | |
Total Non-Agency Mortgage-Backed Securities (Cost $131,754,696) | | | | | | | | | | | | | | | 134,383,718 | | | | 3.10 | |
| | | | | | | | | | | | | | | | | | | | |
The accompanying notes are an integral part of these financial statements.
| | | | | | |
| Summary portfolio of investments—May 31, 2016 | | Wells Fargo Allocation Funds | | | 87 | |
CORE BOND PORTFOLIO
| | | | | | | | | | | | | | | | | | | | |
| Security name | | Interest rate | | | Maturity date | | | Principal | | | Value | | | Percent of
net assets | |
| | | | | |
U.S. Treasury Securities: 30.51% | | | | | | | | | | | | | | | | | | | | |
U.S. Treasury Bond | | | 2.50 | % | | | 2-15-2046 | | | $ | 97,270,000 | | | $ | 94,348,106 | | | | 2.17 | % |
U.S. Treasury Bond | | | 2.50 | | | | 5-15-2046 | | | | 21,802,000 | | | | 21,169,241 | | | | 0.49 | |
U.S. Treasury Bond ## | | | 2.88 | | | | 8-15-2045 | | | | 28,446,000 | | | | 29,807,198 | | | | 0.69 | |
U.S. Treasury Note | | | 0.75 | | | | 1-31-2018 | | | | 117,195,000 | | | | 116,984,401 | | | | 2.69 | |
U.S. Treasury Note | | | 0.75 | | | | 4-30-2018 | | | | 37,441,000 | | | | 37,348,858 | | | | 0.86 | |
U.S. Treasury Note | | | 0.88 | | | | 11-30-2017 | | | | 17,550,000 | | | | 17,562,338 | | | | 0.40 | |
U.S. Treasury Note | | | 0.88 | | | | 3-31-2018 | | | | 145,749,000 | | | | 145,737,632 | | | | 3.36 | |
U.S. Treasury Note | | | 0.88 | | | | 5-31-2018 | | | | 31,597,000 | | | | 31,590,839 | | | | 0.73 | |
U.S. Treasury Note | | | 0.88 | | | | 4-15-2019 | | | | 156,804,000 | | | | 156,130,213 | | | | 3.60 | |
U.S. Treasury Note ## | | | 0.88 | | | | 5-15-2019 | | | | 162,591,000 | | | | 161,828,773 | | | | 3.73 | |
U.S. Treasury Note | | | 1.00 | | | | 5-15-2018 | | | | 31,525,000 | | | | 31,587,798 | | | | 0.73 | |
U.S. Treasury Note | | | 1.25 | | | | 3-31-2021 | | | | 24,971,000 | | | | 24,820,774 | | | | 0.57 | |
U.S. Treasury Note | | | 1.38 | | | | 1-31-2021 | | | | 208,632,000 | | | | 208,697,093 | | | | 4.81 | |
U.S. Treasury Note | | | 1.38 | | | | 5-31-2021 | | | | 108,284,000 | | | | 108,300,892 | | | | 2.49 | |
U.S. Treasury Note | | | 1.63 | | | | 11-30-2020 | | | | 63,040,000 | | | | 63,830,459 | | | | 1.47 | |
U.S. Treasury Note | | | 1.63 | | | | 5-31-2023 | | | | 16,178,000 | | | | 16,107,221 | | | | 0.37 | |
U.S. Treasury Note | | | 1.63 | | | | 2-15-2026 | | | | 29,111,000 | | | | 28,513,992 | | | | 0.66 | |
U.S. Treasury Note | | | 1.63 | | | | 5-15-2026 | | | | 30,682,000 | | | | 30,074,343 | | | | 0.69 | |
| | |
Total U.S. Treasury Securities (Cost $1,322,216,760) | | | | 1,324,440,171 | | | | 30.51 | |
| | | | | | | | | | | | | | | | | | | | |
| | | | | |
Yankee Corporate Bonds and Notes: 5.22% | | | | | | | | | | | | | | | | | | | | |
| | | | | |
Consumer Discretionary: 0.20% | | | | | | | | | | | | | | | | | | | | |
| | | | | |
| Media: 0.20% | | | | | | | | | | | | | | | | | | | | |
Other securities | | | | | | | | | | | | | | | 8,574,676 | | | | 0.20 | |
| | | | | | | | | | | | | | | | | | | | |
| | | | | |
Energy: 0.68% | | | | | | | | | | | | | | | | | | | | |
| | | | | |
| Oil, Gas & Consumable Fuels: 0.68% | | | | | | | | | | | | | | | | | | | | |
Other securities | | | | | | | | | | | | | | | 29,720,643 | | | | 0.68 | |
| | | | | | | | | | | | | | | | | | | | |
| | | | | |
Financials: 3.25% | | | | | | | | | | | | | | | | | | | | |
| | | | | |
| Banks: 2.62% | | | | | | | | | | | | | | | | | | | | |
Other securities | | | | | | | | | | | | | | | 113,661,490 | | | | 2.62 | |
| | | | | | | | | | | | | | | | | | | | |
| | | | | |
| Consumer Finance: 0.14% | | | | | | | | | | | | | | | | | | | | |
Other securities | | | | | | | | | | | | | | | 6,064,000 | | | | 0.14 | |
| | | | | | | | | | | | | | | | | | | | |
| | | | | |
| Diversified Financial Services: 0.35% | | | | | | | | | | | | | | | | | | | | |
Other securities | | | | | | | | | | | | | | | 15,352,266 | | | | 0.35 | |
| | | | | | | | | | | | | | | | | | | | |
| | | | | |
| Insurance: 0.14% | | | | | | | | | | | | | | | | | | | | |
Other securities | | | | | | | | | | | | | | | 6,005,914 | | | | 0.14 | |
| | | | | | | | | | | | | | | | | | | | |
| | | | | |
Health Care: 0.66% | | | | | | | | | | | | | | | | | | | | |
| | | | | |
| Pharmaceuticals: 0.66% | | | | | | | | | | | | | | | | | | | | |
Other securities | | | | | | | | | | | | | | | 28,544,631 | | | | 0.66 | |
| | | | | | | | | | | | | | | | | | | | |
| | | | | |
Industrials: 0.07% | | | | | | | | | | | | | | | | | | | | |
| | | | | |
| Marine: 0.07% | | | | | | | | | | | | | | | | | | | | |
Other securities | | | | | | | | | | | | | | | 3,165,798 | | | | 0.07 | |
| | | | | | | | | | | | | | | | | | | | |
The accompanying notes are an integral part of these financial statements.
| | | | |
| 88 | | Wells Fargo Allocation Funds | | Summary portfolio of investments—May 31, 2016 |
CORE BOND PORTFOLIO
| | | | | | | | | | | | | | | | | | | | |
| Security name | | | | | | | | | | | Value | | | Percent of
net assets | |
| | | | | |
Information Technology: 0.09% | | | | | | | | | | | | | | | | | | | | |
| | | | | |
| Internet Software & Services: 0.09% | | | | | | | | | | | | | | | | | | | | |
Other securities | | | | | | | | | | | | | | $ | 3,939,050 | | | | 0.09 | % |
| | | | | | | | | | | | | | | | | | | | |
| | | | | |
Materials: 0.19% | | | | | | | | | | | | | | | | | | | | |
| | | | | |
| Chemicals: 0.04% | | | | | | | | | | | | | | | | | | | | |
Other securities | | | | | | | | | | | | | | | 1,713,181 | | | | 0.04 | |
| | | | | | | | | | | | | | | | | | | | |
| | | | | |
| Metals & Mining: 0.15% | | | | | | | | | | | | | | | | | | | | |
Other securities | | | | | | | | | | | | | | | 6,378,982 | | | | 0.15 | |
| | | | | | | | | | | | | | | | | | | | |
| | | | | |
Utilities: 0.08% | | | | | | | | | | | | | | | | | | | | |
| | | | | |
| Electric Utilities: 0.08% | | | | | | | | | | | | | | | | | | | | |
Other securities | | | | | | | | | | | | | | | 3,426,208 | | | | 0.08 | |
| | | | | | | | | | | | | | | | | | | | |
| | |
Total Yankee Corporate Bonds and Notes (Cost $224,850,713) | | | | 226,546,839 | | | | 5.22 | |
| | | | | | | | | | | | | | | | | | | | |
| | | | | |
Yankee Government Bonds: 2.19% | | | | | | | | | | | | | | | | | | | | |
Other securities | | | | | | | | | | | | | | | 95,050,298 | | | | 2.19 | |
| | | | | | | | | | | | | | | | | | | | |
| | |
Total Yankee Government Bonds (Cost $93,245,320) | | | | 95,050,298 | | | | 2.19 | |
| | | | | | | | | | | | | | | | | | | | |
| | | | | |
| | | Yield | | | | | | Shares | | | | | | | |
| Short-Term Investments: 4.57% | | | | | | | | | | | | | | | | | | | | |
| | | | | |
| Investment Companies: 4.57% | | | | | | | | | | | | | | | | | | | | |
Wells Fargo Cash Investment Money Market Fund Select Class (l)(u)## | | | 0.41 | % | | | | | | | 198,368,365 | | | | 198,368,365 | | | | 4.57 | |
| | | | | | | | | | | | | | | | | | | | |
| | |
Total Short-Term Investments (Cost $198,368,365) | | | | 198,368,365 | | | | 4.57 | |
| | | | | | | | | | | | | | | | | | | | |
| | | | | |
| Total investments in securities (Cost $4,691,556,895) * | | | | | | | | | | | | | | | 4,728,536,593 | | | | 108.93 | |
Other assets and liabilities, net | | | | | | | | | | | | | | | (387,701,535 | ) | | | (8.93 | ) |
| | | | | | | | | | | | | | | | | | | | |
| Total net assets | | | | | | | | | | | | | | $ | 4,340,835,058 | | | | 100.00 | % |
| | | | | | | | | | | | | | | | | | | | |
| %% | The security is issued on a when-issued basis. |
| ± | Variable rate investment. The rate shown is the rate in effect at period end. |
| ## | All or a portion of this security is segregated for when-issued securities. |
| (l) | The issuer of the security is an affiliated person of the Portfolio as defined in the Investment Company Act of 1940. |
| (u) | The rate represents the 7-day annualized yield at period end. |
| * | Cost for federal income tax purposes is $4,697,050,907 and unrealized gains (losses) consists of: |
| | | | |
Gross unrealized gains | | $ | 47,813,964 | |
Gross unrealized losses | | | (16,328,278 | ) |
| | | | |
Net unrealized gains | | $ | 31,485,686 | |
The accompanying notes are an integral part of these financial statements.
| | | | | | |
| Portfolio of investments—May 31, 2016 | | Wells Fargo Allocation Funds | | | 89 | |
MANAGED FIXED INCOME PORTFOLIO
| | | | | | | | | | | | | | | | |
| Security name | | Interest rate | | | Maturity date | | | Principal | | | Value | |
| | | |
Agency Securities: 29.90% | | | | | | | | | | | | | |
FHLMC | | | 3.50 | % | | | 9-1-2032 | | | $ | 1,018,735 | | | $ | 1,080,181 | |
FHLMC | | | 3.50 | | | | 4-1-2043 | | | | 1,675,535 | | | | 1,756,016 | |
FHLMC | | | 3.50 | | | | 5-1-2044 | | | | 733,840 | | | | 773,306 | |
FHLMC | | | 4.00 | | | | 4-1-2044 | | | | 918,722 | | | | 994,735 | |
FHLMC | | | 4.00 | | | | 8-1-2044 | | | | 685,596 | | | | 739,389 | |
FHLMC Structured Pass-Through Securities Series T-20 Class A6 | | | 7.50 | | | | 9-25-2029 | | | | 62,952 | | | | 66,223 | |
FHLMC Structured Pass-Through Securities Series T-58 Class 4A | | | 7.50 | | | | 9-25-2043 | | | | 1,097,153 | | | | 1,313,351 | |
FNMA (a) | | | 2.51 | | | | 6-1-2046 | | | | 970,000 | | | | 990,613 | |
FNMA | | | 2.57 | | | | 9-1-2019 | | | | 527,552 | | | | 542,398 | |
FNMA | | | 2.57 | | | | 9-1-2019 | | | | 528,178 | | | | 543,047 | |
FNMA | | | 2.73 | | | | 1-1-2023 | | | | 576,575 | | | | 600,989 | |
FNMA | | | 2.73 | | | | 9-1-2023 | | | | 592,853 | | | | 613,965 | |
FNMA | | | 2.76 | | | | 4-1-2021 | | | | 1,089,536 | | | | 1,119,279 | |
FNMA | | | 2.78 | | | | 10-1-2020 | | | | 550,000 | | | | 573,434 | |
FNMA | | | 2.85 | | | | 12-1-2023 | | | | 590,000 | | | | 617,089 | |
FNMA | | | 2.90 | | | | 3-1-2023 | | | | 597,093 | | | | 624,283 | |
FNMA | | | 2.96 | | | | 6-1-2022 | | | | 520,055 | | | | 537,600 | |
FNMA | | | 3.00 | | | | 12-1-2032 | | | | 69,259 | | | | 72,061 | |
FNMA | | | 3.03 | | | | 11-1-2022 | | | | 584,797 | | | | 605,990 | |
FNMA | | | 3.07 | | | | 2-1-2026 | | | | 360,000 | | | | 380,105 | |
FNMA | | | 3.08 | | | | 1-1-2026 | | | | 480,000 | | | | 507,203 | |
FNMA | | | 3.31 | | | | 6-1-2021 | | | | 550,000 | | | | 582,339 | |
FNMA | | | 3.35 | | | | 1-1-2028 | | | | 280,000 | | | | 300,896 | |
FNMA | | | 3.50 | | | | 9-1-2032 | | | | 1,903,311 | | | | 2,009,525 | |
FNMA | | | 3.50 | | | | 10-1-2032 | | | | 978,186 | | | | 1,033,205 | |
FNMA | | | 3.50 | | | | 11-1-2042 | | | | 366,320 | | | | 385,950 | |
FNMA | | | 3.50 | | | | 11-1-2042 | | | | 520,012 | | | | 545,028 | |
FNMA | | | 3.50 | | | | 2-1-2043 | | | | 279,679 | | | | 293,167 | |
FNMA | | | 3.50 | | | | 4-1-2046 | | | | 298,196 | | | | 313,397 | |
FNMA | | | 3.50 | | | | 6-13-2046 | | | | 600,000 | | | | 627,844 | |
FNMA | | | 5.00 | | | | 9-1-2033 | | | | 254,910 | | | | 284,122 | |
FNMA | | | 5.50 | | | | 2-1-2036 | | | | 372,350 | | | | 399,641 | |
FNMA Series 2002-90 Class A2 | | | 6.50 | | | | 11-25-2042 | | | | 426,765 | | | | 481,129 | |
FNMA Series 2002-T4 Class A2 | | | 7.00 | | | | 12-25-2041 | | | | 211,895 | | | | 245,043 | |
FNMA Series 2002-W4 Class A4 | | | 6.25 | | | | 5-25-2042 | | | | 1,938,171 | | | | 2,239,254 | |
FNMA Series 2003-86 Class PT | | | 4.50 | | | | 9-25-2018 | | | | 200,315 | | | | 205,393 | |
FNMA Series 2003-W4 Class 3A ± | | | 6.44 | | | | 10-25-2042 | | | | 283,801 | | | | 325,113 | |
FNMA Series 2004-T2 Class 1A1 | | | 6.00 | | | | 11-25-2043 | | | | 845,834 | | | | 951,227 | |
FNMA Series 2004-T3 Class A1 | | | 6.00 | | | | 2-25-2044 | | | | 1,171,703 | | | | 1,341,595 | |
FNMA Series 2004-W1 Class 2A2 | | | 7.00 | | | | 12-25-2033 | | | | 192,648 | | | | 227,746 | |
FNMA Series 2004-W11 Class 1A3 | | | 7.00 | | | | 5-25-2044 | | | | 1,119,584 | | | | 1,334,622 | |
FNMA Series 2004-W8 Class 3A | | | 7.50 | | | | 6-25-2044 | | | | 399,053 | | | | 470,784 | |
FNMA Series 2006-M2 Class A2F ± | | | 5.26 | | | | 5-25-2020 | | | | 357,573 | | | | 364,614 | |
GNMA | | | 6.50 | | | | 10-15-2023 | | | | 28,269 | | | | 32,327 | |
GNMA | | | 6.50 | | | | 11-15-2023 | | | | 14,333 | | | | 16,390 | |
GNMA | | | 6.50 | | | | 11-15-2023 | | | | 4,468 | | | | 5,110 | |
GNMA | | | 6.50 | | | | 12-15-2023 | | | | 20,562 | | | | 23,514 | |
GNMA | | | 6.50 | | | | 1-15-2024 | | | | 36,252 | | | | 41,455 | |
GNMA | | | 7.00 | | | | 8-15-2027 | | | | 93,434 | | | | 105,994 | |
SBA Series 2006-20B Class 1 | | | 5.35 | | | | 2-1-2026 | | | | 521,008 | | | | 569,771 | |
The accompanying notes are an integral part of these financial statements.
| | | | |
| 90 | | Wells Fargo Allocation Funds | | Portfolio of investments—May 31, 2016 |
MANAGED FIXED INCOME PORTFOLIO
| | | | | | | | | | | | | | | | |
| Security name | | Interest rate | | | Maturity date | | | Principal | | | Value | |
| | | |
Agency Securities (continued) | | | | | | | | | | | | | |
SBA Series 2006-20H Class 1 | | | 5.70 | % | | | 8-1-2026 | | | $ | 292,209 | | | $ | 326,111 | |
SBA Series 2007-20J Class 1 | | | 5.57 | | | | 10-1-2027 | | | | 655,212 | | | | 736,858 | |
SBA Series 2013-20A Class 1 | | | 2.13 | | | | 1-1-2033 | | | | 493,211 | | | | 494,705 | |
SBA Series 2013-20J Class 1 | | | 3.37 | | | | 10-1-2033 | | | | 509,200 | | | | 539,974 | |
SBA Series 2014-10A Class 1 | | | 3.19 | | | | 3-10-2024 | | | | 715,531 | | | | 749,564 | |
SBA Series 2014-10B Class 1 | | | 3.02 | | | | 9-10-2024 | | | | 1,098,138 | | | | 1,143,815 | |
SBA Series 2014-20A Class 1 | | | 3.46 | | | | 1-1-2034 | | | | 426,894 | | | | 456,198 | |
SBA Series 2015-10B Class 1 | | | 2.83 | | | | 9-10-2025 | | | | 587,526 | | | | 602,108 | |
SBA Series 2015-20C Class 1 | | | 2.72 | | | | 3-1-2035 | | | | 550,231 | | | | 565,279 | |
SBA Series 2015-20E Class 1 | | | 2.77 | | | | 5-1-2035 | | | | 857,586 | | | | 871,792 | |
SBA Series 2015-20F Class 1 | | | 2.98 | | | | 6-1-2035 | | | | 587,138 | | | | 611,515 | |
| | | |
Total Agency Securities (Cost $36,336,997) | | | | | | | | | | | | 37,905,371 | |
| | | | | | | | | | | | | | | | |
| | | |
Asset-Backed Securities: 4.20% | | | | | | | | | | | | | |
American Express Credit Accounts Series 2014-2 Class A | | | 1.26 | | | | 1-15-2020 | | | | 570,000 | | | | 571,433 | |
Barclays Dryrock Issuance Trust Series 2014-3 Class A | | | 2.41 | | | | 7-15-2022 | | | | 570,000 | | | | 581,957 | |
Capital Auto Receivables Asset Trust Series 2014-2 Class A3 | | | 1.26 | | | | 5-21-2018 | | | | 446,305 | | | | 446,435 | |
Capital Auto Receivables Asset Trust Series 2014-3 Class A3 | | | 1.48 | | | | 11-20-2018 | | | | 570,000 | | | | 570,435 | |
CNH Equipment Trust Series 2014-A Class A3 | | | 0.84 | | | | 5-15-2019 | | | | 302,612 | | | | 302,196 | |
CNH Equipment Trust Series 2015-A Class A4 | | | 1.85 | | | | 4-15-2021 | | | | 580,000 | | | | 583,942 | |
Ford Credit Auto Owner Trust Series 2015-2 Class A 144A | | | 2.44 | | | | 1-15-2027 | | | | 600,000 | | | | 610,125 | |
Ford Credit Auto Owner Trust Series 2016-1 Class A 144A | | | 2.31 | | | | 8-15-2027 | | | | 600,000 | | | | 606,352 | |
Green Tree Financial Corporation Series 1997-7 Class A8 ± | | | 6.86 | | | | 7-15-2028 | | | | 5,106 | | | | 5,118 | |
Mississippi Higher Education Assistance Corporation Series 2014-1 Class A1 ± | | | 1.12 | | | | 10-25-2035 | | | | 579,890 | | | | 568,792 | |
South Carolina Student Loan Corporation Series 2014-1 Class B ± | | | 1.94 | | | | 8-1-2035 | | | | 500,000 | | | | 479,196 | |
| | | |
Total Asset-Backed Securities (Cost $5,305,821) | | | | | | | | | | | | 5,325,981 | |
| | | | | | | | | | | | | | | | |
| | | | |
Corporate Bonds and Notes: 32.44% | | | | | | | | | | | | | | | | |
| | | | |
Consumer Discretionary: 3.48% | | | | | | | | | | | | | | | | |
| | | | |
| Automobiles: 0.34% | | | | | | | | | | | | | | | | |
General Motors Company | | | 4.88 | | | | 10-2-2023 | | | | 400,000 | | | | 424,735 | |
| | | | | | | | | | | | | | | | |
| | | | |
| Diversified Consumer Services: 1.92% | | | | | | | | | | | | | | | | |
Massachusetts Institute of Technology | | | 3.96 | | | | 7-1-2038 | | | | 200,000 | | | | 219,073 | |
Massachusetts Institute of Technology | | | 7.25 | | | | 11-2-2096 | | | | 500,000 | | | | 816,839 | |
Northwestern University | | | 4.64 | | | | 12-1-2044 | | | | 350,000 | | | | 422,900 | |
President and Fellows of Harvard College | | | 3.53 | | | | 10-1-2031 | | | | 250,000 | | | | 260,122 | |
President and Fellows of Harvard College | | | 5.63 | | | | 10-1-2038 | | | | 250,000 | | | | 339,070 | |
Service Corporation International | | | 5.38 | | | | 1-15-2022 | | | | 360,000 | | | | 375,750 | |
| | | | |
| | | | | | | | | | | | | | | 2,433,754 | |
| | | | | | | | | | | | | | | | |
| | | | |
| Media: 0.86% | | | | | | | | | | | | | | | | |
Charter Communications 144A | | | 4.91 | | | | 7-23-2025 | | | | 325,000 | | | | 348,275 | |
Lamar Media Corporation | | | 5.88 | | | | 2-1-2022 | | | | 315,000 | | | | 329,175 | |
Time Warner Incorporated | | | 3.40 | | | | 6-15-2022 | | | | 140,000 | | | | 145,050 | |
Time Warner Incorporated | | | 3.60 | | | | 7-15-2025 | | | | 260,000 | | | | 269,662 | |
| | | | |
| | | | | | | | | | | | | | | 1,092,162 | |
| | | | | | | | | | | | | | | | |
The accompanying notes are an integral part of these financial statements.
| | | | | | |
| Portfolio of investments—May 31, 2016 | | Wells Fargo Allocation Funds | | | 91 | |
MANAGED FIXED INCOME PORTFOLIO
| | | | | | | | | | | | | | | | |
| Security name | | Interest rate | | | Maturity date | | | Principal | | | Value | |
| | | | |
| Textiles, Apparel & Luxury Goods: 0.36% | | | | | | | | | | | | | | | | |
Hanesbrands Incorporated 144A | | | 4.63 | % | | | 5-15-2024 | | | $ | 200,000 | | | $ | 200,000 | |
The William Carter Company | | | 5.25 | | | | 8-15-2021 | | | | 250,000 | | | | 258,750 | |
| | | | |
| | | | | | | | | | | | | | | 458,750 | |
| | | | | | | | | | | | | | | | |
| | | | |
Consumer Staples: 1.08% | | | | | | | | | | | | | | | | |
| | | | |
| Beverages: 0.11% | | | | | | | | | | | | | | | | |
Anheuser-Busch InBev Worldwide Incorporated | | | 3.65 | | | | 2-1-2026 | | | | 140,000 | | | | 145,487 | |
| | | | | | | | | | | | | | | | |
| | | | |
| Food & Staples Retailing: 0.52% | | | | | | | | | | | | | | | | |
CVS Health Corporation | | | 3.50 | | | | 7-20-2022 | | | | 120,000 | | | | 126,610 | |
SABMiller Holdings Incorporated 144A | | | 3.75 | | | | 1-15-2022 | | | | 500,000 | | | | 528,513 | |
| | | | |
| | | | | | | | | | | | | | | 655,123 | |
| | | | | | | | | | | | | | | | |
| | | | |
| Food Products: 0.25% | | | | | | | | | | | | | | | | |
Kraft Foods Group Incorporated | | | 3.50 | | | | 6-6-2022 | | | | 300,000 | | | | 313,036 | |
| | | | | | | | | | | | | | | | |
| | | | |
| Household Products: 0.20% | | | | | | | | | | | | | | | | |
The Procter & Gamble Company | | | 5.50 | | | | 2-1-2034 | | | | 200,000 | | | | 258,969 | |
| | | | | | | | | | | | | | | | |
| | | | |
Energy: 3.85% | | | | | | | | | | | | | | | | |
| | | | |
| Energy Equipment & Services: 0.13% | | | | | | | | | | | | | | | | |
Halliburton Company | | | 3.80 | | | | 11-15-2025 | | | | 160,000 | | | | 161,815 | |
| | | | | | | | | | | | | | | | |
| | | | |
| Oil, Gas & Consumable Fuels: 3.72% | | | | | | | | | | | | | | | | |
Anadarko Petroleum Corporation | | | 5.55 | | | | 3-15-2026 | | | | 150,000 | | | | 159,885 | |
Chevron Corporation | | | 2.95 | | | | 5-16-2026 | | | | 250,000 | | | | 250,873 | |
Chevron Corporation | | | 3.19 | | | | 6-24-2023 | | | | 250,000 | | | | 259,742 | |
Cimarex Energy Company | | | 5.88 | | | | 5-1-2022 | | | | 350,000 | | | | 366,710 | |
Columbia Pipeline Group Company | | | 2.45 | | | | 6-1-2018 | | | | 210,000 | | | | 209,633 | |
Concho Resources Incorporated | | | 6.50 | | | | 1-15-2022 | | | | 375,000 | | | | 387,188 | |
ConocoPhillips Company | | | 3.35 | | | | 11-15-2024 | | | | 370,000 | | | | 371,825 | |
Devon Energy Corporation | | | 5.85 | | | | 12-15-2025 | | | | 130,000 | | | | 135,312 | |
EQT Corporation | | | 8.13 | | | | 6-1-2019 | | | | 400,000 | | | | 436,492 | |
Exxon Mobil Corporation | | | 3.04 | | | | 3-1-2026 | | | | 390,000 | | | | 400,993 | |
Florida Gas Transmission Company 144A | | | 4.35 | | | | 7-15-2025 | | | | 230,000 | | | | 222,255 | |
Magellan Midstream Partners LP | | | 5.00 | | | | 3-1-2026 | | | | 170,000 | | | | 186,940 | |
Marathon Oil Corporation | | | 3.85 | | | | 6-1-2025 | | | | 410,000 | | | | 358,910 | |
Newfield Exploration Company | | | 5.63 | | | | 7-1-2024 | | | | 249,000 | | | | 247,755 | |
Pioneer Natural Resource Company | | | 4.45 | | | | 1-15-2026 | | | | 190,000 | | | | 200,591 | |
Plains All American Pipeline LP | | | 4.65 | | | | 10-15-2025 | | | | 400,000 | | | | 379,595 | |
Southwestern Energy Company | | | 4.95 | | | | 1-23-2025 | | | | 175,000 | | | | 146,563 | |
| | | | |
| | | | | | | | | | | | | | | 4,721,262 | |
| | | | | | | | | | | | | | | �� | |
| | | | |
Financials: 11.04% | | | | | | | | | | | | | | | | |
| | | | |
| Banks: 3.85% | | | | | | | | | | | | | | | | |
Bank of America Corporation | | | 3.95 | | | | 4-21-2025 | | | | 120,000 | | | | 119,821 | |
Bank of America Corporation | | | 4.00 | | | | 4-1-2024 | | | | 700,000 | | | | 736,721 | |
Chase Capital VI ± | | | 1.26 | | | | 8-1-2028 | | | | 1,000,000 | | | | 813,150 | |
The accompanying notes are an integral part of these financial statements.
| | | | |
| 92 | | Wells Fargo Allocation Funds | | Portfolio of investments—May 31, 2016 |
MANAGED FIXED INCOME PORTFOLIO
| | | | | | | | | | | | | | | | |
| Security name | | Interest rate | | | Maturity date | | | Principal | | | Value | |
| | | | |
| Banks (continued) | | | | | | | | | | | | | | | | |
Citigroup Incorporated | | | 3.30 | % | | | 4-27-2025 | | | $ | 130,000 | | | $ | 130,908 | |
Citigroup Incorporated | | | 3.40 | | | | 5-1-2026 | | | | 250,000 | | | | 251,340 | |
Citigroup Incorporated | | | 4.40 | | | | 6-10-2025 | | | | 100,000 | | | | 102,732 | |
CoreStates Capital Trust II 144A± | | | 1.28 | | | | 1-15-2027 | | | | 750,000 | | | | 628,125 | |
Manufacturers & Traders Trust Company ± | | | 1.65 | | | | 12-28-2020 | | | | 758,000 | | | | 742,304 | |
National Capital Commerce Incorporated ±(i) | | | 1.61 | | | | 4-1-2027 | | | | 400,000 | | | | 321,000 | |
NTC Capital Trust Series A ± | | | 1.15 | | | | 1-15-2027 | | | | 450,000 | | | | 388,125 | |
PNC Bank | | | 3.25 | | | | 6-1-2025 | | | | 250,000 | | | | 258,980 | |
US Bancorp NA | | | 2.95 | | | | 7-15-2022 | | | | 200,000 | | | | 205,158 | |
US Bancorp NA | | | 3.10 | | | | 4-27-2026 | | | | 180,000 | | | | 181,328 | |
| | | | |
| | | | | | | | | | | | | | | 4,879,692 | |
| | | | | | | | | | | | | | | | |
| | | | |
| Capital Markets: 1.26% | | | | | | | | | | | | | | | | |
Goldman Sachs Capital II ± | | | 4.00 | | | | 12-29-2049 | | | | 62,000 | | | | 46,965 | |
Goldman Sachs Group Incorporated | | | 3.50 | | | | 1-23-2025 | | | | 265,000 | | | | 267,260 | |
Goldman Sachs Group Incorporated | | | 4.25 | | | | 10-21-2025 | | | | 120,000 | | | | 122,210 | |
Goldman Sachs Group Incorporated | | | 5.75 | | | | 1-24-2022 | | | | 200,000 | | | | 229,220 | |
Morgan Stanley | | | 3.70 | | | | 10-23-2024 | | | | 100,000 | | | | 103,312 | |
Morgan Stanley | | | 3.95 | | | | 4-23-2027 | | | | 180,000 | | | | 179,466 | |
Morgan Stanley | | | 5.50 | | | | 7-24-2020 | | | | 350,000 | | | | 390,877 | |
The Bank of New York Mellon Corporation | | | 3.25 | | | | 9-11-2024 | | | | 250,000 | | | | 260,786 | |
| | | | |
| | | | | | | | | | | | | | | 1,600,096 | |
| | | | | | | | | | | | | | | | |
| | | | |
| Consumer Finance: 0.43% | | | | | | | | | | | | | | | | |
American Honda Finance Corporation | | | 2.45 | | | | 9-24-2020 | | | | 120,000 | | | | 123,165 | |
Caterpillar Financial Services Corporation | | | 3.75 | | | | 11-24-2023 | | | | 150,000 | | | | 162,091 | |
Daimler Finance North America LLC 144A | | | 2.38 | | | | 8-1-2018 | | | | 260,000 | | | | 263,786 | |
| | | | |
| | | | | | | | | | | | | | | 549,042 | |
| | | | | | | | | | | | | | | | |
| | | | |
| Diversified Financial Services: 1.31% | | | | | | | | | | | | | | | | |
Abay Leasing 2014 LLC | | | 2.65 | | | | 11-9-2026 | | | | 503,125 | | | | 518,431 | |
ABB Treasury Center USA Incorporated 144A | | | 4.00 | | | | 6-15-2021 | | | | 510,000 | | | | 545,666 | |
Berkshire Hathaway Incorporated | | | 2.75 | | | | 3-15-2023 | | | | 210,000 | | | | 215,213 | |
CNH Industrial Capital LLC | | | 3.38 | | | | 7-15-2019 | | | | 390,000 | | | | 385,125 | |
| | | | |
| | | | | | | | | | | | | | | 1,664,435 | |
| | | | | | | | | | | | | | | | |
| | | | |
| Insurance: 1.42% | | | | | | | | | | | | | | | | |
ACE INA Holdings Incorporated | | | 2.88 | | | | 11-3-2022 | | | | 110,000 | | | | 113,005 | |
Minnesota Life Insurance Company 144A | | | 8.25 | | | | 9-15-2025 | | | | 650,000 | | | | 817,222 | |
NLV Financial Corporation 144A | | | 7.50 | | | | 8-15-2033 | | | | 565,000 | | | | 639,611 | |
Pacific LifeCorp 144A | | | 6.00 | | | | 2-10-2020 | | | | 200,000 | | | | 221,874 | |
| | | | |
| | | | | | | | | | | | | | | 1,791,712 | |
| | | | | | | | | | | | | | | | |
| | | | |
| REITs: 2.77% | | | | | | | | | | | | | | | | |
AvalonBay Communities Incorporated | | | 2.95 | | | | 9-15-2022 | | | | 190,000 | | | | 193,343 | |
AvalonBay Communities Incorporated | | | 3.63 | | | | 10-1-2020 | | | | 40,000 | | | | 42,305 | |
Boston Properties LP | | | 3.70 | | | | 11-15-2018 | | | | 180,000 | | | | 187,954 | |
Boston Properties LP | | | 5.88 | | | | 10-15-2019 | | | | 200,000 | | | | 223,213 | |
Duke Realty LP | | | 3.88 | | | | 10-15-2022 | | | | 150,000 | | | | 155,395 | |
The accompanying notes are an integral part of these financial statements.
| | | | | | |
| Portfolio of investments—May 31, 2016 | | Wells Fargo Allocation Funds | | | 93 | |
MANAGED FIXED INCOME PORTFOLIO
| | | | | | | | | | | | | | | | |
| Security name | | Interest rate | | | Maturity date | | | Principal | | | Value | |
| | | | |
| REITs (continued) | | | | | | | | | | | | | | | | |
ERP Operating LP | | | 4.63 | % | | | 12-15-2021 | | | $ | 281,000 | | | $ | 313,908 | |
Liberty Property LP | | | 3.75 | | | | 4-1-2025 | | | | 100,000 | | | | 101,083 | |
Liberty Property LP | | | 6.63 | | | | 10-1-2017 | | | | 400,000 | | | | 424,494 | |
Potlatch Corporation | | | 7.50 | | | | 11-1-2019 | | | | 310,000 | | | | 342,938 | |
ProLogis LP | | | 3.75 | | | | 11-1-2025 | | | | 170,000 | | | | 178,966 | |
Realty Income Corporation | | | 4.65 | | | | 8-1-2023 | | | | 370,000 | | | | 399,605 | |
Simon Property Group LP | | | 3.38 | | | | 10-1-2024 | | | | 300,000 | | | | 313,616 | |
UDR Incorporated | | | 4.63 | | | | 1-10-2022 | | | | 260,000 | | | | 283,976 | |
Ventas Realty LP | | | 3.50 | | | | 2-1-2025 | | | | 150,000 | | | | 150,067 | |
Vornado Realty LP | | | 2.50 | | | | 6-30-2019 | | | | 200,000 | | | | 201,991 | |
| | | | |
| | | | | | | | | | | | | | | 3,512,854 | |
| | | | | | | | | | | | | | | | |
| | | | |
Health Care: 3.24% | | | | | | | | | | | | | | | | |
| | | | |
| Health Care Equipment & Supplies: 0.64% | | | | | | | | | | | | | | | | |
Becton Dickinson & Company | | | 3.73 | | | | 12-15-2024 | | | | 290,000 | | | | 307,343 | |
C.R. Bard Incorporated | | | 3.00 | | | | 5-15-2026 | | | | 170,000 | | | | 169,514 | |
Medtronic Incorporated | | | 3.15 | | | | 3-15-2022 | | | | 130,000 | | | | 136,810 | |
Teleflex Incorporated | | | 4.88 | | | | 6-1-2026 | | | | 200,000 | | | | 200,500 | |
| | | | |
| | | | | | | | | | | | | | | 814,167 | |
| | | | | | | | | | | | | | | | |
| | | | |
| Health Care Providers & Services: 2.09% | | | | | | | | | | | | | | | | |
Allina Health System Incorporated | | | 4.81 | | | | 11-15-2045 | | | | 235,000 | | | | 273,527 | |
Ascension Health | | | 3.95 | | | | 11-15-2046 | | | | 225,000 | | | | 231,190 | |
Howard Hughes Medical Institute | | | 3.50 | | | | 9-1-2023 | | | | 120,000 | | | | 129,675 | |
Mayo Clinic | | | 3.77 | | | | 11-15-2043 | | | | 120,000 | | | | 118,640 | |
Mednax Incorporated 144A | | | 5.25 | | | | 12-1-2023 | | | | 475,000 | | | | 485,987 | |
Memorial Sloan Kettering Cancer Center | | | 4.20 | | | | 7-1-2055 | | | | 375,000 | | | | 400,034 | |
Texas Health Resources | | | 4.33 | | | | 11-15-2055 | | | | 375,000 | | | | 412,854 | |
The New York and Presbyterian Hospital | | | 4.02 | | | | 8-1-2045 | | | | 175,000 | | | | 182,910 | |
UnitedHealth Group Incorporated | | | 3.75 | | | | 7-15-2025 | | | | 380,000 | | | | 409,170 | |
| | | | |
| | | | | | | | | | | | | | | 2,643,987 | |
| | | | | | | | | | | | | | | | |
| | | | |
| Life Sciences Tools & Services: 0.12% | | | | | | | | | | | | | | | | |
Thermo Fisher Scientific Incorporated | | | 3.30 | | | | 2-15-2022 | | | | 150,000 | | | | 153,703 | |
| | | | | | | | | | | | | | | | |
| | | | |
| Pharmaceuticals: 0.39% | | | | | | | | | | | | | | | | |
Bayer US Finance LLC 144A | | | 3.38 | | | | 10-8-2024 | | | | 240,000 | | | | 245,644 | |
EMD Finance LLC 144A | | | 2.95 | | | | 3-19-2022 | | | | 250,000 | | | | 253,039 | |
| | | | |
| | | | | | | | | | | | | | | 498,683 | |
| | | | | | | | | | | | | | | | |
| | | | |
Industrials: 3.16% | | | | | | | | | | | | | | | | |
| | | | |
| Aerospace & Defense: 0.23% | | | | | | | | | | | | | | | | |
BAE Systems Holdings Incorporated 144A | | | 3.80 | | | | 10-7-2024 | | | | 100,000 | | | | 102,924 | |
United Technologies Corporation | | | 3.10 | | | | 6-1-2022 | | | | 180,000 | | | | 188,378 | |
| | | | |
| | | | | | | | | | | | | | | 291,302 | |
| | | | | | | | | | | | | | | | |
| | | | |
| Air Freight & Logistics: 0.19% | | | | | | | | | | | | | | | | |
FedEx Corporation | | | 4.00 | | | | 1-15-2024 | | | | 225,000 | | | | 244,670 | |
| | | | | | | | | | | | | | | | |
The accompanying notes are an integral part of these financial statements.
| | | | |
| 94 | | Wells Fargo Allocation Funds | | Portfolio of investments—May 31, 2016 |
MANAGED FIXED INCOME PORTFOLIO
| | | | | | | | | | | | | | | | |
| Security name | | Interest rate | | | Maturity date | | | Principal | | | Value | |
| | | | |
| Commercial Services & Supplies: 0.48% | | | | | | | | | | | | | | | | |
Clean Harbors Incorporated | | | 5.25 | % | | | 8-1-2020 | | | $ | 350,000 | | | $ | 357,438 | |
Waste Management Incorporated | | | 3.13 | | | | 3-1-2025 | | | | 240,000 | | | | 247,023 | |
| | | | |
| | | | | | | | | | | | | | | 604,461 | |
| | | | | | | | | | | | | | | | |
| | | | |
| Construction & Engineering: 0.18% | | | | | | | | | | | | | | | | |
Valmont Industries Incorporated | | | 5.00 | | | | 10-1-2044 | | | | 260,000 | | | | 230,731 | |
| | | | | | | | | | | | | | | | |
| | | | |
| Machinery: 1.22% | | | | | | | | | | | | | | | | |
Actuant Corporation | | | 5.63 | | | | 6-15-2022 | | | | 425,000 | | | | 433,500 | |
Briggs & Stratton Corporation | | | 6.88 | | | | 12-15-2020 | | | | 350,000 | | | | 383,250 | |
Deere & Company | | | 2.60 | | | | 6-8-2022 | | | | 340,000 | | | | 344,696 | |
Oshkosh Corporation | | | 5.38 | | | | 3-1-2022 | | | | 375,000 | | | | 387,188 | |
| | | | |
| | | | | | | | | | | | | | | 1,548,634 | |
| | | | | | | | | | | | | | | | |
| | | | |
| Road & Rail: 0.58% | | | | | | | | | | | | | | | | |
Burlington Northern Santa Fe LLC | | | 3.05 | | | | 9-1-2022 | | | | 100,000 | | | | 104,721 | |
Burlington Northern Santa Fe LLC | | | 3.40 | | | | 9-1-2024 | | | | 150,000 | | | | 159,896 | |
Burlington Northern Santa Fe LLC | | | 3.45 | | | | 9-15-2021 | | | | 250,000 | | | | 267,079 | |
Union Pacific Corporation | | | 7.88 | | | | 1-15-2019 | | | | 171,000 | | | | 196,451 | |
| | | | |
| | | | | | | | | | | | | | | 728,147 | |
| | | | | | | | | | | | | | | | |
| | | | |
| Transportation Infrastructure: 0.28% | | | | | | | | | | | | | | | | |
Vessel Management Service | | | 3.43 | | | | 8-15-2036 | | | | 348,000 | | | | 356,383 | |
| | | | | | | | | | | | | | | | |
| | | | |
Information Technology: 1.17% | | | | | | | | | | | | | | | | |
| | | | |
| Electronic Equipment, Instruments & Components: 0.22% | | | | | | | | | | | | | | | | |
Jabil Circuit Incorporated | | | 8.25 | | | | 3-15-2018 | | | | 250,000 | | | | 271,875 | |
| | | | | | | | | | | | | | | | |
| | | | |
| IT Services: 0.09% | | | | | | | | | | | | | | | | |
Fiserv Incorporated | | | 4.75 | | | | 6-15-2021 | | | | 100,000 | | | | 109,789 | |
| | | | | | | | | | | | | | | | |
| | | | |
| Semiconductors & Semiconductor Equipment: 0.20% | | | | | | | | | | | | | | | | |
Micron Technology Incorporated 144A | | | 7.50 | | | | 9-15-2023 | | | | 245,000 | | | | 257,250 | |
| | | | | | | | | | | | | | | | |
| | | | |
| Software: 0.36% | | | | | | | | | | | | | | | | |
Oracle Corporation | | | 2.50 | | | | 5-15-2022 | | | | 220,000 | | | | 223,573 | |
Oracle Corporation | | | 3.40 | | | | 7-8-2024 | | | | 220,000 | | | | 232,887 | |
| | | | |
| | | | | | | | | | | | | | | 456,460 | |
| | | | | | | | | | | | | | | | |
| | | | |
| Technology Hardware, Storage & Peripherals: 0.30% | | | | | | | | | | | | | | | | |
Hewlett Packard Enterprise Company 144A | | | 4.90 | | | | 10-15-2025 | | | | 375,000 | | | | 383,548 | |
| | | | | | | | | | | | | | | | |
| | | | |
Materials: 1.78% | | | | | | | | | | | | | | | | |
| | | | |
| Chemicals: 0.69% | | | | | | | | | | | | | | | | |
Ecolab Incorporated | | | 4.35 | | | | 12-8-2021 | | | | 330,000 | | | | 366,095 | |
Scotts Miracle-Gro Company 144A | | | 6.00 | | | | 10-15-2023 | | | | 390,000 | | | | 413,400 | |
Valspar Corporation | | | 3.30 | | | | 2-1-2025 | | | | 100,000 | | | | 98,656 | |
| | | | |
| | | | | | | | | | | | | | | 878,151 | |
| | | | | | | | | | | | | | | | |
The accompanying notes are an integral part of these financial statements.
| | | | | | |
| Portfolio of investments—May 31, 2016 | | Wells Fargo Allocation Funds | | | 95 | |
MANAGED FIXED INCOME PORTFOLIO
| | | | | | | | | | | | | | | | |
| Security name | | Interest rate | | | Maturity date | | | Principal | | | Value | |
| | | | |
| Containers & Packaging: 0.56% | | | | | | | | | | | | | | | | |
Ball Corporation | | | 5.00 | % | | | 3-15-2022 | | | $ | 350,000 | | | $ | 365,750 | |
Sealed Air Corporation 144A | | | 6.50 | | | | 12-1-2020 | | | | 300,000 | | | | 342,000 | |
| | | | |
| | | | | | | | | | | | | | | 707,750 | |
| | | | | | | | | | | | | | | | |
| | | | |
| Metals & Mining: 0.25% | | | | | | | | | | | | | | | | |
Alcoa Incorporated | | | 5.40 | | | | 4-15-2021 | | | | 300,000 | | | | 310,500 | |
| | | | | | | | | | | | | | | | |
| | | | |
| Paper & Forest Products: 0.28% | | | | | | | | | | | | | | | | |
Georgia Pacific LLC 144A | | | 3.73 | | | | 7-15-2023 | | | | 340,000 | | | | 355,194 | |
| | | | | | | | | | | | | | | | |
| | | | |
Telecommunication Services: 0.95% | | | | | | | | | | | | | | | | |
| | | | |
| Diversified Telecommunication Services: 0.95% | | | | | | | | | | | | | | | | |
AT&T Incorporated | | | 2.40 | | | | 3-15-2017 | | | | 400,000 | | | | 403,856 | |
AT&T Incorporated | | | 4.75 | | | | 5-15-2046 | | | | 280,000 | | | | 277,637 | |
Verizon Communications Incorporated | | | 3.50 | | | | 11-1-2024 | | | | 110,000 | | | | 114,257 | |
Verizon Communications Incorporated | | | 5.15 | | | | 9-15-2023 | | | | 350,000 | | | | 401,890 | |
| | | | |
| | | | | | | | | | | | | | | 1,197,640 | |
| | | | | | | | | | | | | | | | |
| | | | |
Utilities: 2.69% | | | | | | | | | | | | | | | | |
| | | | |
| Electric Utilities: 2.12% | | | | | | | | | | | | | | | | |
Entergy Texas Incorporated | | | 7.13 | | | | 2-1-2019 | | | | 250,000 | | | | 281,877 | |
Great River Energy 144A | | | 5.83 | | | | 7-1-2017 | | | | 261,811 | | | | 267,131 | |
IPALCO Enterprises Incorporated | | | 3.45 | | | | 7-15-2020 | | | | 350,000 | | | | 353,500 | |
ITC Holdings Corporation | | | 3.65 | | | | 6-15-2024 | | | | 120,000 | | | | 122,751 | |
Monongahela Power Company 144A | | | 4.10 | | | | 4-15-2024 | | | | 380,000 | | | | 408,084 | |
Northern States Power Company of Wisconsin | | | 3.30 | | | | 6-15-2024 | | | | 370,000 | | | | 387,003 | |
Otter Tail Corporation (i) | | | 9.00 | | | | 12-15-2016 | | | | 350,000 | | | | 361,291 | |
PacifiCorp | | | 3.35 | | | | 7-1-2025 | | | | 130,000 | | | | 137,063 | |
Tenaska Alabama II Partners LP 144A | | | 7.00 | | | | 6-30-2021 | | | | 164,954 | | | | 166,604 | |
Trans-Allegheny Interstate Line Company 144A | | | 3.85 | | | | 6-1-2025 | | | | 200,000 | | | | 208,454 | |
| | | | |
| | | | | | | | | | | | | | | 2,693,758 | |
| | | | | | | | | | | | | | | | |
| | | | |
| Gas Utilities: 0.57% | | | | | | | | | | | | | | | | |
AmeriGas Finance LLC | | | 7.00 | | | | 5-20-2022 | | | | 375,000 | | | | 395,156 | |
Boardwalk Pipelines Company | | | 5.95 | | | | 6-1-2026 | | | | 325,000 | | | | 325,544 | |
| | | | |
| | | | | | | | | | | | | | | 720,700 | |
| | | | | | | | | | | | | | | | |
| | | | |
Total Corporate Bonds and Notes (Cost $39,867,746) | | | | | | | | | | | | | | | 41,120,407 | |
| | | | | | | | | | | | | | | | |
| | | | |
Municipal Obligations: 8.93% | | | | | | | | | | | | | | | | |
| | | | |
| Alaska: 0.25% | | | | | | | | | | | | | | | | |
Alaska Taxable Build America Bonds Series 2010A (GO Revenue) | | | 5.74 | | | | 8-1-2033 | | | | 250,000 | | | | 322,840 | |
| | | | | | | | | | | | | | | | |
| | | | |
| Arizona: 0.90% | | | | | | | | | | | | | | | | |
Arizona School Facilities Board Refunding Certificates of Participation Series A-3 (Miscellaneous Revenue) | | | 2.38 | | | | 9-1-2019 | | | | 235,000 | | | | 239,263 | |
Maricopa County AZ Elementary School District #28 Kyrene Elementary Build America Bonds Series D (GO Revenue) | | | 5.38 | | | | 7-1-2019 | | | | 800,000 | | | | 900,280 | |
| | | | |
| | | | | | | | | | | | | | | 1,139,543 | |
| | | | | | | | | | | | | | | | |
The accompanying notes are an integral part of these financial statements.
| | | | |
| 96 | | Wells Fargo Allocation Funds | | Portfolio of investments—May 31, 2016 |
MANAGED FIXED INCOME PORTFOLIO
| | | | | | | | | | | | | | | | |
| Security name | | Interest rate | | | Maturity date | | | Principal | | | Value | |
| | | | |
| Arkansas: 0.29% | | | | | | | | | | | | | | | | |
Arkansas Taxable Bond Amendment 82 Series A (GO Revenue) | | | 2.61 | % | | | 7-1-2021 | | | $ | 350,000 | | | $ | 368,431 | |
| | | | | | | | | | | | | | | | |
| | | | |
| Georgia: 0.49% | | | | | | | | | | | | | | | | |
Cherokee County GA School System Build America Bonds (GO Revenue) | | | 5.87 | | | | 8-1-2028 | | | | 500,000 | | | | 622,730 | |
| | | | | | | | | | | | | | | | |
| | | | |
| Indiana: 0.28% | | | | | | | | | | | | | | | | |
Indiana Housing & CDA Series A-2 (Housing Revenue, GNMA/FNMA/FHLMC Insured) | | | 5.51 | | | | 1-1-2039 | | | | 40,000 | | | | 40,536 | |
Indianapolis IN Local Public Improvement Bond Bank Build America Bonds (Miscellaneous Revenue) | | | 5.85 | | | | 1-15-2030 | | | | 250,000 | | | | 311,410 | |
| | | | |
| | | | | | | | | | | | | | | 351,946 | |
| | | | | | | | | | | | | | | | |
| | | | |
| Kentucky: 0.04% | | | | | | | | | | | | | | | | |
Kentucky Housing Corporation Series D (Housing Revenue) | | | 5.75 | | | | 7-1-2037 | | | | 50,000 | | | | 50,098 | |
| | | | | | | | | | | | | | | | |
| | | | |
| Maryland: 0.25% | | | | | | | | | | | | | | | | |
Baltimore County MD (GO Revenue) | | | 3.57 | | | | 8-1-2032 | | | | 300,000 | | | | 311,568 | |
| | | | | | | | | | | | | | | | |
| | | | |
| Massachusetts: 0.67% | | | | | | | | | | | | | | | | |
Boston MA Series C Qualified School Construction Bonds (GO Revenue) | | | 4.40 | | | | 4-1-2026 | | | | 400,000 | | | | 441,632 | |
Massachusetts Build America Bonds Series D (GO Revenue) | | | 4.50 | | | | 8-1-2031 | | | | 350,000 | | | | 405,682 | |
| | | | |
| | | | | | | | | | | | | | | 847,314 | |
| | | | | | | | | | | | | | | | |
| | | | |
| Minnesota: 0.23% | | | | | | | | | | | | | | | | |
Minnetonka MN Independent School District #276 Series E (GO Revenue, South Dakota Credit Program Insured) | | | 2.55 | | | | 1-1-2024 | | | | 290,000 | | | | 296,531 | |
| | | | | | | | | | | | | | | | |
| | | | |
| Missouri: 0.26% | | | | | | | | | | | | | | | | |
Missouri Higher Education Loan Authority Notes Class A-1 (Education Revenue) ± | | | 1.48 | | | | 8-27-2029 | | | | 338,721 | | | | 334,626 | |
| | | | | | | | | | | | | | | | |
| | | | |
| New Jersey: 0.99% | | | | | | | | | | | | | | | | |
Hudson County NJ Improvement Authority Hudson County Lease Project (Miscellaneous Revenue, AGM Insured) | | | 7.40 | | | | 12-1-2025 | | | | 1,030,000 | | | | 1,254,592 | |
| | | | | | | | | | | | | | | | |
| | | | |
| North Carolina: 0.94% | | | | | | | | | | | | | | | | |
Duke University North Carolina Series A (Education Revenue) | | | 5.85 | | | | 4-1-2037 | | | | 300,000 | | | | 404,118 | |
North Carolina Education Assistance Authority Student Loan Notes 2011-1 Series A3 (Education Revenue) ± | | | 1.52 | | | | 10-25-2041 | | | | 650,000 | | | | 631,794 | |
University of North Carolina Chapel Hill Refunding Bonds Series 2016C (Education Revenue) | | | 3.33 | | | | 12-1-2036 | | | | 150,000 | | | | 153,980 | |
| | | | |
| | | | | | | | | | | | | | | 1,189,892 | |
| | | | | | | | | | | | | | | | |
| | | | |
| Ohio: 0.54% | | | | | | | | | | | | | | | | |
Cuyahoga County OH Build America Bonds Series B (GO Revenue) | | | 6.03 | | | | 12-1-2034 | | | | 325,000 | | | | 409,910 | |
Ohio Veterans Compensation (GO Revenue) | | | 3.38 | | | | 10-1-2021 | | | | 250,000 | | | | 268,460 | |
| | | | |
| | | | | | | | | | | | | | | 678,370 | |
| | | | | | | | | | | | | | | | |
| | | | |
| Oklahoma: 0.32% | | | | | | | | | | | | | | | | |
Oklahoma Water Resource Board Revolving Fund Series A (Water & Sewer Revenue) | | | 3.27 | | | | 4-1-2023 | | | | 375,000 | | | | 406,549 | |
| | | | | | | | | | | | | | | | |
The accompanying notes are an integral part of these financial statements.
| | | | | | |
| Portfolio of investments—May 31, 2016 | | Wells Fargo Allocation Funds | | | 97 | |
MANAGED FIXED INCOME PORTFOLIO
| | | | | | | | | | | | | | | | |
| Security name | | Interest rate | | | Maturity date | | | Principal | | | Value | |
| | | | |
| Texas: 0.90% | | | | | | | | | | | | | | | | |
Clear Creek TX Independent School District Taxable Refunding Series B (GO Revenue) | | | 3.40 | % | | | 2-15-2022 | | | $ | 375,000 | | | $ | 405,649 | |
Harris County TX Taxable Refunding Permanent Improvement Series B (GO Revenue) | | | 2.12 | | | | 10-1-2021 | | | | 500,000 | | | | 507,725 | |
Texas State A&M University (Education Revenue) | | | 3.11 | | | | 5-15-2028 | | | | 220,000 | | | | 225,436 | |
| | | | |
| | | | | | | | | | | | | | | 1,138,810 | |
| | | | | | | | | | | | | | | | |
| | | | |
| Virginia: 0.20% | | | | | | | | | | | | | | | | |
Virginia State HDA (Housing Revenue) %% | | | 3.10 | | | | 6-25-2041 | | | | 250,000 | | | | 250,348 | |
| | | | | | | | | | | | | | | | |
| | | | |
| Washington: 0.87% | | | | | | | | | | | | | | | | |
King County WA Economic Development Taxable Bond Series C (GO Revenue) | | | 5.03 | | | | 12-1-2023 | | | | 230,000 | | | | 264,438 | |
King County WA School District #210 (GO Revenue, AGM Insured) | | | 4.90 | | | | 12-1-2022 | | | | 400,000 | | | | 438,096 | |
Washington Build America Bonds (Tax Revenue) | | | 5.09 | | | | 8-1-2033 | | | | 325,000 | | | | 395,707 | |
| | | | |
| | | | | | | | | | | | | | | 1,098,241 | |
| | | | | | | | | | | | | | | | |
| | | | |
| West Virginia: 0.42% | | | | | | | | | | | | | | | | |
Ohio County WV Special District Excise Tax Series A (Tax Revenue) | | | 8.25 | | | | 3-1-2035 | | | | 475,000 | | | | 534,670 | |
| | | | | | | | | | | | | | | | |
| | | | |
| Wisconsin: 0.09% | | | | | | | | | | | | | | | | |
Milwaukee County WI Taxable Pension Promissory Notes Series A (GO Revenue) | | | 6.84 | | | | 12-1-2028 | | | | 90,000 | | | | 118,907 | |
| | | | | | | | | | | | | | | | |
| | | | |
Total Municipal Obligations (Cost $10,453,269) | | | | | | | | | | | | | | | 11,316,006 | |
| | | | | | | | | | | | | | | | |
| | | | |
Non-Agency Mortgage-Backed Securities: 12.38% | | | | | | | | | | | | | | | | |
Commercial Mortgage Pass-Through Certificate Series 2010-C1 Class A3 144A | | | 4.21 | | | | 7-10-2046 | | | | 700,000 | | | | 756,168 | |
Commercial Mortgage Pass-Through Certificate Series 2012-CR2 Class A4 | | | 3.15 | | | | 8-15-2045 | | | | 550,000 | | | | 575,007 | |
Commercial Mortgage Pass-Through Certificate Series 2012-CR3 Class A3 | | | 2.82 | | | | 10-15-2045 | | | | 620,000 | | | | 636,941 | |
Commercial Mortgage Pass-Through Certificate Series 2012-UBS5 Class A3 | | | 3.55 | | | | 9-10-2047 | | | | 630,000 | | | | 664,141 | |
Commercial Mortgage Pass-Through Certificate Series 2013-CR12 Class ASB | | | 3.62 | | | | 10-10-2046 | | | | 550,000 | | | | 586,902 | |
Commercial Mortgage Pass-Through Certificate Series 2013-CR13 Class A4 ± | | | 4.19 | | | | 11-10-2023 | | | | 600,000 | | | | 665,637 | |
Commercial Mortgage Pass-Through Certificate Series 2013-CR7 Class A4 | | | 3.21 | | | | 3-10-2046 | | | | 630,000 | | | | 659,812 | |
Credit Suisse First Boston Commercial Mortgage Trust Series 2004-AR5 Class 10A1 ± | | | 2.75 | | | | 6-25-2034 | | | | 592,191 | | | | 595,832 | |
GS Mortgage Securities Trust Series 2011-GC3 Class A4 144A | | | 4.75 | | | | 3-10-2044 | | | | 498,499 | | | | 544,075 | |
GS Mortgage Securities Trust Series 2011-GC5 Class A4 | | | 3.71 | | | | 8-10-2044 | | | | 545,000 | | | | 582,359 | |
GS Mortgage Securities Trust Series 2012-GCJ7 Class A4 | | | 3.38 | | | | 5-10-2045 | | | | 560,000 | | | | 590,387 | |
GS Mortgage Securities Trust Series 2013-GC10 Class AAB | | | 2.56 | | | | 2-10-2046 | | | | 212,500 | | | | 216,710 | |
GS Mortgage Securities Trust Series 2013-GC12 Class AAB | | | 2.68 | | | | 6-10-2046 | | | | 212,500 | | | | 217,391 | |
GS Mortgage Securities Trust Series 2013-GC14 Class A5 | | | 4.24 | | | | 8-10-2046 | | | | 615,000 | | | | 682,817 | |
GS Mortgage Securities Trust Series 2013-GC16 Class A4 | | | 4.27 | | | | 11-10-2046 | | | | 350,000 | | | | 389,727 | |
JPMorgan Chase Commercial Mortgage Securities Trust Series 2010-C2 Class A3 144A | | | 4.07 | | | | 11-15-2043 | | | | 395,000 | | | | 420,311 | |
JPMorgan Chase Commercial Mortgage Securities Trust Series 2013-C12 Class ASB | | | 3.16 | | | | 7-15-2045 | | | | 550,000 | | | | 572,497 | |
MMAF Equipment Finance LLC Series 2015-AA Class A4 144A | | | 1.93 | | | | 7-16-2021 | | | | 500,000 | | | | 502,700 | |
Morgan Stanley Bank of America Merrill Lynch Trust Series 2014-C15 Class ASB | | | 3.65 | | | | 4-15-2047 | | | | 550,000 | | | | 584,522 | |
Morgan Stanley Capital I Trust Series 2011-C2 Class A4 144A | | | 4.66 | | | | 6-15-2044 | | | | 500,000 | | | | 551,419 | |
Morgan Stanley Capital I Trust Series 2011-C3 Class A4 | | | 4.12 | | | | 7-15-2049 | | | | 530,000 | | | | 574,743 | |
Motel 6 Trust Series 2015-MTL6 Class B 144A | | | 3.30 | | | | 2-5-2030 | | | | 500,000 | | | | 500,516 | |
Nomura Asset Acceptance Corporation Series 2004-R2 Class A1 144A± | | | 6.50 | | | | 10-25-2034 | | | | 975,563 | | | | 984,759 | |
Sequoia Mortgage Trust Series 10 Class 1A ± | | | 1.24 | | | | 10-20-2027 | | | | 264,892 | | | | 258,101 | |
Structured Asset Securities Corporation Series 2007-RM1 Class A1 144A±(i)(a) | | | 0.73 | | | | 5-25-2047 | | | | 1,883,961 | | | | 1,233,994 | |
Towd Point Mortgage Trust Series 2016-2 Class A1A 144A±(a) | | | 2.75 | | | | 8-25-2055 | | | | 450,000 | | | | 450,006 | |
WF RBS Commercial Mortgage Trust Series 2013-C17 Class A4 | | | 4.02 | | | | 12-15-2046 | | | | 630,000 | | | | 690,593 | |
| |
Total Non-Agency Mortgage-Backed Securities (Cost $16,167,367) | | | | 15,688,067 | |
| | | | | | | | | | | | | | | | |
The accompanying notes are an integral part of these financial statements.
| | | | |
| 98 | | Wells Fargo Allocation Funds | | Portfolio of investments—May 31, 2016 |
MANAGED FIXED INCOME PORTFOLIO
| | | | | | | | | | | | | | | | |
| Security name | | Interest rate | | | Maturity date | | | Principal | | | Value | |
| | | | |
U.S. Treasury Securities: 4.29% | | | | | | | | | | | | | | | | |
TIPS | | | 0.38 | % | | | 7-15-2025 | | | $ | 632,539 | | | $ | 639,210 | |
U.S. Treasury Bond | | | 2.50 | | | | 2-15-2045 | | | | 665,000 | | | | 645,492 | |
U.S. Treasury Bond | | | 2.50 | | | | 2-15-2046 | | | | 190,000 | | | | 184,293 | |
U.S. Treasury Bond | | | 2.50 | | | | 5-15-2046 | | | | 250,000 | | | | 242,744 | |
U.S. Treasury Bond ## | | | 2.88 | | | | 8-15-2045 | | | | 1,850,000 | | | | 1,938,526 | |
U.S. Treasury Bond | | | 3.00 | | | | 11-15-2045 | | | | 550,000 | | | | 590,778 | |
U.S. Treasury Bond | | | 4.50 | | | | 2-15-2036 | | | | 880,000 | | | | 1,202,540 | |
| |
Total U.S. Treasury Securities (Cost $5,236,374) | | | | 5,443,583 | |
| | | | | | | | | | | | | | | | |
| | | | |
Yankee Corporate Bonds and Notes: 5.74% | | | | | | | | | | | | | | | | |
| | | | |
Consumer Discretionary: 0.27% | | | | | | | | | | | | | | | | |
| | | | |
| Media: 0.27% | | | | | | | | | | | | | | | | |
Pearson Dollar Finance Two plc 144A | | | 6.25 | | | | 5-6-2018 | | | | 325,000 | | | | 348,203 | |
| | | | | | | | | | | | | | | | |
| | | | |
Energy: 1.84% | | | | | | | | | | | | | | | | |
| | | | |
| Energy Equipment & Services: 0.42% | | | | | | | | | | | | | | | | |
Ensco plc | | | 4.70 | | | | 3-15-2021 | | | | 160,000 | | | | 125,600 | |
Schlumberger Norge AS 144A | | | 4.20 | | | | 1-15-2021 | | | | 380,000 | | | | 408,916 | |
| |
| | | | 534,516 | |
| | | | | | | | | | | | | | | | |
| | | | |
| Oil, Gas & Consumable Fuels: 1.42% | | | | | | | | | | | | | | | | |
BP Capital Markets plc | | | 3.81 | | | | 2-10-2024 | | | | 110,000 | | | | 115,553 | |
BP Capital Markets plc | | | 4.50 | | | | 10-1-2020 | | | | 350,000 | | | | 383,202 | |
Petroleos Mexicanos | | | 2.29 | | | | 2-15-2024 | | | | 220,000 | | | | 223,425 | |
Petroleos Mexicanos | | | 2.83 | | | | 2-15-2024 | | | | 460,000 | | | | 476,587 | |
Petroleos Mexicanos | | | 6.38 | | | | 1-23-2045 | | | | 250,000 | | | | 234,075 | |
Total Capital International SA | | | 3.70 | | | | 1-15-2024 | | | | 200,000 | | | | 212,691 | |
Weatherford International Limited « | | | 4.50 | | | | 4-15-2022 | | | | 190,000 | | | | 147,250 | |
| |
| | | | 1,792,783 | |
| | | | | | | | | | | | | | | | |
|
Financials: 1.54% | |
| | | | |
| Banks: 0.71% | | | | | | | | | | | | | | | | |
Bank of Nova Scotia | | | 4.50 | | | | 12-16-2025 | | | | 250,000 | | | | 257,089 | |
Credit Suisse New York | | | 3.63 | | | | 9-9-2024 | | | | 250,000 | | | | 260,168 | |
HSBC | | | 3.60 | | | | 5-25-2023 | | | | 250,000 | | | | 252,022 | |
Royal Bank of Canada | | | 4.65 | | | | 1-27-2026 | | | | 120,000 | | | | 125,323 | |
| |
| | | | 894,602 | |
| | | | | | | | | | | | | | | | |
| | | | |
| Diversified Financial Services: 0.83% | | | | | | | | | | | | | | | | |
Shell International Finance BV | | | 3.25 | | | | 5-11-2025 | | | | 200,000 | | | | 204,732 | |
Shell International Finance BV | | | 3.40 | | | | 8-12-2023 | | | | 370,000 | | | | 385,080 | |
Tyco Electronics Group SA | | | 3.50 | | | | 2-3-2022 | | | | 450,000 | | | | 467,511 | |
| |
| | | | 1,057,323 | |
| | | | | | | | | | | | | | | | |
| | | | |
Health Care: 0.18% | | | | | | | | | | | | | | | | |
| | | | |
| Pharmaceuticals: 0.18% | | | | | | | | | | | | | | | | |
Actavis Funding SCS | | | 4.55 | | | | 3-15-2035 | | | | 230,000 | | | | 226,633 | |
| | | | | | | | | | | | | | | | |
The accompanying notes are an integral part of these financial statements.
| | | | | | |
| Portfolio of investments—May 31, 2016 | | Wells Fargo Allocation Funds | | | 99 | |
MANAGED FIXED INCOME PORTFOLIO
| | | | | | | | | | | | | | | | |
| Security name | | Interest rate | | | Maturity date | | | Principal | | | Value | |
| | | | |
Industrials: 0.52% | | | | | | | | | | | | | | | | |
| | | | |
| Aerospace & Defense: 0.40% | | | | | | | | | | | | | | | | |
BAE Systems plc 144A | | | 4.75 | % | | | 10-11-2021 | | | $ | 470,000 | | | $ | 515,433 | |
| | | | | | | | | | | | | | | | |
| | | | |
| Road & Rail: 0.12% | | | | | | | | | | | | | | | | |
Canadian Pacific Railway Company | | | 2.90 | | | | 2-1-2025 | | | | 150,000 | | | | 149,549 | |
| | | | | | | | | | | | | | | | |
| | | | |
Information Technology: 0.58% | | | | | | | | | | | | | | | | |
| | | | |
| Semiconductors & Semiconductor Equipment: 0.30% | | | | | | | | | | | | | | | | |
TSMC Global Limited 144A | | | 1.63 | | | | 4-3-2018 | | | | 380,000 | | | | 378,817 | |
| | | | | | | | | | | | | | | | |
| | | | |
| Technology Hardware, Storage & Peripherals: 0.28% | | | | | | | | | | | | | | | | |
Seagate HDD Cayman | | | 4.75 | | | | 6-1-2023 | | | | 425,000 | | | | 355,884 | |
| | | | | | | | | | | | | | | | |
| | | | |
Materials: 0.49% | | | | | | | | | | | | | | | | |
| | | | |
| Metals & Mining: 0.49% | | | | | | | | | | | | | | | | |
Rio Tinto Finance (USA) Limited | | | 3.75 | | | | 9-20-2021 | | | | 370,000 | | | | 386,846 | |
Teck Resources Limited | | | 3.00 | | | | 3-1-2019 | | | | 240,000 | | | | 229,800 | |
| |
| | | | 616,646 | |
| | | | | | | | | | | | | | | | |
| | | | |
Telecommunication Services: 0.32% | | | | | | | | | | | | | | | | |
| | | | |
| Wireless Telecommunication Services: 0.32% | | | | | | | | | | | | | | | | |
Rogers Communications Incorporated | | | 4.10 | | | | 10-1-2023 | | | | 370,000 | | | | 402,651 | |
| | | | | | | | | | | | | | | | |
| |
Total Yankee Corporate Bonds and Notes (Cost $7,170,407) | | | | 7,273,040 | |
| | | | | | | | | | | | | | | | |
| | | | |
| | | Yield | | | | | | Shares | | | | |
| Short-Term Investments: 3.47% | | | | | | | | | | | | | | | | |
| | | | |
| Investment Companies: 3.47% | | | | | | | | | | | | | | | | |
Securities Lending Cash Investments LLC (l)(r)(u) | | | 0.45 | | | | | | | | 143,100 | | | | 143,100 | |
Wells Fargo Cash Investment Money Market Fund Select Class (l)(u)## | | | 0.41 | | | | | | | | 4,250,997 | | | | 4,250,997 | |
| | | | |
Total Short-Term Investments (Cost $4,394,097) | | | | | | | | | | | | | | | 4,394,097 | |
| | | | | | | | | | | | | | | | |
| | | | | | | | |
| Total investments in securities (Cost $124,932,078) * | | | 101.35 | % | | | 128,466,552 | |
Other assets and liabilities, net | | | (1.35 | ) | | | (1,712,822 | ) |
| | | | | | | | |
| Total net assets | | | 100.00 | % | | $ | 126,753,730 | |
| | | | | | | | |
The accompanying notes are an integral part of these financial statements.
| | | | |
| 100 | | Wells Fargo Allocation Funds | | Portfolio of investments—May 31, 2016 |
MANAGED FIXED INCOME PORTFOLIO
| (a) | The security is fair valued in accordance with procedures approved by the Board of Trustees. |
| ± | Variable rate investment. The rate shown is the rate in effect at period end. |
| 144A | The security may be resold in transactions exempt from registration, normally to qualified institutional buyers, pursuant to Rule 144A under the Securities Act of 1933. |
| (i) | Illiquid security for which the designation as illiquid is unaudited. |
| %% | The security is issued on a when-issued basis. |
| ## | All or a portion of this security is segregated for when-issued securities. |
| « | All or a portion of this security is on loan. |
| (l) | The issuer of the security is an affiliated person of the Portfolio as defined in the Investment Company Act of 1940. |
| (r) | The investment is a non-registered investment vehicle purchased with cash collateral received from securities on loan. |
| (u) | The rate represents the 7-day annualized yield at period end. |
| * | Cost for federal income tax purposes is $124,949,952 and unrealized gains (losses) consists of: |
| | | | |
Gross unrealized gains | | $ | 5,110,592 | |
Gross unrealized losses | | | (1,593,992 | ) |
| | | | |
Net unrealized gains | | $ | 3,516,600 | |
The accompanying notes are an integral part of these financial statements.
| | | | | | |
| Portfolio of investments—May 31, 2016 | | Wells Fargo Allocation Funds | | | 101 | |
REAL RETURN PORTFOLIO
| | | | | | | | | | | | |
| Security name | | | | | | Shares | | | Value | |
| | | | |
Common Stocks: 16.92% | | | | | | | | | | | | |
| | | | |
Consumer Staples: 3.87% | | | | | | | | | | | | |
| | | | |
| Beverages: 0.39% | | | | | | | | | | | | |
Constellation Brands Incorporated Class A | | | | | | | 697 | | | $ | 106,746 | |
The Coca-Cola Company | | | | | | | 3,173 | | | | 141,516 | |
| |
| | | | 248,262 | |
| | | | | |
| | | | |
| Food & Staples Retailing: 0.55% | | | | | | | | | | | | |
The Kroger Company | | | | | | | 2,083 | | | | 74,488 | |
Wal-Mart Stores Incorporated | | | | | | | 1,764 | | | | 124,856 | |
Walgreens Boots Alliance Incorporated | | | | | | | 2,009 | | | | 155,497 | |
| |
| | | | 354,841 | |
| | | | | |
| | | | |
| Food Products: 1.38% | | | | | | | | | | | | |
Biostime International Holdings Limited | | | | | | | 176,000 | | | | 537,915 | |
Marine Harvest ASA | | | | | | | 4,555 | | | | 76,065 | |
Mead Johnson Nutrition Company | | | | | | | 970 | | | | 79,812 | |
Mondelez International Incorporated Class A | | | | | | | 2,400 | | | | 106,776 | |
The Hershey Company | | | | | | | 909 | | | | 84,401 | |
| |
| | | | 884,969 | |
| | | | | |
| | | | |
| Household Products: 1.22% | | | | | | | | | | | | |
Church & Dwight Company Incorporated | | | | | | | 1,092 | | | | 107,540 | |
Reckitt Benckiser Group plc | | | | | | | 4,568 | | | | 454,854 | |
The Procter & Gamble Company | | | | | | | 2,721 | | | | 220,510 | |
| |
| | | | 782,904 | |
| | | | | |
| | | | |
| Personal Products: 0.08% | | | | | | | | | | | | |
The Estee Lauder Companies Incorporated Class A | | | | | | | 574 | | | | 52,682 | |
| | | | | | | | | | | | |
| | | | |
| Tobacco: 0.25% | | | | | | | | | | | | |
Philip Morris International | | | | | | | 1,604 | | | | 158,283 | |
| | | | | | | | | | | | |
| | | | |
Energy: 3.41% | | | | | | | | | | | | |
| | | | |
| Energy Equipment & Services: 0.34% | | | | | | | | | | | | |
Halliburton Company | | | | | | | 2,474 | | | | 104,353 | |
Schlumberger Limited | | | | | | | 876 | | | | 66,839 | |
Weatherford International plc † | | | | | | | 8,288 | | | | 46,496 | |
| |
| | | | 217,688 | |
| | | | | |
| | | | |
| Oil, Gas & Consumable Fuels: 3.07% | | | | | | | | | | | | |
Anadarko Petroleum Corporation | | | | | | | 1,640 | | | | 85,050 | |
BP plc | | | | | | | 104,961 | | | | 543,092 | |
Chevron Corporation | | | | | | | 2,867 | | | | 289,567 | |
Cimarex Energy Company | | | | | | | 927 | | | | 107,792 | |
Eni SpA | | | | | | | 32,056 | | | | 489,710 | |
EOG Resources Incorporated | | | | | | | 1,489 | | | | 121,145 | |
Occidental Petroleum Corporation | | | | | | | 1,817 | | | | 137,074 | |
Phillips 66 Company | | | | | | | 640 | | | | 51,430 | |
The accompanying notes are an integral part of these financial statements.
| | | | |
| 102 | | Wells Fargo Allocation Funds | | Portfolio of investments—May 31, 2016 |
REAL RETURN PORTFOLIO
| | | | | | | | | | | | |
| Security name | | | | | | Shares | | | Value | |
| | | | |
| Oil, Gas & Consumable Fuels (continued) | | | | | | | | | | | | |
Pioneer Natural Resources Company | | | | | | | 603 | | | $ | 96,673 | |
Valero Energy Corporation | | | | | | | 848 | | | | 46,386 | |
| | | | |
| | | | | | | | | | | 1,967,919 | |
| | | | | | | | | | | | |
| | | | |
Financials: 4.49% | | | | | | | | | | | | |
| | | | |
| REITs: 4.49% | | | | | | | | | | | | |
American Homes 4 Rent Class A | | | | | | | 3,735 | | | | 68,500 | |
American Tower Corporation | | | | | | | 4,616 | | | | 488,280 | |
AvalonBay Communities Incorporated | | | | | | | 1,406 | | | | 252,911 | |
Boston Properties Incorporated | | | | | | | 2,087 | | | | 262,190 | |
Camden Property Trust | | | | | | | 1,931 | | | | 164,541 | |
Equinix Incorporated | | | | | | | 446 | | | | 161,452 | |
Essex Property Trust Incorporated | | | | | | | 384 | | | | 87,256 | |
General Growth Properties Incorporated | | | | | | | 9,763 | | | | 262,332 | |
Host Hotels & Resorts Incorporated | | | | | | | 6,728 | | | | 103,611 | |
Physicians Realty Trust | | | | | | | 12,864 | | | | 244,287 | |
Prologis Incorporated | | | | | | | 4,182 | | | | 198,770 | |
Public Storage Incorporated | | | | | | | 560 | | | | 142,078 | |
Simon Property Group Incorporated | | | | | | | 1,418 | | | | 280,254 | |
Ventas Incorporated | | | | | | | 2,466 | | | | 163,570 | |
| | | | |
| | | | | | | | | | | 2,880,032 | |
| | | | | | | | | | | | |
| | | | |
Materials: 5.15% | | | | | | | | | | | | |
| | | | |
| Chemicals: 2.57% | | | | | | | | | | | | |
Akzo Nobel NV | | | | | | | 8,858 | | | | 601,207 | |
Dow Chemical Company | | | | | | | 1,751 | | | | 89,931 | |
Ecolab Incorporated | | | | | | | 436 | | | | 51,117 | |
International Flavors & Fragrances Incorporated | | | | | | | 253 | | | | 32,637 | |
LyondellBasell Industries NV Class A | | | | | | | 290 | | | | 23,594 | |
Monsanto Company | | | | | | | 244 | | | | 27,443 | |
Nitto Denko Corporation | | | | | | | 10,400 | | | | 684,560 | |
PolyOne Corporation | | | | | | | 875 | | | | 32,786 | |
PPG Industries Incorporated | | | | | | | 504 | | | | 54,271 | |
Praxair Incorporated | | | | | | | 468 | | | | 51,414 | |
| | | | |
| | | | | | | | | | | 1,648,960 | |
| | | | | | | | | | | | |
| | | | |
| Construction Materials: 0.08% | | | | | | | | | | | | |
Martin Marietta Materials Incorporated | | | | | | | 267 | | | | 50,474 | |
| | | | | | | | | | | | |
| | | | |
| Containers & Packaging: 0.09% | | | | | | | | | | | | |
Crown Holdings Incorporated † | | | | | | | 1,051 | | | | 54,831 | |
| | | | | | | | | | | | |
| | | | |
| Metals & Mining: 2.41% | | | | | | | | | | | | |
Agnico-Eagle Mines Limited-U.S. Exchange Traded Shares | | | | | | | 4,600 | | | | 206,632 | |
Detour Gold Corporation † | | | | | | | 9,800 | | | | 193,631 | |
Fresnillo plc | | | | | | | 8,800 | | | | 128,602 | |
Goldcorp Incorporated-U.S. Exchange Traded Shares | | | | | | | 5,500 | | | | 92,510 | |
Newmont Mining Corporation | | | | | | | 8,600 | | | | 278,726 | |
Randgold Resources Limited ADR | | | | | | | 2,850 | | | | 240,284 | |
The accompanying notes are an integral part of these financial statements.
| | | | | | |
| Portfolio of investments—May 31, 2016 | | Wells Fargo Allocation Funds | | | 103 | |
REAL RETURN PORTFOLIO
| | | | | | | | | | | | | | | | |
| Security name | | | | | | | | Shares | | | Value | |
| | | | |
| Metals & Mining (continued) | | | | | | | | | | | | | | | | |
Royal Gold Incorporated | | | | | | | | | | | 2,377 | | | $ | 133,421 | |
Silver Wheaton Corporation | | | | | | | | | | | 7,000 | | | | 130,340 | |
Steel Dynamics Incorporated | | | | | | | | | | | 1,880 | | | | 46,417 | |
Tahoe Resources Incorporated | | | | | | | | | | | 8,000 | | | | 95,535 | |
| | | | |
| | | | | | | | | | | | | | | 1,546,098 | |
| | | | | | | | | | | | | | | | |
| | | | |
Total Common Stocks (Cost $10,010,837) | | | | | | | | | | | | | | | 10,847,943 | |
| | | | | | | | | | | | | | | | |
| | | | |
| | | Interest rate | | | Maturity date | | | Principal | | | | |
| Corporate Bonds and Notes: 10.42% | | | | | | | | | | | | | | | | |
| | | | |
Consumer Discretionary: 3.77% | | | | | | | | | | | | | | | | |
| | | | |
| Auto Components: 0.53% | | | | | | | | | | | | | | | | |
American Axle & Manufacturing Incorporated | | | 6.25 | % | | | 3-15-2021 | | | $ | 100,000 | | | | 104,000 | |
Cooper Tire & Rubber Company (i) | | | 8.00 | | | | 12-15-2019 | | | | 15,000 | | | | 17,138 | |
Goodyear Tire & Rubber Company | | | 7.00 | | | | 5-15-2022 | | | | 85,000 | | | | 91,269 | |
Tenneco Incorporated | | | 6.88 | | �� | | 12-15-2020 | | | | 125,000 | | | | 129,525 | |
| | | | |
| | | | | | | | | | | | | | | 341,932 | |
| | | | | | | | | | | | | | | | |
| | | | |
| Diversified Consumer Services: 0.16% | | | | | | | | | | | | | | | | |
Service Corporation International | | | 5.38 | | | | 1-15-2022 | | | | 100,000 | | | | 104,375 | |
| | | | | | | | | | | | | | | | |
| | | | |
| Hotels, Restaurants & Leisure: 0.53% | | | | | | | | | | | | | | | | |
Hilton Worldwide Finance LLC | | | 5.63 | | | | 10-15-2021 | | | | 100,000 | | | | 103,561 | |
MGM Resorts International | | | 7.63 | | | | 1-15-2017 | | | | 105,000 | | | | 108,281 | |
NCL Corporation Limited 144A | | | 5.25 | | | | 11-15-2019 | | | | 125,000 | | | | 127,500 | |
| | | | |
| | | | | | | | | | | | | | | 339,342 | |
| | | | | | | | | | | | | | | | |
| | | | |
| Household Durables: 0.57% | | | | | | | | | | | | | | | | |
Calatlantic Group Incorporated | | | 6.63 | | | | 5-1-2020 | | | | 15,000 | | | | 16,538 | |
DR Horton Incorporated | | | 3.63 | | | | 2-15-2018 | | | | 135,000 | | | | 137,363 | |
Lennar Corporation | | | 4.50 | | | | 6-15-2019 | | | | 100,000 | | | | 103,250 | |
Tempur Sealy International Incorporated | | | 6.88 | | | | 12-15-2020 | | | | 100,000 | | | | 106,320 | |
| | | | |
| | | | | | | | | | | | | | | 363,471 | |
| | | | | | | | | | | | | | | | |
| | | | |
| Media: 0.93% | | | | | | | | | | | | | | | | |
CCO Holdings LLC | | | 6.63 | | | | 1-31-2022 | | | | 125,000 | | | | 132,625 | |
CSC Holdings LLC | | | 7.63 | | | | 7-15-2018 | | | | 75,000 | | | | 81,375 | |
DISH DBS Corporation | | | 4.25 | | | | 4-1-2018 | | | | 130,000 | | | | 133,250 | |
Nexstar Broadcasting Group Incorporated | | | 6.88 | | | | 11-15-2020 | | | | 75,000 | | | | 78,188 | |
Sinclair Television Group Incorporated | | | 6.38 | | | | 11-1-2021 | | | | 85,000 | | | | 89,675 | |
TEGNA Incorporated | | | 5.13 | | | | 10-15-2019 | | | | 50,000 | | | | 51,375 | |
TEGNA Incorporated | | | 5.13 | | | | 7-15-2020 | | | | 30,000 | | | | 31,050 | |
| | | | |
| | | | | | | | | | | | | | | 597,538 | |
| | | | | | | | | | | | | | | | |
| | | | |
| Multiline Retail: 0.16% | | | | | | | | | | | | | | | | |
Dollar Tree Incorporated 144A | | | 5.25 | | | | 3-1-2020 | | | | 100,000 | | | | 104,219 | |
| | | | | | | | | | | | | | | | |
The accompanying notes are an integral part of these financial statements.
| | | | |
| 104 | | Wells Fargo Allocation Funds | | Portfolio of investments—May 31, 2016 |
REAL RETURN PORTFOLIO
| | | | | | | | | | | | | | | | |
| Security name | | Interest rate | | | Maturity date | | | Principal | | | Value | |
| | | | |
| Specialty Retail: 0.53% | | | | | | | | | | | | | | | | |
Best Buy Company Incorporated | | | 5.00 | % | | | 8-1-2018 | | | $ | 100,000 | | | $ | 104,750 | |
L Brands Incorporated | | | 6.90 | | | | 7-15-2017 | | | | 120,000 | | | | 126,900 | |
Sally Beauty Holdings Incorporated | | | 5.75 | | | | 6-1-2022 | | | | 100,000 | | | | 104,000 | |
| | | | |
| | | | | | | | | | | | | | | 335,650 | |
| | | | | | | | | | | | | | | | |
| | | | |
| Textiles, Apparel & Luxury Goods: 0.36% | | | | | | | | | | | | | | | | |
HanesBrands Incorporated | | | 6.38 | | | | 12-15-2020 | | | | 125,000 | | | | 128,985 | |
The William Carter Company | | | 5.25 | | | | 8-15-2021 | | | | 100,000 | | | | 103,500 | |
| | | | |
| | | | | | | | | | | | | | | 232,485 | |
| | | | | | | | | | | | | | | | |
| | | | |
Consumer Staples: 0.72% | | | | | | | | | | | | | | | | |
| | | | |
| Beverages: 0.16% | | | | | | | | | | | | | | | | |
Cott Beverages Incorporated | | | 6.75 | | | | 1-1-2020 | | | | 100,000 | | | | 104,500 | |
| | | | | | | | | | | | | | | | |
| | | | |
| Food Products: 0.36% | | | | | | | | | | | | | | | | |
Pinnacle Foods Incorporated | | | 4.88 | | | | 5-1-2021 | | | | 100,000 | | | | 102,000 | |
Smithfield Foods Incorporated | | | 7.75 | | | | 7-1-2017 | | | | 120,000 | | | | 127,560 | |
| | | | |
| | | | | | | | | | | | | | | 229,560 | |
| | | | | | | | | | | | | | | | |
| | | | |
| Household Products: 0.20% | | | | | | | | | | | | | | | | |
Spectrum Brands Incorporated | | | 6.38 | | | | 11-15-2020 | | | | 120,000 | | | | 125,850 | |
| | | | | | | | | | | | | | | | |
| | | | |
Energy: 0.85% | | | | | | | | | | | | | | | | |
| | | | |
| Energy Equipment & Services: 0.15% | | | | | | | | | | | | | | | | |
NGPL PipeCo LLC 144A | | | 7.12 | | | | 12-15-2017 | | | | 95,000 | | | | 99,750 | |
| | | | | | | | | | | | | | | | |
| | | | |
| Oil, Gas & Consumable Fuels: 0.70% | | | | | | | | | | | | | | | | |
Kinder Morgan Incorporated | | | 7.00 | | | | 6-15-2017 | | | | 60,000 | | | | 62,627 | |
Rockies Express Pipeline LLC 144A | | | 6.00 | | | | 1-15-2019 | | | | 50,000 | | | | 51,875 | |
Sabine Pass LNG LP | | | 7.50 | | | | 11-30-2016 | | | | 65,000 | | | | 66,463 | |
Targa Resources Partners Incorporated | | | 5.00 | | | | 1-15-2018 | | | | 130,000 | | | | 132,600 | |
Tesoro Corporation | | | 4.25 | | | | 10-1-2017 | | | | 65,000 | | | | 66,463 | |
Tesoro Logistics LP | | | 5.88 | | | | 10-1-2020 | | | | 65,000 | | | | 66,950 | |
| | | | |
| | | | | | | | | | | | | | | 446,978 | |
| | | | | | | | | | | | | | | | |
| | | | |
Financials: 1.60% | | | | | | | | | | | | | | | | |
| | | | |
| Banks: 0.21% | | | | | | | | | | | | | | | | |
CIT Group Incorporated | | | 4.25 | | | | 8-15-2017 | | | | 105,000 | | | | 106,239 | |
CIT Group Incorporated | | | 5.25 | | | | 3-15-2018 | | | | 25,000 | | | | 25,813 | |
| | | | |
| | | | | | | | | | | | | | | 132,052 | |
| | | | | | | | | | | | | | | | |
| | | | |
| Consumer Finance: 1.00% | | | | | | | | | | | | | | | | |
Ally Financial Incorporated | | | 6.25 | | | | 12-1-2017 | | | | 125,000 | | | | 130,313 | |
Diamond 1 Finance Corporation 144A%% | | | 3.48 | | | | 6-1-2019 | | | | 100,000 | | | | 101,329 | |
General Motors Financial Company Incorporated | | | 3.25 | | | | 5-15-2018 | | | | 135,000 | | | | 137,552 | |
Navient Corporation | | | 4.63 | | | | 9-25-2017 | | | | 130,000 | | | | 132,600 | |
Toll Brothers Finance Corporation | | | 4.00 | | | | 12-31-2018 | | | | 135,000 | | | | 140,063 | |
| | | | |
| | | | | | | | | | | | | | | 641,857 | |
| | | | | | | | | | | | | | | | |
The accompanying notes are an integral part of these financial statements.
| | | | | | |
| Portfolio of investments—May 31, 2016 | | Wells Fargo Allocation Funds | | | 105 | |
REAL RETURN PORTFOLIO
| | | | | | | | | | | | | | | | |
| Security name | | Interest rate | | | Maturity date | | | Principal | | | Value | |
| | | | |
| REITs: 0.39% | | | | | | | | | | | | | | | | |
Iron Mountain Incorporated 144A | | | 6.00 | % | | | 10-1-2020 | | | $ | 100,000 | | | $ | 105,500 | |
VEREIT Operating Partnership LP | | | 2.00 | | | | 2-6-2017 | | | | 135,000 | | | | 135,173 | |
VEREIT Operating Partnership LP %% | | | 4.13 | | | | 6-1-2021 | | | | 10,000 | | | | 10,100 | |
| | | | |
| | | | | | | | | | | | | | | 250,773 | |
| | | | | | | | | | | | | | | | |
| | | | |
Health Care: 0.68% | | | | | | | | | | | | | | | | |
| | | | |
| Health Care Providers & Services: 0.68% | | | | | | | | | | | | | | | | |
Centene Corporation 144A | | | 5.63 | | | | 2-15-2021 | | | | 65,000 | | | | 67,600 | |
Fresenius Medical Care Holdings Incorporated | | | 6.88 | | | | 7-15-2017 | | | | 125,000 | | | | 131,719 | |
HCA Incorporated | | | 8.00 | | | | 10-1-2018 | | | | 115,000 | | | | 128,800 | |
Tenet Healthcare Corporation | | | 6.25 | | | | 11-1-2018 | | | | 100,000 | | | | 105,125 | |
| | | | |
| | | | | | | | | | | | | | | 433,244 | |
| | | | | | | | | | | | | | | | |
| | | | |
Industrials: 0.93% | | | | | | | | | | | | | | | | |
| | | | |
| Airlines: 0.16% | | | | | | | | | | | | | | | | |
US Airways Group Incorporated | | | 6.13 | | | | 6-1-2018 | | | | 100,000 | | | | 104,000 | |
| | | | | | | | | | | | | | �� | | |
| | | | |
| Building Products: 0.14% | | | | | | | | | | | | | | | | |
USG Corporation | | | 9.75 | | | | 1-15-2018 | | | | 80,000 | | | | 89,422 | |
| | | | | | | | | | | | | | | | |
| | | | |
| Commercial Services & Supplies: 0.17% | | | | | | | | | | | | | | | | |
ACCO Brands Corporation | | | 6.75 | | | | 4-30-2020 | | | | 105,000 | | | | 110,906 | |
| | | | | | | | | | | | | | | | |
| | | | |
| Machinery: 0.24% | | | | | | | | | | | | | | | | |
Case New Holland Industrial Incorporated | | | 7.88 | | | | 12-1-2017 | | | | 65,000 | | | | 69,550 | |
SPX Flow Incorporated | | | 6.88 | | | | 9-1-2017 | | | | 80,000 | | | | 83,300 | |
| | | | |
| | | | | | | | | | | | | | | 152,850 | |
| | | | | | | | | | | | | | | | |
| | | | |
| Trading Companies & Distributors: 0.22% | | | | | | | | | | | | | | | | |
Ashtead Capital Incorporated 144A | | | 6.50 | | | | 7-15-2022 | | | | 100,000 | | | | 104,438 | |
United Rentals North America Incorporated | | | 7.38 | | | | 5-15-2020 | | | | 33,000 | | | | 34,320 | |
| | | | |
| | | | | | | | | | | | | | | 138,758 | |
| | | | | | | | | | | | | | | | |
| | | | |
Information Technology: 0.62% | | | | | | | | | | | | | | | | |
| | | | |
| Communications Equipment: 0.16% | | | | | | | | | | | | | | | | |
ViaSat Incorporated | | | 6.88 | | | | 6-15-2020 | | | | 100,000 | | | | 103,125 | |
| | | | | | | | | | | | | | | | |
| | | | |
| Electronic Equipment, Instruments & Components: 0.13% | | | | | | | | | | | | | | | | |
Jabil Circuit Incorporated | | | 8.25 | | | | 3-15-2018 | | | | 75,000 | | | | 81,563 | |
| | | | | | | | | | | | | | | | |
| | | | |
| Internet Software & Services: 0.20% | | | | | | | | | | | | | | | | |
IAC/InterActiveCorp | | | 4.88 | | | | 11-30-2018 | | | | 123,000 | | | | 125,921 | |
| | | | | | | | | | | | | | | | |
| | | | |
| Software: 0.13% | | | | | | | | | | | | | | | | |
Activision Blizzard Incorporated 144A | | | 5.63 | | | | 9-15-2021 | | | | 80,000 | | | | 84,000 | |
| | | | | | | | | | | | | | | | |
| | | | |
Materials: 0.63% | | | | | | | | | | | | | | | | |
| | | | |
| Chemicals: 0.13% | | | | | | | | | | | | | | | | |
Ashland Incorporated | | | 3.88 | | | | 4-15-2018 | | | | 80,000 | | | | 82,000 | |
| | | | | | | | | | | | | | | | |
The accompanying notes are an integral part of these financial statements.
| | | | |
| 106 | | Wells Fargo Allocation Funds | | Portfolio of investments—May 31, 2016 |
REAL RETURN PORTFOLIO
| | | | | | | | | | | | | | | | |
| Security name | | Interest rate | | | Maturity date | | | Principal | | | Value | |
| | | | |
| Containers & Packaging: 0.32% | | | | | | | | | | | | | | | | |
Owens-Illinois Incorporated | | | 7.80 | % | | | 5-15-2018 | | | $ | 120,000 | | | $ | 130,800 | |
Reynolds Group Holdings | | | 5.75 | | | | 10-15-2020 | | | | 70,000 | | | | 72,188 | |
| | | | |
| | | | | | | | | | | | | | | 202,988 | |
| | | | | | | | | | | | | | | | |
| | | | |
| Metals & Mining: 0.18% | | | | | | | | | | | | | | | | |
Alcoa Incorporated | | | 6.75 | | | | 7-15-2018 | | | | 60,000 | | | | 64,800 | |
Steel Dynamics Incorporated | | | 6.13 | | | | 8-15-2019 | | | | 50,000 | | | | 51,875 | |
| | | | |
| | | | | | | | | | | | | | | 116,675 | |
| | | | | | | | | | | | | | | | |
| | | | |
Telecommunication Services: 0.52% | | | | | | | | | | | | | | | | |
| | | | |
| Diversified Telecommunication Services: 0.35% | | | | | | | | | | | | | | | | |
Frontier Communications Corporation | | | 8.13 | | | | 10-1-2018 | | | | 60,000 | | | | 65,100 | |
Hughes Satelite Systems Corporation | | | 6.50 | | | | 6-15-2019 | | | | 75,000 | | | | 80,438 | |
SBA Communications Corporation | | | 5.63 | | | | 10-1-2019 | | | | 80,000 | | | | 82,900 | |
| | | | |
| | | | | | | | | | | | | | | 228,438 | |
| | | | | | | | | | | | | | | | |
| | | | |
| Wireless Telecommunication Services: 0.17% | | | | | | | | | | | | | | | | |
T-Mobile USA Incorporated | | | 6.25 | | | | 4-1-2021 | | | | 5,000 | | | | 5,238 | |
T-Mobile USA Incorporated | | | 6.46 | | | | 4-28-2019 | | | | 100,000 | | | | 101,688 | |
| | | | |
| | | | | | | | | | | | | | | 106,926 | |
| | | | | | | | | | | | | | | | |
| | | | |
Utilities: 0.10% | | | | | | | | | | | | | | | | |
| | | | |
| Independent Power & Renewable Electricity Producers: 0.10% | | | | | | | | | | | | | | | | |
NRG Energy Incorporated | | | 7.63 | | | | 1-15-2018 | | | | 60,000 | | | | 64,650 | |
| | | | | | | | | | | | | | | | |
| | | | |
Total Corporate Bonds and Notes (Cost $6,659,854) | | | | | | | | | | | | | | | 6,675,798 | |
| | | | | | | | | | | | | | | | |
| | | | |
Loans: 3.55% | | | | | | | | | | | | | | | | |
| | | | |
Consumer Discretionary: 0.66% | | | | | | | | | | | | | | | | |
| | | | |
| Auto Components: 0.15% | | | | | | | | | | | | | | | | |
Allison Transmission Incorporated ± | | | 3.50 | | | | 8-23-2019 | | | | 100,000 | | | | 100,264 | |
| | | | | | | | | | | | | | | | |
| | | | |
| Media: 0.30% | | | | | | | | | | | | | | | | |
Live Nation Entertainment Incorporated ± | | | 3.50 | | | | 8-16-2020 | | | | 100,000 | | | | 100,125 | |
Virgin Media Investment Holdings Limited ± | | | 3.65 | | | | 6-30-2023 | | | | 90,898 | | | | 90,929 | |
| | | | |
| | | | | | | | | | | | | | | 191,054 | |
| | | | | | | | | | | | | | | | |
| | | | |
| Multiline Retail: 0.21% | | | | | | | | | | | | | | | | |
Michaels Stores Incorporated ± | | | 3.75 | | | | 1-28-2020 | | | | 132,944 | | | | 133,110 | |
| | | | | | | | | | | | | | | | |
| | | | |
Financials: 0.21% | | | | | | | | | | | | | | | | |
| | | | |
| Diversified Financial Services: 0.21% | | | | | | | | | | | | | | | | |
Delos Finance SARL ± | | | 3.50 | | | | 3-6-2021 | | | | 135,000 | | | | 135,405 | |
| | | | | | | | | | | | | | | | |
| | | | |
Health Care: 0.34% | | | | | | | | | | | | | | | | |
| | | | |
| Health Care Equipment & Supplies: 0.16% | | | | | | | | | | | | | | | | |
Prestige Brands Incorporated ±%%< | | | 0.00 | | | | 9-3-2021 | | | | 100,000 | | | | 100,250 | |
| | | | | | | | | | | | | | | | |
The accompanying notes are an integral part of these financial statements.
| | | | | | |
| Portfolio of investments—May 31, 2016 | | Wells Fargo Allocation Funds | | | 107 | |
REAL RETURN PORTFOLIO
| | | | | | | | | | | | | | | | |
| Security name | | Interest rate | | | Maturity date | | | Principal | | | Value | |
| | | | |
| Health Care Providers & Services: 0.18% | | | | | | | | | | | | | | | | |
Community Health Systems Incorporated ± | | | 3.92 | % | | | 12-31-2018 | | | $ | 118,263 | | | $ | 118,079 | |
| | | | |
| | | | | | | | | | | | | | | 118,079 | |
| | | | | | | | | | | | | | | | |
| | | | |
Industrials: 1.02% | | | | | | | | | | | | | | | | |
| | | | |
| Aerospace & Defense: 0.19% | | | | | | | | | | | | | | | | |
TransDigm Incorporated ± | | | 3.75 | | | | 2-28-2020 | | | | 118,522 | | | | 118,485 | |
| | | | | | | | | | | | | | | | |
| | | | |
| Airlines: 0.21% | | | | | | | | | | | | | | | | |
Delta Air Lines Incorporated ± | | | 0.03 | | | | 8-24-2022 | | | | 134,325 | | | | 134,224 | |
| | | | | | | | | | | | | | | | |
| | | | |
| Commercial Services & Supplies: 0.62% | | | | | | | | | | | | | | | | |
Hertz Corporation ± | | | 3.00 | | | | 3-11-2018 | | | | 132,944 | | | | 132,575 | |
KAR Auction Services Incorporated ± | | | 3.94 | | | | 3-9-2021 | | | | 133,082 | | | | 133,525 | |
ServiceMaster Company ± | | | 4.25 | | | | 7-1-2021 | | | | 133,308 | | | | 133,808 | |
| | | | |
| | | | | | | | | | | | | | | 399,908 | |
| | | | | | | | | | | | | | | | |
| | | | |
Information Technology: 0.50% | | | | | | | | | | | | | | | | |
| | | | |
| Internet Software & Services: 0.10% | | | | | | | | | | | | | | | | |
Zayo Group LLC ± | | | 3.75 | | | | 5-6-2021 | | | | 62,460 | | | | 62,518 | |
| | | | | | | | | | | | | | | | |
| | | | |
| IT Services: 0.16% | | | | | | | | | | | | | | | | |
First Data Corporation ± | | | 4.19 | | | | 7-8-2022 | | | | 100,000 | | | | 100,208 | |
| | | | | | | | | | | | | | | | |
| | | | |
| Semiconductors & Semiconductor Equipment: 0.24% | | | | | | | | | | | | | | | | |
Avago Technologies ± | | | 4.25 | | | | 2-1-2023 | | | | 100,000 | | | | 100,239 | |
NXP Semiconductors NV ± | | | 3.75 | | | | 12-7-2020 | | | | 53,454 | | | | 53,602 | |
| | | | |
| | | | | | | | | | | | | | | 153,841 | |
| | | | | | | | | | | | | | | | |
| | | | |
Materials: 0.41% | | | | | | | | | | | | | | | | |
| | | | |
| Chemicals: 0.20% | | | | | | | | | | | | | | | | |
Ineos US Finance LLC ± | | | 3.75 | | | | 12-15-2020 | | | | 132,973 | | | | 131,810 | |
| | | | | | | | | | | | | | | | |
| | | | |
| Containers & Packaging: 0.21% | | | | | | | | | | | | | | | | |
Berry Plastics Group Incorporated ± | | | 3.50 | | | | 2-8-2020 | | | | 132,944 | | | | 132,969 | |
| | | | | | | | | | | | | | | | |
| | | | |
Telecommunication Services: 0.41% | | | | | | | | | | | | | | | | |
| | | | |
| Diversified Telecommunication Services: 0.41% | | | | | | | | | | | | | | | | |
Level 3 Financing Incorporated ± | | | 3.50 | | | | 5-31-2022 | | | | 135,000 | | | | 134,943 | |
West Corporation ± | | | 3.25 | | | | 6-30-2018 | | | | 127,491 | | | | 127,350 | |
| | | | |
| | | | | | | | | | | | | | | 262,293 | |
| | | | | | | | | | | | | | | | |
| | | | |
Total Loans (Cost $2,267,585) | | | | | | | | | | | | | | | 2,274,418 | |
| | | | | | | | | | | | | | | | |
| | | | |
U.S. Treasury Securities: 65.19% | | | | | | | | | | | | | | | | |
TIPS | | | 0.13 | | | | 4-15-2018 | | | | 283,256 | | | | 286,837 | |
TIPS | | | 0.13 | | | | 4-15-2019 | | | | 1,564,840 | | | | 1,587,721 | |
TIPS | | | 0.13 | | | | 4-15-2020 | | | | 3,848,323 | | | | 3,897,478 | |
TIPS | | | 0.13 | | | | 4-15-2021 | | | | 959,403 | | | | 969,708 | |
TIPS | | | 0.13 | | | | 1-15-2022 | | | | 1,535,891 | | | | 1,542,670 | |
The accompanying notes are an integral part of these financial statements.
| | | | |
| 108 | | Wells Fargo Allocation Funds | | Portfolio of investments—May 31, 2016 |
REAL RETURN PORTFOLIO
| | | | | | | | | | | | | | | | |
| Security name | | Interest rate | | | Maturity date | | | Principal | | | Value | |
| | | | |
U.S. Treasury Securities (continued) | | | | | | | | | | | | | | | | |
TIPS | | | 0.13 | % | | | 7-15-2022 | | | $ | 1,672,139 | | | $ | 1,682,807 | |
TIPS | | | 0.13 | | | | 1-15-2023 | | | | 1,738,128 | | | | 1,733,964 | |
TIPS | | | 0.13 | | | | 7-15-2024 | | | | 1,885,170 | | | | 1,872,185 | |
TIPS | | | 0.25 | | | | 1-15-2025 | | | | 1,558,153 | | | | 1,553,020 | |
TIPS | | | 0.38 | | | | 7-15-2023 | | | | 1,723,957 | | | | 1,755,047 | |
TIPS | | | 0.38 | | | | 7-15-2025 | | | | 1,812,274 | | | | 1,831,388 | |
TIPS | | | 0.63 | | | | 7-15-2021 | | | | 1,415,603 | | | | 1,470,586 | |
TIPS | | | 0.63 | | | | 1-15-2024 | | | | 1,750,055 | | | | 1,803,011 | |
TIPS | | | 0.63 | | | | 1-15-2026 | | | | 1,968,939 | | | | 2,032,955 | |
TIPS | | | 0.63 | | | | 2-15-2043 | | | | 569,586 | | | | 526,414 | |
TIPS | | | 0.75 | | | | 2-15-2042 | | | | 848,245 | | | | 808,671 | |
TIPS | | | 0.75 | | | | 2-15-2045 | | | | 1,172,899 | | | | 1,113,980 | |
TIPS | | | 1.00 | | | | 2-15-2046 | | | | 472,289 | | | | 483,309 | |
TIPS | | | 1.13 | | | | 1-15-2021 | | | | 1,322,455 | | | | 1,398,238 | |
TIPS | | | 1.25 | | | | 7-15-2020 | | | | 1,266,453 | | | | 1,348,310 | |
TIPS | | | 1.38 | | | | 7-15-2018 | | | | 1,065,505 | | | | 1,115,784 | |
TIPS | | | 1.38 | | | | 1-15-2020 | | | | 704,633 | | | | 746,673 | |
TIPS | | | 1.38 | | | | 2-15-2044 | | | | 883,710 | | | | 971,678 | |
TIPS | | | 1.63 | | | | 1-15-2018 | | | | 312,546 | | | | 324,470 | |
TIPS | | | 1.75 | | | | 1-15-2028 | | | | 676,235 | | | | 774,069 | |
TIPS | | | 1.88 | | | | 7-15-2019 | | | | 524,106 | | | | 564,124 | |
TIPS | | | 2.00 | | | | 1-15-2026 | | | | 719,778 | | | | 831,625 | |
TIPS | | | 2.13 | | | | 1-15-2019 | | | | 460,231 | | | | 492,094 | |
TIPS | | | 2.13 | | | | 2-15-2040 | | | | 385,560 | | | | 484,239 | |
TIPS | | | 2.13 | | | | 2-15-2041 | | | | 380,541 | | | | 481,771 | |
TIPS | | | 2.38 | | | | 1-15-2025 | | | | 1,149,467 | | | | 1,351,386 | |
TIPS | | | 2.38 | | | | 1-15-2027 | | | | 649,369 | | | | 781,584 | |
TIPS | | | 2.50 | | | | 1-15-2029 | | | | 659,849 | | | | 817,749 | |
TIPS | | | 2.63 | | | | 7-15-2017 | | | | 206,786 | | | | 215,870 | |
TIPS | | | 3.38 | | | | 4-15-2032 | | | | 201,210 | | | | 287,020 | |
TIPS | | | 3.63 | | | | 4-15-2028 | | | | 713,973 | | | | 969,572 | |
TIPS | | | 3.88 | | | | 4-15-2029 | | | | 622,791 | | | | 878,784 | |
| | | | |
Total U.S. Treasury Securities (Cost $40,364,353) | | | | | | | | | | | | | | | 41,786,791 | |
| | | | | | | | | | | | | | | | |
| | | | |
Yankee Corporate Bonds and Notes: 1.21% | | | | | | | | | | | | | | | | |
| | | | |
Consumer Discretionary: 0.32% | | | | | | | | | | | | | | | | |
| | | | |
| Auto Components: 0.16% | | | | | | | | | | | | | | | | |
Schaeffler Holding Finance BV 144A | | | 6.25 | | | | 11-15-2019 | | | | 100,000 | | | | 104,500 | |
| | | | | | | | | | | | | | | | |
| | | | |
| Automobiles: 0.16% | | | | | | | | | | | | | | | | |
Jaguar Land Rover Automotive plc 144A | | | 4.13 | | | | 12-15-2018 | | | | 100,000 | | | | 102,750 | |
| | | | | | | | | | | | | | | | |
| | | | |
Consumer Staples: 0.16% | | | | | | | | | | | | | | | | |
| | | | |
| Food & Staples Retailing: 0.16% | | | | | | | | | | | | | | | | |
Tesco plc 144A | | | 5.50 | | | | 11-15-2017 | | | | 100,000 | | | | 104,652 | |
| | | | | | | | | | | | | | | | |
| | | | |
Financials: 0.26% | | | | | | | | | | | | | | | | |
| | | | |
| Banks: 0.26% | | | | | | | | | | | | | | | | |
Nielsen Holding and Finance BV 144A | | | 5.50 | | | | 10-1-2021 | | | | 80,000 | | | | 83,200 | |
The accompanying notes are an integral part of these financial statements.
| | | | | | |
| Portfolio of investments—May 31, 2016 | | Wells Fargo Allocation Funds | | | 109 | |
REAL RETURN PORTFOLIO
| | | | | | | | | | | | | | | | |
| Security name | | Interest rate | | | Maturity date | | | Principal | | | Value | |
| | | | |
| Banks (continued) | | | | | | | | | | | | | | | | |
Royal Bank of Scotland Group plc | | | 4.70 | % | | | 7-3-2018 | | | $ | 80,000 | | | $ | 82,507 | |
| | | | |
| | | | | | | | | | | | | | | 165,707 | |
| | | | | | | | | | | | | | | | |
| | | | |
Health Care: 0.15% | | | | | | | | | | | | | | | | |
| | | | |
| Pharmaceuticals: 0.15% | | | | | | | | | | | | | | | | |
Mallinckrodt International Finance SA | | | 3.50 | | | | 4-15-2018 | | | | 100,000 | | | | 97,250 | |
| | | | | | | | | | | | | | | | |
| | | | |
Information Technology: 0.17% | | | | | | | | | | | | | | | | |
| | | | |
| Communications Equipment: 0.17% | | | | | | | | | | | | | | | | |
Nokia Corporation | | | 5.38 | | | | 5-15-2019 | | | | 100,000 | | | | 106,600 | |
| | | | | | | | | | | | | | | | |
| | | | |
Materials: 0.15% | | | | | | | | | | | | | | | | |
| | | | |
| Containers & Packaging: 0.15% | | | | | | | | | | | | | | | | |
Ardagh Packaging Finance plc 144A± | | | 3.63 | | | | 12-15-2019 | | | | 95,000 | | | | 95,238 | |
| | | | | | | | | | | | | | | | |
| | | | |
Total Yankee Corporate Bonds and Notes (Cost $774,066) | | | | | | | | | | | | | | | 776,697 | |
| | | | | | | | | | | | | | | | |
| | | | |
| | | Yield | | | | | | Shares | | | | |
| Short-Term Investments: 1.04% | | | | | | | | | | | | | | | | |
| | | | |
| Investment Companies: 0.96% | | | | | | | | | | | | | | | | |
Wells Fargo Government Money Market Fund Select Class (l)(u)## | | | 0.23 | | | | | | | | 618,330 | | | | 618,330 | |
| | | | | | | | | | | | | | | | |
| | | | | | | | | Principal | | | | |
| | | | |
| U.S. Treasury Securities: 0.08% | | | | | | | | | | | | | | | | |
U.S. Treasury Bill (z)# | | | 0.30 | | | | 6-16-2016 | | | $ | 50,000 | | | | 49,997 | |
| | | | | | | | | | | | | | | | |
| | | | |
Total Short-Term Investments (Cost $668,323) | | | | | | | | | | | | | | | 668,327 | |
| | | | | | | | | | | | | | | | |
| | | | | | | | |
| Total investments in securities (Cost $60,745,018) * | | | 98.33 | % | | | 63,029,974 | |
Other assets and liabilities, net | | | 1.67 | | | | 1,067,907 | |
| | | | | | | | |
| Total net assets | | | 100.00 | % | | $ | 64,097,881 | |
| | | | | | | | |
| † | Non-income-earning security |
| (i) | Illiquid security for which the designation as illiquid is unaudited. |
| 144A | The security may be resold in transactions exempt from registration, normally to qualified institutional buyers, pursuant to Rule 144A under the Securities Act of 1933. |
| %% | The security is issued on a when-issued basis. |
| ± | Variable rate investment. The rate shown is the rate in effect at period end. |
| < | All or a portion of the position represents an unfunded loan commitment. |
| (l) | The issuer of the security is an affiliated person of the Portfolio as defined in the Investment Company Act of 1940. |
| (u) | The rate represents the 7-day annualized yield at period end. |
| ## | All or a portion of this security is segregated for when-issued securities and/or unfunded loans. |
| (z) | Zero coupon security. The rate represents the current yield to maturity. |
| # | All or a portion of this security is segregated as collateral for investments in derivative instruments. |
| * | Cost for federal income tax purposes is $60,839,053 and unrealized gains (losses) consists of: |
| | | | |
Gross unrealized gains | | $ | 2,850,475 | |
Gross unrealized losses | | | (659,554 | ) |
| | | | |
Net unrealized gains | | $ | 2,190,921 | |
The accompanying notes are an integral part of these financial statements.
| | | | |
| 110 | | Wells Fargo Allocation Funds | | Portfolio of investments—May 31, 2016 |
STABLE INCOME PORTFOLIO
| | | | | | | | | | | | | | | | |
| Security name | | Interest rate | | | Maturity date | | | Principal | | | Value | |
| | | | |
Agency Securities: 23.33% | | | | | | | | | | | | | | | | |
FHLMC | | | 6.00 | % | | | 7-1-2017 | | | $ | 6,356 | | | $ | 6,412 | |
FHLMC | | | 7.50 | | | | 7-17-2017 | | | | 8,298 | | | | 8,364 | |
FHLMC Series T-54 Class 4A ± | | | 3.14 | | | | 2-25-2043 | | | | 415,626 | | | | 438,143 | |
FHLMC Series T-57 Class 1A2 | | | 7.00 | | | | 7-25-2043 | | | | 518,364 | | | | 621,624 | |
FHLMC Series T-63 Class 1A1 ± | | | 1.58 | | | | 2-25-2045 | | | | 358,728 | | | | 360,705 | |
FHLMC Structured Pass-Through Securities Series T-54 Class 3A | | | 7.00 | | | | 2-25-2043 | | | | 383,901 | | | | 456,802 | |
FHLMC Structured Pass-Through Securities Series T-55 Class 1A2 | | | 7.00 | | | | 3-25-2043 | | | | 578,557 | | | | 644,152 | |
FHLMC Structured Pass-Through Securities Series T-58 Class 4A | | | 7.50 | | | | 9-25-2043 | | | | 644,577 | | | | 771,594 | |
FNMA ± | | | 1.58 | | | | 10-1-2034 | | | | 196,179 | | | | 199,964 | |
FNMA ± | | | 1.58 | | | | 4-1-2044 | | | | 152,455 | | | | 155,324 | |
FNMA ± | | | 1.58 | | | | 10-1-2044 | | | | 207,364 | | | | 211,366 | |
FNMA ± | | | 1.72 | | | | 7-1-2017 | | | | 61 | | | | 61 | |
FNMA ± | | | 1.84 | | | | 4-1-2037 | | | | 237,977 | | | | 245,337 | |
FNMA ± | | | 1.87 | | | | 9-1-2033 | | | | 115,950 | | | | 119,870 | |
FNMA ± | | | 1.91 | | | | 4-1-2034 | | | | 271,239 | | | | 285,902 | |
FNMA ± | | | 1.92 | | | | 10-1-2033 | | | | 304,047 | | | | 315,239 | |
FNMA ± | | | 2.06 | | | | 6-1-2033 | | | | 279,113 | | | | 293,232 | |
FNMA ± | | | 2.16 | | | | 8-1-2035 | | | | 241,485 | | | | 253,645 | |
FNMA ± | | | 2.20 | | | | 12-1-2033 | | | | 250,884 | | | | 263,025 | |
FNMA ± | | | 2.29 | | | | 1-1-2036 | | | | 187,181 | | | | 195,330 | |
FNMA ± | | | 2.34 | | | | 7-1-2035 | | | | 180,369 | | | | 190,071 | |
FNMA ± | | | 2.46 | | | | 6-1-2033 | | | | 200,430 | | | | 206,150 | |
FNMA | | | 5.50 | | | | 2-1-2017 | | | | 12,484 | | | | 12,589 | |
FNMA Series 2003-W4 Class 3A ± | | | 6.44 | | | | 10-25-2042 | | | | 237,132 | | | | 271,650 | |
FNMA Series 2004-W2 Class 2A2 | | | 7.00 | | | | 2-25-2044 | | | | 170,650 | | | | 198,744 | |
FNMA Series 2007-88 Class HC ± | | | 2.59 | | | | 9-25-2037 | | | | 207,716 | | | | 220,182 | |
HUD | | | 0.83 | | | | 8-1-2016 | | | | 150,000 | | | | 150,066 | |
| | | | |
Total Agency Securities (Cost $6,627,572) | | | | | | | | | | | | | | | 7,095,543 | |
| | | | | | | | | | | | | | | | |
| | | | |
Asset-Backed Securities: 26.77% | | | | | | | | | | | | | | | | |
Ally Auto Receivables Trust Series 2013-2 Class A3 | | | 0.79 | | | | 1-15-2018 | | | | 26,907 | | | | 26,898 | |
Ally Auto Receivables Trust Series 2014-SN1 Class A3 | | | 0.75 | | | | 2-21-2017 | | | | 824 | | | | 823 | |
Ally Auto Receivables Trust Series 2014-SN2 Class A2B ± | | | 0.74 | | | | 3-20-2017 | | | | 9,568 | | | | 9,567 | |
Ally Auto Receivables Trust Series 2015-1 Class A2 | | | 0.92 | | | | 2-15-2018 | | | | 92,514 | | | | 92,484 | |
Ally Auto Receivables Trust Series 2016-1 Class A2A | | | 1.20 | | | | 8-15-2018 | | | | 140,000 | | | | 140,113 | |
Ally Auto Receivables Trust Series 2016-2 Class A2 | | | 1.17 | | | | 10-15-2018 | | | | 140,000 | | | | 140,054 | |
Ally Auto Receivables Trust Series 2016-3 Class A2 | | | 1.19 | | | | 12-17-2018 | | | | 150,000 | | | | 149,998 | |
American Express Credit Account Master Trust Series 2014-4 Class A | | | 1.43 | | | | 6-15-2020 | | | | 130,000 | | | | 130,551 | |
AmeriCredit Automobile Receivables Trust Series 2013-5 Class A3 | | | 0.90 | | | | 9-10-2018 | | | | 32,771 | | | | 32,764 | |
AmeriCredit Automobile Receivables Trust Series 2014-1 Class A3 | | | 0.90 | | | | 2-8-2019 | | | | 54,456 | | | | 54,422 | |
AmeriCredit Automobile Receivables Trust Series 2014-4 Class A3 | | | 1.27 | | | | 7-8-2019 | | | | 125,000 | | | | 124,951 | |
AmeriCredit Automobile Receivables Trust Series 2015-2 Class A3 | | | 1.27 | | | | 1-8-2020 | | | | 135,000 | | | | 134,827 | |
AmeriCredit Automobile Receivables Trust Series 2016-1 Class A2 ± | | | 1.19 | | | | 6-10-2019 | | | | 140,000 | | | | 140,216 | |
AmeriCredit Automobile Receivables Trust Series 2016-2 Class A2A | | | 1.42 | | | | 10-8-2019 | | | | 140,000 | | | | 139,923 | |
Bank of the West Auto Trust Series 2014-1 Class A3 144A | | | 1.09 | | | | 3-15-2019 | | | | 114,639 | | | | 114,556 | |
Bank of the West Auto Trust Series 2015-1 Class A2 144A± | | | 0.78 | | | | 4-16-2018 | | | | 55,217 | | | | 55,194 | |
BMW Vehicle Lease Trust Series 2014-1 Class A3 | | | 0.73 | | | | 2-21-2017 | | | | 27,406 | | | | 27,397 | |
Capital Auto Receivables Asset Trust Series 2014-2 Class A4 | | | 1.62 | | | | 10-22-2018 | | | | 150,000 | | | | 150,271 | |
Capital Auto Receivables Asset Trust Series 2015-1 Class A2 | | | 1.42 | | | | 6-20-2018 | | | | 130,000 | | | | 130,057 | |
Capital Auto Receivables Asset Trust Series 2015-2 Class A1B ± | | | 0.84 | | | | 10-20-2017 | | | | 150,000 | | | | 149,887 | |
The accompanying notes are an integral part of these financial statements.
| | | | | | |
| Portfolio of investments—May 31, 2016 | | Wells Fargo Allocation Funds | | | 111 | |
STABLE INCOME PORTFOLIO
| | | | | | | | | | | | | | | | |
| Security name | | Interest rate | | | Maturity date | | | Principal | | | Value | |
| | | | |
Asset-Backed Securities (continued) | | | | | | | | | | | | | | | | |
Capital Auto Receivables Asset Trust Series 2016-1 Class A2B ± | | | 1.14 | % | | | 11-20-2018 | | | $ | 75,000 | | | $ | 75,121 | |
Capital One Multi-Asset Execution Trust Series 2014-A2 Class A2 | | | 1.26 | | | | 1-15-2020 | | | | 100,000 | | | | 100,184 | |
CarMax Auto Owner Trust Series 2014-1 Class A3 | | | 0.79 | | | | 10-15-2018 | | | | 64,197 | | | | 64,064 | |
CarMax Auto Owner Trust Series 2015-1 Class A3 | | | 1.38 | | | | 11-15-2019 | | | | 130,000 | | | | 130,294 | |
CarMax Auto Owner Trust Series 2015-3 Class A2B ± | | | 0.88 | | | | 11-15-2018 | | | | 111,109 | | | | 111,231 | |
CarMax Auto Owner Trust Series 2016-1 Class A2 | | | 1.30 | | | | 4-15-2019 | | | | 140,000 | | | | 140,236 | |
CarMax Auto Owner Trust Series 2016-2 Class A2A | | | 1.24 | | | | 6-17-2019 | | | | 150,000 | | | | 149,833 | |
Chase Issuance Trust Series 2014-A6 Class A6 | | | 1.26 | | | | 7-15-2019 | | | | 120,000 | | | | 120,267 | |
Chrysler Capital Auto Receivables Trust Series 2014-AA Class A3 144A | | | 0.83 | | | | 9-17-2018 | | | | 27,339 | | | | 27,326 | |
CNH Equipment Trust Series 2014-A Class A3 | | | 0.84 | | | | 5-15-2019 | | | | 55,020 | | | | 54,945 | |
College Loan Corporation Trust Series 2004-1 Class A4 ± | | | 0.83 | | | | 4-25-2024 | | | | 103,057 | | | | 101,488 | |
Fifth Third Auto Trust Series 2014-1 Class A3 | | | 0.68 | | | | 4-16-2018 | | | | 34,255 | | | | 34,235 | |
Fifth Third Auto Trust Series 2014-2 Class A3 | | | 0.89 | | | | 11-15-2018 | | | | 97,525 | | | | 97,506 | |
Ford Credit Auto Owner Trust Series 2014-A Class A3 | | | 0.79 | | | | 5-15-2018 | | | | 87,813 | | | | 87,764 | |
Ford Credit Auto Owner Trust Series 2014-B Class A3 | | | 0.90 | | | | 10-15-2018 | | | | 83,179 | | | | 83,153 | |
Ford Credit Auto Owner Trust Series 2014-C Class A3 | | | 1.06 | | | | 5-15-2019 | | | | 250,000 | | | | 250,030 | |
Ford Credit Auto Owner Trust Series 2016-A Class A2 ± | | | 0.83 | | | | 12-15-2018 | | | | 140,000 | | | | 140,191 | |
Ford Credit Auto Owner Trust Series 2016-B Class A2A | | | 1.08 | | | | 3-15-2019 | | | | 150,000 | | | | 149,958 | |
GE Equipment Small Ticket LLC Series 2014-1A Class A3 144A | | | 0.95 | | | | 9-25-2017 | | | | 58,190 | | | | 58,127 | |
GM Financial Automobile Lease Series 2014-1A Class A3 144A | | | 1.01 | | | | 5-22-2017 | | | | 39,551 | | | | 39,548 | |
GM Financial Automobile Lease Series 2016-1A Class A2 | | | 1.30 | | | | 7-20-2018 | | | | 140,000 | | | | 139,907 | |
GM Financial Automobile Lease Series 2016-2 Class A2A | | | 1.28 | | | | 10-22-2018 | | | | 160,000 | | | | 159,689 | |
GSAMP Trust Series 2005-SEA2 Class A1 144A± | | | 0.80 | | | | 1-25-2045 | | | | 138,887 | | | | 137,356 | |
Honda Auto Receivables Owner Trust Series 2014-1 Class A3 | | | 0.67 | | | | 11-21-2017 | | | | 52,813 | | | | 52,776 | |
Honda Auto Receivables Owner Trust Series 2014-4 Class A3 | | | 0.99 | | | | 9-17-2018 | | | | 95,356 | | | | 95,348 | |
Honda Auto Receivables Owner Trust Series 2015-3 Class A2 | | | 0.92 | | | | 11-20-2017 | | | | 123,122 | | | | 123,122 | |
Honda Auto Receivables Owner Trust Series 2016-2 A2 | | | 1.13 | | | | 9-15-2018 | | | | 150,000 | | | | 149,995 | |
Hyundai Auto Lease Securitization Trust Series 2015-A Class A3 144A | | | 1.42 | | | | 9-17-2018 | | | | 130,000 | | | | 130,213 | |
Hyundai Auto Lease Securitization Trust Series 2015-B Class A3 144A | | | 1.40 | | | | 11-15-2018 | | | | 140,000 | | | | 140,239 | |
Hyundai Auto Lease Securitization Trust Series 2016-A Class A2 144A | | | 1.33 | | | | 7-16-2018 | | | | 140,000 | | | | 140,088 | |
Hyundai Auto Lease Securitization Trust Series 2016-B Class A2A 144A | | | 1.24 | | | | 11-15-2018 | | | | 150,000 | | | | 149,995 | |
Hyundai Auto Receivables Trust Series 2014-A Class A3 | | | 0.79 | | | | 7-16-2018 | | | | 51,917 | | | | 51,883 | |
Hyundai Auto Receivables Trust Series 2015-A Class A3 | | | 1.05 | | | | 4-15-2019 | | | | 130,000 | | | | 129,996 | |
Hyundai Auto Receivables Trust Series 2016-A Class A2 | | | 1.21 | | | | 6-17-2019 | | | | 130,000 | | | | 130,007 | |
John Deere Owner Trust Series 2014-A Class A3 | | | 0.92 | | | | 4-16-2018 | | | | 63,999 | | | | 63,974 | |
John Deere Owner Trust Series 2015-A Class A3 | | | 1.32 | | | | 6-17-2019 | | | | 130,000 | | | | 130,181 | |
Mercedes Benz Auto Lease Trust Series 2016-A Class A2A | | | 1.34 | | | | 7-16-2018 | | | | 75,000 | | | | 75,127 | |
Mercedes Benz Auto Receivables Trust Series 2015-1 Class A2B ± | | | 0.70 | | | | 6-15-2018 | | | | 99,802 | | | | 99,815 | |
Mercedes-Benz Auto Lease Trust Series 2015-A Class A3 | | | 1.10 | | | | 8-15-2017 | | | | 130,000 | | | | 130,068 | |
Nissan Auto Receivables Owner Trust Series 2014-A Class A3 | | | 0.72 | | | | 8-15-2018 | | | | 54,334 | | | | 54,252 | |
Nissan Auto Receivables Owner Trust Series 2014-B Class A3 | | | 1.11 | | | | 5-15-2019 | | | | 130,000 | | | | 130,077 | |
Nissan Auto Receivables Owner Trust Series 2015-A Class A3 | | | 1.05 | | | | 10-15-2019 | | | | 135,000 | | | | 134,898 | |
Nissan Auto Receivables Owner Trust Series 2015-B Class A2B ± | | | 0.71 | | | | 7-16-2018 | | | | 105,555 | | | | 105,625 | |
Nissan Auto Receivables Owner Trust Series 2016-A Class A2A | | | 1.22 | | | | 8-15-2018 | | | | 150,000 | | | | 149,893 | |
Santander Drive Auto Receivables Trust Series 2015-3 Class A2A | | | 1.02 | | | | 9-17-2018 | | | | 57,853 | | | | 57,828 | |
Santander Drive Auto Receivables Trust Series 2015-4 Class A2B ± | | | 1.13 | | | | 12-17-2018 | | | | 78,958 | | | | 79,030 | |
Santander Drive Auto Receivables Trust Series 2016-2 Class A2A | | | 1.38 | | | | 7-15-2019 | | | | 150,000 | | | | 149,891 | |
SunTrust Auto Receivables Trust Series 2015-1A Class A2 144A | | | 0.99 | | | | 6-15-2018 | | | | 84,283 | | | | 84,285 | |
Toyota Auto Receivables Owner Trust 2016-B Class A2A | | | 1.02 | | | | 10-15-2018 | | | | 180,000 | | | | 179,866 | |
Toyota Auto Receivables Owner Trust Series 2014-A Class A3 | | | 0.67 | | | | 12-15-2017 | | | | 51,039 | | | | 50,993 | |
The accompanying notes are an integral part of these financial statements.
| | | | |
| 112 | | Wells Fargo Allocation Funds | | Portfolio of investments—May 31, 2016 |
STABLE INCOME PORTFOLIO
| | | | | | | | | | | | | | | | |
| Security name | | Interest rate | | | Maturity date | | | Principal | | | Value | |
| | | | |
Asset-Backed Securities (continued) | | | | | | | | | | | | | | | | |
Toyota Auto Receivables Owner Trust Series 2014-B Class A3 | | | 0.76 | % | | | 3-15-2018 | | | $ | 77,492 | | | $ | 77,439 | |
Toyota Auto Receivables Owner Trust Series 2015-B Class A2B ± | | | 0.64 | | | | 11-15-2017 | | | | 89,223 | | | | 89,246 | |
Toyota Auto Receivables Owner Trust Series 2015-C Class A2B ± | | | 0.76 | | | | 2-15-2018 | | | | 101,333 | | | | 101,382 | |
Volkswagen Auto Lease Trust Series 2014-A Class A3 | | | 0.80 | | | | 4-20-2017 | | | | 37,965 | | | | 37,959 | |
Volkswagen Auto Lease Trust Series 2015-A Class A3 | | | 1.25 | | | | 12-20-2017 | | | | 130,000 | | | | 129,612 | |
Volvo Financial Equipment LLC Series 2014-1A Class A3 144A | | | 0.82 | | | | 4-16-2018 | | | | 65,828 | | | | 65,685 | |
Volvo Financial Equipment LLC Series 2015-1A Class A3 144A | | | 1.51 | | | | 6-17-2019 | | | | 150,000 | | | | 149,907 | |
World Omni Auto Receivables Trust Series 2015-B | | | 0.96 | | | | 7-15-2019 | | | | 123,812 | | | | 123,575 | |
| | | | |
Total Asset-Backed Securities (Cost $8,143,016) | | | | | | | | | | | | | | | 8,141,676 | |
| | | | | | | | | | | | | | | | |
| | | | |
Corporate Bonds and Notes: 26.49% | | | | | | | | | | | | | | | | |
| | | | |
Consumer Discretionary: 1.10% | | | | | | | | | | | | | | | | |
| | | | |
| Automobiles: 0.33% | | | | | | | | | | | | | | | | |
American Honda Finance Corporation ± | | | 1.48 | | | | 2-22-2019 | | | | 50,000 | | | | 50,520 | |
Hyundai Capital America 144A | | | 1.45 | | | | 2-6-2017 | | | | 50,000 | | | | 49,987 | |
| | | | |
| | | | | | | | | | | | | | | 100,507 | |
| | | | | | | | | | | | | | | | |
| | | | |
| Hotels, Restaurants & Leisure: 0.24% | | | | | | | | | | | | | | | | |
McDonald’s Corporation | | | 5.80 | | | | 10-15-2017 | | | | 70,000 | | | | 74,309 | |
| | | | | | | | | | | | | | | | |
| | | | |
| Specialty Retail: 0.53% | | | | | | | | | | | | | | | | |
Lowe’s Companies Incorporated | | | 1.63 | | | | 4-15-2017 | | | | 160,000 | | | | 160,855 | |
| | | | | | | | | | | | | | | | |
| | | | |
Consumer Staples: 2.35% | | | | | | | | | | | | | | | | |
| | | | |
| Beverages: 1.09% | | | | | | | | | | | | | | | | |
Anheuser-Busch InBev NV Companies Incorporated | | | 1.38 | | | | 7-15-2017 | | | | 140,000 | | | | 140,354 | |
Brown Forman Corporation | | | 1.00 | | | | 1-15-2018 | | | | 100,000 | | | | 99,536 | |
PepsiCo Incorporated ± | | | 0.88 | | | | 7-17-2017 | | | | 90,000 | | | | 90,134 | |
| | | | |
| | | | | | | | | | | | | | | 330,024 | |
| | | | | | | | | | | | | | | | |
| | | | |
| Food Products: 1.26% | | | | | | | | | | | | | | | | |
Cargill Incorporated 144A | | | 1.90 | | | | 3-1-2017 | | | | 114,000 | | | | 114,773 | |
Diageo Capital plc | | | 1.50 | | | | 5-11-2017 | | | | 90,000 | | | | 90,321 | |
General Mills Incorporated | | | 5.70 | | | | 2-15-2017 | | | | 85,000 | | | | 87,825 | |
Kraft Heinz Company 144A | | | 1.60 | | | | 6-30-2017 | | | | 90,000 | | | | 90,332 | |
| | | | |
| | | | | | | | | | | | | | | 383,251 | |
| | | | | | | | | | | | | | | | |
| | | | |
Energy: 1.19% | | | | | | | | | | | | | | | | |
| | | | |
| Oil, Gas & Consumable Fuels: 1.19% | | | | | | | | | | | | | | | | |
Chevron Corporation ± | | | 0.75 | | | | 2-22-2017 | | | | 110,000 | | | | 109,940 | |
Chevron Corporation ± | | | 1.13 | | | | 5-16-2018 | | | | 60,000 | | | | 60,070 | |
Chevron Corporation | | | 1.34 | | | | 11-9-2017 | | | | 30,000 | | | | 30,077 | |
Exxon Mobil Corporation ± | | | 1.23 | | | | 2-28-2018 | | | | 90,000 | | | | 90,747 | |
Marathon Oil Corporation | | | 6.00 | | | | 10-1-2017 | | | | 70,000 | | | | 72,066 | |
| | | | |
| | | | | | | | | | | | | | | 362,900 | |
| | | | | | | | | | | | | | | | |
The accompanying notes are an integral part of these financial statements.
| | | | | | |
| Portfolio of investments—May 31, 2016 | | Wells Fargo Allocation Funds | | | 113 | |
STABLE INCOME PORTFOLIO
| | | | | | | | | | | | | | | | |
| Security name | | Interest rate | | | Maturity date | | | Principal | | | Value | |
| | | | |
Financials: 10.21% | | | | | | | | | | | | | | | | |
| | | | |
| Banks: 3.33% | | | | | | | | | | | | | | | | |
Bank of America Corporation | | | 2.00 | % | | | 1-11-2018 | | | $ | 50,000 | | | $ | 50,185 | |
Bank of America Corporation | | | 3.88 | | | | 3-22-2017 | | | | 70,000 | | | | 71,423 | |
Berkshire Hathaway Finance Corporation ± | | | 1.32 | | | | 3-15-2019 | | | | 100,000 | | | | 100,879 | |
Branch Banking & Trust Company ± | | | 0.95 | | | | 9-13-2016 | | | | 250,000 | | | | 250,080 | |
Citigroup Incorporated | | | 1.80 | | | | 2-5-2018 | | | | 150,000 | | | | 150,162 | |
Citigroup Incorporated | | | 1.85 | | | | 11-24-2017 | | | | 40,000 | | | | 40,105 | |
HSBC USA Incorporated ± | | | 1.40 | | | | 8-7-2018 | | | | 110,000 | | | | 109,581 | |
JPMorgan Chase & Company | | | 3.15 | | | | 7-5-2016 | | | | 120,000 | | | | 120,249 | |
JPMorgan Chase & Company | | | 6.00 | | | | 1-15-2018 | | | | 60,000 | | | | 64,167 | |
US Bancorp ± | | | 1.12 | | | | 11-15-2018 | | | | 55,000 | | | | 54,949 | |
| | | | |
| | | | | | | | | | | | | | | 1,011,780 | |
| | | | | | | | | | | | | | | | |
| | | | |
| Capital Markets: 1.99% | | | | | | | | | | | | | | | | |
Bank of New York Mellon Corporation ± | | | 1.50 | | | | 8-17-2020 | | | | 90,000 | | | | 89,715 | |
Charles Schwab Corporation | | | 2.20 | | | | 7-25-2018 | | | | 90,000 | | | | 91,079 | |
Goldman Sachs Group Incorporated ± | | | 1.68 | | | | 4-25-2019 | | | | 70,000 | | | | 70,211 | |
Goldman Sachs Group Incorporated | | | 2.38 | | | | 1-22-2018 | | | | 40,000 | | | | 40,430 | |
Goldman Sachs Group Incorporated | | | 5.95 | | | | 1-18-2018 | | | | 50,000 | | | | 53,331 | |
Morgan Stanley | | | 4.75 | | | | 3-22-2017 | | | | 50,000 | | | | 51,384 | |
Morgan Stanley | | | 5.55 | | | | 4-27-2017 | | | | 115,000 | | | | 119,445 | |
State Street Corporation ± | | | 1.53 | | | | 8-18-2020 | | | | 90,000 | | | | 90,269 | |
| | | | |
| | | | | | | | | | | | | | | 605,864 | |
| | | | | | | | | | | | | | | | |
| | | | |
| Consumer Finance: 2.54% | | | | | | | | | | | | | | | | |
American Honda Finance Corporation | | | 0.95 | | | | 5-5-2017 | | | | 60,000 | | | | 60,014 | |
American Honda Finance Corporation | | | 1.55 | | | | 12-11-2017 | | | | 30,000 | | | | 30,156 | |
BMW Bank North America | | | 0.70 | | | | 7-18-2016 | | | | 245,000 | | | | 245,112 | |
Caterpillar Financial Service | | | 1.80 | | | | 11-13-2018 | | | | 90,000 | | | | 91,187 | |
Daimler Finance North America LLC 144A | | | 2.63 | | | | 9-15-2016 | | | | 150,000 | | | | 150,700 | |
John Deere Capital Corporation ± | | | 1.20 | | | | 1-8-2019 | | | | 75,000 | | | | 75,401 | |
Toyota Motor Credit Corporation | | | 2.05 | | | | 1-12-2017 | | | | 120,000 | | | | 120,832 | |
| | | | |
| | | | | | | | | | | | | | | 773,402 | |
| | | | | | | | | | | | | | | | |
| | | | |
| Diversified Financial Services: 0.61% | | | | | | | | | | | | | | | | |
AIG Global Funding 144A | | | 1.65 | | | | 12-15-2017 | | | | 100,000 | | | | 100,222 | |
General Electric Capital Corporation | | | 5.63 | | | | 9-15-2017 | | | | 80,000 | | | | 84,605 | |
| | | | |
| | | | | | | | | | | | | | | 184,827 | |
| | | | | | | | | | | | | | | | |
| | | | |
| Insurance: 0.76% | | | | | | | | | | | | | | | | |
Marsh & McLennan Company Incorporated | | | 2.55 | | | | 10-15-2018 | | | | 54,000 | | | | 54,922 | |
New York Life Global Funding 144A | | | 1.55 | | | | 11-2-2018 | | | | 70,000 | | | | 70,253 | |
Travelers Company Incorporated | | | 5.80 | | | | 5-15-2018 | | | | 97,000 | | | | 105,152 | |
| | | | |
| | | | | | | | | | | | | | | 230,327 | |
| | | | | | | | | | | | | | | | |
| | | | |
| REITs: 0.98% | | | | | | | | | | | | | | | | |
AvalonBay Communities Incorporated | | | 5.70 | | | | 3-15-2017 | | | | 80,000 | | | | 82,561 | |
Boston Properties LP | | | 3.70 | | | | 11-15-2018 | | | | 90,000 | | | | 93,977 | |
The accompanying notes are an integral part of these financial statements.
| | | | |
| 114 | | Wells Fargo Allocation Funds | | Portfolio of investments—May 31, 2016 |
STABLE INCOME PORTFOLIO
| | | | | | | | | | | | | | | | |
| Security name | | Interest rate | | | Maturity date | | | Principal | | | Value | |
| | | | |
| REITs (continued) | | | | | | | | | | | | | | | | |
ERP Operating LP | | | 5.75 | % | | | 6-15-2017 | | | $ | 30,000 | | | $ | 31,348 | |
Simon Property Group LP | | | 2.15 | | | | 9-15-2017 | | | | 90,000 | | | | 90,845 | |
| | | | |
| | | | | | | | | | | | | | | 298,731 | |
| | | | | | | | | | | | | | | | |
| | | | |
Health Care: 1.90% | | | | | | | | | | | | | | | | |
| | | | |
| Biotechnology: 0.22% | | | | | | | | | | | | | | | | |
AbbVie Incorporated | | | 1.80 | | | | 5-14-2018 | | | | 65,000 | | | | 65,117 | |
| | | | | | | | | | | | | | | | |
| | | | |
| Health Care Equipment & Supplies: 0.46% | | | | | | | | | | | | | | | | |
Becton Dickinson & Company | | | 1.80 | | | | 12-15-2017 | | | | 50,000 | | | | 50,206 | |
Medtronic pIc ± | | | 1.43 | | | | 3-15-2020 | | | | 90,000 | | | | 90,916 | |
| | | | |
| | | | | | | | | | | | | | | 141,122 | |
| | | | | | | | | | | | | | | | |
| | | | |
| Health Care Providers & Services: 0.63% | | | | | | | | | | | | | | | | |
Cardinal Health Incorporated | | | 1.90 | | | | 6-15-2017 | | | | 90,000 | | | | 90,526 | |
UnitedHealth Group Incorporated | | | 1.45 | | | | 7-17-2017 | | | | 70,000 | | | | 70,300 | |
UnitedHealth Group Incorporated | | | 1.70 | | | | 2-15-2019 | | | | 30,000 | | | | 30,186 | |
| | | | |
| | | | | | | | | | | | | | | 191,012 | |
| | | | | | | | | | | | | | | | |
| | | | |
| Pharmaceuticals: 0.59% | | | | | | | | | | | | | | | | |
Johnson & Johnson ± | | | 0.91 | | | | 3-1-2019 | | | | 90,000 | | | | 90,172 | |
Merck & Company Incorporated ± | | | 0.75 | | | | 2-10-2017 | | | | 90,000 | | | | 90,021 | |
| | | | |
| | | | | | | | | | | | | | | 180,193 | |
| | | | | | | | | | | | | | | | |
| | | | |
Industrials: 2.29% | | | | | | | | | | | | | | | | |
| | | | |
| Aerospace & Defense: 0.40% | | | | | | | | | | | | | | | | |
Lockheed Martin Corporation | | | 1.85 | | | | 11-23-2018 | | | | 30,000 | | | | 30,266 | |
Northrop Grumman Corporation | | | 1.75 | | | | 6-1-2018 | | | | 90,000 | | | | 90,141 | |
| | | | |
| | | | | | | | | | | | | | | 120,407 | |
| | | | | | | | | | | | | | | | |
| | | | |
| Commercial Services & Supplies: 0.26% | | | | | | | | | | | | | | | | |
Cintas Corporation No. 2 | | | 2.85 | | | | 6-1-2016 | | | | 80,000 | | | | 80,000 | |
| | | | | | | | | | | | | | | | |
| | | | |
| Electrical Equipment: 0.56% | | | | | | | | | | | | | | | | |
ABB Treasury Center USA Incorporated 144A | | | 2.50 | | | | 6-15-2016 | | | | 90,000 | | | | 90,056 | |
Eaton Corporation | | | 1.50 | | | | 11-2-2017 | | | | 80,000 | | | | 80,166 | |
| | | | |
| | | | | | | | | | | | | | | 170,222 | |
| | | | | | | | | | | | | | | | |
| | | | |
| Industrial Conglomerates: 0.16% | | | | | | | | | | | | | | | | |
Roper Industries Incorporated | | | 1.85 | | | | 11-15-2017 | | | | 50,000 | | | | 50,110 | |
| | | | | | | | | | | | | | | | |
| | | | |
| Machinery: 0.32% | | | | | | | | | | | | | | | | |
Parker Hannifin Corporation | | | 5.50 | | | | 5-15-2018 | | | | 90,000 | | | | 97,338 | |
| | | | | | | | | | | | | | | | |
| | | | |
| Road & Rail: 0.59% | | | | | | | | | | | | | | | | |
Burlington Northern Santa Fe LLC | | | 5.65 | | | | 5-1-2017 | | | | 80,000 | | | | 83,374 | |
Union Pacific Corporation | | | 5.75 | | | | 11-15-2017 | | | | 90,000 | | | | 95,910 | |
| | | | |
| | | | | | | | | | | | | | | 179,284 | |
| | | | | | | | | | | | | | | | |
The accompanying notes are an integral part of these financial statements.
| | | | | | |
| Portfolio of investments—May 31, 2016 | | Wells Fargo Allocation Funds | | | 115 | |
STABLE INCOME PORTFOLIO
| | | | | | | | | | | | | | | | |
| Security name | | Interest rate | | | Maturity date | | | Principal | | | Value | |
| | | | |
Information Technology: 1.58% | | | | | | | | | | | | | | | | |
| | | | |
| Communications Equipment: 0.39% | | | | | | | | | | | | | | | | |
Cisco Systems Incorporated ± | | | 0.94 | % | | | 6-15-2018 | | | $ | 90,000 | | | $ | 90,154 | |
Cisco Systems Incorporated ± | | | 1.25 | | | | 2-21-2018 | | | | 30,000 | | | | 30,208 | |
| | | | |
| | | | | | | | | | | | | | | 120,362 | |
| | | | | | | | | | | | | | | | |
| | | | |
| IT Services: 0.16% | | | | | | | | | | | | | | | | |
Visa Incorporated | | | 1.20 | | | | 12-14-2017 | | | | 50,000 | | | | 50,145 | |
| | | | | | | | | | | | | | | | |
| | | | |
| Software: 0.30% | | | | | | | | | | | | | | | | |
Oracle Corporation ± | | | 0.83 | | | | 7-7-2017 | | | | 90,000 | | | | 90,158 | |
| | | | | | | | | | | | | | | | |
| | | | |
| Technology Hardware, Storage & Peripherals: 0.73% | | | | | | | | | | | | | | | | |
Apple Incorporated | | | 0.90 | | | | 5-12-2017 | | | | 90,000 | | | | 90,104 | |
Apple Incorporated | | | 1.70 | | | | 2-22-2019 | | | | 30,000 | | | | 30,278 | |
HP Enterprise Company 144A | | | 2.45 | | | | 10-5-2017 | | | | 100,000 | | | | 100,875 | |
| | | | |
| | | | | | | | | | | | | | | 221,257 | |
| | | | | | | | | | | | | | | | |
| | | | |
Materials: 0.89% | | | | | | | | | | | | | | | | |
| | | | |
| Chemicals: 0.89% | | | | | | | | | | | | | | | | |
Ecolab Incorporated | | | 3.00 | | | | 12-8-2016 | | | | 90,000 | | | | 90,928 | |
Praxair Incorporated | | | 1.05 | | | | 11-7-2017 | | | | 90,000 | | | | 89,818 | |
Sherwin-Williams Company | | | 1.35 | | | | 12-15-2017 | | | | 90,000 | | | | 90,019 | |
| | | | |
| | | | | | | | | | | | | | | 270,765 | |
| | | | | | | | | | | | | | | | |
| | | | |
Telecommunication Services: 0.73% | | | | | | | | | | | | | | | | |
| | | | |
| Diversified Telecommunication Services: 0.73% | | | | | | | | | | | | | | | | |
AT&T Incorporated | | | 1.60 | | | | 2-15-2017 | | | | 90,000 | | | | 90,316 | |
Verizon Communications Incorporated | | | 1.35 | | | | 6-9-2017 | | | | 130,000 | | | | 130,392 | |
| | | | |
| | | | | | | | | | | | | | | 220,708 | |
| | | | | | | | | | | | | | | | |
| | | | |
Utilities: 4.25% | | | | | | | | | | | | | | | | |
| | | | |
| Electric Utilities: 2.91% | | | | | | | | | | | | | | | | |
Alabama Power Company Series Q | | | 5.50 | | | | 10-15-2017 | | | | 90,000 | | | | 94,834 | |
Commonwealth Edison Company | | | 5.95 | | | | 8-15-2016 | | | | 120,000 | | | | 121,249 | |
Connecticut Light & Power | | | 5.38 | | | | 3-1-2017 | | | | 75,000 | | | | 77,359 | |
Florida Power & Light Company | | | 5.55 | | | | 11-1-2017 | | | | 115,000 | | | | 121,779 | |
Florida Power & Light Company | | | 5.80 | | | | 9-15-2017 | | | | 80,000 | | | | 84,540 | |
Public Service Colorado 1st Mortgage | | | 5.80 | | | | 8-1-2018 | | | | 39,000 | | | | 42,578 | |
Southern California Edison Company | | | 1.13 | | | | 5-1-2017 | | | | 90,000 | | | | 90,149 | |
Union Electric Company | | | 6.40 | | | | 6-15-2017 | | | | 120,000 | | | | 126,541 | |
Westar Energy Incorporated | | | 5.15 | | | | 1-1-2017 | | | | 75,000 | | | | 76,481 | |
Xcel Energy Incorporated | | | 1.20 | | | | 6-1-2017 | | | | 50,000 | | | | 49,945 | |
| | | | |
| | | | | | | | | | | | | | | 885,455 | |
| | | | | | | | | | | | | | | | |
| | | | |
| Gas Utilities: 0.30% | | | | | | | | | | | | | | | | |
Southern California Gas Company | | | 5.45 | | | | 4-15-2018 | | | | 85,000 | | | | 90,810 | |
| | | | | | | | | | | | | | | | |
The accompanying notes are an integral part of these financial statements.
| | | | |
| 116 | | Wells Fargo Allocation Funds | | Portfolio of investments—May 31, 2016 |
STABLE INCOME PORTFOLIO
| | | | | | | | | | | | | | | | |
| Security name | | Interest rate | | | Maturity date | | | Principal | | | Value | |
| | | | |
| Multi-Utilities: 1.04% | | | | | | | | | | | | | | | | |
Consumers Energy Company | | | 5.15 | % | | | 2-15-2017 | | | $ | 130,000 | | | $ | 133,910 | |
Entergy Mississippi Incorporated | | | 3.25 | | | | 6-1-2016 | | | | 80,000 | | | | 80,000 | |
Peco Energy Company | | | 5.35 | | | | 3-1-2018 | | | | 96,000 | | | | 102,597 | |
| |
| | | | 316,507 | |
| | | | | | | | | | | | | | | | |
| | | | |
Total Corporate Bonds and Notes (Cost $8,038,308) | | | | | | | | | | | | | | | 8,057,749 | |
| | | | | | | | | | | | | | | | |
| | | | |
Municipal Obligations: 0.92% | | | | | | | | | | | | | | | | |
| | | | |
| Arizona: 0.23% | | | | | | | | | | | | | | | | |
Arizona School Facilities Board Certificate of Participation Series A-3 (Miscellaneous Revenue) | | | 0.95 | | | | 9-1-2016 | | | | 70,000 | | | | 70,008 | |
| | | | | | | | | | | | | | | | |
| | | | |
| Michigan: 0.20% | | | | | | | | | | | | | | | | |
Chippewa Valley MI School District (GO Revenue, Qualified School Board Loan Fund Insured) | | | 1.18 | | | | 5-1-2017 | | | | 60,000 | | | | 60,226 | |
| | | | | | | | | | | | | | | | |
| | | | |
| Minnesota: 0.10% | | | | | | | | | | | | | | | | |
Saint Paul MN Housing & RDA HealthPartners Obligated Group Series B (Health Revenue) | | | 1.04 | | | | 7-1-2016 | | | | 30,000 | | | | 30,005 | |
| | | | | | | | | | | | | | | | |
| | | | |
| North Carolina: 0.39% | | | | | | | | | | | | | | | | |
North Carolina Education Assistance Authority Student Loan Notes Series 2011-1 Tranche A-2 (Education Revenue) ± | | | 1.54 | | | | 1-26-2026 | | | | 118,723 | | | | 118,519 | |
| | | | | | | | | | | | | | | | |
| | | |
Total Municipal Obligations (Cost $278,623) | | | | | | | | | | | | 278,758 | |
| | | | | | | | | | | | | | | | |
| | | | |
Non-Agency Mortgage-Backed Securities: 6.55% | | | | | | | | | | | | | | | | |
Bear Stearns Commercial Mortgage Securities Trust Series 2007-PW16 Class A1A ± | | | 5.72 | | | | 6-11-2040 | | | | 86,357 | | | | 89,258 | |
Bear Stearns Commercial Mortgage Securities Trust Series 2007-PW17 Class A1A ± | | | 5.65 | | | | 6-11-2050 | | | | 124,107 | | | | 128,762 | |
CGGS Commercial Mortgage Trust Series 2016 144A± | | | 2.08 | | | | 2-15-2033 | | | | 130,000 | | | | 130,938 | |
CIT Education Loan Trust Series 2005-1 Class A3 ± | | | 0.75 | | | | 3-15-2026 | | | | 63,901 | | | | 63,281 | |
CNH Equipment Trust Series 2014-B Class A3 | | | 0.91 | | | | 5-15-2019 | | | | 76,630 | | | | 76,546 | |
CNH Equipment Trust Series 2015 Class A2B ± | | | 0.90 | | | | 12-17-2018 | | | | 134,312 | | | | 134,434 | |
CNH Equipment Trust Series 2016-B Class A2A (a) | | | 1.31 | | | | 10-15-2019 | | | | 150,000 | | | | 150,058 | |
Commercial Mortgage Trust Pass-Through Certificates Series 2007-C9 Class A4 ± | | | 5.81 | | | | 12-10-2049 | | | | 127,339 | | | | 131,741 | |
Dell Equipment Finance Trust Series 2015-1 Class A2 144A | | | 1.01 | | | | 7-24-2017 | | | | 86,863 | | | | 86,830 | |
GAHR Commercial Mortgage Trust Series 2015 Class AFL1 144A± | | | 1.73 | | | | 12-15-2016 | | | | 138,717 | | | | 138,806 | |
JPMorgan Chase Commercial Mortgage Securities Trust Series 2007-LDPX Class A1A | | | 5.44 | | | | 1-15-2049 | | | | 92,917 | | | | 94,574 | |
MMAF Equipment Finance LLC Series 2016-A Class A2 144A | | | 1.39 | | | | 12-17-2018 | | | | 150,000 | | | | 149,900 | |
Morgan Stanley Capital I Series 2007-T27 Class A4 ± | | | 5.64 | | | | 6-11-2042 | | | | 121,607 | | | | 125,980 | |
SCG Trust Series 2013-SRP1 Class A 144A± | | | 1.83 | | | | 11-15-2026 | | | | 140,000 | | | | 139,750 | |
SLMA Series 2006-1 Class A5 ± | | | 0.75 | | | | 7-26-2021 | | | | 135,000 | | | | 134,119 | |
Structured Asset Securities Corporation Series 2006-RF3 Class 1A1 144A | | | 6.00 | | | | 10-25-2036 | | | | 124,536 | | | | 123,245 | |
Towd Point Mortgage Trust Series 2015-6 Class A1 144A±(a) | | | 3.50 | | | | 4-25-2055 | | | | 92,048 | | | | 93,986 | |
| | | |
Total Non-Agency Mortgage-Backed Securities (Cost $2,001,056) | | | | | | | | | | | | 1,992,208 | |
| | | | | | | | | | | | | | | | |
| | | | |
U.S. Treasury Securities: 12.89% | | | | | | | | | | | | | | | | |
U.S. Treasury Note | | | 0.63 | | | | 7-31-2017 | | | | 300,000 | | | | 299,437 | |
U.S. Treasury Note | | | 0.63 | | | | 9-30-2017 | | | | 1,350,000 | | | | 1,346,783 | |
U.S. Treasury Note | | | 0.75 | | | | 2-28-2018 | | | | 875,000 | | | | 873,223 | |
U.S. Treasury Note | | | 0.88 | | | | 7-15-2017 | | | | 1,400,000 | | | | 1,401,477 | |
| | | |
Total U.S. Treasury Securities (Cost $3,919,962) | | | | | | | | | | | | 3,920,920 | |
| | | | | | | | | | | | | | | | |
The accompanying notes are an integral part of these financial statements.
| | | | | | |
| Portfolio of investments—May 31, 2016 | | Wells Fargo Allocation Funds | | | 117 | |
STABLE INCOME PORTFOLIO
| | | | | | | | | | | | | | | | |
| Security name | | Interest rate | | | Maturity date | | | Principal | | | Value | |
| | | | |
Yankee Corporate Bonds and Notes: 1.70% | | | | | | | | | | | | | | | | |
| | | | |
Energy: 0.30% | | | | | | | | | | | | | | | | |
| | | | |
| Oil, Gas & Consumable Fuels: 0.30% | | | | | | | | | | | | | | | | |
Shell International Finance Company ± | | | 0.95 | % | | | 5-10-2017 | | | $ | 90,000 | | | $ | 90,096 | |
| | | | | | | | | | | | | | | | |
| | | | |
Financials: 0.92% | | | | | | | | | | | | | | | | |
| | | | |
| Banks: 0.59% | | | | | | | | | | | | | | | | |
Bank of Nova Scotia ± | | | 1.10 | | | | 6-11-2018 | | | | 90,000 | | | | 89,815 | |
Toronto Dominion Bank ± | | | 1.18 | | | | 7-23-2018 | | | | 90,000 | | | | 89,992 | |
| | | | |
| | | | | | | | | | | | | | | 179,807 | |
| | | | | | | | | | | | | | | | |
| | | | |
| Diversified Financial Services: 0.33% | | | | | | | | | | | | | | | | |
ConocoPhillips Canada Funding Company | | | 5.63 | | | | 10-15-2016 | | | | 100,000 | | | | 101,611 | |
| | | | | | | | | | | | | | | | |
| | | | |
Industrials: 0.48% | | | | | | | | | | | | | | | | |
| | | | |
| Road & Rail: 0.48% | | | | | | | | | | | | | | | | |
Canadian National Railway Company | | | 1.45 | | | | 12-15-2016 | | | | 90,000 | | | | 90,251 | |
Canadian National Railway Company | | | 5.80 | | | | 6-1-2016 | | | | 57,000 | | | | 57,000 | |
| | | | |
| | | | | | | | | | | | | | | 147,251 | |
| | | | | | | | | | | | | | | | |
| | | | |
Total Yankee Corporate Bonds and Notes (Cost $519,012) | | | | | | | | | | | | | | | 518,765 | |
| | | | | | | | | | | | | | | | |
| | | | |
| | | Yield | | | | | | Shares | | | | |
| Short-Term Investments: 1.04% | |
| | | | |
| Investment Companies: 1.04% | | | | | | | | | | | | | | | | |
Wells Fargo Cash Investment Money Market Fund Select Class (l)(u) | | | 0.41 | | | | | | | | 317,146 | | | | 317,146 | |
| | | | | | | | | | | | | | | | |
| | | |
Total Short-Term Investments (Cost $317,146) | | | | | | | | | | | | 317,146 | |
| | | | | | | | | | | | | | | | |
| | | | | | | | |
| Total investments in securities (Cost $29,844,695) * | | | 99.69 | % | | | 30,322,765 | |
Other assets and liabilities, net | | | 0.31 | | | | 95,436 | |
| | | | | | | | |
| Total net assets | | | 100.00 | % | | $ | 30,418,201 | |
| | | | | | | | |
| ± | Variable rate investment. The rate shown is the rate in effect at period end. |
| 144A | The security may be resold in transactions exempt from registration, normally to qualified institutional buyers, pursuant to Rule 144A under the Securities Act of 1933. |
| (a) | The security is fair valued in accordance with procedures approved by the Board of Trustees. |
| (l) | The issuer of the security is an affiliated person of the Portfolio as defined in the Investment Company Act of 1940. |
| (u) | The rate represents the 7-day annualized yield at period end. |
| * | Cost for federal income tax purposes is $29,844,695 and unrealized gains (losses) consists of: |
| | | | |
Gross unrealized gains | | $ | 510,739 | |
Gross unrealized losses | | | (32,669 | ) |
| | | | |
Net unrealized gains | | $ | 478,070 | |
The accompanying notes are an integral part of these financial statements.
| | | | |
| 118 | | Wells Fargo Allocation Funds | | Statements of assets and liabilities—May 31, 2016 |
| | | | | | | | |
| | | C&B Large Cap Value Portfolio | | | Diversified Large
Cap Growth Portfolio | |
| | |
Assets | | | | | | | | |
Investments | | | | | | | | |
In unaffiliated securities (including securities on loan), at value (see cost below) | | $ | 278,436,916 | | | $ | 113,251,607 | |
In affiliated securities, at value (see cost below) | | | 26,317,459 | | | | 5,231,602 | |
| | | | |
Total investments, at value (see cost below) | | | 304,754,375 | | | | 118,483,209 | |
Cash | | | 17,670 | | | | 0 | |
Foreign currency, at value (see cost below) | | | 0 | | | | 0 | |
Receivable for investments sold | | | 259,153 | | | | 922,481 | |
Receivable for dividends | | | 554,970 | | | | 120,029 | |
Receivable for securities lending income | | | 3,494 | | | | 1,484 | |
Prepaid expenses and other assets | | | 592 | | | | 330 | |
| | | | |
Total assets | | | 305,590,254 | | | | 119,527,533 | |
| | | | |
| | |
Liabilities | | | | | | | | |
Payable for investments purchased | | | 0 | | | | 591,975 | |
Payable upon receipt of securities loaned | | | 12,454,900 | | | | 3,113,406 | |
Payable for daily variation margin on open futures contracts | | | 0 | | | | 0 | |
Due to custodian bank | | | 0 | | | | 0 | |
Advisory fee payable | | | 159,438 | | �� | | 47,773 | |
Accrued expenses and other liabilities | | | 11,627 | | | | 15,903 | |
| | | | |
Total liabilities | | | 12,625,965 | | | | 3,769,057 | |
| | | | |
Total net assets | | $ | 292,964,289 | | | $ | 115,758,476 | |
| | | | |
| | |
Investments in unaffiliated securities (including securities on loan), at cost | | $ | 210,754,976 | | | $ | 76,805,738 | |
| | | | |
Investments in affiliated securities, at cost | | $ | 26,317,459 | | | $ | 5,231,602 | |
| | | | |
Total investments, at cost | | $ | 237,072,435 | | | $ | 82,037,340 | |
| | | | |
Securities on loan, at value | | $ | 12,216,762 | | | $ | 3,056,884 | |
| | | | |
Foreign currency, at cost | | $ | 0 | | | $ | 0 | |
| | | | |
The accompanying notes are an integral part of these financial statements.
| | | | | | |
| Statements of assets and liabilities—May 31, 2016 | | Wells Fargo Allocation Funds | | | 119 | |
| | | | | | | | | | | | | | | | | | | | | | | | | | |
Emerging Growth Portfolio | | | Index Portfolio | | | International Growth
Portfolio | | | International Value
Portfolio | | | Large Company Value
Portfolio | | | Small Company Growth
Portfolio | | | Small Company Value
Portfolio | |
| | | | | | |
| | | | | | | | | | | | | | | | | | | | | | | | | | |
| | | | | | | | | | | | | | | | | | | | | | | | | | |
| $ | 881,803,132 | | | $ | 2,280,382,178 | | | $ | 139,081,211 | | | $ | 493,603,692 | | | $ | 77,925,106 | | | $ | 1,165,439,366 | | | $ | 213,456,058 | |
| | 107,801,958 | | | | 67,271,596 | | | | 12,373,217 | | | | 16,847,390 | | | | 2,883,174 | | | | 191,548,024 | | | | 10,841,628 | |
| | |
| | 989,605,090 | | | | 2,347,653,774 | | | | 151,454,428 | | | | 510,451,082 | | | | 80,808,280 | | | | 1,356,987,390 | | | | 224,297,686 | |
| | 0 | | | | 22,803 | | | | 0 | | | | 0 | | | | 9,201 | | | | 0 | | | | 0 | |
| | 0 | | | | 0 | | | | 293,888 | | | | 8,634,767 | | | | 0 | | | | 0 | | | | 0 | |
| | 2,761,183 | | | | 1,362,819 | | | | 866,987 | | | | 33,527 | | | | 699,380 | | | | 7,015,660 | | | | 4,010,253 | |
| | 59,172 | | | | 5,412,117 | | | | 417,958 | | | | 3,701,260 | | | | 198,742 | | | | 442,558 | | | | 189,778 | |
| | 149,480 | | | | 6,050 | | | | 53,622 | | | | 232,005 | | | | 3,040 | | | | 204,650 | | | | 20,988 | |
| | 625 | | | | 1,706 | | | | 797 | | | | 494 | | | | 538 | | | | 5,660 | | | | 615 | |
| | |
| | 992,575,550 | | | | 2,354,459,269 | | | | 153,087,680 | | | | 523,053,135 | | | | 81,719,181 | | | | 1,364,655,918 | | | | 228,519,320 | |
| | |
| | | | | | |
| | | | | | | | | | | | | | | | | | | | | | | | | | |
| | 642,370 | | | | 1,078,571 | | | | 1,738,254 | | | | 0 | | | | 796,799 | | | | 15,415,653 | | | | 4,829,981 | |
| | 92,823,723 | | | | 12,693,253 | | | | 2,506,158 | | | | 14,316,539 | | | | 1,759,295 | | | | 151,177,536 | | | | 5,965,825 | |
| | 0 | | | | 36,000 | | | | 0 | | | | 0 | | | | 0 | | | | 0 | | | | 0 | |
| | 0 | | | | 0 | | | | 328,836 | | | | 0 | | | | 0 | | | | 682,735 | | | | 0 | |
| | 581,155 | | | | 167,698 | | | | 106,110 | | | | 361,069 | | | | 40,657 | | | | 771,774 | | | | 143,912 | |
| | 40,637 | | | | 71,289 | | | | 31,707 | | | | 56,557 | | | | 7,600 | | | | 11,780 | | | | 9,832 | |
| | |
| | 94,087,885 | | | | 14,046,811 | | | | 4,711,065 | | | | 14,734,165 | | | | 2,604,351 | | | | 168,059,478 | | | | 10,949,550 | |
| | |
| $ | 898,487,665 | | | $ | 2,340,412,458 | | | $ | 148,376,615 | | | $ | 508,318,970 | | | $ | 79,114,830 | | | $ | 1,196,596,440 | | | $ | 217,569,770 | |
| | |
| | | | | | |
| $ | 694,969,727 | | | $ | 1,093,021,946 | | | $ | 123,433,617 | | | $ | 550,701,975 | | | $ | 66,303,876 | | | $ | 1,086,280,944 | | | $ | 191,380,274 | |
| | |
| $ | 107,801,958 | | | $ | 53,161,799 | | | $ | 12,373,217 | | | $ | 16,847,390 | | | $ | 2,883,174 | | | $ | 191,548,024 | | | $ | 10,841,628 | |
| | |
| $ | 802,771,685 | | | $ | 1,146,183,745 | | | $ | 135,806,834 | | | $ | 567,549,365 | | | $ | 69,187,050 | | | $ | 1,277,828,968 | | | $ | 202,221,902 | |
| | |
| $ | 91,305,713 | | | $ | 12,474,646 | | | $ | 2,382,463 | | | $ | 13,468,272 | | | $ | 1,690,157 | | | $ | 149,147,065 | | | $ | 5,896,435 | |
| | |
| $ | 0 | | | $ | 0 | | | $ | 296,547 | | | $ | 8,869,296 | | | $ | 0 | | | $ | 0 | | | $ | 0 | |
| | |
The accompanying notes are an integral part of these financial statements.
| | | | |
| 120 | | Wells Fargo Allocation Funds | | Statements of assets and liabilities—May 31, 2016 |
| | | | | | | | |
| | | Core Bond
Portfolio | | | Managed
Fixed Income
Portfolio | |
| | |
Assets | | | | | | | | |
Investments | | | | | | | | |
In unaffiliated securities, at value (see cost below) | | $ | 4,530,168,228 | | | $ | 124,072,455 | |
In affiliated securities, at value (see cost below) | | | 198,368,365 | | | | 4,394,097 | |
| | | | | | | | |
Total investments, at value (see cost below) | | | 4,728,536,593 | | | | 128,466,552 | |
Cash | | | 7,419 | | | | 7,006 | |
Segregated cash | | | 0 | | | | 0 | |
Foreign currency, at value (see cost below) | | | 0 | | | | 0 | |
Receivable for investments sold | | | 1,149,740,110 | | | | 0 | |
Principal paydown receivable | | | 143,538 | | | | 0 | |
Receivable for dividends and interest | | | 17,908,065 | | | | 940,980 | |
Receivable for daily variation margin on open futures contracts | | | 0 | | | | 0 | |
Receivable for securities lending income | | | 5,040 | | | | 372 | |
Prepaid expenses and other assets | | | 28,457 | | | | 1,533 | |
| | | | |
Total assets | | | 5,896,369,222 | | | | 129,416,443 | |
| | | | |
| | |
Liabilities | | | | | | | | |
Payable for investments purchased | | | 1,554,183,980 | | | | 2,478,918 | |
Payable upon receipt of securities loaned | | | 0 | | | | 143,100 | |
Payable for daily variation margin on open futures contracts | | | 0 | | | | 0 | |
Advisory fee payable | | | 1,244,119 | | | | 33,208 | |
Shareholder report expenses payable | | | 1,507 | | | | 2,570 | |
Custodian and accounting fees payable | | | 57,367 | | | | 4,668 | |
Accrued expenses and other liabilities | | | 47,191 | | | | 249 | |
| | | | |
Total liabilities | | | 1,555,534,164 | | | | 2,662,713 | |
| | | | |
Total net assets | | $ | 4,340,835,058 | | | $ | 126,753,730 | |
| | | | |
| | |
Investments in unaffiliated securities, at cost | | $ | 4,493,188,530 | | | $ | 120,537,981 | |
| | | | |
Investments in affiliated securities, at cost | | $ | 198,368,365 | | | $ | 4,394,097 | |
| | | | |
Total investments, at cost | | $ | 4,691,556,895 | | | $ | 124,932,078 | |
| | | | |
Securities on loan, at value | | $ | 0 | | | $ | 140,535 | |
| | | | |
Foreign currency, at cost | | $ | 0 | | | $ | 0 | |
| | | | |
The accompanying notes are an integral part of these financial statements.
| | | | | | |
| Statements of assets and liabilities—May 31, 2016 | | Wells Fargo Allocation Funds | | | 121 | |
| | | | | | |
Real Return Portfolio | | | Stable
Income Portfolio | |
| |
| | | | | | |
| | | | | | |
| $ | 62,411,644 | | | $ | 30,005,619 | |
| | 618,330 | | | | 317,146 | |
| | |
| | 63,029,974 | | | | 30,322,765 | |
| | 0 | | | | 0 | |
| | 0 | | | | 12,274 | |
| | 21,680 | | | | 0 | |
| | 1,190,800 | | | | 0 | |
| | 0 | | | | 0 | |
| | 263,082 | | | | 92,033 | |
| | 31 | | | | 0 | |
| | 2,930 | | | | 15 | |
| | 206 | | | | 324 | |
| | |
| | 64,508,703 | | | | 30,427,411 | |
| | |
| |
| | | | | | |
| | 388,377 | | | | 0 | |
| | 0 | | | | 0 | |
| | 1,203 | | | | 117 | |
| | 15,974 | | | | 1,921 | |
| | 2,654 | | | | 4,124 | |
| | 1,809 | | | | 1,966 | |
| | 805 | | | | 1,082 | |
| | |
| | 410,822 | | | | 9,210 | |
| | |
| $ | 64,097,881 | | | $ | 30,418,201 | |
| | |
| |
| $ | 60,126,688 | | | $ | 29,527,549 | |
| | |
| $ | 618,330 | | | $ | 317,146 | |
| | |
| $ | 60,745,018 | | | $ | 29,844,695 | |
| | |
| $ | 0 | | | $ | 0 | |
| | |
| $ | 21,777 | | | $ | 0 | |
| | |
The accompanying notes are an integral part of these financial statements.
| | | | |
| 122 | | Wells Fargo Allocation Funds | | Statements of operations—year ended May 31, 2016 |
| | | | | | | | |
| | | C&B Large
Cap Value
Portfolio | | | Diversified Large Cap Growth
Portfolio | |
| | |
Investment income | | | | | | | | |
Dividends* | | $ | 6,182,005 | | | $ | 1,033,489 | |
Income from affiliated securities | | | 30,399 | | | | 6,535 | |
Securities lending income, net | | | 20,442 | | | | 11,053 | |
Interest | | | 0 | | | | 0 | |
| | | | |
Total investment income | | | 6,232,846 | | | | 1,051,077 | |
| | | | |
| | |
Expenses | | | | | | | | |
Advisory fee | | | 2,013,954 | | | | 747,058 | |
Custody and accounting fees | | | 23,584 | | | | 23,283 | |
Professional fees | | | 44,260 | | | | 48,177 | |
Shareholder report expenses | | | 1,061 | | | | 2,050 | |
Trustees’ fees and expenses | | | 12,601 | | | | 19,695 | |
Other fees and expenses | | | 9,104 | | | | 13,402 | |
| | | | |
Total expenses | | | 2,104,564 | | | | 853,665 | |
Less: Fee waivers and/or expense reimbursements | | | 0 | | | | (138,673 | ) |
| | | | |
Net expenses | | | 2,104,564 | | | | 714,992 | |
| | | | |
Net investment income (loss) | | | 4,128,282 | | | | 336,085 | |
| | | | |
| | |
REALIZED AND UNREALIZED GAINS (LOSSES) ON INVESTMENTS | | | | | | | | |
| | |
Net realized gains (losses) on: | | | | | | | | |
Unaffiliated securities | | | 14,000,084 | | | | 5,117,947 | |
Affiliated securities | | | 0 | | | | 0 | |
Futures transactions | | | 0 | | | | 0 | |
| | | | |
Net realized gain (losses) on investments | | | 14,000,084 | | | | 5,117,947 | |
| | | | |
| | |
Net change in unrealized gains (losses) on: | | | | | | | | |
Unaffiliated securities | | | (18,760,215 | ) | | | (7,846,480 | ) |
Affiiliated securities | | | 0 | | | | 0 | |
Futures transactions | | | 0 | | | | 0 | |
| | | | |
Net change in unrealized gains (losses) on investments | | | (18,760,215 | ) | | | (7,846,480 | ) |
| | | | |
Net realized and unrealized gains (losses) on investments | | | (4,760,131 | ) | | | (2,728,533 | ) |
| | | | |
Net increase (decrease) in net assets resulting from operations | | $ | (631,849 | ) | | $ | (2,392,448 | ) |
| | | | |
| | |
* Net of foreign dividend withholding taxes in the amount of | | | $38,949 | | | | $2,403 | |
The accompanying notes are an integral part of these financial statements.
| | | | | | |
| Statements of operations—year ended May 31, 2016 | | Wells Fargo Allocation Funds | | | 123 | |
| | | | | | | | | | | | | | | | | | | | | | | | | | |
Emerging
Growth
Portfolio | | | Index
Portfolio | | | International
Growth Portfolio | | | International
Value Portfolio | | | Large Company
Value Portfolio | | | Small Company
Growth Portfolio | | | Small Company
Value Portfolio | |
| | | | | | |
| | | | | | | | | | | | | | | | | | | | | | | | | | |
| $ | 1,009,155 | | | $ | 53,355,178 | | | $ | 3,063,804 | | | $ | 16,120,553 | | | $ | 1,726,450 | | | $ | 4,949,491 | | | $ | 2,915,555 | |
| | 44,350 | | | | 1,008,833 | | | | 19,787 | | | | 11,579 | | | | 5,223 | | | | 143,025 | | | | 17,302 | |
| | 2,887,743 | | | | 137,335 | | | | 126,956 | | | | 723,831 | | | | 38,150 | | | | 2,906,307 | | | | 102,931 | |
| | 0 | | | | 1,715 | | | | 0 | | | | 0 | | | | 0 | | | | 0 | | | | 0 | |
| | |
| | 3,941,248 | | | | 54,503,061 | | | | 3,210,547 | | | | 16,855,963 | | | | 1,769,823 | | | | 7,998,823 | | | | 3,035,788 | |
| | |
| | | | | | |
| | | | | | | | | | | | | | | | | | | | | | | | | | |
| | 7,746,284 | | | | 2,086,232 | | | | 1,270,909 | | | | 4,189,538 | | | | 504,535 | | | | 8,131,574 | | | | 1,655,212 | |
| | 59,221 | | | | 144,630 | | | | 86,894 | | | | 187,952 | | | | 10,912 | | | | 68,505 | | | | 22,717 | |
| | 46,987 | | | | 60,723 | | | | 57,356 | | | | 60,833 | | | | 46,940 | | | | 48,594 | | | | 46,658 | |
| | 4,524 | | | | 7,122 | | | | 1,429 | | | | 2,646 | | | | 1,125 | | | | 1,984 | | | | 2,789 | |
| | 12,250 | | | | 9,545 | | | | 16,976 | | | | 11,965 | | | | 15,565 | | | | 11,943 | | | | 12,045 | |
| | 34,034 | | | | 264,943 | | | | 48,726 | | | | 53,937 | | | | 14,613 | | | | 25,031 | | | | 9,443 | |
| | |
| | 7,903,300 | | | | 2,573,195 | | | | 1,482,290 | | | | 4,506,871 | | | | 593,690 | | | | 8,287,631 | | | | 1,748,864 | |
| | 0 | | | | (11,554 | ) | | | 0 | | | | 0 | | | | (20,538 | ) | | | 0 | | | | 0 | |
| | |
| | 7,903,300 | | | | 2,561,641 | | | | 1,482,290 | | | | 4,506,871 | | | | 573,152 | | | | 8,287,631 | | | | 1,748,864 | |
| | |
| | (3,962,052 | ) | | | 51,941,420 | | | | 1,728,257 | | | | 12,349,092 | | | | 1,196,671 | | | | (288,808 | ) | | | 1,286,924 | |
| | |
| | | | | | |
| | | | | | | | | | | | | | | | | | | | | | | | | | |
| | | | | | |
| | | | | | | | | | | | | | | | | | | | | | | | | | |
| | 18,746,231 | | | | 153,490,597 | | | | (1,635,815 | ) | | | (1,517,228 | ) | | | (1,089,821 | ) | | | (95,998,247 | ) | | | 12,552,384 | |
| | 0 | | | | 1,980,988 | | | | 0 | | | | 0 | | | | 0 | | | | 0 | | | | 0 | |
| | 0 | | | | (1,069,185 | ) | | | 0 | | | | 0 | | | | 0 | | | | 0 | | | | 0 | |
| | |
| | 18,746,231 | | | | 154,402,400 | | | | (1,635,815 | ) | | | (1,517,228 | ) | | | (1,089,821 | ) | | | (95,998,247 | ) | | | 12,552,384 | |
| | |
| | | | | | |
| | | | | | | | | | | | | | | | | | | | | | | | | | |
| | (175,228,106 | ) | | | (175,233,159 | ) | | | (20,243,476 | ) | | | (73,474,825 | ) | | | (3,378,107 | ) | | | (55,183,521 | ) | | | (24,625,962 | ) |
| | 0 | | | | (5,340,034 | ) | | | 0 | | | | 0 | | | | 0 | | | | 0 | | | | 0 | |
| | 0 | | | | 950,920 | | | | 0 | | | | 0 | | | | 0 | | | | 0 | | | | 0 | |
| | |
| | (175,228,106 | ) | | | (179,622,273 | ) | | | (20,243,476 | ) | | | (73,474,825 | ) | | | (3,378,107 | ) | | | (55,183,521 | ) | | | (24,625,962 | ) |
| | |
| | (156,481,875 | ) | | | (25,219,873 | ) | | | (21,879,291 | ) | | | (74,992,053 | ) | | | (4,467,928 | ) | | | (151,181,768 | ) | | | (12,073,578 | ) |
| | |
| $ | (160,443,927 | ) | | $ | 26,721,547 | | | $ | (20,151,034 | ) | | $ | (62,642,961 | ) | | $ | (3,271,257 | ) | | $ | (151,470,576 | ) | | $ | (10,786,654 | ) |
| | |
| | | | | | |
| | $0 | | | | $26,513 | | | | $278,962 | | | | $2,059,737 | | | | $882 | | | | $10,989 | | | | $0 | |
The accompanying notes are an integral part of these financial statements.
| | | | |
| 124 | | Wells Fargo Allocation Funds | | Statements of operations—year ended May 31, 2016 |
| | | | | | | | |
| | | Core Bond
Portfolio | | | Managed
Fixed Income Portfolio | |
| | |
Investment income | | | | | | | | |
Interest* | | $ | 84,398,045 | | | $ | 4,235,725 | |
Income from affiliated securities | | | 558,083 | | | | 8,545 | |
Securities lending income, net | | | 140,636 | | | | 2,790 | |
Dividends** | | | 0 | | | | 0 | |
| | | | |
Total investment income | | | 85,096,764 | | | | 4,247,060 | |
| | | | |
| | |
Expenses | | | | | | | | |
Advisory fee | | | 13,642,706 | | | | 483,661 | |
Custody and accounting fees | | | 207,548 | | | | 16,323 | |
Professional fees | | | 78,405 | | | | 56,291 | |
Shareholder report expenses | | | 4,066 | | | | 2,616 | |
Trustees’ fees and expenses | | | 11,445 | | | | 14,388 | |
Other fees and expenses | | | 23,050 | | | | 7,353 | |
| | | | |
Total expenses | | | 13,967,220 | | | | 580,632 | |
Less: Fee waivers and/or expense reimbursements | | | (517,427 | ) | | | (110,513 | ) |
| | | | |
Net expenses | | | 13,449,793 | | | | 470,119 | |
| | | | |
Net investment income | | | 71,646,971 | | | | 3,776,941 | |
| | | | |
| | |
REALIZED AND UNREALIZED GAINS (LOSSES) ON INVESTMENTS | | | | | | | | |
| | |
Net realized gains (losses) on: | | | | | | | | |
Unaffiliated securities | | | 33,934,338 | | | | 1,250,302 | |
Futures transactions | | | 0 | | | | 0 | |
TBA sale commitments | | | (189,467 | ) | | | 0 | |
| | | | |
Net realized gain (losses) on investments | | | 33,744,871 | | | | 1,250,302 | |
| | | | |
| | |
Net change in unrealized gains (losses) on: | | | | | | | | |
Unaffiliated securities | | | 4,164,647 | | | | (257,799 | ) |
Futures transactions | | | 0 | | | | 0 | |
| | | | |
Net change in unrealized gains (losses) on investments | | | 4,164,647 | | | | (257,799 | ) |
| | | | |
Net realized and unrealized gains (losses) on investments | | | 37,909,518 | | | | 992,503 | |
| | | | |
Net increase in net assets resulting from operations | | $ | 109,556,489 | | | $ | 4,769,444 | |
| | | | |
| | |
* Net of foreign interest withholding taxes in the amount of | | | $0 | | | | $25 | |
** Net of foreign dividend withholding taxes in the amount of | | | $0 | | | | $0 | |
The accompanying notes are an integral part of these financial statements.
| | | | | | |
| Statements of operations—year ended May 31, 2016 | | Wells Fargo Allocation Funds | | | 125 | |
| | | | | | |
Real Return
Portfolio | | | Stable Income
Portfolio | |
| |
| | | | | | |
| $ | 816,658 | | | $ | 449,902 | |
| | 1,913 | | | | 2,017 | |
| | 11,283 | | | | 256 | |
| | 223,749 | | | | 0 | |
| | |
| | 1,053,603 | | | | 452,175 | |
| | |
| |
| | | | | | |
| | 222,726 | | | | 83,551 | |
| | 12,881 | | | | 9,872 | |
| | 45,224 | | | | 53,826 | |
| | 1,435 | | | | 1,080 | |
| | 18,201 | | | | 17,918 | |
| | 8,575 | | | | 5,937 | |
| | |
| | 309,042 | | | | 172,184 | |
| | (64,822 | ) | | | (59,251 | ) |
| | |
| | 244,220 | | | | 112,933 | |
| | |
| | 809,383 | | | | 339,242 | |
| | |
| |
| | | | | | |
| |
| | | | | | |
| | (74,459 | ) | | | 2,319 | |
| | (57,211 | ) | | | (30,710 | ) |
| | 0 | | | | 0 | |
| | |
| | (131,670 | ) | | | (28,391 | ) |
| | |
| |
| | | | | | |
| | 490,429 | | | | (86,200 | ) |
| | (5,454 | ) | | | 3,799 | |
| | |
| | 484,975 | | | | (82,401 | ) |
| | |
| | 353,305 | | | | (110,792 | ) |
| | |
| $ | 1,162,688 | | | $ | 228,450 | |
| | |
| |
| | $0 | | | | $0 | |
| | $12,907 | | | | $0 | |
The accompanying notes are an integral part of these financial statements.
| | | | |
| 126 | | Wells Fargo Allocation Funds | | Statements of changes in net assets |
| | | | | | | | |
| | | C&B Large Cap Value Portfolio | |
| | | Year ended
May 31, 2016 | | | Year ended
May 31, 2015 | |
| | |
Operations | | | | | | | | |
Net investment income | | $ | 4,128,282 | | | $ | 3,962,347 | |
Net realized gains on investments | | | 14,000,084 | | | | 41,880,494 | |
Net change in unrealized gains (losses) on investments | | | (18,760,215 | ) | | | (13,267,776 | ) |
| | | | |
Net increase (decrease) in net assets resulting from operations | | | (631,849 | ) | | | 32,575,065 | |
| | | | |
| | |
Capital share transactions | | | | | | | | |
Transactions in investors’ beneficial interests | | | | | | | | |
Contributions | | | 38,393,377 | | | | 32,358,693 | |
Withdrawals | | | (80,332,043 | ) | | | (46,347,409 | ) |
| | | | |
Net decrease in net assets resulting from capital share transactions | | | (41,938,666 | ) | | | (13,988,716 | ) |
| | | | |
Total increase (decrease) in net assets | | | (42,570,515 | ) | | | 18,586,349 | |
| | | | |
| | |
Net assets | | | | | | | | |
Beginning of period | | | 335,534,804 | | | | 316,948,455 | |
| | | | |
End of period | | $ | 292,964,289 | | | $ | 335,534,804 | |
| | | | |
The accompanying notes are an integral part of these financial statements.
| | | | | | |
| Statements of changes in net assets | | Wells Fargo Allocation Funds | | | 127 | |
| | | | | | | | |
| | | Diversified Large Cap Growth Portfolio | |
| | | Year ended
May 31, 2016 | | | Year ended
May 31, 2015 | |
| | |
Operations | | | | | | | | |
Net investment income | | $ | 336,085 | | | $ | 378,418 | |
Net realized gains on investments | | | 5,117,947 | | | | 13,356,513 | |
Net change in unrealized gains (losses) on investments | | | (7,846,480 | ) | | | 2,762,375 | |
| | | | |
Net increase (decrease) in net assets resulting from operations | | | (2,392,448 | ) | | | 16,497,306 | |
| | | | |
| | |
Capital share transactions | | | | | | | | |
Transactions in investors’ beneficial interests | | | | | | | | |
Contributions | | | 7,089,759 | | | | 1,385,145 | |
Withdrawals | | | (12,268,696 | ) | | | (38,000,934 | ) |
| | | | |
Net decrease in net assets resulting from capital share transactions | | | (5,178,937 | ) | | | (36,615,789 | ) |
| | | | |
Total decrease in net assets | | | (7,571,385 | ) | | | (20,118,483 | ) |
| | | | |
| | |
Net assets | | | | | | | | |
Beginning of period | | | 123,329,861 | | | | 143,448,344 | |
| | | | |
End of period | | $ | 115,758,476 | | | $ | 123,329,861 | |
| | | | |
The accompanying notes are an integral part of these financial statements.
| | | | |
| 128 | | Wells Fargo Allocation Funds | | Statements of changes in net assets |
| | | | | | | | |
| | | Emerging Growth Portfolio | |
| | | Year ended
May 31, 2016 | | | Year ended
May 31, 2015 | |
| | |
Operations | | | | | | | | |
Net investment loss | | $ | (3,962,052 | ) | | $ | (7,075,125 | ) |
Net realized gains on investments | | | 18,746,231 | | | | 124,199,895 | |
Net change in unrealized gains (losses) on investments | | | (175,228,106 | ) | | | 125,177,937 | |
| | | | |
Net increase (decrease) in net assets resulting from operations | | | (160,443,927 | ) | | | 242,302,707 | |
| | | | |
| | |
Capital share transactions | | | | | | | | |
Transactions in investors’ beneficial interests | | | | | | | | |
Contributions | | | 105,565,223 | | | | 45,776,720 | |
Withdrawals | | | (194,401,064 | ) | | | (236,510,647 | ) |
| | | | |
Net decrease in net assets resulting from capital share transactions | | | (88,835,841 | ) | | | (190,733,927 | ) |
| | | | |
Total increase (decrease) in net assets | | | (249,279,768 | ) | | | 51,568,780 | |
| | | | |
| | |
Net assets | | | | | | | | |
Beginning of period | | | 1,147,767,433 | | | | 1,096,198,653 | |
| | | | |
End of period | | $ | 898,487,665 | | | $ | 1,147,767,433 | |
| | | | |
The accompanying notes are an integral part of these financial statements.
| | | | | | |
| Statements of changes in net assets | | Wells Fargo Allocation Funds | | | 129 | |
| | | | | | | | |
| | | Index Portfolio | |
| | | Year ended
May 31, 2016 | | | Year ended
May 31, 2015 | |
| | |
Operations | | | | | | | | |
Net investment income | | $ | 51,941,420 | | | $ | 54,937,429 | |
Net realized gains on investments | | | 154,402,400 | | | | 151,694,995 | |
Net change in unrealized gains (losses) on investments | | | (179,622,273 | ) | | | 106,085,589 | |
| | | | |
Net increase in net assets resulting from operations | | | 26,721,547 | | | | 312,718,013 | |
| | | | |
| | |
Capital share transactions | | | | | | | | |
Transactions in investors’ beneficial interests | | | | | | | | |
Contributions | | | 66,728,942 | | | | 163,917,502 | |
Withdrawals | | | (523,281,965 | ) | | | (543,742,749 | ) |
| | | | |
Net decrease in net assets resulting from capital share transactions | | | (456,553,023 | ) | | | (379,825,247 | ) |
| | | | |
Total decrease in net assets | | | (429,831,476 | ) | | | (67,107,234 | ) |
| | | | |
| | |
Net assets | | | | | | | | |
Beginning of period | | | 2,770,243,934 | | | | 2,837,351,168 | |
| | | | |
End of period | | $ | 2,340,412,458 | | | $ | 2,770,243,934 | |
| | | | |
The accompanying notes are an integral part of these financial statements.
| | | | |
| 130 | | Wells Fargo Allocation Funds | | Statements of changes in net assets |
| | | | | | | | |
| | | International Growth Portfolio | |
| | | Year ended
May 31, 2016 | | | Year ended
May 31, 2015 | |
| | |
Operations | | | | | | | | |
Net investment income | | $ | 1,728,257 | | | $ | 1,168,188 | |
Net realized gains (losses) on investments | | | (1,635,815 | ) | | | 5,764,586 | |
Net change in unrealized gains (losses) on investments | | | (20,243,476 | ) | | | 1,080,710 | |
| | | | |
Net increase (decrease) in net assets resulting from operations | | | (20,151,034 | ) | | | 8,013,484 | |
| | | | |
| | |
Capital share transactions | | | | | | | | |
Transactions in investors’ beneficial interests | | | | | | | | |
Contributions | | | 15,674,750 | | | | 9,541,797 | |
Withdrawals | | | (5,551,430 | ) | | | (15,259,152 | ) |
| | | | |
Net increase (decrease) in net assets resulting from capital share transactions | | | 10,123,320 | | | | (5,717,355 | ) |
| | | | |
Total increase (decrease) in net assets | | | (10,027,714 | ) | | | 2,296,129 | |
| | | | |
| | |
Net assets | | | | | | | | |
Beginning of period | | | 158,404,329 | | | | 156,108,200 | |
| | | | |
End of period | | $ | 148,376,615 | | | $ | 158,404,329 | |
| | | | |
The accompanying notes are an integral part of these financial statements.
| | | | | | |
| Statements of changes in net assets | | Wells Fargo Allocation Funds | | | 131 | |
| | | | | | | | |
| | | International Value Portfolio | |
| | | Year ended
May 31, 2016 | | | Year ended
May 31, 2015 | |
| | |
Operations | | | | | | | | |
Net investment income | | $ | 12,349,092 | | | $ | 12,375,837 | |
Net realized gains (losses) on investments | | | (1,517,228 | ) | | | 12,459,307 | |
Net change in unrealized gains (losses) on investments | | | (73,474,825 | ) | | | (27,933,255 | ) |
| | | | |
Net decrease in net assets resulting from operations | | | (62,642,961 | ) | | | (3,098,111 | ) |
| | | | |
| | |
Capital share transactions | | | | | | | | |
Transactions in investors’ beneficial interests | | | | | | | | |
Contributions | | | 46,792,442 | | | | 42,159,536 | |
Withdrawals | | | (10,044,159 | ) | | | (17,083,113 | ) |
| | | | |
Net increase in net assets resulting from capital share transactions | | | 36,748,283 | | | | 25,076,423 | |
| | | | |
Total increase (decrease) in net assets | | | (25,894,678 | ) | | | 21,978,312 | |
| | | | |
| | |
Net assets | | | | | | | | |
Beginning of period | | | 534,213,648 | | | | 512,235,336 | |
| | | | |
End of period | | $ | 508,318,970 | | | $ | 534,213,648 | |
| | | | |
The accompanying notes are an integral part of these financial statements.
| | | | |
| 132 | | Wells Fargo Allocation Funds | | Statements of changes in net assets |
| | | | | | | | |
| | | Large Company Value Portfolio | |
| | | Year ended
May 31, 2016 | | | Year ended
May 31, 2015 | |
| | |
Operations | | | | | | | | |
Net investment income | | $ | 1,196,671 | | | $ | 964,436 | |
Net realized gains (losses) on investments | | | (1,089,821 | ) | | | 9,724,164 | |
Net change in unrealized gains (losses) on investments | | | (3,378,107 | ) | | | (3,904,014 | ) |
| | | | |
Net increase (decrease) in net assets resulting from operations | | | (3,271,257 | ) | | | 6,784,586 | |
| | | | |
| | |
Capital share transactions | | | | | | | | |
Transactions in investors’ beneficial interests | | | | | | | | |
Contributions | | | 6,867,155 | | | | 1,636,829 | |
Withdrawals | | | (6,977,356 | ) | | | (21,975,522 | ) |
| | | | |
Net decrease in net assets resulting from capital share transactions | | | (110,201 | ) | | | (20,338,693 | ) |
| | | | |
Total decrease in net assets | | | (3,381,458 | ) | | | (13,554,107 | ) |
| | | | |
| | |
Net assets | | | | | | | | |
Beginning of period | | | 82,496,288 | | | | 96,050,395 | |
| | | | |
End of period | | $ | 79,114,830 | | | $ | 82,496,288 | |
| | | | |
The accompanying notes are an integral part of these financial statements.
| | | | | | |
| Statements of changes in net assets | | Wells Fargo Allocation Funds | | | 133 | |
| | | | | | | | |
| | | Small Company Growth Portfolio | |
| | | Year ended
May 31, 2016 | | | Year ended
May 31, 2015 | |
| | |
Operations | | | | | | | | |
Net investment loss | | $ | (288,808 | ) | | $ | (1,603,331 | ) |
Net realized gains (losses) on investments | | | (95,998,247 | ) | | | 17,519,892 | |
Net change in unrealized gains (losses) on investments | | | (55,183,521 | ) | | | 73,745,204 | |
| | | | |
Net increase (decrease) in net assets resulting from operations | | | (151,470,576 | ) | | | 89,661,765 | |
| | | | |
| | |
Capital share transactions | | | | | | | | |
Transactions in investors’ beneficial interests | | | | | | | | |
Contributions | | | 708,902,550 | | | | 343,108,775 | |
Withdrawals | | | (112,220,954 | ) | | | (37,300,648 | ) |
| | | | |
Net increase in net assets resulting from capital share transactions | | | 596,681,596 | | | | 305,808,127 | |
| | | | |
Total increase in net assets | | | 445,211,020 | | | | 395,469,892 | |
| | | | |
| | |
Net assets | | | | | | | | |
Beginning of period | | | 751,385,420 | | | | 355,915,528 | |
| | | | |
End of period | | $ | 1,196,596,440 | | | $ | 751,385,420 | |
| | | | |
The accompanying notes are an integral part of these financial statements.
| | | | |
| 134 | | Wells Fargo Allocation Funds | | Statements of changes in net assets |
| | | | | | | | |
| | | Small Company Value Portfolio | |
| | | Year ended
May 31, 2016 | | | Year ended
May 31, 2015 | |
| | |
Operations | | | | | | | | |
Net investment income | | $ | 1,286,924 | | | $ | 1,850,375 | |
Net realized gains on investments | | | 12,552,384 | | | | 16,879,349 | |
Net change in unrealized gains (losses) on investments | | | (24,625,962 | ) | | | (3,678,556 | ) |
| | | | |
Net increase (decrease) in net assets resulting from operations | | | (10,786,654 | ) | | | 15,051,168 | |
| | | | |
| | |
Capital share transactions | | | | | | | | |
Transactions in investors’ beneficial interests | | | | | | | | |
Contributions | | | 36,132,062 | | | | 22,862,632 | |
Withdrawals | | | (23,471,861 | ) | | | (28,565,086 | ) |
| | | | |
Net increase (decrease) in net assets resulting from capital share transactions | | | 12,660,201 | | | | (5,702,454 | ) |
| | | | |
Total increase in net assets | | | 1,873,547 | | | | 9,348,714 | |
| | | | |
| | |
Net assets | | | | | | | | |
Beginning of period | | | 215,696,223 | | | | 206,347,509 | |
| | | | |
End of period | | $ | 217,569,770 | | | $ | 215,696,223 | |
| | | | |
The accompanying notes are an integral part of these financial statements.
| | | | | | |
| Statements of changes in net assets | | Wells Fargo Allocation Funds | | | 135 | |
| | | | | | | | |
| | | Core Bond Portfolio | |
| | | Year ended
May 31, 2016 | | | Year ended
May 31, 2015 | |
| | |
Operations | | | | | | | | |
Net investment income | | $ | 71,646,971 | | | $ | 58,488,996 | |
Net realized gains on investments | | | 33,744,871 | | | | 54,777,871 | |
Net change in unrealized gains (losses) on investments | | | 4,164,647 | | | | (15,603,380 | ) |
| | | | |
Net increase in net assets resulting from operations | | | 109,556,489 | | | | 97,663,487 | |
| | | | |
| | |
Capital share transactions | | | | | | | | |
Transactions in investors’ beneficial interests | | | | | | | | |
Contributions | | | 1,207,036,360 | | | | 1,275,843,092 | |
Withdrawals | | | (728,304,768 | ) | | | (517,501,361 | ) |
| | | | |
Net increase in net assets resulting from capital share transactions | | | 478,731,592 | | | | 758,341,731 | |
| | | | |
Total increase in net assets | | | 588,288,081 | | | | 856,005,218 | |
| | | | |
| | |
Net assets | | | | | | | | |
Beginning of period | | | 3,752,546,977 | | | | 2,896,541,759 | |
| | | | |
End of period | | $ | 4,340,835,058 | | | $ | 3,752,546,977 | |
| | | | |
The accompanying notes are an integral part of these financial statements.
| | | | |
| 136 | | Wells Fargo Allocation Funds | | Statements of changes in net assets |
| | | | | | | | |
| | | Managed Fixed Income Portfolio | |
| | | Year ended
May 31, 2016 | | | Year ended
May 31, 2015 | |
| | |
Operations | | | | | | | | |
Net investment income | | $ | 3,776,941 | | | $ | 3,704,473 | |
Net realized gains on investments | | | 1,250,302 | | | | 1,635,962 | |
Net change in unrealized gains (losses) on investments | | | (257,799 | ) | | | (507,703 | ) |
| | | | |
Net increase in net assets resulting from operations | | | 4,769,444 | | | | 4,832,732 | |
| | | | |
| | |
Capital share transactions | | | | | | | | |
Transactions in investors’ beneficial interests | | | | | | | | |
Contributions | | | 18,117,390 | | | | 17,767,001 | |
Withdrawals | | | (17,218,838 | ) | | | (14,012,007 | ) |
| | | | |
Net increase in net assets resulting from capital share transactions | | | 898,552 | | | | 3,754,994 | |
| | | | |
Total increase in net assets | | | 5,667,996 | | | | 8,587,726 | |
| | | | |
| | |
Net assets | | | | | | | | |
Beginning of period | | | 121,085,734 | | | | 112,498,008 | |
| | | | |
End of period | | $ | 126,753,730 | | | $ | 121,085,734 | |
| | | | |
The accompanying notes are an integral part of these financial statements.
| | | | | | |
| Statements of changes in net assets | | Wells Fargo Allocation Funds | | | 137 | |
| | | | | | | | |
| | | Real Return Portfolio | |
| | | Year ended
May 31, 2016 | | | Year ended
May 31, 2015 | |
| | |
Operations | | | | | | | | |
Net investment income | | $ | 809,383 | | | $ | 400,921 | |
Net realized gains (losses) on investments | | | (131,670 | ) | | | 1,132,514 | |
Net change in unrealized gains (losses) on investments | | | 484,975 | | | | (896,307 | ) |
| | | | |
Net increase in net assets resulting from operations | | | 1,162,688 | | | | 637,128 | |
| | | | |
| | |
Capital share transactions | | | | | | | | |
Transactions in investors’ beneficial interests | | | | | | | | |
Contributions | | | 29,489,684 | | | | 12,526,145 | |
Withdrawals | | | (14,951,275 | ) | | | (11,966,906 | ) |
| | | | |
Net increase in net assets resulting from capital share transactions | | | 14,538,409 | | | | 559,239 | |
| | | | |
Total increase in net assets | | | 15,701,097 | | | | 1,196,367 | |
| | | | |
| | |
Net assets | | | | | | | | |
Beginning of period | | | 48,396,784 | | | | 47,200,417 | |
| | | | |
End of period | | $ | 64,097,881 | | | $ | 48,396,784 | |
| | | | |
The accompanying notes are an integral part of these financial statements.
| | | | |
| 138 | | Wells Fargo Allocation Funds | | Statements of changes in net assets |
| | | | | | | | |
| | | Stable Income Portfolio | |
| | | Year ended
May 31, 2016 | | | Year ended
May 31, 2015 | |
| | |
Operations | | | | | | | | |
Net investment income | | $ | 339,242 | | | $ | 308,337 | |
Net realized gains (losses) on investments | | | (28,391 | ) | | | 148 | |
Net change in unrealized gains (losses) on investments | | | (82,401 | ) | | | (79,402 | ) |
| | | | |
Net increase in net assets resulting from operations | | | 228,450 | | | | 229,083 | |
| | | | |
| | |
Capital share transactions | | | | | | | | |
Transactions in investors’ beneficial interests | | | | | | | | |
Contributions | | | 5,915,120 | | | | 3,703,378 | |
Withdrawals | | | (2,801,173 | ) | | | (1,665,191 | ) |
| | | | |
Net increase in net assets resulting from capital share transactions | | | 3,113,947 | | | | 2,038,187 | |
| | | | |
Total increase in net assets | | | 3,342,397 | | | | 2,267,270 | |
| | | | |
| | |
Net assets | | | | | | | | |
Beginning of period | | | 27,075,804 | | | | 24,808,534 | |
| | | | |
End of period | | $ | 30,418,201 | | | $ | 27,075,804 | |
| | | | |
The accompanying notes are an integral part of these financial statements.
| | | | | | |
| Financial highlights | | Wells Fargo Allocation Funds | | | 139 | |
| | | | | | | | | | | | | | | | | | | | |
| | | Ratio to average net assets (annualized) | | | Total
return | | | Portfolio turnover
rate | |
| | | Net investment
income (loss) | | | Gross
expenses | | | Net
expenses | | | |
| | | | | |
C&B Large Cap Value Portfolio | | | | | | | | | | | | | | | | | | | | |
Year ended May 31, 2016 | | | 1.33 | % | | | 0.68 | % | | | 0.68 | % | | | 0.35 | % | | | 29 | % |
Year ended May 31, 2015 | | | 1.20 | % | | | 0.68 | % | | | 0.68 | % | | | 10.29 | % | | | 35 | % |
Year ended May 31, 2014 | | | 1.35 | % | | | 0.68 | % | | | 0.68 | % | | | 17.80 | % | | | 22 | % |
Year ended May 31, 2013 | | | 1.73 | % | | | 0.68 | % | | | 0.68 | % | | | 29.30 | % | | | 18 | % |
Year ended May 31, 2012 | | | 1.81 | % | | | 0.68 | % | | | 0.68 | % | | | (4.61 | )% | | | 21 | % |
| | | | | |
Diversified Large Cap Growth Portfolio | | | | | | | | | | | | | | | | | | | | |
Year ended May 31, 2016 | | | 0.29 | % | | | 0.74 | % | | | 0.62 | % | | | (2.28 | )% | | | 59 | % |
Year ended May 31, 2015 | | | 0.28 | % | | | 0.72 | % | | | 0.62 | % | | | 13.11 | % | | | 46 | % |
Year ended May 31, 2014 | | | 0.15 | % | | | 0.72 | % | | | 0.62 | % | | | 21.70 | % | | | 54 | % |
Year ended May 31, 2013 | | | 0.51 | % | | | 0.71 | % | | | 0.62 | % | | | 20.30 | % | | | 56 | % |
Year ended May 31, 2012 | | | 0.24 | % | | | 0.71 | % | | | 0.62 | % | | | 1.26 | % | | | 79 | % |
| | | | | |
Emerging Growth Portfolio | | | | | | | | | | | | | | | | | | | | |
Year ended May 31, 2016 | | | (0.40 | )% | | | 0.80 | % | | | 0.80 | % | | | (14.47 | )% | | | 66 | % |
Year ended May 31, 2015 | | | (0.63 | )% | | | 0.80 | % | | | 0.80 | % | | | 24.02 | % | | | 56 | % |
Year ended May 31, 2014 | | | (0.62 | )% | | | 0.80 | % | | | 0.80 | % | | | 11.92 | % | | | 63 | % |
Year ended May 31, 2013 | | | (0.47 | )% | | | 0.80 | % | | | 0.80 | % | | | 20.53 | % | | | 65 | % |
Year ended May 31, 2012 | | | (0.57 | )% | | | 0.80 | % | | | 0.80 | % | | | (4.83 | )% | | | 75 | % |
| | | | | |
Index Portfolio | | | | | | | | | | | | | | | | | | | | |
Year ended May 31, 2016 | | | 2.12 | % | | | 0.11 | % | | | 0.10 | % | | | 1.62 | % | | | 4 | % |
Year ended May 31, 2015 | | | 1.96 | % | | | 0.11 | % | | | 0.11 | % | | | 11.69 | % | | | 4 | % |
Year ended May 31, 2014 | | | 1.99 | % | | | 0.10 | % | | | 0.10 | % | | | 20.33 | % | | | 5 | % |
Year ended May 31, 2013 | | | 2.20 | % | | | 0.09 | % | | | 0.09 | % | | | 27.22 | % | | | 4 | % |
Year ended May 31, 2012 | | | 2.09 | % | | | 0.10 | % | | | 0.10 | % | | | (0.52 | )% | | | 9 | % |
| | | | | |
International Growth Portfolio | | | | | | | | | | | | | | | | | | | | |
Year ended May 31, 2016 | | | 1.16 | % | | | 0.99 | % | | | 0.99 | % | | | (12.40 | )% | | | 62 | % |
Year ended May 31, 2015 | | | 0.76 | % | | | 1.00 | % | | | 1.00 | % | | | 5.13 | % | | | 51 | % |
Year ended May 31, 2014 | | | 1.13 | % | | | 1.00 | % | | | 1.00 | % | | | 16.45 | % | | | 46 | % |
Year ended May 31, 2013 | | | 1.63 | % | | | 1.04 | % | | | 1.04 | % | | | 30.34 | % | | | 46 | % |
Year ended May 31, 2012 | | | 2.04 | % | | | 0.97 | % | | | 0.90 | % | | | (9.44 | )% | | | 69 | % |
| | | | | |
International Value Portfolio | | | | | | | | | | | | | | | | | | | | |
Year ended May 31, 2016 | | | 2.50 | % | | | 0.91 | % | | | 0.91 | % | | | (11.85 | )% | | | 14 | % |
Year ended May 31, 2015 | | | 2.45 | % | | | 0.91 | % | | | 0.91 | % | | | (1.04 | )% | | | 18 | % |
Year ended May 31, 2014 | | | 3.09 | % | | | 0.91 | % | | | 0.91 | % | | | 18.22 | % | | | 11 | % |
Year ended May 31, 2013 | | | 3.04 | % | | | 0.91 | % | | | 0.91 | % | | | 29.45 | % | | | 16 | % |
Year ended May 31, 2012 | | | 3.44 | % | | | 0.91 | % | | | 0.85 | % | | | (21.07 | )% | | | 9 | % |
| | | | | |
Large Company Value Portfolio | | | | | | | | | | | | | | | | | | | | |
Year ended May 31, 2016 | | | 1.54 | % | | | 0.76 | % | | | 0.74 | % | | | (3.92 | )% | | | 50 | % |
Year ended May 31, 2015 | | | 1.09 | % | | | 0.74 | % | | | 0.74 | % | | | 7.90 | % | | | 72 | % |
Year ended May 31, 2014 | | | 0.99 | % | | | 0.73 | % | | | 0.73 | % | | | 20.26 | % | | | 62 | % |
Year ended May 31, 2013 | | | 1.49 | % | | | 0.78 | % | | | 0.74 | % | | | 28.91 | % | | | 95 | % |
Year ended May 31, 2012 | | | 1.67 | % | | | 0.77 | % | | | 0.74 | % | | | (6.06 | )% | | | 104 | % |
| | | | | |
Small Company Growth Portfolio | | | | | | | | | | | | | | | | | | | | |
Year ended May 31, 2016 | | | (0.03 | )% | | | 0.80 | % | | | 0.80 | % | | | (13.86 | )% | | | 49 | % |
Year ended May 31, 2015 | | | (0.32 | )% | | | 0.82 | % | | | 0.82 | % | | | 18.07 | % | | | 58 | % |
Year ended May 31, 2014 | | | (0.37 | )% | | | 0.83 | % | | | 0.83 | % | | | 23.47 | % | | | 77 | % |
Year ended May 31, 2013 | | | (0.02 | )% | | | 0.86 | % | | | 0.86 | % | | | 31.39 | % | | | 109 | % |
Year ended May 31, 2012 | | | (0.12 | )% | | | 0.83 | % | | | 0.83 | % | | | (10.75 | )% | | | 107 | % |
The accompanying notes are an integral part of these financial statements.
| | | | |
| 140 | | Wells Fargo Allocation Funds | | Financial highlights |
| | | | | | | | | | | | | | | | | | | | |
| | | Ratio to average net assets (annualized) | | | Total
return | | | Portfolio turnover
rate | |
| | | Net investment
income | | | Gross
expenses | | | Net
expenses | | | |
| | | | | |
Small Company Value Portfolio | | | | | | | | | | | | | | | | | | | | |
Year ended May 31, 2016 | | | 0.62 | % | | | 0.85 | % | | | 0.85 | % | | | (4.96 | )% | | | 72 | % |
Year ended May 31, 2015 | | | 0.89 | % | | | 0.84 | % | | | 0.84 | % | | | 7.29 | % | | | 54 | % |
Year ended May 31, 2014 | | | 0.89 | % | | | 0.85 | % | | | 0.85 | % | | | 18.09 | % | | | 47 | % |
Year ended May 31, 2013 | | | 0.58 | % | | | 0.85 | % | | | 0.85 | % | | | 30.76 | % | | | 57 | % |
Year ended May 31, 2012 | | | 0.69 | % | | | 0.84 | % | | | 0.84 | % | | | (7.17 | )% | | | 60 | % |
| | | | | |
Core Bond Portfolio | | | | | | | | | | | | | | | | | | | | |
Year ended May 31, 2016 | | | 1.86 | % | | | 0.36 | % | | | 0.35 | % | | | 2.78 | % | | | 667 | % |
Year ended May 31, 2015 | | | 1.82 | % | | | 0.37 | % | | | 0.35 | % | | | 3.22 | % | | | 586 | % |
Year ended May 31, 2014 | | | 1.94 | % | | | 0.37 | % | | | 0.35 | % | | | 2.90 | % | | | 646 | % |
Year ended May 31, 2013 | | | 1.75 | % | | | 0.37 | % | | | 0.35 | % | | | 2.61 | % | | | 547 | % |
Year ended May 31, 2012 | | | 2.33 | % | | | 0.37 | % | | | 0.35 | % | | | 8.20 | % | | | 803 | % |
| | | | | |
Managed Fixed Income Portfolio | | | | | | | | | | | | | | | | | | | | |
Year ended May 31, 2016 | | | 3.12 | % | | | 0.48 | % | | | 0.39 | % | | | 3.95 | % | | | 25 | % |
Year ended May 31, 2015 | | | 3.20 | % | | | 0.48 | % | | | 0.39 | % | | | 4.23 | % | | | 31 | % |
Year ended May 31, 2014 | | | 3.33 | % | | | 0.48 | % | | | 0.39 | % | | | 3.07 | % | | | 35 | % |
Year ended May 31, 2013 | | | 3.42 | % | | | 0.47 | % | | | 0.39 | % | | | 4.81 | % | | | 49 | % |
Year ended May 31, 2012 | | | 3.83 | % | | | 0.46 | % | | | 0.39 | % | | | 6.97 | % | | | 51 | % |
| | | | | |
Real Return Portfolio | | | | | | | | | | | | | | | | | | | | |
Year ended May 31, 2016 | | | 1.45 | % | | | 0.56 | % | | | 0.44 | % | | | 1.29 | % | | | 29 | % |
Year ended May 31, 2015 | | | 0.89 | % | | | 0.57 | % | | | 0.44 | % | | | 1.50 | % | | | 57 | % |
Year ended May 31, 2014 | | | 1.45 | % | | | 0.53 | % | | | 0.44 | % | | | (0.26 | )% | | | 9 | % |
Year ended May 31, 2013 | | | 1.52 | % | | | 0.50 | % | | | 0.44 | % | | | (1.86 | )% | | | 15 | % |
Year ended May 31, 2012 | | | 3.00 | % | | | 0.48 | % | | | 0.44 | % | | | 12.62 | % | | | 23 | % |
| | | | | |
Stable Income Portfolio | | | | | | | | | | | | | | | | | | | | |
Year ended May 31, 2016 | | | 1.22 | % | | | 0.62 | % | | | 0.41 | % | | | 0.83 | % | | | 20 | % |
Year ended May 31, 2015 | | | 1.20 | % | | | 0.64 | % | | | 0.41 | % | | | 0.89 | % | | | 26 | % |
Year ended May 31, 2014 | | | 1.41 | % | | | 0.66 | % | | | 0.41 | % | | | 1.52 | % | | | 33 | % |
Year ended May 31, 2013 | | | 1.50 | % | | | 0.58 | % | | | 0.41 | % | | | 2.78 | % | | | 20 | % |
Year ended May 31, 2012 | | | 1.76 | % | | | 0.59 | % | | | 0.41 | % | | | 1.71 | % | | | 11 | % |
The accompanying notes are an integral part of these financial statements.
| | | | | | |
| Notes to financial statements | | Wells Fargo Allocation Funds | | | 141 | |
1. ORGANIZATION
Wells Fargo Master Trust (the “Trust”), a Delaware statutory trust organized on March 10, 1999, is an open-end management investment company registered under the Investment Company Act of 1940, as amended (the “1940 Act”). As an investment company, the Trust follows the accounting and reporting guidance in Financial Accounting Standards Board (“FASB”) Accounting Standards Codification Topic 946, Financial Services – Investment Companies. These financial statements report on the following portfolios: Wells Fargo C&B Large Cap Value Portfolio (“C&B Large Cap Value Portfolio”), Wells Fargo Diversified Large Cap Growth Portfolio (“Diversified Large Cap Growth Portfolio”), Wells Fargo Emerging Growth Portfolio (“Emerging Growth Portfolio”), Wells Fargo Index Portfolio (“Index Portfolio”), Wells Fargo International Growth Portfolio (“International Growth Portfolio”), Wells Fargo International Value Portfolio (“International Value Portfolio”), Wells Fargo Large Company Value Portfolio (“Large Company Value Portfolio”), Wells Fargo Small Company Growth Portfolio (“Small Company Growth Portfolio”), Wells Fargo Small Company Value Portfolio (“Small Company Value Portfolio”), Wells Fargo Core Bond Portfolio (“Core Bond Portfolio”), Wells Fargo Managed Fixed Income Portfolio (“Managed Fixed Income Portfolio”), Wells Fargo Real Return Portfolio (“Real Return Portfolio”), and Wells Fargo Stable Income Portfolio (“Stable Income Portfolio”) (each, a “Portfolio”, collectively, the “Portfolios”). Each Portfolio is a diversified series of the Trust.
The Portfolios, which are master portfolios in a master/feeder structure, offer their shares to multiple feeder funds and other affiliated master portfolios rather than directly to the public.
2. SIGNIFICANT ACCOUNTING POLICIES
The following significant accounting policies, which are consistently followed in the preparation of the financial statements of each Portfolio, are in conformity with U.S. generally accepted accounting principles which require management to make estimates and assumptions that affect the reported amounts of assets and liabilities, disclosure of contingent assets and liabilities at the date of the financial statements, and the reported amounts of revenues and expenses during the reporting period. Actual results could differ from those estimates.
Securities valuation
All investments are valued each business day as of the close of regular trading on the New York Stock Exchange (generally 4 p.m. Eastern Time), although the Portfolios may deviate from this calculation time under unusual or unexpected circumstances.
Equity securities and futures that are listed on a foreign or domestic exchange or market are valued at the official closing price or, if none, the last sales price. If no sale occurs on the principal exchange or market that day, the prior day’s price will be deemed “stale” and a fair value price will be determined in accordance with the Portfolio’s Valuation Procedures.
The values of securities denominated in foreign currencies are translated into U.S. dollars at rates provided by an independent foreign currency pricing source at a time each business day specified by the Management Valuation Team of Wells Fargo Funds Management, LLC (“Funds Management”).
Many securities markets and exchanges outside the U.S. close prior to the close of the New York Stock Exchange and therefore may not fully reflect trading or events that occur after the close of the principal exchange in which the foreign securities are traded, but before the close of the New York Stock Exchange. If such trading or events are expected to materially affect the value of such securities, then fair value pricing procedures approved by the Board of Trustees of the Portfolios are applied. These procedures take into account multiple factors including movements in U.S. securities markets after foreign exchanges close. Foreign securities that are fair valued under these procedures are categorized as Level 2 and the application of these procedures may result in transfers between Level 1 and Level 2. Depending on market activity, such fair valuations may be frequent. Such fair value pricing may result in net asset values that are higher or lower than net asset values based on the last reported sales price or latest quoted bid price. On May 31, 2016, such fair value pricing was not used in pricing foreign securities.
Debt securities are valued at the evaluated bid price provided by an independent pricing service or, if a reliable price is not available, the quoted bid price from an independent broker-dealer.
Investments in registered open-end investment companies are valued at net asset value. Interests in non-registered investment vehicles that are redeemable at net asset value are fair valued normally at net asset value.
Investments which are not valued using any of the methods discussed above are valued at their fair value, as determined in good faith by the Board of Trustees. The Board of Trustees has established a Valuation Committee comprised of the Trustees and has delegated to it the authority to take any actions regarding the valuation of portfolio securities that the Valuation Committee deems necessary or appropriate, including determining the fair value of portfolio securities, unless
| | | | |
| 142 | | Wells Fargo Allocation Funds | | Notes to financial statements |
the determination has been delegated to the Management Valuation Team. The Board of Trustees retains the authority to make or ratify any valuation decisions or approve any changes to the Valuation Procedures as it deems appropriate. On a quarterly basis, the Board of Trustees receives reports on any valuation actions taken by the Valuation Committee or the Management Valuation Team which may include items for ratification.
Valuations of fair valued securities are compared to the next actual sales price when available, or other appropriate market values, to assess the continued appropriateness of the fair valuation methodologies used. These securities are fair valued on a day-to-day basis, taking into consideration changes to appropriate market information and any significant changes to the inputs considered in the valuation process until there is a readily available price provided on an exchange or by an independent pricing service. Valuations received from an independent pricing service or independent broker-dealer quotes are periodically validated by comparisons to most recent trades and valuations provided by other independent pricing services in addition to the review of prices by the adviser and/or subadviser. Unobservable inputs used in determining fair valuations are identified based on the type of security, taking into consideration factors utilized by market participants in valuing the investment, knowledge about the issuer and the current market environment.
Foreign currency translation
The accounting records of the Portfolios are maintained in U.S. dollars. The value of other assets and liabilities denominated in foreign currencies are translated into U.S. dollars at rates provided by an independent foreign currency pricing source at a time each business day specified by the Management Valuation Team. Purchases and sales of securities, and income and expenses are converted at the rate of exchange on the respective dates of such transactions. Net realized foreign exchange gains or losses arise from sales of foreign currencies, currency gains or losses realized between the trade and settlement dates on securities transactions, and the difference between the amounts of dividends, interest and foreign withholding taxes recorded and the U.S. dollar equivalent of the amounts actually paid or received. Net unrealized foreign exchange gains and losses arise from changes in the fair value of assets and liabilities other than investments in securities resulting from changes in exchange rates. The changes in net assets arising from changes in exchange rates and the changes in net assets resulting from changes in market prices of securities are not separately presented. Such changes are included in net realized and unrealized gains or losses from investments.
Security loans
The Portfolios may lend their securities from time to time in order to earn additional income in the form of fees or interest on securities received as collateral or the investment of any cash received as collateral. The Portfolios continue to receive interest or dividends on the securities loaned. The Portfolios receive collateral in the form of cash or securities with a value at least equal to the value of the securities on loan. The value of the loaned securities is determined at the close of each business day and any additional required collateral is delivered to the Portfolios on the next business day. In a securities lending transaction, the net asset value of the Portfolios will be affected by an increase or decrease in the value of the securities loaned and by an increase or decrease in the value of the instrument in which collateral is invested. The amount of securities lending activity undertaken by the Portfolios fluctuate from time to time. In the event of default or bankruptcy by the borrower, the Portfolios may be prevented from recovering the loaned securities or gaining access to the collateral or may experience delays or costs in doing so. In addition, the investment of any cash collateral received may lose all or part of its value. The Portfolios have the right under the lending agreement to recover the securities from the borrower on demand.
The Portfolios lend their securities through an unaffiliated securities lending agent. Cash collateral received in connection with its securities lending transactions is invested in Securities Lending Cash Investments, LLC (the “Securities Lending Fund”). The Securities Lending Fund is exempt from registration under Section 3(c)(7) of the 1940 Act and is managed by Funds Management and is subadvised by Wells Capital Management Incorporated (“WellsCap”), an affiliate of Funds Management and an indirect wholly owned subsidiary of Wells Fargo & Company (“Wells Fargo”). Funds Management receives an advisory fee starting at 0.05% and declining to 0.01% as the average daily net assets of the Securities Lending Fund increase. All of the fees received by Funds Management are paid to WellsCap for its services as subadviser. The Securities Lending Fund seeks to provide a positive return compared to the daily Fed Funds Open rate by investing in high-quality, U.S. dollar-denominated short-term money market instruments. Securities Lending Fund investments are fair valued based upon the amortized cost valuation technique. Income earned from investment in the Securities Lending Fund is included in securities lending income on the Statements of Operations.
When-issued transactions
Each Portfolio may purchase securities on a forward commitment or when-issued basis. A Portfolio records a when-issued transaction on the trade date and will segregate assets in an amount at least equal in value to the Portfolio’s commitment to purchase when-issued securities. Securities purchased on a when-issued basis are marked-to-market daily and the
| | | | | | |
| Notes to financial statements | | Wells Fargo Allocation Funds | | | 143 | |
Portfolio begins earning interest on the settlement date. Losses may arise due to changes in the market value of the underlying securities or if the counterparty does not perform under the contract.
Loans
The Portfolio may invest in direct debt instruments which are interests in amounts owed to lenders by corporate or other borrowers. The loans pay interest at rates which are periodically reset by reference to a base lending rate plus a spread. Investments in loans may be in the form of participations in loans or assignments of all or a portion of loans from third parties. When the Portfolio purchases participations, it generally has no rights to enforce compliance with terms of the loan agreement with the borrower. As a result, the Portfolio assumes the credit risk of both the borrower and the lender that is selling the participation. When the Portfolio purchases assignments from lenders, it acquires direct rights against the borrower on the loan and may enforce compliance by the borrower with the terms of the loan agreement. Loans may include fully funded term loans or unfunded loan commitments, which are contractual obligations for future funding.
Futures contracts
The Portfolios are subject to interest rate risk or equity price risk in the normal course of pursuing its investment objectives. A Portfolio may buy and sell futures contracts in order to gain exposure to, or protect against, changes in security values and interest rates. The primary risks associated with the use of futures contracts are the imperfect correlation between changes in market values of securities held by the Portfolio and the prices of futures contracts, and the possibility of an illiquid market.
The aggregate principal amounts of the contracts are not recorded in the financial statements. Fluctuations in the value of the contracts are recorded in the Statements of Assets and Liabilities as an asset or liability and in the Statements of Operations as unrealized gains or losses until the contracts are closed, at which point they are recorded as net realized gains or losses on futures contracts. With futures contracts, there is minimal counterparty risk to the Portfolios since futures are exchange traded and the exchange’s clearinghouse, as counterparty to all exchange traded futures, guarantees the futures against default.
TBA sale commitments
Each Portfolio may enter into To Be Announced (“TBA”) sale commitments to hedge its portfolio positions or to sell mortgage-backed securities it owns under delayed delivery arrangements. Proceeds of TBA sale commitments are not received until the contractual settlement date. During the time a TBA sale commitment is outstanding, equivalent deliverable securities or offsetting TBA purchase commitments, which are deliverable on or before the sale commitment date, are held as “cover” for the transaction. Unsettled TBA sale commitments are valued at the current market value of the underlying securities, generally according to the procedures described under “Securities valuation”. The contract is marked-to-market daily and the change in market value is recorded by the Portfolio as an unrealized gain or loss. If the TBA sale commitment is closed through the acquisition of an offsetting purchase commitment, the Portfolio realizes a gain or loss. If the Portfolio delivers securities under the commitment, the Portfolio realizes a gain or a loss from the sale of the securities based upon the unit price established at the date the commitment was entered into.
Inflation-indexed bonds and TIPS
Each Portfolio may invest in inflation-indexed bonds, including Treasury inflation-protected securities (TIPS). Inflation-indexed bonds are fixed income securities whose principal value is periodically adjusted according to the rate of inflation. If the index measuring inflation falls, the principal value of inflation-indexed bonds (other than municipal inflation indexed bonds and certain corporate inflation-indexed bonds) will be adjusted downward, and consequently the interest payable on these securities (calculated with respect to a smaller principal amount) will be reduced. Repayment of the original bond principal upon maturity (as adjusted for inflation) is guaranteed in the case of U.S. Treasury inflation-indexed bonds. For bonds that do not provide a similar guarantee, the adjusted principal value of the bond repaid at maturity may be less than the original principal. The value of inflation-indexed bonds is expected to change in response to changes in real interest rates. Real interest rates are tied to the relationship between nominal interest rates and the rate of inflation. If nominal interest rates increase at a faster rate than inflation, real interest rates may rise, leading to a decrease in value of inflation-indexed bonds. Inflation-indexed bonds, including TIPS, decline in value when real interest rates rise. In certain interest rate environments, such as when real interest rates are rising faster than nominal interest rates, inflation-indexed bonds may experience greater losses than other fixed income securities with similar durations.
Mortgage dollar roll transactions
Each Portfolio may engage in mortgage dollar roll transactions through TBA mortgage-backed securities issued by Government National Mortgage Association (GNMA), Federal National Mortgage Association (FNMA) and Federal Home Loan Mortgage Corporation (FHLMC). In a mortgage dollar roll transaction, a Portfolio sells a mortgage-backed security to a financial institution, such as a bank or broker-dealer and simultaneously agrees to repurchase a substantially similar
| | | | |
| 144 | | Wells Fargo Allocation Funds | | Notes to financial statements |
security from the institution at a later date at an agreed upon price. The mortgage-backed securities that are repurchased will bear the same interest rate as those sold, but generally will be collateralized by different pools of mortgages with different pre-payment histories. During the roll period, a Portfolio foregoes principal and interest paid on the securities. A Portfolio is compensated by the difference between the current sales price and the forward price for the future purchase as well as by the earnings on the cash proceeds of the initial sale. Mortgage dollar rolls may be renewed without physical delivery of the securities subject to the contract. A Portfolio accounts for TBA dollar roll transactions as purchases and sales which, as a result, may increase its portfolio turnover rate.
Security transactions and income recognition
Securities transactions are recorded on a trade date basis. Realized gains or losses are recorded on the basis of identified cost.
Dividend income is recognized on the ex-dividend date, except for certain dividends from foreign securities which are recorded as soon as the custodian verifies the ex-dividend date.
Interest income is accrued daily and bond discounts are accreted and premiums are amortized daily based on the effective interest method. To the extent debt obligations are placed on non-accrual status, any related interest income may be reduced by writing off interest receivables when the collection of all or a portion of interest has become doubtful based on consistently applied procedures. If the issuer subsequently resumes interest payments or when the collectability of interest is reasonably assured, the debt obligation is removed from non-accrual status.
Income from foreign securities is recorded net of foreign taxes withheld where recovery of such taxes is not assured.
Federal and other taxes
Each Portfolio is treated as a separate entity for federal income tax purposes. The Portfolios are not required to pay federal income taxes on their net investment income and net capital gain as they are treated as partnerships for federal income tax purposes. All interest, dividends, gains and losses of a Portfolio are deemed to have been “passed through” to the interestholders in proportion to their holdings of the Portfolio regardless of whether such interest, dividends and gains have been distributed by the Portfolio.
Each Portfolio’s income tax returns and all financial records supporting those returns for the prior three fiscal years are subject to examination by the federal revenue authority. Management has analyzed each Portfolio’s tax positions taken on federal, state, and foreign tax returns for all open tax years and does not believe that there are any uncertain tax positions that require recognition of a tax liability.
3. FAIR VALUATION MEASUREMENTS
Fair value measurements of investments are determined within a framework that has established a fair value hierarchy based upon the various data inputs utilized in determining the value of each Portfolio’s investments. The three-level hierarchy gives the highest priority to unadjusted quoted prices in active markets for identical assets or liabilities (Level 1) and the lowest priority to significant unobservable inputs (Level 3). Each Portfolio’s investments are classified within the fair value hierarchy based on the lowest level of input that is significant to the fair value measurement. The inputs are summarized into three broad levels as follows:
| n | | Level 1 – quoted prices in active markets for identical securities |
| n | | Level 2 – other significant observable inputs (including quoted prices for similar securities, interest rates, prepayment speeds, credit risk, use of amortized cost, etc.) |
| n | | Level 3 – significant unobservable inputs (including the Portfolio’s own assumptions in determining the fair value of investments) |
The inputs or methodologies used for valuing investments in securities are not necessarily an indication of the risk associated with investing in those securities.
| | | | | | |
| Notes to financial statements | | Wells Fargo Allocation Funds | | | 145 | |
The following is a summary of the inputs used in valuing each Portfolio’s assets and liabilities as of May 31, 2016:
| | | | | | | | | | | | | | | | |
| C&B Large Cap Value Portfolio | | Quoted prices (Level 1) | | | Other significant
observable inputs
(Level 2) | | | Significant
unobservable inputs
(Level 3) | | | Total | |
Assets | | | | | | | | | | | | | | | | |
Investments in : | | | | | | | | | | | | | | | | |
| | | | |
Common stocks | | | | | | | | | | | | | | | | |
Consumer discretionary | | $ | 39,284,297 | | | $ | 0 | | | $ | 0 | | | $ | 39,284,297 | |
Consumer staples | | | 19,100,896 | | | | 0 | | | | 0 | | | | 19,100,896 | |
Energy | | | 17,758,921 | | | | 0 | | | | 0 | | | | 17,758,921 | |
Financials | | | 76,240,999 | | | | 0 | | | | 0 | | | | 76,240,999 | |
Health care | | | 44,180,838 | | | | 0 | | | | 0 | | | | 44,180,838 | |
Industrials | | | 53,765,968 | | | | 0 | | | | 0 | | | | 53,765,968 | |
Information technology | | | 14,076,445 | | | | 0 | | | | 0 | | | | 14,076,445 | |
Materials | | | 14,028,552 | | | | 0 | | | | 0 | | | | 14,028,552 | |
| | | | |
Short-term investments | | | | | | | | | | | | | | | | |
Investment companies | | | 13,862,559 | | | | 0 | | | | 0 | | | | 13,862,559 | |
Investments measured at net asset value* | | | | | | | | | | | | | | | 12,454,900 | |
Total assets | | $ | 292,299,475 | | | $ | 0 | | | $ | 0 | | | $ | 304,754,375 | |
| * | Investments that are measured at fair value using the net asset value per share (or its equivalent) as a practical expedient have not been categorized in the fair value hierarchy. The fair value amount presented in the table is intended to permit reconciliation of the fair value hierarchy to the amounts presented in the Statements of Assets and Liabilities. The Portfolio’s investment in Securities Lending Cash Investment, LLC valued at $12,454,900 does not have a redemption period notice, can be redeemed daily and does not have any unfunded commitments. |
| | | | | | | | | | | | | | | | |
| Diversified Large Cap Growth Portfolio | | Quoted prices
(Level 1) | | | Other significant
observable inputs (Level 2) | | | Significant
unobservable inputs
(Level 3) | | | Total | |
Assets | | | | | | | | | | | | | | | | |
Investments in : | | | | | | | | | | | | | | | | |
| | | | |
Common stocks | | | | | | | | | | | | | | | | |
Consumer discretionary | | $ | 29,503,276 | | | $ | 0 | | | $ | 0 | | | $ | 29,503,276 | |
Consumer staples | | | 9,135,507 | | | | 0 | | | | 0 | | | | 9,135,507 | |
Energy | | | 1,379,452 | | | | 0 | | | | 0 | | | | 1,379,452 | |
Financials | | | 2,559,149 | | | | 0 | | | | 0 | | | | 2,559,149 | |
Health care | | | 16,475,660 | | | | 0 | | | | 0 | | | | 16,475,660 | |
Industrials | | | 7,788,848 | | | | 0 | | | | 0 | | | | 7,788,848 | |
Information technology | | | 43,031,066 | | | | 0 | | | | 0 | | | | 43,031,066 | |
Materials | | | 3,378,649 | | | | 0 | | | | 0 | | | | 3,378,649 | |
| | | | |
Short-term investments | | | | | | | | | | | | | | | | |
Investment companies | | | 2,118,196 | | | | 0 | | | | 0 | | | | 2,118,196 | |
Investments measured at net asset value* | | | | | | | | | | | | | | | 3,113,406 | |
Total assets | | $ | 115,369,803 | | | $ | 0 | | | $ | 0 | | | $ | 118,483,209 | |
| * | Investments that are measured at fair value using the net asset value per share (or its equivalent) as a practical expedient have not been categorized in the fair value hierarchy. The fair value amount presented in the table is intended to permit reconciliation of the fair value hierarchy to the amounts presented in the Statements of Assets and Liabilities. The Portfolio’s investment in Securities Lending Cash Investment, LLC valued at $3,113,406 does not have a redemption period notice, can be redeemed daily and does not have any unfunded commitments. |
| | | | |
| 146 | | Wells Fargo Allocation Funds | | Notes to financial statements |
| | | | | | | | | | | | | | | | |
| Emerging Growth Portfolio | | Quoted prices
(Level 1) | | | Other significant
observable inputs
(Level 2) | | | Significant
unobservable inputs
(Level 3) | | | Total | |
Assets | | | | | | | | | | | | | | | | |
Investments in : | | | | | | | | | | | | | | | | |
| | | | |
Common stocks | | | | | | | | | | | | | | | | |
Consumer discretionary | | $ | 109,137,314 | | | $ | 0 | | | $ | 0 | | | $ | 109,137,314 | |
Energy | | | 25,543,672 | | | | 0 | | | | 0 | | | | 25,543,672 | |
Financials | | | 48,113,098 | | | | 0 | | | | 0 | | | | 48,113,098 | |
Health care | | | 289,674,989 | | | | 0 | | | | 0 | | | | 289,674,989 | |
Industrials | | | 103,520,118 | | | | 0 | | | | 0 | | | | 103,520,118 | |
Information technology | | | 305,813,941 | | | | 0 | | | | 0 | | | | 305,813,941 | |
| | | | |
Short-term investments | | | | | | | | | | | | | | | | |
Investment companies | | | 14,978,235 | | | | 0 | | | | 0 | | | | 14,978,235 | |
Investments measured at net asset value* | | | | | | | | | | | | | | | 92,823,723 | |
Total assets | | $ | 896,781,367 | | | $ | 0 | | | $ | 0 | | | $ | 989,605,090 | |
| * | Investments that are measured at fair value using the net asset value per share (or its equivalent) as a practical expedient have not been categorized in the fair value hierarchy. The fair value amount presented in the table is intended to permit reconciliation of the fair value hierarchy to the amounts presented in the Statements of Assets and Liabilities. The Portfolio’s investment in Securities Lending Cash Investment, LLC valued at $92,823,723 does not have a redemption period notice, can be redeemed daily and does not have any unfunded commitments. |
| | | | | | | | | | | | | | | | |
| Index Portfolio | | Quoted prices (Level 1) | | | Other significant
observable inputs
(Level 2) | | | Significant
unobservable inputs
(Level 3) | | | Total | |
Assets | | | | | | | | | | | | | | | | |
Investments in : | | | | | | | | | | | | | | | | |
| | | | |
Common stocks | | | | | | | | | | | | | | | | |
Consumer discretionary | | $ | 289,694,308 | | | $ | 0 | | | $ | 0 | | | $ | 289,694,308 | |
Consumer staples | | | 232,754,716 | | | | 0 | | | | 0 | | | | 232,754,716 | |
Energy | | | 164,580,503 | | | | 0 | | | | 0 | | | | 164,580,503 | |
Financials | | | 376,210,320 | | | | 0 | | | | 0 | | | | 376,210,320 | |
Health care | | | 339,368,191 | | | | 0 | | | | 0 | | | | 339,368,191 | |
Industrials | | | 231,365,470 | | | | 0 | | | | 0 | | | | 231,365,470 | |
Information technology | | | 470,278,237 | | | | 0 | | | | 0 | | | | 470,278,237 | |
Materials | | | 65,656,243 | | | | 0 | | | | 0 | | | | 65,656,243 | |
Telecommunication services | | | 61,249,364 | | | | 0 | | | | 0 | | | | 61,249,364 | |
Utilities | | | 77,036,436 | | | | 0 | | | | 0 | | | | 77,036,436 | |
| | | | |
Short-term investments | | | | | | | | | | | | | | | | |
Investment companies | | | 24,960,298 | | | | 0 | | | | 0 | | | | 24,960,298 | |
U.S. Treasury securities | | | 1,806,435 | | | | 0 | | | | 0 | | | | 1,806,435 | |
Investments measured at net asset value* | | | | | | | | | | | | | | | 12,693,253 | |
Total assets | | $ | 2,334,960,521 | | | $ | 0 | | | $ | 0 | | | $ | 2,347,653,774 | |
Liabilities | | | | | | | | | | | | | | | | |
Futures contracts | | $ | 36,000 | | | $ | 0 | | | $ | 0 | | | $ | 36,000 | |
Total liabilities | | $ | 36,000 | | | $ | 0 | | | $ | 0 | | | $ | 36,000 | |
| * | Investments that are measured at fair value using the net asset value per share (or its equivalent) as a practical expedient have not been categorized in the fair value hierarchy. The fair value amount presented in the table is intended to permit reconciliation of the fair value hierarchy to the amounts presented in the Statements of Assets and Liabilities. The Portfolio’s investment in Securities Lending Cash Investment, LLC valued at $12,693,253 does not have a redemption period notice, can be redeemed daily and does not have any unfunded commitments. |
| | | | | | |
| Notes to financial statements | | Wells Fargo Allocation Funds | | | 147 | |
| | | | | | | | | | | | | | | | |
| International Growth Portfolio | | Quoted prices
(Level 1) | | | Other significant
observable inputs
(Level 2) | | | Significant
unobservable inputs
(Level 3) | | | Total | |
Assets | | | | | | | | | | | | | | | | |
Investments in : | | | | | | | | | | | | | | | | |
| | | | |
Common stocks | | | | | | | | | | | | | | | | |
Belgium | | $ | 2,938,206 | | | $ | 0 | | | $ | 0 | | | $ | 2,938,206 | |
Canada | | | 2,250,330 | | | | 0 | | | | 0 | | | | 2,250,330 | |
China | | | 2,541,486 | | | | 0 | | | | 0 | | | | 2,541,486 | |
Denmark | | | 381,268 | | | | 0 | | | | 0 | | | | 381,268 | |
France | | | 12,797,598 | | | | 0 | | | | 0 | | | | 12,797,598 | |
Germany | | | 20,329,351 | | | | 0 | | | | 0 | | | | 20,329,351 | |
Hong Kong | | | 4,686,104 | | | | 0 | | | | 0 | | | | 4,686,104 | |
Ireland | | | 7,904,971 | | | | 0 | | | | 0 | | | | 7,904,971 | |
Japan | | | 18,993,997 | | | | 0 | | | | 0 | | | | 18,993,997 | |
Mexico | | | 1,246,753 | | | | 0 | | | | 0 | | | | 1,246,753 | |
South Korea | | | 14,650 | | | | 0 | | | | 0 | | | | 14,650 | |
Spain | | | 2,487,845 | | | | 0 | | | | 0 | | | | 2,487,845 | |
Sweden | | | 1,433,455 | | | | 0 | | | | 0 | | | | 1,433,455 | |
Switzerland | | | 12,652,706 | | | | 0 | | | | 0 | | | | 12,652,706 | |
Taiwan | | | 1,785,144 | | | | 0 | | | | 0 | | | | 1,785,144 | |
United Kingdom | | | 33,515,136 | | | | 0 | | | | 0 | | | | 33,515,136 | |
United States | | | 8,935,376 | | | | 0 | | | | 0 | | | | 8,935,376 | |
| | | | |
Participation Notes | | | | | | | | | | | | | | | | |
Ireland | | | 0 | | | | 2,418,886 | | | | 0 | | | | 2,418,886 | |
| | | | |
Preferred stocks | | | | | | | | | | | | | | | | |
Germany | | | 1,767,949 | | | | 0 | | | | 0 | | | | 1,767,949 | |
| | | | |
Short-term investments | | | | | | | | | | | | | | | | |
Investment companies | | | 9,867,059 | | | | 0 | | | | 0 | | | | 9,867,059 | |
Investments measured at net asset value* | | | | | | | | | | | | | | | 2,506,158 | |
Total assets | | $ | 146,529,384 | | | $ | 2,418,886 | | | $ | 0 | | | $ | 151,454,428 | |
| * | Investments that are measured at fair value using the net asset value per share (or its equivalent) as a practical expedient have not been categorized in the fair value hierarchy. The fair value amount presented in the table is intended to permit reconciliation of the fair value hierarchy to the amounts presented in the Statements of Assets and Liabilities. The Portfolio’s investment in Securities Lending Cash Investments, LLC valued at $2,506,158 does not have a redemption period notice, can be redeemed daily and does not have any unfunded commitments. |
| | | | |
| 148 | | Wells Fargo Allocation Funds | | Notes to financial statements |
| | | | | | | | | | | | | | | | |
| International Value Portfolio | | Quoted prices
(Level 1) | | | Other significant
observable inputs (Level 2) | | | Significant unobservable inputs (Level 3) | | | Total | |
Assets | | | | | | | | | | | | | | | | |
Investments in : | | | | | | | | | | | | | | | | |
| | | | |
Common stocks | | | | | | | | | | | | | | | | |
Australia | | $ | 28,434,311 | | | $ | 0 | | | $ | 48,710 | | | $ | 28,483,021 | |
Austria | | | 5,746,241 | | | | 0 | | | | 0 | | | | 5,746,241 | |
Belgium | | | 4,130,894 | | | | 0 | | | | 0 | | | | 4,130,894 | |
Brazil | | | 4,150,492 | | | | 0 | | | | 0 | | | | 4,150,492 | |
Canada | | | 7,819,869 | | | | 0 | | | | 0 | | | | 7,819,869 | |
China | | | 14,102,164 | | | | 0 | | | | 0 | | | | 14,102,164 | |
Czech Republic | | | 1,044,370 | | | | 0 | | | | 0 | | | | 1,044,370 | |
Denmark | | | 1,226,054 | | | | 0 | | | | 0 | | | | 1,226,054 | |
Finland | | | 1,974,732 | | | | 0 | | | | 0 | | | | 1,974,732 | |
France | | | 45,224,124 | | | | 0 | | | | 0 | | | | 45,224,124 | |
Germany | | | 47,995,403 | | | | 0 | | | | 0 | | | | 47,995,403 | |
Hong Kong | | | 9,988,633 | | | | 0 | | | | 0 | | | | 9,988,633 | |
Hungary | | | 1,196,850 | | | | 0 | | | | 0 | | | | 1,196,850 | |
India | | | 2,865,322 | | | | 0 | | | | 0 | | | | 2,865,322 | |
Ireland | | | 4,655,800 | | | | 0 | | | | 0 | | | | 4,655,800 | |
Israel | | | 5,473,993 | | | | 0 | | | | 0 | | | | 5,473,993 | |
Italy | | | 5,639,354 | | | | 0 | | | | 0 | | | | 5,639,354 | |
Japan | | | 109,897,120 | | | | 0 | | | | 0 | | | | 109,897,120 | |
Liechtenstein | | | 599,721 | | | | 0 | | | | 0 | | | | 599,721 | |
Netherlands | | | 6,898,832 | | | | 0 | | | | 0 | | | | 6,898,832 | |
Norway | | | 6,230,948 | | | | 0 | | | | 0 | | | | 6,230,948 | |
Poland | | | 1,982,872 | | | | 0 | | | | 0 | | | | 1,982,872 | |
Portugal | | | 1,401,875 | | | | 0 | | | | 0 | | | | 1,401,875 | |
Russia | | | 4,194,456 | | | | 0 | | | | 0 | | | | 4,194,456 | |
Singapore | | | 4,050,076 | | | | 0 | | | | 0 | | | | 4,050,076 | |
South Africa | | | 1,860,099 | | | | 0 | | | | 0 | | | | 1,860,099 | |
South Korea | | | 12,328,179 | | | | 0 | | | | 0 | | | | 12,328,179 | |
Spain | | | 8,854,110 | | | | 0 | | | | 0 | | | | 8,854,110 | |
Sweden | | | 10,406,680 | | | | 0 | | | | 0 | | | | 10,406,680 | |
Switzerland | | | 31,110,463 | | | | 0 | | | | 0 | | | | 31,110,463 | |
Taiwan | | | 2,154,895 | | | | 0 | | | | 0 | | | | 2,154,895 | |
Thailand | | | 5,047,806 | | | | 0 | | | | 0 | | | | 5,047,806 | |
United Kingdom | | | 93,883,267 | | | | 0 | | | | 0 | | | | 93,883,267 | |
| | | | |
Preferred stocks | | | | | | | | | | | | | | | | |
Brazil | | | 978,198 | | | | 0 | | | | 0 | | | | 978,198 | |
| | | | |
Rights | | | | | | | | | | | | | | | | |
Brazil | | | 0 | | | | 6,779 | | | | 0 | | | | 6,779 | |
| | | | |
Short-term investments | | | | | | | | | | | | | | | | |
Investment companies | | | 2,530,851 | | | | 0 | | | | 0 | | | | 2,530,851 | |
Investments measured at net asset value* | | | | | | | | | | | | | | | 14,316,539 | |
Total assets | | $ | 496,079,054 | | | $ | 6,779 | | | $ | 48,710 | | | $ | 510,451,082 | |
| * | Investments that are measured at fair value using the net asset value per share (or its equivalent) as a practical expedient have not been categorized in the fair value hierarchy. The fair value amount presented in the table is intended to permit reconciliation of the fair value hierarchy to the amounts presented in the Statements of Assets and Liabilities. The Portfolio’s investment in Securities Lending Cash Investment, LLC valued at $14,316,539 does not have a redemption period notice, can be redeemed daily and does not have any unfunded commitments. |
| | | | | | |
| Notes to financial statements | | Wells Fargo Allocation Funds | | | 149 | |
| | | | | | | | | | | | | | | | |
| Large Company Value Portfolio | | Quoted prices
(Level 1) | | | Other significant
observable inputs
(Level 2) | | | Significant
unobservable inputs
(Level 3) | | | Total | |
Assets | | | | | | | | | | | | | | | | |
Investments in : | | | | | | | | | | | | | | | | |
| | | | |
Common stocks | | | | | | | | | | | | | | | | |
Consumer discretionary | | $ | 5,992,355 | | | $ | 0 | | | $ | 0 | | | $ | 5,992,355 | |
Consumer staples | | | 5,245,325 | | | | 0 | | | | 0 | | | | 5,245,325 | |
Energy | | | 8,764,370 | | | | 0 | | | | 0 | | | | 8,764,370 | |
Financials | | | 22,808,234 | | | | 0 | | | | 0 | | | | 22,808,234 | |
Health care | | | 10,075,327 | | | | 0 | | | | 0 | | | | 10,075,327 | |
Industrials | | | 8,482,370 | | | | 0 | | | | 0 | | | | 8,482,370 | |
Information technology | | | 8,745,638 | | | | 0 | | | | 0 | | | | 8,745,638 | |
Materials | | | 2,668,280 | | | | 0 | | | | 0 | | | | 2,668,280 | |
Telecommunication services | | | 1,794,709 | | | | 0 | | | | 0 | | | | 1,794,709 | |
Utilities | | | 3,348,498 | | | | 0 | | | | 0 | | | | 3,348,498 | |
| | | | |
Short-term investments | | | | | | | | | | | | | | | | |
Investment companies | | | 1,123,879 | | | | 0 | | | | 0 | | | | 1,123,879 | |
Investments measured at net asset value* | | | | | | | | | | | | | | | 1,759,295 | |
Total assets | | $ | 79,048,985 | | | $ | 0 | | | $ | 0 | | | $ | 80,808,280 | |
| * | Investments that are measured at fair value using the net asset value per share (or its equivalent) as a practical expedient have not been categorized in the fair value hierarchy. The fair value amount presented in the table is intended to permit reconciliation of the fair value hierarchy to the amounts presented in the Statements of Assets and Liabilities. The Portfolio’s investment in Securities Lending Cash Investment, LLC valued at $1,759,295 does not have a redemption period notice, can be redeemed daily and does not have any unfunded commitments. |
| | | | | | | | | | | | | | | | |
| Small Company Growth Portfolio | | Quoted prices (Level 1) | | | Other significant
observable inputs
(Level 2) | | | Significant
unobservable inputs
(Level 3) | | | Total | |
Assets | | | | | | | | | | | | | | | | |
Investments in : | | | | | | | | | | | | | | | | |
| | | | |
Common stocks | | | | | | | | | | | | | | | | |
Consumer discretionary | | $ | 167,660,319 | | | $ | 0 | | | $ | 0 | | | $ | 167,660,319 | |
Consumer staples | | | 31,118,946 | | | | 0 | | | | 0 | | | | 31,118,946 | |
Energy | | | 32,226,308 | | | | 0 | | | | 0 | | | | 32,226,308 | |
Financials | | | 112,573,141 | | | | 0 | | | | 0 | | | | 112,573,141 | |
Health care | | | 277,040,158 | | | | 0 | | | | 0 | | | | 277,040,158 | |
Industrials | | | 196,541,616 | | | | 0 | | | | 0 | | | | 196,541,616 | |
Information technology | | | 323,772,888 | | | | 0 | | | | 0 | | | | 323,772,888 | |
Materials | | | 24,505,990 | | | | 0 | | | | 0 | | | | 24,505,990 | |
| | | | |
Short-term investments | | | | | | | | | | | | | | | | |
Investment companies | | | 40,370,488 | | | | 0 | | | | 0 | | | | 40,370,488 | |
Investments measured at net asset value* | | | | | | | | | | | | | | | 151,177,536 | |
Total assets | | $ | 1,205,809,854 | | | $ | 0 | | | $ | 0 | | | $ | 1,356,987,390 | |
| * | Investments that are measured at fair value using the net asset value per share (or its equivalent) as a practical expedient have not been categorized in the fair value hierarchy. The fair value amount presented in the table is intended to permit reconciliation of the fair value hierarchy to the amounts presented in the Statements of Assets and Liabilities. The Portfolio’s investment in Securities Lending Cash Investment, LLC valued at $151,177,536 does not have a redemption period notice, can be redeemed daily and does not have any unfunded commitments. |
| | | | |
| 150 | | Wells Fargo Allocation Funds | | Notes to financial statements |
| | | | | | | | | | | | | | | | |
| Small Company Value Portfolio | | Quoted prices
(Level 1) | | | Other significant
observable inputs
(Level 2) | | | Significant
unobservable inputs
(Level 3) | | | Total | |
Assets | | | | | | | | | | | | | | | | |
Investments in : | | | | | | | | | | | | | | | | |
| | | | |
Common stocks | | | | | | | | | | | | | | | | |
Consumer discretionary | | $ | 31,528,281 | | | $ | 0 | | | $ | 0 | | | $ | 31,528,281 | |
Consumer staples | | | 5,274,964 | | | | 0 | | | | 0 | | | | 5,274,964 | |
Energy | | | 13,960,510 | | | | 0 | | | | 0 | | | | 13,960,510 | |
Financials | | | 85,916,166 | | | | 0 | | | | 0 | | | | 85,916,166 | |
Health care | | | 8,309,486 | | | | 0 | | | | 0 | | | | 8,309,486 | |
Industrials | | | 16,923,555 | | | | 0 | | | | 0 | | | | 16,923,555 | |
Information technology | | | 32,348,308 | | | | 0 | | | | 0 | | | | 32,348,308 | |
Materials | | | 8,659,206 | | | | 0 | | | | 0 | | | | 8,659,206 | |
Utilities | | | 10,535,582 | | | | 0 | | | | 0 | | | | 10,535,582 | |
| | | | |
Warrants | | | | | | | | | | | | | | | | |
Health care | | | 0 | | | | 0 | | | | 0 | | | | 0 | |
| | | | |
Short-term investments | | | | | | | | | | | | | | | | |
Investment companies | | | 4,875,803 | | | | 0 | | | | 0 | | | | 4,875,803 | |
Investments measured at net asset value* | | | | | | | | | | | | | | | 5,965,825 | |
Total assets | | $ | 218,331,861 | | | $ | 0 | | | $ | 0 | | | $ | 224,297,686 | |
| * | Investments that are measured at fair value using the net asset value per share (or its equivalent) as a practical expedient have not been categorized in the fair value hierarchy. The fair value amount presented in the table is intended to permit reconciliation of the fair value hierarchy to the amounts presented in the Statements of Assets and Liabilities. The Portfolio’s investment in Securities Lending Cash Investment, LLC valued at $5,965,825 does not have a redemption period notice, can be redeemed daily and does not have any unfunded commitments. |
| | | | | | | | | | | | | | | | |
| Core Bond Portfolio | | Quoted prices
(Level 1) | | | Other significant
observable inputs
(Level 2) | | | Significant
unobservable inputs
(Level 3) | | | Total | |
Assets | | | | | | | | | | | | | | | | |
Investments in : | | | | | | | | | | | | | | | | |
| | | | |
Agency securities | | $ | 0 | | | $ | 1,325,492,614 | | | $ | 0 | | | $ | 1,325,492,614 | |
| | | | |
Asset-backed securities | | | 0 | | | | 573,632,539 | | | | 0 | | | | 573,632,539 | |
| | | | |
Corporate bonds and notes | | | 0 | | | | 810,667,590 | | | | 0 | | | | 810,667,590 | |
| | | | |
Municipal obligations | | | 0 | | | | 39,954,459 | | | | 0 | | | | 39,954,459 | |
| | | | |
Non-agency mortgage-backed securities | | | 0 | | | | 134,383,718 | | | | 0 | | | | 134,383,718 | |
| | | | |
U.S. Treasury securities | | | 1,324,440,171 | | | | 0 | | | | 0 | | | | 1,324,440,171 | |
| | | | |
Yankee corporate bonds and notes | | | 0 | | | | 226,546,839 | | | | 0 | | | | 226,546,839 | |
| | | | |
Yankee government bonds | | | 0 | | | | 95,050,298 | | | | 0 | | | | 95,050,298 | |
| | | | |
Short-term investments | | | | | | | | | | | | | | | | |
Investment companies | | | 198,368,365 | | | | 0 | | | | 0 | | | | 198,368,365 | |
Total assets | | $ | 1,522,808,536 | | | $ | 3,205,728,057 | | | $ | 0 | | | $ | 4,728,536,593 | |
| | | | | | |
| Notes to financial statements | | Wells Fargo Allocation Funds | | | 151 | |
| | | | | | | | | | | | | | | | |
| Managed Fixed Income Portfolio | | Quoted prices
(Level 1) | | | Other significant
observable inputs
(Level 2) | | | Significant
unobservable inputs
(Level 3) | | | Total | |
Assets | | | | | | | | | | | | | | | | |
Investments in : | | | | | | | | | | | | | | | | |
| | | | |
Agency securities | | $ | 0 | | | $ | 37,905,371 | | | $ | 0 | | | $ | 37,905,371 | |
| | | | |
Asset-backed securities | | | 0 | | | | 5,325,981 | | | | 0 | | | | 5,325,981 | |
| | | | |
Corporate bonds and notes | | | 0 | | | | 41,120,407 | | | | 0 | | | | 41,120,407 | |
| | | | |
Municipal obligations | | | 0 | | | | 11,316,006 | | | | 0 | | | | 11,316,006 | |
| | | | |
Non-agency mortgage-backed securities | | | 0 | | | | 14,454,073 | | | | 1,233,994 | | | | 15,688,067 | |
| | | | |
U.S. Treasury securities | | | 5,443,583 | | | | 0 | | | | 0 | | | | 5,443,583 | |
| | | | |
Yankee corporate bonds and notes | | | 0 | | | | 7,273,040 | | | | 0 | | | | 7,273,040 | |
| | | | |
Short-term investments | | | | | | | | | | | | | | | | |
Investment companies | | | 4,250,997 | | | | 0 | | | | 0 | | | | 4,250,997 | |
Investments measured at net asset value* | | | | | | | | | | | | | | | 143,100 | |
Total assets | | $ | 9,694,580 | | | $ | 117,394,878 | | | $ | 1,233,994 | | | $ | 128,466,552 | |
| * | Investments that are measured at fair value using the net asset value per share (or its equivalent) as a practical expedient have not been categorized in the fair value hierarchy. The fair value amount presented in the table is intended to permit reconciliation of the fair value hierarchy to the amounts presented in the Statements of Assets and Liabilities. The Portfolio’s investment in Securities Lending Cash Investment, LLC valued at $143,100 does not have a redemption period notice, can be redeemed daily and does not have any unfunded commitments. |
| | | | | | | | | | | | | | | | |
| Real Return Portfolio | | Quoted prices
(Level 1) | | | Other significant
observable inputs
(Level 2) | | | Significant
unobservable inputs
(Level 3) | | | Total | |
Assets | | | | | | | | | | | | | | | | |
Investments in : | | | | | | | | | | | | | | | | |
| | | | |
Common stocks | | | | | | | | | | | | | | | | |
Consumer staples | | $ | 2,481,941 | | | $ | 0 | | | $ | 0 | | | $ | 2,481,941 | |
Energy | | | 2,185,607 | | | | 0 | | | | 0 | | | | 2,185,607 | |
Financials | | | 2,880,032 | | | | 0 | | | | 0 | | | | 2,880,032 | |
Materials | | | 3,300,363 | | | | 0 | | | | 0 | | | | 3,300,363 | |
| | | | |
Corporate bonds and notes | | | 0 | | | | 6,675,798 | | | | 0 | | | | 6,675,798 | |
| | | | |
Loans | | | 0 | | | | 2,274,418 | | | | 0 | | | | 2,274,418 | |
| | | | |
U.S. Treasury securities | | | 41,786,791 | | | | 0 | | | | 0 | | | | 41,786,791 | |
| | | | |
Yankee corporate bonds and notes | | | 0 | | | | 776,697 | | | | 0 | | | | 776,697 | |
| | | | |
Short-term investments | | | | | | | | | | | | | | | | |
Investment companies | | | 618,330 | | | | 0 | | | | 0 | | | | 618,330 | |
U.S. Treasury securities | | | 49,997 | | | | 0 | | | | 0 | | | | 49,997 | |
| | | 53,303,061 | | | | 9,726,913 | | | | 0 | | | | 63,029,974 | |
Futures contracts | | | 31 | | | | 0 | | | | 0 | | | | 31 | |
Total assets | | $ | 53,303,092 | | | $ | 9,726,913 | | | $ | 0 | | | $ | 63,030,005 | |
Liabilities | | | | | | | | | | | | | | | | |
Futures contracts | | $ | 1,203 | | | $ | 0 | | | $ | 0 | | | $ | 1,203 | |
Total liabilities | | $ | 1,203 | | | $ | 0 | | | $ | 0 | | | $ | 1,203 | |
| | | | |
| 152 | | Wells Fargo Allocation Funds | | Notes to financial statements |
| | | | | | | | | | | | | | | | |
| Stable Income Portfolio | | Quoted prices
(Level 1) | | | Other significant
observable inputs
(Level 2) | | | Significant
unobservable inputs
(Level 3) | | | Total | |
Assets | | | | | | | | | | | | | | | | |
Investments in : | | | | | | | | | | | | | | | | |
| | | | |
Agency securities | | $ | 0 | | | $ | 7,095,543 | | | $ | 0 | | | $ | 7,095,543 | |
| | | | |
Asset-backed securities | | | 0 | | | | 8,141,676 | | | | 0 | | | | 8,141,676 | |
| | | | |
Corporate bonds and notes | | | 0 | | | | 8,057,749 | | | | 0 | | | | 8,057,749 | |
| | | | |
Municipal obligations | | | 0 | | | | 278,758 | | | | 0 | | | | 278,758 | |
| | | | |
Non-agency mortgage-backed securities | | | 0 | | | | 1,992,208 | | | | 0 | | | | 1,992,208 | |
| | | | |
U.S. Treasury securities | | | 3,920,920 | | | | 0 | | | | 0 | | | | 3,920,920 | |
| | | | |
Yankee corporate bonds and notes | | | 0 | | | | 518,765 | | | | 0 | | | | 518,765 | |
| | | | |
Short-term investments | | | | | | | | | | | | | | | | |
Investment companies | | | 317,146 | | | | 0 | | | | 0 | | | | 317,146 | |
Total assets | | $ | 4,238,066 | | | $ | 26,084,699 | | | $ | 0 | | | $ | 30,322,765 | |
Liabilities | | | | | | | | | | | | | | | | |
Futures contracts | | $ | 117 | | | $ | 0 | | | $ | 0 | | | $ | 117 | |
Total liabilities | | $ | 117 | | | $ | 0 | | | $ | 0 | | | $ | 117 | |
Futures contracts are reported at their variation margin at measurement date, which represents the amount due to/from the Portfolio at that date. All other assets and liabilities are reported at their market value at measurement date.
The Portfolios recognize transfers between levels within the fair value hierarchy at the end of the reporting period. At May 31, 2016, the Portfolios did not have any transfers into/out of Level 1, Level 2 or Level 3, except International Value Portfolio which had an immaterial transfer between Level 1 and Level 3.
4. TRANSACTIONS WITH AFFILIATES AND OTHER EXPENSES
Advisory fee
The Trust has entered into an advisory contract with Funds Management, an indirect wholly owned subsidiary of Wells Fargo. The adviser is responsible for implementing investment policies and guidelines and for supervising the subadvisers, who are responsible for day-to-day portfolio management of the Portfolios. Pursuant to the contract, Funds Management is entitled to receive an annual advisory fee which is calculated based on the average daily net assets of each Portfolio.
Funds Management has retained the services of certain subadvisers to provide daily portfolio management for the Portfolios. Funds Management has engaged WellsCap, Peregrine Capital Management, Inc. (“Peregrine”) (an affiliate of Funds Management and a direct wholly owned subsidiary of Wells Fargo), Artisan Partners Limited Partnership, Cooke & Bieler, L.P., Golden Capital Management, LLC (an affiliate of Funds Management), LSV Asset Management, and Phocas Financial Corporation as subadvisers.
The fees for subadvisory services are borne by Funds Management. The subadvisers are each entitled to receive from Funds Management an annual subadvisory fee which is calculated based on the average daily net assets of each Portfolio.
| | | | | | |
| Notes to financial statements | | Wells Fargo Allocation Funds | | | 153 | |
The annual advisory and subadvisory fee rates for each Portfolio are as follows:
| | | | | | | | | | | | | | | | | | | | | | |
| | | Advisory fee | | | Effective rate for
the year ended May 31, 2016 | | | | | Subadvisory fee | |
| | | starting at | | | declining to | | | | Subadviser | | starting at | | | declining to | |
C&B Large Cap Value Portfolio | | | 0.65 | % | | | 0.475 | % | | | 0.65 | % | | Cooke & Bieler, L.P. | | | 0.38 | % | | | 0.30 | % |
Diversified Large Cap Growth Portfolio | | | 0.65 | | | | 0.475 | | | | 0.65 | | | WellsCap | | | 0.30 | | | | 0.20 | |
Emerging Growth Portfolio | | | 0.80 | | | | 0.68 | | | | 0.79 | | | WellsCap | | | 0.55 | | | | 0.40 | |
Index Portfolio | | | 0.10 | | | | 0.05 | | | | 0.09 | | | Golden Capital Management, LLC | | | 0.05 | | | | 0.02 | |
International Growth Portfolio | | | 0.85 | | | | 0.70 | | | | 0.85 | | | Artisan Partners Limited Partnership | | | 0.80 | | | | 0.50 | |
International Value Portfolio | | | 0.85 | | | | 0.70 | | | | 0.85 | | | LSV Asset Management | | | 0.35 | | | | 0.30 | |
Large Company Value Portfolio | | | 0.65 | | | | 0.475 | | | | 0.65 | | | Phocas Financial Corporation | | | 0.29 | | | | 0.20 | |
Small Company Growth Portfolio | | | 0.80 | | | | 0.68 | | | | 0.79 | | | Peregrine Capital Management, Inc. | | | 0.50 | | | | 0.45 | |
Small Company Value Portfolio | | | 0.80 | | | | 0.68 | | | | 0.80 | | | Peregrine Capital Management, Inc. | | | 0.45 | | | | 0.40 | |
Core Bond Portfolio | | | 0.40 | | | | 0.30 | | | | 0.35 | | | WellsCap | | | 0.20 | | | | 0.10 | |
Managed Fixed Income Portfolio | | | 0.40 | | | | 0.30 | | | | 0.40 | | | WellsCap | | | 0.20 | | | | 0.10 | |
Real Return Portfolio | | | 0.40 | | | | 0.30 | | | | 0.40 | | | WellsCap | | | 0.20 | | | | 0.10 | |
Stable Income Portfolio | | | 0.30 | | | | 0.225 | | | | 0.30 | | | Galliard Capital Management, Inc. | | | 0.28 | | | | 0.18 | |
Funds Management has voluntarily waived and/or reimbursed advisory fees to the extent necessary to maintain certain net operating expense ratios for the Portfolios.
5. INVESTMENT PORTFOLIO TRANSACTIONS
Purchases and sales of investments, excluding short-term securities, for the year ended May 31, 2016 were as follows:
| | | | | | | | | | | | | | | | |
| | | Purchases at cost | | | Sales proceeds | |
| | | U.S.
government | | | Non-U.S.
government | | | U.S.
government | | | Non-U.S.
government | |
C&B Large Cap Value Portfolio | | $ | 0 | | | $ | 85,183,352 | | | $ | 0 | | | $ | 114,963,169 | |
Diversified Large Cap Growth Portfolio | | | 0 | | | | 66,502,732 | | | | 0 | | | | 72,054,473 | |
Emerging Growth Portfolio | | | 0 | | | | 645,259,305 | | | | 0 | | | | 731,708,252 | |
Index Portfolio | | | 0 | | | | 102,056,002 | | | | 0 | | | | 425,715,055 | |
International Growth Portfolio | | | 0 | | | | 93,383,839 | | | | 0 | | | | 88,165,073 | |
International Value Portfolio | | | 0 | | | | 116,965,232 | | | | 0 | | | | 66,237,230 | |
Large Company Value Portfolio | | | 0 | | | | 40,427,589 | | | | 0 | | | | 38,186,695 | |
Small Company Growth Portfolio | | | 0 | | | | 1,109,978,075 | | | | 0 | | | | 480,747,665 | |
Small Company Value Portfolio | | | 0 | | | | 164,018,108 | | | | 0 | | | | 145,721,707 | |
Core Bond Portfolio | | | 24,379,101,867 | | | | 3,479,831,644 | | | | 23,990,784,629 | | | | 2,994,795,146 | |
Managed Fixed Income Portfolio | | | 18,980,575 | | | | 24,268,744 | | | | 17,908,760 | | | | 11,830,653 | |
Real Return Portfolio | | | 19,521,137 | | | | 12,085,988 | | | | 10,372,097 | | | | 4,914,247 | |
Stable Income Portfolio | | | 4,718,255 | | | | 11,562,924 | | | | 799,123 | | | | 4,557,635 | |
As of May 31, 2016, Real Return Portfolio had unfunded term loan commitments of $100,313.
| | | | |
| 154 | | Wells Fargo Allocation Funds | | Notes to financial statements |
6. INVESTMENTS IN AFFILIATES
An affiliated investment is a company which is under common ownership or control of the Portfolio or which the Portfolio has ownership of at least 5% of the outstanding voting shares. The following is a summary of transactions for the long-term holdings of issuers that were either affiliates of Index Portfolio at the beginning of the period or the end of the period.
| | | | | | | | | | | | | | | | | | | | | | | | |
| | | Shares,
beginning
of period | | Shares
purchases | | Shares
sold | | | Shares,
end of
period | | | Value, end
of period | | | Income
from
affiliated
securities | | | Realized gains
on affiliated
securities | |
Wells Fargo & Company | | 674,695 | | 0 | | | 90,743 | | | | 583,952 | | | $ | 29,618,045 | | | $ | 944,748 | | | $ | 1,980,988 | |
7. DERIVATIVE TRANSACTIONS
During the year ended May 31, 2016, Index Portfolio used uninvested cash to enter into futures contracts to gain market exposure. During the year ended May 31, 2016, Real Return Portfolio and Stable Income Portfolio entered into futures contracts to speculate on interest rates and to help manage the duration of each portfolio.
At May 31, 2016, the Portfolios had long and short futures contracts outstanding as follows:
| | | | | | | | | | | | | | | | |
| | | Expiration date | | Counterparty | | Contracts | | Type | | Contract value at May 31, 2016 | | | Unrealized
gains (losses) | |
Index Portfolio | | 6-16-2016 | | Jefferies Bache | | 60 Long | | S&P 500 Index | | $ | 31,423,500 | | | $ | 1,118,000 | |
Real Return Portfolio | | 9-21-2016 | | JPMorgan | | 2 Short | | 10-Year U.S. Treasury Notes | | | 259,375 | | | | (217 | ) |
Real Return Portfolio | | 9-21-2016 | | JPMorgan | | 3 Short | | U.S. Treasury Bonds | | | 489,938 | | | | (3,004 | ) |
Real Return Portfolio | | 9-30-2016 | | JPMorgan | | 10 Short | | 5-Year U.S. Treasury Notes | | | 1,201,172 | | | | (2,233 | ) |
Stable Income Portfolio | | 9-30-2016 | | JPMorgan | | 15 Short | | 5-Year U.S. Treasury Notes | | | 1,801,758 | | | | (3,867 | ) |
As of May 31, 2016, Stable Income Portfolio had segregated $12,274 as cash collateral for open futures contracts.
The Portfolios had average notional amounts in futures contracts during the year ended May 31, 2016 as follows:
| | | | | | | | |
| | | Long contracts | | | Short contracts | |
Index Portfolio | | $ | 29,775,935 | | | $ | 0 | |
Real Return Portfolio | | | 80,886 | | | | 1,223,081 | |
Stable Income Portfolio | | | 0 | | | | 1,966,559 | |
The receivable and payable for daily variation margin on open futures contracts reflected in the Statements of Assets and Liabilities only represents the current day’s variation margin. The realized gains or losses and change in unrealized gains or losses on derivative instruments are reflected in the Statements of Operations.
For certain types of derivative transactions, the Portfolios have entered into International Swaps and Derivatives Association, Inc. master agreements (“ISDA Master Agreements”) or similar agreements with approved counterparties. The ISDA Master Agreements or similar agreements may have requirements to deliver/deposit securities or cash to/with an exchange or broker-dealer as collateral and allows the Portfolios to offset, with each counterparty, certain derivative financial instrument’s assets and/or liabilities with collateral held or pledged. Collateral requirements differ by type of derivative. Collateral or margin requirements are set by the broker or exchange clearing house for exchange traded derivatives while collateral terms are contract specific for over-the-counter traded derivatives. Cash collateral that has been pledged to cover obligations of the Portfolios under ISDA Master Agreements or similar agreements, if any, will be reported separately in the Statements of Assets and Liabilities. Securities pledged as collateral, if any, for the same purpose are noted in the Portfolio of Investments or Summary Portfolio of Investments. With respect to balance sheet offsetting, absent an event of default by the counterparty or a termination of the agreement, the reported amounts of financial assets and financial liabilities in the Statements of Assets and Liabilities are not offset across transactions between each Portfolio and the applicable counterparty. A reconciliation of the gross amounts on the Statements of Assets and Liabilities to the net amounts by derivative type, including any collateral exposure, is as follows:
| | | | | | |
| Notes to financial statements | | Wells Fargo Allocation Funds | | | 155 | |
| | | | | | | | | | | | | | | | | | | | |
| | | Derivative type | | Counterparty | | Gross amounts of
assets in the
Statements of Assets
and Liabilities | | | Amounts
subject to
netting
agreements | | | Collateral
received | | | Net amount of assets | |
Real Return Portfolio | | Futures – variation margin | | JPMorgan | | $ | 31 | | | $ | (31 | ) | | $ | 0 | | | $ | 0 | |
| | | | | | | | | | | | | | | | | | | | |
| | | Derivative type | | Counterparty | | Gross amounts of liabilities in the Statements of Assets and Liabilities | | | Amounts
subject to
netting
agreements | | | Collateral
pledged1 | | | Net amount of liabilities | |
Index Portfolio | | Futures – variation margin | | Jefferies Bache | | $ | 36,000 | | | $ | 0 | | | $ | (36,000 | ) | | $ | 0 | |
Real Return Portfolio | | Futures – variation margin | | JPMorgan | | $ | 1,203 | | | $ | (31 | ) | | $ | (1,172 | ) | | $ | 0 | |
Stable Income Portfolio | | Futures – variation margin | | JPMorgan | | $ | 117 | | | $ | 0 | | | $ | (117 | ) | | $ | 0 | |
| 1 | Collateral pledged within this table is limited to the collateral for the net transaction with the counterparty. |
8. CONCENTRATION RISKS
Concentration risks result from exposure to a limited number of sectors. Portfolios that invest a substantial portion of their assets in a sector may be more affected by changes in that sector than would be a portfolio whose investments are not heavily weighted in any sector. The Portfolio of Investments or Summary Portfolio of Investments includes information on each Portfolio’s holdings, including sector composition, country and/or geographical composition as relevant.
9. INDEMNIFICATION
Under the Trust’s organizational documents, the officers and Trustees have been granted certain indemnification rights against certain liabilities that may arise out of performance of their duties to the Trust. Additionally, in the normal course of business, the Trust may enter into contracts with service providers that contain a variety of indemnification clauses. The Trust’s maximum exposure under these arrangements is dependent on future claims that may be made against the Portfolios and, therefore, cannot be estimated.
10. REDEMPTION IN-KIND
After the close of business on October 29, 2015, Wells Fargo Core Bond Fund, which invests all of its assets in Core Bond Portfolio, redeemed assets through an in-kind redemption. In the redemption transaction, Wells Fargo Core Bond Fund issued securities which it received from Core Bond Portfolio with a value of $223,656,162 along with cash in the amount of $20,349,815. Core Bond Portfolio recognized gains in the amount of $1,735,222, which are reflected on the Statements of Operations. The redemption in-kind represented 6.35% of Core Bond Portfolio and is reflected on the Statements of Changes in Net Assets.
| | | | |
| 156 | | Wells Fargo Allocation Funds | | Report of independent registered public accounting firm |
BOARD OF TRUSTEES AND SHAREHOLDERS OF WELLS FARGO MASTER TRUST:
We have audited the accompanying statements of assets and liabilities, including the portfolios of investments or summary portfolios of investments (for Wells Fargo Index Portfolio and Wells Fargo Core Bond Portfolio), of the Wells Fargo C&B Large Cap Value Portfolio, Wells Fargo Diversified Large Cap Growth Portfolio, Wells Fargo Emerging Growth Portfolio, Wells Fargo Index Portfolio, Wells Fargo International Growth Portfolio, Wells Fargo International Value Portfolio, Wells Fargo Large Company Value Portfolio, Wells Fargo Small Company Growth Portfolio, Wells Fargo Small Company Value Portfolio, Wells Fargo Core Bond Portfolio, Wells Fargo Managed Fixed Income Portfolio, Wells Fargo Real Return Portfolio, and Wells Fargo Stable Income Portfolio (formerly known as Wells Fargo Advantage C&B Large Cap Value Portfolio, Wells Fargo Advantage Diversified Large Cap Growth Portfolio, Wells Fargo Advantage Emerging Growth Portfolio, Wells Fargo Advantage Index Portfolio, Wells Fargo Advantage International Growth Portfolio, Wells Fargo Advantage International Value Portfolio, Wells Fargo Advantage Large Company Value Portfolio, Wells Fargo Advantage Small Company Growth Portfolio, Wells Fargo Advantage Small Company Value Portfolio, Wells Fargo Advantage Core Bond Portfolio, Wells Fargo Advantage Managed Fixed Income Portfolio, Wells Fargo Advantage Real Return Portfolio, and Wells Fargo Advantage Stable Income Portfolio, respectively), thirteen of the portfolios constituting the Wells Fargo Master Trust (collectively the “Portfolios”), as of May 31, 2016, and the related statements of operations for the year then ended, the statements of changes in net assets for each of the years in the two-year period then ended, and the financial highlights for each of the years in the five-year period then ended. These financial statements and financial highlights are the responsibility of the Portfolios’ management. Our responsibility is to express an opinion on these financial statements and financial highlights based on our audits.
We conducted our audits in accordance with the standards of the Public Company Accounting Oversight Board (United States). Those standards require that we plan and perform the audit to obtain reasonable assurance about whether the financial statements and financial highlights are free of material misstatement. An audit includes examining, on a test basis, evidence supporting the amounts and disclosures in the financial statements. Our procedures included confirmation of securities owned as of May 31, 2016, by correspondence with custodian and brokers, or by other appropriate auditing procedures. An audit also includes assessing the accounting principles used and significant estimates made by management, as well as evaluating the overall financial statement presentation. We believe that our audits provide a reasonable basis for our opinion.
In our opinion, the financial statements and financial highlights referred to above present fairly, in all material respects, the financial position of each of the aforementioned Portfolios of Wells Fargo Master Trust as of May 31, 2016, the results of their operations for the year then ended, the changes in their net assets for each of the years in the two-year period then ended, and the financial highlights for each of the years in the five-year period then ended, in conformity with U.S. generally accepted accounting principles.
Boston, Massachusetts
July 27, 2016
| | | | | | |
| Other information (unaudited) | | Wells Fargo Allocation Funds | | | 157 | |
TAX INFORMATION
For corporate shareholders, pursuant to Section 854 of the Internal Revenue Code, the percentage of ordinary income dividends qualifying for the corporate dividends-received deduction was as follows for the fiscal year ended May 31, 2016:
| | | | |
| | | Dividends-received deduction | |
Growth Balanced Fund | | | 67.98 | % |
Moderate Balanced Fund | | | 28.60 | |
Pursuant to Section 852 of the Internal Revenue Code, the following amounts were designated as long-term capital gain distributions for the fiscal year ended May 31, 2016:
| | | | |
| | | Long-term capital gain distributions | |
Moderate Balanced Fund | | $ | 6,284,057 | |
Pursuant to Section 854 of the Internal Revenue Code, the following amounts of income dividends paid during the fiscal year ended May 31, 2016 have been designated as qualified dividend income (QDI):
| | | | |
| | | QDI | |
Growth Balanced Fund | | $ | 2,568,800 | |
Moderate Balanced Fund | | | 1,146,131 | |
For the fiscal year ended May 31, 2016, the following amounts have been designated as interest-related dividends for nonresident alien shareholders pursuant to Section 871 of the Internal Revenue Code:
| | | | |
| | | Interest-related dividends | |
Growth Balanced Fund | | $ | 1,258,021 | |
Moderate Balanced Fund | | | 1,697,481 | |
For the fiscal year ended May 31, 2016, the following amounts have been designated as short-term capital gain dividends for nonresident alien shareholders pursuant to Section 871 of the Internal Revenue Code:
| | | | |
| | | Short-term Capital
gain dividends | |
Moderate Balanced Fund | | $ | 435,504 | |
For the fiscal year ended May 31, 2016, the percentage of ordinary income distributed which was derived from interest on U.S. government securities was as follows:
| | | | |
| | | % of U.S. government income | |
Growth Balanced Fund | | | 4.04 | % |
Moderate Balanced Fund | | | 4.48 | |
PROXY VOTING INFORMATION
A description of the policies and procedures used to determine how to vote proxies relating to portfolio securities is available without charge, upon request, by calling 1-800-222-8222, visiting our website at wellsfargofunds.com, or visiting the SEC website at sec.gov. Information regarding how the proxies related to portfolio securities were voted during the most recent 12-month period ended June 30 is available on the website at wellsfargofunds.com or by visiting the SEC website at sec.gov.
| | | | |
| 158 | | Wells Fargo Allocation Funds | | Other information (unaudited) |
PORTFOLIO HOLDINGS INFORMATION
The complete portfolio holdings are publicly available on the website (wellsfargofunds.com) on a one-month delayed basis. In addition, top ten holdings information (excluding derivative positions) is publicly available on the website on a monthly, seven-day or more delayed basis. Each Fund and Portfolio files its complete schedule of portfolio holdings with the SEC for the first and third quarters of each fiscal year on Form N-Q, which is available by visiting the SEC website at sec.gov. In addition, each Form N-Q may be reviewed and copied at the SEC’s Public Reference Room in Washington, DC, and at regional offices in New York City, at 233 Broadway, and in Chicago, at 175 West Jackson Boulevard, Suite 900. Information about the Public Reference Room may be obtained by calling 1-800-SEC-0330.
| | | | | | |
| Other information (unaudited) | | Wells Fargo Allocation Funds | | | 159 | |
BOARD OF TRUSTEES AND OFFICERS
Each of the Trustees and Officers1 listed in the table below acts in identical capacities for each fund in the Wells Fargo family of funds, which consists of 142 mutual funds comprising the Wells Fargo Funds Trust, Wells Fargo Variable Trust, Wells Fargo Master Trust and four closed-end funds (collectively the “Fund Complex”). This table should be read in conjunction with the Prospectus and the Statement of Additional Information2. The mailing address of each Trustee and Officer is 525 Market Street, 12th Floor, San Francisco, CA 94105. Each Trustee and Officer serves an indefinite term, however, each Trustee serves such term until reaching the mandatory retirement age established by the Trustees.
Independent Trustees
| | | | | | |
Name and year of birth | | Position held and length of service* | | Principal occupations during past five years or longer | | Current other public
company or investment
company directorships |
| William R. Ebsworth (Born 1957) | | Trustee, since 2015 | | Retired. From 1984 to 2013, equities analyst, portfolio manager, research director and chief financial officer at Fidelity Management and Research Company in Boston, Tokyo, and Hong Kong and retired in 2013 as Chief Investment Officer of Fidelity Strategic Advisers, Inc. where he lead a team of investment professionals managing client assets. Prior thereto, Board member of Hong Kong Securities Clearing Co., Hong Kong Options Clearing Corp., the Thailand International Fund, Ltd., Fidelity Investments Life Insurance Company, and Empire Fidelity Investments Life Insurance Company. Mr. Ebsworth is a CFA ® charterholder and an Adjunct Lecturer, Finance, at Babson College. | | Asset Allocation Trust |
| Jane A. Freeman (Born 1953) | | Trustee, since 2015 | | Retired. From 2012 to 2014 and 1999 to 2008, Chief Financial Officer of Scientific Learning Corporation. From 2008 to 2012, Ms. Freeman provided consulting services related to strategic business projects. Prior to 1999, Portfolio Manager at Rockefeller & Co. and Scudder, Stevens & Clark. Board member of the Harding Loevner Funds from 1996 to 2014, serving as both Lead Independent Director and chair of the Audit Committee. Board member of the Russell Exchange Traded Funds Trust from 2011 to 2012 and the chair of the Audit Committee. Ms. Freeman is Chair of Taproot Foundation (non-profit organization), a Board Member of Ruth Bancroft Garden (non-profit organization) and an inactive chartered financial analyst. | | Asset Allocation Trust |
| Peter G. Gordon (Born 1942) | | Trustee, since 1998; Chairman, since 2005 | | Co-Founder, Retired Chairman, President and CEO of Crystal Geyser Water Company. Trustee Emeritus, Colby College. | | Asset Allocation Trust |
| Isaiah Harris, Jr. (Born 1952) | | Trustee, since 2009 | | Retired. Chairman of the Board of CIGNA Corporation since 2009, and Director since 2005. From 2003 to 2011, Director of Deluxe Corporation. Prior thereto, President and CEO of BellSouth Advertising and Publishing Corp. from 2005 to 2007, President and CEO of BellSouth Enterprises from 2004 to 2005 and President of BellSouth Consumer Services from 2000 to 2003. Emeritus member of the Iowa State University Foundation Board of Governors. Emeritus Member of the Advisory Board of Iowa State University School of Business. Advisory Board Member, Palm Harbor Academy (charter school). Advisory Board Member, Child Evangelism Fellowship (non-profit). Mr. Harris is a certified public accountant (inactive status). | | CIGNA Corporation; Asset Allocation Trust |
| Judith M. Johnson (Born 1949) | | Trustee, since 2008;
Audit Committee Chairman, since 2008 | | Retired. Prior thereto, Chief Executive Officer and Chief Investment Officer of Minneapolis Employees Retirement Fund from 1996 to 2008. Ms. Johnson is an attorney, certified public accountant and a certified managerial accountant. | | Asset Allocation Trust |
| David F. Larcker (Born 1950) | | Trustee, since 2009 | | James Irvin Miller Professor of Accounting at the Graduate School of Business, Stanford University, Director of the Corporate Governance Research Initiative and Senior Faculty of The Rock Center for Corporate Governance since 2006. From 2005 to 2008, Professor of Accounting at the Graduate School of Business, Stanford University. Prior thereto, Ernst & Young Professor of Accounting at The Wharton School, University of Pennsylvania from 1985 to 2005. | | Asset Allocation Trust |
| | | | |
| 160 | | Wells Fargo Allocation Funds | | Other information (unaudited) |
| | | | | | |
Name and year of birth | | Position held and length of service* | | Principal occupations during past five years or longer | | Current other public
company or investment
company directorships |
| Olivia S. Mitchell (Born 1953) | | Trustee, since 2006 | | International Foundation of Employee Benefit Plans Professor, Wharton School of the University of Pennsylvania since 1993. Director of Wharton’s Pension Research Council and Boettner Center on Pensions & Retirement Research, and Research Associate at the National Bureau of Economic Research. Previously, Cornell University Professor from 1978 to 1993. | | Asset Allocation Trust |
| Timothy J. Penny (Born 1951) | | Trustee, since 1996 | | President and Chief Executive Officer of Southern Minnesota Initiative Foundation, a non-profit organization, since 2007 and Senior Fellow at the Humphrey Institute Policy Forum at the University of Minnesota since 1995. Member of the Board of Trustees of NorthStar Education Finance, Inc., a non-profit organization, since 2007. | | Asset Allocation Trust |
| Michael S. Scofield (Born 1943) | | Trustee, since 2010 | | Served on the Investment Company Institute’s Board of Governors and Executive Committee from 2008-2011 as well the Governing Council of the Independent Directors Council from 2006-2011 and the Independent Directors Council Executive Committee from 2008-2011. Chairman of the IDC from 2008-2010. Institutional Investor (Fund Directions) Trustee of Year in 2007. Trustee of the Evergreen Funds complex (and its predecessors) from 1984 to 2010. Chairman of the Evergreen Funds from 2000-2010. Former Trustee of the Mentor Funds. Retired Attorney, Law Offices of Michael S. Scofield. | | Asset Allocation Trust |
| * | Length of service dates reflect the Trustee’s commencement of service with the Trust’s predecessor entities, where applicable. |
Officers
| | | | | | |
Officers Name and
year of birth | | Position held and
length of service | | Principal occupations during past five years or longer | | |
Karla M. Rabusch (Born 1959) | | President, since 2003 | | Executive Vice President of Wells Fargo Bank, N.A. and President of Wells Fargo Funds Management, LLC since 2003. | | |
Nancy Wiser1 (Born 1967) | | Treasurer, since 2012 | | Executive Vice President of Wells Fargo Funds Management, LLC since 2011. Chief Operating Officer and Chief Compliance Officer at LightBox Capital Management LLC, from 2008 to 2011. | | |
| Jeremy DePalma1 (Born 1974) | | Treasurer, since 2012 | | Senior Vice President of Wells Fargo Funds Management, LLC since 2009. Senior Vice President of Evergreen Investment Management Company, LLC from 2008 to 2010 and head of the Fund Reporting and Control Team within Fund Administration from 2005 to 2010. | | |
| C. David Messman (Born 1960) | | Secretary, since 2000; Chief Legal Officer, since 2003 | | Senior Vice President and Secretary of Wells Fargo Funds Management, LLC since 2001. Assistant General Counsel of Wells Fargo Bank, N.A. since 2013 and Vice President and Managing Counsel of Wells Fargo Bank, N.A. from 1996 to 2013. | | |
Michael Whitaker (Born 1967) | | Chief Compliance Officer, since 2016* | | Executive Vice President of Wells Fargo Funds Management, LLC since 2016. Chief Compliance Officer of Fidelity’s Fixed Income Funds and Asset Allocation Funds from 2008 to 2016, Compliance Officer of FMR Co., Inc. from 2014 to 2016, Fidelity Investments Money Management, Inc. from 2014 to 2016, Fidelity Investments from 2007 to 2016. | | |
| David Berardi (Born 1975) | | Assistant Treasurer, since 2009 | | Vice President of Wells Fargo Funds Management, LLC since 2009. Vice President of Evergreen Investment Management Company, LLC from 2008 to 2010. Manager of Fund Reporting and Control for Evergreen Investment Management Company, LLC from 2004 to 2010. | | |
| 1 | Jeremy DePalma acts as Treasurer of the Growth Balanced Fund, Moderate Balanced Fund, International Growth Portfolio, and International Value Portfolio and Assistant Treasurer of the remaining funds in this shareholder report. In addition, Jeremy DePalma acts as Treasurer of 65 other funds and Assistant Treasurer of 64 other funds in the Fund Complex. Nancy Wiser serves as Treasurer of the remaining funds in this shareholder report as well as 64 other funds. |
| 2 | The Statement of Additional Information includes additional information about the Trustees and is available, without charge, upon request, by calling 1-800-222-8222 or by visiting the website at wellsfargofunds.com. |
| * | Michael Whitaker became Chief Compliance Officer effective May 16, 2016. |
| | | | | | |
| Other information (unaudited) | | Wells Fargo Allocation Funds | | | 161 | |
BOARD CONSIDERATION OF INVESTMENT MANAGEMENT, ADVISORY AND SUB-ADVISORY AGREEMENTS:
Wells Fargo Growth Balanced Fund, Wells Fargo Moderate Balanced Fund, Wells Fargo C&B Large Cap Value Portfolio, Wells Fargo Diversified Large Cap Growth Portfolio, Wells Fargo Emerging Growth Portfolio, Wells Fargo Index Portfolio, Wells Fargo Real Return Portfolio, Wells Fargo International Growth Portfolio, Wells Fargo International Value Portfolio, Wells Fargo Large Company Value Portfolio, Wells Fargo Managed Fixed Income Portfolio, Wells Fargo Small Company Growth Portfolio, Wells Fargo Small Company Value Portfolio, Wells Fargo Core Bond Portfolio and Wells Fargo Stable Income Portfolio
Under the Investment Company Act of 1940 (the “1940 Act”), the Board of Trustees (each, a “Board” and collectively, the “Boards”) of each of Wells Fargo Funds Trust (“Funds Trust”) and Wells Fargo Master Trust (“Master Trust”) (collectively, the “Trusts”), must determine annually whether to approve the continuation of the Trusts’ investment management, advisory and sub-advisory agreements, as applicable. In this regard, at an in-person meeting held on May 24-25, 2016 (the “Meeting”), the Funds Trust Board, all the members of which have no direct or indirect interest in the investment management, advisory and sub-advisory agreements and are not “interested persons” of the Trusts, as defined in the 1940 Act (the “Independent Trustees”), reviewed and approved for each of the Wells Fargo Growth Balanced Fund and Wells Fargo Moderate Balanced Fund (individually, a “Gateway Fund” and collectively, the “Gateway Funds”) an investment management agreement (the “Gateway Fund Management Agreement”) with Wells Fargo Funds Management, LLC (“Funds Management”).
At the Meeting, the Master Trust Board, all the members of which are Independent Trustees, reviewed and approved an investment advisory agreement (the “Master Portfolio Advisory Agreement”) with Funds Management for each of the Wells Fargo C&B Large Cap Value Portfolio, Wells Fargo Diversified Large Cap Growth Portfolio, Wells Fargo Emerging Growth Portfolio, Wells Fargo Index Portfolio, Wells Fargo Real Return Portfolio, Wells Fargo International Growth Portfolio, Wells Fargo International Value Portfolio, Wells Fargo Large Company Value Portfolio, Wells Fargo Managed Fixed Income Portfolio, Wells Fargo Small Company Growth Portfolio, Wells Fargo Small Company Value Portfolio, Wells Fargo Core Bond Portfolio, and Wells Fargo Stable Income Portfolio (individually, a “Master Portfolio” and collectively, the “Master Portfolios”). The Gateway Funds and the Master Portfolios are collectively referred to as the “Funds.”
The Master Trust Board also reviewed and approved the following at the Meeting: (i) an investment sub-advisory agreement with Wells Capital Management Incorporated (“WellsCap”) for each of the Diversified Large Cap Growth Portfolio, Emerging Growth Portfolio, Real Return Portfolio and Core Bond Portfolio; (ii) an investment sub-advisory agreement with Artisan Partners Limited Partnership (“Artisan”) for the International Growth Portfolio; (iii) an investment sub-advisory agreement with Cooke & Bieler L.P. (“Cooke & Bieler”) for the C&B Large Cap Value Portfolio; (iv) an investment sub-advisory agreement with LSV Asset Management (“LSV”) for the International Value Portfolio; (v) an investment sub-advisory agreement with Peregrine Capital Management, Inc. (“Peregrine”) for each of the Small Company Growth Portfolio and Small Company Value Portfolio; (vi) an investment sub-advisory agreement with Golden Capital Management, LLC (“Golden”) for the Index Portfolio; (vii) an investment sub-advisory agreement with Phocas Financial Corporation (“Phocas”) for the Large Company Value Portfolio; and (viii) an investment sub-advisory agreement with Galliard Capital Management, Inc. (“Galliard”) for Managed Fixed Income Portfolio and Stable Income Portfolio (collectively, the “Sub-Advisory Agreements”).
WellsCap, Artisan, Cooke & Bieler, LSV, Peregrine, Golden, Phocas and Galliard are collectively referred to as the “Sub-Advisers”, and the Gateway Fund Management Agreement, the Master Portfolio Advisory Agreement and the Sub-Advisory Agreements are collectively referred to as the “Advisory Agreements.”
The Gateway Funds are gateway blended funds that each invests all of their assets in multiple Master Portfolios.
At the Meeting, the Boards considered the factors and reached the conclusions described below relating to the selection of Funds Management and the Sub-Advisers and the approval of the Advisory Agreements. Prior to the Meeting, including at an in-person meeting in April 2016, the Trustees conferred extensively among themselves and with representatives of Funds Management about these matters. Also, the Boards have adopted a team-based approach, with each team consisting of a sub-set of Trustees, to assist the Boards in the discharge of their duties in reviewing performance and other matters throughout the year. The Independent Trustees were assisted in their evaluation of the Advisory Agreements by independent legal counsel, from whom they received separate legal advice and with whom they met separately.
In providing information to the Boards, Funds Management and the Sub-Advisers were guided by a detailed set of requests for information submitted to them by independent legal counsel on behalf of the Independent Trustees at the start of the Boards’ annual contract renewal process earlier in 2016. In considering and approving the Advisory
| | | | |
| 162 | | Wells Fargo Allocation Funds | | Other information (unaudited) |
Agreements, the Trustees considered the information they believed relevant, including but not limited to the information discussed below. The Boards considered not only the specific information presented in connection with the Meetings, but also the knowledge gained over time through interaction with Funds Management and the Sub-Advisers about various topics. In this regard, the Boards reviewed reports of Funds Management at each of their quarterly meetings, which included, among other things, portfolio reviews and performance reports. In addition, the Boards and the teams mentioned above confer with portfolio managers at various times throughout the year. The Boards did not identify any particular information or consideration that was all-important or controlling, and each individual Trustee may have attributed different weights to various factors.
After its deliberations, the Funds Trust Board unanimously approved the continuation of the Gateway Fund Management Agreement for a one-year period. Additionally, after its deliberations, the Master Trust Board unanimously approved the continuation of the Master Portfolio Advisory Agreement and the Sub-Advisory Agreements, each for a one-year term. The Boards also determined that the compensation payable to Funds Management and each of the Sub-Advisers was reasonable. The Boards considered the approval of the Advisory Agreements for the Funds as part of their consideration of agreements for funds across the complex, but their approvals were made on a fund-by-fund basis. The following summarizes a number of important, but not necessarily all, factors considered by the Boards in support of their approvals.
Nature, extent and quality of services
The Boards received and considered various information regarding the nature, extent and quality of services provided to the Funds by Funds Management and the Sub-Advisers under the Advisory Agreements. This information included a description of the investment advisory services and Fund-level administrative services, as well as, among other things, a summary of the background and experience of senior management of Funds Management, and the qualifications, background, tenure and responsibilities of each of the portfolio managers primarily responsible for the day-to-day portfolio management of the Funds.
The Boards evaluated the ability of Funds Management and the Sub-Advisers to attract and retain qualified investment professionals, including research, advisory and supervisory personnel. The Boards further considered the compliance programs and compliance records of Funds Management and the Sub-Advisers. In addition, the Boards took into account the full range of services provided to the Funds by Funds Management and its affiliates.
Fund performance and expenses
The Boards considered the performance results for each of the Funds over various time periods ended December 31, 2015. The Boards considered these results in comparison to the performance of funds in a universe that was determined by Broadridge Inc. (“Broadridge”) to be similar to the respective Funds (each, a “Universe”), and in comparison to each Fund’s benchmark index and to other comparative data. Broadridge is an independent provider of investment company data. The Boards received a description of the methodology used by Broadridge to select the mutual funds in each performance Universe.
The Funds Trust Board noted that the performance of each Gateway Fund (Administrator Class) relative to its respective Universe was as follows: (i) the performance of the Growth Balanced Fund was higher than the average performance of its Universe for all periods under review; and (ii) the performance of the Moderate Balanced Fund was higher than the average performance of its Universe for all periods under review.
The Funds Trust Board also noted that the performance of each Gateway Fund relative to its respective benchmark was as follows: (i) the performance of the Growth Balanced Fund was higher than or in range of its benchmark, the Growth Balanced Composite Index, which is a proprietary index used by the Funds Trust Board to help it assess the Growth Balanced Fund’s relative performance, for all periods under review; and (ii) the performance of the Moderate Balanced Fund was higher than or in range of its benchmark, the Moderate Balanced Composite Index, which is a proprietary index used by the Funds Trust Board to help it assess the Moderate Balanced Fund’s relative performance, for all periods under review.
The Master Trust Board took note of the performance of the Master Portfolios in the context of reviewing the performance of the Gateway Funds.
The Funds Trust Board also received and considered information regarding each Gateway Fund’s net operating expense ratios, which include fees and expenses of the corresponding Master Portfolio, and their various components, including actual management fees assessed at the Gateway Fund and Master Portfolio levels, custodian and other non-management fees, and Rule 12b-1 and non-Rule 12b-1 shareholder service fees. The Funds Trust Board considered these ratios in comparison to the median ratios of funds in class-specific expense groups that were determined by Broadridge
| | | | | | |
| Other information (unaudited) | | Wells Fargo Allocation Funds | | | 163 | |
to be similar to each Gateway Fund (the “Groups”). The Funds Trust Board received a description of the methodology used by Broadridge to select the mutual funds in the expense Groups and an explanation of how funds comprising expense groups and their expense ratios may vary from year-to-year. Based on the Broadridge reports, the Funds Trust Board noted that the net operating expense ratios of the Growth Balanced Fund were lower than or in range of the median net operating expense ratios of its expense Groups for all share classes. The Funds Trust Board also noted that the net operating expense ratios of the Moderate Balanced Fund were lower than or equal to the median net operating expense ratios of its expense Groups for all share classes.
With respect to the Master Portfolios, the Master Trust Board reviewed the fee rates that are payable to Funds Management for investment advisory services (as discussed below), which are the only fees charged at the Master Portfolio level, relative to a corresponding expense Group.
The Boards took into account the Fund performance and expense information provided to it among the factors considered in deciding to re-approve the Advisory Agreements.
Investment management, advisory and sub-advisory fee rates
The Funds Trust Board noted that the Gateway Funds are gateway blended funds that invest all of their assets in multiple master portfolios, and therefore pay an advisory fee to Funds Management. The Funds Trust Board also noted that the fee rate to be paid by the Gateway Funds under the Gateway Fund Management Agreement will incorporate the advisory fee and Fund-level administration fee previously payable separately by each Gateway Fund under the Gateway Fund Advisory Agreement and Administration Agreement with Funds Management.
The Funds Trust Board reviewed and considered the fee rates that are payable by each Gateway Fund to Funds Management under the Gateway Fund Management Agreement, as well as the contractual fee rates payable by each Gateway Fund to Funds Management for class-level administrative services under a Class-Level Administration Agreement, which include class-level transfer agency and sub-transfer agency costs (collectively, the “Management Rates”).
The Master Trust Board reviewed and considered the contractual investment advisory fee rates that are payable by the Master Portfolios to Funds Management for investment advisory services under the Master Portfolio Advisory Agreement (the “Advisory Agreement Rates”). The Master Trust Board also reviewed and considered the contractual investment sub-advisory fee rates that are payable by Funds Management to the Sub-Advisers for investment sub-advisory services (the “Sub-Advisory Agreement Rates”).
Among other information reviewed by the Funds Trust Board was a comparison of each Gateway Fund’s Management Rate, which, except in the case of the Diversified Equity Fund, include the advisory fees paid at the Master Portfolio level, with the average contractual investment management fee rates of funds in the expense Groups at a common asset level as well as transfer agency costs of the funds in the expense Groups. The Funds Trust Board noted that the Management Rates of the Growth Balanced Fund were lower than the sum of the management fee rates and transfer agency costs of its respective expense Groups for all share classes. The Funds Trust Board also noted that the Management Rates of the Moderate Balanced Fund were lower than the sum of the management fee rates and transfer agency costs of its respective expense Groups for all share classes.
The Master Trust Board reviewed a comparison of the Advisory Agreement Rates of each Master Portfolio with those of other funds in each Master Portfolio’s respective expense Group at a common asset level. The Master Trust Board noted that the Advisory Agreement Rates of each Master Portfolio were lower than or equal to the median rate for the Master Portfolio’s respective expense Group.
The Master Trust Board also received and considered information about the portions of the total management fees that were retained by Funds Management after payment of the fees to the Sub-Advisers for sub-advisory services. With respect to the Master Portfolios sub-advised by Artisan, Cooke & Bieler, LSV and Phocas, the Master Trust Board considered this amount in comparison to the median amount retained by advisers to funds in a sub-advised expense universe that was determined by Broadridge to be similar to the respective Master Portfolio. In assessing the reasonableness of these amounts, the Master Trust Board received and evaluated information about the nature and extent of responsibilities retained and risks assumed by Funds Management and not delegated to or assumed by the Sub-Advisers, and about Funds Management’s on-going oversight services. However, given the affiliation between Funds Management and WellsCap, Peregrine, Golden and Galliard, the Master Trust Board ascribed limited relevance to the allocation of the advisory fee between them. The Master Trust Board noted that the Small Company Growth Portfolio and Small Company Value Portfolio were each subject to a reduction in each of their investment sub-advisory fee breakpoint effective May 1, 2016 due to a new breakpoint schedule in the Sub-Advisory Agreement with Peregrine that was
| | | | |
| 164 | | Wells Fargo Allocation Funds | | Other information (unaudited) |
approved by the Board at the April 2016 Board meeting. With respect to Artisan, Cooke & Bieler, LSV and Phocas, the Master Trust Board considered that the Sub-Advisory Agreement Rates paid to each of these Sub-Advisers had been negotiated by Funds Management on an arm’s-length basis.
The Boards also received and considered information about the nature and extent of services offered and fee rates charged by Funds Management and the Sub-Advisers to other types of clients with investment strategies similar to those of the Funds. In this regard, the Boards received information about the significantly greater scope of services, and compliance, reporting and other legal burdens and risks of managing mutual funds compared with those associated with managing assets of non-mutual fund clients such as collective funds or institutional separate accounts.
Based on its consideration of the factors and information it deemed relevant, including those described here, the Funds Trust Board determined that the compensation payable to Funds Management under the Gateway Fund Management Agreement was reasonable, in light of the services covered by the Gateway Fund Management Agreement. The Master Trust Board determined that the compensation payable to Funds Management under the Master Portfolio Advisory Agreement and to each Sub-Adviser under each Sub-Advisory Agreement was reasonable, in light of the services covered by the Master Portfolio Advisory Agreement and each Sub-Advisory Agreement, respectively.
Profitability
The Boards received and considered information concerning the profitability of Funds Management, as well as the profitability of Wells Fargo as a whole, from providing services to the Funds and the fund family as a whole. The Boards also received and considered information concerning the profitability of WellsCap, Peregrine, Galliard and Golden, if any, from providing services to the fund family as a whole, noting that their profitability information with respect to providing services to the Funds was subsumed in the Wells Fargo and Funds Management profitability analysis. The Boards did not receive or consider profitability information with respect to Artisan, Cooke & Bieler, LSV and Phocas, as the sub-advisory fees paid to them had been negotiated by Funds Management on an arm’s-length basis.
Funds Management reported on the methodologies and estimates used in calculating profitability. Among other things, the Boards noted that the levels of profitability reported on a fund-by-fund basis varied widely, depending on factors such as the size and type of fund. Based on its review, the Boards did not deem the profits reported by Funds Management or Wells Fargo from its services to the Funds to be at a level that would prevent the Boards from approving the continuation of the Advisory Agreements.
Economies of scale
With respect to possible economies of scale, the Boards noted the existence of breakpoints in each Master Portfolio’s advisory fee structure and each Gateway Fund’s management fee structure, which operate generally to reduce the Funds’ expense ratios as the Funds grow in size. They considered that, for a small fund or a fund that shrinks in size, breakpoints conversely can result in higher fee levels. The Boards also considered that fee waiver and expense reimbursement arrangements and competitive fee rates at the outset are means of sharing potential economies of scale with shareholders of the Funds and the fund family as a whole. The Boards considered Funds Management’s view that any analyses of potential economies of scale in managing a particular fund are inherently limited in light of the joint and common costs and investments that Funds Management incurs across the fund family as a whole.
The Boards concluded that the Funds’ fee and expense arrangements, including contractual breakpoints, constituted a reasonable approach to sharing potential economies of scale with the Funds and their shareholders.
Other benefits to Funds Management and the Sub-Advisers
The Boards received and considered information regarding potential “fall-out” or ancillary benefits received by Funds Management and its affiliates, including WellsCap, Peregrine, Golden and Galliard, and by Artisan, Cooke & Bieler, LSV and Phocas, as a result of their relationships with the Funds. Ancillary benefits could include, among others, benefits directly attributable to other relationships with the Funds and benefits potentially derived from an increase in Funds Management’s and the Sub-Advisers’ business as a result of their relationships with the Funds. The Boards noted that various affiliates of Funds Management may receive distribution-related fees, shareholder servicing payments and sub-transfer agency fees in respect of shares sold or held through them and services provided.
The Boards also reviewed information about soft dollar credits earned and utilized by WellsCap, Artisan, Cooke & Bieler, Peregrine and Golden, fees earned by Funds Management and WellsCap from managing a private investment vehicle for the fund family’s securities lending collateral and commissions earned by an affiliated broker from portfolio transactions.
Based on their consideration of the factors and information they deemed relevant, including those described here, the Boards did not find that any ancillary benefits received by Funds Management and its affiliates, including WellsCap, Peregrine, Golden and Galliard, or by Artisan, Cooke & Bieler, LSV or Phocas, were unreasonable.
| | | | | | |
| Other information (unaudited) | | Wells Fargo Allocation Funds | | | 165 | |
Conclusion
At the Meeting, after considering the above-described factors and based on its deliberations and its evaluation of the information described above, the Funds Trust Board unanimously approved the continuation of the Gateway Fund Management Agreement for a one-year period. Additionally, after its deliberations, the Master Trust Board unanimously approved the continuation of the Master Portfolio Advisory Agreement and the Sub-Advisory Agreements, each for a one-year term. The Boards also determined that the compensation payable to Funds Management and each of the Sub-Advisers was reasonable.
| | | | |
| 166 | | Wells Fargo Allocation Funds | | List of abbreviations |
The following is a list of common abbreviations for terms and entities that may have appeared in this report.
| ACA | — ACA Financial Guaranty Corporation |
| ADR | — American depositary receipt |
| ADS | — American depositary shares |
| AGC | — Assured Guaranty Corporation |
| AGM | — Assured Guaranty Municipal |
| Ambac | — Ambac Financial Group Incorporated |
| AMT | — Alternative minimum tax |
| BAN | — Bond anticipation notes |
| BHAC | — Berkshire Hathaway Assurance Corporation |
| CAB | — Capital appreciation bond |
| CCAB | — Convertible capital appreciation bond |
| CDA | — Community Development Authority |
| CDO | — Collateralized debt obligation |
| DRIVER | — Derivative inverse tax-exempt receipts |
| DW&P | — Department of Water & Power |
| DWR | — Department of Water Resources |
| ECFA | — Educational & Cultural Facilities Authority |
| EDA | — Economic Development Authority |
| EDFA | — Economic Development Finance Authority |
| ETF | — Exchange-traded fund |
| FDIC | — Federal Deposit Insurance Corporation |
| FFCB | — Federal Farm Credit Banks |
| FGIC | — Financial Guaranty Insurance Corporation |
| FHA | — Federal Housing Administration |
| FHLB | — Federal Home Loan Bank |
| FHLMC | — Federal Home Loan Mortgage Corporation |
| FICO | — The Financing Corporation |
| FNMA | — Federal National Mortgage Association |
| GDR | — Global depositary receipt |
| GNMA | — Government National Mortgage Association |
| HCFR | — Healthcare facilities revenue |
| HEFA | — Health & Educational Facilities Authority |
| HEFAR | — Higher education facilities authority revenue |
| HFA | — Housing Finance Authority |
| HFFA | — Health Facilities Financing Authority |
| HUD | — Department of Housing and Urban Development |
| IDA | — Industrial Development Authority |
| IDAG | — Industrial Development Agency |
| KRW | — Republic of Korea won |
| LIBOR | — London Interbank Offered Rate |
| LIFER | — Long Inverse Floating Exempt Receipts |
| LLC | — Limited liability company |
| LLLP | — Limited liability limited partnership |
| LLP | — Limited liability partnership |
| MBIA | — Municipal Bond Insurance Association |
| MFHR | — Multifamily housing revenue |
| MSTR | — Municipal securities trust receipts |
| MUD | — Municipal Utility District |
| National | — National Public Finance Guarantee Corporation |
| PCFA | — Pollution Control Financing Authority |
| PCL | — Public Company Limited |
| PCR | — Pollution control revenue |
| PFA | — Public Finance Authority |
| PFFA | — Public Facilities Financing Authority |
| PFOTER | — Puttable floating option tax-exempt receipts |
| plc | — Public limited company |
| PUTTER | — Puttable tax-exempt receipts |
| R&D | — Research & development |
| Radian | — Radian Asset Assurance |
| RAN | — Revenue anticipation notes |
| RDA | — Redevelopment Authority |
| RDFA | — Redevelopment Finance Authority |
| REIT | — Real estate investment trust |
| ROC | — Reset option certificates |
| SAVRS | — Select auction variable rate securities |
| SBA | — Small Business Authority |
| SDR | — Swedish depositary receipt |
| SFHR | — Single-family housing revenue |
| SFMR | — Single-family mortgage revenue |
| SPA | — Standby purchase agreement |
| SPDR | — Standard & Poor’s Depositary Receipts |
| SPEAR | — Short Puttable Exempt Adjustable Receipts |
| STRIPS | — Separate trading of registered interest and |
| TAN | — Tax anticipation notes |
| TIPS | — Treasury inflation-protected securities |
| TRAN | — Tax revenue anticipation notes |
| TTFA | — Transportation Trust Fund Authority |
| TVA | — Tennessee Valley Authority |
This page is intentionally left blank.
This page is intentionally left blank.

For more information
More information about Wells Fargo Funds is available free upon request. To obtain literature, please write, email, visit the Funds’ website, or call:
Wells Fargo Funds
P.O. Box 8266
Boston, MA 02266-8266
Email: fundservice@wellsfargo.com
Website: wellsfargofunds.com
Individual investors: 1-800-222-8222
Retail investment professionals: 1-888-877-9275
Institutional investment professionals: 1-866-765-0778
This report and the financial statements contained herein are submitted for the general information of the shareholders of the Funds. If this report is used for promotional purposes, distribution of the report must be accompanied or preceded by a current prospectus. Before investing, please consider the investment objectives, risks, charges, and expenses of the investment. For a current prospectus and, if available, a summary prospectus, containing this information, call 1-800-222-8222 or visit the Funds’ website at wellsfargofunds.com. Read the prospectus carefully before you invest or send money.
Wells Fargo Asset Management (WFAM) is a trade name used by the asset management businesses of Wells Fargo & Company. Wells Fargo Funds Management, LLC, a wholly owned subsidiary of Wells Fargo & Company, provides investment advisory and administrative services for Wells Fargo Funds. Other affiliates of Wells Fargo & Company provide subadvisory and other services for the funds. The funds are distributed by Wells Fargo Funds Distributor, LLC, Member FINRA, an affiliate of Wells Fargo & Company.
NOT FDIC INSURED ¡ NO BANK GUARANTEE ¡ MAY LOSE VALUE
© 2016 Wells Fargo Funds Management, LLC. All rights reserved.
| | |
 | | 243136 07-16 AAFLD/AR110 05-16 |
Annual Report
May 31, 2016

Equity Gateway Funds

| n | | Wells Fargo C&B Large Cap Value Fund |
| n | | Wells Fargo Diversified Equity Fund |
| n | | Wells Fargo Emerging Growth Fund |
| n | | Wells Fargo International Value Fund |
| n | | Wells Fargo Small Company Growth Fund |
| n | | Wells Fargo Small Company Value Fund |

Reduce clutter. Save trees.
Sign up for electronic delivery of prospectuses and shareholder reports at wellsfargo.com/advantagedelivery
Contents
| * | A complete schedule of portfolio holdings as of the report date may be obtained, free of charge, by accessing the following website: https://www.wellsfargofunds.com/assets/edocs/regulatory/holdings/index-ann.pdf or by calling Wells Fargo Funds at 1-800-222-8222. This complete schedule, filed on Form N-CSR, is also available on the SEC’s website at sec.gov. |
The views expressed and any forward-looking statements are as of May 31, 2016, unless otherwise noted, and are those of the Fund managers and/or Wells Fargo Funds Management, LLC. Discussions of individual securities, or the markets generally, or any Wells Fargo Fund are not intended as individual recommendations. Future events or results may vary significantly from those expressed in any forward-looking statements. The views expressed are subject to change at any time in response to changing circumstances in the market. Wells Fargo Funds Management, LLC and the Fund disclaim any obligation to publicly update or revise any views expressed or forward-looking statements.
NOT FDIC INSURED ¡ NO BANK GUARANTEE ¡ MAY LOSE VALUE
| | | | |
| 2 | | Wells Fargo Equity Gateway Funds | | Letter to shareholders (unaudited) |

Karla M. Rabusch
President
Wells Fargo Funds
By July 2015, equity markets were declining, led by stocks in China, which endured the largest one-day in eight years.
Global equity markets around the world hit low points before starting to rebound in the middle of February 2016 when business data improved and central bankers reasserted their commitment to initiatives that are intended to spark economic growth.
Dear Valued Shareholder:
We are pleased to offer you this annual report for the Wells Fargo Equity Gateway Funds for the 12-month period that ended May 31, 2016. During much of the period, global equity, bond, and currency markets were volatile as recessionary pressures and diverging central bank policies concerned investors. As the period closed, investor confidence appeared to improve based on favorable economic data in key markets and central bank monetary policies that were intended to support increased business activity.
Shifting investor sentiment reflected changing economic and business data.
Early in the period, U.S. unemployment data improved and major European economies reported second-quarter 2015 gross domestic product growth. As the summer months arrived, oil prices declined once again after a spring rally, concerns arose about Greece’s ability to repay its sovereign debt, and the U.S. dollar strengthened in anticipation of a federal funds interest-rate increase. By July 2015, equity markets were declining, led by stocks in China, which endured the largest one-day loss in eight years on July 27, 2015.
The S&P 500 Index,1 a common measure of U.S. stock performance, fell into correction territory—defined as a loss of 10% or more—in August 2015 before recovering a portion of those losses. The Index then traded in a narrow range at its lower level for another month, retested the August lows in late September, and regained most of its year-to-date-2015 losses from October through December. As anticipated, the U.S. Federal Reserve (Fed) increased the federal funds rate in December and suggested it planned to pursue additional increases in 2016. During the first six weeks of 2016, the Index suffered the worst loss to open a year on record before trending higher through the end of the period. By the end of the period, the Index recorded a 1.72% gain.
Overseas, the Morgan Stanley Capital Index (MSCI) All Country World Index (ACWI) ex USA Index (Net)2 and the MSCI Emerging Markets (EM) Index (Net)3 recorded negative return patterns. In August 2015, China allowed its currency’s value to decline in an attempt to bolster exports and the U.S. dollar strengthened, which negatively affected investment returns and U.S. corporate profits earned overseas. During the fourth quarter of 2015, Japan’s economy contracted, China’s manufacturing sector retrenched, and growth appeared to slow in Europe.
Global equity markets around the world hit low points before starting to rebound in the middle of February 2016 when business data improved and central bankers reasserted their commitment to initiatives that are intended to spark economic growth. The European Central Bank (ECB) pushed the deposit interest rate further into negative territory. The Bank of Japan followed the ECB’s lead by setting a
| 1 | The S&P 500 Index consists of 500 stocks chosen for market size, liquidity, and industry group representation. It is a market-value-weighted index with each stock’s weight in the index proportionate to its market value. You cannot invest directly in an index. |
| 2 | The Morgan Stanley Capital International (MSCI) All Country World Index (ACWI) ex USA Index (Net) is a free-float-adjusted market-capitalization-weighted index that is designed to measure the equity market performance of developed markets, excluding the U.S. and Canada. Source: MSCI. MSCI makes no express or implied warranties or representations and shall have no liability whatsoever with respect to any MSCI data contained herein. The MSCI data may not be further redistributed or used as a basis for other indexes or any securities or financial products. This report is not approved, reviewed, or produced by MSCI. You cannot invest directly in an index. |
| 3 | The MSCI Emerging Markets (EM) Index (Net) is a free-float-adjusted market-capitalization-weighted index that is designed to measure the equity market performance of emerging markets. The MSCI EM Index (Net) consists of the following 23 emerging markets country indexes: Brazil, Chile, China, Colombia, Czech Republic, Egypt, Greece, Hungary, India, Indonesia, Korea, Malaysia, Mexico, Peru, the Philippines, Poland, Qatar, Russia, South Africa, Taiwan, Thailand, Turkey, and United Arab Emirates. You cannot invest directly in an index. |
| | | | | | |
| Letter to shareholders (unaudited) | | Wells Fargo Equity Gateway Funds | | | 3 | |
negative deposit rate. Negative deposit interest rates are intended to encourage banks to lend assets rather than keep them on deposit. The People’s Bank of China reduced reserve ratios in February, which also was intended to encourage lending. The ECB expanded and extended its bond-buying program, which injects liquidity into the markets and encourages investment. For its part, the Fed acknowledged that risks to global growth existed and indicated it would base further rate increases on data indicating the risks were being successfully addressed.
For the 12-month reporting period, the MSCI ACWI ex USA Index (Net) and MSCI EM Index (Net) recorded returns of -11.39% and -17.63%, respectively.
Don’t let short-term uncertainty derail long-term investment goals.
Periods of investment uncertainty can present challenges, but experience has taught us that maintaining long-term investment goals can be an effective way to plan for the future. To help you create a sound strategy based on your personal goals and risk tolerance, Wells Fargo Funds offers more than 100 mutual funds spanning a wide range of asset classes and investment styles. Although diversification cannot guarantee an investment profit or prevent losses, we believe it can be an effective way to manage investment risk and potentially smooth out overall portfolio performance. We encourage investors to know their investments and to understand that appropriate levels of risk-taking may unlock opportunities.
Thank you for choosing to invest with Wells Fargo Funds. We appreciate your confidence in us and remain committed to helping you meet your financial needs.
Sincerely,

Karla M. Rabusch
President
Wells Fargo Funds
Notice to shareholders
British Exit from European Union (“Brexit”)
On June 23, 2016, the United Kingdom (UK) voted to leave the European Union (EU). It is expected that the UK’s exit from the EU will take place within two years after giving formal notice to the EU of its intention to withdraw; however, the exact timeframe is unknown. There is considerable uncertainty about how the UK exit from the EU will be conducted, how negotiations of necessary treaties and trade agreements will proceed or how the financial markets will react. In addition, it is not yet known whether Brexit will increase the likelihood of other countries seeking to depart the EU. Immediately following the vote, markets in the UK, Europe and the world were negatively impacted. In light of the uncertainties surrounding the impact of Brexit on the broader global economy, the negative impact could be significant, potentially resulting in increased volatility and illiquidity and lower economic growth for companies that rely significantly on Europe for their business activities and revenues. Any further exits from the EU, or the possibility of such exits, would likely cause additional market disruption globally and introduce new legal and regulatory uncertainties.
For further information about your Fund, contact your investment professional, visit our website at wellsfargofunds.com, or call us directly at 1-800-222-8222. We are available 24 hours a day, 7 days a week.
| | | | |
| 4 | | Wells Fargo Equity Gateway Funds | | Performance highlights (unaudited) |
Wells Fargo C&B Large Cap Value Fund1
Investment objective
The Fund seeks maximum long-term total return (current income and capital appreciation), consistent with minimizing risk to principal.
Manager
Wells Fargo Funds Management, LLC
Subadviser for the affiliated master portfolio
Cooke & Bieler, L.P.
Portfolio managers
Andrew Armstrong, CFA®
Steve Lyons, CFA®
Michael M. Meyer, CFA®
Edward W. O’Connor, CFA®
R. James O’Neil, CFA®
Mehul Trivedi, CFA®
William Weber, CFA®
Average annual total returns (%) as of May 31, 2016
| | | | | | | | | | | | | | | | | | | | | | | | | | | | | | | | | | |
| | | | | Including sales charge | | | Excluding sales charge | | | Expense ratios2 (%) | |
| | | Inception date | | 1 year | | | 5 year | | | 10 year | | | 1 year | | | 5 year | | | 10 year | | | Gross | | | Net3 | |
| Class A (CBEAX) | | 7-26-2004 | | | (5.85 | ) | | | 8.15 | | | | 5.10 | | | | (0.08 | ) | | | 9.44 | | | | 5.73 | | | | 1.24 | | | | 1.15 | |
| Class B (CBEBX)* | | 7-26-2004 | | | (5.81 | ) | | | 8.35 | | | | 5.18 | | | | (0.81 | ) | | | 8.64 | | | | 5.18 | | | | 1.99 | | | | 1.90 | |
| Class C (CBECX) | | 7-26-2004 | | | (1.82 | ) | | | 8.64 | | | | 4.95 | | | | (0.82 | ) | | | 8.64 | | | | 4.95 | | | | 1.99 | | | | 1.90 | |
| Administrator Class (CBLLX) | | 7-26-2004 | | | – | | | | – | | | | – | | | | 0.11 | | | | 9.68 | | | | 5.94 | | | | 1.16 | | | | 1.00 | |
| Institutional Class (CBLSX) | | 7-26-2004 | | | – | | | | – | | | | – | | | | 0.33 | | | | 9.92 | | | | 6.22 | | | | 0.91 | | | | 0.80 | |
| Russell 1000® Value Index4 | | – | | | – | | | | – | | | | – | | | | (0.06 | ) | | | 10.70 | | | | 6.11 | | | | – | | | | – | |
| * | | Class B shares are closed to investment, except in connection with the reinvestment of any distributions and permitted exchanges. |
Figures quoted represent past performance, which is no guarantee of future results, and do not reflect taxes that a shareholder may pay on fund distributions or the redemption of fund shares. Investment return and principal value of an investment will fluctuate so that an investor’s shares, when redeemed, may be worth more or less than their original cost. Performance shown without sales charges would be lower if sales charges were reflected. Current performance may be lower or higher than the performance data quoted, which assumes the reinvestment of dividends and capital gains. Current month-end performance is available on the Fund’s website, wellsfargofunds.com.
Index returns do not include transaction costs associated with buying and selling securities, any mutual fund fees or expenses, or any taxes. It is not possible to invest directly in an index.
For Class A shares, the maximum front-end sales charge is 5.75%. For Class B shares, the maximum contingent deferred sales charge is 5.00%. For Class C shares, the maximum contingent deferred sales charge is 1.00%. Performance including a contingent deferred sales charge assumes the sales charge for the corresponding time period. Administrator Class and Institutional Class shares are sold without a front-end sales charge or contingent deferred sales charge.
Stock values fluctuate in response to the activities of individual companies and general market and economic conditions. Consult the Fund’s prospectus for additional information on these and other risks.
Please see footnotes on page 5.
| | | | | | |
| Performance highlights (unaudited) | | Wells Fargo Equity Gateway Funds | | | 5 | |
Wells Fargo C&B Large Cap Value Fund (continued)
|
| Growth of $10,000 investment as of May 31, 20165 |
|
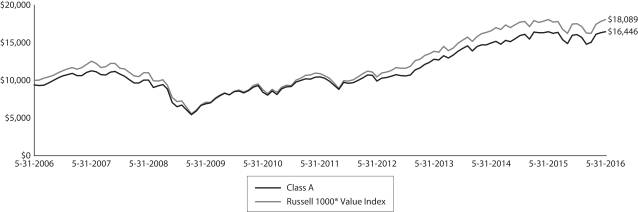 |
| 1 | The Fund is a gateway feeder fund that invests all of its assets in a single affiliated master portfolio of the Wells Fargo Master Trust with a substantially similar investment objective and substantially similar investment strategies. References to the investment activities of the Fund are intended to refer to the investment activities of the affiliated master portfolio in which it invests. |
| 2 | Reflects the expense ratios as stated in the most recent prospectuses. The expense ratios shown are subject to change and may differ from the annualized expense ratios shown in the financial highlights of this report. |
| 3 | The manager has contractually committed through September 30, 2016, to waive fees and/or reimburse expenses to the extent necessary to cap the Fund’s Total Annual Fund Operating Expenses After Fee Waiver at the amounts shown. After this time, the cap may be increased or the commitment to maintain the cap may be terminated only with the approval of the Board of Trustees. Brokerage commissions, stamp duty fees, interest, taxes, acquired fund fees and expenses, and extraordinary expenses are excluded from the expense cap. Net expenses from the affiliated master portfolio are included in the expense cap. Without this cap, the Fund’s returns would have been lower. |
| 4 | The Russell 1000® Value Index measures the performance of those Russell 1000 companies with lower price-to-book ratios and lower forecasted growth values. You cannot invest directly in an index. |
| 5 | The chart compares the performance of Class A shares for the most recent ten years with the Russell 1000® Value Index. The chart assumes a hypothetical $10,000 investment in Class A shares and reflects all operating expenses and assumes the maximum initial sales charge of 5.75%. |
| 6 | The ten largest holdings, excluding cash and cash equivalents, are calculated based on the value of the securities of the affiliated master portfolio allocable to the Fund divided by the total net assets of the Fund. Holdings are subject to change and may have changed since the date specified. |
| 7 | Amounts represent the sector distribution of the affiliated master portfolio which are calculated based on the total long-term investments of the affiliated master portfolio. These amounts are subject to change and may have changed since the date specified. |
| | | | |
| 6 | | Wells Fargo Equity Gateway Funds | | Performance highlights (unaudited) |
Wells Fargo C&B Large Cap Value Fund (continued)
MANAGER’S DISCUSSION
Fund highlights
| n | | The Fund underperformed its benchmark, the Russell 1000® Value Index,4 by 2 basis points (bps; 100 bps equals 1.00%) for the 12-month period that ended May 31, 2016. |
| n | | Sector allocation detracted from performance including utilities and telecommunication services which were underweight relative to the benchmark. A consumer discretionary overweight contributed to performance. |
| n | | Aiding performance was an underweight to the energy sector as well as security selection in six of the eight Global Industry Classification Standard economic sectors in which the Fund invested. |
Strong stock selection aided the Fund’s relative performance during the period.
The global economy remained fragile, but the U.S. economy saw evidence of improvement, particularly as the end of the period approached. Against this backdrop, the Fund underperformed its benchmark by 2 bps.
Favorable stock selection drove Fund performance higher in six of eight sectors to which the portfolio had exposure. Stock selection in the health care sector was the largest contributor, with two of the companies ranking among the Fund’s top five contributors. Offsetting this bright spot were the Fund’s industrials and information technology (IT) holdings. Headwinds affecting energy and commodities exposures negatively affected the Fund’s industrials holdings while IT holding QUALCOMM Incorporated dragged on performance as a result of the licensing-fee collection regulatory issue.
Sector weightings hurt relative performance. Unfavorable positioning included a zero weight to utilities and telecommunication services and an overweight to consumer discretionary. These detractors were partially offset by an overweight to industrials and an underweight to energy.
| | | | |
| Ten largest holdings (%) as of May 31, 20166 | |
Laboratory Corporation of America Holdings | | | 3.37 | |
State Street Corporation | | | 3.24 | |
JPMorgan Chase & Company | | | 3.20 | |
Omnicom Group Incorporated | | | 2.92 | |
UnitedHealth Group Incorporated | | | 2.91 | |
The Progressive Corporation | | | 2.85 | |
Twenty-First Century Fox Incorporated Class A | | | 2.85 | |
RenaissanceRe Holdings Limited | | | 2.85 | |
Crown Holdings Incorporated | | | 2.67 | |
AerCap Holdings NV | | | 2.62 | |
Contributors during the period included insurance provider The Progressive Corporation; advertising agency Omnicom Group Incorporated; tobacco producer Philip Morris International Incorporated; medical technology company Becton, Dickinson and Company; and health care company Johnson & Johnson. Laggards included financial services holding company State Street Corporation, diversified retailer Kohl’s Corporation, crude oil producer Devon Energy Corporation, and financial data systems provider American Express Company.
Market turbulence persistence provided us with a number of opportunities.
During the period, we added to existing holdings and initiated positions in the following: industrial supply company W.W. Grainger, Incorporated; aviation electronics and communication systems builder Rockwell Collins, Incorporated; airplane lessor AerCap Holdings N.V.; analog integrated circuits manufacturer Linear Technology Corporation; pharmaceutical company Abbott Laboratories; restaurant chain owner Brinker International, Incorporated; appliance manufacturer Whirlpool Corporation; coatings company Axalta Coating Systems Limited; insurance underwriter The Chubb Corporation; and private-label credit card provider Alliance Data Systems Corporation.
Please see footnotes on page 5.
| | | | | | |
| Performance highlights (unaudited) | | Wells Fargo Equity Gateway Funds | | | 7 | |
Wells Fargo C&B Large Cap Value Fund (continued)
To make room for these positions, we trimmed existing holdings and eliminated biopharmaceutical company Baxalta Incorporated; health care company Baxter International Incorporated; technology solutions provider Fiserv, Incorporated; insurance broker Willis Group Holdings plc; fast food chain operator McDonald’s Corporation; and consumer products company Colgate-Palmolive Company, all of which reached our price targets. We also completed the elimination of communications equipment developer QUALCOMM in early 2016 due to concerns about the effects on royalty revenues of licensing-fee collection regulations in China.
|
| Sector distribution as of May 31, 20167 |
|
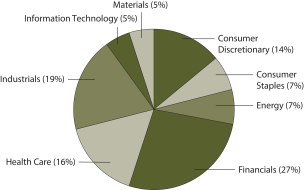 |
Continued market volatility highlights the importance of our long-term perspective.
The level of volatility we experienced in 2015 seems to us to be closer to the norm. In our view, lower market volatility levels during the prior six years were the exception and were driven largely by the effects of quantitative easing–related government bond buying. While this new normal may be nerve-wracking, we believe our investment style lends itself well to the new backdrop.
The start to 2016 was the worst ever recorded for the broad equity market, as measured by the Russell 1000® Value Index. Fear of impending disaster, both foreign and domestic, drove less-stalwart investors away from stocks. By February 11, 2016, worries of global recession pushed
the index into correction territory and oil prices down 29%. And then, sentiments turned. The index rebounded nearly 14% before quarter-end, and oil roared back 46%. Both finished the first quarter of 2016 in positive territory, turning a wild quarter into a placid 1.6% point-to-point index return.
We continue to find companies that we consider to be great at reasonable valuations and firmly believe that the Fund’s holdings will perform well if the economy continues to achieve progress forward. We also see a degree of downside mitigation if it does not. We are excited about the portfolio’s current positioning and its enviable collection of reasonably valued, financially strong, well-positioned companies that we believe can dependably grow earnings and cash flows, and we believe the portfolio will compound value at an above-average rate.
Please see footnotes on page 5.
| | | | |
| 8 | | Wells Fargo Equity Gateway Funds | | Performance highlights (unaudited) |
Wells Fargo Diversified Equity Fund1
Investment objective
The Fund seeks long-term total capital appreciation.
Manager
Wells Fargo Funds Management, LLC
Subadvisers for the affiliated master portfolios
Artisan Partners Limited Partnership
Cooke & Bieler, L.P.
Golden Capital Management, LLC
LSV Asset Management
Peregrine Capital Management, Inc.
Phocas Financial Corporation
Wells Capital Management Incorporated
Portfolio managers
Thomas C. Biwer, CFA®
Aldo Ceccarelli, CFA®
Erik Sens, CFA®
Average annual total returns (%) as of May 31, 2016
| | | | | | | | | | | | | | | | | | | | | | | | | | | | | | | | | | |
| | | | | Including sales charge | | | Excluding sales charge | | | Expense ratios2 (%) | |
| | | Inception date | | 1 year | | | 5 year | | | 10 year | | | 1 year | | | 5 year | | | 10 year | | | Gross | | | Net3 | |
| Class A (NVDAX) | | 5-2-1996 | | | (9.74 | ) | | | 6.77 | | | | 4.57 | | | | (4.24 | ) | | | 8.04 | | | | 5.19 | | | | 1.39 | | | | 1.25 | |
| Class B (NVDBX)* | | 5-6-1996 | | | (9.61 | ) | | | 7.00 | | | | 4.64 | | | | (4.61 | ) | | | 7.31 | | | | 4.64 | | | | 2.14 | | | | 2.00 | |
| Class C (WFDEX) | | 10-1-1998 | | | (5.96 | ) | | | 7.24 | | | | 4.40 | | | | (4.96 | ) | | | 7.24 | | | | 4.40 | | | | 2.14 | | | | 2.00 | |
| Administrator Class (NVDEX) | | 11-11-1994 | | | – | | | | – | | | | – | | | | (3.98 | ) | | | 8.32 | | | | 5.46 | | | | 1.31 | | | | 1.00 | |
| Diversified Equity Composite Index4 | | – | | | – | | | | – | | | | – | | | | (1.26 | ) | | | 9.76 | | | | 6.57 | | | | – | | | | – | |
| MSCI EAFE Index (Net)5 | | – | | | – | | | | – | | | | – | | | | (9.68 | ) | | | 2.12 | | | | 1.92 | | | | – | | | | – | |
| Russell 1000® Growth Index6 | | – | | | – | | | | – | | | | – | | | | 1.61 | | | | 12.11 | | | | 8.78 | | | | – | | | | – | |
| Russell 1000® Value Index7 | | – | | | – | | | | – | | | | – | | | | (0.06 | ) | | | 10.70 | | | | 6.11 | | | | – | | | | – | |
| Russell 2000® Index8 | | – | | | – | | | | – | | | | – | | | | (5.97 | ) | | | 7.86 | | | | 6.27 | | | | – | | | | – | |
| S&P 500 Index9 | | – | | | – | | | | – | | | | – | | | | 1.72 | | | | 11.67 | | | | 7.41 | | | | – | | | | – | |
| * | | Effective June 7, 2016, Class B shares are no longer offered by the Fund. |
Figures quoted represent past performance, which is no guarantee of future results, and do not reflect taxes that a shareholder may pay on fund distributions or the redemption of fund shares. Investment return and principal value of an investment will fluctuate so that an investor’s shares, when redeemed, may be worth more or less than their original cost. Performance shown without sales charges would be lower if sales charges were reflected. Current performance may be lower or higher than the performance data quoted, which assumes the reinvestment of dividends and capital gains. Current month-end performance is available on the Fund’s website, wellsfargofunds.com.
Index returns do not include transaction costs associated with buying and selling securities, any mutual fund fees or expenses, or any taxes. It is not possible to invest directly in an index.
For Class A shares, the maximum front-end sales charge is 5.75%. For Class B shares, the maximum contingent deferred sales charge is 5.00%. For Class C shares, the maximum contingent deferred sales charge is 1.00%. Performance including a contingent deferred sales charge assumes the sales charge for the corresponding time period. Administrator Class shares are sold without a front-end sales charge or contingent deferred sales charge.
Stock values fluctuate in response to the activities of individual companies and general market and economic conditions. Consult the Fund’s prospectus for additional information on these and other risks.
Please see footnotes on page 9.
| | | | | | |
| Performance highlights (unaudited) | | Wells Fargo Equity Gateway Funds | | | 9 | |
Wells Fargo Diversified Equity Fund (continued)
|
| Growth of $10,000 investment as of May 31, 201610 |
|
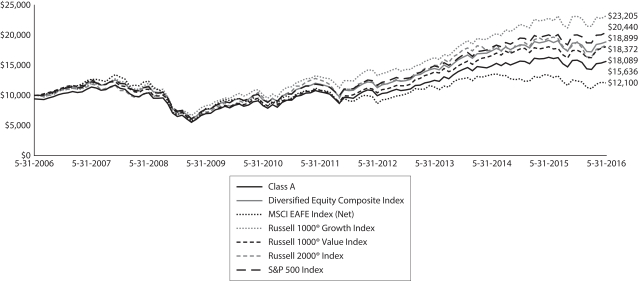 |
| 1 | The Fund is a gateway feeder fund that invests all of its assets in two or more affiliated master portfolios of the Wells Fargo Master Trust in varying proportions. References to the investment activities of the Fund are intended to refer to the investment activities of the affiliated master portfolios in which it invests. |
| 2 | Reflects the expense ratios as stated in the most recent prospectuses, which include the impact of 0.59% in net expenses from affiliated master portfolios. The expense ratios shown are subject to change and may differ from the annualized expense ratios shown in the financial highlights of this report, which do not include net expenses from affiliated master portfolios. |
| 3 | The manager has contractually committed through September 30, 2016, to waive fees and/or reimburse expenses to the extent necessary to cap the Fund’s Total Annual Fund Operating Expenses After Fee Waiver at the amounts shown. After this time, the cap may be increased or the commitment to maintain the cap may be terminated only with the approval of the Board of Trustees. Brokerage commissions, stamp duty fees, interest, taxes, acquired fund fees and expenses, and extraordinary expenses are excluded from the expense cap. Net expenses from the affiliated master portfolios are included in the expense cap. Without this cap, the Fund’s returns would have been lower. |
| 4 | Source: Wells Fargo Funds Management, LLC. The Diversified Equity Composite Index is weighted 15% in the MSCI EAFE Index (Net), 25% in the Russell 1000® Growth Index, 25% in the Russell 1000® Value Index, 10% in the Russell 2000® Index, and 25% in the S&P 500 Index. You cannot invest directly in an index. |
| 5 | The Morgan Stanley Capital International (MSCI) Europe, Australasia, Far East (EAFE) Index (Net) is a free-float-adjusted market-capitalization-weighted index that is designed to measure the equity market performance of developed markets, excluding the U.S. and Canada. The MSCI EAFE Index (Net) consists of the following 21 developed markets country indexes: Australia, Austria, Belgium, Denmark, Finland, France, Germany, Hong Kong, Ireland, Israel, Italy, Japan, the Netherlands, New Zealand, Norway, Portugal, Singapore, Spain, Sweden, Switzerland, and the United Kingdom. Source: MSCI. MSCI makes no representations and shall have no liability whatsoever with respect to any MSCI data contained herein. The MSCI data may not be further redistributed or used as a basis for other indexes or any securities or financial products. This report is not approved, reviewed, or produced by MSCI. You cannot invest directly in an index. |
| 6 | The Russell 1000® Growth Index measures the performance of those Russell 1000 companies with higher price-to-book ratios and higher forecasted growth values. You cannot invest directly in an index. |
| 7 | The Russell 1000® Value Index measures the performance of those Russell 1000 companies with lower price-to-book ratios and lower forecasted growth values. You cannot invest directly in an index. |
| 8 | The Russell 2000® Index measures the performance of the 2,000 smallest companies in the Russell 3000® Index, which represents approximately 8% of the total market capitalization of the Russell 3000® Index. You cannot invest directly in an index. |
| 9 | The S&P 500 Index consists of 500 stocks chosen for market size, liquidity, and industry group representation. It is a market-value-weighted index with each stock’s weight in the index proportionate to its market value. You cannot invest directly in an index. |
| 10 | The chart compares the performance of Class A shares for the most recent ten years with the Diversified Equity Composite Index, the MSCI EAFE Index (Net), the Russell 1000® Growth Index, the Russell 1000® Value Index, the Russell 2000® Index, and the S&P 500 Index. The chart assumes a hypothetical $10,000 investment in Class A shares and reflects all operating expenses and assumes the maximum initial sales charge of 5.75%. |
| 11 | The ten largest holdings, excluding cash and cash equivalents, are calculated based on the value of the securities of the affiliated master portfolios allocable to the Fund divided by the total net assets of the Fund. Holdings are subject to change and may have changed since the date specified. |
| 12 | Amounts represent the sector distribution of the affiliated master portfolios which are calculated based on the total long-term investments of the affiliated master portfolios. These amounts are subject to change and may have changed since the date specified. |
| | | | |
| 10 | | Wells Fargo Equity Gateway Funds | | Performance highlights (unaudited) |
Wells Fargo Diversified Equity Fund (continued)
MANAGERS’ DISCUSSION
Fund highlights
| n | | The Fund underperformed its custom benchmark, the Diversified Equity Composite Index, for the 12-month period that ended May 31, 2016, during a volatile period for global equities. |
| n | | Largely responsible for the lagging performance was the general underperformance by underlying funds compared with their individual style benchmarks. |
Global equity markets experienced higher volatility during the period.
Equity markets experienced sizable volatility during the 12-month period that ended May 31, 2016. Markets swooned in late August 2015 and then recovered, just to falter again at the start of 2016. Despite the volatility, select U.S. market segments achieved nominal gains over the time span. Foreign markets generally provided negative returns, with many European and Asian markets declining 10% or more for the period.
Investors were grappling with many concerns, but market volatility mainly was driven by two significant issues: questions about when the U.S. Federal Reserve would raise rates and whether or not Chinese economic data would continue to weaken. After much uncertainty throughout the year, the Federal Open Market Committee decided in December to raise the federal funds rate and indicated a likely slow path toward normalizing monetary policy. The devaluation of the Chinese currency by that nation’s central bank in August was seen by many as indicative of underlying economic weakness. Both events contributed to the elevated volatility. Additionally, crude oil prices declined and varied greatly during the period, heightening investor uncertainty.
Despite these challenges, select U.S. equity market segments provided small positive returns. One notable phenomenon was the unusually narrow market leadership. Just a few stocks contributed a large portion of the gains in several indexes or markets; these few stocks were some of the largest constituents of the broad indexes. Excluding that narrow set of stocks, many indexes would have provided negative returns. This effect also can be seen in the relative weakness of mid-cap and small-cap stocks; small-cap stocks, as measured by the Russell 2000® Index,8 lost 5.97% during the period.
The Fund is designed to provide diversification at two levels: across asset classes (U.S. large-cap core, growth and value stocks, U.S. small-cap stocks, and international stocks) and across funds and managers, both of which are widely thought to provide investors a smoother ride, especially in volatile markets. In most periods, some underlying funds will outperform their individual style benchmarks while others underperform. Over market cycles, we hope the two will balance out yet deliver outperformance in total. In the 12 months that ended May 31, 2016, the Fund encountered significant underperformance among underlying managers. This was the primary reason the Fund lagged its custom benchmark.
Among the Fund’s U.S. equity holdings, the Wells Fargo Diversified Large Cap Growth Portfolio, which is overseen by two managers, was the biggest detractor, owing to its emphasis on high-growth companies, which were hard-hit during the period. Also detracting significantly was the Wells Fargo Large Company Value Portfolio, which suffered from poor stock selection among its energy and technology holdings. In the small-cap segment of the Fund, the three underlying portfolios also trailed their style benchmarks. In the Fund’s international segment, the Wells Fargo International Growth Portfolio was a major detractor, suffering from weak stock selection in the European consumer staples and industrials sectors. Contributing positively to returns was the Fund’s investment in the Wells Fargo International Value Portfolio, which outperformed due partly to strong stock selection in the U.K. and Japan.
Please see footnotes on page 9.
| | | | | | |
| Performance highlights (unaudited) | | Wells Fargo Equity Gateway Funds | | | 11 | |
Wells Fargo Diversified Equity Fund (continued)
| | | | |
| Ten largest holdings (%) as of May 31, 201611 | |
Facebook Incorporated Class A | | | 1.61 | |
Apple Incorporated | | | 1.57 | |
Amazon.com Incorporated | | | 1.52 | |
Alphabet Incorporated Class A | | | 1.43 | |
Exxon Mobil Corporation | | | 1.26 | |
JPMorgan Chase & Company | | | 1.03 | |
Medtronic plc | | | 1.03 | |
Alphabet Incorporated Class C | | | 1.01 | |
Visa Incorporated Class A | | | 1.00 | |
Microsoft Corporation | | | 0.97 | |
|
| Sector distribution as of May 31, 201612 |
|
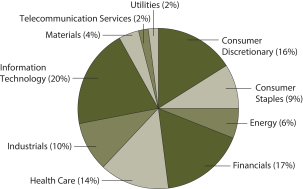 |
No changes were made to the Fund’s composition.
The Fund’s overall asset allocation among the underlying funds remains aligned with the composition of its composite benchmark: 25% in U.S. large-cap value portfolios, 25% in U.S. large-cap blend portfolios, 25% in U.S. large-cap growth portfolios, 10% in U.S. small-cap portfolios, and 15% in international portfolios.
Equities remain attractive.
After eight years of intermittent growth and trillions spent on monetary stimulus, global economies seem to be heading in the right direction. It’s too early to call for the world’s economies to boom—and we don’t see volatility going away—but monetary policy may be starting to have some traction. Further, the stability we have been looking for in China and in commodity prices is starting to be evident. Monetary stimulus, particularly in Europe and Japan, is showing results.
We believe the U.S. stock market still offers unlocked potential. The risk of a recession is low, in our opinion. Instead, we expect earnings to improve at the end of the year for many businesses around the globe. Speculation about negative interest rates is giving way to expectations of a federal funds rate hike over the next several months. We expect volatile markets around the globe, which likely will create investment opportunity.
Please see footnotes on page 9.
| | | | |
| 12 | | Wells Fargo Equity Gateway Funds | | Performance highlights (unaudited) |
Wells Fargo Emerging Growth Fund1
The Fund is closed to most new investors.2
Investment objective
The Fund seeks long-term capital appreciation.
Manager
Wells Fargo Funds Management, LLC
Subadviser for the affiliated master portfolio
Wells Capital Management Incorporated
Portfolio managers
Joseph M. Eberhardy, CFA®, CPA
Thomas C. Ognar, CFA®
Bruce C. Olson, CFA®
Average annual total returns (%) as of May 31, 20163
| | | | | | | | | | | | | | | | | | | | | | | | | | | | | | | | | | | | |
| | | | | Including sales charge | | | Excluding sales charge | | | | | Expense ratios4 (%) | |
| | | Inception date | | 1 year | | | 5 year | | | Since
inception | | | 1 year | | | 5 year | | | Since
inception | | | | | Gross | | | Net5 | |
| Class A (WEMAX) | | 3-31-2008 | | | (19.83 | ) | | | 4.58 | | | | 5.51 | | | | (14.94 | ) | | | 5.82 | | | | 6.19 | | | | | | 1.34 | | | | 1.34 | |
| Class C (WEMCX) | | 3-31-2008 | | | (16.59 | ) | | | 5.03 | | | | 5.40 | | | | (15.59 | ) | | | 5.03 | | | | 5.40 | | | | | | 2.09 | | | | 2.09 | |
| Administrator Class (WFGDX) | | 1-31-2007 | | | – | | | | – | | | | – | | | | (14.80 | ) | | | 6.00 | | | | 6.40 | | | | | | 1.26 | | | | 1.20 | |
| Institutional Class (WEMIX) | | 3-31-2008 | | | – | | | | – | | | | – | | | | (14.62 | ) | | | 6.31 | | | | 6.66 | | | | | | 1.01 | | | | 0.90 | |
| Russell 2000® Growth Index6 | | – | | | – | | | | – | | | | – | | | | (9.13 | ) | | | 8.15 | | | | 6.76 | | | | | | – | | | | – | |
Figures quoted represent past performance, which is no guarantee of future results, and do not reflect taxes that a shareholder may pay on fund distributions or the redemption of fund shares. Investment return and principal value of an investment will fluctuate so that an investor’s shares, when redeemed, may be worth more or less than their original cost. Performance shown without sales charges would be lower if sales charges were reflected. Current performance may be lower or higher than the performance data quoted, which assumes the reinvestment of dividends and capital gains. Current month-end performance is available on the Fund’s website, wellsfargofunds.com.
Index returns do not include transaction costs associated with buying and selling securities, any mutual fund fees or expenses, or any taxes. It is not possible to invest directly in an index.
For Class A shares, the maximum front-end sales charge is 5.75%. For Class C shares, the maximum contingent deferred sales charge is 1.00%. Performance including a contingent deferred sales charge assumes the sales charge for the corresponding time period. Administrator Class and Institutional Class shares are sold without a front-end sales charge or contingent deferred sales charge.
Stock values fluctuate in response to the activities of individual companies and general market and economic conditions. Smaller-company stocks tend to be more volatile and less liquid than those of larger companies. Certain investment strategies tend to increase the total risk of an investment (relative to the broader market. The Fund is exposed to foreign investment risk. Consult the Fund’s prospectus for additional information on these and other risks.
Please see footnotes on page 13.
| | | | | | |
| Performance highlights (unaudited) | | Wells Fargo Equity Gateway Funds | | | 13 | |
Wells Fargo Emerging Growth Fund (continued)
|
| Growth of $10,000 investment as of May 31, 20167 |
|
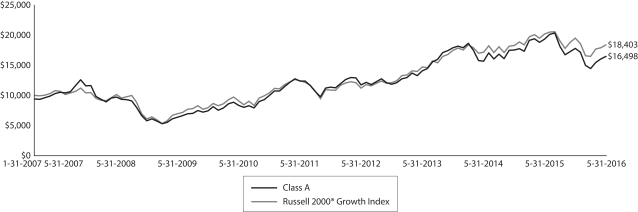 |
| 1 | The Fund is a gateway feeder fund that invests all of its assets in a single affiliated master portfolio of the Wells Fargo Master Trust with a substantially similar investment objective and substantially similar investment strategies. References to the investment activities of the Fund are intended to refer to the investment activities of the affiliated master portfolio in which it invests. |
| 2 | Please see the Fund’s current Statement of Additional Information for further details. |
| 3 | Historical performance shown for Class A shares prior to their inception reflects the performance of the former Investor Class shares, and includes the higher expenses applicable to the former Investor Class shares. If these expenses had not been included, returns would be higher. Historical performance shown for Class C shares prior to their inception reflects the performance of the former Investor Class shares, adjusted to reflect the higher expenses applicable to Class C shares. Historical performance shown for Institutional Class shares prior to their inception reflects the performance of Administrator Class shares, and includes the higher expenses applicable to Administrator Class shares. If these expenses had not been included, returns would be higher. |
| 4 | Reflects the expense ratios as stated in the most recent prospectuses. The expense ratios shown are subject to change and may differ from the annualized expense ratios shown in the financial highlights of this report. |
| 5 | The manager has contractually committed through September 30, 2016, to waive fees and/or reimburse expenses to the extent necessary to cap the Fund’s Total Annual Fund Operating Expenses After Fee Waiver at 1.35% for Class A, 2.10% for Class C, 1.20% for Administrator Class, and 0.90% for Institutional Class. After this time, the cap may be increased or the commitment to maintain the cap may be terminated only with the approval of the Board of Trustees. Brokerage commissions, stamp duty fees, interest, taxes, acquired fund fees and expenses, and extraordinary expenses are excluded from the expense cap. Net expenses from the affiliated master portfolio are included in the expense cap. Without this cap, the Fund’s returns would have been lower. |
| 6 | The Russell 2000® Growth Index measures the performance of those Russell 2000 companies with higher price-to-book ratios and higher forecasted growth values. You cannot invest directly in an index. |
| 7 | The chart compares the performance of Class A shares since inception with the Russell 2000® Growth Index. The chart assumes a hypothetical $10,000 investment in Class A shares and reflects all operating expenses and assumes the maximum initial sales charge of 5.75%. |
| 8 | The ten largest holdings, excluding cash and cash equivalents, are calculated based on the value of the securities of the affiliated master portfolio allocable to the Fund divided by the total net assets of the Fund. Holdings are subject to change and may have changed since the date specified. |
| 9 | Amounts represent the sector distribution of the affiliated master portfolio which are calculated based on the total long-term investments of the affiliated master portfolio. These amounts are subject to change and may have changed since the date specified. |
| * | This security was not held in the Fund at the end of the reporting period |
| | | | |
| 14 | | Wells Fargo Equity Gateway Funds | | Performance highlights (unaudited) |
Wells Fargo Emerging Growth Fund (continued)
MANAGER’S DISCUSSION
Fund highlights
| n | | The Fund underperformed its benchmark, the Russell 2000® Growth Index, for the 12-month period that ended May 31, 2016. |
| n | | The Fund’s relative underperformance was driven primarily by stock selection within the health care, consumer discretionary, and information technology (IT) sectors. |
| n | | Stock selection within the energy and financials sectors contributed positively to the Fund’s performance. |
Smaller-cap growth stocks underperformed the broad stock market.
For much of the period, investor sentiment deteriorated in an environment of generally rising spreads for high-yield bonds and declining oil prices. As a result, investors tended to favor larger-market-cap stocks, leading smaller-cap growth stocks to decline significantly. Although small-cap growth stocks recovered slightly by the end of the period, they still significantly underperformed large-caps for the 12-month reporting period.
Select holdings within the health care, consumer discretionary, and IT sectors detracted from performance.
Within health care, stock selection in the biotechnology, providers and services, and equipment and services industries influenced the Fund’s underperformance. PTC Therapeutics, Incorporated,* declined after the FDA informed the company that its application for review of a new drug, Translarna, was deemed insufficiently complete to permit a substantive review. Behavioral-health holding Acadia Healthcare Company, Incorporated, also detracted from performance in the midst of a general decline in the health care sector in late summer 2015 and early 2016. The company, which has been expanding its European operations, came under pressure again more recently over concerns that Britain may withdraw from the European Union.
Holdings in the hotels, restaurants, and leisure and retail industries drove weakness in the consumer discretionary sector. Fiesta Restaurant Group, Incorporated, reported slower-than-expected same-store sales growth, citing inclement weather and a nationwide egg shortage as the primary concerns. Also, The Habit Restaurants, Incorporated, reported generally strong results throughout the year but saw its stock decline due to investors’ concern about increased labor costs. Within retail, Boot Barn Holdings, Incorporated,* which has exposure to the oil and gas industries in Texas, Colorado, Wyoming, and North Dakota, reported lower same-store sales after falling oil prices led to layoffs across those regions.
Sharp declines in several holdings with significant market opportunities in faster-growing areas, such as cloud services, data analytics, and network security, largely influenced weakness in the IT sector. These holdings declined due to multiple factors, including investors’ general preference during much of the period for select mega-cap IT companies with well-established products. Due partly to this investor preference, many small-cap IT companies that were actively reinvesting in their businesses to expand market share were pressured at times during the period. Company-specific factors also influenced underperformance; while Demandware, Incorporated—a cloud-based, e-commerce platform provider—generated solid sales growth, the company suffered due to some delays in completing several large deals. SPS Commerce, Incorporated, also struggled to meet expectations after experiencing higher-than-expected turnover among its sales staff.
Please see footnotes on page 13.
| | | | | | |
| Performance highlights (unaudited) | | Wells Fargo Equity Gateway Funds | | | 15 | |
Wells Fargo Emerging Growth Fund (continued)
| | | | |
| Ten largest holdings (%) as of May 31, 20168 | |
Proofpoint Incorporated | | | 3.69 | |
MarketAxess Holdings Incorporated | | | 3.62 | |
Acadia Healthcare Company Incorporated | | | 3.43 | |
SPS Commerce Incorporated | | | 2.71 | |
InterXion Holding NV | | | 2.65 | |
Envestnet Incorporated | | | 2.29 | |
Q2 Holdings Incorporated | | | 2.21 | |
On Assignment Incorporated | | | 2.14 | |
Wageworks Incorporated | | | 2.13 | |
Ligand Pharmaceuticals Incorporated | | | 2.01 | |
|
| Sector distribution as of May 31, 20169 |
|
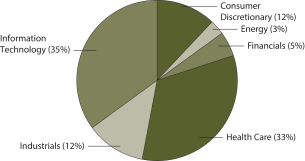 |
Holdings within the energy and financials sectors benefited performance.
Among the Fund’s energy holdings, RSP Permian, Incorporated, delivered the top results, driven by effective execution in a challenging environment. In financials, MarketAxess Holdings Incorporated continued to expand its market presence through its electronic bond-trading platform.
We continue to focus on consistently implementing our process.
Over the course of the 12-month period, we made modest adjustments to the Fund to capitalize on opportunities and position for the future. Using our bottom-up research process, we added select IT companies to the Fund that met our criteria for robust and sustainable growth that, in our view, had been underappreciated by the market. Funding for these purchases came primarily from sales of certain holdings within the consumer discretionary and health care sectors.
Given the abundant political and economic headlines dominating the media in the U.S. and worldwide over much of the reporting period, we expect heightened market volatility to continue into summer 2016 and through November 2016’s general election. With this volatility, we intend to capitalize on potential
opportunities as the valuation gaps of the companies held within the Fund widen and contract. We maintain strong conviction for the rapidly growing companies within the Fund; many holdings have been trading at multiyear-low valuations relative to the broad market. Our investment strategy—seeking robust growth companies with sustainable business models that, in our view, are underappreciated by investors—should position us, going forward, to take advantage of opportunities within the market for the benefit of Fund shareholders.
Please see footnotes on page 13.
| | | | |
| 16 | | Wells Fargo Equity Gateway Funds | | Performance highlights (unaudited) |
Wells Fargo Index Fund1
Investment objective
The Fund seeks to replicate the total return of S&P 500 Index, before fees and expenses.
Manager
Wells Fargo Funds Management, LLC
Subadviser for the affiliated master portfolio
Golden Capital Management, LLC
Portfolio managers
John R. Campbell, CFA®
Justin Carr, CFA®
David Neal, CFA®
Average annual total returns (%) as of May 31, 20162
| | | | | | | | | | | | | | | | | | | | | | | | | | | | | | | | | | |
| | | | | Including sales charge | | | Excluding sales charge | | | Expense ratios3 (%) | |
| | | Inception date | | 1 year | | | 5 year | | | 10 year | | | 1 year | | | 5 year | | | 10 year | | | Gross | | | Net4 | |
| Class A (WFILX) | | 11-4-1998 | | | (4.59 | ) | | | 9.77 | | | | 6.23 | | | | 1.24 | | | | 11.08 | | | | 6.86 | | | | 0.63 | | | | 0.56 | |
| Class B (WFMIX)* | | 11-3-1998 | | | (4.22 | ) | | | 9.98 | | | | 6.30 | | | | 0.48 | | | | 10.25 | | | | 6.30 | | | | 1.38 | | | | 1.31 | |
| Class C (WFINX) | | 4-30-1999 | | | (0.52 | ) | | | 10.26 | | | | 6.06 | | | | 0.48 | | | | 10.26 | | | | 6.06 | | | | 1.38 | | | | 1.31 | |
| Administrator Class (WFIOX) | | 2-14-1985 | | | – | | | | – | | | | – | | | | 1.49 | | | | 11.41 | | | | 7.16 | | | | 0.40 | | | | 0.25 | |
| S&P 500 Index5 | | – | | | – | | | | – | | | | – | | | | 1.72 | | | | 11.67 | | | | 7.41 | | | | – | | | | – | |
| * | | Class B shares are closed to investment, except in connection with the reinvestment of any distribution and permitted exchanges. |
Figures quoted represent past performance, which is no guarantee of future results, and do not reflect taxes that a shareholder may pay on fund distributions or the redemption of fund shares. Investment return and principal value of an investment will fluctuate so that an investor’s shares, when redeemed, may be worth more or less than their original cost. Performance shown without sales charges would be lower if sales charges were reflected. Current performance may be lower or higher than the performance data quoted, which assumes the reinvestment of dividends and capital gains. Current month-end performance is available on the Fund’s website, wellsfargofunds.com.
Index returns do not include transaction costs associated with buying and selling securities, any mutual fund fees or expenses, or any taxes. It is not possible to invest directly in an index.
For Class A shares, the maximum front-end sales charge is 5.75%. For Class B shares, the maximum contingent deferred sales charge is 5.00%. For Class C shares, the maximum contingent deferred sales charge is 1.00%. Performance including a contingent deferred sales charge assumes the sales charge for the corresponding time period. Administrator Class shares are sold without a front-end sales charge or contingent deferred sales charge.
Stock values fluctuate in response to the activities of individual companies and general market and economic conditions. The use of derivatives may reduce returns and/or increase volatility. Consult the Fund’s prospectus for additional information on these and other risks.
Please see footnotes on page 17.
| | | | | | |
| Performance highlights (unaudited) | | Wells Fargo Equity Gateway Funds | | | 17 | |
Wells Fargo Index Fund (continued)
|
| Growth of $10,000 investment as of May 31, 20166 |
|
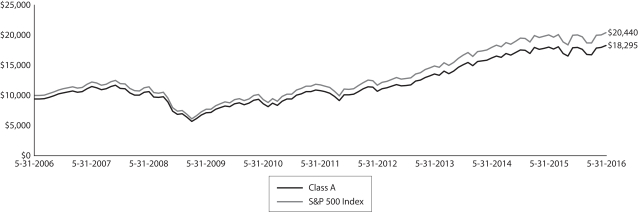 |
| 1 | The Fund is a gateway feeder fund that invests all of its assets in a single affiliated master portfolio of the Wells Fargo Master Trust with a substantially similar investment objective and substantially similar investment strategies. References to the investment activities of the Fund are intended to refer to the investment activities of the affiliated master portfolio in which it invests. |
| 2 | Historical performance shown for all classes of the Fund prior to July 19, 2010, is based on the performance of the Fund’s predecessor, Evergreen Equity Index Fund. |
| 3 | Reflects the expense ratios as stated in the most recent prospectuses. The expense ratios shown are subject to change and may differ from the annualized expense ratios shown in the financial highlights of this report. |
| 4 | The manager has contractually committed through September 30, 2017 (September 30, 2016 for Administrator Class), to waive fees and/or reimburse expenses to the extent necessary to cap the Fund’s Total Annual Fund Operating Expenses After Fee Waiver at 0.45% for Class A, 1.20% for Class B, 1.20% for Class C, and 0.25% for Administrator Class. After this time, the caps may be increased or the commitment to maintain the caps may be terminated only with the approval of the Board of Trustees. Brokerage commissions, stamp duty fees, interest, taxes, acquired fund fees and expenses, and extraordinary expenses are excluded from the expense cap. Net expenses from the affiliated master portfolio are included in the expense cap. Without this cap, the Fund’s returns would have been lower. |
| 5 | The S&P 500 Index consists of 500 stocks chosen for market size, liquidity, and industry group representation. It is a market-value-weighted index with each stock’s weight in the index proportionate to its market value. You cannot invest directly in an index. |
| 6 | The chart compares the performance of Class A shares for the most recent ten years with the S&P 500 Index. The chart assumes a hypothetical $10,000 investment in Class A shares and reflects all operating expenses and assumes the maximum initial sales charge of 5.75%. |
| 7 | The ten largest holdings, excluding cash and cash equivalents, are calculated based on the value of the securities of the affiliated master portfolio allocable to the Fund divided by the total net assets of the Fund. Holdings are subject to change and may have changed since the date specified. |
| 8 | Amounts represent the sector distribution of the affiliated master portfolio which are calculated based on the total long-term investments of the affiliated master portfolio. These amounts are subject to change and may have changed since the date specified. |
| | | | |
| 18 | | Wells Fargo Equity Gateway Funds | | Performance highlights (unaudited) |
Wells Fargo Index Fund (continued)
MANAGER’S DISCUSSION
Fund highlights
| n | | The Fund trailed its benchmark, the S&P 500 Index,5 for the 12-month period that ended May 31, 2016. |
| n | | Energy was the bottom-performing sector as nearly 60% of its constituents posted double-digit declines, including six that lost over half their value. The materials, health care, and financials sectors also declined during the period. |
| n | | The utilities, telecommunication services, and consumer staples sectors posted the highest returns in the S&P 500 Index. |
The Fund achieved its goal to approximate the performance of the S&P 500 Index before the deduction of fees and expenses. The Fund trailed the index after fees and expenses for the 12-month period ended May 31, 2016. The Fund’s management team rebalances the portfolio in order to reflect the ongoing changes in its benchmark’s constituents and weights. One cannot invest directly in the benchmark, and timing of cash flows and other practical issues affect the Fund’s tracking error, which is a measure of how closely a portfolio follows the index to which it is benchmarked. The team uses an investment process designed to control trading and implementation costs and reduce tracking error to the benchmark as much as possible.
The S&P 500 Index delivered positive returns during six months of the reporting period.
The S&P 500 Index delivered positive returns during six months of the reporting period, but there also were several months of decline. The top-performing sectors were utilities, telecommunication services, and consumer staples. Of the four sectors with negative returns, energy was the worst performer. During the period, U.S. gross domestic product growth declined from 3.9% during the second quarter of 2015 to 0.8% in the first quarter of 2016.
During the period, manufacturing activity slowed through December 2015 and generally improved from January to May 2016. Retail sales were weak with the exception of a relatively stronger estimate for April 2016. Unemployment improved from 5.5% in May 2015 to 4.7% in May 2016 (though it ticked up briefly in March and April 2016). Inflation remained low and was actually at or below zero for the last half of 2015. Consumer confidence declined toward the end of the period. In the fourth quarter of 2015, the U.S. Federal Reserve (Fed) raised the federal funds rate target by 0.25% to a range of 0.25% to 0.50%. This was the first rate increase in nearly a decade. After its March 2016 meeting, the Fed downwardly revised its year-end federal funds rate projection to 0.9% from 1.4%. In the second half of 2015, the U.S. dollar continued to appreciate against most major currencies, but that trend changed in the first quarter of 2016 as the U.S. dollar weakened. After several years of healthy profits, U.S. corporations saw a decline in profits.
| | | | |
| Ten largest holdings (%) as of May 31, 20167 | |
Apple Incorporated | | | 2.99 | |
Microsoft Corporation | | | 2.27 | |
Exxon Mobil Corporation | | | 2.00 | |
Johnson & Johnson | | | 1.68 | |
General Electric Company | | | 1.52 | |
Amazon.com Incorporated | | | 1.51 | |
Facebook Incorporated Class A | | | 1.47 | |
Berkshire Hathaway Incorporated Class B | | | 1.42 | |
AT&T Incorporated | | | 1.30 | |
JPMorgan Chase & Company | | | 1.30 | |
The utilities, telecommunication services, and consumer staples sectors were the top performers.
The utilities, telecommunication services, and consumer staples sectors were the top performers. These sectors traditionally are viewed as defensive in nature, yet they were the only sectors to post double-digit returns during the period. The strength was broad-based in utilities and consumer staples as approximately 60% of their constituents posted double-digit returns. AT&T Incorporated was the top performer in the telecommunication services sector.
Please see footnotes on page 17.
| | | | | | |
| Performance highlights (unaudited) | | Wells Fargo Equity Gateway Funds | | | 19 | |
Wells Fargo Index Fund (continued)
|
| Sector distribution as of May 31, 20168 |
|
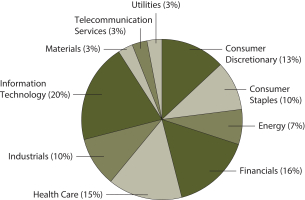 |
Energy was the worst-performing sector for the period, though materials, health care, and financials also declined. Weakness within the energy sector was as pervasive as strength in utilities and consumer staples as nearly 60% of its constituents posted double-digit declines. Six of the sector’s 42 stocks—Chesapeake Energy Corporation; CONSOL Energy Incorporated; Ensco plc; Kinder Morgan, Incorporated; Marathon Oil Corporation; and The Williams Companies, Incorporated—lost over half their value. The Fund held positions in Chesapeake Energy, Kinder Morgan, Marathon Oil, and The Williams Companies. The bottom performers within materials, health care, and financials were CF Industries Holdings, Incorporated; Endo International plc; and Genworth Financial, Incorporated, respectively. The Fund held positions in CF Industries and Genworth Financial.
Please see footnotes on page 17.
| | | | |
| 20 | | Wells Fargo Equity Gateway Funds | | Performance highlights (unaudited) |
Wells Fargo International Value Fund1
Investment objective
The Fund seeks long-term capital appreciation.
Manager
Wells Fargo Funds Management, LLC
Subadviser for the affiliated master portfolio
LSV Asset Management
Portfolio managers
Josef Lakonishok
Puneed Mansharamani, CFA®
Menno Vermeulen, CFA®
Average annual total returns (%) as of May 31, 20162
| | | | | | | | | | | | | | | | | | | | | | | | | | | | | | | | | | |
| | | | | Including sales charge | | | Excluding sales charge | | | Expense ratios3 (%) | |
| | | Inception date | | 1 year | | | 5 year | | | 10 year | | | 1 year | | | 5 year | | | 10 year | | | Gross | | | Net4 | |
| Class A (WFFAX) | | 10-31-2003 | | | (17.35 | ) | | | (0.72 | ) | | | (0.53 | ) | | | (12.31 | ) | | | 0.46 | | | | 0.06 | | | | 1.45 | | | | 1.35 | |
| Class C (WFVCX) | | 4-8-2005 | | | (13.95 | ) | | | (0.29 | ) | | | (0.70 | ) | | | (12.95 | ) | | | (0.29 | ) | | | (0.70 | ) | | | 2.20 | | | | 2.10 | |
| Administrator Class (WFVDX) | | 4-8-2005 | | | – | | | | – | | | | – | | | | (12.36 | ) | | | 0.64 | | | | 0.26 | | | | 1.37 | | | | 1.25 | |
| Institutional Class (WFVIX) | | 8-31-2006 | | | – | | | | – | | | | – | | | | (11.98 | ) | | | 0.88 | | | | 0.48 | | | | 1.12 | | | | 1.00 | |
| MSCI EAFE Value Index (Net)5 | | – | | | – | | | | – | | | | – | | | | (13.76 | ) | | | 0.89 | | | | 0.70 | | | | – | | | | – | |
Figures quoted represent past performance, which is no guarantee of future results, and do not reflect taxes that a shareholder may pay on fund distributions or the redemption of fund shares. Investment return and principal value of an investment will fluctuate so that an investor’s shares, when redeemed, may be worth more or less than their original cost. Performance shown without sales charges would be lower if sales charges were reflected. Current performance may be lower or higher than the performance data quoted, which assumes the reinvestment of dividends and capital gains. Current month-end performance is available on the Fund’s website, wellsfargofunds.com.
Index returns do not include transaction costs associated with buying and selling securities, any mutual fund fees or expenses, or any taxes. It is not possible to invest directly in an index.
For Class A shares, the maximum front-end sales charge is 5.75%. For Class C shares, the maximum contingent deferred sales charge is 1.00%. Performance including a contingent deferred sales charge assumes the sales charge for the corresponding time period. Administrator Class and Institutional Class shares are sold without a front-end sales charge or contingent deferred sales charge.
Stock values fluctuate in response to the activities of individual companies and general market and economic conditions. Foreign investments are especially volatile and can rise or fall dramatically due to differences in the political and economic conditions of the host country. These risks are generally intensified in emerging markets. The use of derivatives may reduce returns and/or increase volatility. Certain investment strategies tend to increase the total risk of an investment (relative to the broader market). The Fund is exposed to smaller company securities risk. Consult the Fund’s prospectus for additional information on these and other risks.
Please see footnotes on page 21.
| | | | | | |
| Performance highlights (unaudited) | | Wells Fargo Equity Gateway Funds | | | 21 | |
Wells Fargo International Value Fund (continued)
|
| Growth of $10,000 investment as of May 31, 20166 |
|
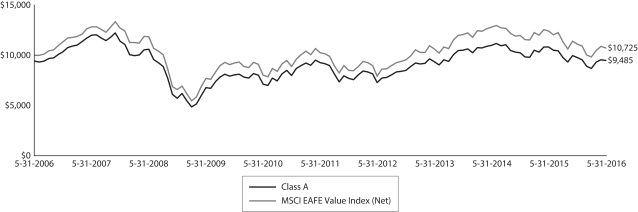 |
| 1 | The Fund is a gateway feeder fund that invests all of its assets in a single affiliated master portfolio of the Wells Fargo Master Trust with a substantially similar investment objective and substantially similar investment strategies. References to the investment activities of the Fund are intended to refer to the investment activities of the affiliated master portfolio in which it invests. |
| 2 | Historical performance shown for Institutional Class shares prior to their inception reflects the performance of Administrator Class shares, and includes the higher expenses applicable to Administrator Class shares. If these expenses had not been included, returns would be higher. |
| 3 | Reflects the expense ratios as stated in the most recent prospectuses. The expense ratios shown are subject to change and may differ from the annualized expense ratios shown in the financial highlights of this report. |
| 4 | The manager has contractually committed through September 30, 2016, to waive fees and/or reimburse expenses to the extent necessary to cap the Fund’s Total Annual Fund Operating Expenses After Fee Waiver at the amounts shown. After this time, the cap may be increased or the commitment to maintain the cap may be terminated only with the approval of the Board of Trustees. Brokerage commissions, stamp duty fees, interest, taxes, acquired fund fees and expenses, and extraordinary expenses are excluded from the expense cap. Net expenses from the affiliated master portfolio are included in the expense cap. Without this cap, the Fund’s returns would have been lower. |
| 5 | The Morgan Stanley Capital International (MSCI) Europe, Australasia, and Far East (EAFE) Value Index (Net) is a free-float-adjusted market capitalization-weighted index that is designed to measure the equity market performance of value securities within developed equity markets, excluding the U.S. and Canada. The MSCI EAFE Value Index (Net) consists of the following 21 developed markets country indexes: Australia, Austria, Belgium, Denmark, Finland, France, Germany, Hong Kong, Ireland, Israel, Italy, Japan, the Netherlands, New Zealand, Norway, Portugal, Singapore, Spain, Sweden, Switzerland, and the United Kingdom. Source: MSCI. MSCI makes no express or implied warranties or representations and shall have no liability whatsoever with respect to any MSCI data contained herein. The MSCI data may not be further redistributed or used as a basis for other indexes or any securities or financial products. This report is not approved, reviewed, or produced by MSCI. You cannot invest directly in an index. |
| 6 | The chart compares the performance of Class A shares for the most recent ten years with the MSCI EAFE Value Index (Net). The chart assumes a hypothetical $10,000 investment of in Class A shares and reflects all operating expenses and assumes the maximum initial sales charge of 5.75%. |
| 7 | The MSCI EAFE (Europe, Australasia, Far East) Index (Net) is a free-float-adjusted market-capitalization-weighted index that is designed to measure the equity market performance of developed markets, excluding the U.S. and Canada. The MSCI EAFE Index (Net) consists of the following 21 developed markets country indexes: Australia, Austria, Belgium, Denmark, Finland, France, Germany, Hong Kong, Ireland, Israel, Italy, Japan, the Netherlands, New Zealand, Norway, Portugal, Singapore, Spain, Sweden, Switzerland, and the United Kingdom. You cannot invest directly in an index. |
| 8 | The MSCI Emerging Markets (EM) Index (Net) is a free-float-adjusted market-capitalization-weighted index that is designed to measure the equity market performance of emerging markets. The MSCI EM Index (Net) consists of the following 23 emerging markets country indexes: Brazil, Chile, China, Colombia, Czech Republic, Egypt, Greece, Hungary, India, Indonesia, Korea, Malaysia, Mexico, Peru, the Philippines, Poland, Qatar, Russia, South Africa, Taiwan, Thailand, Turkey, and United Arab Emirates. You cannot invest directly in an index. |
| 9 | The ten largest holdings, excluding cash and cash equivalents, are calculated based on the value of the securities of the affiliated master portfolio allocable to the Fund divided by the total net assets of the Fund. Holdings are subject to change and may have changed since the date specified. |
| 10 | Amounts represent the composition of the affiliated master portfolio which are calculated based on the total long-term investments of the affiliated master portfolio. These amounts are subject to change and may have changed since the date specified. |
| | | | |
| 22 | | Wells Fargo Equity Gateway Funds | | Performance highlights (unaudited) |
Wells Fargo International Value Fund (continued)
MANAGER’S DISCUSSION
Fund highlights
| n | | The Fund outperformed its benchmark, the Morgan Stanley Capital International (MSCI) Europe, Australasia, and Far East (EAFE) Value Index (Net),5 for the 12-month period that ended May 31, 2016. |
| n | | The Fund benefited from solid stock selection over the past 12 months despite the headwind of value stocks lagging growth stocks in the period. |
| n | | The most significant changes in sector exposures during the period were increases in the Fund’s weights in industrials and health care stocks and decreases in financials and energy stocks. The Fund is underweight the financials, energy, and utilities sectors relative to the MSCI EAFE Value Index (Net) and overweight the industrials, consumer discretionary, and consumer staples sectors. |
International developed stock markets declined over the past 12 months, with the MSCI EAFE Index (Net)7 returning -9.68%. Value stocks underperformed, and the MSCI EAFE Value Index (Net) declined 13.76%. Defensive sectors such as consumer staples, health care, telecommunication services, and utilities held up best in the period, while materials, consumer discretionary, and financials stocks lagged. Emerging markets trailed the developed markets by a wide margin, with the MSCI Emerging Markets (EM) Index (Net)8 declining 17.63%.
| | | | |
| Ten largest holdings (%) as of May 31, 20169 | |
Nippon Telegraph & Telephone Corporation | | | 2.02 | |
Sanofi SA | | | 1.62 | |
Royal Dutch Shell plc Class B | | | 1.36 | |
Swiss Reinsurance AG | | | 1.34 | |
BP plc | | | 1.32 | |
BAE Systems plc | | | 1.29 | |
Allianz AG | | | 1.15 | |
Magna International Incorporated | | | 1.05 | |
Gas Natural SDG SA | | | 1.05 | |
Daimler AG | | | 1.02 | |
Favorable stock selection allowed the Fund to outperform despite the fact that value stocks and emerging markets underperformed.
The Fund outperformed its benchmark, the MSCI EAFE Value Index (Net), for the 12-month period that ended May 31, 2016. Value stocks trailed growth stocks over the period, adversely affecting the Fund’s performance given our deep value discipline. However, the Fund benefited from strong stock selection, particularly in the materials, consumer staples, and financials sectors. The Fund’s exposure to emerging markets had a negative effect on results because emerging markets trailed the developed markets by nearly 8 percentage points.
Top-contributing positions included out-of-benchmark exposure to Smurfit Kappa Group plc and Mondi plc as well as a lack of exposure to Glencore plc in the materials sector; exposure to Royal Ahold N.V., KT&G Corporation, and Marine Harvest ASA in the consumer staples sector; and holdings in Challenger Limited and Amlin plc as well as a lack of exposure to HSBC Holdings plc in the financials sector. The Fund also was aided by its exposure to telecommunication services company NTT DOCOMO, Incorporated, and industrials company Thales S.A. Detractors included holdings in GlaxoSmithKline plc and Bayer AG in the health care sector and exposure to Credit Suisse Group AG and Resona Holdings, Incorporated, in the financials sector. The Fund was also negatively affected by its underweight to Siemens AG as well as a lack of exposure to Nestle S.A. and Imperial Brands plc; all three of those stocks posted strong returns.
Please see footnotes on page 21.
| | | | | | |
| Performance highlights (unaudited) | | Wells Fargo Equity Gateway Funds | | | 23 | |
Wells Fargo International Value Fund (continued)
|
| Sector distribution as of May 31, 201610 |
|
 |
|
| Country allocation as of May 31, 201610 |
|
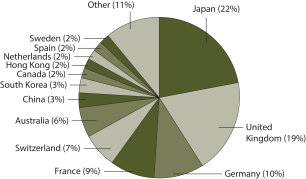 |
The most significant changes in sector exposures during the period were increases in the Fund’s weight in industrials and health care stocks and decreases in financials and energy stocks. In the health care sector, we initiated positions in pharmaceutical companies AstraZeneca plc and Bayer AG and added to holdings of Sanofi S.A. and Toho Holdings Company, Limited. Within industrials, we initiated or added to several stocks, including aerospace and defense company BAE Systems plc and airlines EasyJet plc and Qantas Airways Limited. We also added to or initiated positions in several Japanese industrials, including Sojitz Corporation; Central Glass Company, Limited; Fujikura Limited; and Nisshinbo Holdings Incorporated. Although the reduction in the Fund’s allocation to energy and financials was partially a result of the sectors’ poor performance, we also reduced the Fund’s exposure to the energy sector by selling ENI S.p.A. and trimming positions in China Petroleum & Chemical Corporation and JX Holdings, Incorporated. Within financials, Amlin plc left the portfolio after a takeover, while we trimmed the Fund’s holdings of Standard Chartered plc and Hannover Ruck SE.
The Fund is underweight the financials, energy, and utilities sectors relative to the value benchmark and overweight the industrials, consumer discretionary, and consumer staples sectors. At the end of the reporting period, the Fund’s emerging markets exposure stood at 11.5% of the portfolio.
We believe that the Fund remains attractive based on valuation.
The Fund remains attractively positioned from a valuation standpoint. As of the end of the reporting period, the stocks within the Fund were trading at an average price of approximately 11 times forecasted earnings per share and 6 times cash flow per share compared with 13 times forward earnings per share and 9 times cash flow per share for the MSCI EAFE Value Index (Net). We believe that the emerging markets portion of the portfolio was trading at particularly attractive valuations of less than 10 times forecasted earnings per share and 6 times cash flow per share. We continue to concentrate on finding attractively valued companies that are generating strong cash flows and earnings and that we believe could produce strong performance going forward.
Please see footnotes on page 21.
| | | | |
| 24 | | Wells Fargo Equity Gateway Funds | | Performance highlights (unaudited) |
Wells Fargo Small Company Growth Fund1
Investment objective
The Fund seeks long-term capital appreciation.
Manager
Wells Fargo Funds Management, LLC
Subadviser for the affiliated master portfolio
Peregrine Capital Management, Inc.
Portfolio managers
William A. Grierson, CFA®
Daniel J. Hagen, CFA®
James P. Ross, CFA®
Paul E. von Kuster, CFA®
Average annual total returns (%) as of May 31, 20162
| | | | | | | | | | | | | | | | | | | | | | | | | | | | | | | | | | |
| | | | | Including sales charge | | | Excluding sales charge | | | Expense ratios3 (%) | |
| | | Inception date | | 1 year | | | 5 year | | | 10 year | | | 1 year | | | 5 year | | | 10 year | | | Gross | | | Net4 | |
| Class A (WFSAX) | | 1-30-2004 | | | (19.14 | ) | | | 6.20 | | | | 6.05 | | | | (14.20 | ) | | | 7.47 | | | | 6.68 | | | | 1.36 | | | | 1.35 | |
| Class B (WFSBX)* | | 1-30-2004 | | | (19.83 | ) | | | 6.36 | | | | 6.11 | | | | (14.83 | ) | | | 6.67 | | | | 6.11 | | | | 2.11 | | | | 2.10 | |
| Class C (WSMCX) | | 1-30-2004 | | | (15.84 | ) | | | 6.67 | | | | 5.89 | | | | (14.84 | ) | | | 6.67 | | | | 5.89 | | | | 2.11 | | | | 2.10 | |
| Class R6 (WSCRX) | | 10-31-2014 | | | – | | | | – | | | | – | | | | (13.83 | ) | | | 7.97 | | | | 7.14 | | | | 0.93 | | | | 0.90 | |
| Administrator Class (NVSCX) | | 11-11-1994 | | | – | | | | – | | | | – | | | | (14.04 | ) | | | 7.70 | | | | 6.93 | | | | 1.28 | | | | 1.20 | |
| Institutional Class (WSCGX) | | 3-31-2008 | | | – | | | | – | | | | – | | | | (13.85 | ) | | | 7.96 | | | | 7.14 | | | | 1.03 | | | | 0.95 | |
| Russell 2000® Growth Index5 | | – | | | – | | | | – | | | | – | | | | (9.13 | ) | | | 8.15 | | | | 7.20 | | | | – | | | | – | |
| * | | Class B shares are closed to investment, except in connection with the reinvestment of any distributions and permitted exchanges. |
Figures quoted represent past performance, which is no guarantee of future results, and do not reflect taxes that a shareholder may pay on fund distributions or the redemption of fund shares. Investment return and principal value of an investment will fluctuate so that an investor’s shares, when redeemed, may be worth more or less than their original cost. Performance shown without sales charges would be lower if sales charges were reflected. Current performance may be lower or higher than the performance data quoted, which assumes the reinvestment of dividends and capital gains. Current month-end performance is available on the Fund’s website, wellsfargofunds.com.
Index returns do not include transaction costs associated with buying and selling securities, any mutual fund fees or expenses, or any taxes. It is not possible to invest directly in an index.
For Class A shares, the maximum front-end sales charge is 5.75%. For Class B shares, the maximum contingent deferred sales charge is 5.00%. For Class C shares, the maximum contingent deferred sales charge is 1.00%. Performance including a contingent deferred sales charge assumes the sales charge for the corresponding time period. Class R6, Administrator Class and Institutional Class shares are sold without a front-end sales charge or contingent deferred sales charge.
Stock values fluctuate in response to the activities of individual companies and general market and economic conditions. Smaller-company stocks tend to be more volatile and less liquid than those of larger companies. Certain investment strategies tend to increase the total risk of an investment (relative to the broader market). The Fund is exposed to foreign investment risk. Consult the Fund’s prospectus for additional information on these and other risks.
Please see footnotes on page 25.
| | | | | | |
| Performance highlights (unaudited) | | Wells Fargo Equity Gateway Funds | | | 25 | |
Wells Fargo Small Company Growth Fund (continued)
|
| Growth of $10,000 investment as of May 31, 20166 |
|
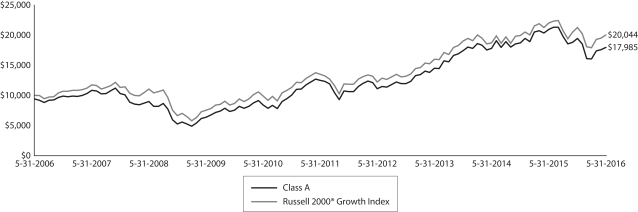 |
| 1 | The Fund is a gateway feeder fund that invests all of its assets in a single affiliated master portfolio of the Wells Fargo Master Trust with a substantially similar investment objective and substantially similar investment strategies. References to the investment activities of the Fund are intended to refer to the investment activities of the affiliated master portfolio in which it invests. |
| 2 | Historical performance shown for Class R6 shares prior to their inception reflects the performance of Institutional Class shares, and includes the higher expenses applicable to Institutional Class shares. If these expenses had not been included, returns would be higher. Historical performance shown for Institutional Class shares prior to their inception reflects the performance of Administrator Class shares, and includes the higher expenses applicable to Administrator Class shares. If these expenses had not been included, returns would be higher. |
| 3 | Reflects the expense ratios as stated in the most recent prospectuses. The expense ratios shown are subject to change and may differ from the annualized expense ratios shown in the financial highlights of this report. |
| 4 | The manager has contractually committed through September 30, 2016, to waive fees and/or reimburse expenses to the extent necessary to cap the Fund’s Total Annual Fund Operating Expenses After Fee Waiver at the amounts shown. After this time, the cap may be increased or the commitment to maintain the cap may be terminated only with the approval of the Board of Trustees. Brokerage commissions, stamp duty fees, interest, taxes, acquired fund fees and expenses, and extraordinary expenses are excluded from the expense cap. Net expenses from the affiliated master portfolio are included in the expense cap. Without this cap, the Fund’s returns would have been lower. |
| 5 | The Russell 2000® Growth Index measures the performance shown of those Russell 2000 companies with higher price-to-book ratios and higher forecasted growth values. You cannot invest directly in an index. |
| 6 | The chart compares the performance of Class A shares for the most recent ten years with the Russell 2000® Growth Index. The chart assumes a hypothetical $10,000 investment in Class A shares and reflects all operating expenses and assumes the maximum initial sales charge of 5.75%. |
| 7 | The ten largest holdings, excluding cash and cash equivalents, are calculated based on the value of the securities of the affiliated master portfolio allocable to the Fund divided by the total net assets of the Fund. Holdings are subject to change and may have changed since the date specified. |
| 8 | Amounts represent the sector distribution of the affiliated master portfolio which are calculated based on the total long-term investments of the affiliated master portfolio. These amounts are subject to change and may have changed since the date specified. |
| * | This security was not held in the Fund at the end of the reporting period |
| | | | |
| 26 | | Wells Fargo Equity Gateway Funds | | Performance highlights (unaudited) |
Wells Fargo Small Company Growth Fund (continued)
MANAGER’S DISCUSSION
Fund highlights
| n | | The Fund underperformed the Russell 2000® Growth Index5 for the 12-month period that ended May 31, 2016. |
| n | | Select holdings within the consumer discretionary, financials, and materials sectors detracted from Fund performance. |
| n | | The Fund’s holdings within the energy sector contributed to relative performance. |
A number of broad concerns, including sluggish economic growth in both the U.S. and China, led to bouts of heightened investor risk aversion from August 2015 through the end of the reporting period. Worries about slowing growth combined with overproduction led to sharply falling oil prices for much of the period, from more than $60 per barrel in May 2015 to a low of $26 per barrel in February 2016. As the period progressed, market results worldwide shifted to higher degrees of correlation with the movement of oil prices, triggering continued market declines, especially in small-cap stocks. Other unique risk factors during the period included uncertainties over the timing and magnitude of expected interest-rate increases by the U.S. Federal Reserve (Fed) and the outcome of the 2016 U.S. presidential election.
The combined impact of these concerns contributed to an environment in which investors’ behavior often became driven more by risk aversion than by companies’ underlying fundamentals. As a result, the reporting period was marked by relatively brief, but painful, instances of significant dislocation between the strength of companies’ fundamentals in comparison with their respective stock prices.
| | | | |
| Ten largest holdings (%) as of May 31, 20167 | |
SS&C Technologies Holdings Incorporated | | | 1.79 | |
ICON plc ADR | | | 1.50 | |
Copart Incorporated | | | 1.37 | |
IMAX Corporation | | | 1.33 | |
Evercore Partners Incorporated Class A | | | 1.30 | |
Hub Group Incorporated Class A | | | 1.29 | |
Teradyne Incorporated | | | 1.28 | |
Qlik Technologies Incorporated | | | 1.26 | |
Cadence Design Systems Incorporated | | | 1.26 | |
Marketo Incorporated | | | 1.25 | |
Stock selection within the consumer discretionary, financials, and materials sectors detracted from Fund performance.
Within the consumer discretionary sector, fears over a weak holiday season (which ultimately did not manifest) coupled with a strong downward-trending stock market in the third quarter of 2015 and in early 2016 drove a high degree of stock-price dislocation relative to companies’ underlying fundamentals. As small-cap stocks began to recover from significant declines in early 2016, these issues were partly remedied. However, some dislocation remained; for example, Party City Holdco Incorporated’s stock price declined materially over the reporting period to a valuation well below that of the broad market
despite the company’s report of nearly double-digit growth in earnings per share in 2015. The period’s weaker-than-usual capital-markets environment contributed to disappointing fundamentals for certain Fund holdings within the financials sector, including LPL Financial Holdings Incorporated,* a full-service online brokerage. The Fed’s indications of a more moderate approach to interest-rate increases also negatively affected a number of financials holdings. Within the materials sector, stock selection detracted from returns. Flotek Industries, Incorporated,* a provider of oil-field chemicals and services, declined following disclosure of technological and data issues affecting some of the company’s services.
Stock selection within the energy sector contributed to relative returns.
Select Fund holdings within the energy sector delivered strong results, driving outperformance relative to the benchmark’s energy sector for the reporting period. We tend to emphasize energy-related companies with leading asset positions, fundamental strength to weather a variety of oil-price environments, and favorable cost structures. The Fund’s key contributors in this sector included Diamondback Energy, Incorporated, and QEP Resources, Incorporated.
Please see footnotes on page 25.
| | | | | | |
| Performance highlights (unaudited) | | Wells Fargo Equity Gateway Funds | | | 27 | |
Wells Fargo Small Company Growth Fund (continued)
|
| Sector distribution as of May 31, 20168 |
|
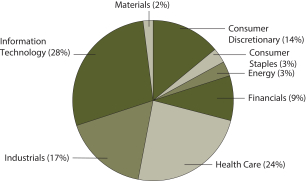 |
We remain focused on consistent implementation of our disciplined process.
Our team has employed the same bottom-up style for more than 30 years. We believe the combination of our disciplined investment process and experienced team has been the key to the success of this investment style over time. Looking ahead, we remain focused on identifying attractive growth companies with potentially underappreciated opportunities relative to their valuations. We are of the opinion these stocks ultimately may be rewarded by the marketplace, which could lead to outperformance and may add value to the Fund.
Please see footnotes on page 25.
| | | | |
| 28 | | Wells Fargo Equity Gateway Funds | | Performance highlights (unaudited) |
Wells Fargo Small Company Value Fund1
Investment objective
The Fund seeks long-term capital appreciation.
Manager
Wells Fargo Funds Management, LLC
Subadviser for the affiliated master portfolio
Peregrine Capital Management, Inc.
Portfolio managers
Jason R. Ballsrud, CFA®
Tasso H. Coin, Jr., CFA®
Douglas G. Pugh, CFA®
Average annual total returns (%) as of May 31, 20162
| | | | | | | | | | | | | | | | | | | | | | | | | | | | | | | | | | | | |
| | | | | Including sales charge | | | Excluding sales charge | | | | | Expense ratios3 (%) | |
| | | Inception date | | 1 year | | | 5 year | | | 10 year | | | 1 year | | | 5 year | | | 10 year | | | | | Gross | | | Net4 | |
| Class A (SCVAX) | | 1-31-2002 | | | (10.91 | ) | | | 6.04 | | | | 4.12 | | | | (5.48 | ) | | | 7.30 | | | | 4.74 | | | | | | 1.45 | | | | 1.35 | |
| Class C (SCVFX) | | 8-30-2002 | | | (7.20 | ) | | | 6.49 | | | | 3.97 | | | | (6.20 | ) | | | 6.49 | | | | 3.97 | | | | | | 2.20 | | | | 2.10 | |
| Administrator Class (SCVIX) | | 1-31-2002 | | | – | | | | – | | | | – | | | | (5.36 | ) | | | 7.52 | | | | 5.00 | | | | | | 1.37 | | | | 1.20 | |
| Institutional Class (SCVNX) | | 7-30-2010 | | | – | | | | – | | | | – | | | | (5.13 | ) | | | 7.73 | | | | 5.13 | | | | | | 1.12 | | | | 1.00 | |
| Russell 2000® Value Index5 | | – | | | – | | | | – | | | | – | | | | (2.75 | ) | | | 7.55 | | | | 5.25 | | | | | | – | | | | – | |
Figures quoted represent past performance, which is no guarantee of future results, and do not reflect taxes that a shareholder may pay on fund distributions or the redemption of fund shares. Investment return and principal value of an investment will fluctuate so that an investor’s shares, when redeemed, may be worth more or less than their original cost. Performance shown without sales charges would be lower if sales charges were reflected. Current performance may be lower or higher than the performance data quoted, which assumes the reinvestment of dividends and capital gains. Current month-end performance is available on the Fund’s website, wellsfargofunds.com.
Index returns do not include transaction costs associated with buying and selling securities, any mutual fund fees or expenses, or any taxes. It is not possible to invest directly in an index.
For Class A shares, the maximum front-end sales charge is 5.75%. For Class C shares, the maximum contingent deferred sales charge is 1.00%. Performance including a contingent deferred sales charge assumes the sales charge for the corresponding time period. Administrator Class and Institutional Class shares are sold without a front-end sales charge or contingent deferred sales charge.
Stock values fluctuate in response to the activities of individual companies and general market and economic conditions. Smaller-company stocks tend to be more volatile and less liquid than those of larger companies. Certain investment strategies tend to increase the total risk of an investment (relative to the broader market). The Fund is exposed to foreign investment risk. Consult the Fund’s prospectus for additional information on these and other risks.
Please see footnotes on page 29.
| | | | | | |
| Performance highlights (unaudited) | | Wells Fargo Equity Gateway Funds | | | 29 | |
Wells Fargo Small Company Value Fund (continued)
|
| Growth of $10,000 investment as of May 31, 20166 |
|
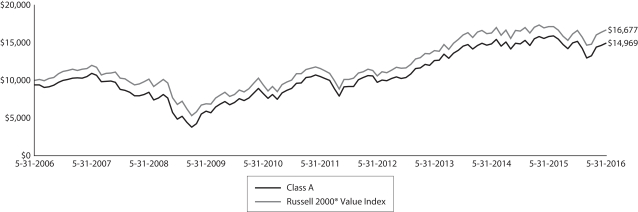
|
| 1 | The Fund is a gateway feeder fund that invests all of its assets in a single affiliated master portfolio of the Wells Fargo Master Trust with a substantially similar investment objective and substantially similar investment strategies. References to the investment activities of the Fund are intended to refer to the investment activities of the affiliated master portfolio in which it invests. |
| 2 | Historical performance shown for Institutional Class shares prior to their inception reflects the performance of Administrator Class shares and includes the higher expenses applicable to Administrator Class shares. If these expenses had not been included, returns would be higher. |
| 3 | Reflects the expense ratios as stated in the most recent prospectuses. The expense ratios shown are subject to change and may differ from the annualized expense ratios shown in the financial highlights of this report. |
| 4 | The manager has contractually committed through September 30, 2016, to waive fees and/or reimburse expenses to the extent necessary to cap the Fund’s Total Annual Fund Operating Expenses After Fee Waiver at the amounts shown. After this time, the cap may be increased or the commitment to maintain the cap may be terminated only with the approval of the Board of Trustees. Brokerage commissions, stamp duty fees, interest, taxes, acquired fund fees and expenses, and extraordinary expenses are excluded from the expense cap. Net expenses from the affiliated master portfolio are included in the expense cap. Without this cap, the Fund’s returns would have been lower. |
| 5 | The Russell 2000® Value Index measures the performance of those Russell 2000 companies with lower price-to-book ratios and lower forecasted growth values. You cannot invest directly in an index. |
| 6 | The chart compares the performance of Class A shares for the most recent ten years with the Russell 2000® Value Index. The chart assumes a hypothetical $10,000 investment in Class A shares and reflects all operating expenses and assumes the maximum initial sales charge of 5.75%. |
| 7 | The Russell 1000® Growth Index measures the performance of those Russell 1000 companies with higher price/book ratios and higher forecasted growth values. You cannot invest directly in an index. |
| 8 | The ten largest holdings, excluding cash and cash equivalents, are calculated based on the value of the securities of the affiliated master portfolio allocable to the Fund divided by the total net assets of the Fund. Holdings are subject to change and may have changed since the date specified. |
| 9 | Amounts represent the sector distribution of the affiliated master portfolio which are calculated based on the total long-term investments of the affiliated master portfolio. These amounts are subject to change and may have changed since the date specified. |
| | | | |
| 30 | | Wells Fargo Equity Gateway Funds | | Performance highlights (unaudited) |
Wells Fargo Small Company Value Fund (continued)
MANAGER’S DISCUSSION
Fund highlights
| n | | The Fund underperformed its benchmark, the Russell 2000® Value Index,5 for the 12-month period that ended May 31, 2016. |
| n | | The Fund’s relative performance trailed the benchmark in the economically sensitive consumer discretionary and information technology (IT) sectors. |
| n | | Outperformance driven by strong stock selection relative to the index was most significant in the energy and health care sectors. |
Markets were volatile for the one-year period that ended May 31, 2016. Strong market performance in early 2015 gave way to a bear market that emerged during mid-2015 as investors grew concerned about slowing economic growth and recessionary pressures. Stock prices generally declined through mid-February 2016 before a rebound occurred during the last several weeks of the period. In this unsettled environment, investors tended to sell small-cap stocks and buy large-cap growth stocks. Large-cap growth stocks delivered a positive return during the period as measured by the Russell 1000® Growth Index,7 a common measure of large-cap growth stock performance. As market losses and stock sales increased, the Fund experienced relatively higher losses because less-liquid smaller-cap and economically sensitive stocks came under greater pressure. Once stock prices stabilized and began to recover in late-February 2016, the Fund once again started to gather outperformance over the benchmark. In our view, the shake-up in the markets was unwarranted and the rapid recovery that ensued in the late first quarter of 2016 was understandable.
Despite a volatile market, areas of strength benefited the Fund.
Fund performance was pressured most substantially in the consumer discretionary and IT sectors. Retail stocks within the consumer discretionary sector saw dramatic price declines as earnings were pressured when consumer confidence waned during the second half of 2015. We elected to sell certain of these holdings in favor of higher-quality retailers that have exhibited strong recovery patterns in the past and therefore offered a better risk/return opportunity for the portfolio. The Fund’s IT positions in aggregate lagged as investors tended to sell value stocks within the sector in favor of larger or more growth-oriented IT stocks. In particular, less than a handful of large-cap growth stocks—given the moniker the FANG stocks, for Facebook, Amazon, Netflix, and Google—dramatically outperformed the market and appeared immune at times to macroeconomic fears.
The Fund’s energy sector positions, though negative in absolute terms for the period, outperformed the energy stocks in the benchmark, which were hard hit by the collapse in energy prices. In our analysis, our energy positions were of higher quality with many holding hedges that allowed them to sidestep much of the maelstrom brought on by the precipitous fall in oil prices. The portfolio’s health care positions were also a bright spot, delivering a positive return for the year and outperforming the health care stocks in the benchmark.
| | | | |
| Ten largest holdings (%) as of May 31, 20168 | |
Great Western Bancorp Incorporated | | | 1.58 | |
Western Alliance Bancorp | | | 1.56 | |
Primerica Incorporated | | | 1.50 | |
Avista Corporation | | | 1.48 | |
Talmer Bancorp Incorporated Class A | | | 1.43 | |
Equity Commonwealth | | | 1.41 | |
Scholastic Corporation | | | 1.40 | |
PrivateBancorp Incorporated | | | 1.38 | |
Lions Gate Entertainment Corporation | | | 1.32 | |
Generac Holdings Incorporated | | | 1.29 | |
|
| Sector distribution as of May 31, 20169 |
|
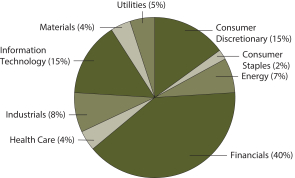 |
Please see footnotes on page 29.
| | | | | | |
| Performance highlights (unaudited) | | Wells Fargo Equity Gateway Funds | | | 31 | |
Wells Fargo Small Company Value Fund (continued)
Portfolio turnover was driven by sales of stocks we viewed as fully valued as well as our desire to add new investments to the portfolio.
Changes to the Fund’s holdings over the period were consistent with our strict value-oriented investment process. Following our sell discipline, we sold stocks that reached our estimates of fair value relative to their peer groups. During the one-year period, we added 63 new positions from a mix of different sectors. The number of Fund holdings continued to range between 90 and 110 at any given time during the period, with all holdings possessing strong value characteristics based on our analysis.
While small-cap value stocks have lagged the overall market for several quarters, we remain confident in our deep-value investment philosophy and believe the Fund is well positioned to potentially benefit from a long overdue market rotation. The key to this rotation would be a solidified and accelerating economic recovery. Key catalysts such as a recovery in housing and new household formation among members of the Millennial generation may be the opening acts to higher sustainable economic output, which could support small-cap value stock performance.
In our view, because the market has been slow to recognize the strength of the improving underlying operating performance of small-cap companies, their stocks are priced at favorable levels that offer an optimal entry point for investors. In this environment, we are finding opportunities to buy attractive stocks at valuations that have not been seen for several years now. Our disciplined bottom-up process is focused on identifying the best values in each sector and helping us capture consistent outperformance versus the benchmark. Although this year is off to a volatile start, we believe the portfolio is positioned to outperform in the coming year as investors seeking to diversify returns recognize the fundamental opportunity and attractive valuations of the portfolio’s holdings.
Please see footnotes on page 29.
| | | | |
| 32 | | Wells Fargo Equity Gateway Funds | | Fund expenses (unaudited) |
As a shareholder of the Fund, you incur two types of costs: (1) transaction costs, including sales charges (loads) on purchase payments and contingent deferred sales charges (if any) on redemptions and (2) ongoing costs, including management fees, distribution (12b-1) and/or shareholder servicing fees, and other Fund expenses. This example is intended to help you understand your ongoing costs (in dollars) of investing in the Fund and to compare these costs with the ongoing costs of investing in other mutual funds.
The example is based on an investment of $1,000 invested at the beginning of the six-month period and held for the entire period from December 1, 2015 to May 31, 2016.
Actual expenses
The “Actual” line of the table below provides information about actual account values and actual expenses. You may use the information in this line, together with the amount you invested, to estimate the expenses that you paid over the period. Simply divide your account value by $1,000 (for example, an $8,600 account value divided by $1,000 = 8.6), then multiply the result by the number in the “Actual” line under the heading entitled “Expenses paid during period” for your applicable class of shares to estimate the expenses you paid on your account during this period.
Hypothetical example for comparison purposes
The “Hypothetical” line of the table below provides information about hypothetical account values and hypothetical expenses based on the Fund’s actual expense ratio and an assumed rate of return of 5% per year before expenses, which is not the Fund’s actual return. The hypothetical account values and expenses may not be used to estimate the actual ending account balance or expenses you paid for the period. You may use this information to compare the ongoing costs of investing in the Fund and other funds. To do so, compare this 5% hypothetical example with the 5% hypothetical examples that appear in the shareholder reports of the other funds.
Please note that the expenses shown in the table are meant to highlight your ongoing costs only and do not reflect any transactional costs, such as sales charges (loads) and contingent deferred sales charges. Therefore, the “Hypothetical” line of the table is useful in comparing ongoing costs only and will not help you determine the relative total costs of owning different funds. In addition, if these transactional costs were included, your costs would have been higher.
| | | | | | | | | | | | | | | | |
| Wells Fargo C&B Large Cap Value Fund | | Beginning account value 12-1-2015 | | | Ending account value 5-31-2016 | | | Expenses paid during the period1 | | | Net annualized expense ratio | |
Class A | | | | | | | | | | | | | | | | |
Actual | | $ | 1,000.00 | | | $ | 1,022.63 | | | $ | 5.82 | | | | 1.15 | % |
Hypothetical (5% return before expenses) | | $ | 1,000.00 | | | $ | 1,019.25 | | | $ | 5.81 | | | | 1.15 | % |
Class B | | | | | | | | | | | | | | | | |
Actual | | $ | 1,000.00 | | | $ | 1,018.87 | | | $ | 9.59 | | | | 1.90 | % |
Hypothetical (5% return before expenses) | | $ | 1,000.00 | | | $ | 1,015.50 | | | $ | 9.57 | | | | 1.90 | % |
Class C | | | | | | | | | | | | | | | | |
Actual | | $ | 1,000.00 | | | $ | 1,019.19 | | | $ | 9.59 | | | | 1.90 | % |
Hypothetical (5% return before expenses) | | $ | 1,000.00 | | | $ | 1,015.50 | | | $ | 9.57 | | | | 1.90 | % |
Administrator Class | | | | | | | | | | | | | | | | |
Actual | | $ | 1,000.00 | | | $ | 1,023.81 | | | $ | 5.06 | | | | 1.00 | % |
Hypothetical (5% return before expenses) | | $ | 1,000.00 | | | $ | 1,020.00 | | | $ | 5.05 | | | | 1.00 | % |
Institutional Class | | | | | | | | | | | | | | | | |
Actual | | $ | 1,000.00 | | | $ | 1,024.41 | | | $ | 4.05 | | | | 0.80 | % |
Hypothetical (5% return before expenses) | | $ | 1,000.00 | | | $ | 1,021.00 | | | $ | 4.04 | | | | 0.80 | % |
Please see footnote on page 34.
| | | | | | |
| Fund expenses (unaudited) | | Wells Fargo Equity Gateway Funds | | | 33 | |
| | | | | | | | | | | | | | | | |
| Wells Fargo Diversified Equity Fund | | Beginning account value 12-1-2015 | | | Ending account value 5-31-2016 | | | Expenses paid during the period1 | | | Net annualized expense ratio | |
Class A | | | | | | | | | | | | | | | | |
Actual | | $ | 1,000.00 | | | $ | 984.08 | | | $ | 6.20 | | | | 1.25 | % |
Hypothetical (5% return before expenses) | | $ | 1,000.00 | | | $ | 1,018.75 | | | $ | 6.31 | | | | 1.25 | % |
Class B | | | | | | | | | | | | | | | | |
Actual | | $ | 1,000.00 | | | $ | 984.00 | | | $ | 9.77 | | | | 1.97 | % |
Hypothetical (5% return before expenses) | | $ | 1,000.00 | | | $ | 1,015.15 | | | $ | 9.92 | | | | 1.97 | % |
Class C | | | | | | | | | | | | | | | | |
Actual | | $ | 1,000.00 | | | $ | 980.19 | | | $ | 9.90 | | | | 2.00 | % |
Hypothetical (5% return before expenses) | | $ | 1,000.00 | | | $ | 1,015.00 | | | $ | 10.08 | | | | 2.00 | % |
Administrator Class | | | | | | | | | | | | | | | | |
Actual | | $ | 1,000.00 | | | $ | 985.41 | | | $ | 4.96 | | | | 1.00 | % |
Hypothetical (5% return before expenses) | | $ | 1,000.00 | | | $ | 1,020.00 | | | $ | 5.05 | | | | 1.00 | % |
| Wells Fargo Emerging Growth Fund | | | | | | | | | | | | |
Class A | | | | | | | | | | | | | | | | |
Actual | | $ | 1,000.00 | | | $ | 924.16 | | | $ | 6.49 | | | | 1.35 | % |
Hypothetical (5% return before expenses) | | $ | 1,000.00 | | | $ | 1,018.26 | | | $ | 6.80 | | | | 1.35 | % |
Class C | | | | | | | | | | | | | | | | |
Actual | | $ | 1,000.00 | | | $ | 919.85 | | | $ | 10.07 | | | | 2.10 | % |
Hypothetical (5% return before expenses) | | $ | 1,000.00 | | | $ | 1,014.51 | | | $ | 10.57 | | | | 2.10 | % |
Administrator Class | | | | | | | | | | | | | | | | |
Actual | | $ | 1,000.00 | | | $ | 924.32 | | | $ | 5.77 | | | | 1.20 | % |
Hypothetical (5% return before expenses) | | $ | 1,000.00 | | | $ | 1,019.00 | | | $ | 6.06 | | | | 1.20 | % |
Institutional Class | | | | | | | | | | | | | | | | |
Actual | | $ | 1,000.00 | | | $ | 925.61 | | | $ | 4.33 | | | | 0.90 | % |
Hypothetical (5% return before expenses) | | $ | 1,000.00 | | | $ | 1,020.50 | | | $ | 4.55 | | | | 0.90 | % |
| Wells Fargo Index Fund | | | | | | | | | | | | |
Class A | | | | | | | | | | | | | | | | |
Actual | | $ | 1,000.00 | | | $ | 1,017.20 | | | $ | 2.27 | | | | 0.45 | % |
Hypothetical (5% return before expenses) | | $ | 1,000.00 | | | $ | 1,022.75 | | | $ | 2.28 | | | | 0.45 | % |
Class B | | | | | | | | | | | | | | | | |
Actual | | $ | 1,000.00 | | | $ | 1,013.39 | | | $ | 6.04 | | | | 1.20 | % |
Hypothetical (5% return before expenses) | | $ | 1,000.00 | | | $ | 1,019.00 | | | $ | 6.06 | | | | 1.20 | % |
Class C | | | | | | | | | | | | | | | | |
Actual | | $ | 1,000.00 | | | $ | 1,013.34 | | | $ | 6.04 | | | | 1.20 | % |
Hypothetical (5% return before expenses) | | $ | 1,000.00 | | | $ | 1,019.00 | | | $ | 6.06 | | | | 1.20 | % |
Administrator Class | | | | | | | | | | | | | | | | |
Actual | | $ | 1,000.00 | | | $ | 1,018.18 | | | $ | 1.26 | | | | 0.25 | % |
Hypothetical (5% return before expenses) | | $ | 1,000.00 | | | $ | 1,023.75 | | | $ | 1.26 | | | | 0.25 | % |
Please see footnote on page 34.
| | | | |
| 34 | | Wells Fargo Equity Gateway Funds | | Fund expenses (unaudited) |
| | | | | | | | | | | | | | | | |
| Wells Fargo International Value Fund | | Beginning account value 12-1-2015 | | | Ending account value 5-31-2016 | | | Expenses paid during the period1 | | | Net annualized expense ratio | |
Class A | | | | | | | | | | | | | | | | |
Actual | | $ | 1,000.00 | | | $ | 969.61 | | | $ | 6.65 | | | | 1.35 | % |
Hypothetical (5% return before expenses) | | $ | 1,000.00 | | | $ | 1,018.25 | | | $ | 6.81 | | | | 1.35 | % |
Class C | | | | | | | | | | | | | | | | |
Actual | | $ | 1,000.00 | | | $ | 966.15 | | | $ | 10.32 | | | | 2.10 | % |
Hypothetical (5% return before expenses) | | $ | 1,000.00 | | | $ | 1,014.50 | | | $ | 10.58 | | | | 2.10 | % |
Administrator Class | | | | | | | | | | | | | | | | |
Actual | | $ | 1,000.00 | | | $ | 970.68 | | | $ | 6.16 | | | | 1.25 | % |
Hypothetical (5% return before expenses) | | $ | 1,000.00 | | | $ | 1,018.75 | | | $ | 6.31 | | | | 1.25 | % |
Institutional Class | | | | | | | | | | | | | | | | |
Actual | | $ | 1,000.00 | | | $ | 971.08 | | | $ | 4.93 | | | | 1.00 | % |
Hypothetical (5% return before expenses) | | $ | 1,000.00 | | | $ | 1,020.00 | | | $ | 5.05 | | | | 1.00 | % |
| Wells Fargo Small Company Growth Fund | | | | | | | | | | | | |
Class A | | | | | | | | | | | | | | | | |
Actual | | $ | 1,000.00 | | | $ | 924.19 | | | $ | 6.46 | | | | 1.34 | % |
Hypothetical (5% return before expenses) | | $ | 1,000.00 | | | $ | 1,018.29 | | | $ | 6.77 | | | | 1.34 | % |
Class B | | | | | | | | | | | | | | | | |
Actual | | $ | 1,000.00 | | | $ | 920.99 | | | $ | 9.97 | | | | 2.08 | % |
Hypothetical (5% return before expenses) | | $ | 1,000.00 | | | $ | 1,014.62 | | | $ | 10.46 | | | | 2.08 | % |
Class C | | | | | | | | | | | | | | | | |
Actual | | $ | 1,000.00 | | | $ | 920.91 | | | $ | 10.05 | | | | 2.09 | % |
Hypothetical (5% return before expenses) | | $ | 1,000.00 | | | $ | 1,014.53 | | | $ | 10.54 | | | | 2.09 | % |
Class R6 | | | | | | | | | | | | | | | | |
Actual | | $ | 1,000.00 | | | $ | 926.35 | | | $ | 4.33 | | | | 0.90 | % |
Hypothetical (5% return before expenses) | | $ | 1,000.00 | | | $ | 1,020.50 | | | $ | 4.55 | | | | 0.90 | % |
Administrator Class | | | | | | | | | | | | | | | | |
Actual | | $ | 1,000.00 | | | $ | 925.09 | | | $ | 5.78 | | | | 1.20 | % |
Hypothetical (5% return before expenses) | | $ | 1,000.00 | | | $ | 1,019.00 | | | $ | 6.06 | | | | 1.20 | % |
Institutional Class | | | | | | | | | | | | | | | | |
Actual | | $ | 1,000.00 | | | $ | 926.10 | | | $ | 4.57 | | | | 0.95 | % |
Hypothetical (5% return before expenses) | | $ | 1,000.00 | | | $ | 1,020.25 | | | $ | 4.80 | | | | 0.95 | % |
| Wells Fargo Small Company Value Fund | | | | | | | | | | | | |
Class A | | | | | | | | | | | | | | | | |
Actual | | $ | 1,000.00 | | | $ | 984.78 | | | $ | 6.70 | | | | 1.35 | % |
Hypothetical (5% return before expenses) | | $ | 1,000.00 | | | $ | 1,018.25 | | | $ | 6.81 | | | | 1.35 | % |
Class C | | | | | | | | | | | | | | | | |
Actual | | $ | 1,000.00 | | | $ | 981.07 | | | $ | 10.40 | | | | 2.10 | % |
Hypothetical (5% return before expenses) | | $ | 1,000.00 | | | $ | 1,014.50 | | | $ | 10.58 | | | | 2.10 | % |
Administrator Class | | | | | | | | | | | | | | | | |
Actual | | $ | 1,000.00 | | | $ | 985.55 | | | $ | 5.96 | | | | 1.20 | % |
Hypothetical (5% return before expenses) | | $ | 1,000.00 | | | $ | 1,019.00 | | | $ | 6.06 | | | | 1.20 | % |
Institutional Class | | | | | | | | | | | | | | | | |
Actual | | $ | 1,000.00 | | | $ | 986.83 | | | $ | 4.97 | | | | 1.00 | % |
Hypothetical (5% return before expenses) | | $ | 1,000.00 | | | $ | 1,020.00 | | | $ | 5.05 | | | | 1.00 | % |
| 1 | Expenses paid is equal to the annualized expense ratio of each class multiplied by the average account value over the period, multiplied by the number of days in the most recent fiscal half-year divided by the number of days in the fiscal year (to reflect the one-half-year period). |
| | | | | | |
| Portfolios of investments—May 31, 2016 | | Wells Fargo Equity Gateway Funds | | | 35 | |
C&B LARGE CAP VALUE FUND
| | | | | | | | | | | | | | | | |
| Security name | | | | | | | | | | | Value | |
| | | | |
Investment Companies: 100.00% | | | | | | | | | | | | | | | | |
| | | | |
| Affiliated Master Portfolios: 100.00% | | | | | | | | | | | | | | | | |
Wells Fargo C&B Large Cap Value Portfolio | | | | | | | | | | | | | | $ | 252,625,889 | |
| | | | | | | | | | | | | | | | |
| | | | |
Total Investment Companies (Cost $194,366,573) | | | | | | | | | | | | | | | 252,625,889 | |
| | | | | | | | | | | | | | | | |
| | | | | | | | |
| Total investments in securities (Cost $194,366,573) * | | | 100.00 | % | | | 252,625,889 | |
Other assets and liabilities, net | | | (0.00 | ) | | | (9,716 | ) |
| | | | | | | | |
| Total net assets | | | 100.00 | % | | $ | 252,616,173 | |
| | | | | | | | |
| | | | | | | | |
* | | Cost for federal income tax purposes is $201,424,793 and unrealized gains (losses) consists of: |
| | Gross unrealized gains | | $ | 51,201,096 | | | |
| | Gross unrealized losses | | | 0 | | | |
| | | | | | | | |
| | Net unrealized gains | | $ | 51,201,096 | | | |
DIVERSIFIED EQUITY FUND
| | | | | | | | | | | | | | | | |
| Security name | | | | | | | | | | | Value | |
| | | | |
Investment Companies: 100.06% | | | | | | | | | | | | | | | | |
| | | | |
| Affiliated Master Portfolios: 100.06% | | | | | | | | | | | | | | | | |
Wells Fargo C&B Large Cap Value Portfolio | | | | | | | | | | | | | | $ | 17,549,648 | |
Wells Fargo Diversified Large Cap Growth Portfolio | | | | | | | | | | | | | | | 53,011,559 | |
Wells Fargo Emerging Growth Portfolio | | | | | | | | | | | | | | | 5,349,574 | |
Wells Fargo Index Portfolio | | | | | | | | | | | | | | | 52,872,245 | |
Wells Fargo International Growth Portfolio | | | | | | | | | | | | | | | 15,634,453 | |
Wells Fargo International Value Portfolio | | | | | | | | | | | | | | | 15,806,203 | |
Wells Fargo Large Company Value Portfolio | | | | | | | | | | | | | | | 35,299,653 | |
Wells Fargo Small Company Growth Portfolio | | | | | | | | | | | | | | | 5,329,774 | |
Wells Fargo Small Company Value Portfolio | | | | | | | | | | | | | | | 10,680,165 | |
| | | | |
Total Investment Companies (Cost $165,981,249) | | | | | | | | | | | | | | | 211,533,274 | |
| | | | | | | | | | | | | | | | |
| | | | | | | | |
| Total investments in securities (Cost $165,981,249) * | | | 100.06 | % | | | 211,533,274 | |
Other assets and liabilities, net | | | (0.06 | ) | | | (125,719 | ) |
| | | | | | | | |
| Total net assets | | | 100.00 | % | | $ | 211,407,555 | |
| | | | | | | | |
| | | | | | | | |
* | | Cost for federal income tax purposes is $173,861,221 and unrealized gains (losses) consists of: |
| | Gross unrealized gains | | $ | 37,672,053 | | | |
| | Gross unrealized losses | | | 0 | | | |
| | | | | | | | |
| | Net unrealized gains | | $ | 37,672,053 | | | |
The accompanying notes are an integral part of these financial statements.
| | | | |
| 36 | | Wells Fargo Equity Gateway Funds | | Portfolios of investments—May 31, 2016 |
EMERGING GROWTH FUND
| | | | | | | | | | |
| Security name | | | | | | | | Value | |
| | | | |
Investment Companies: 100.06% | | | | | | | | | | |
| | | | |
| Affiliated Master Portfolios: 100.06% | | | | | | | | | | |
Wells Fargo Emerging Growth Portfolio | | | | | | | | $ | 815,110,887 | |
| | | | | | | | | | |
| | | | |
Total Investment Companies (Cost $653,109,010) | | | | | | | | | 815,110,887 | |
| | | | | | | | | | |
| | | | | | | | |
| Total investments in securities (Cost $653,109,010) * | | | 100.06 | % | | | 815,110,887 | |
Other assets and liabilities, net | | | (0.06 | ) | | | (507,260 | ) |
| | | | | | | | |
| Total net assets | | | 100.00 | % | | $ | 814,603,627 | |
| | | | | | | | |
| | | | | | | | |
* | | Cost for federal income tax purposes is $657,243,782 and unrealized gains (losses) consists of: |
| | Gross unrealized gains | | $ | 157,867,105 | | | |
| | Gross unrealized losses | | | 0 | | | |
| | | | | | | | |
| | Net unrealized gains | | $ | 157,867,105 | | | |
INDEX FUND
| | | | | | | | | | |
| Security name | | | | | | | | Value | |
| | | | |
Investment Companies: 100.09% | | | | | | | | | | |
| | | | |
| Affiliated Master Portfolios: 100.09% | | | | | | | | | | |
Wells Fargo Index Portfolio | | | | | | | | $ | 2,224,794,535 | |
| | | | | | | | | | |
| | | | |
Total Investment Companies (Cost $871,427,701) | | | | | | | | | 2,224,794,535 | |
| | | | | | | | | | |
| | | | | | | | |
| Total investments in securities (Cost $871,427,701) * | | | 100.09 | % | | | 2,224,794,535 | |
Other assets and liabilities, net | | | (0.09 | ) | | | (2,093,436 | ) |
| | | | | | | | |
| Total net assets | | | 100.00 | % | | $ | 2,222,701,099 | |
| | | | | | | | |
| | | | | | | | |
* | | Cost for federal income tax purposes is $917,294,054 and unrealized gains (losses) consists of: |
| | Gross unrealized gains | | $ | 1,307,500,481 | | | |
| | Gross unrealized losses | | | 0 | | | |
| | | | | | | | |
| | Net unrealized gains | | $ | 1,307,500,481 | | | |
The accompanying notes are an integral part of these financial statements.
| | | | | | |
| Portfolios of investments—May 31, 2016 | | Wells Fargo Equity Gateway Funds | | | 37 | |
INTERNATIONAL VALUE FUND
| | | | | | | | | | | | | | | | |
| Security name | | | | | | | | | | | Value | |
| | | | |
Investment Companies: 99.97% | | | | | | | | | | | | | | | | |
| | | | |
| Affiliated Master Portfolios: 99.97% | | | | | | | | | | | | | | | | |
Wells Fargo International Value Portfolio | | | | | | | | | | | | | | $ | 473,721,935 | |
| | | | | | | | | | | | | | | | |
| | | | |
Total Investment Companies (Cost $526,903,907) | | | | | | | | | | | | | | | 473,721,935 | |
| | | | | | | | | | | | | | | | |
| | | | | | | | |
| Total investments in securities (Cost $526,903,907) * | | | 99.97 | % | | | 473,721,935 | |
Other assets and liabilities, net | | | 0.03 | | | | 154,630 | |
| | | | | | | | |
| Total net assets | | | 100.00 | % | | $ | 473,876,565 | |
| | | | | | | | |
| | | | | | | | |
* | | Cost for federal income tax purposes is $527,840,357 and unrealized gains (losses) consists of: |
| | Gross unrealized gains | | $ | 0 | | | |
| | Gross unrealized losses | | | (54,118,422 | ) | | |
| | | | | | | | |
| | Net unrealized losses | | $ | (54,118,422 | ) | | |
SMALL COMPANY GROWTH FUND
| | | | | | | | | | | | | | | | |
| Security name | | | | | | | | | | | Value | |
| | | | |
Investment Companies: 99.15% | | | | | | | | | | | | | | | | |
| | | | |
| Affiliated Master Portfolios: 99.15% | | | | | | | | | | | | | | | | |
Wells Fargo Small Company Growth Portfolio | | | | | | | | | | | | | | $ | 1,183,630,838 | |
| | | | | | | | | | | | | | | | |
| | | | |
Total Investment Companies (Cost $1,149,153,992) | | | | | | | | | | | | | | | 1,183,630,838 | |
| | | | | | | | | | | | | | | | |
| | | | | | | | |
| Total investments in securities (Cost $1,149,153,992) * | | | 99.15 | % | | | 1,183,630,838 | |
Other assets and liabilities, net | | | 0.85 | | | | 10,200,001 | |
| | | | | | | | |
| Total net assets | | | 100.00 | % | | $ | 1,193,830,839 | |
| | | | | | | | |
| | | | | | | | |
* | | Cost for federal income tax purposes is $1,170,032,707 and unrealized gains (losses) consists of: |
| | Gross unrealized gains | | $ | 13,598,131 | | | |
| | Gross unrealized losses | | | 0 | | | |
| | | | | | | | |
| | Net unrealized gains | | $ | 13,598,131 | | | |
The accompanying notes are an integral part of these financial statements.
| | | | |
| 38 | | Wells Fargo Equity Gateway Funds | | Portfolios of investments—May 31, 2016 |
SMALL COMPANY VALUE FUND
| | | | | | | | | | |
| Security name | | | | | | | | Value | |
| | | | |
Investment Companies: 100.26% | | | | | | | | | | |
| | | | |
| Affiliated Master Portfolios: 100.26% | | | | | | | | | | |
Wells Fargo Small Company Value Portfolio | | | | | | | | $ | 121,259,745 | |
| | | | | | | | | | |
| | | | |
Total Investment Companies (Cost $111,820,445) | | | | | | | | | 121,259,745 | |
| | | | | | | | | | |
| | | | | | | | |
| Total investments in securities (Cost $111,820,445) * | | | 100.26 | % | | | 121,259,745 | |
Other assets and liabilities, net | | | (0.26 | ) | | | (313,869 | ) |
| | | | | | | | |
| Total net assets | | | 100.00 | % | | $ | 120,945,876 | |
| | | | | | | | |
| | | | | | | | |
* | | Cost for federal income tax purposes is $116,877,360 and unrealized gains (losses) consists of: |
| | Gross unrealized gains | | $ | 4,382,385 | | | |
| | Gross unrealized losses | | | 0 | | | |
| | | | | | | | |
| | Net unrealized gains | | $ | 4,382,385 | | | |
The accompanying notes are an integral part of these financial statements.
This page is intentionally left blank.
| | | | |
| 40 | | Wells Fargo Equity Gateway Funds | | Statements of assets and liabilities—May 31, 2016 |
| | | | | | | | |
| | | C&B Large Cap
Value Fund | | | Diversified
Equity Fund | |
| | |
Assets | | | | | | | | |
Investments in affiliated Master Portfolio(s), at value (see cost below) | | $ | 252,625,889 | | | $ | 211,533,274 | |
Cash | | | 469 | | | | 0 | |
Receivable for Fund shares sold | | | 103,507 | | | | 41,442 | |
Receivable from manager | | | 15,340 | | | | 0 | |
Prepaid expenses and other assets | | | 44,293 | | | | 16,892 | |
| | | | |
Total assets | | | 252,789,498 | | | | 211,591,608 | |
| | | | |
| | |
Liabilities | | | | | | | | |
Payable for Fund shares redeemed | | | 94,613 | | | | 84,909 | |
Management fee payable | | | 0 | | | | 2,916 | |
Distribution fees payable | | | 4,639 | | | | 1,845 | |
Administration fees payable | | | 33,942 | | | | 27,662 | |
Shareholder report expenses payable | | | 8,362 | | | | 21,776 | |
Shareholder servicing fees payable | | | 24,998 | | | | 44,125 | |
Accrued expenses and other liabilities | | | 6,771 | | | | 820 | |
| | | | |
Total liabilities | | | 173,325 | | | | 184,053 | |
| | | | |
Total net assets | | $ | 252,616,173 | | | $ | 211,407,555 | |
| | | | |
| | |
NET ASSETS CONSIST OF | | | | | | | | |
Paid-in capital | | $ | 199,696,226 | | | $ | 167,366,146 | |
Undistributed (accumulated) net investment income (loss) | | | 910,811 | | | | 473,513 | |
Accumulated net realized gains (losses) on investments | | | (6,250,180 | ) | | | (1,984,129 | ) |
Net unrealized gains (losses) on investments | | | 58,259,316 | | | | 45,552,025 | |
| | | | |
Total net assets | | $ | 252,616,173 | | | $ | 211,407,555 | |
| | | | |
| | |
COMPUTATION OF NET ASSET VALUE AND OFFERING PRICE PER SHARE | | | | | | | | |
Net assets – Class A | | $ | 88,387,101 | | | $ | 67,596,969 | |
Shares outstanding – Class A1 | | | 7,045,320 | | | | 2,475,796 | |
Net asset value per share – Class A | | | $12.55 | | | | $27.30 | |
Maximum offering price per share – Class A2 | | | $13.32 | | | | $28.97 | |
Net assets – Class B | | $ | 104,938 | | | $ | 711 | |
Shares outstanding – Class B1 | | | 8,260 | | | | 29 | |
Net asset value per share – Class B | | | $12.70 | | | | $24.49 | |
Net assets – Class C | | $ | 7,282,057 | | | $ | 2,846,425 | |
Shares outstanding – Class C1 | | | 583,270 | | | | 113,302 | |
Net asset value per share – Class C | | | $12.48 | | | | $25.12 | |
Net assets – Class R6 | | | N/A | | | | N/A | |
Shares outstanding – Class R61 | | | N/A | | | | N/A | |
Net asset value per share – Class R6 | | | N/A | | | | N/A | |
Net assets – Administrator Class | | $ | 23,209,917 | | | $ | 140,963,450 | |
Shares outstanding – Administrator Class1 | | | 1,850,268 | | | | 5,148,658 | |
Net asset value per share – Administrator Class | | | $12.54 | | | | $27.38 | |
Net assets – Institutional Class | | $ | 133,632,160 | | | | N/A | |
Shares outstanding – Institutional Class1 | | | 10,626,034 | | | | N/A | |
Net asset value per share – Institutional Class | | | $12.58 | | | | N/A | |
| | |
Investments in affiliated Master Portfolio(s), at cost | | $ | 194,366,573 | | | $ | 165,981,249 | |
| | | | |
| 1 | Each Fund has an unlimited number of authorized shares. |
| 2 | Maximum offering price is computed as 100/94.25 of net asset value. On investments of $50,000 or more, the offering price is reduced. |
The accompanying notes are an integral part of these financial statements.
| | | | | | |
| Statements of assets and liabilities—May 31, 2016 | | Wells Fargo Equity Gateway Funds | | | 41 | |
| | | | | | | | | | | | | | | | | | |
Emerging
Growth Fund | | | Index Fund | | | International
Value Fund | | | Small Company
Growth Fund | | | Small Company
Value Fund | |
| | | | |
| | | | | | | | | | | | | | | | | | |
| $ | 815,110,887 | | | $ | 2,224,794,535 | | | $ | 473,721,935 | | | $ | 1,183,630,838 | | | $ | 121,259,745 | |
| | 0 | | | | 36 | | | | 0 | | | | 0 | | | | 0 | |
| | 431,832 | | | | 1,984,182 | | | | 1,110,409 | | | | 13,837,370 | | | | 408,320 | |
| | 28,803 | | | | 189,576 | | | | 30,395 | | | | 3,720 | | | | 12,628 | |
| | 44,199 | | | | 51,895 | | | | 38,807 | | | | 152,854 | | | | 29,481 | |
| | |
| | 815,615,721 | | | | 2,227,020,224 | | | | 474,901,546 | | | | 1,197,624,782 | | | | 121,710,174 | |
| | |
| | | | |
| | | | | | | | | | | | | | | | | | |
| | 789,648 | | | | 3,604,351 | | | | 947,882 | | | | 3,573,885 | | | | 723,513 | |
| | 0 | | | | 0 | | | | 0 | | | | 0 | | | | 0 | |
| | 2,353 | | | | 50,811 | | | | 524 | | | | 16,686 | | | | 1,251 | |
| | 95,414 | | | | 289,690 | | | | 51,912 | | | | 121,174 | | | | 14,662 | |
| | 68,146 | | | | 46,921 | | | | 17,369 | | | | 10,655 | | | | 3,324 | |
| | 44,572 | | | | 276,184 | | | | 3,746 | | | | 58,400 | | | | 18,553 | |
| | 11,961 | | | | 51,168 | | | | 3,548 | | | | 13,143 | | | | 2,995 | |
| | |
| | 1,012,094 | | | | 4,319,125 | | | | 1,024,981 | | | | 3,793,943 | | | | 764,298 | |
| | |
| $ | 814,603,627 | | | $ | 2,222,701,099 | | | $ | 473,876,565 | | | $ | 1,193,830,839 | | | $ | 120,945,876 | |
| | |
| | | | |
| | | | | | | | | | | | | | | | | | |
| $ | 669,977,965 | | | $ | 812,899,809 | | | $ | 557,477,053 | | | $ | 1,268,354,177 | | | $ | 192,148,076 | |
| | (1,370,106 | ) | | | 16,373,457 | | | | 7,379,031 | | | | (511,635 | ) | | | 291,961 | |
| | (16,006,109 | ) | | | 40,060,999 | | | | (37,797,547 | ) | | | (108,488,549 | ) | | | (80,933,461 | ) |
| | 162,001,877 | | | | 1,353,366,834 | | | | (53,181,972 | ) | | | 34,476,846 | | | | 9,439,300 | |
| | |
| $ | 814,603,627 | | | $ | 2,222,701,099 | | | $ | 473,876,565 | | | $ | 1,193,830,839 | | | $ | 120,945,876 | |
| | |
| | | | |
| | | | | | | | | | | | | | | | | | |
| $ | 127,153,799 | | | $ | 639,496,219 | | | $ | 4,981,190 | | | $ | 128,674,626 | | | $ | 23,151,460 | |
| | 10,135,732 | | | | 10,175,460 | | | | 388,325 | | | | 3,414,142 | | | | 1,145,225 | |
| | $12.55 | | | | $62.85 | | | | $12.83 | | | | $37.69 | | | | $20.22 | |
| | $13.32 | | | | $66.68 | | | | $13.61 | | | | $39.99 | | | | $21.45 | |
| | N/A | | | $ | 1,071,212 | | | | N/A | | | $ | 17,062 | | | | N/A | |
| | N/A | | | | 16,658 | | | | N/A | | | | 508 | | | | N/A | |
| | N/A | | | | $64.31 | | | | N/A | | | | $33.59 | | | | N/A | |
| $ | 3,814,808 | | | $ | 79,857,866 | | | $ | 782,958 | | | $ | 26,945,662 | | | $ | 2,003,710 | |
| | 329,427 | | | | 1,265,221 | | | | 62,341 | | | | 792,080 | | | | 110,425 | |
| | $11.58 | | | | $63.12 | | | | $12.56 | | | | $34.02 | | | | $18.15 | |
| | N/A | | | | N/A | | | | N/A | | | $ | 229,390,606 | | | | N/A | |
| | N/A | | | | N/A | | | | N/A | | | | 5,767,613 | | | | N/A | |
| | N/A | | | | N/A | | | | N/A | | | | $39.77 | | | | N/A | |
| $ | 99,791,558 | | | $ | 1,502,275,802 | | | $ | 11,873,218 | | | $ | 130,103,796 | | | $ | 64,022,554 | |
| | 7,785,361 | | | | 23,721,522 | | | | 919,950 | | | | 3,332,123 | | | | 3,099,560 | |
| | $12.82 | | | | $63.33 | | | | $12.91 | | | | $39.05 | | | | $20.66 | |
| $ | 583,843,462 | | | | N/A | | | $ | 456,239,199 | | | $ | 678,699,087 | | | $ | 31,768,152 | |
| | 44,219,594 | | | | N/A | | | | 35,827,889 | | | | 17,076,168 | | | | 1,529,365 | |
| | $13.20 | | | | N/A | | | | $12.73 | | | | $39.75 | | | | $20.77 | |
| | | | |
| $ | 653,109,010 | | | $ | 871,427,701 | | | $ | 526,903,907 | | | $ | 1,149,153,992 | | | $ | 111,820,445 | |
| | |
The accompanying notes are an integral part of these financial statements.
| | | | |
| 42 | | Wells Fargo Equity Gateway Funds | | Statements of operations—year ended May 31, 2016 |
| | | | | | | | |
| | | C&B Large Cap
Value Fund | | | Diversified
Equity Fund | |
| | |
Investment income | | | | | | | | |
Dividends allocated from affiliated Master Portfolio(s)* | | $ | 5,396,471 | | | $ | 3,993,990 | |
Securities lending income allocated from affiliated Master Portfolio(s) | | | 17,748 | | | | 100,403 | |
Interest allocated from affiliated Master Portfolio(s) | | | 0 | | | | 39 | |
Affiliated income allocated from affiliated Master Portfolio(s) | | | 26,439 | | | | 34,523 | |
Expenses allocated from affiliated Master Portfolio(s) | | | (1,836,920 | ) | | | (1,381,070 | ) |
Waivers allocated from affiliated Master Portfolio(s) | | | 0 | | | | 77,072 | |
| | | | |
Total investment income (loss) | | | 3,603,738 | | | | 2,824,957 | |
| | | | |
| | |
Expenses | | | | | | | | |
Management fee | | | 135,336 | | | | 668,208 | |
Administration fees | | | | | | | | |
Class A | | | 130,295 | | | | 154,811 | |
Class B | | | 337 | | | | 61 | |
Class C | | | 15,369 | | | | 7,609 | |
Class R6 | | | N/A | | | | N/A | |
Administrator Class | | | 49,318 | | | | 187,009 | |
Institutional Class | | | 170,632 | | | | N/A | |
Investor Class | | | 87,078 | 1 | | | N/A | |
Shareholder servicing fees | |
Class A | | | 153,044 | | | | 180,323 | |
Class B | | | 387 | | | | 70 | |
Class C | | | 17,922 | | | | 8,854 | |
Administrator Class | | | 97,483 | | | | 367,380 | |
Investor Class | | | 68,029 | 1 | | | N/A | |
Distribution fees | |
Class B | | | 1,161 | | | | 211 | |
Class C | | | 53,766 | | | | 26,563 | |
Custody and accounting fees | | | 11,544 | | | | 9,875 | |
Professional fees | | | 32,925 | | | | 31,578 | |
Registration fees | | | 66,198 | | | | 45,783 | |
Shareholder report expenses | | | 27,282 | | | | 31,015 | |
Trustees’ fees and expenses | | | 12,257 | | | | 13,019 | |
Interest expense | | | 0 | | | | 0 | |
Other fees and expenses | | | 12,432 | | | | 9,376 | |
| | | | |
Total expenses | | | 1,142,795 | | | | 1,741,745 | |
Less: Fee waivers and/or expense reimbursements | | | (388,259 | ) | | | (602,364 | ) |
| | | | |
Net expenses | | | 754,536 | | | | 1,139,381 | |
| | | | |
Net investment income (loss) | | | 2,849,202 | | | | 1,685,576 | |
| | | | |
| | |
REALIZED AND UNREALIZED GAINS (LOSSES) ON INVESTMENTS | | | | | | | | |
Net realized gains (losses) on securities transaction allocated from affiliated Master Portfolio(s) | | | 11,830,809 | | | | 13,338,712 | |
Net change in unrealized gains (losses) on securities transactions allocated from affiliated Master Portfolio(s) | | | (16,093,129 | ) | | | (26,151,655 | ) |
| | | | |
Net realized and unrealized gains (losses) on investments | | | (4,262,320 | ) | | | (12,812,943 | ) |
| | | | |
Net increase (decrease) in net assets resulting from operations | | $ | (1,413,118 | ) | | $ | (11,127,367 | ) |
| | | | |
| | |
* Net of foreign dividend withholding taxes allocated from affiliated Master Portfolio(s) in the amount of | | | $33,927 | | | | $101,477 | |
| 1 | For the period from June 1, 2015 to October 23, 2015. Effective at the close of business on October 23, 2015, Investor Class shares were converted to Class A shares and are no longer offered by the Fund. |
| 2 | For the period from June 1, 2015 to December 8, 2015. Class B shares of the Fund were no longer offered to shareholders effective December 9, 2015. |
| 3 | For the period from June 1, 2015 to January 7, 2016. Class B shares of the Fund were no longer offered to shareholders effective January 8, 2016. |
The accompanying notes are an integral part of these financial statements.
| | | | | | |
| Statements of operations—year ended May 31, 2016 | | Wells Fargo Equity Gateway Funds | | | 43 | |
| | | | | | | | | | | | | | | | | | |
Emerging Growth Fund | | | Index Fund | | | International
Value Fund | | | Small Company
Growth Fund | | | Small Company
Value Fund | |
| | | | |
| | | | | | | | | | | | | | | | | | |
| $ | 924,377 | | | $ | 50,839,516 | | | $ | 15,006,915 | | | $ | 4,892,441 | | | $ | 1,586,314 | |
| | 2,642,118 | | | | 130,852 | | | | 674,021 | | | | 2,873,991 | | | | 56,768 | |
| | 0 | | | | 1,633 | | | | 0 | | | | 0 | | | | 0 | |
| | 40,616 | | | | 959,100 | | | | 10,774 | | | | 141,412 | | | | 9,510 | |
| | (7,255,174 | ) | | | (2,452,026 | ) | | | (4,193,055 | ) | | | (8,191,978 | ) | | | (954,898 | ) |
| | 0 | | | | 11,023 | | | | 0 | | | | 0 | | | | 0 | |
| | |
| | (3,648,063 | ) | | | 49,490,098 | | | | 11,498,655 | | | | (284,134 | ) | | | 697,694 | |
| | |
| | | | |
| | | | | | | | | | | | | | | | | | |
| | 452,398 | | | | 1,166,745 | | | | 229,784 | | | | 513,817 | | | | 56,548 | |
| | | | | | | | | | | | | | | | | | |
| | 278,371 | | | | 1,166,679 | | | | 10,844 | | | | 257,233 | | | | 49,981 | |
| | N/A | | | | 3,107 | | | | 2 | 2 | | | 86 | | | | 29 | 3 |
| | 9,279 | | | | 168,410 | | | | 1,803 | | | | 53,649 | | | | 4,725 | |
| | N/A | | | | N/A | | | | N/A | | | | 36,074 | | | | N/A | |
| | 150,218 | | | | 2,055,056 | | | | 139,165 | | | | 191,770 | | | | 82,570 | |
| | 794,310 | | | | N/A | | | | 438,504 | | | | 774,218 | | | | 28,838 | |
| | 55,252 | 1 | | | 290,084 | 1 | | | N/A | | | | N/A | | | | N/A | |
| | | | | | | | | | | | | | | | | | |
| | 324,745 | | | | 1,365,521 | | | | 12,633 | | | | 301,576 | | | | 58,203 | |
| | N/A | | | | 3,602 | | | | 2 | 2 | | | 100 | | | | 34 | 3 |
| | 10,787 | | | | 196,413 | | | | 2,102 | | | | 62,943 | | | | 5,496 | |
| | 266,558 | | | | 1,606,960 | | | | 287,915 | | | | 376,786 | | | | 162,206 | |
| | 43,166 | 1 | | | 223,991 | 1 | | | N/A | | | | N/A | | | | N/A | |
| | | | | | | | | | | | | | | | | | |
| | N/A | | | | 10,805 | | | | 8 | 2 | | | 299 | | | | 102 | 3 |
| | 32,361 | | | | 589,239 | | | | 6,307 | | | | 188,829 | | | | 16,489 | |
| | 35,324 | | | | 88,900 | | | | 17,984 | | | | 39,869 | | | | 5,573 | |
| | 32,929 | | | | 31,926 | | | | 33,855 | | | | 32,891 | | | | 31,342 | |
| | 71,165 | | | | 77,687 | | | | 53,359 | | | | 132,644 | | | | 62,415 | |
| | 112,717 | | | | 112,450 | | | | 33,405 | | | | 80,692 | | | | 11,849 | |
| | 11,946 | | | | 5,534 | | | | 12,049 | | | | 16,013 | | | | 17,549 | |
| | 0 | | | | 510 | | | | 0 | | | | 0 | | | | 0 | |
| | 23,234 | | | | 32,013 | | | | 10,261 | | | | 21,803 | | | | 9,198 | |
| | |
| | 2,704,760 | | | | 9,195,632 | | | | 1,289,982 | | | | 3,081,292 | | | | 603,147 | |
| | (748,747 | ) | | | (3,548,383 | ) | | | (544,334 | ) | | | (436,129 | ) | | | (186,900 | ) |
| | |
| | 1,956,013 | | | | 5,647,249 | | | | 745,648 | | | | 2,645,163 | | | | 416,247 | |
| | |
| | (5,604,076 | ) | | | 43,842,849 | | | | 10,753,007 | | | | (2,929,297 | ) | | | 281,447 | |
| | |
| | | | |
| | | | | | | | | | | | | | | | | | |
| | 16,759,240 | | | | 145,902,899 | | | | (1,414,408 | ) | | | (96,538,450 | ) | | | 5,081,876 | |
| | (161,957,206 | ) | | | (169,888,364 | ) | | | (68,327,246 | ) | | | (52,968,762 | ) | | | (11,987,449 | ) |
| | |
| | (145,197,966 | ) | | | (23,985,465 | ) | | | (69,741,654 | ) | | | (149,507,212 | ) | | | (6,905,573 | ) |
| | |
| $ | (150,802,042 | ) | | $ | 19,857,384 | | | $ | (58,988,647 | ) | | $ | (152,436,509 | ) | | $ | (6,624,126 | ) |
| | |
| | | | |
| | $0 | | | | $25,267 | | | | $1,917,871 | | | | $10,858 | | | | $0 | |
The accompanying notes are an integral part of these financial statements.
| | | | |
| 44 | | Wells Fargo Equity Gateway Funds | | Statements of changes in net assets |
| | | | | | | | | | | | | | | | |
| | | C&B Large Cap Value Fund | |
| | | Year ended
May 31, 2016 | | | Year ended
May 31, 2015 | |
| | | | |
Operations | | | | | | | | | | | | | | | | |
Net investment income | | | | | | $ | 2,849,202 | | | | | | | $ | 2,657,630 | |
Net realized gains on investments | | | | | | | 11,830,809 | | | | | | | | 35,718,120 | |
Net change in unrealized gains (losses) on investments | | | | | | | (16,093,129 | ) | | | | | | | (10,878,572 | ) |
| | | | |
Net increase (decrease) in net assets resulting from operations | | | | | | | (1,413,118 | ) | | | | | | | 27,497,178 | |
| | | | |
| | | | |
Distributions to shareholders from | | | | | | | | | | | | | | | | |
Net investment income | | | | | | | | | | | | | | | | |
Class A | | | | | | | (704,407 | ) | | | | | | | (191,216 | ) |
Class C | | | | | | | (5,711 | ) | | | | | | | (4,396 | ) |
Administrator Class | | | | | | | (390,601 | ) | | | | | | | (542,158 | ) |
Institutional Class | | | | | | | (1,708,080 | ) | | | | | | | (1,502,171 | ) |
Investor Class | | | | | | | 0 | 1 | | | | | | | (465,119 | ) |
Net realized gains | | | | | | | | | | | | | | | | |
Class A | | | | | | | (2,768,349 | ) | | | | | | | 0 | |
Class B | | | | | | | (4,185 | ) | | | | | | | 0 | |
Class C | | | | | | | (226,860 | ) | | | | | | | 0 | |
Administrator Class | | | | | | | (1,238,469 | ) | | | | | | | 0 | |
Institutional Class | | | | | | | (4,289,359 | ) | | | | | | | 0 | |
| | | | |
Total distributions to shareholders | | | | | | | (11,336,021 | ) | | | | | | | (2,705,060 | ) |
| | | | |
| | | | |
Capital share transactions | | | Shares | | | | | | | | Shares | | | | | |
Proceeds from shares sold | | | | | | | | | | | | | | | | |
Class A | | | 5,575,994 | | | | 70,098,722 | | | | 130,294 | | | | 1,649,118 | |
Class B | | | 1,293 | | | | 16,730 | | | | 2,800 | | | | 33,928 | |
Class C | | | 62,571 | | | | 770,614 | | | | 79,178 | | | | 996,261 | |
Administrator Class | | | 262,362 | | | | 3,228,873 | | | | 918,168 | | | | 11,427,828 | |
Institutional Class | | | 4,202,150 | | | | 52,013,737 | | | | 3,151,544 | | | | 39,122,654 | |
Investor Class | | | 97,970 | 1 | | | 1,221,665 | 1 | | | 516,799 | | | | 6,496,956 | |
| | | | |
| | | | | | | 127,350,341 | | | | | | | | 59,726,745 | |
| | | | |
Reinvestment of distributions | | | | | | | | | | | | | | | | |
Class A | | | 283,128 | | | | 3,389,659 | | | | 13,941 | | | | 178,728 | |
Class B | | | 341 | | | | 4,144 | | | | 0 | | | | 0 | |
Class C | | | 18,836 | | | | 224,790 | | | | 328 | | | | 4,197 | |
Administrator Class | | | 129,270 | | | | 1,547,567 | | | | 40,849 | | | | 523,278 | |
Institutional Class | | | 125,571 | | | | 1,506,294 | | | | 39,316 | | | | 504,812 | |
Investor Class | | | 0 | 1 | | | 0 | 1 | | | 35,187 | | | | 451,449 | |
| | | | |
| | | | | | | 6,672,454 | | | | | | | | 1,662,464 | |
| | | | |
Payment for shares redeemed | | | | | | | | | | | | | | | | |
Class A | | | (886,210 | ) | | | (10,862,850 | ) | | | (534,599 | ) | | | (6,629,667 | ) |
Class B | | | (14,555 | ) | | | (187,133 | ) | | | (20,246 | ) | | | (256,296 | ) |
Class C | | | (86,496 | ) | | | (1,042,353 | ) | | | (98,840 | ) | | | (1,234,205 | ) |
Administrator Class | | | (2,802,823 | ) | | | (34,387,115 | ) | | | (1,188,416 | ) | | | (14,887,845 | ) |
Institutional Class | | | (3,825,560 | ) | | | (47,032,229 | ) | | | (1,771,504 | ) | | | (22,562,089 | ) |
Investor Class | | | (5,539,205 | )1 | | | (69,791,462 | )1 | | | (1,183,734 | ) | | | (14,758,082 | ) |
| | | | |
| | | | | | | (163,303,142 | ) | | | | | | | (60,328,184 | ) |
| | | | |
Net increase (decrease) in net assets resulting from capital share transactions | | | | | | | (29,280,347 | ) | | | | | | | 1,061,025 | |
| | | | |
Total increase (decrease) in net assets | | | | | | | (42,029,486 | ) | | | | | | | 25,853,143 | |
| | | | |
| | | | |
Net assets | | | | | | | | | | | | | | | | |
Beginning of period | | | | | | | 294,645,659 | | | | | | | | 268,792,516 | |
| | | | |
End of period | | | | | | $ | 252,616,173 | | | | | | | $ | 294,645,659 | |
| | | | |
Undistributed net investment income | | | | | | $ | 910,811 | | | | | | | $ | 1,073,489 | |
| | | | |
| 1 | For the period from June 1, 2015 to October 23, 2015. Effective at the close of business on October 23, 2015, Investor Class shares were converted to Class A shares and are no longer offered by the Fund. |
The accompanying notes are an integral part of these financial statements.
| | | | | | |
| Statements of changes in net assets | | Wells Fargo Equity Gateway Funds | | | 45 | |
| | | | | | | | | | | | | | | | |
| | | Diversified Equity Fund | |
| | | Year ended May 31, 2016 | | | Year ended May 31, 2015 | |
| | | | |
Operations | | | | | | | | | | | | | | | | |
Net investment income | | | | | | $ | 1,685,576 | | | | | | | $ | 1,736,992 | |
Net realized gains on investments | | | | | | | 13,338,712 | | | | | | | | 29,109,484 | |
Net change in unrealized gains (losses) on investments | | | | | | | (26,151,655 | ) | | | | | | | (4,344,945 | ) |
| | | | |
Net increase (decrease) in net assets resulting from operations | | | | | | | (11,127,367 | ) | | | | | | | 26,501,531 | |
| | | | |
| | | | |
Distributions to shareholders from | | | | | | | | | | | | | | | | |
Net investment income | | | | | | | | | | | | | | | | |
Class A | | | | | | | (221,131 | ) | | | | | | | (390,822 | ) |
Administrator Class | | | | | | | (839,164 | ) | | | | | | | (1,510,404 | ) |
Net realized gains | | | | | | | | | | | | | | | | |
Class A | | | | | | | (8,544,677 | ) | | | | | | | (7,603,395 | ) |
Class B | | | | | | | (4,748 | ) | | | | | | | (21,431 | ) |
Class C | | | | | | | (466,528 | ) | | | | | | | (406,484 | ) |
Administrator Class | | | | | | | (17,061,026 | ) | | | | | | | (19,427,983 | ) |
| | | | |
Total distributions to shareholders | | | | | | | (27,137,274 | ) | | | | | | | (29,360,519 | ) |
| | | | |
| | | | |
Capital share transactions | | | Shares | | | | | | | | Shares | | | | | |
Proceeds from shares sold | | | | | | | | | | | | | | | | |
Class A | | | 94,693 | | | | 2,811,823 | | | | 72,592 | | | | 2,360,097 | |
Class B | | | 230 | | | | 6,416 | | | | 1,406 | | | | 41,124 | |
Class C | | | 11,634 | | | | 316,337 | | | | 18,482 | | | | 554,242 | |
Administrator Class | | | 415,025 | | | | 11,962,561 | | | | 481,984 | | | | 15,640,677 | |
| | | | |
| | | | | | | 15,097,137 | | | | | | | | 18,596,140 | |
| | | | |
Reinvestment of distributions | | | | | | | | | | | | | | | | |
Class A | | | 320,487 | | | | 8,727,909 | | | | 255,678 | | | | 7,964,368 | |
Class B | | | 121 | | | | 2,943 | | | | 757 | | | | 21,428 | |
Class C | | | 17,905 | | | | 449,232 | | | | 13,515 | | | | 392,475 | |
Administrator Class | | | 649,470 | | | | 17,753,217 | | | | 663,957 | | | | 20,758,097 | |
| | | | |
| | | | | | | 26,933,301 | | | | | | | | 29,136,368 | |
| | | | |
Payment for shares redeemed | | | | | | | | | | | | | | | | |
Class A | | | (457,048 | ) | | | (12,951,934 | ) | | | (318,000 | ) | | | (10,362,321 | ) |
Class B | | | (1,838 | ) | | | (44,756 | ) | | | (27,329 | ) | | | (827,317 | ) |
Class C | | | (54,060 | ) | | | (1,358,279 | ) | | | (33,140 | ) | | | (1,009,906 | ) |
Administrator Class | | | (1,073,233 | ) | | | (31,084,914 | ) | | | (2,856,844 | ) | | | (92,459,859 | ) |
| | | | |
| | | | | | | (45,439,883 | ) | | | | | | | (104,659,403 | ) |
| | | | |
Net decrease in net assets resulting from capital share transactions | | | | | | | (3,409,445 | ) | | | | | | | (56,926,895 | ) |
| | | | |
Total decrease in net assets | | | | | | | (41,674,086 | ) | | | | | | | (59,785,883 | ) |
| | | | |
| | | | |
Net assets | | | | | | | | | | | | | | | | |
Beginning of period | | | | | | | 253,081,641 | | | | | | | | 312,867,524 | |
| | | | |
End of period | | | | | | $ | 211,407,555 | | | | | | | $ | 253,081,641 | |
| | | | |
Undistributed net investment income | | | | | | $ | 473,513 | | | | | | | $ | 46,525 | |
| | | | |
The accompanying notes are an integral part of these financial statements.
| | | | |
| 46 | | Wells Fargo Equity Gateway Funds | | Statements of changes in net assets |
| | | | | | | | | | | | | | | | |
| | | Emerging Growth Fund | |
| | | Year ended
May 31, 2016 | | | Year ended
May 31, 2015 | |
| | | | |
Operations | | | | | | | | | | | | | | | | |
Net investment loss | | | | | | $ | (5,604,076 | ) | | | | | | $ | (9,024,176 | ) |
Net realized gains on investments | | | | | | | 16,759,240 | | | | | | | | 112,708,948 | |
Net change in unrealized gains (losses) on investments | | | | | | | (161,957,206 | ) | | | | | | | 117,750,083 | |
| | | | |
Net increase (decrease) in net assets resulting from operations | | | | | | | (150,802,042 | ) | | | | | | | 221,434,855 | |
| | | | |
| | | | |
Distributions to shareholders from | | | | | | | | | | | | | | | | |
Net realized gains | | | | | | | | | | | | | | | | |
Class A | | | | | | | (17,578,574 | ) | | | | | | | (9,447,019 | ) |
Class C | | | | | | | (550,009 | ) | | | | | | | (383,862 | ) |
Administrator Class | | | | | | | (13,726,906 | ) | | | | | | | (11,952,978 | ) |
Institutional Class | | | | | | | (69,855,887 | ) | | | | | | | (49,504,949 | ) |
Investor Class | | | | | | | 0 | 1 | | | | | | | (3,083,544 | ) |
| | | | |
Total distributions to shareholders | | | | | | | (101,711,376 | ) | | | | | | | (74,372,352 | ) |
| | | | |
| | | | |
Capital share transactions | | | Shares | | | | | | | | Shares | | | | | |
Proceeds from shares sold | | | | | | | | | | | | | | | | |
Class A | | | 3,191,945 | | | | 46,782,655 | | | | 589,286 | | | | 9,273,753 | |
Class C | | | 10,483 | | | | 144,504 | | | | 4,497 | | | | 66,858 | |
Administrator Class | | | 2,336,832 | | | | 33,830,513 | | | | 2,507,269 | | | | 40,410,865 | |
Institutional Class | | | 11,852,732 | | | | 173,650,959 | | | | 10,077,065 | | | | 166,502,610 | |
Investor Class | | | 89,491 | 1 | | | 1,444,439 | 1 | | | 128,783 | | | | 2,057,466 | |
| | | | |
| | | | | | | 255,853,070 | | | | | | | | 218,311,552 | |
| | | | |
Reinvestment of distributions | | | | | | | | | | | | | | | | |
Class A | | | 1,300,151 | | | | 17,174,997 | | | | 606,373 | | | | 9,247,183 | |
Class C | | | 41,108 | | | | 503,162 | | | | 24,422 | | | | 350,946 | |
Administrator Class | | | 810,410 | | | | 10,932,427 | | | | 665,028 | | | | 10,314,584 | |
Institutional Class | | | 4,771,143 | | | | 66,223,470 | | | | 2,893,200 | | | | 45,886,151 | |
Investor Class | | | 0 | 1 | | | 0 | 1 | | | 196,696 | | | | 2,981,905 | |
| | | | |
| | | | | | | 94,834,056 | | | | | | | | 68,780,769 | |
| | | | |
Payment for shares redeemed | | | | | | | | | | | | | | | | |
Class A | | | (2,239,881 | ) | | | (30,073,121 | ) | | | (2,238,922 | ) | | | (35,052,130 | ) |
Class C | | | (47,632 | ) | | | (594,685 | ) | | | (50,484 | ) | | | (748,028 | ) |
Administrator Class | | | (4,765,394 | ) | | | (70,399,879 | ) | | | (6,591,370 | ) | | | (106,561,035 | ) |
Institutional Class | | | (14,016,874 | ) | | | (206,834,361 | ) | | | (14,421,358 | ) | | | (236,697,488 | ) |
Investor Class | | | (2,736,791 | )1 | | | (40,078,310 | )1 | | | (409,799 | ) | | | (6,362,087 | ) |
| | | | |
| | | | | | | (347,980,356 | ) | | | | | | | (385,420,768 | ) |
| | | | |
Net increase (decrease) in net assets resulting from capital share transactions | | | | | | | 2,706,770 | | | | | | | | (98,328,447 | ) |
| | | | |
Total increase (decrease) in net assets | | | | | | | (249,806,648 | ) | | | | | | | 48,734,056 | |
| | | | |
| | | | |
Net assets | | | | | | | | | | | | | | | | |
Beginning of period | | | | | | | 1,064,410,275 | | | | | | | | 1,015,676,219 | |
| | | | |
End of period | | | | | | $ | 814,603,627 | | | | | | | $ | 1,064,410,275 | |
| | | | |
Accumulated net investment loss | | | | | | $ | (1,370,106 | ) | | | | | | $ | (3,804,464 | ) |
| | | | |
| 1 | For the period from June 1, 2015 to October 23, 2015. Effective at the close of business on October 23, 2015, Investor Class shares were converted to Class A shares and are no longer offered by the Fund. |
The accompanying notes are an integral part of these financial statements.
| | | | | | |
| Statements of changes in net assets | | Wells Fargo Equity Gateway Funds | | | 47 | |
| | | | | | | | | | | | | | | | |
| | | Index Fund | |
| | | Year ended
May 31, 2016 | | | Year ended
May 31, 2015 | |
| | | | |
Operations | | | | | | | | | | | | | | | | |
Net investment income | | | | | | $ | 43,842,849 | | | | | | | $ | 45,846,902 | |
Net realized gains on investments | | | | | | | 145,902,899 | | | | | | | | 143,388,775 | |
Net change in unrealized gains (losses) on investments | | | | | | | (169,888,364 | ) | | | | | | | 102,650,064 | |
| | | | |
Net increase in net assets resulting from operations | | | | | | | 19,857,384 | | | | | | | | 291,885,741 | |
| | | | |
| | | | |
Distributions to shareholders from | | | | | | | | | | | | | | | | |
Net investment income | | | | | | | | | | | | | | | | |
Class A | | | | | | | (11,172,028 | ) | | | | | | | (6,566,177 | ) |
Class B | | | | | | | (6,396 | ) | | | | | | | (12,077 | ) |
Class C | | | | | | | (728,373 | ) | | | | | | | (604,147 | ) |
Administrator Class | | | | | | | (31,972,442 | ) | | | | | | | (34,295,290 | ) |
Investor Class | | | | | | | 0 | 1 | | | | | | | (3,502,692 | ) |
Net realized gains | | | | | | | | | | | | | | | | |
Class A | | | | | | | (39,384,515 | ) | | | | | | | (5,235,617 | ) |
Class B | | | | | | | (83,225 | ) | | | | | | | (31,633 | ) |
Class C | | | | | | | (4,840,929 | ) | | | | | | | (945,801 | ) |
Administrator Class | | | | | | | (97,917,183 | ) | | | | | | | (22,741,125 | ) |
Investor Class | | | | | | | 0 | 1 | | | | | | | (2,537,733 | ) |
| | | | |
Total distributions to shareholders | | | | | | | (186,105,091 | ) | | | | | | | (76,472,292 | ) |
| | | | |
| | | | |
Capital share transactions | | | Shares | | | | | | | | Shares | | | | | |
Proceeds from shares sold | | | | | | | | | | | | | | | | |
Class A | | | 3,880,729 | | | | 256,525,864 | | | | 388,150 | | | | 25,178,381 | |
Class B | | | 149 | | | | 8,695 | | | | 146 | | | | 9,762 | |
Class C | | | 135,073 | | | | 8,323,805 | | | | 86,074 | | | | 5,639,238 | |
Administrator Class | | | 3,967,724 | | | | 247,773,885 | | | | 5,874,897 | | | | 384,950,475 | |
Investor Class | | | 142,837 | 1 | | | 9,251,027 | 1 | | | 810,418 | | | | 52,754,953 | |
| | | | |
| | | | | | | 521,883,276 | | | | | | | | 468,532,809 | |
| | | | |
Reinvestment of distributions | | | | | | | | | | | | | | | | |
Class A | | | 806,782 | | | | 49,545,858 | | | | 174,805 | | | | 11,529,519 | |
Class B | | | 1,408 | | | | 88,216 | | | | 614 | | | | 41,109 | |
Class C | | | 52,914 | | | | 3,262,843 | | | | 13,660 | | | | 904,452 | |
Administrator Class | | | 2,060,178 | | | | 127,480,756 | | | | 829,053 | | | | 55,036,997 | |
Investor Class | | | 0 | 1 | | | 0 | 1 | | | 90,165 | | | | 5,962,586 | |
| | | | |
| | | | | | | 180,377,673 | | | | | | | | 73,474,663 | |
| | | | |
Payment for shares redeemed | | | | | | | | | | | | | | | | |
Class A | | | (1,123,946 | ) | | | (69,747,531 | ) | | | (910,851 | ) | | | (59,490,312 | ) |
Class B | | | (15,549 | ) | | | (1,010,540 | ) | | | (24,275 | ) | | | (1,605,163 | ) |
Class C | | | (162,173 | ) | | | (10,047,846 | ) | | | (112,909 | ) | | | (7,341,983 | ) |
Administrator Class | | | (9,338,168 | ) | | | (589,128,029 | ) | | | (11,398,138 | ) | | | (748,386,873 | ) |
Investor Class | | | (3,630,262 | )1 | | | (242,534,900 | )1 | | | (480,314 | ) | | | (31,414,981 | ) |
| | | | |
| | | | | | | (912,468,846 | ) | | | | | | | (848,239,312 | ) |
| | | | |
Net decrease in net assets resulting from capital share transactions | | | | | | | (210,207,897 | ) | | | | | | | (306,231,840 | ) |
| | | | |
Total decrease in net assets | | | | | | | (376,455,604 | ) | | | | | | | (90,818,391 | ) |
| | | | |
| | | | |
Net assets | | | | | | | | | | | | | | | | |
Beginning of period | | | | | | | 2,599,156,703 | | | | | | | | 2,689,975,094 | |
| | | | |
End of period | | | | | | $ | 2,222,701,099 | | | | | | | $ | 2,599,156,703 | |
| | | | |
Undistributed net investment income | | | | | | $ | 16,373,457 | | | | | | | $ | 17,817,859 | |
| | | | |
| 1 | For the period from June 1, 2015 to October 23, 2015. Effective at the close of business on October 23, 2015, Investor Class shares were converted to Class A shares and are no longer offered by the Fund. |
The accompanying notes are an integral part of these financial statements.
| | | | |
| 48 | | Wells Fargo Equity Gateway Funds | | Statements of changes in net assets |
| | | | | | | | | | | | | | | | |
| | | International Value Fund | |
| | | Year ended
May 31, 2016 | | | Year ended
May 31, 2015 | |
| | | | |
Operations | | | | | | | | | | | | | | | | |
Net investment income | | | | | | $ | 10,753,007 | | | | | | | $ | 9,858,076 | |
Net realized gains (losses) on investments | | | | | | | (1,414,408 | ) | | | | | | | 11,094,516 | |
Net change in unrealized gains (losses) on investments | | | | | | | (68,327,246 | ) | | | | | | | (25,271,313 | ) |
| | | | |
Net decrease in net assets resulting from operations | | | | | | | (58,988,647 | ) | | | | | | | (4,318,721 | ) |
| | | | |
| | | | |
Distributions to shareholders from | | | | | | | | | | | | | | | | |
Net investment income | | | | | | | | | | | | | | | | |
Class A | | | | | | | (74,978 | ) | | | | | | | (124,398 | ) |
Class C | | | | | | | (6,472 | ) | | | | | | | (15,574 | ) |
Administrator Class | | | | | | | 0 | | | | | | | | (11,810,387 | ) |
Institutional Class | | | | | | | (8,593,037 | ) | | | | | | | (99,504 | ) |
| | | | |
Total distributions to shareholders | | | | | | | (8,674,487 | ) | | | | | | | (12,049,863 | ) |
| | | | |
| | | | |
Capital share transactions | | | Shares | | | | | | | | Shares | | | | | |
Proceeds from shares sold | | | | | | | | | | | | | | | | |
Class A | | | 137,751 | | | | 1,746,788 | | | | 96,792 | | | | 1,420,552 | |
Class C | | | 26,626 | | | | 345,603 | | | | 16,755 | | | | 237,604 | |
Administrator Class | | | 1,268,931 | | | | 18,094,801 | | | | 6,638,872 | | | | 95,650,707 | |
Institutional Class | | | 38,985,756 | | | | 524,060,776 | | | | 125,680 | | | | 1,859,946 | |
| | | | |
| | | | | | | 544,247,968 | | | | | | | | 99,168,809 | |
| | | | |
Reinvestment of distributions | | | | | | | | | | | | | | | | |
Class A | | | 5,589 | | | | 73,109 | | | | 9,086 | | | | 123,662 | |
Class C | | | 454 | | | | 5,827 | | | | 1,125 | | | | 15,035 | |
Administrator Class | | | 0 | | | | 0 | | | | 874,917 | | | | 11,802,625 | |
Institutional Class | | | 662,612 | | | | 8,587,447 | | | | 6,675 | | | | 90,113 | |
| | | | |
| | | | | | | 8,666,383 | | | | | | | | 12,031,435 | |
| | | | |
Payment for shares redeemed | | | | | | | | | | | | | | | | |
Class A | | | (143,571 | ) | | | (1,876,076 | ) | | | (152,548 | ) | | | (2,261,304 | ) |
Class B | | | (134 | )1 | | | (1,823 | )1 | | | (1,476 | ) | | | (21,755 | ) |
Class C | | | (28,008 | ) | | | (352,174 | ) | | | (15,291 | ) | | | (213,669 | ) |
Administrator Class | | | (33,457,218 | ) | | | (455,926,251 | ) | | | (4,339,458 | ) | | | (63,303,960 | ) |
Institutional Class | | | (4,077,552 | ) | | | (51,283,434 | ) | | | (28,692 | ) | | | (410,073 | ) |
| | | | |
| | | | | | | (509,439,758 | ) | | | | | | | (66,210,761 | ) |
| | | | |
Net increase in net assets resulting from capital share transactions | | | | | | | 43,474,593 | | | | | | | | 44,989,483 | |
| | | | |
Total increase (decrease) in net assets | | | | | | | (24,188,541 | ) | | | | | | | 28,620,899 | |
| | | | |
| | | | |
Net assets | | | | | | | | | | | | | | | | |
Beginning of period | | | | | | | 498,065,106 | | | | | | | | 469,444,207 | |
| | | | |
End of period | | | | | | $ | 473,876,565 | | | | | | | $ | 498,065,106 | |
| | | | |
Undistributed net investment income | | | | | | $ | 7,379,031 | | | | | | | $ | 5,915,574 | |
| | | | |
| 1 | For the period from June 1, 2015 to December 8, 2015. Class B shares of the Fund were no longer offered to shareholders effective December 9, 2015. |
The accompanying notes are an integral part of these financial statements.
| | | | | | |
| Statements of changes in net assets | | Wells Fargo Equity Gateway Funds | | | 49 | |
| | | | | | | | | | | | | | | | |
| | | Small Company Growth Fund | |
| | | Year ended
May 31, 2016 | | | Year ended
May 31, 2015 | |
| | | | |
Operations | | | | | | | | | | | | | | | | |
Net investment loss | | | | | | $ | (2,929,297 | ) | | | | | | $ | (2,896,434 | ) |
Net realized gains (losses) on investments | | | | | | | (96,538,450 | ) | | | | | | | 16,034,580 | |
Net change in unrealized gains (losses) on investments | | | | | | | (52,968,762 | ) | | | | | | | 73,081,605 | |
| | | | |
Net increase (decrease) in net assets resulting from operations | | | | | | | (152,436,509 | ) | | | | | | | 86,219,751 | |
| | | | |
| | | | |
Distributions to shareholders from | | | | | | | | | | | | | | | | |
Net realized gains | | | | | | | | | | | | | | | | |
Class A | | | | | | | (959,782 | ) | | | | | | | (1,858,139 | ) |
Class B | | | | | | | (390 | ) | | | | | | | (3,974 | ) |
Class C | | | | | | | (215,622 | ) | | | | | | | (460,132 | ) |
Class R6 | | | | | | | (879,243 | ) | | | | | | | (1,115 | )1 |
Administrator Class | | | | | | | (1,038,580 | ) | | | | | | | (5,745,406 | ) |
Institutional Class | | | | | | | (4,261,265 | ) | | | | | | | (12,434,827 | ) |
| | | | |
Total distributions to shareholders | | | | | | | (7,354,882 | ) | | | | | | | (20,503,593 | ) |
| | | | |
| | | | |
Capital share transactions | | | Shares | | | | | | | | Shares | | | | | |
Proceeds from shares sold | | | | | | | | | | | | | | | | |
Class A | | | 2,891,844 | | | | 116,614,639 | | | | 1,510,052 | | | | 64,079,862 | |
Class B | | | 550 | | | | 20,540 | | | | 529 | | | | 19,657 | |
Class C | | | 578,225 | | | | 21,398,369 | | | | 290,683 | | | | 11,238,963 | |
Class R6 | | | 6,430,379 | | | | 268,578,557 | | | | 13,839 | 1 | | | 637,602 | 1 |
Administrator Class | | | 1,812,201 | | | | 76,404,712 | | | | 2,449,329 | | | | 104,749,365 | |
Institutional Class | | | 13,905,905 | | | | 582,506,295 | | | | 6,506,083 | | | | 283,139,829 | |
| | | | |
| | | | | | | 1,065,523,112 | | | | | | | | 463,865,278 | |
| | | | |
Reinvestment of distributions | | | | | | | | | | | | | | | | |
Class A | | | 23,512 | | | | 924,981 | | | | 43,783 | | | | 1,755,706 | |
Class B | | | 10 | | | | 368 | | | | 93 | | | | 3,360 | |
Class C | | | 4,971 | | | | 177,103 | | | | 9,491 | | | | 347,563 | |
Class R6 | | | 20,281 | | | | 840,043 | | | | 27 | 1 | | | 1,115 | 1 |
Administrator Class | | | 25,417 | | | | 1,035,227 | | | | 138,133 | | | | 5,721,481 | |
Institutional Class | | | 79,935 | | | | 3,310,125 | | | | 218,839 | | | | 9,195,633 | |
| | | | |
| | | | | | | 6,287,847 | | | | | | | | 17,024,858 | |
| | | | |
Payment for shares redeemed | | | | | | | | | | | | | | | | |
Class A | | | (1,436,430 | ) | | | (53,673,216 | ) | | | (388,500 | ) | | | (16,048,290 | ) |
Class B | | | (1,960 | ) | | | (71,547 | ) | | | (1,539 | ) | | | (58,026 | ) |
Class C | | | (221,799 | ) | | | (7,390,685 | ) | | | (49,730 | ) | | | (1,913,997 | ) |
Class R6 | | | (696,900 | ) | | | (27,316,064 | ) | | | (13 | )1 | | | (614 | )1 |
Administrator Class | | | (2,556,843 | ) | | | (105,996,475 | ) | | | (1,451,172 | ) | | | (62,196,609 | ) |
Institutional Class | | | (6,761,785 | ) | | | (270,191,008 | ) | | | (1,407,660 | ) | | | (61,985,956 | ) |
| | | | |
| | | | | | | (464,638,995 | ) | | | | | | | (142,203,492 | ) |
| | | | |
Net increase in net assets resulting from capital share transactions | | | | | | | 607,171,964 | | | | | | | | 338,686,644 | |
| | | | |
Total increase in net assets | | | | | | | 447,380,573 | | | | | | | | 404,402,802 | |
| | | | |
| | | | |
Net assets | | | | | | | | | | | | | | | | |
Beginning of period | | | | | | | 746,450,266 | | | | | | | | 342,047,464 | |
| | | | |
End of period | | | | | | $ | 1,193,830,839 | | | | | | | $ | 746,450,266 | |
| | | | |
Accumulated net investment loss | | | | | | $ | (511,635 | ) | | | | | | $ | (873,181 | ) |
| | | | |
| 1 | For the period from October 31, 2014 (commencement of class operations) to May 31, 2015 |
The accompanying notes are an integral part of these financial statements.
| | | | |
| 50 | | Wells Fargo Equity Gateway Funds | | Statements of changes in net assets |
| | | | | | | | | | | | | | | | |
| | | Small Company Value Fund | |
| | | Year ended May 31, 2016 | | | Year ended May 31, 2015 | |
| | | | |
Operations | | | | | | | | | | | | | | | | |
Net investment income | | | | | | $ | 281,447 | | | | | | | $ | 542,897 | |
Net realized gains on investments | | | | | | | 5,081,876 | | | | | | | | 7,943,351 | |
Net change in unrealized gains (losses) on investments | | | | | | | (11,987,449 | ) | | | | | | | (915,138 | ) |
| | | | |
Net increase (decrease) in net assets resulting from operations | | | | | | | (6,624,126 | ) | | | | | | | 7,571,110 | |
| | | | |
| | | | |
Distributions to shareholders from | | | | | | | | | | | | | | | | |
Net investment income | | | | | | | | | | | | | | | | |
Class A | | | | | | | (30,336 | ) | | | | | | | 0 | |
Administrator Class | | | | | | | (230,332 | ) | | | | | | | 0 | |
Institutional Class | | | | | | | (170,512 | ) | | | | | | | 0 | |
| | | | |
Total distributions to shareholders | | | | | | | (431,180 | ) | | | | | | | 0 | |
| | | | |
| | | | |
Capital share transactions | | | Shares | | | | | | | | Shares | | | | | |
Proceeds from shares sold | | | | | | | | | | | | | | | | |
Class A | | | 184,247 | | | | 3,586,453 | | | | 194,148 | | | | 3,976,608 | |
Class B | | | 708 | 1 | | | 13,845 | 1 | | | 179 | | | | 3,340 | |
Class C | | | 18,509 | | | | 342,862 | | | | 31,950 | | | | 594,610 | |
Administrator Class | | | 473,663 | | | | 9,486,626 | | | | 558,083 | | | | 11,639,194 | |
Institutional Class | | | 1,003,324 | | | | 20,946,201 | | | | 450,222 | | | | 9,191,898 | |
| | | | |
| | | | | | | 34,375,987 | | | | | | | | 25,405,650 | |
| | | | |
Reinvestment of distributions | | | | | | | | | | | | | | | | |
Class A | | | 1,492 | | | | 28,226 | | | | 0 | | | | 0 | |
Administrator Class | | | 11,843 | | | | 228,808 | | | | 0 | | | | 0 | |
Institutional Class | | | 8,652 | | | | 167,939 | | | | 0 | | | | 0 | |
| | | | |
| | | | | | | 424,973 | | | | | | | | 0 | |
| | | | |
Payment for shares redeemed | | | | | | | | | | | | | | | | |
Class A | | | (270,420 | ) | | | (5,299,278 | ) | | | (284,709 | ) | | | (5,834,552 | ) |
Class B | | | (1,264 | )1 | | | (21,882 | )1 | | | (2,794 | ) | | | (51,063 | ) |
Class C | | | (42,627 | ) | | | (755,968 | ) | | | (17,350 | ) | | | (318,222 | ) |
Administrator Class | | | (630,158 | ) | | | (12,681,576 | ) | | | (649,811 | ) | | | (13,424,863 | ) |
Institutional Class | | | (247,681 | ) | | | (4,876,787 | ) | | | (266,922 | ) | | | (5,603,780 | ) |
| | | | |
| | | | | | | (23,635,491 | ) | | | | | | | (25,232,480 | ) |
| | | | |
Net increase in net assets resulting from capital share transactions | | | | | | | 11,165,469 | | | | | | | | 173,170 | |
| | | | |
Total increase in net assets | | | | | | | 4,110,163 | | | | | | | | 7,744,280 | |
| | | | |
| | | | |
Net assets | | | | | | | | | | | | | | | | |
Beginning of period | | | | | | | 116,835,713 | | | | | | | | 109,091,433 | |
| | | | |
End of period | | | | | | $ | 120,945,876 | | | | | | | $ | 116,835,713 | |
| | | | |
Undistributed net investment income | | | | | | $ | 291,961 | | | | | | | $ | 431,085 | |
| | | | |
| 1 | For the period from June 1, 2015 to January 8, 2016. Class B shares of the Fund were no longer offered to shareholders effective January 9, 2016. |
The accompanying notes are an integral part of these financial statements.
This page is intentionally left blank.
| | | | |
| 52 | | Wells Fargo Equity Gateway Funds | | Financial highlights |
| | | | | | | | | | | | | | | | | | | | | | | | |
| C&B Large Cap Value Fund | | Beginning
net asset
value per
share | | | Net
investment
income (loss) | | | Net realized
and unrealized
gains (losses)
on investments | | | Distributions
from net
investment
income | | | Distributions
from net
realized gains | | | Ending
net asset
value per
share | |
Class A | | | | | | | | | | | | | | | | | | | | | | | | |
Year ended May 31, 2016 | | $ | 13.07 | | | | 0.11 | 4 | | | (0.14 | ) | | | (0.10 | ) | | | (0.39 | ) | | $ | 12.55 | |
Year ended May 31, 2015 | | $ | 11.99 | | | | 0.10 | | | | 1.07 | | | | (0.09 | ) | | | 0.00 | | | $ | 13.07 | |
Year ended May 31, 2014 | | $ | 10.32 | | | | 0.09 | | | | 1.68 | | | | (0.10 | ) | | | 0.00 | | | $ | 11.99 | |
Year ended May 31, 2013 | | $ | 8.13 | | | | 0.12 | | | | 2.20 | | | | (0.13 | ) | | | 0.00 | | | $ | 10.32 | |
Year ended May 31, 2012 | | $ | 8.70 | | | | 0.12 | | | | (0.58 | ) | | | (0.11 | ) | | | 0.00 | | | $ | 8.13 | |
Class B | | | | | | | | | | | | | | | | | | | | | | | | |
Year ended May 31, 2016 | | $ | 13.22 | | | | 0.01 | 4 | | | (0.14 | ) | | | 0.00 | | | | (0.39 | ) | | $ | 12.70 | |
Year ended May 31, 2015 | | $ | 12.14 | | | | (0.01 | )4 | | | 1.09 | | | | 0.00 | | | | 0.00 | | | $ | 13.22 | |
Year ended May 31, 2014 | | $ | 10.43 | | | | 0.02 | 4 | | | 1.69 | | | | 0.00 | | | | 0.00 | | | $ | 12.14 | |
Year ended May 31, 2013 | | $ | 8.16 | | | | 0.05 | 4 | | | 2.22 | | | | 0.00 | | | | 0.00 | | | $ | 10.43 | |
Year ended May 31, 2012 | | $ | 8.68 | | | | 0.05 | 4 | | | (0.56 | ) | | | (0.01 | ) | | | 0.00 | | | $ | 8.16 | |
Class C | | | | | | | | | | | | | | | | | | | | | | | | |
Year ended May 31, 2016 | | $ | 13.01 | | | | 0.01 | | | | (0.14 | ) | | | (0.01 | ) | | | (0.39 | ) | | $ | 12.48 | |
Year ended May 31, 2015 | | $ | 11.95 | | | | (0.00 | )5 | | | 1.07 | | | | (0.01 | ) | | | 0.00 | | | $ | 13.01 | |
Year ended May 31, 2014 | | $ | 10.29 | | | | 0.01 | | | | 1.67 | | | | (0.02 | ) | | | 0.00 | | | $ | 11.95 | |
Year ended May 31, 2013 | | $ | 8.11 | | | | 0.04 | | | | 2.20 | | | | (0.06 | ) | | | 0.00 | | | $ | 10.29 | |
Year ended May 31, 2012 | | $ | 8.66 | | | | 0.05 | | | | (0.56 | ) | | | (0.04 | ) | | | 0.00 | | | $ | 8.11 | |
Administrator Class | | | | | | | | | | | | | | | | | | | | | | | | |
Year ended May 31, 2016 | | $ | 13.07 | | | | 0.13 | 4 | | | (0.15 | ) | | | (0.12 | ) | | | (0.39 | ) | | $ | 12.54 | |
Year ended May 31, 2015 | | $ | 12.00 | | | | 0.13 | | | | 1.06 | | | | (0.12 | ) | | | 0.00 | | | $ | 13.07 | |
Year ended May 31, 2014 | | $ | 10.32 | | | | 0.12 | 4 | | | 1.68 | | | | (0.12 | ) | | | 0.00 | | | $ | 12.00 | |
Year ended May 31, 2013 | | $ | 8.13 | | | | 0.13 | 4 | | | 2.21 | | | | (0.15 | ) | | | 0.00 | | | $ | 10.32 | |
Year ended May 31, 2012 | | $ | 8.69 | | | | 0.13 | 4 | | | (0.56 | ) | | | (0.13 | ) | | | 0.00 | | | $ | 8.13 | |
Institutional Class | | | | | | | | | | | | | | | | | | | | | | | | |
Year ended May 31, 2016 | | $ | 13.11 | | | | 0.16 | | | | (0.14 | ) | | | (0.16 | ) | | | (0.39 | ) | | $ | 12.58 | |
Year ended May 31, 2015 | | $ | 12.03 | | | | 0.15 | | | | 1.08 | | | | (0.15 | ) | | | 0.00 | | | $ | 13.11 | |
Year ended May 31, 2014 | | $ | 10.35 | | | | 0.14 | | | | 1.69 | | | | (0.15 | ) | | | 0.00 | | | $ | 12.03 | |
Year ended May 31, 2013 | | $ | 8.16 | | | | 0.17 | | | | 2.19 | | | | (0.17 | ) | | | 0.00 | | | $ | 10.35 | |
Year ended May 31, 2012 | | $ | 8.73 | | | | 0.14 | | | | (0.56 | ) | | | (0.15 | ) | | | 0.00 | | | $ | 8.16 | |
| 1 | Ratios include net expenses allocated from the affiliated Master Portfolio. |
| 2 | Total return calculations do not include any sales charges. |
| 3 | Portfolio turnover rate is calculated by aggregating the results of multiplying the Fund’s investment percentage in the affiliated Master Portfolio by the affiliated Master Portfolio’s portfolio turnover rate. |
| 4 | Calculated based upon average shares outstanding |
| 5 | Amount is less than $0.005. |
The accompanying notes are an integral part of these financial statements.
| | | | | | |
| Financial highlights | | Wells Fargo Equity Gateway Funds | | | 53 | |
| | | | | | | | | | | | | | | | | | | | | | |
| Ratio to average net assets (annualized) | | | Total
return2 | | | Portfolio
turnover
rate3 | | | Net assets at
end of period
(000s omitted) | |
Net investment
income (loss) | | | Gross
expenses1 | | | Net
expenses1 | | | | |
| | | | | | | | | | | | | | | | | | | | | | |
| | 0.89 | % | | | 1.25 | % | | | 1.15 | % | | | (0.08 | )% | | | 29 | % | | $ | 88,387 | |
| | 0.73 | % | | | 1.29 | % | | | 1.15 | % | | | 9.78 | % | | | 35 | % | | $ | 27,085 | |
| | 0.86 | % | | | 1.31 | % | | | 1.15 | % | | | 17.25 | % | | | 22 | % | | $ | 29,537 | |
| | 1.25 | % | | | 1.30 | % | | | 1.15 | % | | | 28.82 | % | | | 18 | % | | $ | 23,571 | |
| | 1.33 | % | | | 1.30 | % | | | 1.15 | % | | | (5.23 | )% | | | 21 | % | | $ | 21,380 | |
| | | | | | | | | | | | | | | | | | | | | | |
| | 0.08 | % | | | 2.00 | % | | | 1.90 | % | | | (0.81 | )% | | | 29 | % | | $ | 105 | |
| | (0.04 | )% | | | 2.04 | % | | | 1.90 | % | | | 8.90 | % | | | 35 | % | | $ | 280 | |
| | 0.17 | % | | | 2.06 | % | | | 1.90 | % | | | 16.40 | % | | | 22 | % | | $ | 469 | |
| | 0.57 | % | | | 2.03 | % | | | 1.89 | % | | | 27.82 | % | | | 18 | % | | $ | 1,167 | |
| | 0.61 | % | | | 2.05 | % | | | 1.90 | % | | | (5.84 | )% | | | 21 | % | | $ | 2,418 | |
| | | | | | | | | | | | | | | | | | | | | | |
| | 0.11 | % | | | 2.00 | % | | | 1.90 | % | | | (0.82 | )% | | | 29 | % | | $ | 7,282 | |
| | (0.02 | )% | | | 2.04 | % | | | 1.90 | % | | | 8.93 | % | | | 35 | % | | $ | 7,654 | |
| | 0.11 | % | | | 2.06 | % | | | 1.90 | % | | | 16.39 | % | | | 22 | % | | $ | 7,262 | |
| | 0.51 | % | | | 2.05 | % | | | 1.90 | % | | | 27.76 | % | | | 18 | % | | $ | 5,818 | |
| | 0.58 | % | | | 2.05 | % | | | 1.90 | % | | | (5.81 | )% | | | 21 | % | | $ | 5,524 | |
| | | | | | | | | | | | | | | | | | | | | | |
| | 1.03 | % | | | 1.16 | % | | | 0.98 | % | | | 0.11 | % | | | 29 | % | | $ | 23,210 | |
| | 0.92 | % | | | 1.13 | % | | | 0.95 | % | | | 9.93 | % | | | 35 | % | | $ | 55,705 | |
| | 1.08 | % | | | 1.14 | % | | | 0.95 | % | | | 17.49 | % | | | 22 | % | | $ | 53,884 | |
| | 1.48 | % | | | 1.13 | % | | | 0.95 | % | | | 29.09 | % | | | 18 | % | | $ | 70,727 | |
| | 1.54 | % | | | 1.13 | % | | | 0.95 | % | | | (4.90 | )% | | | 21 | % | | $ | 81,999 | |
| | | | | | | | | | | | | | | | | | | | | | |
| | 1.25 | % | | | 0.92 | % | | | 0.77 | % | | | 0.33 | % | | | 29 | % | | $ | 133,632 | |
| | 1.18 | % | | | 0.86 | % | | | 0.70 | % | | | 10.15 | % | | | 35 | % | | $ | 132,768 | |
| | 1.34 | % | | | 0.88 | % | | | 0.70 | % | | | 17.86 | % | | | 22 | % | | $ | 104,758 | |
| | 1.68 | % | | | 0.87 | % | | | 0.70 | % | | | 29.32 | % | | | 18 | % | | $ | 130,015 | |
| | 1.78 | % | | | 0.87 | % | | | 0.70 | % | | | (4.72 | )% | | | 21 | % | | $ | 96,653 | |
The accompanying notes are an integral part of these financial statements.
| | | | |
| 54 | | Wells Fargo Equity Gateway Funds | | Financial highlights |
| | | | | | | | | | | | | | | | | | | | | | | | |
| | | | | | |
| Diversified Equity Fund | | Beginning
net asset
value per
share | | | Net
investment
income (loss) | | | Net realized
and unrealized
gains (losses)
on investments | | | Distributions
from net
investment
income | | | Distributions
from net
realized gains | | | Ending
net asset
value per
share | |
Class A | | | | | | | | | | | | | | | | | | | | | | | | |
Year ended May 31, 2016 | | $ | 32.37 | | | | 0.16 | | | | (1.55 | ) | | | (0.08 | ) | | | (3.60 | ) | | $ | 27.30 | |
Year ended May 31, 2015 | | $ | 32.78 | | | | 0.14 | | | | 2.79 | | | | (0.15 | ) | | | (3.19 | ) | | $ | 32.37 | |
Year ended May 31, 2014 | | $ | 30.65 | | | | 0.16 | | | | 5.48 | | | | (0.17 | ) | | | (3.34 | ) | | $ | 32.78 | |
Year ended May 31, 2013 | | $ | 26.08 | | | | 0.23 | 4 | | | 6.14 | | | | (0.24 | ) | | | (1.56 | ) | | $ | 30.65 | |
Year ended May 31, 2012 | | $ | 29.71 | | | | 0.15 | | | | (2.01 | ) | | | (0.18 | ) | | | (1.59 | ) | | $ | 26.08 | |
Class B | | | | | | | | | | | | | | | | | | | | | | | | |
Year ended May 31, 2016 | | $ | 29.46 | | | | (0.10 | )4 | | | (1.27 | ) | | | 0.00 | | | | (3.60 | ) | | $ | 24.49 | |
Year ended May 31, 2015 | | $ | 30.20 | | | | (0.14 | )4 | | | 2.59 | | | | 0.00 | | | | (3.19 | ) | | $ | 29.46 | |
Year ended May 31, 2014 | | $ | 28.54 | | | | (0.10 | )4 | | | 5.10 | | | | 0.00 | | | | (3.34 | ) | | $ | 30.20 | |
Year ended May 31, 2013 | | $ | 24.36 | | | | 0.01 | 4 | | | 5.73 | | | | 0.00 | | | | (1.56 | ) | | $ | 28.54 | |
Year ended May 31, 2012 | | $ | 27.87 | | | | (0.01 | )4 | | | (1.91 | ) | | | 0.00 | | | | (1.59 | ) | | $ | 24.36 | |
Class C | | | | | | | | | | | | | | | | | | | | | | | | |
Year ended May 31, 2016 | | $ | 30.22 | | | | (0.05 | )4 | | | (1.45 | ) | | | 0.00 | | | | (3.60 | ) | | $ | 25.12 | |
Year ended May 31, 2015 | | $ | 30.88 | | | | (0.12 | ) | | | 2.65 | | | | 0.00 | | | | (3.19 | ) | | $ | 30.22 | |
Year ended May 31, 2014 | | $ | 29.13 | | | | (0.08 | )4 | | | 5.18 | | | | (0.01 | ) | | | (3.34 | ) | | $ | 30.88 | |
Year ended May 31, 2013 | | $ | 24.88 | | | | 0.02 | 4 | | | 5.84 | | | | (0.05 | ) | | | (1.56 | ) | | $ | 29.13 | |
Year ended May 31, 2012 | | $ | 28.43 | | | | (0.59 | )4 | | | (1.37 | ) | | | 0.00 | | | | (1.59 | ) | | $ | 24.88 | |
Administrator Class | | | | | | | | | | | | | | | | | | | | | | | | |
Year ended May 31, 2016 | | $ | 32.45 | | | | 0.24 | | | | (1.55 | ) | | | (0.16 | ) | | | (3.60 | ) | | $ | 27.38 | |
Year ended May 31, 2015 | | $ | 32.84 | | | | 0.22 | 4 | | | 2.81 | | | | (0.23 | ) | | | (3.19 | ) | | $ | 32.45 | |
Year ended May 31, 2014 | | $ | 30.70 | | | | 0.23 | 4 | | | 5.49 | | | | (0.24 | ) | | | (3.34 | ) | | $ | 32.84 | |
Year ended May 31, 2013 | | $ | 26.12 | | | | 0.30 | 4 | | | 6.15 | | | | (0.31 | ) | | | (1.56 | ) | | $ | 30.70 | |
Year ended May 31, 2012 | | $ | 29.78 | | | | 0.33 | | | | (2.13 | ) | | | (0.27 | ) | | | (1.59 | ) | | $ | 26.12 | |
| 1 | Ratios include net expenses allocated from the affiliated Master Portfolios which were as follows: |
| | | | | | | | | | | | | | | | | | | | |
| | | Year ended May 31 | |
| | | | |
| | | 2016 | | | 2015 | | | 2014 | | | 2013 | | | 2012 | |
| | | | |
Class A | | | 0.59 | % | | | 0.59 | % | | | 0.58 | % | | | 0.57 | % | | | 0.56 | % |
Class B | | | 0.55 | % | | | 0.59 | % | | | 0.58 | % | | | 0.57 | % | | | 0.56 | % |
Class C | | | 0.59 | % | | | 0.59 | % | | | 0.58 | % | | | 0.57 | % | | | 0.56 | % |
Administrator Class | | | 0.59 | % | | | 0.59 | % | | | 0.58 | % | | | 0.57 | % | | | 0.56 | % |
| 2 | Total return calculations do not include any sales charges. |
| 3 | Portfolio turnover rate is calculated by aggregating the results of multiplying the Fund’s investment percentage in each respective affiliated Master Portfolio by the corresponding affiliated Master Portfolio’s portfolio turnover rate. |
| 4 | Calculated based upon average shares outstanding |
The accompanying notes are an integral part of these financial statements.
| | | | | | |
| Financial highlights | | Wells Fargo Equity Gateway Funds | | | 55 | |
| | | | | | | | | | | | | | | | | | | | | | |
| Ratio to average net assets (annualized) | | | Total
return2 | | | Portfolio
turnover
rate3 | | | Net assets at
end of period
(000s omitted) | |
Net investment
income (loss) | | | Gross
expenses1 | | | Net
expenses1 | | | | |
| | | | | | | | | | | | | | | | | | | | | | |
| | 0.60 | % | | | 1.41 | % | | | 1.25 | % | | | (4.24 | )% | | | 39 | % | | $ | 67,597 | |
| | 0.44 | % | | | 1.44 | % | | | 1.25 | % | | | 9.39 | % | | | 38 | % | | $ | 81,502 | |
| | 0.48 | % | | | 1.43 | % | | | 1.25 | % | | | 19.10 | % | | | 37 | % | | $ | 82,186 | |
| | 0.81 | % | | | 1.43 | % | | | 1.25 | % | | | 25.42 | % | | | 44 | % | | $ | 75,640 | |
| | 0.74 | % | | | 1.41 | % | | | 1.25 | % | | | (5.91 | )% | | | 57 | % | | $ | 75,751 | |
| | | | | | | | | | | | | | | | | | | | | | |
| | (0.36 | )% | | | 2.12 | % | | | 1.99 | % | | | (4.61 | )% | | | 39 | % | | $ | 1 | |
| | (0.47 | )% | | | 2.18 | % | | | 2.00 | % | | | 8.54 | % | | | 38 | % | | $ | 45 | |
| | (0.34 | )% | | | 2.18 | % | | | 2.00 | % | | | 18.20 | % | | | 37 | % | | $ | 806 | |
| | 0.04 | % | | | 2.18 | % | | | 2.00 | % | | | 24.48 | % | | | 44 | % | | $ | 2,029 | |
| | (0.05 | )% | | | 2.16 | % | | | 2.00 | % | | | (6.61 | )% | | | 57 | % | | $ | 2,922 | |
| | | | | | | | | | | | | | | | | | | | | | |
| | (0.17 | )% | | | 2.16 | % | | | 2.00 | % | | | (4.96 | )% | | | 39 | % | | $ | 2,846 | |
| | (0.31 | )% | | | 2.19 | % | | | 2.00 | % | | | 8.58 | % | | | 38 | % | | $ | 4,165 | |
| | (0.25 | )% | | | 2.19 | % | | | 2.00 | % | | | 18.23 | % | | | 37 | % | | $ | 4,292 | |
| | 0.07 | % | | | 2.18 | % | | | 2.00 | % | | | 24.50 | % | | | 44 | % | | $ | 2,667 | |
| | (0.02 | )% | | | 2.16 | % | | | 2.00 | % | | | (6.62 | )% | | | 57 | % | | $ | 2,499 | |
| | | | | | | | | | | | | | | | | | | | | | |
| | 0.85 | % | | | 1.33 | % | | | 1.00 | % | | | (3.98 | )% | | | 39 | % | | $ | 140,963 | |
| | 0.67 | % | | | 1.28 | % | | | 1.00 | % | | | 9.65 | % | | | 38 | % | | $ | 167,371 | |
| | 0.71 | % | | | 1.27 | % | | | 1.00 | % | | | 19.40 | % | | | 37 | % | | $ | 225,584 | |
| | 1.06 | % | | | 1.27 | % | | | 1.00 | % | | | 25.75 | % | | | 44 | % | | $ | 290,011 | |
| | 0.99 | % | | | 1.25 | % | | | 1.00 | % | | | (5.67 | )% | | | 57 | % | | $ | 293,895 | |
The accompanying notes are an integral part of these financial statements.
| | | | |
| 56 | | Wells Fargo Equity Gateway Funds | | Financial highlights |
| | | | | | | | | | | | | | | | | | | | |
| Emerging Growth Fund | | Beginning
net asset
value per
share | | | Net
investment
loss | | | Net realized
and unrealized
gains (losses)
on investments | | | Distributions
from net
realized gains | | | Ending
net asset
value per
share | |
Class A | | | | | | | | | | | | | | | | | | | | |
Year ended May 31, 2016 | | $ | 16.70 | | | | (0.13 | )4 | | | (2.28 | ) | | | (1.74 | ) | | $ | 12.55 | |
Year ended May 31, 2015 | | $ | 14.61 | | | | (0.22 | ) | | | 3.51 | | | | (1.20 | ) | | $ | 16.70 | |
Year ended May 31, 2014 | | $ | 14.10 | | | | (0.19 | ) | | | 1.88 | | | | (1.18 | ) | | $ | 14.61 | |
Year ended May 31, 2013 | | $ | 12.44 | | | | (0.15 | ) | | | 2.49 | | | | (0.68 | ) | | $ | 14.10 | |
Year ended May 31, 2012 | | $ | 13.12 | | | | (0.14 | )4 | | | (0.54 | ) | | | 0.00 | | | $ | 12.44 | |
Class C | | | | | | | | | | | | | | | | | | | | |
Year ended May 31, 2016 | | $ | 15.67 | | | | (0.21 | ) | | | (2.14 | ) | | | (1.74 | ) | | $ | 11.58 | |
Year ended May 31, 2015 | | $ | 13.88 | | | | (0.33 | ) | | | 3.32 | | | | (1.20 | ) | | $ | 15.67 | |
Year ended May 31, 2014 | | $ | 13.55 | | | | (0.32 | ) | | | 1.83 | | | | (1.18 | ) | | $ | 13.88 | |
Year ended May 31, 2013 | | $ | 12.06 | | | | (0.27 | ) | | | 2.44 | | | | (0.68 | ) | | $ | 13.55 | |
Year ended May 31, 2012 | | $ | 12.81 | | | | (0.23 | )4 | | | (0.52 | ) | | | 0.00 | | | $ | 12.06 | |
Administrator Class | | | | | | | | | | | | | | | | | | | | |
Year ended May 31, 2016 | | $ | 17.00 | | | | (0.12 | )4 | | | (2.32 | ) | | | (1.74 | ) | | $ | 12.82 | |
Year ended May 31, 2015 | | $ | 14.83 | | | | (0.16 | )4 | | | 3.53 | | | | (1.20 | ) | | $ | 17.00 | |
Year ended May 31, 2014 | | $ | 14.28 | | | | (0.17 | )4 | | | 1.90 | | | | (1.18 | ) | | $ | 14.83 | |
Year ended May 31, 2013 | | $ | 12.56 | | | | (0.12 | ) | | | 2.52 | | | | (0.68 | ) | | $ | 14.28 | |
Year ended May 31, 2012 | | $ | 13.22 | | | | (0.12 | )4 | | | (0.54 | ) | | | 0.00 | | | $ | 12.56 | |
Institutional Class | | | | | | | | | | | | | | | | | | | | |
Year ended May 31, 2016 | | $ | 17.40 | | | | (0.07 | ) | | | (2.39 | ) | | | (1.74 | ) | | $ | 13.20 | |
Year ended May 31, 2015 | | $ | 15.11 | | | | (0.12 | ) | | | 3.61 | | | | (1.20 | ) | | $ | 17.40 | |
Year ended May 31, 2014 | | $ | 14.49 | | | | (0.11 | ) | | | 1.91 | | | | (1.18 | ) | | $ | 15.11 | |
Year ended May 31, 2013 | | $ | 12.70 | | | | (0.08 | ) | | | 2.55 | | | | (0.68 | ) | | $ | 14.49 | |
Year ended May 31, 2012 | | $ | 13.33 | | | | (0.08 | )4 | | | (0.55 | ) | | | 0.00 | | | $ | 12.70 | |
| 1 | Ratios include net expenses allocated from the affiliated Master Portfolio. |
| 2 | Total return calculations do not include any sales charges. |
| 3 | Portfolio turnover rate is calculated by multiplying the Fund’s investment percentage in the affiliated Master Portfolio by the affiliated Master Portfolio’s portfolio turnover rate. |
| 4 | Calculated based upon average shares outstanding |
The accompanying notes are an integral part of these financial statements.
| | | | | | |
| Financial highlights | | Wells Fargo Equity Gateway Funds | | | 57 | |
| | | | | | | | | | | | | | | | | | | | | | |
| Ratio to average net assets (annualized) | | | Total
return2 | | | Portfolio
turnover
rate3 | | | Net assets at
end of period
(000s omitted) | |
Net investment
loss | | | Gross
expenses1 | | | Net
expenses1 | | | | |
| | | | | | | | | | | | | | | | | | | | | | |
| | (0.92 | )% | | | 1.35 | % | | | 1.35 | % | | | (14.94 | )% | | | 68 | % | | $ | 127,154 | |
| | (1.20 | )% | | | 1.39 | % | | | 1.37 | % | | | 23.32 | % | | | 56 | % | | $ | 131,638 | |
| | (1.20 | )% | | | 1.39 | % | | | 1.37 | % | | | 11.30 | % | | | 63 | % | | $ | 130,403 | |
| | (1.04 | )% | | | 1.40 | % | | | 1.37 | % | | | 19.89 | % | | | 65 | % | | $ | 125,070 | |
| | (1.13 | )% | | | 1.41 | % | | | 1.37 | % | | | (5.18 | )% | | | 75 | % | | $ | 125,113 | |
| | | | | | | | | | | | | | | | | | | | | | |
| | (1.70 | )% | | | 2.10 | % | | | 2.10 | % | | | (15.59 | )% | | | 68 | % | | $ | 3,815 | |
| | (1.95 | )% | | | 2.14 | % | | | 2.12 | % | | | 22.35 | % | | | 56 | % | | $ | 5,101 | |
| | (1.95 | )% | | | 2.14 | % | | | 2.12 | % | | | 10.40 | % | | | 63 | % | | $ | 4,816 | |
| | (1.79 | )% | | | 2.15 | % | | | 2.12 | % | | | 19.09 | % | | | 65 | % | | $ | 4,878 | |
| | (1.89 | )% | | | 2.17 | % | | | 2.12 | % | | | (5.85 | )% | | | 75 | % | | $ | 5,114 | |
| | | | | | | | | | | | | | | | | | | | | | |
| | (0.80 | )% | | | 1.23 | % | | | 1.20 | % | | | (14.80 | )% | | | 68 | % | | $ | 99,792 | |
| | (1.03 | )% | | | 1.21 | % | | | 1.20 | % | | | 23.45 | % | | | 56 | % | | $ | 159,813 | |
| | (1.03 | )% | | | 1.22 | % | | | 1.20 | % | | | 11.45 | % | | | 63 | % | | $ | 190,126 | |
| | (0.87 | )% | | | 1.23 | % | | | 1.20 | % | | | 20.19 | % | | | 65 | % | | $ | 200,140 | |
| | (0.95 | )% | | | 1.22 | % | | | 1.19 | % | | | (4.99 | )% | | | 75 | % | | $ | 185,744 | |
| | | | | | | | | | | | | | | | | | | | | | |
| | (0.50 | )% | | | 1.01 | % | | | 0.90 | % | | | (14.62 | )% | | | 68 | % | | $ | 583,843 | |
| | (0.73 | )% | | | 0.96 | % | | | 0.90 | % | | | 23.89 | % | | | 56 | % | | $ | 723,946 | |
| | (0.73 | )% | | | 0.96 | % | | | 0.90 | % | | | 11.77 | % | | | 63 | % | | $ | 650,650 | |
| | (0.57 | )% | | | 0.97 | % | | | 0.90 | % | | | 20.52 | % | | | 65 | % | | $ | 578,841 | |
| | (0.67 | )% | | | 0.98 | % | | | 0.90 | % | | | (4.73 | )% | | | 75 | % | | $ | 526,865 | |
The accompanying notes are an integral part of these financial statements.
| | | | |
| 58 | | Wells Fargo Equity Gateway Funds | | Financial highlights |
| | | | | | | | | | | | | | | | | | | | | | | | |
| Index Fund | | Beginning net asset value per share | | | Net investment income | | | Net realized and unrealized gains (losses) on investments | | | Distributions from net investment income | | | Distributions from net realized gains | | | Ending net asset value per share | |
Class A | | | | | | | | | | | | | | | | | | | | | | | | |
Year ended May 31, 2016 | | $ | 67.32 | | | | 0.81 | | | | (0.17 | ) | | | (1.08 | ) | | | (4.03 | ) | | $ | 62.85 | |
Year ended May 31, 2015 | | $ | 62.14 | | | | 1.00 | | | | 5.91 | | | | (0.96 | ) | | | (0.77 | ) | | $ | 67.32 | |
Year ended May 31, 2014 | | $ | 54.00 | | | | 0.90 | | | | 9.59 | | | | (0.85 | ) | | | (1.50 | ) | | $ | 62.14 | |
Year ended May 31, 2013 | | $ | 44.25 | | | | 0.86 | | | | 10.66 | | | | (0.83 | ) | | | (0.94 | ) | | $ | 54.00 | |
Year ended May 31, 2012 | | $ | 47.17 | | | | 0.73 | | | | (1.35 | ) | | | (0.65 | ) | | | (1.65 | ) | | $ | 44.25 | |
Class B | | | | | | | | | | | | | | | | | | | | | | | | |
Year ended May 31, 2016 | | $ | 68.44 | | | | 0.61 | 4 | | | (0.42 | ) | | | (0.29 | ) | | | (4.03 | ) | | $ | 64.31 | |
Year ended May 31, 2015 | | $ | 62.99 | | | | 0.49 | 4 | | | 6.02 | | | | (0.29 | ) | | | (0.77 | ) | | $ | 68.44 | |
Year ended May 31, 2014 | | $ | 54.57 | | | | 0.45 | 4 | | | 9.70 | | | | (0.23 | ) | | | (1.50 | ) | | $ | 62.99 | |
Year ended May 31, 2013 | | $ | 44.53 | | | | 0.47 | 4 | | | 10.78 | | | | (0.27 | ) | | | (0.94 | ) | | $ | 54.57 | |
Year ended May 31, 2012 | | $ | 47.23 | | | | 0.38 | 4 | | | (1.29 | ) | | | (0.14 | ) | | | (1.65 | ) | | $ | 44.53 | |
Class C | | | | | | | | | | | | | | | | | | | | | | | | |
Year ended May 31, 2016 | | $ | 67.55 | | | | 0.62 | 4 | | | (0.45 | ) | | | (0.57 | ) | | | (4.03 | ) | | $ | 63.12 | |
Year ended May 31, 2015 | | $ | 62.37 | | | | 0.50 | | | | 5.94 | | | | (0.49 | ) | | | (0.77 | ) | | $ | 67.55 | |
Year ended May 31, 2014 | | $ | 54.22 | | | | 0.47 | | | | 9.62 | | | | (0.44 | ) | | | (1.50 | ) | | $ | 62.37 | |
Year ended May 31, 2013 | | $ | 44.41 | | | | 0.48 | 4 | | | 10.71 | | | | (0.44 | ) | | | (0.94 | ) | | $ | 54.22 | |
Year ended May 31, 2012 | | $ | 47.27 | | | | 0.39 | 4 | | | (1.31 | ) | | | (0.29 | ) | | | (1.65 | ) | | $ | 44.41 | |
Administrator Class | | | | | | | | | | | | | | | | | | | | | | | | |
Year ended May 31, 2016 | | $ | 67.80 | | | | 1.31 | | | | (0.51 | ) | | | (1.24 | ) | | | (4.03 | ) | | $ | 63.33 | |
Year ended May 31, 2015 | | $ | 62.56 | | | | 1.27 | | | | 5.90 | | | | (1.16 | ) | | | (0.77 | ) | | $ | 67.80 | |
Year ended May 31, 2014 | | $ | 54.34 | | | | 1.08 | | | | 9.66 | | | | (1.02 | ) | | | (1.50 | ) | | $ | 62.56 | |
Year ended May 31, 2013 | | $ | 44.52 | | | | 1.02 | | | | 10.71 | | | | (0.97 | ) | | | (0.94 | ) | | $ | 54.34 | |
Year ended May 31, 2012 | | $ | 47.45 | | | | 0.83 | | | | (1.32 | ) | | | (0.79 | ) | | | (1.65 | ) | | $ | 44.52 | |
| 1 | Ratios include net expenses allocated from the affiliated Master Portfolio. |
| 2 | Total return calculations do not include any sales charges. |
| 3 | Portfolio turnover rate is calculated by multiplying the Fund’s investment percentage in the affiliated Master Portfolio by the affiliated Master Portfolio’s portfolio turnover rate. |
| 4 | Calculated based upon average shares outstanding |
The accompanying notes are an integral part of these financial statements.
| | | | | | |
| Financial highlights | | Wells Fargo Equity Gateway Funds | | | 59 | |
| | | | | | | | | | | | | | | | | | | | | | |
| Ratio to average net assets (annualized) | | | Total return2 | | | Portfolio turnover rate3 | | | Net assets at end of period (000s omitted) | |
Net investment income | | | Gross expenses1 | | | Net expenses1 | | | | |
| | | | | | | | | | | | | | | | | | | | | | |
| | 1.78 | % | | | 0.63 | % | | | 0.48 | % | | | 1.24 | % | | | 4 | % | | $ | 639,496 | |
| | 1.50 | % | | | 0.68 | % | | | 0.56 | % | | | 11.21 | % | | | 4 | % | | $ | 445,088 | |
| | 1.53 | % | | | 0.67 | % | | | 0.56 | % | | | 19.77 | % | | | 5 | % | | $ | 432,448 | |
| | 1.72 | % | | | 0.67 | % | | | 0.56 | % | | | 26.63 | % | | | 4 | % | | $ | 407,533 | |
| | 1.63 | % | | | 0.68 | % | | | 0.56 | % | | | (0.95 | )% | | | 9 | % | | $ | 347,412 | |
| | | | | | | | | | | | | | | | | | | | | | |
| | 0.95 | % | | | 1.39 | % | | | 1.25 | % | | | 0.48 | % | | | 4 | % | | $ | 1,071 | |
| | 0.74 | % | | | 1.43 | % | | | 1.31 | % | | | 10.39 | % | | | 4 | % | | $ | 2,098 | |
| | 0.77 | % | | | 1.42 | % | | | 1.31 | % | | | 18.86 | % | | | 5 | % | | $ | 3,412 | |
| | 0.95 | % | | | 1.42 | % | | | 1.31 | % | | | 25.66 | % | | | 4 | % | | $ | 5,453 | |
| | 0.85 | % | | | 1.43 | % | | | 1.31 | % | | | (1.68 | )% | | | 9 | % | | $ | 8,869 | |
| | | | | | | | | | | | | | | | | | | | | | |
| | 0.99 | % | | | 1.38 | % | | | 1.24 | % | | | 0.48 | % | | | 4 | % | | $ | 79,858 | |
| | 0.75 | % | | | 1.43 | % | | | 1.31 | % | | | 10.38 | % | | | 4 | % | | $ | 83,718 | |
| | 0.78 | % | | | 1.42 | % | | | 1.31 | % | | | 18.89 | % | | | 5 | % | | $ | 78,118 | |
| | 0.97 | % | | | 1.42 | % | | | 1.31 | % | | | 25.67 | % | | | 4 | % | | $ | 70,322 | |
| | 0.87 | % | | | 1.43 | % | | | 1.31 | % | | | (1.67 | )% | | | 9 | % | | $ | 65,245 | |
| | | | | | | | | | | | | | | | | | | | | | |
| | 1.97 | % | | | 0.40 | % | | | 0.25 | % | | | 1.49 | % | | | 4 | % | | $ | 1,502,276 | |
| | 1.81 | % | | | 0.37 | % | | | 0.25 | % | | | 11.56 | % | | | 4 | % | | $ | 1,832,814 | |
| | 1.84 | % | | | 0.36 | % | | | 0.25 | % | | | 20.13 | % | | | 5 | % | | $ | 1,984,845 | |
| | 2.03 | % | | | 0.36 | % | | | 0.25 | % | | | 27.02 | % | | | 4 | % | | $ | 1,832,524 | |
| | 1.94 | % | | | 0.37 | % | | | 0.25 | % | | | (0.63 | )% | | | 9 | % | | $ | 1,682,905 | |
The accompanying notes are an integral part of these financial statements.
| | | | |
| 60 | | Wells Fargo Equity Gateway Funds | | Financial highlights |
| | | | | | | | | | | | | | | | | | | | |
| International Value Fund | | Beginning net asset value per share | | | Net investment income | | | Net realized and unrealized gains (losses) on investments | | | Distributions from net investment income | | | Ending net asset value per share | |
Class A | | | | | | | | | | | | | | | | | | | | |
Year ended May 31, 2016 | | $ | 14.85 | | | | 0.26 | | | | (2.08 | ) | | | (0.20 | ) | | $ | 12.83 | |
Year ended May 31, 2015 | | $ | 15.45 | | | | 0.26 | 4 | | | (0.53 | ) | | | (0.33 | ) | | $ | 14.85 | |
Year ended May 31, 2014 | | $ | 13.40 | | | | 0.36 | | | | 1.97 | | | | (0.28 | ) | | $ | 15.45 | |
Year ended May 31, 2013 | | $ | 10.64 | | | | 0.31 | | | | 2.71 | | | | (0.26 | ) | | $ | 13.40 | |
Year ended May 31, 2012 | | $ | 14.03 | | | | 0.34 | | | | (3.36 | ) | | | (0.37 | ) | | $ | 10.64 | |
Class C | | | | | | | | | | | | | | | | | | | | |
Year ended May 31, 2016 | | $ | 14.54 | | | | 0.17 | | | | (2.05 | ) | | | (0.10 | ) | | $ | 12.56 | |
Year ended May 31, 2015 | | $ | 15.16 | | | | 0.13 | | | | (0.51 | ) | | | (0.24 | ) | | $ | 14.54 | |
Year ended May 31, 2014 | | $ | 13.18 | | | | 0.19 | | | | 2.00 | | | | (0.21 | ) | | $ | 15.16 | |
Year ended May 31, 2013 | | $ | 10.47 | | | | 0.19 | | | | 2.70 | | | | (0.18 | ) | | $ | 13.18 | |
Year ended May 31, 2012 | | $ | 13.79 | | | | 0.23 | 4 | | | (3.28 | ) | | | (0.27 | ) | | $ | 10.47 | |
Administrator Class | | | | | | | | | | | | | | | | | | | | |
Year ended May 31, 2016 | | $ | 14.73 | | | | 0.14 | 4 | | | (1.96 | ) | | | 0.00 | | | $ | 12.91 | |
Year ended May 31, 2015 | | $ | 15.35 | | | | 0.28 | | | | (0.52 | ) | | | (0.38 | ) | | $ | 14.73 | |
Year ended May 31, 2014 | | $ | 13.31 | | | | 0.38 | | | | 1.98 | | | | (0.32 | ) | | $ | 15.35 | |
Year ended May 31, 2013 | | $ | 10.57 | | | | 0.33 | 4 | | | 2.70 | | | | (0.29 | ) | | $ | 13.31 | |
Year ended May 31, 2012 | | $ | 13.95 | | | | 0.35 | | | | (3.33 | ) | | | (0.40 | ) | | $ | 10.57 | |
Institutional Class | | | | | | | | | | | | | | | | | | | | |
Year ended May 31, 2016 | | $ | 14.75 | | | | 0.36 | | | | (2.12 | ) | | | (0.26 | ) | | $ | 12.73 | |
Year ended May 31, 2015 | | $ | 15.38 | | | | 0.29 | | | | (0.51 | ) | | | (0.41 | ) | | $ | 14.75 | |
Year ended May 31, 2014 | | $ | 13.34 | | | | 0.41 | | | | 1.98 | | | | (0.35 | ) | | $ | 15.38 | |
Year ended May 31, 2013 | | $ | 10.58 | | | | 0.35 | | | | 2.73 | | | | (0.32 | ) | | $ | 13.34 | |
Year ended May 31, 2012 | | $ | 13.98 | | | | 0.36 | | | | (3.33 | ) | | | (0.43 | ) | | $ | 10.58 | |
| 1 | Ratios include net expenses allocated from the affiliated Master Portfolio. |
| 2 | Total return calculations do not include any sales charges. |
| 3 | Portfolio turnover rate is calculated by multiplying the Fund’s investment percentage in the affiliated Master Portfolio by the affiliated Master Portfolio’s portfolio turnover rate. |
| 4 | Calculated based upon average shares outstanding |
The accompanying notes are an integral part of these financial statements.
| | | | | | |
| Financial highlights | | Wells Fargo Equity Gateway Funds | | | 61 | |
| | | | | | | | | | | | | | | | | | | | | | |
| Ratio to average net assets (annualized) | | | Total return2 | | | Portfolio turnover rate3 | | | Net assets at end of period (000s omitted) | |
Net investment income | | | Gross expenses1 | | | Net expenses1 | | | | |
| | | | | | | | | | | | | | | | | | | | | | |
| | 1.98 | % | | | 1.46 | % | | | 1.39 | % | | | (12.31 | )% | | | 14 | % | | $ | 4,981 | |
| | 1.80 | % | | | 1.50 | % | | | 1.49 | % | | | (1.55 | )% | | | 18 | % | | $ | 5,768 | |
| | 2.45 | % | | | 1.51 | % | | | 1.50 | % | | | 17.48 | % | | | 11 | % | | $ | 6,725 | |
| | 2.35 | % | | | 1.51 | % | | | 1.50 | % | | | 28.58 | % | | | 16 | % | | $ | 5,922 | |
| | 2.81 | % | | | 1.46 | % | | | 1.46 | % | | | (21.53 | )% | | | 9 | % | | $ | 4,742 | |
| | | | | | | | | | | | | | | | | | | | | | |
| | 1.25 | % | | | 2.21 | % | | | 2.14 | % | | | (12.95 | )% | | | 14 | % | | $ | 783 | |
| | 1.07 | % | | | 2.25 | % | | | 2.24 | % | | | (2.37 | )% | | | 18 | % | | $ | 920 | |
| | 1.88 | % | | | 2.26 | % | | | 2.25 | % | | | 16.64 | % | | | 11 | % | | $ | 920 | |
| | 1.67 | % | | | 2.26 | % | | | 2.25 | % | | | 27.67 | % | | | 16 | % | | $ | 595 | |
| | 1.96 | % | | | 2.21 | % | | | 2.21 | % | | | (22.14 | )% | | | 9 | % | | $ | 441 | |
| | | | | | | | | | | | | | | | | | | | | | |
| | 0.99 | % | | | 1.36 | % | | | 1.25 | % | | | (12.36 | )% | | | 14 | % | | $ | 11,873 | |
| | 2.12 | % | | | 1.34 | % | | | 1.25 | % | | | (1.35 | )% | | | 18 | % | | $ | 487,582 | |
| | 2.76 | % | | | 1.34 | % | | | 1.25 | % | | | 17.81 | % | | | 11 | % | | $ | 459,415 | |
| | 2.67 | % | | | 1.34 | % | | | 1.25 | % | | | 28.90 | % | | | 16 | % | | $ | 372,187 | |
| | 3.04 | % | | | 1.29 | % | | | 1.25 | % | | | (21.37 | )% | | | 9 | % | | $ | 259,969 | |
| | | | | | | | | | | | | | | | | | | | | | |
| | 2.81 | % | | | 1.13 | % | | | 1.01 | % | | | (11.98 | )% | | | 14 | % | | $ | 456,239 | |
| | 2.42 | % | | | 1.07 | % | | | 1.05 | % | | | (1.19 | )% | | | 18 | % | | $ | 3,793 | |
| | 2.91 | % | | | 1.08 | % | | | 1.05 | % | | | 18.07 | % | | | 11 | % | | $ | 2,359 | |
| | 2.81 | % | | | 1.08 | % | | | 1.05 | % | | | 29.20 | % | | | 16 | % | | $ | 1,941 | |
| | 3.20 | % | | | 1.03 | % | | | 1.03 | % | | | (21.26 | )% | | | 9 | % | | $ | 1,505 | |
The accompanying notes are an integral part of these financial statements.
| | | | |
| 62 | | Wells Fargo Equity Gateway Funds | | Financial highlights |
| | | | | | | | | | | | | | | | | | | | | | | | |
| Small Company Growth Fund | | Beginning net asset value per share | | | Net investment loss | | | Net realized and unrealized gains (losses) on investments | | | Distributions from net investment income | | | Distributions from net realized gains | | | Ending net asset value per share | |
Class A | | | | | | | | | | | | | | | | | | | | | | | | |
Year ended May 31, 2016 | | $ | 44.23 | | | | (0.22 | )4 | | | (6.05 | ) | | | 0.00 | | | | (0.27 | ) | | $ | 37.69 | |
Year ended May 31, 2015 | | $ | 39.44 | | | | (0.37 | )4 | | | 7.08 | | | | 0.00 | | | | (1.92 | ) | | $ | 44.23 | |
Year ended May 31, 2014 | | $ | 34.23 | | | | (0.37 | )4 | | | 7.98 | | | | 0.00 | | | | (2.40 | ) | | $ | 39.44 | |
Year ended May 31, 2013 | | $ | 26.21 | | | | (0.15 | ) | | | 8.17 | | | | 0.00 | | | | 0.00 | | | $ | 34.23 | |
Year ended May 31, 2012 | | $ | 29.53 | | | | (0.18 | )4 | | | (3.14 | ) | | | 0.00 | | | | 0.00 | | | $ | 26.21 | |
Class B | | | | | | | | | | | | | | | | | | | | | | | | |
Year ended May 31, 2016 | | $ | 39.74 | | | | (0.50 | )4 | | | (5.38 | ) | | | 0.00 | | | | (0.27 | ) | | $ | 33.59 | |
Year ended May 31, 2015 | | $ | 35.88 | | | | (0.62 | )4 | | | 6.40 | | | | 0.00 | | | | (1.92 | ) | | $ | 39.74 | |
Year ended May 31, 2014 | | $ | 31.55 | | | | (0.60 | )4 | | | 7.33 | | | | 0.00 | | | | (2.40 | ) | | $ | 35.88 | |
Year ended May 31, 2013 | | $ | 24.35 | | | | (0.36 | )4 | | | 7.56 | | | | 0.00 | | | | 0.00 | | | $ | 31.55 | |
Year ended May 31, 2012 | | $ | 27.63 | | | | (0.37 | )4 | | | (2.91 | ) | | | 0.00 | | | | 0.00 | | | $ | 24.35 | |
Class C | | | | | | | | | | | | | | | | | | | | | | | | |
Year ended May 31, 2016 | | $ | 40.25 | | | | (0.46 | )4 | | | (5.50 | ) | | | 0.00 | | | | (0.27 | ) | | $ | 34.02 | |
Year ended May 31, 2015 | | $ | 36.32 | | | | (0.63 | )4 | | | 6.48 | | | | 0.00 | | | | (1.92 | ) | | $ | 40.25 | |
Year ended May 31, 2014 | | $ | 31.91 | | | | (0.62 | )4 | | | 7.43 | | | | 0.00 | | | | (2.40 | ) | | $ | 36.32 | |
Year ended May 31, 2013 | | $ | 24.62 | | | | (0.37 | )4 | | | 7.66 | | | | 0.00 | | | | 0.00 | | | $ | 31.91 | |
Year ended May 31, 2012 | | $ | 27.95 | | | | (0.36 | )4 | | | (2.97 | ) | | | 0.00 | | | | 0.00 | | | $ | 24.62 | |
Class R6 | | | | | | | | | | | | | | | | | | | | | | | | |
Year ended May 31, 2016 | | $ | 46.45 | | | | (0.03 | ) | | | (6.38 | ) | | | 0.00 | | | | (0.27 | ) | | $ | 39.77 | |
Year ended May 31, 20155 | | $ | 42.98 | | | | (0.09 | )4 | | | 5.48 | | | | 0.00 | | | | (1.92 | ) | | $ | 46.45 | |
Administrator Class | | | | | | | | | | | | | | | | | | | | | | | | |
Year ended May 31, 2016 | | $ | 45.73 | | | | (0.19 | )4 | | | (6.22 | ) | | | 0.00 | | | | (0.27 | ) | | $ | 39.05 | |
Year ended May 31, 2015 | | $ | 40.64 | | | | (0.30 | )4 | | | 7.31 | | | | 0.00 | | | | (1.92 | ) | | $ | 45.73 | |
Year ended May 31, 2014 | | $ | 35.13 | | | | (0.26 | ) | | | 8.17 | | | | 0.00 | | | | (2.40 | ) | | $ | 40.64 | |
Year ended May 31, 2013 | | $ | 26.90 | | | | (0.09 | )4 | | | 8.38 | | | | (0.06 | ) | | | 0.00 | | | $ | 35.13 | |
Year ended May 31, 2012 | | $ | 30.22 | | | | (0.13 | )4 | | | (3.19 | ) | | | 0.00 | | | | 0.00 | | | $ | 26.90 | |
Institutional Class | | | | | | | | | | | | | | | | | | | | | | | | |
Year ended May 31, 2016 | | $ | 46.44 | | | | (0.09 | ) | | | (6.33 | ) | | | 0.00 | | | | (0.27 | ) | | $ | 39.75 | |
Year ended May 31, 2015 | | $ | 41.14 | | | | (0.20 | )4 | | | 7.42 | | | | 0.00 | | | | (1.92 | ) | | $ | 46.44 | |
Year ended May 31, 2014 | | $ | 35.46 | | | | (0.20 | )4 | | | 8.28 | | | | 0.00 | | | | (2.40 | ) | | $ | 41.14 | |
Year ended May 31, 2013 | | $ | 27.15 | | | | (0.06 | )4 | | | 8.51 | | | | (0.14 | ) | | | 0.00 | | | $ | 35.46 | |
Year ended May 31, 2012 | | $ | 30.44 | | | | (0.07 | )4 | | | (3.22 | ) | | | 0.00 | | | | 0.00 | | | $ | 27.15 | |
| 1 | Ratios include net expenses allocated from the affiliated Master Portfolio. |
| 2 | Total return calculations do not include any sales charges. Returns for periods of less than one year are not annualized. |
| 3 | Portfolio turnover rate is calculated by multiplying the Fund’s investment percentage in the affiliated Master Portfolio by the affiliated Master Portfolio’s portfolio turnover rate. |
| 4 | Calculated based upon average shares outstanding |
| 5 | For the period from October 31, 2014 (commencement of class operations) to May 31, 2015 |
The accompanying notes are an integral part of these financial statements.
| | | | | | |
| Financial highlights | | Wells Fargo Equity Gateway Funds | | | 63 | |
| | | | | | | | | | | | | | | | | | | | | | |
| Ratio to average net assets (annualized) | | | Total return2 | | | Portfolio turnover rate3 | | | Net assets at end of period (000s omitted) | |
Net investment income | | | Gross expenses1 | | | Net expenses1 | | | | |
| | | | | | | | | | | | | | | | | | | | | | |
| | (0.57 | )% | | | 1.34 | % | | | 1.34 | % | | | (14.20 | )% | | | 49 | % | | $ | 128,675 | |
| | (0.90 | )% | | | 1.41 | % | | | 1.40 | % | | | 17.51 | % | | | 58 | % | | $ | 85,588 | |
| | (0.96 | )% | | | 1.45 | % | | | 1.41 | % | | | 22.63 | % | | | 77 | % | | $ | 30,364 | |
| | (0.58 | )% | | | 1.53 | % | | | 1.45 | % | | | 30.55 | % | | | 109 | % | | $ | 9,357 | |
| | (0.70 | )% | | | 1.46 | % | | | 1.44 | % | | | (11.18 | )% | | | 107 | % | | $ | 6,450 | |
| | | | | | | | | | | | | | | | | | | | | | |
| | (1.38 | )% | | | 2.08 | % | | | 2.08 | % | | | (14.83 | )% | | | 49 | % | | $ | 17 | |
| | (1.65 | )% | | | 2.15 | % | | | 2.15 | % | | | 16.63 | % | | | 58 | % | | $ | 76 | |
| | (1.71 | )% | | | 2.20 | % | | | 2.16 | % | | | 21.74 | % | | | 77 | % | | $ | 101 | |
| | (1.33 | )% | | | 2.28 | % | | | 2.20 | % | | | 29.57 | % | | | 109 | % | | $ | 164 | |
| | (1.48 | )% | | | 2.21 | % | | | 2.19 | % | | | (11.87 | )% | | | 107 | % | | $ | 193 | |
| | | | | | | | | | | | | | | | | | | | | | |
| | (1.32 | )% | | | 2.09 | % | | | 2.09 | % | | | (14.84 | )% | | | 49 | % | | $ | 26,946 | |
| | (1.64 | )% | | | 2.16 | % | | | 2.15 | % | | | 16.62 | % | | | 58 | % | | $ | 17,334 | |
| | (1.71 | )% | | | 2.20 | % | | | 2.16 | % | | | 21.75 | % | | | 77 | % | | $ | 6,546 | |
| | (1.31 | )% | | | 2.28 | % | | | 2.20 | % | | | 29.56 | % | | | 109 | % | | $ | 2,406 | |
| | (1.45 | )% | | | 2.22 | % | | | 2.19 | % | | | (11.85 | )% | | | 107 | % | | $ | 1,628 | |
| | | | | | | | | | | | | | | | | | | | | | |
| | (0.09 | )% | | | 0.91 | % | | | 0.90 | % | | | (13.83 | )% | | | 49 | % | | $ | 229,391 | |
| | (0.34 | )% | | | 0.91 | % | | | 0.90 | % | | | 13.00 | % | | | 58 | % | | $ | 644 | |
| | | | | | | | | | | | | | | | | | | | | | |
| | (0.46 | )% | | | 1.25 | % | | | 1.20 | % | | | (14.04 | )% | | | 49 | % | | $ | 130,104 | |
| | (0.70 | )% | | | 1.24 | % | | | 1.20 | % | | | 17.73 | % | | | 58 | % | | $ | 185,267 | |
| | (0.74 | )% | | | 1.29 | % | | | 1.20 | % | | | 22.92 | % | | | 77 | % | | $ | 118,456 | |
| | (0.30 | )% | | | 1.37 | % | | | 1.20 | % | | | 30.89 | % | | | 109 | % | | $ | 98,445 | |
| | (0.48 | )% | | | 1.30 | % | | | 1.20 | % | | | (10.99 | )% | | | 107 | % | | $ | 97,776 | |
| | | | | | | | | | | | | | | | | | | | | | |
| | (0.18 | )% | | | 1.01 | % | | | 0.95 | % | | | (13.85 | )% | | | 49 | % | | $ | 678,699 | |
| | (0.45 | )% | | | 0.98 | % | | | 0.95 | % | | | 18.03 | % | | | 58 | % | | $ | 457,542 | |
| | (0.49 | )% | | | 1.02 | % | | | 0.95 | % | | | 23.19 | % | | | 77 | % | | $ | 186,581 | |
| | (0.19 | )% | | | 1.10 | % | | | 0.95 | % | | | 31.25 | % | | | 109 | % | | $ | 71,336 | |
| | (0.27 | )% | | | 1.03 | % | | | 0.95 | % | | | (10.78 | )% | | | 107 | % | | $ | 9,692 | |
The accompanying notes are an integral part of these financial statements.
| | | | |
| 64 | | Wells Fargo Equity Gateway Funds | | Financial highlights |
| | | | | | | | | | | | | | | | | | | | |
| Small Company Value Fund | | Beginning
net asset
value per
share | | | Net
investment
income (loss) | | | Net realized
and unrealized
gains (losses)
on investments | | | Distributions
from net
investment
income | | | Ending
net asset
value per
share | |
Class A | | | | | | | | | | | | | | | | | | | | |
Year ended May 31, 2016 | | $ | 21.42 | | | | 0.08 | | | | (1.25 | ) | | | (0.03 | ) | | $ | 20.22 | |
Year ended May 31, 2015 | | $ | 20.08 | | | | 0.07 | | | | 1.27 | | | | 0.00 | | | $ | 21.42 | |
Year ended May 31, 2014 | | $ | 17.10 | | | | 0.06 | | | | 2.92 | | | | 0.00 | | | $ | 20.08 | |
Year ended May 31, 2013 | | $ | 13.17 | | | | (0.00 | )4 | | | 3.93 | | | | 0.00 | | | $ | 17.10 | |
Year ended May 31, 2012 | | $ | 14.36 | | | | 0.03 | | | | (1.11 | ) | | | (0.11 | ) | | $ | 13.17 | |
Class C | | | | | | | | | | | | | | | | | | | | |
Year ended May 31, 2016 | | $ | 19.34 | | | | (0.11 | )5 | | | (1.08 | ) | | | 0.00 | | | $ | 18.15 | |
Year ended May 31, 2015 | | $ | 18.27 | | | | (0.08 | )5 | | | 1.15 | | | | 0.00 | | | $ | 19.34 | |
Year ended May 31, 2014 | | $ | 15.68 | | | | (0.07 | )5 | | | 2.66 | | | | 0.00 | | | $ | 18.27 | |
Year ended May 31, 2013 | | $ | 12.16 | | | | (0.10 | )5 | | | 3.62 | | | | 0.00 | | | $ | 15.68 | |
Year ended May 31, 2012 | | $ | 13.30 | | | | (0.08 | )5 | | | (1.02 | ) | | | (0.04 | ) | | $ | 12.16 | |
Administrator Class | | | | | | | | | | | | | | | | | | | | |
Year ended May 31, 2016 | | $ | 21.90 | | | | 0.13 | | | | (1.30 | ) | | | (0.07 | ) | | $ | 20.66 | |
Year ended May 31, 2015 | | $ | 20.49 | | | | 0.11 | | | | 1.30 | | | | 0.00 | | | $ | 21.90 | |
Year ended May 31, 2014 | | $ | 17.42 | | | | 0.12 | | | | 2.95 | | | | 0.00 | | | $ | 20.49 | |
Year ended May 31, 2013 | | $ | 13.39 | | | | 0.03 | 5 | | | 4.01 | | | | (0.01 | ) | | $ | 17.42 | |
Year ended May 31, 2012 | | $ | 14.60 | | | | 0.06 | | | | (1.13 | ) | | | (0.14 | ) | | $ | 13.39 | |
Institutional Class | | | | | | | | | | | | | | | | | | | | |
Year ended May 31, 2016 | | $ | 22.02 | | | | 0.08 | 5 | | | (1.22 | ) | | | (0.11 | ) | | $ | 20.77 | |
Year ended May 31, 2015 | | $ | 20.57 | | | | 0.14 | | | | 1.31 | | | | 0.00 | | | $ | 22.02 | |
Year ended May 31, 2014 | | $ | 17.45 | | | | 0.13 | | | | 2.99 | | | | 0.00 | | | $ | 20.57 | |
Year ended May 31, 2013 | | $ | 13.41 | | | | 0.06 | 5 | | | 4.03 | | | | (0.05 | ) | | $ | 17.45 | |
Year ended May 31, 2012 | | $ | 14.63 | | | | 0.11 | | | | (1.17 | ) | | | (0.16 | ) | | $ | 13.41 | |
| 1 | Ratios include net expenses allocated from the affiliated Master Portfolio. |
| 2 | Total return calculations do not include any sales charges. |
| 3 | Portfolio turnover rate is calculated by multiplying the Fund’s investment percentage in the affiliated Master Portfolio by the affiliated Master Portfolio’s portfolio turnover rate. |
| 4 | Amount is less than $0.005. |
| 5 | Calculated based upon average shares outstanding |
The accompanying notes are an integral part of these financial statements.
| | | | | | |
| Financial highlights | | Wells Fargo Equity Gateway Funds | | | 65 | |
| | | | | | | | | | | | | | | | | | | | | | |
| Ratio to average net assets (annualized) | | | Total
return2 | | | Portfolio
turnover
rate3 | | | Net assets at
end of period
(000s omitted) | |
Net investment
income (loss) | | | Gross
expenses1 | | | Net
expenses1 | | | | |
| | | | | | | | | | | | | | | | | | | | | | |
| | 0.11 | % | | | 1.48 | % | | | 1.37 | % | | | (5.48 | )% | | | 72 | % | | $ | 23,151 | |
| | 0.33 | % | | | 1.50 | % | | | 1.40 | % | | | 6.62 | % | | | 54 | % | | $ | 26,339 | |
| | 0.33 | % | | | 1.56 | % | | | 1.42 | % | | | 17.43 | % | | | 47 | % | | $ | 26,517 | |
| | (0.02 | )% | | | 1.57 | % | | | 1.45 | % | | | 29.84 | % | | | 57 | % | | $ | 21,652 | |
| | 0.08 | % | | | 1.50 | % | | | 1.45 | % | | | (7.44 | )% | | | 60 | % | | $ | 18,605 | |
| | | | | | | | | | | | | | | | | | | | | | |
| | (0.62 | )% | | | 2.23 | % | | | 2.12 | % | | | (6.20 | )% | | | 72 | % | | $ | 2,004 | |
| | (0.42 | )% | | | 2.26 | % | | | 2.15 | % | | | 5.86 | % | | | 54 | % | | $ | 2,602 | |
| | (0.42 | )% | | | 2.31 | % | | | 2.17 | % | | | 16.52 | % | | | 47 | % | | $ | 2,192 | |
| | (0.76 | )% | | | 2.32 | % | | | 2.20 | % | | | 28.95 | % | | | 57 | % | | $ | 1,814 | |
| | (0.68 | )% | | | 2.25 | % | | | 2.20 | % | | | (8.20 | )% | | | 60 | % | | $ | 1,557 | |
| | | | | | | | | | | | | | | | | | | | | | |
| | 0.28 | % | | | 1.39 | % | | | 1.20 | % | | | (5.36 | )% | | | 72 | % | | $ | 64,023 | |
| | 0.52 | % | | | 1.34 | % | | | 1.20 | % | | | 6.88 | % | | | 54 | % | | $ | 71,034 | |
| | 0.55 | % | | | 1.39 | % | | | 1.20 | % | | | 17.62 | % | | | 47 | % | | $ | 68,358 | |
| | 0.23 | % | | | 1.40 | % | | | 1.20 | % | | | 30.21 | % | | | 57 | % | | $ | 60,550 | |
| | 0.32 | % | | | 1.33 | % | | | 1.20 | % | | | (7.24 | )% | | | 60 | % | | $ | 60,333 | |
| | | | | | | | | | | | | | | | | | | | | | |
| | 0.40 | % | | | 1.14 | % | | | 1.00 | % | | | (5.13 | )% | | | 72 | % | | $ | 31,768 | |
| | 0.75 | % | | | 1.07 | % | | | 1.00 | % | | | 7.05 | % | | | 54 | % | | $ | 16,850 | |
| | 0.75 | % | | | 1.13 | % | | | 1.00 | % | | | 17.88 | % | | | 47 | % | | $ | 11,967 | |
| | 0.40 | % | | | 1.14 | % | | | 1.00 | % | | | 30.54 | % | | | 57 | % | | $ | 8,185 | |
| | 0.59 | % | | | 1.05 | % | | | 1.00 | % | | | (7.14 | )% | | | 60 | % | | $ | 62 | |
The accompanying notes are an integral part of these financial statements.
| | | | |
| 66 | | Wells Fargo Equity Gateway Funds | | Notes to financial statements |
1. ORGANIZATION
Wells Fargo Funds Trust (the “Trust”), a Delaware statutory trust organized on March 10, 1999, is an open-end management investment company registered under the Investment Company Act of 1940, as amended (the “1940 Act”). As an investment company, the Trust follows the accounting and reporting guidance in Financial Accounting Standards Board (“FASB”) Accounting Standards Codification Topic 946, Financial Services – Investment Companies. These financial statements report on the following funds: Wells Fargo C&B Large Cap Value Fund (“C&B Large Cap Value Fund”), Wells Fargo Diversified Equity Fund (“Diversified Equity Fund“), Wells Fargo Emerging Growth Fund (“Emerging Growth Fund”), Wells Fargo Index Fund (“Index Fund”), Wells Fargo International Value Fund (“International Value Fund”), Wells Fargo Small Company Growth Fund (“Small Company Growth Fund”), and Wells Fargo Small Company Value Fund (“Small Company Value Fund”) (each, a “Fund”, collectively, the “Funds”). Each Fund is a diversified series of the Trust.
After the close of business on October 23, 2015, Investor Class shares became Class A shares in a tax-free conversion. Shareholders of Investor Class in the applicable Funds received Class A shares at a value equal to the value of their Investor Class shares immediately prior to the conversion. Investor Class shares are no longer offered by the applicable Funds.
Each Fund seeks to achieve its investment objective by investing all investable assets in separate diversified portfolios (each, an “affiliated Master Portfolio”, collectively, the “affiliated Master Portfolios”) of Wells Fargo Master Trust, a registered open-end management investment company. Each affiliated Master Portfolio directly acquires portfolio securities, and a Fund investing in an affiliated Master Portfolio acquires an indirect interest in those securities. Each Fund accounts for its investment in the affiliated Master Portfolios as partnership investments and records on a daily basis its share of the affiliated Master Portfolio’s income, expense and realized and unrealized gains and losses. The financial statements of the affiliated Master Portfolios for the year ended May 31, 2016 are included in this report and should be read in conjunction with each Fund’s financial statements. As of May 31, 2016, the Funds own the following percentages of the affiliated Master Portfolios:
| | | | | | | | | | | | | | | | | | | | | | | | | | | | |
| | | C&B Large Cap Value Fund | | | Diversified Equity Fund | | | Emerging Growth Fund | | | Index Fund | | | International Value Fund | | | Small Company Growth Fund | | | Small Company Value Fund | |
Wells Fargo C&B Large Cap Value Portfolio | | | 86 | % | | | 6 | % | | | N/A | | | | N/A | | | | N/A | | | | N/A | | | | N/A | |
Wells Fargo Diversified Large Cap Growth Portfolio | | | N/A | | | | 46 | % | | | N/A | | | | N/A | | | | N/A | | | | N/A | | | | N/A | |
Wells Fargo Emerging Growth Portfolio | | | N/A | | | | 1 | % | | | 91 | % | | | N/A | | | | N/A | | | | N/A | | | | N/A | |
Wells Fargo Index Portfolio | | | N/A | | | | 2 | % | | | N/A | | | | 95 | % | | | N/A | | | | N/A | | | | N/A | |
Wells Fargo International Growth Portfolio | | | N/A | | | | 11 | % | | | N/A | | | | N/A | | | | N/A | | | | N/A | | | | N/A | |
Wells Fargo International Value Portfolio | | | N/A | | | | 3 | % | | | N/A | | | | N/A | | | | 93 | % | | | N/A | | | | N/A | |
Wells Fargo Large Company Value Portfolio | | | N/A | | | | 45 | % | | | N/A | | | | N/A | | | | N/A | | | | N/A | | | | N/A | |
Wells Fargo Small Company Growth Portfolio | | | N/A | | | | 0 | %* | | | N/A | | | | N/A | | | | N/A | | | | 99 | % | | | N/A | |
Wells Fargo Small Company Value Portfolio | | | N/A | | | | 5 | % | | | N/A | | | | N/A | | | | N/A | | | | N/A | | | | 56 | % |
| * | The amount owned is less than 1%. |
2. SIGNIFICANT ACCOUNTING POLICIES
The following significant accounting policies, which are consistently followed in the preparation of the financial statements of each Fund, are in conformity with U.S. generally accepted accounting principles which require management to make estimates and assumptions that affect the reported amounts of assets and liabilities, disclosure of contingent assets and liabilities at the date of the financial statements, and the reported amounts of revenues and expenses during the reporting period. Actual results could differ from those estimates.
| | | | | | |
| Notes to financial statements | | Wells Fargo Equity Gateway Funds | | | 67 | |
Securities valuation
All investments are valued each business day as of the close of regular trading on the New York Stock Exchange (generally 4 p.m. Eastern Time), although a Fund may deviate from this calculation time under unusual or unexpected circumstances.
Investments in the affiliated Master Portfolios are valued daily based on each Fund’s proportionate share of each affiliated Master Portfolio’s net assets, which are also valued daily. Securities held in the affiliated Master Portfolios are valued as discussed in the Notes to Financial Statements of the affiliated Master Portfolios, which are included elsewhere in this report.
Security transactions and income recognition
Securities transactions are recorded on a trade date basis in each affiliated Master Portfolio. Realized gains or losses in each affiliated Master Portfolio are recorded on the basis of identified cost.
Dividend income in each affiliated Master Portfolio is recognized on the ex-dividend date, except for certain dividends from foreign securities which are recorded as soon as the custodian verifies the ex-dividend date. Dividend income from foreign securities in each affiliated Master Portfolio is recorded net of foreign taxes withheld where recovery of such taxes is not assured.
Interest income is accrued daily and bond discounts are accreted and premiums are amortized daily based on the effective interest method by each affiliated Master Portfolio. To the extent debt obligations are placed on non-accrual status, any related interest income may be reduced by writing off interest receivables when the collection of all or a portion of interest has become doubtful based on consistently applied procedures. If the issuer subsequently resumes interest payments or when the collectability of interest is reasonably assured, the debt obligation is removed from non-accrual status.
Each Fund records daily its proportionate share of each affiliated Master Portfolio’s interest and dividend income and realized and unrealized gains or losses.
Distributions to shareholders
Distributions to shareholders from net investment income and net realized gains, if any, are recorded on the ex-dividend date. Such distributions are determined in conformity with federal income tax regulations, which may differ in amount or character from net investment income and realized gains recognized for purposes of U.S. generally accepted accounting principles.
Federal and other taxes
Each Fund is treated as a separate entity for federal income tax purposes. Each Fund intends to continue to qualify as a regulated investment company by distributing substantially all of its investment company taxable income and any net realized capital gains (after reduction for capital loss carryforwards) sufficient to relieve it from all, or substantially all, federal income taxes. Accordingly, no provision for federal income taxes was required.
Each Fund’s income and federal excise tax returns and all financial records supporting those returns for the prior three fiscal years are subject to examination by the federal and Delaware revenue authorities. Management has analyzed each Fund’s tax positions taken on federal, state, and foreign tax returns for all open tax years and does not believe that there are any uncertain tax positions that require recognition of a tax liability.
Reclassifications are made to each Fund’s capital accounts for permanent tax differences to reflect income and gains available for distribution (or available capital loss carryforwards) under federal income tax regulations. U.S. generally accepted accounting principles require that certain components of net assets be adjusted to reflect permanent differences between financial and tax reporting. These reclassifications have no effect on net assets or net asset values per share. At May 31, 2016, as a result of permanent book-to-tax differences, the following reclassification adjustments were made on the Statements of Assets and Liabilities:
| | | | | | | | | | | | |
| | | Paid-in capital | | | Undistributed
(accumulated) net investment
income (loss) | | | Accumulated net realized gains (losses) on investments | |
C&B Large Cap Value Fund | | $ | 186,439 | | | $ | (203,081 | ) | | $ | 16,642 | |
Diversified Equity Fund | | | 273,389 | | | | (198,293 | ) | | | (75,096 | ) |
Emerging Growth Fund | | | (8,081,671 | ) | | | 8,038,434 | | | | 43,237 | |
Index Fund | | | 0 | | | | (1,408,012 | ) | | | 1,408,012 | |
International Value Fund | | | 0 | | | | (615,063 | ) | | | 615,063 | |
Small Company Growth Fund | | | 7,479,778 | | | | 3,290,843 | | | | (10,770,621 | ) |
Small Company Value Fund | | | (43,798 | ) | | | 10,609 | | | | 33,189 | |
| | | | |
| 68 | | Wells Fargo Equity Gateway Funds | | Notes to financial statements |
At May 31, 2016, capital loss carryforwards available to offset future net realized capital gains were as follows through the indicated expiration dates:
| | | | | | | | | | | | | | | | | | | | |
| | | 2017 | | | 2018 | | | 2019 | | | No expiration | |
| | | | | Short-term | | | Long-term | |
International Value Fund | | $ | 0 | | | $ | 31,783,032 | | | $ | 4,561,591 | | | $ | 0 | | | $ | 19,415 | |
Small Company Growth Fund | | | 546,818 | | | | 0 | | | | 0 | | | | 58,698,280 | | | | 28,260,757 | |
Small Company Value Fund | | | 0 | | | | 75,262,378 | | | | 0 | | | | 0 | | | | 0 | |
At May 31, 2016, current year deferred post-October capital losses and late-year ordinary losses, which will be recognized on the first day of the following fiscal year were as follows:
| | | | | | | | |
| | | Deferred post-October
capital losses | | | Late-year
ordinary losses
deferred | |
Emerging Growth Fund | | $ | 11,871,337 | | | $ | 1,370,106 | |
International Value Fund | | | 779,929 | | | | 0 | |
Small Company Growth Fund | | | 0 | | | | 615,614 | |
Small Company Value Fund | | | 614,168 | | | | 0 | |
Class allocations
The separate classes of shares offered by each Fund differ principally in applicable sales charges, distribution, shareholder servicing, and administration fees. Class specific expenses are charged directly to that share class. Investment income, common expenses, and realized and unrealized gains (losses) on investments are allocated daily to each class of shares based on the relative proportion of net assets of each class.
3. FAIR VALUATION MEASUREMENTS
At May 31, 2016, each affiliated Master Portfolio of each Fund was measured at fair value using the net asset value per share (or its equivalent) as a practical expedient. The aggregate value of affiliated Master Portfolio(s) of each Fund was as follows:
| | | | |
| | | Aggregate value of
affiliated Master
Portfolio(s) | |
C&B Large Cap Value Fund | | $ | 252,625,889 | |
Diversified Equity Fund | | | 211,533,274 | |
Emerging Growth Fund | | | 815,110,887 | |
Index Fund | | | 2,224,794,535 | |
International Value Fund | | | 473,721,935 | |
Small Company Growth Fund | | | 1,183,630,838 | |
Small Company Value Fund | | | 121,259,745 | |
The investment objective of each affiliated Master Portfolio is as follows:
| | |
| Affiliated Master Portfolio | | Investment objective |
Wells Fargo C&B Large Cap Value Portfolio | | Seeks maximum long-term total return (current income and capital appreciation), consistent with minimizing risk to principal |
Wells Fargo Diversified Large Cap Growth Portfolio | | Seeks long-term capital appreciation |
Wells Fargo Emerging Growth Portfolio | | Seeks long-term capital appreciation |
Wells Fargo Index Portfolio | | Seeks to replicate the total return of the S&P 500 Index, before expenses |
Wells Fargo International Growth Portfolio | | Seeks long-term capital appreciation |
Wells Fargo International Value Portfolio | | Seeks long-term capital appreciation |
Wells Fargo Large Company Value Portfolio | | Seeks long-term capital appreciation |
Wells Fargo Small Company Growth Portfolio | | Seeks long-term capital appreciation |
Wells Fargo Small Company Value Portfolio | | Seeks long-term capital appreciation |
| | | | | | |
| Notes to financial statements | | Wells Fargo Equity Gateway Funds | | | 69 | |
Each affiliated Master Portfolio does not have a redemption period notice, can be redeemed daily and does not have any unfunded commitments.
4. TRANSACTIONS WITH AFFILIATES
Management fee
Wells Fargo Funds Management, LLC (“Funds Management”), an indirect wholly owned subsidiary of Wells Fargo & Company (“Wells Fargo”), is the manager of each Fund. Under the investment management agreement, Funds Management is responsible for, among other services, implementing the investment objectives and strategies of each Fund, supervising the applicable subadviser(s), providing fund-level administrative services in connection with each Fund’s operations, and providing any other fund-level administrative services reasonably necessary for the operation of each Fund. For each Fund that continues to invest substantially all of its assets in a single affiliated Master Portfolio, each Fund pays Funds Management an investment management fee only for fund-level administrative services at an annual rate starting at 0.05% and declining to 0.03% as the average daily net assets of each Fund increase. For Diversified Equity Fund which invests in multiple affiliated Master Portfolios, Funds Management receives a management fee for providing advisory and fund-level administrative services, including the determination of the asset allocations of its investments in the various affiliated Master Portfolios, at an annual rate starting at 0.30% and declining to 0.22% as the average daily net assets of Diversified Equity Fund increase.
Prior to July 1, 2015, Funds Management provided advisory services pursuant to an investment advisory agreement for Diversified Equity Fund at an annual rate which started at 0.25% and declined to 0.19% as the average daily net assets of Diversified Equity Fund increased. For each Fund that invested all of its assets in a single affiliated Master Portfolio prior to July 1, 2015, Funds Management did not receive an advisory fee. Fund-level administrative services were provided to each Fund by Funds Management under a separate administration agreement at an annual fee which started at 0.05% and declined to 0.03% as the average daily net assets of each Fund increased. For financial statement purposes, the advisory fee and fund-level administration fee for the year ended May 31, 2016 have been included in management fee on the Statements of Operations.
For the year ended May 31, 2016, the management fee was equivalent to an annual rate for each Fund as follows:
| | | | |
| | | Management fee | |
C&B Large Cap Value Fund | | | 0.05 | % |
Diversified Equity Fund | | | 0.30 | |
Emerging Growth Fund | | | 0.05 | |
Index Fund | | | 0.05 | |
International Value Fund | | | 0.05 | |
Small Company Growth Fund | | | 0.05 | |
Small Company Value Fund | | | 0.05 | |
Funds Management also serves as the adviser to each affiliated Master Portfolio and is entitled to receive a fee from each affiliated Master Portfolio for those services.
Administration fees
Under a class-level administration agreement, Funds Management provides class-level administrative services to the Fund, which includes paying fees and expenses for services provided by the transfer agent, sub-transfer agents, omnibus account servicers and record-keepers. As compensation for its services under the class-level administration agreement, Funds Management receives an annual fee which is calculated based on the average daily net assets of each class as follows:
| | | | | | | | |
| | | Class-level administration fee | |
| | | Current rate | | | Rate prior to
July 1, 2015 | |
Class A, Class B, Class C | | | 0.21 | % | | | 0.26 | % |
Class R6 | | | 0.03 | | | | 0.03 | |
Administrator Class | | | 0.13 | | | | 0.10 | |
Institutional Class | | | 0.13 | | | | 0.08 | |
Investor Class | | | 0.32 | | | | 0.32 | |
| | | | |
| 70 | | Wells Fargo Equity Gateway Funds | | Notes to financial statements |
Funds Management has contractually waived and/or reimbursed management and administration fees to the extent necessary to maintain certain net operating expense ratios for the Funds. Waiver of fees and/or reimbursement of expenses by Funds Management were made first from fund level expenses on a proportionate basis and then from class specific expenses. Funds Management has committed to waive fees and/or reimburse expenses to the extent necessary to cap each Fund’s expenses as follows:
| | | | | | | | | | | | | | | | | | | | | | | | | | |
| | | Expiration date | | Class A | | | Class B | | | Class C | | | Class R6 | | | Administrator
Class | | | Institutional
Class | |
C&B Large Cap Value Fund | | September 30, 2016 | | | 1.15 | % | | | 1.90 | % | | | 1.90 | % | | | N/A | | | | 1.00 | % | | | 0.80 | % |
Diversified Equity Fund | | September 30, 2016 | | | 1.25 | | | | 2.00 | | | | 2.00 | | | | N/A | | | | 1.00 | | | | N/A | |
Emerging Growth Fund | | September 30, 2016 | | | 1.35 | | | | N/A | | | | 2.10 | | | | N/A | | | | 1.20 | | | | 0.90 | |
Index Fund | | September 30, 2017 | | | 0.45 | | | | 1.20 | | | | 1.20 | | | | N/A | | | | 0.25 | * | | | N/A | |
International Value Fund | | September 30, 2016 | | | 1.35 | | | | N/A | | | | 2.10 | | | | N/A | | | | 1.25 | | | | 1.00 | |
Small Company Growth Fund | | September 30, 2016 | | | 1.35 | | | | 2.10 | | | | 2.10 | | | | 0.90 | % | | | 1.20 | | | | 0.95 | |
Small Company Value Fund | | September 30, 2016 | | | 1.35 | | | | N/A | | | | 2.10 | | | | N/A | | | | 1.20 | | | | 1.00 | |
| * | The expiration date for Administrator Class is September 30, 2016. |
Net expenses from affiliated Master Portfolio(s) are included in the expense caps. After the expiration date, each expense cap may be increased or the commitment to maintain the cap may be terminated only with the approval of the Board of Trustees.
Prior to the following dates, the expense caps for the following Funds and classes were as follows:
| | | | | | | | | | | | | | | | | | | | | | | | | | |
| | | | | Class A | | | Class B | | | Class C | | | Class R6 | | | Administrator
Class | | | Institutional
Class | |
C&B Large Cap Value Fund | | September 30, 2015 | | | 1.15 | % | | | 1.90 | % | | | 1.90 | % | | | N/A | | | | 0.95 | % | | | 0.70 | % |
Diversified Equity Fund | | September 30, 2015 | | | 1.25 | | | | 2.00 | | | | 2.00 | | | | N/A | | | | 1.00 | | | | N/A | |
Emerging Growth Fund | | September 30, 2015 | | | 1.37 | | | | N/A | | | | 2.12 | | | | N/A | | | | 1.20 | | | | 0.90 | |
Index Fund | | October 23, 2015 | | | 0.56 | | | | 1.31 | | | | 1.31 | | | | N/A | | | | 0.25 | | | | N/A | |
International Value Fund | | September 30, 2015 | | | 1.50 | | | | N/A | | | | 2.25 | | | | N/A | | | | 1.25 | | | | 1.05 | |
Small Company Growth Fund | | June 30, 2015 | | | 1.40 | | | | 2.15 | | | | 2.15 | | | | 0.90 | % | | | 1.20 | | | | 0.95 | |
Small Company Value Fund | | September 30, 2015 | | | 1.40 | | | | N/A | | | | 2.15 | | | | N/A | | | | 1.20 | | | | 1.00 | |
Distribution fees
The Trust has adopted a Distribution Plan for Class B and Class C shares of the applicable Funds pursuant to Rule 12b-1 under the 1940 Act. Distribution fees are charged to the Class B and Class C shares and paid to Wells Fargo Funds Distributor, LLC (“Funds Distributor”), the principal underwriter of each Fund, at an annual rate of 0.75% of the average daily net assets of Class B and Class C shares.
In addition, Funds Distributor is entitled to receive the front-end sales charge from the purchase of Class A shares and a contingent deferred sales charge on the redemption of certain Class A shares. Funds Distributor is also entitled to receive the contingent deferred sales charges from redemptions of Class B and Class C shares. For the year ended May 31, 2016, Funds Distributor received the following amounts in front-end sales charges and contingent deferred sales charges.
| | | | | | | | | | | | | | | | |
| | | Front-end
sales charges Class A | | | Contingent deferred sales charges | |
| | | | Class A | | | Class B | | | Class C | |
C&B Large Cap Value Fund | | $ | 2,353 | | | $ | 0 | | | $ | 0 | | | $ | 111 | |
Diversified Equity Fund | | | 9,359 | | | | 275 | | | | 0 | | | | 15 | |
Emerging Growth Fund | | | 1,228 | | | | 56 | | | | N/A | | | | 0 | |
Index Fund | | | 14,224 | | | | 0 | | | | 210 | | | | 11 | |
International Value Fund | | | 2,315 | | | | 0 | | | | 0 | | | | 0 | |
Small Company Growth Fund | | | 41,207 | | | | 12 | | | | 0 | | | | 1,646 | |
Small Company Value Fund | | | 942 | | | | 0 | | | | 0 | | | | 0 | |
| | | | | | |
| Notes to financial statements | | Wells Fargo Equity Gateway Funds | | | 71 | |
Shareholder servicing fees
The Trust has entered into contracts with one or more shareholder servicing agents, whereby Class A, Class B, Class C, Administrator Class, and Investor Class of each applicable Fund are charged a fee at an annual rate of 0.25% of the average daily net assets of each respective class. Administrator Class of the Index Fund is charged a fee at an annual rate of 0.10% of its average daily net assets.
A portion of these total shareholder servicing fees were paid to affiliates of Wells Fargo.
5. INVESTMENT PORTFOLIO TRANSACTIONS
Purchases and sales of investments, excluding U.S. Government obligations (if any) and short-term securities, for the year ended May 31, 2016 were as follows:
| | | | | | | | |
| | | Purchases at cost* | | | Sales proceeds* | |
C&B Large Cap Value Fund | | $ | 73,454,611 | | | $ | 99,134,099 | |
Diversified Equity Fund | | | 86,215,468 | | | | 91,540,365 | |
Emerging Growth Fund | | | 585,381,308 | | | | 663,808,069 | |
Index Fund | | | 97,014,368 | | | | 404,684,450 | |
International Value Fund | | | 109,004,384 | | | | 61,729,014 | |
Small Company Growth Fund | | | 1,097,951,016 | | | | 475,538,571 | |
Small Company Value Fund | | | 91,413,407 | | | | 81,216,140 | |
| * | The Funds seek to achieve their investment objective by investing some or all of their investable assets in affiliated Master Portfolios. Purchases and sales related to these investments have been calculated by aggregating the results of multiplying each Fund’s ownership percentage of the respective affiliated Master Portfolio by the corresponding affiliated Master Portfolio’s purchases and sales. |
6. BANK BORROWINGS
The Trust (excluding the money market funds and certain other funds) and Wells Fargo Variable Trust are parties to a $200,000,000 revolving credit agreement whereby the Funds are permitted to use bank borrowings for temporary or emergency purposes, such as to fund shareholder redemption requests. Interest under the credit agreement is charged to each Fund based on a borrowing rate equal to the higher of the Federal Funds rate in effect on that day plus 1.25% or the overnight LIBOR rate in effect on that day plus 1.25%. In addition, an annual commitment fee equal to 0.20% of the unused balance is allocated to each participating fund.
Prior to September 1, 2015, the Funds, except Diversified Equity Fund, were are parties to a $150,000,000 revolving credit agreement. Diversified Equity Fund and certain other funds in the Trust were parties to a $25,000,000 revolving credit agreement. Interest under each credit agreement was charged to each Fund based on a borrowing rate equal to the higher of the Federal Funds rate in effect on that day plus 1.25% or the overnight LIBOR rate in effect on that day plus 1.25%. In addition, the applicable Funds paid an annual commitment fee equal to 0.10% under the $150,000,000 credit agreement and an annual commitment fee equal to 0.15% under the $25,000,000 credit agreement. The annual commitment fee applied on the unused balance for each credit agreement was allocated to each participating fund.
During the year ended May 31, 2016, Index Fund had average borrowings outstanding of $36,691 at an average rate of 1.39% and paid interest in the amount of $510.
7. DISTRIBUTIONS TO SHAREHOLDERS
The tax character of distributions paid during the years ended May 31, 2016 and May 31, 2015 were as follows:
| | | | | | | | | | | | | | | | |
| | | Ordinary income | | | Long-term capital gain | |
| | | 2016 | | | 2015 | | | 2016 | | | 2015 | |
C&B Large Cap Value Fund | | $ | 2,808,799 | | | $ | 2,705,060 | | | $ | 8,527,222 | | | $ | 0 | |
Diversified Equity Fund | | | 1,825,620 | | | | 7,274,890 | | | | 25,311,654 | | | | 22,085,629 | |
Emerging Growth Fund | | | 0 | | | | 10,973,787 | | | | 101,711,376 | | | | 63,398,565 | |
Index Fund | | | 45,151,660 | | | | 51,868,400 | | | | 140,953,431 | | | | 24,603,892 | |
International Value Fund | | | 8,674,487 | | | | 12,049,863 | | | | 0 | | | | 0 | |
Small Company Growth Fund | | | 0 | | | | 1,846,056 | | | | 7,354,882 | | | | 18,657,537 | |
Small Company Value Fund | | | 431,180 | | | | 0 | | | | 0 | | | | 0 | |
| | | | |
| 72 | | Wells Fargo Equity Gateway Funds | | Notes to financial statements |
As of May 31, 2016, the components of distributable earnings on a tax basis were as follows:
| | | | | | | | | | | | | | | | | | | | | | | | |
| | | Undistributed
ordinary
income | | | Undistributed
long-term
gain | | | Unrealized
gains
(losses) | | | Late-year
ordinary
losses
deferred | | | Post-October
capital losses
deferred | | | Capital loss
carryforward | |
C&B Large Cap Value Fund | | $ | 910,811 | | | $ | 808,040 | | | $ | 51,201,096 | | | $ | 0 | | | $ | 0 | | | $ | 0 | |
Diversified Equity Fund | | | 1,185,879 | | | | 5,183,471 | | | | 37,672,053 | | | | 0 | | | | 0 | | | | 0 | |
Emerging Growth Fund | | | 0 | | | | 0 | | | | 157,867,105 | | | | (1,370,106 | ) | | | (11,871,337 | ) | | | 0 | |
Index Fund | | | 16,678,396 | | | | 85,622,413 | | | | 1,307,500,481 | | | | 0 | | | | 0 | | | | 0 | |
International Value Fund | | | 7,661,901 | | | | 0 | | | | (54,118,422 | ) | | | 0 | | | | (779,929 | ) | | | (36,364,038 | ) |
Small Company Growth Fund | | | 0 | | | | 0 | | | | 13,598,131 | | | | (615,614 | ) | | | 0 | | | | (87,505,855 | ) |
Small Company Value Fund | | | 291,961 | | | | 0 | | | | 4,382,385 | | | | 0 | | | | (614,168 | ) | | | (75,262,378 | ) |
8. CONCENTRATION RISK
Concentration risks result from exposure to a limited number of sectors. Through their investments in affiliated Master Portfolio(s), Funds that invest a substantial portion of their assets in a sector may be more affected by changes in that sector than would be a fund whose investments are not heavily weighted in any sector.
9. INDEMNIFICATION
Under the Trust’s organizational documents, the officers and Trustees have been granted certain indemnification rights against certain liabilities that may arise out of performance of their duties to the Trust. Additionally, in the normal course of business, the Trust may enter into contracts with service providers that contain a variety of indemnification clauses. The Trust’s maximum exposure under these arrangements is dependent on future claims that may be made against the Funds and, therefore, cannot be estimated.
| | | | | | |
| Report of independent registered public accounting firm | | Wells Fargo Equity Gateway Funds | | | 73 | |
BOARD OF TRUSTEES AND SHAREHOLDERS OF WELLS FARGO FUNDS TRUST:
We have audited the accompanying statements of assets and liabilities, including the portfolios of investments, of the Wells Fargo C&B Large Cap Value Fund, Wells Fargo Diversified Equity Fund, Wells Fargo Emerging Growth Fund, Wells Fargo Index Fund, Wells Fargo International Value Fund, Wells Fargo Small Company Growth Fund, and Wells Fargo Small Company Value Fund (formerly known as Wells Fargo Advantage C&B Large Cap Value Fund, Wells Fargo Advantage Diversified Equity Fund, Wells Fargo Advantage Emerging Growth Fund, Wells Fargo Advantage Index Fund, Wells Fargo Advantage International Value Fund, Wells Fargo Advantage Small Company Growth Fund, and Wells Fargo Advantage Small Company Value Fund, respectively) (the “Funds”), seven of the funds constituting the Wells Fargo Funds Trust, as of May 31, 2016, and the related statements of operations for the year then ended, the statements of changes in net assets for each of the years in the two-year period then ended, and the financial highlights for each of the years or periods in the five-year period then ended. These financial statements and financial highlights are the responsibility of the Fund’s management. Our responsibility is to express an opinion on these financial statements and financial highlights based on our audits.
We conducted our audits in accordance with the standards of the Public Company Accounting Oversight Board (United States). Those standards require that we plan and perform the audit to obtain reasonable assurance about whether the financial statements and financial highlights are free of material misstatement. An audit includes examining, on a test basis, evidence supporting the amounts and disclosures in the financial statements. Our procedures included confirmation of securities owned as of May 31, 2016, by correspondence with the transfer agent or by other appropriate auditing procedures. An audit also includes assessing the accounting principles used and significant estimates made by management, as well as evaluating the overall financial statement presentation. We believe that our audits provide a reasonable basis for our opinion.
In our opinion, the financial statements and financial highlights referred to above present fairly, in all material respects, the financial position of each of the aforementioned Funds of the Wells Fargo Funds Trust as of May 31, 2016, the results of their operations for the year then ended, the changes in their net assets for each of the years in the two-year period then ended, and the financial highlights for each of the years or periods in the five-year period then ended, in conformity with U.S. generally accepted accounting principles.

Boston, Massachusetts
July 27, 2016
| | | | |
| 74 | | Wells Fargo Equity Gateway Funds | | Portfolio of investments—May 31, 2016 |
C&B LARGE CAP VALUE PORTFOLIO
| | | | | | | | | | | | | | | | |
| Security name | | | | | | | | Shares | | | Value | |
| | | | |
Common Stocks: 95.04% | | | | | | | | | | | | | | | | |
| | | | |
Consumer Discretionary: 13.41% | | | | | | | | | | | | | | | | |
| | | | |
| Hotels, Restaurants & Leisure: 3.02% | | | | | | | | | | | | | | | | |
Brinker International Incorporated | | | | | | | | | | | 78,307 | | | $ | 3,521,466 | |
Carnival Corporation | | | | | | | | | | | 111,500 | | | | 5,323,010 | |
| |
| | | | 8,844,476 | |
| | | | | |
| | | | |
| Household Durables: 1.22% | | | | | | | | | | | | | | | | |
Whirlpool Corporation | | | | | | | | | | | 20,400 | | | | 3,562,248 | |
| | | | | |
| | | | |
| Media: 5.77% | | | | | | | | | | | | | | | | |
Omnicom Group Incorporated | | | | | | | | | | | 102,600 | | | | 8,549,658 | |
Twenty-First Century Fox Incorporated Class A | | | | | | | | | | | 289,400 | | | | 8,357,872 | |
| |
| | | | 16,907,530 | |
| | | | | |
| | | | |
| Multiline Retail: 1.03% | | | | | | | | | | | | | | | | |
Kohl’s Corporation | | | | | | | | | | | 84,200 | | | | 3,034,568 | |
| | | | | |
| | | | |
| Textiles, Apparel & Luxury Goods: 2.37% | | | | | | | | | | | | | | | | |
Gildan Activewear Incorporated | | | | | | | | | | | 232,500 | | | | 6,935,475 | |
| | | | | |
| | | | |
Consumer Staples: 6.52% | | | | | | | | | | | | | | | | |
| | | | |
| Beverages: 1.68% | | | | | | | | | | | | | | | | |
Diageo plc ADR « | | | | | | | | | | | 45,120 | | | | 4,923,946 | |
| | | | | |
| | | | |
| Household Products: 1.67% | | | | | | | | | | | | | | | | |
The Procter & Gamble Company | | | | | | | | | | | 60,390 | | | | 4,894,006 | |
| | | | | |
| | | | |
| Personal Products: 1.48% | | | | | | | | | | | | | | | | |
Unilever NV ADR | | | | | | | | | | | 96,500 | | | | 4,319,340 | |
| | | | | |
| | | | |
| Tobacco: 1.69% | | | | | | | | | | | | | | | | |
Philip Morris International | | | | | | | | | | | 50,300 | | | | 4,963,604 | |
| | | | | |
| | | | |
Energy: 6.06% | | | | | | | | | | | | | | | | |
| | | | |
| Oil, Gas & Consumable Fuels: 6.06% | | | | | | | | | | | | | | | | |
Chevron Corporation | | | | | | | | | | | 30,900 | | | | 3,120,900 | |
Devon Energy Corporation | | | | | | | | | | | 40,100 | | | | 1,447,209 | |
Exxon Mobil Corporation | | | | | | | | | | | 82,000 | | | | 7,299,640 | |
Noble Energy Incorporated | | | | | | | | | | | 19,870 | | | | 710,353 | |
World Fuel Services Corporation | | | | | | | | | | | 112,700 | | | | 5,180,819 | |
| |
| | | | 17,758,921 | |
| | | | | |
| | | | |
Financials: 26.02% | | | | | | | | | | | | | | | | |
| | | | |
| Banks: 8.11% | | | | | | | | | | | | | | | | |
Bank of America Corporation | | | | | | | | | | | 468,700 | | | | 6,932,073 | |
JPMorgan Chase & Company | | | | | | | | | | | 143,470 | | | | 9,364,287 | |
PNC Financial Services Group Incorporated | | | | | | | | | | | 83,000 | | | | 7,448,420 | |
| |
| | | | 23,744,780 | |
| | | | | |
The accompanying notes are an integral part of these financial statements.
| | | | | | |
| Portfolio of investments—May 31, 2016 | | Wells Fargo Equity Gateway Funds | | | 75 | |
C&B LARGE CAP VALUE PORTFOLIO
| | | | | | | | | | | | | | | | |
| Security name | | | | | | | | Shares | | | Value | |
| | | | |
| Capital Markets: 3.24% | | | | | | | | | | | | | | | | |
State Street Corporation | | | | | | | | | | | 150,600 | | | $ | 9,496,836 | |
| | | | | |
| | | | |
| Consumer Finance: 2.15% | | | | | | | | | | | | | | | | |
American Express Company | | | | | | | | | | | 95,700 | | | | 6,293,232 | |
| | | | | |
| | | | |
| Diversified Financial Services: 2.26% | | | | | | | | | | | | | | | | |
Berkshire Hathaway Incorporated Class B † | | | | | | | | | | | 47,200 | | | | 6,633,488 | |
| | | | | |
| | | | |
| Insurance: 10.26% | | | | | | | | | | | | | | | | |
Chubb Limited | | | | | | | | | | | 49,600 | | | | 6,279,856 | |
FNF Group | | | | | | | | | | | 202,900 | | | | 7,091,355 | |
RenaissanceRe Holdings Limited | | | | | | | | | | | 72,200 | | | | 8,339,822 | |
The Progressive Corporation | | | | | | | | | | | 251,100 | | | | 8,361,630 | |
| |
| | | | 30,072,663 | |
| | | | | |
| | | | |
Health Care: 15.08% | | | | | | | | | | | | | | | | |
| | | | |
| Health Care Equipment & Supplies: 4.06% | | | | | | | | | | | | | | | | |
Abbott Laboratories | | | | | | | | | | | 138,800 | | | | 5,500,644 | |
Becton Dickinson & Company | | | | | | | | | | | 38,400 | | | | 6,391,680 | |
| |
| | | | 11,892,324 | |
| | | | | |
| | | | |
| Health Care Providers & Services: 8.59% | | | | | | | | | | | | | | | | |
Cardinal Health Incorporated | | | | | | | | | | | 85,740 | | | | 6,769,173 | |
Laboratory Corporation of America Holdings † | | | | | | | | | | | 77,160 | | | | 9,872,622 | |
UnitedHealth Group Incorporated | | | | | | | | | | | 63,690 | | | | 8,513,442 | |
| |
| | | | 25,155,237 | |
| | | | | |
| | | | |
| Pharmaceuticals: 2.43% | | | | | | | | | | | | | | | | |
Johnson & Johnson | | | | | | | | | | | 63,300 | | | | 7,133,277 | |
| | | | | |
| | | | |
Industrials: 18.35% | | | | | | | | | | | | | | | | |
| | | | |
| Aerospace & Defense: 1.48% | | | | | | | | | | | | | | | | |
Rockwell Collins Incorporated | | | | | | | | | | | 49,100 | | | | 4,340,440 | |
| | | | | |
| | | | |
| Air Freight & Logistics: 2.34% | | | | | | | | | | | | | | | | |
United Parcel Service Incorporated Class B | | | | | | | | | | | 66,600 | | | | 6,865,794 | |
| | | | | |
| | | | |
| Electrical Equipment: 2.58% | | | | | | | | | | | | | | | | |
Eaton Corporation plc | | | | | | | | | | | 122,800 | | | | 7,568,164 | |
| | | | | |
| | | | |
| Industrial Conglomerates: 1.70% | | | | | | | | | | | | | | | | |
3M Company | | | | | | | | | | | 29,500 | | | | 4,965,440 | |
| | | | | |
| | | | |
| Machinery: 4.77% | | | | | | | | | | | | | | | | |
Donaldson Company Incorporated | | | | | | | | | | | 190,200 | | | | 6,373,602 | |
Parker-Hannifin Corporation | | | | | | | | | | | 66,100 | | | | 7,590,924 | |
| |
| | | | 13,964,526 | |
| | | | | |
The accompanying notes are an integral part of these financial statements.
| | | | |
| 76 | | Wells Fargo Equity Gateway Funds | | Portfolio of investments—May 31, 2016 |
C&B LARGE CAP VALUE PORTFOLIO
| | | | | | | | | | | | | | | | |
| Security name | | | | | | | | Shares | | | Value | |
| | | | |
| Trading Companies & Distributors: 5.48% | | | | | | | | | | | | | | | | |
AerCap Holdings NV † | | | | | | | | | | | 196,700 | | | $ | 7,689,003 | |
W.W. Grainger Incorporated « | | | | | | | | | | | 19,500 | | | | 4,452,825 | |
WESCO International Incorporated †« | | | | | | | | | | | 67,200 | | | | 3,919,776 | |
| | | | |
| | | | | | | | | | | | | | | 16,061,604 | |
| | | | | | | | | | | | | | | | |
| | | | |
Information Technology: 4.81% | | | | | | | | | | | | | | | | |
| | | | |
| IT Services: 2.87% | | | | | | | | | | | | | | | | |
Alliance Data Systems Corporation † | | | | | | | | | | | 22,100 | | | | 4,910,399 | |
The Western Union Company | | | | | | | | | | | 179,800 | | | | 3,497,110 | |
| | | | |
| | | | | | | | | | | | | | | 8,407,509 | |
| | | | | | | | | | | | | | | | |
| | | | |
| Semiconductors & Semiconductor Equipment: 1.94% | | | | | | | | | | | | | | | | |
Linear Technology Corporation | | | | | | | | | | | 119,800 | | | | 5,668,936 | |
| | | | | | | | | | | | | | | | |
| | | | |
Materials: 4.79% | | | | | | | | | | | | | | | | |
| | | | |
| Chemicals: 1.07% | | | | | | | | | | | | | | | | |
Axalta Coating Systems Limited † | | | | | | | | | | | 111,500 | | | | 3,138,725 | |
| | | | | | | | | | | | | | | | |
| | | | |
| Containers & Packaging: 3.72% | | | | | | | | | | | | | | | | |
Ball Corporation | | | | | | | | | | | 42,600 | | | | 3,079,980 | |
Crown Holdings Incorporated † | | | | | | | | | | | 149,700 | | | | 7,809,847 | |
| | | | |
| | | | | | | | | | | | | | | 10,889,827 | |
| | | | | | | | | | | | | | | | |
| | | | |
Total Common Stocks (Cost $210,754,976) | | | | | | | | | | | | | | | 278,436,916 | |
| | | | | | | | | | | | | | | | |
| | | | |
| | | Yield | | | | | | | | | | |
| Short-Term Investments: 8.98% | | | | | | | | | | | | | | | | |
| | | | |
| Investment Companies: 8.98% | | | | | | | | | | | | | | | | |
Securities Lending Cash Investments LLC (l)(r)(u) | | | 0.45 | % | | | | | | | 12,454,900 | | | | 12,454,900 | |
Wells Fargo Cash Investment Money Market Fund Select Class (l)(u) | | | 0.41 | | | | | | | | 13,862,559 | | | | 13,862,559 | |
| | | | |
Total Short-Term Investments (Cost $26,317,459) | | | | | | | | | | | | | | | 26,317,459 | |
| | | | | | | | | | | | | | | | |
| | | | | | | | |
| Total investments in securities (Cost $237,072,435) * | | | 104.02 | % | | | 304,754,375 | |
Other assets and liabilities, net | | | (4.02 | ) | | | (11,790,086 | ) |
| | | | | | | | |
| Total net assets | | | 100.00 | % | | $ | 292,964,289 | |
| | | | | | | | |
| « | All or a portion of this security is on loan. |
| † | Non-income-earning security |
| (l) | The issuer of the security is an affiliated person of the Portfolio as defined in the Investment Company Act of 1940. |
| (r) | The investment is a non-registered investment vehicle purchased with cash collateral received from securities on loan. |
| (u) | The rate represents the 7-day annualized yield at period end. |
| * | Cost for federal income tax purposes is $245,961,339 and unrealized gains (losses) consists of: |
| | | | |
Gross unrealized gains | | $ | 70,742,300 | |
Gross unrealized losses | | | (11,949,264 | ) |
| | | | |
Net unrealized gains | | $ | 58,793,036 | |
The accompanying notes are an integral part of these financial statements.
| | | | | | |
| Portfolio of investments—May 31, 2016 | | Wells Fargo Equity Gateway Funds | | | 77 | |
DIVERSIFIED LARGE CAP GROWTH PORTFOLIO
| | | | | | | | | | | | | | | | |
| Security name | | | | | | | | Shares | | | Value | |
| | | | |
Common Stocks: 97.83% | | | | | | | | | | | | | | | | |
| | | | |
Consumer Discretionary: 25.49% | | | | | | | | | | | | | | | | |
| | | | |
| Auto Components: 0.42% | | | | | | | | | | | | | | | | |
Delphi Automotive plc | | | | | | | | | | | 7,120 | | | $ | 483,875 | |
| | | | | | | | | | | | | | | | |
| | | | |
| Distributors: 0.63% | | | | | | | | | | | | | | | | |
LKQ Corporation † | | | | | | | | | | | 21,990 | | | | 727,209 | |
| | | | | | | | | | | | | | | | |
| | | | |
| Hotels, Restaurants & Leisure: 4.41% | | | | | | | | | | | | | | | | |
Hilton Worldwide Holdings Incorporated | | | | | | | | | | | 13,168 | | | | 273,631 | |
Marriott International Incorporated Class A « | | | | | | | | | | | 8,000 | | | | 528,320 | |
McDonald’s Corporation | | | | | | | | | | | 7,210 | | | | 880,053 | |
Starbucks Corporation | | | | | | | | | | | 45,878 | | | | 2,518,243 | |
Yum! Brands Incorporated | | | | | | | | | | | 11,080 | | | | 909,557 | |
| | | | |
| | | | | | | | | | | | | | | 5,109,804 | |
| | | | | | | | | | | | | | | | |
| | | | |
| Internet & Catalog Retail: 5.12% | | | | | | | | | | | | | | | | |
Amazon.com Incorporated † | | | | | | | | | | | 6,810 | | | | 4,922,200 | |
Netflix Incorporated † | | | | | | | | | | | 6,460 | | | | 662,602 | |
The Priceline Group Incorporated † | | | | | | | | | | | 270 | | | | 341,369 | |
| | | | |
| | | | | | | | | | | | | | | 5,926,171 | |
| | | | | | | | | | | | | | | | |
| | | | |
| Media: 1.04% | | | | | | | | | | | | | | | | |
Charter Communications Incorporated Class A † | | | | | | | | | | | 11 | | | | 2,408 | |
The Walt Disney Company | | | | | | | | | | | 12,090 | | | | 1,199,570 | |
| | | | |
| | | | | | | | | | | | | | | 1,201,978 | |
| | | | | | | | | | | | | | | | |
| | | | |
| Multiline Retail: 3.42% | | | | | | | | | | | | | | | | |
Dollar General Corporation | | | | | | | | | | | 16,210 | | | | 1,457,279 | |
Dollar Tree Incorporated † | | | | | | | | | | | 27,690 | | | | 2,507,053 | |
| | | | |
| | | | | | | | | | | | | | | 3,964,332 | |
| | | | | | | | | | | | | | | | |
| | | | |
| Specialty Retail: 7.49% | | | | | | | | | | | | | | | | |
CarMax Incorporated Ǡ | | | | | | | | | | | 17,730 | | | | 951,392 | |
O’Reilly Automotive Incorporated † | | | | | | | | | | | 5,550 | | | | 1,467,587 | |
The Home Depot Incorporated | | | | | | | | | | | 23,570 | | | | 3,114,068 | |
The TJX Companies Incorporated | | | | | | | | | | | 18,600 | | | | 1,415,832 | |
Tractor Supply Company | | | | | | | | | | | 15,550 | | | | 1,494,355 | |
ULTA Salon, Cosmetics and Fragrance Incorporated † | | | | | | | | | | | 960 | | | | 223,690 | |
| | | | |
| | | | | | | | | | | | | | | 8,666,924 | |
| | | | | | | | | | | | | | | | |
| | | | |
| Textiles, Apparel & Luxury Goods: 2.96% | | | | | | | | | | | | | | | | |
Coach Incorporated | | | | | | | | | | | 12,480 | | | | 491,962 | |
Nike Incorporated Class B | | | | | | | | | | | 26,160 | | | | 1,444,555 | |
Under Armour Incorporated Class A « | | | | | | | | | | | 11,690 | | | | 441,064 | |
Under Armour Incorporated Class C † | | | | | | | | | | | 5,230 | | | | 182,893 | |
VF Corporation | | | | | | | | | | | 13,840 | | | | 862,509 | |
| | | | |
| | | | | | | | | | | | | | | 3,422,983 | |
| | | | | | | | | | | | | | | | |
The accompanying notes are an integral part of these financial statements.
| | | | |
| 78 | | Wells Fargo Equity Gateway Funds | | Portfolio of investments—May 31, 2016 |
DIVERSIFIED LARGE CAP GROWTH PORTFOLIO
| | | | | | | | | | | | | | | | |
| Security name | | | | | | | | Shares | | | Value | |
| | | | |
Consumer Staples: 7.89% | | | | | | | | | | | | | | | | |
| | | | |
| Beverages: 3.15% | | | | | | | | | | | | | | | | |
Constellation Brands Incorporated Class A | | | | | | | | | | | 7,780 | | | $ | 1,191,507 | |
Dr Pepper Snapple Group Incorporated | | | | | | | | | | | 11,210 | | | | 1,024,594 | |
Monster Beverage Corporation † | | | | | | | | | | | 6,390 | | | | 958,500 | |
The Coca-Cola Company | | | | | | | | | | | 10,670 | | | | 475,882 | |
| | | | |
| | | | | | | | | | | | | | | 3,650,483 | |
| | | | | | | | | | | | | | | | |
| | | | |
| Food & Staples Retailing: 2.64% | | | | | | | | | | | | | | | | |
Costco Wholesale Corporation | | | | | | | | | | | 10,720 | | | | 1,594,814 | |
CVS Health Corporation | | | | | | | | | | | 12,330 | | | | 1,189,229 | |
Sprouts Farmers Market Incorporated † | | | | | | | | | | | 11,038 | | | | 273,301 | |
| | | | |
| | | | | | | | | | | | | | | 3,057,344 | |
| | | | | | | | | | | | | | | | |
| | | | |
| Household Products: 0.44% | | | | | | | | | | | | | | | | |
Colgate-Palmolive Company | | | | | | | | | | | 7,190 | | | | 506,248 | |
| | | | | | | | | | | | | | | | |
| | | | |
| Personal Products: 0.79% | | | | | | | | | | | | | | | | |
The Estee Lauder Companies Incorporated Class A | | | | | | | | | | | 9,910 | | | | 909,540 | |
| | | | | | | | | | | | | | | | |
| | | | |
| Tobacco: 0.87% | | | | | | | | | | | | | | | | |
Reynolds American Incorporated | | | | | | | | | | | 20,360 | | | | 1,011,892 | |
| | | | | | | | | | | | | | | | |
| | | | |
Energy: 1.19% | | | | | | | | | | | | | | | | |
| | | | |
| Energy Equipment & Services: 0.21% | | | | | | | | | | | | | | | | |
Schlumberger Limited | | | | | | | | | | | 3,250 | | | | 247,975 | |
| | | | | | | | | | | | | | | | |
| | | | |
| Oil, Gas & Consumable Fuels: 0.98% | | | | | | | | | | | | | | | | |
Concho Resources Incorporated † | | | | | | | | | | | 8,480 | | | | 1,028,963 | |
EOG Resources Incorporated | | | | | | | | | | | 1,260 | | | | 102,514 | |
| | | | |
| | | | | | | | | | | | | | | 1,131,477 | |
| | | | | | | | | | | | | | | | |
| | | | |
Financials: 2.21% | | | | | | | | | | | | | | | | |
| | | | |
| Capital Markets: 0.68% | | | | | | | | | | | | | | | | |
SEI Investments Company | | | | | | | | | | | 350 | | | | 18,011 | |
TD Ameritrade Holding Corporation | | | | | | | | | | | 23,610 | | | | 771,339 | |
| | | | |
| | | | | | | | | | | | | | | 789,350 | |
| | | | | | | | | | | | | | | | |
| | | | |
| Diversified Financial Services: 1.28% | | | | | | | | | | | | | | | | |
Intercontinental Exchange Incorporated | | | | | | | | | | | 2,820 | | | | 764,558 | |
S&P Global Incorporated | | | | | | | | | | | 6,370 | | | | 712,230 | |
| | | | |
| | | | | | | | | | | | | | | 1,476,788 | |
| | | | | | | | | | | | | | | | |
| | | | |
| REITs: 0.25% | | | | | | | | | | | | | | | | |
American Tower Corporation | | | | | | | | | | | 2,770 | | | | 293,011 | |
| | | | | | | | | | | | | | | | |
|
Health Care: 14.23% | |
| | | | |
| Biotechnology: 6.39% | | | | | | | | | | | | | | | | |
Alexion Pharmaceuticals Incorporated † | | | | | | | | | | | 16,270 | | | | 2,455,143 | |
Biogen Incorporated † | | | | | | | | | | | 2,470 | | | | 715,633 | |
The accompanying notes are an integral part of these financial statements.
| | | | | | |
| Portfolio of investments—May 31, 2016 | | Wells Fargo Equity Gateway Funds | | | 79 | |
DIVERSIFIED LARGE CAP GROWTH PORTFOLIO
| | | | | | | | | | | | | | | | |
| Security name | | | | | | | | Shares | | | Value | |
| | | | |
| Biotechnology (continued) | | | | | | | | | | | | | | | | |
BioMarin Pharmaceutical Incorporated † | | | | | | | | | | | 10,910 | | | $ | 978,082 | |
Celgene Corporation † | | | | | | | | | | | 15,120 | | | | 1,595,462 | |
Incyte Corporation † | | | | | | | | | | | 2,640 | | | | 222,842 | |
Regeneron Pharmaceuticals Incorporated † | | | | | | | | | | | 2,390 | | | | 953,443 | |
Vertex Pharmaceuticals Incorporated † | | | | | | | | | | | 5,190 | | | | 483,449 | |
| |
| | | | 7,404,054 | |
| | | | | |
| | | | |
| Health Care Equipment & Supplies: 2.04% | | | | | | | | | | | | | | | | |
Intuitive Surgical Incorporated † | | | | | | | | | | | 1,440 | | | | 913,982 | |
Medtronic plc | | | | | | | | | | | 17,995 | | | | 1,448,238 | |
| |
| | | | 2,362,220 | |
| | | | | |
| | | | |
| Health Care Providers & Services: 1.30% | | | | | | | | | | | | | | | | |
AmerisourceBergen Corporation | | | | | | | | | | | 1,600 | | | | 119,968 | |
UnitedHealth Group Incorporated | | | | | | | | | | | 10,350 | | | | 1,383,485 | |
| |
| | | | 1,503,453 | |
| | | | | |
| | | | |
| Health Care Technology: 0.84% | | | | | | | | | | | | | | | | |
Cerner Corporation † | | | | | | | | | | | 17,441 | | | | 969,894 | |
| | | | | | | | | | | | | | | | |
| | | | |
| Life Sciences Tools & Services: 0.54% | | | | | | | | | | | | | | | | |
Quintiles Transnational Holdings Incorporated † | | | | | | | | | | | 9,264 | | | | 628,933 | |
| | | | | | | | | | | | | | | | |
| | | | |
| Pharmaceuticals: 3.12% | | | | | | | | | | | | | | | | |
Allergan plc † | | | | | | | | | | | 142 | | | | 33,477 | |
Bristol-Myers Squibb Company | | | | | | | | | | | 35,360 | | | | 2,535,312 | |
Novo Nordisk A/S ADR | | | | | | | | | | | 9,650 | | | | 540,786 | |
Zoetis Incorporated | | | | | | | | | | | 10,492 | | | | 497,531 | |
| |
| | | | 3,607,106 | |
| | | | | |
| | | | |
Industrials: 6.73% | | | | | | | | | | | | | | | | |
| | | | |
| Aerospace & Defense: 0.71% | | | | | | | | | | | | | | | | |
Honeywell International Incorporated | | | | | | | | | | | 2,150 | | | | 244,735 | |
The Boeing Company | | | | | | | | | | | 4,540 | | | | 572,721 | |
| |
| | | | 817,456 | |
| | | | | |
| | | | |
| Air Freight & Logistics: 0.35% | | | | | | | | | | | | | | | | |
United Parcel Service Incorporated Class B | | | | | | | | | | | 3,950 | | | | 407,206 | |
| | | | | | | | | | | | | | | | |
| | | | |
| Airlines: 1.70% | | | | | | | | | | | | | | | | |
Delta Air Lines Incorporated | | | | | | | | | | | 14,950 | | | | 649,727 | |
Southwest Airlines Company | | | | | | | | | | | 30,910 | | | | 1,313,057 | |
| |
| | | | 1,962,784 | |
| | | | | |
| | | | |
| Electrical Equipment: 0.17% | | | | | | | | | | | | | | | | |
Rockwell Automation Incorporated | | | | | | | | | | | 1,750 | | | | 203,088 | |
| | | | | | | | | | | | | | | | |
| | | | |
| Industrial Conglomerates: 1.17% | | | | | | | | | | | | | | | | |
3M Company | | | | | | | | | | | 3,500 | | | | 589,120 | |
The accompanying notes are an integral part of these financial statements.
| | | | |
| 80 | | Wells Fargo Equity Gateway Funds | | Portfolio of investments—May 31, 2016 |
DIVERSIFIED LARGE CAP GROWTH PORTFOLIO
| | | | | | | | | | | | | | | | |
| Security name | | | | | | | | Shares | | | Value | |
| | | | |
| Industrial Conglomerates (continued) | | | | | | | | | | | | | | | | |
Danaher Corporation | | | | | | | | | | | 7,780 | | | $ | 765,241 | |
| | | | |
| | | | | | | | | | | | | | | 1,354,361 | |
| | | | | | | | | | | | | | | | |
| | | | |
| Professional Services: 0.46% | | | | | | | | | | | | | | | | |
Verisk Analytics Incorporated † | | | | | | | | | | | 6,680 | | | | 530,325 | |
| | | | | | | | | | | | | | | | |
| | | | |
| Road & Rail: 2.17% | | | | | | | | | | | | | | | | |
Canadian Pacific Railway Limited | | | | | | | | | | | 1,030 | | | | 133,478 | |
Kansas City Southern | | | | | | | | | | | 9,460 | | | | 880,726 | |
Union Pacific Corporation | | | | | | | | | | | 17,810 | | | | 1,499,424 | |
| | | | |
| | | | | | | | | | | | | | | 2,513,628 | |
| | | | | | | | | | | | | | | | |
| | | | |
Information Technology: 37.17% | | | | | | | | | | | | | | | | |
| | | | |
| Communications Equipment: 1.31% | | | | | | | | | | | | | | | | |
Harris Corporation | | | | | | | | | | | 9,390 | | | | 739,650 | |
Palo Alto Networks Incorporated † | | | | | | | | | | | 5,940 | | | | 774,932 | |
| | | | |
| | | | | | | | | | | | | | | 1,514,582 | |
| | | | | | | | | | | | | | | | |
| | | | |
| Internet Software & Services: 12.01% | | | | | | | | | | | | | | | | |
Alphabet Incorporated Class A † | | | | | | | | | | | 7,004 | | | | 5,244,945 | |
Alphabet Incorporated Class C † | | | | | | | | | | | 2,984 | | | | 2,195,388 | |
Facebook Incorporated Class A † | | | | | | | | | | | 48,180 | | | | 5,724,266 | |
Tencent Holdings Limited ADR | | | | | | | | | | | 32,810 | | | | 731,663 | |
| | | | |
| | | | | | | | | | | | | | | 13,896,262 | |
| | | | | | | | | | | | | | | | |
| | | | |
| IT Services: 8.90% | | | | | | | | | | | | | | | | |
Accenture plc Class A | | | | | | | | | | | 7,720 | | | | 918,448 | |
Alliance Data Systems Corporation † | | | | | | | | | | | 1,370 | | | | 304,400 | |
Cognizant Technology Solutions Corporation Class A † | | | | | | | | | | | 15,200 | | | | 933,888 | |
Fidelity National Information Services Incorporated | | | | | | | | | | | 12,440 | | | | 923,919 | |
MasterCard Incorporated Class A | | | | | | | | | | | 20,110 | | | | 1,928,549 | |
PayPal Holdings Incorporated † | | | | | | | | | | | 42,670 | | | | 1,612,499 | |
Visa Incorporated Class A | | | | | | | | | | | 46,630 | | | | 3,680,972 | |
| | | | |
| | | | | | | | | | | | | | | 10,302,675 | |
| | | | | | | | | | | | | | | | |
| | | | |
| Semiconductors & Semiconductor Equipment: 3.82% | | | | | | | | | | | | | | | | |
ARM Holdings plc ADR | | | | | | | | | | | 298 | | | | 12,844 | |
Broadcom Limited | | | | | | | | | | | 8,411 | | | | 1,298,322 | |
Microchip Technology Incorporated « | | | | | | | | | | | 36,529 | | | | 1,887,819 | |
Texas Instruments Incorporated | | | | | | | | | | | 20,220 | | | | 1,225,332 | |
| | | | |
| | | | | | | | | | | | | | | 4,424,317 | |
| | | | | | | | | | | | | | | | |
| | | | |
| Software: 8.44% | | | | | | | | | | | | | | | | |
Adobe Systems Incorporated † | | | | | | | | | | | 18,800 | | | | 1,870,036 | |
Electronic Arts Incorporated † | | | | | | | | | | | 10,590 | | | | 812,783 | |
Fortinet Incorporated † | | | | | | | | | | | 17,780 | | | | 608,254 | |
Microsoft Corporation | | | | | | | | | | | 34,800 | | | | 1,844,400 | |
Red Hat Incorporated † | | | | | | | | | | | 9,000 | | | | 697,140 | |
The accompanying notes are an integral part of these financial statements.
| | | | | | |
| Portfolio of investments—May 31, 2016 | | Wells Fargo Equity Gateway Funds | | | 81 | |
DIVERSIFIED LARGE CAP GROWTH PORTFOLIO
| | | | | | | | | | | | | | | | |
| Security name | | | | | | | | Shares | | | Value | |
| | | | |
| Software (continued) | | | | | | | | | | | | | | | | |
Salesforce.com Incorporated † | | | | | | | | | | | 22,154 | | | $ | 1,854,511 | |
ServiceNow Incorporated † | | | | | | | | | | | 17,254 | | | | 1,235,904 | |
Splunk Incorporated † | | | | | | | | | | | 13,100 | | | | 752,595 | |
Tableau Software Incorporated Class A † | | | | | | | | | | | 1,930 | | | | 99,279 | |
| | | | |
| | | | | | | | | | | | | | | 9,774,902 | |
| | | | | | | | | | | | | | | | |
| | | | |
| Technology Hardware, Storage & Peripherals: 2.69% | | | | | | | | | | | | | | | | |
Apple Incorporated | | | | | | | | | | | 31,227 | | | | 3,118,328 | |
| | | | | | | | | | | | | | | | |
| | | | |
Materials: 2.92% | | | | | | | | | | | | | | | | |
| | | | |
| Chemicals: 2.92% | | | | | | | | | | | | | | | | |
Ecolab Incorporated | | | | | | | | | | | 13,320 | | | | 1,561,637 | |
Praxair Incorporated | | | | | | | | | | | 8,140 | | | | 894,260 | |
The Sherwin-Williams Company | | | | | | | | | | | 3,170 | | | | 922,752 | |
| | | | |
| | | | | | | | | | | | | | | 3,378,649 | |
| | | | | | | | | | | | | | | | |
| | | | |
Total Common Stocks (Cost $76,805,738) | | | | | | | | | | | | | | | 113,251,607 | |
| | | | | | | | | | | | | | �� | | |
| | | | |
| | | Yield | | | | | | | | | | |
| Short-Term Investments: 4.52% | | | | | | | | | | | | | | | | |
| | | | |
| Investment Companies: 4.52% | | | | | | | | | | | | | | | | |
Securities Lending Cash Investments LLC (l)(r)(u) | | | 0.45 | % | | | | | | | 3,113,406 | | | | 3,113,406 | |
Wells Fargo Cash Investment Money Market Fund Select Class (l)(u) | | | 0.41 | | | | | | | | 2,118,196 | | | | 2,118,196 | |
| | | | |
Total Short-Term Investments (Cost $5,231,602) | | | | | | | | | | | | | | | 5,231,602 | |
| | | | | | | | | | | | | | | | |
| | | | | | | | |
| Total investments in securities (Cost $82,037,340) * | | | 102.35 | % | | | 118,483,209 | |
Other assets and liabilities, net | | | (2.35 | ) | | | (2,724,733 | ) |
| | | | | | | | |
| Total net assets | | | 100.00 | % | | $ | 115,758,476 | |
| | | | | | | | |
| † | Non-income-earning security |
| « | All or a portion of this security is on loan. |
| (l) | The issuer of the security is an affiliated person of the Portfolio as defined in the Investment Company Act of 1940. |
| (r) | The investment is a non-registered investment vehicle purchased with cash collateral received from securities on loan. |
| (u) | The rate represents the 7-day annualized yield at period end. |
| * | Cost for federal income tax purposes is $82,417,127 and unrealized gains (losses) consists of: |
| | | | |
Gross unrealized gains | | $ | 37,113,069 | |
Gross unrealized losses | | | (1,046,987 | ) |
| | | | |
Net unrealized gains | | $ | 36,066,082 | |
The accompanying notes are an integral part of these financial statements.
| | | | |
| 82 | | Wells Fargo Equity Gateway Funds | | Portfolio of investments—May 31, 2016 |
EMERGING GROWTH PORTFOLIO
| | | | | | | | | | | | | | | | |
| Security name | | | | | | | | Shares | | | Value | |
| | | | |
Common Stocks: 98.14% | | | | | | | | | | | | | | | | |
| | | | |
Consumer Discretionary: 12.15% | | | | | | | | | | | | | | | | |
| | | | |
| Auto Components: 1.67% | | | | | | | | | | | | | | | | |
Gentherm Incorporated † | | | | | | | | | | | 90,670 | | | $ | 3,316,709 | |
Motorcar Parts of America Incorporated † | | | | | | | | | | | 389,542 | | | | 11,670,678 | |
| |
| | | | 14,987,387 | |
| | | | | | | | | | | | | | | | |
| | | | |
| Diversified Consumer Services: 0.93% | | | | | | | | | | | | | | | | |
Grand Canyon Education Incorporated † | | | | | | | | | | | 200,830 | | | | 8,386,661 | |
| | | | | | | | | | | | | | | | |
| | | | |
| Hotels, Restaurants & Leisure: 3.79% | | | | | | | | | | | | | | | | |
Fiesta Restaurant Group Incorporated † | | | | | | | | | | | 100,565 | | | | 2,527,198 | |
Jack in the Box Incorporated | | | | | | | | | | | 58,340 | | | | 4,970,568 | |
Planet Fitness Incorporated Class A Ǡ | | | | | | | | | | | 233,881 | | | | 4,177,115 | |
The Habit Restaurants Incorporated Class A Ǡ | | | | | | | | | | | 636,258 | | | | 11,382,656 | |
Wingstop Incorporated Ǡ | | | | | | | | | | | 269,058 | | | | 7,506,718 | |
Zoe’s Kitchen Incorporated «† | | | | | | | | | | | 93,210 | | | | 3,441,313 | |
| |
| | | | 34,005,568 | |
| | | | | | | | | | | | | | | | |
| | | | |
| Household Durables: 0.33% | | | | | | | | | | | | | | | | |
Universal Electronics Incorporated † | | | | | | | | | | | 45,300 | | | | 2,941,329 | |
| | | | | | | | | | | | | | | | |
| | | | |
| Leisure Products: 0.48% | | | | | | | | | | | | | | | | |
MCBC Holdings Incorporated † | | | | | | | | | | | 279,012 | | | | 4,291,205 | |
| | | | | | | | | | | | | | | | |
| | | | |
| Media: 1.31% | | | | | | | | | | | | | | | | |
IMAX Corporation † | | | | | | | | | | | 352,460 | | | | 11,751,016 | |
| | | | | | | | | | | | | | | | |
| | | | |
| Specialty Retail: 2.67% | | | | | | | | | | | | | | | | |
Five Below Incorporated † | | | | | | | | | | | 76,207 | | | | 3,190,025 | |
Lithia Motors Incorporated Class A | | | | | | | | | | | 132,820 | | | | 10,936,399 | |
Monro Muffler Brake Incorporated | | | | | | | | | | | 41,437 | | | | 2,608,459 | |
Sportsman’s Warehouse Holdings Incorporated † | | | | | | | | | | | 843,623 | | | | 7,288,903 | |
| |
| | | | 24,023,786 | |
| | | | | | | | | | | | | | | | |
| | | | |
| Textiles, Apparel & Luxury Goods: 0.97% | | | | | | | | | | | | | | | | |
G-III Apparel Group Limited † | | | | | | | | | | | 223,680 | | | | 8,750,362 | |
| | | | | | | | | | | | | | | | |
| | | | |
Energy: 2.84% | | | | | | | | | | | | | | | | |
| | | | |
| Oil, Gas & Consumable Fuels: 2.84% | | | | | | | | | | | | | | | | |
Matador Resources Company † | | | | | | | | | | | 211,056 | | | | 4,795,192 | |
PDC Energy Incorporated † | | | | | | | | | | | 145,970 | | | | 8,473,559 | |
RSP Permian Incorporated † | | | | | | | | | | | 372,758 | | | | 12,274,921 | |
| |
| | | | 25,543,672 | |
| | | | | | | | | | | | | | | | |
| | | | |
Financials: 5.35% | | | | | | | | | | | | | | | | |
| | | | |
| Capital Markets: 0.30% | | | | | | | | | | | | | | | | |
Financial Engines Incorporated « | | | | | | | | | | | 97,090 | | | | 2,683,568 | |
| | | | | |
The accompanying notes are an integral part of these financial statements.
| | | | | | |
| Portfolio of investments—May 31, 2016 | | Wells Fargo Equity Gateway Funds | | | 83 | |
EMERGING GROWTH PORTFOLIO
| | | | | | | | | | | | | | | | |
| Security name | | | | | | | | Shares | | | Value | |
| | | | |
| Diversified Financial Services: 3.61% | | | | | | | | | | | | | | | | |
MarketAxess Holdings Incorporated | | | | | | | | | | | 232,241 | | | $ | 32,499,806 | |
| | | | | |
| | | | |
| Thrifts & Mortgage Finance: 1.44% | | | | | | | | | | | | | | | | |
LendingTree Incorporated Ǡ | | | | | | | | | | | 155,312 | | | | 12,929,724 | |
| | | | | |
| | | | |
Health Care: 32.24% | | | | | | | | | | | | | | | | |
| | | | |
| Biotechnology: 4.62% | | | | | | | | | | | | | | | | |
Alder Biopharmaceuticals Incorporated † | | | | | | | | | | | 109,100 | | | | 3,280,637 | |
Ligand Pharmaceuticals Incorporated Ǡ | | | | | | | | | | | 151,180 | | | | 18,079,616 | |
Radius Health Incorporated Ǡ | | | | | | | | | | | 138,345 | | | | 5,016,390 | |
Repligen Corporation † | | | | | | | | | | | 345,720 | | | | 8,283,451 | |
Ultragenyx Pharmaceutical Incorporated † | | | | | | | | | | | 93,134 | | | | 6,808,095 | |
| |
| | | | 41,468,189 | |
| | | | | |
| | | | |
| Health Care Equipment & Supplies: 14.19% | | | | | | | | | | | | | | | | |
Abiomed Incorporated † | | | | | | | | | | | 99,730 | | | | 9,904,186 | |
Cerus Corporation Ǡ | | | | | | | | | | | 765,578 | | | | 4,256,614 | |
Cynosure Incorporated Class A † | | | | | | | | | | | 350,398 | | | | 16,738,512 | |
Entellus Medical Incorporated Ǡ | | | | | | | | | | | 285,455 | | | | 5,121,063 | |
Glaukos Corporation † | | | | | | | | | | | 291,082 | | | | 7,087,847 | |
Inogen Incorporated † | | | | | | | | | | | 289,670 | | | | 13,828,846 | |
Integra LifeSciences Holdings Corporation | | | | | | | | | | | 36,100 | | | | 2,697,031 | |
Natus Medical Incorporated † | | | | | | | | | | | 229,400 | | | | 7,416,502 | |
Nevro Corporation Ǡ | | | | | | | | | | | 247,965 | | | | 17,288,120 | |
NxStage Medical Incorporated † | | | | | | | | | | | 931,950 | | | | 17,613,855 | |
The Spectranetics Corporation † | | | | | | | | | | | 885,169 | | | | 16,216,296 | |
Zeltiq Aesthetics Incorporated Ǡ | | | | | | | | | | | 328,200 | | | | 9,340,572 | |
| |
| | | | 127,509,444 | |
| | | | | |
| | | | |
| Health Care Providers & Services: 9.55% | | | | | | | | | | | | | | | | |
AAC Holdings Incorporated Ǡ | | | | | | | | | | | 141,639 | | | | 3,046,655 | |
Acadia Healthcare Company Incorporated † | | | | | | | | | | | 523,230 | | | | 30,802,550 | |
Adeptus Health Incorporated Class A Ǡ | | | | | | | | | | | 79,987 | | | | 5,719,071 | |
Diplomat Pharmacy Incorporated Ǡ | | | | | | | | | | | 285,406 | | | | 9,298,527 | |
ExamWorks Group Incorporated † | | | | | | | | | | | 482,658 | | | | 16,849,591 | |
HealthEquity Incorporated † | | | | | | | | | | | 602,042 | | | | 15,538,704 | |
Teladoc Incorporated Ǡ | | | | | | | | | | | 401,259 | | | | 4,586,390 | |
| |
| | | | 85,841,488 | |
| | | | | |
| | | | |
| Health Care Technology: 0.80% | | | | | | | | | | | | | | | | |
Veeva Systems Incorporated Class A † | | | | | | | | | | | 217,920 | | | | 7,180,464 | |
| | | | | |
| | | | |
| Life Sciences Tools & Services: 1.99% | | | | | | | | | | | | | | | | |
ICON plc ADR † | | | | | | | | | | | 107,780 | | | | 7,592,023 | |
INC Research Holdings Incorporated Class A † | | | | | | | | | | | 235,945 | | | | 10,265,967 | |
| |
| | | | 17,857,990 | |
| | | | | |
| | | | |
| Pharmaceuticals: 1.09% | | | | | | | | | | | | | | | | |
Intersect ENT Incorporated † | | | | | | | | | | | 117,220 | | | | 1,539,099 | |
The accompanying notes are an integral part of these financial statements.
| | | | |
| 84 | | Wells Fargo Equity Gateway Funds | | Portfolio of investments—May 31, 2016 |
EMERGING GROWTH PORTFOLIO
| | | | | | | | | | | | | | | | |
| Security name | | | | | | | | Shares | | | Value | |
| | | | |
| Pharmaceuticals (continued) | | | | | | | | | | | | | | | | |
Pacira Pharmaceuticals Incorporated Ǡ | | | | | | | | | | | 177,990 | | | $ | 8,278,315 | |
| | | | |
| | | | | | | | | | | | | | | 9,817,414 | |
| | | | | | | | | | | | | | | | |
| | | | |
Industrials: 11.52% | | | | | | | | | | | | | | | | |
| | | | |
| Aerospace & Defense: 0.62% | | | | | | | | | | | | | | | | |
HEICO Corporation | | | | | | | | | | | 83,300 | | | | 5,543,615 | |
| | | | | |
| | | | |
| Airlines: 0.63% | | | | | | | | | | | | | | | | |
SkyWest Incorporated | | | | | | | | | | | 241,600 | | | | 5,701,760 | |
| | | | | |
| | | | |
| Building Products: 0.98% | | | | | | | | | | | | | | | | |
Apogee Enterprises Incorporated | | | | | | | | | | | 194,950 | | | | 8,815,639 | |
| | | | | |
| | | | |
| Commercial Services & Supplies: 0.82% | | | | | | | | | | | | | | | | |
G&K Services Incorporated Class A | | | | | | | | | | | 49,560 | | | | 3,715,018 | |
Multi-Color Corporation | | | | | | | | | | | 59,400 | | | | 3,703,590 | |
| |
| | | | 7,418,608 | |
| | | | | | | | | | | | | | | | |
| | | | |
| Construction & Engineering: 1.39% | | | | | | | | | | | | | | | | |
Dycom Industries Incorporated † | | | | | | | | | | | 125,470 | | | | 10,651,148 | |
Granite Construction Incorporated | | | | | | | | | | | 42,200 | | | | 1,811,646 | |
| |
| | | | 12,462,794 | |
| | | | | | | | | | | | | | | | |
| | | | |
| Machinery: 2.36% | | | | | | | | | | | | | | | | |
John Bean Technologies Corporation | | | | | | | | | | | 154,160 | | | | 9,354,429 | |
Milacron Holdings Corporation Ǡ | | | | | | | | | | | 454,708 | | | | 7,457,211 | |
Mueller Water Products Incorporated Class A | | | | | | | | | | | 397,700 | | | | 4,378,677 | |
| | | | |
| | | | | | | | | | | | | | | 21,190,317 | |
| | | | | | | | | | | | | | | | |
| | | | |
| Professional Services: 4.72% | | | | | | | | | | | | | | | | |
CEB Incorporated | | | | | | | | | | | 62,476 | | | | 3,983,470 | |
On Assignment Incorporated † | | | | | | | | | | | 510,813 | | | | 19,242,326 | |
Wageworks Incorporated † | | | | | | | | | | | 341,866 | | | | 19,161,589 | |
| | | | |
| | | | | | | | | | | | | | | 42,387,385 | |
| | | | | | | | | | | | | | | | |
| | | | |
Information Technology: 34.04% | | | | | | | | | | | | | | | | |
| | | | |
| Communications Equipment: 0.77% | | | | | | | | | | | | | | | | |
Infinera Corporation † | | | | | | | | | | | 528,153 | | | | 6,924,086 | |
| | | | | |
| | | | |
| Internet Software & Services: 11.18% | | | | | | | | | | | | | | | | |
2U Incorporated Ǡ | | | | | | | | | | | 208,810 | | | | 5,813,270 | |
Demandware Incorporated † | | | | | | | | | | | 216,450 | | | | 10,387,436 | |
Envestnet Incorporated † | | | | | | | | | | | 607,642 | | | | 20,532,223 | |
LogMeIn Incorporated † | | | | | | | | | | | 136,600 | | | | 8,369,482 | |
Q2 Holdings Incorporated † | | | | | | | | | | | 794,743 | | | | 19,852,680 | |
SPS Commerce Incorporated † | | | | | | | | | | | 446,298 | | | | 24,323,241 | |
Stamps.com Incorporated † | | | | | | | | | | | 61,150 | | | | 5,564,039 | |
Xactly Corporation † | | | | | | | | | | | 569,901 | | | | 5,619,224 | |
| |
| | | | 100,461,595 | |
| | | | | | | | | | | | | | | | |
The accompanying notes are an integral part of these financial statements.
| | | | | | |
| Portfolio of investments—May 31, 2016 | | Wells Fargo Equity Gateway Funds | | | 85 | |
EMERGING GROWTH PORTFOLIO
| | | | | | | | | | | | | | | | |
| Security name | | | | | | | | Shares | | | Value | |
| | | | |
| IT Services: 3.02% | | | | | | | | | | | | | | | | |
InterXion Holding NV † | | | | | | | | | | | 635,870 | | | $ | 23,819,690 | |
Maximus Incorporated | | | | | | | | | | | 56,560 | | | | 3,260,684 | |
| | | | | | | | | | | | | | | 27,080,374 | |
| | | | | | | | | | | | | | | | |
| | | | |
| Semiconductors & Semiconductor Equipment: 2.48% | | | | | | | | | | | | | | | | |
Cavium Incorporated † | | | | | | | | | | | 117,580 | | | | 5,849,605 | |
Microsemi Corporation † | | | | | | | | | | | 232,060 | | | | 7,850,590 | |
Monolithic Power Systems Incorporated | | | | | | | | | | | 126,090 | | | | 8,615,730 | |
| | | | |
| | | | | | | | | | | | | | | 22,315,925 | |
| | | | | | | | | | | | | | | | |
| | | | |
| Software: 16.59% | | | | | | | | | | | | | | | | |
Callidus Software Incorporated † | | | | | | | | | | | 730,162 | | | | 13,551,802 | |
CommVault Systems Incorporated † | | | | | | | | | | | 80,300 | | | | 3,635,984 | |
CyberArk Software Limited Ǡ | | | | | | | | | | | 234,750 | | | | 10,662,345 | |
Fleetmatics Group plc † | | | | | | | | | | | 253,480 | | | | 10,367,332 | |
Guidewire Software Incorporated † | | | | | | | | | | | 71,181 | | | | 4,178,325 | |
HubSpot Incorporated † | | | | | | | | | | | 236,266 | | | | 11,284,064 | |
Paycom Software Incorporated † | | | | | | | | | | | 386,950 | | | | 15,648,258 | |
Paylocity Holding Corporation † | | | | | | | | | | | 211,353 | | | | 7,758,769 | |
Proofpoint Incorporated † | | | | | | | | | | | 564,560 | | | | 33,094,507 | |
Qlik Technologies Incorporated † | | | | | | | | | | | 425,270 | | | | 12,205,249 | |
Rapid7 Incorporated Ǡ | | | | | | | | | | | 256,669 | | | | 3,298,197 | |
Ringcentral Incorporated Class A † | | | | | | | | | | | 524,240 | | | | 10,348,498 | |
Synchronoss Technologies Incorporated † | | | | | | | | | | | 241,051 | | | | 8,501,869 | |
Tyler Technologies Incorporated † | | | | | | | | | | | 29,335 | | | | 4,496,762 | |
| | | | |
| | | | | | | | | | | | | | | 149,031,961 | |
| | | | | | | | | | | | | | | | |
| | | |
Total Common Stocks (Cost $694,969,727) | | | | | | | | | | | | 881,803,132 | |
| | | | | | | | | | | | | | | | |
| | | | |
| | | Yield | | | | | | | | | | |
| Short-Term Investments: 12.00% | | | | | | | | | | | | | | | | |
| | | | |
| Investment Companies: 12.00% | | | | | | | | | | | | | | | | |
Securities Lending Cash Investments LLC (l)(r)(u) | | | 0.45 | % | | | | | | | 92,823,723 | | | | 92,823,723 | |
Wells Fargo Cash Investment Money Market Fund Select Class (l)(u) | | | 0.41 | | | | | | | | 14,978,235 | | | | 14,978,235 | |
| | | | |
Total Short-Term Investments (Cost $107,801,958) | | | | | | | | | | | | | | | 107,801,958 | |
| | | | | | | | | | | | | | | | |
| | | | | | | | |
| Total investments in securities (Cost $802,771,685) * | | | 110.14 | % | | | 989,605,090 | |
Other assets and liabilities, net | | | (10.14 | ) | | | (91,117,425 | ) |
| | | | | | | | |
| Total net assets | | | 100.00 | % | | $ | 898,487,665 | |
| | | | | | | | |
| † | Non-income-earning security |
| « | All or a portion of this security is on loan. |
| (l) | The issuer of the security is an affiliated person of the Portfolio as defined in the Investment Company Act of 1940. |
| (r) | The investment is a non-registered investment vehicle purchased with cash collateral received from securities on loan. |
| (u) | The rate represents the 7-day annualized yield at period end. |
| * | Cost for federal income tax purposes is $810,183,984 and unrealized gains (losses) consists of: |
| | | | |
Gross unrealized gains | | $ | 221,478,685 | |
Gross unrealized losses | | | (42,057,579 | ) |
| | | | |
Net unrealized gains | | $ | 179,421,106 | |
The accompanying notes are an integral part of these financial statements.
| | | | |
| 86 | | Wells Fargo Equity Gateway Funds | | Summary portfolio of investments—May 31, 2016 |
INDEX PORTFOLIO
The Summary portfolio of investments shows the 50 largest portfolio holdings in unaffiliated issuers and any holdings exceeding 1% of the total net assets as of the report date. The remaining securities held are grouped as “Other securities” in each category.
| | | | | | | | | | | | | | | | | | | | |
| Security name | | | | | | | | Shares | | | Value | | | Percent of
net assets | |
| | | | | |
Common Stocks: 98.62% | | | | | | | | | | | | | | | | | | | | |
| | | | | |
Consumer Discretionary: 12.38% | | | | | | | | | | | | | | | | | | | | |
| | | | | |
| Auto Components: 0.34% | | | | | | | | | | | | | | | | | | | | |
Other securities | | | | | | | | | | | | | | $ | 7,886,248 | | | | 0.34 | % |
| | | | | | | | | | | | | | | | | | | | |
| | | | | |
| Automobiles: 0.57% | | | | | | | | | | | | | | | | | | | | |
Other securities | | | | | | | | | | | | | | | 13,284,003 | | | | 0.57 | |
| | | | | | | | | | | | | | | | | | | | |
| | | | | |
| Distributors: 0.13% | | | | | | | | | | | | | | | | | | | | |
Other securities | | | | | | | | | | | | | | | 3,111,665 | | | | 0.13 | |
| | | | | | | | | | | | | | | | | | | | |
| | | | | |
| Diversified Consumer Services: 0.03% | | | | | | | | | | | | | | | | | | | | |
Other securities | | | | | | | | | | | | | | | 637,041 | | | | 0.03 | |
| | | | | | | | | | | | | | | | | | | | |
| | | | | |
| Hotels, Restaurants & Leisure: 1.73% | | | | | | | | | | | | | | | | | | | | |
McDonald’s Corporation | | | | | | | | | | | 113,965 | | | | 13,910,568 | | | | 0.59 | |
Starbucks Corporation | | | | | | | | | | | 186,834 | | | | 10,255,318 | | | | 0.44 | |
Other securities | | | | | | | | | | | | | | | 16,388,522 | | | | 0.70 | |
| | | | | |
| | | | | | | | | | | | | | | 40,554,408 | | | | 1.73 | |
| | | | | | | | | | | | | | | | | | | | |
| | | | | |
| Household Durables: 0.48% | | | | | | | | | | | | | | | | | | | | |
Other securities | | | | | | | | | | | | | | | 11,299,293 | | | | 0.48 | |
| | | | | | | | | | | | | | | | | | | | |
| | | | | |
| Internet & Catalog Retail: 2.20% | | | | | | | | | | | | | | | | | | | | |
Amazon.com Incorporated † | | | | | | | | | | | 48,803 | | | | 35,274,320 | | | | 1.51 | |
Other securities | | | | | | | | | | | | | | | 16,121,438 | | | | 0.69 | |
| | | | | |
| | | | | | | | | | | | | | | 51,395,758 | | | | 2.20 | |
| | | | | | | | | | | | | | | | | | | | |
| | | | | |
| Leisure Products: 0.11% | | | | | | | | | | | | | | | | | | | | |
Other securities | | | | | | | | | | | | | | | 2,609,363 | | | | 0.11 | |
| | | | | | | | | | | | | | | | | | | | |
| | | | | |
| Media: 2.76% | | | | | | | | | | | | | | | | | | | | |
Comcast Corporation Class A | | | | | | | | | | | 307,530 | | | | 19,466,649 | | | | 0.83 | |
The Walt Disney Company | | | | | | | | | | | 189,735 | | | | 18,825,507 | | | | 0.80 | |
Other securities | | | | | | | | | | | | | | | 26,322,549 | | | | 1.13 | |
| | | | | |
| | | | | | | | | | | | | | | 64,614,705 | | | | 2.76 | |
| | | | | | | | | | | | | | | | | | | | |
| | | | | |
| Multiline Retail: 0.60% | | | | | | | | | | | | | | | | | | | | |
Other securities | | | | | | | | | | | | | | | 14,012,634 | | | | 0.60 | |
| | | | | | | | | | | | | | | | | | | | |
| | | | | |
| Specialty Retail: 2.61% | | | | | | | | | | | | | | | | | | | | |
The Home Depot Incorporated | | | | | | | | | | | 160,262 | | | | 21,173,815 | | | | 0.90 | |
Other securities | | | | | | | | | | | | | | | 39,991,483 | | | | 1.71 | |
| | | | | |
| | | | | | | | | | | | | | | 61,165,298 | | | | 2.61 | |
| | | | | | | | | | | | | | | | | | | | |
| | | | | |
Textiles, Apparel & Luxury Goods: 0.82% | | | | | | | | | | | | | | | | | | | | |
Other securities | | | | | | | | | | | | | | | 19,123,892 | | | | 0.82 | |
| | | | | | | | | | | | | | | | | | | | |
The accompanying notes are an integral part of these financial statements.
| | | | | | |
| Summary portfolio of investments—May 31, 2016 | | Wells Fargo Equity Gateway Funds | | | 87 | |
INDEX PORTFOLIO
| | | | | | | | | | | | | | | | | | | | |
| Security name | | | | | | | | Shares | | | Value | | | Percent of
net assets | |
| | | | | |
Consumer Staples: 9.94% | | | | | | | | | | | | | | | | | | | | |
| | | | | |
| Beverages: 2.24% | | | | | | | | | | | | | | | | | | | | |
PepsiCo Incorporated | | | | | | | | | | | 182,703 | | | $ | 18,484,063 | | | | 0.79 | % |
The Coca-Cola Company | | | | | | | | | | | 492,530 | | | | 21,966,838 | | | | 0.94 | |
Other securities | | | | | | | | | | | | | | | 11,966,753 | | | | 0.51 | |
| | | | | |
| | | | | | | | | | | | | | | 52,417,654 | | | | 2.24 | |
| | | | | | | | | | | | | | | | | | | | |
| | | | | |
| Food & Staples Retailing: 2.27% | | | | | | | | | | | | | | | | | | | | |
CVS Health Corporation | | | | | | | | | | | 138,851 | | | | 13,392,179 | | | | 0.57 | |
Wal-Mart Stores Incorporated | | | | | | | | | | | 198,315 | | | | 14,036,736 | | | | 0.60 | |
Other securities | | | | | | | | | | | | | | | 25,639,454 | | | | 1.10 | |
| | | | | |
| | | | | | | | | | | | | | | 53,068,369 | | | | 2.27 | |
| | | | | | | | | | | | | | | | | | | | |
| | | | | |
| Food Products: 1.70% | | | | | | | | | | | | | | | | | | | | |
Other securities | | | | | | | | | | | | | | | 39,787,489 | | | | 1.70 | |
| | | | | | | | | | | | | | | | | | | | |
| | | | | |
| Household Products: 1.90% | | | | | | | | | | | | | | | | | | | | |
The Procter & Gamble Company | | | | | | | | | | | 335,289 | | | | 27,171,821 | | | | 1.16 | |
Other securities | | | | | | | | | | | | | | | 17,458,605 | | | | 0.74 | |
| | | | | |
| | | | | | | | | | | | | | | 44,630,426 | | | | 1.90 | |
| | | | | | | | | | | | | | | | | | | | |
| | | | | |
| Personal Products: 0.11% | | | | | | | | | | | | | | | | | | | | |
Other securities | | | | | | | | | | | | | | | 2,574,521 | | | | 0.11 | |
| | | | | | | | | | | | | | | | | | | | |
| | | | | |
| Tobacco: 1.72% | | | | | | | | | | | | | | | | | | | | |
Altria Group Incorporated | | | | | | | | | | | 247,486 | | | | 15,750,009 | | | | 0.67 | |
Philip Morris International | | | | | | | | | | | 195,840 | | | | 19,325,491 | | | | 0.83 | |
Other securities | | | | | | | | | | | | | | | 5,200,757 | | | | 0.22 | |
| | | | | |
| | | | | | | | | | | | | | | 40,276,257 | | | | 1.72 | |
| | | | | | | | | | | | | | | | | | | | |
| | | | | |
Energy: 7.03% | | | | | | | | | | | | | | | | | | | | |
| | | | | |
| Energy Equipment & Services: 1.04% | | | | | | | | | | | | | | | | | | | | |
Schlumberger Limited | | | | | | | | | | | 175,750 | | | | 13,409,725 | | | | 0.57 | |
Other securities | | | | | | | | | | | | | | | 10,958,290 | | | | 0.47 | |
| | | | | |
| | | | | | | | | | | | | | | 24,368,015 | | | | 1.04 | |
| | | | | | | | | | | | | | | | | | | | |
| | | | | |
| Oil, Gas & Consumable Fuels: 5.99% | | | | | | | | | | | | | | | | | | | | |
Chevron Corporation | | | | | | | | | | | 238,034 | | | | 24,041,434 | | | | 1.03 | |
Exxon Mobil Corporation | | | | | | | | | | | 524,916 | | | | 46,728,022 | | | | 2.00 | |
Other securities | | | | | | | | | | | | | | | 69,443,032 | | | | 2.96 | |
| | | | | |
| | | | | | | | | | | | | | | 140,212,488 | | | | 5.99 | |
| | | | | | | | | | | | | | | | | | | | |
| | | | | |
Financials: 16.07% | | | | | | | | | | | | | | | | | | | | |
| | | | | |
| Banks: 5.55% | | | | | | | | | | | | | | | | | | | | |
Bank of America Corporation | | | | | | | | | | | 1,305,178 | | | | 19,303,583 | | | | 0.82 | |
Citigroup Incorporated | | | | | | | | | | | 372,647 | | | | 17,354,171 | | | | 0.74 | |
JPMorgan Chase & Company | | | | | | | | | | | 463,928 | | | | 30,280,581 | | | | 1.29 | |
The accompanying notes are an integral part of these financial statements.
| | | | |
| 88 | | Wells Fargo Equity Gateway Funds | | Summary portfolio of investments—May 31, 2016 |
INDEX PORTFOLIO
| | | | | | | | | | | | | | | | | | | | |
| Security name | | | | | | | | Shares | | | Value | | | Percent of
net assets | |
| | | | | |
| Banks (continued) | | | | | | | | | | | | | | | | | | | | |
Wells Fargo & Company (l) | | | | | | | | | | | 583,952 | | | $ | 29,618,045 | | | | 1.27 | % |
Other securities | | | | | | | | | | | | | | | 33,288,574 | | | | 1.43 | |
| | | | | |
| | | | | | | | | | | | | | | 129,844,954 | | | | 5.55 | |
| | | | | | | | | | | | | | | | | | | | |
| | | | | |
| Capital Markets: 1.93% | | | | | | | | | | | | | | | | | | | | |
Other securities | | | | | | | | | | | | | | | 45,232,634 | | | | 1.93 | |
| | | | | | | | | | | | | | | | | | | | |
| | | | | |
| Consumer Finance: 0.79% | | | | | | | | | | | | | | | | | | | | |
Other securities | | | | | | | | | | | | | | | 18,550,439 | | | | 0.79 | |
| | | | | | | | | | | | | | | | | | | | |
| | | | | |
| Diversified Financial Services: 2.10% | | | | | | | | | | | | | | | | | | | | |
Berkshire Hathaway Incorporated Class B † | | | | | | | | | | | 236,820 | | | | 33,282,683 | | | | 1.42 | |
Other securities | | | | | | | | | | | | | | | 15,844,996 | | | | 0.68 | |
| | | | | |
| | | | | | | | | | | | | | | 49,127,679 | | | | 2.10 | |
| | | | | | | | | | | | | | | | | | | | |
| | | | | |
| Insurance: 2.71% | | | | | | | | | | | | | | | | | | | | |
Other securities | | | | | | | | | | | | | | | 63,425,299 | | | | 2.71 | |
| | | | | | | | | | | | | | | | | | | | |
| | | | | |
| Real Estate Management & Development: 0.05% | | | | | | | | | | | | | | | | | | | | |
Other securities | | | | | | | | | | | | | | | 1,097,167 | | | | 0.05 | |
| | | | | | | | | | | | | | | | | | | | |
| | | | | |
| REITs: 2.94% | | | | | | | | | | | | | | | | | | | | |
Other securities | | | | | | | | | | | | | | | 68,932,148 | | | | 2.94 | |
| | | | | | | | | | | | | | | | | | | | |
| | | | | |
Health Care: 14.50% | | | | | | | | | | | | | | | | | | | | |
| | | | | |
| Biotechnology: 3.26% | | | | | | | | | | | | | | | | | | | | |
AbbVie Incorporated | | | | | | | | | | | 203,663 | | | | 12,816,513 | | | | 0.55 | |
Amgen Incorporated | | | | | | | | | | | 95,066 | | | | 15,015,675 | | | | 0.64 | |
Celgene Corporation † | | | | | | | | | | | 98,804 | | | | 10,425,798 | | | | 0.45 | |
Gilead Sciences Incorporated | | | | | | | | | | | 172,772 | | | | 15,041,530 | | | | 0.64 | |
Other securities | | | | | | | | | | | | | | | 23,038,465 | | | | 0.98 | |
| | | | | |
| | | | | | | | | | | | | | | 76,337,981 | | | | 3.26 | |
| | | | | | | | | | | | | | | | | | | | |
| | | | | |
| Health Care Equipment & Supplies: 2.34% | | | | | | | | | | | | | | | | | | | | |
Medtronic plc | | | | | | | | | | | 177,741 | | | | 14,304,596 | | | | 0.61 | |
Other securities | | | | | | | | | | | | | | | 40,350,847 | | | | 1.73 | |
| | | | | |
| | | | | | | | | | | | | | | 54,655,443 | | | | 2.34 | |
| | | | | | | | | | | | | | | | | | | | |
| | | | | |
| Health Care Providers & Services: 2.65% | | | | | | | | | | | | | | | | | | | | |
UnitedHealth Group Incorporated | | | | | | | | | | | 120,167 | | | | 16,062,723 | | | | 0.68 | |
Other securities | | | | | | | | | | | | | | | 46,048,368 | | | | 1.97 | |
| | | | | |
| | | | | | | | | | | | | | | 62,111,091 | | | | 2.65 | |
| | | | | | | | | | | | | | | | | | | | |
| | | | | |
| Health Care Technology: 0.09% | | | | | | | | | | | | | | | | | | | | |
Other securities | | | | | | | | | | | | | | | 2,127,138 | | | | 0.09 | |
| | | | | | | | | | | | | | | | | | | | |
| | | | | |
| Life Sciences Tools & Services: 0.61% | | | | | | | | | | | | | | | | | | | | |
Other securities | | | | | | | | | | | | | | | 14,366,808 | | | | 0.61 | |
| | | | | | | | | | | | | | | | | | | | |
The accompanying notes are an integral part of these financial statements.
| | | | | | |
| Summary portfolio of investments—May 31, 2016 | | Wells Fargo Equity Gateway Funds | | | 89 | |
INDEX PORTFOLIO
| | | | | | | | | | | | | | | | | | | | |
| Security name | | | | | | | | Shares | | | Value | | | Percent of
net assets | |
| | | | | |
| Pharmaceuticals: 5.55% | | | | | | | | | | | | | | | | | | | | |
Allergan plc † | | | | | | | | | | | 49,889 | | | $ | 11,761,332 | | | | 0.50 | % |
Bristol-Myers Squibb Company | | | | | | | | | | | 211,023 | | | | 15,130,349 | | | | 0.65 | |
Johnson & Johnson | | | | | | | | | | | 348,788 | | | | 39,304,920 | | | | 1.68 | |
Merck & Company Incorporated | | | | | | | | | | | 350,798 | | | | 19,735,895 | | | | 0.84 | |
Pfizer Incorporated | | | | | | | | | | | 764,495 | | | | 26,527,977 | | | | 1.13 | |
Other securities | | | | | | | | | | | | | | | 17,309,257 | | | | 0.75 | |
| | | | | |
| | | | | | | | | | | | | | | 129,769,730 | | | | 5.55 | |
| | | | | | | | | | | | | | | | | | | | |
| | | | | |
Industrials: 9.89% | | | | | | | | | | | | | | | | | | | | |
| | | | | |
| Aerospace & Defense: 2.47% | | | | | | | | | | | | | | | | | | | | |
Honeywell International Incorporated | | | | | | | | | | | 97,244 | | | | 11,069,285 | | | | 0.47 | |
The Boeing Company | | | | | | | | | | | 78,717 | | | | 9,930,150 | | | | 0.42 | |
Other securities | | | | | | | | | | | | | | | 36,863,920 | | | | 1.58 | |
| | | | | |
| | | | | | | | | | | | | | | 57,863,355 | | | | 2.47 | |
| | | | | | | | | | | | | | | | | | | | |
| | | | | |
| Air Freight & Logistics: 0.72% | | | | | | | | | | | | | | | | | | | | |
Other securities | | | | | | | | | | | | | | | 16,813,712 | | | | 0.72 | |
| | | | | | | | | | | | | | | | | | | | |
| | | | | |
| Airlines: 0.56% | | | | | | | | | | | | | | | | | | | | |
Other securities | | | | | | | | | | | | | | | 13,101,665 | | | | 0.56 | |
| | | | | | | | | | | | | | | | | | | | |
| | | | | |
| Building Products: 0.09% | | | | | | | | | | | | | | | | | | | | |
Other securities | | | | | | | | | | | | | | | 2,199,357 | | | | 0.09 | |
| | | | | | | | | | | | | | | | | | | | |
| | | | | |
| Commercial Services & Supplies: 0.41% | | | | | | | | | | | | | | | | | | | | |
Other securities | | | | | | | | | | | | | | | 9,486,053 | | | | 0.41 | |
| | | | | | | | | | | | | | | | | | | | |
| | | | | |
| Construction & Engineering: 0.09% | | | | | | | | | | | | | | | | | | | | |
Other securities | | | | | | | | | | | | | | | 2,170,658 | | | | 0.09 | |
| | | | | | | | | | | | | | | | | | | | |
| | | | | |
| Electrical Equipment: 0.54% | | | | | | | | | | | | | | | | | | | | |
Other securities | | | | | | | | | | | | | | | 12,588,715 | | | | 0.54 | |
| | | | | | | | | | | | | | | | | | | | |
| | | | | |
| Industrial Conglomerates: 2.48% | | | | | | | | | | | | | | | | | | | | |
3M Company | | | | | | | | | | | 76,478 | | | | 12,872,777 | | | | 0.55 | |
General Electric Company | | | | | | | | | | | 1,179,405 | | | | 35,653,413 | | | | 1.52 | |
Other securities | | | | | | | | | | | | | | | 9,618,219 | | | | 0.41 | |
| | | | | |
| | | | | | | | | | | | | | | 58,144,409 | | | | 2.48 | |
| | | | | | | | | | | | | | | | | | | | |
| | | | | |
| Machinery: 1.27% | | | | | | | | | | | | | | | | | | | | |
Other securities | | | | | | | | | | | | | | | 29,656,290 | | | | 1.27 | |
| | | | | | | | | | | | | | | | | | | | |
| | | | | |
| Professional Services: 0.31% | | | | | | | | | | | | | | | | | | | | |
Other securities | | | | | | | | | | | | | | | 7,149,770 | | | | 0.31 | |
| | | | | | | | | | | | | | | | | | | | |
| | | | | |
| Road & Rail: 0.77% | | | | | | | | | | | | | | | | | | | | |
Other securities | | | | | | | | | | | | | | | 18,072,541 | | | | 0.77 | |
| | | | | | | | | | | | | | | | | | | | |
The accompanying notes are an integral part of these financial statements.
| | | | |
| 90 | | Wells Fargo Equity Gateway Funds | | Summary portfolio of investments—May 31, 2016 |
INDEX PORTFOLIO
| | | | | | | | | | | | | | | | | | | | |
| Security name | | | | | | | | Shares | | | Value | | | Percent of
net assets | |
| | | | | |
| Trading Companies & Distributors: 0.18% | | | | | | | | | | | | | | | | | | | | |
Other securities | | | | | | | | | | | | | | $ | 4,118,945 | | | | 0.18 | % |
| | | | | | | | | | | | | | | | | | | | |
| | | | | |
Information Technology: 20.09% | | | | | | | | | | | | | | | | | | | | |
| | | | | |
| Communications Equipment: 0.99% | | | | | | | | | | | | | | | | | | | | |
Cisco Systems Incorporated | | | | | | | | | | | 636,069 | | | | 18,477,804 | | | | 0.79 | |
Other securities | | | | | | | | | | | | | | | 4,629,500 | | | | 0.20 | |
| | | | | |
| | | | | | | | | | | | | | | 23,107,304 | | | | 0.99 | |
| | | | | | | | | | | | | | | | | | | | |
| | | | | |
| Electronic Equipment, Instruments & Components: 0.36% | | | | | | | | | | | | | | | | | | | | |
Other securities | | | | | | | | | | | | | | | 8,570,189 | | | | 0.36 | |
| | | | | | | | | | | | | | | | | | | | |
| | | | | |
| Internet Software & Services: 4.25% | | | | | | | | | | | | | | | | | | | | |
Alphabet Incorporated Class A † | | | | | | | | | | | 36,983 | | | | 27,694,720 | | | | 1.18 | |
Alphabet Incorporated Class C † | | | | | | | | | | | 37,562 | | | | 27,635,115 | | | | 1.18 | |
Facebook Incorporated Class A † | | | | | | | | | | | 290,084 | | | | 34,464,880 | | | | 1.47 | |
Other securities | | | | | | | | | | | | | | | 9,790,121 | | | | 0.42 | |
| | | | | |
| | | | | | | | | | | | | | | 99,584,836 | | | | 4.25 | |
| | | | | | | | | | | | | | | | | | | | |
| | | | | |
| IT Services: 3.77% | | | | | | | | | | | | | | | | | | | | |
International Business Machines Corporation | | | | | | | | | | | 111,740 | | | | 17,178,908 | | | | 0.73 | |
MasterCard Incorporated Class A | | | | | | | | | | | 123,941 | | | | 11,885,942 | | | | 0.51 | |
Visa Incorporated Class A | | | | | | | | | | | 242,581 | | | | 19,149,344 | | | | 0.82 | |
Other securities | | | | | | | | | | | | | | | 39,987,166 | | | | 1.71 | |
| | | | | |
| | | | | | | | | | | | | | | 88,201,360 | | | | 3.77 | |
| | | | | | | | | | | | | | | | | | | | |
| | | | | |
| Semiconductors & Semiconductor Equipment: 2.78% | | | | | | | | | | | | | | | | | | | | |
Intel Corporation | | | | | | | | | | | 597,122 | | | | 18,863,084 | | | | 0.81 | |
QUALCOMM Incorporated | | | | | | | | | | | 188,956 | | | | 10,377,464 | | | | 0.44 | |
Other securities | | | | | | | | | | | | | | | 35,787,470 | | | | 1.53 | |
| | | | | |
| | | | | | | | | | | | | | | 65,028,018 | | | | 2.78 | |
| | | | | | | | | | | | | | | | | | | | |
| | | | | |
| Software: 4.21% | | | | | | | | | | | | | | | | | | | | |
Microsoft Corporation | | | | | | | | | | | 999,750 | | | | 52,986,750 | | | | 2.26 | |
Oracle Corporation | | | | | | | | | | | 398,281 | | | | 16,010,896 | | | | 0.68 | |
Other securities | | | | | | | | | | | | | | | 29,566,155 | | | | 1.27 | |
| | | | | |
| | | | | | | | | | | | | | | 98,563,801 | | | | 4.21 | |
| | | | | | | | | | | | | | | | | | | | |
| | | | | |
| Technology Hardware, Storage & Peripherals: 3.73% | | | | | | | | | | | | | | | | | | | | |
Apple Incorporated | | | | | | | | | | | 700,845 | | | | 69,986,382 | | | | 2.99 | |
Other securities | | | | | | | | | | | | | | | 17,236,347 | | | | 0.74 | |
| | | | | |
| | | | | | | | | | | | | | | 87,222,729 | | | | 3.73 | |
| | | | | | | | | | | | | | | | | | | | |
| | | | | |
Materials: 2.81% | | | | | | | | | | | | | | | | | | | | |
| | | | | |
| Chemicals: 2.03% | | | | | | | | | | | | | | | | | | | | |
Other securities | | | | | | | | | | | | | | | 47,609,352 | | | | 2.03 | |
| | | | | | | | | | | | | | | | | | | | |
The accompanying notes are an integral part of these financial statements.
| | | | | | |
| Summary portfolio of investments—May 31, 2016 | | Wells Fargo Equity Gateway Funds | | | 91 | |
INDEX PORTFOLIO
| | | | | | | | | | | | | | | | | | | | |
| Security name | | | | | | | | Shares | | | Value | | | Percent of
net assets | |
| | | | | |
| Construction Materials: 0.15% | | | | | | | | | | | | | | | | | | | | |
Other securities | | | | | | | | | | | | | | $ | 3,502,643 | | | | 0.15 | % |
| | | | | | | | | | | | | | | | | | | | |
| | | | | |
| Containers & Packaging: 0.31% | | | | | | | | | | | | | | | | | | | | |
Other securities | | | | | | | | | | | | | | | 7,133,000 | | | | 0.31 | |
| | | | | | | | | | | | | | | | | | | | |
| | | | | |
| Metals & Mining: 0.32% | | | | | | | | | | | | | | | | | | | | |
Other securities | | | | | | | | | | | | | | | 7,411,248 | | | | 0.32 | |
| | | | | | | | | | | | | | | | | | | | |
| | | | | |
Telecommunication Services: 2.62% | | | | | | | | | | | | | | | | | | | | |
| | | | | |
| Diversified Telecommunication Services: 2.62% | | | | | | | | | | | | | | | | | | | | |
AT&T Incorporated | | | | | | | | | | | 777,524 | | | | 30,440,065 | | | | 1.30 | |
Verizon Communications Incorporated | | | | | | | | | | | 514,941 | | | | 26,210,497 | | | | 1.12 | |
Other securities | | | | | | | | | | | | | | | 4,598,802 | | | | 0.20 | |
| | | | | |
| | | | | | | | | | | | | | | 61,249,364 | | | | 2.62 | |
| | | | | | | | | | | | | | | | | | | | |
| | | | | |
Utilities: 3.29% | | | | | | | | | | | | | | | | | | | | |
| | | | | |
| Electric Utilities: 2.00% | | | | | | | | | | | | | | | | | | | | |
Other securities | | | | | | | | | | | | | | | 46,854,436 | | | | 2.00 | |
| | | | | | | | | | | | | | | | | | | | |
| | | | | |
| Gas Utilities: 0.04% | | | | | | | | | | | | | | | | | | | | |
Other securities | | | | | | | | | | | | | | | 1,001,279 | | | | 0.04 | |
| | | | | | | | | | | | | | | | | | | | |
| | | | | |
| Independent Power & Renewable Electricity Producers: 0.07% | | | | | | | | | | | | | | | | | | | | |
Other securities | | | | | | | | | | | | | | | 1,576,779 | | | | 0.07 | |
| | | | | | | | | | | | | | | | | | | | |
| | | | | |
| Multi-Utilities: 1.11% | | | | | | | | | | | | | | | | | | | | |
Other securities | | | | | | | | | | | | | | | 25,936,618 | | | | 1.11 | |
| | | | | | | | | | | | | | | | | | | | |
| | | | | |
| Water Utilities: 0.07% | | | | | | | | | | | | | | | | | | | | |
Other securities | | | | | | | | | | | | | | | 1,667,324 | | | | 0.07 | |
| | | | | | | | | | | | | | | | | | | | |
| | | | |
Total Common Stocks (Cost $1,106,723,098) | | | | | | | | | | | | 2,308,193,788 | | | | 98.62 | |
| | | | | | | | | | | | | | | | | | | | |
| | | | | |
| | | Yield | | | | | | | | | | | | | |
| Short-Term Investments: 1.69% | | | | | | | | | | | | | | | | | | | | |
| | | | | |
| Investment Companies: 1.61% | | | | | | | | | | | | | | | | | | | | |
Securities Lending Cash Investments LLC (l)(r)(u) | | | 0.45 | % | | | | | | | 12,693,253 | | | | 12,693,253 | | | | 0.54 | |
Wells Fargo Cash Investment Money Market Fund Select Class (l)(u) | | | 0.41 | | | | | | | | 24,960,298 | | | | 24,960,298 | | | | 1.07 | |
| | | | | |
| | | | | | | | | | | | | | | 37,653,551 | | | | 1.61 | |
| | | | | | | | | | | | | | | | | | | | |
| | | | | |
| | | | | | Maturity date | | | Principal | | | | | | | |
| U.S. Treasury Securities: 0.08% | | | | | | | | | | | | | | | | | | | | |
U.S. Treasury Bill #(z) | | | 0.12 | | | | 6-9-2016 | | | $ | 160,000 | | | | 159,995 | | | | 0.01 | |
U.S. Treasury Bill #(z) | | | 0.25 | | | | 7-21-2016 | | | | 255,000 | | | | 254,911 | | | | 0.01 | |
U.S. Treasury Bill #(z) | | | 0.29 | | | | 8-18-2016 | | | | 410,000 | | | | 409,740 | | | | 0.02 | |
U.S. Treasury Bill #(z) | | | 0.33 | | | | 9-1-2016 | | | | 183,000 | | | | 182,841 | | | | 0.01 | |
The accompanying notes are an integral part of these financial statements.
| | | | |
| 92 | | Wells Fargo Equity Gateway Funds | | Summary portfolio of investments—May 31, 2016 |
INDEX PORTFOLIO
| | | | | | | | | | | | | | | | | | | | |
| Security name | | Yield | | | Maturity date | | | Principal | | | Value | | | Percent of
net assets | |
| | | | | |
| U.S. Treasury Securities (continued) | | | | | | | | | | | | | | | | | | | | |
U.S. Treasury Bill #(z) | | | 0.37 | % | | | 10-6-2016 | | | $ | 800,000 | | | $ | 798,948 | | | | 0.03 | % |
| | | | | |
| | | | | | | | | | | | | | | 1,806,435 | | | | 0.08 | |
| | | | | | | | | | | | | | | | | | | | |
| | | | |
Total Short-Term Investments (Cost $39,460,647) | | | | | | | | | | | | 39,459,986 | | | | 1.69 | |
| | | | | | | | | | | | | | | | | | | | |
| | | | | |
| Total investments in securities (Cost $1,146,183,745)* | | | | | | | | | | | | | | | 2,347,653,774 | | | | 100.31 | |
Other assets and liabilities, net | | | | | | | | | | | | | | | (7,241,316 | ) | | | (0.31 | ) |
| | | | | | | | | | | | | | | | | | | | |
| Total net assets | | | | | | | | | | | | | | $ | 2,340,412,458 | | | | 100.00 | % |
| | | | | | | | | | | | | | | | | | | | |
| † | Non-income-earning security |
| (l) | The issuer of the security is an affiliated person of the Portfolio as defined in the Investment Company Act of 1940. |
| (r) | The investment is a non-registered investment vehicle purchased with cash collateral received from securities on loan. |
| (u) | The rate represents the 7-day annualized yield at period end. |
| (z) | Zero coupon security. The rate represents the current yield to maturity. |
| # | All or a portion of this security is segregated as collateral for investments in derivative instruments. |
| * | Cost for federal income tax purposes is $1,208,116,279 and unrealized gains (losses) consists of: |
| | | | |
Gross unrealized gains | | $ | 1,232,363,587 | |
Gross unrealized losses | | | (92,826,092 | ) |
| | | | |
Net unrealized gains | | $ | 1,139,537,495 | |
The accompanying notes are an integral part of these financial statements.
| | | | | | |
| Portfolio of investments—May 31, 2016 | | Wells Fargo Equity Gateway Funds | | | 93 | |
INTERNATIONAL GROWTH PORTFOLIO
| | | | | | | | | | | | | | | | |
| Security name | | | | | | | | Shares | | | Value | |
| | | | |
Common Stocks: 90.91% | | | | | | | | | | | | | | | | |
| | | | |
| Belgium: 1.98% | | | | | | | | | | | | | | | | |
Anheuser-Busch InBev NV (Consumer Staples, Beverages) | | | | | | | | | | | 7,001 | | | $ | 886,853 | |
Telenet Group Holding NV (Consumer Discretionary, Media)† | | | | | | | | | | | 22,809 | | | | 1,085,943 | |
UCB SA (Health Care, Pharmaceuticals) | | | | | | | | | | | 13,359 | | | | 965,410 | |
| | | | |
| | | | | | | | | | | | | | | 2,938,206 | |
| | | | | | | | | | | | | | | | |
| | | | |
| Canada: 1.52% | | | | | | | | | | | | | | | | |
Canadian Pacific Railway Limited (Industrials, Road & Rail) | | | | | | | | | | | 17,365 | | | | 2,250,330 | |
| | | | | | | | | | | | | | | | |
| | | | |
| China: 1.71% | | | | | | | | | | | | | | | | |
Baidu Incorporated ADR (Information Technology, Internet Software & Services)† | | | | | | | | | | | 11,187 | | | | 1,997,327 | |
Tencent Holdings Limited (Information Technology, Internet Software & Services) | | | | | | | | | | | 24,400 | | | | 544,159 | |
| | | | |
| | | | | | | | | | | | | | | 2,541,486 | |
| | | | | | | | | | | | | | | | |
| | | | |
| Denmark: 0.26% | | | | | | | | | | | | | | | | |
ISS A/S (Industrials, Commercial Services & Supplies) | | | | | | | | | | | 9,457 | | | | 381,268 | |
| | | | | | | | | | | | | | | | |
| | | | |
| France: 8.62% | | | | | | | | | | | | | | | | |
Groupe Danone SA (Consumer Staples, Food Products) | | | | | | | | | | | 55,591 | | | | 3,901,709 | |
L’Oreal SA (Consumer Staples, Personal Products) | | | | | | | | | | | 8,570 | | | | 1,610,531 | |
LVMH Moet Hennessy Louis Vuitton SA (Consumer Discretionary, Textiles, Apparel & Luxury Goods) | | | | | | | | | | | 6,978 | | | | 1,118,415 | |
Orange SA (Telecommunication Services, Diversified Telecommunication Services) | | | | | | | | | | | 97,060 | | | | 1,686,324 | |
Pernod-Ricard SA (Consumer Staples, Beverages) | | | | | | | | | | | 13,944 | | | | 1,519,054 | |
Zodiac Aerospace SA (Industrials, Aerospace & Defense) | | | | | | | | | | | 126,809 | | | | 2,961,565 | |
| | | | |
| | | | | | | | | | | | | | | 12,797,598 | |
| | | | | | | | | | | | | | | | |
| | | | |
| Germany: 13.70% | | | | | | | | | | | | | | | | |
Allianz AG (Financials, Insurance) | | | | | | | | | | | 11,863 | | | | 1,936,348 | |
Bayer AG (Health Care, Pharmaceuticals) | | | | | | | | | | | 33,356 | | | | 3,178,034 | |
Beiersdorf AG (Consumer Staples, Personal Products) | | | | | | | | | | | 27,765 | | | | 2,523,319 | |
Deutsche Boerse AG (Financials, Diversified Financial Services) | | | | | | | | | | | 47,920 | | | | 4,198,808 | |
Linde AG (Materials, Chemicals) | | | | | | | | | | | 27,933 | | | | 4,180,214 | |
Vonovia SE (Financials, Real Estate Management & Development) | | | | | | | | | | | 51,955 | | | | 1,780,768 | |
Wirecard AG (Information Technology, IT Services)« | | | | | | | | | | | 56,945 | | | | 2,531,860 | |
| | | | |
| | | | | | | | | | | | | | | 20,329,351 | |
| | | | | | | | | | | | | | | | |
| | | | |
| Hong Kong: 3.16% | | | | | | | | | | | | | | | | |
AIA Group Limited (Financials, Insurance) | | | | | | | | | | | 801,200 | | | | 4,686,104 | |
| | | | | | | | | | | | | | | | |
| | | | |
| Ireland: 5.33% | | | | | | | | | | | | | | | | |
Allegion plc (Industrials, Building Products) | | | | | | | | | | | 2,032 | | | | 137,444 | |
Medtronic plc (Health Care, Health Care Equipment & Supplies) | | | | | | | | | | | 96,515 | | | | 7,767,527 | |
| | | | |
| | | | | | | | | | | | | | | 7,904,971 | |
| | | | | | | | | | | | | | | | |
| | | | |
| Japan: 12.80% | | | | | | | | | | | | | | | | |
Japan Tobacco Incorporated (Consumer Staples, Tobacco) | | | | | | | | | | | 137,154 | | | | 5,452,223 | |
KDDI Corporation (Telecommunication Services, Wireless Telecommunication Services) | | | | | | | | | | | 53,700 | | | | 1,569,756 | |
NGK Insulators Limited (Industrials, Machinery) | | | | | | | | | | | 93,000 | | | | 2,048,377 | |
Nippon Telegraph and Telephone Corporation (Telecommunication Services, Diversified Telecommunication Services) | | | | | | | | | | | 31,500 | | | | 1,381,067 | |
The accompanying notes are an integral part of these financial statements.
| | | | |
| 94 | | Wells Fargo Equity Gateway Funds | | Portfolio of investments—May 31, 2016 |
INTERNATIONAL GROWTH PORTFOLIO
| | | | | | | | | | | | | | | | |
| Security name | | | | | | | | Shares | | | Value | |
| | | | |
| Japan (continued) | | | | | | | | | | | | | | | | |
NTT DOCOMO Incorporated (Telecommunication Services, Wireless Telecommunication Services) | | | | | | | | | | | 140,893 | | | $ | 3,535,844 | |
Olympus Corporation (Health Care, Health Care Equipment & Supplies) | | | | | | | | | | | 54,600 | | | | 2,314,959 | |
Ono Pharmaceutical Company Limited (Health Care, Pharmaceuticals) | | | | | | | | | | | 22,600 | | | | 1,004,943 | |
Toyota Motor Corporation (Consumer Discretionary, Automobiles) | | | | | | | | | | | 32,300 | | | | 1,686,828 | |
| | | | |
| | | | | | | | | | | | | | | 18,993,997 | |
| | | | | | | | | | | | | | | | |
| | | | |
| Mexico: 0.84% | | | | | | | | | | | | | | | | |
Grupo Televisa SAB ADR (Consumer Discretionary, Media) | | | | | | | | | | | 46,625 | | | | 1,246,753 | |
| | | | | | | | | | | | | | | | |
| | | | |
| South Korea: 0.01% | | | | | | | | | | | | | | | | |
Orion Corporation (Consumer Staples, Food Products) | | | | | | | | | | | 18 | | | | 14,650 | |
| | | | | | | | | | | | | | | | |
| | | | |
| Spain: 1.68% | | | | | | | | | | | | | | | | |
Grifols SA (Health Care, Biotechnology) | | | | | | | | | | | 43,240 | | | | 979,780 | |
Grifols SA ADR (Health Care, Biotechnology) | | | | | | | | | | | 91,232 | | | | 1,508,065 | |
| | | | |
| | | | | | | | | | | | | | | 2,487,845 | |
| | | | | | | | | | | | | | | | |
| | | | |
| Sweden: 0.96% | | | | | | | | | | | | | | | | |
Swedbank AB Class A (Financials, Banks) | | | | | | | | | | | 65,125 | | | | 1,433,455 | |
| | | | | | | | | | | | | | | | |
| | | | |
| Switzerland: 8.53% | | | | | | | | | | | | | | | | |
Actelion Limited (Health Care, Biotechnology) | | | | | | | | | | | 15,960 | | | | 2,618,789 | |
Nestle SA (Consumer Staples, Food Products) | | | | | | | | | | | 94,160 | | | | 6,953,062 | |
Roche Holding AG (Health Care, Pharmaceuticals) | | | | | | | | | | | 9,081 | | | | 2,383,534 | |
Syngenta AG (Materials, Chemicals) | | | | | | | | | | | 1,775 | | | | 697,321 | |
| | | | |
| | | | | | | | | | | | | | | 12,652,706 | |
| | | | | | | | | | | | | | | | |
| | | | |
| Taiwan: 1.20% | | | | | | | | | | | | | | | | |
Taiwan Semiconductor Manufacturing Company Limited (Information Technology, Semiconductors & Semiconductor Equipment) | | | | | | | | | | | 372,000 | | | | 1,785,144 | |
| | | | | | | | | | | | | | | | |
| | | | |
| United Kingdom: 22.59% | | | | | | | | | | | | | | | | |
Aon plc (Financials, Insurance) | | | | | | | | | | | 37,385 | | | | 4,085,059 | |
Babcock International Group plc (Industrials, Commercial Services & Supplies) | | | | | | | | | | | 57,838 | | | | 868,691 | |
British American Tobacco plc (Consumer Staples, Tobacco) | | | | | | | | | | | 25,042 | | | | 1,522,597 | |
Coca Cola European Partners plc (Consumer Staples, Beverages) | | | | | | | | | | | 34,108 | | | | 1,323,731 | |
Croda International plc (Materials, Chemicals) | | | | | | | | | | | 11,912 | | | | 507,231 | |
Delphi Automotive plc (Consumer Discretionary, Auto Components) | | | | | | | | | | | 37,027 | | | | 2,516,355 | |
Diageo plc (Consumer Staples, Beverages) | | | | | | | | | | | 25,404 | | | | 688,229 | |
Imperial Tobacco Group plc (Consumer Staples, Tobacco) | | | | | | | | | | | 46,968 | | | | 2,558,461 | |
Intercontinental Hotels Group plc (Consumer Discretionary, Hotels, Restaurants & Leisure) | | | | | | | | | | | 31,658 | | | | 1,220,118 | |
International Consolidated Airlines Group SA (Industrials, Airlines) | | | | | | | | | | | 283,379 | | | | 2,197,863 | |
Johnson Matthey plc (Materials, Chemicals) | | | | | | | | | | | 24,446 | | | | 1,021,119 | |
Liberty Global plc Class A (Consumer Discretionary, Media) † | | | | | | | | | | | 73,803 | | | | 2,756,542 | |
Liberty Global plc Class C (Consumer Discretionary, Media) † | | | | | | | | | | | 112,794 | | | | 4,075,249 | |
Lloyds Banking Group plc (Financials, Banks) | | | | | | | | | | | 2,149,990 | | | | 2,242,658 | |
Unilever plc (Consumer Staples, Personal Products) | | | | | | | | | | | 81,147 | | | | 3,697,470 | |
WPP plc (Consumer Discretionary, Media) | | | | | | | | | | | 96,877 | | | | 2,233,763 | |
| | | | |
| | | | | | | | | | | | | | | 33,515,136 | |
| | | | | | | | | | | | | | | | |
The accompanying notes are an integral part of these financial statements.
| | | | | | |
| Portfolio of investments—May 31, 2016 | | Wells Fargo Equity Gateway Funds | | | 95 | |
INTERNATIONAL GROWTH PORTFOLIO
| | | | | | | | | | | | | | | | |
| Security name | | | | | | | | Shares | | | Value | |
| | | | |
| United States: 6.02% | | | | | | | | | | | | | | | | |
Amazon.com Incorporated (Consumer Discretionary, Internet & Catalog Retail)† | | | | | | | | | | | 2,170 | | | $ | 1,568,454 | |
Cognizant Technology Solutions Corporation Class A (Information Technology, IT Services)† | | | | | | | | | | | 72,405 | | | | 4,448,563 | |
WABCO Holdings Incorporated (Industrials, Machinery)† | | | | | | | | | | | 11,026 | | | | 1,189,705 | |
Willis Towers Watson plc (Financials, Insurance) | | | | | | | | | | | 13,503 | | | | 1,728,654 | |
| | | | |
| | | | | | | | | | | | | | | 8,935,376 | |
| | | | | | | | | | | | | | | | |
| | | | |
Total Common Stocks (Cost $120,591,514) | | | | | | | | | | | | | | | 134,894,376 | |
| | | | | | | | | | | | | | | | |
| | | | |
| | | | | | Expiration date | | | | | | | |
| Participation Notes: 1.63% | | | | | | | | | | | | | | | | |
| | | | |
| Ireland: 1.63% | | | | | | | | | | | | | | | | |
HSBC Bank plc (Ryanair Holdings plc) (Industrials, Airlines) | | | | | | | 10-29-2018 | | | | 155,215 | | | | 2,418,886 | |
| | | | | | | | | | | | | | | | |
| | | | |
Total Participation Notes (Cost $1,623,518) | | | | | | | | | | | | | | | 2,418,886 | |
| | | | | | | | | | | | | | | | |
| | | | |
| | | Dividend yield | | | | | | | | | | |
| Preferred Stocks: 1.19% | | | | | | | | | | | | | | | | |
| | | | |
| Germany: 1.19% | | | | | | | | | | | | | | | | |
Henkel AG & Company KGaA (Consumer Staples, Household Products) ± | | | 1.43 | % | | | | | | | 15,169 | | | | 1,767,949 | |
| | | | | | | | | | | | | | | | |
| | | | |
Total Preferred Stocks (Cost $1,218,585) | | | | | | | | | | | | | | | 1,767,949 | |
| | | | | | | | | | | | | | | | |
| | | Yield | | | | | | | | | | |
| Short-Term Investments: 8.34% | | | | | | | | | | | | | | | | |
| | | | |
| Investment Companies: 8.34% | | | | | | | | | | | | | | | | |
Securities Lending Cash Investments LLC (l)(r)(u) | | | 0.45 | | | | | | | | 2,506,158 | | | | 2,506,158 | |
Wells Fargo Cash Investment Money Market Fund Select Class (l)(u) | | | 0.41 | | | | | | | | 9,867,059 | | | | 9,867,059 | |
| | | | |
Total Short-Term Investments (Cost $12,373,217) | | | | | | | | | | | | | | | 12,373,217 | |
| | | | | | | | | | | | | | | | |
| | | | | | | | |
| Total investments in securities (Cost $135,806,834) * | | | 102.07 | % | | | 151,454,428 | |
Other assets and liabilities, net | | | (2.07 | ) | | | (3,077,813 | ) |
| | | | | | | | |
| Total net assets | | | 100.00 | % | | $ | 148,376,615 | |
| | | | | | | | |
The accompanying notes are an integral part of these financial statements.
| | | | |
| 96 | | Wells Fargo Equity Gateway Funds | | Portfolio of investments—May 31, 2016 |
INTERNATIONAL GROWTH PORTFOLIO
| † | Non-income-earning security |
| « | All or a portion of this security is on loan. |
| ± | Variable rate investment. The rate shown is the rate in effect at period end. |
| (l) | The issuer of the security is an affiliated person of the Portfolio as defined in the Investment Company Act of 1940. |
| (r) | The investment is a non-registered investment vehicle purchased with cash collateral received from securities on loan. |
| (u) | The rate represents the 7-day annualized yield at period end. |
| * | Cost for federal income tax purposes is $135,907,466 and unrealized gains (losses) consists of: |
| | | | |
Gross unrealized gains | | $ | 17,425,961 | |
Gross unrealized losses | | | (1,878,999 | ) |
| | | | |
Net unrealized gains | | $ | 15,546,962 | |
The following table shows the percent of total long-term investments by sector as of May 31, 2016:
| | | | |
Consumer Staples | | | 24.75 | % |
Health Care | | | 16.34 | |
Financials | | | 15.88 | |
Consumer Discretionary | | | 14.03 | |
Industrials | | | 10.39 | |
Information Technology | | | 8.13 | |
Telecommunication Services | | | 5.88 | |
Materials | | | 4.60 | |
| | | | |
| | | 100.00 | % |
| | | | |
The accompanying notes are an integral part of these financial statements.
| | | | | | |
| Portfolio of investments—May 31, 2016 | | Wells Fargo Equity Gateway Funds | | | 97 | |
INTERNATIONAL VALUE PORTFOLIO
| | | | | | | | | | | | | | | | |
| Security name | | | | | | | | Shares | | | Value | |
| | | | |
Common Stocks: 96.91% | | | | | | | | | | | | | | | | |
| | | | |
| Australia: 5.60% | | | | | | | | | | | | | | | | |
AGL Energy Limited (Utilities, Multi-Utilities) | | | | | | | | | | | 131,500 | | | $ | 1,766,830 | |
Arrium Limited (Materials, Metals & Mining) †(a) | | | | | | | | | | | 3,063,400 | | | | 48,710 | |
Asaleo Care Limited (Consumer Staples, Personal Products) | | | | | | | | | | | 1,262,800 | | | | 1,861,885 | |
Automotive Holdings Group Limited (Consumer Discretionary, Specialty Retail) | | | | | | | | | | | 410,016 | | | | 1,155,723 | |
Bendigo Bank Limited (Financials, Banks) | | | | | | | | | | | 272,500 | | | | 2,016,762 | |
Boart Longyear Limited (Industrials, Construction & Engineering) † | | | | | | | | | | | 199,991 | | | | 14,454 | |
Cabcharge Australia Limited (Industrials, Commercial Services & Supplies) « | | | | | | | | | | | 207,386 | | | | 491,634 | |
Challenger Financial Services Group Limited (Financials, Diversified Financial Services) | | | | | | | | | | | 475,400 | | | | 3,288,208 | |
CSR Limited (Materials, Construction Materials) | | | | | | | | | | | 754,900 | | | | 1,958,719 | |
Downer EDI Limited (Industrials, Commercial Services & Supplies) | | | | | | | | | | | 518,900 | | | | 1,466,387 | |
Lendlease Corporation Limited (Financials, Real Estate Management & Development) | | | | | | | | | | | 350,500 | | | | 3,402,140 | |
McMillan Shakespeare Limited (Industrials, Professional Services) | | | | | | | | | | | 158,800 | | | | 1,719,295 | |
Metcash Limited (Consumer Staples, Food & Staples Retailing) † | | | | | | | | | | | 1,164,200 | | | | 1,724,923 | |
Mincor Resources NL (Materials, Metals & Mining) †(i) | | | | | | | | | | | 570,994 | | | | 119,679 | |
Mineral Resources Limited (Industrials, Commercial Services & Supplies) « | | | | | | | | | | | 144,300 | | | | 857,287 | |
Myer Holdings Limited (Consumer Discretionary, Multiline Retail) « | | | | | | | | | | | 1,059,500 | | | | 857,644 | |
Panoramic Resources Limited (Materials, Metals & Mining) † | | | | | | | | | | | 368,800 | | | | 31,986 | |
Primary Health Care Limited (Health Care, Health Care Providers & Services) | | | | | | | | | | | 339,000 | | | | 950,648 | |
Qantas Airways Limited (Industrials, Airlines) | | | | | | | | | | | 821,700 | | | | 1,829,162 | |
Rio Tinto Limited (Materials, Metals & Mining) | | | | | | | | | | | 58,300 | | | | 1,883,073 | |
Seven Group Holdings Limited (Industrials, Trading Companies & Distributors) | | | | | | | | | | | 165,800 | | | | 659,076 | |
UGL Limited (Industrials, Construction & Engineering) † | | | | | | | | | | | 152,800 | | | | 378,796 | |
| | | | |
| | | | | | | | | | | | | | | 28,483,021 | |
| | | | | | | | | | | | | | | | |
| | | | |
| Austria: 1.13% | | | | | | | | | | | | | | | | |
OMV AG (Energy, Oil, Gas & Consumable Fuels) « | | | | | | | | | | | 62,900 | | | | 1,753,142 | |
Raiffeisen Bank International AG (Financials, Banks) † | | | | | | | | | | | 81,200 | | | | 1,086,425 | |
RHI AG (Materials, Construction Materials) « | | | | | | | | | | | 64,721 | | | | 1,272,809 | |
Voestalpine AG (Materials, Metals & Mining) | | | | | | | | | | | 47,700 | | | | 1,633,865 | |
| | | | |
| | | | | | | | | | | | | | | 5,746,241 | |
| | | | | | | | | | | | | | | | |
| | | | |
| Belgium: 0.81% | | | | | | | | | | | | | | | | |
Delhaize Group SA (Consumer Staples, Food & Staples Retailing) | | | | | | | | | | | 39,400 | | | | 4,130,894 | |
| | | | | | | | | | | | | | | | |
| | | | |
| Brazil: 0.82% | | | | | | | | | | | | | | | | |
Banco do Brasil SA (Financials, Banks) | | | | | | | | | | | 309,500 | | | | 1,410,633 | |
Companhia de Saneamento de Minas Gerais SA (Utilities, Water Utilities) | | | | | | | | | | | 72,400 | | | | 510,503 | |
JBS SA (Consumer Staples, Food Products) | | | | | | | | | | | 805,600 | | | | 2,229,356 | |
| | | | |
| | | | | | | | | | | | | | | 4,150,492 | |
| | | | | | | | | | | | | | | | |
| | | | |
| Canada: 1.54% | | | | | | | | | | | | | | | | |
Magna International Incorporated (Consumer Discretionary, Auto Components) | | | | | | | | | | | 131,600 | | | | 5,343,882 | |
Metro Incorporated (Consumer Staples, Food & Staples Retailing) | | | | | | | | | | | 9,500 | | | | 321,871 | |
WestJet Airlines Limited (Industrials, Airlines) | | | | | | | | | | | 120,000 | | | | 2,154,116 | |
| | | | |
| | | | | | | | | | | | | | | 7,819,869 | |
| | | | | | | | | | | | | | | | |
The accompanying notes are an integral part of these financial statements.
| | | | |
| 98 | | Wells Fargo Equity Gateway Funds | | Portfolio of investments—May 31, 2016 |
INTERNATIONAL VALUE PORTFOLIO
| | | | | | | | | | | | |
| Security name | | | | | | Shares | | | Value | |
| | | | |
| China: 2.77% | | | | | | | | | | | | |
China BlueChemical Limited H Shares (Materials, Chemicals) | | | | | | | 1,984,000 | | | $ | 439,144 | |
China Communications Services Corporation Limited H Shares (Telecommunication Services, Diversified Telecommunication Services) | | | | | | | 2,836,000 | | | | 1,332,098 | |
China Petroleum & Chemical Corporation H Shares (Energy, Oil, Gas & Consumable Fuels) | | | | | | | 2,970,000 | | | | 2,025,673 | |
China Railway Construction Corporation Limited H Shares (Industrials, Construction & Engineering) | | | | | | | 1,747,500 | | | | 2,183,602 | |
Dongfeng Motor Group Company Limited H Shares (Consumer Discretionary, Automobiles) | | | | | | | 1,730,000 | | | | 1,927,973 | |
PICC Property & Casualty Company Limited H Shares (Financials, Insurance) | | | | | | | 1,225,000 | | | | 2,235,370 | |
Shanghai Pharmaceuticals Holding Company Limited H Shares (Health Care, Health Care Providers & Services) | | | | | | | 823,400 | | | | 1,778,033 | |
Shenzhen International Holdings Limited H Shares (Industrials, Transportation Infrastructure) | | | | | | | 731,500 | | | | 1,110,794 | |
TCL Communication Technology Holdings Limited H Shares (Information Technology, Technology Hardware, Storage & Peripherals) « | | | | | | | 1,586,000 | | | | 1,069,477 | |
| | | | |
| | | | | | | | | | | 14,102,164 | |
| | | | | | | | | | | | |
| | | | |
| Czech Republic: 0.21% | | | | | | | | | | | | |
CEZ AS (Utilities, Electric Utilities) | | | | | | | 57,500 | | | | 1,044,370 | |
| | | | | | | | | | | | |
| | | | |
| Denmark: 0.24% | | | | | | | | | | | | |
Sydbank AS (Financials, Banks) | | | | | | | 43,000 | | | | 1,226,054 | |
| | | | | | | | | | | | |
| | | | |
| Finland: 0.39% | | | | | | | | | | | | |
Tieto Oyj (Information Technology, IT Services) | | | | | | | 72,000 | | | | 1,974,732 | |
| | | | | | | | | | | | |
| | | | |
| France: 8.90% | | | | | | | | | | | | |
Alstom SA (Industrials, Machinery) † | | | | | | | 83,800 | | | | 2,104,429 | |
AXA SA (Financials, Insurance) | | | | | | | 132,200 | | | | 3,321,346 | |
BNP Paribas SA (Financials, Banks) | | | | | | | 49,100 | | | | 2,718,718 | |
Cie Generale des Establissements Michelin (Consumer Discretionary, Auto Components) | | | | | | | 32,700 | | | | 3,323,284 | |
Credit Agricole SA (Financials, Banks) « | | | | | | | 219,328 | | | | 2,202,419 | |
Electricite de France SA (Utilities, Electric Utilities) « | | | | | | | 148,600 | | | | 1,979,944 | |
Engie SA (Utilities, Multi-Utilities) | | | | | | | 171,900 | | | | 2,648,058 | |
Orange SA (Telecommunication Services, Diversified Telecommunication Services) | | | | | | | 181,900 | | | | 3,160,337 | |
Renault SA (Consumer Discretionary, Automobiles) | | | | | | | 40,500 | | | | 3,800,557 | |
Sanofi SA (Health Care, Pharmaceuticals) | | | | | | | 100,200 | | | | 8,215,518 | |
SCOR SE (Financials, Insurance) | | | | | | | 109,700 | | | | 3,667,835 | |
Societe Generale SA (Financials, Banks) « | | | | | | | 39,000 | | | | 1,605,120 | |
Thales SA (Industrials, Aerospace & Defense) | | | | | | | 22,200 | | | | 1,923,207 | |
Total SA (Energy, Oil, Gas & Consumable Fuels) | | | | | | | 93,700 | | | | 4,553,352 | |
| | | | |
| | | | | | | | | | | 45,224,124 | |
| | | | | | | | | | | | |
| | | | |
| Germany: 9.44% | | | | | | | | | | | | |
Allianz AG (Financials, Insurance) | | | | | | | 35,700 | | | | 5,827,161 | |
Aurubis AG (Materials, Metals & Mining) | | | | | | | 25,900 | | | | 1,353,132 | |
BASF SE (Materials, Chemicals) | | | | | | | 46,500 | | | | 3,592,186 | |
Bayer AG (Health Care, Pharmaceuticals) | | | | | | | 51,400 | | | | 4,897,199 | |
Bayerische Motoren Werke AG (Consumer Discretionary, Automobiles) | | | | | | | 31,200 | | | | 2,634,498 | |
Daimler AG (Consumer Discretionary, Automobiles) | | | | | | | 75,700 | | | | 5,170,734 | |
Deutsche Bank AG (Financials, Capital Markets) | | | | | | | 130,100 | | | | 2,324,054 | |
E.ON SE (Utilities, Multi-Utilities) | | | | | | | 87,200 | | | | 857,199 | |
Hannover Rueck SE (Financials, Insurance) | | | | | | | 16,300 | | | | 1,838,104 | |
Metro AG (Consumer Staples, Food & Staples Retailing) | | | | | | | 108,100 | | | | 3,551,794 | |
Muenchener Rueckversicherungs Gesellschaft AG (Financials, Insurance) | | | | | | | 23,200 | | | | 4,358,607 | |
The accompanying notes are an integral part of these financial statements.
| | | | | | |
| Portfolio of investments—May 31, 2016 | | Wells Fargo Equity Gateway Funds | | | 99 | |
INTERNATIONAL VALUE PORTFOLIO
| | | | | | | | | | | | | | | | |
| Security name | | | | | | | | Shares | | | Value | |
| | | | |
| Germany (continued) | | | | | | | | | | | | | | | | |
Siemens AG (Industrials, Industrial Conglomerates) | | | | | | | | | | | 33,900 | | | $ | 3,650,807 | |
Stada Arzneimittel AG (Health Care, Pharmaceuticals) | | | | | | | | | | | 56,900 | | | | 3,030,007 | |
Volkswagen AG (Consumer Discretionary, Automobiles) | | | | | | | | | | | 22,600 | | | | 3,488,993 | |
Wincor Nixdorf AG (Information Technology, Technology Hardware, Storage & Peripherals) † | | | | | | | | | | | 26,600 | | | | 1,420,928 | |
| | | | |
| | | | | | | | | | | | | | | 47,995,403 | |
| | | | | | | | | | | | | | | | |
| | | | |
| Hong Kong: 1.96% | | | | | | | | | | | | | | | | |
China Resources Cement Holdings Limited (Materials, Construction Materials) | | | | | | | | | | | 3,186,000 | | | | 1,045,498 | |
Kingboard Laminates Holdings Limited (Information Technology, Electronic Equipment, Instruments
& Components) (i) | | | | | | | | | | | 2,204,000 | | | | 1,162,874 | |
Lee & Man Paper Manufacturing Limited (Materials, Paper & Forest Products) | | | | | | | | | | | 2,338,000 | | | | 1,546,481 | |
Skyworth Digital Holdings Limited (Consumer Discretionary, Household Durables) | | | | | | | | | | | 3,680,000 | | | | 2,221,047 | |
Wheelock & Company Limited (Financials, Real Estate Management & Development) | | | | | | | | | | | 379,000 | | | | 1,707,042 | |
Yue Yuen Industrial Holdings Limited (Consumer Discretionary, Textiles, Apparel & Luxury Goods) | | | | | | | | | | | 611,500 | | | | 2,305,691 | |
| | | | |
| | | | | | | | | | | | | | | 9,988,633 | |
| | | | | | | | | | | | | | | | |
| | | | |
| Hungary: 0.23% | | | | | | | | | | | | | | | | |
Richter Gedeon (Health Care, Pharmaceuticals) | | | | | | | | | | | 59,700 | | | | 1,196,850 | |
| | | | | | | | | | | | | | | | |
| | | | |
| India: 0.56% | | | | | | | | | | | | | | | | |
Gail India Limited GDR (Utilities, Gas Utilities) | | | | | | | | | | | 1,800 | | | | 58,860 | |
Tata Motors Limited ADR (Consumer Discretionary, Automobiles) | | | | | | | | | | | 83,800 | | | | 2,806,462 | |
| | | | |
| | | | | | | | | | | | | | | 2,865,322 | |
| | | | | | | | | | | | | | | | |
| | | | |
| Ireland: 0.92% | | | | | | | | | | | | | | | | |
C&C Group plc (Consumer Staples, Beverages) | | | | | | | | | | | 240,000 | | | | 1,103,660 | |
Smurfit Kappa Group plc (Materials, Containers & Packaging) | | | | | | | | | | | 130,200 | | | | 3,552,140 | |
| | | | |
| | | | | | | | | | | | | | | 4,655,800 | |
| | | | | | | | | | | | | | | | |
| | | | |
| Israel: 1.08% | | | | | | | | | | | | | | | | |
Bank Hapoalim Limited (Financials, Banks) | | | | | | | | | | | 542,900 | | | | 2,804,192 | |
Teva Pharmaceutical Industries Limited (Health Care, Pharmaceuticals) | | | | | | | | | | | 51,404 | | | | 2,669,801 | |
| | | | |
| | | | | | | | | | | | | | | 5,473,993 | |
| | | | | | | | | | | | | | | | |
| | | | |
| Italy: 1.11% | | | | | | | | | | | | | | | | |
Enel SpA (Utilities, Electric Utilities) | | | | | | | | | | | 688,400 | | | | 3,120,474 | |
Mediobanca SpA (Financials, Capital Markets) | | | | | | | | | | | 324,800 | | | | 2,518,880 | |
| | | | |
| | | | | | | | | | | | | | | 5,639,354 | |
| | | | | | | | | | | | | | | | |
| | | | |
| Japan: 21.62% | | | | | | | | | | | | | | | | |
Adeka Corporation (Materials, Chemicals) | | | | | | | | | | | 155,300 | | | | 2,128,915 | |
Aisin Seiki Company Limited (Consumer Discretionary, Auto Components) | | | | | | | | | | | 46,400 | | | | 1,917,009 | |
Anritsu Corporation (Information Technology, Electronic Equipment, Instruments & Components) | | | | | | | | | | | 206,300 | | | | 1,173,694 | |
Aoyama Trading Company Limited (Consumer Discretionary, Specialty Retail) | | | | | | | | | | | 24,800 | | | | 886,874 | |
Aozora Bank Limited (Financials, Banks) | | | | | | | | | | | 588,000 | | | | 2,001,860 | |
Calsonic Kansei Corporation (Consumer Discretionary, Auto Components) | | | | | | | | | | | 326,000 | | | | 2,543,586 | |
Central Glass Company Limited (Industrials, Building Products) | | | | | | | | | | | 444,000 | | | | 2,193,236 | |
CKD Corporation (Industrials, Machinery) | | | | | | | | | | | 171,200 | | | | 1,501,198 | |
DCM Holdings Company Limited (Consumer Discretionary, Specialty Retail) | | | | | | | | | | | 143,100 | | | | 1,046,742 | |
The accompanying notes are an integral part of these financial statements.
| | | | |
| 100 | | Wells Fargo Equity Gateway Funds | | Portfolio of investments—May 31, 2016 |
INTERNATIONAL VALUE PORTFOLIO
| | | | | | | | | | | | | | | | |
| Security name | | | | | | | | Shares | | | Value | |
| | | | |
| Japan (continued) | | | | | | | | | | | | | | | | |
Denka Company Limited (Materials, Chemicals) | | | | | | | | | | | 682,000 | | | $ | 2,993,200 | |
DIC Incorporated (Materials, Chemicals) | | | | | | | | | | | 808,700 | | | | 1,920,694 | |
Eizo Corporation (Information Technology, Technology Hardware, Storage & Peripherals) | | | | | | | | | | | 63,300 | | | | 1,792,076 | |
Fujikura Limited (Industrials, Electrical Equipment) | | | | | | | | | | | 348,000 | | | | 1,816,445 | |
Geo Holdings Corporation (Consumer Discretionary, Specialty Retail) | | | | | | | | | | | 91,700 | | | | 1,263,685 | |
Hitachi Limited (Information Technology, Electronic Equipment, Instruments & Components) | | | | | | | | | | | 327,800 | | | | 1,515,633 | |
Isuzu Motors Limited (Consumer Discretionary, Automobiles) | | | | | | | | | | | 221,400 | | | | 2,671,155 | |
Itochu Corporation (Industrials, Trading Companies & Distributors) | | | | | | | | | | | 200,700 | | | | 2,522,003 | |
Japan Airlines Company Limited (Industrials, Airlines) | | | | | | | | | | | 80,700 | | | | 2,770,043 | |
JFE Holdings Incorporated (Materials, Metals & Mining) | | | | | | | | | | | 70,000 | | | | 942,837 | |
KDDI Corporation (Telecommunication Services, Wireless Telecommunication Services) | | | | | | | | | | | 102,800 | | | | 3,005,044 | |
Kureha Corporation (Materials, Chemicals) | | | | | | | | | | | 271,000 | | | | 1,010,728 | |
Kyorin Company Limited (Health Care, Pharmaceuticals) | | | | | | | | | | | 99,000 | | | | 1,917,686 | |
Maeda Road Construction Company Limited (Industrials, Construction & Engineering) | | | | | | | | | | | 148,000 | | | | 2,665,029 | |
Makino Milling Machine Company Limited (Industrials, Machinery) | | | | | | | | | | | 232,000 | | | | 1,474,945 | |
Marubeni Corporation (Industrials, Trading Companies & Distributors) | | | | | | | | | | | 516,000 | | | | 2,483,193 | |
Matsumotokiyoshi Holdings Company Limited (Consumer Staples, Food & Staples Retailing) | | | | | | | | | | | 60,500 | | | | 3,310,877 | |
Miraca Holdings Incorporated (Health Care, Health Care Providers & Services) | | | | | | | | | | | 25,100 | | | | 1,061,936 | |
Mitsubishi Corporation (Industrials, Trading Companies & Distributors) | | | | | | | | | | | 35,500 | | | | 630,591 | |
Mitsubishi Gas Chemical Company Incorporated (Materials, Chemicals) | | | | | | | | | | | 556,400 | | | | 3,160,479 | |
Mitsubishi UFJ Financial Group Incorporated (Financials, Banks) | | | | | | | | | | | 657,100 | | | | 3,286,242 | |
Mizuho Financial Group Incorporated (Financials, Banks) | | | | | | | | | | | 2,244,400 | | | | 3,534,775 | |
Namura Shipbuilding Company Limited (Industrials, Machinery) | | | | | | | | | | | 108,800 | | | | 695,628 | |
Nippon Telegraph & Telephone Corporation (Telecommunication Services, Diversified Telecommunication Services) | | | | | | | | | | | 234,000 | | | | 10,259,358 | |
Nissan Motor Company Limited (Consumer Discretionary, Automobiles) | | | | | | | | | | | 419,800 | | | | 4,264,912 | |
Nisshinbo Holdings Incorporated (Industrials, Industrial Conglomerates) | | | | | | | | | | | 147,200 | | | | 1,516,731 | |
NTT DOCOMO Incorporated (Telecommunication Services, Wireless Telecommunication Services) | | | | | | | | | | | 98,600 | | | | 2,474,461 | |
Resona Holdings Incorporated (Financials, Banks) | | | | | | | | | | | 1,013,300 | | | | 3,856,094 | |
Ricoh Company Limited (Information Technology, Technology Hardware, Storage & Peripherals) | | | | | | | | | | | 166,000 | | | | 1,448,106 | |
Sankyu Incorporated (Industrials, Road & Rail) | | | | | | | | | | | 370,000 | | | | 1,984,738 | |
Sojitz Corporation (Industrials, Trading Companies & Distributors) | | | | | | | | | | | 1,160,700 | | | | 2,599,482 | |
Sumitomo Corporation (Industrials, Trading Companies & Distributors) | | | | | | | | | | | 285,000 | | | | 2,927,597 | |
Sumitomo Metal Mining Company Limited (Materials, Metals & Mining) | | | | | | | | | | | 108,000 | | | | 1,114,769 | |
Sumitomo Mitsui Financial Group Incorporated (Financials, Banks) | | | | | | | | | | | 100,400 | | | | 3,279,422 | |
The Keiyo Bank Limited (Financials, Banks) | | | | | | | | | | | 62,000 | | | | 231,797 | |
Toho Holdings Company Limited (Health Care, Health Care Providers & Services) | | | | | | | | | | | 63,000 | | | | 1,549,185 | |
Toyo Ink SC Holding Company Limited (Materials, Chemicals) | | | | | | | | | | | 375,000 | | | | 1,608,570 | |
Toyo Tire & Rubber Company Limited (Consumer Discretionary, Auto Components) | | | | | | | | | | | 95,400 | | | | 1,163,908 | |
Tsumura & Company (Health Care, Pharmaceuticals) | | | | | | | | | | | 83,700 | | | | 1,976,570 | |
UBE Industries Limited (Materials, Chemicals) | | | | | | | | | | | 809,000 | | | | 1,519,592 | |
Yokohama Rubber Company Limited (Consumer Discretionary, Auto Components) | | | | | | | | | | | 148,500 | | | | 2,283,790 | |
| | | | |
| | | | | | | | | | | | | | | 109,897,120 | |
| | | | | | | | | | | | | | | | |
| | | | |
| Liechtenstein: 0.12% | | | | | | | | | | | | | | | | |
VP Bank AG (Financials, Capital Markets) | | | | | | | | | | | 6,558 | | | | 599,721 | |
| | | | | | | | | | | | | | | | |
| | | | |
| Netherlands: 1.36% | | | | | | | | | | | | | | | | |
Aegon NV (Financials, Insurance) « | | | | | | | | | | | 334,000 | | | | 1,716,908 | |
ING Groep NV (Financials, Banks) | | | | | | | | | | | 237,100 | | | | 2,953,346 | |
Koninklijke Ahold NV (Consumer Staples, Food & Staples Retailing) | | | | | | | | | | | 100,600 | | | | 2,228,578 | |
| | | | |
| | | | | | | | | | | | | | | 6,898,832 | |
| | | | | | | | | | | | | | | | |
The accompanying notes are an integral part of these financial statements.
| | | | | | |
| Portfolio of investments—May 31, 2016 | | Wells Fargo Equity Gateway Funds | | | 101 | |
INTERNATIONAL VALUE PORTFOLIO
| | | | | | | | | | | | | | | | |
| Security name | | | | | | | | Shares | | | Value | |
| | | | |
| Norway: 1.23% | | | | | | | | | | | | | | | | |
Atea ASA (Information Technology, IT Services) (i) | | | | | | | | | | | 84,900 | | | $ | 761,153 | |
DNB Nor ASA (Financials, Banks) | | | | | | | | | | | 148,800 | | | | 1,908,559 | |
Marine Harvest ASA (Consumer Staples, Food Products) | | | | | | | | | | | 97,500 | | | | 1,628,186 | |
Yara International ASA (Materials, Chemicals) | | | | | | | | | | | 53,600 | | | | 1,933,050 | |
| | | | |
| | | | | | | | | | | | | | | 6,230,948 | |
| | | | | | | | | | | | | | | | |
| | | | |
| Poland: 0.39% | | | | | | | | | | | | | | | | |
Asseco Poland SA (Information Technology, Software) | | | | | | | | | | | 101,800 | | | | 1,424,673 | |
KGHM Polska Miedz SA (Materials, Metals & Mining) | | | | | | | | | | | 36,500 | | | | 558,199 | |
| | | | |
| | | | | | | | | | | | | | | 1,982,872 | |
| | | | | | | | | | | | | | | | |
| | | | |
| Portugal: 0.28% | | | | | | | | | | | | | | | | |
Sonae SGPS SA (Consumer Staples, Food & Staples Retailing) | | | | | | | | | | | 1,362,100 | | | | 1,401,875 | |
| | | | | | | | | | | | | | | | |
| | | | |
| Russia: 0.82% | | | | | | | | | | | | | | | | |
Gazprom Neft Sponsored ADR (Energy, Oil, Gas & Consumable Fuels) (i) | | | | | | | | | | | 150,014 | | | | 1,860,174 | |
Gazprom Neft Sponsored ADR (Energy, Oil, Gas & Consumable Fuels) | | | | | | | | | | | 886 | | | | 10,694 | |
LUKOIL OAO ADR (Energy, Oil, Gas & Consumable Fuels) | | | | | | | | | | | 60,400 | | | | 2,323,588 | |
| | | | |
| | | | | | | | | | | | | | | 4,194,456 | |
| | | | | | | | | | | | | | | | |
| | | | |
| Singapore: 0.80% | | | | | | | | | | | | | | | | |
DBS Group Holdings Limited (Financials, Banks) | | | | | | | | | | | 227,000 | | | | 2,555,007 | |
United Overseas Bank Limited (Financials, Banks) | | | | | | | | | | | 113,000 | | | | 1,495,069 | |
| | | | |
| | | | | | | | | | | | | | | 4,050,076 | |
| | | | | | | | | | | | | | | | |
| | | | |
| South Africa: 0.37% | | | | | | | | | | | | | | | | |
Barclays Africa Group Limited (Financials, Banks) | | | | | | | | | | | 200,300 | | | | 1,860,099 | |
| | | | | | | | | | | | | | | | |
| | | | |
| South Korea: 2.42% | | | | | | | | | | | | | | | | |
BNK Financial Group Incorporated (Financials, Banks) | | | | | | | | | | | 13,188 | | | | 96,824 | |
E-MART Limited (Consumer Staples, Food & Staples Retailing) | | | | | | | | | | | 8,500 | | | | 1,298,037 | |
Industrial Bank of Korea (Financials, Banks) | | | | | | | | | | | 192,500 | | | | 1,841,332 | |
KT&G Corporation (Consumer Staples, Tobacco) | | | | | | | | | | | 31,300 | | | | 3,348,506 | |
Kwangju Bank (Financials, Banks) | | | | | | | | | | | 13,510 | | | | 103,156 | |
SK Telecom Company Limited (Telecommunication Services, Wireless Telecommunication Services) | | | | | | | | | | | 22,300 | | | | 4,153,885 | |
Woori Bank (Financials, Banks) | | | | | | | | | | | 178,044 | | | | 1,486,439 | |
| | | | |
| | | | | | | | | | | | | | | 12,328,179 | |
| | | | | | | | | | | | | | | | |
| | | | |
| Spain: 1.74% | | | | | | | | | | | | | | | | |
Banco Santander Central Hispano SA (Financials, Banks) | | | | | | | | | | | 429,681 | | | | 2,051,461 | |
Distribuidora Internacional SA (Consumer Staples, Food & Staples Retailing) | | | | | | | | | | | 248,800 | | | | 1,487,947 | |
Gas Natural SDG SA (Utilities, Gas Utilities) | | | | | | | | | | | 268,500 | | | | 5,314,702 | |
| | | | |
| | | | | | | | | | | | | | | 8,854,110 | |
| | | | | | | | | | | | | | | | |
| | | | |
| Sweden: 2.05% | | | | | | | | | | | | | | | | |
Boliden AB (Materials, Metals & Mining) | | | | | | | | | | | 169,300 | | | | 2,995,760 | |
Nordea Bank AB (Financials, Banks) | | | | | | | | | | | 177,300 | | | | 1,720,637 | |
Skandinaviska Enskilda Banken AB Class A (Financials, Banks) | | | | | | | | | | | 144,900 | | | | 1,388,835 | |
Telefonaktiebolaget LM Ericsson Class B (Information Technology, Communications Equipment) | | | | | | | | | | | 304,500 | | | | 2,347,264 | |
The accompanying notes are an integral part of these financial statements.
| | | | |
| 102 | | Wells Fargo Equity Gateway Funds | | Portfolio of investments—May 31, 2016 |
INTERNATIONAL VALUE PORTFOLIO
| | | | | | | | | | | | | | |
| Security name | | | | | | | Shares | | | Value | |
| | | | |
| Sweden (continued) | | | | | | | | | | | | | | |
Telia Company AB (Telecommunication Services, Diversified Telecommunication Services) | | | | | | | | | 417,000 | | | $ | 1,954,184 | |
| | | | |
| | | | | | | | | | | | | 10,406,680 | |
| | | | | | | | | | | | | | |
| | | | |
| Switzerland: 6.12% | | | | | | | | | | | | | | |
Aryzta AG (Consumer Staples, Food Products) | | | | | | | | | 42,100 | | | | 1,675,529 | |
Baloise Holding AG (Financials, Insurance) | | | | | | | | | 28,800 | | | | 3,557,988 | |
Credit Suisse Group AG (Financials, Capital Markets) « | | | | | | | | | 273,395 | | | | 3,746,117 | |
Georg Fischer AG (Industrials, Machinery) | | | | | | | | | 3,000 | | | | 2,394,869 | |
Swiss Life Holding AG (Financials, Insurance) | | | | | | | | | 15,100 | | | | 3,914,759 | |
Swiss Reinsurance AG (Financials, Insurance) | | | | | | | | | 75,700 | | | | 6,800,815 | |
UBS Group AG (Financials, Capital Markets) | | | | | | | | | 158,900 | | | | 2,455,437 | |
Valiant Holding AG (Financials, Banks) | | | | | | | | | 22,700 | | | | 2,427,575 | |
Zurich Insurance Group AG (Financials, Insurance) | | | | | | | | | 17,100 | | | | 4,137,374 | |
| | | | |
| | | | | | | | | | | | | 31,110,463 | |
| | | | | | | | | | | | | | |
| | | | |
| Taiwan: 0.42% | | | | | | | | | | | | | | |
Pegatron Corporation (Information Technology, Technology Hardware, Storage & Peripherals) | | | | | | | | | 1,035,000 | | | | 2,154,895 | |
| | | | | | | | | | | | | | |
| | | | |
| Thailand: 0.99% | | | | | | | | | | | | | | |
Bangchak Petroleum PCL (Energy, Oil, Gas & Consumable Fuels) | | | | | | | | | 2,188,900 | | | | 1,853,442 | |
Thai Oil PCL (Energy, Oil, Gas & Consumable Fuels) | | | | | | | | | 1,003,900 | | | | 1,784,399 | |
Thanachart Capital PCL (Financials, Banks) | | | | | | | | | 1,481,500 | | | | 1,409,965 | |
| | | | |
| | | | | | | | | | | | | 5,047,806 | |
| | | | | | | | | | | | | | |
| | | | |
| United Kingdom: 18.47% | | | | | | | | | | | | | | |
3i Group plc (Financials, Capital Markets) | | | | | | | | | 409,100 | | | | 3,326,999 | |
AMEC Foster Wheeler plc (Energy, Energy Equipment & Services) | | | | | | | | | 83,300 | | | | 526,988 | |
AstraZeneca plc (Health Care, Pharmaceuticals) | | | | | | | | | 60,300 | | | | 3,517,873 | |
Aviva plc (Financials, Insurance) | | | | | | | | | 314,900 | | | | 2,051,472 | |
BAE Systems plc (Industrials, Aerospace & Defense) | | | | | | | | | 939,800 | | | | 6,582,565 | |
Barclays plc (Financials, Banks) | | | | | | | | | 715,000 | | | | 1,888,880 | |
Barratt Developments plc (Consumer Discretionary, Household Durables) | | | | | | | | | 318,600 | | | | 2,731,750 | |
Bellway plc (Consumer Discretionary, Household Durables) | | | | | | | | | 51,700 | | | | 2,046,462 | |
Berkeley Group Holdings plc (Consumer Discretionary, Household Durables) | | | | | | | | | 58,800 | | | | 2,789,087 | |
Bovis Homes Group plc (Consumer Discretionary, Household Durables) | | | | | | | | | 108,600 | | | | 1,588,637 | |
BP plc (Energy, Oil, Gas & Consumable Fuels) | | | | | | | | | 1,298,500 | | | | 6,718,737 | |
BT Group plc (Telecommunication Services, Diversified Telecommunication Services) | | | | | | | | | 252,200 | | | | 1,617,432 | |
Carillion plc (Industrials, Construction & Engineering) « | | | | | | | | | 496,300 | | | | 1,993,277 | |
Centrica plc (Utilities, Multi-Utilities) | | | | | | | | | 898,500 | | | | 2,652,135 | |
Chemring Group plc (Industrials, Aerospace & Defense) | | | | | | | | | 341,066 | | | | 681,696 | |
Crest Nicholson Holdings plc (Consumer Discretionary, Household Durables) | | | | | | | | | 264,876 | | | | 2,255,762 | |
Darty plc (Consumer Discretionary, Specialty Retail) | | | | | | | | | 226,400 | | | | 551,211 | |
Debenhams plc (Consumer Discretionary, Multiline Retail) | | | | | | | | | 1,238,200 | | | | 1,326,180 | |
easyJet plc (Industrials, Airlines) | | | | | | | | | 103,400 | | | | 2,295,811 | |
Firstgroup plc (Industrials, Road & Rail) † | | | | | | | | | 952,400 | | | | 1,491,140 | |
GlaxoSmithKline plc (Health Care, Pharmaceuticals) | | | | | | | | | 110,500 | | | | 2,312,616 | |
Home Retail Group plc (Consumer Discretionary, Internet & Catalog Retail) | | | | | | | | | 164,100 | | | | 392,875 | |
International Consolidated Airlines Group SA (Industrials, Airlines) | | | | | | | | | 182,900 | | | | 1,418,556 | |
J Sainsbury plc (Consumer Staples, Food & Staples Retailing) | | | | | | | | | 1,211,800 | | | | 4,712,471 | |
Lloyds Banking Group plc (Financials, Banks) | | | | | | | | | 2,460,500 | | | | 2,566,551 | |
The accompanying notes are an integral part of these financial statements.
| | | | | | |
| Portfolio of investments—May 31, 2016 | | Wells Fargo Equity Gateway Funds | | | 103 | |
INTERNATIONAL VALUE PORTFOLIO
| | | | | | | | | | | | | | | | |
| Security name | | | | | | | | Shares | | | Value | |
| | | | |
| United Kingdom (continued) | | | | | | | | | | | | | | | | |
Marks & Spencer Group plc (Consumer Discretionary, Multiline Retail) | | | | | | | | | | | 379,900 | | | $ | 2,089,216 | |
Marston’s plc (Consumer Discretionary, Hotels, Restaurants & Leisure) | | | | | | | | | | | 558,800 | | | | 1,235,859 | |
Meggitt plc (Industrials, Aerospace & Defense) | | | | | | | | | | | 392,800 | | | | 2,207,378 | |
Mitchells & Butlers plc (Consumer Discretionary, Hotels, Restaurants & Leisure) | | | | | | | | | | | 236,800 | | | | 995,640 | |
Mitie Group plc (Industrials, Commercial Services & Supplies) « | | | | | | | | | | | 539,300 | | | | 2,200,345 | |
Mondi plc (Materials, Paper & Forest Products) | | | | | | | | | | | 142,300 | | | | 2,774,108 | |
Old Mutual plc (Financials, Insurance) | | | | | | | | | | | 982,800 | | | | 2,535,143 | |
Paragon Group of Companies plc (Financials, Thrifts & Mortgage Finance) | | | | | | | | | | | 328,000 | | | | 1,468,881 | |
Premier Foods plc (Consumer Staples, Food Products) † | | | | | | | | | | | 73,926 | | | | 45,505 | |
Redrow plc (Consumer Discretionary, Household Durables) | | | | | | | | | | | 388,600 | | | | 2,368,383 | |
Royal Dutch Shell plc Class B (Energy, Oil, Gas & Consumable Fuels) | | | | | | | | | | | 287,900 | | | | 6,923,951 | |
Royal Mail plc (Industrials, Air Freight & Logistics) | | | | | | | | | | | 290,000 | | | | 2,272,316 | |
Smiths Group plc (Industrials, Industrial Conglomerates) | | | | | | | | | | | 46,300 | | | | 752,397 | |
Standard Chartered plc (Financials, Banks) | | | | | | | | | | | 253,000 | | | | 1,939,527 | |
Tullett Prebon plc (Financials, Capital Markets) | | | | | | | | | | | 279,500 | | | | 1,360,174 | |
Vesuvius plc (Industrials, Machinery) | | | | | | | | | | | 145,400 | | | | 726,114 | |
William Morrison Supermarkets plc (Consumer Staples, Food & Staples Retailing) | | | | | | | | | | | 679,700 | | | | 1,951,167 | |
| | | | |
| | | | | | | | | | | | | | | 93,883,267 | |
| | | | | | | | | | | | | | | | |
| | | | |
Total Common Stocks (Cost $547,156,375) | | | | | | | | | | | | | | | 492,618,715 | |
| | | | | | | | | | | | | | | | |
| | | | |
| | | Dividend yield | | | | | | | | | | |
| Preferred Stocks: 0.19% | | | | | | | | | | | | | | | | |
| | | | |
| Brazil: 0.19% | | | | | | | | | | | | | | | | |
Banco do Estado do Rio Grande do Sul SA (Financials, Banks) ± | | | 8.95 | % | | | | | | | 349,800 | | | | 808,288 | |
Companhia Energetica de Minas Gerais SA (Utilities, Water Utilities) ± | | | 8.48 | | | | | | | | 109,056 | | | | 169,910 | |
| | | | |
Total Preferred Stocks (Cost $3,545,600) | | | | | | | | | | | | | | | 978,198 | |
| | | | | | | | | | | | | | | | |
| | | | |
| | | | | | Expiration date | | | | | | | |
| Rights: 0.00% | | | | | | | | | | | | | | | | |
| | | | |
| Brazil: 0.00% | | | | | | | | | | | | | | | | |
Companhia de Saneamento de Minas Gerais (Utilities, Electric Utilities) †(a) | | | | | | | 6-20-2016 | | | | 3,288 | | | | 6,779 | |
| | | | | | | | | | | | | | | | |
| | | | |
Total Rights (Cost $0) | | | | | | | | | | | | | | | 6,779 | |
| | | | | | | | | | | | | | | | |
| | | | |
| | | Yield | | | | | | | | | | |
| Short-Term Investments: 3.32% | | | | | | | | | | | | | | | | |
| | | | |
| Investment Companies: 3.32% | | | | | | | | | | | | | | | | |
Securities Lending Cash Investments LLC (l)(r)(u) | | | 0.45 | | | | | | | | 14,316,539 | | | | 14,316,539 | |
Wells Fargo Cash Investment Money Market Fund Select Class (l)(u) | | | 0.41 | | | | | | | | 2,530,851 | | | | 2,530,851 | |
| | | | |
Total Short-Term Investments (Cost $16,847,390) | | | | | | | | | | | | | | | 16,847,390 | |
| | | | | | | | | | | | | | | | |
| | | | | | | | |
| Total investments in securities (Cost $567,549,365)* | | | 100.42 | % | | | 510,451,082 | |
Other assets and liabilities, net | | | (0.42 | ) | | | (2,132,112 | ) |
| | | | | | | | |
| Total net assets | | | 100.00 | % | | $ | 508,318,970 | |
| | | | | | | | |
The accompanying notes are an integral part of these financial statements.
| | | | |
| 104 | | Wells Fargo Equity Gateway Funds | | Portfolio of investments—May 31, 2016 |
INTERNATIONAL VALUE PORTFOLIO
| † | Non-income-earning security |
| (a) | The security is fair valued in accordance with procedures approved by the Board of Trustees. |
| « | All or a portion of this security is on loan. |
| (i) | Illiquid security for which the designation as illiquid is unaudited. |
| ± | Variable rate investment. The rate shown is the rate in effect at period end. |
| (l) | The issuer of the security is an affiliated person of the Portfolio as defined in the Investment Company Act of 1940. |
| (r) | The investment is a non-registered investment vehicle purchased with cash collateral received from securities on loan. |
| (u) | The rate represents the 7-day annualized yield at period end. |
| * | Cost for federal income tax purposes is $568,923,013 and unrealized gains (losses) consists of: |
| | | | |
Gross unrealized gains | | $ | 53,695,416 | |
Gross unrealized losses | | | (112,167,347 | ) |
| | | | |
Net unrealized losses | | $ | (58,471,931 | ) |
The following table shows the percent of total long-term investments by sector as of May 31, 2016:
| | | | |
Financials | | | 27.13 | % |
Consumer Discretionary | | | 14.88 | |
Industrials | | | 14.85 | |
Materials | | | 8.74 | |
Consumer Staples | | | 7.70 | |
Health Care | | | 7.11 | |
Energy | | | 6.15 | |
Telecommunication Services | | | 5.66 | |
Utilities | | | 4.08 | |
Information Technology | | | 3.70 | |
| | | | |
| | | 100.00 | % |
| | | | |
The accompanying notes are an integral part of these financial statements.
| | | | | | |
| Portfolio of investments—May 31, 2016 | | Wells Fargo Equity Gateway Funds | | | 105 | |
LARGE COMPANY VALUE PORTFOLIO
| | | | | | | | | | | | | | | | |
| Security name | | | | | | | | Shares | | | Value | |
| | | |
Common Stocks: 98.50% | | | | | | | | | | | | | |
| | | |
Consumer Discretionary: 7.57% | | | | | | | | | | | | | |
| | | |
| Hotels, Restaurants & Leisure: 1.48% | | | | | | | | | | | | | |
Norwegian Cruise Line Holdings Limited † | | | | | | | | | | | 25,250 | | | $ | 1,171,850 | |
| | | | | | | | | | | | | | | | |
| | | |
| Household Durables: 2.04% | | | | | | | | | | | | | |
Harman International Industries Incorporated | | | | | | | | | | | 11,707 | | | | 915,956 | |
Newell Rubbermaid Incorporated | | | | | | | | | | | 14,635 | | | | 697,943 | |
| | | | |
| | | | | | | | | | | | | | | 1,613,899 | |
| | | | | | | | | | | | | | | | |
| | | |
| Leisure Products: 1.26% | | | | | | | | | | | | | |
Mattel Incorporated | | | | | | | | | | | 31,393 | | | | 1,000,809 | |
| | | | | | | | | | | | | | | | |
| | | |
| Media: 1.21% | | | | | | | | | | | | | |
Scripps Networks Interactive Incorporated Class A | | | | | | | | | | | 14,827 | | | | 953,969 | |
| | | | | | | | | | | | | | | | |
| | | |
| Multiline Retail: 0.63% | | | | | | | | | | | | | |
JCPenny Company Incorporated †« | | | | | | | | | | | 64,446 | | | | 502,034 | |
| | | | | | | | | | | | | | | | |
| | | |
| Textiles, Apparel & Luxury Goods: 0.95% | | | | | | | | | | | | | |
Skechers U.S.A. Incorporated Class A † | | | | | | | | | | | 24,055 | | | | 749,794 | |
| | | | | | | | | | | | | | | | |
| | | |
Consumer Staples: 6.63% | | | | | | | | | | | | | |
| | | |
| Food & Staples Retailing: 2.68% | | | | | | | | | | | | | |
CVS Health Corporation | | | | | | | | | | | 22,018 | | | | 2,123,636 | |
| | | | | | | | | | | | | | | | |
| | | |
| Food Products: 2.16% | | | | | | | | | | | | | |
ConAgra Foods Incorporated | | | | | | | | | | | 17,627 | | | | 805,554 | |
TreeHouse Foods Incorporated † | | | | | | | | | | | 9,540 | | | | 903,438 | |
| | | | |
| | | | | | | | | | | | | | | 1,708,992 | |
| | | | | | | | | | | | | | | | |
| | | |
| Household Products: 1.26% | | | | | | | | | | | | | |
The Procter & Gamble Company | | | | | | | | | | | 12,296 | | | | 996,468 | |
| | | | | | | | | | | | | | | | |
| | | |
| Personal Products: 0.53% | | | | | | | | | | | | | |
Herbalife Limited †« | | | | | | | | | | | 7,190 | | | | 416,229 | |
| | | | | | | | | | | | | | | | |
| | | |
Energy: 11.08% | | | | | | | | | | | | | |
| | | |
| Energy Equipment & Services: 0.79% | | | | | | | | | | | | | |
Baker Hughes Incorporated | | | | | | | | | | | 7,892 | | | | 366,031 | |
Noble Corporation plc « | | | | | | | | | | | 30,604 | | | | 255,237 | |
| | | | |
| | | | | | | | | | | | | | | 621,268 | |
| | | | | | | | | | | | | | | | |
| | | |
| Oil, Gas & Consumable Fuels: 10.29% | | | | | | | | | | | | | |
Chevron Corporation | | | | | | | | | | | 11,430 | | | | 1,154,430 | |
ConocoPhillips | | | | | | | | | | | 19,177 | | | | 839,761 | |
Exxon Mobil Corporation | | | | | | | | | | | 29,377 | | | | 2,615,141 | |
Kinder Morgan Incorporated | | | | | | | | | | | 69,137 | | | | 1,249,997 | |
Noble Energy Incorporated | | | | | | | | | | | 35,551 | | | | 1,270,948 | |
The accompanying notes are an integral part of these financial statements.
| | | | |
| 106 | | Wells Fargo Equity Gateway Funds | | Portfolio of investments—May 31, 2016 |
LARGE COMPANY VALUE PORTFOLIO
| | | | | | | | | | | | | | | | |
| Security name | | | | | | | | Shares | | | Value | |
| | | |
| Oil, Gas & Consumable Fuels (continued) | | | | | | | | | | | | | |
Valero Energy Corporation | | | | | | | | | | | 18,516 | | | $ | 1,012,825 | |
| | | | |
| | | | | | | | | | | | | | | 8,143,102 | |
| | | | | | | | | | | | | | | | |
| | | |
Financials: 28.83% | | | | | | | | | | | | | |
| | | |
| Banks: 10.71% | | | | | | | | | | | | | |
Bank of America Corporation | | | | | | | | | | | 98,811 | | | | 1,461,415 | |
BOK Financial Corporation « | | | | | | | | | | | 20,150 | | | | 1,284,361 | |
Citigroup Incorporated | | | | | | | | | | | 31,329 | | | | 1,458,992 | |
First Republic Bank | | | | | | | | | | | 11,924 | | | | 863,417 | |
JPMorgan Chase & Company | | | | | | | | | | | 32,086 | | | | 2,094,253 | |
KeyCorp | | | | | | | | | | | 31,683 | | | | 406,176 | |
SunTrust Banks Incorporated | | | | | | | | | | | 20,655 | | | | 905,102 | |
| | | | |
| | | | | | | | | | | | | | | 8,473,716 | |
| | | | | | | | | | | | | | | | |
| | | |
| Capital Markets: 4.62% | | | | | | | | | | | | | |
Affiliated Managers Group Incorporated † | | | | | | | | | | | 5,309 | | | | 921,218 | |
Ameriprise Financial Incorporated | | | | | | | | | | | 16,468 | | | | 1,674,302 | |
Goldman Sachs Group Incorporated | | | | | | | | | | | 6,635 | | | | 1,058,150 | |
| | | | |
| | | | | | | | | | | | | | | 3,653,670 | |
| | | | | | | | | | | | | | | | |
| | | |
| Insurance: 7.43% | | | | | | | | | | | | | |
American International Group Incorporated | | | | | | | | | | | 28,858 | | | | 1,670,301 | |
Arthur J. Gallagher & Company | | | | | | | | | | | 21,660 | | | | 1,046,828 | |
Chubb Limited | | | | | | | | | | | 7,121 | | | | 901,590 | |
Endurance Specialty Holdings Limited | | | | | | | | | | | 11,667 | | | | 792,423 | |
MetLife Incorporated | | | | | | | | | | | 32,223 | | | | 1,467,758 | |
| | | | |
| | | | | | | | | | | | | | | 5,878,900 | |
| | | | | | | | | | | | | | | | |
| | | |
| REITs: 6.07% | | | | | | | | | | | | | |
Alexandria Real Estate Equities Incorporated | | | | | | | | | | | 18,859 | | | | 1,827,437 | |
Equity Residential | | | | | | | | | | | 8,391 | | | | 580,741 | |
Pebblebrook Hotel Trust | | | | | | | | | | | 23,015 | | | | 580,438 | |
Prologis Incorporated | | | | | | | | | | | 18,228 | | | | 866,377 | |
VEREIT Incorporated | | | | | | | | | | | 98,744 | | | | 946,955 | |
| | | | |
| | | | | | | | | | | | | | | 4,801,948 | |
| | | | | | | | | | | | | | | | |
| | | |
Health Care: 12.74% | | | | | | | | | | | | | |
| | | |
| Biotechnology: 3.40% | | | | | | | | | | | | | |
AbbVie Incorporated | | | | | | | | | | | 10,500 | | | | 660,765 | |
Baxalta Incorporated | | | | | | | | | | | 33,576 | | | | 1,518,642 | |
Gilead Sciences Incorporated | | | | | | | | | | | 5,874 | | | | 511,390 | |
| | | | |
| | | | | | | | | | | | | | | 2,690,797 | |
| | | | | | | | | | | | | | | | |
| | | |
| Health Care Equipment & Supplies: 1.05% | | | | | | | | | | | | | |
Medtronic plc | | | | | | | | | | | 10,277 | | | | 827,093 | |
| | | | | | | | | | | | | | | | |
The accompanying notes are an integral part of these financial statements.
| | | | | | |
| Portfolio of investments—May 31, 2016 | | Wells Fargo Equity Gateway Funds | | | 107 | |
LARGE COMPANY VALUE PORTFOLIO
| | | | | | | | | | | | | | | | |
| Security name | | | | | | | | Shares | | | Value | |
| | | |
| Health Care Providers & Services: 1.81% | | | | | | | | | | | | | |
Cigna Corporation | | | | | | | | | | | 5,586 | | | $ | 715,622 | |
HCA Holdings Incorporated † | | | | | | | | | | | 9,201 | | | | 717,862 | |
| | | | |
| | | | | | | | | | | | | | | 1,433,484 | |
| | | | | | | | | | | | | | | | |
| | | |
| Pharmaceuticals: 6.48% | | | | | | | | | | | | | |
Allergan plc † | | | | | | | | | | | 4,409 | | | | 1,039,422 | |
Johnson & Johnson | | | | | | | | | | | 7,673 | | | | 864,670 | |
Mallinckrodt plc † | | | | | | | | | | | 12,316 | | | | 780,342 | |
Merck & Company Incorporated | | | | | | | | | | | 16,634 | | | | 935,829 | |
Pfizer Incorporated | | | | | | | | | | | 43,334 | | | | 1,503,690 | |
| | | | |
| | | | | | | | | | | | | | | 5,123,953 | |
| | | | | | | | | | | | | | | | |
| | | |
Industrials: 10.72% | | | | | | | | | | | | | |
| | | |
| Aerospace & Defense: 2.19% | | | | | | | | | | | | | |
Curtiss-Wright Corporation | | | | | | | | | | | 11,704 | | | | 974,007 | |
Raytheon Company | | | | | | | | | | | 5,865 | | | | 760,515 | |
| | | |
| | | | | | | | | | | | 1,734,522 | |
| | | | | | | | | | | | | | | | |
| | | |
| Airlines: 0.57% | | | | | | | | | | | | | |
United Continental Holdings Incorporated † | | | | | | | | | | | 9,972 | | | | 449,637 | |
| | | | | | | | | | | | | | | | |
| | | |
| Electrical Equipment: 0.93% | | | | | | | | | | | | | |
Eaton Corporation plc | | | | | | | | | | | 11,922 | | | | 734,753 | |
| | | | | | | | | | | | | | | | |
| | | |
| Industrial Conglomerates: 1.66% | | | | | | | | | | | | | |
General Electric Company | | | | | | | | | | | 43,387 | | | | 1,311,589 | |
| | | | | | | | | | | | | | | | |
| | | |
| Machinery: 1.67% | | �� | | | | | | | | | | | |
Stanley Black & Decker Incorporated | | | | | | | | | | | 11,659 | | | | 1,319,566 | |
| | | | | | | | | | | | | | | | |
| | | |
| Professional Services: 1.01% | | | | | | | | | | | | | |
Robert Half International Incorporated | | | | | | | | | | | 19,238 | | | | 796,799 | |
| | | | | | | | | | | | | | | | |
| | | |
| Road & Rail: 1.65% | | | | | | | | | | | | | |
Hertz Global Holdings Incorporated † | | | | | | | | | | | 51,571 | | | | 499,723 | |
Norfolk Southern Corporation | | | | | | | | | | | 9,605 | | | | 807,396 | |
| | | |
| | | | | | | | | | | | 1,307,119 | |
| | | | | | | | | | | | | | | | |
| | | |
| Trading Companies & Distributors: 1.04% | | | | | | | | | | | | | |
HD Supply Holdings Incorporated † | | | | | | | | | | | 23,467 | | | | 828,385 | |
| | | | | | | | | | | | | | | | |
| | | |
Information Technology: 11.06% | | | | | | | | | | | | | |
| | | |
| Electronic Equipment, Instruments & Components: 2.54% | | | | | | | | | | | | | |
Synnex Corporation | | | | | | | | | | | 14,052 | | | | 1,280,137 | |
TE Connectivity Limited | | | | | | | | | | | 12,197 | | | | 731,820 | |
| | | |
| | | | | | | | | | | | 2,011,957 | |
| | | | | | | | | | | | | | | | |
The accompanying notes are an integral part of these financial statements.
| | | | |
| 108 | | Wells Fargo Equity Gateway Funds | | Portfolio of investments—May 31, 2016 |
LARGE COMPANY VALUE PORTFOLIO
| | | | | | | | | | | | | | | | |
| Security name | | | | | | | | Shares | | | Value | |
| | | |
| Internet Software & Services: 1.41% | | | | | | | | | | | | | |
Alphabet Incorporated Class C † | | | | | | | | | | | 1,511 | | | $ | 1,111,673 | |
| | | | | | | | | | | | | | | | |
| | | |
| IT Services: 1.04% | | | | | | | | | | | | | |
Alliance Data Systems Corporation † | | | | | | | | | | | 3,690 | | | | 819,881 | |
| | | | | | | | | | | | | | | | |
| | | |
| Semiconductors & Semiconductor Equipment: 2.68% | | | | | | | | | | | | | |
NXP Semiconductors NV † | | | | | | | | | | | 14,944 | | | | 1,412,059 | |
Skyworks Solutions Incorporated | | | | | | | | | | | 10,610 | | | | 708,324 | |
| | | |
| | | | | | | | | | | | 2,120,383 | |
| | | | | | | | | | | | | | | | |
| | | |
| Software: 0.58% | | | | | | | | | | | | | |
Citrix Systems Incorporated † | | | | | | | | | | | 5,365 | | | | 455,596 | |
| | | | | | | | | | | | | | | | |
| | | |
| Technology Hardware, Storage & Peripherals: 2.81% | | | | | | | | | | | | | |
Apple Incorporated | | | | | | | | | | | 7,084 | | | | 707,408 | |
NCR Corporation † | | | | | | | | | | | 49,182 | | | | 1,518,740 | |
| | | |
| | | | | | | | | | | | 2,226,148 | |
| | | | | | | | | | | | | | | | |
| | | |
Materials: 3.37% | | | | | | | | | | | | | |
| | | |
| Chemicals: 1.88% | | | | | | | | | | | | | |
Cabot Corporation | | | | | | | | | | | 11,987 | | | | 547,926 | |
FMC Corporation | | | | | | | | | | | 19,782 | | | | 939,447 | |
| | | |
| | | | | | | | | | | | 1,487,373 | |
| | | | | | | | | | | | | | | | |
| | | |
| Containers & Packaging: 1.49% | | | | | | | | | | | | | |
Crown Holdings Incorporated † | | | | | | | | | | | 17,198 | | | | 897,220 | |
WestRock Company | | | | | | | | | | | 7,162 | | | | 283,687 | |
| | | |
| | | | | | | | | | | | 1,180,907 | |
| | | | | | | | | | | | | | | | |
| | | |
Telecommunication Services: 2.27% | | | | | | | | | | | | | |
| | | |
| Diversified Telecommunication Services: 2.27% | | | | | | | | | | | | | |
AT&T Incorporated | | | | | | | | | | | 22,762 | | | | 891,132 | |
Verizon Communications Incorporated | | | | | | | | | | | 17,752 | | | | 903,577 | |
| | | |
| | | | | | | | | | | | 1,794,709 | |
| | | | | | | | | | | | | | | | |
| | | |
Utilities: 4.23% | | | | | | | | | | | | | |
| | | |
| Electric Utilities: 3.13% | | | | | | | | | | | | | |
Duke Energy Corporation | | | | | | | | | | | 15,256 | | | | 1,193,477 | |
The Southern Company | | | | | | | | | | | 25,977 | | | | 1,284,303 | |
| | | |
| | | | | | | | | | | | 2,477,780 | |
| | | | | | | | | | | | | | | | �� |
| | | |
| Gas Utilities: 1.10% | | | | | | | | | | | | | |
Atmos Energy Corporation | | | | | | | | | | | 11,944 | | | | 870,718 | |
| | | | | | | | | | | | | | | | |
| | | | |
Total Common Stocks (Cost $66,303,876) | | | | | | | | | | | | | | | 77,925,106 | |
| | | | | | | | | | | | | | | | |
The accompanying notes are an integral part of these financial statements.
| | | | | | |
| Portfolio of investments—May 31, 2016 | | Wells Fargo Equity Gateway Funds | | | 109 | |
LARGE COMPANY VALUE PORTFOLIO
| | | | | | | | | | | | | | | | |
| Security name | | Yield | | | | | | Shares | | | Value | |
| | | | |
Short-Term Investments: 3.64% | | | | | | | | | | | | | | | | |
| | | | |
| Investment Companies: 3.64% | | | | | | | | | | | | | | | | |
Securities Lending Cash Investments LLC (l)(r)(u) | | | 0.45 | % | | | | | | | 1,759,295 | | | $ | 1,759,295 | |
Wells Fargo Cash Investment Money Market Fund Select Class (l)(u) | | | 0.41 | | | | | | | | 1,123,879 | | | | 1,123,879 | |
| | | | |
Total Short-Term Investments (Cost $2,883,174) | | | | | | | | | | | | | | | 2,883,174 | |
| | | | | | | | | | | | | | | | |
| | | | | | | | |
| Total investments in securities (Cost $69,187,050)* | | | 102.14 | % | | | 80,808,280 | |
Other assets and liabilities, net | | | (2.14 | ) | | | (1,693,450 | ) |
| | | | | | | | |
| Total net assets | | | 100.00 | % | | $ | 79,114,830 | |
| | | | | | | | |
| † | Non-income-earning security |
| « | All or a portion of this security is on loan. |
| (l) | The issuer of the security is an affiliated person of the Portfolio as defined in the Investment Company Act of 1940. |
| (r) | The investment is a non-registered investment vehicle purchased with cash collateral received from securities on loan. |
| (u) | The rate represents the 7-day annualized yield at period end. |
| * | Cost for federal income tax purposes is $70,181,391 and unrealized gains (losses) consists of: |
| | | | |
| Gross unrealized gains | | $ | 13,775,938 | |
Gross unrealized losses | | | (3,149,049 | ) |
| | | | |
Net unrealized gains | | $ | 10,626,889 | |
The accompanying notes are an integral part of these financial statements.
| | | | |
| 110 | | Wells Fargo Equity Gateway Funds | | Portfolio of investments—May 31, 2016 |
SMALL COMPANY GROWTH PORTFOLIO
| | | | | | | | | | | | | | | | |
| Security name | | | | | | | | Shares | | | Value | |
| | | |
Common Stocks: 97.39% | | | | | | | | | | | | | |
| | | | |
Consumer Discretionary: 14.01% | | | | | | | | | | | | | | | | |
| | | |
| Auto Components: 1.32% | | | | | | | | | | | | | |
Gentherm Incorporated † | | | | | | | | | | | 324,905 | | | $ | 11,885,025 | |
Tower International Incorporated | | | | | | | | | | | 178,475 | | | | 3,867,553 | |
| | | | |
| | | | | | | | | | | | | | | 15,752,578 | |
| | | | | | | | | | | | | | | | |
| | | |
| Diversified Consumer Services: 1.01% | | | | | | | | | | | | | |
Houghton Mifflin Harcourt Company † | | | | | | | | | | | 703,180 | | | | 12,094,696 | |
| | | | | | | | | | | | | | | | |
| | | |
| Hotels, Restaurants & Leisure: 3.44% | | | | | | | | | | | | | |
Del Taco Restaurants Incorporated † | | | | | | | | | | | 660,890 | | | | 6,172,713 | |
Extended Stay America Incorporated | | | | | | | | | | | 681,120 | | | | 9,712,771 | |
Krispy Kreme Doughnuts Incorporated † | | | | | | | | | | | 537,600 | | | | 11,493,888 | |
SeaWorld Entertainment Incorporated « | | | | | | | | | | | 313,480 | | | | 5,473,361 | |
Zoe’s Kitchen Incorporated †« | | | | | | | | | | | 226,470 | | | | 8,361,272 | |
| | | | |
| | | | | | | | | | | | | | | 41,214,005 | |
| | | | | | | | | | | | | | | | |
| | | |
| Household Durables: 0.99% | | | | | | | | | | | | | |
Tempur-Pedic International Incorporated † | | | | | | | | | | | 96,410 | | | | 5,612,990 | |
William Lyon Homes Class A †« | | | | | | | | | | | 388,969 | | | | 6,309,077 | |
| | | | |
| | | | | | | | | | | | | | | 11,922,067 | |
| | | | | | | | | | | | | | | | |
| | | |
| Leisure Products: 0.30% | | | | | | | | | | | | | |
Malibu Boats Incorporated Class A † | | | | | | | | | | | 262,490 | | | | 3,569,864 | |
| | | | | | | | | | | | | | | | |
| | | |
| Media: 2.44% | | | | | | | | | | | | | |
IMAX Corporation † | | | | | | | | | | | 481,153 | | | | 16,041,641 | |
Lions Gate Entertainment Corporation « | | | | | | | | | | | 357,164 | | | | 7,964,757 | |
Media General Incorporated † | | | | | | | | | | | 289,410 | | | | 5,163,074 | |
| | | | |
| | | | | | | | | | | | | | | 29,169,472 | |
| | | | | | | | | | | | | | | | |
| | | |
| Specialty Retail: 3.80% | | | | | | | | | | | | | |
Burlington Stores Incorporated † | | | | | | | | | | | 188,080 | | | | 11,352,509 | |
Chico’s FAS Incorporated | | | | | | | | | | | 525,617 | | | | 5,702,944 | |
Dick’s Sporting Goods Incorporated | | | | | | | | | | | 241,689 | | | | 10,368,458 | |
Monro Muffler Brake Incorporated | | | | | | | | | | | 124,471 | | | | 7,835,449 | |
Party City Holdco Incorporated † | | | | | | | | | | | 730,240 | | | | 10,179,546 | |
| | | | |
| | | | | | | | | | | | | | | 45,438,906 | |
| | | | | | | | | | | | | | | | |
| | | |
| Textiles, Apparel & Luxury Goods: 0.71% | | | | | | | | | | | | | |
Kate Spade & Company † | | | | | | | | | | | 388,780 | | | | 8,498,731 | |
| | | | | | | | | | | | | | | | |
| | | |
Consumer Staples: 2.60% | | | | | | | | | | | | | |
| | | |
| Food Products: 1.78% | | | | | | | | | | | | | |
Amplify Snack Brands Incorporated †« | | | | | | | | | | | 723,199 | | | | 9,437,747 | |
WhiteWave Foods Company † | | | | | | | | | | | 265,936 | | | | 11,874,042 | |
| | | | |
| | | | | | | | | | | | | | | 21,311,789 | |
| | | | | | | | | | | | | | | | |
The accompanying notes are an integral part of these financial statements.
| | | | | | |
| Portfolio of investments—May 31, 2016 | | Wells Fargo Equity Gateway Funds | | | 111 | |
SMALL COMPANY GROWTH PORTFOLIO
| | | | | | | | | | | | | | | | |
| Security name | | | | | | | | Shares | | | Value | |
| | | |
| Household Products: 0.82% | | | | | | | | | | | | | |
Central Garden & Pet Company † | | | | | | | | | | | 60,890 | | | $ | 1,137,425 | |
Central Garden & Pet Company Class A † | | | | | | | | | | | 475,575 | | | | 8,669,732 | |
| | | |
| | | | | | | | | | | | 9,807,157 | |
| | | | | | | | | | | | | | | | |
| | | |
Energy: 2.69% | | | | | | | | | | | | | |
| | | |
| Oil, Gas & Consumable Fuels: 2.69% | | | | | | | | | | | | | |
Diamondback Energy Incorporated † | | | | | | | | | | | 110,139 | | | | 10,017,142 | |
GasLog Limited « | | | | | | | | | | | 483,053 | | | | 6,014,010 | |
Memorial Resource Development Corporation † | | | | | | | | | | | 354,153 | | | | 5,595,617 | |
QEP Resources Incorporated | | | | | | | | | | | 568,950 | | | | 10,599,539 | |
| | | | |
| | | | | | | | | | | | | | | 32,226,308 | |
| | | | | | | | | | | | | | | | |
| | | |
Financials: 9.41% | | | | | | | | | | | | | |
| | | |
| Banks: 2.55% | | | | | | | | | | | | | |
ServisFirst Bancshares Incorporated « | | | | | | | | | | | 165,480 | | | | 8,611,579 | |
Signature Bank † | | | | | | | | | | | 69,675 | | | | 9,406,125 | |
SVB Financial Group † | | | | | | | | | | | 113,342 | | | | 12,490,288 | |
| | | | |
| | | | | | | | | | | | | | | 30,507,992 | |
| | | | | | | | | | | | | | | | |
| | | |
| Capital Markets: 3.25% | | | | | | | | | | | | | |
Evercore Partners Incorporated Class A | | | | | | | | | | | 301,814 | | | | 15,694,328 | |
Stifel Financial Corporation † | | | | | | | | | | | 258,781 | | | | 9,776,746 | |
Virtu Financial Incorporated Class A | | | | | | | | | | | 436,538 | | | | 7,774,742 | |
Virtus Investment Partners Incorporated | | | | | | | | | | | 69,078 | | | | 5,623,640 | |
| | | | |
| | | | | | | | | | | | | | | 38,869,456 | |
| | | | | | | | | | | | | | | | |
| | | |
| Insurance: 1.17% | | | | | | | | | | | | | |
Argo Group International Holdings Limited | | | | | | | | | | | 265,607 | | | | 13,984,214 | |
| | | | | | | | | | | | | | | | |
| | | |
| REITs: 1.19% | | | | | | | | | | | | | |
QTS Realty Trust Incorporated Class A | | | | | | | | | | | 275,695 | | | | 14,245,161 | |
| | | | | | | | | | | | | | | | |
| | | |
| Thrifts & Mortgage Finance: 1.25% | | | | | | | | | | | | | |
Essent Group Limited † | | | | | | | | | | | 684,644 | | | | 14,966,318 | |
| | | | | | | | | | | | | | | | |
| | | |
Health Care: 23.15% | | | | | | | | | | | | | |
| | | |
| Biotechnology: 3.91% | | | | | | | | | | | | | |
Alder Biopharmaceuticals Incorporated †« | | | | | | | | | | | 180,740 | | | | 5,434,852 | |
Alnylam Pharmaceuticals Incorporated † | | | | | | | | | | | 100,665 | | | | 7,219,694 | |
Cepheid Incorporated † | | | | | | | | | | | 330,687 | | | | 9,262,543 | |
Flexion Therapeutics Incorporated † | | | | | | | | | | | 379,627 | | | | 6,620,695 | |
Intrexon Corporation « | | | | | | | | | | | 148,882 | | | | 4,576,633 | |
Portola Pharmaceuticals Incorporated † | | | | | | | | | | | 214,134 | | | | 5,884,402 | |
Radius Health Incorporated †« | | | | | | | | | | | 112,560 | | | | 4,081,426 | |
Tesaro Incorporated †« | | | | | | | | | | | 80,082 | | | | 3,707,797 | |
| | | | |
| | | | | | | | | | | | | | | 46,788,042 | |
| | | | | | | | | | | | | | | | |
The accompanying notes are an integral part of these financial statements.
| | | | |
| 112 | | Wells Fargo Equity Gateway Funds | | Portfolio of investments—May 31, 2016 |
SMALL COMPANY GROWTH PORTFOLIO
| | | | | | | | | | | | | | | | |
| Security name | | | | | | | | Shares | | | Value | |
| | | |
| Health Care Equipment & Supplies: 8.29% | | | | | | | | | | | | | |
Accuray Incorporated †« | | | | | | | | | | | 1,254,478 | | | $ | 6,836,905 | |
Analogic Corporation | | | | | | | | | | | 128,080 | | | | 10,502,560 | |
Atricure Incorporated † | | | | | | | | | | | 452,413 | | | | 6,555,464 | |
Cerus Corporation †« | | | | | | | | | | | 1,721,148 | | | | 9,569,583 | |
Dexcom Incorporated † | | | | | | | | | | | 154,016 | | | | 9,932,492 | |
Inogen Incorporated † | | | | | | | | | | | 260,165 | | | | 12,420,277 | |
LDR Holding Corporation † | | | | | | | | | | | 411,724 | | | | 8,658,556 | |
Nevro Corporation †« | | | | | | | | | | | 177,490 | | | | 12,374,603 | |
Novocure Limited †« | | | | | | | | | | | 412,470 | | | | 4,590,791 | |
The Spectranetics Corporation †« | | | | | | | | | | | 491,654 | | | | 9,007,101 | |
Wright Medical Group NV † | | | | | | | | | | | 452,394 | | | | 8,749,300 | |
| | | | |
| | | | | | | | | | | | | | | 99,197,632 | |
| | | | | | | | | | | | | | | | |
| | | |
| Health Care Providers & Services: 6.49% | | | | | | | | | | | | | |
Adeptus Health Incorporated Class A †« | | | | | | | | | | | 160,667 | | | | 11,487,691 | |
AMN Healthcare Services Incorporated † | | | | | | | | | | | 333,325 | | | | 12,446,356 | |
Capital Senior Living Corporation † | | | | | | | | | | | 536,030 | | | | 9,803,989 | |
HealthEquity Incorporated † | | | | | | | | | | | 538,630 | | | | 13,902,040 | |
LifePoint Hospitals Incorporated † | | | | | | | | | | | 146,046 | | | | 9,681,389 | |
Surgery Partners Incorporated † | | | | | | | | | | | 555,680 | | | | 7,643,378 | |
Teladoc Incorporated †« | | | | | | | | | | | 376,900 | | | | 4,307,967 | |
The Ensign Group Incorporated | | | | | | | | | | | 420,510 | | | | 8,347,124 | |
| | | | |
| | | | | | | | | | | | | | | 77,619,934 | |
| | | | | | | | | | | | | | | | |
| | | |
| Health Care Technology: 1.80% | | | | | | | | | | | | | |
Cotiviti Holdings Incorporated † | | | | | | | | | | | 260,329 | | | | 4,753,608 | |
Evolent Health Incorporated Class A †« | | | | | | | | | | | 602,380 | | | | 9,228,462 | |
Medidata Solutions Incorporated † | | | | | | | | | | | 165,162 | | | | 7,587,542 | |
| | | | |
| | | | | | | | | | | | | | | 21,569,612 | |
| | | | | | | | | | | | | | | | |
| | | |
| Life Sciences Tools & Services: 1.51% | | | | | | | | | | | | | |
ICON plc ADR † | | | | | | | | | | | 256,392 | | | | 18,060,252 | |
| | | | | | | | | | | | | | | | |
| | | |
| Pharmaceuticals: 1.15% | | | | | | | | | | | | | |
Cempra Holdings Incorporated †« | | | | | | | | | | | 268,840 | | | | 5,051,504 | |
Pacira Pharmaceuticals Incorporated †« | | | | | | | | | | | 188,200 | | | | 8,753,182 | |
| | | | |
| | | | | | | | | | | | | | | 13,804,686 | |
| | | | | | | | | | | | | | | | |
| | | |
Industrials: 16.42% | | | | | | | | | | | | | |
| | | |
| Air Freight & Logistics: 1.30% | | | | | | | | | | | | | |
Hub Group Incorporated Class A † | | | | | | | | | | | 388,019 | | | | 15,528,520 | |
| | | | | | | | | | | | | | | | |
| | | |
| Building Products: 5.00% | | | | | | | | | | | | | |
A.O. Smith Corporation | | | | | | | | | | | 177,204 | | | | 14,583,889 | |
Apogee Enterprises Incorporated | | | | | | | | | | | 314,635 | | | | 14,227,795 | |
Masonite International Corporation † | | | | | | | | | | | 130,680 | | | | 9,125,384 | |
NCI Building Systems Incorporated † | | | | | | | | | | | 779,634 | | | | 12,552,107 | |
PGT Incorporated † | | | | | | | | | | | 870,941 | | | | 9,336,488 | |
| | | | |
| | | | | | | | | | | | | | | 59,825,663 | |
| | | | | | | | | | | | | | | | |
The accompanying notes are an integral part of these financial statements.
| | | | | | |
| Portfolio of investments—May 31, 2016 | | Wells Fargo Equity Gateway Funds | | | 113 | |
SMALL COMPANY GROWTH PORTFOLIO
| | | | | | | | | | | | | | | | |
| Security name | | | | | | | | Shares | | | Value | |
| | | |
| Commercial Services & Supplies: 3.82% | | | | | | | | | | | | | |
Copart Incorporated † | | | | | | | | | | | 333,795 | | | $ | 16,526,190 | |
KAR Auction Services Incorporated | | | | | | | | | | | 259,840 | | | | 10,663,834 | |
Mobile Mini Incorporated | | | | | | | | | | | 279,215 | | | | 9,618,957 | |
West Corporation | | | | | | | | | | | 423,880 | | | | 8,943,868 | |
| | | | |
| | | | | | | | | | | | | | | 45,752,849 | |
| | | | | | | | | | | | | | | | |
| | | |
| Construction & Engineering: 1.69% | | | | | | | | | | | | | |
Chicago Bridge & Iron Company NV | | | | | | | | | | | 254,619 | | | | 9,736,631 | |
Granite Construction Incorporated | | | | | | | | | | | 243,290 | | | | 10,444,440 | |
| | | | |
| | | | | | | | | | | | | | | 20,181,071 | |
| | | | | | | | | | | | | | | | |
| | | |
| Machinery: 0.91% | | | | | | | | | | | | | |
Wabash National Corporation † | | | | | | | | | | | 770,303 | | | | 10,922,897 | |
| | | | | | | | | | | | | | | | |
| | | |
| Professional Services: 1.98% | | | | | | | | | | | | | |
On Assignment Incorporated † | | | | | | | | | | | 341,274 | | | | 12,855,792 | |
RPX Corporation † | | | | | | | | | | | 437,894 | | | | 4,400,835 | |
TrueBlue Incorporated † | | | | | | | | | | | 325,860 | | | | 6,455,287 | |
| | | | |
| | | | | | | | | | | | | | | 23,711,914 | |
| | | | | | | | | | | | | | | | |
| | | |
| Road & Rail: 1.49% | | | | | | | | | | | | | |
Genesee & Wyoming Incorporated Class A † | | | | | | | | | | | 166,147 | | | | 9,980,450 | |
Swift Transportation Company †« | | | | | | | | | | | 502,826 | | | | 7,834,029 | |
| | | | |
| | | | | | | | | | | | | | | 17,814,479 | |
| | | | | | | | | | | | | | | | |
| | | |
| Trading Companies & Distributors: 0.23% | | | | | | | | | | | | | |
Siteone Landscape Supply Incorporated † | | | | | | | | | | | 99,688 | | | | 2,804,223 | |
| | | | | | | | | | | | | | | | |
| | | |
Information Technology: 27.06% | | | | | | | | | | | | | |
| | | |
| Communications Equipment: 1.35% | | | | | | | | | | | | | |
Ciena Corporation † | | | | | | | | | | | 420,890 | | | | 7,348,739 | |
Infinera Corporation † | | | | | | | | | | | 673,912 | | | | 8,834,986 | |
| | | | |
| | | | | | | | | | | | | | | 16,183,725 | |
| | | | | | | | | | | | | | | | |
| | | |
| Electronic Equipment, Instruments & Components: 0.74% | | | | | | | | | | | | | |
OSI Systems Incorporated † | | | | | | | | | | | 165,436 | | | | 8,814,430 | |
| | | | | | | | | | | | | | | | |
| | | |
| Internet Software & Services: 6.27% | | | | | | | | | | | | | |
2U Incorporated †« | | | | | | | | | | | 431,071 | | | | 12,001,017 | |
Benefitfocus Incorporated †« | | | | | | | | | | | 273,850 | | | | 10,053,034 | |
Cornerstone OnDemand Incorporated † | | | | | | | | | | | 366,620 | | | | 14,668,466 | |
Hortonworks Incorporated †« | | | | | | | | | | | 592,020 | | | | 6,914,794 | |
Marketo Incorporated † | | | | | | | | | | | 429,220 | | | | 15,121,421 | |
Pandora Media Incorporated †« | | | | | | | | | | | 528,370 | | | | 6,229,482 | |
Shopify Incorporated Class A †« | | | | | | | | | | | 344,870 | | | | 10,101,242 | |
| | | | |
| | | | | | | | | | | | | | | 75,089,456 | |
| | | | | | | | | | | | | | | | |
The accompanying notes are an integral part of these financial statements.
| | | | |
| 114 | | Wells Fargo Equity Gateway Funds | | Portfolio of investments—May 31, 2016 |
SMALL COMPANY GROWTH PORTFOLIO
| | | | | | | | | | | | | | | | |
| Security name | | | | | | | | Shares | | | Value | |
| | | |
| IT Services: 2.88% | | | | | | | | | | | | | |
Acxiom Corporation † | | | | | | | | | | | 605,560 | | | $ | 12,825,761 | |
Maximus Incorporated | | | | | | | | | | | 190,500 | | | | 10,982,325 | |
Vantiv Incorporated Class A † | | | | | | | | | | | 197,360 | | | | 10,612,047 | |
| | | | |
| | | | | | | | | | | | | | | 34,420,133 | |
| | | | | | | | | | | | | | | | |
| | | |
| Semiconductors & Semiconductor Equipment: 6.17% | | | | | | | | | | | | | |
Applied Micro Circuits Corporation † | | | | | | | | | | | 1,207,237 | | | | 7,943,619 | |
Cypress Semiconductor Corporation | | | | | | | | | | | 1,143,754 | | | | 12,158,105 | |
FormFactor Incorporated † | | | | | | | | | | | 1,103,995 | | | | 7,915,644 | |
Microsemi Corporation † | | | | | | | | | | | 394,190 | | | | 13,335,448 | |
Nanometrics Incorporated † | | | | | | | | | | | 324,399 | | | | 6,040,309 | |
Silicon Motion Technology Corporation « | | | | | | | | | | | 246,514 | | | | 10,957,547 | |
Teradyne Incorporated | | | | | | | | | | | 780,857 | | | | 15,468,777 | |
| | | | |
| | | | | | | | | | | | | | | 73,819,449 | |
| | | | | | | | | | | | | | | | |
| | | |
| Software: 9.65% | | | | | | | | | | | | | |
Cadence Design Systems Incorporated † | | | | | | | | | | | 614,135 | | | | 15,181,417 | |
CyberArk Software Limited †« | | | | | | | | | | | 239,950 | | | | 10,898,529 | |
PTC Incorporated † | | | | | | | | | | | 414,545 | | | | 14,815,838 | |
Qlik Technologies Incorporated † | | | | | | | | | | | 530,453 | | | | 15,224,001 | |
Secureworks Corporation Class A †« | | | | | | | | | | | 273,420 | | | | 3,777,297 | |
SS&C Technologies Holdings Incorporated | | | | | | | | | | | 349,948 | | | | 21,553,297 | |
Synchronoss Technologies Incorporated † | | | | | | | | | | | 220,910 | | | | 7,791,496 | |
The Rubicon Project Incorporated † | | | | | | | | | | | 652,224 | | | | 9,555,082 | |
Ultimate Software Group Incorporated † | | | | | | | | | | | 45,881 | | | | 9,381,747 | |
Zendesk Incorporated † | | | | | | | | | | | 296,733 | | | | 7,266,991 | |
| | | | |
| | | | | | | | | | | | | | | 115,445,695 | |
| | | | | | | | | | | | | | | | |
| | | |
Materials: 2.05% | | | | | | | | | | | | | |
| | | |
| Chemicals: 0.17% | | | | | | | | | | | | | |
Calgon Carbon Corporation | | | | | | | | | | | 133,782 | | | | 1,990,676 | |
| | | | | | | | | | | | | | | | |
| | | |
| Metals & Mining: 0.91% | | | | | | | | | | | | | |
Steel Dynamics Incorporated | | | | | | | | | | | 440,383 | | | | 10,873,056 | |
| | | | | | | | | | | | | | | | |
| | | |
| Paper & Forest Products: 0.97% | | | | | | | | | | | | | |
Boise Cascade Company † | | | | | | | | | | | 507,067 | | | | 11,642,258 | |
| | | | | | | | | | | | | | | | |
| | | | |
Total Common Stocks (Cost $1,086,280,944) | | | | | | | | | | | | | | | 1,165,439,366 | |
| | | | | | | | | | | | | | | | |
| | | Yield | | | | | | | | | | |
| Short-Term Investments: 16.01% | | | | | | | | | | | | | | | | |
| | | | |
| Investment Companies: 16.01% | | | | | | | | | | | | | | | | |
Securities Lending Cash Investments LLC (l)(r)(u) | | | 0.45 | % | | | | | | | 151,177,536 | | | | 151,177,536 | |
Wells Fargo Cash Investment Money Market Fund Select Class (l)(u) | | | 0.41 | | | | | | | | 40,370,488 | | | | 40,370,488 | |
| | | | |
Total Short-Term Investments (Cost $191,548,024) | | | | | | | | | | | | | | | 191,548,024 | |
| | | | | | | | | | | | | | | | |
| | | | | | | | |
| Total investments in securities (Cost $1,277,828,968) * | | | 113.40 | % | | | 1,356,987,390 | |
Other assets and liabilities, net | | | (13.40 | ) | | | (160,390,950 | ) |
| | | | | | | | |
| Total net assets | | | 100.00 | % | | $ | 1,196,596,440 | |
| | | | | | | | |
The accompanying notes are an integral part of these financial statements.
| | | | | | |
| Portfolio of investments—May 31, 2016 | | Wells Fargo Equity Gateway Funds | | | 115 | |
SMALL COMPANY GROWTH PORTFOLIO
| † | Non-income-earning security |
| « | All or a portion of this security is on loan. |
| (l) | The issuer of the security is an affiliated person of the Portfolio as defined in the Investment Company Act of 1940. |
| (r) | The investment is a non-registered investment vehicle purchased with cash collateral received from securities on loan. |
| (u) | The rate represents the 7-day annualized yield at period end. |
| * | Cost for federal income tax purposes is $1,301,744,639 and unrealized gains (losses) consists of: |
| | | | |
Gross unrealized gains | | $ | 153,262,207 | |
Gross unrealized losses | | | (98,019,456 | ) |
| | | | |
Net unrealized gains | | $ | 55,242,751 | |
The accompanying notes are an integral part of these financial statements.
| | | | |
| 116 | | Wells Fargo Equity Gateway Funds | | Portfolio of investments—May 31, 2016 |
SMALL COMPANY VALUE PORTFOLIO
| | | | | | | | | | | | | | | | |
| Security name | | | | | | | | Shares | | | Value | |
| | | | |
Common Stocks: 98.11% | | | | | | | | | | | | | | | | |
| | | | |
Consumer Discretionary: 14.49% | | | | | | | | | | | | | | | | |
| | | | |
| Auto Components: 1.80% | | | | | | | | | | | | | | | | |
American Axle & Manufacturing Holdings Incorporated † | | | | | | | | | | | 135,919 | | | $ | 2,265,764 | |
Metaldyne Performance Group Incorporated | | | | | | | | | | | 101,000 | | | | 1,646,300 | |
| |
| | | | 3,912,064 | |
| | | | | | | | | | | | | | | | |
| | | | |
| Automobiles: 1.16% | | | | | | | | | | | | | | | | |
Thor Industries Incorporated | | | | | | | | | | | 38,950 | | | | 2,531,750 | |
| | | | | | | | | | | | | | | | |
| | | | |
| Hotels, Restaurants & Leisure: 0.66% | | | | | | | | | | | | | | | | |
ClubCorp Holdings Incorporated | | | | | | | | | | | 119,494 | | | | 1,442,293 | |
| | | | | | | | | | | | | | | | |
| | | | |
| Household Durables: 1.25% | | | | | | | | | | | | | | | | |
Beazer Homes Incorporated † | | | | | | | | | | | 153,160 | | | | 1,202,306 | |
WCI Communities Incorporated † | | | | | | | | | | | 87,500 | | | | 1,505,875 | |
| |
| | | | 2,708,181 | |
| | | | | | | | | | | | | | | | |
| | | | |
| Media: 2.72% | | | | | | | | | | | | | | | | |
Lions Gate Entertainment Corporation | | | | | | | | | | | 128,600 | | | | 2,867,780 | |
Scholastic Corporation | | | | | | | | | | | 78,023 | | | | 3,046,798 | |
| |
| | | | 5,914,578 | |
| | | | | | | | | | | | | | | | |
| | | | |
| Specialty Retail: 4.92% | | | | | | | | | | | | | | | | |
Asbury Automotive Group Incorporated † | | | | | | | | | | | 32,109 | | | | 1,801,315 | |
Ascena Retail Group Incorporated † | | | | | | | | | | | 196,620 | | | | 1,419,596 | |
GNC Holdings Incorporated Class A | | | | | | | | | | | 61,770 | | | | 1,609,109 | |
Outerwall Incorporated « | | | | | | | | | | | 54,010 | | | | 2,227,913 | |
Rent-A-Center Incorporated | | | | | | | | | | | 116,600 | | | | 1,535,622 | |
Urban Outfitters Incorporated † | | | | | | | | | | | 74,250 | | | | 2,118,353 | |
| |
| | | | 10,711,908 | |
| | | | | | | | | | | | | | | | |
| | | | |
| Textiles, Apparel & Luxury Goods: 1.98% | | | | | | | | | | | | | | | | |
G-III Apparel Group Limited † | | | | | | | | | | | 53,900 | | | | 2,108,568 | |
Oxford Industries Incorporated | | | | | | | | | | | 34,700 | | | | 2,198,939 | |
| |
| | | | 4,307,507 | |
| | | | | | | | | | | | | | | | |
| | | | |
Consumer Staples: 2.42% | | | | | | | | | | | | | | | | |
| | | | |
| Food & Staples Retailing: 1.17% | | | | | | | | | | | | | | | | |
SUPERVALU Incorporated † | | | | | | | | | | | 247,150 | | | | 1,144,305 | |
United Natural Foods Incorporated † | | | | | | | | | | | 38,020 | | | | 1,416,625 | |
| |
| | | | 2,560,930 | |
| | | | | | | | | | | | | | | | |
| | | | |
| Food Products: 1.25% | | | | | | | | | | | | | | | | |
Darling Ingredients Incorporated † | | | | | | | | | | | 176,810 | | | | 2,714,034 | |
| | | | | | | | | | | | | | | | |
| | | | |
Energy: 6.42% | | | | | | | | | | | | | | | | |
| | | | |
| Energy Equipment & Services: 1.09% | | | | | | | | | | | | | | | | |
RPC Incorporated « | | | | | | | | | | | 160,300 | | | | 2,364,425 | |
| | | | | | | | | | | | | | | | |
The accompanying notes are an integral part of these financial statements.
| | | | | | |
| Portfolio of investments—May 31, 2016 | | Wells Fargo Equity Gateway Funds | | | 117 | |
SMALL COMPANY VALUE PORTFOLIO
| | | | | | | | | | | | | | | | |
| Security name | | | | | | | | Shares | | | Value | |
| | | | |
| Oil, Gas & Consumable Fuels: 5.33% | | | | | | | | | | | | | | | | |
Callon Petroleum Company † | | | | | | | | | | | 187,300 | | | $ | 2,133,347 | |
Carrizo Oil & Gas Incorporated † | | | | | | | | | �� | | 50,600 | | | | 1,948,100 | |
Delek US Holdings Incorporated | | | | | | | | | | | 122,500 | | | | 1,688,050 | |
Parsley Energy Incorporated Class A † | | | | | | | | | | | 75,800 | | | | 1,976,106 | |
RSP Permian Incorporated † | | | | | | | | | | | 58,540 | | | | 1,927,722 | |
Scorpio Tankers Incorporated | | | | | | | | | | | 327,000 | | | | 1,922,760 | |
| | | | |
| | | | | | | | | | | | | | | 11,596,085 | |
| | | | | | | | | | | | | | | | |
| | | | |
Financials: 39.49% | | | | | | | | | | | | | | | | |
| | | | |
| Banks: 18.42% | | | | | | | | | | | | | | | | |
BancorpSouth Incorporated | | | | | | | | | | | 103,592 | | | | 2,474,813 | |
BankUnited Incorporated | | | | | | | | | | | 72,150 | | | | 2,388,165 | |
Cathay General Bancorp | | | | | | | | | | | 73,000 | | | | 2,249,860 | |
ConnectOne Bancorp Incorporated | | | | | | | | | | | 81,120 | | | | 1,284,941 | |
Customers Bancorp Incorporated † | | | | | | | | | | | 59,400 | | | | 1,597,266 | |
FCB Financial Holdings Class A † | | | | | | | | | | | 63,600 | | | | 2,351,292 | |
Great Western Bancorp Incorporated | | | | | | | | | | | 100,940 | | | | 3,433,979 | |
Pinnacle Financial Partners Incorporated | | | | | | | | | | | 44,960 | | | | 2,211,133 | |
PrivateBancorp Incorporated | | | | | | | | | | | 67,597 | | | | 2,997,927 | |
Renasant Corporation | | | | | | | | | | | 75,600 | | | | 2,601,396 | |
Sterling BanCorp | | | | | | | | | | | 163,800 | | | | 2,696,148 | |
Talmer Bancorp Incorporated Class A | | | | | | | | | | | 155,400 | | | | 3,098,676 | |
Umpqua Holdings Corporation | | | | | | | | | | | 130,600 | | | | 2,088,294 | |
Webster Financial Corporation | | | | | | | | | | | 70,437 | | | | 2,758,313 | |
Western Alliance Bancorp † | | | | | | | | | | | 89,978 | | | | 3,392,171 | |
Wintrust Financial Corporation | | | | | | | | | | | 45,977 | | | | 2,449,195 | |
| | | | |
| | | | | | | | | | | | | | | 40,073,569 | |
| | | | | | | | | | | | | | | | |
| | | | |
| Capital Markets: 2.15% | | | | | | | | | | | | | | | | |
HFF Incorporated Class A | | | | | | | | | | | 66,400 | | | | 2,138,080 | |
Stifel Financial Corporation † | | | | | | | | | | | 67,193 | | | | 2,538,552 | |
| | | | |
| | | | | | | | | | | | | | | 4,676,632 | |
| | | | | | | | | | | | | | | | |
| | | | |
| Consumer Finance: 0.86% | | | | | | | | | | | | | | | | |
PRA Incorporated † | | | | | | | | | | | 67,770 | | | | 1,864,353 | |
| | | | | | | | | | | | | | | | |
| | | | |
| Insurance: 5.28% | | | | | | | | | | | | | | | | |
American Equity Investment Life Holding Company | | | | | | | | | | | 101,108 | | | | 1,638,961 | |
Employers Holdings Incorporated | | | | | | | | | | | 39,034 | | | | 1,165,165 | |
Horace Mann Educators Corporation | | | | | | | | | | | 71,710 | | | | 2,442,443 | |
Kemper Corporation | | | | | | | | | | | 50,310 | | | | 1,625,516 | |
OneBeacon Insurance Group Limited Class A | | | | | | | | | | | 103,456 | | | | 1,346,997 | |
Primerica Incorporated « | | | | | | | | | | | 58,063 | | | | 3,257,915 | |
| | | | |
| | | | | | | | | | | | | | | 11,476,997 | |
| | | | | | | | | | | | | | | | |
| | | | |
| Real Estate Management & Development: 0.75% | | | | | | | | | | | | | | | | |
Alexander & Baldwin Incorporated | | | | | | | | | | | 43,581 | | | | 1,641,260 | |
| | | | | | | | | | | | | | | | |
The accompanying notes are an integral part of these financial statements.
| | | | |
| 118 | | Wells Fargo Equity Gateway Funds | | Portfolio of investments—May 31, 2016 |
SMALL COMPANY VALUE PORTFOLIO
| | | | | | | | | | | | | | | | |
| Security name | | | | | | | | Shares | | | Value | |
| | | | |
| REITs: 12.03% | | | | | | | | | | | | | | | | |
Brandywine Realty Trust | | | | | | | | | | | 162,900 | | | $ | 2,572,191 | |
Corporate Office Properties Trust | | | | | | | | | | | 100,500 | | | | 2,716,515 | |
Equity Commonwealth † | | | | | | | | | | | 106,100 | | | | 3,065,229 | |
Four Corners Property Trust Incorporated | | | | | | | | | | | 122,100 | | | | 2,373,624 | |
Highwoods Properties Incorporated | | | | | | | | | | | 54,100 | | | | 2,632,506 | |
Kite Realty Group Trust | | | | | | | | | | | 79,200 | | | | 2,128,104 | |
National Health Investors Incorporated | | | | | | | | | | | 32,400 | | | | 2,262,492 | |
Parkway Properties Incorporated | | | | | | | | | | | 130,297 | | | | 2,273,683 | |
Ramco-Gershenson Properties Trust | | | | | | | | | | | 150,221 | | | | 2,705,480 | |
Sabra Health Care REIT Incorporated | | | | | | | | | | | 82,600 | | | | 1,729,644 | |
Sunstone Hotel Investors Incorporated | | | | | | | | | | | 143,180 | | | | 1,723,887 | |
| | | | |
| | | | | | | | | | | | | | | 26,183,355 | |
| | | | | | | | | | | | | | | | |
| | | | |
Health Care: 3.82% | | | | | | | | | | | | | | | | |
| | | | |
| Health Care Equipment & Supplies: 0.71% | | | | | | | | | | | | | | | | |
Merit Medical Systems Incorporated † | | | | | | | | | | | 82,810 | | | | 1,554,344 | |
| | | | | | | | | | | | | | | | |
| | | | |
| Health Care Providers & Services: 3.11% | | | | | | | | | | | | | | | | |
Kindred Healthcare Incorporated | | | | | | | | | | | 155,700 | | | | 1,848,159 | |
Molina Healthcare Incorporated † | | | | | | | | | | | 57,260 | | | | 2,773,102 | |
Select Medical Holdings Corporation † | | | | | | | | | | | 168,420 | | | | 2,133,881 | |
| | | | |
| | | | | | | | | | | | | | | 6,755,142 | |
| | | | | | | | | | | | | | | | |
| | | | |
Industrials: 7.78% | | | | | | | | | | | | | | | | |
| | | | |
| Commercial Services & Supplies: 1.03% | | | | | | | | | | | | | | | | |
Quad Graphics Incorporated | | | | | | | | | | | 116,460 | | | | 2,237,197 | |
| | | | | | | | | | | | | | | | |
| | | | |
| Construction & Engineering: 2.82% | | | | | | | | | | | | | | | | |
Argan Incorporated | | | | | | | | | | | 62,300 | | | | 2,161,810 | |
KBR Incorporated | | | | | | | | | | | 116,490 | | | | 1,694,930 | |
Tutor Perini Corporation † | | | | | | | | | | | 100,795 | | | | 2,279,983 | |
| | | | |
| | | | | | | | | | | | | | | 6,136,723 | |
| | | | | | | | | | | | | | | | |
| | | | |
| Electrical Equipment: 1.29% | | | | | | | | | | | | | | | | |
Generac Holdings Incorporated † | | | | | | | | | | | 74,060 | | | | 2,807,615 | |
| | | | | | | | | | | | | | | | |
| | | | |
| Machinery: 1.51% | | | | | | | | | | | | | | | | |
Chart Industries Incorporated † | | | | | | | | | | | 83,380 | | | | 2,164,545 | |
NN Incorporated « | | | | | | | | | | | 67,190 | | | | 1,119,385 | |
| | | | |
| | | | | | | | | | | | | | | 3,283,930 | |
| | | | | | | | | | | | | | | | |
| | | | |
| Trading Companies & Distributors: 1.13% | | | | | | | | | | | | | | | | |
Air Lease Corporation | | | | | | | | | | | 81,800 | | | | 2,458,090 | |
| | | | | | | | | | | | | | | | |
| | | | |
Information Technology: 14.87% | | | | | | | | | | | | | | | | |
| | | | |
| Communications Equipment: 1.85% | | | | | | | | | | | | | | | | |
ARRIS International plc † | | | | | | | | | | | 92,313 | | | | 2,224,743 | |
NetScout Systems Incorporated † | | | | | | | | | | | 73,530 | | | | 1,788,830 | |
| | | | |
| | | | | | | | | | | | | | | 4,013,573 | |
| | | | | | | | | | | | | | | | |
The accompanying notes are an integral part of these financial statements.
| | | | | | |
| Portfolio of investments—May 31, 2016 | | Wells Fargo Equity Gateway Funds | | | 119 | |
SMALL COMPANY VALUE PORTFOLIO
| | | | | | | | | | | | | | | | |
| Security name | | | | | | | | Shares | | | Value | |
| | | | |
| Electronic Equipment, Instruments & Components: 3.75% | | | | | | | | | | | | | | | | |
Anixter International Incorporated † | | | | | | | | | | | 28,320 | | | $ | 1,704,864 | |
Belden Incorporated | | | | | | | | | | | 35,040 | | | | 2,266,037 | |
Jabil Circuit Incorporated | | | | | | | | | | | 113,640 | | | | 2,168,251 | |
VeriFone Systems Incorporated † | | | | | | | | | | | 76,800 | | | | 2,027,520 | |
| |
| | | | 8,166,672 | |
| | | | | | | | | | | | | | | | |
| | | | |
| Internet Software & Services: 1.73% | | | | | | | | | | | | | | | | |
Blucora Incorporated † | | | | | | | | | | | 195,660 | | | | 1,757,027 | |
IAC/InterActive Corp | | | | | | | | | | | 35,940 | | | | 2,008,327 | |
| |
| | | | 3,765,354 | |
| | | | | | | | | | | | | | | | |
| | | | |
| IT Services: 1.01% | | | | | | | | | | | | | | | | |
Cardtronics Incorporated † | | | | | | | | | | | 56,110 | | | | 2,204,562 | |
| | | | | | | | | | | | | | | | |
| | | | |
| Semiconductors & Semiconductor Equipment: 3.76% | | | | | | | | | | | | | | | | |
Cirrus Logic Incorporated † | | | | | | | | | | | 65,270 | | | | 2,349,720 | |
Integrated Device Technology Incorporated † | | | | | | | | | | | 92,580 | | | | 2,161,743 | |
Veeco Instruments Incorporated † | | | | | | | | | | | 73,530 | | | | 1,308,099 | |
Xcerra Corporation † | | | | | | | | | | | 362,971 | | | | 2,370,201 | |
| |
| | | | 8,189,763 | |
| | | | | | | | | | | | | | | | |
| | | | |
| Software: 1.09% | | | | | | | | | | | | | | | | |
EPIQ Systems Incorporated | | | | | | | | | | | 42,760 | | | | 651,235 | |
Mentor Graphics Corporation | | | | | | | | | | | 79,807 | | | | 1,711,062 | |
| |
| | | | 2,362,297 | |
| | | | | | | | | | | | | | | | |
| | | | |
| Technology Hardware, Storage & Peripherals: 1.68% | | | | | | | | | | | | | | | | |
Avid Technology Incorporated † | | | | | | | | | | | 219,320 | | | | 1,304,954 | |
Super Micro Computer Incorporated † | | | | | | | | | | | 89,220 | | | | 2,341,133 | |
| |
| | | | 3,646,087 | |
| | | | | | | | | | | | | | | | |
| | | | |
Materials: 3.98% | | | | | | | | | | | | | | | | |
| | | | |
| Chemicals: 2.96% | | | | | | | | | | | | | | | | |
A. Schulman Incorporated | | | | | | | | | | | 84,600 | | | | 2,141,226 | |
Cabot Corporation | | | | | | | | | | | 42,400 | | | | 1,938,104 | |
Chemtura Corporation † | | | | | | | | | | | 88,513 | | | | 2,361,527 | |
| |
| | | | 6,440,857 | |
| | | | | | | | | | | | | | | | |
| | | | |
| Metals & Mining: 1.02% | | | | | | | | | | | | | | | | |
Ferroglobe plc | | | | | | | | | | | 243,240 | | | | 2,218,349 | |
| | | | | | | | | | | | | | | | |
| | | | |
Utilities: 4.84% | | | | | | | | | | | | | | | | |
| | | | |
| Electric Utilities: 2.86% | | | | | | | | | | | | | | | | |
El Paso Electric Company | | | | | | | | | | | 44,141 | | | | 1,971,337 | |
PNM Resources Incorporated | | | | | | | | | | | 60,087 | | | | 1,973,257 | |
Portland General Electric Company | | | | | | | | | | | 55,124 | | | | 2,270,006 | |
| |
| | | | 6,214,600 | |
| | | | | | | | | | | | | | | | |
The accompanying notes are an integral part of these financial statements.
| | | | |
| 120 | | Wells Fargo Equity Gateway Funds | | Portfolio of investments—May 31, 2016 |
SMALL COMPANY VALUE PORTFOLIO
| | | | | | | | | | | | | | | | |
| Security name | | | | | | | | Shares | | | Value | |
| | | | |
| Gas Utilities: 0.51% | | | | | | | | | | | | | | | | |
Southwest Gas Corporation | | | | | | | | | | | 16,060 | | | $ | 1,115,046 | |
| | | | | | | | | | | | | | | | |
| | | | |
| Multi-Utilities: 1.47% | | | | | | | | | | | | | | | | |
Avista Corporation | | | | | | | | | | | 79,710 | | | | 3,205,936 | |
| | | | | | | | | | | | | | | | |
| |
Total Common Stocks (Cost $191,380,274) | | | | 213,456,058 | |
| | | | | | | | | | | | | | | | |
| | | | |
| | | | | | Expiration date | | | | | | | |
| Warrants: 0.00% | | | | | | | | | | | | | | | | |
| | | | |
Health Care: 0.00% | | | | | | | | | | | | | | | | |
| | | | |
| Health Care Equipment & Supplies: 0.00% | | | | | | | | | | | | | | | | |
EnteroMedics Incorporated †(a) | | | | | | | 6-13-2016 | | | | 9,104 | | | | 0 | |
| | | | | | | | | | | | | | | | |
| | | | |
Total Warrants (Cost $0) | | | | | | | | | | | | | | | 0 | |
| | | | | | | | | | | | | | | | |
| | | | |
| | | Yield | | | | | | | | | | |
| Short-Term Investments: 4.98% | | | | | | | | | | | | | | | | |
| | | | |
| Investment Companies: 4.98% | | | | | | | | | | | | | | | | |
Securities Lending Cash Investments LLC (l)(r)(u) | | | 0.45 | % | | | | | | | 5,965,825 | | | | 5,965,825 | |
Wells Fargo Cash Investment Money Market Fund Select Class (l)(u) | | | 0.41 | | | | | | | | 4,875,803 | | | | 4,875,803 | |
| | | | |
Total Short-Term Investments (Cost $10,841,628) | | | | | | | | | | | | | | | 10,841,628 | |
| | | | | | | | | | | | | | | | |
| | | | | | | | |
| Total investments in securities (Cost $202,221,902) * | | | 103.09 | % | | | 224,297,686 | |
Other assets and liabilities, net | | | (3.09 | ) | | | (6,727,916 | ) |
| | | | | | | | |
| Total net assets | | | 100.00 | % | | $ | 217,569,770 | |
| | | | | | | | |
| † | Non-income-earning security |
| « | All or a portion of this security is on loan. |
| (a) | The security is fair valued in accordance with procedures approved by the Board of Trustees. |
| (l) | The issuer of the security is an affiliated person of the Portfolio as defined in the Investment Company Act of 1940. |
| (r) | The investment is a non-registered investment vehicle purchased with cash collateral received from securities on loan. |
| (u) | The rate represents the 7-day annualized yield at period end. |
| * | Cost for federal income tax purposes is $202,899,156 and unrealized gains (losses) consists of: |
| | | | |
Gross unrealized gains | | $ | 34,100,284 | |
Gross unrealized losses | | | (12,701,754 | ) |
| | | | |
Net unrealized gains | | $ | 21,398,530 | |
The accompanying notes are an integral part of these financial statements.
This page is intentionally left blank.
| | | | |
| 122 | | Wells Fargo Equity Gateway Funds | | Statements of assets and liabilities—May 31, 2016 |
| | | | | | | | |
| | | C&B Large Cap Value Portfolio | | | Diversified Large
Cap Growth Portfolio | |
| | |
Assets | | | | | | | | |
Investments | | | | | | | | |
In unaffiliated securities (including securities on loan), at value (see cost below) | | $ | 278,436,916 | | | $ | 113,251,607 | |
In affiliated securities, at value (see cost below) | | | 26,317,459 | | | | 5,231,602 | |
| | | | |
Total investments, at value (see cost below) | | | 304,754,375 | | | | 118,483,209 | |
Cash | | | 17,670 | | | | 0 | |
Foreign currency, at value (see cost below) | | | 0 | | | | 0 | |
Receivable for investments sold | | | 259,153 | | | | 922,481 | |
Receivable for dividends | | | 554,970 | | | | 120,029 | |
Receivable for securities lending income | | | 3,494 | | | | 1,484 | |
Prepaid expenses and other assets | | | 592 | | | | 330 | |
| | | | |
Total assets | | | 305,590,254 | | | | 119,527,533 | |
| | | | |
| | |
Liabilities | | | | | | | | |
Payable for investments purchased | | | 0 | | | | 591,975 | |
Payable upon receipt of securities loaned | | | 12,454,900 | | | | 3,113,406 | |
Payable for daily variation margin on open futures contracts | | | 0 | | | | 0 | |
Due to custodian bank | | | 0 | | | | 0 | |
Advisory fee payable | | | 159,438 | | | | 47,773 | |
Accrued expenses and other liabilities | | | 11,627 | | | | 15,903 | |
| | | | |
Total liabilities | | | 12,625,965 | | | | 3,769,057 | |
| | | | |
Total net assets | | $ | 292,964,289 | | | $ | 115,758,476 | |
| | | | |
| | |
Investments in unaffiliated securities (including securities on loan), at cost | | $ | 210,754,976 | | | $ | 76,805,738 | |
| | | | |
Investments in affiliated securities, at cost | | $ | 26,317,459 | | | $ | 5,231,602 | |
| | | | |
Total investments, at cost | | $ | 237,072,435 | | | $ | 82,037,340 | |
| | | | |
Securities on loan, at value | | $ | 12,216,762 | | | $ | 3,056,884 | |
| | | | |
Foreign currency, at cost | | $ | 0 | | | $ | 0 | |
| | | | |
The accompanying notes are an integral part of these financial statements.
| | | | | | |
| Statements of assets and liabilities—May 31, 2016 | | Wells Fargo Equity Gateway Funds | | | 123 | |
| | | | | | | | | | | | | | | | | | | | | | | | | | |
Emerging Growth Portfolio | | | Index Portfolio | | | International Growth
Portfolio | | | International Value
Portfolio | | | Large Company Value
Portfolio | | | Small Company Growth
Portfolio | | | Small Company Value
Portfolio | |
| | | | | | |
| | | | | | | | | | | | | | | | | | | | | | | | | | |
| | | | | | | | | | | | | | | | | | | | | | | | | | |
| $ | 881,803,132 | | | $ | 2,280,382,178 | | | $ | 139,081,211 | | | $ | 493,603,692 | | | $ | 77,925,106 | | | $ | 1,165,439,366 | | | $ | 213,456,058 | |
| | 107,801,958 | | | | 67,271,596 | | | | 12,373,217 | | | | 16,847,390 | | | | 2,883,174 | | | | 191,548,024 | | | | 10,841,628 | |
| | |
| | 989,605,090 | | | | 2,347,653,774 | | | | 151,454,428 | | | | 510,451,082 | | | | 80,808,280 | | | | 1,356,987,390 | | | | 224,297,686 | |
| | 0 | | | | 22,803 | | | | 0 | | | | 0 | | | | 9,201 | | | | 0 | | | | 0 | |
| | 0 | | | | 0 | | | | 293,888 | | | | 8,634,767 | | | | 0 | | | | 0 | | | | 0 | |
| | 2,761,183 | | | | 1,362,819 | | | | 866,987 | | | | 33,527 | | | | 699,380 | | | | 7,015,660 | | | | 4,010,253 | |
| | 59,172 | | | | 5,412,117 | | | | 417,958 | | | | 3,701,260 | | | | 198,742 | | | | 442,558 | | | | 189,778 | |
| | 149,480 | | | | 6,050 | | | | 53,622 | | | | 232,005 | | | | 3,040 | | | | 204,650 | | | | 20,988 | |
| | 625 | | | | 1,706 | | | | 797 | | | | 494 | | | | 538 | | | | 5,660 | | | | 615 | |
| | |
| | 992,575,550 | | | | 2,354,459,269 | | | | 153,087,680 | | | | 523,053,135 | | | | 81,719,181 | | | | 1,364,655,918 | | | | 228,519,320 | |
| | |
| | | | | | |
| | | | | | | | | | | | | | | | | | | | | | | | | | |
| | 642,370 | | | | 1,078,571 | | | | 1,738,254 | | | | 0 | | | | 796,799 | | | | 15,415,653 | | | | 4,829,981 | |
| | 92,823,723 | | | | 12,693,253 | | | | 2,506,158 | | | | 14,316,539 | | | | 1,759,295 | | | | 151,177,536 | | | | 5,965,825 | |
| | 0 | | | | 36,000 | | | | 0 | | | | 0 | | | | 0 | | | | 0 | | | | 0 | |
| | 0 | | | | 0 | | | | 328,836 | | | | 0 | | | | 0 | | | | 682,735 | | | | 0 | |
| | 581,155 | | | | 167,698 | | | | 106,110 | | | | 361,069 | | | | 40,657 | | | | 771,774 | | | | 143,912 | |
| | 40,637 | | | | 71,289 | | | | 31,707 | | | | 56,557 | | | | 7,600 | | | | 11,780 | | | | 9,832 | |
| | |
| | 94,087,885 | | | | 14,046,811 | | | | 4,711,065 | | | | 14,734,165 | | | | 2,604,351 | | | | 168,059,478 | | | | 10,949,550 | |
| | |
| $ | 898,487,665 | | | $ | 2,340,412,458 | | | $ | 148,376,615 | | | $ | 508,318,970 | | | $ | 79,114,830 | | | $ | 1,196,596,440 | | | $ | 217,569,770 | |
| | |
| | | | | | |
| $ | 694,969,727 | | | $ | 1,093,021,946 | | | $ | 123,433,617 | | | $ | 550,701,975 | | | $ | 66,303,876 | | | $ | 1,086,280,944 | | | $ | 191,380,274 | |
| | |
| $ | 107,801,958 | | | $ | 53,161,799 | | | $ | 12,373,217 | | | $ | 16,847,390 | | | $ | 2,883,174 | | | $ | 191,548,024 | | | $ | 10,841,628 | |
| | |
| $ | 802,771,685 | | | $ | 1,146,183,745 | | | $ | 135,806,834 | | | $ | 567,549,365 | | | $ | 69,187,050 | | | $ | 1,277,828,968 | | | $ | 202,221,902 | |
| | |
| $ | 91,305,713 | | | $ | 12,474,646 | | | $ | 2,382,463 | | | $ | 13,468,272 | | | $ | 1,690,157 | | | $ | 149,147,065 | | | $ | 5,896,435 | |
| | |
| $ | 0 | | | $ | 0 | | | $ | 296,547 | | | $ | 8,869,296 | | | $ | 0 | | | $ | 0 | | | $ | 0 | |
| | |
The accompanying notes are an integral part of these financial statements.
| | | | |
| 124 | | Wells Fargo Equity Gateway Funds | | Statements of operations—year ended May 31, 2016 |
| | | | | | | | |
| | | C&B Large
Cap Value
Portfolio | | | Diversified Large Cap Growth
Portfolio | |
| | |
Investment income | | | | | | | | |
Dividends* | | $ | 6,182,005 | | | $ | 1,033,489 | |
Income from affiliated securities | | | 30,399 | | | | 6,535 | |
Securities lending income, net | | | 20,442 | | | | 11,053 | |
Interest | | | 0 | | | | 0 | |
| | | | |
Total investment income | | | 6,232,846 | | | | 1,051,077 | |
| | | | |
| | |
Expenses | | | | | | | | |
Advisory fee | | | 2,013,954 | | | | 747,058 | |
Custody and accounting fees | | | 23,584 | | | | 23,283 | |
Professional fees | | | 44,260 | | | | 48,177 | |
Shareholder report expenses | | | 1,061 | | | | 2,050 | |
Trustees’ fees and expenses | | | 12,601 | | | | 19,695 | |
Other fees and expenses | | | 9,104 | | | | 13,402 | |
| | | | |
Total expenses | | | 2,104,564 | | | | 853,665 | |
Less: Fee waivers and/or expense reimbursements | | | 0 | | | | (138,673 | ) |
| | | | |
Net expenses | | | 2,104,564 | | | | 714,992 | |
| | | | |
Net investment income (loss) | | | 4,128,282 | | | | 336,085 | |
| | | | |
| | |
REALIZED AND UNREALIZED GAINS (LOSSES) ON INVESTMENTS | | | | | | | | |
| | |
Net realized gains (losses) on: | | | | | | | | |
Unaffiliated securities | | | 14,000,084 | | | | 5,117,947 | |
Affiliated securities | | | 0 | | | | 0 | |
Futures transactions | | | 0 | | | | 0 | |
| | | | |
Net realized gain (losses) on investments | | | 14,000,084 | | | | 5,117,947 | |
| | | | |
| | |
Net change in unrealized gains (losses) on: | | | | | | | | |
Unaffiliated securities | | | (18,760,215 | ) | | | (7,846,480 | ) |
Affiiliated securities | | | 0 | | | | 0 | |
Futures transactions | | | 0 | | | | 0 | |
| | | | |
Net change in unrealized gains (losses) on investments | | | (18,760,215 | ) | | | (7,846,480 | ) |
| | | | |
Net realized and unrealized gains (losses) on investments | | | (4,760,131 | ) | | | (2,728,533 | ) |
| | | | |
Net increase (decrease) in net assets resulting from operations | | $ | (631,849 | ) | | $ | (2,392,448 | ) |
| | | | |
| | |
* Net of foreign dividend withholding taxes in the amount of | | | $38,949 | | | | $2,403 | |
The accompanying notes are an integral part of these financial statements.
| | | | | | |
| Statements of operations—year ended May 31, 2016 | | Wells Fargo Equity Gateway Funds | | | 125 | |
| | | | | | | | | | | | | | | | | | | | | | | | | | |
Emerging
Growth
Portfolio | | | Index
Portfolio | | | International
Growth Portfolio | | | International
Value Portfolio | | | Large Company
Value Portfolio | | | Small Company
Growth Portfolio | | | Small Company
Value Portfolio | |
| | | | | | |
| | | | | | | | | | | | | | | | | | | | | | | | | | |
| $ | 1,009,155 | | | $ | 53,355,178 | | | $ | 3,063,804 | | | $ | 16,120,553 | | | $ | 1,726,450 | | | $ | 4,949,491 | | | $ | 2,915,555 | |
| | 44,350 | | | | 1,008,833 | | | | 19,787 | | | | 11,579 | | | | 5,223 | | | | 143,025 | | | | 17,302 | |
| | 2,887,743 | | | | 137,335 | | | | 126,956 | | | | 723,831 | | | | 38,150 | | | | 2,906,307 | | | | 102,931 | |
| | 0 | | | | 1,715 | | | | 0 | | | | 0 | | | | 0 | | | | 0 | | | | 0 | |
| | |
| | 3,941,248 | | | | 54,503,061 | | | | 3,210,547 | | | | 16,855,963 | | | | 1,769,823 | | | | 7,998,823 | | | | 3,035,788 | |
| | |
| | | | | | |
| | | | | | | | | | | | | | | | | | | | | | | | | | |
| | 7,746,284 | | | | 2,086,232 | | | | 1,270,909 | | | | 4,189,538 | | | | 504,535 | | | | 8,131,574 | | | | 1,655,212 | |
| | 59,221 | | | | 144,630 | | | | 86,894 | | | | 187,952 | | | | 10,912 | | | | 68,505 | | | | 22,717 | |
| | 46,987 | | | | 60,723 | | | | 57,356 | | | | 60,833 | | | | 46,940 | | | | 48,594 | | | | 46,658 | |
| | 4,524 | | | | 7,122 | | | | 1,429 | | | | 2,646 | | | | 1,125 | | | | 1,984 | | | | 2,789 | |
| | 12,250 | | | | 9,545 | | | | 16,976 | | | | 11,965 | | | | 15,565 | | | | 11,943 | | | | 12,045 | |
| | 34,034 | | | | 264,943 | | | | 48,726 | | | | 53,937 | | | | 14,613 | | | | 25,031 | | | | 9,443 | |
| | |
| | 7,903,300 | | | | 2,573,195 | | | | 1,482,290 | | | | 4,506,871 | | | | 593,690 | | | | 8,287,631 | | | | 1,748,864 | |
| | 0 | | | | (11,554 | ) | | | 0 | | | | 0 | | | | (20,538 | ) | | | 0 | | | | 0 | |
| | |
| | 7,903,300 | | | | 2,561,641 | | | | 1,482,290 | | | | 4,506,871 | | | | 573,152 | | | | 8,287,631 | | | | 1,748,864 | |
| | |
| | (3,962,052 | ) | | | 51,941,420 | | | | 1,728,257 | | | | 12,349,092 | | | | 1,196,671 | | | | (288,808 | ) | | | 1,286,924 | |
| | |
| | | | | | |
| | | | | | | | | | | | | | | | | | | | | | | | | | |
| | | | | | |
| | | | | | | | | | | | | | | | | | | | | | | | | | |
| | 18,746,231 | | | | 153,490,597 | | | | (1,635,815 | ) | | | (1,517,228 | ) | | | (1,089,821 | ) | | | (95,998,247 | ) | | | 12,552,384 | |
| | 0 | | | | 1,980,988 | | | | 0 | | | | 0 | | | | 0 | | | | 0 | | | | 0 | |
| | 0 | | | | (1,069,185 | ) | | | 0 | | | | 0 | | | | 0 | | | | 0 | | | | 0 | |
| | |
| | 18,746,231 | | | | 154,402,400 | | | | (1,635,815 | ) | | | (1,517,228 | ) | | | (1,089,821 | ) | | | (95,998,247 | ) | | | 12,552,384 | |
| | |
| | | | | | |
| | | | | | | | | | | | | | | | | | | | | | | | | | |
| | (175,228,106 | ) | | | (175,233,159 | ) | | | (20,243,476 | ) | | | (73,474,825 | ) | | | (3,378,107 | ) | | | (55,183,521 | ) | | | (24,625,962 | ) |
| | 0 | | | | (5,340,034 | ) | | | 0 | | | | 0 | | | | 0 | | | | 0 | | | | 0 | |
| | 0 | | | | 950,920 | | | | 0 | | | | 0 | | | | 0 | | | | 0 | | | | 0 | |
| | |
| | (175,228,106 | ) | | | (179,622,273 | ) | | | (20,243,476 | ) | | | (73,474,825 | ) | | | (3,378,107 | ) | | | (55,183,521 | ) | | | (24,625,962 | ) |
| | |
| | (156,481,875 | ) | | | (25,219,873 | ) | | | (21,879,291 | ) | | | (74,992,053 | ) | | | (4,467,928 | ) | | | (151,181,768 | ) | | | (12,073,578 | ) |
| | |
| $ | (160,443,927 | ) | | $ | 26,721,547 | | | $ | (20,151,034 | ) | | $ | (62,642,961 | ) | | $ | (3,271,257 | ) | | $ | (151,470,576 | ) | | $ | (10,786,654 | ) |
| | |
| | | | | | |
| | $0 | | | | $26,513 | | | | $278,962 | | | | $2,059,737 | | | | $882 | | | | $10,989 | | | | $0 | |
The accompanying notes are an integral part of these financial statements.
| | | | |
| 126 | | Wells Fargo Equity Gateway Funds | | Statements of changes in net assets |
| | | | | | | | |
| | | C&B Large Cap Value Portfolio | |
| | | Year ended
May 31, 2016 | | | Year ended
May 31, 2015 | |
| | |
Operations | | | | | | | | |
Net investment income | | $ | 4,128,282 | | | $ | 3,962,347 | |
Net realized gains on investments | | | 14,000,084 | | | | 41,880,494 | |
Net change in unrealized gains (losses) on investments | | | (18,760,215 | ) | | | (13,267,776 | ) |
| | | | |
Net increase (decrease) in net assets resulting from operations | | | (631,849 | ) | | | 32,575,065 | |
| | | | |
| | |
Capital share transactions | | | | | | | | |
Transactions in investors’ beneficial interests | | | | | | | | |
Contributions | | | 38,393,377 | | | | 32,358,693 | |
Withdrawals | | | (80,332,043 | ) | | | (46,347,409 | ) |
| | | | |
Net decrease in net assets resulting from capital share transactions | | | (41,938,666 | ) | | | (13,988,716 | ) |
| | | | |
Total increase (decrease) in net assets | | | (42,570,515 | ) | | | 18,586,349 | |
| | | | |
| | |
Net assets | | | | | | | | |
Beginning of period | | | 335,534,804 | | | | 316,948,455 | |
| | | | |
End of period | | $ | 292,964,289 | | | $ | 335,534,804 | |
| | | | |
The accompanying notes are an integral part of these financial statements.
| | | | | | |
| Statements of changes in net assets | | Wells Fargo Equity Gateway Funds | | | 127 | |
| | | | | | | | |
| | | Diversified Large Cap Growth Portfolio | |
| | | Year ended
May 31, 2016 | | | Year ended
May 31, 2015 | |
| | |
Operations | | | | | | | | |
Net investment income | | $ | 336,085 | | | $ | 378,418 | |
Net realized gains on investments | | | 5,117,947 | | | | 13,356,513 | |
Net change in unrealized gains (losses) on investments | | | (7,846,480 | ) | | | 2,762,375 | |
| | | | |
Net increase (decrease) in net assets resulting from operations | | | (2,392,448 | ) | | | 16,497,306 | |
| | | | |
| | |
Capital share transactions | | | | | | | | |
Transactions in investors’ beneficial interests | | | | | | | | |
Contributions | | | 7,089,759 | | | | 1,385,145 | |
Withdrawals | | | (12,268,696 | ) | | | (38,000,934 | ) |
| | | | |
Net decrease in net assets resulting from capital share transactions | | | (5,178,937 | ) | | | (36,615,789 | ) |
| | | | |
Total decrease in net assets | | | (7,571,385 | ) | | | (20,118,483 | ) |
| | | | |
| | |
Net assets | | | | | | | | |
Beginning of period | | | 123,329,861 | | | | 143,448,344 | |
| | | | |
End of period | | $ | 115,758,476 | | | $ | 123,329,861 | |
| | | | |
The accompanying notes are an integral part of these financial statements.
| | | | |
| 128 | | Wells Fargo Equity Gateway Funds | | Statements of changes in net assets |
| | | | | | | | |
| | | Emerging Growth Portfolio | |
| | | Year ended
May 31, 2016 | | | Year ended
May 31, 2015 | |
| | |
Operations | | | | | | | | |
Net investment loss | | $ | (3,962,052 | ) | | $ | (7,075,125 | ) |
Net realized gains on investments | | | 18,746,231 | | | | 124,199,895 | |
Net change in unrealized gains (losses) on investments | | | (175,228,106 | ) | | | 125,177,937 | |
| | | | |
Net increase (decrease) in net assets resulting from operations | | | (160,443,927 | ) | | | 242,302,707 | |
| | | | |
| | |
Capital share transactions | | | | | | | | |
Transactions in investors’ beneficial interests | | | | | | | | |
Contributions | | | 105,565,223 | | | | 45,776,720 | |
Withdrawals | | | (194,401,064 | ) | | | (236,510,647 | ) |
| | | | |
Net decrease in net assets resulting from capital share transactions | | | (88,835,841 | ) | | | (190,733,927 | ) |
| | | | |
Total increase (decrease) in net assets | | | (249,279,768 | ) | | | 51,568,780 | |
| | | | |
| | |
Net assets | | | | | | | | |
Beginning of period | | | 1,147,767,433 | | | | 1,096,198,653 | |
| | | | |
End of period | | $ | 898,487,665 | | | $ | 1,147,767,433 | |
| | | | |
The accompanying notes are an integral part of these financial statements.
| | | | | | |
| Statements of changes in net assets | | Wells Fargo Equity Gateway Funds | | | 129 | |
| | | | | | | | |
| | | Index Portfolio | |
| | | Year ended
May 31, 2016 | | | Year ended
May 31, 2015 | |
| | |
Operations | | | | | | | | |
Net investment income | | $ | 51,941,420 | | | $ | 54,937,429 | |
Net realized gains on investments | | | 154,402,400 | | | | 151,694,995 | |
Net change in unrealized gains (losses) on investments | | | (179,622,273 | ) | | | 106,085,589 | |
| | | | |
Net increase in net assets resulting from operations | | | 26,721,547 | | | | 312,718,013 | |
| | | | |
| | |
Capital share transactions | | | | | | | | |
Transactions in investors’ beneficial interests | | | | | | | | |
Contributions | | | 66,728,942 | | | | 163,917,502 | |
Withdrawals | | | (523,281,965 | ) | | | (543,742,749 | ) |
| | | | |
Net decrease in net assets resulting from capital share transactions | | | (456,553,023 | ) | | | (379,825,247 | ) |
| | | | |
Total decrease in net assets | | | (429,831,476 | ) | | | (67,107,234 | ) |
| | | | |
| | |
Net assets | | | | | | | | |
Beginning of period | | | 2,770,243,934 | | | | 2,837,351,168 | |
| | | | |
End of period | | $ | 2,340,412,458 | | | $ | 2,770,243,934 | |
| | | | |
The accompanying notes are an integral part of these financial statements.
| | | | |
| 130 | | Wells Fargo Equity Gateway Funds | | Statements of changes in net assets |
| | | | | | | | |
| | | International Growth Portfolio | |
| | | Year ended
May 31, 2016 | | | Year ended
May 31, 2015 | |
| | |
Operations | | | | | | | | |
Net investment income | | $ | 1,728,257 | | | $ | 1,168,188 | |
Net realized gains (losses) on investments | | | (1,635,815 | ) | | | 5,764,586 | |
Net change in unrealized gains (losses) on investments | | | (20,243,476 | ) | | | 1,080,710 | |
| | | | |
Net increase (decrease) in net assets resulting from operations | | | (20,151,034 | ) | | | 8,013,484 | |
| | | | |
| | |
Capital share transactions | | | | | | | | |
Transactions in investors’ beneficial interests | | | | | | | | |
Contributions | | | 15,674,750 | | | | 9,541,797 | |
Withdrawals | | | (5,551,430 | ) | | | (15,259,152 | ) |
| | | | |
Net increase (decrease) in net assets resulting from capital share transactions | | | 10,123,320 | | | | (5,717,355 | ) |
| | | | |
Total increase (decrease) in net assets | | | (10,027,714 | ) | | | 2,296,129 | |
| | | | |
| | |
Net assets | | | | | | | | |
Beginning of period | | | 158,404,329 | | | | 156,108,200 | |
| | | | |
End of period | | $ | 148,376,615 | | | $ | 158,404,329 | |
| | | | |
The accompanying notes are an integral part of these financial statements.
| | | | | | |
| Statements of changes in net assets | | Wells Fargo Equity Gateway Funds | | | 131 | |
| | | | | | | | |
| | | International Value Portfolio | |
| | | Year ended
May 31, 2016 | | | Year ended
May 31, 2015 | |
| | |
Operations | | | | | | | | |
Net investment income | | $ | 12,349,092 | | | $ | 12,375,837 | |
Net realized gains (losses) on investments | | | (1,517,228 | ) | | | 12,459,307 | |
Net change in unrealized gains (losses) on investments | | | (73,474,825 | ) | | | (27,933,255 | ) |
| | | | |
Net decrease in net assets resulting from operations | | | (62,642,961 | ) | | | (3,098,111 | ) |
| | | | |
| | |
Capital share transactions | | | | | | | | |
Transactions in investors’ beneficial interests | | | | | | | | |
Contributions | | | 46,792,442 | | | | 42,159,536 | |
Withdrawals | | | (10,044,159 | ) | | | (17,083,113 | ) |
| | | | |
Net increase in net assets resulting from capital share transactions | | | 36,748,283 | | | | 25,076,423 | |
| | | | |
Total increase (decrease) in net assets | | | (25,894,678 | ) | | | 21,978,312 | |
| | | | |
| | |
Net assets | | | | | | | | |
Beginning of period | | | 534,213,648 | | | | 512,235,336 | |
| | | | |
End of period | | $ | 508,318,970 | | | $ | 534,213,648 | |
| | | | |
The accompanying notes are an integral part of these financial statements.
| | | | |
| 132 | | Wells Fargo Equity Gateway Funds | | Statements of changes in net assets |
| | | | | | | | |
| | | Large Company Value Portfolio | |
| | | Year ended
May 31, 2016 | | | Year ended
May 31, 2015 | |
| | |
Operations | | | | | | | | |
Net investment income | | $ | 1,196,671 | | | $ | 964,436 | |
Net realized gains (losses) on investments | | | (1,089,821 | ) | | | 9,724,164 | |
Net change in unrealized gains (losses) on investments | | | (3,378,107 | ) | | | (3,904,014 | ) |
| | | | |
Net increase (decrease) in net assets resulting from operations | | | (3,271,257 | ) | | | 6,784,586 | |
| | | | |
| | |
Capital share transactions | | | | | | | | |
Transactions in investors’ beneficial interests | | | | | | | | |
Contributions | | | 6,867,155 | | | | 1,636,829 | |
Withdrawals | | | (6,977,356 | ) | | | (21,975,522 | ) |
| | | | |
Net decrease in net assets resulting from capital share transactions | | | (110,201 | ) | | | (20,338,693 | ) |
| | | | |
Total decrease in net assets | | | (3,381,458 | ) | | | (13,554,107 | ) |
| | | | |
| | |
Net assets | | | | | | | | |
Beginning of period | | | 82,496,288 | | | | 96,050,395 | |
| | | | |
End of period | | $ | 79,114,830 | | | $ | 82,496,288 | |
| | | | |
The accompanying notes are an integral part of these financial statements.
| | | | | | |
| Statements of changes in net assets | | Wells Fargo Equity Gateway Funds | | | 133 | |
| | | | | | | | |
| | | Small Company Growth Portfolio | |
| | | Year ended
May 31, 2016 | | | Year ended
May 31, 2015 | |
| | |
Operations | | | | | | | | |
Net investment loss | | $ | (288,808 | ) | | $ | (1,603,331 | ) |
Net realized gains (losses) on investments | | | (95,998,247 | ) | | | 17,519,892 | |
Net change in unrealized gains (losses) on investments | | | (55,183,521 | ) | | | 73,745,204 | |
| | | | |
Net increase (decrease) in net assets resulting from operations | | | (151,470,576 | ) | | | 89,661,765 | |
| | | | |
| | |
Capital share transactions | | | | | | | | |
Transactions in investors’ beneficial interests | | | | | | | | |
Contributions | | | 708,902,550 | | | | 343,108,775 | |
Withdrawals | | | (112,220,954 | ) | | | (37,300,648 | ) |
| | | | |
Net increase in net assets resulting from capital share transactions | | | 596,681,596 | | | | 305,808,127 | |
| | | | |
Total increase in net assets | | | 445,211,020 | | | | 395,469,892 | |
| | | | |
| | |
Net assets | | | | | | | | |
Beginning of period | | | 751,385,420 | | | | 355,915,528 | |
| | | | |
End of period | | $ | 1,196,596,440 | | | $ | 751,385,420 | |
| | | | |
The accompanying notes are an integral part of these financial statements.
| | | | |
| 134 | | Wells Fargo Equity Gateway Funds | | Statements of changes in net assets |
| | | | | | | | |
| | | Small Company Value Portfolio | |
| | | Year ended
May 31, 2016 | | | Year ended
May 31, 2015 | |
| | |
Operations | | | | | | | | |
Net investment income | | $ | 1,286,924 | | | $ | 1,850,375 | |
Net realized gains on investments | | | 12,552,384 | | | | 16,879,349 | |
Net change in unrealized gains (losses) on investments | | | (24,625,962 | ) | | | (3,678,556 | ) |
| | | | |
Net increase (decrease) in net assets resulting from operations | | | (10,786,654 | ) | | | 15,051,168 | |
| | | | |
| | |
Capital share transactions | | | | | | | | |
Transactions in investors’ beneficial interests | | | | | | | | |
Contributions | | | 36,132,062 | | | | 22,862,632 | |
Withdrawals | | | (23,471,861 | ) | | | (28,565,086 | ) |
| | | | |
Net increase (decrease) in net assets resulting from capital share transactions | | | 12,660,201 | | | | (5,702,454 | ) |
| | | | |
Total increase in net assets | | | 1,873,547 | | | | 9,348,714 | |
| | | | |
| | |
Net assets | | | | | | | | |
Beginning of period | | | 215,696,223 | | | | 206,347,509 | |
| | | | |
End of period | | $ | 217,569,770 | | | $ | 215,696,223 | |
| | | | |
The accompanying notes are an integral part of these financial statements.
| | | | | | |
| Financial highlights | | Wells Fargo Equity Gateway Funds | | | 135 | |
| | | | | | | | | | | | | | | | | | | | |
| | | Ratio to average net assets (annualized) | | | Total
return | | | Portfolio turnover
rate | |
| | | Net investment
income (loss) | | | Gross
expenses | | | Net
expenses | | | |
| | | | | |
C&B Large Cap Value Portfolio | | | | | | | | | | | | | | | | | | | | |
Year ended May 31, 2016 | | | 1.33 | % | | | 0.68 | % | | | 0.68 | % | | | 0.35 | % | | | 29 | % |
Year ended May 31, 2015 | | | 1.20 | % | | | 0.68 | % | | | 0.68 | % | | | 10.29 | % | | | 35 | % |
Year ended May 31, 2014 | | | 1.35 | % | | | 0.68 | % | | | 0.68 | % | | | 17.80 | % | | | 22 | % |
Year ended May 31, 2013 | | | 1.73 | % | | | 0.68 | % | | | 0.68 | % | | | 29.30 | % | | | 18 | % |
Year ended May 31, 2012 | | | 1.81 | % | | | 0.68 | % | | | 0.68 | % | | | (4.61 | )% | | | 21 | % |
| | | | | |
Diversified Large Cap Growth Portfolio | | | | | | | | | | | | | | | | | | | | |
Year ended May 31, 2016 | | | 0.29 | % | | | 0.74 | % | | | 0.62 | % | | | (2.28 | )% | | | 59 | % |
Year ended May 31, 2015 | | | 0.28 | % | | | 0.72 | % | | | 0.62 | % | | | 13.11 | % | | | 46 | % |
Year ended May 31, 2014 | | | 0.15 | % | | | 0.72 | % | | | 0.62 | % | | | 21.70 | % | | | 54 | % |
Year ended May 31, 2013 | | | 0.51 | % | | | 0.71 | % | | | 0.62 | % | | | 20.30 | % | | | 56 | % |
Year ended May 31, 2012 | | | 0.24 | % | | | 0.71 | % | | | 0.62 | % | | | 1.26 | % | | | 79 | % |
| | | | | |
Emerging Growth Portfolio | | | | | | | | | | | | | | | | | | | | |
Year ended May 31, 2016 | | | (0.40 | )% | | | 0.80 | % | | | 0.80 | % | | | (14.47 | )% | | | 66 | % |
Year ended May 31, 2015 | | | (0.63 | )% | | | 0.80 | % | | | 0.80 | % | | | 24.02 | % | | | 56 | % |
Year ended May 31, 2014 | | | (0.62 | )% | | | 0.80 | % | | | 0.80 | % | | | 11.92 | % | | | 63 | % |
Year ended May 31, 2013 | | | (0.47 | )% | | | 0.80 | % | | | 0.80 | % | | | 20.53 | % | | | 65 | % |
Year ended May 31, 2012 | | | (0.57 | )% | | | 0.80 | % | | | 0.80 | % | | | (4.83 | )% | | | 75 | % |
| | | | | |
Index Portfolio | | | | | | | | | | | | | | | | | | | | |
Year ended May 31, 2016 | | | 2.12 | % | | | 0.11 | % | | | 0.10 | % | | | 1.62 | % | | | 4 | % |
Year ended May 31, 2015 | | | 1.96 | % | | | 0.11 | % | | | 0.11 | % | | | 11.69 | % | | | 4 | % |
Year ended May 31, 2014 | | | 1.99 | % | | | 0.10 | % | | | 0.10 | % | | | 20.33 | % | | | 5 | % |
Year ended May 31, 2013 | | | 2.20 | % | | | 0.09 | % | | | 0.09 | % | | | 27.22 | % | | | 4 | % |
Year ended May 31, 2012 | | | 2.09 | % | | | 0.10 | % | | | 0.10 | % | | | (0.52 | )% | | | 9 | % |
| | | | | |
International Growth Portfolio | | | | | | | | | | | | | | | | | | | | |
Year ended May 31, 2016 | | | 1.16 | % | | | 0.99 | % | | | 0.99 | % | | | (12.40 | )% | | | 62 | % |
Year ended May 31, 2015 | | | 0.76 | % | | | 1.00 | % | | | 1.00 | % | | | 5.13 | % | | | 51 | % |
Year ended May 31, 2014 | | | 1.13 | % | | | 1.00 | % | | | 1.00 | % | | | 16.45 | % | | | 46 | % |
Year ended May 31, 2013 | | | 1.63 | % | | | 1.04 | % | | | 1.04 | % | | | 30.34 | % | | | 46 | % |
Year ended May 31, 2012 | | | 2.04 | % | | | 0.97 | % | | | 0.90 | % | | | (9.44 | )% | | | 69 | % |
| | | | | |
International Value Portfolio | | | | | | | | | | | | | | | | | | | | |
Year ended May 31, 2016 | | | 2.50 | % | | | 0.91 | % | | | 0.91 | % | | | (11.85 | )% | | | 14 | % |
Year ended May 31, 2015 | | | 2.45 | % | | | 0.91 | % | | | 0.91 | % | | | (1.04 | )% | | | 18 | % |
Year ended May 31, 2014 | | | 3.09 | % | | | 0.91 | % | | | 0.91 | % | | | 18.22 | % | | | 11 | % |
Year ended May 31, 2013 | | | 3.04 | % | | | 0.91 | % | | | 0.91 | % | | | 29.45 | % | | | 16 | % |
Year ended May 31, 2012 | | | 3.44 | % | | | 0.91 | % | | | 0.85 | % | | | (21.07 | )% | | | 9 | % |
| | | | | |
Large Company Value Portfolio | | | | | | | | | | | | | | | | | | | | |
Year ended May 31, 2016 | | | 1.54 | % | | | 0.76 | % | | | 0.74 | % | | | (3.92 | )% | | | 50 | % |
Year ended May 31, 2015 | | | 1.09 | % | | | 0.74 | % | | | 0.74 | % | | | 7.90 | % | | | 72 | % |
Year ended May 31, 2014 | | | 0.99 | % | | | 0.73 | % | | | 0.73 | % | | | 20.26 | % | | | 62 | % |
Year ended May 31, 2013 | | | 1.49 | % | | | 0.78 | % | | | 0.74 | % | | | 28.91 | % | | | 95 | % |
Year ended May 31, 2012 | | | 1.67 | % | | | 0.77 | % | | | 0.74 | % | | | (6.06 | )% | | | 104 | % |
| | | | | |
Small Company Growth Portfolio | | | | | | | | | | | | | | | | | | | | |
Year ended May 31, 2016 | | | (0.03 | )% | | | 0.80 | % | | | 0.80 | % | | | (13.86 | )% | | | 49 | % |
Year ended May 31, 2015 | | | (0.32 | )% | | | 0.82 | % | | | 0.82 | % | | | 18.07 | % | | | 58 | % |
Year ended May 31, 2014 | | | (0.37 | )% | | | 0.83 | % | | | 0.83 | % | | | 23.47 | % | | | 77 | % |
Year ended May 31, 2013 | | | (0.02 | )% | | | 0.86 | % | | | 0.86 | % | | | 31.39 | % | | | 109 | % |
Year ended May 31, 2012 | | | (0.12 | )% | | | 0.83 | % | | | 0.83 | % | | | (10.75 | )% | | | 107 | % |
The accompanying notes are an integral part of these financial statements.
| | | | |
| 136 | | Wells Fargo Equity Gateway Funds | | Financial highlights |
| | | | | | | | | | | | | | | | | | | | |
| | | Ratio to average net assets (annualized) | | | Total
return | | | Portfolio turnover
rate | |
| | | Net investment
income | | | Gross
expenses | | | Net
expenses | | | |
| | | | | |
Small Company Value Portfolio | | | | | | | | | | | | | | | | | | | | |
Year ended May 31, 2016 | | | 0.62 | % | | | 0.85 | % | | | 0.85 | % | | | (4.96 | )% | | | 72 | % |
Year ended May 31, 2015 | | | 0.89 | % | | | 0.84 | % | | | 0.84 | % | | | 7.29 | % | | | 54 | % |
Year ended May 31, 2014 | | | 0.89 | % | | | 0.85 | % | | | 0.85 | % | | | 18.09 | % | | | 47 | % |
Year ended May 31, 2013 | | | 0.58 | % | | | 0.85 | % | | | 0.85 | % | | | 30.76 | % | | | 57 | % |
Year ended May 31, 2012 | | | 0.69 | % | | | 0.84 | % | | | 0.84 | % | | | (7.17 | )% | | | 60 | % |
The accompanying notes are an integral part of these financial statements.
| | | | | | |
| Notes to financial statements | | Wells Fargo Equity Gateway Funds | | | 137 | |
1. ORGANIZATION
Wells Fargo Master Trust (the “Trust”), a Delaware statutory trust organized on March 10, 1999, is an open-end management investment company registered under the Investment Company Act of 1940, as amended (the “1940 Act”). As an investment company, the Trust follows the accounting and reporting guidance in Financial Accounting Standards Board (“FASB”) Accounting Standards Codification Topic 946, Financial Services – Investment Companies. These financial statements report on the following portfolios: Wells Fargo C&B Large Cap Value Portfolio (“C&B Large Cap Value Portfolio”), Wells Fargo Diversified Large Cap Growth Portfolio (“Diversified Large Cap Growth Portfolio”), Wells Fargo Emerging Growth Portfolio (“Emerging Growth Portfolio”), Wells Fargo Index Portfolio (“Index Portfolio”), Wells Fargo International Growth Portfolio (“International Growth Portfolio”), Wells Fargo International Value Portfolio (“International Value Portfolio”), Wells Fargo Large Company Value Portfolio (“Large Company Value Portfolio”), Wells Fargo Small Company Growth Portfolio (“Small Company Growth Portfolio”), and Wells Fargo Small Company Value Portfolio (“Small Company Value Portfolio”), (each a “Portfolio”, collectively, the “Portfolios”). Each Portfolio is a diversified series of the Trust.
The Portfolios, which are master portfolios in a master/feeder structure, offer their shares to multiple feeder funds and other affiliated master portfolios rather than directly to the public.
2. SIGNIFICANT ACCOUNTING POLICIES
The following significant accounting policies, which are consistently followed in the preparation of the financial statements of each Portfolio, are in conformity with U.S. generally accepted accounting principles which require management to make estimates and assumptions that affect the reported amounts of assets and liabilities, disclosure of contingent assets and liabilities at the date of the financial statements, and the reported amounts of revenues and expenses during the reporting period. Actual results could differ from those estimates.
Securities valuation
All investments are valued each business day as of the close of regular trading on the New York Stock Exchange (generally 4 p.m. Eastern Time), although the Portfolios may deviate from this calculation time under unusual or unexpected circumstances.
Equity securities and futures that are listed on a foreign or domestic exchange or market are valued at the official closing price or, if none, the last sales price. If no sale occurs on the principal exchange or market that day, the prior day’s price will be deemed “stale” and a fair value price will be determined in accordance with the Portfolio’s Valuation Procedures.
The values of securities denominated in foreign currencies are translated into U.S. dollars at rates provided by an independent foreign currency pricing source at a time each business day specified by the Management Valuation Team of Wells Fargo Funds Management, LLC (“Funds Management”).
Many securities markets and exchanges outside the U.S. close prior to the close of the New York Stock Exchange and therefore may not fully reflect trading or events that occur after the close of the principal exchange in which the foreign securities are traded, but before the close of the New York Stock Exchange. If such trading or events are expected to materially affect the value of such securities, then fair value pricing procedures approved by the Board of Trustees of the Portfolios are applied. These procedures take into account multiple factors including movements in U.S. securities markets after foreign exchanges close. Foreign securities that are fair valued under these procedures are categorized as Level 2 and the application of these procedures may result in transfers between Level 1 and Level 2. Depending on market activity, such fair valuations may be frequent. Such fair value pricing may result in net asset values that are higher or lower than net asset values based on the last reported sales price or latest quoted bid price. On May 31, 2016, such fair value pricing was not used in pricing foreign securities.
Debt securities are valued at the evaluated bid price provided by an independent pricing service or, if a reliable price is not available, the quoted bid price from an independent broker-dealer.
Investments in registered open-end investment companies are valued at net asset value. Interests in non-registered investment vehicles that are redeemable at net asset value are fair valued normally at net asset value.
Investments which are not valued using any of the methods discussed above are valued at their fair value, as determined in good faith by the Board of Trustees. The Board of Trustees has established a Valuation Committee comprised of the Trustees and has delegated to it the authority to take any actions regarding the valuation of portfolio securities that the Valuation Committee deems necessary or appropriate, including determining the fair value of portfolio securities, unless the determination has been delegated to the Management Valuation Team. The Board of Trustees retains the authority to make or ratify any valuation decisions or approve any changes to the Valuation Procedures as it deems appropriate. On a quarterly basis, the Board of Trustees receives reports on any valuation actions taken by the Valuation Committee or the Management Valuation Team which may include items for ratification.
| | | | |
| 138 | | Wells Fargo Equity Gateway Funds | | Notes to financial statements |
Valuations of fair valued securities are compared to the next actual sales price when available, or other appropriate market values, to assess the continued appropriateness of the fair valuation methodologies used. These securities are fair valued on a day-to-day basis, taking into consideration changes to appropriate market information and any significant changes to the inputs considered in the valuation process until there is a readily available price provided on an exchange or by an independent pricing service. Valuations received from an independent pricing service or independent broker-dealer quotes are periodically validated by comparisons to most recent trades and valuations provided by other independent pricing services in addition to the review of prices by the adviser and/or subadviser. Unobservable inputs used in determining fair valuations are identified based on the type of security, taking into consideration factors utilized by market participants in valuing the investment, knowledge about the issuer and the current market environment.
Foreign currency translation
The accounting records of the Portfolios are maintained in U.S. dollars. The value of other assets and liabilities denominated in foreign currencies are translated into U.S. dollars at rates provided by an independent foreign currency pricing source at a time each business day specified by the Management Valuation Team. Purchases and sales of securities, and income and expenses are converted at the rate of exchange on the respective dates of such transactions. Net realized foreign exchange gains or losses arise from sales of foreign currencies, currency gains or losses realized between the trade and settlement dates on securities transactions, and the difference between the amounts of dividends, interest and foreign withholding taxes recorded and the U.S. dollar equivalent of the amounts actually paid or received. Net unrealized foreign exchange gains and losses arise from changes in the fair value of assets and liabilities other than investments in securities resulting from changes in exchange rates. The changes in net assets arising from changes in exchange rates and the changes in net assets resulting from changes in market prices of securities are not separately presented. Such changes are included in net realized and unrealized gains or losses from investments.
Security loans
The Portfolios may lend their securities from time to time in order to earn additional income in the form of fees or interest on securities received as collateral or the investment of any cash received as collateral. The Portfolios continue to receive interest or dividends on the securities loaned. The Portfolios receive collateral in the form of cash or securities with a value at least equal to the value of the securities on loan. The value of the loaned securities is determined at the close of each business day and any additional required collateral is delivered to the Portfolios on the next business day. In a securities lending transaction, the net asset value of the Portfolios will be affected by an increase or decrease in the value of the securities loaned and by an increase or decrease in the value of the instrument in which collateral is invested. The amount of securities lending activity undertaken by the Portfolios fluctuate from time to time. In the event of default or bankruptcy by the borrower, the Portfolios may be prevented from recovering the loaned securities or gaining access to the collateral or may experience delays or costs in doing so. In addition, the investment of any cash collateral received may lose all or part of its value. The Portfolios have the right under the lending agreement to recover the securities from the borrower on demand.
The Portfolios lend their securities through an unaffiliated securities lending agent. Cash collateral received in connection with its securities lending transactions is invested in Securities Lending Cash Investments, LLC (the “Securities Lending Fund”). The Securities Lending Fund is exempt from registration under Section 3(c)(7) of the 1940 Act and is managed by Funds Management and is subadvised by Wells Capital Management Incorporated (“WellsCap”), an affiliate of Funds Management and an indirect wholly owned subsidiary of Wells Fargo & Company (“Wells Fargo”). Funds Management receives an advisory fee starting at 0.05% and declining to 0.01% as the average daily net assets of the Securities Lending Fund increase. All of the fees received by Funds Management are paid to WellsCap for its services as subadviser. The Securities Lending Fund seeks to provide a positive return compared to the daily Fed Funds Open rate by investing in high-quality, U.S. dollar-denominated short-term money market instruments. Securities Lending Fund investments are fair valued based upon the amortized cost valuation technique. Income earned from investment in the Securities Lending Fund is included in securities lending income on the Statements of Operations.
Futures contracts
The Portfolios are subject to interest rate risk or equity price risk in the normal course of pursuing its investment objectives. A Portfolio may buy and sell futures contracts in order to gain exposure to, or protect against, changes in security values and interest rates. The primary risks associated with the use of futures contracts are the imperfect correlation between changes in market values of securities held by the Portfolio and the prices of futures contracts, and the possibility of an illiquid market.
The aggregate principal amounts of the contracts are not recorded in the financial statements. Fluctuations in the value of the contracts are recorded in the Statements of Assets and Liabilities as an asset or liability and in the Statements of
| | | | | | |
| Notes to financial statements | | Wells Fargo Equity Gateway Funds | | | 139 | |
Operations as unrealized gains or losses until the contracts are closed, at which point they are recorded as net realized gains or losses on futures contracts. With futures contracts, there is minimal counterparty risk to the Portfolio since futures are exchange traded and the exchange’s clearinghouse, as counterparty to all exchange traded futures, guarantees the futures against default.
Security transactions and income recognition
Securities transactions are recorded on a trade date basis. Realized gains or losses are recorded on the basis of identified cost.
Dividend income is recognized on the ex-dividend date, except for certain dividends from foreign securities which are recorded as soon as the custodian verifies the ex-dividend date.
Interest income is accrued daily and bond discounts are accreted and premiums are amortized daily based on the effective interest method. To the extent debt obligations are placed on non-accrual status, any related interest income may be reduced by writing off interest receivables when the collection of all or a portion of interest has become doubtful based on consistently applied procedures. If the issuer subsequently resumes interest payments or when the collectability of interest is reasonably assured, the debt obligation is removed from non-accrual status.
Income from foreign securities is recorded net of foreign taxes withheld where recovery of such taxes is not assured.
Federal and other taxes
Each Portfolio is treated as a separate entity for federal income tax purposes. The Portfolios are not required to pay federal income taxes on their net investment income and net capital gain as they are treated as partnerships for federal income tax purposes. All interest, dividends, gains and losses of a Portfolio are deemed to have been “passed through” to the interest holders in proportion to their holdings of the Portfolio regardless of whether such interest, dividends and gains have been distributed by the Portfolio.
Each Portfolio’s income tax returns and all financial records supporting those returns for the prior three fiscal years are subject to examination by the federal revenue authority. Management has analyzed each Portfolio’s tax positions taken on federal, state, and foreign tax returns for all open tax years and does not believe that there are any uncertain tax positions that require recognition of a tax liability.
3. FAIR VALUATION MEASUREMENTS
Fair value measurements of investments are determined within a framework that has established a fair value hierarchy based upon the various data inputs utilized in determining the value of each Portfolio’s investments. The three-level hierarchy gives the highest priority to unadjusted quoted prices in active markets for identical assets or liabilities (Level 1) and the lowest priority to significant unobservable inputs (Level 3). Each Portfolio’s investments are classified within the fair value hierarchy based on the lowest level of input that is significant to the fair value measurement. The inputs are summarized into three broad levels as follows:
| n | | Level 1 – quoted prices in active markets for identical securities |
| n | | Level 2 – other significant observable inputs (including quoted prices for similar securities, interest rates, prepayment speeds, credit risk, use of amortized cost, etc.) |
| n | | Level 3 – significant unobservable inputs (including the Portfolio’s own assumptions in determining the fair value of investments) |
The inputs or methodologies used for valuing investments in securities are not necessarily an indication of the risk associated with investing in those securities.
| | | | |
| 140 | | Wells Fargo Equity Gateway Funds | | Notes to financial statements |
The following is a summary of the inputs used in valuing each Portfolio’s assets and liabilities as of May 31, 2016:
| | | | | | | | | | | | | | | | |
| C&B Large Cap Value Portfolio | | Quoted prices
(Level 1) | | | Other significant
observable inputs
(Level 2) | | | Significant
unobservable inputs
(Level 3) | | | Total | |
Assets | | | | | | | | | | | | | | | | |
Investments in: | | | | | | | | | | | | | | | | |
| | | | |
Common stocks | | | | | | | | | | | | | | | | |
Consumer discretionary | | $ | 39,284,297 | | | $ | 0 | | | $ | 0 | | | $ | 39,284,297 | |
Consumer staples | | | 19,100,896 | | | | 0 | | | | 0 | | | | 19,100,896 | |
Energy | | | 17,758,921 | | | | 0 | | | | 0 | | | | 17,758,921 | |
Financials | | | 76,240,999 | | | | 0 | | | | 0 | | | | 76,240,999 | |
Health care | | | 44,180,838 | | | | 0 | | | | 0 | | | | 44,180,838 | |
Industrials | | | 53,765,968 | | | | 0 | | | | 0 | | | | 53,765,968 | |
Information technology | | | 14,076,445 | | | | 0 | | | | 0 | | | | 14,076,445 | |
Materials | | | 14,028,552 | | | | 0 | | | | 0 | | | | 14,028,552 | |
| | | | |
Short-term investments | | | | | | | | | | | | | | | | |
Investment companies | | | 13,862,559 | | | | 0 | | | | 0 | | | | 13,862,559 | |
Investments measured at net asset value* | | | | | | | | | | | | | | | 12,454,900 | |
Total assets | | $ | 292,299,475 | | | $ | 0 | | | $ | 0 | | | $ | 304,754,375 | |
| * | Investments that are measured at fair value using the net asset value per share (or its equivalent) as a practical expedient have not been categorized in the fair value hierarchy. The fair value amount presented in the table is intended to permit reconciliation of the fair value hierarchy to the amounts presented in the Statements of Assets and Liabilities. The Portfolio’s investment in Securities Lending Cash Investment, LLC valued at $12,454,900 does not have a redemption period notice, can be redeemed daily and does not have any unfunded commitments. |
| | | | | | | | | | | | | | | | |
| Diversified Large Cap Growth Portfolio | | Quoted prices
(Level 1) | | | Other significant
observable inputs
(Level 2) | | | Significant
unobservable inputs
(Level 3) | | | Total | |
Assets | | | | | | | | | | | | | | | | |
Investments in: | | | | | | | | | | | | | | | | |
| | | | |
Common stocks | | | | | | | | | | | | | | | | |
Consumer discretionary | | $ | 29,503,276 | | | $ | 0 | | | $ | 0 | | | $ | 29,503,276 | |
Consumer staples | | | 9,135,507 | | | | 0 | | | | 0 | | | | 9,135,507 | |
Energy | | | 1,379,452 | | | | 0 | | | | 0 | | | | 1,379,452 | |
Financials | | | 2,559,149 | | | | 0 | | | | 0 | | | | 2,559,149 | |
Health care | | | 16,475,660 | | | | 0 | | | | 0 | | | | 16,475,660 | |
Industrials | | | 7,788,848 | | | | 0 | | | | 0 | | | | 7,788,848 | |
Information technology | | | 43,031,066 | | | | 0 | | | | 0 | | | | 43,031,066 | |
Materials | | | 3,378,649 | | | | 0 | | | | 0 | | | | 3,378,649 | |
| | | | |
Short-term investments | | | | | | | | | | | | | | | | |
Investment companies | | | 2,118,196 | | | | 0 | | | | 0 | | | | 2,118,196 | |
Investments measured at net asset value* | | | | | | | | | | | | | | | 3,113,406 | |
Total assets | | $ | 115,369,803 | | | $ | 0 | | | $ | 0 | | | $ | 118,483,209 | |
| * | Investments that are measured at fair value using the net asset value per share (or its equivalent) as a practical expedient have not been categorized in the fair value hierarchy. The fair value amount presented in the table is intended to permit reconciliation of the fair value hierarchy to the amounts presented in the Statements of Assets and Liabilities. The Portfolios investment in Securities Lending Cash Investment, LLC valued at $3,113,406 does not have a redemption period notice, can be redeemed daily and does not have any unfunded commitments. |
| | | | | | |
| Notes to financial statements | | Wells Fargo Equity Gateway Funds | | | 141 | |
| | | | | | | | | | | | | | | | |
| Emerging Growth Portfolio | | Quoted prices
(Level 1) | | | Other significant
observable inputs
(Level 2) | | | Significant
unobservable inputs
(Level 3) | | | Total | |
Assets | | | | | | | | | | | | | | | | |
Investments in: | | | | | | | | | | | | | | | | |
| | | | |
Common stocks | | | | | | | | | | | | | | | | |
Consumer discretionary | | $ | 114,950,584 | | | $ | 0 | | | $ | 0 | | | $ | 114,950,584 | |
Energy | | | 25,543,672 | | | | 0 | | | | 0 | | | | 25,543,672 | |
Financials | | | 48,113,098 | | | | 0 | | | | 0 | | | | 48,113,098 | |
Health care | | | 289,674,989 | | | | 0 | | | | 0 | | | | 289,674,989 | |
Industrials | | | 103,520,118 | | | | 0 | | | | 0 | | | | 103,520,118 | |
Information technology | | | 300,000,671 | | | | 0 | | | | 0 | | | | 300,000,671 | |
| | | | |
Short-term investments | | | | | | | | | | | | | | | | |
Investment companies | | | 14,978,235 | | | | 0 | | | | 0 | | | | 14,978,235 | |
Investments measured at net asset value* | | | | | | | | | | | | | | | 92,823,723 | |
Total assets | | $ | 896,781,367 | | | $ | 0 | | | $ | 0 | | | $ | 989,605,090 | |
| * | Investments that are measured at fair value using the net asset value per share (or its equivalent) as a practical expedient have not been categorized in the fair value hierarchy. The fair value amount presented in the table is intended to permit reconciliation of the fair value hierarchy to the amounts presented in the Statements of Assets and Liabilities. The Portfolio’s investment in Securities Lending Cash Investment, LLC valued at $92,823,723 does not have a redemption period notice, can be redeemed daily and does not have any unfunded commitments. |
| | | | | | | | | | | | | | | | |
| Index Portfolio | | Quoted prices
(Level 1) | | | Other significant
observable inputs
(Level 2) | | | Significant
unobservable inputs
(Level 3) | | | Total | |
Assets | | | | | | | | | | | | | | | | |
Investments in: | | | | | | | | | | | | | | | | |
| | | | |
Common stocks | | | | | | | | | | | | | | | | |
Consumer discretionary | | $ | 289,694,308 | | | $ | 0 | | | $ | 0 | | | $ | 289,694,308 | |
Consumer staples | | | 232,754,716 | | | | 0 | | | | 0 | | | | 232,754,716 | |
Energy | | | 164,580,503 | | | | 0 | | | | 0 | | | | 164,580,503 | |
Financials | | | 376,210,320 | | | | 0 | | | | 0 | | | | 376,210,320 | |
Health care | | | 339,368,191 | | | | 0 | | | | 0 | | | | 339,368,191 | |
Industrials | | | 231,365,470 | | | | 0 | | | | 0 | | | | 231,365,470 | |
Information technology | | | 470,278,237 | | | | 0 | | | | 0 | | | | 470,278,237 | |
Materials | | | 65,656,243 | | | | 0 | | | | 0 | | | | 65,656,243 | |
Telecommunication services | | | 61,249,364 | | | | 0 | | | | 0 | | | | 61,249,364 | |
Utilities | | | 77,036,436 | | | | 0 | | | | 0 | | | | 77,036,436 | |
| | | | |
Short-term investments | | | | | | | | | | | | | | | | |
Investment companies | | | 24,960,298 | | | | 0 | | | | 0 | | | | 24,960,298 | |
U.S. Treasury securities | | | 1,806,435 | | | | 0 | | | | 0 | | | | 1,806,435 | |
Investments measured at net asset value* | | | | | | | | | | | | | | | 12,693,253 | |
Total assets | | $ | 2,334,960,521 | | | $ | 0 | | | $ | 0 | | | $ | 2,347,653,774 | |
Liabilities | | | | | | | | | | | | | | | | |
| | | | |
Futures contracts | | $ | 36,000 | | | $ | 0 | | | $ | 0 | | | $ | 36,000 | |
Total liabilities | | $ | 36,000 | | | $ | 0 | | | $ | 0 | | | $ | 36,000 | |
| * | Investments that are measured at fair value using the net asset value per share (or its equivalent) as a practical expedient have not been categorized in the fair value hierarchy. The fair value amount presented in the table is intended to permit reconciliation of the fair value hierarchy to the amounts presented in the Statements of Assets and Liabilities. The Portfolio’s investment in Securities Lending Cash Investment, LLC valued at $12,693,253 does not have a redemption period notice, can be redeemed daily and does not have any unfunded commitments. |
| | | | |
| 142 | | Wells Fargo Equity Gateway Funds | | Notes to financial statements |
| | | | | | | | | | | | | | | | |
| International Growth Portfolio | | Quoted prices (Level 1) | | | Other significant observable inputs (Level 2) | | | Significant unobservable inputs (Level 3) | | | Total | |
Assets | | | | | | | | | | | | | | | | |
Investments in: | | | | | | | | | | | | | | | | |
| | | | |
Common stocks | | | | | | | | | | | | | | | | |
Belgium | | $ | 2,938,206 | | | $ | 0 | | | $ | 0 | | | $ | 2,938,206 | |
Canada | | | 2,250,330 | | | | 0 | | | | 0 | | | | 2,250,330 | |
China | | | 2,541,486 | | | | 0 | | | | 0 | | | | 2,541,486 | |
Denmark | | | 381,268 | | | | 0 | | | | 0 | | | | 381,268 | |
France | | | 12,797,598 | | | | 0 | | | | 0 | | | | 12,797,598 | |
Germany | | | 20,329,351 | | | | 0 | | | | 0 | | | | 20,329,351 | |
Hong Kong | | | 4,686,104 | | | | 0 | | | | 0 | | | | 4,686,104 | |
Ireland | | | 7,904,971 | | | | 0 | | | | 0 | | | | 7,904,971 | |
Japan | | | 18,993,997 | | | | 0 | | | | 0 | | | | 18,993,997 | |
Mexico | | | 1,246,753 | | | | 0 | | | | 0 | | | | 1,246,753 | |
South Korea | | | 14,650 | | | | 0 | | | | 0 | | | | 14,650 | |
Spain | | | 2,487,845 | | | | 0 | | | | 0 | | | | 2,487,845 | |
Sweden | | | 1,433,455 | | | | 0 | | | | 0 | | | | 1,433,455 | |
Switzerland | | | 12,652,706 | | | | 0 | | | | 0 | | | | 12,652,706 | |
Taiwan | | | 1,785,144 | | | | 0 | | | | 0 | | | | 1,785,144 | |
United Kingdom | | | 33,515,136 | | | | 0 | | | | 0 | | | | 33,515,136 | |
United States | | | 8,935,376 | | | | 0 | | | | 0 | | | | 8,935,376 | |
| | | | |
Participation Notes | | | | | | | | | | | | | | | | |
Ireland | | | 0 | | | | 2,418,886 | | | | 0 | | | | 2,418,886 | |
| | | | |
Preferred stocks | | | | | | | | | | | | | | | | |
Germany | | | 1,767,949 | | | | 0 | | | | 0 | | | | 1,767,949 | |
| | | | |
Short-term investments | | | | | | | | | | | | | | | | |
Investment companies | | | 9,867,059 | | | | 0 | | | | 0 | | | | 9,867,059 | |
Investments measured at net asset value* | | | | | | | | | | | | | | | 2,506,158 | |
Total assets | | $ | 146,529,384 | | | $ | 2,418,886 | | | $ | 0 | | | $ | 151,454,428 | |
| * | Investments that are measured at fair value using the net asset value per share (or its equivalent) as a practical expedient have not been categorized in the fair value hierarchy. The fair value amount presented in the table is intended to permit reconciliation of the fair value hierarchy to the amounts presented in the Statements of Assets and Liabilities. The Portfolio’s investment in Securities Lending Cash Investment, LLC valued at $2,506,158 does not have a redemption period notice, can be redeemed daily and does not have any unfunded commitments. |
| | | | | | |
| Notes to financial statements | | Wells Fargo Equity Gateway Funds | | | 143 | |
| | | | | | | | | | | | | | | | |
| International Value Portfolio | | Quoted prices (Level 1) | | | Other significant observable inputs (Level 2) | | | Significant unobservable inputs (Level 3) | | | Total | |
Assets | | | | | | | | | | | | | | | | |
Investments in: | | | | | | | | | | | | | | | | |
| | | | |
Common stocks | | | | | | | | | | | | | | | | |
Australia | | $ | 28,434,311 | | | $ | 0 | | | $ | 48,710 | | | $ | 28,483,021 | |
Austria | | | 5,746,241 | | | | 0 | | | | 0 | | | | 5,746,241 | |
Belgium | | | 4,130,894 | | | | 0 | | | | 0 | | | | 4,130,894 | |
Brazil | | | 4,150,492 | | | | 0 | | | | 0 | | | | 4,150,492 | |
Canada | | | 7,819,869 | | | | 0 | | | | 0 | | | | 7,819,869 | |
China | | | 14,102,164 | | | | 0 | | | | 0 | | | | 14,102,164 | |
Czech Republic | | | 1,044,370 | | | | 0 | | | | 0 | | | | 1,044,370 | |
Denmark | | | 1,226,054 | | | | 0 | | | | 0 | | | | 1,226,054 | |
Finland | | | 1,974,732 | | | | 0 | | | | 0 | | | | 1,974,732 | |
France | | | 45,224,124 | | | | 0 | | | | 0 | | | | 45,224,124 | |
Germany | | | 47,995,403 | | | | 0 | | | | 0 | | | | 47,995,403 | |
Hong Kong | | | 9,988,633 | | | | 0 | | | | 0 | | | | 9,988,633 | |
Hungary | | | 1,196,850 | | | | 0 | | | | 0 | | | | 1,196,850 | |
India | | | 2,865,322 | | | | 0 | | | | 0 | | | | 2,865,322 | |
Ireland | | | 4,655,800 | | | | 0 | | | | 0 | | | | 4,655,800 | |
Israel | | | 5,473,993 | | | | 0 | | | | 0 | | | | 5,473,993 | |
Italy | | | 5,639,354 | | | | 0 | | | | 0 | | | | 5,639,354 | |
Japan | | | 109,897,120 | | | | 0 | | | | 0 | | | | 109,897,120 | |
Liechtenstein | | | 599,721 | | | | 0 | | | | 0 | | | | 599,721 | |
Netherlands | | | 6,898,832 | | | | 0 | | | | 0 | | | | 6,898,832 | |
Norway | | | 6,230,948 | | | | 0 | | | | 0 | | | | 6,230,948 | |
Poland | | | 1,982,872 | | | | 0 | | | | 0 | | | | 1,982,872 | |
Portugal | | | 1,401,875 | | | | 0 | | | | 0 | | | | 1,401,875 | |
Russia | | | 4,194,456 | | | | 0 | | | | 0 | | | | 4,194,456 | |
Singapore | | | 4,050,076 | | | | 0 | | | | 0 | | | | 4,050,076 | |
South Africa | | | 1,860,099 | | | | 0 | | | | 0 | | | | 1,860,099 | |
South Korea | | | 12,328,179 | | | | 0 | | | | 0 | | | | 12,328,179 | |
Spain | | | 8,854,110 | | | | 0 | | | | 0 | | | | 8,854,110 | |
Sweden | | | 10,406,680 | | | | 0 | | | | 0 | | | | 10,406,680 | |
Switzerland | | | 31,110,463 | | | | 0 | | | | 0 | | | | 31,110,463 | |
Taiwan | | | 2,154,895 | | | | 0 | | | | 0 | | | | 2,154,895 | |
Thailand | | | 5,047,806 | | | | 0 | | | | 0 | | | | 5,047,806 | |
United Kingdom | | | 93,883,267 | | | | 0 | | | | 0 | | | | 93,883,267 | |
| | | | |
Preferred stocks | | | | | | | | | | | | | | | | |
Brazil | | | 978,198 | | | | 0 | | | | 0 | | | | 978,198 | |
| | | | |
Rights | | | | | | | | | | | | | | | | |
Brazil | | | 0 | | | | 6,779 | | | | 0 | | | | 6,779 | |
| | | | |
Short-term investments | | | | | | | | | | | | | | | | |
Investment companies | | | 2,530,851 | | | | 0 | | | | 0 | | | | 2,530,851 | |
Investments measured at net asset value* | | | | | | | | | | | | | | | 14,316,539 | |
Total assets | | $ | 496,079,054 | | | $ | 6,779 | | | $ | 48,710 | | | $ | 510,451,082 | |
| * | Investments that are measured at fair value using the net asset value per share (or its equivalent) as a practical expedient have not been categorized in the fair value hierarchy. The fair value amount presented in the table is intended to permit reconciliation of the fair value hierarchy to the amounts presented in the Statement of Assets and Liabilities. The Portfolio’s investment in Securities Lending Cash Investment, LLC valued at $14,316,539 does not have a redemption period notice, can be redeemed daily and does not have any unfunded commitments. |
| | | | |
| 144 | | Wells Fargo Equity Gateway Funds | | Notes to financial statements |
| | | | | | | | | | | | | | | | |
| Large Company Value Portfolio | | Quoted prices (Level 1) | | | Other significant observable inputs (Level 2) | | | Significant unobservable inputs (Level 3) | | | Total | |
Assets | | | | | | | | | | | | | | | | |
Investments in: | | | | | | | | | | | | | | | | |
| | | | |
Common stocks | | | | | | | | | | | | | | | | |
Consumer discretionary | | $ | 5,992,355 | | | $ | 0 | | | $ | 0 | | | $ | 5,992,355 | |
Consumer staples | | | 5,245,325 | | | | 0 | | | | 0 | | | | 5,245,325 | |
Energy | | | 8,764,370 | | | | 0 | | | | 0 | | | | 8,764,370 | |
Financials | | | 22,808,234 | | | | 0 | | | | 0 | | | | 22,808,234 | |
Health care | | | 10,075,327 | | | | 0 | | | | 0 | | | | 10,075,327 | |
Industrials | | | 8,482,370 | | | | 0 | | | | 0 | | | | 8,482,370 | |
Information technology | | | 8,745,638 | | | | 0 | | | | 0 | | | | 8,745,638 | |
Materials | | | 2,668,280 | | | | 0 | | | | 0 | | | | 2,668,280 | |
Telecommunication services | | | 1,794,709 | | | | 0 | | | | 0 | | | | 1,794,709 | |
Utilities | | | 3,348,498 | | | | 0 | | | | 0 | | | | 3,348,498 | |
| | | | |
Short-term investments | | | | | | | | | | | | | | | | |
Investment companies | | | 1,123,879 | | | | 0 | | | | 0 | | | | 1,123,879 | |
Investments measured at net asset value* | | | | | | | | | | | | | | | 1,759,295 | |
Total assets | | $ | 79,048,985 | | | $ | 0 | | | $ | 0 | | | $ | 80,808,280 | |
| * | Investments that are measured at fair value using the net asset value per share (or its equivalent) as a practical expedient have not been categorized in the fair value hierarchy. The fair value amount presented in the table is intended to permit reconciliation of the fair value hierarchy to the amounts presented in the Statements of Assets and Liabilities. The Portfolio’s investment in Securities Lending Cash Investment, LLC valued at $1,759,295 does not have a redemption period notice, can be redeemed daily and does not have any unfunded commitments. |
| | | | | | | | | | | | | | | | |
| Small Company Growth Portfolio | | Quoted prices (Level 1) | | | Other significant observable inputs (Level 2) | | | Significant unobservable inputs (Level 3) | | | Total | |
Assets | | | | | | | | | | | | | | | | |
Investments in: | | | | | | | | | | | | | | | | |
| | | | |
Common stocks | | | | | | | | | | | | | | | | |
Consumer discretionary | | $ | 167,660,319 | | | $ | 0 | | | $ | 0 | | | $ | 167,660,319 | |
Consumer staples | | | 31,118,946 | | | | 0 | | | | 0 | | | | 31,118,946 | |
Energy | | | 32,226,308 | | | | 0 | | | | 0 | | | | 32,226,308 | |
Financials | | | 112,573,141 | | | | 0 | | | | 0 | | | | 112,573,141 | |
Health care | | | 277,040,158 | | | | 0 | | | | 0 | | | | 277,040,158 | |
Industrials | | | 196,541,616 | | | | 0 | | | | 0 | | | | 196,541,616 | |
Information technology | | | 323,772,888 | | | | 0 | | | | 0 | | | | 323,772,888 | |
Materials | | | 24,505,990 | | | | 0 | | | | 0 | | | | 24,505,990 | |
| | | | |
Short-term investments | | | | | | | | | | | | | | | | |
Investment companies | | | 40,370,488 | | | | 0 | | | | 0 | | | | 40,370,488 | |
Investments measured at net asset value* | | | | | | | | | | | | | | | 151,177,536 | |
Total assets | | $ | 1,205,809,854 | | | $ | 0 | | | $ | 0 | | | $ | 1,356,987,390 | |
| * | Investments that are measured at fair value using the net asset value per share (or its equivalent) as a practical expedient have not been categorized in the fair value hierarchy. The fair value amount presented in the table is intended to permit reconciliation of the fair value hierarchy to the amounts presented in the Statements of Assets and Liabilities. The Portfolio’s investment in Securities Lending Cash Investment, LLC valued at $151,177,536 does not have a redemption period notice, can be redeemed daily and does not have any unfunded commitments. |
| | | | | | |
| Notes to financial statements | | Wells Fargo Equity Gateway Funds | | | 145 | |
| | | | | | | | | | | | | | | | |
| Small Company Value Portfolio | | Quoted prices (Level 1) | | | Other significant observable inputs (Level 2) | | | Significant unobservable inputs (Level 3) | | | Total | |
Assets | | | | | | | | | | | | | | | | |
Investments in: | | | | | | | | | | | | | | | | |
| | | | |
Common stocks | | | | | | | | | | | | | | | | |
Consumer discretionary | | $ | 31,528,281 | | | $ | 0 | | | $ | 0 | | | $ | 31,528,281 | |
Consumer staples | | | 5,274,964 | | | | 0 | | | | 0 | | | | 5,274,964 | |
Energy | | | 13,960,510 | | | | 0 | | | | 0 | | | | 13,960,510 | |
Financials | | | 85,916,166 | | | | 0 | | | | 0 | | | | 85,916,166 | |
Health care | | | 8,309,486 | | | | 0 | | | | 0 | | | | 8,309,486 | |
Industrials | | | 16,923,555 | | | | 0 | | | | 0 | | | | 16,923,555 | |
Information technology | | | 32,348,308 | | | | 0 | | | | 0 | | | | 32,348,308 | |
Materials | | | 8,659,206 | | | | 0 | | | | 0 | | | | 8,659,206 | |
Utilities | | | 10,535,582 | | | | 0 | | | | 0 | | | | 10,535,582 | |
| | | | |
Warrants | | | | | | | | | | | | | | | | |
Health care | | | 0 | | | | 0 | | | | 0 | | | | 0 | |
| | | | |
Short-term investments | | | | | | | | | | | | | | | | |
Investment companies | | | 4,875,803 | | | | 0 | | | | 0 | | | | 4,875,803 | |
Investments measured at net asset value* | | | | | | | | | | | | | | | 5,965,825 | |
Total assets | | $ | 218,331,861 | | | $ | 0 | | | $ | 0 | | | $ | 224,297,686 | |
| * | Investments that are measured at fair value using the net asset value per share (or its equivalent) as a practical expedient have not been categorized in the fair value hierarchy. The fair value amount presented in the table is intended to permit reconciliation of the fair value hierarchy to the amounts presented in the Statements of Assets and Liabilities. The Portfolio’s investment in Securities Lending Cash Investment, LLC valued at $5,965,825 does not have a redemption period notice, can be redeemed daily and does not have any unfunded commitments. |
Futures contracts are reported at their variation margin at measurement date, which represents the amount due from the Index Portfolio at that date. All other assets and liabilities are reported at their market value at measurement date.
The Portfolios recognize transfers between levels within the fair value hierarchy at the end of the reporting period. At May 31, 2016, the Portfolios did not have any transfers into/out of Level 1, Level 2 or Level 3 except International Value Portfolio which had an immaterial transfer between Level 1 and Level 3.
4. TRANSACTIONS WITH AFFILIATES AND OTHER EXPENSES
Advisory fee
The Trust has entered into an advisory contract with Funds Management, an indirect wholly owned subsidiary of Wells Fargo. The adviser is responsible for implementing investment policies and guidelines and for supervising the subadvisers, who are responsible for day-to-day portfolio management of the Portfolios. Pursuant to the contract, Funds Management is entitled to receive an annual advisory fee which is calculated based on the average daily net assets of each Portfolio.
Funds Management has retained the services of certain subadvisers to provide daily portfolio management for the Portfolios. Funds Management has engaged WellsCap, Peregrine Capital Management, Inc. (“Peregrine”) (an affiliate of Funds Management and a direct wholly owned subsidiary of Wells Fargo), Artisan Partners Limited Partnership, Cooke & Bieler, L.P., Golden Capital Management, LLC (an affiliate of Funds Management), LSV Asset Management, and Phocas Financial Corporation as subadvisers.
The fees for subadvisory services are borne by Funds Management. The subadvisers are each entitled to receive from Funds Management an annual subadvisory fee which is calculated based on the average daily net assets of each Portfolio.
| | | | |
| 146 | | Wells Fargo Equity Gateway Funds | | Notes to financial statements |
The annual advisory and subadvisory fee rates for each Portfolio are as follows:
| | | | | | | | | | | | | | | | | | | | |
| | | Advisory fee | | | Effective rate for
the year ended May 31, 2016 | | | | | Subadvisory fee | |
| | | starting at | | | declining to | | | | Subadviser | | starting at | | declining to | |
C&B Large Cap Value Portfolio | | | 0.65 | % | | | 0.475 | % | | | 0.65 | % | | Cooke & Bieler, L.P. | | 0.38% | | | 0.30 | % |
Diversified Large Cap Growth Portfolio | | | 0.65 | | | | 0.475 | | | | 0.65 | | | WellsCap | | 0.30 | | | 0.20 | |
Emerging Growth Portfolio | | | 0.80 | | | | 0.68 | | | | 0.79 | | | WellsCap | | 0.55 | | | 0.40 | |
Index Portfolio | | | 0.10 | | | | 0.05 | | | | 0.09 | | | Golden Capital Management, LLC | | 0.05 | | | 0.02 | |
International Growth Portfolio | | | 0.85 | | | | 0.70 | | | | 0.85 | | | Artisan Partners Limited Partnership | | 0.80 | | | 0.50 | |
International Value Portfolio | | | 0.85 | | | | 0.70 | | | | 0.85 | | | LSV Asset Management | | 0.35 | | | 0.30 | |
Large Company Value Portfolio | | | 0.65 | | | | 0.475 | | | | 0.65 | | | Phocas Financial Corporation | | 0.29 | | | 0.20 | |
Small Company Growth Portfolio | | | 0.80 | | | | 0.68 | | | | 0.79 | | | Peregrine Capital Management, Inc. | | 0.50 | | | 0.45 | |
Small Company Value Portfolio | | | 0.80 | | | | 0.68 | | | | 0.80 | | | Peregrine Capital Management, Inc. | | 0.45 | | | 0.40 | |
Funds Management has voluntarily waived and/or reimbursed advisory fees to the extent necessary to maintain certain net operating expense ratios for the Portfolios.
5. INVESTMENT PORTFOLIO TRANSACTIONS
Purchases and sales of investments, excluding short-term securities, for the year ended May 31, 2016 were as follows:
| | | | | | | | |
| | | Purchases at cost | | | Sales proceeds | |
C&B Large Cap Value Portfolio | | $ | 85,183,352 | | | $ | 114,963,169 | |
Diversified Large Cap Growth Portfolio | | | 66,502,732 | | | | 72,054,473 | |
Emerging Growth Portfolio | | | 645,259,305 | | | | 731,708,252 | |
Index Portfolio | | | 102,056,002 | | | | 425,715,055 | |
International Growth Portfolio | | | 93,383,839 | | | | 88,165,073 | |
International Value Portfolio | | | 116,965,232 | | | | 66,237,230 | |
Large Company Value Portfolio | | | 40,427,589 | | | | 38,186,695 | |
Small Company Growth Portfolio | | | 1,109,978,075 | | | | 480,747,665 | |
Small Company Value Portfolio | | | 164,018,108 | | | | 145,721,707 | |
6. INVESTMENTS IN AFFILIATES
An affiliated investment is a company which is under common ownership or control of the Portfolio or which the Portfolio has ownership of at least 5% of the outstanding voting shares. The following is a summary of transactions for the long-term holdings of issuers that were either affiliates of Index Portfolio at the beginning of the period or the end of the period.
| | | | | | | | | | | | | | | | | | | | | | | | | | | | |
| | | Shares, beginning
of period | | | Shares
purchases | | | Shares
sold | | | Shares, end of
period | | | Value, end of
period | | | Income
from
affiliated
securities | | | Realized
gains
on
affiliated
securities | |
| | | | | | | |
| | | | | | | |
Wells Fargo & Company | | | 674,695 | | | | 0 | | | | 90,743 | | | | 583,952 | | | $ | 29,618,045 | | | $ | 944,748 | | | $ | 1,980,988 | |
7. DERIVATIVE TRANSACTIONS
During the year ended May 31, 2016, Index Portfolio used uninvested cash to enter into futures contracts to gain market exposure.
At May 31, 2016, Index Portfolio had long futures contracts outstanding as follows:
| | | | | | | | | | | | | | | | |
| Expiration date | | Counterparty | | Contracts | | Type | | | Contract
value at
May 31, 2016 | | | Unrealized
gains | |
6-16-2016 | | Jefferies Bache | | 60 Long | | | S&P 500 Index | | | $ | 31,423,500 | | | $ | 1,118,000 | |
| | | | | | |
| Notes to financial statements | | Wells Fargo Equity Gateway Funds | | | 147 | |
Index Portfolio had an average notional amount of $29,775,935 in long futures contracts outstanding during the year ended May 31, 2016.
The payable for daily variation margin on open futures contracts reflected in the Statements of Assets and Liabilities only represents the current day’s variation margin. The realized gains or losses and change in unrealized gains or losses on derivative instruments are reflected in the Statements of Operations.
For certain types of derivative transactions, the Portfolios have entered into International Swaps and Derivatives Association, Inc. master agreements (“ISDA Master Agreements”) or similar agreements with approved counterparties. The ISDA Master Agreements or similar agreements may have requirements to deliver/deposit securities or cash to/with an exchange or broker-dealer as collateral and allows the Portfolio to offset, with each counterparty, certain derivative financial instrument’s assets and/or liabilities with collateral held or pledged. Collateral requirements differ by type of derivative. Collateral or margin requirements are set by the broker or exchange clearing house for exchange traded derivatives while collateral terms are contract specific for over-the-counter traded derivatives. Cash collateral that has been pledged to cover obligations of the Portfolios under ISDA Master Agreements or similar agreements, if any, will be reported separately in the Statements of Assets and Liabilities. Securities pledged as collateral, if any, for the same purpose are noted in the Portfolio of Investments or Summary Portfolio of Investments. With respect to balance sheet offsetting, absent an event of default by the counterparty or a termination of the agreement, the reported amounts of financial assets and financial liabilities in the Statements of Assets and Liabilities are not offset across transactions between the Portfolio and the applicable counterparty. A reconciliation of the gross amounts on the Statements of Assets and Liabilities to the net amounts by derivative type, including any collateral exposure, is as follows:
| | | | | | | | | | | | | | | | | | | | |
| | | Derivative type | | Counterparty | | Gross amounts
of liabilities in the
Statements of
Assets and
Liabilities | | | Amounts
subject to
netting
agreements | | | Collateral
pledged1 | | | Net amount
of liabilities | |
Index Portfolio | | Futures – variation margin | | Jefferies Bache | | $ | 36,000 | | | $ | 0 | | | $ | (36,000 | ) | | $ | 0 | |
| | 1 | Collateral pledged within this table is limited to the collateral for the net transaction with the counterparty. | |
8. CONCENTRATION RISKS
Concentration risks result from exposure to a limited number of sectors. Portfolios that invest a substantial portion of their assets in a sector may be more affected by changes in that sector than would be a portfolio whose investments are not heavily weighted in any sector. The Portfolio of Investments or Summary Portfolio of Investments includes information on each Portfolio’s holdings, including sector composition, country and/or geographical composition as relevant.
9. INDEMNIFICATION
Under the Trust’s organizational documents, the officers and Trustees have been granted certain indemnification rights against certain liabilities that may arise out of performance of their duties to the Trust. Additionally, in the normal course of business, the Trust may enter into contracts with service providers that contain a variety of indemnification clauses. The Trust’s maximum exposure under these arrangements is dependent on future claims that may be made against the Portfolios and, therefore, cannot be estimated.
| | | | |
| 148 | | Wells Fargo Equity Gateway Funds | | Report of independent registered public accounting firm |
BOARD OF TRUSTEES AND SHAREHOLDERS OF WELLS FARGO MASTER TRUST:
We have audited the accompanying statements of assets and liabilities, including the portfolios of investments or summary portfolios of investments (for Wells Fargo Index Portfolio), of the Wells Fargo C&B Large Cap Value Portfolio, Wells Fargo Diversified Large Cap Growth Portfolio, Wells Fargo Emerging Growth Portfolio, Wells Fargo Index Portfolio, Wells Fargo International Growth Portfolio, Wells Fargo International Value Portfolio, Wells Fargo Large Company Value Portfolio, Wells Fargo Small Company Growth Portfolio and Wells Fargo Small Company Value Portfolio (formerly known as Wells Fargo Advantage C&B Large Cap Value Portfolio, Wells Fargo Advantage Diversified Large Cap Growth Portfolio, Wells Fargo Advantage Emerging Growth Portfolio, Wells Fargo Advantage Index Portfolio, Wells Fargo Advantage International Growth Portfolio, Wells Fargo Advantage International Value Portfolio, Wells Fargo Advantage Large Company Value Portfolio, Wells Fargo Advantage Small Company Growth Portfolio and Wells Fargo Advantage Small Company Value Portfolio, respectively), nine of the portfolios constituting the Wells Fargo Master Trust (collectively the “Portfolios”), as of May 31, 2016, and the related statements of operations for the year then ended, the statements of changes in net assets for each of the years in the two-year period then ended, and the financial highlights for each of the years in the five-year period then ended. These financial statements and financial highlights are the responsibility of the Portfolios’ management. Our responsibility is to express an opinion on these financial statements and financial highlights based on our audits.
We conducted our audits in accordance with the standards of the Public Company Accounting Oversight Board (United States). Those standards require that we plan and perform the audit to obtain reasonable assurance about whether the financial statements and financial highlights are free of material misstatement. An audit includes examining, on a test basis, evidence supporting the amounts and disclosures in the financial statements. Our procedures included confirmation of securities owned as of May 31, 2016, by correspondence with custodian and brokers, or by other appropriate auditing procedures. An audit also includes assessing the accounting principles used and significant estimates made by management, as well as evaluating the overall financial statement presentation. We believe that our audits provide a reasonable basis for our opinion.
In our opinion, the financial statements and financial highlights referred to above present fairly, in all material respects, the financial position of each of the aforementioned Portfolios of Wells Fargo Master Trust as of May 31, 2016, the results of their operations for the year then ended, the changes in their net assets for each of the years in the two-year period then ended, and the financial highlights for each of the years in the five-year period then ended, in conformity with U.S. generally accepted accounting principles.
Boston, Massachusetts
July 27, 2016
| | | | | | |
| Other information (unaudited) | | Wells Fargo Equity Gateway Funds | | | 149 | |
TAX INFORMATION
For corporate shareholders, pursuant to Section 854 of the Internal Revenue Code, the percentage of ordinary income dividends qualifying for the corporate dividends-received deduction was as follows for the fiscal year ended May 31, 2016:
| | | | |
| | | Dividends-received deduction | |
C&B Large Cap Value Fund | | | 100.00 | % |
Diversified Equity Fund | | | 100.00 | |
Index Fund | | | 98.84 | |
Small Company Value Fund | | | 100.00 | |
Pursuant to Section 852 of the Internal Revenue Code, the following amounts were designated as long-term capital gain distributions for the fiscal year ended May 31, 2016:
| | | | |
| | | Long-term
capital gain
distributions | |
C&B Large Cap Value Fund | | $ | 8,527,222 | |
Diversified Equity Fund | | | 25,311,654 | |
Emerging Growth Fund | | | 101,711,376 | |
Index Fund | | | 140,953,431 | |
Small Company Growth Fund | | | 7,354,882 | |
Pursuant to Section 854 of the Internal Revenue Code, the following amounts of income dividends paid during the fiscal year ended May 31, 2016 have been designated as qualified dividend income (QDI):
| | | | |
| | | QDI | |
C&B Large Cap Value Fund | | $ | 2,808,799 | |
Diversified Equity Fund | | | 1,825,620 | |
Index Fund | | | 45,123,990 | |
International Value Fund | | | 8,674,487 | |
Small Company Value Fund | | | 431,180 | |
For the fiscal year ended May 31, 2016, the following amounts have been designated as short-term capital gain dividends for nonresident alien shareholders pursuant to Section 871 of the Internal Revenue Code:
| | | | |
| | | Short-term capital gain dividends | |
Diversified Equity Fund | | $ | 765,257 | |
Index Fund | | | 1,272,421 | |
Pursuant to Section 853 of the Internal Revenue Code, International Value Fund expects to designate amounts as foreign taxes paid for the fiscal year ended May 31, 2016. Additional details will be available in the semiannual report.
PROXY VOTING INFORMATION
A description of the policies and procedures used to determine how to vote proxies relating to portfolio securities is available without charge, upon request, by calling 1-800-222-8222, visiting our website at wellsfargofunds.com, or visiting the SEC website at sec.gov. Information regarding how the proxies related to portfolio securities were voted during the most recent 12-month period ended June 30 is available on the website at wellsfargofunds.com or by visiting the SEC website at sec.gov.
| | | | |
| 150 | | Wells Fargo Equity Gateway Funds | | Other information (unaudited) |
PORTFOLIO HOLDINGS INFORMATION
The complete portfolio holdings are publicly available on the website (wellsfargofunds.com) on a one-month delayed basis. In addition, top ten holdings information (excluding derivative positions) is publicly available on the website on a monthly, seven-day or more delayed basis. Each Fund and Portfolio files its complete schedule of portfolio holdings with the SEC for the first and third quarters of each fiscal year on Form N-Q, which is available by visiting the SEC website at sec.gov. In addition, each Form N-Q may be reviewed and copied at the SEC’s Public Reference Room in Washington, DC, and at regional offices in New York City, at 233 Broadway, and in Chicago, at 175 West Jackson Boulevard, Suite 900. Information about the Public Reference Room may be obtained by calling 1-800-SEC-0330.
| | | | | | |
| Other information (unaudited) | | Wells Fargo Equity Gateway Funds | | | 151 | |
BOARD OF TRUSTEES AND OFFICERS
Each of the Trustees and Officers1 listed in the table below acts in identical capacities for each fund in the Wells Fargo family of funds, which consists of 142 mutual funds comprising the Wells Fargo Funds Trust, Wells Fargo Variable Trust, Wells Fargo Master Trust and four closed-end funds (collectively the “Fund Complex”). This table should be read in conjunction with the Prospectus and the Statement of Additional Information2. The mailing address of each Trustee and Officer is 525 Market Street, 12th Floor, San Francisco, CA 94105. Each Trustee and Officer serves an indefinite term, however, each Trustee serves such term until reaching the mandatory retirement age established by the Trustees.
Independent Trustees
| | | | | | |
Name and
year of birth | | Position held and
length of service* | | Principal occupations during past five years or longer | | Current other public
company or investment
company directorships |
William R. Ebsworth
(Born 1957) | | Trustee, since 2015 | | Retired. From 1984 to 2013, equities analyst, portfolio manager, research director and chief financial officer at Fidelity Management and Research Company in Boston, Tokyo, and Hong Kong and retired in 2013 as Chief Investment Officer of Fidelity Strategic Advisers, Inc. where he lead a team of investment professionals managing client assets. Prior thereto, Board member of Hong Kong Securities Clearing Co., Hong Kong Options Clearing Corp., the Thailand International Fund, Ltd., Fidelity Investments Life Insurance Company, and Empire Fidelity Investments Life Insurance Company. Mr. Ebsworth is a CFA® charterholder and an Adjunct Lecturer, Finance, at Babson College. | | Asset Allocation Trust |
Jane A. Freeman
(Born 1953) | | Trustee, since 2015 | | Retired. From 2012 to 2014 and 1999 to 2008, Chief Financial Officer of Scientific Learning Corporation. From 2008 to 2012, Ms. Freeman provided consulting services related to strategic business projects. Prior to 1999, Portfolio Manager at Rockefeller & Co. and Scudder, Stevens & Clark. Board member of the Harding Loevner Funds from 1996 to 2014, serving as both Lead Independent Director and chair of the Audit Committee. Board member of the Russell Exchange Traded Funds Trust from 2011 to 2012 and the chair of the Audit Committee. Ms. Freeman is Chair of Taproot Foundation (non-profit organization), a Board Member of Ruth Bancroft Garden (non-profit organization) and an inactive chartered financial analyst. | | Asset Allocation Trust |
Peter G. Gordon
(Born 1942) | | Trustee, since 1998; Chairman, since 2005 | | Co-Founder, Retired Chairman, President and CEO of Crystal Geyser Water Company. Trustee Emeritus, Colby College. | | Asset Allocation Trust |
Isaiah Harris, Jr.
(Born 1952) | | Trustee, since 2009 | | Retired. Chairman of the Board of CIGNA Corporation since 2009, and Director since 2005. From 2003 to 2011, Director of Deluxe Corporation. Prior thereto, President and CEO of BellSouth Advertising and Publishing Corp. from 2005 to 2007, President and CEO of BellSouth Enterprises from 2004 to 2005 and President of BellSouth Consumer Services from 2000 to 2003. Emeritus member of the Iowa State University Foundation Board of Governors. Emeritus Member of the Advisory Board of Iowa State University School of Business. Advisory Board Member, Palm Harbor Academy (charter school). Advisory Board Member, Child Evangelism Fellowship (non-profit). Mr. Harris is a certified public accountant (inactive status). | | CIGNA Corporation; Asset Allocation Trust |
Judith M. Johnson
(Born 1949) | | Trustee, since 2008;
Audit Committee Chairman, since 2008 | | Retired. Prior thereto, Chief Executive Officer and Chief Investment Officer of Minneapolis Employees Retirement Fund from 1996 to 2008. Ms. Johnson is an attorney, certified public accountant and a certified managerial accountant. | | Asset Allocation Trust |
David F. Larcker
(Born 1950) | | Trustee, since 2009 | | James Irvin Miller Professor of Accounting at the Graduate School of Business, Stanford University, Director of the Corporate Governance Research Initiative and Senior Faculty of The Rock Center for Corporate Governance since 2006. From 2005 to 2008, Professor of Accounting at the Graduate School of Business, Stanford University. Prior thereto, Ernst & Young Professor of Accounting at The Wharton School, University of Pennsylvania from 1985 to 2005. | | Asset Allocation Trust |
| | | | |
| 152 | | Wells Fargo Equity Gateway Funds | | Other information (unaudited) |
| | | | | | |
Name and
year of birth | | Position held and
length of service* | | Principal occupations during past five years or longer | | Current other public
company or investment
company directorships |
Olivia S. Mitchell
(Born 1953) | | Trustee, since 2006 | | International Foundation of Employee Benefit Plans Professor, Wharton School of the University of Pennsylvania since 1993. Director of Wharton’s Pension Research Council and Boettner Center on Pensions & Retirement Research, and Research Associate at the National Bureau of Economic Research. Previously, Cornell University Professor from 1978 to 1993. | | Asset Allocation Trust |
Timothy J. Penny
(Born 1951) | | Trustee, since 1996 | | President and Chief Executive Officer of Southern Minnesota Initiative Foundation, a non-profit organization, since 2007 and Senior Fellow at the Humphrey Institute Policy Forum at the University of Minnesota since 1995. Member of the Board of Trustees of NorthStar Education Finance, Inc., a non-profit organization, since 2007. | | Asset Allocation Trust |
Michael S. Scofield
(Born 1943) | | Trustee, since 2010 | | Served on the Investment Company Institute’s Board of Governors and Executive Committee from 2008-2011 as well the Governing Council of the Independent Directors Council from 2006-2011 and the Independent Directors Council Executive Committee from 2008-2011. Chairman of the IDC from 2008-2010. Institutional Investor (Fund Directions) Trustee of Year in 2007. Trustee of the Evergreen Funds complex (and its predecessors) from 1984 to 2010. Chairman of the Evergreen Funds from 2000-2010. Former Trustee of the Mentor Funds. Retired Attorney, Law Offices of Michael S. Scofield. | | Asset Allocation Trust |
| * | Length of service dates reflect the Trustee’s commencement of service with the Trust’s predecessor entities, where applicable. |
Officers
| | | | | | |
Name and
year of birth | | Position held and
length of service | | Principal occupations during past five years or longer | | |
Karla M. Rabusch
(Born 1959) | | President, since 2003 | | Executive Vice President of Wells Fargo Bank, N.A. and President of Wells Fargo Funds Management, LLC since 2003. | | |
Nancy Wiser1
(Born 1967) | | Treasurer, since 2012 | | Executive Vice President of Wells Fargo Funds Management, LLC since 2011. Chief Operating Officer and Chief Compliance Officer at LightBox Capital Management LLC, from 2008 to 2011. | | |
Jeremy DePalma1
(Born 1974) | | Treasurer, since 2012 | | Senior Vice President of Wells Fargo Funds Management, LLC since 2009. Senior Vice President of Evergreen Investment Management Company, LLC from 2008 to 2010 and head of the Fund Reporting and Control Team within Fund Administration from 2005 to 2010. | | |
C. David Messman
(Born 1960) | | Secretary, since 2000; Chief Legal Officer, since 2003 | | Senior Vice President and Secretary of Wells Fargo Funds Management, LLC since 2001. Assistant General Counsel of Wells Fargo Bank, N.A. since 2013 and Vice President and Managing Counsel of Wells Fargo Bank, N.A. from 1996 to 2013. | | |
Michael Whitaker
(Born 1967) | | Chief Compliance Officer, since 2016* | | Executive Vice President of Wells Fargo Funds Management, LLC since 2016. Chief Compliance Officer of Fidelity’s Fixed Income Funds and Asset Allocation Funds from 2008 to 2016, Compliance Officer of FMR Co., Inc. from 2014 to 2016, Fidelity Investments Money Management, Inc. from 2014 to 2016, Fidelity Investments from 2007 to 2016. | | |
David Berardi
(Born 1975) | | Assistant Treasurer, since 2009 | | Vice President of Wells Fargo Funds Management, LLC since 2009. Vice President of Evergreen Investment Management Company, LLC from 2008 to 2010. Manager of Fund Reporting and Control for Evergreen Investment Management Company, LLC from 2004 to 2010. | | |
| 1 | Jeremy DePalma acts as Treasurer of the International Value Fund, International Growth Portfolio and International Value Portfolio and Assistant Treasurer of the remaining funds in this shareholder report. In addition, Jeremy DePalma acts as Treasurer of 66 other funds and Assistant Treasurer of 60 other funds in the Fund Complex. Nancy Wiser serves as Treasurer of the remaining funds in this shareholder report as well as 60 other funds. |
| 2 | The Statement of Additional Information includes additional information about the Trustees and is available, without charge, upon request, by calling 1-800-222-8222 or by visiting the website at wellsfargofunds.com. |
| * | Michael Whitaker became Chief Compliance Officer effective May 16, 2016. |
| | | | | | |
| Other information (unaudited) | | Wells Fargo Equity Gateway Funds | | | 153 | |
BOARD CONSIDERATION OF INVESTMENT MANAGEMENT, ADVISORY AND SUB-ADVISORY AGREEMENTS:
Wells Fargo C&B Large Cap Value Fund, Wells Fargo Diversified Equity Fund, Wells Fargo Emerging Growth Fund, Wells Fargo Index Fund, Wells Fargo International Value Fund, Wells Fargo Small Company Growth Fund, Wells Fargo Small Company Value Fund, Wells Fargo C&B Large Cap Value Portfolio, Wells Fargo Diversified Large Cap Growth Portfolio, Wells Fargo Emerging Growth Portfolio, Wells Fargo Index Portfolio, Wells Fargo International Growth Portfolio, Wells Fargo International Value Portfolio, Wells Fargo Large Company Value Portfolio, Wells Fargo Small Company Growth Portfolio and Wells Fargo Small Company Value Portfolio
Under the Investment Company Act of 1940 (the “1940 Act”), the Board of Trustees (each, a “Board” and collectively, the “Boards”) of each of Wells Fargo Funds Trust (“Funds Trust”) and Wells Fargo Master Trust (“Master Trust”) (collectively, the “Trusts”) must determine annually whether to approve the continuation of the Trusts’ investment management, advisory and sub-advisory agreements, as applicable. In this regard, at an in-person meeting held on May 24-25, 2016 (the “Meeting”), the Funds Trust Board, all the members of which have no direct or indirect interest in the investment management, advisory and sub-advisory agreements and are not “interested persons” of the Trusts, as defined in the 1940 Act (the “Independent Trustees”), reviewed and approved for each of the Wells Fargo C&B Large Cap Value Fund, Wells Fargo Diversified Equity Fund, Wells Fargo Emerging Growth Fund, Wells Fargo Index Fund, Wells Fargo International Value Fund, Wells Fargo Small Company Growth Fund and Wells Fargo Small Company Value Fund (individually, a “Gateway Fund” and collectively, the “Gateway Funds”) an investment management agreement (the “Gateway Fund Management Agreement”) with Wells Fargo Funds Management, LLC (“Funds Management”).
At the Meeting, the Master Trust Board, all the members of which are Independent Trustees, reviewed and approved an investment advisory agreement (the “Master Portfolio Advisory Agreement”) with Funds Management for each of the Wells Fargo C&B Large Cap Value Portfolio, Wells Fargo Diversified Large Cap Growth Portfolio, Wells Fargo Emerging Growth Portfolio, Wells Fargo Index Portfolio, Wells Fargo International Growth Portfolio, Wells Fargo International Value Portfolio, Wells Fargo Large Company Value Portfolio, Wells Fargo Small Company Growth Portfolio and Wells Fargo Small Company Value Portfolio (individually, a “Master Portfolio” and collectively, the “Master Portfolios”). The Gateway Funds and the Master Portfolios are collectively referred to as the “Funds.”
The Master Trust Board also reviewed and approved the following at the Meeting: (i) an investment sub-advisory agreement with Wells Capital Management Incorporated (“WellsCap”) for each of the Diversified Large Cap Growth Portfolio and Emerging Growth Portfolio; (ii) an investment sub-advisory agreement with Artisan Partners Limited Partnership (“Artisan”) for the International Growth Portfolio; (iii) an investment sub-advisory agreement with Cooke & Bieler L.P. (“Cooke & Bieler”) for the C&B Large Cap Value Portfolio; (iv) an investment sub-advisory agreement with LSV Asset Management (“LSV”) for the International Value Portfolio; (v) an investment sub-advisory agreement with Peregrine Capital Management, Inc. (“Peregrine”) for each of the Small Company Growth Portfolio and Small Company Value Portfolio; (vi) an investment sub-advisory agreement with Golden Capital Management, LLC (“Golden”) for the Index Portfolio; and (vii) an investment sub-advisory agreement with Phocas Financial Corporation (“Phocas”) for the Large Company Value Portfolio (collectively, the “Sub-Advisory Agreements”). WellsCap, Artisan, Cooke & Bieler, LSV, Peregrine, Golden and Phocas are collectively referred to as the “Sub-Advisers”, and the Gateway Fund Management Agreement, the Master Portfolio Advisory Agreement and the Sub-Advisory Agreements are collectively referred to as the “Advisory Agreements.”
The Diversified Equity Fund is a gateway blended fund that invests all of its assets in multiple Master Portfolios. The C&B Large Cap Value Fund, Emerging Growth Fund, Index Fund, International Value Fund, Small Company Growth Fund and Small Company Value Fund are gateway feeder funds that invest substantially all of their assets in the C&B Large Cap Value Portfolio, Emerging Growth Portfolio, Index Portfolio, International Value Portfolio, Small Company Growth Portfolio and Small Company Value Portfolio, respectively. Each of these Master Portfolios has a substantially similar investment objective and substantially similar investment strategies to the respective Gateway Fund. Information provided to the Boards regarding these Funds is also applicable to the Master Portfolios identified above, as relevant.
At the Meeting, the Boards considered the factors and reached the conclusions described below relating to the selection of Funds Management and the Sub-Advisers and the approval of the Advisory Agreements. Prior to the Meeting, including at an in-person meeting in April 2016, the Trustees conferred extensively among themselves and with representatives of Funds Management about these matters. Also, the Boards have adopted a team-based approach, with each team consisting of a sub-set of Trustees, to assist the Boards in the discharge of their duties in reviewing performance and other matters throughout the year. The Independent Trustees were assisted in their evaluation of the Advisory Agreements by independent legal counsel, from whom they received separate legal advice and with whom they met separately.
| | | | |
| 154 | | Wells Fargo Equity Gateway Funds | | Other information (unaudited) |
In providing information to the Boards, Funds Management and the Sub-Advisers were guided by a detailed set of requests for information submitted to them by independent legal counsel on behalf of the Independent Trustees at the start of the Boards’ annual contract renewal process earlier in 2016. In considering and approving the Advisory Agreements, the Trustees considered the information they believed relevant, including but not limited to the information discussed below. The Boards considered not only the specific information presented in connection with the Meetings, but also the knowledge gained over time through interaction with Funds Management and the Sub-Advisers about various topics. In this regard, the Boards reviewed reports of Funds Management at each of their quarterly meetings, which included, among other things, portfolio reviews and performance reports. In addition, the Boards and the teams mentioned above confer with portfolio managers at various times throughout the year. The Boards did not identify any particular information or consideration that was all-important or controlling, and each individual Trustee may have attributed different weights to various factors.
After its deliberations, the Funds Trust Board unanimously approved the continuation of the Gateway Fund Management Agreement for a one-year period. Additionally, after its deliberations, the Master Trust Board unanimously approved the continuation of the Master Portfolio Advisory Agreement and each Sub-Advisory Agreement for a one-year term. The Boards also determined that the compensation payable to Funds Management and each of the Sub-Advisers was reasonable. The Boards considered the approval of the Advisory Agreements for the Funds as part of their consideration of agreements for funds across the complex, but their approvals were made on a fund-by-fund basis. The following summarizes a number of important, but not necessarily all, factors considered by the Boards in support of their approvals.
Nature, extent and quality of services
The Boards received and considered various information regarding the nature, extent and quality of services provided to the Funds by Funds Management and the Sub-Advisers under the Advisory Agreements. This information included a description of the investment advisory services and Fund-level administrative services, as well as, among other things, a summary of the background and experience of senior management of Funds Management, and the qualifications, background, tenure and responsibilities of each of the portfolio managers primarily responsible for the day-to-day portfolio management of the Funds.
The Boards evaluated the ability of Funds Management and the Sub-Advisers to attract and retain qualified investment professionals, including research, advisory and supervisory personnel. The Boards further considered the compliance programs and compliance records of Funds Management and the Sub-Advisers. In addition, the Boards took into account the full range of services provided to the Funds by Funds Management and its affiliates.
Fund performance and expenses
The Boards considered the performance results for each of the Funds over various time periods ended December 31, 2015. The Boards considered these results in comparison to the performance of funds in a universe that was determined by Broadridge Inc. (“Broadridge”) to be similar to the respective Funds (each, a “Universe”), and in comparison to each Fund’s benchmark index and to other comparative data. Broadridge is an independent provider of investment company data. The Boards received a description of the methodology used by Broadridge to select the mutual funds in each performance Universe.
The Funds Trust Board noted that the performance of each Gateway Fund (Administrator Class) relative to its respective Universe was as follows: (i) the performance of the C&B Large Cap Value Fund was higher than or in range of the average performance of its Universe for all periods under review; (ii) the performance of the Diversified Equity Fund was higher than or in range of the average performance of its Universe for all periods under review except the three- and ten-year periods; (iii) the performance of the Emerging Growth Fund was higher than or in range of the average performance of its Universe for all periods under review except the one-year period; (iv) the performance of the Index Fund was higher than the average performance of its Universe for all periods under review; (v) the performance of the International Value Fund was higher than or in range of the average performance of its Universe for all periods under review; (vi) the performance of the Small Company Growth Fund was higher than the average performance of its Universe for all periods under review except the one-year period; and (vii) the performance of the Small Company Value Fund was higher than the average performance of its Universe for all periods under review except the ten-year period.
The Funds Trust Board also noted that the performance of each Gateway Fund relative to its respective benchmark was as follows: (i) the performance of the C&B large Cap Value Fund was higher than or in range of its benchmark, the Russell 1000 Value Index, for all periods under review except the five-year period; (ii) the performance of the Diversified Equity Fund was lower than its benchmark, the Diversified Equity Composite Index, which is a proprietary index used by the Funds Trust Board to help it assess the Diversified Equity Fund’s relative performance, for all periods under review; (iii) the performance of the Emerging Growth Fund was lower than its benchmark, the Russell 2000® Growth Index, for all periods
| | | | | | |
| Other information (unaudited) | | Wells Fargo Equity Gateway Funds | | | 155 | |
under review; (iv) the performance of the Index Fund was in range of its benchmark, the S&P 500 Index, for all periods under review; (v) the performance of the International Value Fund was higher than or in range of its benchmark, the MSCI EAFE Value Index, for all periods under review except the three-year period; (vi) the performance of the Small Company Growth Fund was higher than or in range of its benchmark, the Russell 2000® Growth Index, for all periods under review except the one-year period; and (vii) the performance of the Small Company Value Fund was higher than its benchmark, the Russell 2000® Value Index, for all periods under review except the ten-year period.
The Funds Trust Board received information concerning, and discussed factors contributing to the underperformance of certain Gateway Funds for certain periods as noted above. Funds Management advised the Funds Trust Board about certain market conditions and investment decisions that it believed contributed to such underperformance. The Master Trust Board took note of the performance of the Master Portfolios in the context of reviewing the performance of the Gateway Funds.
The Funds Trust Board also received and considered information regarding each Gateway Fund’s net operating expense ratios, which include fees and expenses of the corresponding Master Portfolio, and their various components, including actual management fees assessed at the Gateway Fund and Master Portfolio levels, custodian and other non-management fees, and Rule 12b-1 and non-Rule 12b-1 shareholder service fees. The Funds Trust Board considered these ratios in comparison to the median ratios of funds in class-specific expense groups that were determined by Broadridge to be similar to each Gateway Fund (the “Groups”). The Funds Trust Board received a description of the methodology used by Broadridge to select the mutual funds in the expense Groups and an explanation of how funds comprising expense groups and their expense ratios may vary from year-to-year. Based on the Broadridge reports, the Funds Trust Board noted that the net operating expense ratios of the Gateway Funds were as follows: (i) the net operating expense ratios of the C&B Large Cap Value Fund were lower than the median net operating expense ratios of its expense Groups for all share classes; (ii) the net operating expense ratios of the Diversified Equity Fund were lower than the median net operating expense ratios of its expense Groups for all share classes; (iii) the net operating expense ratios of the Emerging Growth Fund were equal to or lower than the median net operating expense ratios for its expense Groups for all share classes; (iv) the net operating expense ratios of the Index Fund were lower than the median net operating expense ratios for its expense Groups for all share classes; (v) the net operating expense ratios of the International Value Fund were equal to or lower than the median net operating expense ratios for its expense Groups for all share classes; (vi) the net operating expense ratios of the Small Company Growth Fund were lower than or in range of the net operating expense ratios for its expense Groups for all share classes; and (vii) the net operating expense ratios of the Small Company Value Fund were lower than or equal to the net operating expense ratios for its expense Groups for all share classes.
With respect to the Master Portfolios, the Master Trust Board reviewed the fee rates that are payable to Funds Management for investment advisory services (as discussed below), which are the only fees charged at the Master Portfolio level, relative to a corresponding expense Group.
The Boards took into account the Fund performance and expense information provided to it among the factors considered in deciding to re-approve the Advisory Agreements.
Investment management, advisory and sub-advisory fee rates
Except with respect to the Diversified Equity Fund, the Funds Trust Board noted that Funds Management receives no advisory fees from a Gateway Fund as long as the Gateway Fund continues to invest all (or substantially all) of its assets in a single master portfolio. If a Gateway Fund were to change its investment structure so that it begins to invest in two or more master portfolios (a gateway blended fund), Funds Management would be entitled to receive an annual fee of 0.25% of the Gateway Fund’s average daily net assets for providing investment advisory services to the Gateway Fund, including allocating the Gateway Fund’s assets among various master portfolios. The Funds Trust Board noted that the Diversified Equity Fund is a gateway blended fund that invests in multiple master portfolios and therefore pays an advisory fee to Funds Management.
The Funds Trust Board reviewed and considered the fee rates that are payable by each Gateway Fund to Funds Management under the Gateway Fund Management Agreement, as well as the contractual fee rates payable by each Gateway Fund to Funds Management for class-level administrative services under a Class-Level Administration Agreement, which include class-level transfer agency and sub-transfer agency costs (collectively, the “Management Rates”).
The Master Trust Board reviewed and considered the contractual investment advisory fee rates that are payable by the Master Portfolios to Funds Management for investment advisory services under the Master Portfolio Advisory Agreement (the “Advisory Agreement Rates”). The Master Trust Board also reviewed and considered the contractual investment sub-advisory fee rates that are payable by Funds Management to the Sub-Advisers for investment sub-advisory services (the “Sub-Advisory Agreement Rates”).
| | | | |
| 156 | | Wells Fargo Equity Gateway Funds | | Other information (unaudited) |
Among other information reviewed by the Funds Trust Board was a comparison of each Gateway Fund’s Management Rate, which, except in the case of the Diversified Equity Fund, include the advisory fees paid at the Master Portfolio level, with the average contractual investment management fee rates of funds in the expense Groups at a common asset level as well as transfer agency costs of the funds in the expense Groups. The Funds Trust Board noted that the Management Rates of the Gateway Funds were as follows: (i) the Management Rates of the C&B Large Cap Value Fund were lower than or equal to the sum of the management fee rates and transfer agency costs of its respective expense Groups for all share classes; (ii) the Management Rates for the Diversified Equity Fund were lower than the sum of the management fee rates and transfer agency costs of its respective expense Groups for all share classes; (iii) the Management Rates for the Emerging Growth Fund were equal to or in range of the sum of the management fee rates and transfer agency costs of its respective expense Groups for all share classes; (iv) the Management Rates for the Index Fund were in range of the sum of the management fee rates and transfer agency costs of its respective expense Groups for all share classes; (v) the Management Rates for the International Value Fund were in range of the sum of the management fee rates and transfer agency costs of its respective expense Groups for all share classes except the Administrator Class; (vi) the Management Rates for the Small Company Growth Fund were lower than or in range of the sum of the management fee rates and transfer agency costs of its respective expense Groups for all share classes; and (vii) the Management Rates for the Small Company Value Fund were lower than the sum of the management fee rates and transfer agency costs of its respective expense Groups for all share classes.
The Master Trust Board reviewed a comparison of the Advisory Agreement Rates of each Master Portfolio with those of other funds in each Master Portfolio’s respective expense Group at a common asset level. The Master Trust Board noted that the Advisory Agreement Rates of each Master Portfolio were lower than or equal to the median rate for the Master Portfolio’s respective expense Group. The Master Trust Board also discussed and accepted Funds Management’s proposal to revise the Master Portfolio Advisory Agreement to reduce fees at all asset levels for the International Growth Portfolio and the International Value Portfolio.
The Master Trust Board also received and considered information about the portions of the total management fees that were retained by Funds Management after payment of the fees to the Sub-Advisers for sub-advisory services. With respect to the Master Portfolios sub-advised by Artisan, Cooke & Bieler, LSV and Phocas, the Master Trust Board considered this amount in comparison to the median amount retained by advisers to funds in a sub-advised expense universe that was determined by Broadridge to be similar to the respective Master Portfolio. In assessing the reasonableness of these amounts, the Master Trust Board received and evaluated information about the nature and extent of responsibilities retained and risks assumed by Funds Management and not delegated to or assumed by the Sub-Advisers, and about Funds Management’s on-going oversight services. However, given the current affiliation between Funds Management and WellsCap, Peregrine and Golden, the Master Trust Board ascribed limited relevance to the allocation of the fees between them. The Master Trust Board noted that the Small Company Growth Portfolio and Small Company Value Portfolio were each subject to a reduction in its investment sub-advisory fee breakpoint effective May 1, 2016 due to a new breakpoint schedule in the Sub-Advisory Agreement with Peregrine that was approved by the Board at the April 2016 Board meeting. With respect to Artisan, Cooke & Bieler, LSV and Phocas, the Master Trust Board considered that the Sub-Advisory Agreement Rates paid to each of these Sub-Advisers had been negotiated by Funds Management on an arm’s-length basis.
Other than with respect to the Wells Fargo Diversified Large Cap Growth Portfolio, the Boards also received and considered information about the nature and extent of services offered and fee rates charged by Funds Management and the Sub-Advisers to other types of clients with investment strategies similar to those of the Funds. In this regard, the Boards received information about the significantly greater scope of services, and compliance, reporting and other legal burdens and risks of managing mutual funds compared with those associated with managing assets of non-mutual fund clients such as collective funds or institutional separate accounts.
Based on its consideration of the factors and information it deemed relevant, including those described here, the Funds Trust Board determined that the compensation payable to Funds Management under the Gateway Fund Management Agreement was reasonable, in light of the services covered by the Gateway Fund Management Agreement. The Master Trust Board determined that the compensation payable to Funds Management under the Master Portfolio Advisory Agreement and to each Sub-Adviser under each Sub-Advisory Agreement was reasonable, in light of the services covered by the Master Portfolio Advisory Agreement and each Sub-Advisory Agreement, respectively.
Profitability
The Boards received and considered information concerning the profitability of Funds Management, as well as the profitability of Wells Fargo as a whole, from providing services to the Funds and the fund family as a whole. The Boards
| | | | | | |
| Other information (unaudited) | | Wells Fargo Equity Gateway Funds | | | 157 | |
also received and considered information concerning the profitability of WellsCap, Peregrine, and Golden, if any, from providing services to the fund family as a whole, noting that the Sub-Adviser’s profitability information with respect to providing services to the Funds was subsumed in the Wells Fargo and Funds Management profitability analysis. The Boards did not receive or consider profitability information with respect to Artisan, Cooke & Bieler, LSV and Phocas, as the sub-advisory fees paid to them had been negotiated by Funds Management on an arm’s-length basis.
Funds Management reported on the methodologies and estimates used in calculating profitability. Among other things, the Boards noted that the levels of profitability reported on a fund-by-fund basis varied widely, depending on factors such as the size and type of fund. Based on its review, the Boards did not deem the profits reported by Funds Management or Wells Fargo from its services to the Funds to be at a level that would prevent the Boards from approving the continuation of the Advisory Agreements.
Economies of scale
With respect to possible economies of scale, the Boards noted the existence of breakpoints in each Master Portfolio’s advisory fee structure and each Gateway Fund’s management fee structure, which operate generally to reduce the Funds’ expense ratios as the Funds grow in size. They considered that, for a small fund or a fund that shrinks in size, breakpoints conversely can result in higher fee levels. The Master Trust Board discussed and accepted Funds Management’s proposal to revise the Master Portfolio Advisory Agreement to reduce fees at all asset levels for the International Growth Portfolio and the International Value Portfolio. The Boards also considered that fee waiver and expense reimbursement arrangements and competitive fee rates at the outset are means of sharing potential economies of scale with shareholders of the Funds and the fund family as a whole. The Boards considered Funds Management’s view that any analyses of potential economies of scale in managing a particular fund are inherently limited in light of the joint and common costs and investments that Funds Management incurs across the fund family as a whole.
The Boards concluded that the Funds’ fee and expense arrangements, including contractual breakpoints, constituted a reasonable approach to sharing potential economies of scale with the Funds and their shareholders.
Other benefits to Funds Management and the Sub-Advisers
The Boards received and considered information regarding potential “fall-out” or ancillary benefits received by Funds Management and its affiliates, including WellsCap, Peregrine and Golden, and by Artisan, Cooke & Bieler, LSV and Phocas, as a result of their relationships with the Funds. Ancillary benefits could include, among others, benefits directly attributable to other relationships with the Funds and benefits potentially derived from an increase in Funds Management’s and the Sub-Advisers’ business as a result of their relationships with the Funds. The Boards noted that various affiliates of Funds Management may receive distribution-related fees, shareholder servicing payments and sub-transfer agency fees in respect of shares sold or held through them and services provided.
The Boards also reviewed information about soft dollar credits earned and utilized by WellsCap, Artisan, Cooke & Bieler, Peregrine and Golden, fees earned by Funds Management and WellsCap from managing a private investment vehicle for the fund family’s securities lending collateral and commissions earned by an affiliated broker from portfolio transactions.
Based on their consideration of the factors and information they deemed relevant, including those described here, the Boards did not find that any ancillary benefits received by Funds Management and its affiliates, including WellsCap, Peregrine and Golden, or by Artisan, Cooke & Bieler, LSV or Phocas, were unreasonable.
Conclusion
At the Meeting, after considering the above-described factors and based on its deliberations and its evaluation of the information described above, the Funds Trust Board unanimously approved the continuation of the Gateway Fund Management Agreement for a one-year period. Additionally, at the Meeting, after considering the above-described factors and based on its deliberations and its evaluation of the information described above, the Master Trust Board unanimously approved the continuation of the Master Portfolio Advisory Agreement for a one-year term and each Sub-Advisory Agreement for a one-year term. The Boards also determined that the compensation payable to Funds Management and each of the Sub-Advisers was reasonable.
| | | | |
| 158 | | Wells Fargo Equity Gateway Funds | | List of abbreviations |
The following is a list of common abbreviations for terms and entities that may have appeared in this report.
| ACA | — ACA Financial Guaranty Corporation |
| ADR | — American depositary receipt |
| ADS | — American depositary shares |
| AGC | — Assured Guaranty Corporation |
| AGM | — Assured Guaranty Municipal |
| Ambac | — Ambac Financial Group Incorporated |
| AMT | — Alternative minimum tax |
| BAN | — Bond anticipation notes |
| BHAC | — Berkshire Hathaway Assurance Corporation |
| CAB | — Capital appreciation bond |
| CCAB | — Convertible capital appreciation bond |
| CDA | — Community Development Authority |
| CDO | — Collateralized debt obligation |
| DRIVER | — Derivative inverse tax-exempt receipts |
| DW&P | — Department of Water & Power |
| DWR | — Department of Water Resources |
| ECFA | — Educational & Cultural Facilities Authority |
| EDA | — Economic Development Authority |
| EDFA | — Economic Development Finance Authority |
| ETF | — Exchange-traded fund |
| FDIC | — Federal Deposit Insurance Corporation |
| FFCB | — Federal Farm Credit Banks |
| FGIC | — Financial Guaranty Insurance Corporation |
| FHA | — Federal Housing Administration |
| FHLB | — Federal Home Loan Bank |
| FHLMC | — Federal Home Loan Mortgage Corporation |
| FICO | — The Financing Corporation |
| FNMA | — Federal National Mortgage Association |
| GDR | — Global depositary receipt |
| GNMA | — Government National Mortgage Association |
| HCFR | — Healthcare facilities revenue |
| HEFA | — Health & Educational Facilities Authority |
| HEFAR | — Higher education facilities authority revenue |
| HFA | — Housing Finance Authority |
| HFFA | — Health Facilities Financing Authority |
| HUD | — Department of Housing and Urban Development |
| IDA | — Industrial Development Authority |
| IDAG | — Industrial Development Agency |
| KRW | — Republic of Korea won |
| LIBOR | — London Interbank Offered Rate |
| LIFER | — Long Inverse Floating Exempt Receipts |
| LLC | — Limited liability company |
| LLLP | — Limited liability limited partnership |
| LLP | — Limited liability partnership |
| MBIA | — Municipal Bond Insurance Association |
| MFHR | — Multifamily housing revenue |
| MSTR | — Municipal securities trust receipts |
| MUD | — Municipal Utility District |
| National | — National Public Finance Guarantee Corporation |
| PCFA | — Pollution Control Financing Authority |
| PCL | — Public Company Limited |
| PCR | — Pollution control revenue |
| PFA | — Public Finance Authority |
| PFFA | — Public Facilities Financing Authority |
| PFOTER | — Puttable floating option tax-exempt receipts |
| plc | — Public limited company |
| PUTTER | — Puttable tax-exempt receipts |
| R&D | — Research & development |
| Radian | — Radian Asset Assurance |
| RAN | — Revenue anticipation notes |
| RDA | — Redevelopment Authority |
| RDFA | — Redevelopment Finance Authority |
| REIT | — Real estate investment trust |
| ROC | — Reset option certificates |
| SAVRS | — Select auction variable rate securities |
| SBA | — Small Business Authority |
| SDR | — Swedish depositary receipt |
| SFHR | — Single-family housing revenue |
| SFMR | — Single-family mortgage revenue |
| SPA | — Standby purchase agreement |
| SPDR | — Standard & Poor’s Depositary Receipts |
| SPEAR | — Short Puttable Exempt Adjustable Receipts |
| STRIPS | — Separate trading of registered interest and |
| TAN | — Tax anticipation notes |
| TIPS | — Treasury inflation-protected securities |
| TRAN | — Tax revenue anticipation notes |
| TTFA | — Transportation Trust Fund Authority |
| TVA | — Tennessee Valley Authority |
This page is intentionally left blank.
This page is intentionally left blank.

For more information
More information about Wells Fargo Funds is available free upon request. To obtain literature, please write, email, visit the Funds’ website, or call:
Wells Fargo Funds
P.O. Box 8266
Boston, MA 02266-8266
Email: fundservice@wellsfargo.com
Website: wellsfargofunds.com
Individual investors: 1-800-222-8222
Retail investment professionals: 1-888-877-9275
Institutional investment professionals: 1-866-765-0778
This report and the financial statements contained herein are submitted for the general information of the shareholders of the Funds. If this report is used for promotional purposes, distribution of the report must be accompanied or preceded by a current prospectus. Before investing, please consider the investment objectives, risks, charges, and expenses of the investment. For a current prospectus and, if available, a summary prospectus, containing this information, call 1-800-222-8222 or visit the Funds’ website at wellsfargofunds.com. Read the prospectus carefully before you invest or send money.
Wells Fargo Asset Management (WFAM) is a trade name used by the asset management businesses of Wells Fargo & Company. Wells Fargo Funds Management, LLC, a wholly owned subsidiary of Wells Fargo & Company, provides investment advisory and administrative services for Wells Fargo Funds. Other affiliates of Wells Fargo & Company provide subadvisory and other services for the funds. The funds are distributed by Wells Fargo Funds Distributor, LLC, Member FINRA, an affiliate of Wells Fargo & Company.
NOT FDIC INSURED ¡ NO BANK GUARANTEE ¡ MAY LOSE VALUE
© 2016 Wells Fargo Funds Management, LLC. All rights reserved.
| | |
 | | 243137 07-16 AEGLD/AR111 05-16 |
Annual Report
May 31, 2016

Income Funds

| n | | Wells Fargo Core Bond Fund |
| n | | Wells Fargo Real Return Fund |

Reduce clutter. Save trees.
Sign up for electronic delivery of prospectuses and shareholder reports at wellsfargo.com/advantagedelivery
Contents
| * | A complete schedule of portfolio holdings as of the report date may be obtained, free of charge, by accessing the following website: https://www.wellsfargofunds.com/assets/edocs/regulatory/holdings/core-bond-ann.pdf or by calling Wells Fargo Funds at 1-800-222-8222. This complete schedule, filed on Form N-CSR, is also available on the SEC’s website at sec.gov. |
The views expressed and any forward-looking statements are as of May 31, 2016, unless otherwise noted, and are those of the Fund managers and/or Wells Fargo Funds Management, LLC. Discussions of individual securities, or the markets generally, or any Wells Fargo Fund are not intended as individual recommendations. Future events or results may vary significantly from those expressed in any forward-looking statements. The views expressed are subject to change at any time in response to changing circumstances in the market. Wells Fargo Funds Management, LLC and the Fund disclaim any obligation to publicly update or revise any views expressed or forward-looking statements.
NOT FDIC INSURED ¡ NO BANK GUARANTEE ¡ MAY LOSE VALUE
| | | | |
| 2 | | Wells Fargo Income Funds | | Letter to shareholders (unaudited) |

Karla M. Rabusch
President
Wells Fargo Funds
The U.S. Federal Reserve (Fed) embarked on a tightening cycle and raised the target federal funds rate to between 0.25% and 0.50% in December 2015.
Dear Valued Shareholder:
We are pleased to offer you this annual report for the Wells Fargo Income Funds for the 12-month period that ended May 31, 2016. Central-bank policies, moderate U.S. economic growth, and weakness in certain emerging markets economies and commodities drove bond markets. The Barclays U.S. Aggregate Bond Index1 returned 2.99% during the reporting period.
Monetary policies remained accommodative despite a move to normalize policy in the U.S.
The U.S. Federal Reserve (Fed) embarked on a tightening cycle and raised the target federal funds rate to between 0.25% and 0.50% in December 2015. However, Fed Chair Janet Yellen has emphasized that the Fed expects to raise rates only gradually, depending on economic data. In addition, the Fed is maintaining its existing policy of reinvesting principal payments from its holdings of agency debt and agency mortgage-backed securities back into agency mortgage-backed securities and of rolling over maturing Treasury securities at auction, and it anticipates doing so until normalization of the level of the federal funds rate is well underway.
The European Central Bank cut all three of its short-term rates during the reporting period, increased its asset-purchase program from 60 billion euros per month to 80 billion, expanded the list of eligible securities to include investment-grade nonbank debt, and created a fund-to-lend program where banks could be paid to lend money. In Japan, the Bank of Japan (BOJ) maintained an aggressive monetary program aimed at combating deflation. The BOJ set a negative deposit rate at the end of January 2016, its latest effort to encourage banks to lend rather than hold deposits.
Global economic growth was below trend, and oil prices garnered attention.
Developed countries experienced subtrend growth and subdued inflation. In the U.S., however, economic growth advanced and inflation, as measured by the Consumer Price Index, excluding food and energy, rose 2.1% over the past 12 months. Oil prices continued to fall dramatically, reaching a secular low of $26 per barrel in February 2016 before increasing to $49 per barrel by the end of the reporting period.
Uncertainty around the divergence between U.S. and non-U.S. economic growth, persistent weakness in European and Japanese inflation, risks of a hard landing in China, and the recalibration of energy and commodity prices weighed on the markets. Periods of greater volatility aided perceived safe-haven investments, such as U.S. Treasuries. As uncertainty about these issues waned, riskier assets tended to outperform. Over the course of the reporting period, asset classes within the Barclays U.S. Aggregate Bond Index performed as follows: Investment-grade corporate bonds returned 3.62%, commercial mortgage-backed securities returned 3.36%, asset-backed securities returned 1.81%, and mortgage-backed securities returned 2.71%. U.S. Treasury Inflation-Protected Securities returned 1.23%.
Since the end of the financial crisis, structural changes in the fixed-income markets have reduced trading liquidity (the degree to which assets can be bought or sold without affecting the price). New regulations and capital requirements have caused traditional liquidity suppliers (banks and broker/dealers) to be more
| 1 | The Barclays U.S. Aggregate Bond Index is a broad-based benchmark that measures the investment-grade, U.S. dollar–denominated, fixed-rate taxable bond market, including Treasuries, government-related and corporate securities, mortgage-backed securities (agency fixed-rate and hybrid adjustable-rate mortgage pass-throughs), asset-backed securities, and commercial mortgage-backed securities. You cannot invest directly in an index |
| | | | | | |
| Letter to shareholders (unaudited) | | Wells Fargo Income Funds | | | 3 | |
risk-averse and hold less inventory. Meanwhile, corporate debt issuance has spiked as companies finance themselves at record-low yields, bond mutual funds hold larger amounts of this new debt supply, trading volumes are lower, and large-size trades are more difficult to execute. However, fixed-income markets appeared to function well over the past year with sufficient liquidity.
Don’t let short-term uncertainty derail long-term investment goals.
Periods of uncertainty can present challenges, but experience has taught us that maintaining long-term investment goals can be an effective way to plan for the future. To help you create a sound strategy based on your personal goals and risk tolerance, Wells Fargo Funds offers more than 100 mutual funds spanning a wide range of asset classes and investment styles. Although diversification cannot guarantee an investment profit or prevent losses, we believe it can be an effective way to manage investment risk and potentially smooth out overall portfolio performance. We encourage investors to know their investments and to understand that appropriate levels of risk-taking may unlock opportunities.
Thank you for choosing to invest in Wells Fargo Funds. We appreciate your confidence in us and remain committed to helping you meet your financial needs.
Sincerely,

Karla M. Rabusch
President
Wells Fargo Funds
Periods of uncertainty can present challenges, but experience has taught us that maintaining long-term investment goals can be an effective way to plan for the future.
Notice to shareholders
British Exit from European Union (“Brexit”)
On June 23, 2016, the United Kingdom (UK) voted to leave the European Union (EU). It is expected that the UK’s exit from the EU will take place within two years after giving formal notice to the EU of its intention to withdraw; however, the exact timeframe is unknown. There is considerable uncertainty about how the UK exit from the EU will be conducted, how negotiations of necessary treaties and trade agreements will proceed or how the financial markets will react. In addition, it is not yet known whether Brexit will increase the likelihood of other countries seeking to depart the EU. Immediately following the vote, markets in the UK, Europe and the world were negatively impacted. In light of the uncertainties surrounding the impact of Brexit on the broader global economy, the negative impact could be significant, potentially resulting in increased volatility and illiquidity and lower economic growth for companies that rely significantly on Europe for their business activities and revenues. Any further exits from the EU, or the possibility of such exits, would likely cause additional market disruption globally and introduce new legal and regulatory uncertainties.
For further information about your Fund, contact your investment professional, visit our website at wellsfargofunds.com, or call us directly at 1-800-222-8222. We are available 24 hours a day, 7 days a week.
| | | | |
| 4 | | Wells Fargo Income Funds | | Performance highlights (unaudited) |
Wells Fargo Core Bond Fund1
Investment objective
The Fund seeks total return, consisting of income and capital appreciation.
Manager
Wells Fargo Funds Management, LLC
Subadviser for the affiliated master portfolio
Wells Capital Management Incorporated
Portfolio managers
Troy Ludgood
Thomas O’Connor, CFA®
Average annual total returns (%) as of May 31, 20162
| | | | | | | | | | | | | | | | | | | | | | | | | | | | | | | | | | |
| | | | | Including sales charge | | | Excluding sales charge | | | Expense ratios3 (%) | |
| | | Inception date | | 1 year | | | 5 year | | | 10 year | | | 1 year | | | 5 year | | | 10 year | | | Gross | | | Net4 | |
| Class A (MBFAX) | | 10-31-2001 | | | (2.24 | ) | | | 2.52 | | | | 4.81 | | | | 2.36 | | | | 3.47 | | | | 5.29 | | | | 0.85 | | | | 0.78 | |
| Class B (MBFBX)* | | 10-31-2001 | | | (3.40 | ) | | | 2.35 | | | | 4.71 | | | | 1.60 | | | | 2.71 | | | | 4.71 | | | | 1.60 | | | | 1.53 | |
| Class C (MBFCX) | | 10-31-2001 | | | 0.61 | | | | 2.70 | | | | 4.47 | | | | 1.61 | | | | 2.70 | | | | 4.47 | | | | 1.60 | | | | 1.53 | |
| Class R (WTRRX) | | 7-9-2010 | | | – | | | | – | | | | – | | | | 2.13 | | | | 3.23 | | | | 5.02 | | | | 1.10 | | | | 1.03 | |
| Class R4 (MBFRX) | | 11-30-2012 | | | – | | | | – | | | | – | | | | 2.65 | | | | 3.75 | | | | 5.57 | | | | 0.62 | | | | 0.52 | |
| Class R6 (WTRIX) | | 11-30-2012 | | | – | | | | – | | | | – | | | | 2.81 | | | | 3.89 | | | | 5.69 | | | | 0.47 | | | | 0.37 | |
| Administrator Class (MNTRX) | | 6-30-1997 | | | – | | | | – | | | | – | | | | 2.47 | | | | 3.58 | | | | 5.40 | | | | 0.79 | | | | 0.70 | |
| Institutional Class (MBFIX) | | 10-31-2001 | | | – | | | | – | | | | – | | | | 2.76 | | | | 3.86 | | | | 5.68 | | | | 0.52 | | | | 0.42 | |
| Barclays U.S. Aggregate Bond Index5 | | – | | | – | | | | – | | | | – | | | | 2.99 | | | | 3.33 | | | | 4.97 | | | | – | | | | – | |
| * | | Class B shares are closed to investment, except in connection with the reinvestment of any distributions and permitted exchanges. |
Figures quoted represent past performance, which is no guarantee of future results, and do not reflect taxes that a shareholder may pay on fund distributions or the redemption of fund shares. Investment return and principal value of an investment will fluctuate so that an investor’s shares, when redeemed, may be worth more or less than their original cost. Performance shown without sales charges would be lower if sales charges were reflected. Current performance may be lower or higher than the performance data quoted, which assumes the reinvestment of dividends and capital gains. Current month-end performance is available on the Fund’s website, wellsfargofunds.com.
Index returns do not include transaction costs associated with buying and selling securities, any mutual fund fees or expenses, or any taxes. It is not possible to invest directly in an index.
For Class A shares, the maximum front-end sales charge is 4.50%. For Class B shares, the maximum contingent deferred sales charge is 5.00%. For Class C shares, the maximum contingent deferred sales charge is 1.00%. Performance including a contingent deferred sales charge assumes the sales charge for the corresponding time period. Class R, Class R4, Class R6, Administrator Class and Institutional Class shares are sold without a front-end sales charge or contingent deferred sales charge.
Bond values fluctuate in response to the financial condition of individual issuers, general market and economic conditions, and changes in interest rates. Changes in market conditions and government policies may lead to periods of heightened volatility in the bond market and reduced liquidity for certain bonds held by the Fund. In general, when interest rates rise, bond values fall and investors may lose principal value. Interest-rate changes and their impact on the Fund and its share price can be sudden and unpredictable. The use of derivatives may reduce returns and/or increase volatility. Certain investment strategies tend to increase the total risk of an investment (relative to the broader market). Securities issued by U.S. government agencies or government-sponsored entities may not be guaranteed by the U.S. Treasury. The Fund is exposed to foreign investment risk and mortgage- and asset-backed securities risk. Consult the Fund’s prospectus for additional information on these and other risks.
Please see footnotes on page 5.
| | | | | | |
| Performance highlights (unaudited) | | Wells Fargo Income Funds | | | 5 | |
Wells Fargo Core Bond Fund (continued)
|
| Growth of $10,000 investment as of May 31, 20166 |
|
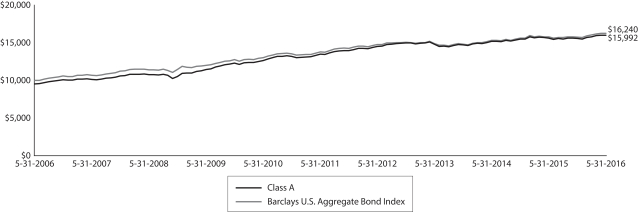 |
| 1 | The Fund is a gateway feeder fund that invests all of its assets in a single affiliated master portfolio of the Wells Fargo Master Trust with a substantially similar investment objective and substantially similar investment strategies. References to the investment activities of the Fund are intended to refer to the investment activities of the affiliated master portfolio in which it invests. |
| 2 | Historical performance shown for Class R shares prior to their inception reflects the performance of Administrator Class shares, adjusted to reflect the higher expenses applicable to Class R shares. Historical performance shown for Class R4 shares prior to their inception reflects the performance of Institutional Class shares, adjusted to reflect the higher expenses applicable to Class R4 shares. Historical performance shown for Class R6 shares prior to their inception reflects the performance of Institutional Class shares and includes the higher expenses applicable to Institutional Class shares. If these expenses had not been included, returns would be higher. |
| 3 | Reflects the expense ratios as stated in the most recent prospectuses. The expense ratios shown are subject to change and may differ from the annualized expense ratios shown in the financial highlights of this report. |
| 4 | The manager has contractually committed through September 30, 2016, to waive fees and/or reimburse expenses to the extent necessary to cap the Fund’s Total Annual Fund Operating Expenses After Fee Waiver at the amounts shown. After this time, the cap may be increased or the commitment to maintain the cap may be terminated only with the approval of the Board of Trustees. Brokerage commissions, stamp duty fees, interest, taxes, acquired fund fees and expenses, and extraordinary expenses are excluded from the expense cap. Net expenses from the affiliated master portfolio are included in the cap. Without this cap, the Fund’s returns would have been lower. |
| 5 | The Barclays U.S. Aggregate Bond Index is a broad-based benchmark that measures the investment-grade, U.S. dollar–denominated, fixed-rate taxable bond market, including Treasuries, government-related and corporate securities, mortgage-backed securities (agency fixed-rate and hybrid adjustable-rate mortgage pass-throughs), asset-backed securities, and commercial mortgage-backed securities. You cannot invest directly in an index |
| 6 | The chart compares the performance of Class A shares for the most recent ten years with the Barclays U.S. Aggregate Bond Index. The chart assumes a hypothetical $10,000 investment in Class A shares and reflects all operating expenses and assumes the maximum initial sales charge of 4.50%. |
| 7 | The ten largest holdings, excluding cash and cash equivalents, are calculated based on the value of the securities of the affiliated master portfolio allocable to the Fund divided by the total net assets of the Fund. Holdings are subject to change and may have changed since the date specified. |
| 8 | Amounts represent the portfolio allocation of the affiliated master portfolio which are calculated based on the total long-term investments of the affiliated master portfolio. These amounts are subject to change and may have changed since the date specified. |
| | | | |
| 6 | | Wells Fargo Income Funds | | Performance highlights (unaudited) |
Wells Fargo Core Bond Fund (continued)
MANAGER’S DISCUSSION
Fund highlights
| n | | The Fund underperformed its benchmark, the Barclays U.S. Aggregate Bond Index,5 for the 12-month period that ended May 31, 2016. |
| n | | Detractors from performance included positions in Federal Family Education Loan Program (FFELP) student loan floating-rate bonds. In credit, positioning in the pipelines, energy, and consumer cyclical subsectors detracted. An overweight to commercial mortgage-backed securities (CMBS) also held back results. |
| n | | Contributors to performance included security selection within the credit sector, particularly in the technology, consumer noncyclical, and telecom subsectors, along with security selection and active relative-value trading within fixed-rate agency mortgages. |
| n | | The Fund does not invest by anticipating interest-rate movements because we seek to avoid macro bets; therefore, duration had a neutral effect on performance. Instead, the Fund seeks to capture relative value with bottom-up security selection. |
Macro events, accommodative monetary policy, and oil-price swings set the stage for fixed income.
The period began with Greek drama firmly taking center stage. Greek voters surprised the markets in a snap referendum by voting overwhelmingly to reject European austerity. As the Greek crisis abated, new concerns emerged for investors, most notably the dramatic sell-off in Chinese equities, which heightened concerns that China’s growth was slowing rapidly and a hard economic landing was becoming more likely.
In December 2015, the long-awaited U.S. Federal Reserve (Fed) rate hike finally arrived at the December 15 Federal Open Market Committee meeting. The federal funds target rate was increased for the first time in more than nine years, and Fed Chair Janet Yellen emphasized that suggested future rate hikes would be gradual and data dependent. Although the rate move was well telegraphed and expected by the market, risk assets stumbled following the announcement, spooked by a path of future interest-rate projections. Adding fuel to the sell-off were investors’ concerns over oil and other industrial commodities making fresh lows for the year. A late year-end rally repaired some of the damage, but uncertainty loomed.
We believe in bottom-up security selection rather than top-down macro bets.
Consistent with our bottom-up process, we maintained a neutral duration. We ended the period with a slight risk-adjusted overweight to mortgage-backed securities and CMBS compared with the benchmark because we believed valuations were close to fair. We maintained an overweight to credit because issuance remained strong and provided security selection opportunities. Notable contributors to performance for the period included security selection within the technology, consumer noncyclical, and telecom sectors. Positioning in the pipeline, energy, and consumer cyclical subsectors detracted.
In asset-backed securities (ABS), we maintained a risk-adjusted overweight that contributed to performance because fundamental valuations looked attractive and primary and secondary market technicals provided a tailwind. The Fund’s holdings of FFELP debt, however, detracted from performance. Student loan ABS remained under pressure because Moody’s Investors Service has placed a number of student loans originated under the FFELP on review for a downgrade due to an elevated risk of low payment rates, driven by a combination of low rates of voluntary prepayments, persistently high volumes of loans in deferment and forbearance, and the growing popularity of the income-based repayment and extended repayment programs.
We continue to focus on risk management and seek relative-value opportunities.
As was the case in the first quarter of 2015, U.S. gross domestic product in the first quarter of 2016 came in below expectations of 1.0% at 0.8% annualized, down from an anemic 1.4% in the fourth quarter of 2015. Employment in the U.S. continued to improve, with the unemployment rate falling to 5.0% as of the nonfarm payroll release in early May 2015.
Please see footnotes on page 5.
| | | | | | |
| Performance highlights (unaudited) | | Wells Fargo Income Funds | | | 7 | |
Wells Fargo Core Bond Fund (continued)
European officials maintained an accommodative stance as European Central Bank (ECB) President Mario Draghi delivered more on the stimulus front, announcing nonfinancial corporate bonds would be included in ECB purchase programs. All eyes will continue to be on the Fed as it remains data dependent going forward.
We believe fixed-income markets will provide plenty of opportunities as we move through the balance of 2016. Increased volatility and a continued strong corporate issuance will provide opportunity for us to add value through our bottom-up, active, relative-value investment management approach, where we remain particularly focused on risk management. We continue to focus on bottom-up security selection and intend to take advantage of relative-value dislocations as they arise.
| | | | |
| Ten largest holdings (%) as of May 31, 20167 | |
U.S. Treasury Note, 1.38%, 1-31-2021 | | | 4.80 | |
U.S. Treasury Note, 0.88%, 5-15-2019 | | | 3.73 | |
U.S. Treasury Note, 0.88%, 4-15-2019 | | | 3.59 | |
U.S. Treasury Note, 0.88%, 3-31-2018 | | | 3.36 | |
U.S. Treasury Note, 0.75%, 1-31-2018 | | | 2.69 | |
U.S. Treasury Note, 1.38%, 5-31-2021 | | | 2.49 | |
GNMA, 3.50%, 8-23-2046 | | | 2.33 | |
U.S. Treasury Bond, 2.50%, 2-15-2046 | | | 2.17 | |
GNMA, 3.00%, 8-23-2046 | | | 1.79 | |
FHLMC, 3.50%, 8-16-2046 | | | 1.62 | |
|
| Portfolio allocation as of May 31, 20168 |
|
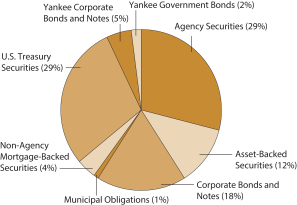 |
Please see footnotes on page 5.
| | | | |
| 8 | | Wells Fargo Income Funds | | Performance highlights (unaudited) |
Wells Fargo Real Return Fund1
Investment objective
The Fund seeks returns that exceed the rate of inflation over the long-term.
Manager
Wells Fargo Funds Management, LLC
Subadviser for the affiliated master portfolio
Wells Capital Management Incorporated
Portfolio managers
Kandarp R. Acharya, CFA®, FRM
Michael Bradshaw, CFA®
Christian L. Chan, CFA®
Ann M. Miletti
Jay N. Mueller, CFA®
Thomas M. Prince, CFA®
Dale Winner, CFA®
Average annual total returns (%) as of May 31, 2016
| | | | | | | | | | | | | | | | | | | | | | | | | | | | | | | | | | |
| | | | | Including sales charge | | | Excluding sales charge | | | Expense ratios2 (%) | |
| | | Inception date | | 1 year | | | 5 year | | | 10 year | | | 1 year | | | 5 year | | | 10 year | | | Gross | | | Net3 | |
| Class A (IPBAX) | | 2-28-2003 | | | (3.54 | ) | | | 1.20 | | | | 3.54 | | | | 1.01 | | | | 2.13 | | | | 4.02 | | | | 1.45 | | | | 0.85 | |
| Class B (IPBBX)* | | 2-28-2003 | | | (4.69 | ) | | | 1.00 | | | | 3.50 | | | | 0.31 | | | | 1.38 | | | | 3.50 | | | | 2.20 | | | | 1.60 | |
| Class C (IPBCX) | | 2-28-2003 | | | (0.79 | ) | | | 1.37 | | | | 3.27 | | | | 0.21 | | | | 1.37 | | | | 3.27 | | | | 2.20 | | | | 1.60 | |
| Administrator Class (IPBIX) | | 2-28-2003 | | | – | | | | – | | | | – | | | | 1.21 | | | | 2.38 | | | | 4.31 | | | | 1.39 | | | | 0.60 | |
| Barclays U.S. TIPS Index4 | | – | | | – | | | | – | | | | – | | | | 1.23 | | | | 2.38 | | | | 4.56 | | | | – | | | | – | |
| Consumer Price Index5 | | – | | | – | | | | – | | | | – | | | | 1.02 | | | | 1.23 | | | | 1.72 | | | | – | | | | – | |
| * | | Class B shares are closed to investment, except in connection with the reinvestment of any distributions and permitted exchanges. |
Figures quoted represent past performance, which is no guarantee of future results, and do not reflect taxes that a shareholder may pay on fund distributions or the redemption of fund shares. Investment return and principal value of an investment will fluctuate so that an investor’s shares, when redeemed, may be worth more or less than their original cost. Performance shown without sales charges would be lower if sales charges were reflected. Current performance may be lower or higher than the performance data quoted, which assumes the reinvestment of dividends and capital gains. Current month-end performance is available on the Fund’s website, wellsfargofunds.com.
Index returns do not include transaction costs associated with buying and selling securities, any mutual fund fees or expenses, or any taxes. It is not possible to invest directly in an index.
For Class A shares, the maximum front-end sales charge is 4.50%. For Class B shares, the maximum contingent deferred sales charge is 5.00%. For Class C shares, the maximum contingent deferred sales charge is 1.00%. Performance including a contingent deferred sales charge assumes the sales charge for the corresponding time period. Administrator Class shares are sold without a front-end sales charge or contingent deferred sales charge.
Bond values fluctuate in response to the financial condition of individual issuers, general market and economic conditions, and changes in interest rates. Changes in market conditions and government policies may lead to periods of heightened volatility in the bond market and reduced liquidity for certain bonds held by the Fund. In general, when interest rates rise, bond values fall and investors may lose principal value. Interest-rate changes and their impact on the fund and its share price can be sudden and unpredictable. Stock values fluctuate in response to the activities of individual companies and general market and economic conditions. High-yield securities have a greater risk of default and tend to be more volatile than higher-rated debt securities. Loans are subject to risks similar to those associated with other below investment-grade bond investments, such as credit risk (for example, risk of issuer default), below-investment-grade bond risk (for example, risk of greater volatility in value), and risk that the loan may become illiquid or difficult to price.
The use of derivatives may reduce returns and/or increase volatility. Foreign investments are especially volatile and can rise or fall dramatically due to differences in the political and economic conditions of the host country. These risks are generally intensified in emerging markets. The Fund is exposed to mortgage- and asset-backed securities risk and small-company securities risk. Securities issued by U.S. government agencies or government-sponsored entities may not be guaranteed by the U.S. Treasury. Consult the Fund’s prospectus for additional information on these and other risks.
Please see footnotes on page 9.
| | | | | | |
| Performance highlights (unaudited) | | Wells Fargo Income Funds | | | 9 | |
Wells Fargo Real Return Fund (continued)
|
| Growth of $10,000 investment as of May 31, 20166 |
|
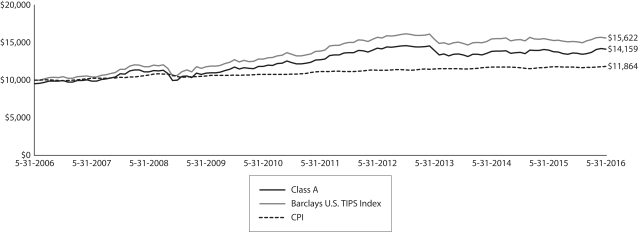 |
| 1 | The Fund is a gateway feeder fund that invests all of its assets in a single affiliated master portfolio of the Wells Fargo Master Trust with a substantially similar investment objective and substantially similar investment strategies. References to the investment activities of the Fund are intended to refer to the investment activities of the affiliated master portfolio in which it invests. |
| 2 | Reflects the expense ratios as stated in the most recent prospectuses. The expense ratios shown are subject to change and may differ from the annualized expense ratios shown in the financial highlights of this report. |
| 3 | The manager has contractually committed through September 30, 2016, to waive fees and/or reimburse expenses to the extent necessary to cap the Fund’s Total Annual Fund Operating Expenses After Fee Waiver at the amounts shown. After this time, the cap may be increased or the commitment to maintain the cap may be terminated only with the approval of the Board of Trustees. Brokerage commissions, stamp duty fees, interest, taxes, acquired fund fees and expenses, and extraordinary expenses are excluded from the expense cap. Net expenses from the affiliated master portfolio are included in the cap. Without this cap, the Fund’s returns would have been lower. |
| 4 | The Barclays U.S. Treasury Inflation-Protected Securities (TIPS) Index is an index of inflation indexed linked U.S. Treasury securities. You cannot invest directly in an index. |
| 5 | The Consumer Price Index (CPI) for All Urban Consumers in U.S. All Items is published monthly by the U.S. government as an indicator of changes in price levels (or inflation) paid by urban consumers for a representative basket of goods and services. You cannot invest directly in an index. |
| 6 | The chart compares the performance of Class A shares since inception with the Barclays U.S. TIPS Index and CPI. The chart assumes a hypothetical $10,000 investment in Class A shares and reflects all operating expenses and assumes the maximum initial sales charge of 4.50%. |
| 7 | The Morgan Stanley Capital International (MSCI) All Country World Index (ACWI) Index (Net) is a free-float-adjusted market-capitalization-weighted index that is designed to measure the equity market performance of developed and emerging markets. The MSCI ACWI Index (Net) consists of 46 country indexes comprising 23 developed and 23 emerging markets country indexes. The developed markets country indexes included are Australia, Austria, Belgium, Canada, Denmark, Finland, France, Germany, Hong Kong, Ireland, Israel, Italy, Japan, the Netherlands, New Zealand, Norway, Portugal, Singapore, Spain, Sweden, Switzerland, the United Kingdom, and the United States. The emerging markets country indexes included are Brazil, Chile, China, Colombia, Czech Republic, Egypt, Greece, Hungary, India, Indonesia, Korea, Malaysia, Mexico, Peru, the Philippines, Poland, Qatar, Russia, South Africa, Taiwan, Thailand, Turkey, and United Arab Emirates. Source: MSCI. MSCI makes no express or implied warranties or representations and shall have no liability whatsoever with respect to any MSCI data contained herein. The MSCI data may not be further redistributed or used as a basis for other indexes or any securities or financial products. This report is not approved, reviewed, or produced by MSCI. You cannot invest directly in an index. |
| 8 | The ten largest holdings, excluding cash and cash equivalents, are calculated based on the value of the securities of the affiliated master portfolio allocable to the Fund divided by the total net assets of the Fund. Holdings are subject to change and may have changed since the date specified. |
| 9 | The S&P 500 Index consists of 500 stocks chosen for market size, liquidity, and industry group representation. It is a market-value-weighted index with each stock’s weight in the index proportionate to its market value. You cannot invest directly in an index. |
| 10 | The MSCI Europe, Australasia, Far East (EAFE) Index (Net) is a free-float-adjusted market-capitalization-weighted index that is designed to measure the equity market performance of developed markets, excluding the U.S. and Canada. The MSCI EAFE Index (Net) consists of the following 21 developed markets country indexes: Australia, Austria, Belgium, Denmark, Finland, France, Germany, Hong Kong, Ireland, Israel, Italy, Japan, the Netherlands, New Zealand, Norway, Portugal, Singapore, Spain, Sweden, Switzerland, and the United Kingdom. You cannot invest directly in an index. |
| 11 | The MSCI Emerging Markets (EM) Index (Net) is a free-float-adjusted market-capitalization-weighted index that is designed to measure the equity market performance of emerging markets. The MSCI EM Index (Net) consists of the following 23 emerging markets country indexes: Brazil, Chile, China, Colombia, Czech Republic, Egypt, Greece, Hungary, India, Indonesia, Korea, Malaysia, Mexico, Peru, the Philippines, Poland, Qatar, Russia, South Africa, Taiwan, Thailand, Turkey, and United Arab Emirates. You cannot invest directly in an index. |
| 12 | Amounts represent the effective maturity of the affiliated master portfolio which are calculated based on the total fixed-income investments of the affiliated master portfolio. These amounts are subject to change and may have changed since the date specified. |
| | | | |
| 10 | | Wells Fargo Income Funds | | Performance highlights (unaudited) |
Wells Fargo Real Return Fund (continued)
MANAGER’S DISCUSSION
Fund highlights
| n | | The Fund underperformed its benchmarks, the Barclays U.S. Treasury Inflation-Protected Securities Index,4 and the Consumer Price Index,5 for the 12-month period that ended May 31, 2016. |
| n | | Exposure to global stocks detracted from the relative performance of the Fund amid a sharp sell-off in overseas markets during the period. |
| n | | Allocations to real estate investment trusts (REITs) and gold-mining stocks contributed positively to the relative performance of the Fund. |
Weakness in China, coupled with wild swings in oil prices, drove volatility higher during the 12-month period.
The 12-month period was marked by several periods of elevated volatility, sharp reversals in global equity markets, and a divergence in policies among global central banks. After reaching their all-time highs in mid-2015, stock prices declined sharply in August 2015 amid turmoil in Chinese equities and the devaluation of the yuan. Fears of a global slowdown sent several equity markets into correction territory for the first time since the financial crisis. Meanwhile, the Volatility Index, which is a forward-looking measure of market volatility, soared to levels last seen in 2011 when U.S. government debt was downgraded. Markets recovered in the fourth quarter of 2015 as contagion fears abated and a strengthening U.S. job market buoyed investor sentiment.
The second round of heightened volatility occurred in early 2016, right on the heels of the U.S. Federal Reserve’s first rate hike since 2006. Although the event itself initially had a muted impact on financial markets, the prospect of tighter U.S. monetary conditions in the face of renewed turmoil in China and another sharp fall in the price of oil below $30 per barrel rekindled concerns about the fragility of global macroeconomic conditions. The resulting sell-off was steep and marked the worst start to the year in recent history. Prices on risk assets such as stocks, high-yield bonds, and emerging markets currencies fell precipitously, as did inflation expectations. Long-term U.S. Treasury bonds and gold, on the other hand, benefited from the overall flight to safety. From year-end 2015 to the low point in mid-February 2016, global stock markets fell 11.4% (as measured by the Morgan Stanley Capital International (MSCI) All Country World Index (ACWI) Index (Net))7 while gold prices and long-term U.S. Treasury bonds gained 10.5% and 17.7%, respectively. Markets reversed course in February and March as investors shifted into a risk-taking mode, in large part due to a rebound in oil prices and a renewed sense of optimism surrounding the willingness of central banks to provide additional stimulus.
| | | | |
| Ten largest holdings (%) as of May 31, 20168 | |
TIPS, 0.13%, 4-15-2020 | | | 6.05 | |
TIPS, 0.63%, 1-15-2026 | | | 3.16 | |
TIPS, 0.13%, 7-15-2024 | | | 2.91 | |
TIPS, 0.38%, 7-15-2025 | | | 2.84 | |
TIPS, 0.63%, 1-15-2024 | | | 2.80 | |
TIPS, 0.38%, 7-15-2023 | | | 2.73 | |
TIPS, 0.13%, 1-15-2023 | | | 2.69 | |
TIPS, 0.13%, 7-15-2022 | | | 2.61 | |
TIPS, 0.13%, 4-15-2019 | | | 2.47 | |
TIPS, 0.25%, 1-15-2025 | | | 2.41 | |
The Fund uses a multi-asset-class strategy to target inflation protection.
During the 12-month period, we maintained allocations to Treasury Inflation-Protected Securities (TIPS) as well as other inflation-sensitive sectors, such as REITs, short-term high-yield bonds, and inflation-sensitive equities. We used this multi-asset-class strategy to target greater inflation protection and real returns than a traditional inflation-hedged strategy while seeking to achieve similar levels of volatility.
Exposure to global stocks detracted from the relative performance of the Fund amid a sharp sell-off in overseas markets during the period. While U.S. equity markets posted slightly positive gains, international developed
and emerging markets stocks ended the period firmly in negative territory. For the 12-month period, large-cap U.S. stocks (as measured by the S&P 500 Index)9 gained 1.7% while international developed and emerging markets stocks (as measured by the MSCI Europe, Australasia, Far East (EAFE) Index (Net)10 and the MSCI Emerging Markets (EM) Index (Net),11) lost 9.7% and 17.6%, respectively. Meanwhile, allocations to REITs and gold-mining stocks contributed positively to the relative performance of the Fund.
Please see footnotes on page 9.
| | | | | | |
| Performance highlights (unaudited) | | Wells Fargo Income Funds | | | 11 | |
Wells Fargo Real Return Fund (continued)
|
| Effective maturity distribution as of May 31, 201612 |
|
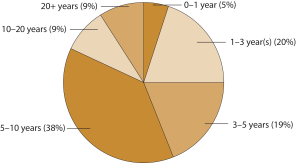
|
We continue to find TIPS and inflation-sensitive equities attractive relative to nominal Treasury bonds and notes.
We expect the European Central Bank and the Bank of Japan to maintain accommodative monetary policies in order to combat subdued inflationary pressures and bolster their respective economies. Meanwhile, U.S. economic growth has shown signs of resilience as evidenced by a steadily declining unemployment rate and rising consumer confidence.
With bond yields hovering near the all-time lows reached during the height of the European debt crisis, our view is that there is a fair amount of downside risk to U.S. government bonds should there be an uptick in inflationary pressures. In the current macroeconomic environment, where yields and inflation expectations remain depressed by historical standards, we continue to find value in TIPS, shorter-term high-yield bonds, and inflation-sensitive global stocks.
Please see footnotes on page 9.
| | | | |
| 12 | | Wells Fargo Income Funds | | Fund expenses (unaudited) |
As a shareholder of the Fund, you incur two types of costs: (1) transaction costs, including sales charges (loads) on purchase payments and contingent deferred sales charges (if any) on redemptions and (2) ongoing costs, including management fees, distribution (12b-1) and/or shareholder servicing fees, and other Fund expenses. This example is intended to help you understand your ongoing costs (in dollars) of investing in the Fund and to compare these costs with the ongoing costs of investing in other mutual funds.
The example is based on an investment of $1,000 invested at the beginning of the six-month period and held for the entire period from December 1, 2015 to May 31, 2016.
Actual expenses
The “Actual” line of the table below provides information about actual account values and actual expenses. You may use the information in this line, together with the amount you invested, to estimate the expenses that you paid over the period. Simply divide your account value by $1,000 (for example, an $8,600 account value divided by $1,000 = 8.6), then multiply the result by the number in the “Actual” line under the heading entitled “Expenses paid during period” for your applicable class of shares to estimate the expenses you paid on your account during this period.
Hypothetical example for comparison purposes
The “Hypothetical” line of the table below provides information about hypothetical account values and hypothetical expenses based on the Fund’s actual expense ratio and an assumed rate of return of 5% per year before expenses, which is not the Fund’s actual return. The hypothetical account values and expenses may not be used to estimate the actual ending account balance or expenses you paid for the period. You may use this information to compare the ongoing costs of investing in the Fund and other funds. To do so, compare this 5% hypothetical example with the 5% hypothetical examples that appear in the shareholder reports of the other funds.
Please note that the expenses shown in the table are meant to highlight your ongoing costs only and do not reflect any transactional costs, such as sales charges (loads) and contingent deferred sales charges. Therefore, the “Hypothetical” line of the table is useful in comparing ongoing costs only and will not help you determine the relative total costs of owning different funds. In addition, if these transactional costs were included, your costs would have been higher.
| | | | | | | | | | | | | | | | |
| Wells Fargo Core Bond Fund | | Beginning
account value
12-1-2015 | | | Ending
account value
5-31-2016 | | | Expenses
paid during
the period1 | | | Net annualized
expense ratio | |
Class A | | | | | | | | | | | | | | | | |
Actual | | $ | 1,000.00 | | | $ | 1,026.53 | | | $ | 3.95 | | | | 0.78 | % |
Hypothetical (5% return before expenses) | | $ | 1,000.00 | | | $ | 1,021.10 | | | $ | 3.94 | | | | 0.78 | % |
Class B | | | | | | | | | | | | | | | | |
Actual | | $ | 1,000.00 | | | $ | 1,022.75 | | | $ | 7.74 | | | | 1.53 | % |
Hypothetical (5% return before expenses) | | $ | 1,000.00 | | | $ | 1,017.35 | | | $ | 7.72 | | | | 1.53 | % |
Class C | | | | | | | | | | | | | | | | |
Actual | | $ | 1,000.00 | | | $ | 1,022.89 | | | $ | 7.74 | | | | 1.53 | % |
Hypothetical (5% return before expenses) | | $ | 1,000.00 | | | $ | 1,017.35 | | | $ | 7.72 | | | | 1.53 | % |
Class R | | | | | | | | | | | | | | | | |
Actual | | $ | 1,000.00 | | | $ | 1,025.73 | | | $ | 5.22 | | | | 1.03 | % |
Hypothetical (5% return before expenses) | | $ | 1,000.00 | | | $ | 1,019.85 | | | $ | 5.20 | | | | 1.03 | % |
Class R4 | | | | | | | | | | | | | | | | |
Actual | | $ | 1,000.00 | | | $ | 1,028.36 | | | $ | 2.64 | | | | 0.52 | % |
Hypothetical (5% return before expenses) | | $ | 1,000.00 | | | $ | 1,022.40 | | | $ | 2.63 | | | | 0.52 | % |
Class R6 | | | | | | | | | | | | | | | | |
Actual | | $ | 1,000.00 | | | $ | 1,028.32 | | | $ | 1.88 | | | | 0.37 | % |
Hypothetical (5% return before expenses) | | $ | 1,000.00 | | | $ | 1,023.15 | | | $ | 1.87 | | | | 0.37 | % |
Please see footnote on page 13.
| | | | | | |
| Fund expenses (unaudited) | | Wells Fargo Income Funds | | | 13 | |
| | | | | | | | | | | | | | | | |
| Wells Fargo Core Bond Fund (continued) | | Beginning
account value
12-1-2015 | | | Ending
account value
5-31-2016 | | | Expenses
paid during
the period1 | | | Net annualized
expense ratio | |
Administrator Class | | | | | | | | | | | | | | | | |
Actual | | $ | 1,000.00 | | | $ | 1,027.42 | | | $ | 3.55 | | | | 0.70 | % |
Hypothetical (5% return before expenses) | | $ | 1,000.00 | | | $ | 1,021.50 | | | $ | 3.54 | | | | 0.70 | % |
Institutional Class | | | | | | | | | | | | | | | | |
Actual | | $ | 1,000.00 | | | $ | 1,028.88 | | | $ | 2.13 | | | | 0.42 | % |
Hypothetical (5% return before expenses) | | $ | 1,000.00 | | | $ | 1,022.90 | | | $ | 2.12 | | | | 0.42 | % |
| Wells Fargo Real Return Fund | | | | | | | | | | | | |
Class A | | | | | | | | | | | | | | | | |
Actual | | $ | 1,000.00 | | | $ | 1,043.22 | | | $ | 4.34 | | | | 0.85 | % |
Hypothetical (5% return before expenses) | | $ | 1,000.00 | | | $ | 1,020.75 | | | $ | 4.29 | | | | 0.85 | % |
Class B | | | | | | | | | | | | | | | | |
Actual | | $ | 1,000.00 | | | $ | 1,039.55 | | | $ | 8.16 | | | | 1.60 | % |
Hypothetical (5% return before expenses) | | $ | 1,000.00 | | | $ | 1,017.00 | | | $ | 8.07 | | | | 1.60 | % |
Class C | | | | | | | | | | | | | | | | |
Actual | | $ | 1,000.00 | | | $ | 1,038.45 | | | $ | 8.15 | | | | 1.60 | % |
Hypothetical (5% return before expenses) | | $ | 1,000.00 | | | $ | 1,017.00 | | | $ | 8.07 | | | | 1.60 | % |
Administrator Class | | | | | | | | | | | | | | | | |
Actual | | $ | 1,000.00 | | | $ | 1,044.34 | | | $ | 3.07 | | | | 0.60 | % |
Hypothetical (5% return before expenses) | | $ | 1,000.00 | | | $ | 1,022.00 | | | $ | 3.03 | | | | 0.60 | % |
| 1 | Expenses paid is equal to the annualized expense ratio of each class multiplied by the average account value over the period, multiplied by the number of days in the most recent fiscal half-year divided by the number of days in the fiscal year (to reflect the one-half-year period). |
| | | | |
| 14 | | Wells Fargo Income Funds | | Portfolios of investments—May 31, 2016 |
CORE BOND FUND
| | | | | | | | | | |
| Security name | | | | | | | | Value | |
| | | | |
Investment Companies: 99.94% | | | | | | | | | | |
| | | | |
| Affiliated Master Portfolios: 99.94% | | | | | | | | | | |
Wells Fargo Core Bond Portfolio | | | | | | | | $ | 3,905,568,217 | |
| | | | | | | | | | |
| | | | |
Total Investment Companies (Cost $3,877,624,021) | | | | | | | | | 3,905,568,217 | |
| | | | | | | | | | |
| | | | | | | | |
| Total investments in securities (Cost $3,877,624,021) * | | | 99.94 | % | | | 3,905,568,217 | |
Other assets and liabilities, net | | | 0.06 | | | | 2,470,823 | |
| | | | | | | | |
| Total net assets | | | 100.00 | % | | $ | 3,908,039,040 | |
| | | | | | | | |
| * | Cost for federal income tax purposes is $3,881,216,516 and unrealized gains (losses) consists of: |
| | | | |
Gross unrealized gains | | $ | 24,351,701 | |
Gross unrealized losses | | | 0 | |
| | | | |
Net unrealized gains | | $ | 24,351,701 | |
REAL RETURN FUND
| | | | | | | | | | |
| Security name | | | | | | | | Value | |
| | | | |
Investment Companies: 99.56% | | | | | | | | | | |
| | | | |
| Affiliated Master Portfolios: 99.56% | | | | | | | | | | |
Wells Fargo Real Return Portfolio | | | | | | | | $ | 45,019,976 | |
| | | | | | | | | | |
| | | | |
Total Investment Companies (Cost $43,936,521) | | | | | | | | | 45,019,976 | |
| | | | | | | | | | |
| | | | | | | | |
| Total investments in securities (Cost $43,936,521) * | | | 99.56 | % | | | 45,019,976 | |
Other assets and liabilities, net | | | 0.44 | | | | 199,399 | |
| | | | | | | | |
| Total net assets | | | 100.00 | % | | $ | 45,219,375 | |
| | | | | | | | |
| * | Cost for federal income tax purposes is $43,877,578 and unrealized gains (losses) consists of: |
| | | | |
Gross unrealized gains | | $ | 1,142,398 | |
Gross unrealized losses | | | 0 | |
| | | | |
Net unrealized gains | | $ | 1,142,398 | |
The accompanying notes are an integral part of these financial statements.
| | | | | | |
| Statements of assets and liabilities—May 31, 2016 | | Wells Fargo Income Funds | | | 15 | |
| | | | | | | | |
| | | Core Bond
Fund | | | Real Return
Fund | |
| | |
Assets | | | | | | | | |
Investment in the affiliated Master Portfolio, at value (see cost below) | | $ | 3,905,568,217 | | | $ | 45,019,976 | |
Receivable for Fund shares sold | | | 12,964,462 | | | | 214,979 | |
Receivable from administrator | | | 0 | | | | 8,340 | |
Prepaid expenses and other assets | | | 120,624 | | | | 27,222 | |
| | | | |
Total assets | | | 3,918,653,303 | | | | 45,270,517 | |
| | | | |
| | |
Liabilities | | | | | | | | |
Dividends payable | | | 1,015,552 | | | | 0 | |
Payable for Fund shares redeemed | | | 8,899,004 | | | | 28,217 | |
Distribution fees payable | | | 46,629 | | | | 3,677 | |
Administration fees payable | | | 214,251 | | | | 0 | |
Shareholder report expenses payable | | | 40,392 | | | | 5,219 | |
Shareholder servicing fees payable | | | 282,997 | | | | 9,661 | |
Accrued expenses and other liabilities | | | 115,438 | | | | 4,368 | |
| | | | |
Total liabilities | | | 10,614,263 | | | | 51,142 | |
| | | | |
Total net assets | | $ | 3,908,039,040 | | | $ | 45,219,375 | |
| | | | |
| | |
NET ASSETS CONSIST OF | | | | | | | | |
Paid-in capital | | $ | 3,900,747,221 | | | $ | 43,990,664 | |
Undistributed net investment income | | | 2,098,037 | | | | 128,869 | |
Accumulated net realized gains (losses) on investments | | | (22,750,414 | ) | | | 16,387 | |
Net unrealized gains on investments | | | 27,944,196 | | | | 1,083,455 | |
| | | | |
Total net assets | | $ | 3,908,039,040 | | | $ | 45,219,375 | |
| | | | |
| | |
COMPUTATION OF NET ASSET VALUE AND OFFERING PRICE PER SHARE | | | | | | | | |
Net assets – Class A | | $ | 699,273,150 | | | $ | 18,938,223 | |
Shares outstanding – Class A1 | | | 52,654,841 | | | | 1,903,750 | |
Net asset value per share – Class A | | | $13.28 | | | | $9.95 | |
Maximum offering price per share – Class A2 | | | $13.91 | | | | $10.42 | |
Net assets – Class B | | $ | 502,330 | | | $ | 20,856 | |
Shares outstanding – Class B1 | | | 37,948 | | | | 2,135 | |
Net asset value per share – Class B | | | $13.24 | | | | $9.77 | |
Net assets – Class C | | $ | 66,612,481 | | | $ | 5,653,637 | |
Shares outstanding – Class C1 | | | 5,064,124 | | | | 578,598 | |
Net asset value per share – Class C | | | $13.15 | | | | $9.77 | |
Net assets – Class R | | $ | 17,984,874 | | | | N/A | |
Shares outstanding – Class R1 | | | 1,387,080 | | | | N/A | |
Net asset value per share – Class R | | | $12.97 | | | | N/A | |
Net assets – Class R4 | | $ | 41,271,569 | | | | N/A | |
Share outstanding – Class R41 | | | 3,187,357 | | | | N/A | |
Net asset value per share – Class R4 | | | $12.95 | | | | N/A | |
Net assets – Class R6 | | $ | 450,791,171 | | | | N/A | |
Shares outstanding – Class R61 | | | 34,810,671 | | | | N/A | |
Net asset value per share – Class R6 | | | $12.95 | | | | N/A | |
Net assets – Administrator Class | | $ | 529,530,285 | | | $ | 20,606,659 | |
Shares outstanding – Administrator Class1 | | | 40,839,230 | | | | 2,054,281 | |
Net asset value per share – Administrator Class | | | $12.97 | | | | $10.03 | |
Net assets – Institutional Class | | $ | 2,102,073,180 | | | | N/A | |
Shares outstanding – Institutional Class1 | | | 162,355,106 | | | | N/A | |
Net asset value per share – Institutional Class | | | $12.95 | | | | N/A | |
| | |
Investment in the affiliated Master Portfolio, at cost | | $ | 3,877,624,021 | | | $ | 43,936,521 | |
| | | | |
| 1 | Each Fund has an unlimited number of authorized shares. |
| 2 | Maximum offering price is computed as 100/95.50 of net asset value. On investments of $50,000 or more, the offering price is reduced. |
The accompanying notes are an integral part of these financial statements.
| | | | |
| 16 | | Wells Fargo Income Funds | | Statements of operations—year ended May 31, 2016 |
| | | | | | | | |
| | | Core Bond
Fund | | | Real Return
Fund | |
| | |
Investment income | | | | | | | | |
Interest allocated from the affiliated Master Portfolio | | $ | 74,734,498 | | | $ | 548,833 | |
Dividends allocated from the affiliated Master Portfolio* | | | 0 | | | | 153,294 | |
Affiliated income allocated from the affiliated Master Portfolio | | | 496,271 | | | | 1,332 | |
Securities lending income allocated from the affiliated Master Portfolio | | | 124,087 | | | | 7,736 | |
Expenses allocated from the affiliated Master Portfolio | | | (12,367,744 | ) | | | (210,581 | ) |
Waivers allocated from the affiliated Master Portfolio | | | 457,699 | | | | 44,127 | |
| | | | |
Total investment income | | | 63,444,811 | | | | 544,741 | |
| | | | |
| | |
Expenses | | | | | | | | |
Management fee | | | 1,703,243 | | | | 19,014 | |
Administration fees | |
Class A | | | 936,796 | | | | 25,821 | |
Class B | | | 1,496 | | | | 84 | |
Class C | | | 108,638 | | | | 11,615 | |
Class R | | | 26,042 | | | | N/A | |
Class R4 | | | 34,171 | | | | N/A | |
Class R6 | | | 173,888 | | | | N/A | |
Administrator Class | | | 476,870 | | | | 14,577 | |
Institutional Class | | | 1,286,681 | | | | N/A | |
Investor Class | | | 53,448 | 1 | | | N/A | |
Shareholder servicing fees | |
Class A | | | 1,463,744 | | | | 40,345 | |
Class B | | | 2,337 | | | | 131 | |
Class C | | | 169,747 | | | | 18,149 | |
Class R | | | 40,690 | | | | N/A | |
Class R4 | | | 42,713 | | | | N/A | |
Administrator Class | | | 1,190,776 | | | | 35,698 | |
Investor Class | | | 70,326 | 1 | | | N/A | |
Distribution fees | |
Class B | | | 7,012 | | | | 393 | |
Class C | | | 509,240 | | | | 54,445 | |
Class R | | | 40,690 | | | | N/A | |
Custody and accounting fees | | | 129,134 | | | | 3,022 | |
Professional fees | | | 30,035 | | | | 31,388 | |
Registration fees | | | 167,768 | | | | 51,552 | |
Shareholder report expenses | | | 192,624 | | | | 980 | |
Trustees’ fees and expenses | | | 87,410 | | | | 20,122 | |
Other fees and expenses | | | 39,106 | | | | 5,883 | |
| | | | |
Total expenses | | | 8,984,625 | | | | 333,219 | |
Less: Fee waivers and/or expense reimbursements | | | (2,424,877 | ) | | | (158,049 | ) |
| | | | |
Net expenses | | | 6,559,748 | | | | 175,170 | |
| | | | |
Net investment income | | | 56,885,063 | | | | 369,571 | |
| | | | |
| | |
REALIZED AND UNREALIZED GAINS (LOSSES) ON INVESTMENTS | | | | | | | | |
Net realized gains (losses) on securities transaction allocated from the affiliated Master Portfolio | | | 30,089,873 | | | | (94,342 | ) |
Net change in unrealized gains (losses) on securities transactions allocated from the affiliated Master Portfolio | | | 4,892,256 | | | | 448,378 | |
| | | | |
Net realized and unrealized gains (losses) on investments | | | 34,982,129 | | | | 354,036 | |
| | | | |
Net increase in net assets resulting from operations | | $ | 91,867,192 | | | $ | 723,607 | |
| | | | |
| | |
* Net of foreign dividend withholding taxes allocated from the affiliated Master Portfolio in the amount of | | | $0 | | | | $8,889 | |
| 1 | For the period from June 1, 2015 to October 23, 2015. Effective at the close of business on October 23, 2015, Investor Class shares were converted to Class A shares and are no longer offered by the Fund. |
The accompanying notes are an integral part of these financial statements.
| | | | | | |
| Statements of changes in net assets | | Wells Fargo Income Funds | | | 17 | |
| | | | | | | | | | | | | | | | |
| | | Core Bond Fund | |
| | | Year ended
May 31, 2016 | | | Year ended
May 31, 2015 | |
| | | | |
Operations | | | | | | | | | | | | | | | | |
Net investment income | | | | | | $ | 56,885,063 | | | | | | | $ | 44,382,432 | |
Net realized gains on investments | | | | | | | 30,089,873 | | | | | | | | 47,175,434 | |
Net change in unrealized gains (losses) on investments | | | | | | | 4,892,256 | | | | | | | | (14,214,826 | ) |
| | | | |
Net increase in net assets resulting from operations | | | | | | | 91,867,192 | | | | | | | | 77,343,040 | |
| | | | |
| | | | |
Distributions to shareholders from | | | | | | | | | | | | | | | | |
Net investment income | | | | | | | | | | | | | | | | |
Class A | | | | | | | (8,389,835 | ) | | | | | | | (6,367,850 | ) |
Class B | | | | | | | (6,347 | ) | | | | | | | (13,601 | ) |
Class C | | | | | | | (461,896 | ) | | | | | | | (526,070 | ) |
Class R | | | | | | | (192,416 | ) | | | | | | | (204,535 | ) |
Class R4 | | | | | | | (721,295 | ) | | | | | | | (301,362 | ) |
Class R6 | | | | | | | (10,656,813 | ) | | | | | | | (8,573,230 | ) |
Administrator Class | | | | | | | (7,206,291 | ) | | | | | | | (6,530,804 | ) |
Institutional Class | | | | | | | (28,855,628 | ) | | | | | | | (21,645,383 | ) |
Investor Class | | | | | | | (390,665 | )1 | | | | | | | (1,042,999 | ) |
| | | | |
Total distributions to shareholders | | | | | | | (56,881,186 | ) | | | | | | | (45,205,834 | ) |
| | | | |
| | | | |
Capital share transactions | | | Shares | | | | | | | | Shares | | | | | |
Proceeds from shares sold | | | | | | | | | | | | | | | | |
Class A | | | 30,562,544 | | | | 401,063,165 | | | | 17,971,486 | | | | 235,630,095 | |
Class B | | | 7,110 | | | | 92,496 | | | | 5,794 | | | | 75,748 | |
Class C | | | 1,245,714 | | | | 16,170,020 | | | | 1,111,855 | | | | 14,430,938 | |
Class R | | | 516,463 | | | | 6,608,967 | | | | 783,753 | | | | 10,023,919 | |
Class R4 | | | 457,816 | | | | 5,844,509 | | | | 4,293,814 | | | | 55,081,322 | |
Class R6 | | | 22,221,787 | | | | 284,183,219 | | | | 44,555,184 | | | | 572,349,232 | |
Administrator Class | | | 20,672,744 | | | | 264,372,378 | | | | 16,736,880 | | | | 215,246,257 | |
Institutional Class | | | 91,619,539 | | | | 1,171,763,978 | | | | 49,516,356 | | | | 633,001,084 | |
Investor Class | | | 428,364 | 1 | | | 5,459,036 | 1 | | | 1,213,452 | | | | 15,517,521 | |
| | | | |
| | | | | | | 2,155,557,768 | | | | | | | | 1,751,356,116 | |
| | | | |
Reinvestment of distributions | | | | | | | | | | | | | | | | |
Class A | | | 581,976 | | | | 7,639,126 | | | | 428,287 | | | | 5,615,379 | |
Class B | | | 470 | | | | 6,137 | | | | 992 | | | | 12,927 | |
Class C | | | 17,152 | | | | 222,796 | | | | 17,848 | | | | 231,386 | |
Class R | | | 5,857 | | | | 74,968 | | | | 6,287 | | | | 80,370 | |
Class R4 | | | 56,422 | | | | 721,295 | | | | 23,328 | | | | 301,362 | |
Class R6 | | | 793,053 | | | | 10,128,176 | | | | 663,379 | | | | 8,507,857 | |
Administrator Class | | | 554,050 | | | | 7,096,753 | | | | 501,436 | | | | 6,420,079 | |
Institutional Class | | | 1,683,434 | | | | 21,533,371 | | | | 1,327,635 | | | | 16,973,646 | |
Investor Class | | | 25,095 | 1 | | | 319,617 | 1 | | | 80,287 | | | | 1,027,384 | |
| | | | |
| | | | | | | 47,742,239 | | | | | | | | 39,170,390 | |
| | | | |
Please see footnote on page 18.
The accompanying notes are an integral part of these financial statements.
| | | | |
| 18 | | Wells Fargo Income Funds | | Statements of changes in net assets |
| | | | | | | | | | | | | | | | |
| | | Core Bond Fund | |
| | | Year ended
May 31, 2016 | | | Year ended
May 31, 2015 | |
| | | | |
| | | Shares | | | | | | Shares | | | | |
| | | | |
Capital share transactions (continued) | | | | | | | | | | | | | | | | |
Payment for shares redeemed | | | | | | | | | | | | | | | | |
Class A | | | (16,942,422 | ) | | $ | (222,433,710 | ) | | | (10,589,489 | ) | | $ | (138,586,528 | ) |
Class B | | | (72,544 | ) | | | (947,339 | ) | | | (115,766 | ) | | | (1,507,965 | ) |
Class C | | | (1,783,639 | ) | | | (23,130,654 | ) | | | (1,858,972 | ) | | | (24,109,058 | ) |
Class R | | | (412,502 | ) | | | (5,265,096 | ) | | | (860,205 | ) | | | (11,034,948 | ) |
Class R4 | | | (1,165,926 | ) | | | (14,848,260 | ) | | | (479,442 | ) | | | (6,178,101 | ) |
Class R6 | | | (44,787,565 | ) | | | (570,876,875 | ) | | | (11,617,990 | ) | | | (149,382,398 | ) |
Administrator Class | | | (18,365,649 | ) | | | (234,906,387 | ) | | | (11,799,313 | ) | | | (150,982,820 | ) |
Institutional Class | | | (36,979,227 | ) | | | (472,735,235 | ) | | | (40,315,878 | ) | | | (513,863,486 | ) |
Investor Class | | | (6,089,488 | )1 | | | (77,924,960 | )1 | | | (1,491,148 | ) | | | (19,075,189 | ) |
| | | | |
| | | | | | | (1,623,068,516 | ) | | | | | | | (1,014,720,493 | ) |
| | | | |
Net increase in net assets resulting from capital share transactions | | | | | | | 580,231,491 | | | | | | | | 775,806,013 | |
| | | | |
Total increase in net assets | | | | | | | 615,217,497 | | | | | | | | 807,943,219 | |
| | | | |
| | |
Net assets | | | | | | | | |
Beginning of period | | | | | | | 3,292,821,543 | | | | | | | | 2,484,878,324 | |
| | | | |
End of period | | | | | | $ | 3,908,039,040 | | | | | | | $ | 3,292,821,543 | |
| | | | |
Undistributed net investment income | | | | | | $ | 2,098,037 | | | | | | | $ | 2,094,160 | |
| | | | |
| 1 | For the period from June 1, 2015 to October 23, 2015. Effective at the close of business on October 23, 2015, Investor Class shares were converted to Class A shares and are no longer offered by the Fund. |
The accompanying notes are an integral part of these financial statements.
| | | | | | |
| Statements of changes in net assets | | Wells Fargo Income Funds | | | 19 | |
| | | | | | | | | | | | | | | | |
| | | Real Return Fund | |
| | | Year ended
May 31, 2016 | | | Year ended
May 31, 2015 | |
| | | | |
Operations | | | | | | | | | | | | | | | | |
Net investment income | | | | | | $ | 369,571 | | | | | | | $ | 102,117 | |
Net realized gains (losses) on investments | | | | | | | (94,342 | ) | | | | | | | 740,740 | |
Net change in unrealized gains (losses) on investments | | | | | | | 448,378 | | | | | | | | (641,821 | ) |
| | | | |
Net increase in net assets resulting from operations | | | | | | | 723,607 | | | | | | | | 201,036 | |
| | | | |
| | | | |
Distributions to shareholders from | | | | | | | | | | | | | | | | |
Net investment income | | | | | | | | | | | | | | | | |
Class A | | | | | | | (105,174 | ) | | | | | | | (118,899 | ) |
Class B | | | | | | | (215 | ) | | | | | | | (784 | ) |
Class C | | | | | | | (19,227 | ) | | | | | | | (40,049 | ) |
Administrator Class | | | | | | | (118,294 | ) | | | | | | | (57,817 | ) |
Net realized gains | | | | | | | | | | | | | | | | |
Class A | | | | | | | (240,328 | ) | | | | | | | (105,640 | ) |
Class B | | | | | | | (692 | ) | | | | | | | (1,138 | ) |
Class C | | | | | | | (113,074 | ) | | | | | | | (66,105 | ) |
Administrator Class | | | | | | | (250,329 | ) | | | | | | | (44,811 | ) |
| | | | |
Total distributions to shareholders | | | | | | | (847,333 | ) | | | | | | | (435,243 | ) |
| | | | |
| | | | |
Capital share transactions | | | Shares | | | | | | | | Shares | | | | | |
Proceeds from shares sold | | | | | | | | | | | | | | | | |
Class A | | | 1,242,256 | | | | 12,000,616 | | | | 382,302 | | | | 3,837,289 | |
Class B | | | 0 | | | | 0 | | | | 333 | | | | 3,340 | |
Class C | | | 195,517 | | | | 1,891,126 | | | | 85,006 | | | | 845,717 | |
Administrator Class | | | 1,653,728 | | | | 16,251,043 | | | | 571,353 | | | | 5,803,056 | |
| | | | |
| | | | | | | 30,142,785 | | | | | | | | 10,489,402 | |
| | | | |
Reinvestment of distributions | | | | | | | | | | | | | | | | |
Class A | | | 30,219 | | | | 289,502 | | | | 20,753 | | | | 205,634 | |
Class B | | | 97 | | | | 907 | | | | 197 | | | | 1,922 | |
Class C | | | 12,509 | | | | 117,358 | | | | 9,408 | | | | 91,880 | |
Administrator Class | | | 34,404 | | | | 332,457 | | | | 9,708 | | | | 96,877 | |
| | | | |
| | | | | | | 740,224 | | | | | | | | 396,313 | |
| | | | |
Payment for shares redeemed | | | | | | | | | | | | | | | | |
Class A | | | (657,483 | ) | | | (6,397,152 | ) | | | (639,048 | ) | | | (6,367,493 | ) |
Class B | | | (7,500 | ) | | | (71,235 | ) | | | (9,996 | ) | | | (98,538 | ) |
Class C | | | (382,563 | ) | | | (3,632,916 | ) | | | (250,951 | ) | | | (2,472,907 | ) |
Administrator Class | | | (686,150 | ) | | | (6,659,978 | ) | | | (150,035 | ) | | | (1,512,161 | ) |
| | | | |
| | | | | | | (16,761,281 | ) | | | | | | | (10,451,099 | ) |
| | | | |
Net increase in net assets resulting from capital share transactions | | | | | | | 14,121,728 | | | | | | | | 434,616 | |
| | | | |
Total increase in net assets | | | | | | | 13,998,002 | | | | | | | | 200,409 | |
| | | | |
| | | | |
Net assets | | | | | | | | | | | | | | | | |
Beginning of period | | | | | | | 31,221,373 | | | | | | | | 31,020,964 | |
| | | | |
End of period | | | | | | $ | 45,219,375 | | | | | | | $ | 31,221,373 | |
| | | | |
Undistributed (overdistributed) net investment income | | | | | | $ | 128,869 | | | | | | | $ | (223 | ) |
| | | | |
The accompanying notes are an integral part of these financial statements.
| | | | |
| 20 | | Wells Fargo Income Funds | | Financial highlights |
| | | | | | | | | | | | | | | | | | | | | | | | |
| Core Bond Fund | | Beginning
net asset
value per
share | | | Net
investment
income | | | Net realized
and unrealized
gains (losses)
on investments | | | Distributions
from net
investment
income | | | Distributions
from net
realized gains | | | Ending
net asset
value per
share | |
Class A | | | | | | | | | | | | | | | | | | | | | | | | |
Year ended May 31, 2016 | | $ | 13.16 | | | | 0.19 | 4 | | | 0.12 | | | | (0.19 | ) | | | 0.00 | | | $ | 13.28 | |
Year ended May 31, 2015 | | $ | 12.98 | | | | 0.18 | | | | 0.19 | | | | (0.19 | ) | | | 0.00 | | | $ | 13.16 | |
Year ended May 31, 2014 | | $ | 13.02 | | | | 0.19 | | | | 0.12 | | | | (0.20 | ) | | | (0.15 | ) | | $ | 12.98 | |
Year ended May 31, 2013 | | $ | 13.46 | | | | 0.18 | | | | 0.12 | | | | (0.18 | ) | | | (0.56 | ) | | $ | 13.02 | |
Year ended May 31, 2012 | | $ | 13.05 | | | | 0.26 | | | | 0.72 | | | | (0.26 | ) | | | (0.31 | ) | | $ | 13.46 | |
Class B | | | | | | | | | | | | | | | | | | | | | | | | |
Year ended May 31, 2016 | | $ | 13.12 | | | | 0.09 | 4 | | | 0.12 | | | | (0.09 | ) | | | 0.00 | | | $ | 13.24 | |
Year ended May 31, 2015 | | $ | 12.94 | | | | 0.09 | 4 | | | 0.18 | | | | (0.09 | ) | | | 0.00 | | | $ | 13.12 | |
Year ended May 31, 2014 | | $ | 12.98 | | | | 0.10 | 4 | | | 0.12 | | | | (0.11 | ) | | | (0.15 | ) | | $ | 12.94 | |
Year ended May 31, 2013 | | $ | 13.43 | | | | 0.08 | 4 | | | 0.10 | | | | (0.07 | ) | | | (0.56 | ) | | $ | 12.98 | |
Year ended May 31, 2012 | | $ | 13.01 | | | | 0.16 | | | | 0.73 | | | | (0.16 | ) | | | (0.31 | ) | | $ | 13.43 | |
Class C | | | | | | | | | | | | | | | | | | | | | | | | |
Year ended May 31, 2016 | | $ | 13.03 | | | | 0.09 | | | | 0.12 | | | | (0.09 | ) | | | 0.00 | | | $ | 13.15 | |
Year ended May 31, 2015 | | $ | 12.86 | | | | 0.09 | | | | 0.17 | | | | (0.09 | ) | | | 0.00 | | | $ | 13.03 | |
Year ended May 31, 2014 | | $ | 12.90 | | | | 0.10 | | | | 0.12 | | | | (0.11 | ) | | | (0.15 | ) | | $ | 12.86 | |
Year ended May 31, 2013 | | $ | 13.34 | | | | 0.07 | | | | 0.12 | | | | (0.07 | ) | | | (0.56 | ) | | $ | 12.90 | |
Year ended May 31, 2012 | | $ | 12.93 | | | | 0.16 | | | | 0.72 | | | | (0.16 | ) | | | (0.31 | ) | | $ | 13.34 | |
Class R | | | | | | | | | | | | | | | | | | | | | | | | |
Year ended May 31, 2016 | | $ | 12.85 | | | | 0.15 | 4 | | | 0.12 | | | | (0.15 | ) | | | 0.00 | | | $ | 12.97 | |
Year ended May 31, 2015 | | $ | 12.67 | | | | 0.15 | 4 | | | 0.18 | | | | (0.15 | ) | | | 0.00 | | | $ | 12.85 | |
Year ended May 31, 2014 | | $ | 12.71 | | | | 0.16 | 4 | | | 0.12 | | | | (0.17 | ) | | | (0.15 | ) | | $ | 12.67 | |
Year ended May 31, 2013 | | $ | 13.16 | | | | 0.14 | 4 | | | 0.11 | | | | (0.14 | ) | | | (0.56 | ) | | $ | 12.71 | |
Year ended May 31, 2012 | | $ | 12.76 | | | | 0.22 | | | | 0.71 | | | | (0.22 | ) | | | (0.31 | ) | | $ | 13.16 | |
Class R4 | | | | | | | | | | | | | | | | | | | | | | | | |
Year ended May 31, 2016 | | $ | 12.83 | | | | 0.22 | | | | 0.12 | | | | (0.22 | ) | | | 0.00 | | | $ | 12.95 | |
Year ended May 31, 2015 | | $ | 12.66 | | | | 0.21 | | | | 0.18 | | | | (0.22 | ) | | | 0.00 | | | $ | 12.83 | |
Year ended May 31, 2014 | | $ | 12.70 | | | | 0.22 | | | | 0.12 | | | | (0.23 | ) | | | (0.15 | ) | | $ | 12.66 | |
Year ended May 31, 20135 | | $ | 13.46 | | | | 0.10 | 4 | | | (0.21 | ) | | | (0.09 | ) | | | (0.56 | ) | | $ | 12.70 | |
Class R6 | | | | | | | | | | | | | | | | | | | | | | | | |
Year ended May 31, 2016 | | $ | 12.83 | | | | 0.24 | | | | 0.12 | | | | (0.24 | ) | | | 0.00 | | | $ | 12.95 | |
Year ended May 31, 2015 | | $ | 12.66 | | | | 0.23 | | | | 0.17 | | | | (0.23 | ) | | | 0.00 | | | $ | 12.83 | |
Year ended May 31, 2014 | | $ | 12.70 | | | | 0.24 | | | | 0.12 | | | | (0.25 | ) | | | (0.15 | ) | | $ | 12.66 | |
Year ended May 31, 20135 | | $ | 13.46 | | | | 0.11 | 4 | | | (0.21 | ) | | | (0.10 | ) | | | (0.56 | ) | | $ | 12.70 | |
Administrator Class | | | | | | | | | | | | | | | | | | | | | | | | |
Year ended May 31, 2016 | | $ | 12.85 | | | | 0.19 | | | | 0.12 | | | | (0.19 | ) | | | 0.00 | | | $ | 12.97 | |
Year ended May 31, 2015 | | $ | 12.67 | | | | 0.19 | 4 | | | 0.18 | | | | (0.19 | ) | | | 0.00 | | | $ | 12.85 | |
Year ended May 31, 2014 | | $ | 12.71 | | | | 0.21 | | | | 0.11 | | | | (0.21 | ) | | | (0.15 | ) | | $ | 12.67 | |
Year ended May 31, 2013 | | $ | 13.16 | | | | 0.19 | | | | 0.10 | | | | (0.18 | ) | | | (0.56 | ) | | $ | 12.71 | |
Year ended May 31, 2012 | | $ | 12.76 | | | | 0.27 | | | | 0.71 | | | | (0.27 | ) | | | (0.31 | ) | | $ | 13.16 | |
Institutional Class | | | | | | | | | | | | | | | | | | | | | | | | |
Year ended May 31, 2016 | | $ | 12.83 | | | | 0.23 | | | | 0.12 | | | | (0.23 | ) | | | 0.00 | | | $ | 12.95 | |
Year ended May 31, 2015 | | $ | 12.66 | | | | 0.22 | | | | 0.18 | | | | (0.23 | ) | | | 0.00 | | | $ | 12.83 | |
Year ended May 31, 2014 | | $ | 12.70 | | | | 0.23 | | | | 0.12 | | | | (0.24 | ) | | | (0.15 | ) | | $ | 12.66 | |
Year ended May 31, 2013 | | $ | 13.14 | | | | 0.22 | | | | 0.12 | | | | (0.22 | ) | | | (0.56 | ) | | $ | 12.70 | |
Year ended May 31, 2012 | | $ | 12.75 | | | | 0.31 | | | | 0.69 | | | | (0.30 | ) | | | (0.31 | ) | | $ | 13.14 | |
| 1 | Ratios include net expenses allocated from the affiliated Master Portfolio. |
| 2 | Total return calculations do not include any sales charges. Returns for periods of less than one year are not annualized. |
| 3 | Portfolio turnover rate is calculated by multiplying the Fund’s investment percentage in the affiliated Master Portfolio by the affiliated Master Portfolio’s portfolio turnover rate. |
| 4 | Calculated based upon average shares outstanding |
| 5 | For the period from November 30, 2012 (commencement of class operations) to May 31, 2013 |
The accompanying notes are an integral part of these financial statements.
| | | | | | |
| Financial highlights | | Wells Fargo Income Funds | | | 21 | |
| | | | | | | | | | | | | | | | | | | | | | |
| Ratio to average net assets (annualized) | | | Total
return2 | | | Portfolio
turnover
rate3 | | | Net assets at
end of period
(000s omitted) | |
Net investment
income | | | Gross
expenses1 | | | Net
expenses1 | | | | |
| | | | | | | | | | | | | | | | | | | | | | |
| | 1.43 | % | | | 0.83 | % | | | 0.78 | % | | | 2.36 | % | | | 667 | % | | $ | 699,273 | |
| | 1.39 | % | | | 0.83 | % | | | 0.78 | % | | | 2.85 | % | | | 586 | % | | $ | 506,043 | |
| | 1.52 | % | | | 0.83 | % | | | 0.78 | % | | | 2.46 | % | | | 646 | % | | $ | 397,780 | |
| | 1.31 | % | | | 0.83 | % | | | 0.80 | % | | | 2.14 | % | | | 547 | % | | $ | 408,864 | |
| | 1.91 | % | | | 0.82 | % | | | 0.82 | % | | | 7.65 | % | | | 803 | % | | $ | 450,013 | |
| | | | | | | | | | | | | | | | | | | | | | |
| | 0.68 | % | | | 1.58 | % | | | 1.53 | % | | | 1.60 | % | | | 667 | % | | $ | 502 | |
| | 0.67 | % | | | 1.58 | % | | | 1.53 | % | | | 2.09 | % | | | 586 | % | | $ | 1,350 | |
| | 0.77 | % | | | 1.58 | % | | | 1.53 | % | | | 1.70 | % | | | 646 | % | | $ | 2,742 | |
| | 0.56 | % | | | 1.57 | % | | | 1.55 | % | | | 1.31 | % | | | 547 | % | | $ | 8,208 | |
| | 1.23 | % | | | 1.57 | % | | | 1.57 | % | | | 6.95 | % | | | 803 | % | | $ | 11,998 | |
| | | | | | | | | | | | | | | | | | | | | | |
| | 0.68 | % | | | 1.58 | % | | | 1.53 | % | | | 1.61 | % | | | 667 | % | | $ | 66,612 | |
| | 0.65 | % | | | 1.58 | % | | | 1.53 | % | | | 2.02 | % | | | 586 | % | | $ | 72,798 | |
| | 0.77 | % | | | 1.58 | % | | | 1.53 | % | | | 1.71 | % | | | 646 | % | | $ | 81,187 | |
| | 0.53 | % | | | 1.58 | % | | | 1.55 | % | | | 1.39 | % | | | 547 | % | | $ | 116,837 | |
| | 1.18 | % | | | 1.57 | % | | | 1.57 | % | | | 6.90 | % | | | 803 | % | | $ | 127,677 | |
| | | | | | | | | | | | | | | | | | | | | | |
| | 1.18 | % | | | 1.08 | % | | | 1.03 | % | | | 2.13 | % | | | 667 | % | | $ | 17,985 | |
| | 1.15 | % | | | 1.08 | % | | | 1.03 | % | | | 2.63 | % | | | 586 | % | | $ | 16,411 | |
| | 1.27 | % | | | 1.08 | % | | | 1.03 | % | | | 2.23 | % | | | 646 | % | | $ | 17,077 | |
| | 1.04 | % | | | 1.07 | % | | | 1.05 | % | | | 1.83 | % | | | 547 | % | | $ | 19,548 | |
| | 1.67 | % | | | 1.07 | % | | | 1.07 | % | | | 7.43 | % | | | 803 | % | | $ | 20,088 | |
| | | | | | | | | | | | | | | | | | | | | | |
| | 1.69 | % | | | 0.60 | % | | | 0.52 | % | | | 2.65 | % | | | 667 | % | | $ | 41,272 | |
| | 1.53 | % | | | 0.59 | % | | | 0.52 | % | | | 3.07 | % | | | 586 | % | | $ | 49,261 | |
| | 1.78 | % | | | 0.58 | % | | | 0.52 | % | | | 2.75 | % | | | 646 | % | | $ | 17 | |
| | 1.56 | % | | | 0.57 | % | | | 0.52 | % | | | (0.84 | )% | | | 547 | % | | $ | 10 | |
| | | | | | | | | | | | | | | | | | | | | | |
| | 1.84 | % | | | 0.45 | % | | | 0.37 | % | | | 2.81 | % | | | 667 | % | | $ | 450,791 | |
| | 1.76 | % | | | 0.45 | % | | | 0.37 | % | | | 3.23 | % | | | 586 | % | | $ | 726,165 | |
| | 1.94 | % | | | 0.45 | % | | | 0.37 | % | | | 2.91 | % | | | 646 | % | | $ | 290,977 | |
| | 1.72 | % | | | 0.45 | % | | | 0.37 | % | | | (0.77 | )% | | | 547 | % | | $ | 205,225 | |
| | | | | | | | | | | | | | | | | | | | | | |
| | 1.51 | % | | | 0.77 | % | | | 0.70 | % | | | 2.47 | % | | | 667 | % | | $ | 529,530 | |
| | 1.47 | % | | | 0.77 | % | | | 0.70 | % | | | 2.96 | % | | | 586 | % | | $ | 487,981 | |
| | 1.60 | % | | | 0.77 | % | | | 0.70 | % | | | 2.57 | % | | | 646 | % | | $ | 412,419 | |
| | 1.43 | % | | | 0.76 | % | | | 0.70 | % | | | 2.19 | % | | | 547 | % | | $ | 526,028 | |
| | 2.08 | % | | | 0.76 | % | | | 0.70 | % | | | 7.83 | % | | | 803 | % | | $ | 802,788 | |
| | | | | | | | | | | | | | | | | | | | | | |
| | 1.79 | % | | | 0.50 | % | | | 0.42 | % | | | 2.76 | % | | | 667 | % | | $ | 2,102,073 | |
| | 1.75 | % | | | 0.50 | % | | | 0.42 | % | | | 3.17 | % | | | 586 | % | | $ | 1,360,398 | |
| | 1.88 | % | | | 0.50 | % | | | 0.42 | % | | | 2.85 | % | | | 646 | % | | $ | 1,208,745 | |
| | 1.67 | % | | | 0.50 | % | | | 0.42 | % | | | 2.56 | % | | | 547 | % | | $ | 1,505,192 | |
| | 2.32 | % | | | 0.49 | % | | | 0.42 | % | | | 8.05 | % | | | 803 | % | | $ | 1,965,338 | |
The accompanying notes are an integral part of these financial statements.
| | | | |
| 22 | | Wells Fargo Income Funds | | Financial highlights |
| | | | | | | | | | | | | | | | | | | | | | | | |
| Real Return Fund | | Beginning
net asset
value per
share | | | Net
investment
income (loss) | | | Net realized
and unrealized
gains (losses)
on investments | | | Distributions
from net
investment
income | | | Distributions
from net
realized gains | | | Ending
net asset
value per
share | |
Class A | | | | | | | | | | | | | | | | | | | | | | | | |
Year ended May 31, 2016 | | $ | 10.07 | | | | 0.10 | 4 | | | (0.01 | ) | | | (0.07 | ) | | | (0.14 | ) | | $ | 9.95 | |
Year ended May 31, 2015 | | $ | 10.11 | | | | 0.05 | 4 | | | 0.07 | | | | (0.08 | ) | | | (0.08 | ) | | $ | 10.07 | |
Year ended May 31, 2014 | | $ | 10.85 | | | | 0.10 | 4 | | | (0.21 | ) | | | (0.09 | ) | | | (0.54 | ) | | $ | 10.11 | |
Year ended May 31, 2013 | | $ | 11.66 | | | | 0.11 | | | | (0.36 | ) | | | (0.21 | ) | | | (0.35 | ) | | $ | 10.85 | |
Year ended May 31, 2012 | | $ | 10.84 | | | | 0.27 | | | | 1.01 | | | | (0.36 | ) | | | (0.10 | ) | | $ | 11.66 | |
Class B | | | | | | | | | | | | | | | | | | | | | | | | |
Year ended May 31, 2016 | | $ | 9.91 | | | | 0.06 | 4 | | | (0.04 | ) | | | (0.02 | ) | | | (0.14 | ) | | $ | 9.77 | |
Year ended May 31, 2015 | | $ | 9.99 | | | | (0.03 | )4 | | | 0.07 | | | | (0.04 | ) | | | (0.08 | ) | | $ | 9.91 | |
Year ended May 31, 2014 | | $ | 10.75 | | | | 0.01 | 4 | | | (0.20 | ) | | | (0.03 | ) | | | (0.54 | ) | | $ | 9.99 | |
Year ended May 31, 2013 | | $ | 11.58 | | | | 0.03 | 4 | | | (0.36 | ) | | | (0.15 | ) | | | (0.35 | ) | | $ | 10.75 | |
Year ended May 31, 2012 | | $ | 10.76 | | | | 0.19 | 4 | | | 1.00 | | | | (0.27 | ) | | | (0.10 | ) | | $ | 11.58 | |
Class C | | | | | | | | | | | | | | | | | | | | | | | | |
Year ended May 31, 2016 | | $ | 9.92 | | | | 0.03 | 4 | | | (0.02 | ) | | | (0.02 | ) | | | (0.14 | ) | | $ | 9.77 | |
Year ended May 31, 2015 | | $ | 10.00 | | | | (0.03 | )4 | | | 0.08 | | | | (0.05 | ) | | | (0.08 | ) | | $ | 9.92 | |
Year ended May 31, 2014 | | $ | 10.76 | | | | 0.03 | 4 | | | (0.21 | ) | | | (0.04 | ) | | | (0.54 | ) | | $ | 10.00 | |
Year ended May 31, 2013 | | $ | 11.59 | | | | 0.04 | | | | (0.37 | ) | | | (0.15 | ) | | | (0.35 | ) | | $ | 10.76 | |
Year ended May 31, 2012 | | $ | 10.77 | | | | 0.19 | | | | 1.00 | | | | (0.27 | ) | | | (0.10 | ) | | $ | 11.59 | |
Administrator Class | | | | | | | | | | | | | | | | | | | | | | | | |
Year ended May 31, 2016 | | $ | 10.15 | | | | 0.13 | 4 | | | (0.02 | ) | | | (0.09 | ) | | | (0.14 | ) | | $ | 10.03 | |
Year ended May 31, 2015 | | $ | 10.17 | | | | 0.10 | 4 | | | 0.06 | | | | (0.10 | ) | | | (0.08 | ) | | $ | 10.15 | |
Year ended May 31, 2014 | | $ | 10.90 | | | | 0.13 | 4 | | | (0.22 | ) | | | (0.10 | ) | | | (0.54 | ) | | $ | 10.17 | |
Year ended May 31, 2013 | | $ | 11.71 | | | | 0.15 | 4 | | | (0.37 | ) | | | (0.24 | ) | | | (0.35 | ) | | $ | 10.90 | |
Year ended May 31, 2012 | | $ | 10.89 | | | | 0.39 | 4 | | | 0.92 | | | | (0.39 | ) | | | (0.10 | ) | | $ | 11.71 | |
| 1 | Ratios include net expenses allocated from the affiliated Master Portfolio. |
| 2 | Total return calculations do not include any sales charges. |
| 3 | Portfolio turnover rate is calculated by multiplying the Fund’s investment percentage in the affiliated Master Portfolio by the affiliated Master Portfolio’s portfolio turnover rate. |
| 4 | Calculated based upon average shares outstanding |
The accompanying notes are an integral part of these financial statements.
| | | | | | |
| Financial highlights | | Wells Fargo Income Funds | | | 23 | |
| | | | | | | | | | | | | | | | | | | | | | |
| Ratio to average net assets (annualized) | | | Total
return2 | | | Portfolio
turnover
rate3 | | | Net assets at
end of period
(000s omitted) | |
Net investment
income (loss) | | | Gross
expenses1 | | | Net
expenses1 | | | | |
| | | | | | | | | | | | | | | | | | | | | | |
| | 0.98 | % | | | 1.20 | % | | | 0.85 | % | | | 1.01 | % | | | 29 | % | | $ | 18,938 | |
| | 0.47 | % | | | 1.31 | % | | | 0.85 | % | | | 1.24 | % | | | 57 | % | | $ | 12,977 | |
| | 0.96 | % | | | 1.20 | % | | | 0.85 | % | | | (0.76 | )% | | | 9 | % | | $ | 15,415 | |
| | 1.09 | % | | | 1.08 | % | | | 0.85 | % | | | (2.27 | )% | | | 15 | % | | $ | 28,298 | |
| | 2.42 | % | | | 1.11 | % | | | 0.85 | % | | | 12.02 | % | | | 23 | % | | $ | 36,935 | |
| | | | | | | | | | | | | | | | | | | | | | |
| | 0.65 | % | | | 1.95 | % | | | 1.60 | % | | | 0.31 | % | | | 29 | % | | $ | 21 | |
| | (0.30 | )% | | | 2.05 | % | | | 1.60 | % | | | 0.45 | % | | | 57 | % | | $ | 95 | |
| | 0.09 | % | | | 1.95 | % | | | 1.60 | % | | | (1.53 | )% | | | 9 | % | | $ | 190 | |
| | 0.29 | % | | | 1.83 | % | | | 1.60 | % | | | (3.02 | )% | | | 15 | % | | $ | 571 | |
| | 1.69 | % | | | 1.84 | % | | | 1.60 | % | | | 11.25 | % | | | 23 | % | | $ | 899 | |
| | | | | | | | | | | | | | | | | | | | | | |
| | 0.30 | % | | | 1.95 | % | | | 1.60 | % | | | 0.21 | % | | | 29 | % | | $ | 5,654 | |
| | (0.33 | )% | | | 2.06 | % | | | 1.60 | % | | | 0.46 | % | | | 57 | % | | $ | 7,471 | |
| | 0.29 | % | | | 1.95 | % | | | 1.60 | % | | | (1.46 | )% | | | 9 | % | | $ | 9,095 | |
| | 0.39 | % | | | 1.83 | % | | | 1.60 | % | | | (3.01 | )% | | | 15 | % | | $ | 13,774 | |
| | 1.68 | % | | | 1.86 | % | | | 1.60 | % | | | 11.24 | % | | | 23 | % | | $ | 15,631 | |
| | | | | | | | | | | | | | | | | | | | | | |
| | 1.30 | % | | | 1.13 | % | | | 0.60 | % | | | 1.21 | % | | | 29 | % | | $ | 20,607 | |
| | 0.99 | % | | | 1.27 | % | | | 0.60 | % | | | 1.56 | % | | | 57 | % | | $ | 10,679 | |
| | 1.31 | % | | | 1.14 | % | | | 0.60 | % | | | (0.51 | )% | | | 9 | % | | $ | 6,320 | |
| | 1.34 | % | | | 1.02 | % | | | 0.60 | % | | | (2.08 | )% | | | 15 | % | | $ | 8,271 | |
| | 3.42 | % | | | 1.01 | % | | | 0.60 | % | | | 12.26 | % | | | 23 | % | | $ | 9,833 | |
The accompanying notes are an integral part of these financial statements.
| | | | |
| 24 | | Wells Fargo Income Funds | | Notes to financial statements |
1. ORGANIZATION
Wells Fargo Funds Trust (the “Trust”), a Delaware statutory trust organized on March 10, 1999, is an open-end management investment company registered under the Investment Company Act of 1940, as amended (the “1940 Act”). As an investment company, the Trust follows the accounting and reporting guidance in Financial Accounting Standards Board (“FASB”) Accounting Standards Codification Topic 946, Financial Services – Investment Companies. These financial statements report on the following funds: Wells Fargo Core Bond Fund (“Core Bond Fund”) and Wells Fargo Real Return Fund (“Real Return Fund”) (each, a “Fund”, collectively, the “Funds”). Each Fund is a diversified series of the Trust.
After the close of business on October 23, 2015, Investor Class shares became Class A shares in a tax-free conversion. Investor Class shareholders of Core Bond Fund received Class A shares at a value equal to the value of their Investor Class shares immediately prior to the conversion. Investor Class shares are no longer offered by Core Bond Fund.
Each Fund seeks to achieve its investment objective by investing all investable assets in a separate diversified portfolio (an “affiliated Master Portfolio”) of Wells Fargo Master Trust, a registered open-end management investment company. Each affiliated Master Portfolio directly acquires portfolio securities, and a Fund investing in an affiliated Master Portfolio acquires an indirect interest in those securities. Each Fund accounts for its investment in the affiliated Master Portfolio as a partnership investment and records on a daily basis its share of the affiliated Master Portfolio’s income, expense, and realized and unrealized gains and losses. The financial statements of each affiliated Master Portfolio for the year ended May 31, 2016 are included in this report and should be read in conjunction with each Fund’s financial statements. As of May 31, 2016, Core Bond Fund owned 90% of Wells Fargo Core Bond Portfolio and Real Return Fund owned 70% of Wells Fargo Real Return Portfolio.
2. SIGNIFICANT ACCOUNTING POLICIES
The following significant accounting policies, which are consistently followed in the preparation of the financial statements of each Fund, are in conformity with U.S. generally accepted accounting principles which require management to make estimates and assumptions that affect the reported amounts of assets and liabilities, disclosure of contingent assets and liabilities at the date of the financial statements, and the reported amounts of revenues and expenses during the reporting period. Actual results could differ from those estimates.
Securities valuation
All investments are valued each business day as of the close of regular trading on the New York Stock Exchange (generally 4 p.m. Eastern Time), although the Funds may deviate from this calculation time under unusual or unexpected circumstances.
An investment in an affiliated Master Portfolio is valued daily based on each Fund’s proportionate share of each affiliated Master Portfolio’s net assets, which is also valued daily. Securities held in the affiliated Master Portfolio are valued as discussed in the Notes to Financial Statements of the affiliated Master Portfolio, which are included elsewhere in this report.
Security transactions and income recognition
Securities transactions are recorded on a trade date basis in each affiliated Master Portfolio. Realized gains or losses in each affiliated Master Portfolio are recorded on the basis of identified cost.
Interest income is accrued daily and bond discounts are accreted and premiums are amortized daily based on the effective interest method by each affiliated Master Portfolio. To the extent debt obligations are placed on non-accrual status, any related interest income may be reduced by writing off interest receivables when the collection of all or a portion of interest has become doubtful based on consistently applied procedures. If the issuer subsequently resumes interest payments or when the collectability of interest is reasonably assured, the debt obligation is removed from non-accrual status.
Dividend income in each affiliated Master Portfolio is recognized on the ex-dividend date, except for certain dividends from foreign securities which are recorded as soon as the custodian verifies the ex-dividend date. Dividend income from foreign securities in each affiliated Master Portfolio is recorded net of foreign taxes withheld where recovery of such taxes is not assured.
Each Fund records daily its proportionate share of each affiliated Master Portfolio’s interest and dividend income and realized and unrealized gains or losses.
| | | | | | |
| Notes to financial statements | | Wells Fargo Income Funds | | | 25 | |
Distributions to shareholders
For Core Bond Fund, distributions to shareholders from net investment income are accrued daily and paid monthly. For Real Return Fund, distributions to shareholders from net investment income are recorded on the ex-dividend date. Distributions from net realized gains, if any, are recorded on the ex-dividend date. Such distributions are determined in conformity with federal income tax regulations, which may differ in amount or character from net investment income and realized gains recognized for purposes of U.S. generally accepted accounting principles.
Federal and other taxes
Each Fund is treated as a separate entity for federal income tax purposes. Each Fund intends to continue to qualify as a regulated investment company by distributing substantially all of its investment company taxable income and any net realized capital gains (after reduction for capital loss carryforwards) sufficient to relieve it from all, or substantially all, federal income taxes. Accordingly, no provision for federal income taxes was required.
Each Fund’s income and federal excise tax returns and all financial records supporting those returns for the prior three fiscal years are subject to examination by the federal and Delaware revenue authorities. Management has analyzed each Fund’s tax positions taken on federal, state, and foreign tax returns for all open tax years and does not believe that there are any uncertain tax positions that require recognition of a tax liability.
Reclassifications are made to each Fund’s capital accounts for permanent tax differences to reflect income and gains available for distribution (or available capital loss carryforwards) under federal income tax regulations. U.S. generally accepted accounting principles require that certain components of net assets be adjusted to reflect permanent differences between financial and tax reporting. These reclassifications have no effect on net assets or net asset values per share. At May 31, 2016, as a result of permanent book-to-tax differences, the following reclassification adjustments were made on the Statements of Assets and Liabilities:
| | | | | | | | | | | | |
| | | Paid-in
capital | | | Undistributed
net investment
income | | | Accumulated
net realized
gains (losses) on
investments | |
Core Bond Fund | | $ | (2,412,754 | ) | | $ | 0 | | | $ | 2,412,754 | |
Real Return Fund | | | 3,798 | | | | 2,431 | | | | (6,229 | ) |
As of May 31, 2016, capital loss carryforwards available to offset future net realized capital gains were as follows through the indicated expiration dates:
| | | | | | | | | | | | |
| | | | | | No expiration | |
| | | 2017 | | | Short-term | | | Long-term | |
Core Bond Fund | | $ | 17,505,682 | | | $ | 0 | | | $ | 0 | |
Real Return Fund | | | 0 | | | | 19,900 | | | | 22,656 | |
As of May 31, 2016, Core Bond Fund had $1,802,544 of current year deferred post-October capital losses, which will be recognized on the first day of the following fiscal year.
Class allocations
The separate classes of shares offered by each Fund differ principally in applicable sales charges, distribution, shareholder servicing, and administration fees. Class specific expenses are charged directly to that share class. Investment income, common expenses, and realized and unrealized gains (losses) on investments are allocated daily to each class of shares based on the relative proportion of net assets of each class.
| | | | |
| 26 | | Wells Fargo Income Funds | | Notes to financial statements |
3. FAIR VALUATION MEASUREMENTS
At May 31, 2016, the affiliated Master Portfolio of each Fund was measured at fair value using the net asset value per share (or its equivalent) as a practical expedient. The investment objective of each affiliate Master Portfolio and the value of each affiliated Master Portfolio was as follows:
| | | | | | |
| Affiliated Master Portfolio | | Investment objective | | Value of affiliated Master
Portfolio | |
Wells Fargo Core Bond Portfolio | | Seeks total return, consisting of income and capital appreciation | | $ | 3,905,568,217 | |
Wells Fargo Real Return Portfolio | | Seeks returns that exceed the rate of inflation over the long-term | | | 45,019,976 | |
Each affiliated Master Portfolio does not have a redemption period notice, can be redeemed daily and does not have any unfunded commitments.
4. TRANSACTIONS WITH AFFILIATES
Management fee
Wells Fargo Funds Management (“Funds Management”), an indirect wholly owned subsidiary of Wells Fargo & Company (“Wells Fargo”), is the manager of each Fund and provides advisory and fund-level administrative services under an investment management agreement. Under the investment management agreement, Funds Management is responsible for, among other services, implementing the investment objectives and strategies of each Fund, supervising the applicable subadviser, providing fund-level administrative services in connection with each Fund’s operations, and providing any other fund-level administrative services reasonably necessary for the operation of each Fund. As long as each Fund continues to invest substantially all of its assets in a single affiliated Master Portfolio, each Fund pays Funds Management an investment management fee only for fund-level administrative services. As compensation for its services under the investment management agreement, Funds Management is entitled to receive an annual management fee starting at 0.05% and declining to 0.03% as the average daily net assets of each Fund increase.
Prior to July 1, 2015, fund-level administrative services were provided by Funds Management under a separate administration agreement at an annual fee which started at 0.05% and declined to 0.03% as the average daily net assets of each Fund increased. For financial statement purposes, the fund-level administration fee under the prior administration agreement for each Fund has been included in management fee on the Statements of Operations.
For the year ended May 31, 2016, the management fee was equivalent to an annual rate of 0.05% of each Fund’s average daily net assets.
Funds Management also serves as the adviser to each affiliated Master Portfolio and is entitled to receive a fee from each affiliated Master Portfolio for those services.
Administration fees
Under a class-level administration agreement, Funds Management provides class-level administrative services to the Fund, which includes paying fees and expenses for services provided by the transfer agent, sub-transfer agents, omnibus account servicers and record-keepers. As compensation for its services under the class-level administration agreement, Funds Management receives an annual fee which is calculated based on the average daily net assets of each class as follows:
| | | | |
| | | Class level
administration fee | |
Class A, Class B, Class C, Class R | | | 0.16 | % |
Class R4, Institutional Class | | | 0.08 | |
Class R6 | | | 0.03 | |
Administrator Class | | | 0.10 | |
Investor Class | | | 0.19 | |
Funds Management has contractually waived and/or reimbursed management and administration fees to the extent necessary to maintain certain net operating expense ratios for the Funds. Waiver of fees and/or reimbursement of expenses by Funds Management were made first from fund level expenses on a proportionate basis and then from class
| | | | | | |
| Notes to financial statements | | Wells Fargo Income Funds | | | 27 | |
specific expenses. Funds Management has committed through September 30, 2016 to waive fees and/or reimburse expenses to the extent necessary to cap each Fund’s expenses as follows:
| | | | | | | | | | | | | | | | | | | | | | | | | | | | | | | | |
| | | Class A | | | Class B | | | Class C | | | Class R | | | Class R4 | | | Class R6 | | | Administrator
Class | | | Institutional
Class | |
Core Bond Fund | | | 0.78 | % | | | 1.53 | % | | | 1.53 | % | | | 1.03% | | | | 0.52% | | | | 0.37% | | | | 0.70 | % | | | 0.42% | |
Real Return Fund | | | 0.85 | | | | 1.60 | | | | 1.60 | | | | N/A | | | | N/A | | | | N/A | | | | 0.60 | | | | N/A | |
Net expenses from affiliated Master Portfolios are included in the expense caps. After the expiration date, each expense cap may be increased or the commitment to maintain the cap may be terminated only with the approval of the Board of Trustees.
Distribution fees
The Trust has adopted a distribution plan for Class B, Class C and Class R shares of the applicable Funds pursuant to Rule 12b-1 under the 1940 Act. Distribution fees are charged to the Class B, Class C and Class R shares and paid to Wells Fargo Funds Distributor, LLC (“Funds Distributor”), the principal underwriter of each Fund, at an annual rate of 0.75% of the average daily net assets of Class B and Class C shares and 0.25% of the average daily net assets of Class R shares.
In addition, Funds Distributor is entitled to receive the front-end sales charge from the purchase of Class A shares and a contingent deferred sales charge on the redemption of certain Class A shares. Funds Distributor is also entitled to receive the contingent deferred sales charges from redemptions of Class B and Class C shares. For the year ended May 31, 2016, Funds Distributor received the following amounts in front-end sales charges and contingent deferred sales charges:
| | | | | | | | | | | | |
| | | Front-end
sales charges Class A | | | Contingent deferred sales charges | |
| | | | Class B | | | Class C | |
Core Bond Fund | | $ | 11,080 | | | $ | 161 | | | $ | 36 | |
Real Return Fund | | | 665 | | | | 0 | | | | 0 | |
Shareholder servicing fees
The Trust has entered into contracts with one or more shareholder servicing agents, whereby Class A, Class B, Class C, Class R, Administrator Class, and Investor Class of each applicable Fund is charged a fee at an annual rate of 0.25% of the average daily net assets of each respective class. Class R4 shares are charged a fee at an annual rate of 0.10% of its average daily net assets.
A portion of these total shareholder servicing fees were paid to affiliates of Wells Fargo.
5. INVESTMENT PORTFOLIO TRANSACTIONS
Purchases and sales of investments, excluding short-term securities, for the year ended May 31, 2016 were as follows:
| | | | | | | | | | | | | | | | |
| | | Purchases at cost* | | | Sales proceeds* | |
| | | U.S. government | | | Non-U.S.
government | | | U.S. government | | | Non-U.S.
government | |
Core Bond Fund | | $ | 21,934,549,372 | | | $ | 3,130,900,368 | | | $ | 21,585,169,658 | | | $ | 2,694,499,673 | |
Real Return Fund | | | 13,711,054 | | | | 8,488,831 | | | | 7,285,046 | | | | 3,451,618 | |
| * | The Funds seek to achieve their investment objective by investing all of their investable assets in a single affiliated Master Portfolio. Purchases and sales have been calculated by multiplying each Fund’s ownership percentage of the respective affiliated Master Portfolio by the affiliated Master Portfolio’s purchases and sales. |
6. BANK BORROWINGS
The Trust (excluding the money market funds and certain other funds) and Wells Fargo Variable Trust are parties to a $200,000,000 revolving credit agreement whereby each Fund is permitted to use bank borrowings for temporary or emergency purposes, such as to fund shareholder redemption requests. Interest under the credit agreement is charged to each Fund based on a borrowing rate equal to the higher of the Federal Funds rate in effect on that day plus 1.25% or the overnight LIBOR rate in effect on that day plus 1.25%. In addition, an annual commitment fee equal to 0.20% of the unused balance is allocated to each participating fund. Prior to September 1, 2015, the revolving credit agreement amount was $150,000,000 and the annual commitment fee was equal to 0.10% of the unused balance which was allocated to each participating fund.
| | | | |
| 28 | | Wells Fargo Income Funds | | Notes to financial statements |
For the year ended May 31, 2016, there were no borrowings by the Funds under the agreement.
7. DISTRIBUTIONS TO SHAREHOLDERS
The tax character of distributions paid during the years ended May 31 2016, and May 31, 2015, were as follows:
| | | | | | | | | | | | | | | | |
| | | Ordinary income | | | Long-term capital gain | |
| | | 2016 | | | 2015 | | | 2016 | | | 2015 | |
Core Bond Fund | | $ | 56,881,186 | | | $ | 45,205,834 | | | $ | 0 | | | $ | 0 | |
Real Return Fund | | | 334,615 | | | | 217,549 | | | | 512,718 | | | | 217,694 | |
As of May 31, 2016, the components of distributable earnings on a tax basis were as follows:
| | | | | | | | | | | | | | | | |
| | | Undistributed
ordinary
income | | | Unrealized
gains | | | Post-October
capital losses
deferred | | | Capital loss
carryforward | |
Core Bond Fund | | $ | 3,263,896 | | | $ | 24,351,701 | | | $ | (1,802,544 | ) | | $ | (17,505,682 | ) |
Real Return Fund | | | 128,869 | | | | 1,142,398 | | | | 0 | | | | (42,556 | ) |
8. INDEMNIFICATION
Under the Trust’s organizational documents, the officers and Trustees have been granted certain indemnification rights against certain liabilities that may arise out of performance of their duties to the Trust. Additionally, in the normal course of business, the Trust may enter into contracts with service providers that contain a variety of indemnification clauses. The Trust’s maximum exposure under these arrangements is dependent on future claims that may be made against the Funds and, therefore, cannot be estimated.
9. REDEMPTION IN-KIND
After the close of business on October 29, 2015, Core Bond Fund redeemed assets through an in-kind redemption. In the redemption transaction, Core Bond Fund made a corresponding in-kind redemption from Wells Fargo Core Bond Portfolio which distributed securities to Core Bond Fund. These securities with a value of $223,656,162 along with cash in the amount of $20,349,815 were then in turn distributed to the shareholder. Core Bond Fund recognized gains in the amount of $1,542,694, which are reflected on the Statements of Operations. The redemption in-kind by a shareholder of Class R6 represented 7.17% of Core Bond Fund and is reflected on the Statements of Changes in Net Assets.
10. SUBSEQUENT DISTRIBUTIONS
On June 24, 2016, Real Return Fund declared distributions from net investment income to shareholders of record on
June 23, 2016. The per share amounts payable on June 27, 2016 were as follows:
| | | | |
| | | Net investment income | |
Class A | | $ | 0.01905 | |
Class B | | | 0.00000 | |
Class C | | | 0.00000 | |
Administrator Class | | | 0.01901 | |
On July 25, 2016, Real Return Fund declared distributions from net investment income to shareholders of record on July 22, 2016. The per share amounts payable on July 26, 2016 were as follows:
| | | | |
| | | Net investment income | |
Class A | | $ | 0.01165 | |
Class B | | | 0.00000 | |
Class C | | | 0.00000 | |
Administrator Class | | | 0.01198 | |
These distributions are not reflected in the accompanying financial statements. The final determination of the source of all distributions is subject to change and made after the tax year-end of each Fund.
| | | | | | |
| Report of independent registered public accounting firm | | Wells Fargo Income Funds | | | 29 | |
BOARD OF TRUSTEES AND SHAREHOLDERS OF WELLS FARGO FUNDS TRUST:
We have audited the accompanying statements of assets and liabilities, including the portfolios of investments, of the Wells Fargo Core Bond Fund and the Wells Fargo Real Return Fund (formerly known as Wells Fargo Advantage Core Bond Fund and the Wells Fargo Advantage Real Return Fund) (the “Funds”), two of the funds constituting the Wells Fargo Funds Trust, as of May 31, 2016, and the related statements of operations for the year then ended, statements of changes in net assets for each of the years in the two-year period then ended, and the financial highlights for each of the years or periods in the five-year period then ended. These financial statements and financial highlights are the responsibility of the Funds’ management. Our responsibility is to express an opinion on these financial statements and financial highlights based on our audits.
We conducted our audits in accordance with the standards of the Public Company Accounting Oversight Board (United States). Those standards require that we plan and perform the audit to obtain reasonable assurance about whether the financial statements and financial highlights are free of material misstatement. An audit includes examining, on a test basis, evidence supporting the amounts and disclosures in the financial statements. Our procedures included confirmation of investments owned as of May 31, 2016, by correspondence with the transfer agent or by other appropriate audit procedures. An audit also includes assessing the accounting principles used and significant estimates made by management, as well as evaluating the overall financial statement presentation. We believe that our audits provide a reasonable basis for our opinion.
In our opinion, the financial statements and financial highlights referred to above present fairly, in all material respects, the financial position of the aforementioned funds of the Wells Fargo Funds Trust as of May 31, 2016, the results of their operations for the year then ended, changes in their net assets for each of the years in the two-year period then ended, and the financial highlights for each of the years or periods in the five-year period then ended, in conformity with U.S. generally accepted accounting principles.

Boston, Massachusetts
July 27, 2016
| | | | |
| 30 | | Wells Fargo Income Funds | | Summary portfolio of investments—May 31, 2016 |
CORE BOND PORTFOLIO
The Summary portfolio of investments shows the 50 largest portfolio holdings in unaffiliated issuers and any holdings exceeding 1% of the total net assets as of the report date. The remaining securities held are grouped as “Other securities” in each category.
| | | | | | | | | | | | | | | | | | | | |
| Security name | | Interest rate | | | Maturity date | | | Principal | | | Value | | | Percent of
net assets | |
| | | | | |
Agency Securities: 30.53% | | | | | | | | | | | | | | | | | | | | |
FHLMC | | | 3.00 | % | | | 2-15-2045 | | | $ | 19,734,107 | | | $ | 20,112,137 | | | | 0.46 | % |
FHLMC | | | 1.13-7.00 | | | | 8-1-2017 to 4-1-2046 | | | | 181,825,901 | | | | 193,227,923 | | | | 4.47 | |
FHLMC | | | 3.50 | | | | 7-1-2032 | | | | 15,970,400 | | | | 16,975,238 | | | | 0.39 | |
FHLMC | | | 3.50 | | | | 4-1-2044 | | | | 16,257,869 | | | | 17,198,235 | | | | 0.40 | |
FHLMC | | | 3.50 | | | | 12-1-2045 | | | | 14,237,054 | | | | 14,991,659 | | | | 0.35 | |
FHLMC | | | 3.50 | | | | 2-1-2046 | | | | 15,782,716 | | | | 16,620,139 | | | | 0.38 | |
FHLMC %% | | | 3.50 | | | | 8-16-2046 | | | | 67,700,000 | | | | 70,571,956 | | | | 1.63 | |
FHLMC | | | 4.00 | | | | 8-1-2044 | | | | 20,216,471 | | | | 21,888,997 | | | | 0.50 | |
FHLMC | | | 4.00 | | | | 10-1-2045 | | | | 14,278,557 | | | | 15,358,973 | | | | 0.35 | |
FHLMC %% | | | 4.00 | | | | 7-14-2046 | | | | 22,600,000 | | | | 24,070,270 | | | | 0.55 | |
FHLMC Series 300 Class 300 | | | 3.00 | | | | 1-15-2043 | | | | 18,852,363 | | | | 19,215,529 | | | | 0.44 | |
FNMA | | | 0.00-8.16 | | | | 4-1-2017 to 6-13-2046 | | | | 381,070,503 | | | | 404,080,072 | | | | 9.30 | |
FNMA | | | 3.00 | | | | 10-25-2042 | | | | 17,620,845 | | | | 17,947,513 | | | | 0.41 | |
FNMA | | | 3.00 | | | | 6-1-2043 | | | | 14,511,441 | | | | 14,929,579 | | | | 0.34 | |
FNMA | | | 3.50 | | | | 5-1-2031 | | | | 12,277,838 | | | | 13,123,375 | | | | 0.30 | |
FNMA | | | 3.50 | | | | 11-1-2035 | | | | 11,089,398 | | | | 11,759,608 | | | | 0.27 | |
FNMA | | | 3.50 | | | | 6-1-2045 | | | | 18,189,829 | | | | 19,162,602 | | | | 0.44 | |
FNMA | | | 3.50 | | | | 8-1-2045 | | | | 11,133,388 | | | | 11,728,810 | | | | 0.27 | |
FNMA | | | 3.50 | | | | 4-1-2046 | | | | 18,707,016 | | | | 19,752,827 | | | | 0.46 | |
FNMA %% | | | 3.50 | | | | 8-16-2046 | | | | 25,300,000 | | | | 26,402,922 | | | | 0.61 | |
FNMA | | | 4.00 | | | | 9-1-2043 | | | | 11,153,542 | | | | 12,034,251 | | | | 0.28 | |
FNMA | | | 4.00 | | | | 12-1-2044 | | | | 12,945,627 | | | | 14,049,558 | | | | 0.32 | |
FNMA | | | 4.00 | | | | 6-1-2045 | | | | 13,076,370 | | | | 14,191,462 | | | | 0.33 | |
FNMA | | | 4.50 | | | | 2-1-2044 | | | | 14,393,935 | | | | 15,894,690 | | | | 0.37 | |
GNMA | | | 3.00-5.00 | | | | 3-15-2041 to 6-21-2046 | | | | 66,418,696 | | | | 71,336,967 | | | | 1.64 | |
GNMA | | | 3.00 | | | | 8-23-2046 | | | | 75,600,000 | | | | 77,918,180 | | | | 1.80 | |
GNMA %% | | | 3.50 | | | | 8-23-2046 | | | | 96,100,000 | | | | 101,149,046 | | | | 2.33 | |
GNMA %% | | | 4.00 | | | | 2-20-2046 | | | | 32,980,001 | | | | 35,208,766 | | | | 0.81 | |
Other securities | | | | | | | | | | | | | | | 14,591,330 | | | | 0.33 | |
| | | | | |
Total Agency Securities (Cost $1,319,170,583) | | | | | | | | | | | | | | | 1,325,492,614 | | | | 30.53 | |
| | | | | | | | | | | | | | | | | | | | |
| | | | | |
Asset-Backed Securities: 13.21% | | | | | | | | | | | | | | | | | | | | |
Ally Master Owner Trust Series 2012-5 Class A | | | 1.54 | | | | 9-15-2019 | | | | 13,065,000 | | | | 13,080,442 | | | | 0.30 | |
Capital Auto Receivables Asset Trust | | | 1.39-2.01 | | | | 2-20-2018 to 10-20-2020 | | | | 74,929,605 | | | | 75,085,096 | | | | 1.72 | |
Capital One Multi Asset Execution Trust 2016-A1 Class A1 ± | | | 0.90 | | | | 2-15-2022 | | | | 17,837,000 | | | | 17,898,939 | | | | 0.41 | |
Discover Card Execution Note Series 2016-A2 Class A2 ± | | | 0.97 | | | | 9-15-2021 | | | | 16,036,000 | | | | 16,130,398 | | | | 0.37 | |
Ford Credit Auto Owner Trust | | | 0.57-2.44 | | | | 10-15-2017 to 1-15-2027 | | | | 29,620,260 | | | | 29,897,230 | | | | 0.68 | |
Ford Credit Auto Owner Trust Series 2016-1 Class A | | | 2.31 | | | | 8-15-2027 | | | | 14,875,000 | | | | 15,006,009 | | | | 0.35 | |
SLM Student Loan Trust | | | 0.68-4.37 | | | | 4-25-2019 to 1-25-2072 | | | | 133,292,178 | | | | 128,674,193 | | | | 2.96 | |
SMB Private Education Loan Trust | | | 1.03-2.98 | | | | 7-15-2022 to 5-15-2031 | | | | 64,510,684 | | | | 64,383,276 | | | | 1.49 | |
Synchrony Credit Card Master Note Trust Series 2016-2 Class A | | | 2.21 | | | | 5-15-2024 | | | | 12,411,000 | | | | 12,410,516 | | | | 0.29 | |
Other securities | | | | | | | | | | | | | | | 201,066,440 | | | | 4.64 | |
| | | | | |
Total Asset-Backed Securities (Cost $575,588,312) | | | | | | | | | | | | | | | 573,632,539 | | | | 13.21 | |
| | | | | | | | | | | | | | | | | | | | |
The accompanying notes are an integral part of these financial statements.
| | | | | | |
| Summary portfolio of investments—May 31, 2016 | | Wells Fargo Income Funds | | | 31 | |
CORE BOND PORTFOLIO
| | | | | | | | | | | | | | | | | | | | |
| Security name | | Interest rate | | | Maturity date | | | Principal | | | Value | | | Percent of
net assets | |
| | | | | |
Corporate Bonds and Notes: 18.68% | | | | | | | | | | | | | | | | | | | | |
| | | | | |
Consumer Discretionary: 1.47% | | | | | | | | | | | | | | | | | | | | |
| | | | | |
| Automobiles: 0.39% | | | | | | | | | | | | | | | | | | | | |
Other securities | | | | | | | | | | | | | | $ | 16,790,759 | | | | 0.39 | % |
| | | | | | | | | | | | | | | | | | | | |
| | | | | |
| Hotels, Restaurants & Leisure: 0.21% | | | | | | | | | | | | | | | | | | | | |
Other securities | | | | | | | | | | | | | | | 9,333,120 | | | | 0.21 | |
| | | | | | | | | | | | | | | | | | | | |
| | | | | |
| Household Durables: 0.12% | | | | | | | | | | | | | | | | | | | | |
Other securities | | | | | | | | | | | | | | | 5,323,211 | | | | 0.12 | |
| | | | | | | | | | | | | | | | | | | | |
| | | | | |
| Media: 0.75% | | | | | | | | | | | | | | | | | | | | |
Other securities | | | | | | | | | | | | | | | 32,431,634 | | | | 0.75 | |
| | | | | | | | | | | | | | | | | | | | |
| | | | | |
Consumer Staples: 1.79% | | | | | | | | | | | | | | | | | | | | |
| | | | | |
| Beverages: 0.55% | | | | | | | | | | | | | | | | | | | | |
Anheuser-Busch InBev Finance Company | | | 3.65 | % | | | 2-1-2026 | | | $ | 11,459,000 | | | | 11,908,136 | | | | 0.27 | |
Other securities | | | | | | | | | | | | | | | 12,195,876 | | | | 0.28 | |
| | |
| | | | 24,104,012 | | | | 0.55 | |
| | | | | | | | | | | | | | | | | | | | |
| | | | | |
| Food & Staples Retailing: 0.22% | | | | | | | | | | | | | | | | | | | | |
Other securities | | | | | | | | | | | | | | | 9,490,939 | | | | 0.22 | |
| | | | | | | | | | | | | | | | | | | | |
| | | | | |
| Food Products: 0.64% | | | | | | | | | | | | | | | | | | | | |
Other securities | | | | | | | | | | | | | | | 27,665,603 | | | | 0.64 | |
| | | | | | | | | | | | | | | | | | | | |
| | | | | |
| Tobacco: 0.38% | | | | | | | | | | | | | | | | | | | | |
Other securities | | | | | | | | | | | | | | | 16,495,109 | | | | 0.38 | |
| | | | | | | | | | | | | | | | | | | | |
| | | | | |
Energy: 2.19% | | | | | | | | | | | | | | | | | | | | |
| | | | | |
| Energy Equipment & Services: 0.12% | | | | | | | | | | | | | | | | | | | | |
Other securities | | | | | | | | | | | | | | | 5,100,096 | | | | 0.12 | |
| | | | | | | | | | | | | | | | | | | | |
| | | | | |
| Oil, Gas & Consumable Fuels: 2.07% | | | | | | | | | | | | | | | | | | | | |
Other securities | | | | | | | | | | | | | | | 89,794,938 | | | | 2.07 | |
| | | | | | | | | | | | | | | | | | | | |
| | | | | |
Financials: 6.62% | | | | | | | | | | | | | | | | | | | | |
| | | | | |
| Banks: 1.96% | | | | | | | | | | | | | | | | | | | | |
Other securities | | | | | | | | | | | | | | | 84,870,363 | | | | 1.96 | |
| | | | | | | | | | | | | | | | | | | | |
| | | | | |
| Capital Markets: 1.47% | | | | | | | | | | | | | | | | | | | | |
Morgan Stanley | | | 4.00 | | | | 7-23-2025 | | | | 14,175,000 | | | | 14,883,509 | | | | 0.34 | |
Other securities | | | | | | | | | | | | | | | 48,796,760 | | | | 1.13 | |
| | |
| | | | 63,680,269 | | | | 1.47 | |
| | | | | | | | | | | | | | | | | | | | |
| | | | | |
| Consumer Finance: 1.26% | | | | | | | | | | | | | | | | | | | | |
Other securities | | | | | | | | | | | | | | | 54,689,470 | | | | 1.26 | |
| | | | | | | | | | | | | | | | | | | | |
| | | | | |
| Diversified Financial Services: 0.41% | | | | | | | | | | | | | | | | | | | | |
Other securities | | | | | | | | | | | | | | | 18,004,368 | | | | 0.41 | |
| | | | | | | | | | | | | | | | | | | | |
The accompanying notes are an integral part of these financial statements.
| | | | |
| 32 | | Wells Fargo Income Funds | | Summary portfolio of investments—May 31, 2016 |
CORE BOND PORTFOLIO
| | | | | | | | | | | | | | | | | | | | |
| Security name | | | | | | | | | | | Value | | | Percent of
net assets | |
| | | | | |
| Insurance: 0.56% | | | | | | | | | | | | | | | | | | | | |
Other securities | | | | | | | | | | | | | | $ | 24,416,968 | | | | 0.56 | % |
| | | | | | | | | | | | | | | | | | | | |
| | | | | |
| IT Services: 0.08% | | | | | | | | | | | | | | | | | | | | |
Other securities | | | | | | | | | | | | | | | 3,627,502 | | | | 0.08 | |
| | | | | | | | | | | | | | | | | | | | |
| | | | | |
| REITs: 0.81% | | | | | | | | | | | | | | | | | | | | |
Other securities | | | | | | | | | | | | | | | 34,986,918 | | | | 0.81 | |
| | | | | | | | | | | | | | | | | | | | |
| | | | | |
Health Care: 1.26% | | | | | | | | | | | | | | | | | | | | |
| | | | | |
| Biotechnology: 0.62% | | | | | | | | | | | | | | | | | | | | |
Other securities | | | | | | | | | | | | | | | 27,065,449 | | | | 0.62 | |
| | | | | | | | | | | | | | | | | | | | |
| | | | | |
| Health Care Providers & Services: 0.24% | | | | | | | | | | | | | | | | | | | | |
Other securities | | | | | | | | | | | | | | | 10,330,033 | | | | 0.24 | |
| | | | | | | | | | | | | | | | | | | | |
| | | | | |
| Pharmaceuticals: 0.40% | | | | | | | | | | | | | | | | | | | | |
Other securities | | | | | | | | | | | | | | | 17,152,759 | | | | 0.40 | |
| | | | | | | | | | | | | | | | | | | | |
| | | | | |
Industrials: 0.90% | | | | | | | | | | | | | | | | | | | | |
| | | | | |
| Aerospace & Defense: 0.39% | | | | | | | | | | | | | | | | | | | | |
Other securities | | | | | | | | | | | | | | | 16,878,061 | | | | 0.39 | |
| | | | | | | | | | | | | | | | | | | | |
| | | | | |
| Air Freight & Logistics: 0.07% | | | | | | | | | | | | | | | | | | | | |
Other securities | | | | | | | | | | | | | | | 3,042,489 | | | | 0.07 | |
| | | | | | | | | | | | | | | | | | | | |
| | | | | |
| Construction & Engineering: 0.05% | | | | | | | | | | | | | | | | | | | | |
Other securities | | | | | | | | | | | | | | | 2,051,187 | | | | 0.05 | |
| | | | | | | | | | | | | | | | | | | | |
| | | | | |
| Road & Rail: 0.33% | | | | | | | | | | | | | | | | | | | | |
Other securities | | | | | | | | | | | | | | | 14,331,886 | | | | 0.33 | |
| | | | | | | | | | | | | | | | | | | | |
| | | | | |
| Transportation Infrastructure: 0.06% | | | | | | | | | | | | | | | | | | | | |
Other securities | | | | | | | | | | | | | | | 2,872,293 | | | | 0.06 | |
| | | | | | | | | | | | | | | | | | | | |
| | | | | |
Information Technology: 1.12% | | | | | | | | | | | | | | | | | | | | |
| | | | | |
| IT Services: 0.39% | | | | | | | | | | | | | | | | | | | | |
Other securities | | | | | | | | | | | | | | | 17,009,696 | | | | 0.39 | |
| | | | | | | | | | | | | | | | | | | | |
| | | | | |
| Semiconductors & Semiconductor Equipment: 0.19% | | | | | | | | | | | | | | | | | | | | |
Other securities | | | | | | | | | | | | | | | 8,081,238 | | | | 0.19 | |
| | | | | | | | | | | | | | | | | | | | |
| | | | | |
| Technology Hardware, Storage & Peripherals: 0.54% | | | | | | | | | | | | | | | | | | | | |
Other securities | | | | | | | | | | | | | | | 23,380,313 | | | | 0.54 | |
| | | | | | | | | | | | | | | | | | | | |
| | | | | |
Materials: 0.24% | | | | | | | | | | | | | | | | | | | | |
| | | | | |
| Chemicals: 0.08% | | | | | | | | | | | | | | | | | | | | |
Other securities | | | | | | | | | | | | | | | 3,409,272 | | | | 0.08 | |
| | | | | | | | | | | | | | | | | | | | |
The accompanying notes are an integral part of these financial statements.
| | | | | | |
| Summary portfolio of investments—May 31, 2016 | | Wells Fargo Income Funds | | | 33 | |
CORE BOND PORTFOLIO
| | | | | | | | | | | | | | | | | | | | |
| Security name | | Interest rate | | | Maturity date | | | Principal | | | Value | | | Percent of
net assets | |
| | | | | |
| Containers & Packaging: 0.09% | | | | | | | | | | | | | | | | | | | | |
Other securities | | | | | | | | | | | | | | $ | 3,845,910 | | | | 0.09 | % |
| | | | | | | | | | | | | | | | | | | | |
| | | | | |
| Metals & Mining: 0.07% | | | | | | | | | | | | | | | | | | | | |
Other securities | | | | | | | | | | | | | | | 3,177,317 | | | | 0.07 | |
| | | | | | | | | | | | | | | | | | | | |
| | | | | |
Telecommunication Services: 1.57% | | | | | | | | | | | | | | | | | | | | |
| | | | |
| Diversified Telecommunication Services: 1.57% | | | | | | | | | | | | | | | | | |
AT&T Incorporated | | | 2.80-4.80 | % | | | 2-17-2021 to 6-15-2044 | | | $ | 48,304,000 | | | | 49,578,672 | | | | 1.14 | |
Other securities | | | | | | | | | | | | | | | 18,544,041 | | | | 0.43 | |
| | | | | |
| | | | | | | | | | | | | | | 68,122,713 | | | | 1.57 | |
| | | | | | | | | | | | | | | | | | | | |
| | | | | |
Utilities: 1.59% | | | | | | | | | | | | | | | | | | | | |
| | | | | |
| Electric Utilities: 1.03% | | | | | | | | | | | | | | | | | | | | |
Other securities | | | | | | | | | | | | | | | 44,726,698 | | | | 1.03 | |
| | | | | | | | | | | | | | | | | | | | |
| | | | | |
| Gas Utilities: 0.11% | | | | | | | | | | | | | | | | | | | | |
Other securities | | | | | | | | | | | | | | | 4,745,775 | | | | 0.11 | |
| | | | | | | | | | | | | | | | | | | | |
| | | | | |
| Multi-Utilities: 0.45% | | | | | | | | | | | | | | | | | | | | |
Other securities | | | | | | | | | | | | | | | 19,639,222 | | | | 0.45 | |
| | | | | | | | | | | | | | | | | | | | |
| | | | | |
Total Corporate Bonds and Notes (Cost $793,938,757) | | | | | | | | | | | | | | | 810,667,590 | | | | 18.68 | |
| | | | | | | | | | | | | | | | | | | | |
| | | | | |
Municipal Obligations: 0.92% | | | | | | | | | | | | | | | | | | | | |
| | | | | |
| California: 0.27% | | | | | | | | | | | | | | | | | | | | |
Other securities | | | | | | | | | | | | | | | 11,581,748 | | | | 0.27 | |
| | | | | | | | | | | | | | | | | | | | |
| | | | | |
| Nevada: 0.19% | | | | | | | | | | | | | | | | | | | | |
Other securities | | | | | | | | | | | | | | | 8,326,483 | | | | 0.19 | |
| | | | | | | | | | | | | | | | | | | | |
| | | | | |
| New Jersey: 0.16% | | | | | | | | | | | | | | | | | | | | |
Other securities | | | | | | | | | | | | | | | 6,984,507 | | | | 0.16 | |
| | | | | | | | | | | | | | | | | | | | |
| | | | | |
| New York: 0.12% | | | | | | | | | | | | | | | | | | | | |
Other securities | | | | | | | | | | | | | | | 5,337,684 | | | | 0.12 | |
| | | | | | | | | | | | | | | | | | | | |
| | | | | |
| Ohio: 0.03% | | | | | | | | | | | | | | | | | | | | |
Other securities | | | | | | | | | | | | | | | 1,465,329 | | | | 0.03 | |
| | | | | | | | | | | | | | | | | | | | |
| | | | | |
| Texas: 0.15% | | | | | | | | | | | | | | | | | | | | |
Other securities | | | | | | | | | | | | | | | 6,258,708 | | | | 0.15 | |
| | | | | | | | | | | | | | | | | | | | |
| | | | | |
Total Municipal Obligations (Cost $32,423,389) | | | | | | | | | | | | | | | 39,954,459 | | | | 0.92 | |
| | | | | | | | | | | | | | | | | | | | |
| | | | |
Non-Agency Mortgage-Backed Securities: 3.10% | | | | | | | | | | | | | | | | | |
Other securities | | | | | | | | | | | | | | | 134,383,718 | | | | 3.10 | |
| | | | | |
Total Non-Agency Mortgage-Backed Securities (Cost $131,754,696) | | | | | | | | | | | | | | | 134,383,718 | | | | 3.10 | |
| | | | | | | | | | | | | | | | | | | | |
The accompanying notes are an integral part of these financial statements.
| | | | |
| 34 | | Wells Fargo Income Funds | | Summary portfolio of investments—May 31, 2016 |
CORE BOND PORTFOLIO
| | | | | | | | | | | | | | | | | | | | |
| Security name | | Interest rate | | | Maturity date | | | Principal | | | Value | | | Percent of
net assets | |
| | | | | |
U.S. Treasury Securities: 30.51% | | | | | | | | | | | | | | | | | | | | |
U.S. Treasury Bond | | | 2.50 | % | | | 2-15-2046 | | | $ | 97,270,000 | | | $ | 94,348,106 | | | | 2.17 | % |
U.S. Treasury Bond | | | 2.50 | | | | 5-15-2046 | | | | 21,802,000 | | | | 21,169,241 | | | | 0.49 | |
U.S. Treasury Bond ## | | | 2.88 | | | | 8-15-2045 | | | | 28,446,000 | | | | 29,807,198 | | | | 0.69 | |
U.S. Treasury Note | | | 0.75 | | | | 1-31-2018 | | | | 117,195,000 | | | | 116,984,401 | | | | 2.69 | |
U.S. Treasury Note | | | 0.75 | | | | 4-30-2018 | | | | 37,441,000 | | | | 37,348,858 | | | | 0.86 | |
U.S. Treasury Note | | | 0.88 | | | | 11-30-2017 | | | | 17,550,000 | | | | 17,562,338 | | | | 0.40 | |
U.S. Treasury Note | | | 0.88 | | | | 3-31-2018 | | | | 145,749,000 | | | | 145,737,632 | | | | 3.36 | |
U.S. Treasury Note | | | 0.88 | | | | 5-31-2018 | | | | 31,597,000 | | | | 31,590,839 | | | | 0.73 | |
U.S. Treasury Note | | | 0.88 | | | | 4-15-2019 | | | | 156,804,000 | | | | 156,130,213 | | | | 3.60 | |
U.S. Treasury Note ## | | | 0.88 | | | | 5-15-2019 | | | | 162,591,000 | | | | 161,828,773 | | | | 3.73 | |
U.S. Treasury Note | | | 1.00 | | | | 5-15-2018 | | | | 31,525,000 | | | | 31,587,798 | | | | 0.73 | |
U.S. Treasury Note | | | 1.25 | | | | 3-31-2021 | | | | 24,971,000 | | | | 24,820,774 | | | | 0.57 | |
U.S. Treasury Note | | | 1.38 | | | | 1-31-2021 | | | | 208,632,000 | | | | 208,697,093 | | | | 4.81 | |
U.S. Treasury Note | | | 1.38 | | | | 5-31-2021 | | | | 108,284,000 | | | | 108,300,892 | | | | 2.49 | |
U.S. Treasury Note | | | 1.63 | | | | 11-30-2020 | | | | 63,040,000 | | | | 63,830,459 | | | | 1.47 | |
U.S. Treasury Note | | | 1.63 | | | | 5-31-2023 | | | | 16,178,000 | | | | 16,107,221 | | | | 0.37 | |
U.S. Treasury Note | | | 1.63 | | | | 2-15-2026 | | | | 29,111,000 | | | | 28,513,992 | | | | 0.66 | |
U.S. Treasury Note | | | 1.63 | | | | 5-15-2026 | | | | 30,682,000 | | | | 30,074,343 | | | | 0.69 | |
| | |
Total U.S. Treasury Securities (Cost $1,322,216,760) | | | | 1,324,440,171 | | | | 30.51 | |
| | | | | | | | | | | | | | | | | | | | |
| | | | | |
Yankee Corporate Bonds and Notes: 5.22% | | | | | | | | | | | | | | | | | | | | |
| | | | | |
Consumer Discretionary: 0.20% | | | | | | | | | | | | | | | | | | | | |
| | | | | |
| Media: 0.20% | | | | | | | | | | | | | | | | | | | | |
Other securities | | | | | | | | | | | | | | | 8,574,676 | | | | 0.20 | |
| | | | | | | | | | | | | | | | | | | | |
| | | | | |
Energy: 0.68% | | | | | | | | | | | | | | | | | | | | |
| | | | | |
| Oil, Gas & Consumable Fuels: 0.68% | | | | | | | | | | | | | | | | | | | | |
Other securities | | | | | | | | | | | | | | | 29,720,643 | | | | 0.68 | |
| | | | | | | | | | | | | | | | | | | | |
| | | | | |
Financials: 3.25% | | | | | | | | | | | | | | | | | | | | |
| | | | | |
| Banks: 2.62% | | | | | | | | | | | | | | | | | | | | |
Other securities | | | | | | | | | | | | | | | 113,661,490 | | | | 2.62 | |
| | | | | | | | | | | | | | | | | | | | |
| | | | | |
| Consumer Finance: 0.14% | | | | | | | | | | | | | | | | | | | | |
Other securities | | | | | | | | | | | | | | | 6,064,000 | | | | 0.14 | |
| | | | | | | | | | | | | | | | | | | | |
| | | | | |
| Diversified Financial Services: 0.35% | | | | | | | | | | | | | | | | | | | | |
Other securities | | | | | | | | | | | | | | | 15,352,266 | | | | 0.35 | |
| | | | | | | | | | | | | | | | | | | | |
| | | | | |
| Insurance: 0.14% | | | | | | | | | | | | | | | | | | | | |
Other securities | | | | | | | | | | | | | | | 6,005,914 | | | | 0.14 | |
| | | | | | | | | | | | | | | | | | | | |
| | | | | |
Health Care: 0.66% | | | | | | | | | | | | | | | | | | | | |
| | | | | |
| Pharmaceuticals: 0.66% | | | | | | | | | | | | | | | | | | | | |
Other securities | | | | | | | | | | | | | | | 28,544,631 | | | | 0.66 | |
| | | | | | | | | | | | | | | | | | | | |
| | | | | |
Industrials: 0.07% | | | | | | | | | | | | | | | | | | | | |
| | | | | |
| Marine: 0.07% | | | | | | | | | | | | | | | | | | | | |
Other securities | | | | | | | | | | | | | | | 3,165,798 | | | | 0.07 | |
| | | | | | | | | | | | | | | | | | | | |
The accompanying notes are an integral part of these financial statements.
| | | | | | |
| Summary portfolio of investments—May 31, 2016 | | Wells Fargo Income Funds | | | 35 | |
CORE BOND PORTFOLIO
| | | | | | | | | | | | | | | | | | | | |
| Security name | | | | | | | | | | | Value | | | Percent of
net assets | |
| | | | | |
Information Technology: 0.09% | | | | | | | | | | | | | | | | | | | | |
| | | | | |
| Internet Software & Services: 0.09% | | | | | | | | | | | | | | | | | | | | |
Other securities | | | | | | | | | | | | | | $ | 3,939,050 | | | | 0.09 | % |
| | | | | | | | | | | | | | | | | | | | |
| | | | | |
Materials: 0.19% | | | | | | | | | | | | | | | | | | | | |
| | | | | |
| Chemicals: 0.04% | | | | | | | | | | | | | | | | | | | | |
Other securities | | | | | | | | | | | | | | | 1,713,181 | | | | 0.04 | |
| | | | | | | | | | | | | | | | | | | | |
| | | | | |
| Metals & Mining: 0.15% | | | | | | | | | | | | | | | | | | | | |
Other securities | | | | | | | | | | | | | | | 6,378,982 | | | | 0.15 | |
| | | | | | | | | | | | | | | | | | | | |
| | | | | |
Utilities: 0.08% | | | | | | | | | | | | | | | | | | | | |
| | | | | |
| Electric Utilities: 0.08% | | | | | | | | | | | | | | | | | | | | |
Other securities | | | | | | | | | | | | | | | 3,426,208 | | | | 0.08 | |
| | | | | | | | | | | | | | | | | | | | |
| | |
Total Yankee Corporate Bonds and Notes (Cost $224,850,713) | | | | 226,546,839 | | | | 5.22 | |
| | | | | | | | | | | | | | | | | | | | |
| | | | | |
Yankee Government Bonds: 2.19% | | | | | | | | | | | | | | | | | | | | |
Other securities | | | | | | | | | | | | | | | 95,050,298 | | | | 2.19 | |
| | | | | | | | | | | | | | | | | | | | |
| | |
Total Yankee Government Bonds (Cost $93,245,320) | | | | 95,050,298 | | | | 2.19 | |
| | | | | | | | | | | | | | | | | | | | |
| | | | | |
| | | Yield | | | | | | Shares | | | | | | | |
| Short-Term Investments: 4.57% | | | | | | | | | | | | | | | | | | | | |
| | | | | |
| Investment Companies: 4.57% | | | | | | | | | | | | | | | | | | | | |
Wells Fargo Cash Investment Money Market Fund Select Class (l)(u)## | | | 0.41 | % | | | | | | | 198,368,365 | | | | 198,368,365 | | | | 4.57 | |
| | | | | | | | | | | | | | | | | | | | |
| | |
Total Short-Term Investments (Cost $198,368,365) | | | | 198,368,365 | | | | 4.57 | |
| | | | | | | | | | | | | | | | | | | | |
| | | | | |
| Total investments in securities (Cost $4,691,556,895) * | | | | | | | | | | | | | | | 4,728,536,593 | | | | 108.93 | |
Other assets and liabilities, net | | | | | | | | | | | | | | | (387,701,535 | ) | | | (8.93 | ) |
| | | | | | | | | | | | | | | | | | | | |
| Total net assets | | | | | | | | | | | | | | $ | 4,340,835,058 | | | | 100.00 | % |
| | | | | | | | | | | | | | | | | | | | |
| %% | The security is issued on a when-issued basis. |
| ± | Variable rate investment. The rate shown is the rate in effect at period end. |
| ## | All or a portion of this security is segregated for when-issued securities. |
| (l) | The issuer of the security is an affiliated person of the Portfolio as defined in the Investment Company Act of 1940. |
| (u) | The rate represents the 7-day annualized yield at period end. |
| * | Cost for federal income tax purposes is $4,697,050,907 and unrealized gains (losses) consists of: |
| | | | |
Gross unrealized gains | | $ | 47,813,964 | |
Gross unrealized losses | | | (16,328,278 | ) |
| | | | |
Net unrealized gains | | $ | 31,485,686 | |
The accompanying notes are an integral part of these financial statements.
| | | | |
| 36 | | Wells Fargo Income Funds | | Portfolio of investments—May 31, 2016 |
REAL RETURN PORTFOLIO
| | | | | | | | | | | | | | | | |
| Security name | | | | | | | | Shares | | | Value | |
| | | | |
Common Stocks: 16.92% | | | | | | | | | | | | | | | | |
| | | | |
Consumer Staples: 3.87% | | | | | | | | | | | | | | | | |
| | | | |
| Beverages: 0.39% | | | | | | | | | | | | | | | | |
Constellation Brands Incorporated Class A | | | | | | | | | | | 697 | | | $ | 106,746 | |
The Coca-Cola Company | | | | | | | | | | | 3,173 | | | | 141,516 | |
| |
| | | | 248,262 | |
| | | | | |
| | | | |
| Food & Staples Retailing: 0.55% | | | | | | | | | | | | | | | | |
The Kroger Company | | | | | | | | | | | 2,083 | | | | 74,488 | |
Wal-Mart Stores Incorporated | | | | | | | | | | | 1,764 | | | | 124,856 | |
Walgreens Boots Alliance Incorporated | | | | | | | | | | | 2,009 | | | | 155,497 | |
| |
| | | | 354,841 | |
| | | | | |
| | | | |
| Food Products: 1.38% | | | | | | | | | | | | | | | | |
Biostime International Holdings Limited | | | | | | | | | | | 176,000 | | | | 537,915 | |
Marine Harvest ASA | | | | | | | | | | | 4,555 | | | | 76,065 | |
Mead Johnson Nutrition Company | | | | | | | | | | | 970 | | | | 79,812 | |
Mondelez International Incorporated Class A | | | | | | | | | | | 2,400 | | | | 106,776 | |
The Hershey Company | | | | | | | | | | | 909 | | | | 84,401 | |
| |
| | | | 884,969 | |
| | | | | |
| | | | |
| Household Products: 1.22% | | | | | | | | | | | | | | | | |
Church & Dwight Company Incorporated | | | | | | | | | | | 1,092 | | | | 107,540 | |
Reckitt Benckiser Group plc | | | | | | | | | | | 4,568 | | | | 454,854 | |
The Procter & Gamble Company | | | | | | | | | | | 2,721 | | | | 220,510 | |
| |
| | | | 782,904 | |
| | | | | |
| | | | |
| Personal Products: 0.08% | | | | | | | | | | | | | | | | |
The Estee Lauder Companies Incorporated Class A | | | | | | | | | | | 574 | | | | 52,682 | |
| | | | | | | | | | | | | | | | |
| | | | |
| Tobacco: 0.25% | | | | | | | | | | | | | | | | |
Philip Morris International | | | | | | | | | | | 1,604 | | | | 158,283 | |
| | | | | | | | | | | | | | | | |
| | | | |
Energy: 3.41% | | | | | | | | | | | | | | | | |
| | | | |
| Energy Equipment & Services: 0.34% | | | | | | | | | | | | | | | | |
Halliburton Company | | | | | | | | | | | 2,474 | | | | 104,353 | |
Schlumberger Limited | | | | | | | | | | | 876 | | | | 66,839 | |
Weatherford International plc † | | | | | | | | | | | 8,288 | | | | 46,496 | |
| |
| | | | 217,688 | |
| | | | | |
| | | | |
| Oil, Gas & Consumable Fuels: 3.07% | | | | | | | | | | | | | | | | |
Anadarko Petroleum Corporation | | | | | | | | | | | 1,640 | | | | 85,050 | |
BP plc | | | | | | | | | | | 104,961 | | | | 543,092 | |
Chevron Corporation | | | | | | | | | | | 2,867 | | | | 289,567 | |
Cimarex Energy Company | | | | | | | | | | | 927 | | | | 107,792 | |
Eni SpA | | | | | | | | | | | 32,056 | | | | 489,710 | |
EOG Resources Incorporated | | | | | | | | | | | 1,489 | | | | 121,145 | |
Occidental Petroleum Corporation | | | | | | | | | | | 1,817 | | | | 137,074 | |
Phillips 66 Company | | | | | | | | | | | 640 | | | | 51,430 | |
The accompanying notes are an integral part of these financial statements.
| | | | | | |
| Portfolio of investments—May 31, 2016 | | Wells Fargo Income Funds | | | 37 | |
REAL RETURN PORTFOLIO
| | | | | | | | | | | | | | | | |
| Security name | | | | | | | | Shares | | | Value | |
| | | | |
| Oil, Gas & Consumable Fuels (continued) | | | | | | | | | | | | | | | | |
Pioneer Natural Resources Company | | | | | | | | | | | 603 | | | $ | 96,673 | |
Valero Energy Corporation | | | | | | | | | | | 848 | | | | 46,386 | |
| | | | |
| | | | | | | | | | | | | | | 1,967,919 | |
| | | | | | | | | | | | | | | | |
| | | | |
Financials: 4.49% | | | | | | | | | | | | | | | | |
| | | | |
| REITs: 4.49% | | | | | | | | | | | | | | | | |
American Homes 4 Rent Class A | | | | | | | | | | | 3,735 | | | | 68,500 | |
American Tower Corporation | | | | | | | | | | | 4,616 | | | | 488,280 | |
AvalonBay Communities Incorporated | | | | | | | | | | | 1,406 | | | | 252,911 | |
Boston Properties Incorporated | | | | | | | | | | | 2,087 | | | | 262,190 | |
Camden Property Trust | | | | | | | | | | | 1,931 | | | | 164,541 | |
Equinix Incorporated | | | | | | | | | | | 446 | | | | 161,452 | |
Essex Property Trust Incorporated | | | | | | | | | | | 384 | | | | 87,256 | |
General Growth Properties Incorporated | | | | | | | | | | | 9,763 | | | | 262,332 | |
Host Hotels & Resorts Incorporated | | | | | | | | | | | 6,728 | | | | 103,611 | |
Physicians Realty Trust | | | | | | | | | | | 12,864 | | | | 244,287 | |
Prologis Incorporated | | | | | | | | | | | 4,182 | | | | 198,770 | |
Public Storage Incorporated | | | | | | | | | | | 560 | | | | 142,078 | |
Simon Property Group Incorporated | | | | | | | | | | | 1,418 | | | | 280,254 | |
Ventas Incorporated | | | | | | | | | | | 2,466 | | | | 163,570 | |
| | | | |
| | | | | | | | | | | | | | | 2,880,032 | |
| | | | | | | | | | | | | | | | |
| | | | |
Materials: 5.15% | | | | | | | | | | | | | | | | |
| | | | |
| Chemicals: 2.57% | | | | | | | | | | | | | | | | |
Akzo Nobel NV | | | | | | | | | | | 8,858 | | | | 601,207 | |
Dow Chemical Company | | | | | | | | | | | 1,751 | | | | 89,931 | |
Ecolab Incorporated | | | | | | | | | | | 436 | | | | 51,117 | |
International Flavors & Fragrances Incorporated | | | | | | | | | | | 253 | | | | 32,637 | |
LyondellBasell Industries NV Class A | | | | | | | | | | | 290 | | | | 23,594 | |
Monsanto Company | | | | | | | | | | | 244 | | | | 27,443 | |
Nitto Denko Corporation | | | | | | | | | | | 10,400 | | | | 684,560 | |
PolyOne Corporation | | | | | | | | | | | 875 | | | | 32,786 | |
PPG Industries Incorporated | | | | | | | | | | | 504 | | | | 54,271 | |
Praxair Incorporated | | | | | | | | | | | 468 | | | | 51,414 | |
| | | | |
| | | | | | | | | | | | | | | 1,648,960 | |
| | | | | | | | | | | | | | | | |
| | | | |
| Construction Materials: 0.08% | | | | | | | | | | | | | | | | |
Martin Marietta Materials Incorporated | | | | | | | | | | | 267 | | | | 50,474 | |
| | | | | | | | | | | | | | | | |
| | | | |
| Containers & Packaging: 0.09% | | | | | | | | | | | | | | | | |
Crown Holdings Incorporated † | | | | | | | | | | | 1,051 | | | | 54,831 | |
| | | | | | | | | | | | | | | | |
| | | | |
| Metals & Mining: 2.41% | | | | | | | | | | | | | | | | |
Agnico-Eagle Mines Limited-U.S. Exchange Traded Shares | | | | | | | | | | | 4,600 | | | | 206,632 | |
Detour Gold Corporation † | | | | | | | | | | | 9,800 | | | | 193,631 | |
Fresnillo plc | | | | | | | | | | | 8,800 | | | | 128,602 | |
Goldcorp Incorporated-U.S. Exchange Traded Shares | | | | | | | | | | | 5,500 | | | | 92,510 | |
Newmont Mining Corporation | | | | | | | | | | | 8,600 | | | | 278,726 | |
Randgold Resources Limited ADR | | | | | | | | | | | 2,850 | | | | 240,284 | |
The accompanying notes are an integral part of these financial statements.
| | | | |
| 38 | | Wells Fargo Income Funds | | Portfolio of investments—May 31, 2016 |
REAL RETURN PORTFOLIO
| | | | | | | | | | | | | | | | |
| Security name | | | | | | | | Shares | | | Value | |
| | | | |
| Metals & Mining (continued) | | | | | | | | | | | | | | | | |
Royal Gold Incorporated | | | | | | | | | | | 2,377 | | | $ | 133,421 | |
Silver Wheaton Corporation | | | | | | | | | | | 7,000 | | | | 130,340 | |
Steel Dynamics Incorporated | | | | | | | | | | | 1,880 | | | | 46,417 | |
Tahoe Resources Incorporated | | | | | | | | | | | 8,000 | | | | 95,535 | |
| | | | |
| | | | | | | | | | | | | | | 1,546,098 | |
| | | | | | | | | | | | | | | | |
| | | | |
Total Common Stocks (Cost $10,010,837) | | | | | | | | | | | | | | | 10,847,943 | |
| | | | | | | | | | | | | | | | |
| | | | |
| | | Interest rate | | | Maturity date | | | Principal | | | | |
| Corporate Bonds and Notes: 10.42% | | | | | | | | | | | | | | | | |
| | | | |
Consumer Discretionary: 3.77% | | | | | | | | | | | | | | | | |
| | | | |
| Auto Components: 0.53% | | | | | | | | | | | | | | | | |
American Axle & Manufacturing Incorporated | | | 6.25 | % | | | 3-15-2021 | | | $ | 100,000 | | | | 104,000 | |
Cooper Tire & Rubber Company (i) | | | 8.00 | | | | 12-15-2019 | | | | 15,000 | | | | 17,138 | |
Goodyear Tire & Rubber Company | | | 7.00 | | | | 5-15-2022 | | | | 85,000 | | | | 91,269 | |
Tenneco Incorporated | | | 6.88 | | | | 12-15-2020 | | | | 125,000 | | | | 129,525 | |
| | | | |
| | | | | | | | | | | | | | | 341,932 | |
| | | | | | | | | | | | | | | | |
| | | | |
| Diversified Consumer Services: 0.16% | | | | | | | | | | | | | | | | |
Service Corporation International | | | 5.38 | | | | 1-15-2022 | | | | 100,000 | | | | 104,375 | |
| | | | | | | | | | | | | | | | |
| | | | |
| Hotels, Restaurants & Leisure: 0.53% | | | | | | | | | | | | | | | | |
Hilton Worldwide Finance LLC | | | 5.63 | | | | 10-15-2021 | | | | 100,000 | | | | 103,561 | |
MGM Resorts International | | | 7.63 | | | | 1-15-2017 | | | | 105,000 | | | | 108,281 | |
NCL Corporation Limited 144A | | | 5.25 | | | | 11-15-2019 | | | | 125,000 | | | | 127,500 | |
| | | | |
| | | | | | | | | | | | | | | 339,342 | |
| | | | | | | | | | | | | | | | |
| | | | |
| Household Durables: 0.57% | | | | | | | | | | | | | | | | |
Calatlantic Group Incorporated | | | 6.63 | | | | 5-1-2020 | | | | 15,000 | | | | 16,538 | |
DR Horton Incorporated | | | 3.63 | | | | 2-15-2018 | | | | 135,000 | | | | 137,363 | |
Lennar Corporation | | | 4.50 | | | | 6-15-2019 | | | | 100,000 | | | | 103,250 | |
Tempur Sealy International Incorporated | | | 6.88 | | | | 12-15-2020 | | | | 100,000 | | | | 106,320 | |
| | | | |
| | | | | | | | | | | | | | | 363,471 | |
| | | | | | | | | | | | | | | | |
| | | | |
| Media: 0.93% | | | | | | | | | | | | | | | | |
CCO Holdings LLC | | | 6.63 | | | | 1-31-2022 | | | | 125,000 | | | | 132,625 | |
CSC Holdings LLC | | | 7.63 | | | | 7-15-2018 | | | | 75,000 | | | | 81,375 | |
DISH DBS Corporation | | | 4.25 | | | | 4-1-2018 | | | | 130,000 | | | | 133,250 | |
Nexstar Broadcasting Group Incorporated | | | 6.88 | | | | 11-15-2020 | | | | 75,000 | | | | 78,188 | |
Sinclair Television Group Incorporated | | | 6.38 | | | | 11-1-2021 | | | | 85,000 | | | | 89,675 | |
TEGNA Incorporated | | | 5.13 | | | | 10-15-2019 | | | | 50,000 | | | | 51,375 | |
TEGNA Incorporated | | | 5.13 | | | | 7-15-2020 | | | | 30,000 | | | | 31,050 | |
| | | | |
| | | | | | | | | | | | | | | 597,538 | |
| | | | | | | | | | | | | | | | |
| | | | |
| Multiline Retail: 0.16% | | | | | | | | | | | | | | | | |
Dollar Tree Incorporated 144A | | | 5.25 | | | | 3-1-2020 | | | | 100,000 | | | | 104,219 | |
| | | | | | | | | | | | | | | | |
The accompanying notes are an integral part of these financial statements.
| | | | | | |
| Portfolio of investments—May 31, 2016 | | Wells Fargo Income Funds | | | 39 | |
REAL RETURN PORTFOLIO
| | | | | | | | | | | | | | | | |
| Security name | | Interest rate | | | Maturity date | | | Principal | | | Value | |
| | | | |
| Specialty Retail: 0.53% | | | | | | | | | | | | | | | | |
Best Buy Company Incorporated | | | 5.00 | % | | | 8-1-2018 | | | $ | 100,000 | | | $ | 104,750 | |
L Brands Incorporated | | | 6.90 | | | | 7-15-2017 | | | | 120,000 | | | | 126,900 | |
Sally Beauty Holdings Incorporated | | | 5.75 | | | | 6-1-2022 | | | | 100,000 | | | | 104,000 | |
| | | | |
| | | | | | | | | | | | | | | 335,650 | |
| | | | | | | | | | | | | | | | |
| | | | |
| Textiles, Apparel & Luxury Goods: 0.36% | | | | | | | | | | | | | | | | |
HanesBrands Incorporated | | | 6.38 | | | | 12-15-2020 | | | | 125,000 | | | | 128,985 | |
The William Carter Company | | | 5.25 | | | | 8-15-2021 | | | | 100,000 | | | | 103,500 | |
| | | | |
| | | | | | | | | | | | | | | 232,485 | |
| | | | | | | | | | | | | | | | |
| | | | |
Consumer Staples: 0.72% | | | | | | | | | | | | | | | | |
| | | | |
| Beverages: 0.16% | | | | | | | | | | | | | | | | |
Cott Beverages Incorporated | | | 6.75 | | | | 1-1-2020 | | | | 100,000 | | | | 104,500 | |
| | | | | | | | | | | | | | | | |
| | | | |
| Food Products: 0.36% | | | | | | | | | | | | | | | | |
Pinnacle Foods Incorporated | | | 4.88 | | | | 5-1-2021 | | | | 100,000 | | | | 102,000 | |
Smithfield Foods Incorporated | | | 7.75 | | | | 7-1-2017 | | | | 120,000 | | | | 127,560 | |
| | | | |
| | | | | | | | | | | | | | | 229,560 | |
| | | | | | | | | | | | | | | | |
| | | | |
| Household Products: 0.20% | | | | | | | | | | | | | | | | |
Spectrum Brands Incorporated | | | 6.38 | | | | 11-15-2020 | | | | 120,000 | | | | 125,850 | |
| | | | | | | | | | | | | | | | |
| | | | |
Energy: 0.85% | | | | | | | | | | | | | | | | |
| | | | |
| Energy Equipment & Services: 0.15% | | | | | | | | | | | | | | | | |
NGPL PipeCo LLC 144A | | | 7.12 | | | | 12-15-2017 | | | | 95,000 | | | | 99,750 | |
| | | | | | | | | | | | | | | | |
| | | | |
| Oil, Gas & Consumable Fuels: 0.70% | | | | | | | | | | | | | | | | |
Kinder Morgan Incorporated | | | 7.00 | | | | 6-15-2017 | | | | 60,000 | | | | 62,627 | |
Rockies Express Pipeline LLC 144A | | | 6.00 | | | | 1-15-2019 | | | | 50,000 | | | | 51,875 | |
Sabine Pass LNG LP | | | 7.50 | | | | 11-30-2016 | | | | 65,000 | | | | 66,463 | |
Targa Resources Partners Incorporated | | | 5.00 | | | | 1-15-2018 | | | | 130,000 | | | | 132,600 | |
Tesoro Corporation | | | 4.25 | | | | 10-1-2017 | | | | 65,000 | | | | 66,463 | |
Tesoro Logistics LP | | | 5.88 | | | | 10-1-2020 | | | | 65,000 | | | | 66,950 | |
| | | | |
| | | | | | | | | | | | | | | 446,978 | |
| | | | | | | | | | | | | | | | |
| | | | |
Financials: 1.60% | | | | | | | | | | | | | | | | |
| | | | |
| Banks: 0.21% | | | | | | | | | | | | | | | | |
CIT Group Incorporated | | | 4.25 | | | | 8-15-2017 | | | | 105,000 | | | | 106,239 | |
CIT Group Incorporated | | | 5.25 | | | | 3-15-2018 | | | | 25,000 | | | | 25,813 | |
| | | | |
| | | | | | | | | | | | | | | 132,052 | |
| | | | | | | | | | | | | | | | |
| | | | |
| Consumer Finance: 1.00% | | | | | | | | | | | | | | | | |
Ally Financial Incorporated | | | 6.25 | | | | 12-1-2017 | | | | 125,000 | | | | 130,313 | |
Diamond 1 Finance Corporation 144A%% | | | 3.48 | | | | 6-1-2019 | | | | 100,000 | | | | 101,329 | |
General Motors Financial Company Incorporated | | | 3.25 | | | | 5-15-2018 | | | | 135,000 | | | | 137,552 | |
Navient Corporation | | | 4.63 | | | | 9-25-2017 | | | | 130,000 | | | | 132,600 | |
Toll Brothers Finance Corporation | | | 4.00 | | | | 12-31-2018 | | | | 135,000 | | | | 140,063 | |
| | | | |
| | | | | | | | | | | | | | | 641,857 | |
| | | | | | | | | | | | | | | | |
The accompanying notes are an integral part of these financial statements.
| | | | |
| 40 | | Wells Fargo Income Funds | | Portfolio of investments—May 31, 2016 |
REAL RETURN PORTFOLIO
| | | | | | | | | | | | | | | | |
| Security name | | Interest rate | | | Maturity date | | | Principal | | | Value | |
| | | | |
| REITs: 0.39% | | | | | | | | | | | | | | | | |
Iron Mountain Incorporated 144A | | | 6.00 | % | | | 10-1-2020 | | | $ | 100,000 | | | $ | 105,500 | |
VEREIT Operating Partnership LP | | | 2.00 | | | | 2-6-2017 | | | | 135,000 | | | | 135,173 | |
VEREIT Operating Partnership LP %% | | | 4.13 | | | | 6-1-2021 | | | | 10,000 | | | | 10,100 | |
| | | | |
| | | | | | | | | | | | | | | 250,773 | |
| | | | | | | | | | | | | | | | |
| | | | |
Health Care: 0.68% | | | | | | | | | | | | | | | | |
| | | | |
| Health Care Providers & Services: 0.68% | | | | | | | | | | | | | | | | |
Centene Corporation 144A | | | 5.63 | | | | 2-15-2021 | | | | 65,000 | | | | 67,600 | |
Fresenius Medical Care Holdings Incorporated | | | 6.88 | | | | 7-15-2017 | | | | 125,000 | | | | 131,719 | |
HCA Incorporated | | | 8.00 | | | | 10-1-2018 | | | | 115,000 | | | | 128,800 | |
Tenet Healthcare Corporation | | | 6.25 | | | | 11-1-2018 | | | | 100,000 | | | | 105,125 | |
| | | | |
| | | | | | | | | | | | | | | 433,244 | |
| | | | | | | | | | | | | | | | |
| | | | |
Industrials: 0.93% | | | | | | | | | | | | | | | | |
| | | | |
| Airlines: 0.16% | | | | | | | | | | | | | | | | |
US Airways Group Incorporated | | | 6.13 | | | | 6-1-2018 | | | | 100,000 | | | | 104,000 | |
| | | | | | | | | | | | | | | | |
| | | | |
| Building Products: 0.14% | | | | | | | | | | | | | | | | |
USG Corporation | | | 9.75 | | | | 1-15-2018 | | | | 80,000 | | | | 89,422 | |
| | | | | | | | | | | | | | | | |
| | | | |
| Commercial Services & Supplies: 0.17% | | | | | | | | | | | | | | | | |
ACCO Brands Corporation | | | 6.75 | | | | 4-30-2020 | | | | 105,000 | | | | 110,906 | |
| | | | | | | | | | | | | | | | |
| | | | |
| Machinery: 0.24% | | | | | | | | | | | | | | | | |
Case New Holland Industrial Incorporated | | | 7.88 | | | | 12-1-2017 | | | | 65,000 | | | | 69,550 | |
SPX Flow Incorporated | | | 6.88 | | | | 9-1-2017 | | | | 80,000 | | | | 83,300 | |
| | | | |
| | | | | | | | | | | | | | | 152,850 | |
| | | | | | | | | | | | | | | | |
| | | | |
| Trading Companies & Distributors: 0.22% | | | | | | | | | | | | | | | | |
Ashtead Capital Incorporated 144A | | | 6.50 | | | | 7-15-2022 | | | | 100,000 | | | | 104,438 | |
United Rentals North America Incorporated | | | 7.38 | | | | 5-15-2020 | | | | 33,000 | | | | 34,320 | |
| | | | |
| | | | | | | | | | | | | | | 138,758 | |
| | | | | | | | | | | | | | | | |
| | | | |
Information Technology: 0.62% | | | | | | | | | | | | | | | | |
| | | | |
| Communications Equipment: 0.16% | | | | | | | | | | | | | | | | |
ViaSat Incorporated | | | 6.88 | | | | 6-15-2020 | | | | 100,000 | | | | 103,125 | |
| | | | | | | | | | | | | | | | |
| | | | |
| Electronic Equipment, Instruments & Components: 0.13% | | | | | | | | | | | | | | | | |
Jabil Circuit Incorporated | | | 8.25 | | | | 3-15-2018 | | | | 75,000 | | | | 81,563 | |
| | | | | | | | | | | | | | | | |
| | | | |
| Internet Software & Services: 0.20% | | | | | | | | | | | | | | | | |
IAC/InterActiveCorp | | | 4.88 | | | | 11-30-2018 | | | | 123,000 | | | | 125,921 | |
| | | | | | | | | | | | | | | | |
| | | | |
| Software: 0.13% | | | | | | | | | | | | | | | | |
Activision Blizzard Incorporated 144A | | | 5.63 | | | | 9-15-2021 | | | | 80,000 | | | | 84,000 | |
| | | | | | | | | | | | | | | | |
| | | | |
Materials: 0.63% | | | | | | | | | | | | | | | | |
| | | | |
| Chemicals: 0.13% | | | | | | | | | | | | | | | | |
Ashland Incorporated | | | 3.88 | | | | 4-15-2018 | | | | 80,000 | | | | 82,000 | |
| | | | | | | | | | | | | | | | |
The accompanying notes are an integral part of these financial statements.
| | | | | | |
| Portfolio of investments—May 31, 2016 | | Wells Fargo Income Funds | | | 41 | |
REAL RETURN PORTFOLIO
| | | | | | | | | | | | | | | | |
| Security name | | Interest rate | | | Maturity date | | | Principal | | | Value | |
| | | | |
| Containers & Packaging: 0.32% | | | | | | | | | | | | | | | | |
Owens-Illinois Incorporated | | | 7.80 | % | | | 5-15-2018 | | | $ | 120,000 | | | $ | 130,800 | |
Reynolds Group Holdings | | | 5.75 | | | | 10-15-2020 | | | | 70,000 | | | | 72,188 | |
| | | | |
| | | | | | | | | | | | | | | 202,988 | |
| | | | | | | | | | | | | | | | |
| | | | |
| Metals & Mining: 0.18% | | | | | | | | | | | | | | | | |
Alcoa Incorporated | | | 6.75 | | | | 7-15-2018 | | | | 60,000 | | | | 64,800 | |
Steel Dynamics Incorporated | | | 6.13 | | | | 8-15-2019 | | | | 50,000 | | | | 51,875 | |
| | | | |
| | | | | | | | | | | | | | | 116,675 | |
| | | | | | | | | | | | | | | | |
| | | | |
Telecommunication Services: 0.52% | | | | | | | | | | | | | | | | |
| | | | |
| Diversified Telecommunication Services: 0.35% | | | | | | | | | | | | | | | | |
Frontier Communications Corporation | | | 8.13 | | | | 10-1-2018 | | | | 60,000 | | | | 65,100 | |
Hughes Satelite Systems Corporation | | | 6.50 | | | | 6-15-2019 | | | | 75,000 | | | | 80,438 | |
SBA Communications Corporation | | | 5.63 | | | | 10-1-2019 | | | | 80,000 | | | | 82,900 | |
| | | | |
| | | | | | | | | | | | | | | 228,438 | |
| | | | | | | | | | | | | | | | |
| | | | |
| Wireless Telecommunication Services: 0.17% | | | | | | | | | | | | | | | | |
T-Mobile USA Incorporated | | | 6.25 | | | | 4-1-2021 | | | | 5,000 | | | | 5,238 | |
T-Mobile USA Incorporated | | | 6.46 | | | | 4-28-2019 | | | | 100,000 | | | | 101,688 | |
| | | | |
| | | | | | | | | | | | | | | 106,926 | |
| | | | | | | | | | | | | | | | |
| | | | |
Utilities: 0.10% | | | | | | | | | | | | | | | | |
| | | | |
| Independent Power & Renewable Electricity Producers: 0.10% | | | | | | | | | | | | | | | | |
NRG Energy Incorporated | | | 7.63 | | | | 1-15-2018 | | | | 60,000 | | | | 64,650 | |
| | | | | | | | | | | | | | | | |
| | | | |
Total Corporate Bonds and Notes (Cost $6,659,854) | | | | | | | | | | | | | | | 6,675,798 | |
| | | | | | | | | | | | | | | | |
| | | | |
Loans: 3.55% | | | | | | | | | | | | | | | | |
| | | | |
Consumer Discretionary: 0.66% | | | | | | | | | | | | | | | | |
| | | | |
| Auto Components: 0.15% | | | | | | | | | | | | | | | | |
Allison Transmission Incorporated ± | | | 3.50 | | | | 8-23-2019 | | | | 100,000 | | | | 100,264 | |
| | | | | | | | | | | | | | | | |
| | | | |
| Media: 0.30% | | | | | | | | | | | | | | | | |
Live Nation Entertainment Incorporated ± | | | 3.50 | | | | 8-16-2020 | | | | 100,000 | | | | 100,125 | |
Virgin Media Investment Holdings Limited ± | | | 3.65 | | | | 6-30-2023 | | | | 90,898 | | | | 90,929 | |
| | | | |
| | | | | | | | | | | | | | | 191,054 | |
| | | | | | | | | | | | | | | | |
| | | | |
| Multiline Retail: 0.21% | | | | | | | | | | | | | | | | |
Michaels Stores Incorporated ± | | | 3.75 | | | | 1-28-2020 | | | | 132,944 | | | | 133,110 | |
| | | | | | | | | | | | | | | | |
| | | | |
Financials: 0.21% | | | | | | | | | | | | | | | | |
| | | | |
| Diversified Financial Services: 0.21% | | | | | | | | | | | | | | | | |
Delos Finance SARL ± | | | 3.50 | | | | 3-6-2021 | | | | 135,000 | | | | 135,405 | |
| | | | | | | | | | | | | | | | |
| | | | |
Health Care: 0.34% | | | | | | | | | | | | | | | | |
| | | | |
| Health Care Equipment & Supplies: 0.16% | | | | | | | | | | | | | | | | |
Prestige Brands Incorporated ±%%< | | | 0.00 | | | | 9-3-2021 | | | | 100,000 | | | | 100,250 | |
| | | | | | | | | | | | | | | | |
The accompanying notes are an integral part of these financial statements.
| | | | |
| 42 | | Wells Fargo Income Funds | | Portfolio of investments—May 31, 2016 |
REAL RETURN PORTFOLIO
| | | | | | | | | | | | | | | | |
| Security name | | Interest rate | | | Maturity date | | | Principal | | | Value | |
| | | | |
| Health Care Providers & Services: 0.18% | | | | | | | | | | | | | | | | |
Community Health Systems Incorporated ± | | | 3.92 | % | | | 12-31-2018 | | | $ | 118,263 | | | $ | 118,079 | |
| | | | |
| | | | | | | | | | | | | | | 118,079 | |
| | | | | | | | | | | | | | | | |
| | | | |
Industrials: 1.02% | | | | | | | | | | | | | | | | |
| | | | |
| Aerospace & Defense: 0.19% | | | | | | | | | | | | | | | | |
TransDigm Incorporated ± | | | 3.75 | | | | 2-28-2020 | | | | 118,522 | | | | 118,485 | |
| | | | | | | | | | | | | | | | |
| | | | |
| Airlines: 0.21% | | | | | | | | | | | | | | | | |
Delta Air Lines Incorporated ± | | | 0.03 | | | | 8-24-2022 | | | | 134,325 | | | | 134,224 | |
| | | | | | | | | | | | | | | | |
| | | | |
| Commercial Services & Supplies: 0.62% | | | | | | | | | | | | | | | | |
Hertz Corporation ± | | | 3.00 | | | | 3-11-2018 | | | | 132,944 | | | | 132,575 | |
KAR Auction Services Incorporated ± | | | 3.94 | | | | 3-9-2021 | | | | 133,082 | | | | 133,525 | |
ServiceMaster Company ± | | | 4.25 | | | | 7-1-2021 | | | | 133,308 | | | | 133,808 | |
| | | | |
| | | | | | | | | | | | | | | 399,908 | |
| | | | | | | | | | | | | | | | |
| | | | |
Information Technology: 0.50% | | | | | | | | | | | | | | | | |
| | | | |
| Internet Software & Services: 0.10% | | | | | | | | | | | | | | | | |
Zayo Group LLC ± | | | 3.75 | | | | 5-6-2021 | | | | 62,460 | | | | 62,518 | |
| | | | | | | | | | | | | | | | |
| | | | |
| IT Services: 0.16% | | | | | | | | | | | | | | | | |
First Data Corporation ± | | | 4.19 | | | | 7-8-2022 | | | | 100,000 | | | | 100,208 | |
| | | | | | | | | | | | | | | | |
| | | | |
| Semiconductors & Semiconductor Equipment: 0.24% | | | | | | | | | | | | | | | | |
Avago Technologies ± | | | 4.25 | | | | 2-1-2023 | | | | 100,000 | | | | 100,239 | |
NXP Semiconductors NV ± | | | 3.75 | | | | 12-7-2020 | | | | 53,454 | | | | 53,602 | |
| | | | |
| | | | | | | | | | | | | | | 153,841 | |
| | | | | | | | | | | | | | | | |
| | | | |
Materials: 0.41% | | | | | | | | | | | | | | | | |
| | | | |
| Chemicals: 0.20% | | | | | | | | | | | | | | | | |
Ineos US Finance LLC ± | | | 3.75 | | | | 12-15-2020 | | | | 132,973 | | | | 131,810 | |
| | | | | | | | | | | | | | | | |
| | | | |
| Containers & Packaging: 0.21% | | | | | | | | | | | | | | | | |
Berry Plastics Group Incorporated ± | | | 3.50 | | | | 2-8-2020 | | | | 132,944 | | | | 132,969 | |
| | | | | | | | | | | | | | | | |
| | | | |
Telecommunication Services: 0.41% | | | | | | | | | | | | | | | | |
| | | | |
| Diversified Telecommunication Services: 0.41% | | | | | | | | | | | | | | | | |
Level 3 Financing Incorporated ± | | | 3.50 | | | | 5-31-2022 | | | | 135,000 | | | | 134,943 | |
West Corporation ± | | | 3.25 | | | | 6-30-2018 | | | | 127,491 | | | | 127,350 | |
| | | | |
| | | | | | | | | | | | | | | 262,293 | |
| | | | | | | | | | | | | | | | |
| | | | |
Total Loans (Cost $2,267,585) | | | | | | | | | | | | | | | 2,274,418 | |
| | | | | | | | | | | | | | | | |
| | | | |
U.S. Treasury Securities: 65.19% | | | | | | | | | | | | | | | | |
TIPS | | | 0.13 | | | | 4-15-2018 | | | | 283,256 | | | | 286,837 | |
TIPS | | | 0.13 | | | | 4-15-2019 | | | | 1,564,840 | | | | 1,587,721 | |
TIPS | | | 0.13 | | | | 4-15-2020 | | | | 3,848,323 | | | | 3,897,478 | |
TIPS | | | 0.13 | | | | 4-15-2021 | | | | 959,403 | | | | 969,708 | |
TIPS | | | 0.13 | | | | 1-15-2022 | | | | 1,535,891 | | | | 1,542,670 | |
The accompanying notes are an integral part of these financial statements.
| | | | | | |
| Portfolio of investments—May 31, 2016 | | Wells Fargo Income Funds | | | 43 | |
REAL RETURN PORTFOLIO
| | | | | | | | | | | | | | | | |
| Security name | | Interest rate | | | Maturity date | | | Principal | | | Value | |
| | | | |
U.S. Treasury Securities (continued) | | | | | | | | | | | | | | | | |
TIPS | | | 0.13 | % | | | 7-15-2022 | | | $ | 1,672,139 | | | $ | 1,682,807 | |
TIPS | | | 0.13 | | | | 1-15-2023 | | | | 1,738,128 | | | | 1,733,964 | |
TIPS | | | 0.13 | | | | 7-15-2024 | | | | 1,885,170 | | | | 1,872,185 | |
TIPS | | | 0.25 | | | | 1-15-2025 | | | | 1,558,153 | | | | 1,553,020 | |
TIPS | | | 0.38 | | | | 7-15-2023 | | | | 1,723,957 | | | | 1,755,047 | |
TIPS | | | 0.38 | | | | 7-15-2025 | | | | 1,812,274 | | | | 1,831,388 | |
TIPS | | | 0.63 | | | | 7-15-2021 | | | | 1,415,603 | | | | 1,470,586 | |
TIPS | | | 0.63 | | | | 1-15-2024 | | | | 1,750,055 | | | | 1,803,011 | |
TIPS | | | 0.63 | | | | 1-15-2026 | | | | 1,968,939 | | | | 2,032,955 | |
TIPS | | | 0.63 | | | | 2-15-2043 | | | | 569,586 | | | | 526,414 | |
TIPS | | | 0.75 | | | | 2-15-2042 | | | | 848,245 | | | | 808,671 | |
TIPS | | | 0.75 | | | | 2-15-2045 | | | | 1,172,899 | | | | 1,113,980 | |
TIPS | | | 1.00 | | | | 2-15-2046 | | | | 472,289 | | | | 483,309 | |
TIPS | | | 1.13 | | | | 1-15-2021 | | | | 1,322,455 | | | | 1,398,238 | |
TIPS | | | 1.25 | | | | 7-15-2020 | | | | 1,266,453 | | | | 1,348,310 | |
TIPS | | | 1.38 | | | | 7-15-2018 | | | | 1,065,505 | | | | 1,115,784 | |
TIPS | | | 1.38 | | | | 1-15-2020 | | | | 704,633 | | | | 746,673 | |
TIPS | | | 1.38 | | | | 2-15-2044 | | | | 883,710 | | | | 971,678 | |
TIPS | | | 1.63 | | | | 1-15-2018 | | | | 312,546 | | | | 324,470 | |
TIPS | | | 1.75 | | | | 1-15-2028 | | | | 676,235 | | | | 774,069 | |
TIPS | | | 1.88 | | | | 7-15-2019 | | | | 524,106 | | | | 564,124 | |
TIPS | | | 2.00 | | | | 1-15-2026 | | | | 719,778 | | | | 831,625 | |
TIPS | | | 2.13 | | | | 1-15-2019 | | | | 460,231 | | | | 492,094 | |
TIPS | | | 2.13 | | | | 2-15-2040 | | | | 385,560 | | | | 484,239 | |
TIPS | | | 2.13 | | | | 2-15-2041 | | | | 380,541 | | | | 481,771 | |
TIPS | | | 2.38 | | | | 1-15-2025 | | | | 1,149,467 | | | | 1,351,386 | |
TIPS | | | 2.38 | | | | 1-15-2027 | | | | 649,369 | | | | 781,584 | |
TIPS | | | 2.50 | | | | 1-15-2029 | | | | 659,849 | | | | 817,749 | |
TIPS | | | 2.63 | | | | 7-15-2017 | | | | 206,786 | | | | 215,870 | |
TIPS | | | 3.38 | | | | 4-15-2032 | | | | 201,210 | | | | 287,020 | |
TIPS | | | 3.63 | | | | 4-15-2028 | | | | 713,973 | | | | 969,572 | |
TIPS | | | 3.88 | | | | 4-15-2029 | | | | 622,791 | | | | 878,784 | |
| | | | |
Total U.S. Treasury Securities (Cost $40,364,353) | | | | | | | | | | | | | | | 41,786,791 | |
| | | | | | | | | | | | | | | | |
| | | | |
Yankee Corporate Bonds and Notes: 1.21% | | | | | | | | | | | | | | | | |
| | | | |
Consumer Discretionary: 0.32% | | | | | | | | | | | | | | | | |
| | | | |
| Auto Components: 0.16% | | | | | | | | | | | | | | | | |
Schaeffler Holding Finance BV 144A | | | 6.25 | | | | 11-15-2019 | | | | 100,000 | | | | 104,500 | |
| | | | | | | | | | | | | | | | |
| | | | |
| Automobiles: 0.16% | | | | | | | | | | | | | | | | |
Jaguar Land Rover Automotive plc 144A | | | 4.13 | | | | 12-15-2018 | | | | 100,000 | | | | 102,750 | |
| | | | | | | | | | | | | | | | |
| | | | |
Consumer Staples: 0.16% | | | | | | | | | | | | | | | | |
| | | | |
| Food & Staples Retailing: 0.16% | | | | | | | | | | | | | | | | |
Tesco plc 144A | | | 5.50 | | | | 11-15-2017 | | | | 100,000 | | | | 104,652 | |
| | | | | | | | | | | | | | | | |
| | | | |
Financials: 0.26% | | | | | | | | | | | | | | | | |
| | | | |
| Banks: 0.26% | | | | | | | | | | | | | | | | |
Nielsen Holding and Finance BV 144A | | | 5.50 | | | | 10-1-2021 | | | | 80,000 | | | | 83,200 | |
The accompanying notes are an integral part of these financial statements.
| | | | |
| 44 | | Wells Fargo Income Funds | | Portfolio of investments—May 31, 2016 |
REAL RETURN PORTFOLIO
| | | | | | | | | | | | | | | | |
| Security name | | Interest rate | | | Maturity date | | | Principal | | | Value | |
| | | | |
| Banks (continued) | | | | | | | | | | | | | | | | |
Royal Bank of Scotland Group plc | | | 4.70 | % | | | 7-3-2018 | | | $ | 80,000 | | | $ | 82,507 | |
| | | | |
| | | | | | | | | | | | | | | 165,707 | |
| | | | | | | | | | | | | | | | |
| | | | |
Health Care: 0.15% | | | | | | | | | | | | | | | | |
| | | | |
| Pharmaceuticals: 0.15% | | | | | | | | | | | | | | | | |
Mallinckrodt International Finance SA | | | 3.50 | | | | 4-15-2018 | | | | 100,000 | | | | 97,250 | |
| | | | | | | | | | | | | | | | |
| | | | |
Information Technology: 0.17% | | | | | | | | | | | | | | | | |
| | | | |
| Communications Equipment: 0.17% | | | | | | | | | | | | | | | | |
Nokia Corporation | | | 5.38 | | | | 5-15-2019 | | | | 100,000 | | | | 106,600 | |
| | | | | | | | | | | | | | | | |
| | | | |
Materials: 0.15% | | | | | | | | | | | | | | | | |
| | | | |
| Containers & Packaging: 0.15% | | | | | | | | | | | | | | | | |
Ardagh Packaging Finance plc 144A± | | | 3.63 | | | | 12-15-2019 | | | | 95,000 | | | | 95,238 | |
| | | | | | | | | | | | | | | | |
| | | | |
Total Yankee Corporate Bonds and Notes (Cost $774,066) | | | | | | | | | | | | | | | 776,697 | |
| | | | | | | | | | | | | | | | |
| | | | |
| | | Yield | | | | | | Shares | | | | |
| Short-Term Investments: 1.04% | | | | | | | | | | | | | | | | |
| | | | |
| Investment Companies: 0.96% | | | | | | | | | | | | | | | | |
Wells Fargo Government Money Market Fund Select Class (l)(u)## | | | 0.23 | | | | | | | | 618,330 | | | | 618,330 | |
| | | | | | | | | | | | | | | | |
| | | | | | | | | Principal | | | | |
| | | | |
| U.S. Treasury Securities: 0.08% | | | | | | | | | | | | | | | | |
U.S. Treasury Bill (z)# | | | 0.30 | | | | 6-16-2016 | | | $ | 50,000 | | | | 49,997 | |
| | | | | | | | | | | | | | | | |
| | | | |
Total Short-Term Investments (Cost $668,323) | | | | | | | | | | | | | | | 668,327 | |
| | | | | | | | | | | | | | | | |
| | | | | | | | |
| Total investments in securities (Cost $60,745,018) * | | | 98.33 | % | | | 63,029,974 | |
Other assets and liabilities, net | | | 1.67 | | | | 1,067,907 | |
| | | | | | | | |
| Total net assets | | | 100.00 | % | | $ | 64,097,881 | |
| | | | | | | | |
| † | Non-income-earning security |
| (i) | Illiquid security for which the designation as illiquid is unaudited. |
| 144A | The security may be resold in transactions exempt from registration, normally to qualified institutional buyers, pursuant to Rule 144A under the Securities Act of 1933. |
| %% | The security is issued on a when-issued basis. |
| ± | Variable rate investment. The rate shown is the rate in effect at period end. |
| < | All or a portion of the position represents an unfunded loan commitment. |
| (l) | The issuer of the security is an affiliated person of the Portfolio as defined in the Investment Company Act of 1940. |
| (u) | The rate represents the 7-day annualized yield at period end. |
| ## | All or a portion of this security is segregated for when-issued securities and/or unfunded loans. |
| (z) | Zero coupon security. The rate represents the current yield to maturity. |
| # | All or a portion of this security is segregated as collateral for investments in derivative instruments. |
| * | Cost for federal income tax purposes is $60,839,053 and unrealized gains (losses) consists of: |
| | | | |
Gross unrealized gains | | $ | 2,850,475 | |
Gross unrealized losses | | | (659,554 | ) |
| | | | |
Net unrealized gains | | $ | 2,190,921 | |
The accompanying notes are an integral part of these financial statements.
| | | | | | |
| Statements of assets and liabilities—May 31, 2016 | | Wells Fargo Income Funds | | | 45 | |
| | | | | | | | |
| | | Core Bond
Portfolio | | | Real Return Portfolio | |
| | |
Assets | | | | | | | | |
Investments | | | | | | | | |
In unaffiliated securities, at value (see cost below) | | $ | 4,530,168,228 | | | $ | 62,411,644 | |
In affiliated securities, at value (see cost below) | | | 198,368,365 | | | | 618,330 | |
| | | | |
Total investments, at value (see cost below) | | | 4,728,536,593 | | | | 63,029,974 | |
Cash | | | 7,419 | | | | 0 | |
Foreign currency, at value (see cost below) | | | 0 | | | | 21,680 | |
Receivable for investments sold | | | 1,149,740,110 | | | | 1,190,800 | |
Principal paydown receivable | | | 143,538 | | | | 0 | |
Receivable for dividends and interest | | | 17,908,065 | | | | 263,082 | |
Receivable for daily variation margin on open futures contracts | | | 0 | | | | 31 | |
Receivable for securities lending income | | | 5,040 | | | | 2,930 | |
Prepaid expenses and other assets | | | 28,457 | | | | 206 | |
| | | | |
Total assets | | | 5,896,369,222 | | | | 64,508,703 | |
| | | | |
| | |
Liabilities | | | | | | | | |
Payable for investments purchased | | | 1,554,183,980 | | | | 388,377 | |
Payable for daily variation margin on open futures contracts | | | 0 | | | | 1,203 | |
Advisory fee payable | | | 1,244,119 | | | | 15,974 | |
Accrued expenses and other liabilities | | | 106,065 | | | | 5,268 | |
| | | | |
Total liabilities | | | 1,555,534,164 | | | | 410,822 | |
| | | | |
Total net assets | | $ | 4,340,835,058 | | | $ | 64,097,881 | |
| | | | |
| | |
Investments in unaffiliated securities, at cost | | $ | 4,493,188,530 | | | $ | 60,126,688 | |
| | | | |
Investments in affiliated securities, at cost | | $ | 198,368,365 | | | $ | 618,330 | |
| | | | |
Total investments, at cost | | $ | 4,691,556,895 | | | $ | 60,745,018 | |
| | | | |
Foreign currency, at cost | | $ | 0 | | | $ | 21,777 | |
| | | | |
The accompanying notes are an integral part of these financial statements.
| | | | |
| 46 | | Wells Fargo Income Funds | | Statements of operations—year ended May 31, 2016 |
| | | | | | | | |
| | | Core Bond
Portfolio | | | Real Return
Portfolio | |
| | |
Investment income | | | | | | | | |
Interest | | $ | 84,398,045 | | | $ | 816,658 | |
Income from affiliated securities | | | 558,083 | | | | 1,913 | |
Securities lending income, net | | | 140,636 | | | | 11,283 | |
Dividends* | | | 0 | | | | 223,749 | |
| | | | |
Total investment income | | | 85,096,764 | | | | 1,053,603 | |
| | | | |
| | |
Expenses | | | | | | | | |
Advisory fee | | | 13,642,706 | | | | 222,726 | |
Custody and accounting fees | | | 207,548 | | | | 12,881 | |
Professional fees | | | 78,405 | | | | 45,224 | |
Shareholder report expenses | | | 4,066 | | | | 1,435 | |
Trustees’ fees and expenses | | | 11,445 | | | | 18,201 | |
Other fees and expenses | | | 23,050 | | | | 8,575 | |
| | | | |
Total expenses | | | 13,967,220 | | | | 309,042 | |
Less: Fee waivers and/or expense reimbursements | | | (517,427 | ) | | | (64,822 | ) |
| | | | |
Net expenses | | | 13,449,793 | | | | 244,220 | |
| | | | |
Net investment income | | | 71,646,971 | | | | 809,383 | |
| | | | |
| | |
REALIZED AND UNREALIZED GAINS (LOSSES) ON INVESTMENTS | | | | | | | | |
| | |
Net realized gains (losses) on: | | | | | | | | |
Unaffiliated securities | | | 33,934,338 | | | | (74,459 | ) |
Futures transactions | | | 0 | | | | (57,211 | ) |
TBA sale commitments | | | (189,467 | ) | | | 0 | |
| | | | |
Net realized gain (losses) on investments | | | 33,744,871 | | | | (131,670 | ) |
| | | | |
| | |
Net change in unrealized gains (losses) on: | | | | | | | | |
Unaffiliated securities | | | 4,164,647 | | | | 490,429 | |
Futures transactions | | | 0 | | | | (5,454 | ) |
| | | | |
Net change in unrealized gains (losses) on investments | | | 4,164,647 | | | | 484,975 | |
| | | | |
Net realized and unrealized gains (losses) on investments | | | 37,909,518 | | | | 353,305 | |
| | | | |
Net increase in net assets resulting from operations | | $ | 109,556,489 | | | $ | 1,162,688 | |
| | | | |
| | |
* Net of foreign dividend withholding taxes in the amount of | | | $0 | | | | $12,907 | |
The accompanying notes are an integral part of these financial statements.
| | | | | | |
| Statements of changes in net assets | | Wells Fargo Income Funds | | | 47 | |
| | | | | | | | |
| | | Core Bond Portfolio | |
| | | Year ended
May 31, 2016 | | | Year ended
May 31, 2015 | |
| | |
Operations | | | | | | | | |
Net investment income | | $ | 71,646,971 | | | $ | 58,488,996 | |
Net realized gains on investments | | | 33,744,871 | | | | 54,777,871 | |
Net change in unrealized gains (losses) on investments | | | 4,164,647 | | | | (15,603,380 | ) |
| | | | |
Net increase in net assets resulting from operations | | | 109,556,489 | | | | 97,663,487 | |
| | | | |
| | |
Capital share transactions | | | | | | | | |
Transactions in investors’ beneficial interests | | | | | | | | |
Contributions | | | 1,207,036,360 | | | | 1,275,843,092 | |
Withdrawals | | | (728,304,768 | ) | | | (517,501,361 | ) |
| | | | |
Net increase in net assets resulting from capital share transactions | | | 478,731,592 | | | | 758,341,731 | |
| | | | |
Total increase in net assets | | | 588,288,081 | | | | 856,005,218 | |
| | | | |
| | |
Net assets | | | | | | | | |
Beginning of period | | | 3,752,546,977 | | | | 2,896,541,759 | |
| | | | |
End of period | | $ | 4,340,835,058 | | | $ | 3,752,546,977 | |
| | | | |
The accompanying notes are an integral part of these financial statements.
| | | | |
| 48 | | Wells Fargo Income Funds | | Statements of changes in net assets |
| | | | | | | | |
| | | Real Return Portfolio | |
| | | Year ended
May 31, 2016 | | | Year ended
May 31, 2015 | |
| | |
Operations | | | | | | | | |
Net investment income | | $ | 809,383 | | | $ | 400,921 | |
Net realized gains (losses) on investments | | | (131,670 | ) | | | 1,132,514 | |
Net change in unrealized gains (losses) on investments | | | 484,975 | | | | (896,307 | ) |
| | | | |
Net increase in net assets resulting from operations | | | 1,162,688 | | | | 637,128 | |
| | | | |
| | |
Capital share transactions | | | | | | | | |
Transactions in investors’ beneficial interests | | | | | | | | |
Contributions | | | 29,489,684 | | | | 12,526,145 | |
Withdrawals | | | (14,951,275 | ) | | | (11,966,906 | ) |
| | | | |
Net increase in net assets resulting from capital share transactions | | | 14,538,409 | | | | 559,239 | |
| | | | |
Total increase in net assets | | | 15,701,097 | | | | 1,196,367 | |
| | | | |
| | |
Net assets | | | | | | | | |
Beginning of period | | | 48,396,784 | | | | 47,200,417 | |
| | | | |
End of period | | $ | 64,097,881 | | | $ | 48,396,784 | |
| | | | |
The accompanying notes are an integral part of these financial statements.
| | | | | | |
| Financial highlights | | Wells Fargo Income Funds | | | 49 | |
| | | | | | | | | | | | | | | | | | | | |
| | | Ratio to average net assets (annualized) | | | Total
return | | | Portfolio turnover
rate | |
| | | Net investment
income | | | Gross
expenses | | | Net
expenses | | | |
| | | | | |
Core Bond Portfolio | | | | | | | | | | | | | | | | | | | | |
Year ended May 31, 2016 | | | 1.86 | % | | | 0.36 | % | | | 0.35 | % | | | 2.78 | % | | | 667 | % |
Year ended May 31, 2015 | | | 1.82 | % | | | 0.37 | % | | | 0.35 | % | | | 3.22 | % | | | 586 | % |
Year ended May 31, 2014 | | | 1.94 | % | | | 0.37 | % | | | 0.35 | % | | | 2.90 | % | | | 646 | % |
Year ended May 31, 2013 | | | 1.75 | % | | | 0.37 | % | | | 0.35 | % | | | 2.61 | % | | | 547 | % |
Year ended May 31, 2012 | | | 2.33 | % | | | 0.37 | % | | | 0.35 | % | | | 8.20 | % | | | 803 | % |
| | | | | |
Real Return Portfolio | | | | | | | | | | | | | | | | | | | | |
Year ended May 31, 2016 | | | 1.45 | % | | | 0.56 | % | | | 0.44 | % | | | 1.29 | % | | | 29 | % |
Year ended May 31, 2015 | | | 0.89 | % | | | 0.57 | % | | | 0.44 | % | | | 1.50 | % | | | 57 | % |
Year ended May 31, 2014 | | | 1.45 | % | | | 0.53 | % | | | 0.44 | % | | | (0.26 | )% | | | 9 | % |
Year ended May 31, 2013 | | | 1.52 | % | | | 0.50 | % | | | 0.44 | % | | | (1.86 | )% | | | 15 | % |
Year ended May 31, 2012 | | | 3.00 | % | | | 0.48 | % | | | 0.44 | % | | | 12.62 | % | | | 23 | % |
The accompanying notes are an integral part of these financial statements.
| | | | |
| 50 | | Wells Fargo Income Funds | | Notes to financial statements |
1. ORGANIZATION
Wells Fargo Master Trust (the “Trust”), a Delaware statutory trust organized on March 10, 1999, is an open-end management investment company registered under the Investment Company Act of 1940, as amended (the “1940 Act”). As an investment company, the Trust follows the accounting and reporting guidance in Financial Accounting Standards Board (“FASB”) Accounting Standards Codification Topic 946, Financial Services – Investment Companies. These financial statements report on the following portfolios: the Wells Fargo Core Bond Portfolio (“Core Bond Portfolio”) and the Wells Fargo Real Return Portfolio (“Real Return Portfolio”) (each, a “Portfolio”, collectively, the “Portfolios”). Each Portfolio is a diversified series of the Trust.
The Portfolios, which are master portfolios in a master/feeder structure, offer their shares to multiple feeder funds and other affiliated master portfolios rather than directly to the public.
2. SIGNIFICANT ACCOUNTING POLICIES
The following significant accounting policies, which are consistently followed in the preparation of the financial statements of each Portfolio, are in conformity with U.S. generally accepted accounting principles which require management to make estimates and assumptions that affect the reported amounts of assets and liabilities, disclosure of contingent assets and liabilities at the date of the financial statements, and the reported amounts of revenues and expenses during the reporting period. Actual results could differ from those estimates.
Securities valuation
All investments are valued each business day as of the close of regular trading on the New York Stock Exchange (generally 4 p.m. Eastern Time), although the Portfolios may deviate from this calculation time under unusual or unexpected circumstances.
Debt securities are valued at the evaluated bid price provided by an independent pricing service or, if a reliable price is not available, the quoted bid price from an independent broker-dealer.
Equity securities and futures that are listed on a foreign or domestic exchange or market are valued at the official closing price or, if none, the last sales price. If no sale occurs on the principal exchange or market that day, the prior day’s price will be deemed “stale” and a fair value price will be determined in accordance with the Portfolio’s Valuation Procedures.
Investments in registered open-end investment companies are valued at net asset value. Interests in non-registered investment vehicles that are redeemable at net asset value are fair valued normally at net asset value.
Investments which are not valued using any of the methods discussed above are valued at their fair value, as determined in good faith by the Board of Trustees. The Board of Trustees has established a Valuation Committee comprised of the Trustees and has delegated to it the authority to take any actions regarding the valuation of portfolio securities that the Valuation Committee deems necessary or appropriate, including determining the fair value of portfolio securities, unless the determination has been delegated to the Management Valuation Team of Wells Fargo Funds Management, LLC (“Funds Management”). The Board of Trustees retains the authority to make or ratify any valuation decisions or approve any changes to the Valuation Procedures as it deems appropriate. On a quarterly basis, the Board of Trustees receives reports on any valuation actions taken by the Valuation Committee or the Management Valuation Team which may include items for ratification.
Valuations of fair valued securities are compared to the next actual sales price when available, or other appropriate market values, to assess the continued appropriateness of the fair valuation methodologies used. These securities are fair valued on a day-to-day basis, taking into consideration changes to appropriate market information and any significant changes to the inputs considered in the valuation process until there is a readily available price provided on an exchange or by an independent pricing service. Valuations received from an independent pricing service or independent broker-dealer quotes are periodically validated by comparisons to most recent trades and valuations provided by other independent pricing services in addition to the review of prices by the adviser and/or subadviser. Unobservable inputs used in determining fair valuations are identified based on the type of security, taking into consideration factors utilized by market participants in valuing the investment, knowledge about the issuer and the current market environment.
Security loans
The Portfolios may lend their securities from time to time in order to earn additional income in the form of fees or interest on securities received as collateral or the investment of any cash received as collateral. The Portfolios continue to receive interest or dividends on the securities loaned. The Portfolios receive collateral in the form of cash or securities with a value at least equal to the value of the securities on loan. The value of the loaned securities is determined at the close of each business day and any additional required collateral is delivered to the Portfolios on the next business day. In a securities lending transaction, the net asset value of the Portfolios will be affected by an increase or decrease in the value
| | | | | | |
| Notes to financial statements | | Wells Fargo Income Funds | | | 51 | |
of the securities loaned and by an increase or decrease in the value of the instrument in which collateral is invested. The amount of securities lending activity undertaken by the Portfolios fluctuate from time to time. In the event of default or bankruptcy by the borrower, the Portfolios may be prevented from recovering the loaned securities or gaining access to the collateral or may experience delays or costs in doing so. In addition, the investment of any cash collateral received may lose all or part of its value. The Portfolios have the right under the lending agreement to recover the securities from the borrower on demand.
The Portfolios lend their securities through an unaffiliated securities lending agent. Cash collateral received in connection with its securities lending transactions is invested in Securities Lending Cash Investments, LLC (the “Securities Lending Fund”). The Securities Lending Fund is exempt from registration under Section 3(c)(7) of the 1940 Act and is managed by Funds Management and is subadvised by Wells Capital Management Incorporated (“WellsCap”), an affiliate of Funds Management and an indirect wholly owned subsidiary of Wells Fargo & Company (“Wells Fargo”). Funds Management receives an advisory fee starting at 0.05% and declining to 0.01% as the average daily net assets of the Securities Lending Fund increase. All of the fees received by Funds Management are paid to WellsCap for its services as subadviser. The Securities Lending Fund seeks to provide a positive return compared to the daily Fed Funds Open rate by investing in high-quality, U.S. dollar-denominated short-term money market instruments. Securities Lending Fund investments are fair valued based upon the amortized cost valuation technique. Income earned from investment in the Securities Lending Fund is included in securities lending income on the Statements of Operations.
When-issued transactions
Each Portfolio may purchase securities on a forward commitment or when-issued basis. A Portfolio records a when-issued transaction on the trade date and will segregate assets in an amount at least equal in value to the Portfolio’s commitment to purchase when-issued securities. Securities purchased on a when-issued basis are marked-to-market daily and the Portfolio begins earning interest on the settlement date. Losses may arise due to changes in the market value of the underlying securities or if the counterparty does not perform under the contract.
Loans
The Portfolio may invest in direct debt instruments which are interests in amounts owed to lenders by corporate or other borrowers. The loans pay interest at rates which are periodically reset by reference to a base lending rate plus a spread. Investments in loans may be in the form of participations in loans or assignments of all or a portion of loans from third parties. When the Portfolio purchases participations, it generally has no rights to enforce compliance with terms of the loan agreement with the borrower. As a result, the Portfolio assumes the credit risk of both the borrower and the lender that is selling the participation. When the Portfolio purchases assignments from lenders, it acquires direct rights against the borrower on the loan and may enforce compliance by the borrower with the terms of the loan agreement. Loans may include fully funded term loans or unfunded loan commitments, which are contractual obligations for future funding.
Futures contracts
The Portfolio is subject to interest rate risk in the normal course of pursuing its investment objectives. A Portfolio may buy and sell futures contracts in order to gain exposure to, or protect against, changes in security values and interest rates. The primary risks associated with the use of futures contracts are the imperfect correlation between changes in market values of securities held by the Portfolio and the prices of futures contracts, and the possibility of an illiquid market.
The aggregate principal amounts of the contracts are not recorded in the financial statements. Fluctuations in the value of the contracts are recorded in the Statements of Assets and Liabilities as an asset or liability and in the Statements of Operations as unrealized gains or losses until the contracts are closed, at which point they are recorded as net realized gains or losses on futures contracts. With futures contracts, there is minimal counterparty risk to the Portfolio since futures are exchange traded and the exchange’s clearinghouse, as counterparty to all exchange traded futures, guarantees the futures against default.
TBA sale commitments
Each Portfolio may enter into To Be Announced (“TBA”) sale commitments to hedge its portfolio positions or to sell mortgage-backed securities it owns under delayed delivery arrangements. Proceeds of TBA sale commitments are not received until the contractual settlement date. During the time a TBA sale commitment is outstanding, equivalent deliverable securities or offsetting TBA purchase commitments, which are deliverable on or before the sale commitment date, are held as “cover” for the transaction. Unsettled TBA sale commitments are valued at the current market value of the underlying securities, generally according to the procedures described under “Securities valuation”. The contract is marked-to-market daily and the change in market value is recorded by the Portfolio as an unrealized gain or loss. If the TBA sale commitment is closed through the acquisition of an offsetting purchase commitment, the Portfolio realizes a gain or loss. If the Portfolio delivers securities under the commitment, the Portfolio realizes a gain or a loss from the sale of the securities based upon the unit price established at the date the commitment was entered into.
| | | | |
| 52 | | Wells Fargo Income Funds | | Notes to financial statements |
Inflation-indexed bonds and TIPS
Each Portfolio may invest in inflation-indexed bonds, including Treasury inflation-protected securities (TIPS). Inflation-indexed bonds are fixed income securities whose principal value is periodically adjusted according to the rate of inflation. If the index measuring inflation falls, the principal value of inflation-indexed bonds (other than municipal inflation indexed bonds and certain corporate inflation-indexed bonds) will be adjusted downward, and consequently the interest payable on these securities (calculated with respect to a smaller principal amount) will be reduced. Repayment of the original bond principal upon maturity (as adjusted for inflation) is guaranteed in the case of U.S. Treasury inflation-indexed bonds. For bonds that do not provide a similar guarantee, the adjusted principal value of the bond repaid at maturity may be less than the original principal. The value of inflation-indexed bonds is expected to change in response to changes in real interest rates. Real interest rates are tied to the relationship between nominal interest rates and the rate of inflation. If nominal interest rates increase at a faster rate than inflation, real interest rates may rise, leading to a decrease in value of inflation-indexed bonds. Inflation-indexed bonds, including TIPS, decline in value when real interest rates rise. In certain interest rate environments, such as when real interest rates are rising faster than nominal interest rates, inflation-indexed bonds may experience greater losses than other fixed income securities with similar durations.
Mortgage dollar roll transactions
Each Portfolio may engage in mortgage dollar roll transactions through TBA mortgage-backed securities issued by Government National Mortgage Association (GNMA), Federal National Mortgage Association (FNMA) and Federal Home Loan Mortgage Corporation (FHLMC). In a mortgage dollar roll transaction, a Portfolio sells a mortgage-backed security to a financial institution, such as a bank or broker-dealer and simultaneously agrees to repurchase a substantially similar security from the institution at a later date at an agreed upon price. The mortgage-backed securities that are repurchased will bear the same interest rate as those sold, but generally will be collateralized by different pools of mortgages with different pre-payment histories. During the roll period, a Portfolio foregoes principal and interest paid on the securities. A Portfolio is compensated by the difference between the current sales price and the forward price for the future purchase as well as by the earnings on the cash proceeds of the initial sale. Mortgage dollar rolls may be renewed without physical delivery of the securities subject to the contract. A Portfolio accounts for TBA dollar roll transactions as purchases and sales which, as a result, may increase its portfolio turnover rate.
Security transactions and income recognition
Securities transactions are recorded on a trade date basis. Realized gains or losses are recorded on the basis of identified cost.
Interest income is accrued daily and bond discounts are accreted and premiums are amortized daily based on the effective interest method. To the extent debt obligations are placed on non-accrual status, any related interest income may be reduced by writing off interest receivables when the collection of all or a portion of interest has become doubtful based on consistently applied procedures. If the issuer subsequently resumes interest payments or when the collectability of interest is reasonably assured, the debt obligation is removed from non-accrual status.
Dividend income is recognized on the ex-dividend date.
Income from foreign securities is recorded net of foreign taxes withheld where recovery of such taxes is not assured.
Federal and other taxes
Each Portfolio is treated as a separate entity for federal income tax purposes. The Portfolios are not required to pay federal income taxes on their net investment income and net capital gain as they are treated as partnerships for federal income tax purposes. All interest, dividends, gains and losses of a Portfolio are deemed to have been “passed through” to the interestholders in proportion to their holdings of the Portfolio regardless of whether such interest, dividends and gains have been distributed by the Portfolio.
Each Portfolio’s income tax returns and all financial records supporting those returns for the prior three fiscal years are subject to examination by the federal revenue authority. Management has analyzed each Portfolio’s tax positions taken on federal, state, and foreign tax returns for all open tax years and does not believe that there are any uncertain tax positions that require recognition of a tax liability.
3. FAIR VALUATION MEASUREMENTS
Fair value measurements of investments are determined within a framework that has established a fair value hierarchy based upon the various data inputs utilized in determining the value of each Portfolio’s investments. The three-level hierarchy gives the highest priority to unadjusted quoted prices in active markets for identical assets or liabilities (Level 1) and the lowest priority to significant unobservable inputs (Level 3). Each Portfolio’s investments are classified within the fair value hierarchy based on the lowest level of input that is significant to the fair value measurement. The inputs are summarized into three broad levels as follows:
| | | | | | |
| Notes to financial statements | | Wells Fargo Income Funds | | | 53 | |
| n | | Level 1 – quoted prices in active markets for identical securities |
| n | | Level 2 – other significant observable inputs (including quoted prices for similar securities, interest rates, prepayment speeds, credit risk, use of amortized cost, etc.) |
| n | | Level 3 – significant unobservable inputs (including the Portfolio’s own assumptions in determining the fair value of investments) |
The inputs or methodologies used for valuing investments in securities are not necessarily an indication of the risk associated with investing in those securities.
The following is a summary of the inputs used in valuing each Portfolio’s assets and liabilities as of May 31, 2016:
| | | | | | | | | | | | | | | | |
| Core Bond Portfolio | | Quoted prices
(Level 1) | | | Other significant
observable inputs
(Level 2) | | | Significant
unobservable inputs
(Level 3) | | | Total | |
Assets | | | | | | | | | | | | | | | | |
Investments in: | | | | | | | | | | | | | | | | |
| | | | |
Agency securities | | $ | 0 | | | $ | 1,325,492,614 | | | $ | 0 | | | $ | 1,325,492,614 | |
| | | | |
Asset-backed securities | | | 0 | | | | 573,632,539 | | | | 0 | | | | 573,632,539 | |
| | | | |
Corporate bonds and notes | | | 0 | | | | 810,667,590 | | | | 0 | | | | 810,667,590 | |
| | | | |
Municipal obligations | | | 0 | | | | 39,954,459 | | | | 0 | | | | 39,954,459 | |
| | | | |
Non-agency mortgage-backed securities | | | 0 | | | | 134,383,718 | | | | 0 | | | | 134,383,718 | |
| | | | |
U.S. Treasury securities | | | 1,324,440,171 | | | | 0 | | | | 0 | | | | 1,324,440,171 | |
| | | | |
Yankee corporate bonds and notes | | | 0 | | | | 226,546,839 | | | | 0 | | | | 226,546,839 | |
| | | | |
Yankee government bonds | | | 0 | | | | 95,050,298 | | | | 0 | | | | 95,050,298 | |
| | | | |
Short-term investments | | | | | | | | | | | | | | | | |
Investment companies | | | 198,368,365 | | | | 0 | | | | 0 | | | | 198,368,365 | |
Total assets | | $ | 1,522,808,536 | | | $ | 3,205,728,057 | | | $ | 0 | | | $ | 4,728,536,593 | |
| | | | | | | | | | | | | | | | |
| Real Return Portfolio | | Quoted prices
(Level 1) | | | Other significant
observable inputs
(Level 2) | | | Significant
unobservable inputs
(Level 3) | | | Total | |
Assets | | | | | | | | | | | | | | | | |
Investments in: | | | | | | | | | | | | | | | | |
| | | | |
Common stocks | | | | | | | | | | | | | | | | |
Consumer staples | | $ | 2,481,941 | | | $ | 0 | | | $ | 0 | | | $ | 2,481,941 | |
Energy | | | 2,185,607 | | | | 0 | | | | 0 | | | | 2,185,607 | |
Financials | | | 2,880,032 | | | | 0 | | | | 0 | | | | 2,880,032 | |
Materials | | | 3,300,363 | | | | 0 | | | | 0 | | | | 3,300,363 | |
| | | | |
Corporate bonds and notes | | | 0 | | | | 6,675,798 | | | | 0 | | | | 6,675,798 | |
| | | | |
Loans | | | 0 | | | | 2,274,418 | | | | 0 | | | | 2,274,418 | |
| | | | |
U.S. Treasury securities | | | 41,786,791 | | | | 0 | | | | 0 | | | | 41,786,791 | |
| | | | |
Yankee corporate bonds and notes | | | 0 | | | | 776,697 | | | | 0 | | | | 776,697 | |
| | | | |
Short-term investments | | | | | | | | | | | | | | | | |
Investment companies | | | 618,330 | | | | 0 | | | | 0 | | | | 618,330 | |
U.S. Treasury securities | | | 49,997 | | | | 0 | | | | 0 | | | | 49,997 | |
| | | 53,303,061 | | | | 9,726,913 | | | | 0 | | | | 63,029,974 | |
| | | | |
Futures contracts | | | 31 | | | | 0 | | | | 0 | | | | 31 | |
Total assets | | $ | 53,303,092 | | | $ | 9,726,913 | | | $ | 0 | | | $ | 63,030,005 | |
Liabilities | | | | | | | | | | | | | | | | |
| | | | |
Futures contracts | | $ | 1,203 | | | $ | 0 | | | $ | 0 | | | $ | 1,203 | |
Total liabilities | | $ | 1,203 | | | $ | 0 | | | $ | 0 | | | $ | 1,203 | |
| | | | |
| 54 | | Wells Fargo Income Funds | | Notes to financial statements |
Futures contracts are reported at their variation margin at measurement date, which represents the amount due to/from the Portfolio at that date. All other assets and liabilities are reported at their market value at measurement date.
The Portfolios recognize transfers between levels within the fair value hierarchy at the end of the reporting period. At May 31, 2016, the Portfolios did not have any transfers into/out of Level 1, Level 2 or Level 3.
4. TRANSACTIONS WITH AFFILIATES
Advisory fee
The Trust has entered into an advisory contract with Funds Management, an indirect wholly owned subsidiary of Wells Fargo. The adviser is responsible for implementing investment policies and guidelines and for supervising the subadviser, who is responsible for day-to-day portfolio management of the Portfolios.
Pursuant to the contract, Funds Management is entitled to receive an annual advisory fee starting at 0.40% and declining to 0.30% as the average daily net assets of each Portfolio increase. For the year ended May 31, 2016, the advisory fee for Core Bond Portfolio and Real Return Portfolio was equivalent to an annual rate of 0.35% and 0.40%, respectively, of each Portfolio’s average daily net assets.
Funds Management has retained the services of a subadviser to provide daily portfolio management to the Portfolios. The fees for subadvisory services are borne by Funds Management. WellsCap is the subadviser to each Portfolio and is entitled to receive a fee from Funds Management at an annual rate starting at 0.20% and declining to 0.10% as the average daily net assets of each Portfolio increases.
Funds Management has voluntarily waived and/or reimbursed advisory fees to the extent necessary to maintain certain net operating expense ratios for the Portfolios.
5. INVESTMENT PORTFOLIO TRANSACTIONS
Purchases and sales of investments, excluding short-term securities, for the year ended May 31, 2016 were as follows:
| | | | | | | | | | | | | | | | |
| | | Purchases at cost | | | Sales proceeds | |
| | | U.S.
government | | | Non-U.S.
government | | | U.S.
government | | | Non-U.S.
government | |
Core Bond Portfolio | | $ | 24,379,101,867 | | | $ | 3,479,831,644 | | | $ | 23,990,784,629 | | | $ | 2,994,795,146 | |
Real Return Portfolio | | | 19,521,137 | | | | 12,085,988 | | | | 10,372,097 | | | | 4,914,247 | |
As of May 31, 2016, Real Return Portfolio had unfunded term loan commitments of $100,313.
6. DERIVATIVE TRANSACTIONS
During the year ended May 31, 2016, Real Return Portfolio entered into futures contracts to speculate on interest rates and to help manage the duration of the portfolio.
At May 31, 2016, the Real Return Portfolio had short futures contracts outstanding as follows:
| | | | | | | | | | | | | | | | | | |
| Expiration date | | Counterparty | | Contracts | | | Type | | | Contract
value at May 31, 2016 | | | Unrealized
losses | |
| 9-21-2016 | | JPMorgan | | | 2 Short | | | | 10-Year U.S. Treasury Notes | | | $ | 259,375 | | | $ | (217 | ) |
| 9-21-2016 | | JPMorgan | | | 3 Short | | | | U.S. Treasury Bonds | | | | 489,938 | | | | (3,004 | ) |
| 9-30-2016 | | JPMorgan | �� | | 10 Short | | | | 5-Year U.S. Treasury Notes | | | | 1,201,172 | | | | (2,233 | ) |
Real Return Portfolio had an average notional amount of $80,886 and $1,223,081 in long and short futures contracts during the year ended May 31, 2016.
The receivable and payable for daily variation margin on open futures contracts reflected in the Statements of Assets and Liabilities only represents the current day’s variation margin. The realized gains or losses and change in unrealized gains or losses on derivative instruments are reflected in the Statements of Operations.
| | | | | | |
| Notes to financial statements | | Wells Fargo Income Funds | | | 55 | |
For certain types of derivative transactions, the Portfolios have entered into International Swaps and Derivatives Association, Inc. master agreements (“ISDA Master Agreements”) or similar agreements with approved counterparties. The ISDA Master Agreements or similar agreements may have requirements to deliver/deposit securities or cash to/with an exchange or broker-dealer as collateral and allows the Portfolio to offset, with each counterparty, certain derivative financial instrument’s assets and/or liabilities with collateral held or pledged. Collateral requirements differ by type of derivative. Collateral or margin requirements are set by the broker or exchange clearing house for exchange traded derivatives while collateral terms are contract specific for over-the-counter traded derivatives. Cash collateral that has been pledged to cover obligations of the Portfolios under ISDA Master Agreements or similar agreements, if any, will be reported separately in the Statements of Assets and Liabilities. Securities pledged as collateral, if any, for the same purpose are noted in the Portfolio of Investments or Summary Portfolio of Investments. With respect to balance sheet offsetting, absent an event of default by the counterparty or a termination of the agreement, the reported amounts of financial assets and financial liabilities in the Statements of Assets and Liabilities are not offset across transactions between the Portfolio and the applicable counterparty. A reconciliation of the gross amounts on the Statements of Assets and Liabilities to the net amounts by derivative type, including any collateral exposure, is as follows:
| | | | | | | | | | | | | | | | | | | | |
| | | Derivative type | | Counterparty | | Gross amounts
of assets in the
Statements of
Assets and
Liabilities | | | Amounts
subject to
netting
agreements | | | Collateral
received | | | Net amount
of assets | |
Real Return Portfolio | | Futures – variation margin | | JPMorgan | | $ | 31 | | | $ | (31 | ) | | $ | 0 | | | $ | 0 | |
| | | | | | | | | | | | | | | | | | | | |
| | | Derivative type | | Counterparty | | Gross amounts
of liabilities in the
Statements of
Assets and
Liabilities | | | Amounts
subject to
netting
agreements | | | Collateral
pledged1 | | | Net amount
of liabilities | |
Real Return Portfolio | | Futures – variation margin | | JPMorgan | | $ | 1,203 | | | $ | (31 | ) | | $ | (1,172 | ) | | $ | 0 | |
| 1 | Collateral pledged within this table is limited to the collateral for the net transaction with the counterparty. |
7. INDEMNIFICATION
Under the Trust’s organizational documents, the officers and Trustees have been granted certain indemnification rights against certain liabilities that may arise out of performance of their duties to the Trust. Additionally, in the normal course of business, the Trust may enter into contracts with service providers that contain a variety of indemnification clauses. The Trust’s maximum exposure under these arrangements is dependent on future claims that may be made against the Portfolios and, therefore, cannot be estimated.
8. REDEMPTION IN-KIND
After the close of business on October 29, 2015, Wells Fargo Core Bond Fund, which invests all of its assets in Core Bond Portfolio, redeemed assets through an in-kind redemption. In the redemption transaction, Wells Fargo Core Bond Fund issued securities which it received from Core Bond Portfolio with a value of $223,656,162 along with cash in the amount of $20,349,815. Core Bond Portfolio recognized gains in the amount of $1,735,222, which are reflected on the Statements of Operations. The redemption in-kind represented 6.35% of Core Bond Portfolio and is reflected on the Statements of Changes in Net Assets.
| | | | |
| 56 | | Wells Fargo Income Funds | | Report of independent registered public accounting firm |
BOARD OF TRUSTEES AND SHAREHOLDERS OF WELLS FARGO MASTER TRUST:
We have audited the accompanying statements of assets and liabilities, including the portfolios of investments or summary portfolio of investments (for Wells Fargo Core Bond Portfolio), of the Wells Fargo Core Bond Portfolio and Wells Fargo Real Return Portfolio (formerly known as Wells Fargo Advantage Core Bond Portfolio and Wells Fargo Advantage Real Return Portfolio, respectively), two of the portfolios constituting the Wells Fargo Master Trust (collectively the “Portfolios”), as of May 31, 2016, and the related statements of operations for the year then ended, statements of changes in net assets for each of the years in the two-year period then ended, and the financial highlights for each of the years in the five-year period then ended. These financial statements and financial highlights are the responsibility of the Portfolios’ management. Our responsibility is to express an opinion on these financial statements and financial highlights based on our audits.
We conducted our audits in accordance with the standards of the Public Company Accounting Oversight Board (United States). Those standards require that we plan and perform the audit to obtain reasonable assurance about whether the financial statements and financial highlights are free of material misstatement. An audit includes examining, on a test basis, evidence supporting the amounts and disclosures in the financial statements. Our procedures included confirmation of securities owned as of May 31, 2016, by correspondence with the custodian and brokers, or by other appropriate auditing procedures. An audit also includes assessing the accounting principles used and significant estimates made by management, as well as evaluating the overall financial statement presentation. We believe that our audits provide a reasonable basis for our opinion.
In our opinion, the financial statements and financial highlights referred to above present fairly, in all material respects, the financial position of the aforementioned Portfolios of Wells Fargo Master Trust as of May 31, 2016, the results of their operations for the year then ended, changes in their net assets for each of the years in the two-year period then ended, and the financial highlights for each of the years in the five-year period then ended, in conformity with U.S. generally accepted accounting principles.
Boston, Massachusetts
July 27, 2016
| | | | | | |
| Other information (unaudited) | | Wells Fargo Income Funds | | | 57 | |
TAX INFORMATION
Pursuant to Section 852 of the Internal Revenue Code, the following amounts were designated as long-term capital gain distributions for the fiscal year ended May 31, 2016:
| | | | |
| | | Long-term capital gain distributions | |
Real Return Fund | | $ | 512,718 | |
Pursuant to Section 854 of the Internal Revenue Code, the following amounts of income dividends paid during the fiscal year ended May 31, 2016 have been designated as qualified dividend income (QDI):
| | | | |
| | | QDI | |
Real Return Fund | | $ | 85,886 | |
For the fiscal year ended May 31, 2016, the following amounts have been designated as interest-related dividends for nonresident alien shareholders pursuant to Section 871 of the Internal Revenue Code:
| | | | |
| | | Interest-related dividends | |
Core Bond Fund | | $ | 50,056,376 | |
Real Return Fund | | | 182,135 | |
For the fiscal year ended May 31, 2016, the following amounts have been designated as short-term capital gain dividends for nonresident alien shareholders pursuant to Section 871 of the Internal Revenue Code:
| | | | |
| | | Short-term capital gain dividends | |
Real Return Fund | | $ | 91,639 | |
For the fiscal year ended May 31, 2016, the percentage of ordinary income distributed which was derived from interest on U.S. government securities was as follows:
| | | | |
| | | % of U.S. government income | |
Core Bond Fund | | | 19.96 | % |
Real Return Fund | | | 33.91 | |
PROXY VOTING INFORMATION
A description of the policies and procedures used to determine how to vote proxies relating to portfolio securities is available without charge, upon request, by calling 1-800-222-8222, visiting our website at wellsfargofunds.com, or visiting the SEC website at sec.gov. Information regarding how the proxies related to portfolio securities were voted during the most recent 12-month period ended June 30 is available on the website at wellsfargofunds.com or by visiting the SEC website at sec.gov.
PORTFOLIO HOLDINGS INFORMATION
The complete portfolio holdings are publicly available on the website (wellsfargofunds.com) on a one-month delayed basis. In addition, top ten holdings information (excluding derivative positions) is publicly available on the website on a monthly, seven-day or more delayed basis. Each Fund and Portfolio files its complete schedule of portfolio holdings with the SEC for the first and third quarters of each fiscal year on Form N-Q, which is available by visiting the SEC website at sec.gov. In addition, each Form N-Q may be reviewed and copied at the SEC’s Public Reference Room in Washington, DC, and at regional offices in New York City, at 233 Broadway, and in Chicago, at 175 West Jackson Boulevard, Suite 900. Information about the Public Reference Room may be obtained by calling 1-800-SEC-0330.
| | | | |
| 58 | | Wells Fargo Income Funds | | Other information (unaudited) |
BOARD OF TRUSTEES AND OFFICERS
Each of the Trustees and Officers1 listed in the table below acts in identical capacities for each fund in the Wells Fargo family of funds, which consists of 142 mutual funds comprising the Wells Fargo Funds Trust, Wells Fargo Variable Trust, Wells Fargo Master Trust and four closed-end funds (collectively the “Fund Complex”). This table should be read in conjunction with the Prospectus and the Statement of Additional Information2. The mailing address of each Trustee and Officer is 525 Market Street, 12th Floor, San Francisco, CA 94105. Each Trustee and Officer serves an indefinite term, however, each Trustee serves such term until reaching the mandatory retirement age established by the Trustees.
Independent Trustees
| | | | | | |
Name and year of birth | | Position held and length of service* | | Principal occupations during past five years or longer | | Current other public
company or investment company directorships |
William R. Ebsworth
(Born 1957) | | Trustee, since 2015 | | Retired. From 1984 to 2013, equities analyst, portfolio manager, research director and chief financial officer at Fidelity Management and Research Company in Boston, Tokyo, and Hong Kong and retired in 2013 as Chief Investment Officer of Fidelity Strategic Advisers, Inc. where he lead a team of investment professionals managing client assets. Prior thereto, Board member of Hong Kong Securities Clearing Co., Hong Kong Options Clearing Corp., the Thailand International Fund, Ltd., Fidelity Investments Life Insurance Company, and Empire Fidelity Investments Life Insurance Company. Mr. Ebsworth is a CFA® charterholder and an Adjunct Lecturer, Finance, at Babson College. | | Asset Allocation Trust |
Jane A. Freeman
(Born 1953) | | Trustee, since 2015 | | Retired. From 2012 to 2014 and 1999 to 2008, Chief Financial Officer of Scientific Learning Corporation. From 2008 to 2012, Ms. Freeman provided consulting services related to strategic business projects. Prior to 1999, Portfolio Manager at Rockefeller & Co. and Scudder, Stevens & Clark. Board member of the Harding Loevner Funds from 1996 to 2014, serving as both Lead Independent Director and chair of the Audit Committee. Board member of the Russell Exchange Traded Funds Trust from 2011 to 2012 and the chair of the Audit Committee. Ms. Freeman is Chair of Taproot Foundation (non-profit organization), a Board Member of Ruth Bancroft Garden (non-profit organization) and an inactive chartered financial analyst. | | Asset Allocation Trust |
Peter G. Gordon
(Born 1942) | | Trustee, since 1998; Chairman, since 2005 | | Co-Founder, Retired Chairman, President and CEO of Crystal Geyser Water Company. Trustee Emeritus, Colby College. | | Asset Allocation Trust |
Isaiah Harris, Jr.
(Born 1952) | | Trustee, since 2009 | | Retired. Chairman of the Board of CIGNA Corporation since 2009, and Director since 2005. From 2003 to 2011, Director of Deluxe Corporation. Prior thereto, President and CEO of BellSouth Advertising and Publishing Corp. from 2005 to 2007, President and CEO of BellSouth Enterprises from 2004 to 2005 and President of BellSouth Consumer Services from 2000 to 2003. Emeritus member of the Iowa State University Foundation Board of Governors. Emeritus Member of the Advisory Board of Iowa State University School of Business. Advisory Board Member, Palm Harbor Academy (charter school). Advisory Board Member, Child Evangelism Fellowship (non-profit). Mr. Harris is a certified public accountant (inactive status). | | CIGNA Corporation; Asset Allocation Trust |
Judith M. Johnson
(Born 1949) | | Trustee, since 2008; Audit Committee Chairman, since 2008 | | Retired. Prior thereto, Chief Executive Officer and Chief Investment Officer of Minneapolis Employees Retirement Fund from 1996 to 2008. Ms. Johnson is an attorney, certified public accountant and a certified managerial accountant. | | Asset Allocation Trust |
David F. Larcker
(Born 1950) | | Trustee, since 2009 | | James Irvin Miller Professor of Accounting at the Graduate School of Business, Stanford University, Director of the Corporate Governance Research Initiative and Senior Faculty of The Rock Center for Corporate Governance since 2006. From 2005 to 2008, Professor of Accounting at the Graduate School of Business, Stanford University. Prior thereto, Ernst & Young Professor of Accounting at The Wharton School, University of Pennsylvania from 1985 to 2005. | | Asset Allocation Trust |
Olivia S. Mitchell
(Born 1953) | | Trustee, since 2006 | | International Foundation of Employee Benefit Plans Professor, Wharton School of the University of Pennsylvania since 1993. Director of Wharton’s Pension Research Council and Boettner Center on Pensions & Retirement Research, and Research Associate at the National Bureau of Economic Research. Previously, Cornell University Professor from 1978 to 1993. | | Asset Allocation Trust |
| | | | | | |
| Other information (unaudited) | | Wells Fargo Income Funds | | | 59 | |
| | | | | | |
Name and year of birth | | Position held and length of service* | | Principal occupations during past five years or longer | | Current other public
company or investment company directorships |
Timothy J. Penny
(Born 1951) | | Trustee, since 1996 | | President and Chief Executive Officer of Southern Minnesota Initiative Foundation, a non-profit organization, since 2007 and Senior Fellow at the Humphrey Institute Policy Forum at the University of Minnesota since 1995. Member of the Board of Trustees of NorthStar Education Finance, Inc., a non-profit organization, since 2007. | | Asset Allocation Trust |
| Michael S. Scofield (Born 1943) | | Trustee, since 2010 | | Served on the Investment Company Institute’s Board of Governors and Executive Committee from 2008-2011 as well the Governing Council of the Independent Directors Council from 2006-2011 and the Independent Directors Council Executive Committee from 2008-2011. Chairman of the IDC from 2008-2010. Institutional Investor (Fund Directions) Trustee of Year in 2007. Trustee of the Evergreen Funds complex (and its predecessors) from 1984 to 2010. Chairman of the Evergreen Funds from 2000-2010. Former Trustee of the Mentor Funds. Retired Attorney, Law Offices of Michael S. Scofield. | | Asset Allocation Trust |
| * | Length of service dates reflect the Trustee’s commencement of service with the Trust’s predecessor entities, where applicable. |
Officers
| | | | | | |
Name and
year of birth | | Position held and
length of service | | Principal occupations during past five years or longer | | |
Karla M. Rabusch
(Born 1959) | | President, since 2003 | | Executive Vice President of Wells Fargo Bank, N.A. and President of Wells Fargo Funds Management, LLC since 2003. | | |
Nancy Wiser1
(Born 1967) | | Treasurer, since 2012 | | Executive Vice President of Wells Fargo Funds Management, LLC since 2011. Chief Operating Officer and Chief Compliance Officer at LightBox Capital Management LLC, from 2008 to 2011. | | |
C. David Messman
(Born 1960) | | Secretary, since 2000; Chief Legal Officer, since 2003 | | Senior Vice President and Secretary of Wells Fargo Funds Management, LLC since 2001. Assistant General Counsel of Wells Fargo Bank, N.A. since 2013 and Vice President and Managing Counsel of Wells Fargo Bank, N.A. from 1996 to 2013. | | |
Michael Whitaker
(Born 1967) | | Chief Compliance Officer, since 2016* | | Executive Vice President of Wells Fargo Funds Management, LLC since 2016. Chief Compliance Officer of Fidelity’s Fixed Income Funds and Asset Allocation Funds from 2008 to 2016, Compliance Officer of FMR Co., Inc. from 2014 to 2016, Fidelity Investments Money Management, Inc. from 2014 to 2016, Fidelity Investments from 2007 to 2016. | | |
David Berardi
(Born 1975) | | Assistant Treasurer, since 2009 | | Vice President of Wells Fargo Funds Management, LLC since 2009. Vice President of Evergreen Investment Management Company, LLC from 2008 to 2010. Manager of Fund Reporting and Control for Evergreen Investment Management Company, LLC from 2004 to 2010. | | |
Jeremy DePalma1
(Born 1974) | | Assistant Treasurer, since 2009 | | Senior Vice President of Wells Fargo Funds Management, LLC since 2009. Senior Vice President of Evergreen Investment Management Company, LLC from 2008 to 2010 and head of the Fund Reporting and Control Team within Fund Administration from 2005 to 2010. | | |
| 1 | Nancy Wiser acts as Treasurer of 73 funds in the Fund Complex. Jeremy DePalma acts as Treasurer of 69 funds and Assistant Treasurer of 73 funds in the Fund Complex. |
| 2 | The Statement of Additional Information includes additional information about the Trustees and is available, without charge, upon request, by calling 1-800-222-8222 or by visiting the website at wellsfargofunds.com. |
| * | Michael Whitaker became Chief Compliance Officer effective May 16, 2016. |
| | | | |
| 60 | | Wells Fargo Income Funds | | Other information (unaudited) |
BOARD CONSIDERATION OF INVESTMENT MANAGEMENT, ADVISORY AND SUB-ADVISORY AGREEMENTS:
Wells Fargo Real Return Fund, Wells Fargo Core Bond Fund, Wells Fargo Real Return Portfolio and Wells Fargo Core Bond Portfolio
Under the Investment Company Act of 1940 (the “1940 Act”), the Board of Trustees (each, a “Board” and collectively, the “Boards”) of each of Wells Fargo Funds Trust (“Funds Trust”) and Wells Fargo Master Trust (“Master Trust”) (collectively, the “Trusts”) must determine annually whether to approve the continuation of the Trusts’ investment management, advisory and sub-advisory agreements, as applicable. In this regard, at an in-person meeting held on May 24-25, 2016 (the “Meeting”), the Funds Trust Board, all the members of which have no direct or indirect interest in the investment management, advisory and sub-advisory agreements and are not “interested persons” of the Trusts, as defined in the 1940 Act (the “Independent Trustees”), reviewed and approved for each of the Wells Fargo Real Return Fund and Wells Fargo Core Bond Fund (individually, a “Gateway Fund” and collectively, the “Gateway Funds”) an investment management agreement (the “Gateway Fund Management Agreement”) with Wells Fargo Funds Management, LLC (“Funds Management”).
At the Meeting, the Master Trust Board, all the members of which are Independent Trustees, reviewed and approved an investment advisory agreement (the “Master Portfolio Advisory Agreement”) with Funds Management for each of the Wells Fargo Real Return Portfolio and Wells Fargo Core Bond Portfolio (individually, a “Master Portfolio” and collectively, the “Master Portfolios”). The Gateway Funds and the Master Portfolios are collectively referred to as the “Funds.”
The Master Trust Board also reviewed and approved at the Meeting an investment sub-advisory agreement with Wells Capital Management Incorporated (the “Sub-Adviser”) for each of the Master Portfolios (the “Sub-Advisory Agreements”). The Gateway Fund Management Agreement, the Master Portfolio Advisory Agreement and the Sub-Advisory Agreements are collectively referred to as the “Advisory Agreements.”
The Real Return Fund and Core Bond Fund are gateway feeder funds that invest substantially all of their assets in the Real Return Portfolio and Core Bond Portfolio, respectively. Each of these Master Portfolios has a substantially similar investment objective and substantially similar investment strategies to the respective Gateway Fund. Information provided to the Boards regarding the Gateway Funds is also applicable to the respective Master Portfolios identified above, as relevant.
At the Meeting, the Boards considered the factors and reached the conclusions described below relating to the selection of Funds Management and the Sub-Adviser and the approval of the Advisory Agreements. Prior to the Meeting, including at an in-person meeting in April 2016, the Trustees conferred extensively among themselves and with representatives of Funds Management about these matters. Also, the Boards have adopted a team-based approach, with each team consisting of a sub-set of Trustees, to assist the Boards in the discharge of their duties in reviewing performance and other matters throughout the year. The Independent Trustees were assisted in their evaluation of the Advisory Agreements by independent legal counsel, from whom they received separate legal advice and with whom they met separately.
In providing information to the Boards, Funds Management and the Sub-Adviser were guided by a detailed set of requests for information submitted to them by independent legal counsel on behalf of the Independent Trustees at the start of the Boards’ annual contract renewal process earlier in 2016. In considering and approving the Advisory Agreements, the Trustees considered the information they believed relevant, including but not limited to the information discussed below. The Boards considered not only the specific information presented in connection with the Meetings, but also the knowledge gained over time through interaction with Funds Management and the Sub-Adviser about various topics. In this regard, the Boards reviewed reports of Funds Management at each of their quarterly meetings, which included, among other things, portfolio reviews and performance reports. In addition, the Boards and the teams mentioned above confer with portfolio managers at various times throughout the year. The Boards did not identify any particular information or consideration that was all-important or controlling, and each individual Trustee may have attributed different weights to various factors.
After its deliberations, the Funds Trust Board unanimously approved the continuation of the Gateway Fund Management Agreement for a one-year period. Additionally, after its deliberations, the Master Trust Board unanimously approved the continuation of the Master Portfolio Advisory Agreement and each Sub-Advisory Agreement for a one-year term. The Boards also determined that the compensation payable to Funds Management and each of the Sub-Advisers was reasonable. The Boards considered the approval of the Advisory Agreements for the Funds as part of their consideration of agreements for funds across the complex, but their approvals were made on a fund-by-fund basis. The following summarizes a number of important, but not necessarily all, factors considered by the Boards in support of their approvals.
| | | | | | |
| Other information (unaudited) | | Wells Fargo Income Funds | | | 61 | |
Nature, extent and quality of services
The Boards received and considered various information regarding the nature, extent and quality of services provided to the Funds by Funds Management and the Sub-Adviser under the Advisory Agreements. This information included a description of the investment advisory services and Fund-level administrative services, as well as, among other things, a summary of the background and experience of senior management of Funds Management, and the qualifications, background, tenure and responsibilities of each of the portfolio managers primarily responsible for the day-to-day portfolio management of the Funds.
The Boards evaluated the ability of Funds Management and the Sub-Adviser to attract and retain qualified investment professionals, including research, advisory and supervisory personnel. The Boards further considered the compliance programs and compliance records of Funds Management and the Sub-Adviser. In addition, the Boards took into account the full range of services provided to the Funds by Funds Management and its affiliates.
Fund performance and expenses
The Boards considered the performance results for each of the Funds over various time periods ended March 31, 2015. The Boards considered these results in comparison to the performance of funds in a universe that was determined by Broadridge Inc. (“Broadridge”) to be similar to the respective Funds (each, a “Universe”), and in comparison to each Fund’s benchmark index and to other comparative data. Broadridge is an independent provider of investment company data. The Boards received a description of the methodology used by Broadridge to select the mutual funds in each performance Universe.
The Funds Trust Board noted that the performance of each Gateway Fund (Administrator Class) relative to its respective Universe was as follows: (i) the performance of the Real Return Fund was higher than the average performance of its Universe for all periods under review; and (ii) the performance of the Core Bond Fund was higher than the average performance of its Universe for all periods under review.
The Funds Trust Board also noted that the performance of each Gateway Fund relative to its respective benchmark was as follows: (i) the performance of the Real Return Fund was higher than or in range of its benchmark, the Barclays U.S. TIPS Index, for all periods under review except the five- and ten-year periods; and (ii) the performance of the Core Bond Fund was higher than or in range of its benchmark, the Barclays U.S. Aggregate Bond Index, for all periods under review except the one-year period.
The Master Trust Board took note of the performance of the Master Portfolios in the context of reviewing the performance of the Gateway Funds.
The Funds Trust Board also received and considered information regarding each Gateway Fund’s net operating expense ratios, which include fees and expenses of the corresponding Master Portfolio, and their various components, including actual management fees assessed at the Gateway Fund and Master Portfolio levels, custodian and other non-management fees, and Rule 12b-1 and non-Rule 12b-1 shareholder service fees. The Funds Trust Board considered these ratios in comparison to the median ratios of funds in class-specific expense groups that were determined by Broadridge to be similar to each Gateway Fund (the “Groups”). The Funds Trust Board received a description of the methodology used by Broadridge to select the mutual funds in the expense Groups and an explanation of how funds comprising expense groups and their expense ratios may vary from year-to-year. Based on the Broadridge reports, the Funds Trust Board noted that the net operating expense ratios of the Gateway Funds were as follows: (i) the net operating expense ratios of the Real Return Fund were lower than or in range of the median net operating expense ratios of its expense Groups for all share classes; and (ii) the net operating expense ratios of the Core Bond Fund were lower than the median net operating expense ratios of its expense Groups for all share classes.
With respect to the Master Portfolios, the Master Trust Board reviewed the fee rates that are payable to Funds Management for investment advisory services (as discussed below), which are the only fees charged at the Master Portfolio level, relative to a corresponding expense Group.
The Boards took into account the Fund performance and expense information provided to it among the factors considered in deciding to re-approve the Advisory Agreements.
Investment management, advisory and sub-advisory fee rates
The Funds Trust Board noted that Funds Management receives no advisory fees from a Gateway Fund as long as the Gateway Fund continues to invest all (or substantially all) of its assets in a single master portfolio. If a Gateway Fund were to change its investment structure so that it begins to invest in two or more master portfolios (a gateway blended fund), Funds Management would be entitled to receive an annual fee of 0.25% of the Gateway Fund’s average daily net assets for providing investment advisory services to the Gateway Fund, including allocating the Gateway Fund’s assets among various master portfolios.
| | | | |
| 62 | | Wells Fargo Income Funds | | Other information (unaudited) |
The Funds Trust Board reviewed and considered the fee rates that are payable by each Gateway Fund to Funds Management under the Gateway Fund Management Agreement, as well as the contractual fee rates payable by each Gateway Fund to Funds Management for class-level administrative services under a Class-Level Administration Agreement, which include class-level transfer agency and sub-transfer agency costs (collectively, the “Management Rates”).
The Master Trust Board reviewed and considered the contractual investment advisory fee rates that are payable by the Master Portfolios to Funds Management for investment advisory services under the Master Portfolio Advisory Agreement (the “Advisory Agreement Rates”). The Master Trust Board also reviewed and considered the contractual investment sub-advisory fee rates that are payable by Funds Management to the Sub-Advisers for investment sub-advisory services (the “Sub-Advisory Agreement Rates”).
Among other information reviewed by the Funds Trust Board was a comparison of each Gateway Fund’s Management Rate, which include the advisory fees paid at the Master Portfolio level, with the average contractual investment management fee rates of funds in the expense Groups at a common asset level as well as transfer agency costs of the funds in the expense Groups. The Funds Trust Board noted that the Management Rates of the Gateway Funds were as follows: (i) the Management Rates of the Real Return Fund were in range of the sum of the management fee rates and transfer agency costs of its respective expense Groups for all share classes; and (ii) the Management Rates for the Core Bond Fund were equal to or in range of the sum of the management fee rates and transfer agency costs of its respective expense Groups for all share classes.
The Master Trust Board reviewed a comparison of the Advisory Agreement Rates of each Master Portfolio with those of other funds in each Master Portfolio’s respective expense Group at a common asset level. The Master Trust Board noted that the Advisory Agreement Rates of each Master Portfolio were equal to or in range of the median rate for the Master Portfolio’s respective expense Group.
The Master Trust Board also received and considered information about the portions of the total management fees that were retained by Funds Management after payment of the fees to the Sub-Adviser for sub-advisory services. In assessing the reasonableness of these amounts, the Master Trust Board received and evaluated information about the nature and extent of responsibilities retained and risks assumed by Funds Management and not delegated to or assumed by the Sub-Adviser, and about Funds Management’s on-going oversight services. However, given the current affiliation between Funds Management and the Sub-Adviser, the Master Trust Board ascribed limited relevance to the allocation of the fees between them.
Other than with respect to the Wells Fargo Real Return Fund and Wells Fargo Real Return Portfolio, the Boards also received and considered information about the nature and extent of services offered and fee rates charged by Funds Management and the Sub-Adviser to other types of clients with investment strategies similar to those of the Funds. In this regard, the Boards received information about the significantly greater scope of services, and compliance, reporting and other legal burdens and risks of managing mutual funds compared with those associated with managing assets of non-mutual fund clients such as collective funds or institutional separate accounts.
Based on its consideration of the factors and information it deemed relevant, including those described here, the Funds Trust Board determined that the compensation payable to Funds Management under the Gateway Fund Management Agreement was reasonable, in light of the services covered by the Gateway Fund Management Agreement. The Master Trust Board determined that the compensation payable to Funds Management under the Master Portfolio Advisory Agreement and to each Sub-Adviser under each Sub-Advisory Agreement was reasonable, in light of the services covered by the Master Portfolio Advisory Agreement and each Sub-Advisory Agreement, respectively.
Profitability
The Boards received and considered information concerning the profitability of Funds Management, as well as the profitability of Wells Fargo as a whole, from providing services to the Funds and the fund family as a whole. The Boards also received and considered information concerning the profitability of the Sub-Adviser from providing services to the fund family as a whole, noting that the Sub-Adviser’s profitability information with respect to providing services to the Funds was subsumed in the Wells Fargo and Funds Management profitability analysis.
Funds Management reported on the methodologies and estimates used in calculating profitability. Among other things, the Boards noted that the levels of profitability reported on a fund-by-fund basis varied widely, depending on factors such as the size and type of fund. Based on its review, the Boards did not deem the profits reported by Funds Management or Wells Fargo from its services to the Funds to be at a level that would prevent the Boards from approving the continuation of the Advisory Agreements.
| | | | | | |
| Other information (unaudited) | | Wells Fargo Income Funds | | | 63 | |
Economies of scale
With respect to possible economies of scale, the Boards noted the existence of breakpoints in each Master Portfolio’s advisory fee structure and each Gateway Fund’s management fee structure, which operate generally to reduce the Funds’ expense ratios as the Funds grow in size. They considered that, for a small fund or a fund that shrinks in size, breakpoints conversely can result in higher fee levels. The Boards also considered that fee waiver and expense reimbursement arrangements and competitive fee rates at the outset are means of sharing potential economies of scale with shareholders of the Funds and the fund family as a whole. The Boards considered Funds Management’s view that any analyses of potential economies of scale in managing a particular fund are inherently limited in light of the joint and common costs and investments that Funds Management incurs across the fund family as a whole.
The Boards concluded that the Funds’ fee and expense arrangements, including contractual breakpoints, constituted a reasonable approach to sharing potential economies of scale with the Funds and their shareholders.
Other benefits to Funds Management and the Sub-Adviser
The Boards received and considered information regarding potential “fall-out” or ancillary benefits received by Funds Management and its affiliates, including the Sub-Adviser, as a result of their relationships with the Funds. Ancillary benefits could include, among others, benefits directly attributable to other relationships with the Funds and benefits potentially derived from an increase in Funds Management’s and the Sub-Adviser’s business as a result of their relationships with the Funds. The Boards noted that various affiliates of Funds Management may receive distribution-related fees, shareholder servicing payments and sub-transfer agency fees in respect of shares sold or held through them and services provided.
The Boards also reviewed information about soft dollar credits earned and utilized by the Sub-Adviser, fees earned by Funds Management and the Sub-Adviser from managing a private investment vehicle for the fund family’s securities lending collateral and commissions earned by an affiliated broker from portfolio transactions.
Based on their consideration of the factors and information they deemed relevant, including those described here, the Boards did not find that any ancillary benefits received by Funds Management and its affiliates, including the Sub-Adviser, were unreasonable.
Conclusion
At the Meeting, after considering the above-described factors and based on its deliberations and its evaluation of the information described above, the Funds Trust Board unanimously approved the continuation of the Gateway Fund Management Agreement for a one-year period. Additionally, at the Meeting, after considering the above-described factors and based on its deliberations and its evaluation of the information described above, the Master Trust Board unanimously approved the continuation of the Master Portfolio Advisory Agreement for a one-year term and each Sub-Advisory Agreement for a one-year term. The Boards also determined that the compensation payable to Funds Management and each of the Sub-Advisers was reasonable.
| | | | |
| 64 | | Wells Fargo Income Funds | | List of abbreviations |
The following is a list of common abbreviations for terms and entities that may have appeared in this report.
| ACA | — ACA Financial Guaranty Corporation |
| ADR | — American depositary receipt |
| ADS | — American depositary shares |
| AGC | — Assured Guaranty Corporation |
| AGM | — Assured Guaranty Municipal |
| Ambac | — Ambac Financial Group Incorporated |
| AMT | — Alternative minimum tax |
| BAN | — Bond anticipation notes |
| BHAC | — Berkshire Hathaway Assurance Corporation |
| CAB | — Capital appreciation bond |
| CCAB | — Convertible capital appreciation bond |
| CDA | — Community Development Authority |
| CDO | — Collateralized debt obligation |
| DRIVER | — Derivative inverse tax-exempt receipts |
| DW&P | — Department of Water & Power |
| DWR | — Department of Water Resources |
| ECFA | — Educational & Cultural Facilities Authority |
| EDA | — Economic Development Authority |
| EDFA | — Economic Development Finance Authority |
| ETF | — Exchange-traded fund |
| FDIC | — Federal Deposit Insurance Corporation |
| FFCB | — Federal Farm Credit Banks |
| FGIC | — Financial Guaranty Insurance Corporation |
| FHA | — Federal Housing Administration |
| FHLB | — Federal Home Loan Bank |
| FHLMC | — Federal Home Loan Mortgage Corporation |
| FICO | — The Financing Corporation |
| FNMA | — Federal National Mortgage Association |
| GDR | — Global depositary receipt |
| GNMA | — Government National Mortgage Association |
| HCFR | — Healthcare facilities revenue |
| HEFA | — Health & Educational Facilities Authority |
| HEFAR | — Higher education facilities authority revenue |
| HFA | — Housing Finance Authority |
| HFFA | — Health Facilities Financing Authority |
| HUD | — Department of Housing and Urban Development |
| IDA | — Industrial Development Authority |
| IDAG | — Industrial Development Agency |
| KRW | — Republic of Korea won |
| LIBOR | — London Interbank Offered Rate |
| LIFER | — Long Inverse Floating Exempt Receipts |
| LLC | — Limited liability company |
| LLLP | — Limited liability limited partnership |
| LLP | — Limited liability partnership |
| MBIA | — Municipal Bond Insurance Association |
| MFHR | — Multifamily housing revenue |
| MSTR | — Municipal securities trust receipts |
| MUD | — Municipal Utility District |
| National | — National Public Finance Guarantee Corporation |
| PCFA | — Pollution Control Financing Authority |
| PCL | — Public Company Limited |
| PCR | — Pollution control revenue |
| PFA | — Public Finance Authority |
| PFFA | — Public Facilities Financing Authority |
| PFOTER | — Puttable floating option tax-exempt receipts |
| plc | — Public limited company |
| PUTTER | — Puttable tax-exempt receipts |
| R&D | — Research & development |
| Radian | — Radian Asset Assurance |
| RAN | — Revenue anticipation notes |
| RDA | — Redevelopment Authority |
| RDFA | — Redevelopment Finance Authority |
| REIT | — Real estate investment trust |
| ROC | — Reset option certificates |
| SAVRS | — Select auction variable rate securities |
| SBA | — Small Business Authority |
| SDR | — Swedish depositary receipt |
| SFHR | — Single-family housing revenue |
| SFMR | — Single-family mortgage revenue |
| SPA | — Standby purchase agreement |
| SPDR | — Standard & Poor’s Depositary Receipts |
| SPEAR | — Short Puttable Exempt Adjustable Receipts |
| STRIPS | — Separate trading of registered interest and |
| TAN | — Tax anticipation notes |
| TIPS | — Treasury inflation-protected securities |
| TRAN | — Tax revenue anticipation notes |
| TTFA | — Transportation Trust Fund Authority |
| TVA | — Tennessee Valley Authority |

For more information
More information about Wells Fargo Funds is available free upon request. To obtain literature, please write, email, visit the Funds’ website, or call:
Wells Fargo Funds
P.O. Box 8266
Boston, MA 02266-8266
Email: fundservice@wellsfargo.com
Website: wellsfargofunds.com
Individual investors: 1-800-222-8222
Retail investment professionals: 1-888-877-9275
Institutional investment professionals: 1-866-765-0778
This report and the financial statements contained herein are submitted for the general information of the shareholders of the Funds. If this report is used for promotional purposes, distribution of the report must be accompanied or preceded by a current prospectus. Before investing, please consider the investment objectives, risks, charges, and expenses of the investment. For a current prospectus and, if available, a summary prospectus, containing this information, call 1-800-222-8222 or visit the Funds’ website at wellsfargofunds.com. Read the prospectus carefully before you invest or send money.
Wells Fargo Asset Management (WFAM) is a trade name used by the asset management businesses of Wells Fargo & Company. Wells Fargo Funds Management, LLC, a wholly owned subsidiary of Wells Fargo & Company, provides investment advisory and administrative services for Wells Fargo Funds. Other affiliates of Wells Fargo & Company provide subadvisory and other services for the funds. The funds are distributed by Wells Fargo Funds Distributor, LLC, Member FINRA, an affiliate of Wells Fargo & Company.
NOT FDIC INSURED ¡ NO BANK GUARANTEE ¡ MAY LOSE VALUE
© 2016 Wells Fargo Funds Management, LLC. All rights reserved.
| | |
 | | 243138 07-16 AILD/AR103 05-16 |
Annual Report
May 31, 2016

WealthBuilderSM Portfolios

| n | | Wells Fargo WealthBuilder Conservative Allocation Portfolio |
| n | | Wells Fargo WealthBuilder Moderate Balanced Portfolio |
| n | | Wells Fargo WealthBuilder Growth Balanced Portfolio |
| n | | Wells Fargo WealthBuilder Growth Allocation Portfolio |
| n | | Wells Fargo WealthBuilder Equity Portfolio |
| n | | Wells Fargo WealthBuilder Tactical Equity Portfolio |

Reduce clutter. Save trees.
Sign up for electronic delivery of prospectuses and shareholder reports at wellsfargo.com/advantagedelivery
Contents
The views expressed and any forward-looking statements are as of May 31, 2016, unless otherwise noted, and are those of the Fund managers and/or Wells Fargo Funds Management, LLC. Discussions of individual securities, or the markets generally, or any Wells Fargo Fund are not intended as individual recommendations. Future events or results may vary significantly from those expressed in any forward-looking statements. The views expressed are subject to change at any time in response to changing circumstances in the market. Wells Fargo Funds Management, LLC and the Funds disclaim any obligation to publicly update or revise any views expressed or forward-looking statements.
NOT FDIC INSURED ¡ NO BANK GUARANTEE ¡ MAY LOSE VALUE
| | | | |
| 2 | | Wells Fargo WealthBuilder Portfolios | | Letter to shareholders (unaudited) |

Karla M. Rabusch
President
Wells Fargo Funds
During much of the period, global equity, bond, and currency markets were volatile as recessionary pressures and diverging central bank policies concerned investors.
During the fourth quarter of 2015, Japan’s economy contracted, China’s manufacturing sector retrenched, and growth appeared to slow in Europe.
Dear Valued Shareholder:
We are pleased to offer you this annual report for the Wells Fargo WealthBuilder Portfolios for the 12-month period that ended May 31, 2016. During much of the period, global equity, bond, and currency markets were volatile as recessionary pressures and diverging central bank policies concerned investors. As the period closed, investor confidence appeared to improve based on favorable economic data in key markets and central bank monetary policies that were intended to support increased business activity.
Shifting investor sentiment reflected changing economic and business data.
Early in the period, oil prices declined after a spring rally, negotiations about Greece’s ability to repay its sovereign debt grew contentious, and the U.S. dollar strengthened. By July 2015, equity markets were declining, led by stocks in China, which endured the largest one-day loss since 2007 on July 27, 2015.
The S&P 500 Index,1 a common measure of U.S. stock performance, fell into correction territory—defined as a loss of 10% or more—during August 2015 before recovering somewhat. The index retested the August lows in late September before recovering most of its year-to-date-2015 losses from October through December. As anticipated, the U.S. Federal Reserve (the Fed) increased the federal funds rate in December and suggested it planned to pursue additional increases in 2016. During the first six weeks of 2016, the index suffered the worst loss to open a year on record before trending higher. By the end of the 12-month reporting period, the index recorded a 1.72% gain.
Overseas, the Morgan Stanley Capital International (MSCI) All Country World Index (ACWI) ex USA Index (Net)2 and the MSCI Emerging Markets (EM) Index (Net)3 recorded negative returns. In August 2015, China allowed its currency’s value to decline in an attempt to bolster exports. The U.S. dollar strengthened, which negatively affected investment returns and U.S. corporate profits earned overseas. During the fourth quarter of 2015, Japan’s economy contracted, China’s manufacturing sector retrenched, and growth appeared to slow in Europe.
Global equity markets hit low points before starting to rebound in the middle of February 2016 when business data improved and central bankers reasserted their commitment to initiatives intended to encourage economic activity. The European Central Bank (ECB) pushed the deposit interest rate further into negative territory. The Bank of Japan (BOJ) followed the ECB’s lead by setting a negative deposit rate. Negative deposit interest rates are intended to encourage banks to lend assets rather than keep them on deposit. The People’s Bank of China (PBOC) reduced reserve ratios, which also was intended to encourage lending. The ECB expanded its bond-buying program, which injects liquidity into the markets and encourages investment.
For the 12-month reporting period, the MSCI ACWI ex USA Index (Net) and MSCI EM Index (Net) recorded returns of -11.39% and -17.63%, respectively.
A December federal funds rate increase marked divergence of central bank policies.
Bond markets were volatile as well. The Fed’s decision to tighten credit conditions through higher interest rates contrasted with actions by the ECB, the PBOC, and the BOJ. In January 2016, amid falling stock markets, U.S. corporate profits declined for the
| 1 | The S&P 500 Index consists of 500 stocks chosen for market size, liquidity, and industry group representation. It is a market-value-weighted index with each stock’s weight in the index proportionate to its market value. You cannot invest directly in an index. |
| 2 | The Morgan Stanley Capital International (MSCI) All Country World Index (ACWI) ex USA Index (Net) is a free float-adjusted market capitalization weighted index that is designed to measure the equity market performance of developed markets, excluding the U.S. and Canada. Source: MSCI. MSCI makes no express or implied warranties or representations and shall have no liability whatsoever with respect to any MSCI data contained herein. The MSCI data may not be further redistributed or used as a basis for other indexes or any securities or financial products. This report is not approved, reviewed, or produced by MSCI. You cannot invest directly in an index. |
| 3 | The MSCI Emerging Markets (EM) Index (Net) is a free float-adjusted market capitalization weighted index that is designed to measure the equity market performance of emerging markets. The MSCI EM Index (Net) consists of the following 23 emerging markets country indexes: Brazil, Chile, China, Colombia, Czech Republic, Egypt, Greece, Hungary, India, Indonesia, Korea, Malaysia, Mexico, Peru, the Philippines, Poland, Qatar, Russia, South Africa, Taiwan, Thailand, Turkey, and United Arab Emirates. You cannot invest directly in an index. |
| | | | | | |
| Letter to shareholders (unaudited) | | Wells Fargo WealthBuilder Portfolios | | | 3 | |
second consecutive quarter. The Fed expressed hesitancy about additional credit tightening in the near term, which investors appeared to read as accommodative of business activity. Overall, policy actions of central banks and intermittently positive economic data heartened investors as the period drew to a close.
Bond markets benefited during the period, with the Barclays Global Aggregate ex U.S. Dollar Bond Index4 gaining 7.25%, the Barclays U.S. Aggregate Bond Index5 gaining 2.99%, and the Barclays U.S. Treasury Index6 adding 3.01% during the period.
Don’t let short-term uncertainty derail long-term investment goals.
Periods of investment uncertainty can present challenges, but experience has taught us that maintaining long-term investment goals can be an effective way to plan for the future. To help you create a sound strategy based on your personal goals and risk tolerance, Wells Fargo Funds offers more than 100 mutual funds spanning a wide range of asset classes and investment styles. Although diversification cannot guarantee an investment profit or prevent losses, we believe it can be an effective way to manage investment risk and potentially smooth out overall portfolio performance. We encourage investors to know their investments and to understand that appropriate levels of risk-taking may unlock opportunities.
Thank you for choosing to invest with Wells Fargo Funds. We appreciate your confidence in us and remain committed to helping you meet your financial needs.
Sincerely,

Karla M. Rabusch
President
Wells Fargo Funds
Notice to shareholders
British Exit from European Union (“Brexit”)
On June 23, 2016, the United Kingdom (UK) voted to leave the European Union (EU). It is expected that the UK’s exit from the EU will take place within two years after giving formal notice to the EU of its intention to withdraw; however, the exact timeframe is unknown. There is considerable uncertainty about how the UK exit from the EU will be conducted, how negotiations of necessary treaties and trade agreements will proceed or how the financial markets will react. In addition, it is not yet known whether Brexit will increase the likelihood of other countries seeking to depart the EU. Immediately following the vote, markets in the UK, Europe and the world were negatively impacted. In light of the uncertainties surrounding the impact of Brexit on the broader global economy, the negative impact could be significant, potentially resulting in increased volatility and illiquidity and lower economic growth for companies that rely significantly on Europe for their business activities and revenues. Any further exits from the EU, or the possibility of such exits, would likely cause additional market disruption globally and introduce new legal and regulatory uncertainties.
Notice to shareholders
At a meeting held on July 15, 2016, shareholders of the Wells Fargo WealthBuilder Equity Portfolio approved the merger of the Portfolio into the Wells Fargo WealthBuilder Tactical Equity Portfolio. Following the merger, which occurred after the close of business on July 22, 2016, the Wells Fargo WealthBuilder Tactical Equity Portfolio changed its name to the Wells Fargo WealthBuilder Equity Portfolio.
For current information about your Fund investments, contact your investment professional, visit our website at wellsfargofunds.com, or call us directly at 1-800-222-8222. We are available 24 hours a day, 7 days a week.
| 4 | The Barclays Global Aggregate ex U.S. Dollar Bond Index tracks an international basket of government, corporate, agency, and mortgage-related bonds. You cannot invest directly in an index. |
| 5 | The Barclays U.S. Aggregate Bond Index is a broad-based benchmark that measures the investment-grade, U.S. dollar–denominated, fixed-rate taxable bond market, including Treasuries, government-related and corporate securities, mortgage-backed securities (agency fixed-rate and hybrid adjustable-rate mortgage pass-throughs), asset-backed securities, and commercial mortgage-backed securities. You cannot invest directly in an index. |
| 6 | The Barclays U.S. Treasury Index is an unmanaged index of prices of U.S. Treasury bonds with maturities of 1 to 30 years. You cannot invest directly in an index. |
| | | | |
| 4 | | Wells Fargo WealthBuilder Portfolios | | Performance highlights (unaudited) |
Wells Fargo WealthBuilder Conservative Allocation Portfolio
Investment objective
The Portfolio seeks current income with a secondary emphasis on capital appreciation.
Manager
Wells Fargo Funds Management, LLC
Subadviser
Wells Capital Management Incorporated
Portfolio managers
Kandarp R. Acharya, CFA®, FRM
Christian L. Chan, CFA®
Average annual total returns (%) as of May 31, 2016
| | | | | | | | | | | | | | | | | | | | | | | | | | | | | | | | | | | | | | |
| | | | | Including sales charge | | | Excluding sales charge | | | | | | Expense ratios1 (%) | |
| | | Inception date | | 1 year | | | 5 year | | | 10 year | | | 1 year | | | 5 year | | | 10 year | | | | | | Gross | | | Net2 | |
| Wells Fargo WealthBuilder Conservative Allocation Portfolio (WBCAX) | | 9-30-2004 | | | (2.59 | ) | | | 1.79 | | | | 3.20 | | | | (1.11 | ) | | | 2.10 | | | | 3.36 | | | | | | | | 2.04 | | | | 2.04 | |
| WealthBuilder Conservative Allocation Composite Index3 | | – | | | – | | | | – | | | | – | | | | 1.87 | | | | 4.36 | | | | 5.37 | | | | | | | | – | | | | – | |
| Barclays U.S. Aggregate Bond Index4 | | – | | | – | | | | – | | | | – | | | | 2.99 | | | | 3.33 | | | | 4.97 | | | | | | | | – | | | | – | |
| MSCI ACWI ex USA Index (Net)5 | | – | | | – | | | | – | | | | – | | | | (11.39 | ) | | | 0.12 | | | | 2.01 | | | | | | | | – | | | | – | |
| Russell 3000® Index6 | | – | | | – | | | | – | | | | – | | | | 0.22 | | | | 11.15 | | | | 7.39 | | | | | | | | – | | | | – | |
Figures quoted represent past performance, which is no guarantee of future results, and do not reflect taxes that a shareholder may pay on fund distributions or the redemption of fund shares. Investment return and principal value of an investment will fluctuate so that an investor’s shares, when redeemed, may be worth more or less than their original cost. Performance shown without sales charges would be lower if sales charges were reflected. Current performance may be lower or higher than the performance data quoted, which assumes the reinvestment of dividends and capital gains. Current month-end performance is available on the Portfolio’s website, wellsfargofunds.com.
Index returns do not include transaction costs associated with buying and selling securities, any mutual fund fees or expenses, or any taxes. It is not possible to invest directly in an index.
For WealthBuilder Portfolios, the maximum front-end sales charge is 1.50%.
Balanced funds may invest in stocks and bonds. Stock values fluctuate in response to the activities of individual companies and general market and economic conditions. Bond values fluctuate in response to the financial condition of individual issuers, general market and economic conditions, and changes in interest rates. Changes in market conditions and government policies may lead to periods of heightened volatility in the bond market and reduced liquidity for certain bonds held by the Portfolio. In general, when interest rates rise, bond values fall and investors may lose principal value. Interest-rate changes and their impact on the Portfolio and its share price can be sudden and unpredictable. The use of derivatives may reduce returns and/or increase volatility. The Portfolio will indirectly be exposed to all of the risks of an investment in the underlying funds and will indirectly bear expenses of the underlying funds. Certain investment strategies tend to increase the total risk of an investment (relative to the broader market). The Portfolio is exposed to alternative investment risk, foreign investment risk, high-yield securities risk, mortgage- and asset-backed securities risk, and smaller-company investment risk. Consult the Portfolio’s prospectus for additional information on these and other risks.
Please see footnotes on page 5.
| | | | | | |
| Performance highlights (unaudited) | | Wells Fargo WealthBuilder Portfolios | | | 5 | |
Wells Fargo WealthBuilder Conservative Allocation Portfolio (continued)
|
| Growth of $10,000 investment as of May 31, 201610 |
|
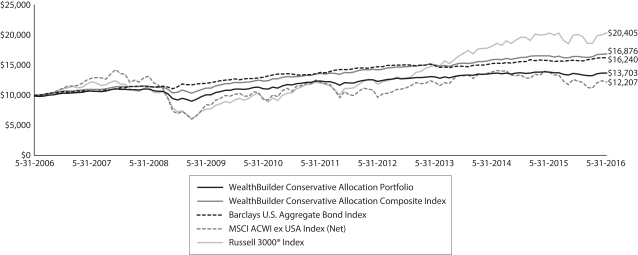 |
| 1 | Reflects the expense ratios as stated in the most recent prospectus, which include the impact of 0.54% of acquired fund fees and expenses and net expenses from affiliated master portfolios. The expense ratios shown are subject to change and may differ from the annualized expense ratios shown in the financial highlights of this report, which do not include acquired fund fees and expenses and net expenses from affiliated master portfolios. |
| 2 | The manager has contractually committed through September 30, 2016, to waive fees and/or reimburse expenses to the extent necessary to cap the Portfolio’s Total Annual Fund Operating Expenses After Fee Waiver at 1.50%. After this time, the cap may be increased or the commitment to maintain the cap may be terminated only with the approval of the Board of Trustees. Brokerage commissions, stamp duty fees, interest, taxes, acquired fund fees and expenses, net expenses from affiliated master portfolios, and extraordinary expenses are excluded from the expense cap. Without this cap, the Portfolio’s returns would have been lower. |
| 3 | Source: Wells Fargo Funds Management, LLC. The WealthBuilder Conservative Allocation Composite Index is comprised of the following indexes: Barclays U.S. Aggregate Bond Index (80%), MSCI ACWI ex USA Index (Net) (6%) and Russell 3000® Index (14%). You cannot invest directly in an index. |
| 4 | The Barclays U.S. Aggregate Bond Index is a broad-based benchmark that measures the investment-grade, U.S. dollar–denominated, fixed-rate taxable bond market, including Treasuries, government-related and corporate securities, mortgage-backed securities (agency fixed-rate and hybrid adjustable-rate mortgage pass-throughs), asset-backed securities, and commercial mortgage-backed securities. You cannot invest directly in an index. |
| 5 | The Morgan Stanley Capital International (MSCI) All Country World Index (ACWI) ex USA Index (Net) is a free-float-adjusted market-capitalization-weighted index that is designed to measure the equity market performance of developed markets, excluding the U.S. and Canada. Source: MSCI. MSCI makes no express or implied warranties or representations and shall have no liability whatsoever with respect to any MSCI data contained herein. The MSCI data may not be further redistributed or used as a basis for other indexes or any securities or financial products. This report is not approved, reviewed, or produced by MSCI. You cannot invest directly in an index. |
| 6 | The Russell 3000® Index measures the performance of the 3,000 largest U.S. companies based on total market capitalization, which represents approximately 98% of the investable U.S. equity market. You cannot invest directly in an index. |
| 7 | The S&P 500 Index consists of approximately 500 stocks chosen for market size, liquidity, and industry group representation. It is a market-value-weighted index with each stock’s weight in the index proportionate to its market value. You cannot invest directly in an index. |
| 8 | The Russell 2000® Index measures the performance of the 2,000 smallest companies in the Russell 3000® Index, which represents approximately 8% of the total market capitalization of the Russell 3000® Index. You cannot invest directly in an index. |
| 9 | The MSCI Emerging Markets (EM) Index (Net) is a free-float-adjusted market-capitalization-weighted index that is designed to measure the equity market performance of emerging markets. The MSCI EM Index (Net) consists of the following 23 emerging markets country indexes: Brazil, Chile, China, Colombia, Czech Republic, Egypt, Greece, Hungary, India, Indonesia, Korea, Malaysia, Mexico, Peru, the Philippines, Poland, Qatar, Russia, South Africa, Taiwan, Thailand, Turkey, and United Arab Emirates. You cannot invest directly in an index. |
| 10 | The chart compares the performance of the Portfolio for the most recent ten years with the WealthBuilder Conservative Allocation Composite Index, the Barclays U.S. Aggregate Bond Index, the MSCI ACWI ex USA Index (Net) and the Russell 3000® Index. The chart assumes a hypothetical $10,000 investment and reflects all operating expenses and assumes the maximum initial sales charge of 1.50%. |
| 11 | The ten largest holdings, excluding cash and cash equivalents, are calculated based on the value of the investments divided by the total net assets of the Portfolio. Holdings are subject to change and may have changed since the date specified. |
| 12 | Current target allocation includes the effect of any tactical futures overlay that may be in place. Effective cash is comprised of the net impact of long and/or short futures contracts held as part of dynamic risk management strategy. The amounts are subject to change and may have changed since the date specified. |
| | | | |
| 6 | | Wells Fargo WealthBuilder Portfolios | | Performance highlights (unaudited) |
Wells Fargo WealthBuilder Conservative Allocation Portfolio (continued)
MANAGER’S DISCUSSION
Fund highlights
| n | | The Portfolio underperformed its benchmark, the WealthBuilder Conservative Allocation Composite Index, for the 12-month period that ended May 31, 2016. |
| n | | The Portfolio’s bond investments added value on an absolute basis but underperformed relative to the benchmark, primarily due to an allocation to U.S. high yield bonds. |
| n | | The Portfolio’s equity investments overall underperformed their benchmarks, due primarily to its overweight to U.S. small cap funds. |
| n | | The Portfolio’s allocation to commodities was a significant detractor from performance. |
| n | | Tactical asset allocation added to performance through the period. During market corrections in August 2015 and January 2016, the portfolio management team tactically shifted the Portfolio’s allocation during periods of depressed equity prices, which added value. |
Equity markets experienced two corrections during the previous 12 months.
Global equity markets experienced two corrections during the previous 12 months. Amid fears of contagion from international markets, U.S. equities sold off heavily during August 2015 and January 2016. In August, the contraction was fueled by fears of collapsing growth in China. In January, in addition to renewed fears of lower output in China and softer domestic economic data, oil prices dropped below $30 a barrel.
The second correction, which followed the first hike in the federal funds interest rate in a decade, raised concerns that the U.S. Federal Reserve acted too hastily. U.S. investors feared a contracting global economy coupled with the currency and business effects of a rate hike would drive down international demand for U.S. goods. Despite the headwinds, the S&P 500 Index7 ended the period up 1.72%.
The European Central Bank (ECB) and the Bank of Japan (BOJ) increased monetary stimulus programs that were intended to bolster their local economies. Brazil’s business and political woes continued and China reduced its economic growth forecasts, which tended to restrain investor enthusiasm for international investments.
U.S. bonds, as measured by the Barclays U.S. Aggregate Bond Index,4 rose 2.99%, outperforming large-cap stocks. Small-cap stocks, as measured by the Russell 2000® Index,8 returned -5.97%. International stocks returned -11.39%, as measured by the Morgan Stanley Capital International (MSCI) All Country World Index (ACWI) ex USA Index (Net).5 Within international stocks, emerging markets stocks fell the most at -17.63%, as measured by the MSCI Emerging Markets (EM) Index (Net).9
| | | | |
| Ten largest holdings (%) as of May 31, 201611 | |
Wells Fargo Core Bond Portfolio | | | 23.80 | |
Wells Fargo Short Duration Government Bond Fund Class R6 | | | 18.32 | |
Wells Fargo Government Securities Fund Institutional Class | | | 14.03 | |
PIMCO High Yield Fund Institutional Class | | | 10.15 | |
Oppenheimer International Bond Fund Class Y | | | 4.59 | |
MFS Value Fund Class I | | | 3.03 | |
PIMCO CommodityRealReturn Strategy Fund Institutional Class | | | 2.72 | |
Thornburg International Value Fund Institutional Class | | | 1.82 | |
Voya Global Real Estate Fund Class I | | | 1.79 | |
T. Rowe Price Blue Chip Growth Fund Retail Class | | | 1.78 | |
The Portfolio’s allocation to stocks and bonds is determined by a combination of inputs from multiple quantitative as well as qualitative factors.
During the period, the portfolio management team took tactical advantage of equity price movements. Through our overlays, we tactically increased equity exposures through the first correction in August 2015, increasing equity holdings as Chinese and U.S. markets sold off. As the market correction reversed in the following months, the overlay added value to the Portfolio’s performance. Again in January and February 2016, we saw a similar correction and used our overlays to overweight equities. Through effective execution of our hedging strategy, the team again added to the Portfolio’s returns.
Please see footnotes on page 5.
| | | | | | |
| Performance highlights (unaudited) | | Wells Fargo WealthBuilder Portfolios | | | 7 | |
Wells Fargo WealthBuilder Conservative Allocation Portfolio (continued)
During the last 12 months, the team altered the Portfolio’s exposure to international stocks, trimming exposure to emerging markets to increase investments in Japan. The currency exposures to the euro and the yen were tactically hedged.
We also expanded bond investments to include municipal bonds. This helped diversify the sources of fixed-income returns during the period.
|
| Current target allocation as of May 31, 201612 |
|
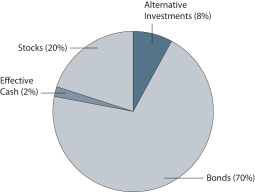 |
We remain cautiously optimistic about the longer-term outlook for stocks.
Bond yields continued to be depressed. The potential for future interest-rate hikes may be a headwind to increases in overall output in the general U.S. economy. With yields at historical lows, there continues to be a duration risk in bonds.
Internationally, the accommodative policies of the ECB and BOJ are intended to bolster their local economies. We believe these central banks will continue to support growth in their economies, which should be supportive of asset prices. In addition to developed international economies, emerging markets stocks are at low valuation levels not seen in years. Finally, domestic stocks and the U.S. economy have shown resilience in the past year. We look to market signals and economic releases to help inform the changing state of U.S. markets.
|
| Neutral target allocation |
|
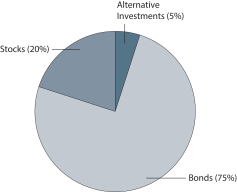
|
Please see footnotes on page 5.
| | | | |
| 8 | | Wells Fargo WealthBuilder Portfolios | | Performance highlights (unaudited) |
Wells Fargo WealthBuilder Moderate Balanced Portfolio
Investment objective
The Portfolio seeks a combination of current income and capital appreciation.
Manager
Wells Fargo Funds Management, LLC
Subadviser
Wells Capital Management Incorporated
Portfolio managers
Kandarp R. Acharya, CFA®, FRM
Christian L. Chan, CFA®
Average annual total returns (%) as of May 31, 2016
| | | | | | | | | | | | | | | | | | | | | | | | | | | | | | | | | | |
| | | | | Including sales charge | | | Excluding sales charge | | | Expense ratios1 (%) | |
| | | Inception date | | 1 year | | | 5 year | | | 10 year | | | 1 year | | | 5 year | | | 10 year | | | Gross | | | Net2 | |
| Wells Fargo WealthBuilder Moderate Balanced Portfolio (WBBBX) | | 9-30-2004 | | | (3.49 | ) | | | 3.10 | | | | 3.52 | | | | (2.02 | ) | | | 3.42 | | | | 3.68 | | | | 2.11 | | | | 2.11 | |
| WealthBuilder Moderate Balanced Composite Index3 | | – | | | – | | | | – | | | | – | | | | 0.66 | | | | 5.33 | | | | 5.66 | | | | – | | | | – | |
| Barclays U.S. Aggregate Bond Index4 | | – | | | – | | | | – | | | | – | | | | 2.99 | | | | 3.33 | | | | 4.97 | | | | – | | | | – | |
| MSCI ACWI ex USA Index (Net)5 | | – | | | – | | | | – | | | | – | | | | (11.39 | ) | | | 0.12 | | | | 2.01 | | | | – | | | | – | |
| Russell 3000® Index6 | | – | | | – | | | | – | | | | – | | | | 0.22 | | | | 11.15 | | | | 7.39 | | | | – | | | | – | |
Figures quoted represent past performance, which is no guarantee of future results, and do not reflect taxes that a shareholder may pay on fund distributions or the redemption of fund shares. Investment return and principal value of an investment will fluctuate so that an investor’s shares, when redeemed, may be worth more or less than their original cost. Performance shown without sales charges would be lower if sales charges were reflected. Current performance may be lower or higher than the performance data quoted, which assumes the reinvestment of dividends and capital gains. Current month-end performance is available on the Portfolio’s website, wellsfargofunds.com.
Index returns do not include transaction costs associated with buying and selling securities, any mutual fund fees or expenses, or any taxes. It is not possible to invest directly in an index.
For WealthBuilder Portfolios, the maximum front-end sales charge is 1.50%.
Balanced funds may invest in stocks and bonds. Stock values fluctuate in response to the activities of individual companies and general market and economic conditions. Bond values fluctuate in response to the financial condition of individual issuers, general market and economic conditions, and changes in interest rates. Changes in market conditions and government policies may lead to periods of heightened volatility in the bond market and reduced liquidity for certain bonds held by the Portfolio. In general, when interest rates rise, bond values fall and investors may lose principal value. Interest-rate changes and their impact on the Portfolio and its share price can be sudden and unpredictable. The use of derivatives may reduce returns and/or increase volatility. The Portfolio will indirectly be exposed to all of the risks of an investment in the underlying funds and will indirectly bear expenses of the underlying funds. Certain investment strategies tend to increase the total risk of an investment (relative to the broader market). The Portfolio is exposed to alternative investment risk, foreign investment risk, high-yield securities risk, mortgage-and asset-backed securities risk, and smaller-company investment risk. Consult the Portfolio’s prospectus for additional information on these and other risks.
Please see footnotes on page 9.
| | | | | | |
| Performance highlights (unaudited) | | Wells Fargo WealthBuilder Portfolios | | | 9 | |
Wells Fargo WealthBuilder Moderate Balanced Portfolio (continued)
|
| Growth of $10,000 investment as of May 31, 20167 |
|
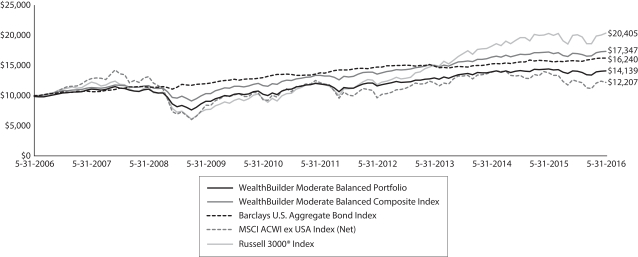 |
| 1 | Reflects the expense ratios as stated in the most recent prospectus, which include the impact of 0.61% of acquired fund fees and expenses and net expenses from affiliated master portfolios. The expense ratios shown are subject to change and may differ from the annualized expense ratios shown in the financial highlights of this report, which do not include acquired fund fees and expenses and net expenses from affiliated master portfolios. |
| 2 | The manager has contractually committed through September 30, 2016, to waive fees and/or reimburse expenses to the extent necessary to cap the Portfolio’s Total Annual Fund Operating Expenses After Fee Waiver at 1.50%. After this time, the cap may be increased or the commitment to maintain the cap may be terminated only with the approval of the Board of Trustees. Brokerage commissions, stamp duty fees, interest, taxes, acquired fund fees and expenses, net expenses from affiliated master portfolios, and extraordinary expenses are excluded from the expense cap. Without this cap, the Portfolio’s returns would have been lower. |
| 3 | Source: Wells Fargo Funds Management, LLC. The WealthBuilder Moderate Balanced Composite Index is comprised of the following indexes: Barclays U.S. Aggregate Bond Index (60%), MSCI ACWI ex USA Index (Net) (12%) and Russell 3000® Index (28%). You cannot invest directly in an index. |
| 4 | The Barclays U.S. Aggregate Bond Index is a broad-based benchmark that measures the investment-grade, U.S. dollar–denominated, fixed-rate taxable bond market, including Treasuries, government-related and corporate securities, mortgage-backed securities (agency fixed-rate and hybrid adjustable-rate mortgage pass-throughs), asset-backed securities, and commercial mortgage-backed securities. You cannot invest directly in an index. |
| 5 | The Morgan Stanley Capital International (MSCI) All Country World Index (ACWI) ex USA Index (Net) is a free-float-adjusted market-capitalization-weighted index that is designed to measure the equity market performance of developed markets, excluding the U.S. and Canada. Source: MSCI. MSCI makes no express or implied warranties or representations and shall have no liability whatsoever with respect to any MSCI data contained herein. The MSCI data may not be further redistributed or used as a basis for other indexes or any securities or financial products. This report is not approved, reviewed, or produced by MSCI. You cannot invest directly in an index. |
| 6 | The Russell 3000® Index measures the performance of the 3,000 largest U.S. companies based on total market capitalization, which represents approximately 98% of the investable U.S. equity market. You cannot invest directly in an index. |
| 7 | The chart compares the performance of the Portfolio for the most recent ten years with the WealthBuilder Moderate Balanced Composite Index, the Barclays U.S. Aggregate Bond Index, the MSCI ACWI ex USA Index (Net), and the Russell 3000® Index. The chart assumes a hypothetical $10,000 investment and reflects all operating expenses and assumes the maximum initial sales charge of 1.50%. |
| 8 | The S&P 500 Index consists of approximately 500 stocks chosen for market size, liquidity, and industry group representation. It is a market-value-weighted index with each stock’s weight in the index proportionate to its market value. You cannot invest directly in an index. |
| 9 | The Russell 2000® Index measures the performance of the 2,000 smallest companies in the Russell 3000® Index, which represents approximately 8% of the total market capitalization of the Russell 3000® Index. You cannot invest directly in an index. |
| 10 | The MSCI Emerging Markets (EM) Index (Net) is a free-float-adjusted market-capitalization-weighted index that is designed to measure the equity market performance of emerging markets. The MSCI EM Index (Net) consists of the following 23 emerging markets country indexes: Brazil, Chile, China, Colombia, Czech Republic, Egypt, Greece, Hungary, India, Indonesia, Korea, Malaysia, Mexico, Peru, the Philippines, Poland, Qatar, Russia, South Africa, Taiwan, Thailand, Turkey, and United Arab Emirates. You cannot invest directly in an index. |
| 11 | The ten largest holdings, excluding cash and cash equivalents, are calculated based on the value of the investments divided by the total net assets of the Portfolio. Holdings are subject to change and may have changed since the date specified. |
| 12 | Current target allocation includes the effect of any tactical futures overlay that may be in place. Effective cash is comprised of the net impact of long and/or short futures contracts held as part of dynamic risk management strategy. The amounts are subject to change and may have changed since the date specified. |
| | | | |
| 10 | | Wells Fargo WealthBuilder Portfolios | | Performance highlights (unaudited) |
Wells Fargo WealthBuilder Moderate Balanced Portfolio (continued)
MANAGER’S DISCUSSION
Fund highlights
| n | | The Portfolio underperformed its benchmark, the WealthBuilder Moderate Balanced Composite Index, for the 12-month period that ended May 31, 2016. |
| n | | The Portfolio’s bond investments added value on an absolute basis but underperformed relative to the benchmark, primarily due to an allocation to U.S. high yield bonds. |
| n | | The Portfolio’s equity investments overall underperformed their benchmarks, due primarily to its overweight to U.S. small cap funds. |
| n | | The Portfolio’s allocation to commodities was a significant detractor from performance. |
| n | | Tactical asset allocation added to performance through the period. During market corrections in August 2015 and January 2016, the portfolio management team tactically shifted the Portfolio’s allocation during periods of depressed equity prices, which added value. |
Equity markets experienced two corrections during the previous 12 months.
Global equity markets experienced two corrections during the previous 12 months. Amid fears of contagion from international markets, U.S. equities sold off heavily during August 2015 and January 2016. In August, the contraction was fueled by fears of collapsing growth in China. In January, in addition to renewed fears of lower output in China and softer domestic economic data, oil prices dropped below $30 a barrel.
The second correction, which followed the first hike in the federal funds interest rate in a decade, raised concerns that the U.S. Federal Reserve acted too hastily. U.S. investors feared a contracting global economy coupled with the currency and business effects of a rate hike would drive down international demand for U.S. goods. Despite the potential headwinds, the S&P 500 Index8 ended the period up 1.72%.
The European Central Bank (ECB) and the Bank of Japan (BOJ) both increased monetary stimulus programs that were intended to bolster their local economies. Brazil’s business and political woes continued and China reduced its economic growth forecasts, which tended to restrain investor enthusiasm for international investments.
U.S. bonds, as measured by the Barclays U.S. Aggregate Bond Index,4 rose 2.99%, outperforming large-cap stocks. Small-cap stocks, as measured by the Russell 2000® Index,9 returned -5.97%. International stocks returned -11.39%, as measured by the Morgan Stanley Capital International (MSCI) All Country World Index (ACWI) ex USA Index (Net).5 Within international stocks, emerging markets stocks fell the most at -17.63%, as measured by the MSCI Emerging Markets (EM) Index (Net).10
| | | | |
| Ten largest holdings (%) as of May 31, 201611 | |
Wells Fargo Core Bond Portfolio | | | 17.18 | |
Wells Fargo Short Duration Government Bond Fund Class R6 | | | 10.53 | |
Wells Fargo Government Securities Fund Institutional Class | | | 10.39 | |
PIMCO High Yield Fund Institutional Class | | | 8.41 | |
MFS Value Fund Class I | | | 6.09 | |
Oppenheimer International Bond Fund Class Y | | | 4.40 | |
Thornburg International Value Fund Institutional Class | | | 3.62 | |
T. Rowe Price Blue Chip Growth Fund Retail Class | | | 3.55 | |
Oakmark Fund Class I | | | 3.06 | |
Invesco Growth and Income Fund Class R6 | | | 3.04 | |
The Portfolio’s allocation to stocks and bonds is determined by a combination of inputs from multiple quantitative as well as qualitative factors.
During the period, the portfolio management team took tactical advantage of equity price movements. Through our overlays, we tactically increased equity exposures through the first correction in August 2015, increasing equity holdings as Chinese and U.S. markets sold off. As the market correction reversed in the following months, the overlay added value to the Portfolio’s performance. Again in January and February 2016, we saw a similar correction and used our overlays to overweight equities. Through effective execution of our hedging strategy, the team again added to the Portfolio’s returns.
Please see footnotes on page 9.
| | | | | | |
| Performance highlights (unaudited) | | Wells Fargo WealthBuilder Portfolios | | | 11 | |
Wells Fargo WealthBuilder Moderate Balanced Portfolio (continued)
During the past 12 months, the team altered the Portfolio’s exposure to international stocks, trimming exposure to emerging markets to increase investments in Japan. Currency exposures to the euro and the yen were tactically hedged.
We also expanded bond investments to include municipal bonds. This helped diversify the sources of fixed-income returns during the period.
|
| Current target allocation as of May 31, 201612 |
|
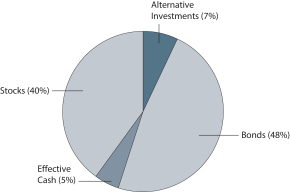 |
We remain cautiously optimistic about the longer-term outlook for stocks.
Bond yields continued to be depressed. The potential for future interest-rate hikes may be a headwind to increases in overall output in the general U.S. economy. With yields at historical lows, there continues to be a duration risk in bonds.
Internationally, the accommodative policies of the ECB and BOJ are intended to bolster their local economies. We believe these central banks will continue to support growth in their economies, which should be supportive of asset prices. In addition to developed international economies, emerging markets stocks are at low valuation levels not seen in years. Finally, domestic stocks and the U.S. economy have shown resilience in the past year. We look to market signals and economic releases to help inform the changing state of U.S. markets.
|
| Neutral target allocation |
|
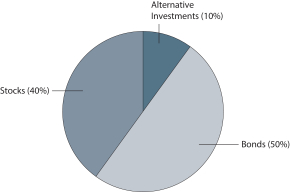
|
Please see footnotes on page 9.
| | | | |
| 12 | | Wells Fargo WealthBuilder Portfolios | | Performance highlights (unaudited) |
Wells Fargo WealthBuilder Growth Balanced Portfolio
Investment objective
The Portfolio seeks a combination of capital appreciation and current income.
Manager
Wells Fargo Funds Management, LLC
Subadviser
Wells Capital Management Incorporated
Portfolio managers
Kandarp R. Acharya, CFA®, FRM Christian L. Chan, CFA®
Average annual total returns (%) as of May 31, 2016
| | | | | | | | | | | | | | | | | | | | | | | | | | | | | | | | | | |
| | | | | Including sales charge | | | Excluding sales charge | | | Expense ratios1 (%) | |
| | | Inception date | | 1 year | | | 5 year | | | 10 year | | | 1 year | | | 5 year | | | 10 year | | | Gross | | | Net2 | |
| Wells Fargo WealthBuilder Growth Balanced Portfolio (WBGBX) | | 10-1-1997 | | | (4.84 | ) | | | 4.35 | | | | 3.59 | | | | (3.39 | ) | | | 4.66 | | | | 3.75 | | | | 2.17 | | | | 2.17 | |
| WealthBuilder Growth Balanced Composite Index3 | | – | | | – | | | | – | | | | – | | | | (0.62 | ) | | | 6.22 | | | | 5.84 | | | | – | | | | – | |
| Barclays U.S. Aggregate Bond Index4 | | – | | | – | | | | – | | | | – | | | | 2.99 | | | | 3.33 | | | | 4.97 | | | | – | | | | – | |
| MSCI ACWI ex USA Index (Net)5 | | – | | | – | | | | – | | | | – | | | | (11.39 | ) | | | 0.12 | | | | 2.01 | | | | – | | | | – | |
| Russell 3000® Index6 | | – | | | – | | | | – | | | | – | | | | 0.22 | | | | 11.15 | | | | 7.39 | | | | – | | | | – | |
Figures quoted represent past performance, which is no guarantee of future results, and do not reflect taxes that a shareholder may pay on fund distributions or the redemption of fund shares. Investment return and principal value of an investment will fluctuate so that an investor’s shares, when redeemed, may be worth more or less than their original cost. Performance shown without sales charges would be lower if sales charges were reflected. Current performance may be lower or higher than the performance data quoted, which assumes the reinvestment of dividends and capital gains. Current month-end performance is available on the Portfolio’s website, wellsfargofunds.com.
Index returns do not include transaction costs associated with buying and selling securities, any mutual fund fees or expenses, or any taxes. It is not possible to invest directly in an index.
For WealthBuilder Portfolios, the maximum front-end sales charge is 1.50%.
Balanced funds may invest in stocks and bonds. Stock values fluctuate in response to the activities of individual companies and general market and economic conditions. Bond values fluctuate in response to the financial condition of individual issuers, general market and economic conditions, and changes in interest rates. Changes in market conditions and government policies may lead to periods of heightened volatility in the bond market and reduced liquidity for certain bonds held by the Portfolio. In general, when interest rates rise, bond values fall and investors may lose principal value. Interest-rate changes and their impact on the Portfolio and its share price can be sudden and unpredictable. The use of derivatives may reduce returns and/or increase volatility. The Portfolio will indirectly be exposed to all of the risks of an investment in the underlying funds and will indirectly bear expenses of the underlying funds. Certain investment strategies tend to increase the total risk of an investment (relative to the broader market). The Portfolio is exposed to alternative investment risk, foreign investment risk, high-yield securities risk, mortgage- and asset-backed securities risk, and smaller-company investment risk. Consult the Portfolio’s prospectus for additional information on these and other risks.
Please see footnotes on page 13.
| | | | | | |
| Performance highlights (unaudited) | | Wells Fargo WealthBuilder Portfolios | | | 13 | |
Wells Fargo WealthBuilder Growth Balanced Portfolio (continued)
|
Growth of $10,000 investment as of May 31, 201610 |
|
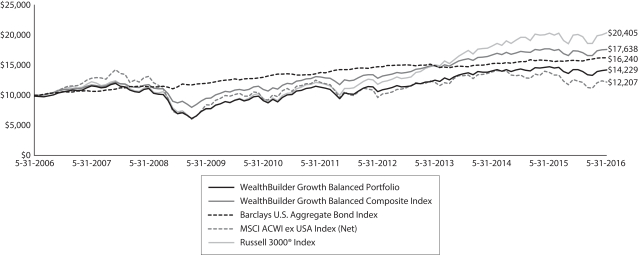 |
| 1 | Reflects the expense ratios as stated in the most recent prospectus, which include the impact of 0.68% of acquired fund fees and expenses and net expenses from affiliated master portfolios. The expense ratios shown are subject to change and may differ from the annualized expense ratios shown in the financial highlights of this report, which do not include acquired fund fees and expenses and net expenses from affiliated master portfolios. |
| 2 | The manager has contractually committed through September 30, 2016, to waive fees and/or reimburse expenses to the extent necessary to cap the Portfolio’s Total Annual Fund Operating Expenses After Fee Waiver at 1.50%. After this time, the cap may be increased or the commitment to maintain the cap may be terminated only with the approval of the Board of Trustees. Brokerage commissions, stamp duty fees, interest, taxes, acquired fund fees and expenses, net expenses from affiliated master portfolios, and extraordinary expenses are excluded from the expense cap. Without this cap, the Portfolio’s returns would have been lower. |
| 3 | Source: Wells Fargo Funds Management, LLC. The WealthBuilder Growth Balanced Composite Index is comprised of the following indexes: Barclays U.S. Aggregate Bond Index (40%), MSCI ACWI ex USA Index (Net) (18%) and Russell 3000® Index (42%). You cannot invest directly in an index. |
| 4 | The Barclays U.S. Aggregate Bond Index is a broad-based benchmark that measures the investment-grade, U.S. dollar–denominated, fixed-rate taxable bond market, including Treasuries, government-related and corporate securities, mortgage-backed securities (agency fixed-rate and hybrid adjustable-rate mortgage pass-throughs), asset-backed securities, and commercial mortgage-backed securities. You cannot invest directly in an index. |
| 5 | The Morgan Stanley Capital International (MSCI) All Country World Index (ACWI) ex USA Index (Net) is a free-float-adjusted market-capitalization-weighted index that is designed to measure the equity market performance of developed markets, excluding the U.S. and Canada. Source: MSCI. MSCI makes no express or implied warranties or representations and shall have no liability whatsoever with respect to any MSCI data contained herein. The MSCI data may not be further redistributed or used as a basis for other indexes or any securities or financial products. This report is not approved, reviewed, or produced by MSCI. You cannot invest directly in an index. |
| 6 | The Russell 3000® Index measures the performance of the 3,000 largest U.S. companies based on total market capitalization, which represents approximately 98% of the investable U.S. equity market. You cannot invest directly in an index. |
| 7 | The S&P 500 Index consists of approximately 500 stocks chosen for market size, liquidity, and industry group representation. It is a market-value-weighted index with each stock’s weight in the index proportionate to its market value. You cannot invest directly in an index. |
| 8 | The Russell 2000® Index measures the performance of the 2,000 smallest companies in the Russell 3000® Index, which represents approximately 8% of the total market capitalization of the Russell 3000® Index. You cannot invest directly in an index. |
| 9 | The MSCI Emerging Markets (EM) Index (Net) is a free-float-adjusted market-capitalization-weighted index that is designed to measure the equity market performance of emerging markets. The MSCI EM Index (Net) consists of the following 23 emerging markets country indexes: Brazil, Chile, China, Colombia, Czech Republic, Egypt, Greece, Hungary, India, Indonesia, Korea, Malaysia, Mexico, Peru, the Philippines, Poland, Qatar, Russia, South Africa, Taiwan, Thailand, Turkey, and United Arab Emirates. You cannot invest directly in an index. |
| 10 | The chart compares the performance of the Portfolio for the most recent ten years with the WealthBuilder Growth Balanced Composite Index, the Barclays U.S. Aggregate Bond Index, the MSCI ACWI ex USA Index (Net), and the Russell 3000® Index. The chart assumes a hypothetical $10,000 investment and reflects all operating expenses and assumes the maximum initial sales charge of 1.50%. |
| 11 | The ten largest holdings, excluding cash and cash equivalents, are calculated based on the value of the investments divided by the total net assets of the Portfolio. Holdings are subject to change and may have changed since the date specified. |
| 12 | Current target allocation includes the effect of any tactical futures overlay that may be in place. Effective cash is comprised of the net impact of long and/or short futures contracts held as part of dynamic risk management strategy. The amounts are subject to change and may have changed since the date specified. |
| | | | |
| 14 | | Wells Fargo WealthBuilder Portfolios | | Performance highlights (unaudited) |
Wells Fargo WealthBuilder Growth Balanced Portfolio (continued)
MANAGER’S DISCUSSION
Fund highlights
| n | | The Portfolio underperformed its benchmark, the WealthBuilder Growth Balanced Composite Index, for the 12-month period that ended May 31, 2016. |
| n | | The Portfolio’s equity investments overall underperformed their benchmarks, due primarily to its overweight to U.S. small cap funds. |
| n | | The Portfolio’s bond investments added value on an absolute basis but underperformed relative to the benchmark, primarily due to an allocation to U.S. high yield bonds. |
| n | | The Portfolio’s allocation to commodities was a significant detractor from performance. |
| n | | Tactical asset allocation added performance through the period. During market corrections in August 2015 and January 2016, the portfolio management team tactically shifted the Portfolio’s allocation during periods of depressed equity prices, which added value. |
Equity markets experienced two corrections during the previous 12 months.
Global equity markets experienced two corrections during the previous 12 months. Amid fears of contagion from international markets, U.S. equities sold off heavily during August 2015 and January 2016. In August, the contraction was fueled by fears of collapsing growth in China. In January, in addition to renewed fears of lower output in China and softer domestic economic data, oil prices dropped below $30 a barrel.
The second correction, which followed the first hike in the federal funds interest rate in a decade, raised concerns that the U.S. Federal Reserve acted too hastily. U.S. investors feared a contracting global economy coupled with the currency and business effects of a rate hike would drive drown international demand for U.S. goods. Despite the headwinds, the S&P 500 Index7 ended the period up 1.72%.
The European Central Bank (ECB) and the Bank of Japan (BOJ) increased monetary stimulus programs that were intended to bolster their local economies. Brazil’s business and political woes continued and China reduced its economic growth forecasts, which tended to restrain investor enthusiasm for international investors.
U.S. bonds, as measured by the Barclays U.S. Aggregate Bond Index,4 rose 2.99%, outperforming large-cap stocks. Small-cap stocks, as measured by the Russell 2000® Index,8 returned -5.97%. International stocks returned -11.39%, as measured by the Morgan Stanley Capital International (MSCI) All Country World Index (ACWI) ex USA Index (Net).5 Within international stocks, emerging markets stocks fell the most at -17.63%, as measured by the MSCI Emerging Markets (EM) Index (Net).9
| | | | |
| Ten largest holdings (%) as of May 31, 201611 | |
Wells Fargo Core Bond Portfolio | | | 11.27 | |
MFS Value Fund Class I | | | 9.12 | |
Wells Fargo Government Securities Fund Institutional Class | | | 8.90 | |
PIMCO High Yield Fund Institutional Class | | | 6.41 | |
Thornburg International Value Fund Institutional Class | | | 5.41 | |
T. Rowe Price Blue Chip Growth Fund Retail Class | | | 5.31 | |
Oppenheimer International Bond Fund Class Y | | | 4.71 | |
Oakmark Fund Class I | | | 4.59 | |
Invesco Growth and Income Fund Class R6 | | | 4.58 | |
American Century Growth Fund Institutional Class | | | 3.79 | |
The Portfolio’s allocation to stocks and bonds is determined by a combination of inputs from multiple quantitative as well as qualitative factors.
During the period, the portfolio management team took tactical advantage of equity price movements. Through our overlays, we tactically increased equity exposures through the first correction in August 2015, increasing equity holdings as Chinese and U.S. markets sold off. As the market correction reversed in the following months, the overlay added value to the Portfolio’s performance. Again in January and February 2016, we saw a similar correction and used our overlays to overweight equities. Through effective hedging of our hedging strategy, the team again added to the Portfolio’s returns.
Please see footnotes on page 13.
| | | | | | |
| Performance highlights (unaudited) | | Wells Fargo WealthBuilder Portfolios | | | 15 | |
Wells Fargo WealthBuilder Growth Balanced Portfolio (continued)
During the past 12 months, the team altered the Portfolio’s exposure to international stocks, trimming exposure to emerging markets to increase investments in Japan. Currency exposures to the euro and the yen were tactically hedged.
We also expanded bond investments to include municipal bonds. This helped diversify the sources of fixed-income returns during the period.
|
| Current target allocation as of May 31, 201612 |
|
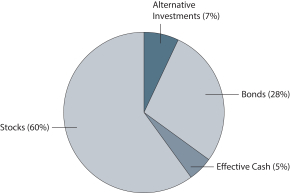 |
We remain cautiously optimistic about the longer- term outlook for stocks.
Bond yields continue to be depressed. The potential for future interest-rate hikes may be a headwind to increases in overall output in the general economy. With yields at historical lows, there continues to be a duration risk in bonds.
Internationally, the accommodative policies of the ECB and BOJ are intended to bolster their local economies. We believe these central banks will continue to support growth in their economies, which should be supportive of asset prices. In addition to developed international economies, emerging markets stocks are at low valuation
levels not seen in years. Finally, domestic stocks and the U.S. economy have shown resilience in the past year. We look to market signals and economic releases to help inform the changing state of U.S. markets.
|
| Neutral target allocation |
|
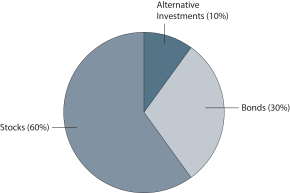
|
Please see footnotes on page 13.
| | | | |
| 16 | | Wells Fargo WealthBuilder Portfolios | | Performance highlights (unaudited) |
Wells Fargo WealthBuilder Growth Allocation Portfolio
Investment objective
The Portfolio seeks capital appreciation with a secondary emphasis on current income.
Manager
Wells Fargo Funds Management, LLC
Subadviser
Wells Capital Management Incorporated
Portfolio managers
Kandarp R. Acharya, CFA®, FRM
Christian L. Chan, CFA®
Average annual total returns (%) as of May 31, 2016
| | | | | | | | | | | | | | | | | | | | | | | | | | | | | | | | | | |
| | | | | Including sales charge | | | Excluding sales charge | | | Expense ratios1 (%) | |
| | | Inception date | | 1 year | | | 5 year | | | 10 year | | | 1 year | | | 5 year | | | 10 year | | | Gross | | | Net2 | |
| Wells Fargo WealthBuilder Growth Allocation Portfolio (WBGGX) | | 9-30-2004 | | | (6.22 | ) | | | 4.85 | | | | 3.46 | | | | (4.79 | ) | | | 5.17 | | | | 3.62 | | | | 2.24 | | | | 2.24 | |
| WealthBuilder Growth Allocation Composite Index3 | | – | | | – | | | | – | | | | – | | | | (1.96 | ) | | | 7.04 | | | | 5.90 | | | | – | | | | – | |
| Barclays U.S. Aggregate Bond Index4 | | – | | | – | | | | – | | | | – | | | | 2.99 | | | | 3.33 | | | | 4.97 | | | | – | | | | – | |
| MSCI ACWI ex USA Index (Net)5 | | – | | | – | | | | – | | | | – | | | | (11.39 | ) | | | 0.12 | | | | 2.01 | | | | – | | | | – | |
| Russell 3000® Index6 | | – | | | – | | | | – | | | | – | | | | 0.22 | | | | 11.15 | | | | 7.39 | | | | – | | | | – | |
Figures quoted represent past performance, which is no guarantee of future results, and do not reflect taxes that a shareholder may pay on fund distributions or the redemption of fund shares. Investment return and principal value of an investment will fluctuate so that an investor’s shares, when redeemed, may be worth more or less than their original cost. Performance shown without sales charges would be lower if sales charges were reflected. Current performance may be lower or higher than the performance data quoted, which assumes the reinvestment of dividends and capital gains. Current month-end performance is available on the Portfolio’s website, wellsfargofunds.com.
Index returns do not include transaction costs associated with buying and selling securities, any mutual fund fees or expenses, or any taxes. It is not possible to invest directly in an index.
For WealthBuilder Portfolios, the maximum front-end sales charge is 1.50%.
Balanced funds may invest in stocks and bonds. Stock values fluctuate in response to the activities of individual companies and general market and economic conditions. Bond values fluctuate in response to the financial condition of individual issuers, general market and economic conditions, and changes in interest rates. Changes in market conditions and government policies may lead to periods of heightened volatility in the bond market and reduced liquidity for certain bonds held by the Portfolio. In general, when interest rates rise, bond values fall and investors may lose principal value. Interest-rate changes and their impact on the Portfolio and its share price can be sudden and unpredictable. The use of derivatives may reduce returns and/or increase volatility. The Portfolio will indirectly be exposed to all of the risks of an investment in the underlying funds and will indirectly bear expenses of the underlying funds. Certain investment strategies tend to increase the total risk of an investment (relative to the broader market). The Portfolio is exposed to alternative investment risk, foreign investment risk, high-yield securities risk, mortgage- and asset-backed securities risk, and smaller-company investment risk. Consult the Portfolio’s prospectus for additional information on these and other risks.
Please see footnotes on page 17.
| | | | | | |
| Performance highlights (unaudited) | | Wells Fargo WealthBuilder Portfolios | | | 17 | |
Wells Fargo WealthBuilder Growth Allocation Portfolio (continued)
|
| Growth of $10,000 investment as of May 31, 201610 |
|
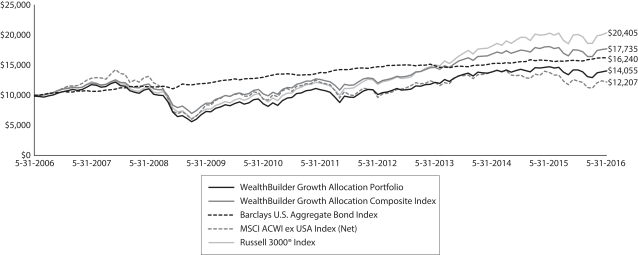 |
| 1 | Reflects the expense ratios as stated in the most recent prospectus, which include the impact of 0.74% of acquired fund fees and expenses and net expenses from affiliated master portfolios. The expense ratios shown are subject to change and may differ from the annualized expense ratios shown in the financial highlights of this report, which do not include acquired fund fees and expenses and net expenses from affiliated master portfolios. |
| 2 | The manager has contractually committed through September 30, 2016, to waive fees and/or reimburse expenses to the extent necessary to cap the Portfolio’s Total Annual Fund Operating Expenses After Fee Waiver at 1.50%. After this time, the cap may be increased or the commitment to maintain the cap may be terminated only with the approval of the Board of Trustees. Brokerage commissions, stamp duty fees, interest, taxes, acquired fund fees and expenses, net expenses from affiliated master portfolios, and extraordinary expenses are excluded from the expense cap. Without this cap, the Portfolio’s returns would have been lower. |
| 3 | Source: Wells Fargo Funds Management, LLC. The WealthBuilder Growth Allocation Composite Index is comprised of the following indexes: Barclays U.S. Aggregate Bond Index (20%), MSCI ACWI ex USA Index (Net) (24%) and Russell 3000® Index (56%). You cannot invest directly in an index. |
| 4 | The Barclays U.S. Aggregate Bond Index is a broad-based benchmark that measures the investment-grade, U.S. dollar–denominated, fixed-rate taxable bond market, including Treasuries, government-related and corporate securities, mortgage-backed securities (agency fixed-rate and hybrid adjustable-rate mortgage pass-throughs), asset-backed securities, and commercial mortgage. You cannot invest directly in an index. |
| 5 | The Morgan Stanley Capital International (MSCI) All Country World Index (ACWI) ex USA Index (Net) is a free-float-adjusted market-capitalization-weighted index that is designed to measure the equity market performance of developed markets, excluding the U.S. and Canada. Source: MSCI. MSCI makes no express or implied warranties or representations and shall have no liability whatsoever with respect to any MSCI data contained herein. The MSCI data may not be further redistributed or used as a basis for other indexes or any securities or financial products. This report is not approved, reviewed, or produced by MSCI. You cannot invest directly in an index. |
| 6 | The Russell 3000® Index measures the performance of the 3,000 largest U.S. companies based on total market capitalization, which represents approximately 98% of the investable U.S. equity market. You cannot invest directly in an index. |
| 7 | The S&P 500 Index consists of approximately 500 stocks chosen for market size, liquidity, and industry group representation. It is a market-value-weighted index with each stock’s weight in the index proportionate to its market value. You cannot invest directly in an index. |
| 8 | The Russell 2000® Index measures the performance of the 2,000 smallest companies in the Russell 3000® Index, which represents approximately 8% of the total market capitalization of the Russell 3000® Index. You cannot invest directly in an index. |
| 9 | The MSCI Emerging Markets (EM) Index (Net) is a free-float-adjusted market-capitalization-weighted index that is designed to measure the equity market performance of emerging markets. The MSCI EM Index (Net) consists of the following 23 emerging markets country indexes: Brazil, Chile, China, Colombia, Czech Republic, Egypt, Greece, Hungary, India, Indonesia, Korea, Malaysia, Mexico, Peru, the Philippines, Poland, Qatar, Russia, South Africa, Taiwan, Thailand, Turkey, and United Arab Emirates. You cannot invest directly in an index. |
| 10 | The chart compares the performance of the Portfolio for the most recent ten years with the WealthBuilder Growth Allocation Composite Index, the Barclays U.S. Aggregate Bond Index, the MSCI ACWI ex USA Index (Net), and the Russell 3000® Index. The chart assumes a hypothetical $10,000 investment and reflects all operating expenses and assumes the maximum initial sales charge of 1.50%. |
| 11 | The ten largest holdings, excluding cash and cash equivalents, are calculated based on the value of the investments divided by the total net assets of the Portfolio. Holdings are subject to change and may have changed since the date specified. |
| 12 | Current target allocation includes the effect of any tactical futures overlay that may be in place. Effective cash is comprised of the net impact of long and/or short futures contracts held as part of dynamic risk management strategy. The amounts are subject to change and may have changed since the date specified. |
| | | | |
| 18 | | Wells Fargo WealthBuilder Portfolios | | Performance highlights (unaudited) |
Wells Fargo WealthBuilder Growth Allocation Portfolio (continued)
MANAGER’S DISCUSSION
Fund highlights
| n | | The Portfolio underperformed its benchmark, the WealthBuilder Growth Allocation Composite Index, for the 12-month period that ended May 31, 2016. |
| n | | The Portfolio’s equity investments overall underperformed their benchmarks, due primarily to its overweight to U.S. small cap funds. |
| n | | The Portfolio’s bond investments added value on an absolute basis but underperformed relative to the benchmark primarily due to an allocation to U.S. high yield bonds. |
| n | | The Portfolio’s allocation to commodities was a significant detractor from performance. |
| n | | Tactical asset allocation added to performance through the period. During market corrections in August 2015 and January 2016, the portfolio management team tactically shifted the Portfolio’s allocation during periods of depressed equity prices, which added value. |
Equity markets experienced two corrections during the previous 12 months.
Global equity markets experienced two corrections during the previous 12 months. Amid fears of contagion from international markets, U.S. equities sold off heavily during August 2015 and January 2016. In August, the contraction was fueled by fears of collapsing growth in China. In January, in addition to renewed fears of lower output in China and softer domestic economic data, oil prices dropped below $30 a barrel.
The second correction, which followed the first hike in the federal funds interest rate in a decade, raised concerns that the U.S. Federal Reserve acted too hastily. U.S. investors feared a contracting global economy coupled with the currency and business effects of a rate hike would drive down international demand for U.S. goods. Despite the potential headwinds, the S&P 500 Index7 ended the period up 1.72%.
The European Central Bank (ECB) and the Bank of Japan (BOJ) both increased monetary stimulus programs that were intended to bolster their local economies. Brazil’s business and political woes continued and China reduced its economic growth forecasts, which tended to restrain investor enthusiasm for international investments.
U.S. bonds, as measured by the Barclays U.S. Aggregate Bond Index,4 rose 2.99%, outperforming large-cap stocks. Small-cap stocks, as measured by the Russell 2000® Index,8 returned -5.97%. International stocks returned -11.39%, as measured by the Morgan Stanley Capital International (MSCI) All Country World Index (ACWI) ex USA Index (Net).5 Within international stocks, emerging markets stocks fell the most at -17.63%, as measured by the MSCI Emerging Markets (EM) Index (Net).9
| | | | |
| Ten largest holdings (%) as of May 31, 201611 | |
MFS Value Fund Class I | | | 12.07 | |
Thornburg International Value Fund Institutional Class | | | 7.17 | |
T. Rowe Price Blue Chip Growth Fund Retail Class | | | 7.03 | |
Oakmark Fund Class I | | | 6.07 | |
Invesco Growth and Income Fund Class R6 | | | 6.05 | |
American Century Growth Fund Institutional Class | | | 5.01 | |
Wells Fargo International Growth Portfolio | | | 4.75 | |
Wells Fargo Core Bond Portfolio | | | 4.62 | |
Wells Fargo Endeavor Select Fund Institutional Class | | | 4.03 | |
Wells Fargo Large Cap Growth Fund Class R6 | | | 4.01 | |
The Portfolio’s allocation to stocks and bonds is determined by a combination of inputs from multiple quantitative as well as qualitative factors.
During the period, the portfolio management team took tactical advantage of equity price movements. Through our overlays, we tactically increased equity exposures through the first correction in August 2015, increasing equity holdings as Chinese and U.S. markets sold off. As the market correction reversed in the following months, the overlay added value to the Portfolio’s performance. Again in January and February 2016, we saw a similar correction and used our overlays to overweight equities. Through effective execution of our hedging strategy, the team again added to the Portfolio’s returns.
Please see footnotes on page 17.
| | | | | | |
| Performance highlights (unaudited) | | Wells Fargo WealthBuilder Portfolios | | | 19 | |
Wells Fargo WealthBuilder Growth Allocation Portfolio (continued)
During the past 12 months, the team altered the Portfolio’s exposure to international stocks, trimming exposure to emerging markets to increase investments in Japan. Currency exposures to the euro and the yen were tactically hedged.
We also expanded bond investments to include municipal bonds. This helped diversify the sources of fixed-income returns during the period.
|
| Current target allocation as of May 31, 201612 |
|
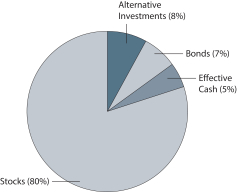 |
We remain cautiously optimistic about the longer-term outlook for stocks.
Bond yields continued to be depressed. The potential for future interest-rate hikes may be a headwind to increases in overall output in the general U.S. economy. With yields at historical lows, there continues to be a duration risk in bonds.
Internationally, the accommodative policies of the ECB and BOJ are intended to bolster their local economies. We believe these central banks will continue to support growth in their economies, which should be supportive of asset prices. In addition to developed international economies, emerging markets stocks are at low valuation levels not seen in years. Finally, domestic stocks and the U.S. economy have shown resilience in the past year. We look to market signals and economic releases to help inform the changing state of U.S. markets.
|
| Neutral target allocation |
|
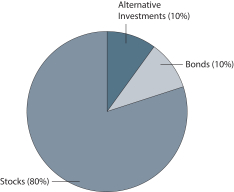
|
Please see footnotes on page 17.
| | | | |
| 20 | | Wells Fargo WealthBuilder Portfolios | | Performance highlights (unaudited) |
Wells Fargo WealthBuilder Equity Portfolio
Investment objective
The Portfolio seeks long-term capital appreciation with no emphasis on income.
Manager
Wells Fargo Funds Management, LLC
Subadviser
Wells Capital Management Incorporated
Portfolio managers
Kandarp R. Acharya, CFA®, FRM
Christian L. Chan, CFA®
Average annual total returns (%) as of May 31, 2016
| | | | | | | | | | | | | | | | | | | | | | | | | | | | | | | | | | |
| | | | | Including sales charge | | | Excluding sales charge | | | Expense ratios1 (%) | |
| | | Inception date | | 1 year | | | 5 year | | | 10 year | | | 1 year | | | 5 year | | | 10 year | | | Gross | | | Net2 | |
| Wells Fargo WealthBuilder Equity Portfolio (WBGIX) | | 10-1-1997 | | | (6.85 | ) | | | 5.44 | | | | 3.35 | | | | (5.43 | ) | | | 5.76 | | | | 3.50 | | | | 2.35 | | | | 2.29 | |
| WealthBuilder Equity Composite Index3 | | – | | | – | | | | – | | | | – | | | | (3.37 | ) | | | 7.79 | | | | 5.84 | | | | – | | | | – | |
| MSCI ACWI ex USA Index (Net)4 | | – | | | – | | | | – | | | | – | | | | (11.39 | ) | | | 0.12 | | | | 2.01 | | | | – | | | | – | |
| Russell 3000® Index5 | | – | | | – | | | | – | | | | – | | | | 0.22 | | | | 11.15 | | | | 7.39 | | | | – | | | | – | |
Figures quoted represent past performance, which is no guarantee of future results, and do not reflect taxes that a shareholder may pay on fund distributions or the redemption of fund shares. Investment return and principal value of an investment will fluctuate so that an investor’s shares, when redeemed, may be worth more or less than their original cost. Performance shown without sales charges would be lower if sales charges were reflected. Current performance may be lower or higher than the performance data quoted, which assumes the reinvestment of dividends and capital gains. Current month-end performance is available on the Portfolio’s website, wellsfargofunds.com.
Index returns do not include transaction costs associated with buying and selling securities, any mutual fund fees or expenses, or any taxes. It is not possible to invest directly in an index.
For WealthBuilder Portfolios, the maximum front-end sales charge is 1.50%.
Stock values fluctuate in response to the activities of individual companies and general market and economic conditions. The Portfolio will indirectly be exposed to all of the risks of an investment in the underlying funds and will indirectly bear expenses of the underlying funds. The use of derivatives may reduce returns and/or increase volatility. Certain investment strategies tend to increase the total risk of an investment (relative to the broader market). The Portfolio is exposed to alternative investment risk, foreign investment risk and smaller-company investment risk. Consult the Portfolio’s prospectus for additional information on these and other risks.
Please see footnotes on page 21.
| | | | | | |
| Performance highlights (unaudited) | | Wells Fargo WealthBuilder Portfolios | | | 21 | |
Wells Fargo WealthBuilder Equity Portfolio (continued)
|
| Growth of $10,000 investment as of May 31, 201610 |
|
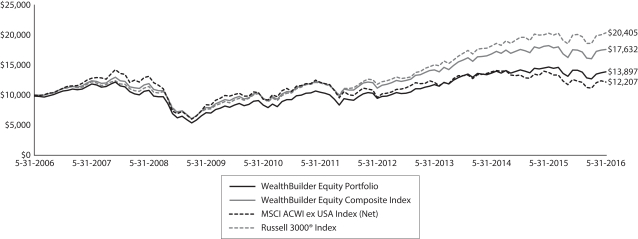 |
| 1 | Reflects the expense ratios as stated in the most recent prospectus, which include the impact of 0.79% of acquired fund fees and expenses and net expenses from affiliated master portfolios. The expense ratios shown are subject to change and may differ from the annualized expense ratios shown in the financial highlights of this report, which do not include acquired fund fees and expenses and net expenses from affiliated master portfolios. |
| 2 | The manager has contractually committed through September 30, 2016, to waive fees and/or reimburse expenses to the extent necessary to cap the Portfolio’s Total Annual Fund Operating Expenses After Fee Waiver at 1.50%. After this time, the cap may be increased or the commitment to maintain the cap may be terminated only with the approval of the Board of Trustees. Brokerage commissions, stamp duty fees, interest, taxes, acquired fund fees and expenses, net expenses from affiliated master portfolios, and extraordinary expenses are excluded from the expense cap. Without this cap, the Portfolio’s returns would have been lower. |
| 3 | Source: Wells Fargo Funds Management, LLC. The WealthBuilder Equity Composite Index is weighted 30% in the MSCI ACWI ex USA Index (Net) and 70% in the Russell 3000® Index. You cannot invest directly in an index. |
| 4 | The Morgan Stanley Capital International (MSCI) All Country World Index (ACWI) ex USA Index (Net) is a free-float-adjusted market-capitalization-weighted index that is designed to measure the equity market performance of developed markets, excluding the U.S. and Canada. Source: MSCI. MSCI makes no express or implied warranties or representations and shall have no liability whatsoever with respect to any MSCI data contained herein. The MSCI data may not be further redistributed or used as a basis for other indexes or any securities or financial products. This report is not approved, reviewed, or produced by MSCI. You cannot invest directly in an index. |
| 5 | The Russell 3000® Index measures the performance of the 3,000 largest U.S. companies based on total market capitalization, which represents approximately 98% of the investable U.S. equity market. You cannot invest directly in an index. |
| 6 | The S&P 500 Index consists of approximately 500 stocks chosen for market size, liquidity, and industry group representation. It is a market-value-weighted index with each stock’s weight in the index proportionate to its market value. You cannot invest directly in an index. |
| 7 | The Barclays U.S. Aggregate Bond Index is a broad-based benchmark that measures the investment-grade, U.S. dollar–denominated, fixed-rate taxable bond market, including Treasuries, government-related and corporate securities, mortgage-backed securities (agency fixed-rate and hybrid adjustable-rate mortgage pass-throughs), asset-backed securities, and commercial mortgage-backed securities. You cannot invest directly in an index. |
| 8 | The Russell 2000® Index measures the performance of the 2,000 smallest companies in the Russell 3000® Index, which represents approximately 8% of the total market capitalization of the Russell 3000® Index. You cannot invest directly in an index. |
| 9 | The MSCI Emerging Markets (EM) Index (Net) is a free-float-adjusted market-capitalization-weighted index that is designed to measure the equity market performance of emerging markets. The MSCI EM Index (Net) consists of the following 23 emerging markets country indexes: Brazil, Chile, China, Colombia, Czech Republic, Egypt, Greece, Hungary, India, Indonesia, Korea, Malaysia, Mexico, Peru, the Philippines, Poland, Qatar, Russia, South Africa, Taiwan, Thailand, Turkey, and United Arab Emirates. You cannot invest directly in an index. |
| 10 | The chart compares the performance of the Portfolio for the most recent ten years with the WealthBuilder Equity Composite Index, the MSCI ACWI ex USA Index (Net), and the Russell 3000® Index. The chart assumes a hypothetical $10,000 investment and reflects all operating expenses and assumes the maximum initial sales charge of 1.50%. |
| 11 | The ten largest holdings, excluding cash and cash equivalents, are calculated based on the value of the investments divided by the total net assets of the Portfolio. Holdings are subject to change and may have changed since the date specified. |
| 12 | Amounts are calculated based on the long-term investments of the Portfolio. These amounts are subject to change and may have changed since the date specified. |
| | | | |
| 22 | | Wells Fargo WealthBuilder Portfolios | | Performance highlights (unaudited) |
Wells Fargo WealthBuilder Equity Portfolio (continued)
MANAGER’S DISCUSSION
Fund highlights
| n | | The Portfolio underperformed its benchmark, the WealthBuilder Equity Composite Index, during the preceding 12-month period that ended on May 31, 2016. |
| n | | Underlying U.S. funds posted narrow losses and underperformed their U.S. equity benchmark; the large cap growth funds were the biggest detractor. |
| n | | Underlying international funds suffered significant losses yet outperformed their international benchmark as a group. |
Equity markets experienced two corrections during the previous 12 months.
Global equity markets experienced two corrections, defined as a loss of 10% or more, during the previous 12 months. Amid fears of contagion from international markets, U.S. equities sold off heavily during August 2015 and January 2016. During August, the contraction was fueled by fears of collapsing growth in China. During January 2016, in addition to renewed fears of lower output in China and softer domestic economic data, oil prices dropped below $30 a barrel.
The second correction, which followed the first hike in the federal funds interest rate in a decade, raised concerns that the U.S. Federal Reserve acted too hastily. U.S. investors feared a contracting global economy coupled with the currency and business effects of a rate hike would drive down international demand for U.S. goods. Despite the potential headwinds, the S&P 500 Index6 ended the period up 1.72%.
The European Central Bank (ECB) and the Bank of Japan (BOJ) increased monetary stimulus programs that were intended to bolster their local economies. Brazil’s business and political woes continued and China reduced its economic growth forecasts, which tended to restrain investor enthusiasm for international investments.
U.S. bonds, as measured by the Barclays U.S. Aggregate Bond Index,7 rose 2.99%, outperforming large-cap stocks. Small-cap stocks, as measured by the Russell 2000® Index,8 returned -5.97%. International stocks returned -11.39%, as measured by the Morgan Stanley Capital International (MSCI) All Country World Index (ACWI) ex USA Index (Net).4 Within international stocks, emerging markets stocks fell the most at -17.63%, as measured by the MSCI Emerging Markets (EM) Index (Net).9
The Portfolio remained broadly diversified among the four main stock segments: international, small-cap, large-cap growth, and large-cap value stocks.
| | | | |
| Ten largest holdings (%) as of May 31, 201611 | |
MFS Value Fund Class I | | | 14.97 | |
T. Rowe Price Blue Chip Growth Fund Retail Class | | | 10.52 | |
Thornburg International Value Fund Institutional Class | | | 8.94 | |
Oakmark Fund Class I | | | 7.55 | |
Invesco Growth and Income Fund Class R6 | | | 7.53 | |
American Century Growth Fund Institutional Class | | | 7.47 | |
Wells Fargo Endeavor Select Fund Insitutional Class | | | 6.00 | |
Wells Fargo Large Cap Growth Fund Class R6 | | | 6.00 | |
Wells Fargo International Growth Portfolio | | | 5.90 | |
Dodge & Cox International Stock Fund | | | 2.99 | |
Bond yields continued to be depressed. The potential for future interest-rate hikes may be a headwind to increases in overall output in the U.S. general economy.
Internationally, the accommodative policies of the ECB and BOJ are intended to bolster their local economies. We believe these central banks will continue to support growth in their economies, which should be supportive of asset prices. In addition to developed international economies, emerging markets stocks are at low valuation levels not seen in years. Finally, domestic stocks and the U.S. economy have shown resilience in the past year. We look to market signals and economic releases to help inform the changing state of U.S. markets.
Please see footnotes on page 21.
| | | | | | |
| Performance highlights (unaudited) | | Wells Fargo WealthBuilder Portfolios | | | 23 | |
Wells Fargo WealthBuilder Equity Portfolio (continued)
|
| Portfolio allocation as of May 31, 201612 |
|
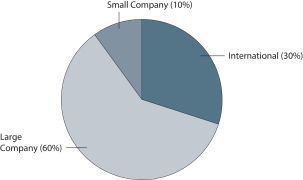
|
Please see footnotes on page 21.
| | | | |
| 24 | | Wells Fargo WealthBuilder Portfolios | | Performance highlights (unaudited) |
Wells Fargo WealthBuilder Tactical Equity Portfolio
Investment objective
The Portfolio seeks long-term capital appreciation with no emphasis on income.
Manager
Wells Fargo Funds Management, LLC
Subadviser
Wells Capital Management Incorporated
Portfolio managers
Kandarp R. Acharya, CFA®, FRM
Christian L. Chan, CFA®
Average annual total returns (%) as of May 31, 2016
| | | | | | | | | | | | | | | | | | | | | | | | | | | | | | | | | | |
| | | | | Including sales charge | | | Excluding sales charge | | | Expense ratios1 (%) | |
| | | Inception date | | 1 year | | | 5 year | | | 10 year | | | 1 year | | | 5 year | | | 10 year | | | Gross | | | Net2 | |
| Wells Fargo WealthBuilder Tactical Equity Portfolio (WBGAX) | | 10-1-1997 | | | (7.53 | ) | | | 5.33 | | | | 3.50 | | | | (6.12 | ) | | | 5.64 | | | | 3.66 | | | | 2.29 | | | | 2.29 | |
| WealthBuilder Tactical Equity Composite Index3 | | – | | | – | | | | – | | | | – | | | | (3.37 | ) | | | 7.79 | | | | 5.84 | | | | – | | | | – | |
| MSCI ACWI ex USA Index (Net)4 | | – | | | – | | | | – | | | | – | | | | (11.39 | ) | | | 0.12 | | | | 2.01 | | | | – | | | | – | |
| Russell 3000® Index5 | | – | | | – | | | | – | | | | – | | | | 0.22 | | | | 11.15 | | | | 7.39 | | | | – | | | | – | |
Figures quoted represent past performance, which is no guarantee of future results, and do not reflect taxes that a shareholder may pay on fund distributions or the redemption of fund shares. Investment return and principal value of an investment will fluctuate so that an investor’s shares, when redeemed, may be worth more or less than their original cost. Performance shown without sales charges would be lower if sales charges were reflected. Current performance may be lower or higher than the performance data quoted, which assumes the reinvestment of dividends and capital gains. Current month-end performance is available on the Portfolio’s website, wellsfargofunds.com.
Index returns do not include transaction costs associated with buying and selling securities, any mutual fund fees or expenses, or any taxes. It is not possible to invest directly in an index.
For WealthBuilder Portfolios, the maximum front-end sales charge is 1.50%.
Stock values fluctuate in response to the activities of individual companies and general market and economic conditions. The Portfolio will indirectly be exposed to all of the risks of an investment in the underlying funds and will indirectly bear expenses of the underlying funds. The use of derivatives may reduce returns and/or increase volatility. Certain investment strategies tend to increase the total risk of an investment (relative to the broader market). The Portfolio is exposed to alternative investment risk, foreign investment risk and smaller-company investment risk. Consult the Portfolio’s prospectus for additional information on these and other risks.
Please see footnotes on page 25.
| | | | | | |
| Performance highlights (unaudited) | | Wells Fargo WealthBuilder Portfolios | | | 25 | |
Wells Fargo WealthBuilder Tactical Equity Portfolio (continued)
|
| Growth of $10,000 investment as of May 31, 20169 |
|
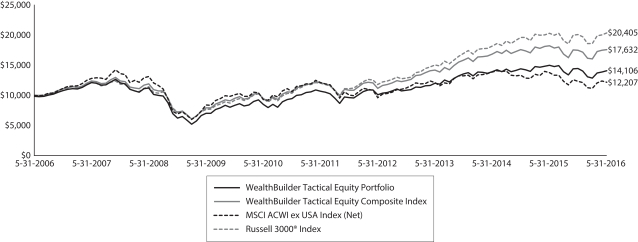 |
| 1 | Reflects the expense ratios as stated in the most recent prospectus, which include the impact of 0.79% of acquired fund fees and expenses and net expenses from affiliated master portfolios. The expense ratios shown are subject to change and may differ from the annualized expense ratios shown in the financial highlights of this report, which do not include acquired fund fees and expenses and net expenses from affiliated master portfolios. |
| 2 | The manager has contractually committed through September 30, 2016, to waive fees and/or reimburse expenses to the extent necessary to cap the Portfolio’s Total Annual Fund Operating Expenses After Fee Waiver at 1.50%. After this time, the cap may be increased or the commitment to maintain the cap may be terminated only with the approval of the Board of Trustees. Brokerage commissions, stamp duty fees, interest, taxes, acquired fund fees and expenses, net expenses from affiliated master portfolios, and extraordinary expenses are excluded from the expense cap. Without this cap, the Portfolio’s returns would have been lower. |
| 3 | Source: Wells Fargo Funds Management, LLC. The WealthBuilder Tactical Equity Composite Index is weighted 30% in the MSCI ACWI ex USA Index (Net) and 70% in the Russell 3000® Index. You cannot invest directly in an index. |
| 4 | The Morgan Stanley Capital International (MSCI) All Country World Index (ACWI) ex USA Index (Net) is a free-float-adjusted market-capitalization-weighted index that is designed to measure the equity market performance of developed markets, excluding the U.S. and Canada. Source: MSCI. MSCI makes no express or implied warranties or representations and shall have no liability whatsoever with respect to any MSCI data contained herein. The MSCI data may not be further redistributed or used as a basis for other indexes or any securities or financial products. This report is not approved, reviewed, or produced by MSCI. You cannot invest directly in an index. |
| 5 | The Russell 3000® Index measures the performance of the 3,000 largest U.S. companies based on total market capitalization, which represents approximately 98% of the investable U.S. equity market. You cannot invest directly in an index. |
| 6 | The S&P 500 Index consists of approximately 500 stocks chosen for market size, liquidity, and industry group representation. It is a market-value-weighted index with each stock’s weight in the index proportionate to its market value. You cannot invest directly in an index. |
| 7 | The Russell 2000® Index measures the performance of the 2,000 smallest companies in the Russell 3000® Index, which represents approximately 8% of the total market capitalization of the Russell 3000® Index. You cannot invest directly in an index. |
| 8 | The MSCI Emerging Markets (EM) Index (Net) is a free-float-adjusted market-capitalization-weighted index that is designed to measure the equity market performance of emerging markets. The MSCI EM Index (Net) consists of the following 23 emerging markets country indexes: Brazil, Chile, China, Colombia, Czech Republic, Egypt, Greece, Hungary, India, Indonesia, Korea, Malaysia, Mexico, Peru, the Philippines, Poland, Qatar, Russia, South Africa, Taiwan, Thailand, Turkey, and United Arab Emirates. You cannot invest directly in an index. |
| 9 | The chart compares the performance of the Portfolio for the most recent ten years with the WealthBuilder Tactical Equity Composite Index, the MSCI ACWI ex USA Index (Net), and the Russell 3000® Index. The chart assumes a hypothetical $10,000 investment and reflects all operating expenses and assumes the maximum initial sales charge of 1.50%. |
| 10 | The ten largest holdings, excluding cash and cash equivalents, are calculated based on the value of the investments divided by the total net assets of the Portfolio. Holdings are subject to change and may have changed since the date specified. |
| 11 | Current target allocation includes the effect of any tactical futures overlay that may be in place. Effective cash is comprised of the net impact of long and/or short futures contracts held as part of dynamic risk management strategy. The amounts are subject to change and may have changed since the date specified. |
| | | | |
| 26 | | Wells Fargo WealthBuilder Portfolios | | Performance highlights (unaudited) |
Wells Fargo WealthBuilder Tactical Equity Portfolio (continued)
MANAGER’S DISCUSSION
Fund highlights
| n | | The Portfolio underperformed its benchmark, the WealthBuilder Tactical Equity Composite Index, for the 12-month period that ended May 31, 2016. |
| n | | Underlying U.S. funds posted narrow losses and underperformed their U.S. equity benchmark; the large cap growth funds were the biggest detractor. |
| n | | Underlying international funds suffered significant losses yet outperformed their international benchmark as a group. |
| n | | The tactical hedging of the yen and euro also detracted from performance. |
Equity markets experienced two corrections during the previous 12 months.
Global equity markets experienced two corrections during the previous 12 months. Amid fears of contagion from international markets, U.S. equities sold off heavily during August 2015 and January 2016. In August, the contraction was fueled by fears of collapsing growth in China. In January, in addition to renewed fears of lower output in China and softer domestic economic data, oil prices dropped below $30 a barrel.
The second correction, which followed the first hike in the federal funds interest rate in a decade, raised concerns that the U.S. Federal Reserve acted too hastily. U.S. investors feared a contracting global economy coupled with the currency and business effects of a rate hike would drive down international demand for U.S. goods. Despite the potential headwinds, the S&P 500 Index6 ended the period up 1.72%.
The European Central Bank (ECB) and the Bank of Japan (BOJ) increased monetary stimulus programs that were intended to bolster their local economies. Brazil’s business and political woes continued and China reduced its economic growth forecasts, which tended to restrain investor enthusiasm for international investments.
Small-cap stocks, as measured by the Russell 2000® Index,7 returned -5.97%. International stocks returned -11.39%, as measured by the Morgan Stanley Capital International (MSCI) All Country World Index (ACWI) ex USA Index (Net).4 Within international stocks, emerging markets stocks fell the most at -17.63%, as measured by the MSCI Emerging Markets Index (Net).8
| | | | |
| Ten largest holdings (%) as of May 31, 201610 | |
MFS Value Fund Class I | | | 14.90 | |
Thornburg International Value Fund Institutional Class | | | 8.94 | |
T. Rowe Price Blue Chip Growth Fund Retail Class | | | 8.72 | |
Oakmark Fund Class I | | | 7.51 | |
Invesco Growth and Income Fund Class R6 | | | 7.48 | |
American Century Growth Fund Institutional Class | | | 6.22 | |
Wells Fargo International Growth Portfolio | | | 5.89 | |
Wells Fargo Large Cap Growth Fund Class R6 | | | 4.99 | |
Wells Fargo Endeavor Select Fund Institutional Class | | | 4.96 | |
Wells Fargo Emerging Growth Portfolio | | | 3.78 | |
During the period, the team altered the Portfolio’s exposure to international stocks, trimming exposure to emerging markets to increase investments in Japan. Currency exposures to the euro and the yen were tactically hedged.
We continue to prefer stocks to bonds.
Bond yields continued to be depressed. The potential for future interest-rate hikes may be a headwind to increases in overall output in the general U.S. economy.
Please see footnotes on page 25.
| | | | | | |
| Performance highlights (unaudited) | | Wells Fargo WealthBuilder Portfolios | | | 27 | |
Wells Fargo WealthBuilder Tactical Equity Portfolio (continued)
|
| Current target allocation as of May 31, 201611 |
|
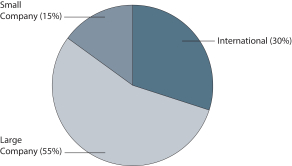 |
Internationally, the accommodative policies of the ECB and BOJ are intended to help bolster their local economies. We believe these central banks will continue to support growth in their economies, which should be supportive of asset prices. In addition to developed international economies, emerging markets stocks are at low valuation levels not seen in years. Finally, domestic stocks and the U.S. economy have shown resilience in the past year. We look to market signals and economic releases to help inform the changing state of U.S. markets.
|
Neutral target allocation |
|
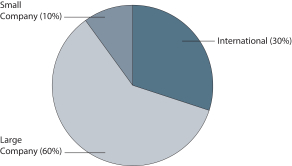
|
Please see footnotes on page 25.
| | | | |
| 28 | | Wells Fargo WealthBuilder Portfolios | | Fund expenses (unaudited) |
As a shareholder of the Fund, you incur two types of costs: (1) transaction costs, including sales charges (loads) on purchase payments and (2) ongoing costs, including management fees, distribution (12b-1) and/or shareholder servicing fees, and other Fund expenses. This example is intended to help you understand your ongoing costs (in dollars) of investing in the Fund and to compare these costs with the ongoing costs of investing in other mutual funds.
The example is based on an investment of $1,000 invested at the beginning of the six-month period and held for the entire period from December 1, 2015 to May 31, 2016.
Actual expenses
The “Actual” line of the table below provides information about actual account values and actual expenses. You may use the information in this line, together with the amount you invested, to estimate the expenses that you paid over the period. Simply divide your account value by $1,000 (for example, an $8,600 account value divided by $1,000 = 8.6), then multiply the result by the number in the “Actual” line under the heading entitled “Expenses paid during period” for your applicable class of shares to estimate the expenses you paid on your account during this period.
Hypothetical example for comparison purposes
The “Hypothetical” line of the table below provides information about hypothetical account values and hypothetical expenses based on the Fund’s actual expense ratio and an assumed rate of return of 5% per year before expenses, which is not the Fund’s actual return. The hypothetical account values and expenses may not be used to estimate the actual ending account balance or expenses you paid for the period. You may use this information to compare the ongoing costs of investing in the Fund and other funds. To do so, compare this 5% hypothetical example with the 5% hypothetical examples that appear in the shareholder reports of the other funds.
Please note that the expenses shown in the table are meant to highlight your ongoing costs only and do not reflect any transactional costs, such as sales charges (loads) and contingent deferred sales charges. Therefore, the “Hypothetical” line of the table is useful in comparing ongoing costs only and will not help you determine the relative total costs of owning different funds. In addition, if these transactional costs were included, your costs would have been higher.
| | | | | | | | | | | | | | | | |
| Wells Fargo WealthBuilder Conservative Allocation Portfolio | | Beginning
account value
12-1-2015 | | | Ending
account value
5-31-2016 | | | Expenses
paid during
the period¹ | | | Net annualized
expense ratio | |
Actual | | $ | 1,000.00 | | | $ | 1,011.41 | | | $ | 7.54 | | | | 1.50 | % |
Hypothetical (5% return before expenses) | | $ | 1,000.00 | | | $ | 1,017.50 | | | $ | 7.57 | | | | 1.50 | % |
| Wells Fargo WealthBuilder Moderate Balanced Portfolio | | | | | | | | | | | | |
Actual | | $ | 1,000.00 | | | $ | 1,005.56 | | | $ | 7.46 | | | | 1.49 | % |
Hypothetical (5% return before expenses) | | $ | 1,000.00 | | | $ | 1,017.56 | | | $ | 7.51 | | | | 1.49 | % |
| Wells Fargo WealthBuilder Growth Balanced Portfolio | | | | | | | | | | | | |
Actual | | $ | 1,000.00 | | | $ | 997.74 | | | $ | 7.44 | | | | 1.49 | % |
Hypothetical (5% return before expenses) | | $ | 1,000.00 | | | $ | 1,017.55 | | | $ | 7.52 | | | | 1.49 | % |
| Wells Fargo WealthBuilder Growth Allocation Portfolio | | | | | | | | | | | | |
Actual | | $ | 1,000.00 | | | $ | 987.85 | | | $ | 7.45 | | | | 1.50 | % |
Hypothetical (5% return before expenses) | | $ | 1,000.00 | | | $ | 1,017.50 | | | $ | 7.57 | | | | 1.50 | % |
| Wells Fargo WealthBuilder Equity Portfolio | | | | | | | | | | | | |
Actual | | $ | 1,000.00 | | | $ | 980.58 | | | $ | 7.43 | | | | 1.50 | % |
Hypothetical (5% return before expenses) | | $ | 1,000.00 | | | $ | 1,017.50 | | | $ | 7.57 | | | | 1.50 | % |
| Wells Fargo WealthBuilder Tactical Equity Portfolio | | | | | | | | | | | | |
Actual | | $ | 1,000.00 | | | $ | 974.37 | | | $ | 7.40 | | | | 1.50 | % |
Hypothetical (5% return before expenses) | | $ | 1,000.00 | | | $ | 1,017.50 | | | $ | 7.57 | | | | 1.50 | % |
| 1 | Expenses paid is equal to the annualized expense ratio multiplied by the average account value over the period, multiplied by the number of days in the most recent fiscal half-year divided by the number of days in the fiscal year (to reflect the one-half-year period). |
| | | | | | |
| Portfolio of investments—May 31, 2016 | | Wells Fargo WealthBuilder Portfolios | | | 29 | |
WEALTHBUILDER CONSERVATIVE ALLOCATION PORTFOLIO
| | | | | | | | | | | | | | | | |
| Security name | | | | | | | | Shares | | | Value | |
| | | | | | | | | | | | | | | | |
| | | | |
Exchange-Traded Funds: 1.67% | | | | | | | | | | | | | | | | |
iShares MSCI Japan Index ETF | | | | | | | | | | | 44,690 | | | $ | 526,448 | |
iShares National AMT-Free Municipal Bond ETF | | | | | | | | | | | 68,291 | | | | 7,670,445 | |
WisdomTree Japan Hedged Equity ETF | | | | | | | | | | | 12,066 | | | | 529,576 | |
| | | | |
Total Exchange-Traded Funds (Cost $8,588,214) | | | | | | | | | | | | | | | 8,726,469 | |
| | | | | | | | | | | | | | | | |
| | | | |
Investment Companies: 98.35% | | | | | | | | | | | | | | | | |
| | | | |
| Affiliated Master Portfolios: 26.54% | | | | | | | | | | | | | | | | |
Wells Fargo Core Bond Portfolio | | | | | | | | | | | | | | | 124,676,465 | |
Wells Fargo Emerging Growth Portfolio | | | | | | | | | | | | | | | 4,016,944 | |
Wells Fargo International Growth Portfolio | | | | | | | | | | | | | | | 6,315,708 | |
Wells Fargo Small Company Value Portfolio | | | | | | | | | | | | | | | 4,015,017 | |
| | | | |
| | | | | | | | | | | | | | | 139,024,134 | |
| | | | | | | | | | | | | | | | |
| | | | |
| Alternative Investment Funds: 6.46% | | | | | | | | | | | | | | | | |
AQR Managed Futures Strategy Fund Class I | | | | | | | | | | | 508,557 | | | | 5,009,285 | |
PIMCO CommodityRealReturn Strategy Fund Institutional Class | | | | | | | | | | | 2,058,075 | | | | 14,262,460 | |
The Arbitrage Fund Class I † | | | | | | | | | | | 394,333 | | | | 5,177,593 | |
Voya Global Real Estate Fund Class I | | | | | | | | | | | 469,303 | | | | 9,371,972 | |
| | | | |
| | | | | | | | | | | | | | | 33,821,310 | |
| | | | | | | | | | | | | | | | |
| | | | |
| Bond Funds: 47.09% | | | | | | | | | | | | | | | | |
Oppenheimer International Bond Fund Class Y | | | | | | | | | | | 4,220,182 | | | | 24,055,035 | |
PIMCO High Yield Fund Institutional Class | | | | | | | | | | | 6,240,034 | | | | 53,165,086 | |
Wells Fargo Government Securities Fund Institutional Class (l) | | | | | | | | | | | 6,475,834 | | | | 73,500,715 | |
Wells Fargo Short Duration Government Bond Fund Class R6 (l) | | | | | | | | | | | 9,604,049 | | | | 95,944,445 | |
| | | | |
| | | | | | | | | | | | | | | 246,665,281 | |
| | | | | | | | | | | | | | | | |
| | | | |
| Stock Funds: 18.26% | | | | | | | | | | | | | | | | |
American Century Growth Fund Institutional Class | | | | | | | | | | | 232,292 | | | | 6,636,591 | |
Calamos Market Neutral Income Fund Investor Class | | | | | | | | | | | 388,696 | | | | 4,975,307 | |
DFA International Small Cap Value Portfolio Institutional Class | | | | | | | | | | | 111,394 | | | | 2,108,679 | |
Dodge & Cox International Stock Fund | | | | | | | | | | | 88,144 | | | | 3,174,941 | |
Invesco Growth and Income Fund Class R6 | | | | | | | | | | | 330,124 | | | | 7,959,302 | |
MFS Value Fund Class I | | | | | | | | | | | 454,341 | | | | 15,892,858 | |
Oakmark Fund Class I | | | | | | | | | | | 122,871 | | | | 7,974,318 | |
Oppenheimer Developing Markets Fund Class Y | | | | | | | | | | | 51,569 | | | | 1,587,812 | |
Royce Pennsylvania Mutual Fund Investor Class | | | | | | | | | | | 398,317 | | | | 4,007,071 | |
T. Rowe Price Blue Chip Growth Fund Retail Class † | | | | | | | | | | | 132,769 | | | | 9,304,455 | |
T. Rowe Price International Discovery Fund | | | | | | | | | | | 39,107 | | | | 2,119,983 | |
Templeton Institutional Foreign Equity Fund Primary Class | | | | | | | | | | | 169,278 | | | | 3,155,345 | |
Thornburg International Value Fund Institutional Class | | | | | | | | | | | 395,118 | | | | 9,518,397 | |
Wells Fargo Emerging Markets Equity Fund Class R6 (l) | | | | | | | | | | | 139,881 | | | | 2,622,762 | |
Wells Fargo Endeavor Select Fund Institutional Class †(l) | | | | | | | | | | | 571,104 | | | | 5,305,551 | |
Wells Fargo Large Cap Growth Fund Class R6 (l) | | | | | | | | | | | 116,760 | | | | 5,305,562 | |
Wells Fargo Small Cap Value Fund Class R6 †(l) | | | | | | | | | | | 194,282 | | | | 4,015,817 | |
| | | | |
| | | | | | | | | | | | | | | 95,664,751 | |
| | | | | | | | | | | | | | | | |
| | | | |
Total Investment Companies (Cost $503,676,170) | | | | | | | | | | | | | | | 515,175,476 | |
| | | | | | | | | | | | | | | | |
The accompanying notes are an integral part of these financial statements.
| | | | |
| 30 | | Wells Fargo WealthBuilder Portfolios | | Portfolio of investments—May 31, 2016 |
WEALTHBUILDER CONSERVATIVE ALLOCATION PORTFOLIO
| | | | | | | | | | | | | | | | |
| Security name | | Yield | | | | | | Shares | | | Value | |
| | | | | | | | | | | | | | | | |
| | | | |
Short-Term Investments: 0.26% | | | | | | | | | | | | | | | | |
| | | | |
| Investment Companies: 0.21% | | | | | | | | | | | | | | | | |
Wells Fargo Cash Investment Money Market Fund Select Class (l)(u) | | | 0.41 | % | | | | | | | 1,091,019 | | | $ | 1,091,019 | |
| | | | | | | | | | | | | | | | |
| | | | |
| | | | | | Maturity date | | | Principal | | | | |
| | | | |
| U.S. Treasury Securities: 0.05% | | | | | | | | | | | | | | | | |
U.S. Treasury Bill (z)# | | | 0.13 | | | | 6-9-2016 | | | $ | 283,000 | | | | 282,991 | |
| | | | | | | | | | | | | | | | |
| | | | |
Total Short-Term Investments (Cost $1,374,010) | | | | | | | | | | | | | | | 1,374,010 | |
| | | | | | | | | | | | | | | | |
| | | | | | | | |
| Total investments in securities (Cost $513,638,394) * | | | 100.28 | % | | | 525,275,955 | |
Other assets and liabilities, net | | | (0.28 | ) | | | (1,444,057 | ) |
| | | | | | | | |
| Total net assets | | | 100.00 | % | | $ | 523,831,898 | |
| | | | | | | | |
| † | Non-income-earning security |
| (l) | The issuer of the security is an affiliated person of the Portfolio as defined in the Investment Company Act of 1940. |
| (u) | The rate represents the 7-day annualized yield at period end. |
| (z) | Zero coupon security. The rate represents the current yield to maturity. |
| # | All or a portion of this security is segregated as collateral for investments in derivative instruments. |
| * | Cost for federal income tax purposes is $521,144,249 and unrealized gains (losses) consists of: |
| | | | |
Gross unrealized gains | | $ | 26,475,829 | |
Gross unrealized losses | | | (22,344,123 | ) |
| | | | |
Net unrealized gains | | $ | 4,131,706 | |
The accompanying notes are an integral part of these financial statements.
| | | | | | |
| Portfolio of investments—May 31, 2016 | | Wells Fargo WealthBuilder Portfolios | | | 31 | |
WEALTHBUILDER MODERATE BALANCED PORTFOLIO
| | | | | | | | | | | | | | | | |
| Security name | | | | | | | | Shares | | | Value | |
| | | | | | | | | | | | | | | | |
| | | | |
Exchange-Traded Funds: 1.46% | | | | | | | | | | | | | | | | |
iShares MSCI Japan Index ETF | | | | | | | | | | | 141,519 | | | $ | 1,667,094 | |
iShares National AMT-Free Municipal Bond ETF | | | | | | | | | | | 78,431 | | | | 8,809,370 | |
WisdomTree Japan Hedged Equity ETF | | | | | | | | | | | 37,016 | | | | 1,624,630 | |
| | | | |
Total Exchange-Traded Funds (Cost $12,274,318) | | | | | | | | | | | | | | | 12,101,094 | |
| | | | | | | | | | | | | | | | |
| | | | |
Investment Companies: 98.28% | | | | | | | | | | | | | | | | |
| | | | |
| Affiliated Master Portfolios: 22.67% | | | | | | | | | | | | | | | | |
Wells Fargo Core Bond Portfolio | | | | | | | | | | | | | | | 143,176,887 | |
Wells Fargo Emerging Growth Portfolio | | | | | | | | | | | | | | | 12,882,232 | |
Wells Fargo International Growth Portfolio | | | | | | | | | | | | | | | 19,977,315 | |
Wells Fargo Small Company Value Portfolio | | | | | | | | | | | | | | | 12,834,637 | |
| | | | |
| | | | | | | | | | | | | | | 188,871,071 | |
| | | | | | | | | | | | | | | | |
| | | | |
| Alternative Investment Funds: 6.47% | | | | | | | | | | | | | | | | |
AQR Managed Futures Strategy Fund Class I | | | | | | | | | | | 806,041 | | | | 7,939,505 | |
PIMCO CommodityRealReturn Strategy Fund Institutional Class | | | | | | | | | | | 3,279,426 | | | | 22,726,420 | |
The Arbitrage Fund Class I † | | | | | | | | | | | 630,740 | | | | 8,281,617 | |
Voya Global Real Estate Fund Class I | | | | | | | | | | | 749,182 | | | | 14,961,161 | |
| | | | |
| | | | | | | | | | | | | | | 53,908,703 | |
| | | | | | | | | | | | | | | | |
| | | | |
| Bond Funds: 33.73% | | | | | | | | | | | | | | | | |
Oppenheimer International Bond Fund Class Y | | | | | | | | | | | 6,436,861 | | | | 36,690,108 | |
PIMCO High Yield Fund Institutional Class | | | | | | | | | | | 8,229,000 | | | | 70,111,082 | |
Wells Fargo Government Securities Fund Institutional Class (l) | | | | | | | | | | | 7,628,131 | | | | 86,579,284 | |
Wells Fargo Short Duration Government Bond Fund Class R6 (l) | | | | | | | | | | | 8,779,414 | | | | 87,706,343 | |
| | | | |
| | | | | | | | | | | | | | | 281,086,817 | |
| | | | | | | | | | | | | | | | |
| | | | |
| Stock Funds: 35.41% | | | | | | | | | | | | | | | | |
American Century Growth Fund Institutional Class | | | | | | | | | | | 737,977 | | | | 21,083,997 | |
Calamos Market Neutral Income Fund Investor Class | | | | | | | | | | | 511,981 | | | | 6,553,363 | |
DFA International Small Cap Value Portfolio Institutional Class | | | | | | | | | | | 353,748 | | | | 6,696,452 | |
Dodge & Cox International Stock Fund | | | | | | | | | | | 278,574 | | | | 10,034,228 | |
Invesco Growth and Income Fund Class R6 | | | | | | | | | | | 1,051,800 | | | | 25,358,896 | |
MFS Value Fund Class I | | | | | | | | | | | 1,451,125 | | | | 50,760,361 | |
Oakmark Fund Class I | | | | | | | | | | | 392,403 | | | | 25,466,968 | |
Oppenheimer Developing Markets Fund Class Y | | | | | | | | | | | 162,632 | | | | 5,007,450 | |
Royce Pennsylvania Mutual Fund Investor Class | | | | | | | | | | | 1,265,156 | | | | 12,727,473 | |
T. Rowe Price Blue Chip Growth Fund Retail Class † | | | | | | | | | | | 422,199 | | | | 29,587,731 | |
T. Rowe Price International Discovery Fund | | | | | | | | | | | 124,701 | | | | 6,760,029 | |
Templeton Institutional Foreign Equity Fund Primary Class | | | | | | | | | | | 534,943 | | | | 9,971,335 | |
Thornburg International Value Fund Institutional Class | | | | | | | | | | | 1,250,877 | | | | 30,133,618 | |
Wells Fargo Emerging Markets Equity Fund Class R6 (l) | | | | | | | | | | | 439,818 | | | | 8,246,588 | |
Wells Fargo Endeavor Select Fund Institutional Class †(l) | | | | | | | | | | | 1,825,750 | | | | 16,961,217 | |
Wells Fargo Large Cap Growth Fund Class R6 (l) | | | | | | | | | | | 371,415 | | | | 16,877,116 | |
Wells Fargo Small Cap Value Fund Class R6 †(l) | | | | | | | | | | | 619,765 | | | | 12,810,541 | |
| | | | |
| | | | | | | | | | | | | | | 295,037,363 | |
| | | | | | | | | | | | | | | | |
| | | | |
Total Investment Companies (Cost $799,354,307) | | | | | | | | | | | | | | | 818,903,954 | |
| | | | | | | | | | | | | | | | |
The accompanying notes are an integral part of these financial statements.
| | | | |
| 32 | | Wells Fargo WealthBuilder Portfolios | | Portfolio of investments—May 31, 2016 |
WEALTHBUILDER MODERATE BALANCED PORTFOLIO
| | | | | | | | | | | | | | | | |
| Security name | | Yield | | | | | | Shares | | | Value | |
| | | | | | | | | | | | | | | | |
| | | | |
Short-Term Investments: 0.26% | | | | | | | | | | | | | | | | |
| | | | |
| Investment Companies: 0.15% | | | | | | | | | | | | | | | | |
Wells Fargo Cash Investment Money Market Fund Select Class (l)(u) | | | 0.41 | % | | | | | | | 1,265,358 | | | $ | 1,265,358 | |
| | | | | | | | | | | | | | | | |
| | | | |
| | | | | | Maturity date | | | Principal | | | | |
| | | | |
| U.S. Treasury Securities: 0.11% | | | | | | | | | | | | | | | | |
U.S. Treasury Bill (z)# | | | 0.13 | | | | 6-9-2016 | | | $ | 912,000 | | | | 911,970 | |
| | | | | | | | | | | | | | | | |
| | | | |
Total Short-Term Investments (Cost $2,177,329) | | | | | | | | | | | | | | | 2,177,328 | |
| | | | | | | | | | | | | | | | |
| | | | | | | | |
| Total investments in securities (Cost $813,805,954) * | | | 100.00 | % | | | 833,182,376 | |
Other assets and liabilities, net | | | 0.00 | | | | 35,267 | |
| | | | | | | | |
| Total net assets | | | 100.00 | % | | $ | 833,217,643 | |
| | | | | | | | |
| † | Non-income-earning security |
| (l) | The issuer of the security is an affiliated person of the Portfolio as defined in the Investment Company Act of 1940. |
| (u) | The rate represents the 7-day annualized yield at period end. |
| (z) | Zero coupon security. The rate represents the current yield to maturity. |
| # | All or a portion of this security is segregated as collateral for investments in derivative instruments. |
| * | Cost for federal income tax purposes is $820,542,776 and unrealized gains (losses) consists of: |
| | | | |
Gross unrealized gains | | $ | 59,617,237 | |
Gross unrealized losses | | | (46,977,637 | ) |
| | | | |
Net unrealized gains | | $ | 12,639,600 | |
The accompanying notes are an integral part of these financial statements.
| | | | | | |
| Portfolio of investments—May 31, 2016 | | Wells Fargo WealthBuilder Portfolios | | | 33 | |
WEALTHBUILDER GROWTH BALANCED PORTFOLIO
| | | | | | | | | | | | | | | | |
| Security name | | | | | | | | Shares | | | Value | |
| | | | | | | | | | | | | | | | |
| | | | |
| Exchange-Traded Funds: 1.23% | | | | | | | | | | | | | | | | |
iShares MSCI Japan Index ETF | | | | | | | | | | | 246,069 | | | $ | 2,898,693 | |
iShares National AMT-Free Municipal Bond ETF | | | | | | | | | | | 56,390 | | | | 6,333,725 | |
WisdomTree Japan Hedged Equity ETF | | | | | | | | | | | 60,553 | | | | 2,657,671 | |
| | | | |
Total Exchange-Traded Funds (Cost $12,540,581) | | | | | | | | | | | | | | | 11,890,089 | |
| | | | | | | | | | | | | | | | |
| | | | |
Investment Companies: 98.50% | | | | | | | | | | | | | | | | |
| | | | |
| Affiliated Master Portfolios: 19.47% | | | | | | | | | | | | | | | | |
Wells Fargo Core Bond Portfolio | | | | | | | | | | | | | | | 108,943,380 | |
Wells Fargo Emerging Growth Portfolio | | | | | | | | | | | | | | | 22,368,837 | |
Wells Fargo International Growth Portfolio | | | | | | | | | | | | | | | 34,619,242 | |
Wells Fargo Small Company Value Portfolio | | | | | | | | | | | | | | | 22,334,971 | |
| | | | |
| | | | | | | | | | | | | | | 188,266,430 | |
| | | | | | | | | | | | | | | | |
| | | | |
| Alternative Investment Funds: 6.43% | | | | | | | | | | | | | | | | |
AQR Managed Futures Strategy Fund Class I | | | | | | | | | | | 922,649 | | | | 9,088,096 | |
PIMCO CommodityRealReturn Strategy Fund Institutional Class | | | | | | | | | | | 3,807,866 | | | | 26,388,513 | |
The Arbitrage Fund Class I † | | | | | | | | | | | 731,423 | | | | 9,603,578 | |
Voya Global Real Estate Fund Class I | | | | | | | | | | | 859,202 | | | | 17,158,262 | |
| | | | |
| | | | | | | | | | | | | | | 62,238,449 | |
| | | | | | | | | | | | | | | | |
| | | | |
| Bond Funds: 20.02% | | | | | | | | | | | | | | | | |
Oppenheimer International Bond Fund Class Y | | | | | | | | | | | 7,983,619 | | | | 45,506,630 | |
PIMCO High Yield Fund Institutional Class | | | | | | | | | | | 7,272,638 | | | | 61,962,876 | |
Wells Fargo Government Securities Fund Institutional Class (l) | | | | | | | | | | | 7,584,472 | | | | 86,083,752 | |
| | | | |
| | | | | | | | | | | | | | | 193,553,258 | |
| | | | | | | | | | | | | | | | |
| | | | |
| Stock Funds: 52.58% | | | | | | | | | | | | | | | | |
American Century Growth Fund Institutional Class | | | | | | | | | | | 1,282,082 | | | | 36,629,071 | |
Calamos Market Neutral Income Fund Investor Class | | | | | | | | | | | 504,066 | | | | 6,452,041 | |
DFA International Small Cap Value Portfolio Institutional Class | | | | | | | | | | | 616,969 | | | | 11,679,230 | |
Dodge & Cox International Stock Fund | | | | | | | | | | | 486,048 | | | | 17,507,448 | |
Invesco Growth and Income Fund Class R6 | | | | | | | | | | | 1,835,702 | | | | 44,258,776 | |
MFS Value Fund Class I | | | | | | | | | | | 2,521,110 | | | | 88,188,420 | |
Oakmark Fund Class I | | | | | | | | | | | 684,123 | | | | 44,399,585 | |
Oppenheimer Developing Markets Fund Class Y | | | | | | | | | | | 284,082 | | | | 8,746,876 | |
Royce Pennsylvania Mutual Fund Investor Class | | | | | | | | | | | 2,201,587 | | | | 22,147,962 | |
T. Rowe Price Blue Chip Growth Fund Retail Class † | | | | | | | | | | | 733,038 | | | | 51,371,297 | |
T. Rowe Price International Discovery Fund | | | | | | | | | | | 216,748 | | | | 11,749,898 | |
Templeton Institutional Foreign Equity Fund Primary Class | | | | | | | | | | | 932,570 | | | | 17,383,098 | |
Thornburg International Value Fund Institutional Class | | | | | | | | | | | 2,173,337 | | | | 52,355,698 | |
Wells Fargo Emerging Markets Equity Fund Class R6 (l) | | | | | | | | | | | 770,740 | | | | 14,451,367 | |
Wells Fargo Endeavor Select Fund Institutional Class †(l) | | | | | | | | | | | 3,160,092 | | | | 29,357,259 | |
Wells Fargo Large Cap Growth Fund Class R6 (l) | | | | | | | | | | | 644,959 | | | | 29,306,936 | |
Wells Fargo Small Cap Value Fund Class R6 †(l) | | | | | | | | | | | 1,083,617 | | | | 22,398,371 | |
| | | | |
| | | | | | | | | | | | | | | 508,383,333 | |
| | | | | | | | | | | | | | | | |
| | | | |
Total Investment Companies (Cost $915,439,728) | | | | | | | | | | | | | | | 952,441,470 | |
| | | | | | | | | | | | | | | | |
The accompanying notes are an integral part of these financial statements.
| | | | |
| 34 | | Wells Fargo WealthBuilder Portfolios | | Portfolio of investments—May 31, 2016 |
WEALTHBUILDER GROWTH BALANCED PORTFOLIO
| | | | | | | | | | | | | | | | |
| Security name | | Yield | | | | | | Shares | | | Value | |
| | | | | | | | | | | | | | | | |
| | | | |
Short-Term Investments: 0.27% | | | | | | | | | | | | | | | | |
| | | | |
| Investment Companies: 0.14% | | | | | | | | | | | | | | | | |
Wells Fargo Cash Investment Money Market Fund Select Class (l)(u) | | | 0.41 | % | | | | | | | 1,324,716 | | | $ | 1,324,716 | |
| | | | | | | | | | | | | | | | |
| | | | |
| | | | | | Maturity date | | | Principal | | | | |
| | | | |
| U.S. Treasury Securities: 0.13% | | | | | | | | | | | | | | | | |
U.S. Treasury Bill (z)# | | | 0.12 | | | | 6-9-2016 | | | $ | 1,315,000 | | | | 1,314,957 | |
| | | | | | | | | | | | | | | | |
| | | | |
Total Short-Term Investments (Cost $2,639,677) | | | | | | | | | | | | | | | 2,639,673 | |
| | | | | | | | | | | | | | | | |
| | | | | | | | |
| Total investments in securities (Cost $930,619,986) * | | | 100.00 | % | | | 966,971,232 | |
Other assets and liabilities, net | | | 0.00 | | | | (39,054 | ) |
| | | | | | | | |
| Total net assets | | | 100.00 | % | | $ | 966,932,178 | |
| | | | | | | | |
| † | Non-income-earning security |
| (l) | The issuer of the security is an affiliated person of the Portfolio as defined in the Investment Company Act of 1940. |
| (u) | The rate represents the 7-day annualized yield at period end. |
| (z) | Zero coupon security. The rate represents the current yield to maturity. |
| # | All or a portion of this security is segregated as collateral for investments in derivative instruments. |
| * | Cost for federal income tax purposes is $944,392,131 and unrealized gains (losses) consists of: |
| | | | |
Gross unrealized gains | | $ | 80,978,171 | |
Gross unrealized losses | | | (58,399,070 | ) |
| | | | |
Net unrealized gains | | $ | 22,579,101 | |
The accompanying notes are an integral part of these financial statements.
| | | | | | |
| Portfolio of investments—May 31, 2016 | | Wells Fargo WealthBuilder Portfolios | | | 35 | |
WEALTHBUILDER GROWTH ALLOCATION PORTFOLIO
| | | | | | | | | | | | | | | | |
| Security name | | | | | | | | Shares | | | Value | |
| | | | | | | | | | | | | | | | |
| | | | |
Exchange-Traded Funds: 1.02% | | | | | | | | | | | | | | | | |
iShares MSCI Japan Index ETF | | | | | | | | | | | 144,590 | | | $ | 1,703,270 | |
iShares National AMT-Free Municipal Bond ETF | | | | | | | | | | | 10,072 | | | | 1,131,287 | |
WisdomTree Japan Hedged Equity ETF | | | | | | | | | | | 35,214 | | | | 1,545,542 | |
| | | | |
Total Exchange-Traded Funds (Cost $4,865,164) | | | | | | | | | | | | | | | 4,380,099 | |
| | | | | | | | | | | | | | | | |
| | | | |
Investment Companies: 98.73% | | | | | | | | | | | | | | | | |
| | | | |
| Affiliated Master Portfolios: 15.45% | | | | | | | | | | | | | | | | |
Wells Fargo Core Bond Portfolio | | | | | | | | | | | | | | | 19,855,433 | |
Wells Fargo Emerging Growth Portfolio | | | | | | | | | | | | | | | 12,994,194 | |
Wells Fargo International Growth Portfolio | | | | | | | | | | | | | | | 20,388,098 | |
Wells Fargo Small Company Value Portfolio | | | | | | | | | | | | | | | 13,139,432 | |
| | | | |
| | | | | | | | | | | | | | | 66,377,157 | |
| | | | | | | | | | | | | | | | |
| | | | |
| Alternative Investment Funds: 6.35% | | | | | | | | | | | | | | | | |
AQR Managed Futures Strategy Fund Class I | | | | | | | | | | | 395,016 | | | | 3,890,906 | |
PIMCO CommodityRealReturn Strategy Fund Institutional Class | | | | | | | | | | | 1,677,987 | | | | 11,628,447 | |
The Arbitrage Fund Class I † | | | | | | | | | | | 317,335 | | | | 4,166,610 | |
Voya Global Real Estate Fund Class I | | | | | | | | | | | 379,483 | | | | 7,578,283 | |
| | | | |
| | | | | | | | | | | | | | | 27,264,246 | |
| | | | | | | | | | | | | | | | |
| | | | |
| Bond Funds: 7.37% | | | | | | | | | | | | | | | | |
Oppenheimer International Bond Fund Class Y | | | | | | | | | | | 1,496,114 | | | | 8,527,848 | |
PIMCO High Yield Fund Institutional Class | | | | | | | | | | | 1,342,286 | | | | 11,436,276 | |
Wells Fargo Government Securities Fund Institutional Class (l) | | | | | | | | | | | 1,029,283 | | | | 11,682,358 | |
| | | | |
| | | | | | | | | | | | | | | 31,646,482 | |
| | | | | | | | | | | | | | | | |
| | | | |
| Stock Funds: 69.56% | | | | | | | | | | | | | | | | |
American Century Growth Fund Institutional Class | | | | | | | | | | | 753,096 | | | | 21,515,945 | |
Calamos Market Neutral Income Fund Class I | | | | | | | | | | | 311,585 | | | | 3,988,289 | |
DFA International Small Cap Value Portfolio Institutional Class | | | | | | | | | | | 362,814 | | | | 6,868,073 | |
Dodge & Cox International Stock Fund | | | | | | | | | | | 283,708 | | | | 10,219,171 | |
Invesco Growth and Income Fund Class R6 | | | | | | | | | | | 1,078,068 | | | | 25,992,213 | |
MFS Value Fund Class I | | | | | | | | | | | 1,482,311 | | | | 51,851,227 | |
Oakmark Fund Class I | | | | | | | | | | | 402,070 | | | | 26,094,317 | |
Oppenheimer Developing Markets Fund Class Y | | | | | | | | | | | 166,424 | | | | 5,124,203 | |
Royce Pennsylvania Mutual Fund Investor Class | | | | | | | | | | | 1,294,310 | | | | 13,020,757 | |
T. Rowe Price Blue Chip Growth Fund Retail Class † | | | | | | | | | | | 430,898 | | | | 30,197,344 | |
T. Rowe Price International Discovery Fund | | | | | | | | | | | 127,390 | | | | 6,905,827 | |
Templeton Institutional Foreign Equity Fund Primary Class | | | | | | | | | | | 547,200 | | | | 10,199,807 | |
Thornburg International Value Fund Institutional Class | | | | | | | | | | | 1,278,453 | | | | 30,797,941 | |
Wells Fargo Emerging Markets Equity Fund Class R6 (l) | | | | | | | | | | | 450,592 | | | | 8,448,600 | |
Wells Fargo Endeavor Select Fund Institutional Class †(l) | | | | | | | | | | | 1,862,181 | | | | 17,299,658 | |
Wells Fargo Large Cap Growth Fund Class R6 (l) | | | | | | | | | | | 379,154 | | | | 17,228,754 | |
Wells Fargo Small Cap Value Fund Class R6 †(l) | | | | | | | | | | | 634,547 | | | | 13,116,082 | |
| | | | |
| | | | | | | | | | | | | | | 298,868,208 | |
| | | | | | | | | | | | | | | | |
| | | | |
Total Investment Companies (Cost $409,002,191) | | | | | | | | | | | | | | | 424,156,093 | |
| | | | | | | | | | | | | | | | |
The accompanying notes are an integral part of these financial statements.
| | | | |
| 36 | | Wells Fargo WealthBuilder Portfolios | | Portfolio of investments—May 31, 2016 |
WEALTHBUILDER GROWTH ALLOCATION PORTFOLIO
| | | | | | | | | | | | | | | | |
| Security name | | Yield | | | Maturity date | | | Principal | | | Value | |
| | | | | | | | | | | | | | | | |
| | | | |
Short-Term Investments: 0.16% | | | | | | | | | | | | | | | | |
| | | | |
| U.S. Treasury Securities: 0.16% | | | | | | | | | | | | | | | | |
U.S. Treasury Bill (z)# | | | 0.11 | % | | | 6-9-2016 | | | $ | 696,000 | | | $ | 695,977 | |
| | | | | | | | | | | | | | | | |
| | | | |
Total Short-Term Investments (Cost $695,980) | | | | | | | | | | | | | | | 695,977 | |
| | | | | | | | | | | | | | | | |
| | | | | | | | |
| Total investments in securities (Cost $414,563,335) * | | | 99.91 | % | | | 429,232,169 | |
Other assets and liabilities, net | | | 0.09 | | | | 395,427 | |
| | | | | | | | |
| Total net assets | | | 100.00 | % | | $ | 429,627,596 | |
| | | | | | | | |
| † | Non-income earning security |
| (l) | The issuer of the security is an affiliated person of the Portfolio as defined in the Investment Company Act of 1940. |
| (z) | Zero coupon security. The rate represents the current yield to maturity. |
| # | All or a portion of this security is segregated as collateral for investments in derivative instruments. |
| * | Cost for federal income tax purposes is $417,545,054 and unrealized gains (losses) consists of: |
| | | | |
Gross unrealized gains | | $ | 38,949,926 | |
Gross unrealized losses | | | (27,262,811 | ) |
| | | | |
Net unrealized gains | | $ | 11,687,115 | |
The accompanying notes are an integral part of these financial statements.
| | | | | | |
| Portfolio of investments—May 31, 2016 | | Wells Fargo WealthBuilder Portfolios | | | 37 | |
WEALTHBUILDER EQUITY PORTFOLIO
| | | | | | | | | | | | | | | | |
| Security name | | | | | | | | Shares | | | Value | |
| | | | |
Investment Companies: 99.88% | | | | | | | | | | | | | | | | |
| | | | |
| Affiliated Master Portfolios: 10.97% | | | | | | | | | | | | | | | | |
Wells Fargo Emerging Growth Portfolio | | | | | | | | | | | | | | $ | 3,397,239 | |
Wells Fargo International Growth Portfolio | | | | | | | | | | | | | | | 7,906,391 | |
Wells Fargo Small Company Value Portfolio | | | | | | | | | | | | | | | 3,390,251 | |
| | | | |
| | | | | | | | | | | | | | | 14,693,881 | |
| | | | | | | | | | | | | | | | |
| | | | |
| Stock Funds: 88.91% | | | | | | | | | | | | | | | | |
American Century Growth Fund Institutional Class | | | | | | | | | | | 350,394 | | | | 10,010,746 | |
DFA International Small Cap Value Portfolio Institutional Class | | | | | | | | | | | 140,850 | | | | 2,666,295 | |
Dodge & Cox International Stock Fund | | | | | | | | | | | 111,262 | | | | 4,007,672 | |
Invesco Growth and Income Fund Class R6 | | | | | | | | | | | 418,353 | | | | 10,086,489 | |
MFS Value Fund Class I | | | | | | | | | | | 573,370 | | | | 20,056,466 | |
Oakmark Fund Class I | | | | | | | | | | | 155,908 | | | | 10,118,404 | |
Oppenheimer Developing Markets Fund Class Y | | | | | | | | | | | 107,577 | | | | 3,312,310 | |
Royce Pennsylvania Mutual Fund Investor Class | | | | | | | | | | | 335,175 | | | | 3,371,864 | |
T. Rowe Price Blue Chip Growth Fund Retail Class † | | | | | | | | | | | 201,020 | | | | 14,087,469 | |
T. Rowe Price International Discovery Fund | | | | | | | | | | | 49,414 | | | | 2,678,720 | |
Templeton Institutional Foreign Equity Fund Primary Class | | | | | | | | | | | 213,608 | | | | 3,981,661 | |
Thornburg International Value Fund Institutional Class | | | | | | | | | | | 497,102 | | | | 11,975,187 | |
Wells Fargo Emerging Markets Equity Fund Class R6 (l) | | | | | | | | | | | 175,032 | | | | 3,281,845 | |
Wells Fargo Endeavor Select Fund Institutional Class †(l) | | | | | | | | | | | 865,622 | | | | 8,041,633 | |
Wells Fargo Large Cap Growth Fund Class R6 (l) | | | | | | | | | | | 176,914 | | | | 8,038,992 | |
Wells Fargo Small Cap Value Fund Class R6 (l)† | | | | | | | | | | | 164,410 | | | | 3,398,353 | |
| | | | |
| | | | | | | | | | | | | | | 119,114,106 | |
| | | | | | | | | | | | | | | | |
| | | | |
Total Investment Companies (Cost $118,968,622) | | | | | | | | | | | | | | | 133,807,987 | |
| | | | | | | | | | | | | | | | |
| | | | |
| | | Yield | | | | | | | | | | |
| Short-Term Investments: 0.12% | | | | | | | | | | | | | | | | |
| | | | |
| Investment Companies: 0.12% | | | | | | | | | | | | | | | | |
Wells Fargo Cash Investment Money Market Fund Select Class (l)(u) | | | 0.41 | % | | | | | | | 155,252 | | | | 155,252 | |
| | | | | | | | | | | | | | | | |
| | | | |
Total Short-Term Investments (Cost $155,252) | | | | | | | | | | | | | | | 155,252 | |
| | | | | | | | | | | | | | | | |
| | | | | | | | |
| Total investments in securities (Cost $119,123,874) * | | | 100.00 | % | | | 133,963,239 | |
Other assets and liabilities, net | | | (0.00 | ) | | | 669 | |
| | | | | | | | |
| Total net assets | | | 100.00 | % | | $ | 133,963,908 | |
| | | | | | | | |
| † | Non-income earning security |
| (l) | The issuer of the security is an affiliated person of the Portfolio as defined in the Investment Company Act of 1940. |
| (u) | The rate represents the 7-day annualized yield at period end. |
| * | Cost for federal income tax purposes is $116,840,949 and unrealized gains (losses) consists of: |
| | | | |
Gross unrealized gains | | $ | 21,593,225 | |
Gross unrealized losses | | | (4,470,935 | ) |
| | | | |
Net unrealized gains | | $ | 17,122,290 | |
The accompanying notes are an integral part of these financial statements.
| | | | |
| 38 | | Wells Fargo WealthBuilder Portfolios | | Portfolio of investments—May 31, 2016 |
WEALTHBUILDER TACTICAL EQUITY PORTFOLIO
| | | | | | | | | | | | | | | | |
| Security name | | | | | | | | Shares | | | Value | |
| | | | |
Exchange-Traded Funds: 0.98% | | | | | | | | | | | | | | | | |
iShares MSCI Japan Index ETF | | | | | | | | | | | 177,120 | | | $ | 2,086,474 | |
WisdomTree Japan Hedged Equity ETF | | | | | | | | | | | 46,565 | | | | 2,043,738 | |
| | | | |
Total Exchange-Traded Funds (Cost $4,759,463) | | | | | | | | | | | | | | | 4,130,212 | |
| | | | | | | | | | | | | | | | |
| | | | |
Investment Companies: 98.56% | | | | | | | | | | | | | | | | |
| | | | |
| Affiliated Master Portfolios: 13.45% | | | | | | | | | | | | | | | | |
Wells Fargo Emerging Growth Portfolio | | | | | | | | | | | | | | | 16,004,365 | |
Wells Fargo International Growth Portfolio | | | | | | | | | | | | | | | 24,932,164 | |
Wells Fargo Small Company Value Portfolio | | | | | | | | | | | | | | | 15,975,319 | |
| | | | |
| | | | | | | | | | | | | | | 56,911,848 | |
| | | | | | | | | | | | | | | | |
| | | | |
| Stock Funds: 85.11% | | | | | | | | | | | | | | | | |
American Century Growth Fund Institutional Class | | | | | | | | | | | 920,724 | | | | 26,305,080 | |
DFA International Small Cap Value Portfolio Institutional Class | | | | | | | | | | | 442,820 | | | | 8,382,577 | |
Dodge & Cox International Stock Fund | | | | | | | | | | | 350,790 | | | | 12,635,467 | |
Invesco Growth and Income Fund Class R6 | | | | | | | | | | | 1,313,060 | | | | 31,657,871 | |
MFS Value Fund Class I | | | | | | | | | | | 1,802,611 | | | | 63,055,319 | |
Oakmark Fund Class I | | | | | | | | | | | 489,422 | | | | 31,763,462 | |
Oppenheimer Developing Markets Fund Class Y | | | | | | | | | | | 203,794 | | | | 6,274,817 | |
Royce Pennsylvania Mutual Fund Investor Class | | | | | | | | | | | 1,582,918 | | | | 15,924,158 | |
T. Rowe Price Blue Chip Growth Fund Retail Class † | | | | | | | | | | | 526,432 | | | | 36,892,362 | |
T. Rowe Price International Discovery Fund | | | | | | | | | | | 155,012 | | | | 8,403,177 | |
Templeton Institutional Foreign Equity Fund Primary Class | | | | | | | | | | | 673,637 | | | | 12,556,596 | |
Thornburg International Value Fund Institutional Class | | | | | | | | | | | 1,569,514 | | | | 37,809,594 | |
Wells Fargo Emerging Markets Equity Fund Class R6 (l) | | | | | | | | | | | 553,651 | | | | 10,380,950 | |
Wells Fargo Endeavor Select Fund Institutional Class †(l) | | | | | | | | | | | 2,260,399 | | | | 20,999,107 | |
Wells Fargo Large Cap Growth Fund Class R6 (l) | | | | | | | | | | | 464,289 | | | | 21,097,281 | |
Wells Fargo Small Cap Value Fund Class R6 (l)† | | | | | | | | | | | 773,175 | | | | 15,981,519 | |
| | | | |
| | | | | | | | | | | | | | | 360,119,337 | |
| | | | | | | | | | | | | | | | |
| | | | |
Total Investment Companies (Cost $386,981,706) | | | | | | | | | | | | | | | 417,031,185 | |
| | | | | | | | | | | | | | | | |
| | | | |
| | | Yield | | | | | | | | | | |
| Short-Term Investments: 0.42% | | | | | | | | | | | | | | | | |
| | | | |
| Investment Companies: 0.29% | | | | | | | | | | | | | | | | |
Wells Fargo Cash Investment Money Market Fund Select Class (l)(u) | | | 0.41 | % | | | | | | | 1,212,049 | | | | 1,212,049 | |
| | | | | | | | | | | | | | | | |
| | | | |
| | | | | | Maturity date | | | Principal | | | | |
| | | | |
| U.S. Treasury Securities: 0.13% | | | | | | | | | | | | | | | | |
U.S. Treasury Bill (z)# | | | 0.10 | | | | 6-9-2016 | | | $ | 272,000 | | | | 271,991 | |
U.S. Treasury Bill (z)# | | | 0.25 | | | | 6-16-2016 | | | | 300,000 | | | | 299,981 | |
| | | | |
| | | | | | | | | | | | | | | 571,972 | |
| | | | | | | | | | | | | | | | |
| | | | |
Total Short-Term Investments (Cost $1,784,008) | | | | | | | | | | | | | | | 1,784,021 | |
| | | | | | | | | | | | | | | | |
| | | | | | | | |
| Total investments in securities (Cost $393,525,177) * | | | 99.96 | % | | | 422,945,418 | |
Other assets and liabilities, net | | | 0.04 | | | | 163,169 | |
| | | | | | | | |
| Total net assets | | | 100.00 | % | | $ | 423,108,587 | |
| | | | | | | | |
The accompanying notes are an integral part of these financial statements.
| | | | | | |
| Portfolio of investments—May 31, 2016 | | Wells Fargo WealthBuilder Portfolios | | | 39 | |
WEALTHBUILDER TACTICAL EQUITY PORTFOLIO
| † | Non-income earning security |
| (l) | The issuer of the security is an affiliated person of the Portfolio as defined in the Investment Company Act of 1940. |
| (u) | The rate represents the 7-day annualized yield at period end. |
| (z) | Zero coupon security. The rate represents the current yield to maturity. |
| # | All or a portion of this security is segregated as collateral for investments in derivative instruments. |
| * | Cost for federal income tax purposes is $392,018,132 and unrealized gains (losses) consists of: |
| | | | |
Gross unrealized gains | | $ | 49,858,431 | |
Gross unrealized losses | | | (18,931,145 | ) |
| | | | |
Net unrealized gains | | $ | 30,927,286 | |
The accompanying notes are an integral part of these financial statements.
| | | | |
| 40 | | Wells Fargo WealthBuilder Portfolios | | Statements of assets and liabilities—May 31, 2016 |
| | | | | | | | |
| | | WealthBuilder
Conservative
Allocation
Portfolio | | | WealthBuilder
Moderate
Balanced
Portfolio | |
| | |
Assets | | | | | | | | |
Investments | | | | | | | | |
In unaffiliated Underlying Funds and securities, at value (see cost below) | | $ | 198,465,950 | | | $ | 413,864,858 | |
In affiliated Underlying Funds, at value (see cost below) | | | 187,785,871 | | | | 230,446,447 | |
In affiliated Master Portfolios, at value (see cost below) | | | 139,024,134 | | | | 188,871,071 | |
| | | | |
Total investments, at value (see cost below) | | | 525,275,955 | | | | 833,182,376 | |
Cash | | | 432,436 | | | | 650,405 | |
Receivable for investments sold | | | 0 | | | | 0 | |
Receivable for Portfolio shares sold | | | 560,282 | | | | 1,966,788 | |
Receivable for dividends | | | 593,405 | | | | 731,179 | |
Receivable for daily variation margin on open futures contracts | | | 37,156 | | | | 120,378 | |
Prepaid expenses and other assets | | | 11,650 | | | | 22,875 | |
| | | | |
Total assets | | | 526,910,884 | | | | 836,674,001 | |
| | | | |
| | |
Liabilities | | | | | | | | |
Payable for investments purchased | | | 1,019,909 | | | | 1,370,948 | |
Payable for Portfolio shares redeemed | | | 1,377,285 | | | | 1,011,820 | |
Management fee payable | | | 110,207 | | | | 175,325 | |
Distribution fee payable | | | 332,254 | | | | 525,976 | |
Administration fee payable | | | 93,031 | | | | 147,273 | |
Shareholder servicing fees payable | | | 110,751 | | | | 175,325 | |
Accrued expenses and other liabilities | | | 35,549 | | | | 49,691 | |
| | | | |
Total liabilities | | | 3,078,986 | | | | 3,456,358 | |
| | | | |
Total net assets | | $ | 523,831,898 | | | $ | 833,217,643 | |
| | | | |
| | |
NET ASSETS CONSIST OF | | | | | | | | |
Paid-in capital | | $ | 511,455,366 | | | $ | 797,080,422 | |
Undistributed (overdistributed/accumulated) net investment income (loss) | | | 5,393 | | | | 194,432 | |
Accumulated net realized gains (losses) on investments | | | 851,609 | | | | 16,948,623 | |
Net unrealized gains on investments | | | 11,519,530 | | | | 18,994,166 | |
| | | | |
Total net assets | | $ | 523,831,898 | | | $ | 833,217,643 | |
| | | | |
| | |
COMPUTATION OF NET ASSET VALUE AND OFFERING PRICE PER SHARE | | | | | | | | |
Net assets | | $ | 523,831,898 | | | $ | 833,217,643 | |
Shares outstanding1 | | | 50,715,548 | | | | 73,104,274 | |
Net asset value per share | | | $10.33 | | | | $11.40 | |
Maximum offering price per share2 | | | $10.49 | | | | $11.57 | |
| | |
Investments in unaffiliated Underlying Funds and securities, at cost | | $ | 188,630,032 | | | $ | 389,404,837 | |
| | | | |
Investments in affiliated Underlying Funds, at cost | | $ | 184,761,362 | | | $ | 231,154,310 | |
| | | | |
Investments in affiliated Master Portfolios, at cost | | $ | 140,247,000 | | | $ | 193,246,807 | |
| | | | |
Total investments, at cost | | $ | 513,638,394 | | | $ | 813,805,954 | |
| | | | |
| 1 | Each Portfolio has an unlimited number of authorized shares. |
| 2 | Maximum offering price is computed as 100/98.50 of net asset value. On investments of $50,000 or more, the offering price is reduced. |
The accompanying notes are an integral part of these financial statements.
| | | | | | |
| Statements of assets and liabilities—May 31, 2016 | | Wells Fargo WealthBuilder Portfolios | | | 41 | |
| | | | | | | | | | | | | | |
WealthBuilder
Growth Balanced Portfolio | | | WealthBuilder
Growth Allocation
Portfolio | | | WealthBuilder
Equity
Portfolio | | | WealthBuilder Tactical Equity Portfolio | |
| | | |
| | | | | | | | | | | | | | |
| | | | | | | | | | | | | | |
| $ | 595,782,401 | | | $ | 295,079,560 | | | $ | 96,353,283 | | | $ | 296,362,664 | |
| | 182,922,401 | | | | 67,775,452 | | | | 22,916,075 | | | | 69,670,906 | |
| | 188,266,430 | | | | 66,377,157 | | | | 14,693,881 | | | | 56,911,848 | |
| | |
| | 966,971,232 | | | | 429,232,169 | | | | 133,963,239 | | | | 422,945,418 | |
| | 1,150,924 | | | | 744,067 | | | | 189,223 | | | | 583,577 | |
| | 176,490 | | | | 222,883 | | | | 55,525 | | | | 204,374 | |
| | 1,596,680 | | | | 427,597 | | | | 41,117 | | | | 549,641 | |
| | 594,326 | | | | 104,512 | | | | 0 | | | | 0 | |
| | 205,203 | | | | 119,366 | | | | 0 | | | | 143,213 | |
| | 26,573 | | | | 19,900 | | | | 10,186 | | | | 11,642 | |
| | |
| | 970,721,428 | | | | 430,870,494 | | | | 134,259,290 | | | | 424,437,865 | |
| | |
| | | |
| | | | | | | | | | | | | | |
| | 599,896 | | | | 105,494 | | | | 0 | | | | 0 | |
| | 1,931,104 | | | | 580,971 | | | | 122,883 | | | | 794,469 | |
| | 203,287 | | | | 86,874 | | | | 17,285 | | | | 83,365 | |
| | 609,862 | | | | 269,667 | | | | 83,779 | | | | 265,024 | |
| | 170,761 | | | | 75,507 | | | | 23,458 | | | | 74,207 | |
| | 203,287 | | | | 89,889 | | | | 27,926 | | | | 88,341 | |
| | 71,053 | | | | 34,496 | | | | 20,051 | | | | 23,872 | |
| | |
| | 3,789,250 | | | | 1,242,898 | | | | 295,382 | | | | 1,329,278 | |
| | |
| $ | 966,932,178 | | | $ | 429,627,596 | | | $ | 133,963,908 | | | $ | 423,108,587 | |
| | |
| | | |
| | | | | | | | | | | | | | |
| $ | 909,204,883 | | | $ | 399,859,087 | | | $ | 113,870,870 | | | $ | 415,776,670 | |
| | (253,996 | ) | | | (827,470 | ) | | | 249 | | | | (1,656,016 | ) |
| | 22,233,054 | | | | 16,263,690 | | | | 5,253,424 | | | | (20,082,063 | ) |
| | 35,748,237 | | | | 14,332,289 | | | | 14,839,365 | | | | 29,069,996 | |
| | |
| $ | 966,932,178 | | | $ | 429,627,596 | | | $ | 133,963,908 | | | $ | 423,108,587 | |
| | |
| | | |
| | | | | | | | | | | | | | |
| $ | 966,932,178 | | | $ | 429,627,596 | | | $ | 133,963,908 | | | $ | 423,108,587 | |
| | 72,736,327 | | | | 32,091,673 | | | | 8,840,440 | | | | 23,182,768 | |
| | $13.29 | | | | $13.39 | | | | $ 15.15 | | | | $18.25 | |
| | $13.49 | | | | $13.59 | | | | $ 15.38 | | | | $18.53 | |
| | | |
| $ | 546,453,981 | | | $ | 270,218,432 | | | $ | 78,225,043 | | | $ | 253,320,457 | |
| | |
| $ | 187,538,451 | | | $ | 73,406,430 | | | $ | 24,426,847 | | | $ | 75,924,884 | |
| | |
| $ | 196,627,554 | | | $ | 70,938,473 | | | $ | 16,471,984 | | | $ | 64,279,836 | |
| | |
| $ | 930,619,986 | | | $ | 414,563,335 | | | $ | 119,123,874 | | | $ | 393,525,177 | |
| | |
The accompanying notes are an integral part of these financial statements.
| | | | |
| 42 | | Wells Fargo WealthBuilder Portfolios | | Statements of operations—year ended May 31, 2016 |
| | | | | | | | |
| | | WealthBuilder
Conservative
Allocation
Portfolio | | | WealthBuilder
Moderate
Balanced Portfolio | |
| | |
Investment income | | | | | | | | |
Dividends from unaffiliated Underlying Funds | | $ | 6,231,002 | | | $ | 10,680,927 | |
Dividends from affiliated Underlying Funds | | | 2,759,247 | | | | 3,000,700 | |
Interest allocated from affiliated Master Portfolios | | | 2,741,174 | | | | 3,230,662 | |
Dividends allocated from affiliated Master Portfolios* | | | 199,318 | | | | 640,067 | |
Affiliated income allocated from affiliated Master Portfolios | | | 18,916 | | | | 24,826 | |
Securities lending income allocated from affiliated Master Portfolios | | | 23,942 | | | | 66,501 | |
Interest | | | 932 | | | | 2,941 | |
Expenses allocated from affiliated Master Portfolios | | | (579,370 | ) | | | (939,625 | ) |
Waivers allocated from affiliated Master Portfolios | | | 16,928 | | | | 19,981 | |
| | | | |
Total investment income | | | 11,412,089 | | | | 16,726,980 | |
| | | | |
| | |
Expenses | | | | | | | | |
Management fee | | | 1,309,479 | | | | 2,119,467 | |
Administration fee | | | 1,122,161 | | | | 1,816,895 | |
Shareholder servicing fees | | | 1,309,198 | | | | 2,119,265 | |
Distribution fee | | | 3,928,436 | | | | 6,358,400 | |
Custody and accounting fees | | | 72,536 | | | | 69,948 | |
Professional fees | | | 33,064 | | | | 33,065 | |
Registration fees | | | 55,394 | | | | 51,397 | |
Shareholder report expenses | | | 30,631 | | | | 50,998 | |
Trustees’ fees and expenses | | | 11,946 | | | | 12,762 | |
Interest expense | | | 0 | | | | 196 | |
Other fees and expenses | | | 12,099 | | | | 17,432 | |
| | | | |
Total expenses | | | 7,884,944 | | | | 12,649,825 | |
Less: Fee waivers and/or expense reimbursements | | | (28,076 | ) | | | (26,755 | ) |
| | | | |
Net expenses | | | 7,856,868 | | | | 12,623,070 | |
| | | | |
Net investment income (loss) | | | 3,555,221 | | | | 4,103,910 | |
| | | | |
| | |
REALIZED AND UNREALIZED GAINS (LOSSES) ON INVESTMENTS | | | | | | | | |
| | |
Net realized gains (losses) on: | | | | | | | | |
Unaffiliated Underlying Funds | | | (2,899,285 | ) | | | (5,620,203 | ) |
Affiliated Underlying Funds | | | 2,529,182 | | | | 6,248,403 | |
Futures transactions | | | 1,154,418 | | | | 4,016,277 | |
Capital gain distributions from unaffiliated Underlying Funds | | | 5,508,933 | | | | 15,227,361 | |
Capital gain distributions from affiliated Underlying Funds | | | 3,400,243 | | | | 10,512,134 | |
Securities transactions allocated from affiliated Master Portfolios | | | 2,119,669 | | | | 2,665,697 | |
| | | | |
Net realized gains on investments | | | 11,813,160 | | | | 33,049,669 | |
| | | | |
|
Net change in unrealized gains (losses) on: | |
Unaffiliated Underlying Funds | | | (12,623,549 | ) | | | (32,029,937 | ) |
Affiliated Underlying Funds | | | (6,425,127 | ) | | | (17,917,730 | ) |
Futures transactions | | | (101,264 | ) | | | (329,989 | ) |
Securities transactions allocated from affiliated Master Portfolios | | | (2,630,630 | ) | | | (6,700,077 | ) |
| | | | |
Net change in unrealized gains (losses) on investments | | | (21,780,570 | ) | | | (56,977,733 | ) |
| | | | |
Net realized and unrealized gains (losses) on investments | | | (9,967,410 | ) | | | (23,928,064 | ) |
| | | | |
Net decrease in net assets resulting from operations | | $ | (6,412,189 | ) | | $ | (19,824,154 | ) |
| | | | |
| | |
* Net of foreign dividend withholding taxes allocated from affiliated Master Portfolios in the amount of | | | $11,833 | | | | $37,563 | |
The accompanying notes are an integral part of these financial statements.
| | | | | | |
| Statements of operations—year ended May 31, 2016 | | Wells Fargo WealthBuilder Portfolios | | | 43 | |
| | | | | | | | | | | | | | |
WealthBuilder
Growth Balanced
Portfolio | | | WealthBuilder
Growth Allocation
Portfolio | | | WealthBuilder Equity
Portfolio | | | WealthBuilder Tactical Equity Portfolio | |
| | | |
| | | | | | | | | | | | | | |
| $ | 13,038,158 | | | $ | 5,160,866 | | | $ | 1,241,238 | | | $ | 3,836,613 | |
| | 1,508,851 | | | | 384,611 | | | | 84,425 | | | | 244,064 | |
| | 2,461,446 | | | | 449,304 | | | | 0 | | | | 0 | |
| | 1,109,600 | | | | 655,174 | | | | 228,930 | | | | 807,916 | |
| | 23,078 | | | | 7,212 | | | | 1,495 | | | | 5,339 | |
| | 109,230 | | | | 62,868 | | | | 18,834 | | | | 77,198 | |
| | 3,866 | | | | 1,899 | | | | 0 | | | | 1,060 | |
| | (1,107,173 | ) | | | (488,014 | ) | | | (137,865 | ) | | | (512,282 | ) |
| | 15,227 | | | | 2,781 | | | | 0 | | | | 0 | |
| | |
| | 17,162,283 | | | | 6,236,701 | | | | 1,437,057 | | | | 4,459,908 | |
| | |
| | | |
| | | | | | | | | | | | | | |
| | 2,445,721 | | | | 1,083,548 | | | | 345,126 | | | | 1,069,051 | |
| | 2,097,321 | | | | 928,715 | | | | 296,034 | | | | 916,634 | |
| | 2,446,722 | | | | 1,083,548 | | | | 345,126 | | | | 1,068,091 | |
| | 7,340,937 | | | | 3,250,645 | | | | 1,035,377 | | | | 3,207,154 | |
| | 85,427 | | | | 59,471 | | | | 42,520 | | | | 53,491 | |
| | 32,563 | | | | 32,559 | | | | 33,397 | | | | 33,010 | |
| | 68,329 | | | | 48,502 | | | | 30,445 | | | | 45,080 | |
| | 76,681 | | | | 42,745 | | | | 10,541 | | | | 27,466 | |
| | 12,945 | | | | 12,945 | | | | 19,716 | | | | 19,693 | |
| | 0 | | | | 0 | | | | 0 | | | | 0 | |
| | 16,153 | | | | 9,507 | | | | 9,828 | | | | 12,146 | |
| | |
| | 14,622,799 | | | | 6,552,185 | | | | 2,168,110 | | | | 6,451,816 | |
| | (32,007 | ) | | | (50,895 | ) | | | (97,356 | ) | | | (41,199 | ) |
| | |
| | 14,590,792 | | | | 6,501,290 | | | | 2,070,754 | | | | 6,410,617 | |
| | |
| | 2,571,491 | | | | (264,589 | ) | | | (633,697 | ) | | | (1,950,709 | ) |
| | |
| | | |
| | | | | | | | | | | | | | |
| | | |
| | | | | | | | | | | | | | |
| | (6,126,547 | ) | | | (3,540,408 | ) | | | (653,058 | ) | | | (2,172,860 | ) |
| | 11,117,761 | | | | 5,121,030 | | | | 2,937,910 | | | | 7,459,886 | |
| | 3,538,361 | | | | 1,311,829 | | | | 0 | | | | (1,026,916 | ) |
| | 24,764,396 | | | | 14,060,805 | | | | 5,266,620 | | | | 16,693,017 | |
| | 18,074,387 | | | | 10,494,175 | | | | 4,166,746 | | | | 12,703,560 | |
| | 2,557,938 | | | | 400,333 | | | | 679,628 | | | | 1,235,698 | |
| | |
| | 53,926,296 | | | | 27,847,764 | | | | 12,397,846 | | | | 34,892,385 | |
| | |
| | | |
| | | | | | | | | | | | | | |
| | (50,548,022 | ) | | | (27,039,330 | ) | | | (9,779,876 | ) | | | (29,748,400 | ) |
| | (30,380,758 | ) | | | (16,953,094 | ) | | | (7,836,049 | ) | | | (22,507,470 | ) |
| | (729,291 | ) | | | (504,273 | ) | | | 0 | | | | (832,133 | ) |
| | (10,855,595 | ) | | | (5,921,658 | ) | | | (2,644,250 | ) | | | (8,206,963 | ) |
| | |
| | (92,513,666 | ) | | | (50,418,355 | ) | | | (20,260,175 | ) | | | (61,294,966 | ) |
| | |
| | (38,587,370 | ) | | | (22,570,591 | ) | | | (7,862,329 | ) | | | (26,402,581 | ) |
| | |
| $ | (36,015,879 | ) | | $ | (22,835,180 | ) | | $ | (8,496,026 | ) | | $ | (28,353,290 | ) |
| | |
| | | |
| | $65,186 | | | | $38,406 | | | | $14,997 | | | | $47,180 | |
The accompanying notes are an integral part of these financial statements.
| | | | |
| 44 | | Wells Fargo WealthBuilder Portfolios | | Statements of changes in net assets |
| | | | | | | | | | | | | | | | |
| | | WealthBuilder Conservative Allocation Portfolio | |
| | | Year ended May 31, 2016 | | | Year ended May 31, 2015 | |
| | | | |
Operations | | | | | | | | | | | | | | | | |
Net investment income | | | | | | $ | 3,555,221 | | | | | | | $ | 1,894,442 | |
Net realized gains on investments | | | | | | | 11,813,160 | | | | | | | | 18,152,708 | |
Net change in unrealized gains (losses) on investments | | | | | | | (21,780,570 | ) | | | | | | | (10,251,043 | ) |
| | | | |
Net increase (decrease) in net assets resulting from operations | | | | | | | (6,412,189 | ) | | | | | | | 9,796,107 | |
| | | | |
| | | | |
Distributions to shareholders from | | | | | | | | | | | | | | | | |
Net investment income | | | | | | | (4,111,475 | ) | | | | | | | (2,454,091 | ) |
Net realized gains | | | | | | | (13,989,868 | ) | | | | | | | (12,035,964 | ) |
| | | | |
Total distributions to shareholders | | | | | | | (18,101,343 | ) | | | | | | | (14,490,055 | ) |
| | | | |
| | | | |
Capital share transactions | | | Shares | | | | | | | | Shares | | | | | |
Proceeds from shares sold | | | 11,262,600 | | | | 116,710,681 | | | | 10,584,440 | | | | 114,883,902 | |
Reinvestment of distributions | | | 1,769,710 | | | | 18,074,814 | | | | 1,349,657 | | | | 14,475,121 | |
Payment for shares redeemed | | | (12,671,692 | ) | | | (131,499,027 | ) | | | (14,783,524 | ) | | | (160,542,713 | ) |
| | | | |
Net increase (decrease) in net assets resulting from capital share transactions | | | | | | | 3,286,468 | | | | | | | | (31,183,690 | ) |
| | | | |
Total decrease in net assets | | | | | | | (21,227,064 | ) | | | | | | | (35,877,638 | ) |
| | | | |
| | | | |
Net assets | | | | | | | | | | | | | | | | |
Beginning of period | | | | | | | 545,058,962 | | | | | | | | 580,936,600 | |
| | | | |
End of period | | | | | | $ | 523,831,898 | | | | | | | $ | 545,058,962 | |
| | | | |
Undistributed net investment income | | | | | | $ | 5,393 | | | | | | | $ | 83,465 | |
| | | | |
The accompanying notes are an integral part of these financial statements.
| | | | | | |
| Statements of changes in net assets | | Wells Fargo WealthBuilder Portfolios | | | 45 | |
| | | | | | | | | | | | | | | | |
| | | WealthBuilder Moderate Balanced Portfolio | |
| | | Year ended May 31, 2016 | | | Year ended May 31, 2015 | |
| | | | |
Operations | | | | | | | | | | | | | | | | |
Net investment income | | | | | | $ | 4,103,910 | | | | | | | $ | 1,846,584 | |
Net realized gains on investments | | | | | | | 33,049,669 | | | | | | | | 46,273,697 | |
Net change in unrealized gains (losses) on investments | | | | | | | (56,977,733 | ) | | | | | | | (18,591,731 | ) |
| | | | |
Net increase (decrease) in net assets resulting from operations | | | | | | | (19,824,154 | ) | | | | | | | 29,528,550 | |
| | | | |
| | | | |
Distributions to shareholders from | | | | | | | | | | | | | | | | |
Net investment income | | | | | | | (5,066,403 | ) | | | | | | | (4,792,750 | ) |
Net realized gains | | | | | | | (33,712,193 | ) | | | | | | | (25,821,821 | ) |
| | | | |
Total distributions to shareholders | | | | | | | (38,778,596 | ) | | | | | | | (30,614,571 | ) |
| | | | |
| | | | |
Capital share transactions | | | Shares | | | | | | | | Shares | | | | | |
Proceeds from shares sold | | | 12,731,081 | | | | 147,098,031 | | | | 14,751,165 | | | | 179,406,067 | |
Reinvestment of distributions | | | 3,437,045 | | | | 38,720,686 | | | | 2,554,487 | | | | 30,574,626 | |
Payment for shares redeemed | | | (16,329,458 | ) | | | (187,173,600 | ) | | | (15,061,182 | ) | | | (183,046,028 | ) |
| | | | |
Net increase (decrease) in net assets resulting from capital share transactions | | | | | | | (1,354,883 | ) | | | | | | | 26,934,665 | |
| | | | |
Total increase (decrease) in net assets | | | | | | | (59,957,633 | ) | | | | | | | 25,848,644 | |
| | | | |
| | | | |
Net assets | | | | | | | | | | | | | | | | |
Beginning of period | | | | | | | 893,175,276 | | | | | | | | 867,326,632 | |
| | | | |
End of period | | | | | | $ | 833,217,643 | | | | | | | $ | 893,175,276 | |
| | | | |
Undistributed net investment income | | | | | | $ | 194,432 | | | | | | | $ | 8,089 | |
| | | | |
The accompanying notes are an integral part of these financial statements.
| | | | |
| 46 | | Wells Fargo WealthBuilder Portfolios | | Statements of changes in net assets |
| | | | | | | | | | | | | | | | |
| | | WealthBuilder Growth Balanced Portfolio | |
| | | Year ended May 31, 2016 | | | Year ended May 31, 2015 | |
| | | | |
Operations | | | | | | | | | | | | | | | | |
Net investment income | | | | | | $ | 2,571,491 | | | | | | | $ | 624,272 | |
Net realized gains on investments | | | | | | | 53,926,296 | | | | | | | | 71,458,770 | |
Net change in unrealized gains (losses) on investments | | | | | | | (92,513,666 | ) | | | | | | | (25,710,997 | ) |
| | | | |
Net increase (decrease) in net assets resulting from operations | | | | | | | (36,015,879 | ) | | | | | | | 46,372,045 | |
| | | | |
| | | | |
Distributions to shareholders from | | | | | | | | | | | | | | | | |
Net investment income | | | | | | | (4,755,991 | ) | | | | | | | (7,084,736 | ) |
Net realized gains | | | | | | | (47,555,710 | ) | | | | | | | (31,685,911 | ) |
| | | | |
Total distributions to shareholders | | | | | | | (52,311,701 | ) | | | | | | | (38,770,647 | ) |
| | | | |
| | | | |
Capital share transactions | | | Shares | | | | | | | | Shares | | | | | |
Proceeds from shares sold | | | 11,752,345 | | | | 160,180,764 | | | | 13,462,004 | | | | 193,585,803 | |
Reinvestment of distributions | | | 3,970,170 | | | | 52,269,033 | | | | 2,738,063 | | | | 38,748,055 | |
Payment for shares redeemed | | | (13,141,127 | ) | | | (175,600,976 | ) | | | (10,990,169 | ) | | | (158,117,020 | ) |
| | | | |
Net increase in net assets resulting from capital share transactions | | | | | | | 36,848,821 | | | | | | | | 74,216,838 | |
| | | | |
Total increase (decrease) in net assets | | | | | | | (51,478,759 | ) | | | | | | | 81,818,236 | |
| | | | |
| | | | |
Net assets | | | | | | | | | | | | | | | | |
Beginning of period | | | | | | | 1,018,410,937 | | | | | | | | 936,592,701 | |
| | | | |
End of period | | | | | | $ | 966,932,178 | | | | | | | $ | 1,018,410,937 | |
| | | | |
Undistributed (overdistributed) net investment income | | | | | | $ | (253,996 | ) | | | | | | $ | 64,025 | |
| | | | |
The accompanying notes are an integral part of these financial statements.
| | | | | | |
| Statements of changes in net assets | | Wells Fargo WealthBuilder Portfolios | | | 47 | |
| | | | | | | | | | | | | | | | |
| | | WealthBuilder Growth Allocation Portfolio | |
| | | Year ended May 31, 2016 | | | Year ended May 31, 2015 | |
| | | | |
Operations | | | | | | | | | | | | | | | | |
Net investment loss | | | | | | $ | (264,589 | ) | | | | | | $ | (833,169 | ) |
Net realized gains on investments | | | | | | | 27,847,764 | | | | | | | | 36,094,950 | |
Net change in unrealized gains (losses) on investments | | | | | | | (50,418,355 | ) | | | | | | | (9,975,831 | ) |
| | | | |
Net increase (decrease) in net assets resulting from operations | | | | | | | (22,835,180 | ) | | | | | | | 25,285,950 | |
| | | | |
| | | | |
Distributions to shareholders from | | | | | | | | | | | | | | | | |
Net investment income | | | | | | | (1,351,047 | ) | | | | | | | (3,617,950 | ) |
Net realized gains | | | | | | | (24,150,116 | ) | | | | | | | (17,215,777 | ) |
| | | | |
Total distributions to shareholders | | | | | | | (25,501,163 | ) | | | | | | | (20,833,727 | ) |
| | | | |
| | | | |
Capital share transactions | | | Shares | | | | | | | | Shares | | | | | |
Proceeds from shares sold | | | 5,396,148 | | | | 74,412,404 | | | | 5,982,612 | | | | 88,279,600 | |
Reinvestment of distributions | | | 1,913,338 | | | | 25,485,665 | | | | 1,439,960 | | | | 20,806,021 | |
Payment for shares redeemed | | | (5,456,680 | ) | | | (73,073,460 | ) | | | (4,390,446 | ) | | | (64,636,176 | ) |
| | | | |
Net increase in net assets resulting from capital share transactions | | | | | | | 26,824,609 | | | | | | | | 44,449,445 | |
| | | | |
Total increase (decrease) in net assets | | | | | | | (21,511,734 | ) | | | | | | | 48,901,668 | |
| | | | |
| | | | |
Net assets | | | | | | | | | | | | | | | | |
Beginning of period | | | | | | | 451,139,330 | | | | | | | | 402,237,662 | |
| | | | |
End of period | | | | | | $ | 429,627,596 | | | | | | | $ | 451,139,330 | |
| | | | |
Accumulated net investment loss | | | | | | $ | (827,470 | ) | | | | | | $ | (299,681 | ) |
| | | | |
The accompanying notes are an integral part of these financial statements.
| | | | |
| 48 | | Wells Fargo WealthBuilder Portfolios | | Statements of changes in net assets |
| | | | | | | | | | | | | | | | |
| | | WealthBuilder Equity Portfolio | |
| | | Year ended
May 31, 2016 | | | Year ended
May 31, 2015 | |
| | | | |
Operations | | | | | | | | | | | | | | | | |
Net investment loss | | | | | | $ | (633,697 | ) | | | | | | $ | (633,406 | ) |
Net realized gains on investments | | | | | | | 12,397,846 | | | | | | | | 14,978,752 | |
Net change in unrealized gains (losses) on investments | | | | | | | (20,260,175 | ) | | | | | | | (4,136,119 | ) |
| | | | |
Net increase (decrease) in net assets resulting from operations | | | | | | | (8,496,026 | ) | | | | | | | 10,209,227 | |
| | | | |
| | | | |
Capital share transactions | | | Shares | | | | | | | | Shares | | | | | |
Proceeds from shares sold | | | 1,036,835 | | | | 15,730,212 | | | | 1,596,485 | | | | 24,451,434 | |
Payment for shares redeemed | | | (1,479,012 | ) | | | (21,987,898 | ) | | | (1,564,539 | ) | | | (24,079,607 | ) |
| | | | |
Net increase (decrease) in net assets resulting from capital share transactions | | | | | | | (6,257,686 | ) | | | | | | | 371,827 | |
| | | | |
Total increase (decrease) in net assets | | | | | | | (14,753,712 | ) | | | | | | | 10,581,054 | |
| | | | |
| | | | |
Net assets | | | | | | | | | | | | | | | | |
Beginning of period | | | | | | | 148,717,620 | | | | | | | | 138,136,566 | |
| | | | |
End of period | | | | | | $ | 133,963,908 | | | | | | | $ | 148,717,620 | |
| | | | |
Undistributed (accumulated) net investment income (loss) | | | | | | $ | 249 | | | | | | | $ | (226,350 | ) |
| | | | |
The accompanying notes are an integral part of these financial statements.
| | | | | | |
| Statements of changes in net assets | | Wells Fargo WealthBuilder Portfolios | | | 49 | |
| | | | | | | | | | | | | | | | |
| | | WealthBuilder Tactical Equity Portfolio | |
| | | Year ended May 31, 2016 | | | | | | Year ended
May 31, 2015 | |
| | | | |
Operations | | | | | | | | | | | | | | | | |
Net investment loss | | | | | | $ | (1,950,709 | ) | | | | | | $ | (1,889,760 | ) |
Net realized gains on investments | | | | | | | 34,892,385 | | | | | | | | 44,444,424 | |
Net change in unrealized gains (losses) on investments | | | | | | | (61,294,966 | ) | | | | | | | (11,412,075 | ) |
| | | | |
Net increase (decrease) in net assets resulting from operations | | | | | | | (28,353,290 | ) | | | | | | | 31,142,589 | |
| | | | |
| | | | |
Capital share transactions | | | Shares | | | | | | | | Shares | | | | | |
Proceeds from shares sold | | | 3,205,454 | | | | 58,573,911 | | | | 4,276,140 | | | | 79,661,839 | |
Payment for shares redeemed | | | (3,286,179 | ) | | | (59,408,002 | ) | | | (4,359,610 | ) | | | (80,457,955 | ) |
| | | | |
Net decrease in net assets resulting from capital share transactions | | | | | | | (834,091 | ) | | | | | | | (796,116 | ) |
| | | | |
Total increase (decrease) in net assets | | | | | | | (29,187,381 | ) | | | | | | | 30,346,473 | |
| | | | |
| | | | |
Net assets | | | | | | | | | | | | | | | | |
Beginning of period | | | | | | | 452,295,968 | | | | | | | | 421,949,495 | |
| | | | |
End of period | | | | | | $ | 423,108,587 | | | | | | | $ | 452,295,968 | |
| | | | |
Accumulated net investment loss | | | | | | $ | (1,656,016 | ) | | | | | | $ | (998,320 | ) |
| | | | |
The accompanying notes are an integral part of these financial statements.
| | | | |
| 50 | | Wells Fargo WealthBuilder Portfolios | | Financial highlights |
| | | | | | | | | | | | | | | | | | | | | | | | |
| | | Beginning net asset value per share | | | Net investment income (loss) | | | Net realized and unrealized gains (losses) on investments | | | Distributions from net investment
income | | | Distributions from net realized gains | | | Ending net asset value per share | |
| | | | | | |
WealthBuilder Conservative Allocation Portfolio | | | | | | | | | | | | | | | | | | | | | | | | |
Year ended May 31, 2016 | | $ | 10.82 | | | | 0.07 | | | | (0.20 | ) | | | (0.08 | ) | | | (0.28 | ) | | $ | 10.33 | |
Year ended May 31, 2015 | | $ | 10.92 | | | | 0.04 | | | | 0.15 | | | | (0.05 | ) | | | (0.24 | ) | | $ | 10.82 | |
Year ended May 31, 2014 | | $ | 10.95 | | | | 0.03 | | | | 0.42 | | | | (0.05 | ) | | | (0.43 | ) | | $ | 10.92 | |
Year ended May 31, 2013 | | $ | 10.57 | | | | 0.06 | | | | 0.59 | | | | (0.08 | ) | | | (0.19 | ) | | $ | 10.95 | |
Year ended May 31, 2012 | | $ | 11.02 | | | | 0.16 | | | | (0.20 | ) | | | (0.21 | ) | | | (0.20 | ) | | $ | 10.57 | |
| | | | | | |
WealthBuilder Moderate Balanced Portfolio | | | | | | | | | | | | | | | | | | | | | | | | |
Year ended May 31, 2016 | | $ | 12.19 | | | | 0.05 | | | | (0.30 | ) | | | (0.07 | ) | | | (0.47 | ) | | $ | 11.40 | |
Year ended May 31, 2015 | | $ | 12.21 | | | | 0.03 | | | | 0.39 | | | | (0.07 | ) | | | (0.37 | ) | | $ | 12.19 | |
Year ended May 31, 2014 | | $ | 12.03 | | | | 0.02 | | | | 0.91 | | | | (0.04 | ) | | | (0.71 | ) | | $ | 12.21 | |
Year ended May 31, 2013 | | $ | 10.96 | | | | 0.04 | 3 | | | 1.21 | | | | (0.06 | ) | | | (0.12 | ) | | $ | 12.03 | |
Year ended May 31, 2012 | | $ | 11.50 | | | | 0.13 | 3 | | | (0.48 | ) | | | (0.19 | ) | | | (0.00 | )4 | | $ | 10.96 | |
| | | | | | |
WealthBuilder Growth Balanced Portfolio | | | | | | | | | | | | | | | | | | | | | | | | |
Year ended May 31, 2016 | | $ | 14.52 | | | | 0.03 | | | | (0.53 | ) | | | (0.06 | ) | | | (0.67 | ) | | $ | 13.29 | |
Year ended May 31, 2015 | | $ | 14.42 | | | | 0.01 | | | | 0.67 | | | | (0.10 | ) | | | (0.48 | ) | | $ | 14.52 | |
Year ended May 31, 2014 | | $ | 12.90 | | | | 0.01 | | | | 1.55 | | | | (0.04 | ) | | | 0.00 | | | $ | 14.42 | |
Year ended May 31, 2013 | | $ | 10.97 | | | | 0.01 | | | | 1.95 | | | | (0.03 | ) | | | 0.00 | | | $ | 12.90 | |
Year ended May 31, 2012 | | $ | 11.82 | | | | 0.09 | | | | (0.82 | ) | | | (0.12 | ) | | | 0.00 | | | $ | 10.97 | |
| | | | | | |
WealthBuilder Growth Allocation Portfolio | | | | | | | | | | | | | | | | | | | | | | | | |
Year ended May 31, 2016 | | $ | 14.92 | | | | (0.01 | ) | | | (0.71 | ) | | | (0.04 | ) | | | (0.77 | ) | | $ | 13.39 | |
Year ended May 31, 2015 | | $ | 14.78 | | | | (0.02 | ) | | | 0.89 | | | | (0.12 | ) | | | (0.61 | ) | | $ | 14.92 | |
Year ended May 31, 2014 | | $ | 13.08 | | | | (0.03 | ) | | | 1.89 | | | | (0.00 | )4 | | | (0.16 | ) | | $ | 14.78 | |
Year ended May 31, 2013 | | $ | 10.87 | | | | (0.01 | ) | | | 2.23 | | | | (0.01 | ) | | | 0.00 | | | $ | 13.08 | |
Year ended May 31, 2012 | | $ | 11.83 | | | | 0.05 | 3 | | | (0.94 | ) | | | (0.07 | ) | | | 0.00 | | | $ | 10.87 | |
| | | | | | |
WealthBuilder Equity Portfolio | | | | | | | | | | | | | | | | | | | | | | | | |
Year ended May 31, 2016 | | $ | 16.02 | | | | (0.07 | ) | | | (0.80 | ) | | | 0.00 | | | | 0.00 | | | $ | 15.15 | |
Year ended May 31, 2015 | | $ | 14.93 | | | | (0.07 | ) | | | 1.16 | | | | 0.00 | | | | 0.00 | | | $ | 16.02 | |
Year ended May 31, 2014 | | $ | 12.82 | | | | (0.08 | ) | | | 2.19 | | | | 0.00 | | | | 0.00 | | | $ | 14.93 | |
Year ended May 31, 2013 | | $ | 10.34 | | | | (0.05 | ) | | | 2.53 | | | | 0.00 | | | | 0.00 | | | $ | 12.82 | |
Year ended May 31, 2012 | | $ | 11.45 | | | | (0.04 | ) | | | (1.07 | ) | | | 0.00 | | | | 0.00 | | | $ | 10.34 | |
| | | | | | |
WealthBuilder Tactical Equity Portfolio | | | | | | | | | | | | | | | | | | | | | | | | |
Year ended May 31, 2016 | | $ | 19.44 | | | | (0.08 | ) | | | (1.11 | ) | | | 0.00 | | | | 0.00 | | | $ | 18.25 | |
Year ended May 31, 2015 | | $ | 18.07 | | | | (0.08 | ) | | | 1.45 | | | | 0.00 | | | | 0.00 | | | $ | 19.44 | |
Year ended May 31, 2014 | | $ | 15.61 | | | | (0.08 | ) | | | 2.54 | | | | 0.00 | | | | 0.00 | | | $ | 18.07 | |
Year ended May 31, 2013 | | $ | 13.12 | | | | (0.07 | ) | | | 2.58 | | | | (0.02 | ) | | | 0.00 | | | $ | 15.61 | |
Year ended May 31, 2012 | | $ | 13.89 | | | | (0.08 | )3 | | | (0.69 | ) | | | 0.00 | | | | 0.00 | | | $ | 13.12 | |
| 1 | Ratios do not reflect net expenses allocated from the affiliated Master Portfolios. Including net expenses allocated from the affiliated Master Portfolios, the expense ratios would be increased by the following amounts: |
| | | | | | | | | | | | | | | | | | | | |
| | | Year ended May 31 | |
| | | 2016 | | | 2015 | | | 2014 | | | 2013 | | | 2012 | |
WealthBuilder Conservative Allocation Portfolio | | | 0.11 | % | | | 0.11 | % | | | 0.09 | % | | | 0.10 | % | | | 0.10 | % |
WealthBuilder Moderate Balanced Portfolio | | | 0.11 | % | | | 0.11 | % | | | 0.10 | % | | | 0.12 | % | | | 0.11 | % |
WealthBuilder Growth Balanced Portfolio | | | 0.11 | % | | | 0.11 | % | | | 0.12 | % | | | 0.15 | % | | | 0.14 | % |
WealthBuilder Growth Allocation Portfolio | | | 0.11 | % | | | 0.11 | % | | | 0.12 | % | | | 0.15 | % | | | 0.15 | % |
WealthBuilder Equity Portfolio | | | 0.10 | % | | | 0.10 | % | | | 0.12 | % | | | 0.21 | % | | | 0.21 | % |
WealthBuilder Tactical Equity Portfolio | | | 0.12 | % | | | 0.12 | % | | | 0.13 | % | | | 0.17 | % | | | 0.16 | % |
| 2 | Total return calculations do not include any sales charges. |
| 3 | Calculated based upon average shares outstanding |
| 4 | Amount is less than $0.005. |
The accompanying notes are an integral part of these financial statements.
| | | | | | |
| Financial highlights | | Wells Fargo WealthBuilder Portfolios | | | 51 | |
| | | | | | | | | | | | | | | | | | | | | | |
| Ratio to average net assets (annualized) | | | Total return2 | | | Portfolio turnover rate | | | Net assets at end of period (000s omitted) | |
Net investment income (loss) | | | Gross expenses1 | | | Net expenses1 | | | | |
| | | | | |
| | | | | | | | | | | | | | | | | | | | | | | |
| | 0.68 | % | | | 1.51 | % | | | 1.50 | % | | | (1.11 | )% | | | 198 | % | | $ | 523,832 | |
| | 0.34 | % | | | 1.55 | % | | | 1.50 | % | | | 1.75 | % | | | 169 | % | | $ | 545,059 | |
| | 0.32 | % | | | 1.55 | % | | | 1.50 | % | | | 4.19 | % | | | 139 | % | | $ | 580,937 | |
| | 0.53 | % | | | 1.54 | % | | | 1.50 | % | | | 6.19 | % | | | 128 | % | | $ | 659,977 | |
| | 1.51 | % | | | 1.54 | % | | | 1.50 | % | | | (0.32 | )% | | | 176 | % | | $ | 662,092 | |
| | | | | |
| | | | | | | | | | | | | | | | | | | | | | | |
| | 0.48 | % | | | 1.49 | % | | | 1.49 | % | | | (2.02 | )% | | | 150 | % | | $ | 833,218 | |
| | 0.21 | % | | | 1.55 | % | | | 1.50 | % | | | 3.44 | % | | | 129 | % | | $ | 893,175 | |
| | 0.17 | % | | | 1.54 | % | | | 1.50 | % | | | 7.94 | % | | | 110 | % | | $ | 867,327 | |
| | 0.34 | % | | | 1.54 | % | | | 1.50 | % | | | 11.42 | % | | | 115 | % | | $ | 799,251 | |
| | 1.20 | % | | | 1.54 | % | | | 1.50 | % | | | (2.96 | )% | | | 145 | % | | $ | 709,801 | |
| | | | | |
| | | | | | | | | | | | | | | | | | | | | | | |
| | 0.26 | % | | | 1.49 | % | | | 1.49 | % | | | (3.39 | )% | | | 100 | % | | $ | 966,932 | |
| | 0.06 | % | | | 1.54 | % | | | 1.50 | % | | | 4.89 | % | | | 89 | % | | $ | 1,018,411 | |
| | 0.04 | % | | | 1.54 | % | | | 1.50 | % | | | 12.07 | % | | | 94 | % | | $ | 936,593 | |
| | 0.06 | % | | | 1.54 | % | | | 1.50 | % | | | 17.85 | % | | | 117 | % | | $ | 788,285 | |
| | 0.84 | % | | | 1.54 | % | | | 1.50 | % | | | (6.17 | )% | | | 131 | % | | $ | 689,816 | |
| | | | | |
| | | | | | | | | | | | | | | | | | | | | | | |
| | (0.06 | )% | | | 1.51 | % | | | 1.50 | % | | | (4.79 | )% | | | 59 | % | | $ | 429,628 | |
| | (0.20 | )% | | | 1.55 | % | | | 1.50 | % | | | 6.14 | % | | | 53 | % | | $ | 451,139 | |
| | (0.19 | )% | | | 1.57 | % | | | 1.50 | % | | | 14.28 | % | | | 60 | % | | $ | 402,238 | |
| | (0.13 | )% | | | 1.57 | % | | | 1.50 | % | | | 20.39 | % | | | 98 | % | | $ | 324,723 | |
| | 0.49 | % | | | 1.57 | % | | | 1.50 | % | | | (7.47 | )% | | | 96 | % | | $ | 276,657 | |
| | | | | |
| | | | | | | | | | | | | | | | | | | | | | | |
| | (0.46 | )% | | | 1.57 | % | | | 1.50 | % | | | (5.43 | )% | | | 26 | % | | $ | 133,964 | |
| | (0.46 | )% | | | 1.61 | % | | | 1.50 | % | | | 7.30 | % | | | 24 | % | | $ | 148,718 | |
| | (0.53 | )% | | | 1.61 | % | | | 1.50 | % | | | 16.46 | % | | | 26 | % | | $ | 138,137 | |
| | (0.38 | )% | | | 1.63 | % | | | 1.50 | % | | | 23.98 | % | | | 44 | % | | $ | 121,888 | |
| | (0.39 | )% | | | 1.60 | % | | | 1.50 | % | | | (9.69 | )% | | | 24 | % | | $ | 109,727 | |
| | | | | |
| | | | | | | | | | | | | | | | | | | | | | | |
| | (0.46 | )% | | | 1.51 | % | | | 1.50 | % | | | (6.12 | )% | | | 27 | % | | $ | 423,109 | |
| | (0.44 | )% | | | 1.55 | % | | | 1.50 | % | | | 7.58 | % | | | 27 | % | | $ | 452,296 | |
| | (0.45 | )% | | | 1.56 | % | | | 1.50 | % | | | 15.76 | % | | | 23 | % | | $ | 421,949 | |
| | (0.49 | )% | | | 1.56 | % | | | 1.50 | % | | | 19.16 | % | | | 67 | % | | $ | 371,334 | |
| | (0.58 | )% | | | 1.56 | % | | | 1.50 | % | | | (5.54 | )% | | | 31 | % | | $ | 346,832 | |
The accompanying notes are an integral part of these financial statements.
| | | | |
| 52 | | Wells Fargo WealthBuilder Portfolios | | Notes to financial statements |
1. ORGANIZATION
Wells Fargo Funds Trust (the “Trust”), a Delaware statutory trust organized on March 10, 1999, is an open-end management investment company registered under the Investment Company Act of 1940, as amended (the “1940 Act”). As an investment company, the Trust follows the accounting and reporting guidance in Financial Accounting Standards Board (“FASB”) Accounting Standards Codification Topic 946, Financial Services – Investment Companies. These financial statements report on the following funds: Wells Fargo WealthBuilder Conservative Allocation Portfolio (“WealthBuilder Conservative Allocation Portfolio”), Wells Fargo WealthBuilder Moderate Balanced Portfolio (“WealthBuilder Moderate Balanced Portfolio”), Wells Fargo WealthBuilder Growth Balanced Portfolio (“WealthBuilder Growth Balanced Portfolio” ), Wells Fargo WealthBuilder Growth Allocation Portfolio (“WealthBuilder Growth Allocation Portfolio” ), Wells Fargo WealthBuilder Equity Portfolio ("WealthBuilder Equity Portfolio") and Wells Fargo WealthBuilder Tactical Equity Portfolio (“WealthBuilder Tactical Equity Portfolio” ) (each, a “Portfolio”, collectively, the “Portfolios”). Each Portfolio is a diversified series of the Trust.
Each Portfolio is a fund-of-funds that may invest in various affiliated mutual funds, unaffiliated mutual funds and exchange-traded funds (collectively, the “Underlying Funds”) to pursue its investment objective. The Underlying Funds incur separate expenses in seeking to achieve their investment objectives. The investment in affiliated funds may also include investments in one or more separate diversified portfolios (each, an “affiliated Master Portfolio”, collectively, the “affiliated Master Portfolios”) of Wells Fargo Master Trust, a registered open-end management investment company. Each affiliated Master Portfolio directly acquires portfolio securities, and a Portfolio investing in an affiliated Master Portfolio acquires an indirect interest in those securities. Each Portfolio accounts for its investment in the affiliated Master Portfolios as partnership investments and records on a daily basis its share of the affiliated Master Portfolio’s income, expense and realized and unrealized gains and losses. The financial statements and financial highlights for the Underlying Funds are presented in separate financial statements and may be obtained by contacting Investor Services for the Wells Fargo Funds or by contacting the servicing agent of the unaffiliated mutual funds.
2. SIGNIFICANT ACCOUNTING POLICIES
The following significant accounting policies, which are consistently followed in the preparation of the financial statements of each Portfolio, are in conformity with U.S. generally accepted accounting principles which require management to make estimates and assumptions that affect the reported amounts of assets and liabilities, disclosure of contingent assets and liabilities at the date of the financial statements, and the reported amounts of revenues and expenses during the reporting period. Actual results could differ from those estimates.
Securities valuation
All investments are valued each business day as of the close of regular trading on the New York Stock Exchange (generally 4 p.m. Eastern Time), although the Portfolios may deviate from this calculation time under unusual or unexpected circumstances.
Investments in mutual funds are valued at net asset per share as reported by the Underlying Funds as of the close of the regular trading on the New York Stock Exchange on each day the exchange is open for trading. Investments in affiliated Master Portfolios are valued daily based on each Portfolio’s proportionate share of each affiliated Master Portfolio’s net assets, which are also valued daily.
Equity securities and futures that are listed on a foreign or domestic exchange or market are valued at the official closing price or, if none, the last sales price. If no sale occurs on the principal exchange or market that day, the prior day’s price will be deemed “stale” and a fair value price will be determined in accordance with the Portfolio’s Valuation Procedures.
Debt securities are valued at the evaluated bid price provided by an independent pricing service or, if a reliable price is not available, the quoted bid price from an independent broker-dealer.
Investments which are not valued using any of the methods discussed above are valued at their fair value, as determined in good faith by the Board of Trustees of the Portfolios. The Board of Trustees has established a Valuation Committee comprised of the Trustees and has delegated to it the authority to take any actions regarding the valuation of portfolio securities that the Valuation Committee deems necessary or appropriate, including determining the fair value of portfolio securities, unless the determination has been delegated to the Management Valuation Team of Wells Fargo Funds Management, LLC (“Funds Management”). The Board of Trustees retains the authority to make or ratify any valuation decisions or approve any changes to the Valuation Procedures as it deems appropriate. On a quarterly basis, the Board of Trustees receives reports on any valuation actions taken by the Valuation Committee or the Management Valuation Team which may include items for ratification.
| | | | | | |
| Notes to financial statements | | Wells Fargo WealthBuilder Portfolios | | | 53 | |
Valuations of fair valued securities are compared to the next actual sales price when available, or other appropriate market values, to assess the continued appropriateness of the fair valuation methodologies used. These securities are fair valued on a day-to-day basis, taking into consideration changes to appropriate market information and any significant changes to the inputs considered in the valuation process until there is a readily available price provided on an exchange or by an independent pricing service. Valuations received from an independent pricing service or independent broker-dealer quotes are periodically validated by comparisons to most recent trades and valuations provided by other independent pricing services in addition to the review of prices by the manager and/or subadviser. Unobservable inputs used in determining fair valuations are identified based on the type of security, taking into consideration factors utilized by market participants in valuing the investment, knowledge about the issuer and the current market environment.
Futures contracts
Each Portfolio is subject to interest rate risk, equity price risk and foreign exchange rate risk in the normal course of pursuing its investment objectives. A Portfolio may buy and sell futures contracts in order to effect tactical allocation changes in a Portfolio. The primary risks associated with the use of futures contracts are the imperfect correlation between changes in market values of securities held by the Portfolio and the prices of futures contracts, and the possibility of an illiquid market.
The aggregate principal amounts of the contracts are not recorded in the financial statements. Fluctuations in the value of the contracts are recorded in the Statements of Assets and Liabilities as an asset or liability and in the Statements of Operations as unrealized gains or losses until the contracts are closed, at which point they are recorded as net realized gains or losses on futures contracts. With futures contracts, there is minimal counterparty risk to the Portfolio since futures are exchange traded and the exchange’s clearinghouse, as counterparty to all exchange traded futures, guarantees the futures against default.
Security transactions and income recognition
Securities transactions are recorded on a trade date basis. Realized gains or losses are recorded on the basis of identified cost.
Income dividends and capital gain distributions from Underlying Funds are recorded on the ex-dividend date. Capital gain distributions from Underlying Funds are treated as realized gains.
Interest income is accrued daily and bond discounts are accreted and premiums are amortized daily based on the effective interest method. To the extent debt obligations are placed on non-accrual status, any related interest income may be reduced by writing off interest receivables when the collection of all or a portion of interest has become doubtful based on consistently applied procedures. If the issuer subsequently resumes interest payments or when the collectability of interest is reasonably assured, the debt obligation is removed from non-accrual status.
Each Portfolio records on a daily basis its proportionate share of each affiliated Master Portfolio’s interest and dividend income, in addition to expenses and realized and unrealized gains and losses.
Distributions to shareholders
Distributions to shareholders from net investment income and net realized gains, if any, are recorded on the ex-dividend date. Such distributions are determined in conformity with federal income tax regulations, which may differ in amount or character from net investment income and realized gains recognized for purposes of U.S. generally accepted accounting principles.
Federal and other taxes
Each Portfolio is treated as a separate entity for federal income tax purposes. Each Portfolio intends to continue to qualify as a regulated investment company by distributing substantially all of its investment company taxable income and any net realized capital gains (after reduction for capital loss carryforwards) sufficient to relieve it from all, or substantially all, federal income taxes. Accordingly, no provision for federal income taxes was required.
Each Portfolio’s income and federal excise tax returns and all financial records supporting those returns for the prior three fiscal years are subject to examination by the federal and Delaware revenue authorities. Management has analyzed each Portfolio’s tax positions taken on federal, state, and foreign tax returns for all open tax years and does not believe that there are any uncertain tax positions that require recognition of a tax liability.
Reclassifications are made to each Portfolio’s capital accounts for permanent tax differences to reflect income and gains available for distribution (or available capital loss carryforwards) under federal income tax regulations. U.S. generally accepted accounting principles require that certain components of net assets be adjusted to reflect permanent
| | | | |
| 54 | | Wells Fargo WealthBuilder Portfolios | | Notes to financial statements |
differences between financial and tax reporting. These reclassifications have no effect on net assets or net asset values per share. At May 31, 2016, as a result of permanent book-to-tax differences, the following reclassification adjustments were made on the Statements of Assets and Liabilities:
| | | | | | | | | | | | |
| | | Paid-in
capital | | | Undistributed
(overdistributed/
accumulated)
net investment
income (loss) | | | Accumulated
net realized
gains (losses) on
investments | |
WealthBuilder Conservative Allocation Portfolio | | $ | 54,967 | | | $ | 478,182 | | | $ | (533,149 | ) |
WealthBuilder Moderate Balanced Portfolio | | | 63,687 | | | | 1,148,836 | | | | (1,212,523 | ) |
WealthBuilder Growth Balanced Portfolio | | | 49,468 | | | | 1,866,479 | | | | (1,915,947 | ) |
WealthBuilder Growth Allocation Portfolio | | | 22,426 | | | | 1,087,847 | | | | (1,110,273 | ) |
WealthBuilder Equity Portfolio | | | (397,649 | ) | | | 860,296 | | | | (462,647 | ) |
WealthBuilder Tactical Equity Portfolio | | | (67,684 | ) | | | 1,293,013 | | | | (1,225,329 | ) |
As of May 31, 2016, WealthBuilder Tactical Equity Portfolio had capital loss carryforwards that are available to offset future net realized capital gains in the amount of $21,843,731 expiring in 2018.
At May 31, 2016, late-year ordinary losses which will be recognized on the first day of the following fiscal year were as follows:
| | | | |
| | | Late-year
ordinary losses
deferred | |
| | |
WealthBuilder Growth Balanced Portfolio | | $ | 330,925 | |
WealthBuilder Growth Allocation Portfolio | | | 847,057 | |
WealthBuilder Tactical Equity Portfolio | | | 1,751,638 | |
3. FAIR VALUATION MEASUREMENTS
Fair value measurements of investments are determined within a framework that has established a fair value hierarchy based upon the various data inputs utilized in determining the value of each Portfolio’s investments. The three-level hierarchy gives the highest priority to unadjusted quoted prices in active markets for identical assets or liabilities (Level 1) and the lowest priority to significant unobservable inputs (Level 3). Each Portfolio’s investments are classified within the fair value hierarchy based on the lowest level of input that is significant to the fair value measurement. The inputs are summarized into three broad levels as follows:
| n | | Level 1 – quoted prices in active markets for identical securities |
| n | | Level 2 – other significant observable inputs (including quoted prices for similar securities, interest rates, prepayment speeds, credit risk, use of amortized cost, etc.) |
| n | | Level 3 – significant unobservable inputs (including the Portfolio’s own assumptions in determining the fair value of investments) |
The inputs or methodologies used for valuing investments in securities are not necessarily an indication of the risk associated with investing in those securities.
| | | | | | |
| Notes to financial statements | | Wells Fargo WealthBuilder Portfolios | | | 55 | |
The following is a summary of the inputs used in valuing each Portfolio’s assets and liabilities as of May 31, 2016:
| | | | | | | | | | | | | | | | |
| WealthBuilder Conservative Allocation Portfolio | | Quoted prices
(Level 1) | | | Other significant
observable inputs
(Level 2) | | | Significant
unobservable inputs (Level 3) | | | Total | |
Assets | | | | | | | | | | | | | | | | |
Investments in: | | | | | | | | | | | | | | | | |
| | | | |
Exchange-traded funds | | $ | 8,726,469 | | | $ | 0 | | | $ | 0 | | | $ | 8,726,469 | |
| | | | |
Investment companies | | | 376,151,342 | | | | 0 | | | | 0 | | | | 376,151,342 | |
| | | | |
Short-term investments | | | | | | | | | | | | | | | | |
Investment companies | | | 1,091,019 | | | | 0 | | | | 0 | | | | 1,091,019 | |
U.S. Treasury securities | | | 282,991 | | | | 0 | | | | 0 | | | | 282,991 | |
Investments measured at net asset value* | | | | | | | | | | | | | | | 139,024,134 | |
| | | 386,251,821 | | | | 0 | | | | 0 | | | | 525,275,955 | |
Futures contracts | | | 37,156 | | | | 0 | | | | 0 | | | | 37,156 | |
Total assets | | $ | 386,288,977 | | | $ | 0 | | | $ | 0 | | | $ | 525,313,111 | |
| * | Investments that are measured at fair value using the net asset value per share (or its equivalent) as a practical expedient have not been categorized in the fair value hierarchy. At May 31, 2016, the aggregated affiliated Master Portfolios measured at fair value using the net asset value per share (or its equivalent) were valued at $139,024,134. Each affiliated Master Portfolio does not have a redemption period notice, can be redeemed daily and does not have any unfunded commitments. |
| | | | | | | | | | | | | | | | |
| WealthBuilder Moderate Balanced Portfolio | | Quoted prices
(Level 1) | | | Other significant
observable inputs (Level 2) | | | Significant
unobservable inputs (Level 3) | | | Total | |
Assets | | | | | | | | | | | | | | | | |
Investments in: | | | | | | | | | | | | | | | | |
| | | | |
Exchange-traded funds | | $ | 12,101,094 | | | $ | 0 | | | $ | 0 | | | $ | 12,101,094 | |
| | | | |
Investment companies | | | 630,032,883 | | | | 0 | | | | 0 | | | | 630,032,883 | |
| | | | |
Short-term investments | | | | | | | | | | | | | | | | |
Investment companies | | | 1,265,358 | | | | 0 | | | | 0 | | | | 1,265,358 | |
U.S. Treasury securities | | | 911,970 | | | | 0 | | | | 0 | | | | 911,970 | |
Investments measured at net asset value* | | | | | | | | | | | | | | | 188,871,071 | |
| | | 644,311,305 | | | | 0 | | | | 0 | | | | 833,182,376 | |
Futures contracts | | | 120,378 | | | | 0 | | | | 0 | | | | 120,378 | |
Total assets | | $ | 644,431,683 | | | $ | 0 | | | $ | 0 | | | $ | 833,302,754 | |
| * | Investments that are measured at fair value using the net asset value per share (or its equivalent) as a practical expedient have not been categorized in the fair value hierarchy. At May 31, 2016, the aggregated affiliated Master Portfolios measured at fair value using the net asset value per share (or its equivalent) were valued at $188,871,071. Each affiliated Master Portfolio does not have a redemption period notice, can be redeemed daily and does not have any unfunded commitments. |
| | | | | | | | | | | | | | | | |
| WealthBuilder Growth Balanced Portfolio | | Quoted prices
(Level 1) | | | Other significant
observable inputs (Level 2) | | | Significant
unobservable inputs (Level 3) | | | Total | |
Assets | | | | | | | | | | | | | | | | |
Investments in: | | | | | | | | | | | | | | | | |
| | | | |
Exchange-traded funds | | $ | 11,890,089 | | | $ | 0 | | | $ | 0 | | | $ | 11,890,089 | |
| | | | |
Investment companies | | | 764,175,040 | | | | 0 | | | | 0 | | | | 764,175,040 | |
| | | | |
Short-term investments | | | | | | | | | | | | | | | | |
Investment companies | | | 1,324,716 | | | | 0 | | | | 0 | | | | 1,324,716 | |
U.S. Treasury securities | | | 1,314,957 | | | | 0 | | | | 0 | | | | 1,314,957 | |
Investments measured at net asset value* | | | | | | | | | | | | | | | 188,266,430 | |
| | | 778,704,802 | | | | 0 | | | | 0 | | | | 966,971,232 | |
Futures contracts | | | 205,203 | | | | 0 | | | | 0 | | | | 205,203 | |
Total assets | | $ | 778,910,005 | | | $ | 0 | | | $ | 0 | | | $ | 967,176,435 | |
| * | Investments that are measured at fair value using the net asset value per share (or its equivalent) as a practical expedient have not been categorized in the fair value hierarchy. At May 31, 2016, the aggregated affiliated Master Portfolios measured at fair value using the net asset value per share (or its equivalent) were valued at $188,266,430. Each affiliated Master Portfolio does not have a redemption period notice, can be redeemed daily and does not have any unfunded commitments. |
| | | | |
| 56 | | Wells Fargo WealthBuilder Portfolios | | Notes to financial statements |
| | | | | | | | | | | | | | | | |
| WealthBuilder Growth Allocation Portfolio | | Quoted prices (Level 1) | | | Other significant
observable inputs
(Level 2) | | | Significant
unobservable inputs (Level 3) | | | Total | |
Assets | | | | | | | | | | | | | | | | |
Investments in: | | | | | | | | | | | | | | | | |
| | | | |
Exchange-traded funds | | $ | 4,380,099 | | | $ | 0 | | | $ | 0 | | | $ | 4,380,099 | |
| | | | |
Investment companies | | | 357,778,936 | | | | 0 | | | | 0 | | | | 357,778,936 | |
| | | | |
Short-term investments | | | | | | | | | | | | | | | | |
U.S. Treasury securities | | | 695,977 | | | | 0 | | | | 0 | | | | 695,977 | |
Investments measured at net asset value* | | | | | | | | | | | | | | | 66,377,157 | |
| | | 362,855,012 | | | | 0 | | | | 0 | | | | 429,232,169 | |
Futures contracts | | | 119,366 | | | | 0 | | | | 0 | | | | 119,366 | |
Total assets | | $ | 362,974,378 | | | $ | 0 | | | $ | 0 | | | $ | 429,351,535 | |
| * | Investments that are measured at fair value using the net asset value per share (or its equivalent) as a practical expedient have not been categorized in the fair value hierarchy. At May 31, 2016, the aggregated affiliated Master Portfolios measured at fair value using the net asset value per share (or its equivalent) were valued at $66,377,157. Each affiliated Master Portfolio does not have a redemption period notice, can be redeemed daily and does not have any unfunded commitments. |
| | | | | | | | | | | | | | | | |
| WealthBuilder Equity Portfolio | | Quoted prices
(Level 1) | | | Other significant
observable inputs
(Level 2) | | | Significant
unobservable inputs (Level 3) | | | Total | |
Assets | | | | | | | | | | | | | | | | |
Investments in : | | | | | | | | | | | | | | | | |
| | | | |
Investment companies | | $ | 119,114,106 | | | $ | 0 | | | $ | 0 | | | $ | 119,114,106 | |
| | | | |
Short-term investments | | | | | | | | | | | | | | | | |
Investment companies | | | 155,252 | | | | 0 | | | | 0 | | | | 155,252 | |
Investments measured at net asset value* | | | | | | | | | | | | | | | 14,693,881 | |
Total assets | | $ | 119,269,358 | | | $ | 0 | | | $ | 0 | | | $ | 133,963,239 | |
| * | Investments that are measured at fair value using the net asset value per share (or its equivalent) as a practical expedient have not been categorized in the fair value hierarchy. At May 31, 2016, the aggregated affiliated Master Portfolios measured at fair value using the net asset value per share (or its equivalent) were valued at $14,693,881. Each affiliated Master Portfolio does not have a redemption period notice, can be redeemed daily and does not have any unfunded commitments. |
| | | | | | | | | | | | | | | | |
| WealthBuilder Tactical Equity Portfolio | | Quoted prices
(Level 1) | | | Other significant
observable inputs
(Level 2) | | | Significant
unobservable inputs (Level 3) | | | Total | |
Assets | | | | | | | | | | | | | | | | |
Investments in: | | | | | | | | | | | | | | | | |
| | | | |
Exchange-traded funds | | $ | 4,130,212 | | | $ | 0 | | | $ | 0 | | | $ | 4,130,212 | |
| | | | |
Investment companies | | | 360,119,337 | | | | 0 | | | | 0 | | | | 360,119,337 | |
| | | | |
Short-term investments | | | | | | | | | | | | | | | | |
Investment companies | | | 1,212,049 | | | | 0 | | | | 0 | | | | 1,212,049 | |
U.S. Treasury securities | | | 571,972 | | | | 0 | | | | 0 | | | | 571,972 | |
Investments measured at net asset value* | | | | | | | | | | | | | | | 56,911,848 | |
| | | 366,033,570 | | | | 0 | | | | 0 | | | | 422,945,418 | |
Futures contracts | | | 143,213 | | | | 0 | | | | 0 | | | | 143,213 | |
Total assets | | $ | 366,176,783 | | | $ | 0 | | | $ | 0 | | | $ | 423,088,631 | |
| * | Investments that are measured at fair value using the net asset value per share (or its equivalent) as a practical expedient have not been categorized in the fair value hierarchy. At May 31, 2016, the aggregated affiliated Master Portfolios measured at fair value using the net asset value per share (or its equivalent) were valued at $56,911,848. Each affiliated Master Portfolio does not have a redemption period notice, can be redeemed daily and does not have any unfunded commitments. |
| | | | | | |
| Notes to financial statements | | Wells Fargo WealthBuilder Portfolios | | | 57 | |
Futures contracts are reported at their variation margin at measurement date, which represents the amount due to the Portfolio at that date. All other assets and liabilities are reported at their market value at measurement date.
The Portfolios recognize transfers between levels within the fair value hierarchy at the end of the reporting period. At May 31, 2016, the Portfolios did not have any transfers into/out of Level 1, Level 2, or Level 3.
The investment objective of each affiliated Master Portfolio is as follows:
| | |
| Affiliated Master Portfolio | | Investment objective |
Wells Fargo Core Bond Portfolio | | Seeks total return, consisting of income and capital appreciation |
Wells Fargo Emerging Growth Portfolio | | Seeks long-term capital appreciation |
Wells Fargo International Growth Portfolio | | Seeks long-term capital appreciation |
Wells Fargo Small Company Value Portfolio | | Seeks long-term capital appreciation |
4. TRANSACTIONS WITH AFFILIATES
Management fee
Funds Management, an indirect wholly owned subsidiary of Wells Fargo & Company (“Wells Fargo”), is the manager of each Portfolio and provides advisory and fund-level administrative services under an investment management agreement. Under the investment management agreement, Funds Management is responsible for, among other services, implementing the investment objectives and strategies of each Portfolio, supervising the subadviser, providing fund-level administrative services in connection with each Portfolio’s operations, and providing any other fund-level administrative services reasonably necessary for the operation of each Portfolio. As compensation for its services under the investment management agreement, Funds Management is entitled to receive an annual management fee starting at 0.25% and declining to 0.18% as the average daily net assets of each Portfolio increase.
Prior to July 1, 2015, Funds Management provided advisory services pursuant to an investment advisory agreement and was entitled to receive an annual fee which started at 0.20% and declined to 0.15% as the average daily net assets of each Portfolio increased. In addition, fund-level administrative services were provided by Funds Management under a separate administration agreement at an annual fee which started at 0.05% and declined to 0.03% as the average daily net assets of each Portfolio increased. For financial statement purposes, the advisory fee and fund-level administration fee for the year ended May 31, 2016 have been included in management fee on the Statements of Operations.
For the year ended May 31, 2016, the management fee was equivalent to an annual rate of 0.25% of each Portfolio’s average daily net assets.
Funds Management also serves as the adviser to and is entitled to receive a fee from each affiliated Master Portfolio and affiliated Underlying Fund for those services.
Funds Management has retained the services of a subadviser to provide daily portfolio management to the Portfolios. The fee for subadvisory services is borne by Funds Management. Wells Capital Management Incorporated, an affiliate of Funds Management and an indirect wholly owned subsidiary of Wells Fargo, is the subadviser to each Portfolio and is paid an annual subadvisory fee of 0.15% of the daily net assets of each Portfolio.
Administration fees
Under a class-level administration agreement, Funds Management provides class-level administrative services to each Portfolio, which includes paying fees and expenses for services provided by the transfer agent, sub-transfer agents, omnibus account servicers and record-keepers. As compensation for its services under the class-level administration agreement, Funds Management receives a fee at an annual rate of 0.21% of the average daily net assets of each Portfolio. Prior to July 1, 2015, the class-level administration fee was 0.26% of the average daily net assets of each Portfolio.
For the year ended May 31, 2016, the administration fee was equivalent to an annual rate of 0.21% of each Portfolio’s average daily net assets.
Funds Management has contractually waived and/or reimbursed management and administration fees to the extent necessary to maintain certain net operating expense ratios for the Portfolios. Funds Management has committed through September 30, 2016 to waive fees and/or reimburse expenses to the extent necessary to cap each Portfolio’s expenses at 1.50%. Acquired fund fees and expenses and net expenses from underlying affiliated Master Portfolios are excluded from the expense caps. After this time, the cap may be increased or the commitment to maintain the cap may be terminated only with the approval of the Board of Trustees.
| | | | |
| 58 | | Wells Fargo WealthBuilder Portfolios | | Notes to financial statements |
Distribution fee
The Trust has adopted a Distribution Plan for each Portfolio pursuant to Rule 12b-1 under the 1940 Act. A distribution fee is charged and paid to Wells Fargo Funds Distributor, LLC (“Funds Distributor”), the principal underwriter of each Portfolio, at an annual rate of 0.75% of each Portfolio’s average daily net assets.
In addition, Funds Distributor is entitled to receive the front-end sales charge from the purchase of Portfolio shares. For the year ended May 31, 2016, Funds Distributor received the following amounts in front-end sales charges:
| | | | |
| | | Front-end
sales charges | |
WealthBuilder Conservative Allocation Portfolio | | $ | 15,956 | |
WealthBuilder Moderate Balanced Portfolio | | | 22,240 | |
WealthBuilder Growth Balanced Portfolio | | | 21,421 | |
WealthBuilder Growth Allocation Portfolio | | | 10,500 | |
WealthBuilder Equity Portfolio | | | 1,685 | |
WealthBuilder Tactical Equity Portfolio | | | 5,968 | |
Shareholder servicing fees
The Trust has entered into contracts with one or more shareholder servicing agents, whereby each Portfolio is charged a fee at an annual rate of 0.25% of its average daily net assets.
A portion of these total shareholder servicing fees were paid to affiliates of Wells Fargo.
5. INVESTMENT PORTFOLIO TRANSACTIONS
Purchases and sales of investments, excluding short-term securities, for the year ended May 31, 2016 were as follows:
| | | | | | | | | | | | | | | | |
| | | Purchases at cost* | | | Sales proceeds* | |
| | | U.S.
government | | | Non-U.S.
government | | | U.S.
government | | | Non-U.S.
government | |
WealthBuilder Conservative Allocation Portfolio | | $ | 700,211,064 | | | $ | 379,857,145 | | | $ | 689,057,904 | | | $ | 356,594,614 | |
WealthBuilder Moderate Balanced Portfolio | | | 804,113,593 | | | | 513,095,745 | | | | 791,305,444 | | | | 485,684,904 | |
WealthBuilder Growth Balanced Portfolio | | | 611,850,519 | | | | 438,934,940 | | | | 602,104,791 | | | | 379,887,639 | |
WealthBuilder Growth Allocation Portfolio | | | 111,512,576 | | | | 174,673,643 | | | | 109,736,372 | | | | 143,314,184 | |
WealthBuilder Equity Portfolio | | | 0 | | | | 39,175,859 | | | | 0 | | | | 36,432,032 | |
WealthBuilder Tactical Equity Portfolio | | | 0 | | | | 139,717,203 | | | | 0 | | | | 115,860,875 | |
| * | The Portfolios seek to achieve their investment objective by investing some of their investable assets in affiliated Master Portfolios. Purchases and sales related to these investments have been calculated by aggregating the results of multiplying such Portfolio’s ownership percentage of the respective affiliated Master Portfolio by the corresponding affiliated Master Portfolio’s purchases and sales. Purchases and sales of the affiliated and unaffiliated Underlying Funds in which the Portfolios invest are actual aggregate purchases and sales of those investments. |
6. INVESTMENTS IN AFFILIATES
An affiliated investment is a company which is under common ownership or control of the Portfolio or which the Portfolio has ownership of at least 5% of the outstanding voting shares. The following is a summary of transactions for the long-term holdings of issuers that were affiliates of each Portfolio at the end of the period.
| | | | | | |
| Notes to financial statements | | Wells Fargo WealthBuilder Portfolios | | | 59 | |
| | | | | | | | | | | | | | | | | | | | | | | | | | | | |
| | | Shares,
beginning of
period | | | Shares
purchases | | | Shares sold | | | Shares,
end of
period | | | Value,
end of
period | | | Dividends from
affiliated
Underlying
Funds | | | Capital gain
distributions
from affiliated
Underlying Funds | |
WealthBuilder Conservative Allocation Portfolio | | | | | | | | | | | | | | | | | | | | | | | | | | | | |
Wells Fargo Emerging Markets Equity Fund Class R6 | | | 0 | | | | 164,339 | | | | 24,458 | | | | 139,881 | | | $ | 2,622,762 | | | $ | 33,041 | | | $ | 0 | |
Wells Fargo Emerging Markets Equity Fund Institutional Class | | | 124,192 | | | | 2,809 | | | | 127,001 | | | | 0 | | | | 0 | | | | 0 | | | | 0 | |
Wells Fargo Endeavor Select Fund Institutional Class | | | 383,422 | | | | 253,287 | | | | 65,605 | | | | 571,104 | | | | 5,305,551 | | | | 0 | | | | 1,685,127 | |
Wells Fargo Government Securities Fund Institutional Class | | | 8,120,190 | | | | 439,277 | | | | 2,083,633 | | | | 6,475,834 | | | | 73,500,715 | | | | 951,276 | | | | 380,907 | |
Wells Fargo Large Cap Growth Fund Class R6 | | | 0 | | | | 129,446 | | | | 12,686 | | | | 116,760 | | | | 5,305,562 | | | | 24,122 | | | | 265,589 | |
Wells Fargo Large Cap Growth Fund Institutional Class | | | 109,534 | | | | 460 | | | | 109,994 | | | | 0 | | | | 0 | | | | 0 | | | | 0 | |
Wells Fargo Short Duration Government Bond Fund Class R6 | | | 0 | | | | 10,522,450 | | | | 918,401 | | | | 9,604,049 | | | | 95,944,445 | | | | 1,595,977 | | | | 0 | |
Wells Fargo Short Duration Government Bond Fund Institutional Class | | | 10,057,069 | | | | 27,125 | | | | 10,084,194 | | | | 0 | | | | 0 | | | | 153,142 | | | | 0 | |
Wells Fargo Small Cap Value Fund Class R6 | | | 0 | | | | 228,169 | | | | 33,887 | | | | 194,282 | | | | 4,015,817 | | | | 0 | | | | 1,068,620 | |
Wells Fargo Small Cap Value Fund Institutional Class | | | 142,460 | | | | 2,624 | | | | 145,084 | | | | 0 | | | | 0 | | | | 0 | | | | 0 | |
| | | | | | | | | | | | | | | | | | | $ | 186,694,852 | | | $ | 2,757,558 | | | $ | 3,400,243 | |
WealthBuilder Moderate Balanced Portfolio | | | | | | | | | | | | | | | | | | | | | | | | | | | | |
Wells Fargo Emerging Markets Equity Fund Class R6 | | | 0 | | | | 488,142 | | | | 48,324 | | | | 439,818 | | | $ | 8,246,588 | | | $ | 107,202 | | | $ | 0 | |
Wells Fargo Emerging Markets Equity Fund Institutional Class | | | 405,178 | | | | 10,572 | | | | 415,750 | | | | 0 | | | | 0 | | | | 0 | | | | 0 | |
Wells Fargo Endeavor Select Fund Institutional Class | | | 1,261,792 | | | | 651,547 | | | | 87,589 | | | | 1,825,750 | | | | 16,961,217 | | | | 0 | | | | 5,595,995 | |
Wells Fargo Government Securities Fund Institutional Class | | | 9,734,764 | | | | 735,438 | | | | 2,842,071 | | | | 7,628,131 | | | | 86,579,284 | | | | 1,166,094 | | | | 473,506 | |
Wells Fargo Large Cap Growth Fund Class R6 | | | 0 | | | | 390,625 | | | | 19,210 | | | | 371,415 | | | | 16,877,116 | | | | 80,044 | | | | 881,309 | |
Wells Fargo Large Cap Growth Fund Institutional Class | | | 359,376 | | | | 559 | | | | 359,935 | | | | 0 | | | | 0 | | | | 0 | | | | 0 | |
Wells Fargo Short Duration Government Bond Fund Class R6 | | | 0 | | | | 10,152,057 | | | | 1,372,643 | | | | 8,779,414 | | | | 87,706,343 | | | | 1,494,374 | | | | 0 | |
Wells Fargo Short Duration Government Bond Fund Institutional Class | | | 10,077,017 | | | | 93,318 | | | | 10,170,335 | | | | 0 | | | | 0 | | | | 151,237 | | | | 0 | |
Wells Fargo Small Cap Value Fund Class R6 | | | 0 | | | | 695,926 | | | | 76,161 | | | | 619,765 | | | | 12,810,541 | | | | 0 | | | | 3,561,324 | |
Wells Fargo Small Cap Value Fund Institutional Class | | | 466,718 | | | | 4,350 | | | | 471,068 | | | | 0 | | | | 0 | | | | 0 | | | | 0 | |
| | | | | | | | | | | | | | | | | | | $ | 229,181,089 | | | $ | 2,998,951 | | | $ | 10,512,134 | |
WealthBuilder Growth Balanced Portfolio | | | | | | | | | | | | | | | | | | | | | | | | | | | | |
Wells Fargo Emerging Markets Equity Fund Class R6 | | | 0 | | | | 839,026 | | | | 68,286 | | | | 770,740 | | | $ | 14,451,367 | | | $ | 187,642 | | | $ | 0 | |
Wells Fargo Emerging Markets Equity Fund Institutional Class | | | 690,996 | | | | 22,616 | | | | 713,612 | | | | 0 | | | | 0 | | | | 0 | | | | 0 | |
Wells Fargo Endeavor Select Fund Institutional Class | | | 2,144,141 | | | | 1,099,195 | | | | 83,244 | | | | 3,160,092 | | | | 29,357,259 | | | | 0 | | | | 9,803,698 | |
Wells Fargo Government Securities Fund Institutional Class | | | 10,020,967 | | | | 1,077,001 | | | | 3,513,496 | | | | 7,584,472 | | | | 86,083,752 | | | | 1,176,214 | | | | 482,951 | |
Wells Fargo Large Cap Growth Fund Class R6 | | | 0 | | | | 660,680 | | | | 15,721 | | | | 644,959 | | | | 29,306,936 | | | | 140,373 | | | | 1,545,548 | |
Wells Fargo Large Cap Growth Fund Institutional Class | | | 612,153 | | | | 4,533 | | | | 616,686 | | | | 0 | | | | 0 | | | | 0 | | | | 0 | |
Wells Fargo Small Cap Value Fund Class R6 | | | 0 | | | | 1,207,814 | | | | 124,197 | | | | 1,083,617 | | | | 22,398,371 | | | | 0 | | | | 6,242,190 | |
Wells Fargo Small Cap Value Fund Institutional Class | | | 791,335 | | | | 8,732 | | | | 800,067 | | | | 0 | | | | 0 | | | | 0 | | | | 0 | |
| | | | | | | | | | | | | | | | | | | $ | 181,597,685 | | | $ | 1,504,229 | | | $ | 18,074,387 | |
| | | | |
| 60 | | Wells Fargo WealthBuilder Portfolios | | Notes to financial statements |
| | | | | | | | | | | | | | | | | | | | | | | | | | | | |
| | | Shares,
beginning of
period | | | Shares
purchases | | | Shares sold | | | Shares,
end of
period | | | Value,
end of
period | | | Dividends from
affiliated
Underlying
Funds | | | Capital gain
distributions
from affiliated
Underlying Funds | |
WealthBuilder Growth Allocation Portfolio | | | | | | | | | | | | | | | | | | | | | | | | | | | | |
Wells Fargo Emerging Markets Equity Fund Class R6 | | | 0 | | | | 491,689 | | | | 41,097 | | | | 450,592 | | | $ | 8,448,600 | | | $ | 111,978 | | | $ | 0 | |
Wells Fargo Emerging Markets Equity Fund Institutional Class | | | 411,518 | | | | 7,708 | | | | 419,226 | | | | 0 | | | | 0 | | | | 0 | | | | 0 | |
Wells Fargo Endeavor Select Fund Institutional Class | | | 1,269,337 | | | | 679,615 | | | | 86,771 | | | | 1,862,181 | | | | 17,299,658 | | | | 0 | | | | 5,782,289 | |
Wells Fargo Government Securities Fund Institutional Class | | | 1,743,801 | | | | 527,068 | | | | 1,241,586 | | | | 1,029,283 | | | | 11,682,358 | | | | 187,979 | | | | 81,134 | |
Wells Fargo Large Cap Growth Fund Class R6 | | | 0 | | | | 387,475 | | | | 8,321 | | | | 379,154 | | | | 17,228,754 | | | | 83,074 | | | | 913,895 | |
Wells Fargo Large Cap Growth Fund Institutional Class | | | 363,446 | | | | 692 | | | | 364,138 | | | | 0 | | | | 0 | | | | 0 | | | | 0 | |
Wells Fargo Small Cap Value Fund Class R6 | | | 0 | | | | 723,225 | | | | 88,678 | | | | 634,547 | | | | 13,116,082 | | | | 0 | | | | 3,716,857 | |
Wells Fargo Small Cap Value Fund Institutional Class | | | 474,722 | | | | 0 | | | | 474,722 | | | | 0 | | | | 0 | | | | 0 | | | | 0 | |
| | | | | | | | | | | | | | | | | | | $ | 67,775,452 | | | $ | 383,031 | | | $ | 10,494,175 | |
WealthBuilder Equity Portfolio | | | | | | | | | | | | | | | | | | | | | | | | | | | | |
Wells Fargo Emerging Markets Equity Fund Class R6 | | | 0 | | | | 203,957 | | | | 28,925 | | | | 175,032 | | | $ | 3,281,845 | | | $ | 44,426 | | | $ | 0 | |
Wells Fargo Emerging Markets Equity Fund Institutional Class | | | 172,208 | | | | 2,819 | | | | 175,027 | | | | 0 | | | | 0 | | | | 0 | | | | 0 | |
Wells Fargo Endeavor Select Fund Institutional Class | | | 633,517 | | | | 313,194 | | | | 81,089 | | | | 865,622 | | | | 8,041,633 | | | | 0 | | | | 2,757,903 | |
Wells Fargo Large Cap Growth Fund Class R6 | | | 0 | | | | 194,011 | | | | 17,097 | | | | 176,914 | | | | 8,038,992 | | | | 39,451 | | | | 435,280 | |
Wells Fargo Large Cap Growth Fund Institutional Class | | | 181,327 | | | | 427 | | | | 181,754 | | | | 0 | | | | 0 | | | | 0 | | | | 0 | |
Wells Fargo Small Cap Value Fund Class R6 | | | 0 | | | | 195,509 | | | | 31,099 | | | | 164,410 | | | | 3,398,353 | | | | 0 | | | | 973,563 | |
Wells Fargo Small Cap Value Fund Institutional Class | | | 131,197 | | | | 19 | | | | 131,216 | | | | 0 | | | | 0 | | | | 0 | | | | 0 | |
| | | | | | | | | | | | | | | | | | | $ | 22,760,823 | | | $ | 83,877 | | | $ | 4,166,746 | |
WealthBuilder Tactical Equity Portfolio | | | | | | | | | | | | | | | | | | | | | | | | | | | | |
Wells Fargo Emerging Markets Equity Fund Class R6 | | | 0 | | | | 626,807 | | | | 73,156 | | | | 553,651 | | | $ | 10,380,950 | | | $ | 138,530 | | | $ | 0 | |
Wells Fargo Emerging Markets Equity Fund Institutional Class | | | 521,226 | | | | 12,149 | | | | 533,375 | | | | 0 | | | | 0 | | | | 0 | | | | 0 | |
Wells Fargo Endeavor Select Fund Institutional Class | | | 1,596,060 | | | | 837,708 | | | | 173,369 | | | | 2,260,399 | | | | 20,999,107 | | | | 0 | | | | 7,093,144 | |
Wells Fargo Large Cap Growth Fund Class R6 | | | 0 | | | | 492,426 | | | | 28,137 | | | | 464,289 | | | | 21,097,281 | | | | 101,557 | | | | 1,118,438 | |
Wells Fargo Large Cap Growth Fund Institutional Class | | | 456,474 | | | | 3,827 | | | | 460,301 | | | | 0 | | | | 0 | | | | 0 | | | | 0 | |
Wells Fargo Small Cap Value Fund Class R6 | | | 0 | | | | 904,121 | | | | 130,946 | | | | 773,175 | | | | 15,981,519 | | | | 0 | | | | 4,491,978 | |
Wells Fargo Small Cap Value Fund Institutional Class | | | 597,307 | | | | 2,617 | | | | 599,924 | | | | 0 | | | | 0 | | | | 0 | | | | 0 | |
| | | | | | | | | | | | | | | | | | | $ | 68,458,857 | | | $ | 240,087 | | | $ | 12,703,560 | |
In addition, each Portfolio’s ownership of affiliated Master Portfolios was as follows:
| | | | | | | | | | | | |
| | | % of ownership,
beginning of period | | | % of ownership,
end of period | | | Value,
end of period | |
WealthBuilder Conservative Allocation Portfolio | | | | | | | | | | | | |
Wells Fargo Core Bond Portfolio | | | 4 | % | | | 3 | % | | $ | 124,676,465 | |
Wells Fargo Emerging Growth Portfolio | | | 0 | * | | | 0 | * | | | 4,016,944 | |
Wells Fargo International Growth Portfolio | | | 4 | | | | 4 | | | | 6,315,708 | |
Wells Fargo Small Company Value Portfolio | | | 2 | | | | 2 | | | | 4,015,017 | |
| | | | | | | | | | | $ | 139,024,134 | |
| | | | | | |
| Notes to financial statements | | Wells Fargo WealthBuilder Portfolios | | | 61 | |
| | | | | | | | | | | | |
| | | % of ownership,
beginning of period | | | % of ownership,
end of period | | | Value,
end of period | |
WealthBuilder Moderate Balanced Portfolio | | | | | | | | | | | | |
Wells Fargo Core Bond Portfolio | | | 4 | % | | | 3 | % | | $ | 143,176,887 | |
Wells Fargo Emerging Growth Portfolio | | | 1 | | | | 1 | | | | 12,882,232 | |
Wells Fargo International Growth Portfolio | | | 13 | | | | 13 | | | | 19,977,315 | |
Wells Fargo Small Company Value Portfolio | | | 6 | | | | 6 | | | | 12,834,637 | |
| | | | | | | | | | | $ | 188,871,071 | |
WealthBuilder Growth Balanced Portfolio | | | | | | | | | | | | |
Wells Fargo Core Bond Portfolio | | | 3 | | | | 3 | | | | 108,943,380 | |
Wells Fargo Emerging Growth Portfolio | | | 2 | | | | 2 | | | | 22,368,837 | |
Wells Fargo International Growth Portfolio | | | 23 | | | | 23 | | | | 34,619,242 | |
Wells Fargo Small Company Value Portfolio | | | 11 | | | | 10 | | | | 22,334,971 | |
| | | | | | | | | | | $ | 188,266,430 | |
WealthBuilder Growth Allocation Portfolio | | | | | | | | | | | | |
Wells Fargo Core Bond Portfolio | | | 1 | | | | 0 | * | | | 19,855,433 | |
Wells Fargo Emerging Growth Portfolio | | | 1 | | | | 1 | | | | 12,994,194 | |
Wells Fargo International Growth Portfolio | | | 14 | | | | 14 | | | | 20,388,098 | |
Wells Fargo Small Company Value Portfolio | | | 6 | | | | 6 | | | | 13,139,432 | |
| | | | | | | | | | | $ | 66,377,157 | |
WealthBuilder Equity Portfolio | | | | | | | | | | | | |
Wells Fargo Emerging Growth Portfolio | | | 0 | * | | | 0 | * | | | 3,397,239 | |
Wells Fargo International Growth Portfolio | | | 6 | | | | 5 | | | | 7,906,391 | |
Wells Fargo Small Company Value Portfolio | | | 2 | | | | 2 | | | | 3,390,251 | |
| | | | | | | | | | | $ | 14,693,881 | |
WealthBuilder Tactical Equity Portfolio | | | | | | | | | | | | |
Wells Fargo Emerging Growth Portfolio | | | 1 | | | | 2 | | | | 16,004,365 | |
Wells Fargo International Growth Portfolio | | | 17 | | | | 17 | | | | 24,932,164 | |
Wells Fargo Small Company Value Portfolio | | | 8 | | | | 7 | | | | 15,975,319 | |
| | | | | | | | | | | $ | 56,911,848 | |
| * | The amount invested is less than 1%. |
7. DERIVATIVE TRANSACTIONS
During the year ended May 31, 2016, the Portfolios entered into futures contracts to gain market exposure to certain asset classes consistent with an active asset allocation strategy.
At May 31, 2016, the Portfolios had short futures contracts outstanding as follows:
| | | | | | | | | | | | | | | | |
| | | Expiration date | | Counterparty | | Contracts | | Type | | Contract
value at
May 31, 2016 | | | Unrealized
losses | |
WealthBuilder Conservative Allocation Portfolio | | 6-13-2016 | | Goldman Sachs | | 50 Short | | Japanese Yen Futures | | $ | 5,652,813 | | | $ | (87,126 | ) |
| | | 9-21-2016 | | Goldman Sachs | | 98 Short | | 10-Year U.S. Treasury Notes | | | 12,709,375 | | | | (30,905 | ) |
WealthBuilder Moderate Balanced Portfolio | | 6-13-2016 | | Goldman Sachs | | 162 Short | | Japanese Yen Futures | | | 18,315,113 | | | | (282,287 | ) |
| | | 9-21-2016 | | Goldman Sachs | | 317 Short | | 10-Year U.S. Treasury Notes | | | 41,110,938 | | | | (99,969 | ) |
WealthBuilder Growth Balanced Portfolio | | 6-13-2016 | | Goldman Sachs | | 280 Short | | Japanese Yen Futures | | | 31,655,750 | | | | (487,903 | ) |
| | | 9-21-2016 | | Goldman Sachs | | 365 Short | | 10-Year U.S. Treasury Notes | | | 47,335,938 | | | | (115,106 | ) |
WealthBuilder Growth Allocation Portfolio | | 6-13-2016 | | Goldman Sachs | | 164 Short | | Japanese Yen Futures | | | 18,541,225 | | | | (285,772 | ) |
| | | 9-21-2016 | | Goldman Sachs | | 161 Short | | 10-Year U.S. Treasury Notes | | | 20,879,688 | | | | (50,773 | ) |
WealthBuilder Tactical Equity Portfolio | | 6-13-2016 | | Goldman Sachs | | 201 Short | | Japanese Yen Futures | | | 22,724,306 | | | | (350,245 | ) |
| | | | |
| 62 | | Wells Fargo WealthBuilder Portfolios | | Notes to financial statements |
The Portfolios had average notional amounts in futures contracts outstanding during the year ended May 31, 2016 as follows:
| | | | | | | | |
| | | Long contracts | | | Short contracts | |
WealthBuilder Conservative Allocation Portfolio | | $ | 4,251,249 | | | $ | 16,368,021 | |
WealthBuilder Moderate Balanced Portfolio | | | 13,671,969 | | | | 53,152,203 | |
WealthBuilder Growth Balanced Portfolio | | | 15,784,880 | | | | 76,809,163 | |
WealthBuilder Growth Allocation Portfolio | | | 6,936,468 | | | | 40,837,421 | |
WealthBuilder Tactical Equity Portfolio | | | 0 | | | | 33,976,664 | |
A summary of derivative instruments by primary risk exposure is outlined in the following tables, unless the only primary risk exposure category is already reflected in the appropriate financial statements.
The fair value of derivative instruments as of May 31, 2016 was as follows for WealthBuilder Conservative Allocation Portfolio:
| | | | | | | | | | | | |
| | | Asset derivatives | | | Liability derivatives | |
| | | Statements of Assets and Liabilities location | | Fair value | | | Statements of Assets and Liabilities location | | Fair value | |
Interest rate contracts | | Receivable for daily variation margin on open futures contracts | | $ | 1,531 | * | | Payable for daily variation margin on open futures contracts | | $ | 0 | |
Foreign exchange contracts | | Receivable for daily variation margin on open futures contracts | | | 35,625 | * | | Payable for daily variation margin on open futures contracts | | | 0 | |
| | | | | $ | 37,156 | | | | | $ | 0 | |
| * | Only the current day’s variation margin as of May 31, 2016 is reported separately on the Statements of Assets and Liabilities. |
The effect of derivative instruments on the Statements of Operations for the year ended May 31, 2016 was as follows for WealthBuilder Conservative Allocation Portfolio:
| | | | | | | | |
| | | Amount of realized
gains (losses) on
derivatives | | | Change in unrealized
gains (losses) on
derivatives | |
Interest rate contracts | | $ | 92,007 | | | $ | 10,107 | |
Equity contracts | | | 1,568,115 | | | | 56,731 | |
Foreign exchange contracts | | | (505,704 | ) | | | (168,102 | ) |
| | | $ | 1,154,418 | | | $ | (101,264 | ) |
The fair value of derivative instruments as of May 31, 2016 was as follows for WealthBuilder Moderate Balanced Portfolio:
| | | | | | | | | | | | |
| | | Asset derivatives | | | Liability derivatives | |
| | | Statements of Assets and
Liabilities location | | Fair value | | | Statements of Assets and
Liabilities location | | Fair value | |
Interest rate contracts | | Receivable for daily variation margin on open futures contracts | | $ | 4,953 | * | | Payable for daily variation margin on open futures contracts | | $ | 0 | |
Foreign exchange contracts | | Receivable for daily variation margin on open futures contracts | | | 115,425 | * | | Payable for daily variation margin on open futures contracts | | | 0 | |
| | | | | $ | 120,378 | | | | | $ | 0 | |
| * | Only the current day’s variation margin as of May 31, 2016 is reported separately on the Statements of Assets and Liabilities. |
| | | | | | |
| Notes to financial statements | | Wells Fargo WealthBuilder Portfolios | | | 63 | |
The effect of derivative instruments on the Statements of Operations for the year ended May 31, 2016 was as follows for WealthBuilder Moderate Balanced Portfolio:
| | | | | | | | |
| | | Amount of realized
gains (losses) on
derivatives | | | Change in unrealized
gains (losses) on
derivatives | |
Interest rate contracts | | $ | 275,983 | | | $ | 33,321 | |
Equity contracts | | | 5,426,610 | | | | 186,217 | |
Foreign exchange contracts | | | (1,686,316 | ) | | | (549,527 | ) |
| | | $ | 4,016,277 | | | $ | (329,989 | ) |
The fair value of derivative instruments as of May 31, 2016 was as follows for WealthBuilder Growth Balanced Portfolio:
| | | | | | | | | | | | |
| | | Asset derivatives | | | Liability derivatives | |
| | | Statements of Assets and
Liabilities location | | Fair value | | | Statements of Assets and
Liabilities location | | Fair value | |
Interest rate contracts | | Receivable for daily variation margin on open futures contracts | | $ | 5,703 | * | | Payable for daily variation margin on open futures contracts | | $ | 0 | |
Foreign exchange contracts | | Receivable for daily variation margin on open futures contracts | | | 199,500 | * | | Payable for daily variation margin on open futures contracts | | | 0 | |
| | | | | $ | 205,203 | | | | | $ | 0 | |
| * | Only the current day’s variation margin as of May 31, 2016 is reported separately on the Statements of Assets and Liabilities. |
The effect of derivative instruments on the Statements of Operations for the year ended May 31, 2016 was as follows for WealthBuilder Growth Balanced Portfolio:
| | | | | | | | |
| | | Amount of realized
gains (losses) on
derivatives | | | Change in unrealized
gains (losses) on
derivatives | |
Interest rate contracts | | $ | 312,750 | | | $ | 35,894 | |
Equity contracts | | | 5,679,240 | | | | 217,190 | |
Foreign exchange contracts | | | (2,453,629 | ) | | | (982,375 | ) |
| | | $ | 3,538,361 | | | $ | (729,291 | ) |
The fair value of derivative instruments as of May 31, 2016 was as follows for WealthBuilder Growth Allocation Portfolio:
| | | | | | | | | | | | |
| | | Asset derivatives | | | Liability derivatives | |
| | | Statements of Assets and
Liabilities location | | Fair value | | | Statements of Assets and
Liabilities location | | Fair value | |
Interest rate contracts | | Receivable for daily variation margin on open futures contracts | | $ | 2,516 | * | | Receivable for daily variation margin on open futures contracts | | $ | 0 | |
Foreign exchange contracts | | Receivable for daily variation margin on open futures contracts | | | 116,850 | * | | Payable for daily variation margin on open futures contracts | | | 0 | |
| | | | | $ | 119,366 | | | | | $ | 0 | |
| * | Only the current day’s variation margin as of May 31, 2016 is reported separately on the Statements of Assets and Liabilities. |
| | | | |
| 64 | | Wells Fargo WealthBuilder Portfolios | | Notes to financial statements |
The effect of derivative instruments on the Statements of Operations for the year ended May 31, 2016 was as follows for WealthBuilder Growth Allocation Portfolio:
| | | | | | | | |
| | | Amount of realized
gains (losses) on
derivatives | | | Change in unrealized
gains (losses) on
derivatives | |
Interest rate contracts | | $ | 146,158 | | | $ | 16,338 | |
Equity contracts | | | 2,457,614 | | | | 95,352 | |
Foreign exchange contracts | | | (1,291,943 | ) | | | (615,963 | ) |
| | | $ | 1,311,829 | | | $ | (504,273 | ) |
For WealthBuilder Tactical Equity Portfolio, the receivable for daily variation margin on open futures contracts reflected in the Statements of Assets and Liabilities only represents the current day’s variation margin. The realized gains (losses) and change in unrealized gain/losses on futures contracts are reflected in the Statements of Operations.
For certain types of derivative transactions, the Portfolios have entered into International Swaps and Derivatives Association, Inc. master agreements (“ISDA Master Agreements”) or similar agreements with approved counterparties. The ISDA Master Agreements or similar agreements may have requirements to deliver/deposit securities or cash to/with an exchange or broker-dealer as collateral and allows the Portfolios to offset, with each counterparty, certain derivative financial instrument’s assets and/or liabilities with collateral held or pledged. Collateral requirements differ by type of derivative. Collateral or margin requirements are set by the broker or exchange clearing house for exchange traded derivatives while collateral terms are contract specific for over-the-counter traded derivatives. Cash collateral that has been pledged to cover obligations of the Portfolios under ISDA Master Agreements or similar agreements, if any, are reported separately in the Statements of Assets and Liabilities. Securities pledged as collateral, if any, are noted in the Portfolio of Investments. With respect to balance sheet offsetting, absent an event of default by the counterparty or a termination of the agreement, the reported amounts of financial assets and financial liabilities in the Statements of Assets and Liabilities are not offset across transactions between each Portfolio and the applicable counterparty. A reconciliation of the gross amounts on the Statements of Assets and Liabilities to the net amounts by derivative type, including any collateral exposure, is as follows:
| | | | | | | | | | | | | | | | | | | | |
| | | Derivative type | | Counterparty | | Gross amounts
of assets in the
Statements of
Assets and
Liabilities | | | Amounts
subject to
netting
agreements | | | Collateral
received | | | Net amount
of assets | |
WealthBuilder Conservative Allocation Portfolio | | Futures – variation margin | | Goldman Sachs | | $ | 37,156 | | | | $0 | | | | $0 | | | | $37,156 | |
WealthBuilder Moderate Balanced Portfolio | | Futures – variation margin | | Goldman Sachs | | | 120,378 | | | | 0 | | | | 0 | | | | 120,378 | |
WealthBuilder Growth Balanced Portfolio | | Futures – variation margin | | Goldman Sachs | | | 205,203 | | | | 0 | | | | 0 | | | | 205,203 | |
WealthBuilder Growth Allocation Portfolio | | Futures – variation margin | | Goldman Sachs | | | 119,366 | | | | 0 | | | | 0 | | | | 119,366 | |
WealthBuilder Tactical Equity Portfolio | | Futures – variation margin | | Goldman Sachs | | | 143,213 | | | | 0 | | | | 0 | | | | 143,213 | |
8. BANK BORROWINGS
The Trust (excluding the money market funds and certain other funds) and Wells Fargo Variable Trust are parties to a $200,000,000 revolving credit agreement whereby each Portfolio is permitted to use bank borrowings for temporary or emergency purposes, such as to fund shareholder redemption requests. Interest under the credit agreement is charged to each Portfolio based on a borrowing rate equal to the higher of the Federal Funds rate in effect on that day plus 1.25% or the overnight LIBOR rate in effect on that day plus 1.25%. In addition, an annual commitment fee equal to 0.20% of the unused balance is allocated to each participating Portfolio. Prior to September 1, 2015, the revolving credit agreement amount was $150,000,000 and the annual commitment fee was equal to 0.10% of the unused balance which was allocated to each participating Portfolio.
For the year ended May 31, 2016, there were no borrowings under the agreement by any Portfolio, except WealthBuilder Moderate Balanced Portfolio. During the year ended May 31, 2016, the WealthBuilder Moderate Balanced Portfolio had average borrowings outstanding of $13,901 at an average rate of 1.41% and paid interest in the amount of $196.
| | | | | | |
| Notes to financial statements | | Wells Fargo WealthBuilder Portfolios | | | 65 | |
9. DISTRIBUTIONS TO SHAREHOLDERS
The tax character of distributions paid during the years ended May 31, 2016 and May 31, 2015 were as follows:
| | | | | | | | | | | | | | | | |
| | | Ordinary income | | | Long-term capital gain | |
| | | 2016 | | | 2015 | | | 2016 | | | 2015 | |
WealthBuilder Conservative Allocation Portfolio | | $ | 6,539,989 | | | $ | 6,136,988 | | | $ | 11,561,354 | | | $ | 8,353,067 | |
WealthBuilder Moderate Balanced Portfolio | | | 9,901,937 | | | | 8,323,885 | | | | 28,876,659 | | | | 22,290,686 | |
WealthBuilder Growth Balanced Portfolio | | | 7,325,526 | | | | 7,084,736 | | | | 44,986,175 | | | | 31,685,911 | |
WealthBuilder Growth Allocation Portfolio | | | 1,351,047 | | | | 3,617,950 | | | | 24,150,116 | | | | 17,215,777 | |
As of May 31, 2016, the components of distributable earnings on a tax basis were as follows:
| | | | | | | | | | | | | | | | | | | | |
| | | Undistributed
ordinary
income | | | Undistributed
long-term
gain | | | Unrealized gains | | | Late-year
ordinary losses
deferred | | | Capital loss
carryforward | |
WealthBuilder Conservative Allocation Portfolio | | $ | 441,955 | | | $ | 7,802,871 | | | $ | 4,131,706 | | | $ | 0 | | | $ | 0 | |
WealthBuilder Moderate Balanced Portfolio | | | 389,008 | | | | 23,108,613 | | | | 12,639,600 | | | | 0 | | | | 0 | |
WealthBuilder Growth Balanced Portfolio | | | 0 | | | | 35,479,119 | | | | 22,579,101 | | | | (330,925 | ) | | | 0 | |
WealthBuilder Growth Allocation Portfolio | | | 0 | | | | 18,928,451 | | | | 11,687,115 | | | | (847,057 | ) | | | 0 | |
WealthBuilder Equity Portfolio | | | 0 | | | | 2,970,748 | | | | 17,122,290 | �� | | | 0 | | | | 0 | |
WealthBuilder Tactical Equity Portfolio | | | 0 | | | | 0 | | | | 30,927,286 | | | | (1,751,638 | ) | | | (21,843,731 | ) |
10. INDEMNIFICATION
Under the Trust’s organizational documents, the officers and Trustees have been granted certain indemnification rights against certain liabilities that may arise out of performance of their duties to the Trust. Additionally, in the normal course of business, the Trust may enter into contracts with service providers that contain a variety of indemnification clauses. The Trust’s maximum exposure under these arrangements is dependent on future claims that may be made against the Portfolios and, therefore, cannot be estimated.
11. SUBSEQUENT DISTRIBUTIONS
On June 24, 2016, the Portfolios declared distributions from net investment income to shareholders of record on June 23, 2016. The per share amounts payable on June 27, 2016 were as follows:
| | | | |
| | | Net investment
income | |
WealthBuilder Conservative Allocation Portfolio | | $ | 0.00471 | |
WealthBuilder Moderate Balanced Portfolio | | $ | 0.00862 | |
On July 20, 2016, WealthBuilder Equity Portfolio declared distributions from net investment income and long-term capital gains to shareholders of record on July 19, 2016. The per share amounts payable on July 21, 2016 were as follows:
| | |
Net investment
income | | Long-term
capital gains |
| $0.00386 | | $0.34829 |
On July 25, 2016, WealthBuilder Conservative Allocation Portfolio declared distributions from net investment income in the amount of $0.00663 per share to shareholders of record on July 22, 2016. This amount was paid to shareholders on July 26, 2016.
These distributions are not reflected in the accompanying financial statements. The final determination of the source of all distributions is subject to change and made after the tax year-end of the Portfolio.
12. SUBSEQUENT EVENTS
After the close of business on July 22, 2016, WealthBuilder Tactical Equity Portfolio acquired the net assets of WealthBuilder Equity Portfolio in a tax-free exchange for shares of WealthBuilder Tactical Equity Portfolio. Shareholders of Wells Fargo WealthBuilder Equity Portfolio received corresponding shares of WealthBuilder Tactical Equity Portfolio. In addition, WealthBuilder Tactical Equity Portfolio changed its name to Wells Fargo WealthBuilder Equity Portfolio.
| | | | |
| 66 | | Wells Fargo WealthBuilder Portfolios | | Report of independent registered public accounting firm |
BOARD OF TRUSTEES AND SHAREHOLDERS OF WELLS FARGO FUNDS TRUST:
We have audited the accompanying statements of assets and liabilities, including the portfolios of investments, of the Wells Fargo WealthBuilder Conservative Allocation Portfolio, Wells Fargo WealthBuilder Moderate Balanced Portfolio, Wells Fargo WealthBuilder Growth Balanced Portfolio, Wells Fargo WealthBuilder Growth Allocation Portfolio, Wells Fargo WealthBuilder Equity Portfolio, and Wells Fargo WealthBuilder Tactical Equity Portfolio (formerly known as Wells Fargo Advantage WealthBuilder Conservative Allocation Portfolio, Wells Fargo Advantage WealthBuilder Moderate Balanced Portfolio, Wells Fargo Advantage WealthBuilder Growth Balanced Portfolio, Wells Fargo Advantage WealthBuilder Growth Allocation Portfolio, Wells Fargo Advantage WealthBuilder Equity Portfolio, and Wells Fargo Advantage WealthBuilder Tactical Equity Portfolio, respectively) (the “Funds”), six of the funds constituting the Wells Fargo Funds Trust, as of May 31, 2016, and the related statements of operations for the year then ended, the statements of changes in net assets for each of the years in the two-year period then ended, and the financial highlights for each of the years in the five-year period then ended. These financial statements and financial highlights are the responsibility of the Funds’ management. Our responsibility is to express an opinion on these financial statements and financial highlights based on our audits.
We conducted our audits in accordance with the standards of the Public Company Accounting Oversight Board (United States). Those standards require that we plan and perform the audit to obtain reasonable assurance about whether the financial statements and financial highlights are free of material misstatement. An audit includes examining, on a test basis, evidence supporting the amounts and disclosures in the financial statements. Our procedures included confirmation of securities owned as of May 31, 2016, by correspondence with the transfer agents and brokers, or by other appropriate auditing procedures. An audit also includes assessing the accounting principles used and significant estimates made by management, as well as evaluating the overall financial statement presentation. We believe that our audits provide a reasonable basis for our opinion.
In our opinion, the financial statements and financial highlights referred to above present fairly, in all material respects, the financial position of the aforementioned Funds of the Wells Fargo Funds Trust as of May 31, 2016, the results of their operations for the year then ended, the changes in their net assets for each of the years in the two-year period then ended, and the financial highlights for each of the years in the five-year period then ended, in conformity with U.S. generally accepted accounting principles.

Boston, Massachusetts
July 27, 2016
| | | | | | |
| Other information (unaudited) | | Wells Fargo WealthBuilder Portfolios | | | 67 | |
TAX INFORMATION
For corporate shareholders, pursuant to Section 854 of the Internal Revenue Code, the percentage of ordinary income dividends qualifying for the corporate dividends-received deduction was as follows for the fiscal year ended May 31, 2016:
| | | | |
| | | Dividends-received deduction | |
WealthBuilder Growth Allocation Portfolio | | | 11.76 | % |
Pursuant to Section 852 of the Internal Revenue Code, the following amounts were designated as long-term capital gain distributions for the fiscal year ended May 31, 2016:
| | | | |
| | | Long-term
capital gain
distributions | |
WealthBuilder Conservative Allocation Portfolio | | $ | 11,561,354 | |
WealthBuilder Moderate Balanced Portfolio | | | 28,876,659 | |
WealthBuilder Growth Balanced Portfolio | | | 44,986,175 | |
WealthBuilder Growth Allocation Portfolio | | | 24,150,116 | |
Pursuant to Section 854 of the Internal Revenue Code, the following amounts of income dividends paid during the fiscal year ended May 31, 2016 have been designated as qualified dividend income (QDI):
| | | | |
| | | QDI | |
WealthBuilder Moderate Balanced Portfolio | | $ | 750,045 | |
WealthBuilder Growth Balanced Portfolio | | | 1,164,565 | |
WealthBuilder Growth Allocation Portfolio | | | 560,670 | |
For the fiscal year ended May 31, 2016, the following amounts have been designated as interest-related dividends for nonresident alien shareholders pursuant to Section 871 of the Internal Revenue Code:
| | | | |
| | | Interest-related dividends | |
WealthBuilder Conservative Allocation Portfolio | | $ | 909,357 | |
WealthBuilder Moderate Balanced Portfolio | | | 804,545 | |
WealthBuilder Growth Balanced Portfolio | | | 516,087 | |
WealthBuilder Growth Allocation Portfolio | | | 66,336 | |
For the fiscal year ended May 31, 2016, the following amounts have been designated as short-term capital gain dividends for nonresident alien shareholders pursuant to Section 871 of the Internal Revenue Code:
| | | | |
| | | Short-term capital gain dividends | |
WealthBuilder Conservative Allocation Portfolio | | $ | 2,469,716 | |
WealthBuilder Moderate Balanced Portfolio | | | 4,835,534 | |
WealthBuilder Growth Balanced Portfolio | | | 2,568,962 | |
| | | | |
| 68 | | Wells Fargo WealthBuilder Portfolios | | Other information (unaudited) |
For the fiscal year ended May 31, 2016, the percentage of ordinary income distributed which was derived from interest on U.S. government securities was as follows:
| | | | |
| | | % of U.S. government income | |
WealthBuilder Conservative Allocation Portfolio | | | 2.76 | % |
WealthBuilder Moderate Balanced Portfolio | | | 1.77 | % |
WealthBuilder Growth Balanced Portfolio | | | 1.57 | % |
WealthBuilder Growth Allocation Portfolio | | | 1.08 | % |
PROXY VOTING INFORMATION
A description of the policies and procedures used to determine how to vote proxies relating to portfolio securities is available without charge, upon request, by calling 1-800-222-8222, visiting our website at wellsfargofunds.com, or visiting the SEC website at sec.gov. Information regarding how the proxies related to portfolio securities were voted during the most recent 12-month period ended June 30 is available on the website at wellsfargofunds.com or by visiting the SEC website at sec.gov.
PORTFOLIO HOLDINGS INFORMATION
The complete portfolio holdings are publicly available on the website (wellsfargofunds.com) on a one-month delayed basis. In addition, top ten holdings information (excluding derivative positions) is publicly available on the website on a monthly, seven-day or more delayed basis. Each Portfolio files its complete schedule of portfolio holdings with the SEC for the first and third quarters of each fiscal year on Form N-Q, which is available by visiting the SEC website at sec.gov. In addition, each Form N-Q may be reviewed and copied at the SEC’s Public Reference Room in Washington, DC, and at regional offices in New York City, at 233 Broadway, and in Chicago, at 175 West Jackson Boulevard, Suite 900. Information about the Public Reference Room may be obtained by calling 1-800-SEC-0330.
| | | | | | |
| Other information (unaudited) | | Wells Fargo WealthBuilder Portfolios | | | 69 | |
BOARD OF TRUSTEES AND OFFICERS
Each of the Trustees and Officers1 listed in the table below acts in identical capacities for each fund in the Wells Fargo family of funds, which consists of 142 mutual funds comprising the Wells Fargo Funds Trust, Wells Fargo Variable Trust, Wells Fargo Master Trust and four closed-end funds (collectively the “Fund Complex”). This table should be read in conjunction with the Prospectus and the Statement of Additional Information2. The mailing address of each Trustee and Officer is 525 Market Street, 12th Floor, San Francisco, CA 94105. Each Trustee and Officer serves an indefinite term, however, each Trustee serves such term until reaching the mandatory retirement age established by the Trustees.
Independent Trustees
| | | | | | |
Name and
year of birth | | Position held and
length of service* | | Principal occupations during past five years or longer | | Current other public
company or investment
company directorships |
| William R. Ebsworth (Born 1957) | | Trustee, since 2015 | | Retired. From 1984 to 2013, equities analyst, portfolio manager, research director and chief financial officer at Fidelity Management and Research Company in Boston, Tokyo, and Hong Kong and retired in 2013 as Chief Investment Officer of Fidelity Strategic Advisers, Inc. where he lead a team of investment professionals managing client assets. Prior thereto, Board member of Hong Kong Securities Clearing Co., Hong Kong Options Clearing Corp., the Thailand International Fund, Ltd., Fidelity Investments Life Insurance Company, and Empire Fidelity Investments Life Insurance Company. Mr. Ebsworth is a CFA ® charterholder and an Adjunct Lecturer, Finance, at Babson College. | | Asset Allocation Trust |
| Jane A. Freeman (Born 1953) | | Trustee, since 2015 | | Retired. From 2012 to 2014 and 1999 to 2008, Chief Financial Officer of Scientific Learning Corporation. From 2008 to 2012, Ms. Freeman provided consulting services related to strategic business projects. Prior to 1999, Portfolio Manager at Rockefeller & Co. and Scudder, Stevens & Clark. Board member of the Harding Loevner Funds from 1996 to 2014, serving as both Lead Independent Director and chair of the Audit Committee. Board member of the Russell Exchange Traded Funds Trust from 2011 to 2012 and the chair of the Audit Committee. Ms. Freeman is Chair of Taproot Foundation (non-profit organization), a Board Member of Ruth Bancroft Garden (non-profit organization) and an inactive chartered financial analyst. | | Asset Allocation Trust |
| Peter G. Gordon (Born 1942) | | Trustee, since 1998; Chairman, since 2005 | | Co-Founder, Retired Chairman, President and CEO of Crystal Geyser Water Company. Trustee Emeritus, Colby College. | | Asset Allocation Trust |
| Isaiah Harris, Jr. (Born 1952) | | Trustee, since 2009 | | Retired. Chairman of the Board of CIGNA Corporation since 2009, and Director since 2005. From 2003 to 2011, Director of Deluxe Corporation. Prior thereto, President and CEO of BellSouth Advertising and Publishing Corp. from 2005 to 2007, President and CEO of BellSouth Enterprises from 2004 to 2005 and President of BellSouth Consumer Services from 2000 to 2003. Emeritus member of the Iowa State University Foundation Board of Governors. Emeritus Member of the Advisory Board of Iowa State University School of Business. Advisory Board Member, Palm Harbor Academy (charter school). Advisory Board Member, Child Evangelism Fellowship (non-profit). Mr. Harris is a certified public accountant (inactive status). | | CIGNA Corporation; Asset Allocation Trust |
| Judith M. Johnson (Born 1949) | | Trustee, since 2008; Audit Committee Chairman, since 2008 | | Retired. Prior thereto, Chief Executive Officer and Chief Investment Officer of Minneapolis Employees Retirement Fund from 1996 to 2008. Ms. Johnson is an attorney, certified public accountant and a certified managerial accountant. | | Asset Allocation Trust |
| | | | |
| 70 | | Wells Fargo WealthBuilder Portfolios | | Other information (unaudited) |
| | | | | | |
Name and
year of birth | | Position held and
length of service* | | Principal occupations during past five years or longer | | Current other public
company or investment
company directorships |
| David F. Larcker (Born 1950) | | Trustee, since 2009 | | James Irvin Miller Professor of Accounting at the Graduate School of Business, Stanford University, Director of the Corporate Governance Research Initiative and Senior Faculty of The Rock Center for Corporate Governance since 2006. From 2005 to 2008, Professor of Accounting at the Graduate School of Business, Stanford University. Prior thereto, Ernst & Young Professor of Accounting at The Wharton School, University of Pennsylvania from 1985 to 2005. | | Asset Allocation Trust |
| Olivia S. Mitchell (Born 1953) | | Trustee, since 2006 | | International Foundation of Employee Benefit Plans Professor, Wharton School of the University of Pennsylvania since 1993. Director of Wharton’s Pension Research Council and Boettner Center on Pensions & Retirement Research, and Research Associate at the National Bureau of Economic Research. Previously, Cornell University Professor from 1978 to 1993. | | Asset Allocation Trust |
| Timothy J. Penny (Born 1951) | | Trustee, since 1996 | | President and Chief Executive Officer of Southern Minnesota Initiative Foundation, a non-profit organization, since 2007 and Senior Fellow at the Humphrey Institute Policy Forum at the University of Minnesota since 1995. Member of the Board of Trustees of NorthStar Education Finance, Inc., a non-profit organization, since 2007. | | Asset Allocation Trust |
Michael S. Scofield
(Born 1943) | | Trustee, since 2010 | | Served on the Investment Company Institute’s Board of Governors and Executive Committee from 2008-2011 as well the Governing Council of the Independent Directors Council from 2006-2011 and the Independent Directors Council Executive Committee from 2008-2011. Chairman of the IDC from 2008-2010. Institutional Investor (Fund Directions) Trustee of Year in 2007. Trustee of the Evergreen Funds complex (and its predecessors) from 1984 to 2010. Chairman of the Evergreen Funds from 2000-2010. Former Trustee of the Mentor Funds. Retired Attorney, Law Offices of Michael S. Scofield. | | Asset Allocation Trust |
| * | Length of service dates reflect the Trustee’s commencement of service with the Trust’s predecessor entities, where applicable. |
Officers
| | | | | | |
Name and
year of birth | | Position held and
length of service | | Principal occupations during past five years or longer | | |
| Karla M. Rabusch (Born 1959) | | President, since 2003 | | Executive Vice President of Wells Fargo Bank, N.A. and President of Wells Fargo Funds Management, LLC since 2003. | | |
| Jeremy DePalma1 (Born 1974) | | Treasurer, since 2012 | | Senior Vice President of Wells Fargo Funds Management, LLC since 2009. Senior Vice President of Evergreen Investment Management Company, LLC from 2008 to 2010 and head of the Fund Reporting and Control Team within Fund Administration from 2005 to 2010. | | |
| C. David Messman (Born 1960) | | Secretary, since 2000; Chief Legal Officer, since 2003 | | Senior Vice President and Secretary of Wells Fargo Funds Management, LLC since 2001. Assistant General Counsel of Wells Fargo Bank, N.A. since 2013 and Vice President and Managing Counsel of Wells Fargo Bank, N.A. from 1996 to 2013. | | |
Michael Whitaker
(Born 1967) | | Chief Compliance Officer, since 2016* | | Executive Vice President of Wells Fargo Funds Management, LLC since 2016. Chief Compliance Officer of Fidelity’s Fixed Income Funds and Asset Allocation Funds from 2008 to 2016, Compliance Officer of FMR Co., Inc. from 2014 to 2016, Fidelity Investments Money Management, Inc. from 2014 to 2016, Fidelity Investments from 2007 to 2016. | | |
David Berardi
(Born 1975) | | Assistant Treasurer, since 2009 | | Vice President of Wells Fargo Funds Management, LLC since 2009. Vice President of Evergreen Investment Management Company, LLC from 2008 to 2010. Manager of Fund Reporting and Control for Evergreen Investment Management Company, LLC from 2004 to 2010. | | |
| 1 | Jeremy DePalma acts as Treasurer of 69 funds and Assistant Treasurer of 73 funds in the Fund Complex. |
| 2 | The Statement of Additional Information includes additional information about the Trustees and is available, without charge, upon request, by calling 1-800-222-8222 or by visiting the website at wellsfargofunds.com. |
| * | Michael Whitaker became Chief Compliance Officer effective May 16, 2016. |
| | | | | | |
| Other information (unaudited) | | Wells Fargo WealthBuilder Portfolios | | | 71 | |
BOARD CONSIDERATION OF INVESTMENT MANAGEMENT AND SUB-ADVISORY AGREEMENTS:
Wells Fargo WealthBuilder Conservative Allocation Portfolio, Wells Fargo WealthBuilder Equity Portfolio, Wells Fargo WealthBuilder Growth Allocation Portfolio, Wells Fargo WealthBuilder Growth Balanced Portfolio, Wells Fargo WealthBuilder Moderate Balanced Portfolio and Wells Fargo WealthBuilder Tactical Equity Portfolio
Under the Investment Company Act of 1940 (the “1940 Act”), the Board of Trustees (the “Board”) of Wells Fargo Funds Trust (the “Trust”) must determine annually whether to approve the continuation of the Trust’s investment management and sub-advisory agreements. In this regard, at an in-person meeting held on May 24-25, 2016 (the “Meeting”), the Board, all the members of which have no direct or indirect interest in the investment management and sub-advisory agreements and are not “interested persons” of the Trust, as defined in the 1940 Act (the “Independent Trustees”), reviewed and approved for the Wells Fargo WealthBuilder Conservative Allocation Portfolio, Wells Fargo WealthBuilder Equity Portfolio, Wells Fargo WealthBuilder Growth Allocation Portfolio, Wells Fargo WealthBuilder Growth Balanced Portfolio, Wells Fargo WealthBuilder Moderate Balanced Portfolio and Wells Fargo WealthBuilder Tactical Equity Portfolio (collectively, the “Funds”): (i) an investment management agreement (the “Management Agreement”) with Wells Fargo Funds Management, LLC (“Funds Management”); and (ii) an investment sub-advisory agreement (the “Sub-Advisory Agreement”) with Wells Capital Management Incorporated (the “Sub-Adviser”), an affiliate of Funds Management. The Management Agreement and the Sub-Advisory Agreement are collectively referred to as the “Advisory Agreements.”
At the Meeting, the Board considered the factors and reached the conclusions described below relating to the selection of Funds Management and the Sub-Adviser and the approval of the Advisory Agreements. Prior to the Meeting, including at an in-person meeting in April 2016, the Trustees conferred extensively among themselves and with representatives of Funds Management about these matters. Also, the Board has adopted a team-based approach, with each team consisting of a sub-set of Trustees, to assist the full Board in the discharge of its duties in reviewing performance and other matters throughout the year. The Independent Trustees were assisted in their evaluation of the Advisory Agreements by independent legal counsel, from whom they received separate legal advice and with whom they met separately.
In providing information to the Board, Funds Management and the Sub-Adviser were guided by a detailed set of requests for information submitted to them by independent legal counsel on behalf of the Independent Trustees at the start of the Board’s annual contract renewal process earlier in 2016. In considering and approving the Advisory Agreements, the Trustees considered the information they believed relevant, including but not limited to the information discussed below. The Board considered not only the specific information presented in connection with the Meeting, but also the knowledge gained over time through interaction with Funds Management and the Sub-Adviser about various topics. In this regard, the Board reviewed reports of Funds Management at each of its quarterly meetings, which included, among other things, portfolio reviews and performance reports. In addition, the Board and the teams mentioned above confer with portfolio managers at various times throughout the year. The Board noted that at its February 2016 meeting, the Board approved the merger of the WealthBuilder Equity Portfolio into the WealthBuilder Tactical Equity Portfolio, pending shareholder approval. The Board did not identify any particular information or consideration that was all-important or controlling, and each individual Trustee may have attributed different weights to various factors.
After its deliberations, the Board unanimously approved the continuation of the Advisory Agreements for a one-year term. The Board also determined that the compensation payable to Funds Management and the Sub-Adviser under each of the Advisory Agreements was reasonable. The Board considered the approval of the Advisory Agreements for the Funds as part of its consideration of agreements for funds across the complex, but its approvals were made on a fund-by-fund basis. The following summarizes a number of important, but not necessarily all, factors considered by the Board in support of its approvals.
Nature, extent and quality of services
The Board received and considered various information regarding the nature, extent and quality of services provided to the Funds by Funds Management and the Sub-Adviser under the Advisory Agreements. This information included a description of the investment advisory services and Fund-level administrative services covered by the Management Agreement, as well as, among other things, a summary of the background and experience of senior management of Funds Management, and the qualifications, background, tenure and responsibilities of each of the portfolio managers primarily responsible for the day-to-day portfolio management of the Funds.
At the Meeting, the Board also received and considered a presentation that the Trustees had requested from Funds Management, which reviewed, among other things, the Funds and their investment strategies, the Funds’ tactical asset allocation process, a volatility analysis, an assessment of performacne and the process of evaluating and selecting unaffiliated underlying mutual funds.
| | | | |
| 72 | | Wells Fargo WealthBuilder Portfolios | | Other information (unaudited) |
The Board evaluated the ability of Funds Management and the Sub-Adviser to attract and retain qualified investment professionals, including research, advisory and supervisory personnel. The Board further considered the compliance programs and compliance records of Funds Management and the Sub-Adviser. In addition, the Board took into account the full range of services provided to the Funds by Funds Management and its affiliates.
Fund performance and expenses
The Board considered the performance results for the Funds over various time periods ended December 31, 2015. The Board considered each Fund’s performance results in comparison to the performance of funds in a universe that was determined by Broadridge Inc. (“Broadridge”) to be similar to the Fund (the “Universe”), and in comparison to each Fund’s benchmark index and to other comparative data. Broadridge is an independent provider of investment company data. The Board received a description of the methodology used by Broadridge to select the mutual funds in the performance Universe.
The Board noted that the performance of each Fund relative to its respective Universe was as follows: (i) the performance of the WealthBuilder Conservative Allocation Portfolio was lower than the average performance of its Universe for all periods under review except the one-year period; (ii) the performance of the WealthBuilder Equity Portfolio was higher than the average performance of its Universe for all periods under review except the ten-year period; (iii) the performance of the WealthBuilder Growth Allocation Portfolio was higher than the average performance of its Universe for all periods under review except the five- and ten-year periods; (iv) the performance of the WealthBuilder Growth Balanced Portfolio was lower than the average performance of its Universe for all periods under review except the one-year period; (v) the performance of the WealthBuilder Moderate Balanced Portfolio was lower than the average performance of its Universe for all periods under review except the one-year period; and (vi) the performance of the WealthBuilder Tactical Equity Portfolio was lower than the average performance of its Universe for all periods under review.
The Board also noted that the performance of each Fund relative to its respective benchmark was as follows: (i) the performance of the WealthBuilder Conservative Allocation Portfolio was lower than the performance of its benchmark, the WealthBuilder Conservative Allocation Composite Index, which is a proprietary index used by the Board to help it assess the Fund’s relative performance, for all periods under review; (ii) the performance of the WealthBuilder Equity Portfolio was lower than the performance of its benchmark, the WealthBuilder Equity Composite Index, which is a proprietary index used by the Board to help it assess the Fund’s relative performance, for all periods under review except the one-year period; (iii) the performance of the WealthBuilder Growth Allocation Portfolio was lower than the performance of its benchmark, the WealthBuilder Growth Allocation Composite Index, which is a proprietary index used by the Board to help it assess the Fund’s relative performance, for all periods under review; (iv) the performance of the WealthBuilder Growth Balanced Portfolio was lower than the performance of its benchmark, the WealthBuilder Growth Balanced Composite Index, which is a proprietary index used by the Board to help it assess the Fund’s relative performance, for all periods under review except the three-year period; (v) the performance of the WealthBuilder Moderate Balanced Portfolio was lower than the performance of its benchmark, the WealthBuilder Moderate Balanced Composite Index, which is a proprietary index used by the Board to help it assess the Fund’s relative performance, for all periods under review; and (vi) the performance of the WealthBuilder Tactical Equity Portfolio was lower than the performance of its benchmark, the WealthBuilder Tactical Equity Composite Index, which is a proprietary index used by the Board to help it assess the Fund’s relative performance, for all periods under review except the one-year period.
The Board received information concerning, and discussed factors contributing to, the relative underperformance of certain Funds for certain periods as noted above. The Board took note of the explanations for the relative underperformance in these periods, including with respect to the market conditions and investment decisions that affected the relevant Funds’ performance, and of recent improved relative performance. The Board noted that a new portfolio management team assumed investment management responsibilities for the Funds in 2013.
The Board also received and considered information regarding each Fund’s net operating expense ratios and their various components, including actual management fees, custodian and other non-management fees, and Rule 12b-1 and non-Rule 12b-1 shareholder service fees. The Board considered these ratios for each Fund in comparison to the median ratios of funds in expense groups that were determined by Broadridge to be similar to the Fund (the “Groups”). The Board received a description of the methodology used by Broadridge to select the mutual funds in the expense Groups and an explanation of how funds comprising expense groups and their expense ratios may vary from year-to-year.
Based on the Broadridge reports, the Board noted that: (i) the net operating expense ratio of the WealthBuilder Conservative Allocation Portfolio, including underlying mutual fund expenses, was in range of the median net operating expense ratio of its expense Group; (ii) the net operating expense ratio of the WealthBuilder Equity Portfolio, including
| | | | | | |
| Other information (unaudited) | | Wells Fargo WealthBuilder Portfolios | | | 73 | |
underlying mutual fund expenses, was higher than the median net operating expense ratio of its expense Group; (iii) the net operating expense ratio of the WealthBuilder Growth Allocation Portfolio, including underlying mutual fund expenses, was higher than the median net operating expense ratio of its expense Group; (iv) the net operating expense ratio of the WealthBuilder Growth Balanced Portfolio, including underlying mutual fund expenses, was in range of the median net operating expense ratio of its expense Group; (v) the net operating expense ratio of the WealthBuilder Moderate Balanced Portfolio, including underlying mutual fund expenses, was higher than the median net operating expense ratio of its expense Group; and (vi) the net operating expense ratio of the WealthBuilder Tactical Equity Portfolio, including underlying mutual fund expenses, was higher than the median net operating expense ratio of its expense Group. The Board noted that the Funds invest in both affiliated and unaffiliated underlying mutual funds, while most of the funds included in each expense Group, and all of the funds identified by Funds Management as being in a competitor sub-group, invest only in affiliated funds. The Board also considered that the Funds are designed to offer exposure to a wide range of investment styles, including alternatives, while maintaining a low investment minimum.
The Board took into account the Fund performance and expense information provided to it among the factors considered in deciding to re-approve the Advisory Agreements.
Investment management and sub-advisory fee rates
The Board reviewed and considered the contractual fee rates payable by the Funds to Funds Management under the Management Agreement, as well as the contractual fee rates payable by the Funds to Funds Management for class-level administrative services under a Class-Level Administration Agreement, which include class-level transfer agency and sub-transfer agency costs (collectively, the “Management Rates”). The Board also reviewed and considered the contractual investment sub-advisory fee rates that are payable by Funds Management to the Sub-Adviser for investment sub-advisory services.
Among other information reviewed by the Board was a comparison of the Funds’ Management Rates with the average contractual investment management fee rates of funds in the expense Groups at a common asset level as well as transfer agency costs of the funds in the expense Groups. The Board noted that the Management Rate for each Fund was higher than the average rate for the Fund’s expense Group. The Board also noted that the Funds are among the few funds-of-funds utilizing both affiliated and unaffiliated underlying funds, and received information from Funds Management about the process and resources required to evaluate and select unaffiliated underlying mutual funds.
The Board also received and considered information about the portion of the total management fee that was retained by Funds Management after payment of the fee to the Sub-Adviser for sub-advisory services. In assessing the reasonableness of this amount, the Board received and evaluated information about the nature and extent of responsibilities retained and risks assumed by Funds Management and not delegated to or assumed by the Sub-Adviser, and about Funds Management’s on-going oversight services. However, given the affiliation between Funds Management and the Sub-Adviser, the Board ascribed limited relevance to the allocation of the fees between them.
Based on its consideration of the factors and information it deemed relevant, including those described here, the Board determined that the compensation payable to Funds Management under the Management Agreement and to the Sub-Adviser under the Sub-Advisory Agreement was reasonable, in light of the services covered by the Advisory Agreements.
Profitability
The Board received and considered information concerning the profitability of Funds Management, as well as the profitability of Wells Fargo as a whole, from providing services to the Funds and the fund family as a whole. The Board also received and considered information concerning the profitability of the Sub-Adviser from providing services to the fund family as a whole, noting that the Sub-Adviser’s profitability information with respect to providing services to the Funds was subsumed in the Wells Fargo and Funds Management profitability analysis.
Funds Management reported on the methodologies and estimates used in calculating profitability. Among other things, the Board noted that the levels of profitability reported on a fund-by-fund basis varied widely, depending on factors such as the size and type of fund. Based on its review, the Board did not deem the profits reported by Funds Management or Wells Fargo from its services to the Funds to be at a level that would prevent it from approving the continuation of the Advisory Agreements.
Economies of scale
With respect to possible economies of scale, the Board noted the existence of breakpoints in the Funds’ management fee structure, which operate generally to reduce the Funds’ expense ratios as the Funds grow in size. It considered that, for a small fund or a fund that shrinks in size, breakpoints conversely can result in higher fee levels. The Board also considered
| | | | |
| 74 | | Wells Fargo WealthBuilder Portfolios | | Other information (unaudited) |
that fee waiver and expense reimbursement arrangements and competitive fee rates at the outset are means of sharing potential economies of scale with shareholders of the Funds and the fund family as a whole. The Board considered Funds Management’s view that any analyses of potential economies of scale in managing a particular fund are inherently limited in light of the joint and common costs and investments that Funds Management incurs across the fund family as a whole.
The Board concluded that the Funds’ fee and expense arrangements, including contractual breakpoints, constituted a reasonable approach to sharing potential economies of scale with the Funds and their shareholders.
Other benefits to Funds Management and the Sub-Adviser
The Board received and considered information regarding potential “fall-out” or ancillary benefits received by Funds Management and its affiliates, including the Sub-Adviser, as a result of their relationships with the Funds. Ancillary benefits could include, among others, fees received from affiliated underlying mutual funds and benefits directly attributable to other relationships with the Funds and benefits potentially derived from an increase in Funds Management’s and the Sub-Adviser’s business as a result of their relationships with the Funds. The Board noted that various affiliates of Funds Management may receive distribution-related fees, shareholder servicing payments and sub-transfer agency fees in respect of shares sold or held through them and services provided.
The Board also reviewed information about soft dollar credits earned and utilized by the Sub-Adviser, fees earned by Funds Management and the Sub-Adviser from managing a private investment vehicle for the fund family’s securities lending collateral and commissions earned by an affiliated broker from portfolio transactions.
Based on its consideration of the factors and information it deemed relevant, including those described here, the Board did not find that any ancillary benefits received by Funds Management and its affiliates, including the Sub-Adviser, were unreasonable.
Conclusion
At the Meeting, after considering the above-described factors and based on its deliberations and its evaluation of the information described above, the Board unanimously approved the continuation of the Advisory Agreements for a one-year term. The Board also determined that the compensation payable to Funds Management and the Sub-Adviser under each of the Advisory Agreements was reasonable.
| | | | | | |
| List of abbreviations | | Wells Fargo WealthBuilder Portfolios | | | 75 | |
The following is a list of common abbreviations for terms and entities that may have appeared in this report.
| ACA | — ACA Financial Guaranty Corporation |
| ADR | — American depositary receipt |
| ADS | — American depositary shares |
| AGC | — Assured Guaranty Corporation |
| AGM | — Assured Guaranty Municipal |
| Ambac | — Ambac Financial Group Incorporated |
| AMT | — Alternative minimum tax |
| BAN | — Bond anticipation notes |
| BHAC | — Berkshire Hathaway Assurance Corporation |
| CAB | — Capital appreciation bond |
| CCAB | — Convertible capital appreciation bond |
| CDA | — Community Development Authority |
| CDO | — Collateralized debt obligation |
| DRIVER | — Derivative inverse tax-exempt receipts |
| DW&P | — Department of Water & Power |
| DWR | — Department of Water Resources |
| ECFA | — Educational & Cultural Facilities Authority |
| EDA | — Economic Development Authority |
| EDFA | — Economic Development Finance Authority |
| ETF | — Exchange-traded fund |
| FDIC | — Federal Deposit Insurance Corporation |
| FFCB | — Federal Farm Credit Banks |
| FGIC | — Financial Guaranty Insurance Corporation |
| FHA | — Federal Housing Administration |
| FHLB | — Federal Home Loan Bank |
| FHLMC | — Federal Home Loan Mortgage Corporation |
| FICO | — The Financing Corporation |
| FNMA | — Federal National Mortgage Association |
| GDR | — Global depositary receipt |
| GNMA | — Government National Mortgage Association |
| HCFR | — Healthcare facilities revenue |
| HEFA | — Health & Educational Facilities Authority |
| HEFAR | — Higher education facilities authority revenue |
| HFA | — Housing Finance Authority |
| HFFA | — Health Facilities Financing Authority |
| HUD | — Department of Housing and Urban Development |
| IDA | — Industrial Development Authority |
| IDAG | — Industrial Development Agency |
| KRW | — Republic of Korea won |
| LIBOR | — London Interbank Offered Rate |
| LIFER | — Long Inverse Floating Exempt Receipts |
| LLC | — Limited liability company |
| LLLP | — Limited liability limited partnership |
| LLP | — Limited liability partnership |
| MBIA | — Municipal Bond Insurance Association |
| MFHR | — Multifamily housing revenue |
| MSTR | — Municipal securities trust receipts |
| MUD | — Municipal Utility District |
| National | — National Public Finance Guarantee Corporation |
| PCFA | — Pollution Control Financing Authority |
| PCL | — Public Company Limited |
| PCR | — Pollution control revenue |
| PFA | — Public Finance Authority |
| PFFA | — Public Facilities Financing Authority |
| PFOTER | — Puttable floating option tax-exempt receipts |
| plc | — Public limited company |
| PUTTER | — Puttable tax-exempt receipts |
| R&D | — Research & development |
| Radian | — Radian Asset Assurance |
| RAN | — Revenue anticipation notes |
| RDA | — Redevelopment Authority |
| RDFA | — Redevelopment Finance Authority |
| REIT | — Real estate investment trust |
| ROC | — Reset option certificates |
| SAVRS | — Select auction variable rate securities |
| SBA | — Small Business Authority |
| SDR | — Swedish depositary receipt |
| SFHR | — Single-family housing revenue |
| SFMR | — Single-family mortgage revenue |
| SPA | — Standby purchase agreement |
| SPDR | — Standard & Poor’s Depositary Receipts |
| SPEAR | — Short Puttable Exempt Adjustable Receipts |
| STRIPS | — Separate trading of registered interest and |
| TAN | — Tax anticipation notes |
| TIPS | — Treasury inflation-protected securities |
| TRAN | — Tax revenue anticipation notes |
| TTFA | — Transportation Trust Fund Authority |
| TVA | — Tennessee Valley Authority |
This page is intentionally left blank.

For more information
More information about Wells Fargo Funds is available free upon request. To obtain literature, please write, email, visit the Portfolios’ website, or call:
Wells Fargo Funds
P.O. Box 8266
Boston, MA 02266-8266
Email: fundservice@wellsfargo.com
Website: wellsfargofunds.com
Individual investors: 1-800-222-8222
Retail investment professionals: 1-888-877-9275
Institutional investment professionals: 1-866-765-0778
This report and the financial statements contained herein are submitted for the general information of the shareholders of the Portfolios. If this report is used for promotional purposes, distribution of the report must be accompanied or preceded by a current prospectus. Before investing, please consider the investment objectives, risks, charges, and expenses of the investment. For a current prospectus and, if available, a summary prospectus, containing this information, call 1-800-222-8222 or visit the Portfolios’ website at wellsfargofunds.com. Read the prospectus carefully before you invest or send money.
Wells Fargo Asset Management (WFAM) is a trade name used by the asset management businesses of Wells Fargo & Company. Wells Fargo Funds Management, LLC, a wholly owned subsidiary of Wells Fargo & Company, provides investment advisory and administrative services for Wells Fargo Funds. Other affiliates of Wells Fargo & Company provide subadvisory and other services for the funds. The funds are distributed by Wells Fargo Funds Distributor, LLC, Member FINRA, an affiliate of Wells Fargo & Company.
NOT FDIC INSURED ¡ NO BANK GUARANTEE ¡ MAY LOSE VALUE
© 2016 Wells Fargo Funds Management, LLC. All rights reserved.
| | |
 | | 243139 07-16 AWBP/AR102 05-16 |
Annual Report
May 31, 2016

Dynamic Target Date Funds

| n | | Wells Fargo Dynamic Target Today Fund |
| n | | Wells Fargo Dynamic Target 2015 Fund |
| n | | Wells Fargo Dynamic Target 2020 Fund |
| n | | Wells Fargo Dynamic Target 2025 Fund |
| n | | Wells Fargo Dynamic Target 2030 Fund |
| n | | Wells Fargo Dynamic Target 2035 Fund |
| n | | Wells Fargo Dynamic Target 2040 Fund |
| n | | Wells Fargo Dynamic Target 2045 Fund |
| n | | Wells Fargo Dynamic Target 2050 Fund |
| n | | Wells Fargo Dynamic Target 2055 Fund |
| n | | Wells Fargo Dynamic Target 2060 Fund |

Reduce clutter. Save trees.
Sign up for electronic delivery of prospectuses and shareholder reports at wellsfargo.com/advantagedelivery
Contents
The views expressed and any forward-looking statements are as of May 31, 2016, unless otherwise noted, and are those of the Fund managers and/or Wells Fargo Funds Management, LLC. Discussions of individual securities, or the markets generally, or any Wells Fargo Fund are not intended as individual recommendations. Future events or results may vary significantly from those expressed in any forward-looking statements. The views expressed are subject to change at any time in response to changing circumstances in the market. Wells Fargo Funds Management, LLC and the Funds disclaim any obligation to publicly update or revise any views expressed or forward-looking statements.
NOT FDIC INSURED ¡ NO BANK GUARANTEE ¡ MAY LOSE VALUE
| | | | |
| 2 | | Wells Fargo Dynamic Target Date Funds | | Letter to shareholders (unaudited) |

Karla M. Rabusch
President
Wells Fargo Funds
During much of the period, global equity, bond, and currency markets were volatile as recessionary pressures and diverging central bank policies concerned investors.
During the last month of 2015, Japan’s economy contracted, China’s manufacturing sector retrenched, and growth appeared to slow in Europe.
Dear Valued Shareholder:
We are pleased to offer you this annual report for the Wells Fargo Dynamic Target Date Funds since commencement of operations on November 30, 2015 through May 31, 2016. During much of the period, global equity, bond, and currency markets were volatile as recessionary pressures and diverging central bank policies concerned investors. As the period closed, investor confidence appeared to improve based on favorable economic data in key markets and central bank monetary policies that were intended to support increased business activity.
Shifting investor sentiment reflected changing economic and business data.
The S&P 500 Index,1 a common measure of U.S. stock performance recorded a gain of 1.92% for the six-month reporting period that ended May 31, 2016. As anticipated, the U.S. Federal Reserve (Fed) increased the federal funds rate in December and suggested it planned to pursue additional increases in 2016. During the first six weeks of 2016, the index suffered the worst loss to open a year on record before trending higher through the end of May 2016. While the U.S. dollar strengthened, which negatively affected investment returns and U.S. corporate profits earned overseas, improving domestic economic data and the Fed’s indications that it would maintain accommodative monetary policies helped improve investor sentiment.
Overseas, the People’s Bank of China (PBOC) allowed the value of the country’s currency to decline in an attempt to bolster exports. The U.S. dollar strengthened, which negatively affected investment returns and U.S. corporate profits earned overseas. During the last month of 2015, Japan’s economy contracted, China’s manufacturing sector retrenched, and growth appeared to slow in Europe.
Global equity markets hit low points before starting to rebound in the middle of February 2016 when business data improved and central bankers reasserted their commitment to initiatives intended to encourage economic activity. The European Central Bank (ECB) pushed the deposit interest rate further into negative territory. The Bank of Japan (BOJ) followed the ECB’s lead by setting a negative deposit rate. Negative deposit interest rates are intended to encourage banks to lend assets rather than keep them on deposit. The PBOC reduced reserve ratios, which also was intended to encourage lending. The ECB expanded its bond-buying program, which injects liquidity into the markets and encourages investment.
For the six-month reporting period, the Morgan Stanley Capital International (MSCI) All Country World Index (ACWI) ex USA Index (Net)2 and MSCI Emerging Markets (EM) Index (Net)3 recorded returns of -1.37% and 0.04%, respectively.
A December federal funds rate increase marked divergence of central bank policies.
Bond markets were volatile as well. The Fed’s decision to tighten credit conditions through higher interest rates contrasted with actions by the ECB, the PBOC, and the BOJ. In January 2016, amid falling stock markets, U.S. corporate profits declined for the
| 1 | The S&P 500 Index consists of 500 stocks chosen for market size, liquidity, and industry group representation. It is a market-value-weighted index with each stock’s weight in the index proportionate to its market value. You cannot invest directly in an index. |
| 2 | The Morgan Stanley Capital International (MSCI) All Country World Index (ACWI) ex USA Index (Net) is a free-float-adjusted market-capitalization-weighted index that is designed to measure the equity market performance of developed markets, excluding the U.S. and Canada. Source: MSCI. MSCI makes no express or implied warranties or representations and shall have no liability whatsoever with respect to any MSCI data contained herein. The MSCI data may not be further redistributed or used as a basis for other indexes or any securities or financial products. This report is not approved, reviewed, or produced by MSCI. You cannot invest directly in an index. |
| 3 | The MSCI Emerging Markets (EM) Index (Net) is a free-float-adjusted market-capitalization-weighted index that is designed to measure the equity market performance of emerging markets. The MSCI EM Index (Net) consists of the following 23 emerging markets country indexes: Brazil, Chile, China, Colombia, Czech Republic, Egypt, Greece, Hungary, India, Indonesia, Korea, Malaysia, Mexico, Peru, the Philippines, Poland, Qatar, Russia, South Africa, Taiwan, Thailand, Turkey, and United Arab Emirates. You cannot invest directly in an index. You cannot invest directly in an index. |
| | | | | | |
| Letter to shareholders (unaudited) | | Wells Fargo Dynamic Target Date Funds | | | 3 | |
second consecutive quarter. The Fed expressed hesitancy about additional credit tightening in the near term, which investors appeared to read as accommodative of business activity. Overall, policy actions of central banks and intermittently positive economic data heartened investors as the period drew to a close.
Bond markets benefited during the period, with the Barclays Global Aggregate ex U.S. Dollar Bond Index4 gaining 9.17%, the Barclays U.S. Aggregate Bond Index5 gaining 6.43%, and the Barclays U.S. Treasury Index6 adding 2.92% during the period.
Don’t let short-term uncertainty derail long-term investment goals.
Periods of investment uncertainty can present challenges, but experience has taught us that maintaining long-term investment goals can be an effective way to plan for the future. To help you create a sound strategy based on your personal goals and risk tolerance, Wells Fargo Funds offers more than 100 mutual funds spanning a wide range of asset classes and investment styles. Although diversification cannot guarantee an investment profit or prevent losses, we believe it can be an effective way to manage investment risk and potentially smooth out overall portfolio performance. We encourage investors to know their investments and to understand that appropriate levels of risk-taking may unlock opportunities.
Thank you for choosing to invest with Wells Fargo Funds. We appreciate your confidence in us and remain committed to helping you meet your financial needs.
Sincerely,

Karla M. Rabusch
President
Wells Fargo Funds
Notice to shareholders
British Exit from European Union (“Brexit”)
On June 23, 2016, the United Kingdom (UK) voted to leave the European Union (EU). It is expected that the UK’s exit from the EU will take place within two years after giving formal notice to the EU of its intention to withdraw; however, the exact timeframe is unknown. There is considerable uncertainty about how the UK exit from the EU will be conducted, how negotiations of necessary treaties and trade agreements will proceed or how the financial markets will react. In addition, it is not yet known whether Brexit will increase the likelihood of other countries seeking to depart the EU. Immediately following the vote, markets in the UK, Europe and the world were negatively impacted. In light of the uncertainties surrounding the impact of Brexit on the broader global economy, the negative impact could be significant, potentially resulting in increased volatility and illiquidity and lower economic growth for companies that rely significantly on Europe for their business activities and revenues. Any further exits from the EU, or the possibility of such exits, would likely cause additional market disruption globally and introduce new legal and regulatory uncertainties.
For further information about your Fund, contact your investment professional, visit our website at wellsfargofunds.com, or call us directly at 1-800-222-8222. We are available 24 hours a day, 7 days a week.
| 4 | The Barclays Global Aggregate ex U.S. Dollar Bond Index tracks an international basket of government, corporate, agency, and mortgage-related bonds. You cannot invest directly in an index. |
| 5 | The Barclays U.S. Aggregate Bond Index is a broad-based benchmark that measures the investment-grade, U.S. dollar–denominated, fixed-rate taxable bond market, including Treasuries, government-related and corporate securities, mortgage-backed securities (agency fixed-rate and hybrid adjustable-rate mortgage pass-throughs), asset-backed securities, and commercial mortgage-backed securities. You cannot invest directly in an index. |
| 6 | The Barclays U.S. Treasury Index is an unmanaged index of prices of U.S. Treasury bonds with maturities of 1 to 30 years. You cannot invest directly in an index. |
| | | | |
| 4 | | Wells Fargo Dynamic Target Date Funds | | Performance highlights (unaudited) |
Wells Fargo Dynamic Target Date Funds
Investment objective
Each Fund seeks total return over time, consistent with its strategic target allocation
| | |
Wells Fargo Dynamic Target Date Funds | | Corresponding S&P Target Date Index |
| Dynamic Target Today Fund | | S&P Target Date Retirement Income Index |
| Dynamic Target 2015 Fund | | S&P Target Date 2015 Index |
| Dynamic Target 2020 Fund | | S&P Target Date 2020 Index |
| Dynamic Target 2025 Fund | | S&P Target Date 2025 Index |
| Dynamic Target 2030 Fund | | S&P Target Date 2030 Index |
| Dynamic Target 2035 Fund | | S&P Target Date 2035 Index |
| Dynamic Target 2040 Fund | | S&P Target Date 2040 Index |
| Dynamic Target 2045 Fund | | S&P Target Date 2045 Index |
| Dynamic Target 2050 Fund | | S&P Target Date 2050 Index |
| Dynamic Target 2055 Fund | | S&P Target Date 2055+ Index |
| Dynamic Target 2060 Fund | | S&P Target Date 2055+ Index |
Manager
Wells Fargo Funds Management, LLC
Subadviser
Wells Capital Management Incorporated
Portfolio managers
Christian Chan, CFA®
Kandarp Acharya, CFA®, FRM
The target date represents the year in which investors may likely begin withdrawing assets. Each Fund gradually seeks to reduce market risk as the target date approaches and after it arrives by decreasing equity exposure and increasing fixed income exposure. The principal value is not guaranteed at any time, including at the target date.
The Funds invest using alternative investment strategies such as equity hedged, event driven, global macro, and relative value, which are speculative and entail a high degree of risk. Alternative investments, such as short sales, commodities and merger arbitrage strategies, are speculative and entail a high degree of risk. Stock values fluctuate in response to the activities of individual companies and general market and economic conditions. Bond values fluctuate in response to the financial condition of individual issuers, general market and economic conditions, and changes in interest rates. Changes in market conditions and government policies may lead to periods of heightened volatility in the bond market and reduced liquidity for certain bonds held by each Fund. In general, when interest rates rise, bond values fall and investors may lose principal value. Interest-rate changes and their impact on each Fund and its share price can be sudden and unpredictable. High-yield securities have a greater risk of default and tend to be more volatile than higher-rated debt securities. The use of derivatives may reduce returns and/or increase volatility. Securities issued by U.S. government agencies or government-sponsored entities may not be guaranteed by the U.S. Treasury. Certain investment strategies tend to increase the total risk of an investment (relative to the broader market). Each Fund is exposed to foreign investment risk, mortgage- and asset-backed securities risk, new fund risk, regulatory risk, and smaller-company investment risk. Consult each Fund’s prospectus for additional information on these and other risks.
| | | | | | |
| Performance highlights (unaudited) | | Wells Fargo Dynamic Target Date Funds | | | 5 | |
Dynamic Target Today Fund
Average annual total returns (%) as of May 31, 2016
| | | | | | | | | | | | | | | | | | |
| | | | | Including sales
charge | | | Excluding sales
charge | | | Expense ratios1 (%) | |
| | | Inception date | | Since inception | | | Since inception | | | Gross | | | Net2 | |
| Class A (WDYAX) | | 11-30-2015 | | | (5.05 | ) | | | 0.75 | * | | | 1.38 | | | | 0.98 | |
| Class C (WDYCX) | | 11-30-2015 | | | (0.62 | ) | | | 0.38 | * | | | 2.13 | | | | 1.73 | |
| Class R (WDYRX) | | 11-30-2015 | | | – | | | | 0.63 | * | | | 1.63 | | | | 1.23 | |
| Class R4 (WDYYX) | | 11-30-2015 | | | – | | | | 0.98 | * | | | 1.05 | | | | 0.67 | |
| Class R6 (WDYZX) | | 11-30-2015 | | | – | | | | 0.99 | * | | | 0.90 | | | | 0.52 | |
| S&P Target Date Retirement Income Index3 | | – | | | – | | | | 2.04 | | | | – | | | | – | |
| * | | Total return differs from the return in the Financial Highlights in this report. The total return presented is calculated based on the NAV at which shareholder transactions were processed. The NAV and total return presented in the Financial Highlights reflects certain adjustments made to the net assets of the Fund that are necessary under U.S. generally accepted accounting principles. |
Figures quoted represent past performance, which is no guarantee of future results, and do not reflect taxes that a shareholder may pay on fund distributions or the redemption of fund shares. Investment return and principal value of an investment will fluctuate so that an investor’s shares, when redeemed, may be worth more or less than their original cost. Performance shown without sales charges would be lower if sales charges were reflected. Current performance may be lower or higher than the performance data quoted and assumes the reinvestment of dividends and capital gains. Current month-end performance is available on the Fund’s website, wellsfargofunds.com.
Index returns do not include transaction costs associated with buying and selling securities, any mutual fund fees or expenses, or any taxes. It is not possible to invest directly in an index.
For Class A shares, the maximum front-end sales charge is 5.75%. For Class C shares, the maximum contingent deferred sales charge is 1.00%. Performance including a contingent deferred sales charge assumes the sales charge for the corresponding time period. Class R, Class R4 and Class R6 shares are sold without a front-end sales charge or contingent deferred sales charge.
|
| Growth of $10,000 investment as of May 31, 20164 |
|
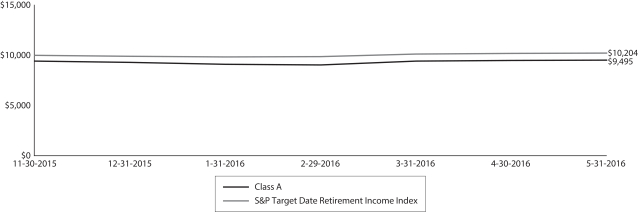
|
Please see footnotes on page 20.
| | | | |
| 6 | | Wells Fargo Dynamic Target Date Funds | | Performance highlights (unaudited) |
Dynamic Target 2015 Fund
Average annual total returns (%) as of May 31, 2016
| | | | | | | | | | | | | | | | | | |
| | | | | Including sales
charge | | | Excluding sales
charge | | | Expense ratios5 (%) | |
| | | Inception date | | Since inception | | | Since inception | | | Gross | | | Net2 | |
| Class A (WDTAX) | | 11-30-2015 | | | (5.53 | ) | | | 0.24 | * | | | 1.40 | | | | 1.00 | |
| Class C (WDTCX) | | 11-30-2015 | | | (1.13 | ) | | | (0.13 | )* | | | 2.15 | | | | 1.75 | |
| Class R (WDTRX) | | 11-30-2015 | | | – | | | | 0.12 | * | | | 1.65 | | | | 1.25 | |
| Class R4 (WDTYX) | | 11-30-2015 | | | – | | | | 0.37 | * | | | 1.07 | | | | 0.69 | |
| Class R6 (WDTZX) | | 11-30-2015 | | | – | | | | 0.48 | * | | | 0.92 | | | | 0.54 | |
| S&P Target Date 2015 Index3 | | – | | | – | | | | 1.74 | | | | – | | | | – | |
| * | | Total return differs from the return in the Financial Highlights in this report. The total return presented is calculated based on the NAV at which shareholder transactions were processed. The NAV and total return presented in the Financial Highlights reflects certain adjustments made to the net assets of the Fund that are necessary under U.S. generally accepted accounting principles. |
Figures quoted represent past performance, which is no guarantee of future results, and do not reflect taxes that a shareholder may pay on fund distributions or the redemption of fund shares. Investment return and principal value of an investment will fluctuate so that an investor’s shares, when redeemed, may be worth more or less than their original cost. Performance shown without sales charges would be lower if sales charges were reflected. Current performance may be lower or higher than the performance data quoted and assumes the reinvestment of dividends and capital gains. Current month-end performance is available on the Fund’s website, wellsfargofunds.com.
Index returns do not include transaction costs associated with buying and selling securities, any mutual fund fees or expenses, or any taxes. It is not possible to invest directly in an index.
For Class A shares, the maximum front-end sales charge is 5.75%. For Class C shares, the maximum contingent deferred sales charge is 1.00%. Performance including a contingent deferred sales charge assumes the sales charge for the corresponding time period. Class R, Class R4 and Class R6 shares are sold without a front-end sales charge or contingent deferred sales charge.
|
| Growth of $10,000 investment as of May 31, 20164 |
|
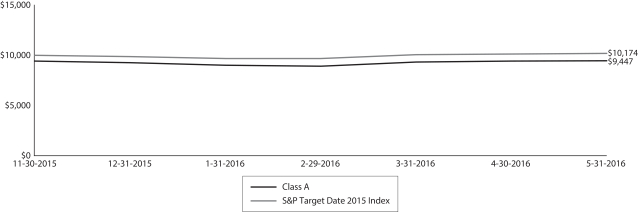
|
Please see footnotes on page 20.
| | | | | | |
| Performance highlights (unaudited) | | Wells Fargo Dynamic Target Date Funds | | | 7 | |
Dynamic Target 2020 Fund
Average annual total returns (%) as of May 31, 2016
| | | | | | | | | | | | | | | | | | |
| | | | | Including sales
charge | | | Excluding sales
charge | | | Expense ratios6 (%) | |
| | | Inception date | | Since inception | | | Since inception | | | Gross | | | Net2 | |
| Class A (WDTDX) | | 11-30-2015 | | | (5.51 | ) | | | 0.25 | * | | | 1.42 | | | | 1.02 | |
| Class C (WDTEX) | | 11-30-2015 | | | (1.09 | ) | | | (0.09 | )* | | | 2.17 | | | | 1.77 | |
| Class R (WDTFX) | | 11-30-2015 | | | – | | | | 0.16 | * | | | 1.67 | | | | 1.27 | |
| Class R4 (WDTGX) | | 11-30-2015 | | | – | | | | 0.41 | * | | | 1.09 | | | | 0.71 | |
| Class R6 (WDTHX) | | 11-30-2015 | | | – | | | | 0.52 | * | | | 0.94 | | | | 0.56 | |
| S&P Target Date 2020 Index3 | | – | | | – | | | | 1.58 | | | | – | | | | – | |
| * | | Total return differs from the return in the Financial Highlights in this report. The total return presented is calculated based on the NAV at which shareholder transactions were processed. The NAV and total return presented in the Financial Highlights reflects certain adjustments made to the net assets of the Fund that are necessary under U.S. generally accepted accounting principles. |
Figures quoted represent past performance, which is no guarantee of future results, and do not reflect taxes that a shareholder may pay on fund distributions or the redemption of fund shares. Investment return and principal value of an investment will fluctuate so that an investor’s shares, when redeemed, may be worth more or less than their original cost. Performance shown without sales charges would be lower if sales charges were reflected. Current performance may be lower or higher than the performance data quoted and assumes the reinvestment of dividends and capital gains. Current month-end performance is available on the Fund’s website, wellsfargofunds.com.
Index returns do not include transaction costs associated with buying and selling securities, any mutual fund fees or expenses, or any taxes. It is not possible to invest directly in an index.
For Class A shares, the maximum front-end sales charge is 5.75%. For Class C shares, the maximum contingent deferred sales charge is 1.00%. Performance including a contingent deferred sales charge assumes the sales charge for the corresponding time period. Class R, Class R4 and Class R6 shares are sold without a front-end sales charge or contingent deferred sales charge.
|
| Growth of $10,000 investment as of May 31, 20164 |
|
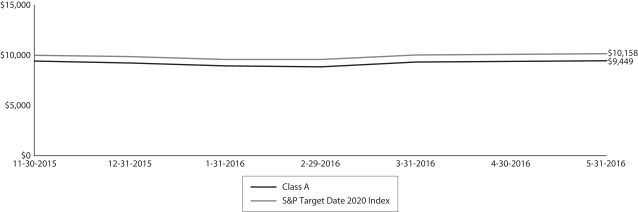
|
Please see footnotes on page 20.
| | | | |
| 8 | | Wells Fargo Dynamic Target Date Funds | | Performance highlights (unaudited) |
Dynamic Target 2025 Fund
Average annual total returns (%) as of May 31, 2016
| | | | | | | | | | | | | | | | | | |
| | | | | Including sales
charge | | | Excluding sales
charge | | | Expense ratios7 (%) | |
| | | Inception date | | Since inception | | | Since inception | | | Gross | | | Net2 | |
| Class A (WDTIX) | | 11-30-2015 | | | (6.01 | ) | | | (0.27 | )* | | | 1.44 | | | | 1.04 | |
| Class C (WDTJX) | | 11-30-2015 | | | (1.63 | ) | | | (0.64 | )* | | | 2.19 | | | | 1.79 | |
| Class R (WDTKX) | | 11-30-2015 | | | – | | | | (0.39 | )* | | | 1.69 | | | | 1.29 | |
| Class R4 (WDTLX) | | 11-30-2015 | | | – | | | | (0.04 | )* | | | 1.11 | | | | 0.73 | |
| Class R6 (WDTMX) | | 11-30-2015 | | | – | | | | (0.03 | )* | | | 0.96 | | | | 0.58 | |
| S&P Target Date 2025 Index3 | | – | | | – | | | | 1.43 | | | | – | | | | – | |
| * | | Total return differs from the return in the Financial Highlights in this report. The total return presented is calculated based on the NAV at which shareholder transactions were processed. The NAV and total return presented in the Financial Highlights reflects certain adjustments made to the net assets of the Fund that are necessary under U.S. generally accepted accounting principles. |
Figures quoted represent past performance, which is no guarantee of future results, and do not reflect taxes that a shareholder may pay on fund distributions or the redemption of fund shares. Investment return and principal value of an investment will fluctuate so that an investor’s shares, when redeemed, may be worth more or less than their original cost. Performance shown without sales charges would be lower if sales charges were reflected. Current performance may be lower or higher than the performance data quoted and assumes the reinvestment of dividends and capital gains. Current month-end performance is available on the Fund’s website, wellsfargofunds.com.
Index returns do not include transaction costs associated with buying and selling securities, any mutual fund fees or expenses, or any taxes. It is not possible to invest directly in an index.
For Class A shares, the maximum front-end sales charge is 5.75%. For Class C shares, the maximum contingent deferred sales charge is 1.00%. Performance including a contingent deferred sales charge assumes the sales charge for the corresponding time period. Class R, Class R4 and Class R6 shares are sold without a front-end sales charge or contingent deferred sales charge.
|
| Growth of $10,000 investment as of May 31, 20164 |
|

|
Please see footnotes on page 20.
| | | | | | |
| Performance highlights (unaudited) | | Wells Fargo Dynamic Target Date Funds | | | 9 | |
Dynamic Target 2030 Fund
Average annual total returns (%) as of May 31, 2016
| | | | | | | | | | | | | | | | | | |
| | | | | Including sales
charge | | | Excluding sales
charge | | | Expense ratios8 (%) | |
| | | Inception date | | Since inception | | | Since inception | | | Gross | | | Net2 | |
| Class A (WDTNX) | | 11-30-2015 | | | (6.26 | ) | | | (0.55 | )* | | | 1.45 | | | | 1.06 | |
| Class C (WDTOX) | | 11-30-2015 | | | (1.89 | ) | | | (0.91 | )* | | | 2.20 | | | | 1.81 | |
| Class R (WDTPX) | | 11-30-2015 | | | – | | | | (0.66 | )* | | | 1.70 | | | | 1.31 | |
| Class R4 (WDTQX) | | 11-30-2015 | | | – | | | | (0.31 | )* | | | 1.12 | | | | 0.75 | |
| Class R6 (WDTSX) | | 11-30-2015 | | | – | | | | (0.29 | )* | | | 0.97 | | | | 0.60 | |
| S&P Target Date 2030 Index3 | | – | | | – | | | | 1.29 | | | | – | | | | – | |
| * | | Total return differs from the return in the Financial Highlights in this report. The total return presented is calculated based on the NAV at which shareholder transactions were processed. The NAV and total return presented in the Financial Highlights reflects certain adjustments made to the net assets of the Fund that are necessary under U.S. generally accepted accounting principles. |
Figures quoted represent past performance, which is no guarantee of future results, and do not reflect taxes that a shareholder may pay on fund distributions or the redemption of fund shares. Investment return and principal value of an investment will fluctuate so that an investor’s shares, when redeemed, may be worth more or less than their original cost. Performance shown without sales charges would be lower if sales charges were reflected. Current performance may be lower or higher than the performance data quoted and assumes the reinvestment of dividends and capital gains. Current month-end performance is available on the Fund’s website, wellsfargofunds.com.
Index returns do not include transaction costs associated with buying and selling securities, any mutual fund fees or expenses, or any taxes. It is not possible to invest directly in an index.
For Class A shares, the maximum front-end sales charge is 5.75%. For Class C shares, the maximum contingent deferred sales charge is 1.00%. Performance including a contingent deferred sales charge assumes the sales charge for the corresponding time period. Class R, Class R4 and Class R6 shares are sold without a front-end sales charge or contingent deferred sales charge.
|
| Growth of $10,000 investment as of May 31, 20164 |
|

|
Please see footnotes on page 20.
| | | | |
| 10 | | Wells Fargo Dynamic Target Date Funds | | Performance highlights (unaudited) |
Dynamic Target 2035 Fund
Average annual total returns (%) as of May 31, 2016
| | | | | | | | | | | | | | | | | | |
| | | | | Including sales
charge | | | Excluding sales
charge | | | Expense ratios9 (%) | |
| | | Inception date | | Since inception | | | Since inception | | | Gross | | | Net2 | |
| Class A (WDTTX) | | 11-30-2015 | | | (6.53 | ) | | | (0.82 | )* | | | 1.46 | | | | 1.07 | |
| Class C (WDCTX) | | 11-30-2015 | | | (2.26 | ) | | | (1.28 | )* | | | 2.21 | | | | 1.82 | |
| Class R (WDTUX) | | 11-30-2015 | | | – | | | | (0.93 | )* | | | 1.71 | | | | 1.32 | |
| Class R4 (WDTVX) | | 11-30-2015 | | | – | | | | (0.68 | )* | | | 1.13 | | | | 0.76 | |
| Class R6 (WDTWX) | | 11-30-2015 | | | – | | | | (0.66 | )* | | | 0.98 | | | | 0.61 | |
| S&P Target Date 2035 Index3 | | – | | | – | | | | 1.15 | | | | – | | | | – | |
| * | | Total return differs from the return in the Financial Highlights in this report. The total return presented is calculated based on the NAV at which shareholder transactions were processed. The NAV and total return presented in the Financial Highlights reflects certain adjustments made to the net assets of the Fund that are necessary under U.S. generally accepted accounting principles. |
Figures quoted represent past performance, which is no guarantee of future results, and do not reflect taxes that a shareholder may pay on fund distributions or the redemption of fund shares. Investment return and principal value of an investment will fluctuate so that an investor’s shares, when redeemed, may be worth more or less than their original cost. Performance shown without sales charges would be lower if sales charges were reflected. Current performance may be lower or higher than the performance data quoted and assumes the reinvestment of dividends and capital gains. Current month-end performance is available on the Fund’s website, wellsfargofunds.com.
Index returns do not include transaction costs associated with buying and selling securities, any mutual fund fees or expenses, or any taxes. It is not possible to invest directly in an index.
For Class A shares, the maximum front-end sales charge is 5.75%. For Class C shares, the maximum contingent deferred sales charge is 1.00%. Performance including a contingent deferred sales charge assumes the sales charge for the corresponding time period. Class R, Class R4 and Class R6 shares are sold without a front-end sales charge or contingent deferred sales charge.
|
| Growth of $10,000 investment as of May 31, 20164 |
|

|
Please see footnotes on page 20.
| | | | | | |
| Performance highlights (unaudited) | | Wells Fargo Dynamic Target Date Funds | | | 11 | |
Dynamic Target 2040 Fund
Average annual total returns (%) as of May 31, 2016
| | | | | | | | | | | | | | | | | | |
| | | | | Including sales
charge | | | Excluding sales
charge | | | Expense ratios10 (%) | |
| | | Inception date | | Since inception | | | Since inception | | | Gross | | | Net2 | |
| Class A (WTDAX) | | 11-30-2015 | | | (6.78 | ) | | | (1.10 | )* | | | 1.47 | | | | 1.08 | |
| Class C (WTDCX) | | 11-30-2015 | | | (2.43 | ) | | | (1.45 | )* | | | 2.22 | | | | 1.83 | |
| Class R (WTDDX) | | 11-30-2015 | | | – | | | | (1.21 | )* | | | 1.72 | | | | 1.33 | |
| Class R4 (WTDEX) | | 11-30-2015 | | | – | | | | (0.96 | )* | | | 1.14 | | | | 0.77 | |
| Class R6 (WTDFX) | | 11-30-2015 | | | – | | | | (0.84 | )* | | | 0.99 | | | | 0.62 | |
| S&P Target Date 2040 Index3 | | – | | | – | | | | 1.04 | | | | – | | | | – | |
| * | | Total return differs from the return in the Financial Highlights in this report. The total return presented is calculated based on the NAV at which shareholder transactions were processed. The NAV and total return presented in the Financial Highlights reflects certain adjustments made to the net assets of the Fund that are necessary under U.S. generally accepted accounting principles. |
Figures quoted represent past performance, which is no guarantee of future results, and do not reflect taxes that a shareholder may pay on fund distributions or the redemption of fund shares. Investment return and principal value of an investment will fluctuate so that an investor’s shares, when redeemed, may be worth more or less than their original cost. Performance shown without sales charges would be lower if sales charges were reflected. Current performance may be lower or higher than the performance data quoted and assumes the reinvestment of dividends and capital gains. Current month-end performance is available on the Fund’s website, wellsfargofunds.com.
Index returns do not include transaction costs associated with buying and selling securities, any mutual fund fees or expenses, or any taxes. It is not possible to invest directly in an index.
For Class A shares, the maximum front-end sales charge is 5.75%. For Class C shares, the maximum contingent deferred sales charge is 1.00%. Performance including a contingent deferred sales charge assumes the sales charge for the corresponding time period. Class R, Class R4 and Class R6 shares are sold without a front-end sales charge or contingent deferred sales charge.
|
| Growth of $10,000 investment as of May 31, 20164 |
|
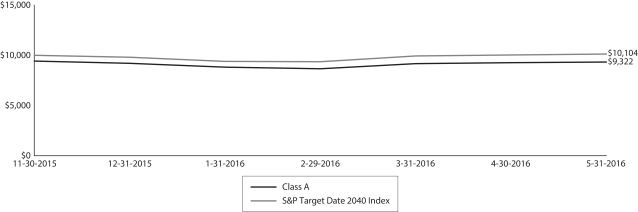
|
Please see footnotes on page 20.
| | | | |
| 12 | | Wells Fargo Dynamic Target Date Funds | | Performance highlights (unaudited) |
Dynamic Target 2045 Fund
Average annual total returns (%) as of May 31, 2016
| | | | | | | | | | | | | | | | | | |
| | | | | Including sales
charge | | | Excluding sales
charge | | | Expense ratios10 (%) | |
| | | Inception date | | Since inception | | | Since inception | | | Gross | | | Net2 | |
| Class A (WTDGX) | | 11-30-2015 | | | (6.68 | ) | | | (0.99 | )* | | | 1.47 | | | | 1.08 | |
| Class C (WTDHX) | | 11-30-2015 | | | (2.33 | ) | | | (1.35 | )* | | | 2.22 | | | | 1.83 | |
| Class R (WTDIX) | | 11-30-2015 | | | – | | | | (1.10 | )* | | | 1.72 | | | | 1.33 | |
| Class R4 (WTDJX) | | 11-30-2015 | | | – | | | | (0.75 | )* | | | 1.14 | | | | 0.77 | |
| Class R6 (WTDKX) | | 11-30-2015 | | | – | | | | (0.74 | )* | | | 0.99 | | | | 0.62 | |
| S&P Target Date 2045 Index3 | | – | | | – | | | | 0.95 | | | | – | | | | – | |
| * | | Total return differs from the return in the Financial Highlights in this report. The total return presented is calculated based on the NAV at which shareholder transactions were processed. The NAV and total return presented in the Financial Highlights reflects certain adjustments made to the net assets of the Fund that are necessary under U.S. generally accepted accounting principles. |
Figures quoted represent past performance, which is no guarantee of future results, and do not reflect taxes that a shareholder may pay on fund distributions or the redemption of fund shares. Investment return and principal value of an investment will fluctuate so that an investor’s shares, when redeemed, may be worth more or less than their original cost. Performance shown without sales charges would be lower if sales charges were reflected. Current performance may be lower or higher than the performance data quoted and assumes the reinvestment of dividends and capital gains. Current month-end performance is available on the Fund’s website, wellsfargofunds.com.
Index returns do not include transaction costs associated with buying and selling securities, any mutual fund fees or expenses, or any taxes. It is not possible to invest directly in an index.
For Class A shares, the maximum front-end sales charge is 5.75%. For Class C shares, the maximum contingent deferred sales charge is 1.00%. Performance including a contingent deferred sales charge assumes the sales charge for the corresponding time period. Class R, Class R4 and Class R6 shares are sold without a front-end sales charge or contingent deferred sales charge.
|
| Growth of $10,000 investment as of May 31, 20164 |
|
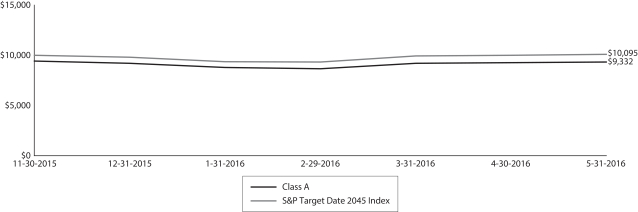
|
Please see footnotes on page 20.
| | | | | | |
| Performance highlights (unaudited) | | Wells Fargo Dynamic Target Date Funds | | | 13 | |
Dynamic Target 2050 Fund
Average annual total returns (%) as of May 31, 2016
| | | | | | | | | | | | | | | | | | |
| | | | | Including sales
charge | | | Excluding sales
charge | | | Expense ratios10 (%) | |
| | | Inception date | | Since inception | | | Since inception | | | Gross | | | Net2 | |
| Class A (WTDLX) | | 11-30-2015 | | | (6.67 | ) | | | (0.98 | )* | | | 1.47 | | | | 1.08 | |
| Class C (WTDMX) | | 11-30-2015 | | | (2.33 | ) | | | (1.35 | )* | | | 2.22 | | | | 1.83 | |
| Class R (WTDNX) | | 11-30-2015 | | | – | | | | (1.10 | )* | | | 1.72 | | | | 1.33 | |
| Class R4 (WTDOX) | | 11-30-2015 | | | – | | | | (0.75 | )* | | | 1.14 | | | | 0.77 | |
| Class R6 (WTDPX) | | 11-30-2015 | | | – | | | | (0.74 | )* | | | 0.99 | | | | 0.62 | |
| S&P Target Date 2050 Index3 | | – | | | – | | | | 0.82 | | | | – | | | | – | |
| * | | Total return differs from the return in the Financial Highlights in this report. The total return presented is calculated based on the NAV at which shareholder transactions were processed. The NAV and total return presented in the Financial Highlights reflects certain adjustments made to the net assets of the Fund that are necessary under U.S. generally accepted accounting principles. |
Figures quoted represent past performance, which is no guarantee of future results, and do not reflect taxes that a shareholder may pay on fund distributions or the redemption of fund shares. Investment return and principal value of an investment will fluctuate so that an investor’s shares, when redeemed, may be worth more or less than their original cost. Performance shown without sales charges would be lower if sales charges were reflected. Current performance may be lower or higher than the performance data quoted and assumes the reinvestment of dividends and capital gains. Current month-end performance is available on the Fund’s website, wellsfargofunds.com.
Index returns do not include transaction costs associated with buying and selling securities, any mutual fund fees or expenses, or any taxes. It is not possible to invest directly in an index.
For Class A shares, the maximum front-end sales charge is 5.75%. For Class C shares, the maximum contingent deferred sales charge is 1.00%. Performance including a contingent deferred sales charge assumes the sales charge for the corresponding time period. Class R, Class R4 and Class R6 shares are sold without a front-end sales charge or contingent deferred sales charge.
|
| Growth of $10,000 investment as of May 31, 20164 |
|

|
Please see footnotes on page 20.
| | | | |
| 14 | | Wells Fargo Dynamic Target Date Funds | | Performance highlights (unaudited) |
Dynamic Target 2055 Fund
Average annual total returns (%) as of May 31, 2016
| | | | | | | | | | | | | | | | | | |
| | | | | Including sales
charge | | | Excluding sales
charge | | | Expense ratios10 (%) | |
| | | Inception date | | Since inception | | | Since inception | | | Gross | | | Net2 | |
| Class A (WTDQX) | | 11-30-2015 | | | (6.58 | ) | | | (0.88 | )* | | | 1.47 | | | | 1.08 | |
| Class C (WTDRX) | | 11-30-2015 | | | (2.23 | ) | | | (1.25 | )* | | | 2.22 | | | | 1.83 | |
| Class R (WTDSX) | | 11-30-2015 | | | – | | | | (1.00 | )* | | | 1.72 | | | | 1.33 | |
| Class R4 (WTDTX) | | 11-30-2015 | | | – | | | | (0.75 | )* | | | 1.14 | | | | 0.77 | |
| Class R6 (WTDUX) | | 11-30-2015 | | | – | | | | (0.63 | )* | | | 0.99 | | | | 0.62 | |
| S&P Target Date 2055+ Index3 | | – | | | – | | | | 0.75 | | | | – | | | | – | |
| * | | Total return differs from the return in the Financial Highlights in this report. The total return presented is calculated based on the NAV at which shareholder transactions were processed. The NAV and total return presented in the Financial Highlights reflects certain adjustments made to the net assets of the Fund that are necessary under U.S. generally accepted accounting principles. |
Figures quoted represent past performance, which is no guarantee of future results, and do not reflect taxes that a shareholder may pay on fund distributions or the redemption of fund shares. Investment return and principal value of an investment will fluctuate so that an investor’s shares, when redeemed, may be worth more or less than their original cost. Performance shown without sales charges would be lower if sales charges were reflected. Current performance may be lower or higher than the performance data quoted and assumes the reinvestment of dividends and capital gains. Current month-end performance is available on the Fund’s website, wellsfargofunds.com.
Index returns do not include transaction costs associated with buying and selling securities, any mutual fund fees or expenses, or any taxes. It is not possible to invest directly in an index.
For Class A shares, the maximum front-end sales charge is 5.75%. For Class C shares, the maximum contingent deferred sales charge is 1.00%. Performance including a contingent deferred sales charge assumes the sales charge for the corresponding time period. Class R, Class R4 and Class R6 shares are sold without a front-end sales charge or contingent deferred sales charge.
|
| Growth of $10,000 investment as of May 31, 20164 |
|

|
Please see footnotes on page 20.
| | | | | | |
| Performance highlights (unaudited) | | Wells Fargo Dynamic Target Date Funds | | | 15 | |
Dynamic Target 2060 Fund
Average annual total returns (%) as of May 31, 2016
| | | | | | | | | | | | | | | | | | |
| | | | | Including sales
charge | | | Excluding sales
charge | | | Expense ratios10 (%) | |
| | | Inception date | | Since inception | | | Since inception | | | Gross | | | Net2 | |
| Class A (WTDVX) | | 11-30-2015 | | | (6.48 | ) | | | (0.78 | )* | | | 1.47 | | | | 1.08 | |
| Class C (WTDWX) | | 11-30-2015 | | | (2.13 | ) | | | (1.15 | )* | | | 2.22 | | | | 1.83 | |
| Class R ((WTDYX) | | 11-30-2015 | | | – | | | | (0.90 | )* | | | 1.72 | | | | 1.33 | |
| Class R4 (WTDZX) | | 11-30-2015 | | | – | | | | (0.65 | )* | | | 1.14 | | | | 0.77 | |
| Class R6 (WTSZX) | | 11-30-2015 | | | – | | | | (0.53 | )* | | | 0.99 | | | | 0.62 | |
| S&P Target Date 2055+ Index3 | | – | | | – | | | | 0.75 | | | | – | | | | – | |
| * | | Total return differs from the return in the Financial Highlights in this report. The total return presented is calculated based on the NAV at which shareholder transactions were processed. The NAV and total return presented in the Financial Highlights reflects certain adjustments made to the net assets of the Fund that are necessary under U.S. generally accepted accounting principles. |
Figures quoted represent past performance, which is no guarantee of future results, and do not reflect taxes that a shareholder may pay on fund distributions or the redemption of fund shares. Investment return and principal value of an investment will fluctuate so that an investor’s shares, when redeemed, may be worth more or less than their original cost. Performance shown without sales charges would be lower if sales charges were reflected. Current performance may be lower or higher than the performance data quoted and assumes the reinvestment of dividends and capital gains. Current month-end performance is available on the Fund’s website, wellsfargofunds.com.
Index returns do not include transaction costs associated with buying and selling securities, any mutual fund fees or expenses, or any taxes. It is not possible to invest directly in an index.
For Class A shares, the maximum front-end sales charge is 5.75%. For Class C shares, the maximum contingent deferred sales charge is 1.00%. Performance including a contingent deferred sales charge assumes the sales charge for the corresponding time period. Class R, Class R4 and Class R6 shares are sold without a front-end sales charge or contingent deferred sales charge.
|
| Growth of $10,000 investment as of May 31, 20164 |
|

|
Please see footnotes on page 20.
| | | | |
| 16 | | Wells Fargo Dynamic Target Date Funds | | Performance highlights (unaudited) |
MANAGER’S DISCUSSION
Highlights
Each Dynamic Target Date Fund seeks total returns over time, consistent with its strategic target allocation. The Funds invest primarily in underlying mutual funds and exchange-traded funds to diversify each Fund’s investments among the following asset classes: equity, fixed income, and alternative-style and inflation-hedging investments.
The portfolio management team employs three levers as it seeks to manage investment risk.
The Dynamic Target Date Funds incorporate three levers as they seek to manage investment risk over each Fund’s investment time horizon: tactical asset allocation, volatility management, and tail risk management. Tactical asset allocation uses timely shifts toward assets with higher expected returns and is driven by the market outlook of the Wells Fargo Asset Management Allocation Committee. Volatility management reduces exposure to risky assets in high-volatility markets and adds risky assets in low-volatility markets. Tail risk management uses institutional hedging techniques in an effort to mitigate risk during severe market downturns when a portfolio’s value falls to a specific level. Volatility management and tail risk management comprise the Dynamic Risk Hedging (DRH) strategy.
During the period, tactical asset allocation benefited all Funds and DRH benefited most Funds.
Eleven Funds comprise the Dynamic Target Date Funds series. For the six-month period from the launch of the Funds on November 30, 2015, through May 31, 2016, each Dynamic Target Date Fund underperformed its custom S&P Target Date Index.3
An equity-market correction, defined as a loss of 10% or more, during January and February 2016 proved to be a challenging environment for the underlying managers. The Funds’ underlying equity fund investments tended to underperform their benchmarks in the volatile market environment. The Funds’ bond investments added to performance on an absolute basis but underperformed their benchmarks. The market correction and the subsequent equity rallies left these historically inversely correlated markets difficult to navigate for the underlying funds.
Tactical asset allocation added to performance during the period for all of the Dynamic Target Date Funds. During the January/February 2016 correction, which bottomed on February 11, 2016, the portfolio management team tactically shifted portfolio allocations to increase equity exposure during periods of depressed equity prices, which contributed to Fund performance when equity markets subsequently rallied.
DRH contributed to performance for the longest-dated Dynamic Target Date Funds in the series, beginning with the Dynamic Target 2020 Fund through the Dynamic Target 2060 Fund, and detracted from performance for the near-term Dynamic Target Today Fund and Dynamic Target 2015 Fund. For the longest-dated Funds, the overlay, through which the portfolio management team took large short positions during the correction, protected the portfolio from some downside risk, reduced portfolio volatility, and added to overall performance. For the Dynamic Target Today Fund and the Dynamic Target 2015 Fund, the whipsawing market that followed the correction limited the effectiveness of the hedging strategy. Because the shorter dated funds are more conservative, the Dynamic Target Today Fund and the Dynamic Target 2015 Fund have lower equity allocations compared with the longer-dated funds. During the market correction, smaller portions were hedged compared to longer-dated portfolios. During the downturn the overlay protected the Funds, but the following whipsawing market overwhelmed the gains for the Dynamic Target 2015 Fund and the Dynamic Target Date Today Fund.
We remain cautiously optimistic about the longer-term investment outlook.
Bond yields continued to be depressed. The potential for future interest-rate hikes may be a headwind to increases in overall output in the general U.S. economy. Especially with yields at historic lows, there continues to be a duration risk in bonds.
Internationally, the accommodative monetary policies of the European Central Bank and the Bank of Japan are intended to bolster their local economies. We believe these central banks will continue to support growth in their economies, and that should be supportive of asset prices. In addition to developed international economies, emerging markets stocks are at low valuation levels not seen in years. Finally, domestic stocks and the U.S. economy have shown resilience in the past year. We look to market signals and economic releases to help inform the changing state of U.S. markets.
Please see footnotes on page 20.
| | | | | | |
| Performance highlights (unaudited) | | Wells Fargo Dynamic Target Date Funds | | | 17 | |
Ten largest holdings (%) as of May 31, 201611
| | | | | | | | | | |
| Dynamic Target Today Fund | | | | | Dynamic Target 2015 Fund | | | |
Wells Fargo Core Bond Portfolio | | | 12.96 | | | Schwab U.S. Broad Market ETF | | | 13.19 | |
Schwab U.S. Aggregate Bond ETF | | | 10.79 | | | Wells Fargo Core Bond Portfolio | | | 9.50 | |
Wells Fargo Strategic Income Fund Institutional Class | | | 9.76 | | | Schwab U.S. Aggregate Bond ETF | | | 7.91 | |
Wells Fargo Short-Term Bond Fund Institutional Class | | | 9.75 | | | Wells Fargo Strategic Income Fund Institutional Class | | | 7.15 | |
Schwab U.S. Broad Market ETF | | | 9.14 | | | Wells Fargo Short-Term Bond Fund Institutional Class | | | 7.14 | |
Wells Fargo Real Return Portfolio | | | 5.39 | | | Wells Fargo Diversified International Fund Class R6 | | | 6.54 | |
Wells Fargo International Bond Fund Class R6 | | | 5.32 | | | Schwab International Equity ETF | | | 5.52 | |
Calamos Market Neutral Income Fund Class I | | | 4.94 | | | Calamos Market Neutral Income Fund Class I | | | 4.92 | |
Wells Fargo Diversified International Fund Class R6 | | | 4.55 | | | Wells Fargo Real Return Portfolio | | | 3.95 | |
Schwab International Equity ETF | | | 3.83 | | | Wells Fargo International Bond Fund Class R6 | | | 3.92 | |
| | | | | | | | | | |
| Dynamic Target 2020 Fund | | | | | Dynamic Target 2025 Fund | | | |
Schwab U.S. Broad Market ETF | | | 15.67 | | | Schwab U.S. Broad Market ETF | | | 17.97 | |
Wells Fargo Diversified International Fund Class R6 | | | 7.79 | | | Wells Fargo Diversified International Fund Class R6 | | | 8.94 | |
Wells Fargo Core Bond Portfolio | | | 7.40 | | | Schwab International Equity ETF | | | 7.54 | |
Schwab International Equity ETF | | | 6.57 | | | Wells Fargo Core Bond Portfolio | | | 5.50 | |
Schwab U.S. Aggregate Bond ETF | | | 6.16 | | | Calamos Market Neutral Income Fund Class I | | | 4.89 | |
Wells Fargo Strategic Income Fund Institutional Class | | | 5.57 | | | Wells Fargo Premier Large Company Growth Fund Class R6 | | | 4.87 | |
Wells Fargo Short-Term Bond Fund Institutional Class | | | 5.57 | | | Wells Fargo Endeavor Select Fund Institutional Class | | | 4.86 | |
Calamos Market Neutral Income Fund Class I | | | 4.90 | | | Schwab U.S. Aggregate Bond ETF | | | 4.58 | |
Wells Fargo Premier Large Company Growth Fund Class R6 | | | 4.24 | | | Wells Fargo Strategic Income Fund Institutional Class | | | 4.14 | |
Wells Fargo Endeavor Select Fund Institutional Class | | | 4.23 | | | Wells Fargo Short-Term Bond Fund Institutional Class | | | 4.14 | |
| | | | | | | | | | |
| Dynamic Target 2030 Fund | | | | | Dynamic Target 2035 Fund | | | |
Schwab U.S. Broad Market ETF | | | 20.26 | | | Schwab U.S. Broad Market ETF | | | 21.81 | |
Wells Fargo Diversified International Fund Class R6 | | | 10.07 | | | Wells Fargo Diversified International Fund Class R6 | | | 10.84 | |
Schwab International Equity ETF | | | 8.50 | | | Schwab International Equity ETF | | | 9.15 | |
Wells Fargo Premier Large Company Growth Fund Class R6 | | | 5.48 | | | Wells Fargo Endeavor Select Fund Institutional Class | | | 5.90 | |
Wells Fargo Endeavor Select Fund Institutional Class | | | 5.48 | | | Wells Fargo Premier Large Company Growth Fund Class R6 | | | 5.90 | |
Calamos Market Neutral Income Fund Class I | | | 4.88 | | | Calamos Market Neutral Income Fund Class I | | | 4.90 | |
Wells Fargo Emerging Markets Equity Income Fund Class R6 | | | 4.56 | | | Wells Fargo Emerging Markets Equity Income Fund Class R6 | | | 4.89 | |
Wells Fargo Enterprise Fund Class R6 | | | 3.97 | | | Wells Fargo Enterprise Fund Class R6 | | | 4.29 | |
Wells Fargo Special Mid Cap Value Fund Class R6 | | | 3.95 | | | Wells Fargo Special Mid Cap Value Fund Class R6 | | | 4.26 | |
Wells Fargo Large Company Value Portfolio | | | 3.65 | | | Wells Fargo Large Company Value Portfolio | | | 3.93 | |
Please see footnotes on page 20.
| | | | |
| 18 | | Wells Fargo Dynamic Target Date Funds | | Performance highlights (unaudited) |
| | | | | | | | | | |
| Dynamic Target 2040 Fund | | | | | Dynamic Target 2045 Fund | | | |
Schwab U.S. Broad Market ETF | | | 22.76 | | | Schwab U.S. Broad Market ETF | | | 23.16 | |
Wells Fargo Diversified International Fund Class R6 | | | 11.38 | | | Wells Fargo Diversified International Fund Class R6 | | | 11.52 | |
Schwab International Equity ETF | | | 9.59 | | | Schwab International Equity ETF | | | 9.72 | |
Wells Fargo Premier Large Company Growth Fund Class R6 | | | 6.16 | | | Wells Fargo Premier Large Company Growth Fund Class R6 | | | 6.27 | |
Wells Fargo Endeavor Select Fund Institutional Class | | | 6.14 | | | Wells Fargo Endeavor Select Fund Institutional Class | | | 6.24 | |
Wells Fargo Emerging Markets Equity Income Fund Class R6 | | | 5.25 | | | Wells Fargo Emerging Markets Equity Income Fund Class R6 | | | 5.22 | |
Calamos Market Neutral Income Fund Class I | | | 4.93 | | | Calamos Market Neutral Income Fund Class I | | | 4.90 | |
Wells Fargo Enterprise Fund Class R6 | | | 4.46 | | | Wells Fargo Enterprise Fund Class R6 | | | 4.52 | |
Wells Fargo Special Mid Cap Value Fund Class R6 | | | 4.44 | | | Wells Fargo Special Mid Cap Value Fund Class R6 | | | 4.50 | |
Wells Fargo Large Company Value Portfolio | | | 4.10 | | | Wells Fargo Large Company Value Portfolio | | | 4.17 | |
| | | | | | | | | | |
| Dynamic Target 2050 Fund | | | | | Dynamic Target 2055 Fund | | | |
Schwab U.S. Broad Market ETF | | | 23.17 | | | Schwab U.S. Broad Market ETF | | | 23.17 | |
Wells Fargo Diversified International Fund Class R6 | | | 11.52 | | | Wells Fargo Diversified International Fund Class R6 | | | 11.52 | |
Schwab International Equity ETF | | | 9.72 | | | Schwab International Equity ETF | | | 9.72 | |
Wells Fargo Premier Large Company Growth Fund Class R6 | | | 6.26 | | | Wells Fargo Premier Large Company Growth Fund Class R6 | | | 6.26 | |
Wells Fargo Endeavor Select Fund Institutional Class | | | 6.25 | | | Wells Fargo Endeavor Select Fund Institutional Class | | | 6.25 | |
Wells Fargo Emerging Markets Equity Income Fund Class R6 | | | 5.21 | | | Wells Fargo Emerging Markets Equity Income Fund Class R6 | | | 5.21 | |
Calamos Market Neutral Income Fund Class I | | | 4.90 | | | Calamos Market Neutral Income Fund Class I | | | 4.90 | |
Wells Fargo Enterprise Fund Class R6 | | | 4.52 | | | Wells Fargo Enterprise Fund Class R6 | | | 4.53 | |
Wells Fargo Special Mid Cap Value Fund Class R6 | | | 4.51 | | | Wells Fargo Special Mid Cap Value Fund Class R6 | | | 4.51 | |
Wells Fargo Large Company Value Portfolio | | | 4.17 | | | Wells Fargo Large Company Value Portfolio | | | 4.17 | |
| | | | | | | | | | |
| Dynamic Target 2060 Fund | | | | | | | | |
Schwab U.S. Broad Market ETF | | | 23.17 | | | | | | | |
Wells Fargo Diversified International Fund Class R6 | | | 11.52 | | | | | | | |
Schwab International Equity ETF | | | 9.72 | | | | | | | |
Wells Fargo Premier Large Company Growth Fund Class R6 | | | 6.26 | | | | | | | |
Wells Fargo Endeavor Select Fund Institutional Class | | | 6.25 | | | | | | | |
Wells Fargo Emerging Markets Equity Income Fund Class R6 | | | 5.21 | | | | | | | |
Calamos Market Neutral Income Fund Class I | | | 4.90 | | | | | | | |
Wells Fargo Enterprise Fund Class R6 | | | 4.52 | | | | | | | |
Wells Fargo Special Mid Cap Value Fund Class R6 | | | 4.51 | | | | | | | |
Wells Fargo Large Company Value Portfolio | | | 4.17 | | | | | | | |
Please see footnotes on page 20.
| | | | | | |
| Performance highlights (unaudited) | | Wells Fargo Dynamic Target Date Funds | | | 19 | |
Allocations as of May 31, 201612
| | | | | | | | | | | | | | | | | | | | | | | | | | | | | | | | |
Dynamic Target Today Fund | | | | | Dynamic Target 2015 Fund | | | | | Dynamic 2020 Today Fund | |
| | | Effective
Allocation | | | Strategic
Target
Allocation | | | | | | | Effective
Allocation | | | Strategic
Target
Allocation | | | | | | | Effective
Allocation | | | Strategic
Target
Allocation | |
Equity | | | 36 | % | | | 35 | % | | | | Equity | | | 51 | % | | | 51 | % | | | | Equity | | | 61 | % | | | 60 | % |
Fixed-Income | | | 44 | % | | | 50 | % | | | | Fixed-Income | | | 31 | % | | | 36 | % | | | | Fixed-Income | | | 23 | % | | | 29 | % |
Alternative Investments | | | 15 | % | | | 15 | % | | | | Alternative Investments | | | 13 | % | | | 13 | % | | | | Alternative Investments | | | 11 | % | | | 11 | % |
Effective Cash | | | 5 | % | | | 0 | % | | | | Effective Cash | | | 5 | % | | | 0 | % | | | | Effective Cash | | | 5 | % | | | 0 | % |
| | | | | | | | | | | | | | | | | | | | | | | | | | | | | | | | | |
Dynamic 2025 Today Fund | | | | | Dynamic 2030 Today Fund | | | | | Dynamic 2035 Today Fund | |
| | | Effective
Allocation | | | Strategic
Target
Allocation | | | | | | | Effective
Allocation | | | Strategic
Target
Allocation | | | | | | | Effective
Allocation | | | Strategic
Target
Allocation | |
Equity | | | 70 | % | | | 70 | % | | | | Equity | | | 79 | % | | | 78 | % | | | | Equity | | | 85 | % | | | 85 | % |
Fixed-Income | | | 16 | % | | | 21 | % | | | | Fixed-Income | | | 9 | % | | | 14 | % | | | | Fixed-Income | | | 4 | % | | | 9 | % |
Alternative Investments | | | 9 | % | | | 9 | % | | | | Alternative Investments | | | 7 | % | | | 8 | % | | | | Alternative Investments | | | 6 | % | | | 6 | % |
Effective Cash | | | 5 | % | | | 0 | % | | | | Effective Cash | | | 5 | % | | | 0 | % | | | | Effective Cash | | | 5 | % | | | 0 | % |
| | | | | | | | | | | | | | | | | | | | | | | | | | | | | | | | | |
Dynamic 2040 Today Fund | | | | | Dynamic 2045 Today Fund | | | | | Dynamic 2050 Today Fund | |
| | | Effective
Allocation | | | Strategic
Target
Allocation | | | | | | | Effective
Allocation | | | Strategic
Target
Allocation | | | | | | | Effective
Allocation | | | Strategic
Target
Allocation | |
Equity | | | 89 | % | | | 89 | % | | | | Equity | | | 90 | % | | | 90 | % | | | | Equity | | | 90 | % | | | 90 | % |
Fixed-Income | | | 0 | % | | | 6 | % | | | | Fixed-Income | | | (1) | % | | | 4 | % | | | | Fixed-Income | | | (1) | % | | | 5 | % |
Alternative Investments | | | 6 | % | | | 5 | % | | | | Alternative Investments | | | 6 | % | | | 6 | % | | | | Alternative Investments | | | 6 | % | | | 5 | % |
Effective Cash | | | 5 | % | | | 0 | % | | | | Effective Cash | | | 5 | % | | | 0 | % | | | | Effective Cash | | | 5 | % | | | 0 | % |
| | | | | | | | | | | | | | | | | | | | | | | | | | | | | | | | | |
| Dynamic 2055 Today Fund | | | | | Dynamic 2060 Today Fund | | | | | | | | | | | |
| | | Effective
Allocation | | | Strategic
Target
Allocation | | | | | | | Effective
Allocation | | | Strategic
Target
Allocation | | | | | | | | | | | |
Equity | | | 90 | % | | | 90 | % | | | | Equity | | | 90 | % | | | 90 | % | | | | | | | | | | | | |
Fixed-Income | | | (1) | % | | | 5 | % | | | | Fixed-Income | | | (1) | % | | | 5 | % | | | | | | | | | | | | |
Alternative Investments | | | 6 | % | | | 5 | % | | | | Alternative Investments | | | 6 | % | | | 5 | % | | | | | | | | | | | | |
Effective Cash | | | 5 | % | | | 0 | % | | | | Effective Cash | | | 5 | % | | | 0 | % | | | | | | | | | | | | |
Please see footnotes on page 20.
| | | | |
| 20 | | Wells Fargo Dynamic Target Date Funds | | Performance highlights (unaudited) |
| 1 | Reflects the expense ratios as stated in the most recent prospectuses, which include the impact of 0.48% of acquired fund fees and expenses and net expenses from affiliated master portfolios. The expense ratios shown are subject to change and may differ from the annualized expense ratios shown in the financial highlights of this report, which do not include acquired fund fees and expenses and net expenses from affiliated master portfolios. |
| 2 | The manager has committed through September 30, 2016, to waive fees and/or reimburse expenses to the extent necessary to cap the Fund’s Total Annual Fund Operating Expenses After Fee Waiver at the amounts shown. After this time, the cap may be increased or the commitment to maintain the cap may be terminated only with the approval of the Board of Trustees. Brokerage commissions, stamp duty fees, interest, taxes, and extraordinary expenses are excluded from the expense cap. Acquired fund fees and expenses and net expenses from the affiliated master portfolios are included in the expense cap. Without this cap, the Fund’s returns would have been lower. |
| 3 | The S&P Target Date Indexes (each, an index, or collectively, the indexes) are a series of indexes designed as benchmarks for multi-asset class portfolios with risk profiles that become more conservative over time, each corresponding to a target retirement date. The index series reflects the market consensus for asset allocations for different target date horizons. In particular, each index is representative of the investment opportunity available to investors for the corresponding target date horizon, with asset class exposures driven by a survey of available target date funds for that horizon. The index returns include hypothetical back-tested performance. You cannot invest directly in an index. |
| 4 | The chart compares the performance of Class A shares since inception with the respective S&P Target Date Indexes. The chart assumes a hypothetical $10,000 investment in Class A and reflects all operating expenses and assumes the maximum initial sales charge of 5.75%. |
| 5 | Reflects the expense ratios as stated in the most recent prospectuses, which include the impact of 0.50% of acquired fund fees and expenses and net expenses from affiliated master portfolios. The expense ratios shown are subject to change and may differ from the annualized expense ratios shown in the financial highlights of this report, which do not include acquired fund fees and expenses and net expenses from affiliated master portfolios. |
| 6 | Reflects the expense ratios as stated in the most recent prospectuses, which include the impact of 0.52% of acquired fund fees and expenses and net expenses from affiliated master portfolios. The expense ratios shown are subject to change and may differ from the annualized expense ratios shown in the financial highlights of this report, which do not include acquired fund fees and expenses and net expenses from affiliated master portfolios. |
| 7 | Reflects the expense ratios as stated in the most recent prospectuses, which include the impact of 0.54% of acquired fund fees and expenses and net expenses from affiliated master portfolios. The expense ratios shown are subject to change and may differ from the annualized expense ratios shown in the financial highlights of this report, which do not include acquired fund fees and expenses and net expenses from affiliated master portfolios. |
| 8 | Reflects the expense ratios as stated in the most recent prospectuses, which include the impact of 0.55% of acquired fund fees and expenses and net expenses from affiliated master portfolios. The expense ratios shown are subject to change and may differ from the annualized expense ratios shown in the financial highlights of this report, which do not include acquired fund fees and expenses and net expenses from affiliated master portfolios. |
| 9 | Reflects the expense ratios as stated in the most recent prospectuses, which include the impact of 0.56% of acquired fund fees and expenses and net expenses from affiliated master portfolios. The expense ratios shown are subject to change and may differ from the annualized expense ratios shown in the financial highlights of this report, which do not include acquired fund fees and expenses and net expenses from affiliated master portfolios. |
| 10 | Reflects the expense ratios as stated in the most recent prospectuses, which include the impact of 0.57% of acquired fund fees and expenses and net expenses from affiliated master portfolios. The expense ratios shown are subject to change and may differ from the annualized expense ratios shown in the financial highlights of this report, which do not include acquired fund fees and expenses and net expenses from affiliated master portfolios. |
| 11 | The ten largest holdings, excluding cash and cash equivalents, are calculated based on the value of the investments divided by total net assets of the Fund. Holdings are subject to change and may have changed since the date specified. |
| 12 | The effective allocation includes the effect of any tactical futures overlay that may be in place. Effective cash is comprised of the net impact of long and/or short futures contracts held as part of dynamic risk management strategy. The amounts are subject to change and may have changed since the date specified. |
| | | | | | |
| Fund expenses (unaudited) | | Wells Fargo Dynamic Target Date Funds | | | 21 | |
As a shareholder of the Fund, you incur two types of costs: (1) transaction costs, including sales charges (loads) on purchase payments and contingent deferred sales charges (if any) on redemptions and (2) ongoing costs, including management fees, distribution (12b-1) and/or shareholder servicing fees, and other Fund expenses. This example is intended to help you understand your ongoing costs (in dollars) of investing in the Fund and to compare these costs with the ongoing costs of investing in other mutual funds.
The example is based on an investment of $1,000 invested at the beginning of the six-month period and held for the entire period from December 1, 2015 to May 31, 2016.
Actual expenses
The “Actual” line of the table below provides information about actual account values and actual expenses. You may use the information in this line, together with the amount you invested, to estimate the expenses that you paid over the period. Simply divide your account value by $1,000 (for example, an $8,600 account value divided by $1,000 = 8.6), then multiply the result by the number in the “Actual” line under the heading entitled “Expenses paid during period” for your applicable class of shares to estimate the expenses you paid on your account during this period.
Hypothetical example for comparison purposes
The “Hypothetical” line of the table below provides information about hypothetical account values and hypothetical expenses based on the Fund’s actual expense ratio and an assumed rate of return of 5% per year before expenses, which is not the Fund’s actual return. The hypothetical account values and expenses may not be used to estimate the actual ending account balance or expenses you paid for the period. You may use this information to compare the ongoing costs of investing in the Fund and other funds. To do so, compare this 5% hypothetical example with the 5% hypothetical examples that appear in the shareholder reports of the other funds.
Please note that the expenses shown in the table are meant to highlight your ongoing costs only and do not reflect any transactional costs, such as sales charges (loads) and contingent deferred sales charges. Therefore, the “Hypothetical” line of the table is useful in comparing ongoing costs only and will not help you determine the relative total costs of owning different funds. In addition, if these transactional costs were included, your costs would have been higher.
| | | | | | | | | | | | | | | | |
| Dynamic Target Today Fund | | Beginning
account value
12-1-2015 | | | Ending
account value
5-31-2016 | | | Expenses
paid during
the period¹ | | | Net annualized
expense ratio | |
Class A | | | | | | | | | | | | | | | | |
Actual | | $ | 1,000.00 | | | $ | 1,007.47 | | | $ | 2.66 | | | | 0.53 | % |
Hypothetical (5% return before expenses) | | $ | 1,000.00 | | | $ | 1,022.35 | | | $ | 2.68 | | | | 0.53 | % |
Class C | | | | | | | | | | | | | | | | |
Actual | | $ | 1,000.00 | | | $ | 1,003.78 | | | $ | 6.41 | | | | 1.28 | % |
Hypothetical (5% return before expenses) | | $ | 1,000.00 | | | $ | 1,018.60 | | | $ | 6.46 | | | | 1.28 | % |
Class R | | | | | | | | | | | | | | | | |
Actual | | $ | 1,000.00 | | | $ | 1,006.26 | | | $ | 3.88 | | | | 0.77 | % |
Hypothetical (5% return before expenses) | | $ | 1,000.00 | | | $ | 1,021.13 | | | $ | 3.91 | | | | 0.77 | % |
Class R4 | | | | | | | | | | | | | | | | |
Actual | | $ | 1,000.00 | | | $ | 1,009.76 | | | $ | 1.11 | | | | 0.22 | % |
Hypothetical (5% return before expenses) | | $ | 1,000.00 | | | $ | 1,023.90 | | | $ | 1.11 | | | | 0.22 | % |
Class R6 | | | | | | | | | | | | | | | | |
Actual | | $ | 1,000.00 | | | $ | 1,009.90 | | | $ | 0.33 | | | | 0.07 | % |
Hypothetical (5% return before expenses) | | $ | 1,000.00 | | | $ | 1,024.67 | | | $ | 0.33 | | | | 0.07 | % |
Please see footnote on page 25.
| | | | |
| 22 | | Wells Fargo Dynamic Target Date Funds | | Fund expenses (unaudited) |
| | | | | | | | | | | | | | | | |
| Dynamic Target 2015 Fund | | Beginning
account value
12-1-2015 | | | Ending
account value
5-31-2016 | | | Expenses
paid during
the period¹ | | | Net annualized
expense ratio | |
Class A | | | | | | | | | | | | | | | | |
Actual | | $ | 1,000.00 | | | $ | 1,002.36 | | | $ | 2.25 | | | | 0.45 | % |
Hypothetical (5% return before expenses) | | $ | 1,000.00 | | | $ | 1,022.75 | | | $ | 2.28 | | | | 0.45 | % |
Class C | | | | | | | | | | | | | | | | |
Actual | | $ | 1,000.00 | | | $ | 998.65 | | | $ | 6.40 | | | | 1.28 | % |
Hypothetical (5% return before expenses) | | $ | 1,000.00 | | | $ | 1,018.60 | | | $ | 6.46 | | | | 1.28 | % |
Class R | | | | | | | | | | | | | | | | |
Actual | | $ | 1,000.00 | | | $ | 1,001.15 | | | $ | 3.84 | | | | 0.77 | % |
Hypothetical (5% return before expenses) | | $ | 1,000.00 | | | $ | 1,021.17 | | | $ | 3.87 | | | | 0.77 | % |
Class R4 | | | | | | | | | | | | | | | | |
Actual | | $ | 1,000.00 | | | $ | 1,003.65 | | | $ | 1.10 | | | | 0.22 | % |
Hypothetical (5% return before expenses) | | $ | 1,000.00 | | | $ | 1,023.90 | | | $ | 1.11 | | | | 0.22 | % |
Class R6 | | | | | | | | | | | | | | | | |
Actual | | $ | 1,000.00 | | | $ | 1,004.81 | | | $ | 0.32 | | | | 0.06 | % |
Hypothetical (5% return before expenses) | | $ | 1,000.00 | | | $ | 1,024.68 | | | $ | 0.32 | | | | 0.06 | % |
| Dynamic Target 2020 Fund | |
Class A | | | | | | | | | | | | | | | | |
Actual | | $ | 1,000.00 | | | $ | 1,002.51 | | | $ | 2.71 | | | | 0.54 | % |
Hypothetical (5% return before expenses) | | $ | 1,000.00 | | | $ | 1,022.30 | | | $ | 2.73 | | | | 0.54 | % |
Class C | | | | | | | | | | | | | | | | |
Actual | | $ | 1,000.00 | | | $ | 999.08 | | | $ | 6.43 | | | | 1.29 | % |
Hypothetical (5% return before expenses) | | $ | 1,000.00 | | | $ | 1,018.57 | | | $ | 6.49 | | | | 1.29 | % |
Class R | | | | | | | | | | | | | | | | |
Actual | | $ | 1,000.00 | | | $ | 1,001.58 | | | $ | 3.88 | | | | 0.77 | % |
Hypothetical (5% return before expenses) | | $ | 1,000.00 | | | $ | 1,021.13 | | | $ | 3.91 | | | | 0.77 | % |
Class R4 | | | | | | | | | | | | | | | | |
Actual | | $ | 1,000.00 | | | $ | 1,004.08 | | | $ | 1.13 | | | | 0.23 | % |
Hypothetical (5% return before expenses) | | $ | 1,000.00 | | | $ | 1,023.87 | | | $ | 1.14 | | | | 0.23 | % |
Class R6 | | | | | | | | | | | | | | | | |
Actual | | $ | 1,000.00 | | | $ | 1,005.24 | | | $ | 0.35 | | | | 0.07 | % |
Hypothetical (5% return before expenses) | | $ | 1,000.00 | | | $ | 1,024.65 | | | $ | 0.35 | | | | 0.07 | % |
| Dynamic Target 2025 Fund | |
Class A | | | | | | | | | | | | | | | | |
Actual | | $ | 1,000.00 | | | $ | 997.26 | | | $ | 2.28 | | | | 0.46 | % |
Hypothetical (5% return before expenses) | | $ | 1,000.00 | | | $ | 1,022.71 | | | $ | 2.31 | | | | 0.46 | % |
Class C | | | | | | | | | | | | | | | | |
Actual | | $ | 1,000.00 | | | $ | 993.56 | | | $ | 6.46 | | | | 1.30 | % |
Hypothetical (5% return before expenses) | | $ | 1,000.00 | | | $ | 1,018.52 | | | $ | 6.54 | | | | 1.30 | % |
Class R | | | | | | | | | | | | | | | | |
Actual | | $ | 1,000.00 | | | $ | 996.06 | | | $ | 3.87 | | | | 0.78 | % |
Hypothetical (5% return before expenses) | | $ | 1,000.00 | | | $ | 1,021.13 | | | $ | 3.92 | | | | 0.78 | % |
Class R4 | | | | | | | | | | | | | | | | |
Actual | | $ | 1,000.00 | | | $ | 999.57 | | | $ | 1.17 | | | | 0.23 | % |
Hypothetical (5% return before expenses) | | $ | 1,000.00 | | | $ | 1,023.83 | | | $ | 1.19 | | | | 0.23 | % |
Class R6 | | | | | | | | | | | | | | | | |
Actual | | $ | 1,000.00 | | | $ | 999.72 | | | $ | 0.38 | | | | 0.08 | % |
Hypothetical (5% return before expenses) | | $ | 1,000.00 | | | $ | 1,024.62 | | | $ | 0.39 | | | | 0.08 | % |
Please see footnote on page 25.
| | | | | | |
| Fund expenses (unaudited) | | Wells Fargo Dynamic Target Date Funds | | | 23 | |
| | | | | | | | | | | | | | | | |
| Dynamic Target 2030 Fund | | Beginning
account value
12-1-2015 | | | Ending
account value
5-31-2016 | | | Expenses
paid during
the period¹ | | | Net annualized
expense ratio | |
Class A | | | | | | | | | | | | | | | | |
Actual | | $ | 1,000.00 | | | $ | 994.54 | | | $ | 2.23 | | | | 0.45 | % |
Hypothetical (5% return before expenses) | | $ | 1,000.00 | | | $ | 1,022.76 | | | $ | 2.27 | | | | 0.45 | % |
Class C | | | | | | | | | | | | | | | | |
Actual | | $ | 1,000.00 | | | $ | 990.94 | | | $ | 6.48 | | | | 1.30 | % |
Hypothetical (5% return before expenses) | | $ | 1,000.00 | | | $ | 1,018.49 | | | $ | 6.57 | | | | 1.30 | % |
Class R | | | | | | | | | | | | | | | | |
Actual | | $ | 1,000.00 | | | $ | 993.42 | | | $ | 3.94 | | | | 0.79 | % |
Hypothetical (5% return before expenses) | | $ | 1,000.00 | | | $ | 1,021.04 | | | $ | 4.00 | | | | 0.79 | % |
Class R4 | | | | | | | | | | | | | | | | |
Actual | | $ | 1,000.00 | | | $ | 996.94 | | | $ | 1.20 | | | | 0.24 | % |
Hypothetical (5% return before expenses) | | $ | 1,000.00 | | | $ | 1,023.79 | | | $ | 1.22 | | | | 0.24 | % |
Class R6 | | | | | | | | | | | | | | | | |
Actual | | $ | 1,000.00 | | | $ | 997.09 | | | $ | 0.43 | | | | 0.09 | % |
Hypothetical (5% return before expenses) | | $ | 1,000.00 | | | $ | 1,024.57 | | | $ | 0.43 | | | | 0.09 | % |
| Dynamic Target 2035 Fund | |
Class A | | | | | | | | | | | | | | | | |
Actual | | $ | 1,000.00 | | | $ | 991.77 | | | $ | 2.71 | | | | 0.55 | % |
Hypothetical (5% return before expenses) | | $ | 1,000.00 | | | $ | 1,022.27 | | | $ | 2.76 | | | | 0.55 | % |
Class C | | | | | | | | | | | | | | | | |
Actual | | $ | 1,000.00 | | | $ | 987.20 | | | $ | 6.46 | | | | 1.30 | % |
Hypothetical (5% return before expenses) | | $ | 1,000.00 | | | $ | 1,018.50 | | | $ | 6.56 | | | | 1.30 | % |
Class R | | | | | | | | | | | | | | | | |
Actual | | $ | 1,000.00 | | | $ | 990.69 | | | $ | 3.92 | | | | 0.79 | % |
Hypothetical (5% return before expenses) | | $ | 1,000.00 | | | $ | 1,021.07 | | | $ | 3.97 | | | | 0.79 | % |
Class R4 | | | | | | | | | | | | | | | | |
Actual | | $ | 1,000.00 | | | $ | 993.20 | | | $ | 1.20 | | | | 0.24 | % |
Hypothetical (5% return before expenses) | | $ | 1,000.00 | | | $ | 1,023.80 | | | $ | 1.21 | | | | 0.24 | % |
Class R6 | | | | | | | | | | | | | | | | |
Actual | | $ | 1,000.00 | | | $ | 993.35 | | | $ | 0.41 | | | | 0.08 | % |
Hypothetical (5% return before expenses) | | $ | 1,000.00 | | | $ | 1,024.58 | | | $ | 0.42 | | | | 0.08 | % |
| Dynamic Target 2040 Fund | |
Class A | | | | | | | | | | | | | | | | |
Actual | | $ | 1,000.00 | | | $ | 989.02 | | | $ | 2.64 | | | | 0.53 | % |
Hypothetical (5% return before expenses) | | $ | 1,000.00 | | | $ | 1,022.35 | | | $ | 2.68 | | | | 0.53 | % |
Class C | | | | | | | | | | | | | | | | |
Actual | | $ | 1,000.00 | | | $ | 985.47 | | | $ | 6.47 | | | | 1.30 | % |
Hypothetical (5% return before expenses) | | $ | 1,000.00 | | | $ | 1,018.48 | | | $ | 6.58 | | | | 1.30 | % |
Class R | | | | | | | | | | | | | | | | |
Actual | | $ | 1,000.00 | | | $ | 987.94 | | | $ | 3.96 | | | | 0.80 | % |
Hypothetical (5% return before expenses) | | $ | 1,000.00 | | | $ | 1,021.02 | | | $ | 4.03 | | | | 0.80 | % |
Class R4 | | | | | | | | | | | | | | | | |
Actual | | $ | 1,000.00 | | | $ | 990.43 | | | $ | 1.21 | | | | 0.24 | % |
Hypothetical (5% return before expenses) | | $ | 1,000.00 | | | $ | 1,023.79 | | | $ | 1.23 | | | | 0.24 | % |
Class R6 | | | | | | | | | | | | | | | | |
Actual | | $ | 1,000.00 | | | $ | 991.58 | | | $ | 0.44 | | | | 0.09 | % |
Hypothetical (5% return before expenses) | | $ | 1,000.00 | | | $ | 1,024.56 | | | $ | 0.45 | | | | 0.09 | % |
Please see footnote on page 25.
| | | | |
| 24 | | Wells Fargo Dynamic Target Date Funds | | Fund expenses (unaudited) |
| | | | | | | | | | | | | | | | |
| Dynamic Target 2045 Fund | | Beginning
account value
12-1-2015 | | | Ending
account value
5-31-2016 | | | Expenses
paid during
the period¹ | | | Net annualized
expense ratio | |
Class A | | | | | | | | | | | | | | | | |
Actual | | $ | 1,000.00 | | | $ | 990.08 | | | $ | 2.65 | | | | 0.53 | % |
Hypothetical (5% return before expenses) | | $ | 1,000.00 | | | $ | 1,022.33 | | | $ | 2.70 | | | | 0.53 | % |
Class C | | | | | | | | | | | | | | | | |
Actual | | $ | 1,000.00 | | | $ | 986.52 | | | $ | 6.46 | | | | 1.30 | % |
Hypothetical (5% return before expenses) | | $ | 1,000.00 | | | $ | 1,018.50 | | | $ | 6.56 | | | | 1.30 | % |
Class R | | | | | | | | | | | | | | | | |
Actual | | $ | 1,000.00 | | | $ | 989.00 | | | $ | 3.96 | | | | 0.80 | % |
Hypothetical (5% return before expenses) | | $ | 1,000.00 | | | $ | 1,021.02 | | | $ | 4.02 | | | | 0.80 | % |
Class R4 | | | | | | | | | | | | | | | | |
Actual | | $ | 1,000.00 | | | $ | 992.50 | | | $ | 1.19 | | | | 0.24 | % |
Hypothetical (5% return before expenses) | | $ | 1,000.00 | | | $ | 1,023.80 | | | $ | 1.21 | | | | 0.24 | % |
Class R6 | | | | | | | | | | | | | | | | |
Actual | | $ | 1,000.00 | | | $ | 992.64 | | | $ | 0.43 | | | | 0.09 | % |
Hypothetical (5% return before expenses) | | $ | 1,000.00 | | | $ | 1,024.57 | | | $ | 0.44 | | | | 0.09 | % |
| Dynamic Target 2050 Fund | |
Class A | | | | | | | | | | | | | | | | |
Actual | | $ | 1,000.00 | | | $ | 990.20 | | | $ | 2.63 | | | | 0.53 | % |
Hypothetical (5% return before expenses) | | $ | 1,000.00 | | | $ | 1,022.35 | | | $ | 2.68 | | | | 0.53 | % |
Class C | | | | | | | | | | | | | | | | |
Actual | | $ | 1,000.00 | | | $ | 986.50 | | | $ | 6.46 | | | | 1.30 | % |
Hypothetical (5% return before expenses) | | $ | 1,000.00 | | | $ | 1,018.50 | | | $ | 6.56 | | | | 1.30 | % |
Class R | | | | | | | | | | | | | | | | |
Actual | | $ | 1,000.00 | | | $ | 988.99 | | | $ | 3.97 | | | | 0.80 | % |
Hypothetical (5% return before expenses) | | $ | 1,000.00 | | | $ | 1,021.01 | | | $ | 4.03 | | | | 0.80 | % |
Class R4 | | | | | | | | | | | | | | | | |
Actual | | $ | 1,000.00 | | | $ | 992.50 | | | $ | 1.20 | | | | 0.24 | % |
Hypothetical (5% return before expenses) | | $ | 1,000.00 | | | $ | 1,023.80 | | | $ | 1.22 | | | | 0.24 | % |
Class R6 | | | | | | | | | | | | | | | | |
Actual | | $ | 1,000.00 | | | $ | 992.64 | | | $ | 0.43 | | | | 0.09 | % |
Hypothetical (5% return before expenses) | | $ | 1,000.00 | | | $ | 1,024.57 | | | $ | 0.44 | | | | 0.09 | % |
| Dynamic Target 2055 Fund | |
Class A | | | | | | | | | | | | | | | | |
Actual | | $ | 1,000.00 | | | $ | 991.21 | | | $ | 2.71 | | | | 0.54 | % |
Hypothetical (5% return before expenses) | | $ | 1,000.00 | | | $ | 1,022.28 | | | $ | 2.75 | | | | 0.54 | % |
Class C | | | | | | | | | | | | | | | | |
Actual | | $ | 1,000.00 | | | $ | 987.50 | | | $ | 6.46 | | | | 1.30 | % |
Hypothetical (5% return before expenses) | | $ | 1,000.00 | | | $ | 1,018.50 | | | $ | 6.56 | | | | 1.30 | % |
Class R | | | | | | | | | | | | | | | | |
Actual | | $ | 1,000.00 | | | $ | 989.99 | | | $ | 3.97 | | | | 0.80 | % |
Hypothetical (5% return before expenses) | | $ | 1,000.00 | | | $ | 1,021.01 | | | $ | 4.03 | | | | 0.80 | % |
Class R4 | | | | | | | | | | | | | | | | |
Actual | | $ | 1,000.00 | | | $ | 992.50 | | | $ | 1.20 | | | | 0.24 | % |
Hypothetical (5% return before expenses) | | $ | 1,000.00 | | | $ | 1,023.80 | | | $ | 1.21 | | | | 0.24 | % |
Class R6 | | | | | | | | | | | | | | | | |
Actual | | $ | 1,000.00 | | | $ | 993.65 | | | $ | 0.43 | | | | 0.09 | % |
Hypothetical (5% return before expenses) | | $ | 1,000.00 | | | $ | 1,024.57 | | | $ | 0.44 | | | | 0.09 | % |
Please see footnote on page 25.
| | | | | | |
| Fund expenses (unaudited) | | Wells Fargo Dynamic Target Date Funds | | | 25 | |
| | | | | | | | | | | | | | | | |
| Dynamic Target 2060 Fund | | Beginning
account value
12-1-2015 | | | Ending
account value
5-31-2016 | | | Expenses
paid during
the period¹ | | | Net annualized
expense ratio | |
Class A | | | | | | | | | | | | | | | | |
Actual | | $ | 1,000.00 | | | $ | 992.22 | | | $ | 2.74 | | | | 0.55 | % |
Hypothetical (5% return before expenses) | | $ | 1,000.00 | | | $ | 1,022.25 | | | $ | 2.78 | | | | 0.55 | % |
Class C | | | | | | | | | | | | | | | | |
Actual | | $ | 1,000.00 | | | $ | 988.54 | | | $ | 6.46 | | | | 1.30 | % |
Hypothetical (5% return before expenses) | | $ | 1,000.00 | | | $ | 1,018.50 | | | $ | 6.56 | | | | 1.30 | % |
Class R | | | | | | | | | | | | | | | | |
Actual | | $ | 1,000.00 | | | $ | 991.02 | | | $ | 3.97 | | | | 0.80 | % |
Hypothetical (5% return before expenses) | | $ | 1,000.00 | | | $ | 1,021.01 | | | $ | 4.03 | | | | 0.80 | % |
Class R4 | | | | | | | | | | | | | | | | |
Actual | | $ | 1,000.00 | | | $ | 993.51 | | | $ | 1.19 | | | | 0.24 | % |
Hypothetical (5% return before expenses) | | $ | 1,000.00 | | | $ | 1,023.80 | | | $ | 1.21 | | | | 0.24 | % |
Class R6 | | | | | | | | | | | | | | | | |
Actual | | $ | 1,000.00 | | | $ | 994.66 | | | $ | 0.43 | | | | 0.09 | % |
Hypothetical (5% return before expenses) | | $ | 1,000.00 | | | $ | 1,024.57 | | | $ | 0.43 | | | | 0.09 | % |
| 1 | Expenses paid is equal to the annualized expense ratio of each class multiplied by the average account value over the period, multiplied by the number of days in the most recent fiscal half-year divided by the number of days in the fiscal year (to reflect the one-half-year period). |
| | | | |
| 26 | | Wells Fargo Dynamic Target Date Funds | | Portfolio of investments—May 31, 2016 |
DYNAMIC TARGET TODAY FUND
| | | | | | | | | | | | | | | | |
| Security name | | | | | | | | Shares | | | Value | |
| | | | |
Exchange-Traded Funds: 28.71% | | | | | | | | | | | | | | | | |
iShares Global Infrastructure ETF | | | | | | | | | | | 2,544 | | | $ | 101,353 | |
Schwab International Equity ETF | | | | | | | | | | | 7,015 | | | | 193,965 | |
Schwab U.S. Aggregate Bond ETF | | | | | | | | | | | 10,334 | | | | 545,739 | |
Schwab U.S. Broad Market ETF | | | | | | | | | | | 9,166 | | | | 462,425 | |
Schwab U.S. REIT ETF | | | | | | | | | | | 3,621 | | | | 148,606 | |
| | | | |
Total Exchange-Traded Funds (Cost $1,439,799) | | | | | | | | | | | | | | | 1,452,088 | |
| | | | | | | | | | | | | | | | |
| | | | |
Investment Companies: 70.31% | | | | | | | | | | | | | | | | |
| | | | |
| Affiliated Master Portfolios: 23.78% | | | | | | | | | | | | | | | | |
Wells Fargo C&B Large Cap Value Portfolio | | | | | | | | | | | | | | | 82,650 | |
Wells Fargo Core Bond Portfolio | | | | | | | | | | | | | | | 655,585 | |
Wells Fargo Large Company Value Portfolio | | | | | | | | | | | | | | | 83,192 | |
Wells Fargo Real Return Portfolio | | | | | | | | | | | | | | | 272,449 | |
Wells Fargo Small Company Growth Portfolio | | | | | | | | | | | | | | | 54,661 | |
Wells Fargo Small Company Value Portfolio | | | | | | | | | | | | | | | 54,373 | |
| | | | |
| | | | | | | | | | | | | | | 1,202,910 | |
| | | | | | | | | | | | | | | | |
| | | | |
| Fixed-Income Funds: 24.83% | | | | | | | | | | | | | | | | |
Wells Fargo International Bond Fund Class R6 (l)† | | | | | | | | | | | 26,414 | | | | 268,895 | |
Wells Fargo Short-Term Bond Fund Institutional Class (l) | | | | | | | | | | | 56,295 | | | | 493,140 | |
Wells Fargo Strategic Income Fund Institutional Class (l) | | | | | | | | | | | 54,721 | | | | 493,585 | |
| | | | |
| | | | | | | | | | | | | | | 1,255,620 | |
| | | | | | | | | | | | | | | | |
| | | | |
| Equity Funds: 21.70% | | | | | | | | | | | | | | | | |
Calamos Market Neutral Income Fund Class I | | | | | | | | | | | 19,502 | | | | 249,625 | |
Wells Fargo Diversified International Fund Class R6 (l) | | | | | | | | | | | 20,420 | | | | 229,932 | |
Wells Fargo Emerging Markets Equity Income Fund Class R6 (l) | | | | | | | | | | | 10,965 | | | | 104,277 | |
Wells Fargo Endeavor Select Fund Institutional Class (l)† | | | | | | | | | | | 13,451 | | | | 124,955 | |
Wells Fargo Enterprise Fund Class R6 (l)† | | | | | | | | | | | 2,082 | | | | 91,018 | |
Wells Fargo Intrinsic Value Fund Class R6 (l) | | | | | | | | | | | 7,085 | | | | 82,395 | |
Wells Fargo Premier Large Company Growth Fund Class R6 (l)† | | | | | | | | | | | 8,539 | | | | 125,178 | |
Wells Fargo Special Mid Cap Value Fund Class R6 (l) | | | | | | | | | | | 2,795 | | | | 90,377 | |
| | | | |
| | | | | | | | | | | | | | | 1,097,757 | |
| | | | | | | | | | | | | | | | |
| | | | |
Total Investment Companies (Cost $3,588,173) | | | | | | | | | | | | | | | 3,556,287 | |
| | | | | | | | | | | | | | | | |
| | | | |
| | | Yield | | | Maturity date | | | Principal | | | | |
| Short-Term Investments: 0.06% | | | | | | | | | | | | | | | | |
| | | | |
| U.S. Treasury Securities: 0.06% | | | | | | | | | | | | | | | | |
U.S. Treasury Bill (z)# | | | 0.09 | % | | | 6-9-2016 | | | $ | 3,000 | | | | 3,000 | |
| | | | | | | | | | | | | | | | |
| | | | |
Total Short-Term Investments (Cost $3,000) | | | | | | | | | | | | | | | 3,000 | |
| | | | | | | | | | | | | | | | |
| | | | | | | | |
| Total investments in securities (Cost $5,030,972) * | | | 99.08 | % | | | 5,011,375 | |
Other assets and liabilities, net | | | 0.92 | | | | 46,473 | |
| | | | | | | | |
| Total net assets | | | 100.00 | % | | $ | 5,057,848 | |
| | | | | | | | |
The accompanying notes are an integral part of these financial statements.
| | | | | | |
| Portfolio of investments—May 31, 2016 | | Wells Fargo Dynamic Target Date Funds | | | 27 | |
DYNAMIC TARGET TODAY FUND
| (l) | The issuer of the security is an affiliated person of the Fund as defined in the Investment Company Act of 1940. |
| † | Non-income-earning security |
| (z) | Zero coupon security. The rate represents the current yield to maturity. |
| # | All or a portion of this security is segregated as collateral for investments in derivative instruments. |
| * | Cost for federal income tax purposes is $5,035,702 and unrealized gains (losses) consists of: |
| | | | |
Gross unrealized gains | | $ | 81,745 | |
Gross unrealized losses | | | (106,072 | ) |
| | | | |
Net unrealized losses | | $ | (24,327 | ) |
The accompanying notes are an integral part of these financial statements.
| | | | |
| 28 | | Wells Fargo Dynamic Target Date Funds | | Portfolio of investments—May 31, 2016 |
DYNAMIC TARGET 2015 FUND
| | | | | | | | | | | | | | | | |
| Security name | | | | | | | | Shares | | | Value | |
| | | |
Exchange-Traded Funds: 30.56% | | | | | | | | | | | | | |
iShares Global Infrastructure ETF | | | | | | | | | | | 2,561 | | | $ | 102,030 | |
Schwab International Equity ETF | | | | | | | | | | | 10,231 | | | | 282,887 | |
Schwab U.S. Aggregate Bond ETF | | | | | | | | | | | 7,678 | | | | 405,475 | |
Schwab U.S. Broad Market ETF | | | | | | | | | | | 13,405 | | | | 676,282 | |
Schwab U.S. REIT ETF | | | | | | | | | | | 2,450 | | | | 100,548 | |
| | | | |
Total Exchange-Traded Funds (Cost $1,560,574) | | | | | | | | | | | | | | | 1,567,222 | |
| | | | | | | | | | | | | | | | |
| | | | |
Investment Companies: 68.50% | | | | | | | | | | | | | | | | |
| | | |
| Affiliated Master Portfolios: 21.27% | | | | | | | | | | | | | |
Wells Fargo C&B Large Cap Value Portfolio | | | | | | | | | | | | | | | 120,498 | |
Wells Fargo Core Bond Portfolio | | | | | | | | | | | | | | | 487,203 | |
Wells Fargo Large Company Value Portfolio | | | | | | | | | | | | | | | 121,833 | |
Wells Fargo Real Return Portfolio | | | | | | | | | | | | | | | 202,701 | |
Wells Fargo Small Company Growth Portfolio | | | | | | | | | | | | | | | 79,555 | |
Wells Fargo Small Company Value Portfolio | | | | | | | | | | | | | | | 79,184 | |
| | | | |
| | | | | | | | | | | | | | | 1,090,974 | |
| | | | | | | | | | | | | | | | |
| | | |
| Fixed-Income Funds: 18.22% | | | | | | | | | | | | | |
Wells Fargo International Bond Fund Class R6 (l)† | | | | | | | | | | | 19,765 | | | | 201,204 | |
Wells Fargo Short-Term Bond Fund Institutional Class (l) | | | | | | | | | | | 41,805 | | | | 366,215 | |
Wells Fargo Strategic Income Fund Institutional Class (l) | | | | | | | | | | | 40,667 | | | | 366,819 | |
| | | | |
| | | | | | | | | | | | | | | 934,238 | |
| | | | | | | | | | | | | | | | |
| | | |
| Equity Funds: 29.01% | | | | | | | | | | | | | |
Calamos Market Neutral Income Fund Class I | | | | | | | | | | | 19,730 | | | | 252,550 | |
Wells Fargo Diversified International Fund Class R6 (l) | | | | | | | | | | | 29,792 | | | | 335,454 | |
Wells Fargo Emerging Markets Equity Income Fund Class R6 (l) | | | | | | | | | | | 15,909 | | | | 151,293 | |
Wells Fargo Endeavor Select Fund Institutional Class (l)† | | | | | | | | | | | 19,614 | | | | 182,215 | |
Wells Fargo Enterprise Fund Class R6 (l)† | | | | | | | | | | | 3,023 | | | | 132,116 | |
Wells Fargo Intrinsic Value Fund Class R6 (l) | | | | | | | | | | | 10,319 | | | | 120,009 | |
Wells Fargo Premier Large Company Growth Fund Class R6 (l)† | | | | | | | | | | | 12,459 | | | | 182,654 | |
Wells Fargo Special Mid Cap Value Fund Class R6 (l) | | | | | | | | | | | 4,068 | | | | 131,520 | |
| | | | |
| | | | | | | | | | | | | | | 1,487,811 | |
| | | | | | | | | | | | | | | | |
| | | |
Total Investment Companies (Cost $3,572,635) | | | | | | | | | | | | 3,513,023 | |
| | | | | | | | | | | | | | | | |
| | | | |
| | | Yield | | | Maturity date | | | Principal | | | | |
| Short-Term Investments: 0.06% | | | | | | | | | | | | | |
| | | | |
| U.S. Treasury Securities: 0.06% | | | | | | | | | | | | | | | | |
U.S. Treasury Bill (z)# | | | 0.09 | % | | | 6-9-2016 | | | $ | 3,000 | | | | 3,000 | |
| | | | | | | | | | | | | | | | |
| | | |
Total Short-Term Investments (Cost $3,000) | | | | | | | | | | | | 3,000 | |
| | | | | | | | | | | | | | | | |
| | | | | | | | |
| Total investments in securities (Cost $5,136,209) * | | | 99.12 | % | | | 5,083,245 | |
Other assets and liabilities, net | | | 0.88 | | | | 45,165 | |
| | | | | | | | |
| Total net assets | | | 100.00 | % | | $ | 5,128,410 | |
| | | | | | | | |
The accompanying notes are an integral part of these financial statements.
| | | | | | |
| Portfolio of investments—May 31, 2016 | | Wells Fargo Dynamic Target Date Funds | | | 29 | |
DYNAMIC TARGET 2015 FUND
| (l) | The issuer of the security is an affiliated person of the Fund as defined in the Investment Company Act of 1940. |
| † | Non-income-earning security |
| (z) | Zero coupon security. The rate represents the current yield to maturity. |
| # | All or a portion of this security is segregated as collateral for investments in derivative instruments. |
| * | Cost for federal income tax purposes is $5,143,240 and unrealized gains (losses) consists of: |
| | | | |
Gross unrealized gains | | $ | 84,764 | |
Gross unrealized losses | | | (144,759 | ) |
| | | | |
Net unrealized losses | | $ | (59,995 | ) |
The accompanying notes are an integral part of these financial statements.
| | | | |
| 30 | | Wells Fargo Dynamic Target Date Funds | | Portfolio of investments—May 31, 2016 |
DYNAMIC TARGET 2020 FUND
| | | | | | | | | | | | | | | | |
| Security name | | | | | | | | Shares | | | Value | |
| | | | |
Exchange-Traded Funds: 31.39% | | | | | | | | | | | | | | | | |
iShares Global Infrastructure ETF | | | | | | | | | | | 1,329 | | | $ | 52,947 | |
Schwab International Equity ETF | | | | | | | | | | | 12,002 | | | | 331,855 | |
Schwab U.S. Aggregate Bond ETF | | | | | | | | | | | 5,892 | | | | 311,157 | |
Schwab U.S. Broad Market ETF | | | | | | | | | | | 15,686 | | | | 791,359 | |
Schwab U.S. REIT ETF | | | | | | | | | | | 2,395 | | | | 98,291 | |
| | | | |
Total Exchange-Traded Funds (Cost $1,589,344) | | | | | | | | | | | | | | | 1,585,609 | |
| | | | | | | | | | | | | | | | |
| | | | |
Investment Companies: 67.61% | | | | | | | | | | | | | | | | |
| | | | |
| Affiliated Master Portfolios: 19.80% | | | | | | | | | | | | | | | | |
Wells Fargo C&B Large Cap Value Portfolio | | | | | | | | | | | | | | | 141,485 | |
Wells Fargo Core Bond Portfolio | | | | | | | | | | | | | | | 373,767 | |
Wells Fargo Large Company Value Portfolio | | | | | | | | | | | | | | | 142,659 | |
Wells Fargo Real Return Portfolio | | | | | | | | | | | | | | | 155,360 | |
Wells Fargo Small Company Growth Portfolio | | | | | | | | | | | | | | | 93,500 | |
Wells Fargo Small Company Value Portfolio | | | | | | | | | | | | | | | 93,123 | |
| | | | |
| | | | | | | | | | | | | | | 999,894 | |
| | | | | | | | | | | | | | | | |
| | | | |
| Fixed-Income Funds: 14.18% | | | | | | | | | | | | | | | | |
Wells Fargo International Bond Fund Class R6 (l)† | | | | | | | | | | | 15,093 | | | | 153,647 | |
Wells Fargo Short-Term Bond Fund Institutional Class (l) | | | | | | | | | | | 32,087 | | | | 281,078 | |
Wells Fargo Strategic Income Fund Institutional Class (l) | | | | | | | | | | | 31,187 | | | | 281,303 | |
| | | | |
| | | | | | | | | | | | | | | 716,028 | |
| | | | | | | | | | | | | | | | |
| | | | |
| Equity Funds: 33.63% | | | | | | | | | | | | | | | | |
Calamos Market Neutral Income Fund Class I | | | | | | | | | | | 19,351 | | | | 247,698 | |
Wells Fargo Diversified International Fund Class R6 (l) | | | | | | | | | | | 34,923 | | | | 393,234 | |
Wells Fargo Emerging Markets Equity Income Fund Class R6 (l) | | | | | | | | | | | 18,721 | | | | 178,035 | |
Wells Fargo Endeavor Select Fund Institutional Class (l)† | | | | | | | | | | | 23,007 | | | | 213,737 | |
Wells Fargo Enterprise Fund Class R6 (l)† | | | | | | | | | | | 3,573 | | | | 156,168 | |
Wells Fargo Intrinsic Value Fund Class R6 (l) | | | | | | | | | | | 12,107 | | | | 140,801 | |
Wells Fargo Premier Large Company Growth Fund Class R6 (l)† | | | | | | | | | | | 14,603 | | | | 214,087 | |
Wells Fargo Special Mid Cap Value Fund Class R6 (l) | | | | | | | | | | | 4,789 | | | | 154,841 | |
| | | | |
| | | | | | | | | | | | | | | 1,698,601 | |
| | | | | | | | | | | | | | | | |
| | | | |
Total Investment Companies (Cost $3,501,318) | | | | | | | | | | | | | | | 3,414,523 | |
| | | | | | | | | | | | | | | | |
| | | | |
| | | Yield | | | Maturity date | | | Principal | | | | |
| Short-Term Investments: 0.06% | | | | | | | | | | | | | | | | |
| | | | |
| U.S. Treasury Securities: 0.06% | | | | | | | | | | | | | | | | |
U.S. Treasury Bill (z)# | | | 0.09 | % | | | 6-9-2016 | | | $ | 3,000 | | | | 3,000 | |
| | | | | | | | | | | | | | | | |
| | | | |
Total Short-Term Investments (Cost $3,000) | | | | | | | | | | | | | | | 3,000 | |
| | | | | | | | | | | | | | | | |
| | | | | | | | |
| Total investments in securities (Cost $5,093,662) * | | | 99.06 | % | | | 5,003,132 | |
Other assets and liabilities, net | | | 0.94 | | | | 47,365 | |
| | | | | | | | |
| Total net assets | | | 100.00 | % | | $ | 5,050,497 | |
| | | | | | | | |
The accompanying notes are an integral part of these financial statements.
| | | | | | |
| Portfolio of investments—May 31, 2016 | | Wells Fargo Dynamic Target Date Funds | | | 31 | |
DYNAMIC TARGET 2020 FUND
| (l) | The issuer of the security is an affiliated person of the Fund as defined in the Investment Company Act of 1940. |
| † | Non-income-earning security |
| (z) | Zero coupon security. The rate represents the current yield to maturity. |
| # | All or a portion of this security is segregated as collateral for investments in derivative instruments. |
| * | Cost for federal income tax purposes is $5,101,693 and unrealized gains (losses) consists of: |
| | | | |
Gross unrealized gains | | $ | 80,782 | |
Gross unrealized losses | | | (179,343 | ) |
| | | | |
Net unrealized losses | | $ | (98,561 | ) |
The accompanying notes are an integral part of these financial statements.
| | | | |
| 32 | | Wells Fargo Dynamic Target Date Funds | | Portfolio of investments—May 31, 2016 |
DYNAMIC TARGET 2025 FUND
| | | | | | | | | | | | | | | | |
| Security name | | | | | | | | Shares | | | Value | |
| | | | |
Exchange-Traded Funds: 32.10% | | | | | | | | | | | | | | | | |
iShares Global Infrastructure ETF | | | | | | | | | | | 1,271 | | | $ | 50,637 | |
Schwab International Equity ETF | | | | | | | | | | | 13,895 | | | | 384,197 | |
Schwab U.S. Aggregate Bond ETF | | | | | | | | | | | 4,419 | | | | 233,367 | |
Schwab U.S. Broad Market ETF | | | | | | | | | | | 18,156 | | | | 915,970 | |
Schwab U.S. REIT ETF | | | | | | | | | | | 1,271 | | | | 52,162 | |
| | | | |
Total Exchange-Traded Funds (Cost $1,643,164) | | | | | | | | | | | | | | | 1,636,333 | |
| | | | | | | | | | | | | | | | |
| | | | |
Investment Companies: 66.88% | | | | | | | | | | | | | | | | |
| | | | |
| Affiliated Master Portfolios: 18.48% | | | | | | | | | | | | | | | | |
Wells Fargo C&B Large Cap Value Portfolio | | | | | | | | | | | | | | | 163,963 | |
Wells Fargo Core Bond Portfolio | | | | | | | | | | | | | | | 280,198 | |
Wells Fargo Large Company Value Portfolio | | | | | | | | | | | | | | | 165,213 | |
Wells Fargo Real Return Portfolio | | | | | | | | | | | | | | | 116,379 | |
Wells Fargo Small Company Growth Portfolio | | | | | | | | | | | | | | | 108,232 | |
Wells Fargo Small Company Value Portfolio | | | | | | | | | | | | | | | 107,945 | |
| | | | |
| | | | | | | | | | | | | | | 941,930 | |
| | | | | | | | | | | | | | | | |
| | | | |
| Fixed-Income Funds: 10.54% | | | | | | | | | | | | | | | | |
Wells Fargo International Bond Fund Class R6 (l)† | | | | | | | | | | | 11,328 | | | | 115,318 | |
Wells Fargo Short-Term Bond Fund Institutional Class (l) | | | | | | | | | | | 24,065 | | | | 210,808 | |
Wells Fargo Strategic Income Fund Institutional Class (l) | | | | | | | | | | | 23,392 | | | | 210,993 | |
| | | | |
| | | | | | | | | | | | | | | 537,119 | |
| | | | | | | | | | | | | | | | |
| | | | |
| Equity Funds: 37.86% | | | | | | | | | | | | | | | | |
Calamos Market Neutral Income Fund Class I | | | | | | | | | | | 19,476 | | | | 249,291 | |
Wells Fargo Diversified International Fund Class R6 (l) | | | | | | | | | | | 40,448 | | | | 455,447 | |
Wells Fargo Emerging Markets Equity Income Fund Class R6 (l) | | | | | | | | | | | 21,645 | | | | 205,847 | |
Wells Fargo Endeavor Select Fund Institutional Class (l)† | | | | | | | | | | | 26,665 | | | | 247,716 | |
Wells Fargo Enterprise Fund Class R6 (l)† | | | | | | | | | | | 4,136 | | | | 180,779 | |
Wells Fargo Intrinsic Value Fund Class R6 (l) | | | | | | | | | | | 14,010 | | | | 162,940 | |
Wells Fargo Premier Large Company Growth Fund Class R6 (l)† | | | | | | | | | | | 16,918 | | | | 248,021 | |
Wells Fargo Special Mid Cap Value Fund Class R6 (l) | | | | | | | | | | | 5,546 | | | | 179,300 | |
| | | | |
| | | | | | | | | | | | | | | 1,929,341 | |
| | | | | | | | | | | | | | | | |
| | | | |
Total Investment Companies (Cost $3,505,356) | | | | | | | | | | | | | | | 3,408,390 | |
| | | | | | | | | | | | | | | | |
| | | | |
| | | Yield | | | Maturity date | | | Principal | | | | |
| Short-Term Investments: 0.06% | | | | | | | | | | | | | | | | |
| | | | |
| U.S. Treasury Securities: 0.06% | | | | | | | | | | | | | | | | |
U.S. Treasury Bill (z)# | | | 0.16 | % | | | 6-9-2016 | | | $ | 3,000 | | | | 3,000 | |
| | | | | | | | | | | | | | | | |
| | | | |
Total Short-Term Investments (Cost $3,000) | | | | | | | | | | | | | | | 3,000 | |
| | | | | | | | | | | | | | | | |
| | | | | | | | |
| Total investments in securities (Cost $5,151,520) * | | | 99.04 | % | | | 5,047,723 | |
Other assets and liabilities, net | | | 0.96 | | | | 48,724 | |
| | | | | | | | |
| Total net assets | | | 100.00 | % | | $ | 5,096,447 | |
| | | | | | | | |
The accompanying notes are an integral part of these financial statements.
| | | | | | |
| Portfolio of investments—May 31, 2016 | | Wells Fargo Dynamic Target Date Funds | | | 33 | |
DYNAMIC TARGET 2025 FUND
| (l) | The issuer of the security is an affiliated person of the Fund as defined in the Investment Company Act of 1940. |
| † | Non-income-earning security |
| (z) | Zero coupon security. The rate represents the current yield to maturity. |
| # | All or a portion of this security is segregated as collateral for investments in derivative instruments. |
| * | Cost for federal income tax purposes is $5,164,832 and unrealized gains (losses) consists of: |
| | | | |
Gross unrealized gains | | $ | 81,827 | |
Gross unrealized losses | | | (198,936 | ) |
| | | | |
Net unrealized losses | | $ | (117,109 | ) |
The accompanying notes are an integral part of these financial statements.
| | | | |
| 34 | | Wells Fargo Dynamic Target Date Funds | | Portfolio of investments—May 31, 2016 |
DYNAMIC TARGET 2030 FUND
| | | | | | | | | | | | | | | | |
| Security name | | | | | | | | Shares | | | Value | |
| | | | |
Exchange-Traded Funds: 32.79% | | | | | | | | | | | | | | | | |
iShares Global Infrastructure ETF | | | | | | | | | | | 84 | | | $ | 3,347 | |
Schwab International Equity ETF | | | | | | | | | | | 15,579 | | | | 430,759 | |
Schwab U.S. Aggregate Bond ETF | | | | | | | | | | | 2,892 | | | | 152,727 | |
Schwab U.S. Broad Market ETF | | | | | | | | | | | 20,352 | | | | 1,026,758 | |
Schwab U.S. REIT ETF | | | | | | | | | | | 1,191 | | | | 48,879 | |
| | | | |
Total Exchange-Traded Funds (Cost $1,677,198) | | | | | | | | | | | | | | | 1,662,470 | |
| | | | | | | | | | | | | | | | |
| | | | |
Investment Companies: 66.08% | | | | | | | | | | | | | | | | |
| | | | |
| Affiliated Master Portfolios: 17.16% | | | | | | | | | | | | | | | | |
Wells Fargo C&B Large Cap Value Portfolio | | | | | | | | | | | | | | | 183,237 | |
Wells Fargo Core Bond Portfolio | | | | | | | | | | | | | | | 183,263 | |
Wells Fargo Large Company Value Portfolio | | | | | | | | | | | | | | | 185,029 | |
Wells Fargo Real Return Portfolio | | | | | | | | | | | | | | | 76,203 | |
Wells Fargo Small Company Growth Portfolio | | | | | | | | | | | | | | | 121,286 | |
Wells Fargo Small Company Value Portfolio | | | | | | | | | | | | | | | 120,766 | |
| | | | |
| | | | | | | | | | | | | | | 869,784 | |
| | | | | | | | | | | | | | | | |
| | | | |
| Fixed-Income Funds: 6.92% | | | | | | | | | | | | | | | | |
Wells Fargo International Bond Fund Class R6 (l)† | | | | | | | | | | | 7,426 | | | | 75,599 | |
Wells Fargo Short-Term Bond Fund Institutional Class (l) | | | | | | | | | | | 15,716 | | | | 137,676 | |
Wells Fargo Strategic Income Fund Institutional Class (l) | | | | | | | | | | | 15,278 | | | | 137,803 | |
| | | | |
| | | | | | | | | | | | | | | 351,078 | |
| | | | | | | | | | | | | | | | |
| | | | |
| Equity Funds: 42.00% | | | | | | | | | | | | | | | | |
Calamos Market Neutral Income Fund Class I | | | | | | | | | | | 19,328 | | | | 247,398 | |
Wells Fargo Diversified International Fund Class R6 (l) | | | | | | | | | | | 45,343 | | | | 510,563 | |
Wells Fargo Emerging Markets Equity Income Fund Class R6 (l) | | | | | | | | | | | 24,282 | | | | 230,925 | |
Wells Fargo Endeavor Select Fund Institutional Class (l)† | | | | | | | | | | | 29,879 | | | | 277,575 | |
Wells Fargo Enterprise Fund Class R6 (l)† | | | | | | | | | | | 4,608 | | | | 201,433 | |
Wells Fargo Intrinsic Value Fund Class R6 (l) | | | | | | | | | | | 15,710 | | | | 182,703 | |
Wells Fargo Premier Large Company Growth Fund Class R6 (l)† | | | | | | | | | | | 18,961 | | | | 277,974 | |
Wells Fargo Special Mid Cap Value Fund Class R6 (l) | | | | | | | | | | | 6,195 | | | | 200,284 | |
| | | | |
| | | | | | | | | | | | | | | 2,128,855 | |
| | | | | | | | | | | | | | | | |
| | | | |
Total Investment Companies (Cost $3,467,841) | | | | | | | | | | | | | | | 3,349,717 | |
| | | | | | | | | | | | | | | | |
| | | | |
| | | Yield | | | Maturity date | | | Principal | | | | |
| Short-Term Investments: 0.16% | | | | | | | | | | | | | | | | |
| | | | |
| U.S. Treasury Securities: 0.16% | | | | | | | | | | | | | | | | |
U.S. Treasury Bill (z)# | | | 0.17 | % | | | 6-9-2016 | | | $ | 8,000 | | | | 8,000 | |
| | | | | | | | | | | | | | | | |
| | | | |
Total Short-Term Investments (Cost $8,000) | | | | | | | | | | | | | | | 8,000 | |
| | | | | | | | | | | | | | | | |
| | | | | | | | |
| Total investments in securities (Cost $5,153,039) * | | | 99.03 | % | | | 5,020,187 | |
Other assets and liabilities, net | | | 0.97 | | | | 48,934 | |
| | | | | | | | |
| Total net assets | | | 100.00 | % | | $ | 5,069,121 | |
| | | | | | | | |
The accompanying notes are an integral part of these financial statements.
| | | | | | |
| Portfolio of investments—May 31, 2016 | | Wells Fargo Dynamic Target Date Funds | | | 35 | |
DYNAMIC TARGET 2030 FUND
| (l) | The issuer of the security is an affiliated person of the Fund as defined in the Investment Company Act of 1940. |
| † | Non-income-earning security |
| (z) | Zero coupon security. The rate represents the current yield to maturity. |
| # | All or a portion of this security is segregated as collateral for investments in derivative instruments. |
| * | Cost for federal income tax purposes is $5,170,821 and unrealized gains (losses) consists of: |
| | | | |
Gross unrealized gains | | $ | 86,941 | |
Gross unrealized losses | | | (237,575 | ) |
| | | | |
Net unrealized losses | | $ | (150,634 | ) |
The accompanying notes are an integral part of these financial statements.
| | | | |
| 36 | | Wells Fargo Dynamic Target Date Funds | | Portfolio of investments—May 31, 2016 |
DYNAMIC TARGET 2035 FUND
| | | | | | | | | | | | | | | | |
| Security name | | | | | | | | Shares | | | Value | |
| | | | |
Exchange-Traded Funds: 33.02% | | | | | | | | | | | | | | | | |
Schwab International Equity ETF | | | | | | | | | | | 16,531 | | | $ | 457,082 | |
Schwab U.S. Aggregate Bond ETF | | | | | | | | | | | 1,894 | | | | 100,022 | |
Schwab U.S. Broad Market ETF | | | | | | | | | | | 21,603 | | | | 1,089,871 | |
Schwab U.S. REIT ETF | | | | | | | | | | | 78 | | | | 3,201 | |
| | | | |
Total Exchange-Traded Funds (Cost $1,669,762) | | | | | | | | | | | | | | | 1,650,176 | |
| | | | | | | | | | | | | | | | |
| | | | |
Investment Companies: 65.84% | | | | | | | | | | | | | | | | |
| | | | |
| Affiliated Master Portfolios: 16.37% | | | | | | | | | | | | | | | | |
Wells Fargo C&B Large Cap Value Portfolio | | | | | | | | | | | | | | | 194,790 | |
Wells Fargo Core Bond Portfolio | | | | | | | | | | | | | | | 120,029 | |
Wells Fargo Large Company Value Portfolio | | | | | | | | | | | | | | | 196,262 | |
Wells Fargo Real Return Portfolio | | | | | | | | | | | | | | | 49,934 | |
Wells Fargo Small Company Growth Portfolio | | | | | | | | | | | | | | | 128,545 | |
Wells Fargo Small Company Value Portfolio | | | | | | | | | | | | | | | 128,239 | |
| | | | |
| | | | | | | | | | | | | | | 817,799 | |
| | | | | | | | | | | | | | | | |
| | | | |
| Fixed-Income Funds: 4.60% | | | | | | | | | | | | | | | | |
Wells Fargo International Bond Fund Class R6 (l)† | | | | | | | | | | | 4,862 | | | | 49,499 | |
Wells Fargo Short-Term Bond Fund Institutional Class (l) | | | | | | | | | | | 10,291 | | | | 90,151 | |
Wells Fargo Strategic Income Fund Institutional Class (l) | | | | | | | | | | | 10,002 | | | | 90,218 | |
| | | | |
| | | | | | | | | | | | | | | 229,868 | |
| | | | | | | | | | | | | | | | |
| | | | |
| Equity Funds: 44.87% | | | | | | | | | | | | | | | | |
Calamos Market Neutral Income Fund Class I | | | | | | | | | | | 19,130 | | | | 244,870 | |
Wells Fargo Diversified International Fund Class R6 (l) | | | | | | | | | | | 48,108 | | | | 541,697 | |
Wells Fargo Emerging Markets Equity Income Fund Class R6 (l) | | | | | | | | | | | 25,721 | | | | 244,602 | |
Wells Fargo Endeavor Select Fund Institutional Class (l)† | | | | | | | | | | | 31,745 | | | | 294,912 | |
Wells Fargo Enterprise Fund Class R6 (l)† | | | | | | | | | | | 4,907 | | | | 214,493 | |
Wells Fargo Intrinsic Value Fund Class R6 (l) | | | | | | | | | | | 16,667 | | | | 193,840 | |
Wells Fargo Premier Large Company Growth Fund Class R6 (l)† | | | | | | | | | | | 20,115 | | | | 294,888 | |
Wells Fargo Special Mid Cap Value Fund Class R6 (l) | | | | | | | | | | | 6,592 | | | | 213,103 | |
| | | | |
| | | | | | | | | | | | | | | 2,242,405 | |
| | | | | | | | | | | | | | | | |
| | | | |
Total Investment Companies (Cost $3,416,963) | | | | | | | | | | | | | | | 3,290,072 | |
| | | | | | | | | | | | | | | | |
| | | | |
| | | Yield | | | Maturity date | | | Principal | | | | |
| Short-Term Investments: 0.16% | | | | | | | | | | | | | | | | |
| | | | |
| U.S. Treasury Securities: 0.16% | | | | | | | | | | | | | | | | |
U.S. Treasury Bill (z)# | | | 0.16 | % | | | 6-9-2016 | | | $ | 8,000 | | | | 8,000 | |
| | | | | | | | | | | | | | | | |
| | | | |
Total Short-Term Investments (Cost $8,000) | | | | | | | | | | | | | | | 8,000 | |
| | | | | | | | | | | | | | | | |
| | | | | | | | |
| Total investments in securities (Cost $5,094,725) * | | | 99.02 | % | | | 4,948,248 | |
Other assets and liabilities, net | | | 0.98 | | | | 48,879 | |
| | | | | | | | |
| Total net assets | | | 100.00 | % | | $ | 4,997,127 | |
| | | | | | | | |
The accompanying notes are an integral part of these financial statements.
| | | | | | |
| Portfolio of investments—May 31, 2016 | | Wells Fargo Dynamic Target Date Funds | | | 37 | |
DYNAMIC TARGET 2035 FUND
| (l) | The issuer of the security is an affiliated person of the Fund as defined in the Investment Company Act of 1940. |
| † | Non-income-earning security |
| (z) | Zero coupon security. The rate represents the current yield to maturity. |
| # | All or a portion of this security is segregated as collateral for investments in derivative instruments. |
| * | Cost for federal income tax purposes is $5,120,977 and unrealized gains (losses) consists of: |
| | | | |
Gross unrealized gains | | $ | 78,049 | |
Gross unrealized losses | | | (250,778 | ) |
| | | | |
Net unrealized losses | | $ | (172,729 | ) |
The accompanying notes are an integral part of these financial statements.
| | | | |
| 38 | | Wells Fargo Dynamic Target Date Funds | | Portfolio of investments—May 31, 2016 |
DYNAMIC TARGET 2040 FUND
| | | | | | | | | | | | | | | | |
| Security name | | | | | | | | Shares | | | Value | |
| | | | |
Exchange-Traded Funds: 33.58% | | | | | | | | | | | | | | | | |
Schwab International Equity ETF | | | | | | | | | | | 17,425 | | | $ | 481,801 | |
Schwab U.S. Aggregate Bond ETF | | | | | | | | | | | 1,177 | | | | 62,157 | |
Schwab U.S. Broad Market ETF | | | | | | | | | | | 22,665 | | | | 1,143,449 | |
| | | | |
Total Exchange-Traded Funds (Cost $1,707,950) | | | | | | | | | | | | | | | 1,687,407 | |
| | | | | | | | | | | | | | | | |
| | | | |
Investment Companies: 65.33% | | | | | | | | | | | | | | | | |
| | | | |
| Affiliated Master Portfolios: 15.64% | | | | | | | | | | | | | | | | |
Wells Fargo C&B Large Cap Value Portfolio | | | | | | | | | | | | | | | 204,823 | |
Wells Fargo Core Bond Portfolio | | | | | | | | | | | | | | | 74,638 | |
Wells Fargo Large Company Value Portfolio | | | | | | | | | | | | | | | 205,888 | |
Wells Fargo Real Return Portfolio | | | | | | | | | | | | | | | 31,179 | |
Wells Fargo Small Company Growth Portfolio | | | | | | | | | | | | | | | 134,931 | |
Wells Fargo Small Company Value Portfolio | | | | | | | | | | | | | | | 134,356 | |
| | | | |
| | | | | | | | | | | | | | | 785,815 | |
| | | | | | | | | | | | | | | | |
| | | | |
| Fixed-Income Funds: 2.85% | | | | | | | | | | | | | | | | |
Wells Fargo International Bond Fund Class R6 (l)† | | | | | | | | | | | 3,052 | | | | 31,074 | |
Wells Fargo Short-Term Bond Fund Institutional Class (l) | | | | | | | | | | | 6,399 | | | | 56,055 | |
Wells Fargo Strategic Income Fund Institutional Class (l) | | | | | | | | | | | 6,216 | | | | 56,065 | |
| | | | |
| | | | | | | | | | | | | | | 143,194 | |
| | | | | | | | | | | | | | | | |
| | | | |
| Equity Funds: 46.84% | | | | | | | | | | | | | | | | |
Calamos Market Neutral Income Fund Class I | | | | | | | | | | | 19,357 | | | | 247,772 | |
Wells Fargo Diversified International Fund Class R6 (l) | | | | | | | | | | | 50,806 | | | | 572,075 | |
Wells Fargo Emerging Markets Equity Income Fund Class R6 (l) | | | | | | | | | | | 27,749 | | | | 263,893 | |
Wells Fargo Endeavor Select Fund Institutional Class (l)† | | | | | | | | | | | 33,204 | | | | 308,468 | |
Wells Fargo Enterprise Fund Class R6 (l)† | | | | | | | | | | | 5,128 | | | | 224,148 | |
Wells Fargo Intrinsic Value Fund Class R6 (l) | | | | | | | | | | | 17,620 | | | | 204,920 | |
Wells Fargo Premier Large Company Growth Fund Class R6 (l)† | | | | | | | | | | | 21,100 | | | | 309,319 | |
Wells Fargo Special Mid Cap Value Fund Class R6 (l) | | | | | | | | | | | 6,898 | | | | 223,027 | |
| | | | |
| | | | | | | | | | | | | | | 2,353,622 | |
| | | | | | | | | | | | | | | | |
| | | | |
Total Investment Companies (Cost $3,413,960) | | | | | | | | | | | | | | | 3,282,631 | |
| | | | | | | | | | | | | | | | |
| | | | |
| | | Yield | | | Maturity date | | | Principal | | | | |
| Short-Term Investments: 0.16% | | | | | | | | | | | | | | | | |
| | | | |
| U.S. Treasury Securities: 0.16% | | | | | | | | | | | | | | | | |
U.S. Treasury Bill (z)# | | | 0.15 | % | | | 6-9-2016 | | | $ | 8,000 | | | | 8,000 | |
| | | | | | | | | | | | | | | | |
| | | | |
Total Short-Term Investments (Cost $8,000) | | | | | | | | | | | | | | | 8,000 | |
| | | | | | | | | | | | | | | | |
| | | | | | | | |
| Total investments in securities (Cost $5,129,910) * | | | 99.07 | % | | | 4,978,038 | |
Other assets and liabilities, net | | | 0.93 | | | | 46,896 | |
| | | | | | | | |
| Total net assets | | | 100.00 | % | | $ | 5,024,934 | |
| | | | | | | | |
The accompanying notes are an integral part of these financial statements.
| | | | | | |
| Portfolio of investments—May 31, 2016 | | Wells Fargo Dynamic Target Date Funds | | | 39 | |
DYNAMIC TARGET 2040 FUND
| (l) | The issuer of the security is an affiliated person of the Fund as defined in the Investment Company Act of 1940. |
| † | Non-income-earning security |
| (z) | Zero coupon security. The rate represents the current yield to maturity. |
| # | All or a portion of this security is segregated as collateral for investments in derivative instruments. |
| * | Cost for federal income tax purposes is $5,161,917 and unrealized gains (losses) consists of: |
| | | | |
Gross unrealized gains | | $ | 78,315 | |
Gross unrealized losses | | | (262,194 | ) |
| | | | |
Net unrealized losses | | $ | (183,879 | ) |
The accompanying notes are an integral part of these financial statements.
| | | | |
| 40 | | Wells Fargo Dynamic Target Date Funds | | Portfolio of investments—May 31, 2016 |
DYNAMIC TARGET 2045 FUND
| | | | | | | | | | | | | | | | |
| Security name | | | | | | | | Shares | | | Value | |
| | | | |
Exchange-Traded Funds: 33.86% | | | | | | | | | | | | | | | | |
Schwab International Equity ETF | | | | | | | | | | | 17,553 | | | $ | 485,341 | |
Schwab U.S. Aggregate Bond ETF | | | | | | | | | | | 924 | | | | 48,796 | |
Schwab U.S. Broad Market ETF | | | | | | | | | | | 22,934 | | | | 1,157,020 | |
| | | | |
Total Exchange-Traded Funds (Cost $1,712,754) | | | | | | | | | | | | | | | 1,691,157 | |
| | | | | | | | | | | | | | | | |
| | | | |
Investment Companies: 64.96% | | | | | | | | | | | | | | | | |
| | | | |
| Affiliated Master Portfolios: 15.42% | | | | | | | | | | | | | | | | |
Wells Fargo C&B Large Cap Value Portfolio | | | | | | | | | | | | | | | 206,212 | |
Wells Fargo Core Bond Portfolio | | | | | | | | | | | | | | | 58,631 | |
Wells Fargo Large Company Value Portfolio | | | | | | | | | | | | | | | 208,245 | |
Wells Fargo Real Return Portfolio | | | | | | | | | | | | | | | 24,508 | |
Wells Fargo Small Company Growth Portfolio | | | | | | | | | | | | | | | 136,547 | |
Wells Fargo Small Company Value Portfolio | | | | | | | | | | | | | | | 135,787 | |
| | | | |
| | | | | | | | | | | | | | | 769,930 | |
| | | | | | | | | | | | | | | | |
| | | | |
| Fixed-Income Funds: 2.25% | | | | | | | | | | | | | | | | |
Wells Fargo International Bond Fund Class R6 (l)† | | | | | | | | | | | 2,400 | | | | 24,429 | |
Wells Fargo Short-Term Bond Fund Institutional Class (l) | | | | | | | | | | | 5,029 | | | | 44,052 | |
Wells Fargo Strategic Income Fund Institutional Class (l) | | | | | | | | | | | 4,884 | | | | 44,050 | |
| | | | |
| | | | | | | | | | | | | | | 112,531 | |
| | | | | | | | | | | | | | | | |
| | | | |
| Equity Funds: 47.29% | | | | | | | | | | | | | | | | |
Calamos Market Neutral Income Fund Class I | | | | | | | | | | | 19,119 | | | | 244,725 | |
Wells Fargo Diversified International Fund Class R6 (l) | | | | | | | | | | | 51,090 | | | | 575,277 | |
Wells Fargo Emerging Markets Equity Income Fund Class R6 (l) | | | | | | | | | | | 27,405 | | | | 260,619 | |
Wells Fargo Endeavor Select Fund Institutional Class (l)† | | | | | | | | | | | 33,574 | | | | 311,902 | |
Wells Fargo Enterprise Fund Class R6 (l)† | | | | | | | | | | | 5,165 | | | | 225,760 | |
Wells Fargo Intrinsic Value Fund Class R6 (l) | | | | | | | | | | | 17,713 | | | | 206,005 | |
Wells Fargo Premier Large Company Growth Fund Class R6 (l)† | | | | | | | | | | | 21,347 | | | | 312,954 | |
Wells Fargo Special Mid Cap Value Fund Class R6 (l) | | | | | | | | | | | 6,958 | | | | 224,957 | |
| | | | |
| | | | | | | | | | | | | | | 2,362,199 | |
| | | | | | | | | | | | | | | | |
| | | | |
Total Investment Companies (Cost $3,379,908) | | | | | | | | | | | | | | | 3,244,660 | |
| | | | | | | | | | | | | | | | |
| | | | |
| | | Yield | | | Maturity date | | | Principal | | | | |
| Short-Term Investments: 0.24% | | | | | | | | | | | | | | | | |
| | | | |
| U.S. Treasury Securities: 0.24% | | | | | | | | | | | | | | | | |
U.S. Treasury Bill (z)# | | | 0.14 | % | | | 6-9-2016 | | | $ | 12,000 | | | | 12,000 | |
| | | | | | | | | | | | | | | | |
| | | | |
Total Short-Term Investments (Cost $12,000) | | | | | | | | | | | | | | | 12,000 | |
| | | | | | | | | | | | | | | | |
| | | | | | | | |
| Total investments in securities (Cost $5,104,662) * | | | 99.06 | % | | | 4,947,817 | |
Other assets and liabilities, net | | | 0.94 | | | | 47,060 | |
| | | | | | | | |
| Total net assets | | | 100.00 | % | | $ | 4,994,877 | |
| | | | | | | | |
The accompanying notes are an integral part of these financial statements.
| | | | | | |
| Portfolio of investments—May 31, 2016 | | Wells Fargo Dynamic Target Date Funds | | | 41 | |
DYNAMIC TARGET 2045 FUND
| (l) | The issuer of the security is an affiliated person of the Fund as defined in the Investment Company Act of 1940. |
| † | Non-income-earning security |
| (z) | Zero coupon security. The rate represents the current yield to maturity. |
| # | All or a portion of this security is segregated as collateral for investments in derivative instruments. |
| * | Cost for federal income tax purposes is $5,134,118 and unrealized gains (losses) consists of: |
| | | | |
Gross unrealized gains | | $ | 78,456 | |
Gross unrealized losses | | | (264,757 | ) |
| | | | |
Net unrealized losses | | $ | (186,301 | ) |
The accompanying notes are an integral part of these financial statements.
| | | | |
| 42 | | Wells Fargo Dynamic Target Date Funds | | Portfolio of investments—May 31, 2016 |
DYNAMIC TARGET 2050 FUND
| | | | | | | | | | | | | | | | |
| Security name | | | | | | | | Shares | | | Value | |
| | | | |
Exchange-Traded Funds: 33.85% | | | | | | | | | | | | | | | | |
Schwab International Equity ETF | | | | | | | | | | | 17,510 | | | $ | 484,152 | |
Schwab U.S. Aggregate Bond ETF | | | | | | | | | | | 911 | | | | 48,110 | |
Schwab U.S. Broad Market ETF | | | | | | | | | | | 22,879 | | | | 1,154,246 | |
| | | | |
Total Exchange-Traded Funds (Cost $1,708,103) | | | | | | | | | | | | | | | 1,686,508 | |
| | | | | | | | | | | | | | | | |
| | | | |
Investment Companies: 64.90% | | | | | | | | | | | | | | | | |
| | | | |
| Affiliated Master Portfolios: 15.39% | | | | | | | | | | | | | | | | |
Wells Fargo C&B Large Cap Value Portfolio | | | | | | | | | | | | | | | 205,801 | |
Wells Fargo Core Bond Portfolio | | | | | | | | | | | | | | | 57,723 | |
Wells Fargo Large Company Value Portfolio | | | | | | | | | | | | | | | 207,750 | |
Wells Fargo Real Return Portfolio | | | | | | | | | | | | | | | 24,045 | |
Wells Fargo Small Company Growth Portfolio | | | | | | | | | | | | | | | 136,006 | |
Wells Fargo Small Company Value Portfolio | | | | | | | | | | | | | | | 135,381 | |
| | | | |
| | | | | | | | | | | | | | | 766,706 | |
| | | | | | | | | | | | | | | | |
| | | | |
| Fixed-Income Funds: 2.22% | | | | | | | | | | | | | | | | |
Wells Fargo International Bond Fund Class R6 (l)† | | | | | | | | | | | 2,354 | | | | 23,968 | |
Wells Fargo Short-Term Bond Fund Institutional Class (l) | | | | | | | | | | | 4,947 | | | | 43,333 | |
Wells Fargo Strategic Income Fund Institutional Class (l) | | | | | | | | | | | 4,804 | | | | 43,333 | |
| | | | |
| | | | | | | | | | | | | | | 110,634 | |
| | | | | | | | | | | | | | | | |
| | | | |
| Equity Funds: 47.29% | | | | | | | | | | | | | | | | |
Calamos Market Neutral Income Fund Class I | | | | | | | | | | | 19,064 | | | | 244,023 | |
Wells Fargo Diversified International Fund Class R6 (l) | | | | | | | | | | | 50,959 | | | | 573,793 | |
Wells Fargo Emerging Markets Equity Income Fund Class R6 (l) | | | | | | | | | | | 27,289 | | | | 259,515 | |
Wells Fargo Endeavor Select Fund Institutional Class (l)† | | | | | | | | | | | 33,498 | | | | 311,200 | |
Wells Fargo Enterprise Fund Class R6 (l)† | | | | | | | | | | | 5,158 | | | | 225,436 | |
Wells Fargo Intrinsic Value Fund Class R6 (l) | | | | | | | | | | | 17,669 | | | | 205,496 | |
Wells Fargo Premier Large Company Growth Fund Class R6 (l)† | | | | | | | | | | | 21,287 | | | | 312,073 | |
Wells Fargo Special Mid Cap Value Fund Class R6 (l) | | | | | | | | | | | 6,945 | | | | 224,524 | |
| | | | |
| | | | | | | | | | | | | | | 2,356,060 | |
| | | | | | | | | | | | | | | | |
| | | | |
Total Investment Companies (Cost $3,368,585) | | | | | | | | | | | | | | | 3,233,400 | |
| | | | | | | | | | | | | | | | |
| | | | |
| | | Yield | | | Maturity date | | | Principal | | | | |
| Short-Term Investments: 0.24% | | | | | | | | | | | | | | | | |
| | | | |
| U.S. Treasury Securities: 0.24% | | | | | | | | | | | | | | | | |
U.S. Treasury Bill #(z) | | | 0.14 | % | | | 6-9-2016 | | | $ | 12,000 | | | | 12,000 | |
| | | | | | | | | | | | | | | | |
| | | | |
Total Short-Term Investments (Cost $12,000) | | | | | | | | | | | | | | | 12,000 | |
| | | | | | | | | | | | | | | | |
| | | | | | | | |
| Total investments in securities (Cost $5,088,688) * | | | 98.99 | % | | | 4,931,908 | |
Other assets and liabilities, net | | | 1.01 | | | | 50,194 | |
| | | | | | | | |
| Total net assets | | | 100.00 | % | | $ | 4,982,102 | |
| | | | | | | | |
The accompanying notes are an integral part of these financial statements.
| | | | | | |
| Portfolio of investments—May 31, 2016 | | Wells Fargo Dynamic Target Date Funds | | | 43 | |
DYNAMIC TARGET 2050 FUND
| (l) | The issuer of the security is an affiliated person of the Fund as defined in the Investment Company Act of 1940. |
| † | Non-income-earning security |
| # | All or a portion of this security is segregated as collateral for investments in derivative instruments. |
| (z) | Zero coupon security. The rate represents the current yield to maturity. |
| * | Cost for federal income tax purposes is $5,118,490 and unrealized gains (losses) consists of: |
| | | | |
Gross unrealized gains | | $ | 78,219 | |
Gross unrealized losses | | | (264,801 | ) |
| | | | |
Net unrealized losses | | $ | (186,582 | ) |
The accompanying notes are an integral part of these financial statements.
| | | | |
| 44 | | Wells Fargo Dynamic Target Date Funds | | Portfolio of investments—May 31, 2016 |
DYNAMIC TARGET 2055 FUND
| | | | | | | | | | | | | | | | |
| Security name | | | | | | | | Shares | | | Value | |
| | | | |
Exchange-Traded Funds: 33.85% | | | | | | | | | | | | | | | | |
Schwab International Equity ETF | | | | | | | | | | | 17,497 | | | $ | 483,792 | |
Schwab U.S. Aggregate Bond ETF | | | | | | | | | | | 910 | | | | 48,057 | |
Schwab U.S. Broad Market ETF | | | | | | | | | | | 22,862 | | | | 1,153,388 | |
| | | | |
Total Exchange-Traded Funds (Cost $1,706,943) | | | | | | | | | | | | | | | 1,685,237 | |
| | | | | | | | | | | | | | | | |
| | | | |
Investment Companies: 64.90% | | | | | | | | | | | | | | | | |
| | | | |
| Affiliated Master Portfolios: 15.39% | | | | | | | | | | | | | | | | |
Wells Fargo C&B Large Cap Value Portfolio | | | | | | | | | | | | | | | 205,664 | |
Wells Fargo Core Bond Portfolio | | | | | | | | | | | | | | | 57,675 | |
Wells Fargo Large Company Value Portfolio | | | | | | | | | | | | | | | 207,571 | |
Wells Fargo Real Return Portfolio | | | | | | | | | | | | | | | 24,024 | |
Wells Fargo Small Company Growth Portfolio | | | | | | | | | | | | | | | 135,893 | |
Wells Fargo Small Company Value Portfolio | | | | | | | | | | | | | | | 135,300 | |
| | | | |
| | | | | | | | | | | | | | | 766,127 | |
| | | | | | | | | | | | | | | | |
| | | | |
| Fixed-Income Funds: 2.22% | | | | | | | | | | | | | | | | |
Wells Fargo International Bond Fund Class R6 (l)† | | | | | | | | | | | 2,352 | | | | 23,947 | |
Wells Fargo Short-Term Bond Fund Institutional Class (l) | | | | | | | | | | | 4,942 | | | | 43,295 | |
Wells Fargo Strategic Income Fund Institutional Class (l) | | | | | | | | | | | 4,800 | | | | 43,297 | |
| | | | |
| | | | | | | | | | | | | | | 110,539 | |
| | | | | | | | | | | | | | | | |
| | | | |
| Equity Funds: 47.29% | | | | | | | | | | | | | | | | |
Calamos Market Neutral Income Fund Class I | | | | | | | | | | | 19,051 | | | | 243,856 | |
Wells Fargo Diversified International Fund Class R6 (l) | | | | | | | | | | | 50,920 | | | | 573,363 | |
Wells Fargo Emerging Markets Equity Income Fund Class R6 (l) | | | | | | | | | | | 27,258 | | | | 259,224 | |
Wells Fargo Endeavor Select Fund Institutional Class (l)† | | | | | | | | | | | 33,480 | | | | 311,031 | |
Wells Fargo Enterprise Fund Class R6 (l)† | | | | | | | | | | | 5,158 | | | | 225,452 | |
Wells Fargo Intrinsic Value Fund Class R6 (l) | | | | | | | | | | | 17,654 | | | | 205,318 | |
Wells Fargo Premier Large Company Growth Fund Class R6 (l)† | | | | | | | | | | | 21,272 | | | | 311,852 | |
Wells Fargo Special Mid Cap Value Fund Class R6 (l) | | | | | | | | | | | 6,941 | | | | 224,397 | |
| | | | |
| | | | | | | | | | | | | | | 2,354,493 | |
| | | | | | | | | | | | | | | | |
| | | | |
Total Investment Companies (Cost $3,367,032) | | | | | | | | | | | | | | | 3,231,159 | |
| | | | | | | | | | | | | | | | |
| | | | |
| | | Yield | | | Maturity date | | | Principal | | | | |
| Short-Term Investments: 0.24% | | | | | | | | | | | | | | | | |
| | | | |
| U.S. Treasury Securities: 0.24% | | | | | | | | | | | | | | | | |
U.S. Treasury Bill #(z) | | | 0.14 | % | | | 6-9-2016 | | | $ | 12,000 | | | | 12,000 | |
| | | | | | | | | | | | | | | | |
| | | | |
Total Short-Term Investments (Cost $12,000) | | | | | | | | | | | | | | | 12,000 | |
| | | | | | | | | | | | | | | | |
| | | | | | | | |
| Total investments in securities (Cost $5,085,975) * | | | 98.99 | % | | | 4,928,396 | |
Other assets and liabilities, net | | | 1.01 | | | | 50,280 | |
| | | | | | | | |
| Total net assets | | | 100.00 | % | | $ | 4,978,676 | |
| | | | | | | | |
| (l) | The issuer of the security is an affiliated person of the Fund as defined in the Investment Company Act of 1940. |
| † | Non-income-earning security |
| # | All or a portion of this security is segregated as collateral for investments in derivative instruments. |
| (z) | Zero coupon security. The rate represents the current yield to maturity. |
| * | Cost for federal income tax purposes is $5,115,251 and unrealized gains (losses) consists of: |
| | | | |
Gross unrealized gains | | $ | 78,155 | |
Gross unrealized losses | | | (265,010 | ) |
| | | | |
Net unrealized losses | | $ | (186,855 | ) |
The accompanying notes are an integral part of these financial statements.
| | | | | | |
| Portfolio of investments—May 31, 2016 | | Wells Fargo Dynamic Target Date Funds | | | 45 | |
DYNAMIC TARGET 2060 FUND
| | | | | | | | | | | | | | | | |
| Security name | | | | | | | | Shares | | | Value | |
| | | | |
Exchange-Traded Funds: 33.85% | | | | | | | | | | | | | | | | |
Schwab International Equity ETF | | | | | | | | | | | 17,514 | | | $ | 484,262 | |
Schwab U.S. Aggregate Bond ETF | | | | | | | | | | | 912 | | | | 48,163 | |
Schwab U.S. Broad Market ETF | | | | | | | | | | | 22,884 | | | | 1,154,498 | |
| | | | |
Total Exchange-Traded Funds (Cost $1,708,436) | | | | | | | | | | | | | | | 1,686,923 | |
| | | | | | | | | | | | | | | | |
| | | | |
Investment Companies: 64.90% | | | | | | | | | | | | | | | | |
| | | | |
| Affiliated Master Portfolios: 15.39% | | | | | | | | | | | | | | | | |
Wells Fargo C&B Large Cap Value Portfolio | | | | | | | | | | | | | | | 205,825 | |
Wells Fargo Core Bond Portfolio | | | | | | | | | | | | | | | 57,794 | |
Wells Fargo Large Company Value Portfolio | | | | | | | | | | | | | | | 207,761 | |
Wells Fargo Real Return Portfolio | | | | | | | | | | | | | | | 24,073 | |
Wells Fargo Small Company Growth Portfolio | | | | | | | | | | | | | | | 136,041 | |
Wells Fargo Small Company Value Portfolio | | | | | | | | | | | | | | | 135,400 | |
| | | | |
| | | | | | | | | | | | | | | 766,894 | |
| | | | | | | | | | | | | | | | |
| | | | |
| Fixed-Income Funds: 2.22% | | | | | | | | | | | | | | | | |
Wells Fargo International Bond Fund Class R6 (l)† | | | | | | | | | | | 2,358 | | | | 24,007 | |
Wells Fargo Short-Term Bond Fund Institutional Class (l) | | | | | | | | | | | 4,955 | | | | 43,405 | |
Wells Fargo Strategic Income Fund Institutional Class (l) | | | | | | | | | | | 4,810 | | | | 43,386 | |
| | | | |
| | | | | | | | | | | | | | | 110,798 | |
| | | | | | | | | | | | | | | | |
| | | | |
| Equity Funds: 47.29% | | | | | | | | | | | | | | | | |
Calamos Market Neutral Income Fund Class I | | | | | | | | | | | 19,070 | | | | 244,090 | |
Wells Fargo Diversified International Fund Class R6 (l) | | | | | | | | | | | 50,970 | | | | 573,927 | |
Wells Fargo Emerging Markets Equity Income Fund Class R6 (l) | | | | | | | | | | | 27,299 | | | | 259,611 | |
Wells Fargo Endeavor Select Fund Institutional Class (l)† | | | | | | | | | | | 33,509 | | | | 311,295 | |
Wells Fargo Enterprise Fund Class R6 (l)† | | | | | | | | | | | 5,158 | | | | 225,440 | |
Wells Fargo Intrinsic Value Fund Class R6 (l) | | | | | | | | | | | 17,674 | | | | 205,552 | |
Wells Fargo Premier Large Company Growth Fund Class R6 (l)† | | | | | | | | | | | 21,293 | | | | 312,157 | |
Wells Fargo Special Mid Cap Value Fund Class R6 (l) | | | | | | | | | | | 6,946 | | | | 224,549 | |
| | | | |
| | | | | | | | | | | | | | | 2,356,621 | |
| | | | | | | | | | | | | | | | |
| | | | |
Total Investment Companies (Cost $3,370,370) | | | | | | | | | | | | | | | 3,234,313 | |
| | | | | | | | | | | | | | | | |
| | | | |
| | | Yield | | | Maturity date | | | Principal | | | | |
| Short-Term Investments: 0.24% | | | | | | | | | | | | | | | | |
| | | | |
| U.S. Treasury Securities: 0.24% | | | | | | | | | | | | | | | | |
U.S. Treasury Bill #(z) | | | 0.14 | % | | | 6-9-2016 | | | $ | 12,000 | | | | 12,000 | |
| | | | | | | | | | | | | | | | |
| | | | |
Total Short-Term Investments (Cost $12,000) | | | | | | | | | | | | | | | 12,000 | |
| | | | | | | | | | | | | | | | |
| | | | | | | | |
| Total investments in securities (Cost $5,090,806) * | | | 98.99 | % | | | 4,933,236 | |
Other assets and liabilities, net | | | 1.01 | | | | 50,219 | |
| | | | | | | | |
| Total net assets | | | 100.00 | % | | $ | 4,983,455 | |
| | | | | | | | |
The accompanying notes are an integral part of these financial statements.
| | | | |
| 46 | | Wells Fargo Dynamic Target Date Funds | | Portfolio of investments—May 31, 2016 |
DYNAMIC TARGET 2060 FUND
| (l) | The issuer of the security is an affiliated person of the Fund as defined in the Investment Company Act of 1940. |
| † | Non-income-earning security |
| # | All or a portion of this security is segregated as collateral for investments in derivative instruments. |
| (z) | Zero coupon security. The rate represents the current yield to maturity. |
| * | Cost for federal income tax purposes is $5,119,539 and unrealized gains (losses) consists of: |
| | | | |
Gross unrealized gains | | $ | 78,275 | |
Gross unrealized losses | | | (264,578 | ) |
| | | | |
Net unrealized losses | | $ | (186,303 | ) |
The accompanying notes are an integral part of these financial statements.
This page is intentionally left blank.
| | | | |
| 48 | | Wells Fargo Dynamic Target Date Funds | | Statements of assets and liabilities—May 31, 2016 |
| | | | | | | | |
| | | Dynamic Target
Today Fund | | | Dynamic Target
2015 Fund | |
| | |
Assets | | | | | | | | |
Investments | | | | | | | | |
In affiliated Underlying Funds, at value (see cost below) | | $ | 2,103,752 | | | $ | 2,169,499 | |
In unaffiliated Underlying Funds and securities, at value (see cost below) | | | 1,704,713 | | | | 1,822,772 | |
In affiliated Master Portfolios, at value (see cost below) | | | 1,202,910 | | | | 1,090,974 | |
| | | | |
Total investments, at value (see cost below) | | | 5,011,375 | | | | 5,083,245 | |
Cash | | | 48 | | | | 19 | |
Receivable for investments sold | | | 196 | | | | 257 | |
Receivable for Fund shares sold | | | 0 | | | | 0 | |
Receivable for dividends | | | 658 | | | | 488 | |
Receivable for daily variation margin on open futures contracts | | | 31 | | | | 31 | |
Receivable from manager | | | 18,013 | | | | 17,551 | |
Prepaid expenses and other assets | | | 50,981 | | | | 50,987 | |
| | | | |
Total assets | | | 5,081,302 | | | | 5,152,578 | |
| | | | |
| | |
Liabilities | | | | | | | | |
Payable for investments purchased | | | 876 | | | | 756 | |
Payable for Fund shares redeemed | | | 0 | | | | 1,250 | |
Distribution fees payable | | | 85 | | | | 84 | |
Administration fees payable | | | 178 | | | | 193 | |
Shareholder report expenses payable | | | 10,167 | | | | 10,167 | |
Custodian and accounting fees payable | | | 10,436 | | | | 10,006 | |
Professional fees payable | | | 1,712 | | | | 1,712 | |
| | | | |
Total liabilities | | | 23,454 | | | | 24,168 | |
| | | | |
Total net assets | | $ | 5,057,848 | | | $ | 5,128,410 | |
| | | | |
| | |
NET ASSETS CONSIST OF | | | | | | | | |
Paid-in capital | | $ | 5,018,954 | | | $ | 5,114,710 | |
Undistributed net investment income | | | 29,433 | | | | 26,353 | |
Accumulated net realized gains on investments | | | 29,689 | | | | 40,942 | |
Net unrealized losses on investments | | | (20,228 | ) | | | (53,595 | ) |
| | | | |
Total net assets | | $ | 5,057,848 | | | $ | 5,128,410 | |
| | | | |
| | |
COMPUTATION OF NET ASSET VALUE AND OFFERING PRICE PER SHARE | | | | | | | | |
Net assets – Class A | | $ | 100,950 | | | $ | 198,702 | |
Shares outstanding – Class A1 | | | 10,035 | | | | 19,881 | |
Net asset value per share – Class A | | | $10.06 | | | | $9.99 | |
Maximum offering price per share – Class A2 | | | $10.67 | | | | $10.60 | |
Net assets – Class C | | $ | 100,572 | | | $ | 100,020 | |
Shares outstanding – Class C1 | | | 10,028 | | | | 10,037 | |
Net asset value per share – Class C | | | $10.03 | | | | $9.97 | |
Net assets – Class R | | $ | 100,824 | | | $ | 100,272 | |
Shares outstanding – Class R1 | | | 10,033 | | | | 10,042 | |
Net asset value per share – Class R | | | $10.05 | | | | $9.99 | |
Net assets – Class R4 | | $ | 101,107 | | | $ | 100,551 | |
Share outstanding – Class R41 | | | 10,037 | | | | 10,047 | |
Net asset value per share – Class R4 | | | $10.07 | | | | $10.01 | |
Net assets – Class R6 | | $ | 4,654,395 | | | $ | 4,628,865 | |
Shares outstanding – Class R61 | | | 461,784 | | | | 462,212 | |
Net asset value per share – Class R6 | | | $10.08 | | | | $10.01 | |
| | |
Investments in affiliated Underlying Funds, at cost | | $ | 2,177,117 | | | $ | 2,280,043 | |
| | | | |
Investments in unaffiliated Underlying Funds and securities, at cost | | $ | 1,695,088 | | | $ | 1,818,467 | |
| | | | |
Investments in affiliated Master Portfolios, at cost | | $ | 1,158,767 | | | $ | 1,037,699 | |
| | | | |
Total investments, at cost | | $ | 5,030,972 | | | $ | 5,136,209 | |
| | | | |
| 1 | Each Fund has an unlimited number of authorized shares. |
| 2 | Maximum offering price is computed as 100/94.25 of net asset value. On investments of $50,000 or more, the offering price is reduced. |
The accompanying notes are an integral part of these financial statements.
| | | | | | |
| Statements of assets and liabilities—May 31, 2016 | | Wells Fargo Dynamic Target Date Funds | | | 49 | |
| | | | | | | | | | | | | | | | | | | | | | | | | | |
Dynamic Target
2020 Fund | | | Dynamic Target
2025 Fund | | | Dynamic Target
2030 Fund | | | Dynamic Target
2035 Fund | | | Dynamic Target
2040 Fund | | | Dynamic Target
2045 Fund | | | Dynamic Target
2050 Fund | |
| | | | | | |
| | | | | | | | | | | | | | | | | | | | | | | | | | |
| | | | | | | | | | | | | | | | | | | | | | | | | | |
| $ | 2,166,931 | | | $ | 2,217,169 | | | $ | 2,232,535 | | | $ | 2,227,403 | | | $ | 2,249,044 | | | $ | 2,230,005 | | | $ | 2,222,671 | |
| | 1,836,307 | | | | 1,888,624 | | | | 1,917,868 | | | | 1,903,046 | | | | 1,943,179 | | | | 1,947,882 | | | | 1,942,531 | |
| | 999,894 | | | | 941,930 | | | | 869,784 | | | | 817,799 | | | | 785,815 | | | | 769,930 | | | | 766,706 | |
| | |
| | 5,003,132 | | | | 5,047,723 | | | | 5,020,187 | | | | 4,948,248 | | | | 4,978,038 | | | | 4,947,817 | | | | 4,931,908 | |
| | 157 | | | | 253 | | | | 215 | | | | 217 | | | | 26,488 | | | | 148 | | | | 143 | |
| | 78 | | | | 28 | | | | 28 | | | | 0 | | | | 28 | | | | 55 | | | | 55 | |
| | 0 | | | | 0 | | | | 0 | | | | 50 | | | | 0 | | | | 0 | | | | 0 | |
| | 375 | | | | 282 | | | | 184 | | | | 121 | | | | 73 | | | | 59 | | | | 58 | |
| | 31 | | | | 31 | | | | 31 | | | | 31 | | | | 31 | | | | 31 | | | | 31 | |
| | 17,025 | | | | 19,225 | | | | 19,258 | | | | 19,267 | | | | 17,416 | | | | 17,803 | | | | 18,448 | |
| | 51,127 | | | | 50,216 | | | | 50,218 | | | | 50,231 | | | | 49,766 | | | | 50,627 | | | | 50,435 | |
| | |
| | 5,071,925 | | | | 5,117,758 | | | | 5,090,121 | | | | 5,018,165 | | | | 5,071,840 | | | | 5,016,540 | | | | 5,001,078 | |
| | |
| | | | | | |
| | | | | | | | | | | | | | | | | | | | | | | | | | |
| | 630 | | | | 566 | | | | 439 | | | | 356 | | | | 26,609 | | | | 242 | | | | 282 | |
| | 0 | | | | 0 | | | | 0 | | | | 0 | | | | 0 | | | | 0 | | | | 0 | |
| | 84 | | | | 83 | | | | 83 | | | | 83 | | | | 82 | | | | 82 | | | | 82 | |
| | 179 | | | | 190 | | | | 187 | | | | 177 | | | | 178 | | | | 177 | | | | 174 | |
| | 10,168 | | | | 10,231 | | | | 10,105 | | | | 10,106 | | | | 10,205 | | | | 10,169 | | | | 8,138 | |
| | 9,693 | | | | 9,337 | | | | 9,282 | | | | 9,413 | | | | 9,410 | | | | 9,281 | | | | 9,448 | |
| | 674 | | | | 904 | | | | 904 | | | | 903 | | | | 422 | | | | 1,712 | | | | 852 | |
| | |
| | 21,428 | | | | 21,311 | | | | 21,000 | | | | 21,038 | | | | 46,906 | | | | 21,663 | | | | 18,976 | |
| | |
| $ | 5,050,497 | | | $ | 5,096,447 | | | $ | 5,069,121 | | | $ | 4,997,127 | | | $ | 5,024,934 | | | $ | 4,994,877 | | | $ | 4,982,102 | |
| | |
| | | | | | |
| | | | | | | | | | | | | | | | | | | | | | | | | | |
| $ | 5,044,282 | | | $ | 5,108,469 | | | $ | 5,101,326 | | | $ | 5,050,847 | | | $ | 5,089,633 | | | $ | 5,054,259 | | | $ | 5,041,580 | |
| | 24,266 | | | | 22,478 | | | | 20,699 | | | | 19,497 | | | | 18,542 | | | | 18,377 | | | | 18,348 | |
| | 73,110 | | | | 69,928 | | | | 80,579 | | | | 73,891 | | | | 69,262 | | | | 79,717 | | | | 79,585 | |
| | (91,161 | ) | | | (104,428 | ) | | | (133,483 | ) | | | (147,108 | ) | | | (152,503 | ) | | | (157,476 | ) | | | (157,411 | ) |
| | |
| $ | 5,050,497 | | | $ | 5,096,447 | | | $ | 5,069,121 | | | $ | 4,997,127 | | | $ | 5,024,934 | | | $ | 4,994,877 | | | $ | 4,982,102 | |
| | |
| | | | | | |
| | | | | | | | | | | | | | | | | | | | | | | | | | |
| $ | 118,907 | | | $ | 187,873 | | | $ | 173,435 | | | $ | 119,179 | | | $ | 157,051 | | | $ | 121,180 | | | $ | 108,422 | |
| | 11,897 | | | | 18,894 | | | | 17,495 | | | | 12,066 | | | | 15,947 | | | | 12,285 | | | | 10,993 | |
| | $9.99 | | | | $9.94 | | | | $9.91 | | | | $9.88 | | | | $9.85 | | | | $9.86 | | | | $9.86 | |
| | $10.60 | | | | $10.55 | | | | $10.51 | | | | $10.48 | | | | $10.45 | | | | $10.46 | | | | $10.46 | |
| $ | 100,058 | | | $ | 99,591 | | | $ | 99,329 | | | $ | 98,969 | | | $ | 98,765 | | | $ | 98,883 | | | $ | 98,883 | |
| | 10,041 | | | | 10,046 | | | | 10,050 | | | | 10,053 | | | | 10,056 | | | | 10,056 | | | | 10,056 | |
| | $9.96 | | | | $9.91 | | | | $9.88 | | | | $9.84 | | | | $9.82 | | | | $9.83 | | | | $9.83 | |
| $ | 100,310 | | | $ | 99,844 | | | $ | 99,584 | | | $ | 99,223 | | | $ | 99,018 | | | $ | 99,136 | | | $ | 99,135 | |
| | 10,046 | | | | 10,051 | | | | 10,055 | | | | 10,058 | | | | 10,061 | | | | 10,061 | | | | 10,061 | |
| | $9.99 | | | | $9.93 | | | | $9.90 | | | | $9.87 | | | | $9.84 | | | | $9.85 | | | | $9.85 | |
| $ | 100,590 | | | $ | 100,120 | | | $ | 99,856 | | | $ | 99,495 | | | $ | 99,289 | | | $ | 99,408 | | | $ | 99,408 | |
| | 10,051 | | | | 10,056 | | | | 10,060 | | | | 10,063 | | | | 10,065 | | | | 10,066 | | | | 10,066 | |
| | $10.01 | | | | $9.96 | | | | $9.93 | | | | $9.89 | | | | $9.86 | | | | $9.88 | | | | $9.88 | |
| $ | 4,630,632 | | | $ | 4,609,019 | | | $ | 4,596,917 | | | $ | 4,580,261 | | | $ | 4,570,811 | | | $ | 4,576,270 | | | $ | 4,576,254 | |
| | 462,410 | | | | 462,646 | | | | 462,826 | | | | 462,960 | | | | 463,073 | | | | 463,098 | | | | 463,100 | |
| | $10.01 | | | | $9.96 | | | | $9.93 | | | | $9.89 | | | | $9.87 | | | | $9.88 | | | | $9.88 | |
| | | | | | |
| $ | 2,308,733 | | | $ | 2,374,910 | | | $ | 2,415,514 | | | $ | 2,421,899 | | | $ | 2,449,929 | | | $ | 2,435,333 | | | $ | 2,427,755 | |
| | |
| $ | 1,842,449 | | | $ | 1,897,707 | | | $ | 1,934,766 | | | $ | 1,924,729 | | | $ | 1,965,704 | | | $ | 1,971,494 | | | $ | 1,966,123 | |
| | |
| $ | 942,480 | | | $ | 878,903 | | | $ | 802,759 | | | $ | 748,097 | | | $ | 714,277 | | | $ | 697,835 | | | $ | 694,810 | |
| | |
| $ | 5,093,662 | | | $ | 5,151,520 | | | $ | 5,153,039 | | | $ | 5,094,725 | | | $ | 5,129,910 | | | $ | 5,104,662 | | | $ | 5,088,688 | |
| | |
The accompanying notes are an integral part of these financial statements.
| | | | |
| 50 | | Wells Fargo Dynamic Target Date Funds | | Statements of assets and liabilities—May 31, 2016 |
| | | | | | | | |
| | | Dynamic Target
2055 Fund | | | Dynamic Target
2060 Fund | |
| | |
Assets | | | | | | | | |
Investments | | | | | | | | |
In affiliated Underlying Funds, at value (see cost below) | | $ | 2,221,176 | | | $ | 2,223,329 | |
In unaffiliated Underlying Funds and securities, at value (see cost below) | | | 1,941,093 | | | | 1,943,013 | |
In affiliated Master Portfolios, at value (see cost below) | | | 766,127 | | | | 766,894 | |
| | | | |
Total investments, at value (see cost below) | | | 4,928,396 | | | | 4,933,236 | |
Cash | | | 149 | | | | 110 | |
Receivable for investments sold | | | 55 | | | | 106 | |
Receivable for dividends | | | 58 | | | | 58 | |
Receivable for daily variation margin on open futures contracts | | | 31 | | | | 31 | |
Receivable from manager | | | 17,851 | | | | 18,391 | |
Prepaid expenses and other assets | | | 51,056 | | | | 50,393 | |
| | | | |
Total assets | | | 4,997,596 | | | | 5,002,325 | |
| | | | |
| | |
Liabilities | | | | | | | | |
Payable for investments purchased | | | 279 | | | | 257 | |
Distribution fees payable | | | 82 | | | | 83 | |
Administration fees payable | | | 173 | | | | 174 | |
Shareholder report expenses payable | | | 8,138 | | | | 8,158 | |
Custodian and accounting fees payable | | | 9,396 | | | | 9,346 | |
Professional fees payable | | | 852 | | | | 852 | |
| | | | |
Total liabilities | | | 18,920 | | | | 18,870 | |
| | | | |
Total net assets | | $ | 4,978,676 | | | $ | 4,983,455 | |
| | | | |
| | |
NET ASSETS CONSIST OF | | | | | | | | |
Paid-in capital | | $ | 5,035,727 | | | $ | 5,034,536 | |
Undistributed net investment income | | | 18,338 | | | | 18,379 | |
Accumulated net realized gains on investments | | | 82,821 | | | | 88,741 | |
Net unrealized losses on investments | | | (158,210 | ) | | | (158,201 | ) |
| | | | |
Total net assets | | $ | 4,978,676 | | | $ | 4,983,455 | |
| | | | |
| | |
COMPUTATION OF NET ASSET VALUE AND OFFERING PRICE PER SHARE | | | | | | | | |
Net assets – Class A | | $ | 102,557 | | | $ | 101,245 | |
Shares outstanding – Class A1 | | | 10,393 | | | | 10,247 | |
Net asset value per share – Class A | | | $9.87 | | | | $9.88 | |
Maximum offering price per share – Class A2 | | | $10.47 | | | | $10.48 | |
Net assets – Class C | | $ | 98,932 | | | $ | 99,056 | |
Shares outstanding – Class C1 | | | 10,056 | | | | 10,056 | |
Net asset value per share – Class C | | | $9.84 | | | | $9.85 | |
Net assets – Class R | | $ | 99,184 | | | $ | 99,308 | |
Shares outstanding – Class R1 | | | 10,061 | | | | 10,061 | |
Net asset value per share – Class R | | | $9.86 | | | | $9.87 | |
Net assets – Class R4 | | $ | 99,458 | | | $ | 99,582 | |
Share outstanding – Class R41 | | | 10,066 | | | | 10,066 | |
Net asset value per share – Class R4 | | | $9.88 | | | | $9.89 | |
Net assets – Class R6 | | $ | 4,578,545 | | | $ | 4,584,264 | |
Shares outstanding – Class R61 | | | 463,100 | | | | 463,099 | |
Net asset value per share – Class R6 | | | $9.89 | | | | $9.90 | |
| | |
Investments in affiliated Underlying Funds, at cost | | $ | 2,426,880 | | | $ | 2,429,277 | |
| | | | |
Investments in unaffiliated Underlying Funds and securities, at cost | | $ | 1,964,796 | | | $ | 1,966,574 | |
| | | | |
Investments in affiliated Master Portfolios, at cost | | $ | 694,299 | | | $ | 694,955 | |
| | | | |
Total investments, at cost | | $ | 5,085,975 | | | $ | 5,090,806 | |
| | | | |
| 1 | Each Fund has an unlimited number of authorized shares. |
| 2 | Maximum offering price is computed as 100/94.25 of net asset value. On investments of $50,000 or more, the offering price is reduced. |
The accompanying notes are an integral part of these financial statements.
This page is intentionally left blank.
| | | | |
| 52 | | Wells Fargo Dynamic Target Date Funds | | Statements of operations—year ended May 31, 20161 |
| | | | | | | | |
| | | Dynamic Target
Today Fund | | | Dynamic Target
2015 Fund | |
| | |
Investment income | | | | | | | | |
Dividends from unaffiliated Underlying Funds | | $ | 18,908 | | | $ | 20,803 | |
Dividends from affiliated Underlying Funds | | | 17,275 | | | | 16,399 | |
Interest allocated from affiliated Master Portfolios | | | 8,429 | | | | 6,161 | |
Dividends allocated from affiliated Master Portfolios* | | | 2,951 | | | | 3,879 | |
Interest | | | 19 | | | | 20 | |
Securities lending income allocated from affiliated Master Portfolios | | | 181 | | | | 240 | |
Affiliated income allocated from affiliated Master Portfolios | | | 95 | | | | 82 | |
Expenses allocated from affiliated Master Portfolios | | | (2,880 | ) | | | (2,826 | ) |
Waivers allocated from affiliated Master Portfolios | | | 203 | | | | 157 | |
| | | | |
Total investment income | | | 45,181 | | | | 44,915 | |
| | | | |
| | |
Expenses | | | | | | | | |
Management fee | | | 4,916 | | | | 4,927 | |
Administration fees | | | | | | | | |
Class A | | | 103 | | | | 161 | |
Class C | | | 103 | | | | 102 | |
Class R | | | 103 | | | | 102 | |
Class R4 | | | 40 | | | | 39 | |
Class R6 | | | 678 | | | | 672 | |
Shareholder servicing fees | | | | | | | | |
Class A | | | 123 | | | | 192 | |
Class C | | | 123 | | | | 121 | |
Class R | | | 123 | | | | 122 | |
Class R4 | | | 49 | | | | 49 | |
Distribution fees | | | | | | | | |
Class C | | | 368 | | | | 364 | |
Class R | | | 123 | | | | 122 | |
Custody and accounting fees | | | 12,992 | | | | 12,991 | |
Professional fees | | | 24,943 | | | | 24,943 | |
Registration fees | | | 39,121 | | | | 38,821 | |
Shareholder report expenses | | | 23,977 | | | | 23,978 | |
Trustees’ fees and expenses | | | 8,251 | | | | 8,251 | |
Other fees and expenses | | | 2,732 | | | | 3,005 | |
| | | | |
Total expenses | | | 118,868 | | | | 118,962 | |
Less: Fee waivers and/or expense reimbursements | | | (116,004 | ) | | | (116,091 | ) |
| | | | |
Net expenses | | | 2,864 | | | | 2,871 | |
| | | | |
Net investment income | | | 42,317 | | | | 42,044 | |
| | | | |
| | |
REALIZED AND UNREALIZED GAINS (LOSSES) ON INVESTMENTS | | | | | | | | |
| | |
Net realized gains (losses) on: | | | | | | | | |
Unaffiliated Underlying Funds | | | (246 | ) | | | (8,424 | ) |
Affiliated Underlying Funds | | | (4,088 | ) | | | (1,473 | ) |
Futures transactions | | | (6,695 | ) | | | (949 | ) |
Capital gain distributions from unaffiliated Underlying Funds | | | 3,701 | | | | 3,693 | |
Capital gain distributions from affiliated Underlying Funds | | | 68,288 | | | | 96,727 | |
Securities transactions allocated from affiliated Master Portfolios | | | (25,201 | ) | | | (40,860 | ) |
| | | | |
Net realized gains on investments | | | 35,759 | | | | 48,714 | |
| | | | |
| | |
Net change in unrealized gains (losses) on: | | | | | | | | |
Unaffiliated Underlying Funds | | | 9,625 | | | | 4,305 | |
Affiliated Underlying Funds | | | (73,365 | ) | | | (110,544 | ) |
Futures transactions | | | (631 | ) | | | (631 | ) |
Securities transactions allocated from affiliated Master Portfolios | | | 44,143 | | | | 53,275 | |
| | | | |
Net change in unrealized gains (losses) on investments | | | (20,228 | ) | | | (53,595 | ) |
| | | | |
Net realized and unrealized gains (losses) on investments | | | 15,531 | | | | (4,881 | ) |
| | | | |
Net increase (decrease) in net assets resulting from operations | | $ | 57,848 | | | $ | 37,163 | |
| | | | |
| | |
* Net of foreign dividend withholding taxes allocated from affiliated Master Portfolios in the amount of | | | $39 | | | | $33 | |
| 1 | For the period from November 30, 2015 (commencement of operations) to May 31, 2016 |
The accompanying notes are an integral part of these financial statements.
| | | | | | |
| Statements of operations—year ended May 31, 20161 | | Wells Fargo Dynamic Target Date Funds | | | 53 | |
| | | | | | | | | | | | | | | | | | | | | | | | | | |
Dynamic Target
2020 Fund | | | Dynamic Target
2025 Fund | | | Dynamic Target
2030 Fund | | | Dynamic Target
2035 Fund | | | Dynamic Target
2040 Fund | | | Dynamic Target
2045 Fund | | | Dynamic Target
2050 Fund | |
| | | | | | |
| | | | | | | | | | | | | | | | | | | | | | | | | | |
| $ | 21,288 | | | $ | 22,223 | | | $ | 22,755 | | | $ | 22,979 | | | $ | 23,558 | | | $ | 23,639 | | | $ | 23,579 | |
| | 15,810 | | | | 15,406 | | | | 14,943 | | | | 14,696 | | | | 14,388 | | | | 14,345 | | | | 14,287 | |
| | 4,733 | | | | 3,529 | | | | 2,291 | | | | 1,514 | | | | 913 | | | | 749 | | | | 741 | |
| | 4,375 | | | | 4,903 | | | | 5,365 | | | | 5,660 | | | | 5,865 | | | | 5,923 | | | | 5,908 | |
| | 31 | | | | 32 | | | | 36 | | | | 43 | | | | 41 | | | | 40 | | | | 39 | |
| | 271 | | | | 304 | | | | 334 | | | | 351 | | | | 365 | | | | 369 | | | | 368 | |
| | 73 | | | | 67 | | | | 60 | | | | 55 | | | | 51 | | | | 50 | | | | 50 | |
| | (2,761 | ) | | | (2,750 | ) | | | (2,707 | ) | | | (2,678 | ) | | | (2,651 | ) | | | (2,644 | ) | | | (2,636 | ) |
| | 127 | | | | 103 | | | | 78 | | | | 63 | | | | 50 | | | | 47 | | | | 47 | |
| | |
| | 43,947 | | | | 43,817 | | | | 43,155 | | | | 42,683 | | | | 42,580 | | | | 42,518 | | | | 42,383 | |
| | |
| | | | | | |
| | | | | | | | | | | | | | | | | | | | | | | | | | |
| | 4,864 | | | | 4,880 | | | | 4,843 | | | | 4,808 | | | | 4,800 | | | | 4,796 | | | | 4,783 | |
| | | | | | | | | | | | | | | | | | | | | | | | | | |
| | 110 | | | | 154 | | | | 135 | | | | 119 | | | | 121 | | | | 117 | | | | 104 | |
| | 102 | | | | 101 | | | | 101 | | | | 100 | | | | 100 | | | | 100 | | | | 100 | |
| | 102 | | | | 101 | | | | 101 | | | | 100 | | | | 100 | | | | 100 | | | | 100 | |
| | 39 | | | | 39 | | | | 38 | | | | 38 | | | | 38 | | | | 38 | | | | 38 | |
| | 670 | | | | 667 | | | | 664 | | | | 661 | | | | 660 | | | | 660 | | | | 660 | |
| | | | | | | | | | | | | | | | | | | | | | | | | | |
| | 131 | | | | 183 | | | | 160 | | | | 141 | | | | 144 | | | | 140 | | | | 124 | |
| | 121 | | | | 120 | | | | 120 | | | | 119 | | | | 119 | | | | 119 | | | | 119 | |
| | 121 | | | | 121 | | | | 120 | | | | 120 | | | | 119 | | | | 119 | | | | 119 | |
| | 49 | | | | 48 | | | | 48 | | | | 48 | | | | 48 | | | | 48 | | | | 48 | |
| | | | | | | | | | | | | | | | | | | | | | | | | | |
| | 363 | | | | 361 | | | | 360 | | | | 358 | | | | 357 | | | | 357 | | | | 357 | |
| | 121 | | | | 121 | | | | 120 | | | | 120 | | | | 119 | | | | 119 | | | | 119 | |
| | 12,990 | | | | 12,991 | | | | 12,990 | | | | 12,990 | | | | 12,990 | | | | 12,990 | | | | 13,139 | |
| | 23,904 | | | | 25,634 | | | | 25,634 | | | | 25,634 | | | | 24,853 | | | | 24,943 | | | | 22,082 | |
| | 38,621 | | | | 39,175 | | | | 39,175 | | | | 39,175 | | | | 40,240 | | | | 39,121 | | | | 39,175 | |
| | 23,978 | | | | 24,041 | | | | 23,915 | | | | 23,915 | | | | 24,014 | | | | 23,977 | | | | 23,966 | |
| | 8,251 | | | | 6,976 | | | | 6,976 | | | | 6,976 | | | | 6,841 | | | | 8,251 | | | | 8,743 | |
| | 3,082 | | | | 3,201 | | | | 3,201 | | | | 3,201 | | | | 3,032 | | | | 3,082 | | | | 2,732 | |
| | |
| | 117,619 | | | | 118,914 | | | | 118,701 | | | | 118,623 | | | | 118,695 | | | | 119,077 | | | | 116,508 | |
| | (114,681 | ) | | | (115,772 | ) | | | (115,402 | ) | | | (115,369 | ) | | | (115,337 | ) | | | (115,772 | ) | | | (113,238 | ) |
| | |
| | 2,938 | | | | 3,142 | | | | 3,299 | | | | 3,254 | | | | 3,358 | | | | 3,305 | | | | 3,270 | |
| | |
| | 41,009 | | | | 40,675 | | | | 39,856 | | | | 39,429 | | | | 39,222 | | | | 39,213 | | | | 39,113 | |
| | |
| | | | | | |
| | | | | | | | | | | | | | | | | | | | | | | | | | |
| | | | | | |
| | | | | | | | | | | | | | | | | | | | | | | | | | |
| | (2,115 | ) | | | (2,583 | ) | | | (4,823 | ) | | | (6,604 | ) | | | (7,667 | ) | | | (6,911 | ) | | | (7,069 | ) |
| | (9,454 | ) | | | (14,797 | ) | | | (18,596 | ) | | | (25,491 | ) | | | (30,289 | ) | | | (28,886 | ) | | | (29,036 | ) |
| | 26,466 | | | | 22,407 | | | | 33,447 | | | | 31,462 | | | | 29,800 | | | | 37,278 | | | | 37,269 | |
| | 3,685 | | | | 3,671 | | | | 3,664 | | | | 3,664 | | | | 3,646 | | | | 3,658 | | | | 3,646 | |
| | 114,607 | | | | 130,735 | | | | 146,900 | | | | 157,679 | | | | 164,908 | | | | 166,707 | | | | 166,707 | |
| | (51,238 | ) | | | (59,698 | ) | | | (69,235 | ) | | | (75,391 | ) | | | (79,282 | ) | | | (80,166 | ) | | | (79,970 | ) |
| | |
| | 81,951 | | | | 79,735 | | | | 91,357 | | | | 85,319 | | | | 81,116 | | | | 91,680 | | | | 91,547 | |
| | |
| | | | | | |
| | | | | | | | | | | | | | | | | | | | | | | | | | |
| | (6,142 | ) | | | (9,083 | ) | | | (16,898 | ) | | | (21,684 | ) | | | (22,526 | ) | | | (23,613 | ) | | | (23,592 | ) |
| | (141,802 | ) | | | (157,741 | ) | | | (182,979 | ) | | | (194,496 | ) | | | (200,885 | ) | | | (205,327 | ) | | | (205,084 | ) |
| | (631 | ) | | | (631 | ) | | | (631 | ) | | | (631 | ) | | | (631 | ) | | | (631 | ) | | | (631 | ) |
| | 57,414 | | | | 63,027 | | | | 67,025 | | | | 69,703 | | | | 71,539 | | | | 72,095 | | | | 71,896 | |
| | |
| | (91,161 | ) | | | (104,428 | ) | | | (133,483 | ) | | | (147,108 | ) | | | (152,503 | ) | | | (157,476 | ) | | | (157,411 | ) |
| | |
| | (9,210 | ) | | | (24,693 | ) | | | (42,126 | ) | | | (61,789 | ) | | | (71,387 | ) | | | (65,796 | ) | | | (65,864 | ) |
| | |
| $ | 31,799 | | | $ | 15,982 | | | $ | (2,270 | ) | | $ | (22,360 | ) | | $ | (32,165 | ) | | $ | (26,583 | ) | | $ | (26,751 | ) |
| | |
| | | | | | |
| | $29 | | | | $26 | | | | $23 | | | | $21 | | | | $19 | | | | $19 | | | | $19 | |
The accompanying notes are an integral part of these financial statements.
| | | | |
| 54 | | Wells Fargo Dynamic Target Date Funds | | Statements of operations—year ended May 31, 20161 |
| | | | | | | | |
| | | Dynamic Target
2055 Fund | | | Dynamic Target
2060 Fund | |
| | |
Investment income | | | | | | | | |
Dividends from unaffiliated Underlying Funds | | $ | 23,579 | | | $ | 23,580 | |
Dividends from affiliated Underlying Funds | | | 14,287 | | | | 14,306 | |
Interest allocated from affiliated Master Portfolios | | | 741 | | | | 741 | |
Dividends allocated from affiliated Master Portfolios* | | | 5,899 | | | | 5,913 | |
Interest | | | 43 | | | | 39 | |
Securities lending income allocated from affiliated Master Portfolios | | | 367 | | | | 368 | |
Affiliated income allocated from affiliated Master Portfolios | | | 50 | | | | 50 | |
Expenses allocated from affiliated Master Portfolios | | | (2,635 | ) | | | (2,637 | ) |
Waivers allocated from affiliated Master Portfolios | | | 47 | | | | 47 | |
| | | | |
Total investment income | | | 42,378 | | | | 42,407 | |
| | | | |
| | |
Expenses | | | | | | | | |
Management fee | | | 4,783 | | | | 4,785 | |
Administration fees | | | | | | | | |
Class A | | | 102 | | | | 101 | |
Class C | | | 100 | | | | 100 | |
Class R | | | 100 | | | | 100 | |
Class R4 | | | 38 | | | | 38 | |
Class R6 | | | 660 | | | | 660 | |
Shareholder servicing fees | | | | | | | | |
Class A | | | 122 | | | | 120 | |
Class C | | | 119 | | | | 119 | |
Class R | | | 119 | | | | 119 | |
Class R4 | | | 48 | | | | 48 | |
Distribution fees | | | | | | | | |
Class C | | | 358 | | | | 358 | |
Class R | | | 119 | | | | 119 | |
Custody and accounting fees | | | 13,140 | | | | 12,989 | |
Professional fees | | | 22,082 | | | | 22,082 | |
Registration fees | | | 38,588 | | | | 39,130 | |
Shareholder report expenses | | | 23,966 | | | | 23,966 | |
Trustees’ fees and expenses | | | 8,743 | | | | 8,743 | |
Other fees and expenses | | | 2,701 | | | | 2,732 | |
| | | | |
Total expenses | | | 115,888 | | | | 116,309 | |
Less: Fee waivers and/or expense reimbursements | | | (112,613 | ) | | | (113,049 | ) |
| | | | |
Net expenses | | | 3,275 | | | | 3,260 | |
| | | | |
Net investment income | | | 39,103 | | | | 39,147 | |
| | | | |
| | |
REALIZED AND UNREALIZED GAINS (LOSSES) ON INVESTMENTS | | | | | | | | |
| | |
Net realized gains (losses) on: | | | | | | | | |
Unaffiliated Underlying Funds | | | (7,134 | ) | | | (6,737 | ) |
Affiliated Underlying Funds | | | (28,556 | ) | | | (28,228 | ) |
Futures transactions | | | 40,080 | | | | 45,280 | |
Capital gain distributions from unaffiliated Underlying Funds | | | 3,646 | | | | 3,647 | |
Capital gain distributions from affiliated Underlying Funds | | | 166,707 | | | | 166,707 | |
Securities transactions allocated from affiliated Master Portfolios | | | (79,960 | ) | | | (79,968 | ) |
| | | | |
Net realized gains on investments | | | 94,783 | | | | 100,701 | |
| | | | |
| | |
Net change in unrealized gains (losses) on: | | | | | | | | |
Unaffiliated Underlying Funds | | | (23,703 | ) | | | (23,561 | ) |
Affiliated Underlying Funds | | | (205,704 | ) | | | (205,948 | ) |
Futures transactions | | | (631 | ) | | | (631 | ) |
Securities transactions allocated from affiliated Master Portfolios | | | 71,828 | | | | 71,939 | |
| | | | |
Net change in unrealized gains (losses) on investments | | | (158,210 | ) | | | (158,201 | ) |
| | | | |
Net realized and unrealized gains (losses) on investments | | | (63,427 | ) | | | (57,500 | ) |
| | | | |
Net increase (decrease) in net assets resulting from operations | | $ | (24,324 | ) | | $ | (18,353 | ) |
| | | | |
| | |
* Net of foreign dividend withholding taxes allocated from affiliated Master Portfolios in the amount of | | | $19 | | | | $19 | |
| 1 | For the period from November 30, 2015 (commencement of operations) to May 31, 2016 |
The accompanying notes are an integral part of these financial statements.
| | | | | | |
| Statements of changes in net assets | | Wells Fargo Dynamic Target Date Funds | | | 55 | |
| | | | | | | | |
| | | Dynamic Target Today Fund | |
| | | Year ended May 31, 20161 | |
| | |
Operations | | | | | | | | |
Net investment income | | | | | | $ | 42,317 | |
Net realized gains on investments | | | | | | | 35,759 | |
Net change in unrealized gains (losses) on investments | | | | | | | (20,228 | ) |
| | | | |
Net increase in net assets resulting from operations | | | | | | | 57,848 | |
| | | | |
| | |
Distributions to shareholders from | | | | | | | | |
Net investment income | | | | | | | | |
Class A | | | | | | | (341 | ) |
Class C | | | | | | | (274 | ) |
Class R | | | | | | | (321 | ) |
Class R4 | | | | | | | (368 | ) |
Class R6 | | | | | | | (17,595 | ) |
| | | | |
Total distributions to shareholders | | | | | | | (18,899 | ) |
| | | | |
| | |
Capital share transactions | | | Shares | | | | | |
Proceeds from shares sold | | | | | | | | |
Class A | | | 10,000 | | | | 100,000 | |
Class C | | | 10,000 | | | | 100,000 | |
Class R | | | 10,000 | | | | 100,000 | |
Class R4 | | | 10,000 | | | | 100,000 | |
Class R6 | | | 460,000 | | | | 4,600,000 | |
| | | | |
| | | | | | | 5,000,000 | |
| | | | |
Reinvestment of distributions | | | | | | | | |
Class A | | | 35 | | | | 341 | |
Class C | | | 28 | | | | 274 | |
Class R | | | 33 | | | | 321 | |
Class R4 | | | 37 | | | | 368 | |
Class R6 | | | 1,784 | | | | 17,595 | |
| | | | |
| | | | | | | 18,899 | |
| | | | |
Net increase in net assets resulting from capital share transactions | | | | | | | 5,018,899 | |
| | | | |
Total increase in net assets | | | | | | | 5,057,848 | |
| | | | |
| | |
Net assets | | | | | | | | |
Beginning of period | | | | | | | 0 | |
| | | | |
End of period | | | | | | $ | 5,057,848 | |
| | | | |
Undistributed net investment income | | | | | | $ | 29,433 | |
| | | | |
| 1 | For the period from November 30, 2015 (commencement of operations) to May 31, 2016 |
The accompanying notes are an integral part of these financial statements.
| | | | |
| 56 | | Wells Fargo Dynamic Target Date Funds | | Statements of changes in net assets |
| | | | | | | | |
| | | Dynamic Target 2015 Fund | |
| | | Year ended May 31, 20161 | |
| | |
Operations | | | | | | | | |
Net investment income | | | | | | $ | 42,044 | |
Net realized gains on investments | | | | | | | 48,714 | |
Net change in unrealized gains (losses) on investments | | | | | | | (53,595 | ) |
| | | | |
Net increase in net assets resulting from operations | | | | | | | 37,163 | |
| | | | |
| | |
Distributions to shareholders from | | | | | | | | |
Net investment income | | | | | | | | |
Class A | | | | | | | (429 | ) |
Class C | | | | | | | (361 | ) |
Class R | | | | | | | (409 | ) |
Class R4 | | | | | | | (457 | ) |
Class R6 | | | | | | | (21,726 | ) |
| | | | |
Total distributions to shareholders | | | | | | | (23,382 | ) |
| | | | |
| | |
Capital share transactions | | | Shares | | | | | |
Proceeds from shares sold | | | | | | | | |
Class A | | | 20,347 | | | | 196,247 | |
Class C | | | 10,000 | | | | 100,000 | |
Class R | | | 10,000 | | | | 100,000 | |
Class R4 | | | 10,000 | | | | 100,000 | |
Class R6 | | | 460,000 | | | | 4,600,000 | |
| | | | |
| | | | | | | 5,096,247 | |
| | | | |
Reinvestment of distributions | | | | | | | | |
Class A | | | 44 | | | | 429 | |
Class C | | | 37 | | | | 361 | |
Class R | | | 42 | | | | 409 | |
Class R4 | | | 47 | | | | 457 | |
Class R6 | | | 2,212 | | | | 21,726 | |
| | | | |
| | | | | | | 23,382 | |
| | | | |
Payment for shares redeemed | | | | | | | | |
Class A | | | (510 | ) | | | (5,000 | ) |
| | | | |
Net increase in net assets resulting from capital share transactions | | | | | | | 5,114,629 | |
| | | | |
Total increase in net assets | | | | | | | 5,128,410 | |
| | | | |
| | |
Net assets | | | | | | | | |
Beginning of period | | | | | | | 0 | |
| | | | |
End of period | | | | | | $ | 5,128,410 | |
| | | | |
Undistributed net investment income | | | | | | $ | 26,353 | |
| | | | |
| 1 | For the period from November 30, 2015 (commencement of operations) to May 31, 2016 |
The accompanying notes are an integral part of these financial statements.
| | | | | | |
| Statements of changes in net assets | | Wells Fargo Dynamic Target Date Funds | | | 57 | |
| | | | | | | | |
| | | Dynamic Target 2020 Fund | |
| | | Year ended
May 31, 20161 | |
| | |
Operations | | | | | | | | |
Net investment income | | | | | | $ | 41,009 | |
Net realized gains on investments | | | | | | | 81,951 | |
Net change in unrealized gains (losses) on investments | | | | | | | (91,161 | ) |
| | | | |
Net increase in net assets resulting from operations | | | | | | | 31,799 | |
| | | | |
| | |
Distributions to shareholders from | | | | | | | | |
Net investment income | | | | | | | | |
Class A | | | | | | | (520 | ) |
Class C | | | | | | | (402 | ) |
Class R | | | | | | | (451 | ) |
Class R4 | | | | | | | (499 | ) |
Class R6 | | | | | | | (23,616 | ) |
| | | | |
Total distributions to shareholders | | | | | | | (25,488 | ) |
| | | | |
| | |
Capital share transactions | | | Shares | | | | | |
Proceeds from shares sold | | | | | | | | |
Class A | | | 13,233 | | | | 131,778 | |
Class C | | | 10,000 | | | | 100,000 | |
Class R | | | 10,000 | | | | 100,000 | |
Class R4 | | | 10,000 | | | | 100,000 | |
Class R6 | | | 460,000 | | | | 4,600,000 | |
| | | | |
| | | | | | | 5,031,778 | |
| | | | |
Reinvestment of distributions | | | | | | | | |
Class A | | | 53 | | | | 520 | |
Class C | | | 41 | | | | 402 | |
Class R | | | 46 | | | | 451 | |
Class R4 | | | 51 | | | | 499 | |
Class R6 | | | 2,410 | | | | 23,616 | |
| | | | |
| | | | | | | 25,488 | |
| | | | |
Payment for shares redeemed | | | | | | | | |
Class A | | | (1,389 | ) | | | (13,080 | ) |
| | | | |
Net increase in net assets resulting from capital share transactions | | | | | | | 5,044,186 | |
| | | | |
Total increase in net assets | | | | | | | 5,050,497 | |
| | | | |
| | |
Net assets | | | | | | | | |
Beginning of period | | | | | | | 0 | |
| | | | |
End of period | | | | | | $ | 5,050,497 | |
| | | | |
Undistributed net investment income | | | | | | $ | 24,266 | |
| | | | |
| 1 | For the period from November 30, 2015 (commencement of operations) to May 31, 2016 |
The accompanying notes are an integral part of these financial statements.
| | | | |
| 58 | | Wells Fargo Dynamic Target Date Funds | | Statements of changes in net assets |
| | | | | | | | |
| | | Dynamic Target 2025 Fund | |
| | | Year ended
May 31, 20161 | |
| | |
Operations | | | | | | | | |
Net investment income | | | | | | $ | 40,675 | |
Net realized gains on investments | | | | | | | 79,735 | |
Net change in unrealized gains (losses) on investments | | | | | | | (104,428 | ) |
| | | | |
Net increase in net assets resulting from operations | | | | | | | 15,982 | |
| | | | |
| | |
Distributions to shareholders from | | | | | | | | |
Net investment income | | | | | | | | |
Class A | | | | | | | (520 | ) |
Class C | | | | | | | (451 | ) |
Class R | | | | | | | (500 | ) |
Class R4 | | | | | | | (548 | ) |
Class R6 | | | | | | | (25,875 | ) |
| | | | |
Total distributions to shareholders | | | | | | | (27,894 | ) |
| | | | |
| | |
Capital share transactions | | | Shares | | | | | |
Proceeds from shares sold | | | | | | | | |
Class A | | | 18,841 | | | | 180,465 | |
Class C | | | 10,000 | | | | 100,000 | |
Class R | | | 10,000 | | | | 100,000 | |
Class R4 | | | 10,000 | | | | 100,000 | |
Class R6 | | | 460,000 | | | | 4,600,000 | |
| | | | |
| | | | | | | 5,080,465 | |
| | | | |
Reinvestment of distributions | | | | | | | | |
Class A | | | 53 | | | | 520 | |
Class C | | | 46 | | | | 451 | |
Class R | | | 51 | | | | 500 | |
Class R4 | | | 56 | | | | 548 | |
Class R6 | | | 2,646 | | | | 25,875 | |
| | | | |
| | | | | | | 27,894 | |
| | | | |
Net increase in net assets resulting from capital share transactions | | | | | | | 5,108,359 | |
| | | | |
Total increase in net assets | | | | | | | 5,096,447 | |
| | | | |
| | |
Net assets | | | | | | | | |
Beginning of period | | | | | | | 0 | |
| | | | |
End of period | | | | | | $ | 5,096,447 | |
| | | | |
Undistributed net investment income | | | | | | $ | 22,478 | |
| | | | |
| 1 | For the period from November 30, 2015 (commencement of operations) to May 31, 2016 |
The accompanying notes are an integral part of these financial statements.
| | | | | | |
| Statements of changes in net assets | | Wells Fargo Dynamic Target Date Funds | | | 59 | |
| | | | | | | | |
| | | Dynamic Target 2030 Fund | |
| | | Year ended
May 31, 20161 | |
| | |
Operations | | | | | | | | |
Net investment income | | | | | | $ | 39,856 | |
Net realized gains on investments | | | | | | | 91,357 | |
Net change in unrealized gains (losses) on investments | | | | | | | (133,483 | ) |
| | | | |
Net decrease in net assets resulting from operations | | | | | | | (2,270 | ) |
| | | | |
| | |
Distributions to shareholders from | | | | | | | | |
Net investment income | | | | | | | | |
Class A | | | | | | | (584 | ) |
Class C | | | | | | | (490 | ) |
Class R | | | | | | | (536 | ) |
Class R4 | | | | | | | (586 | ) |
Class R6 | | | | | | | (27,614 | ) |
| | | | |
Total distributions to shareholders | | | | | | | (29,810 | ) |
| | | | |
| | |
Capital share transactions | | | Shares | | | | | |
Proceeds from shares sold | | | | | | | | |
Class A | | | 17,435 | | | | 171,391 | |
Class C | | | 10,000 | | | | 100,000 | |
Class R | | | 10,000 | | | | 100,000 | |
Class R4 | | | 10,000 | | | | 100,000 | |
Class R6 | | | 460,000 | | | | 4,600,000 | |
| | | | |
| | | | | | | 5,071,391 | |
| | | | |
Reinvestment of distributions | | | | | | | | |
Class A | | | 60 | | | | 584 | |
Class C | | | 50 | | | | 490 | |
Class R | | | 55 | | | | 536 | |
Class R4 | | | 60 | | | | 586 | |
Class R6 | | | 2,826 | | | | 27,614 | |
| | | | |
| | | | | | | 29,810 | |
| | | | |
Net increase in net assets resulting from capital share transactions | | | | | | | 5,101,201 | |
| | | | |
Total increase in net assets | | | | | | | 5,069,121 | |
| | | | |
| | |
Net assets | | | | | | | | |
Beginning of period | | | | | | | 0 | |
| | | | |
End of period | | | | | | $ | 5,069,121 | |
| | | | |
Undistributed net investment income | | | | | | $ | 20,699 | |
| | | | |
| 1 | For the period from November 30, 2015 (commencement of operations) to May 31, 2016 |
The accompanying notes are an integral part of these financial statements.
| | | | |
| 60 | | Wells Fargo Dynamic Target Date Funds | | Statements of changes in net assets |
| | | | | | | | |
| | | Dynamic Target 2035 Fund | |
| | | Year ended
May 31, 20161 | |
| | |
Operations | | | | | | | | |
Net investment income | | | | | | $ | 39,429 | |
Net realized gains on investments | | | | | | | 85,319 | |
Net change in unrealized gains (losses) on investments | | | | | | | (147,108 | ) |
| | | | |
Net decrease in net assets resulting from operations | | | | | | | (22,360 | ) |
| | | | |
| | |
Distributions to shareholders from | | | | | | | | |
Net investment income | | | | | | | | |
Class A | | | | | | | (676 | ) |
Class C | | | | | | | (517 | ) |
Class R | | | | | | | (564 | ) |
Class R4 | | | | | | | (613 | ) |
Class R6 | | | | | | | (28,856 | ) |
| | | | |
Total distributions to shareholders | | | | | | | (31,226 | ) |
| | | | |
| | |
Capital share transactions | | | Shares | | | | | |
Proceeds from shares sold | | | | | | | | |
Class A | | | 11,997 | | | | 119,487 | |
Class C | | | 10,000 | | | | 100,000 | |
Class R | | | 10,000 | | | | 100,000 | |
Class R4 | | | 10,000 | | | | 100,000 | |
Class R6 | | | 460,000 | | | | 4,600,000 | |
| | | | |
| | | | | | | 5,019,487 | |
| | | | |
Reinvestment of distributions | | | | | | | | |
Class A | | | 69 | | | | 676 | |
Class C | | | 53 | | | | 517 | |
Class R | | | 58 | | | | 564 | |
Class R4 | | | 63 | | | | 613 | |
Class R6 | | | 2,960 | | | | 28,856 | |
| | | | |
| | | | | | | 31,226 | |
| | | | |
Net increase in net assets resulting from capital share transactions | | | | | | | 5,050,713 | |
| | | | |
Total increase in net assets | | | | | | | 4,997,127 | |
| | | | |
| | |
Net assets | | | | | | | | |
Beginning of period | | | | | | | 0 | |
| | | | |
End of period | | | | | | $ | 4,997,127 | |
| | | | |
Undistributed net investment income | | | | | | $ | 19,497 | |
| | | | |
| 1 | For the period from November 30, 2015 (commencement of operations) to May 31, 2016 |
The accompanying notes are an integral part of these financial statements.
| | | | | | |
| Statements of changes in net assets | | Wells Fargo Dynamic Target Date Funds | | | 61 | |
| | | | | | | | |
| | | Dynamic Target 2040 Fund | |
| | | Year ended
May 31, 20161 | |
| | |
Operations | | | | | | | | |
Net investment income | | | | | | $ | 39,222 | |
Net realized gains on investments | | | | | | | 81,116 | |
Net change in unrealized gains (losses) on investments | | | | | | | (152,503 | ) |
| | | | |
Net decrease in net assets resulting from operations | | | | | | | (32,165 | ) |
| | | | |
| | |
Distributions to shareholders from | | | | | | | | |
Net investment income | | | | | | | | |
Class A | | | | | | | (695 | ) |
Class C | | | | | | | (544 | ) |
Class R | | | | | | | (589 | ) |
Class R4 | | | | | | | (637 | ) |
Class R6 | | | | | | | (29,928 | ) |
| | | | |
Total distributions to shareholders | | | | | | | (32,393 | ) |
| | | | |
| | |
Capital share transactions | | | Shares | | | | | |
Proceeds from shares sold | | | | | | | | |
Class A | | | 15,876 | | | | 157,099 | |
Class C | | | 10,000 | | | | 100,000 | |
Class R | | | 10,000 | | | | 100,000 | |
Class R4 | | | 10,000 | | | | 100,000 | |
Class R6 | | | 460,000 | | | | 4,600,000 | |
| | | | |
| | | | | | | 5,057,099 | |
| | | | |
Reinvestment of distributions | | | | | | | | |
Class A | | | 71 | | | | 695 | |
Class C | | | 56 | | | | 544 | |
Class R | | | 61 | | | | 589 | |
Class R4 | | | 65 | | | | 637 | |
Class R6 | | | 3,073 | | | | 29,928 | |
| | | | |
| | | | | | | 32,393 | |
| | | | |
Net increase in net assets resulting from capital share transactions | | | | | | | 5,089,492 | |
| | | | |
Total increase in net assets | | | | | | | 5,024,934 | |
| | | | |
| | |
Net assets | | | | | | | | |
Beginning of period | | | | | | | 0 | |
| | | | |
End of period | | | | | | $ | 5,024,934 | |
| | | | |
Undistributed net investment income | | | | | | $ | 18,542 | |
| | | | |
| 1 | For the period from November 30, 2015 (commencement of operations) to May 31, 2016 |
The accompanying notes are an integral part of these financial statements.
| | | | |
| 62 | | Wells Fargo Dynamic Target Date Funds | | Statements of changes in net assets |
| | | | | | | | |
| | | Dynamic Target 2045 Fund | |
| | | Year ended
May 31, 20161 | |
| | |
Operations | | | | | | | | |
Net investment income | | | | | | $ | 39,213 | |
Net realized gains on investments | | | | | | | 91,680 | |
Net change in unrealized gains (losses) on investments | | | | | | | (157,476 | ) |
| | | | |
Net decrease in net assets resulting from operations | | | | | | | (26,583 | ) |
| | | | |
| | |
Distributions to shareholders from | | | | | | | | |
Net investment income | | | | | | | | |
Class A | | | | | | | (695 | ) |
Class C | | | | | | | (549 | ) |
Class R | | | | | | | (595 | ) |
Class R4 | | | | | | | (642 | ) |
Class R6 | | | | | | | (30,176 | ) |
| | | | |
Total distributions to shareholders | | | | | | | (32,657 | ) |
| | | | |
| | |
Capital share transactions | | | Shares | | | | | |
Proceeds from shares sold | | | | | | | | |
Class A | | | 12,214 | | | | 121,460 | |
Class C | | | 10,000 | | | | 100,000 | |
Class R | | | 10,000 | | | | 100,000 | |
Class R4 | | | 10,000 | | | | 100,000 | |
Class R6 | | | 460,000 | | | | 4,600,000 | |
| | | | |
| | | | | | | 5,021,460 | |
| | | | |
Reinvestment of distributions | | | | | | | | |
Class A | | | 71 | | | | 695 | |
Class C | | | 56 | | | | 549 | |
Class R | | | 61 | | | | 595 | |
Class R4 | | | 66 | | | | 642 | |
Class R6 | | | 3,098 | | | | 30,176 | |
| | | | |
| | | | | | | 32,657 | |
| | | | |
Net increase in net assets resulting from capital share transactions | | | | | | | 5,054,117 | |
| | | | |
Total increase in net assets | | | | | | | 4,994,877 | |
| | | | |
| | |
Net assets | | | | | | | | |
Beginning of period | | | | | | | 0 | |
| | | | |
End of period | | | | | | $ | 4,994,877 | |
| | | | |
Undistributed net investment income | | | | | | $ | 18,377 | |
| | | | |
| 1 | For the period from November 30, 2015 (commencement of operations) to May 31, 2016 |
The accompanying notes are an integral part of these financial statements.
| | | | | | |
| Statements of changes in net assets | | Wells Fargo Dynamic Target Date Funds | | | 63 | |
| | | | | | | | |
| | | Dynamic Target 2050 Fund | |
| | | Year ended
May 31, 20161 | |
| | |
Operations | | | | | | | | |
Net investment income | | | | | | $ | 39,113 | |
Net realized gains on investments | | | | | | | 91,547 | |
Net change in unrealized gains (losses) on investments | | | | | | | (157,411 | ) |
| | | | |
Net decrease in net assets resulting from operations | | | | | | | (26,751 | ) |
| | | | |
| | |
Distributions to shareholders from | | | | | | | | |
Net investment income | | | | | | | | |
Class A | | | | | | | (614 | ) |
Class C | | | | | | | (546 | ) |
Class R | | | | | | | (593 | ) |
Class R4 | | | | | | | (642 | ) |
Class R6 | | | | | | | (30,190 | ) |
| | | | |
Total distributions to shareholders | | | | | | | (32,585 | ) |
| | | | |
| | |
Capital share transactions | | | Shares | | | | | |
Proceeds from shares sold | | | | | | | | |
Class A | | | 10,930 | | | | 108,853 | |
Class C | | | 10,000 | | | | 100,000 | |
Class R | | | 10,000 | | | | 100,000 | |
Class R4 | | | 10,000 | | | | 100,000 | |
Class R6 | | | 460,000 | | | | 4,600,000 | |
| | | | |
| | | | | | | 5,008,853 | |
| | | | |
Reinvestment of distributions | | | | | | | | |
Class A | | | 63 | | | | 614 | |
Class C | | | 56 | | | | 546 | |
Class R | | | 61 | | | | 593 | |
Class R4 | | | 66 | | | | 642 | |
Class R6 | | | 3,100 | | | | 30,190 | |
| | | | |
| | | | | | | 32,585 | |
| | | | |
Net increase in net assets resulting from capital share transactions | | | | | | | 5,041,438 | |
| | | | |
Total increase in net assets | | | | | | | 4,982,102 | |
| | | | |
| | |
Net assets | | | | | | | | |
Beginning of period | | | | | | | 0 | |
| | | | |
End of period | | | | | | $ | 4,982,102 | |
| | | | |
Undistributed net investment income | | | | | | $ | 18,348 | |
| | | | |
| 1 | For the period from November 30, 2015 (commencement of operations) to May 31, 2016 |
The accompanying notes are an integral part of these financial statements.
| | | | |
| 64 | | Wells Fargo Dynamic Target Date Funds | | Statements of changes in net assets |
| | | | | | | | |
| | | Dynamic Target 2055 Fund | |
| | | Year ended
May 31, 20161 | |
| | |
Operations | | | | | | | | |
Net investment income | | | | | | $ | 39,103 | |
Net realized gains on investments | | | | | | | 94,783 | |
Net change in unrealized gains (losses) on investments | | | | | | | (158,210 | ) |
| | | | |
Net decrease in net assets resulting from operations | | | | | | | (24,324 | ) |
| | | | |
| | |
Distributions to shareholders from | | | | | | | | |
Net investment income | | | | | | | | |
Class A | | | | | | | (614 | ) |
Class C | | | | | | | (546 | ) |
Class R | | | | | | | (593 | ) |
Class R4 | | | | | | | (642 | ) |
Class R6 | | | | | | | (30,190 | ) |
| | | | |
Total distributions to shareholders | | | | | | | (32,585 | ) |
| | | | |
| | |
Capital share transactions | | | Shares | | | | | |
Proceeds from shares sold | | | | | | | | |
Class A | | | 10,330 | | | | 103,000 | |
Class C | | | 10,000 | | | | 100,000 | |
Class R | | | 10,000 | | | | 100,000 | |
Class R4 | | | 10,000 | | | | 100,000 | |
Class R6 | | | 460,000 | | | | 4,600,000 | |
| | | | |
| | | | | | | 5,003,000 | |
| | | | |
Reinvestment of distributions | | | | | | | | |
Class A | | | 63 | | | | 614 | |
Class C | | | 56 | | | | 546 | |
Class R | | | 61 | | | | 593 | |
Class R4 | | | 66 | | | | 642 | |
Class R6 | | | 3,100 | | | | 30,190 | |
| | | | |
| | | | | | | 32,585 | |
| | | | |
Net increase in net assets resulting from capital share transactions | | | | | | | 5,035,585 | |
| | | | |
Total increase in net assets | | | | | | | 4,978,676 | |
| | | | |
| | |
Net assets | | | | | | | | |
Beginning of period | | | | | | | 0 | |
| | | | |
End of period | | | | | | $ | 4,978,676 | |
| | | | |
Undistributed net investment income | | | | | | $ | 18,338 | |
| | | | |
| 1 | For the period from November 30, 2015 (commencement of operations) to May 31, 2016 |
The accompanying notes are an integral part of these financial statements.
| | | | | | |
| Statements of changes in net assets | | Wells Fargo Dynamic Target Date Funds | | | 65 | |
| | | | | | | | |
| | | Dynamic Target 2060 Fund | |
| | | Year ended
May 31, 20161 | |
| | |
Operations | | | | | | | | |
Net investment income | | | | | | $ | 39,147 | |
Net realized gains on investments | | | | | | | 100,701 | |
Net change in unrealized gains (losses) on investments | | | | | | | (158,201 | ) |
| | | | |
Net decrease in net assets resulting from operations | | | | | | | (18,353 | ) |
| | | | |
| | |
Distributions to shareholders from | | | | | | | | |
Net investment income | | | | | | | | |
Class A | | | | | | | (615 | ) |
Class C | | | | | | | (549 | ) |
Class R | | | | | | | (595 | ) |
Class R4 | | | | | | | (642 | ) |
Class R6 | | | | | | | (30,185 | ) |
| | | | |
Total distributions to shareholders | | | | | | | (32,586 | ) |
| | | | |
| | |
Capital share transactions | | | Shares | | | | | |
Proceeds from shares sold | | | | | | | | |
Class A | | | 10,184 | | | | 101,808 | |
Class C | | | 10,000 | | | | 100,000 | |
Class R | | | 10,000 | | | | 100,000 | |
Class R4 | | | 10,000 | | | | 100,000 | |
Class R6 | | | 460,000 | | | | 4,600,000 | |
| | | | |
| | | | | | | 5,001,808 | |
| | | | |
Reinvestment of distributions | | | | | | | | |
Class A | | | 63 | | | | 615 | |
Class C | | | 56 | | | | 549 | |
Class R | | | 61 | | | | 595 | |
Class R4 | | | 66 | | | | 642 | |
Class R6 | | | 3,099 | | | | 30,185 | |
| | | | |
| | | | | | | 32,586 | |
| | | | |
Net increase in net assets resulting from capital share transactions | | | | | | | 5,034,394 | |
| | | | |
Total increase in net assets | | | | | | | 4,983,455 | |
| | | | |
| | |
Net assets | | | | | | | | |
Beginning of period | | | | | | | 0 | |
| | | | |
End of period | | | | | | $ | 4,983,455 | |
| | | | |
Undistributed net investment income | | | | | | $ | 18,379 | |
| | | | |
| 1 | For the period from November 30, 2015 (commencement of operations) to May 31, 2016 |
The accompanying notes are an integral part of these financial statements.
| | | | |
| 66 | | Wells Fargo Dynamic Target Date Funds | | Financial highlights |
| | | | | | | | | | | | | | | | | | | | |
| Dynamic Target Today Fund | | Beginning
net asset
value per
share | | | Net
investment
income | | | Net realized
and unrealized
gains (losses)
on investments | | | Distributions
from net
investment
income | | | Ending
net asset
value per
share | |
Class A | | | | | | | | | | | | | | | | | | | | |
Year ended May 31, 20163 | | $ | 10.00 | | | | 0.06 | | | | 0.03 | | | | (0.03 | ) | | $ | 10.06 | |
Class C | | | | | | | | | | | | | | | | | | | | |
Year ended May 31, 20163 | | $ | 10.00 | | | | 0.03 | | | | 0.03 | | | | (0.03 | ) | | $ | 10.03 | |
Class R | | | | | | | | | | | | | | | | | | | | |
Year ended May 31, 20163 | | $ | 10.00 | | | | 0.05 | | | | 0.03 | | | | (0.03 | ) | | $ | 10.05 | |
Class R4 | | | | | | | | | | | | | | | | | | | | |
Year ended May 31, 20163 | | $ | 10.00 | | | | 0.08 | | | | 0.03 | | | | (0.04 | ) | | $ | 10.07 | |
Class R6 | | | | | | | | | | | | | | | | | | | | |
Year ended May 31, 20163 | | $ | 10.00 | | | | 0.09 | | | | 0.03 | | | | (0.04 | ) | | $ | 10.08 | |
| 1 | Ratios do not reflect net expenses allocated from the affiliated Master Portfolios. Including annualized net expenses allocated from the affiliated Master Portfolios, the expense ratios would be increased by the following amounts: |
| | | | |
| | | Year ended
May 31, 20163 | |
Class A | | | 0.11 | % |
Class C | | | 0.10 | % |
Class R | | | 0.11 | % |
Class R4 | | | 0.11 | % |
Class R6 | | | 0.11 | % |
| 2 | Total return calculations do not include any sales charges. Returns for periods of less than one year are not annualized. |
| 3 | For the period from November 30, 2015 (commencement of class operations) to May 31, 2016 |
The accompanying notes are an integral part of these financial statements.
| | | | | | |
| Financial highlights | | Wells Fargo Dynamic Target Date Funds | | | 67 | |
| | | | | | | | | | | | | | | | | | | | | | |
| Ratio to average net assets (annualized) | | | Total
return2 | | | Portfolio
turnover
rate | | | Net assets at
end of period
(000s omitted) | |
Net investment
income | | | Gross
expenses1 | | | Net
expenses1 | | | | |
| | | | | | | | | | | | | | | | | | | | | | |
| | 1.31 | % | | | 5.22 | % | | | 0.53 | % | | | 0.95 | % | | | 66 | % | | $ | 101 | |
| | | | | | | | | | | | | | | | | | | | | | |
| | 0.56 | % | | | 5.97 | % | | | 1.28 | % | | | 0.58 | % | | | 66 | % | | $ | 101 | |
| | | | | | | | | | | | | | | | | | | | | | |
| | 1.06 | % | | | 5.47 | % | | | 0.77 | % | | | 0.83 | % | | | 66 | % | | $ | 101 | |
| | | | | | | | | | | | | | | | | | | | | | |
| | 1.62 | % | | | 4.94 | % | | | 0.22 | % | | | 1.08 | % | | | 66 | % | | $ | 101 | |
| | | | | | | | | | | | | | | | | | | | | | |
| | 1.77 | % | | | 4.79 | % | | | 0.07 | % | | | 1.19 | % | | | 66 | % | | $ | 4,654 | |
The accompanying notes are an integral part of these financial statements.
| | | | |
| 68 | | Wells Fargo Dynamic Target Date Funds | | Financial highlights |
| | | | | | | | | | | | | | | | | | | | |
| Dynamic Target 2015 Fund | | Beginning
net asset
value per
share | | | Net
investment
income | | | Net realized
and unrealized
gains (losses)
on investments | | | Distributions
from net
investment income | | | Ending
net asset
value per
share | |
Class A | | | | | | | | | | | | | | | | | | | | |
Year ended May 31, 20163 | | $ | 10.00 | | | | 0.07 | | | | (0.04 | ) | | | (0.04 | ) | | $ | 9.99 | |
Class C | | | | | | | | | | | | | | | | | | | | |
Year ended May 31, 20163 | | $ | 10.00 | | | | 0.03 | | | | (0.02 | ) | | | (0.04 | ) | | $ | 9.97 | |
Class R | | | | | | | | | | | | | | | | | | | | |
Year ended May 31, 20163 | | $ | 10.00 | | | | 0.05 | | | | (0.02 | ) | | | (0.04 | ) | | $ | 9.99 | |
Class R4 | | | | | | | | | | | | | | | | | | | | |
Year ended May 31, 20163 | | $ | 10.00 | | | | 0.08 | | | | (0.02 | ) | | | (0.05 | ) | | $ | 10.01 | |
Class R6 | | | | | | | | | | | | | | | | | | | | |
Year ended May 31, 20163 | | $ | 10.00 | | | | 0.09 | | | | (0.03 | ) | | | (0.05 | ) | | $ | 10.01 | |
| 1 | Ratios do not reflect net expenses allocated from the affiliated Master Portfolios. Including annualized net expenses allocated from the affiliated Master Portfolios, the expense ratios would be increased by the following amounts: |
| | | | |
| | | Year ended
May 31, 20163 | |
Class A | | | 0.10 | % |
Class C | | | 0.10 | % |
Class R | | | 0.12 | % |
Class R4 | | | 0.10 | % |
Class R6 | | | 0.11 | % |
| 2 | Total return calculations do not include any sales charges. Returns for periods of less than one year are not annualized. |
| 3 | For the period from November 30, 2015 (commencement of class operations) to May 31, 2016 |
The accompanying notes are an integral part of these financial statements.
| | | | | | |
| Financial highlights | | Wells Fargo Dynamic Target Date Funds | | | 69 | |
| | | | | | | | | | | | | | | | | | | | | | |
| Ratio to average net assets (annualized) | | | Total
return2 | | | Portfolio
turnover
rate | | | Net assets at
end of period
(000s omitted) | |
Net investment
income | | | Gross
expenses1 | | | Net
expenses1 | | | | |
| | | | | | | | | | | | | | | | | | | | | | |
| | 1.16 | % | | | 5.21 | % | | | 0.45 | % | | | 0.34 | % | | | 38 | % | | $ | 199 | |
| | | | | | | | | | | | | | | | | | | | | | |
| | 0.56 | % | | | 5.96 | % | | | 1.28 | % | | | 0.07 | % | | | 38 | % | | $ | 100 | |
| | | | | | | | | | | | | | | | | | | | | | |
| | 1.06 | % | | | 5.46 | % | | | 0.77 | % | | | 0.32 | % | | | 38 | % | | $ | 100 | |
| | | | | | | | | | | | | | | | | | | | | | |
| | 1.61 | % | | | 4.93 | % | | | 0.22 | % | | | 0.57 | % | | | 38 | % | | $ | 101 | |
| | | | | | | | | | | | | | | | | | | | | | |
| | 1.77 | % | | | 4.78 | % | | | 0.06 | % | | | 0.58 | % | | | 38 | % | | $ | 4,629 | |
The accompanying notes are an integral part of these financial statements.
| | | | |
| 70 | | Wells Fargo Dynamic Target Date Funds | | Financial highlights |
| | | | | | | | | | | | | | | | | | | | |
| Dynamic Target 2020 Fund | | Beginning
net asset
value per
share | | | Net
investment
income | | | Net realized
and unrealized
gains (losses)
on investments | | | Distributions
from net
investment
income | | | Ending
net asset
value per
share | |
Class A | | | | | | | | | | | | | | | | | | | | |
Year ended May 31, 20163 | | $ | 10.00 | | | | 0.06 | | | | (0.03 | ) | | | (0.04 | ) | | $ | 9.99 | |
Class C | | | | | | | | | | | | | | | | | | | | |
Year ended May 31, 20163 | | $ | 10.00 | | | | 0.03 | | | | (0.03 | ) | | | (0.04 | ) | | $ | 9.96 | |
Class R | | | | | | | | | | | | | | | | | | | | |
Year ended May 31, 20163 | | $ | 10.00 | | | | 0.05 | | | | (0.01 | ) | | | (0.05 | ) | | $ | 9.99 | |
Class R4 | | | | | | | | | | | | | | | | | | | | |
Year ended May 31, 20163 | | $ | 10.00 | | | | 0.08 | | | | (0.02 | ) | | | (0.05 | ) | | $ | 10.01 | |
Class R6 | | | | | | | | | | | | | | | | | | | | |
Year ended May 31, 20163 | | $ | 10.00 | | | | 0.08 | | | | (0.02 | ) | | | (0.05 | ) | | $ | 10.01 | |
| 1 | Ratios do not reflect net expenses allocated from the affiliated Master Portfolios. Including annualized net expenses allocated from the affiliated Master Portfolios, the expense ratios would be increased by the following amounts: |
| | | | |
| | | Year ended
May 31, 20163 | |
Class A | | | 0.10 | % |
Class C | | | 0.10 | % |
Class R | | | 0.11 | % |
Class R4 | | | 0.10 | % |
Class R6 | | | 0.11 | % |
| 2 | Total return calculations do not include any sales charges. Returns for periods of less than one year are not annualized. |
| 3 | For the period from November 30, 2015 (commencement of class operations) to May 31, 2016 |
The accompanying notes are an integral part of these financial statements.
| | | | | | |
| Financial highlights | | Wells Fargo Dynamic Target Date Funds | | | 71 | |
| | | | | | | | | | | | | | | | | | | | | | |
| Ratio to average net assets (annualized) | | | Total
return2 | | | Portfolio
turnover
rate | | | Net assets at
end of period
(000s omitted) | |
Net investment
income | | | Gross
expenses1 | | | Net
expenses1 | | | | |
| | | | | | | | | | | | | | | | | | | | | | |
| | 1.33 | % | | | 5.21 | % | | | 0.54 | % | | | 0.35 | % | | | 38 | % | | $ | 119 | |
| | | | | | | | | | | | | | | | | | | | | | |
| | 0.53 | % | | | 5.97 | % | | | 1.29 | % | | | 0.01 | % | | | 38 | % | | $ | 100 | |
| | | | | | | | | | | | | | | | | | | | | | |
| | 1.03 | % | | | 5.47 | % | | | 0.77 | % | | | 0.36 | % | | | 38 | % | | $ | 100 | |
| | | | | | | | | | | | | | | | | | | | | | |
| | 1.59 | % | | | 4.94 | % | | | 0.23 | % | | | 0.61 | % | | | 38 | % | | $ | 101 | |
| | | | | | | | | | | | | | | | | | | | | | |
| | 1.74 | % | | | 4.79 | % | | | 0.07 | % | | | 0.62 | % | | | 38 | % | | $ | 4,631 | |
The accompanying notes are an integral part of these financial statements.
| | | | |
| 72 | | Wells Fargo Dynamic Target Date Funds | | Financial highlights |
| | | | | | | | | | | | | | | | | | | | |
| Dynamic Target 2025 Fund | | Beginning
net asset
value per
share | | | Net
investment
income | | | Net realized
and unrealized
gains (losses)
on investments | | | Distributions
from net
investment
income | | | Ending
net asset
value per
share | |
Class A | | | | | | | | | | | | | | | | | | | | |
Year ended May 31, 20163 | | $ | 10.00 | | | | 0.07 | | | | (0.08 | ) | | | (0.05 | ) | | $ | 9.94 | |
Class C | | | | | | | | | | | | | | | | | | | | |
Year ended May 31, 20163 | | $ | 10.00 | | | | 0.02 | | | | (0.06 | ) | | | (0.05 | ) | | $ | 9.91 | |
Class R | | | | | | | | | | | | | | | | | | | | |
Year ended May 31, 20163 | | $ | 10.00 | | | | 0.05 | | | | (0.07 | ) | | | (0.05 | ) | | $ | 9.93 | |
Class R4 | | | | | | | | | | | | | | | | | | | | |
Year ended May 31, 20163 | | $ | 10.00 | | | | 0.08 | | | | (0.07 | ) | | | (0.05 | ) | | $ | 9.96 | |
Class R6 | | | | | | | | | | | | | | | | | | | | |
Year ended May 31, 20163 | | $ | 10.00 | | | | 0.08 | | | | (0.06 | ) | | | (0.06 | ) | | $ | 9.96 | |
| 1 | Ratios do not reflect net expenses allocated from the affiliated Master Portfolios. Including annualized net expenses allocated from the affiliated Master Portfolios, the expense ratios would be increased by the following amounts: |
| | | | |
| | | Year ended
May 31, 20163 | |
Class A | | | 0.10 | % |
Class C | | | 0.10 | % |
Class R | | | 0.12 | % |
Class R4 | | | 0.10 | % |
Class R6 | | | 0.11 | % |
| 2 | Total return calculations do not include any sales charges. Returns for periods of less than one year are not annualized. |
| 3 | For the period from November 30, 2015 (commencement of class operations) to May 31, 2016 |
The accompanying notes are an integral part of these financial statements.
| | | | | | |
| Financial highlights | | Wells Fargo Dynamic Target Date Funds | | | 73 | |
| | | | | | | | | | | | | | | | | | | | | | |
| Ratio to average net assets (annualized) | | | Total
return2 | | | Portfolio
turnover
rate | | | Net assets at
end of period
(000s omitted) | |
Net investment
income | | | Gross
expenses1 | | | Net
expenses1 | | | | |
| | | | | | | | | | | | | | | | | | | | | | |
| | 1.09 | % | | | 5.25 | % | | | 0.46 | % | | | (0.07 | )% | | | 38 | % | | $ | 188 | |
| | | | | | | | | | | | | | | | | | | | | | |
| | 0.52 | % | | | 6.00 | % | | | 1.30 | % | | | (0.44 | )% | | | 38 | % | | $ | 100 | |
| | | | | | | | | | | | | | | | | | | | | | |
| | 1.02 | % | | | 5.50 | % | | | 0.78 | % | | | (0.19 | )% | | | 38 | % | | $ | 100 | |
| | | | | | | | | | | | | | | | | | | | | | |
| | 1.58 | % | | | 4.97 | % | | | 0.23 | % | | | 0.16 | % | | | 38 | % | | $ | 100 | |
| | | | | | | | | | | | | | | | | | | | | | |
| | 1.73 | % | | | 4.82 | % | | | 0.08 | % | | | 0.17 | % | | | 38 | % | | $ | 4,609 | |
The accompanying notes are an integral part of these financial statements.
| | | | |
| 74 | | Wells Fargo Dynamic Target Date Funds | | Financial highlights |
| | | | | | | | | | | | | | | | | | | | |
| Dynamic Target 2030 Fund | | Beginning
net asset
value per
share | | | Net
investment
income | | | Net realized
and unrealized
gains (losses)
on investments | | | Distributions
from net
investment
income | | | Ending
net asset
value per
share | |
Class A | | | | | | | | | | | | | | | | | | | | |
Year ended May 31, 20163 | | $ | 10.00 | | | | 0.06 | | | | (0.10 | ) | | | (0.05 | ) | | $ | 9.91 | |
Class C | | | | | | | | | | | | | | | | | | | | |
Year ended May 31, 20163 | | $ | 10.00 | | | | 0.02 | | | | (0.09 | ) | | | (0.05 | ) | | $ | 9.88 | |
Class R | | | | | | | | | | | | | | | | | | | | |
Year ended May 31, 20163 | | $ | 10.00 | | | | 0.05 | | | | (0.10 | ) | | | (0.05 | ) | | $ | 9.90 | |
Class R4 | | | | | | | | | | | | | | | | | | | | |
Year ended May 31, 20163 | | $ | 10.00 | | | | 0.07 | | | | (0.08 | ) | | | (0.06 | ) | | $ | 9.93 | |
Class R6 | | | | | | | | | | | | | | | | | | | | |
Year ended May 31, 20163 | | $ | 10.00 | | | | 0.08 | | | | (0.09 | ) | | | (0.06 | ) | | $ | 9.93 | |
| 1 | Ratios do not reflect net expenses allocated from the affiliated Master Portfolios. Including annualized net expenses allocated from the affiliated Master Portfolios, the expense ratios would be increased by the following amounts: |
| | | | |
| | | Year ended
May 31, 20163 | |
Class A | | | 0.10 | % |
Class C | | | 0.10 | % |
Class R | | | 0.11 | % |
Class R4 | | | 0.10 | % |
Class R6 | | | 0.11 | % |
| 2 | Total return calculations do not include any sales charges. Returns for periods of less than one year are not annualized. |
| 3 | For the period from November 30, 2015 (commencement of class operations) to May 31, 2016 |
The accompanying notes are an integral part of these financial statements.
| | | | | | |
| Financial highlights | | Wells Fargo Dynamic Target Date Funds | | | 75 | |
| | | | | | | | | | | | | | | | | | | | | | |
| Ratio to average net assets (annualized) | | | Total
return2 | | | Portfolio
turnover
rate | | | Net assets at
end of period
(000s omitted) | |
Net investment
income | | | Gross
expenses1 | | | Net
expenses1 | | | | |
| | | | | | | | | | | | | | | | | | | | | | |
| | 1.19 | % | | | 5.29 | % | | | 0.45 | % | | | (0.34 | )% | | | 22 | % | | $ | 173 | |
| | | | | | | | | | | | | | | | | | | | | | |
| | 0.49 | % | | | 6.03 | % | | | 1.30 | % | | | (0.70 | )% | | | 22 | % | | $ | 99 | |
| | | | | | | | | | | | | | | | | | | | | | |
| | 1.00 | % | | | 5.53 | % | | | 0.79 | % | | | (0.46 | )% | | | 22 | % | | $ | 100 | |
| | | | | | | | | | | | | | | | | | | | | | |
| | 1.55 | % | | | 5.00 | % | | | 0.24 | % | | | (0.10 | )% | | | 22 | % | | $ | 100 | |
| | | | | | | | | | | | | | | | | | | | | | |
| | 1.70 | % | | | 4.85 | % | | | 0.09 | % | | | (0.09 | )% | | | 22 | % | | $ | 4,597 | |
The accompanying notes are an integral part of these financial statements.
| | | | |
| 76 | | Wells Fargo Dynamic Target Date Funds | | Financial highlights |
| | | | | | | | | | | | | | | | | | | | |
| Dynamic Target 2035 Fund | | Beginning
net asset
value per
share | | | Net
investment
income | | | Net realized
and unrealized
gains (losses)
on investments | | | Distributions
from net
investment
income | | | Ending
net asset
value per
share | |
Class A | | | | | | | | | | | | | | | | | | | | |
Year ended May 31, 20163 | | $ | 10.00 | | | | 0.06 | | | | (0.12 | ) | | | (0.06 | ) | | $ | 9.88 | |
Class C | | | | | | | | | | | | | | | | | | | | |
Year ended May 31, 20163 | | $ | 10.00 | | | | 0.02 | | | | (0.13 | ) | | | (0.05 | ) | | $ | 9.84 | |
Class R | | | | | | | | | | | | | | | | | | | | |
Year ended May 31, 20163 | | $ | 10.00 | | | | 0.05 | | | | (0.12 | ) | | | (0.06 | ) | | $ | 9.87 | |
Class R4 | | | | | | | | | | | | | | | | | | | | |
Year ended May 31, 20163 | | $ | 10.00 | | | | 0.07 | | | | (0.12 | ) | | | (0.06 | ) | | $ | 9.89 | |
Class R6 | | | | | | | | | | | | | | | | | | | | |
Year ended May 31, 20163 | | $ | 10.00 | | | | 0.08 | | | | (0.13 | ) | | | (0.06 | ) | | $ | 9.89 | |
| 1 | Ratios do not reflect net expenses allocated from the affiliated Master Portfolios. Including annualized net expenses allocated from the affiliated Master Portfolios, the expense ratios would be increased by the following amounts: |
| | | | |
| | | Year ended
May 31, 20163 | |
Class A | | | 0.10 | % |
Class C | | | 0.10 | % |
Class R | | | 0.12 | % |
Class R4 | | | 0.10 | % |
Class R6 | | | 0.11 | % |
| 2 | Total return calculations do not include any sales charges. Returns for periods of less than one year are not annualized. |
| 3 | For the period from November 30, 2015 (commencement of class operations) to May 31, 2016 |
The accompanying notes are an integral part of these financial statements.
| | | | | | |
| Financial highlights | | Wells Fargo Dynamic Target Date Funds | | | 77 | |
| | | | | | | | | | | | | | | | | | | | | | |
| Ratio to average net assets (annualized) | | | Total
return2 | | | Portfolio
turnover
rate | | | Net assets at
end of period
(000s omitted) | |
Net investment
income | | | Gross
expenses1 | | | Net
expenses1 | | | | |
| | | | | | | | | | | | | | | | | | | | | | |
| | 1.24 | % | | | 5.32 | % | | | 0.55 | % | | | (0.62 | )% | | | 19 | % | | $ | 119 | |
| | | | | | | | | | | | | | | | | | | | | | |
| | 0.48 | % | | | 6.06 | % | | | 1.30 | % | | | (1.08 | )% | | | 19 | % | | $ | 99 | |
| | | | | | | | | | | | | | | | | | | | | | |
| | 0.99 | % | | | 5.57 | % | | | 0.79 | % | | | (0.73 | )% | | | 19 | % | | $ | 99 | |
| | | | | | | | | | | | | | | | | | | | | | |
| | 1.54 | % | | | 5.03 | % | | | 0.24 | % | | | (0.48 | )% | | | 19 | % | | $ | 99 | |
| | | | | | | | | | | | | | | | | | | | | | |
| | 1.69 | % | | | 4.88 | % | | | 0.08 | % | | | (0.46 | )% | | | 19 | % | | $ | 4,580 | |
The accompanying notes are an integral part of these financial statements.
| | | | |
| 78 | | Wells Fargo Dynamic Target Date Funds | | Financial highlights |
| | | | | | | | | | | | | | | | | | | | |
| Dynamic Target 2040 Fund | | Beginning
net asset
value per
share | | | Net
investment
income | | | Net realized
and unrealized
gains (losses)
on investments | | | Distributions
from net
investment
income | | | Ending
net asset
value per
share | |
Class A | | | | | | | | | | | | | | | | | | | | |
Year ended May 31, 20163 | | $ | 10.00 | | | | 0.06 | | | | (0.15 | ) | | | (0.06 | ) | | $ | 9.85 | |
Class C | | | | | | | | | | | | | | | | | | | | |
Year ended May 31, 20163 | | $ | 10.00 | | | | 0.02 | | | | (0.15 | ) | | | (0.05 | ) | | $ | 9.82 | |
Class R | | | | | | | | | | | | | | | | | | | | |
Year ended May 31, 20163 | | $ | 10.00 | | | | 0.05 | | | | (0.15 | ) | | | (0.06 | ) | | $ | 9.84 | |
Class R4 | | | | | | | | | | | | | | | | | | | | |
Year ended May 31, 20163 | | $ | 10.00 | | | | 0.07 | | | | (0.15 | ) | | | (0.06 | ) | | $ | 9.86 | |
Class R6 | | | | | | | | | | | | | | | | | | | | |
Year ended May 31, 20163 | | $ | 10.00 | | | | 0.08 | | | | (0.14 | ) | | | (0.07 | ) | | $ | 9.87 | |
| 1 | Ratios do not reflect net expenses allocated from the affiliated Master Portfolios. Including annualized net expenses allocated from the affiliated Master Portfolios, the expense ratios would be increased by the following amounts: |
| | | | |
| | | Year ended
May 31, 20163 | |
Class A | | | 0.10 | % |
Class C | | | 0.10 | % |
Class R | | | 0.11 | % |
Class R4 | | | 0.10 | % |
Class R6 | | | 0.11 | % |
| 2 | Total return calculations do not include any sales charges. Returns for periods of less than one year are not annualized. |
| 3 | For the period from November 30, 2015 (commencement of class operations) to May 31, 2016 |
The accompanying notes are an integral part of these financial statements.
| | | | | | |
| Financial highlights | | Wells Fargo Dynamic Target Date Funds | | | 79 | |
| | | | | | | | | | | | | | | | | | | | | | |
| Ratio to average net assets (annualized) | | | Total
return2 | | | Portfolio
turnover
rate | | | Net assets at
end of period
(000s omitted) | |
Net investment
income | | | Gross
expenses1 | | | Net
expenses1 | | | | |
| | | | | | | | | | | | | | | | | | | | | | |
| | 1.22 | % | | | 5.33 | % | | | 0.53 | % | | | (0.90 | )% | | | 15 | % | | $ | 157 | |
| | | | | | | | | | | | | | | | | | | | | | |
| | 0.47 | % | | | 6.07 | % | | | 1.30 | % | | | (1.25 | )% | | | 15 | % | | $ | 99 | |
| | | | | | | | | | | | | | | | | | | | | | |
| | 0.99 | % | | | 5.58 | % | | | 0.80 | % | | | (1.00 | )% | | | 15 | % | | $ | 99 | |
| | | | | | | | | | | | | | | | | | | | | | |
| | 1.53 | % | | | 5.04 | % | | | 0.24 | % | | | (0.76 | )% | | | 15 | % | | $ | 99 | |
| | | | | | | | | | | | | | | | | | | | | | |
| | 1.69 | % | | | 4.90 | % | | | 0.09 | % | | | (0.64 | )% | | | 15 | % | | $ | 4,571 | |
The accompanying notes are an integral part of these financial statements.
| | | | |
| 80 | | Wells Fargo Dynamic Target Date Funds | | Financial highlights |
| | | | | | | | | | | | | | | | | | | | |
| Dynamic Target 2045 Fund | | Beginning
net asset
value per
share | | | Net
investment
income | | | Net realized
and unrealized
gains (losses)
on investments | | | Distributions
from net
investment
income | | | Ending
net asset
value per
share | |
Class A | | | | | | | | | | | | | | | | | | | | |
Year ended May 31, 20163 | | $ | 10.00 | | | | 0.06 | | | | (0.14 | ) | | | (0.06 | ) | | $ | 9.86 | |
Class C | | | | | | | | | | | | | | | | | | | | |
Year ended May 31, 20163 | | $ | 10.00 | | | | 0.02 | | | | (0.14 | ) | | | (0.05 | ) | | $ | 9.83 | |
Class R | | | | | | | | | | | | | | | | | | | | |
Year ended May 31, 20163 | | $ | 10.00 | | | | 0.05 | | | | (0.14 | ) | | | (0.06 | ) | | $ | 9.85 | |
Class R4 | | | | | | | | | | | | | | | | | | | | |
Year ended May 31, 20163 | | $ | 10.00 | | | | 0.07 | | | | (0.13 | ) | | | (0.06 | ) | | $ | 9.88 | |
Class R6 | | | | | | | | | | | | | | | | | | | | |
Year ended May 31, 20163 | | $ | 10.00 | | | | 0.08 | | | | (0.13 | ) | | | (0.07 | ) | | $ | 9.88 | |
| 1 | Ratios do not reflect net expenses allocated from the affiliated Master Portfolios. Including annualized net expenses allocated from the affiliated Master Portfolios, the expense ratios would be increased by the following amounts: |
| | | | |
| | | Year ended
May 31, 20163 | |
Class A | | | 0.10 | % |
Class C | | | 0.10 | % |
Class R | | | 0.11 | % |
Class R4 | | | 0.10 | % |
Class R6 | | | 0.11 | % |
| 2 | Total return calculations do not include any sales charges. Returns for periods of less than one year are not annualized. |
| 3 | For the period from November 30, 2015 (commencement of class operations) to May 31, 2016 |
The accompanying notes are an integral part of these financial statements.
| | | | | | |
| Financial highlights | | Wells Fargo Dynamic Target Date Funds | | | 81 | |
| | | | | | | | | | | | | | | | | | | | | | |
| Ratio to average net assets (annualized) | | | Total
return2 | | | Portfolio
turnover
rate | | | Net assets at
end of period
(000s omitted) | |
Net investment
income | | | Gross
expenses1 | | | Net
expenses1 | | | | |
| | | | | | | | | | | | | | | | | | | | | | |
| | 1.23 | % | | | 5.36 | % | | | 0.53 | % | | | (0.79 | )% | | | 14 | % | | $ | 121 | |
| | | | | | | | | | | | | | | | | | | | | | |
| | 0.48 | % | | | 6.10 | % | | | 1.30 | % | | | (1.15 | )% | | | 14 | % | | $ | 99 | |
| | | | | | | | | | | | | | | | | | | | | | |
| | 0.99 | % | | | 5.60 | % | | | 0.80 | % | | | (0.90 | )% | | | 14 | % | | $ | 99 | |
| | | | | | | | | | | | | | | | | | | | | | |
| | 1.54 | % | | | 5.07 | % | | | 0.24 | % | | | (0.55 | )% | | | 14 | % | | $ | 99 | |
| | | | | | | | | | | | | | | | | | | | | | |
| | 1.69 | % | | | 4.92 | % | | | 0.09 | % | | | (0.53 | )% | | | 14 | % | | $ | 4,576 | |
The accompanying notes are an integral part of these financial statements.
| | | | |
| 82 | | Wells Fargo Dynamic Target Date Funds | | Financial highlights |
| | | | | | | | | | | | | | | | | | | | |
| Dynamic Target 2050 Fund | | Beginning
net asset
value per
share | | | Net
investment
income | | | Net realized
and unrealized
gains (losses)
on investments | | | Distributions
from net
investment
income | | | Ending
net asset
value per
share | |
Class A | | | | | | | | | | | | | | | | | | | | |
Year ended May 31, 20163 | | $ | 10.00 | | | | 0.06 | | | | (0.14 | ) | | | (0.06 | ) | | $ | 9.86 | |
Class C | | | | | | | | | | | | | | | | | | | | |
Year ended May 31, 20163 | | $ | 10.00 | | | | 0.02 | | | | (0.14 | ) | | | (0.05 | ) | | $ | 9.83 | |
Class R | | | | | | | | | | | | | | | | | | | | |
Year ended May 31, 20163 | | $ | 10.00 | | | | 0.05 | | | | (0.14 | ) | | | (0.06 | ) | | $ | 9.85 | |
Class R4 | | | | | | | | | | | | | | | | | | | | |
Year ended May 31, 20163 | | $ | 10.00 | | | | 0.07 | | | | (0.13 | ) | | | (0.06 | ) | | $ | 9.88 | |
Class R6 | | | | | | | | | | | | | | | | | | | | |
Year ended May 31, 20163 | | $ | 10.00 | | | | 0.08 | | | | (0.13 | ) | | | (0.07 | ) | | $ | 9.88 | |
| 1 | Ratios do not reflect net expenses allocated from the affiliated Master Portfolios. Including annualized net expenses allocated from the affiliated Master Portfolios, the expense ratios would be increased by the following amounts: |
| | | | |
| | | Year ended
May 31, 20163 | |
Class A | | | 0.10 | % |
Class C | | | 0.10 | % |
Class R | | | 0.11 | % |
Class R4 | | | 0.10 | % |
Class R6 | | | 0.11 | % |
| 2 | Total return calculations do not include any sales charges. Returns for periods of less than one year are not annualized. |
| 3 | For the period from November 30, 2015 (commencement of class operations) to May 31, 2016 |
The accompanying notes are an integral part of these financial statements.
| | | | | | |
| Financial highlights | | Wells Fargo Dynamic Target Date Funds | | | 83 | |
| | | | | | | | | | | | | | | | | | | | | | |
| Ratio to average net assets (annualized) | | | Total
return2 | | | Portfolio
turnover
rate | | | Net assets at
end of period
(000s omitted) | |
Net investment
income | | | Gross
expenses1 | | | Net
expenses1 | | | | |
| | | | | | | | | | | | | | | | | | | | | | |
| | 1.22 | % | | | 5.25 | % | | | 0.53 | % | | | (0.78 | )% | | | 14 | % | | $ | 108 | |
| | | | | | | | | | | | | | | | | | | | | | |
| | 0.48 | % | | | 6.00 | % | | | 1.30 | % | | | (1.15 | )% | | | 14 | % | | $ | 99 | |
| | | | | | | | | | | | | | | | | | | | | | |
| | 0.98 | % | | | 5.51 | % | | | 0.80 | % | | | (0.90 | )% | | | 14 | % | | $ | 99 | |
| | | | | | | | | | | | | | | | | | | | | | |
| | 1.53 | % | | | 4.97 | % | | | 0.24 | % | | | (0.55 | )% | | | 14 | % | | $ | 99 | |
| | | | | | | | | | | | | | | | | | | | | | |
| | 1.69 | % | | | 4.82 | % | | | 0.09 | % | | | (0.53 | )% | | | 14 | % | | $ | 4,576 | |
The accompanying notes are an integral part of these financial statements.
| | | | |
| 84 | | Wells Fargo Dynamic Target Date Funds | | Financial highlights |
| | | | | | | | | | | | | | | | | | | | |
| Dynamic Target 2055 Fund | | Beginning
net asset
value per
share | | | Net
investment
income | | | Net realized
and unrealized
gains (losses)
on investments | | | Distributions
from net
investment
income | | | Ending
net asset
value per
share | |
Class A | | | | | | | | | | | | | | | | | | | | |
Year ended May 31, 20163 | | $ | 10.00 | | | | 0.06 | | | | (0.13 | ) | | | (0.06 | ) | | $ | 9.87 | |
Class C | | | | | | | | | | | | | | | | | | | | |
Year ended May 31, 20163 | | $ | 10.00 | | | | 0.02 | | | | (0.13 | ) | | | (0.05 | ) | | $ | 9.84 | |
Class R | | | | | | | | | | | | | | | | | | | | |
Year ended May 31, 20163 | | $ | 10.00 | | | | 0.05 | | | | (0.13 | ) | | | (0.06 | ) | | $ | 9.86 | |
Class R4 | | | | | | | | | | | | | | | | | | | | |
Year ended May 31, 20163 | | $ | 10.00 | | | | 0.07 | | | | (0.13 | ) | | | (0.06 | ) | | $ | 9.88 | |
Class R6 | | | | | | | | | | | | | | | | | | | | |
Year ended May 31, 20163 | | $ | 10.00 | | | | 0.08 | | | | (0.12 | ) | | | (0.07 | ) | | $ | 9.89 | |
| 1 | Ratios do not reflect net expenses allocated from the affiliated Master Portfolios. Including annualized net expenses allocated from the affiliated Master Portfolios, the expense ratios would be increased by the following amounts: |
| | | | |
| | | Year ended
May 31, 20163 | |
Class A | | | 0.10 | % |
Class C | | | 0.10 | % |
Class R | | | 0.11 | % |
Class R4 | | | 0.10 | % |
Class R6 | | | 0.11 | % |
| 2 | Total return calculations do not include any sales charges. Returns for periods of less than one year are not annualized. |
| 3 | For the period from November 30, 2015 (commencement of class operations) to May 31, 2016 |
The accompanying notes are an integral part of these financial statements.
| | | | | | |
| Financial highlights | | Wells Fargo Dynamic Target Date Funds | | | 85 | |
| | | | | | | | | | | | | | | | | | | | | | |
| Ratio to average net assets (annualized) | | | Total
return2 | | | Portfolio
turnover
rate | | | Net assets at
end of period
(000s omitted) | |
Net investment
income | | | Gross
expenses1 | | | Net
expenses1 | | | | |
| | | | | | | | | | | | | | | | | | | | | | |
| | 1.21 | % | | | 5.23 | % | | | 0.54 | % | | | (0.68 | )% | | | 14 | % | | $ | 103 | |
| | | | | | | | | | | | | | | | | | | | | | |
| | 0.47 | % | | | 5.98 | % | | | 1.30 | % | | | (1.05 | )% | | | 14 | % | | $ | 99 | |
| | | | | | | | | | | | | | | | | | | | | | |
| | 0.98 | % | | | 5.48 | % | | | 0.80 | % | | | (0.80 | )% | | | 14 | % | | $ | 99 | |
| | | | | | | | | | | | | | | | | | | | | | |
| | 1.53 | % | | | 4.95 | % | | | 0.24 | % | | | (0.55 | )% | | | 14 | % | | $ | 99 | |
| | | | | | | | | | | | | | | | | | | | | | |
| | 1.69 | % | | | 4.80 | % | | | 0.09 | % | | | (0.43 | )% | | | 14 | % | | $ | 4,579 | |
The accompanying notes are an integral part of these financial statements.
| | | | |
| 86 | | Wells Fargo Dynamic Target Date Funds | | Financial highlights |
| | | | | | | | | | | | | | | | | | | | |
| Dynamic Target 2060 Fund | | Beginning
net asset
value per
share | | | Net
investment
income | | | Net realized
and unrealized
gains (losses)
on investments | | | Distributions
from net
investment
income | | | Ending
net asset
value per
share | |
Class A | | | | | | | | | | | | | | | | | | | | |
Year ended May 31, 20163 | | $ | 10.00 | | | | 0.06 | | | | (0.12 | ) | | | (0.06 | ) | | $ | 9.88 | |
Class C | | | | | | | | | | | | | | | | | | | | |
Year ended May 31, 20163 | | $ | 10.00 | | | | 0.02 | | | | (0.12 | ) | | | (0.05 | ) | | $ | 9.85 | |
Class R | | | | | | | | | | | | | | | | | | | | |
Year ended May 31, 20163 | | $ | 10.00 | | | | 0.05 | | | | (0.12 | ) | | | (0.06 | ) | | $ | 9.87 | |
Class R4 | | | | | | | | | | | | | | | | | | | | |
Year ended May 31, 20163 | | $ | 10.00 | | | | 0.07 | | | | (0.12 | ) | | | (0.06 | ) | | $ | 9.89 | |
Class R6 | | | | | | | | | | | | | | | | | | | | |
Year ended May 31, 20163 | | $ | 10.00 | | | | 0.08 | | | | (0.11 | ) | | | (0.07 | ) | | $ | 9.90 | |
| 1 | Ratios do not reflect net expenses allocated from the affiliated Master Portfolios. Including annualized net expenses allocated from the affiliated Master Portfolios, the expense ratios would be increased by the following amounts: |
| | | | |
| | | Year ended
May 31, 20163 | |
Class A | | | 0.10 | % |
Class C | | | 0.10 | % |
Class R | | | 0.11 | % |
Class R4 | | | 0.10 | % |
Class R6 | | | 0.11 | % |
| 2 | Total return calculations do not include any sales charges. Returns for periods of less than one year are not annualized. |
| 3 | For the period from November 30, 2015 (commencement of class operations) to May 31, 2016 |
The accompanying notes are an integral part of these financial statements.
| | | | | | |
| Financial highlights | | Wells Fargo Dynamic Target Date Funds | | | 87 | |
| | | | | | | | | | | | | | | | | | | | | | |
| Ratio to average net assets (annualized) | | | Total
return2 | | | Portfolio
turnover
rate | | | Net assets at
end of period
(000s omitted) | |
Net investment
income | | | Gross
expenses1 | | | Net
expenses1 | | | | |
| | | | | | | | | | | | | | | | | | | | | | |
| | 1.22 | % | | | 5.24 | % | | | 0.55 | % | | | (0.58 | )% | | | 14 | % | | $ | 101 | |
| | | | | | | | | | | | | | | | | | | | | | |
| | 0.48 | % | | | 5.99 | % | | | 1.30 | % | | | (0.94 | )% | | | 14 | % | | $ | 99 | |
| | | | | | | | | | | | | | | | | | | | | | |
| | 0.98 | % | | | 5.50 | % | | | 0.80 | % | | | (0.70 | )% | | | 14 | % | | $ | 99 | |
| | | | | | | | | | | | | | | | | | | | | | |
| | 1.53 | % | | | 4.96 | % | | | 0.24 | % | | | (0.45 | )% | | | 14 | % | | $ | 100 | |
| | | | | | | | | | | | | | | | | | | | | | |
| | 1.69 | % | | | 4.81 | % | | | 0.09 | % | | | (0.33 | )% | | | 14 | % | | $ | 4,584 | |
The accompanying notes are an integral part of these financial statements.
| | | | |
| 88 | | Wells Fargo Dynamic Target Date Funds | | Notes to financial statements |
1. ORGANIZATION
Wells Fargo Funds Trust (the “Trust”), a Delaware statutory trust organized on March 10, 1999, is an open-end management investment company registered under the Investment Company Act of 1940, as amended (the “1940 Act”). As an investment company, the Trust follows the accounting and reporting guidance in Financial Accounting Standards Board (“FASB”) Accounting Standards Codification Topic 946, Financial Services – Investment Companies. These financial statements report on the following funds: Wells Fargo Dynamic Target Today Fund (“Dynamic Target Today Fund”), Wells Fargo Dynamic Target 2015 Fund (“Dynamic Target 2015 Fund”), Wells Fargo Dynamic Target 2020 Fund (“Dynamic Target 2020 Fund”), Wells Fargo Dynamic Target 2025 Fund (“Dynamic Target 2025 Fund”), Wells Fargo Dynamic Target 2030 Fund (“Dynamic Target 2030 Fund”), Wells Fargo Dynamic Target 2035 Fund (“Dynamic Target 2035 Fund”), Wells Fargo Dynamic Target 2040 Fund (“Dynamic Target 2040 Fund”), Wells Fargo Dynamic Target 2045 Fund (“Dynamic Target 2045 Fund”), Wells Fargo Dynamic Target 2050 Fund (“Dynamic Target 2050 Fund”), Wells Fargo Dynamic Target 2055 Fund (“Dynamic Target 2055 Fund”) and Wells Fargo Dynamic Target 2060 Fund (“Dynamic Target 2060 Fund”) (each, a “Fund”, collectively, the “Funds”). Each Fund is a diversified series of the Trust.
Each Fund is a fund-of-funds that primarily invests in various affiliated mutual funds, unaffiliated mutual funds and exchange-traded funds (collectively, the “Underlying Funds”) to pursue its investment objective. The Underlying Funds incur separate expenses in seeking to achieve their investment objectives. The investment in affiliated mutual funds may also include investments in one or more separate diversified portfolios (each, an “affiliated Master Portfolio”, collectively, the “affiliated Master Portfolios”) of Wells Fargo Master Trust, a registered open-end management investment company. Each affiliated Master Portfolio directly acquires portfolio securities, and a Fund investing in an affiliated Master Portfolio acquires an indirect interest in those securities. Each Fund accounts for its investment in an affiliated Master Portfolios as partnership investments and records on a daily basis its share of the affiliated Master Portfolio’s income, expense and realized and unrealized gains and losses. The financial statements and financial highlights for the Underlying Funds are presented in separate financial statements and may be obtained by contacting Investor Services for the Wells Fargo Funds or by contacting the servicing agent of the unaffiliated mutual funds.
2. SIGNIFICANT ACCOUNTING POLICIES
The following significant accounting policies, which are consistently followed in the preparation of the financial statements of each Fund, are in conformity with U.S. generally accepted accounting principles which require management to make estimates and assumptions that affect the reported amounts of assets and liabilities, disclosure of contingent assets and liabilities at the date of the financial statements, and the reported amounts of revenues and expenses during the reporting period. Actual results could differ from those estimates.
Securities valuation
All investments are valued each business day as of the close of regular trading on the New York Stock Exchange (generally 4 p.m. Eastern Time), although a Fund may deviate from this calculation time under unusual or unexpected circumstances.
Investments in mutual funds are valued at net asset per share as reported by the Underlying Funds as of the close of the regular trading on the New York Stock Exchange on each day the exchange is open for trading. Investments in affiliated Master Portfolios are valued daily based on each Fund’s proportionate share of each affiliated Master Portfolio’s net assets, which are also valued daily.
Equity securities and futures that are listed on a foreign or domestic exchange or market are valued at the official closing price or, if none, the last sales price. If no sale occurs on the principal exchange or market that day, the prior day’s price will be deemed “stale” and a fair value price will be determined in accordance with each Fund’s Valuation Procedures.
Debt securities are valued at the evaluated bid price provided by an independent pricing service or, if a reliable price is not available, the quoted bid price from an independent broker-dealer.
Investments which are not valued using any of the methods discussed above are valued at their fair value, as determined in good faith by the Board of Trustees of the Funds. The Board of Trustees has established a Valuation Committee comprised of the Trustees and has delegated to it the authority to take any actions regarding the valuation of portfolio securities that the Valuation Committee deems necessary or appropriate, including determining the fair value of portfolio securities, unless the determination has been delegated to the Management Valuation Team of Wells Fargo Funds Management, LLC (“Funds Management”). The Board of Trustees retains the authority to make or ratify any valuation decisions or approve any changes to the Valuation Procedures as it deems appropriate. On a quarterly basis, the Board of Trustees receives reports on any valuation actions taken by the Valuation Committee or the Management Valuation Team which may include items for ratification.
| | | | | | |
| Notes to financial statements | | Wells Fargo Dynamic Target Date Funds | | | 89 | |
Valuations of fair valued securities are compared to the next actual sales price when available, or other appropriate market values, to assess the continued appropriateness of the fair valuation methodologies used. These securities are fair valued on a day-to-day basis, taking into consideration changes to appropriate market information and any significant changes to the inputs considered in the valuation process until there is a readily available price provided on an exchange or by an independent pricing service. Valuations received from an independent pricing service or independent broker-dealer quotes are periodically validated by comparisons to most recent trades and valuations provided by other independent pricing services in addition to the review of prices by the manager and/or subadviser. Unobservable inputs used in determining fair valuations are identified based on the type of security, taking into consideration factors utilized by market participants in valuing the investment, knowledge about the issuer and the current market environment.
Futures contracts
Each Fund is subject to interest rate risk and equity price risk in the normal course of pursuing its investment objectives. The Fund may buy and sell futures contracts in order to effect tactical allocation changes in the Fund. The primary risks associated with the use of futures contracts are the imperfect correlation between changes in market values of securities held by the Fund and the prices of futures contracts, and the possibility of an illiquid market.
The aggregate principal amounts of the contracts are not recorded in the financial statements. Fluctuations in the value of the contracts are recorded in the Statements of Assets and Liabilities as an asset or liability and in the Statements of Operations as unrealized gains or losses until the contracts are closed, at which point they are recorded as net realized gains or losses on futures contracts. With futures contracts, there is minimal counterparty risk to the Fund since futures are exchange traded and the exchange’s clearinghouse, as counterparty to all exchange traded futures, guarantees the futures against default.
Security transactions and income recognition
Securities transactions are recorded on a trade date basis. Realized gains or losses are recorded on the basis of identified cost.
Income dividends and capital gain distributions from Underlying Funds are recorded on the ex-dividend date. Capital gain distributions from Underlying Funds are treated as realized gains.
Interest income is accrued daily and bond discounts are accreted and premiums are amortized daily based on the effective interest method. To the extent debt obligations are placed on non-accrual status, any related interest income may be reduced by writing off interest receivables when the collection of all or a portion of interest has become doubtful based on consistently applied procedures. If the issuer subsequently resumes interest payments or when the collectability of interest is reasonably assured, the debt obligation is removed from non-accrual status.
Each Fund records on a daily basis its proportionate share of each affiliated Master Portfolio’s interest and dividend income, in addition to expenses and realized and unrealized gains and losses.
Distributions to shareholders
Distributions to shareholders from net investment income and net realized gains, if any, are recorded on the ex-dividend date. Such distributions are determined in conformity with federal income tax regulations, which may differ in amount or character from net investment income and realized gains recognized for purposes of U.S. generally accepted accounting principles.
Federal and other taxes
Each Fund is treated as a separate entity for federal income tax purposes. Each Fund intends to qualify as a regulated investment company by distributing substantially all of its investment company taxable income and any net realized capital gains (after reduction for capital loss carryforwards) sufficient to relieve it from all, or substantially all, federal income taxes. Accordingly, no provision for federal income taxes was required.
Each Fund’s income and federal excise tax returns and all financial records supporting the returns for the fiscal year since commencement of operations will be subject to examination by the federal and Delaware revenue authorities. The Fund is not subject to examination by federal and state tax authorities for tax years before 2015, the year the Fund commenced operations.
Reclassifications are made to each Fund’s capital accounts for permanent tax differences to reflect income and gains available for distribution (or available capital loss carryforwards) under federal income tax regulations. U.S. generally accepted accounting principles require that certain components of net assets be adjusted to reflect permanent differences between financial and tax reporting. These reclassifications have no effect on net assets or net asset values
| | | | |
| 90 | | Wells Fargo Dynamic Target Date Funds | | Notes to financial statements |
per share. At May 31, 2016, as a result of permanent book-to-tax differences, the following reclassification adjustments were made on the Statements of Assets and Liabilities:
| | | | | | | | | | | | |
| | | Paid-in capital | | | Undistributed net investment income | | | Accumulated net realized gains on investments | |
Dynamic Target Today Fund | | $ | 55 | | | $ | 6,015 | | | $ | (6,070 | ) |
Dynamic Target 2015 Fund | | | 81 | | | | 7,691 | | | | (7,772 | ) |
Dynamic Target 2020 Fund | | | 96 | | | | 8,745 | | | | (8,841 | ) |
Dynamic Target 2025 Fund | | | 110 | | | | 9,697 | | | | (9,807 | ) |
Dynamic Target 2030 Fund | | | 125 | | | | 10,653 | | | | (10,778 | ) |
Dynamic Target 2035 Fund | | | 134 | | | | 11,294 | | | | (11,428 | ) |
Dynamic Target 2040 Fund | | | 141 | | | | 11,713 | | | | (11,854 | ) |
Dynamic Target 2045 Fund | | | 142 | | | | 11,821 | | | | (11,963 | ) |
Dynamic Target 2050 Fund | | | 142 | | | | 11,820 | | | | (11,962 | ) |
Dynamic Target 2055 Fund | | | 142 | | | | 11,820 | | | | (11,962 | ) |
Dynamic Target 2060 Fund | | | 142 | | | | 11,818 | | | | (11,960 | ) |
Class allocations
The separate classes of shares offered by each Fund differ principally in applicable sales charges, distribution, shareholder servicing, and administration fees. Class specific expenses are charged directly to that share class. Investment income, common expenses, and realized and unrealized gains (losses) on investments are allocated daily to each class of shares based on the relative proportion of net assets of each class.
3. FAIR VALUATION MEASUREMENTS
Fair value measurements of investments are determined within a framework that has established a fair value hierarchy based upon the various data inputs utilized in determining the value of each Fund’s investments. The three-level hierarchy gives the highest priority to unadjusted quoted prices in active markets for identical assets or liabilities (Level 1) and the lowest priority to significant unobservable inputs (Level 3). Each Fund’s investments are classified within the fair value hierarchy based on the lowest level of input that is significant to the fair value measurement. The inputs are summarized into three broad levels as follows:
| n | | Level 1 – quoted prices in active markets for identical securities |
| n | | Level 2 – other significant observable inputs (including quoted prices for similar securities, interest rates, prepayment speeds, credit risk, use of amortized cost, etc.) |
| n | | Level 3 – significant unobservable inputs (including the Fund’s own assumptions in determining the fair value of investments) |
The inputs or methodologies used for valuing investments in securities are not necessarily an indication of the risk associated with investing in those securities.
| | | | | | |
| Notes to financial statements | | Wells Fargo Dynamic Target Date Funds | | | 91 | |
The following is a summary of the inputs used in valuing each Fund’s assets and liabilities as of May 31, 2016:
| | | | | | | | | | | | | | | | |
| Dynamic Target Today Fund | | Quoted prices
(Level 1) | | | Other significant
observable inputs
(Level 2) | | | Significant
unobservable inputs
(Level 3) | | | Total | |
Assets | | | | | | | | | |
Investments in: | | | | | | | | | |
| | | | |
Exchange-traded funds | | $ | 1,452,088 | | | $ | 0 | | | $ | 0 | | | $ | 1,452,088 | |
| | | | |
Investment companies | | | 2,353,377 | | | | 0 | | | | 0 | | | | 2,353,377 | |
| | | | |
Short-term investments | | | | | | | | | | | | | | | | |
U.S. Treasury securities | | | 3,000 | | | | 0 | | | | 0 | | | | 3,000 | |
Investments measured at net asset value* | | | | | | | | | | | | | | | 1,202,910 | |
| | | | |
| | | 3,808,465 | | | | 0 | | | | 0 | | | | 5,011,375 | |
Futures contracts | | | 31 | | | | 0 | | | | 0 | | | | 31 | |
Total assets | | $ | 3,808,496 | | | $ | 0 | | | $ | 0 | | | $ | 5,011,406 | |
| * | Investments that are measured at fair value using the net asset value per share (or its equivalent) as a practical expedient have not been categorized in the fair value hierarchy. At May 31, 2016, the aggregated affiliated Master Portfolios measured at fair value using the net asset value per share (or its equivalent) were valued at $1,202,910. Each affiliated Master Portfolio does not have a redemption period notice, can be redeemed daily and does not have any unfunded commitments. |
| | | | | | | | | | | | | | | | |
| Dynamic Target 2015 Fund | | Quoted prices
(Level 1) | | | Other significant
observable inputs
(Level 2) | | | Significant
unobservable inputs
(Level 3) | | | Total | |
Assets | | | | | | | | | |
Investments in: | | | | | | | | | | | | | | | | |
| | | | |
Exchange-traded funds | | $ | 1,567,222 | | | $ | 0 | | | $ | 0 | | | $ | 1,567,222 | |
| | | | |
Investment companies | | | 2,422,049 | | | | 0 | | | | 0 | | | | 2,422,049 | |
| | | | |
Short-term investments | | | | | | | | | | | | | | | | |
U.S. Treasury securities | | | 3,000 | | | | 0 | | | | 0 | | | | 3,000 | |
Investments measured at net asset value* | | | | | | | | | | | | | | | 1,090,974 | |
| | | | |
| | | 3,992,271 | | | | 0 | | | | 0 | | | | 5,083,245 | |
Futures contracts | | | 31 | | | | | | | | 0 | | | | 31 | |
Total assets | | $ | 3,992,302 | | | $ | 0 | | | $ | 0 | | | $ | 5,083,276 | |
| * | Investments that are measured at fair value using the net asset value per share (or its equivalent) as a practical expedient have not been categorized in the fair value hierarchy. At May 31, 2016, the aggregated affiliated Master Portfolios measured at fair value using the net asset value per share (or its equivalent) were valued at $1,090,974. Each affiliated Master Portfolio does not have a redemption period notice, can be redeemed daily and does not have any unfunded commitments. |
| | | | | | | | | | | | | | | | |
| Dynamic Target 2020 Fund | | Quoted prices
(Level 1) | | | Other significant
observable inputs
(Level 2) | | | Significant
unobservable inputs
(Level 3) | | | Total | |
Assets | | | | | | | | | |
Investments in: | | | | | | | | | | | | | | | | |
| | | | |
Exchange-traded funds | | $ | 1,585,609 | | | $ | 0 | | | $ | 0 | | | $ | 1,585,609 | |
| | | | |
Investment companies | | | 2,414,629 | | | | 0 | | | | 0 | | | | 2,414,629 | |
| | | | |
Short-term investments | | | | | | | | | | | | | | | | |
U.S. Treasury securities | | | 3,000 | | | | 0 | | | | 0 | | | | 3,000 | |
Investments measured at net asset value* | | | | | | | | | | | | | | | 999,894 | |
| | | | |
| | | 4,003,238 | | | | 0 | | | | 0 | | | | 5,003,132 | |
Futures contracts | | | 31 | | | | 0 | | | | 0 | | | | 31 | |
Total assets | | $ | 4,003,269 | | | $ | 0 | | | $ | 0 | | | $ | 5,003,163 | |
| * | Investments that are measured at fair value using the net asset value per share (or its equivalent) as a practical expedient have not been categorized in the fair value hierarchy. At May 31, 2016, the aggregated affiliated Master Portfolios measured at fair value using the net asset value per share (or its equivalent) were valued at $999,894. Each affiliated Master Portfolio does not have a redemption period notice, can be redeemed daily and does not have any unfunded commitments. |
| | | | |
| 92 | | Wells Fargo Dynamic Target Date Funds | | Notes to financial statements |
| | | | | | | | | | | | | | | | |
| Dynamic Target 2025 Fund | | Quoted prices
(Level 1) | | | Other significant
observable inputs
(Level 2) | | | Significant
unobservable inputs
(Level 3) | | | Total | |
Assets | | | | | | | | | | | | | | | | |
Investments in: | | | | | | | | | | | | | | | | |
| | | | |
Exchange-traded funds | | $ | 1,636,333 | | | $ | 0 | | | $ | 0 | | | $ | 1,636,333 | |
| | | | |
Investment companies | | | 2,466,460 | | | | 0 | | | | 0 | | | | 2,466,460 | |
| | | | |
Short-term investments | | | | | | | | | | | | | | | | |
U.S. Treasury securities | | | 3,000 | | | | 0 | | | | 0 | | | | 3,000 | |
Investments measured at net asset value* | | | | | | | | | | | | | | | 941,930 | |
| | | | |
| | | 4,105,793 | | | | 0 | | | | 0 | | | | 5,047,723 | |
Futures contracts | | | 31 | | | | 0 | | | | 0 | | | | 31 | |
Total assets | | $ | 4,105,824 | | | $ | 0 | | | $ | 0 | | | $ | 5,047,754 | |
| * | Investments that are measured at fair value using the net asset value per share (or its equivalent) as a practical expedient have not been categorized in the fair value hierarchy. At May 31, 2016, the aggregated affiliated Master Portfolios measured at fair value using the net asset value per share (or its equivalent) were valued at $941,930. Each affiliated Master Portfolio does not have a redemption period notice, can be redeemed daily and does not have any unfunded commitments. |
| | | | | | | | | | | | | | | | |
| Dynamic Target 2030 Fund | | Quoted prices
(Level 1) | | | Other significant
observable inputs
(Level 2) | | | Significant
unobservable inputs
(Level 3) | | | Total | |
Assets | | | | | | | | | | | | | | | | |
Investments in: | | | | | | | | | | | | | | | | |
| | | | |
Exchange-traded funds | | $ | 1,662,470 | | | $ | 0 | | | $ | 0 | | | $ | 1,662,470 | |
| | | | |
Investment companies | | | 2,479,933 | | | | 0 | | | | 0 | | | | 2,479,933 | |
| | | | |
Short-term investments | | | | | | | | | | | | | | | | |
U.S. Treasury securities | | | 8,000 | | | | 0 | | | | 0 | | | | 8,000 | |
Investments measured at net asset value* | | | | | | | | | | | | | | | 869,784 | |
| | | | |
| | | 4,150,403 | | | | 0 | | | | 0 | | | | 5,020,187 | |
Futures contracts | | | 31 | | | | 0 | | | | 0 | | | | 31 | |
Total assets | | $ | 4,150,434 | | | $ | 0 | | | $ | 0 | | | $ | 5,020,218 | |
| * | Investments that are measured at fair value using the net asset value per share (or its equivalent) as a practical expedient have not been categorized in the fair value hierarchy. At May 31, 2016, the aggregated affiliated Master Portfolios measured at fair value using the net asset value per share (or its equivalent) were valued at $869,784. Each affiliated Master Portfolio does not have a redemption period notice, can be redeemed daily and does not have any unfunded commitments. |
| | | | | | | | | | | | | | | | |
| Dynamic Target 2035 Fund | | Quoted prices
(Level 1) | | | Other significant
observable inputs
(Level 2) | | | Significant
unobservable inputs
(Level 3) | | | Total | |
Assets | | | | | | | | | | | | | | | | |
Investments in: | | | | | | | | | | | | | | | | |
| | | | |
Exchange-traded funds | | $ | 1,650,176 | | | $ | 0 | | | $ | 0 | | | $ | 1,650,176 | |
| | | | |
Investment companies | | | 2,472,273 | | | | 0 | | | | 0 | | | | 2,472,273 | |
| | | | |
Short-term investments | | | | | | | | | | | | | | | | |
U.S. Treasury securities | | | 8,000 | | | | 0 | | | | 0 | | | | 8,000 | |
Investments measured at net asset value* | | | | | | | | | | | | | | | 817,799 | |
| | | | |
| | | 4,130,449 | | | | 0 | | | | 0 | | | | 4,948,248 | |
Futures contracts | | | 31 | | | | 0 | | | | 0 | | | | 31 | |
Total assets | | $ | 4,130,480 | | | $ | 0 | | | $ | 0 | | | $ | 4,948,279 | |
| * | Investments that are measured at fair value using the net asset value per share (or its equivalent) as a practical expedient have not been categorized in the fair value hierarchy. At May 31, 2016, the aggregated affiliated Master Portfolios measured at fair value using the net asset value per share (or its equivalent) were valued at $817,799. Each affiliated Master Portfolio does not have a redemption period notice, can be redeemed daily and does not have any unfunded commitments. |
| | | | | | |
| Notes to financial statements | | Wells Fargo Dynamic Target Date Funds | | | 93 | |
| | | | | | | | | | | | | | | | |
| Dynamic Target 2040 Fund | | Quoted prices
(Level 1) | | | Other significant
observable inputs
(Level 2) | | | Significant
unobservable inputs
(Level 3) | | | Total | |
Assets | | | | | | | | | | | | | | | | |
Investments in: | | | | | | | | | | | | | | | | |
| | | | |
Exchange-traded funds | | $ | 1,687,407 | | | $ | 0 | | | $ | 0 | | | $ | 1,687,407 | |
| | | | |
Investment companies | | | 2,496,816 | | | | 0 | | | | 0 | | | | 2,496,816 | |
| | | | |
Short-term investments | | | | | | | | | | | | | | | | |
U.S. Treasury securities | | | 8,000 | | | | 0 | | | | 0 | | | | 8,000 | |
Investments measured at net asset value* | | | | | | | | | | | | | | | 785,815 | |
| | | | |
| | | 4,192,223 | | | | 0 | | | | 0 | | | | 4,978,038 | |
Futures contracts | | | 31 | | | | 0 | | | | 0 | | | | 31 | |
Total assets | | $ | 4,192,254 | | | $ | 0 | | | $ | 0 | | | $ | 4,978,069 | |
| * | Investments that are measured at fair value using the net asset value per share (or its equivalent) as a practical expedient have not been categorized in the fair value hierarchy. At May 31, 2016, the aggregated affiliated Master Portfolios measured at fair value using the net asset value per share (or its equivalent) were valued at $785,815. Each affiliated Master Portfolio does not have a redemption period notice, can be redeemed daily and does not have any unfunded commitments. |
| | | | | | | | | | | | | | | | |
| Dynamic Target 2045 Fund | | Quoted prices
(Level 1) | | | Other significant
observable inputs
(Level 2) | | | Significant
unobservable inputs
(Level 3) | | | Total | |
Assets | | | | | | | | | | | | | | | | |
Investments in: | | | | | | | | | | | | | | | | |
| | | | |
Exchange-traded funds | | $ | 1,691,157 | | | $ | 0 | | | $ | 0 | | | $ | 1,691,157 | |
| | | | |
Investment companies | | | 2,474,730 | | | | 0 | | | | 0 | | | | 2,474,730 | |
| | | | |
Short-term investments | | | | | | | | | | | | | | | | |
U.S. Treasury securities | | | 12,000 | | | | 0 | | | | 0 | | | | 12,000 | |
Investments measured at net asset value* | | | | | | | | | | | | | | | 769,930 | |
| | | | |
| | | 4,177,887 | | | | 0 | | | | 0 | | | | 4,947,817 | |
Futures contracts | | | 31 | | | | 0 | | | | 0 | | | | 31 | |
Total assets | | $ | 4,177,918 | | | $ | 0 | | | $ | 0 | | | $ | 4,947,848 | |
| * | Investments that are measured at fair value using the net asset value per share (or its equivalent) as a practical expedient have not been categorized in the fair value hierarchy. At May 31, 2016, the aggregated affiliated Master Portfolios measured at fair value using the net asset value per share (or its equivalent) were valued at $769,930. Each affiliated Master Portfolio does not have a redemption period notice, can be redeemed daily and does not have any unfunded commitments. |
| | | | | | | | | | | | | | | | |
| Dynamic Target 2050 Fund | | Quoted prices
(Level 1) | | | Other significant
observable inputs
(Level 2) | | | Significant
unobservable inputs
(Level 3) | | | Total | |
Assets | | | | | | | | | | | | | | | | |
Investments in: | | | | | | | | | | | | | | | | |
| | | | |
Exchange-traded funds | | $ | 1,686,508 | | | $ | 0 | | | $ | 0 | | | $ | 1,686,508 | |
| | | | |
Investment companies | | | 2,466,694 | | | | 0 | | | | 0 | | | | 2,466,694 | |
| | | | |
Short-term investments | | | | | | | | | | | | | | | | |
U.S. Treasury securities | | | 12,000 | | | | 0 | | | | 0 | | | | 12,000 | |
Investments measured at net asset value* | | | | | | | | | | | | | | | 766,706 | |
| | | | |
| | | 4,165,202 | | | | 0 | | | | 0 | | | | 4,931,908 | |
Futures contracts | | | 31 | | | | 0 | | | | 0 | | | | 31 | |
Total assets | | $ | 4,165,233 | | | $ | 0 | | | $ | 0 | | | $ | 4,931,939 | |
| * | Investments that are measured at fair value using the net asset value per share (or its equivalent) as a practical expedient have not been categorized in the fair value hierarchy. At May 31, 2016, the aggregated affiliated Master Portfolios measured at fair value using the net asset value per share (or its equivalent) were valued at $766,706. Each affiliated Master Portfolio does not have a redemption period notice, can be redeemed daily and does not have any unfunded commitments. |
| | | | |
| 94 | | Wells Fargo Dynamic Target Date Funds | | Notes to financial statements |
| | | | | | | | | | | | | | | | |
| Dynamic Target 2055 Fund | | Quoted prices
(Level 1) | | | Other significant
observable inputs
(Level 2) | | | Significant
unobservable inputs
(Level 3) | | | Total | |
Assets | | | | | | | | | | | | | | | | |
Investments in: | | | | | | | | | | | | | | | | |
| | | | |
Exchange-traded funds | | $ | 1,685,237 | | | $ | 0 | | | $ | 0 | | | $ | 1,685,237 | |
| | | | |
Investment companies | | | 2,465,032 | | | | 0 | | | | 0 | | | | 2,465,032 | |
| | | | |
Short-term investments | | | | | | | | | | | | | | | | |
U.S. Treasury securities | | | 12,000 | | | | 0 | | | | 0 | | | | 12,000 | |
Investments measured at net asset value* | | | | | | | | | | | | | | | 766,127 | |
| | | | |
| | | 4,162,269 | | | | 0 | | | | 0 | | | | 4,928,396 | |
Futures contracts | | | 31 | | | | 0 | | | | 0 | | | | 31 | |
Total assets | | $ | 4,162,300 | | | $ | 0 | | | $ | 0 | | | $ | 4,928,427 | |
| * | Investments that are measured at fair value using the net asset value per share (or its equivalent) as a practical expedient have not been categorized in the fair value hierarchy. At May 31, 2016, the aggregated affiliated Master Portfolios measured at fair value using the net asset value per share (or its equivalent) were valued at $766,127. Each affiliated Master Portfolio does not have a redemption period notice, can be redeemed daily and does not have any unfunded commitments. |
| | | | | | | | | | | | | | | | |
| Dynamic Target 2060 Fund | | Quoted prices
(Level 1) | | | Other significant
observable inputs
(Level 2) | | | Significant
unobservable inputs
(Level 3) | | | Total | |
Assets | | | | | | | | | | | | | | | | |
Investments in: | | | | | | | | | | | | | | | | |
| | | | |
Exchange-traded funds | | $ | 1,686,923 | | | $ | 0 | | | $ | 0 | | | $ | 1,686,923 | |
| | | | |
Investment companies | | | 2,467,419 | | | | 0 | | | | 0 | | | | 2,467,419 | |
| | | | |
Short-term investments | | | | | | | | | | | | | | | | |
U.S. Treasury securities | | | 12,000 | | | | 0 | | | | 0 | | | | 12,000 | |
Investments measured at net asset value* | | | | | | | | | | | | | | | 766,894 | |
| | | | |
| | | 4,166,342 | | | | 0 | | | | 0 | | | | 4,933,236 | |
| | | | |
Futures contracts | | | 31 | | | | 0 | | | | 0 | | | | 31 | |
Total assets | | $ | 4,166,373 | | | $ | 0 | | | $ | 0 | | | $ | 4,933,267 | |
| * | Investments that are measured at fair value using the net asset value per share (or its equivalent) as a practical expedient have not been categorized in the fair value hierarchy. At May 31, 2016, the aggregated affiliated Master Portfolios measured at fair value using the net asset value per share (or its equivalent) were valued at $766,894. Each affiliated Master Portfolio does not have a redemption period notice, can be redeemed daily and does not have any unfunded commitments. |
Futures contracts are reported at their variation margin at measurement date, which represents the amount due to/from the Fund at that date. All other assets and liabilities are reported at their market value at measurement date.
The Funds recognize transfers between levels within the fair value hierarchy at the end of the reporting period. At May 31, 2016, the Fund did not have any transfers into/out of Level 1, Level 2, or Level 3.
The investment objective of each affiliated Master Portfolio is as follows:
| | |
| Affiliated Master Portfolio | | Investment objective |
Wells Fargo C&B Large Cap Value Portfolio | | Seeks maximum long-term total return (current income and capital appreciation), consistent with minimizing risk to principal |
Wells Fargo Core Bond Portfolio | | Seeks total return, consisting of income and capital appreciation |
Wells Fargo Large Company Value Portfolio | | Seeks long-term capital appreciation |
Wells Fargo Real Return Portfolio | | Seeks returns that exceed the rate of inflation over the long-term |
Wells Fargo Small Company Growth Portfolio | | Seeks long-term capital appreciation |
Wells Fargo Small Company Value Portfolio | | Seeks long-term capital appreciation |
| | | | | | |
| Notes to financial statements | | Wells Fargo Dynamic Target Date Funds | | | 95 | |
4. TRANSACTIONS WITH AFFILIATES
Management fee
Funds Management, an indirect wholly owned subsidiary of Wells Fargo & Company (“Wells Fargo”), is the manager of each Fund and provides advisory and fund-level administrative services under an investment management agreement. Under the investment management agreement, Funds Management is responsible for, among other services, implementing the investment objectives and strategies of each Fund, supervising the applicable subadviser, providing fund-level administrative services in connection with each Fund’s operations, and providing any other fund-level administrative services reasonably necessary for the operation of each Fund. As compensation for its services under the investment management agreement, Funds Management is entitled to receive an annual management fee starting at 0.20% and declining to 0.18% as the average daily net assets of each Fund increase.
For the period from November 30, 2015 (commencement of operations) to May 31, 2016, the management fee was equivalent to an annual rate of 0.20% for each Fund.
Funds Management also serves as the manager to each affiliated Underlying Fund and the adviser to each affiliated Master Portfolio.
Funds Management has retained the service of a subadviser to provide daily portfolio management to the Funds. The fee for subadvisory services is borne by Funds Management. Wells Capital Management Incorporated (“WellsCap”), an affiliate of Funds Management and an indirect wholly owned subsidiary of Wells Fargo, is the subadviser to each Fund and is paid an annual subadvisory fee starting at 0.15% and declining to 0.08% as the average daily net asset of each Fund increase.
Administration fees
Under a class-level administration agreement, Funds Management provides class-level administrative services to each Fund, which includes paying fees and expenses for services provided by the transfer agent, sub-transfer agents, omnibus account servicers and record-keepers. As compensation for its services under the class-level administration agreement, Funds Management receives an annual fee which is calculated based on the average daily net assets of each class as follows:
| | | | |
| | | Class-level administration fee | |
Class A, Class C, Class R | | | 0.21 | % |
Class R4 | | | 0.08 | |
Class R6 | | | 0.03 | |
Funds Management has contractually waived and/or reimbursed management and administration fees to the extent necessary to maintain certain net operating expense ratios for the Funds. Waiver of fees and/or reimbursement of expenses by Funds Management are made first from fund level expenses on a proportionate basis and then from class specific expenses. Funds Management has committed through September 30, 2016 to waive fees and/or reimburse expenses to the extent necessary to cap each Fund’s expenses as follows:
| | | | | | | | | | | | | | | | | | | | |
| | | Class A | | | Class C | | | Class R | | | Class R4 | | | Class R6 | |
Dynamic Target Today Fund | | | 0.98 | % | | | 1.73 | % | | | 1.23 | % | | | 0.67 | % | | | 0.52 | % |
Dynamic Target 2015 Fund | | | 1.00 | % | | | 1.75 | % | | | 1.25 | % | | | 0.69 | % | | | 0.54 | % |
Dynamic Target 2020 Fund | | | 1.02 | % | | | 1.77 | % | | | 1.27 | % | | | 0.71 | % | | | 0.56 | % |
Dynamic Target 2025 Fund | | | 1.04 | % | | | 1.79 | % | | | 1.29 | % | | | 0.73 | % | | | 0.58 | % |
Dynamic Target 2030 Fund | | | 1.06 | % | | | 1.81 | % | | | 1.31 | % | | | 0.75 | % | | | 0.60 | % |
Dynamic Target 2035 Fund | | | 1.07 | % | | | 1.82 | % | | | 1.32 | % | | | 0.76 | % | | | 0.61 | % |
Dynamic Target 2040 Fund | | | 1.08 | % | | | 1.83 | % | | | 1.33 | % | | | 0.77 | % | | | 0.62 | % |
Dynamic Target 2045 Fund | | | 1.08 | % | | | 1.83 | % | | | 1.33 | % | | | 0.77 | % | | | 0.62 | % |
Dynamic Target 2050 Fund | | | 1.08 | % | | | 1.83 | % | | | 1.33 | % | | | 0.77 | % | | | 0.62 | % |
Dynamic Target 2055 Fund | | | 1.08 | % | | | 1.83 | % | | | 1.33 | % | | | 0.77 | % | | | 0.62 | % |
Dynamic Target 2060 Fund | | | 1.08 | % | | | 1.83 | % | | | 1.33 | % | | | 0.77 | % | | | 0.62 | % |
| | | | |
| 96 | | Wells Fargo Dynamic Target Date Funds | | Notes to financial statements |
Net expenses from the underlying affiliated Master Portfolios and acquired fund fees and expenses are included in the expense caps. After the expiration date, each expense cap may be increased or the commitment to maintain the cap may be terminated only with the approval of the Board of Trustees.
Distribution fees
The Trust has adopted a Distribution Plan for Class C and Class R shares of each Fund pursuant to Rule 12b-1 under the 1940 Act. Distribution fees are charged to the Class C and Class R shares and paid to Wells Fargo Funds Distributor, LLC (“Funds Distributor”), the principal underwriter of each Fund, at an annual rate of 0.75% of the average daily net assets of Class C shares and 0.25% of the average daily net assets of Class R shares.
In addition, Funds Distributor is entitled to receive the front-end sales charge from the purchase of Class A shares and a contingent deferred sales charge on the redemption of certain Class A shares. Funds Distributor is also entitled to receive the contingent deferred sales charges from redemptions of Class C shares. For the the period from November 30, 2015 (commencement of operations) to May 31, 2016, Funds Distributor received the following amounts in front-end sales charges:
| | | | |
| | | Front-end sales charges
Class A | |
Dynamic Target 2015 Fund | | $ | 59 | |
Dynamic Target 2060 Fund | | | 2 | |
Shareholder servicing fees
The Trust has entered into contracts with one or more shareholder servicing agents, whereby Class A, Class C, and Class R shares of each Fund are charged a fee at an annual rate of 0.25% of the average daily net assets of each respective class. Class R4 shares are charged a fee at an annual rate of 0.10% of its average daily net assets.
A portion of these total shareholder servicing fees are paid to affiliates of Wells Fargo.
5. INVESTMENT PORTFOLIO TRANSACTIONS
Purchases and sales of investments, excluding short-term securities, for the period from November 30, 2015 (commencement of operations) to May 31, 2016 were as follows:
| | | | | | | | | | | | | | | | |
| | | Purchases at cost* | | | Sales proceeds* | |
| | | U.S. government | | | Non-U.S.
government | | | U.S. government | | | Non-U.S.
government | |
Dynamic Target Today Fund | | $ | 2,141,181 | | | $ | 5,247,560 | | | $ | 2,059,376 | | | $ | 1,238,949 | |
Dynamic Target 2015 Fund | | | 1,591,285 | | | | 4,488,272 | | | | 1,530,467 | | | | 311,247 | |
Dynamic Target 2020 Fund | | | 1,220,753 | | | | 4,919,477 | | | | 1,174,111 | | | | 683,643 | |
Dynamic Target 2025 Fund | | | 915,131 | | | | 5,378,144 | | | | 880,174 | | | | 1,010,059 | |
Dynamic Target 2030 Fund | | | 598,557 | | | | 4,889,839 | | | | 575,685 | | | | 484,840 | |
Dynamic Target 2035 Fund | | | 392,035 | | | | 4,899,104 | | | | 377,052 | | | | 496,527 | |
Dynamic Target 2040 Fund | | | 243,807 | | | | 4,962,149 | | | | 234,476 | | | | 492,132 | |
Dynamic Target 2045 Fund | | | 191,522 | | | | 4,923,857 | | | | 184,191 | | | | 470,290 | |
Dynamic Target 2050 Fund | | | 188,541 | | | | 4,923,835 | | | | 181,332 | | | | 482,968 | |
Dynamic Target 2055 Fund | | | 188,383 | | | | 4,918,442 | | | | 181,180 | | | | 480,185 | |
Dynamic Target 2060 Fund | | | 188,772 | | | | 4,916,401 | | | | 181,555 | | | | 474,709 | |
| * | The Funds seek to achieve their investment objective by investing some of their investable assets in affiliated Master Portfolios. Purchases and sales related to these investments have been calculated by aggregating the results of multiplying such Fund’s ownership percentage of the respective affiliated Master Portfolio by the corresponding affiliated Master Portfolio’s purchases and sales. Purchases and sales of the affiliated and unaffiliated Underlying Funds in which the Funds invest are actual aggregate purchases and sales of those investments. |
| | | | | | |
| Notes to financial statements | | Wells Fargo Dynamic Target Date Funds | | | 97 | |
6. INVESTMENTS IN AFFILIATES
An affiliated investment is a company which is under common ownership or control of the Fund or which the Fund has ownership of at least 5% of the outstanding voting shares. The following is a summary of transactions for the long-term holdings of issuers that were affiliates of the Fund at the end of the period.
| | | | | | | | | | | | | | | | | | | | | | | | | | | | |
| | | Shares,
beginning
of period* | | | Shares
purchased | | | Shares
sold | | | Shares,
end of
period | | | Value,
end of
period | | | Dividends
from
affiliated
Underlying
Funds | | | Capital gain
distributions
from affiliated
Underlying
Funds | |
Dynamic Target Today Fund | | | | | | | | | | | | | | | | | | | | | | | | | | | | |
Wells Fargo Diversified International Fund Class R6 | | | N/A | | | | 21,191 | | | | 771 | | | | 20,420 | | | $ | 229,932 | | | $ | 2,313 | | | $ | 0 | |
Wells Fargo Emerging Markets Equity Income Fund Class R6 | | | N/A | | | | 11,527 | | | | 562 | | | | 10,965 | | | | 104,277 | | | | 1,165 | | | | 0 | |
Wells Fargo Endeavor Select Fund Institutional Class | | | N/A | | | | 13,860 | | | | 409 | | | | 13,451 | | | | 124,955 | | | | 0 | | | | 39,542 | |
Wells Fargo Enterprise Fund Class R6 | | | N/A | | | | 2,171 | | | | 89 | | | | 2,082 | | | | 91,018 | | | | 0 | | | | 6,201 | |
Wells Fargo International Bond Fund Class R6 | | | N/A | | | | 29,917 | | | | 3,503 | | | | 26,414 | | | | 268,895 | | | | 0 | | | | 1,659 | |
Wells Fargo Intrinsic Value Fund Class R6 | | | N/A | | | | 7,228 | | | | 143 | | | | 7,085 | | | | 82,395 | | | | 1,113 | | | | 8,084 | |
Wells Fargo Premier Large Company Growth Fund Class R6 | | | N/A | | | | 8,771 | | | | 232 | | | | 8,539 | | | | 125,178 | | | | 0 | | | | 7,938 | |
Wells Fargo Short-Term Bond Fund Institutional Class | | | N/A | | | | 60,169 | | | | 3,874 | | | | 56,295 | | | | 493,140 | | | | 3,678 | | | | 1,836 | |
Wells Fargo Special Mid Cap Value Fund Class R6 | | | N/A | | | | 2,869 | | | | 74 | | | | 2,795 | | | | 90,377 | | | | 633 | | | | 3,028 | |
Wells Fargo Strategic Income Fund Institutional Class | | | N/A | | | | 57,234 | | | | 2,513 | | | | 54,721 | | | | 493,585 | | | | 8,373 | | | | 0 | |
| | | | | | | | | | | | | | | | | | | $ | 2,103,752 | | | $ | 17,275 | | | $ | 68,288 | |
Dynamic Target 2015 Fund | | | | | | | | | | | | | | | | | | | | | | | | | | | | |
Wells Fargo Diversified International Fund Class R6 | | | N/A | | | | 30,633 | | | | 841 | | | | 29,792 | | | $ | 335,454 | | | $ | 3,360 | | | $ | 0 | |
Wells Fargo Emerging Markets Equity Income Fund Class R6 | | | N/A | | | | 16,689 | | | | 780 | | | | 15,909 | | | | 151,293 | | | | 1,697 | | | | 0 | |
Wells Fargo Endeavor Select Fund Institutional Class | | | N/A | | | | 20,260 | | | | 646 | | | | 19,614 | | | | 182,215 | | | | 0 | | | | 57,476 | |
Wells Fargo Enterprise Fund Class R6 | | | N/A | | | | 3,273 | | | | 250 | | | | 3,023 | | | | 132,116 | | | | 0 | | | | 9,014 | |
Wells Fargo International Bond Fund Class R6 | | | N/A | | | | 22,287 | | | | 2,522 | | | | 19,765 | | | | 201,204 | | | | 0 | | | | 1,211 | |
Wells Fargo Intrinsic Value Fund Class R6 | | | N/A | | | | 10,547 | | | | 228 | | | | 10,319 | | | | 120,009 | | | | 1,617 | | | | 11,746 | |
Wells Fargo Premier Large Company Growth Fund Class R6 | | | N/A | | | | 12,973 | | | | 514 | | | | 12,459 | | | | 182,654 | | | | 0 | | | | 11,539 | |
Wells Fargo Short-Term Bond Fund Institutional Class | | | N/A | | | | 45,073 | | | | 3,268 | | | | 41,805 | | | | 366,215 | | | | 2,683 | | | | 1,339 | |
Wells Fargo Special Mid Cap Value Fund Class R6 | | | N/A | | | | 4,243 | | | | 175 | | | | 4,068 | | | | 131,520 | | | | 921 | | | | 4,402 | |
Wells Fargo Strategic Income Fund Institutional Class | | | N/A | | | | 43,015 | | | | 2,348 | | | | 40,667 | | | | 366,819 | | | | 6,121 | | | | 0 | |
| | | | | | | | | | | | | | | | | | | $ | 2,169,499 | | | $ | 16,399 | | | $ | 96,727 | |
Dynamic Target 2020 Fund | | | | | | | | | | | | | | | | | | | | | | | | | | | | |
Wells Fargo Diversified International Fund Class R6 | | | N/A | | | | 36,342 | | | | 1,419 | | | | 34,923 | | | $ | 393,234 | | | $ | 4,016 | | | $ | 0 | |
Wells Fargo Emerging Markets Equity Income Fund Class R6 | | | N/A | | | | 20,081 | | | | 1,360 | | | | 18,721 | | | | 178,035 | | | | 1,999 | | | | 0 | |
Wells Fargo Endeavor Select Fund Institutional Class | | | N/A | | | | 23,725 | | | | 718 | | | | 23,007 | | | | 213,737 | | | | 0 | | | | 68,736 | |
Wells Fargo Enterprise Fund Class R6 | | | N/A | | | | 3,747 | | | | 174 | | | | 3,573 | | | | 156,168 | | | | 0 | | | | 10,780 | |
Wells Fargo International Bond Fund Class R6 | | | N/A | | | | 17,827 | | | | 2,734 | | | | 15,093 | | | | 153,647 | | | | 0 | | | | 940 | |
Wells Fargo Intrinsic Value Fund Class R6 | | | N/A | | | | 12,465 | | | | 358 | | | | 12,107 | | | | 140,801 | | | | 1,933 | | | | 14,049 | |
Wells Fargo Premier Large Company Growth Fund Class R6 | | | N/A | | | | 15,044 | | | | 441 | | | | 14,603 | | | | 214,087 | | | | 0 | | | | 13,799 | |
Wells Fargo Short-Term Bond Fund Institutional Class | | | N/A | | | | 35,551 | | | | 3,464 | | | | 32,087 | | | | 281,078 | | | | 2,056 | | | | 1,039 | |
Wells Fargo Special Mid Cap Value Fund Class R6 | | | N/A | | | | 4,993 | | | | 204 | | | | 4,789 | | | | 154,841 | | | | 1,102 | | | | 5,264 | |
Wells Fargo Strategic Income Fund Institutional Class | | | N/A | | | | 34,015 | | | | 2,828 | | | | 31,187 | | | | 281,303 | | | | 4,704 | | | | 0 | |
| | | | | | | | | | | | | | | | | | | $ | 2,166,931 | | | $ | 15,810 | | | $ | 114,607 | |
Dynamic Target 2025 Fund | | | | | | | | | | | | | | | | | | | | | | | | | | | | |
Wells Fargo Diversified International Fund Class R6 | | | N/A | | | | 42,325 | | | | 1,877 | | | | 40,448 | | | $ | 455,447 | | | $ | 4,585 | | | $ | 0 | |
Wells Fargo Emerging Markets Equity Income Fund Class R6 | | | N/A | | | | 23,281 | | | | 1,636 | | | | 21,645 | | | | 205,847 | | | | 2,307 | | | | 0 | |
Wells Fargo Endeavor Select Fund Institutional Class | | | N/A | | | | 27,873 | | | | 1,208 | | | | 26,665 | | | | 247,716 | | | | 0 | | | | 78,890 | |
Wells Fargo Enterprise Fund Class R6 | | | N/A | | | | 4,448 | | | | 312 | | | | 4,136 | | | | 180,779 | | | | 0 | | | | 12,372 | |
Wells Fargo International Bond Fund Class R6 | | | N/A | | | | 13,738 | | | | 2,410 | | | | 11,328 | | | | 115,318 | | | | 0 | | | | 698 | |
Wells Fargo Intrinsic Value Fund Class R6 | | | N/A | | | | 14,434 | | | | 424 | | | | 14,010 | | | | 162,940 | | | | 2,214 | | | | 16,124 | |
Wells Fargo Premier Large Company Growth Fund Class R6 | | | N/A | | | | 17,758 | | | | 840 | | | | 16,918 | | | | 248,021 | | | | 0 | | | | 15,837 | |
Wells Fargo Short-Term Bond Fund Institutional Class | | | N/A | | | | 27,170 | | | | 3,105 | | | | 24,065 | | | | 210,808 | | | | 1,532 | | | | 772 | |
Wells Fargo Special Mid Cap Value Fund Class R6 | | | N/A | | | | 5,779 | | | | 233 | | | | 5,546 | | | | 179,300 | | | | 1,264 | | | | 6,042 | |
Wells Fargo Strategic Income Fund Institutional Class | | | N/A | | | | 26,383 | | | | 2,991 | | | | 23,392 | | | | 210,993 | | | | 3,504 | | | | 0 | |
| | | | | | | | | | | | | | | | | | | $ | 2,217,169 | | | $ | 15,406 | | | $ | 130,735 | |
| | | | |
| 98 | | Wells Fargo Dynamic Target Date Funds | | Notes to financial statements |
| | | | | | | | | | | | | | | | | | | | | | | | | | | | |
| | | Shares,
beginning
of period* | | | Shares
purchased | | | Shares
sold | | | Shares,
end of
period | | | Value,
end of
period | | | Dividends
from
affiliated
Underlying
Funds | | | Capital gain
distributions
from affiliated
Underlying
Funds | |
Dynamic Target 2030 Fund | | | | | | | | | | | | | | | | | | | | | | | | | | | | |
Wells Fargo Diversified International Fund Class R6 | | | N/A | | | | 48,099 | | | | 2,756 | | | | 45,343 | | | $ | 510,563 | | | $ | 5,164 | | | $ | 0 | |
Wells Fargo Emerging Markets Equity Income Fund Class R6 | | | N/A | | | | 26,472 | | | | 2,190 | | | | 24,282 | | | | 230,925 | | | | 2,589 | | | | 0 | |
Wells Fargo Endeavor Select Fund Institutional Class | | | N/A | | | | 31,459 | | | | 1,580 | | | | 29,879 | | | | 277,575 | | | | 0 | | | | 89,067 | |
Wells Fargo Enterprise Fund Class R6 | | | N/A | | | | 4,902 | | | | 294 | | | | 4,608 | | | | 201,433 | | | | 0 | | | | 13,968 | |
Wells Fargo International Bond Fund Class R6 | | | N/A | | | | 9,188 | | | | 1,762 | | | | 7,426 | | | | 75,599 | | | | 0 | | | | 456 | |
Wells Fargo Intrinsic Value Fund Class R6 | | | N/A | | | | 16,349 | | | | 639 | | | | 15,710 | | | | 182,703 | | | | 2,493 | | | | 18,203 | |
Wells Fargo Premier Large Company Growth Fund Class R6 | | | N/A | | | | 19,762 | | | | 801 | | | | 18,961 | | | | 277,974 | | | | 0 | | | | 17,881 | |
Wells Fargo Short-Term Bond Fund Institutional Class | | | N/A | | | | 18,294 | | | | 2,578 | | | | 15,716 | | | | 137,676 | | | | 994 | | | | 504 | |
Wells Fargo Special Mid Cap Value Fund Class R6 | | | N/A | | | | 6,569 | | | | 374 | | | | 6,195 | | | | 200,284 | | | | 1,423 | | | | 6,821 | |
Wells Fargo Strategic Income Fund Institutional Class | | | N/A | | | | 17,783 | | | | 2,505 | | | | 15,278 | | | | 137,803 | | | | 2,280 | | | | 0 | |
| | | | | | | | | | | | | | | | | | | $ | 2,232,535 | | | $ | 14,943 | | | $ | 146,900 | |
Dynamic Target 2035 Fund | | | | | | | | | | | | | | | | | | | | | | | | | | | | |
Wells Fargo Diversified International Fund Class R6 | | | N/A | | | | 51,373 | | | | 3,265 | | | | 48,108 | | | $ | 541,697 | | | $ | 5,555 | | | $ | 0 | |
Wells Fargo Emerging Markets Equity Income Fund Class R6 | | | N/A | | | | 28,433 | | | | 2,712 | | | | 25,721 | | | | 244,602 | | | | 2,752 | | | | 0 | |
Wells Fargo Endeavor Select Fund Institutional Class | | | N/A | | | | 34,011 | | | | 2,266 | | | | 31,745 | | | | 294,912 | | | | 0 | | | | 95,840 | |
Wells Fargo Enterprise Fund Class R6 | | | N/A | | | | 5,241 | | | | 334 | | | | 4,907 | | | | 214,493 | | | | 0 | | | | 15,030 | |
Wells Fargo International Bond Fund Class R6 | | | N/A | | | | 6,324 | | | | 1,462 | | | | 4,862 | | | | 49,499 | | | | 0 | | | | 305 | |
Wells Fargo Intrinsic Value Fund Class R6 | | | N/A | | | | 17,538 | | | | 871 | | | | 16,667 | | | | 193,840 | | | | 2,691 | | | | 19,587 | |
Wells Fargo Premier Large Company Growth Fund Class R6 | | | N/A | | | | 21,323 | | | | 1,208 | | | | 20,115 | | | | 294,888 | | | | 0 | | | | 19,240 | |
Wells Fargo Short-Term Bond Fund Institutional Class | | | N/A | | | | 12,422 | | | | 2,131 | | | | 10,291 | | | | 90,151 | | | | 656 | | | | 337 | |
Wells Fargo Special Mid Cap Value Fund Class R | | | N/A | | | | 7,058 | | | | 466 | | | | 6,592 | | | | 213,103 | | | | 1,536 | | | | 7,340 | |
Wells Fargo Strategic Income Fund Institutional Class | | | N/A | | | | 12,201 | | | | 2,199 | | | | 10,002 | | | | 90,218 | | | | 1,506 | | | | 0 | |
| | | | | | | | | | | | | | | | | | | $ | 2,227,403 | | | $ | 14,696 | | | $ | 157,679 | |
Dynamic Target 2040 Fund | | | | | | | | | | | | | | | | | | | | | | | | | | | | |
Wells Fargo Diversified International Fund Class R6 | | | N/A | | | | 54,667 | | | | 3,861 | | | | 50,806 | | | $ | 572,075 | | | $ | 5,791 | | | $ | 0 | |
Wells Fargo Emerging Markets Equity Income Fund Class R6 | | | N/A | | | | 30,828 | | | | 3,079 | | | | 27,749 | | | | 263,893 | | | | 2,883 | | | | 0 | |
Wells Fargo Endeavor Select Fund Institutional Class | | | N/A | | | | 35,877 | | | | 2,673 | | | | 33,204 | | | | 308,468 | | | | 0 | | | | 100,407 | |
Wells Fargo Enterprise Fund Class R6 | | | N/A | | | | 5,546 | | | | 418 | | | | 5,128 | | | | 224,148 | | | | 0 | | | | 15,747 | |
Wells Fargo International Bond Fund Class R6 | | | N/A | | | | 4,055 | | | | 1,003 | | | | 3,052 | | | | 31,074 | | | | 0 | | | | 183 | |
Wells Fargo Intrinsic Value Fund Class R6 | | | N/A | | | | 18,696 | | | | 1,076 | | | | 17,620 | | | | 204,920 | | | | 2,808 | | | | 20,523 | |
Wells Fargo Premier Large Company Growth Fund Class R6 | | | N/A | | | | 22,655 | | | | 1,555 | | | | 21,100 | | | | 309,319 | | | | 0 | | | | 20,157 | |
Wells Fargo Short-Term Bond Fund Institutional Class | | | N/A | | | | 7,949 | | | | 1,550 | | | | 6,399 | | | | 56,055 | | | | 395 | | | | 202 | |
Wells Fargo Special Mid Cap Value Fund Class R | | | N/A | | | | 7,452 | | | | 554 | | | | 6,898 | | | | 223,027 | | | | 1,605 | | | $ | 7,689 | |
Wells Fargo Strategic Income Fund Institutional Class | | | N/A | | | | 7,804 | | | | 1,588 | | | | 6,216 | | | | 56,065 | | | | 906 | | | | 0 | |
| | | | | | | | | | | | | | | | | | | $ | 2,249,044 | | | $ | 14,388 | | | $ | 164,908 | |
Dynamic Target 2045 Fund | | | | | | | | | | | | | | | | | | | | | | | | | | | | |
Wells Fargo Diversified International Fund Class R6 | | | N/A | | | | 54,687 | | | | 3,597 | | | | 51,090 | | | $ | 575,277 | | | $ | 5,881 | | | $ | 0 | |
Wells Fargo Emerging Markets Equity Income Fund Class R6 | | | N/A | | | | 30,224 | | | | 2,819 | | | | 27,405 | | | | 260,619 | | | | 2,924 | | | | 0 | |
Wells Fargo Endeavor Select Fund Institutional Class | | | N/A | | | | 36,213 | | | | 2,639 | | | | 33,574 | | | | 311,902 | | | | 0 | | | | 101,546 | |
Wells Fargo Enterprise Fund Class R6 | | | N/A | | | | 5,583 | | | | 418 | | | | 5,165 | | | | 225,760 | | | | 0 | | | | 15,925 | |
Wells Fargo International Bond Fund Class R6 | | | N/A | | | | 3,261 | | | | 861 | | | | 2,400 | | | | 24,429 | | | | 0 | | | | 153 | |
Wells Fargo Intrinsic Value Fund Class R6 | | | N/A | | | | 18,656 | | | | 943 | | | | 17,713 | | | | 206,005 | | | | 2,847 | | | | 20,751 | |
Wells Fargo Premier Large Company Growth Fund Class R6 | | | N/A | | | | 22,766 | | | | 1,419 | | | | 21,347 | | | | 312,954 | | | | 0 | | | | 20,386 | |
Wells Fargo Short-Term Bond Fund Institutional Class | | | N/A | | | | 6,338 | | | | 1,309 | | | | 5,029 | | | | 44,052 | | | | 324 | | | | 169 | |
Wells Fargo Special Mid Cap Value Fund Class R | | | N/A | | | | 7,461 | | | | 503 | | | | 6,958 | | | | 224,957 | | | | 1,624 | | | | 7,777 | |
Wells Fargo Strategic Income Fund Institutional Class | | | N/A | | | | 6,240 | | | | 1,356 | | | | 4,884 | | | | 44,050 | | | | 745 | | | | 0 | |
| | | | | | | | | | | | | | | | | | | $ | 2,230,005 | | | $ | 14,345 | | | $ | 166,707 | |
| | | | | | |
| Notes to financial statements | | Wells Fargo Dynamic Target Date Funds | | | 99 | |
| | | | | | | | | | | | | | | | | | | | | | | | | | | | |
| | | Shares,
beginning
of period* | | | Shares
purchased | | | Shares
sold | | | Shares,
end of
period | | | Value,
end of
period | | | Dividends
from
affiliated
Underlying
Funds | | | Capital gain
distributions
from affiliated
Underlying
Funds | |
Dynamic Target 2050 Fund | | | | | | | | | | | | | | | | | | | | | | | | | | | | |
Wells Fargo Diversified International Fund Class R6 | | | N/A | | | | 54,670 | | | | 3,711 | | | | 50,959 | | | $ | 573,793 | | | $ | 5,862 | | | $ | 0 | |
Wells Fargo Emerging Markets Equity Income Fund Class R6 | | | N/A | | | | 30,213 | | | | 2,924 | | | | 27,289 | | | | 259,515 | | | | 2,914 | | | | 0 | |
Wells Fargo Endeavor Select Fund Institutional Class | | | N/A | | | | 36,082 | | | | 2,584 | | | | 33,498 | | | | 311,200 | | | | 0 | | | | 101,546 | |
Wells Fargo Enterprise Fund Class R6 | | | N/A | | | | 5,592 | | | | 434 | | | | 5,158 | | | | 225,436 | | | | 0 | | | | 15,925 | |
Wells Fargo International Bond Fund Class R6 | | | N/A | | | | 3,251 | | | | 897 | | | | 2,354 | | | | 23,968 | | | | 0 | | | | 152 | |
Wells Fargo Intrinsic Value Fund Class R6 | | | N/A | | | | 18,640 | | | | 971 | | | | 17,669 | | | | 205,496 | | | | 2,831 | | | | 20,752 | |
Wells Fargo Premier Large Company Growth Fund Class R6 | | | N/A | | | | 22,768 | | | | 1,481 | | | | 21,287 | | | | 312,073 | | | | 0 | | | | 20,386 | |
Wells Fargo Short-Term Bond Fund Institutional Class | | | N/A | | | | 6,319 | | | | 1,372 | | | | 4,947 | | | | 43,333 | | | | 322 | | | | 169 | |
Wells Fargo Special Mid Cap Value Fund Class R | | | N/A | | | | 7,467 | | | | 522 | | | | 6,945 | | | | 224,524 | | | | 1,618 | | | | 7,777 | |
Wells Fargo Strategic Income Fund Institutional Class | | | N/A | | | | 6,217 | | | | 1,413 | | | | 4,804 | | | | 43,333 | | | | 740 | | | | 0 | |
| | | | | | | | | | | | | | | | | | | $ | 2,222,671 | | | $ | 14,287 | | | $ | 166,707 | |
Dynamic Target 2055 Fund | | | | | | | | | | | | | | | | | | | | | | | | | | | | |
Wells Fargo Diversified International Fund Class R6 | | | N/A | | | | 54,584 | | | | 3,664 | | | | 50,920 | | | $ | 573,363 | | | $ | 5,862 | | | $ | 0 | |
Wells Fargo Emerging Markets Equity Income Fund Class R6 | | | N/A | | | | 30,165 | | | | 2,907 | | | | 27,258 | | | | 259,224 | | | | 2,913 | | | | 0 | |
Wells Fargo Endeavor Select Fund Institutional Class | | | N/A | | | | 36,022 | | | | 2,542 | | | | 33,480 | | | | 311,031 | | | | 0 | | | | 101,546 | |
Wells Fargo Enterprise Fund Class R6 | | | N/A | | | | 5,580 | | | | 422 | | | | 5,158 | | | | 225,452 | | | | 0 | | | | 15,925 | |
Wells Fargo International Bond Fund Class R6 | | | N/A | | | | 3,256 | | | | 904 | | | | 2,352 | | | | 23,947 | | | | 0 | | | | 152 | |
Wells Fargo Intrinsic Value Fund Class R6 | | | N/A | | | | 18,610 | | | | 956 | | | | 17,654 | | | | 205,318 | | | | 2,831 | | | | 20,752 | |
Wells Fargo Premier Large Company Growth Fund Class R6 | | | N/A | | | | 22,711 | | | | 1,439 | | | | 21,272 | | | | 311,852 | | | | 0 | | | | 20,386 | |
Wells Fargo Short-Term Bond Fund Institutional Class | | | N/A | | | | 6,323 | | | | 1,381 | | | | 4,942 | | | | 43,295 | | | | 322 | | | | 169 | |
Wells Fargo Special Mid Cap Value Fund Class R | | | N/A | | | | 7,459 | | | | 518 | | | | 6,941 | | | | 224,397 | | | | 1,618 | | | | 7,777 | |
Wells Fargo Strategic Income Fund Institutional Class | | | N/A | | | | 6,224 | | | | 1,424 | | | | 4,800 | | | | 43,297 | | | | 741 | | | | 0 | |
| | | | | | | | | | | | | | | | | | | $ | 2,221,176 | | | $ | 14,287 | | | $ | 166,707 | |
Dynamic Target 2060 Fund | | | | | | | | | | | | | | | | | | | | | | | | | | | | |
Wells Fargo Diversified International Fund Class R6 | | | N/A | | | | 54,536 | | | | 3,566 | | | | 50,970 | | | $ | 573,927 | | | $ | 5,877 | | | $ | 0 | |
Wells Fargo Emerging Markets Equity Income Fund Class R6 | | | N/A | | | | 30,170 | | | | 2,871 | | | | 27,299 | | | | 259,611 | | | | 2,918 | | | | 0 | |
Wells Fargo Endeavor Select Fund Institutional Class | | | N/A | | | | 35,991 | | | | 2,482 | | | | 33,509 | | | | 311,295 | | | | 0 | | | | 101,546 | |
Wells Fargo Enterprise Fund Class R6 | | | N/A | | | | 5,588 | | | | 430 | | | | 5,158 | | | | 225,440 | | | | 0 | | | | 15,925 | |
Wells Fargo International Bond Fund Class R6 | | | N/A | | | | 3,260 | | | | 902 | | | | 2,358 | | | | 24,007 | | | | 0 | | | | 152 | |
Wells Fargo Intrinsic Value Fund Class R6 | | | N/A | | | | 18,623 | | | | 949 | | | | 17,674 | | | | 205,552 | | | | 2,831 | | | | 20,752 | |
Wells Fargo Premier Large Company Growth Fund Class R6 | | | N/A | | | | 22,719 | | | | 1,426 | | | | 21,293 | | | | 312,157 | | | | 0 | | | | 20,386 | |
Wells Fargo Short-Term Bond Fund Institutional Class | | | N/A | | | | 6,333 | | | | 1,378 | | | | 4,955 | | | | 43,405 | | | | 322 | | | | 169 | |
Wells Fargo Special Mid Cap Value Fund Class R | | | N/A | | | | 7,458 | | | | 512 | | | | 6,946 | | | | 224,549 | | | | 1,618 | | | | 7,777 | |
Wells Fargo Strategic Income Fund Institutional Class | | | N/A | | | | 6,236 | | | | 1,426 | | | | 4,810 | | | | 43,386 | | | | 740 | | | | 0 | |
| | | | | | | | | | | | | | | | | | | $ | 2,223,329 | | | $ | 14,306 | | | $ | 166,707 | |
| * | Each Fund commenced operations on November 30, 2015. |
In addition, each Fund’s ownership of affiliated Master Portfolios was as follows:
| | | | | | | | | | | | |
| | | % of ownership,
beginning of period* | | | % of ownership, end of
period | | | Value, end of
period | |
Dynamic Target Today Fund | | | | | | | | | | | | |
Wells Fargo C&B Large Cap Value Portfolio | | | N/A | | | | 0.03 | % | | $ | 82,650 | |
Wells Fargo Core Bond Portfolio | | | N/A | | | | 0.02 | | | | 655,585 | |
Wells Fargo Large Company Value Portfolio | | | N/A | | | | 0.11 | | | | 83,192 | |
Wells Fargo Real Return Portfolio | | | N/A | | | | 0.43 | | | | 272,449 | |
Wells Fargo Small Company Growth Portfolio | | | N/A | | | | 0.00 | ** | | | 54,661 | |
Wells Fargo Small Company Value Portfolio | | | N/A | | | | 0.02 | | | | 54,373 | |
| | | | | | | | | | | $ | 1,202,910 | |
| | | | |
| 100 | | Wells Fargo Dynamic Target Date Funds | | Notes to financial statements |
| | | | | | | | | | | | |
| | | % of ownership,
beginning of period* | | | % of ownership, end of
period | | | Value, end of
period | |
Dynamic Target 2015 Fund | | | | | | | | | | | | |
Wells Fargo C&B Large Cap Value Portfolio | | | N/A | | | | 0.04 | % | | $ | 120,498 | |
Wells Fargo Core Bond Portfolio | | | N/A | | | | 0.01 | | | | 487,203 | |
Wells Fargo Large Company Value Portfolio | | | N/A | | | | 0.15 | | | | 121,833 | |
Wells Fargo Real Return Portfolio | | | N/A | | | | 0.32 | | | | 202,701 | |
Wells Fargo Small Company Growth Portfolio | | | N/A | | | | 0.01 | | | | 79,555 | |
Wells Fargo Small Company Value Portfolio | | | N/A | | | | 0.04 | | | | 79,184 | |
| | | | | | | | | | | $ | 1,090,974 | |
Dynamic Target 2020 Fund | | | | | | | | | | | | |
Wells Fargo C&B Large Cap Value Portfolio | | | N/A | | | | 0.05 | % | | $ | 141,485 | |
Wells Fargo Core Bond Portfolio | | | N/A | | | | 0.01 | | | | 373,767 | |
Wells Fargo Large Company Value Portfolio | | | N/A | | | | 0.18 | | | | 142,659 | |
Wells Fargo Real Return Portfolio | | | N/A | | | | 0.24 | | | | 155,360 | |
Wells Fargo Small Company Growth Portfolio | | | N/A | | | | 0.01 | | | | 93,500 | |
Wells Fargo Small Company Value Portfolio | | | N/A | | | | 0.04 | | | | 93,123 | |
| | | | | | | | | | | $ | 999,894 | |
Dynamic Target 2025 Fund | | | | | | | | | | | | |
Wells Fargo C&B Large Cap Value Portfolio | | | N/A | | | | 0.06 | % | | $ | 163,963 | |
Wells Fargo Core Bond Portfolio | | | N/A | | | | 0.01 | | | | 280,198 | |
Wells Fargo Large Company Value Portfolio | | | N/A | | | | 0.21 | | | | 165,213 | |
Wells Fargo Real Return Portfolio | | | N/A | | | | 0.18 | | | | 116,379 | |
Wells Fargo Small Company Growth Portfolio | | | N/A | | | | 0.01 | | | | 108,232 | |
Wells Fargo Small Company Value Portfolio | | | N/A | | | | 0.05 | | | | 107,945 | |
| | | | | | | | | | | $ | 941,930 | |
Dynamic Target 2030 Fund | | | | | | | | | | | | |
Wells Fargo C&B Large Cap Value Portfolio | | | N/A | | | | 0.06 | % | | $ | 183,237 | |
Wells Fargo Core Bond Portfolio | | | N/A | | | | 0.00 | ** | | | 183,263 | |
Wells Fargo Large Company Value Portfolio | | | N/A | | | | 0.23 | | | | 185,029 | |
Wells Fargo Real Return Portfolio | | | N/A | | | | 0.12 | | | | 76,203 | |
Wells Fargo Small Company Growth Portfolio | | | N/A | | | | 0.01 | | | | 121,286 | |
Wells Fargo Small Company Value Portfolio | | | N/A | | | | 0.06 | | | | 120,766 | |
| | | | | | | | | | | $ | 869,784 | |
Dynamic Target 2035 Fund | | | | | | | | | | | | |
Wells Fargo C&B Large Cap Value Portfolio | | | N/A | | | | 0.07 | % | | $ | 194,790 | |
Wells Fargo Core Bond Portfolio | | | N/A | | | | 0.00 | ** | | | 120,029 | |
Wells Fargo Large Company Value Portfolio | | | N/A | | | | 0.25 | | | | 196,262 | |
Wells Fargo Real Return Portfolio | | | N/A | | | | 0.08 | | | | 49,934 | |
Wells Fargo Small Company Growth Portfolio | | | N/A | | | | 0.01 | | | | 128,545 | |
Wells Fargo Small Company Value Portfolio | | | N/A | | | | 0.06 | | | | 128,239 | |
| | | | | | | | | | | $ | 817,799 | |
Dynamic Target 2040 Fund | | | | | | | | | | | | |
Wells Fargo C&B Large Cap Value Portfolio | | | N/A | | �� | | 0.07 | % | | $ | 204,823 | |
Wells Fargo Core Bond Portfolio | | | N/A | | | | 0.00 | ** | | | 74,638 | |
Wells Fargo Large Company Value Portfolio | | | N/A | | | | 0.26 | | | | 205,888 | |
Wells Fargo Real Return Portfolio | | | N/A | | | | 0.05 | | | | 31,179 | |
Wells Fargo Small Company Growth Portfolio | | | N/A | | | | 0.01 | | | | 134,931 | |
Wells Fargo Small Company Value Portfolio | | | N/A | | | | 0.06 | | | | 134,356 | |
| | | | | | | | | | | $ | 785,815 | |
| | | | | | |
| Notes to financial statements | | Wells Fargo Dynamic Target Date Funds | | | 101 | |
| | | | | | | | | | | | |
| | | % of ownership,
beginning of period* | | | % of ownership, end of
period | | | Value, end of
period | |
Dynamic Target 2045 Fund | | | | | | | | | | | | |
Wells Fargo C&B Large Cap Value Portfolio | | | N/A | | | | 0.07 | % | | $ | 206,212 | |
Wells Fargo Core Bond Portfolio | | | N/A | | | | 0.00 | ** | | | 58,631 | |
Wells Fargo Large Company Value Portfolio | | | N/A | | | | 0.26 | | | | 208,245 | |
Wells Fargo Real Return Portfolio | | | N/A | | | | 0.04 | | | | 24,508 | |
Wells Fargo Small Company Growth Portfolio | | | N/A | | | | 0.01 | | | | 136,547 | |
Wells Fargo Small Company Value Portfolio | | | N/A | | | | 0.06 | | | | 135,787 | |
| | | | | | | | | | | $ | 769,930 | |
Dynamic Target 2050 Fund | | | | | | | | | | | | |
Wells Fargo C&B Large Cap Value Portfolio | | | N/A | | | | 0.07 | % | | $ | 205,801 | |
Wells Fargo Core Bond Portfolio | | | N/A | | | | 0.00 | ** | | | 57,723 | |
Wells Fargo Large Company Value Portfolio | | | N/A | | | | 0.26 | | | | 207,750 | |
Wells Fargo Real Return Portfolio | | | N/A | | | | 0.04 | | | | 24,045 | |
Wells Fargo Small Company Growth Portfolio | | | N/A | | | | 0.01 | | | | 136,006 | |
Wells Fargo Small Company Value Portfolio | | | N/A | | | | 0.06 | | | | 135,381 | |
| | | | | | | | | | | $ | 766,706 | |
Dynamic Target 2055 Fund | | | | | | | | | | | | |
Wells Fargo C&B Large Cap Value Portfolio | | | N/A | | | | 0.07 | % | | $ | 205,664 | |
Wells Fargo Core Bond Portfolio | | | N/A | | | | 0.00 | ** | | | 57,675 | |
Wells Fargo Large Company Value Portfolio | | | N/A | | | | 0.26 | | | | 207,571 | |
Wells Fargo Real Return Portfolio | | | N/A | | | | 0.04 | | | | 24,024 | |
Wells Fargo Small Company Growth Portfolio | | | N/A | | | | 0.01 | | | | 135,893 | |
Wells Fargo Small Company Value Portfolio | | | N/A | | | | 0.06 | | | | 135,300 | |
| | | | | | | | | | | $ | 766,127 | |
Dynamic Target 2060 Fund | | | | | | | | | | | | |
Wells Fargo C&B Large Cap Value Portfolio | | | N/A | | | | 0.07 | % | | $ | 205,825 | |
Wells Fargo Core Bond Portfolio | | | N/A | | | | 0.00 | ** | | | 57,794 | |
Wells Fargo Large Company Value Portfolio | | | N/A | | | | 0.26 | | | | 207,761 | |
Wells Fargo Real Return Portfolio | | | N/A | | | | 0.04 | | | | 24,073 | |
Wells Fargo Small Company Growth Portfolio | | | N/A | | | | 0.01 | | | | 136,041 | |
Wells Fargo Small Company Value Portfolio | | | N/A | | | | 0.06 | | | | 135,400 | |
| | | | | | | | | | | $ | 766,894 | |
| * | Each Fund commenced operations on November 30, 2015. |
| ** | The amount invested is less than 0.005%. |
7. DERIVATIVE TRANSACTIONS
During the period from November 30, 2015 (commencement of operations) to May 31, 2016, the Funds entered into futures contracts to gain market exposure to certain asset classes consistent with an active asset allocation strategy.
At May 31, 2016, the Fund had short futures contracts outstanding as follows:
| | | | | | | | | | | | | | | | |
| | | Expiration date | | Counterparty | | Contracts | | Type | | Contract
value at
May 31, 2016 | | | Unrealized
losses | |
Dynamic Target Today Fund | | 9-21-2016 | | Goldman Sachs | | 2 Short | | 10-Year U.S. Treasury Notes | | $ | 259,375 | | | $ | (631 | ) |
Dynamic Target 2015 Fund | | 9-21-2016 | | Goldman Sachs | | 2 Short | | 10-Year U.S. Treasury Notes | | | 259,375 | | | | (631 | ) |
Dynamic Target 2020 Fund | | 9-21-2016 | | Goldman Sachs | | 2 Short | | 10-Year U.S. Treasury Notes | | | 259,375 | | | | (631 | ) |
Dynamic Target 2025 Fund | | 9-21-2016 | | Goldman Sachs | | 2 Short | | 10-Year U.S. Treasury Notes | | | 259,375 | | | | (631 | ) |
Dynamic Target 2030 Fund | | 9-21-2016 | | Goldman Sachs | | 2 Short | | 10-Year U.S. Treasury Notes | | | 259,375 | | | | (631 | ) |
Dynamic Target 2035 Fund | | 9-21-2016 | | Goldman Sachs | | 2 Short | | 10-Year U.S. Treasury Notes | | | 259,375 | | | | (631 | ) |
Dynamic Target 2040 Fund | | 9-21-2016 | | Goldman Sachs | | 2 Short | | 10-Year U.S. Treasury Notes | | | 259,375 | | | | (631 | ) |
| | | | |
| 102 | | Wells Fargo Dynamic Target Date Funds | | Notes to financial statements |
| | | | | | | | | | | | | | | | |
| | | Expiration date | | Counterparty | | Contracts | | Type | | Contract
value at
May 31, 2016 | | | Unrealized
losses | |
Dynamic Target 2045 Fund | | 9-21-2016 | | Goldman Sachs | | 2 Short | | 10-Year U.S. Treasury Notes | | $ | 259,375 | | | $ | (631 | ) |
Dynamic Target 2050 Fund | | 9-21-2016 | | Goldman Sachs | | 2 Short | | 10-Year U.S. Treasury Notes | | | 259,375 | | | | (631 | ) |
Dynamic Target 2055 Fund | | 9-21-2016 | | Goldman Sachs | | 2 Short | | 10-Year U.S. Treasury Notes | | | 259,375 | | | | (631 | ) |
Dynamic Target 2060 Fund | | 9-21-2016 | | Goldman Sachs | | 2 Short | | 10-Year U.S. Treasury Notes | | | 259,375 | | | | (631 | ) |
During the period from November 30, 2015 (commencement of operations) to May 31, 2016, the Funds had average notional amounts in futures contracts outstanding as follows:
| | | | | | | | |
| | | Long contracts | | | Short contracts | |
Dynamic Target Today Fund | | $ | 93,581 | | | $ | 298,877 | |
Dynamic Target 2015 Fund | | | 81,931 | | | | 406,989 | |
Dynamic Target 2020 Fund | | | 81,931 | | | | 469,337 | |
Dynamic Target 2025 Fund | | | 81,931 | | | | 486,875 | |
Dynamic Target 2030 Fund | | | 81,931 | | | | 535,361 | |
Dynamic Target 2035 Fund | | | 81,931 | | | | 597,268 | |
Dynamic Target 2040 Fund | | | 81,931 | | | | 631,268 | |
Dynamic Target 2045 Fund | | | 81,931 | | | | 588,054 | |
Dynamic Target 2050 Fund | | | 81,931 | | | | 586,539 | |
Dynamic Target 2055 Fund | | | 81,931 | | | | 588,294 | |
Dynamic Target 2060 Fund | | | 81,931 | | | | 587,355 | |
The fair value of derivative instruments for each Fund is reflected in the Statements of Assets and Liabilities.
The effect of derivative instruments on the Statements of Operations for the period from November 30, 2015 (commencement of operations) to May 31, 2016 was as follows for the Funds:
| | | | | | | | | | | | | | | | | | |
| | | Amount of realized gains (losses) on derivatives | | Change in unrealized gains (losses) on derivatives | |
| | | Interest rate
contracts | | Equity contracts | | | Total | | Interest rate contracts | | Equity contracts | | | Total | |
Dynamic Target Today Fund | | $(3,292) | | $ | (3,403 | ) | | $(6,695) | | $(631) | | $ | 0 | | | $ | (631 | ) |
Dynamic Target 2015 Fund | | (4,310) | | | 3,361 | | | (949) | | (631) | | | 0 | | | | (631 | ) |
Dynamic Target 2020 Fund | | (3,435) | | | 29,901 | | | 26,466 | | (631) | | | 0 | | | | (631 | ) |
Dynamic Target 2025 Fund | | (5,129) | | | 27,536 | | | 22,407 | | (631) | | | 0 | | | | (631 | ) |
Dynamic Target 2030 Fund | | (3,343) | | | 36,790 | | | 33,447 | | (631) | | | 0 | | | | (631 | ) |
Dynamic Target 2035 Fund | | (3,424) | | | 34,886 | | | 31,462 | | (631) | | | 0 | | | | (631 | ) |
Dynamic Target 2040 Fund | | (3,423) | | | 33,223 | | | 29,800 | | (631) | | | 0 | | | | (631 | ) |
Dynamic Target 2045 Fund | | (3,202) | | | 40,480 | | | 37,278 | | (631) | | | 0 | | | | (631 | ) |
Dynamic Target 2050 Fund | | (3,202) | | | 40,471 | | | 37,269 | | (631) | | | 0 | | | | (631 | ) |
Dynamic Target 2055 Fund | | (3,202) | | | 43,282 | | | 40,080 | | (631) | | | 0 | | | | (631 | ) |
Dynamic Target 2060 Fund | | (3,342) | | | 48,622 | | | 45,280 | | (631) | | | 0 | | | | (631 | ) |
For certain types of derivative transactions, the Funds have entered into International Swaps and Derivatives Association, Inc. master agreements (“ISDA Master Agreements”) or similar agreements with approved counterparties. The ISDA Master Agreements or similar agreements may have requirements to deliver/deposit securities or cash to/with an
| | | | | | |
| Notes to financial statements | | Wells Fargo Dynamic Target Date Funds | | | 103 | |
exchange or broker-dealer as collateral and allows the Fund to offset, with each counterparty, certain derivative financial instrument’s assets and/or liabilities with collateral held or pledged. Collateral requirements differ by type of derivative. Collateral or margin requirements are set by the broker or exchange clearing house for exchange traded derivatives while collateral terms are contract specific for over-the-counter traded derivatives. Cash collateral that has been pledged to cover obligations of the Funds under ISDA Master Agreements or similar agreements, if any, are reported separately in the Statements of Assets and Liabilities. Securities pledged as collateral, if any, are noted in the Portfolio of Investments. With respect to balance sheet offsetting, absent an event of default by the counterparty or a termination of the agreement, the reported amounts of financial assets and financial liabilities in the Statements of Assets and Liabilities are not offset across transactions between the Fund and the applicable counterparty. A reconciliation of the gross amounts on the Statements of Assets and Liabilities to the net amounts by derivative type, including any collateral exposure, is as follows:
| | | | | | | | | | | | | | | | | | | | |
| | | Derivative type | | Counterparty | | Gross amounts
of assets in the
Statements of
Assets and
Liabilities | | | Amounts
subject to
netting
agreements | | | Collateral
received | | | Net amount
of assets | |
Dynamic Target Today Fund | | Futures – variation margin | | Goldman Sachs | | $ | 31 | | | $ | 0 | | | $ | 0 | | | $ | 31 | |
Dynamic Target 2015 Fund | | Futures – variation margin | | Goldman Sachs | | | 31 | | | | 0 | | | | 0 | | | | 31 | |
Dynamic Target 2020 Fund | | Futures – variation margin | | Goldman Sachs | | | 31 | | | | 0 | | | | 0 | | | | 31 | |
Dynamic Target 2025 Fund | | Futures – variation margin | | Goldman Sachs | | | 31 | | | | 0 | | | | 0 | | | | 31 | |
Dynamic Target 2030 Fund | | Futures – variation margin | | Goldman Sachs | | | 31 | | | | 0 | | | | 0 | | | | 31 | |
Dynamic Target 2035 Fund | | Futures – variation margin | | Goldman Sachs | | | 31 | | | | 0 | | | | 0 | | | | 31 | |
Dynamic Target 2040 Fund | | Futures – variation margin | | Goldman Sachs | | | 31 | | | | 0 | | | | 0 | | | | 31 | |
Dynamic Target 2045 Fund | | Futures – variation margin | | Goldman Sachs | | | 31 | | | | 0 | | | | 0 | | | | 31 | |
Dynamic Target 2050 Fund | | Futures – variation margin | | Goldman Sachs | | | 31 | | | | 0 | | | | 0 | | | | 31 | |
Dynamic Target 2055 Fund | | Futures – variation margin | | Goldman Sachs | | | 31 | | | | 0 | | | | 0 | | | | 31 | |
Dynamic Target 2060 Fund | | Futures – variation margin | | Goldman Sachs | | | 31 | | | | 0 | | | | 0 | | | | 31 | |
8. DISTRIBUTIONS TO SHAREHOLDERS
The tax character of distributions paid during the period from November 30, 2015 (commencement of operations) to May 31, 2016 were as follows:
| | | | |
| | | Ordinary income | |
Dynamic Target Today Fund | | $ | 18,899 | |
Dynamic Target 2015 Fund | | | 23,382 | |
Dynamic Target 2020 Fund | | | 25,488 | |
Dynamic Target 2025 Fund | | | 27,894 | |
Dynamic Target 2030 Fund | | | 29,810 | |
Dynamic Target 2035 Fund | | | 31,226 | |
Dynamic Target 2040 Fund | | | 32,393 | |
Dynamic Target 2045 Fund | | | 32,657 | |
Dynamic Target 2050 Fund | | | 32,585 | |
Dynamic Target 2055 Fund | | | 32,585 | |
Dynamic Target 2060 Fund | | | 32,586 | |
| | | | |
| 104 | | Wells Fargo Dynamic Target Date Funds | | Notes to financial statements |
As of May 31, 2016, the components of distributable earnings on a tax basis were as follows:
| | | | | | | | | | | | |
| | | Undistributed
ordinary
income | | | Undistributed
long-term
gain | | | Unrealized
gains
(losses) | |
Dynamic Target Today Fund | | $ | 29,433 | | | $ | 33,788 | | | $ | (24,327 | ) |
Dynamic Target 2015 Fund | | | 26,353 | | | | 47,342 | | | | (59,995 | ) |
Dynamic Target 2020 Fund | | | 24,266 | | | | 80,510 | | | | (98,561 | ) |
Dynamic Target 2025Fund | | | 22,478 | | | | 82,609 | | | | (117,109 | ) |
Dynamic Target 2030 Fund | | | 20,699 | | | | 97,730 | | | | (150,634 | ) |
Dynamic Target 2035 Fund | | | 19,497 | | | | 99,512 | | | | (172,729 | ) |
Dynamic Target 2040 Fund | | | 18,542 | | | | 100,638 | | | | (183,879 | ) |
Dynamic Target 2045 Fund | | | 18,377 | | | | 108,542 | | | | (186,301 | ) |
Dynamic Target 2050 Fund | | | 18,348 | | | | 108,756 | | | | (186,582 | ) |
Dynamic Target 2055 Fund | | | 18,338 | | | | 111,466 | | | | (186,855 | ) |
Dynamic Target 2060 Fund | | | 18,379 | | | | 116,843 | | | | (186,303 | ) |
9. CONCENTRATION OF OWNERSHIP
As of May 31, 2016, the Funds were primarily owned by Wells Fargo. Investment by and/or voting activities of Wells Fargo with respect to their holdings in each Fund could have a material impact on the Fund. At May 31, 2016, Wells Fargo’s ownership of each Fund was as follows:
| | | | |
| | | % of
ownership | |
Dynamic Target Today Fund | | | 100.00 | % |
Dynamic Target 2015 Fund | | | 98.08 | % |
Dynamic Target 2020 Fund | | | 99.63 | % |
Dynamic Target 2025 Fund | | | 98.27 | % |
Dynamic Target 2030 Fund | | | 98.54 | % |
Dynamic Target 2035 Fund | | | 99.60 | % |
Dynamic Target 2040 Fund | | | 98.84 | % |
Dynamic Target 2045 Fund | | | 99.56 | % |
Dynamic Target 2050 Fund | | | 99.82 | % |
Dynamic Target 2055 Fund | | | 99.93 | % |
Dynamic Target 2060 Fund | | | 99.96 | % |
10. INDEMNIFICATION
Under the Trust’s organizational documents, the officers and Trustees have been granted certain indemnification rights against certain liabilities that may arise out of performance of their duties to the Trust. Additionally, in the normal course of business, the Trust may enter into contracts with service providers that contain a variety of indemnification clauses. The Trust’s maximum exposure under these arrangements is dependent on future claims that may be made against the Funds and, therefore, cannot be estimated.
| | | | | | |
| Report of independent registered public accounting firm | | Wells Fargo Dynamic Target Date Funds | | | 105 | |
BOARD OF TRUSTEES AND SHAREHOLDERS OF WELLS FARGO FUNDS TRUST:
We have audited the accompanying statements of assets and liabilities, including the portfolios of investments, of the Wells Fargo Dynamic Target Today Fund, Wells Fargo Dynamic Target 2015 Fund, Wells Fargo Dynamic Target 2020 Fund, Wells Fargo Dynamic Target 2025 Fund, Wells Fargo Dynamic Target 2030 Fund, Wells Fargo Dynamic Target 2035 Fund, Wells Fargo Dynamic Target 2040 Fund, Wells Fargo Dynamic Target 2045 Fund, Wells Fargo Dynamic Target 2050 Fund, Wells Fargo Dynamic Target 2055 Fund, and Wells Fargo Dynamic Target 2060 Fund (the “Funds”), eleven of the funds constituting the Wells Fargo Funds Trust, as of May 31, 2016, and the related statements of operations, the statements of changes in net assets, and the financial highlights for the period from November 30, 2015 (commencement of operations) to May 31, 2016. These financial statements and financial highlights are the responsibility of the Funds’ management. Our responsibility is to express an opinion on these financial statements and financial highlights based on our audits.
We conducted our audits in accordance with the standards of the Public Company Accounting Oversight Board (United States). Those standards require that we plan and perform the audit to obtain reasonable assurance about whether the financial statements and financial highlights are free of material misstatement. An audit includes examining, on a test basis, evidence supporting the amounts and disclosures in the financial statements. Our procedures included confirmation of investments owned as of May 31, 2016, by correspondence with the custodian or the transfer agent or by other appropriate audit procedures. An audit also includes assessing the accounting principles used and significant estimates made by management, as well as evaluating the overall financial statement presentation. We believe that our audits provide a reasonable basis for our opinion.
In our opinion, the financial statements and financial highlights referred to above present fairly, in all material respects, the financial position of each of the aforementioned Funds of the Wells Fargo Funds Trust as of May 31, 2016, the results of their operations, the changes in their net assets, and the financial highlights for the period from November 30, 2015 (commencement of operations) to May 31, 2016, in conformity with U.S. generally accepted accounting principles.

Boston, Massachusetts
July 27, 2016
| | | | |
| 106 | | Wells Fargo Dynamic Target Date Funds | | Other information (unaudited) |
TAX INFORMATION
For corporate shareholders, pursuant to Section 854 of the Internal Revenue Code, the percentage of ordinary income dividends qualifying for the corporate dividends-received deduction was as follows for the fiscal year ended May 31, 2016:
| | | | |
| | | Dividends-received
deduction | |
Dynamic Target 2015 Fund | | | 5.41 | % |
Dynamic Target 2020 Fund | | | 6.32 | |
Dynamic Target 2025 Fund | | | 7.15 | |
Dynamic Target 2030 Fund | | | 7.94 | |
Dynamic Target 2035 Fund | | | 8.42 | |
Dynamic Target 2040 Fund | | | 8.74 | |
Dynamic Target 2045 Fund | | | 8.83 | |
Dynamic Target 2050 Fund | | | 8.83 | |
Dynamic Target 2055 Fund | | | 8.82 | |
Dynamic Target 2060 Fund | | | 8.82 | |
Pursuant to Section 854 of the Internal Revenue Code, the following amounts of income dividends paid during the fiscal year ended May 31, 2016 have been designated as qualified dividend income (QDI):
| | | | |
| | | QDI | |
Dynamic Target 2015 Fund | | $ | 1,514 | |
Dynamic Target 2020 Fund | | | 1,882 | |
Dynamic Target 2025 Fund | | | 2,294 | |
Dynamic Target 2030 Fund | | | 2,689 | |
Dynamic Target 2035 Fund | | | 2,968 | |
Dynamic Target 2040 Fund | | | 3,184 | |
Dynamic Target 2045 Fund | | | 3,237 | |
Dynamic Target 2050 Fund | | | 3,228 | |
Dynamic Target 2055 Fund | | | 3,226 | |
Dynamic Target 2060 Fund | | | 3,228 | |
For the fiscal year ended May 31, 2016, the following amounts have been designated as interest-related dividends for nonresident alien shareholders pursuant to Section 871 of the Internal Revenue Code:
| | | | |
| | | Interest-related dividends | |
Dynamic Target Today Fund | | $ | 2,708 | |
Dynamic Target 2015 Fund | | | 2,399 | |
Dynamic Target 2020 Fund | | | 2,016 | |
Dynamic Target 2025 Fund | | | 1,632 | |
Dynamic Target 2030 Fund | | | 1,145 | |
Dynamic Target 2035 Fund | | | 809 | |
Dynamic Target 2040 Fund | | | 522 | |
Dynamic Target 2045 Fund | | | 438 | |
Dynamic Target 2050 Fund | | | 437 | |
Dynamic Target 2055 Fund | | | 437 | |
Dynamic Target 2060 Fund | | | 437 | |
| | | | | | |
| Other information (unaudited) | | Wells Fargo Dynamic Target Date Funds | | | 107 | |
For the fiscal year ended May 31, 2016, the percentage of ordinary income distributed which was derived from interest on U.S. government securities was as follows:
| | | | |
| | | % of U.S. government income | |
Dynamic Target Today Fund | | | 2.64 | % |
Dynamic Target 2015 Fund | | | 1.88 | |
Dynamic Target 2020 Fund | | | 1.44 | |
Dynamic Target 2025 Fund | | | 1.06 | |
PROXY VOTING INFORMATION
A description of the policies and procedures used to determine how to vote proxies relating to portfolio securities is available without charge, upon request, by calling 1-800-222-8222, visiting our website at wellsfargofunds.com, or visiting the SEC website at sec.gov. Information regarding how the proxies related to portfolio securities were voted during the most recent 12-month period ended June 30 is available on the website at wellsfargofunds.com or by visiting the SEC website at sec.gov.
PORTFOLIO HOLDINGS INFORMATION
The complete portfolio holdings are publicly available on the website (wellsfargofunds.com) on a one-month delayed basis. In addition, top ten holdings information (excluding derivative positions) is publicly available on the website on a monthly, seven-day or more delayed basis. Each Fund files its complete schedule of portfolio holdings with the SEC for the first and third quarters of each fiscal year on Form N-Q, which is available by visiting the SEC website at sec.gov. In addition, each Form N-Q may be reviewed and copied at the SEC’s Public Reference Room in Washington, DC, and at regional offices in New York City, at 233 Broadway, and in Chicago, at 175 West Jackson Boulevard, Suite 900. Information about the Public Reference Room may be obtained by calling 1-800-SEC-0330.
| | | | |
| 108 | | Wells Fargo Dynamic Target Date Funds | | Other information (unaudited) |
BOARD OF TRUSTEES AND OFFICERS
Each of the Trustees and Officers1 listed in the table below acts in identical capacities for each fund in the Wells Fargo family of funds, which consists of 142 mutual funds comprising the Wells Fargo Funds Trust, Wells Fargo Variable Trust, Wells Fargo Master Trust and four closed-end funds (collectively the “Fund Complex”). This table should be read in conjunction with the Prospectus and the Statement of Additional Information2. The mailing address of each Trustee and Officer is 525 Market Street, 12th Floor, San Francisco, CA 94105. Each Trustee and Officer serves an indefinite term, however, each Trustee serves such term until reaching the mandatory retirement age established by the Trustees.
Independent Trustees
| | | | | | |
Name and
year of birth | | Position held and
length of service* | | Principal occupations during past five years or longer | | Current other public
company or investment
company directorships |
| William R. Ebsworth (Born 1957) | | Trustee, since 2015 | | Retired. From 1984 to 2013, equities analyst, portfolio manager, research director and chief financial officer at Fidelity Management and Research Company in Boston, Tokyo, and Hong Kong and retired in 2013 as Chief Investment Officer of Fidelity Strategic Advisers, Inc. where he lead a team of investment professionals managing client assets. Prior thereto, Board member of Hong Kong Securities Clearing Co., Hong Kong Options Clearing Corp., the Thailand International Fund, Ltd., Fidelity Investments Life Insurance Company, and Empire Fidelity Investments Life Insurance Company. Mr. Ebsworth is a CFA® charterholder and an Adjunct Lecturer, Finance, at Babson College. | | Asset Allocation Trust |
| Jane A. Freeman (Born 1953) | | Trustee, since 2015 | | Retired. From 2012 to 2014 and 1999 to 2008, Chief Financial Officer of Scientific Learning Corporation. From 2008 to 2012, Ms. Freeman provided consulting services related to strategic business projects. Prior to 1999, Portfolio Manager at Rockefeller & Co. and Scudder, Stevens & Clark. Board member of the Harding Loevner Funds from 1996 to 2014, serving as both Lead Independent Director and chair of the Audit Committee. Board member of the Russell Exchange Traded Funds Trust from 2011 to 2012 and the chair of the Audit Committee. Ms. Freeman is Chair of Taproot Foundation (non-profit organization), a Board Member of Ruth Bancroft Garden (non-profit organization) and an inactive chartered financial analyst. | | Asset Allocation Trust |
| Peter G. Gordon (Born 1942) | | Trustee, since 1998; Chairman, since 2005 | | Co-Founder, Retired Chairman, President and CEO of Crystal Geyser Water Company. Trustee Emeritus, Colby College. | | Asset Allocation Trust |
| Isaiah Harris, Jr. (Born 1952) | | Trustee, since 2009 | | Retired. Chairman of the Board of CIGNA Corporation since 2009, and Director since 2005. From 2003 to 2011, Director of Deluxe Corporation. Prior thereto, President and CEO of BellSouth Advertising and Publishing Corp. from 2005 to 2007, President and CEO of BellSouth Enterprises from 2004 to 2005 and President of BellSouth Consumer Services from 2000 to 2003. Emeritus member of the Iowa State University Foundation Board of Governors. Emeritus Member of the Advisory Board of Iowa State University School of Business. Advisory Board Member, Palm Harbor Academy (charter school). Advisory Board Member, Child Evangelism Fellowship (non-profit). Mr. Harris is a certified public accountant (inactive status). | | CIGNA Corporation; Asset Allocation Trust |
| Judith M. Johnson (Born 1949) | | Trustee, since 2008; Audit Committee Chairman, since 2008 | | Retired. Prior thereto, Chief Executive Officer and Chief Investment Officer of Minneapolis Employees Retirement Fund from 1996 to 2008. Ms. Johnson is an attorney, certified public accountant and a certified managerial accountant. | | Asset Allocation Trust |
| David F. Larcker (Born 1950) | | Trustee, since 2009 | | James Irvin Miller Professor of Accounting at the Graduate School of Business, Stanford University, Director of the Corporate Governance Research Initiative and Senior Faculty of The Rock Center for Corporate Governance since 2006. From 2005 to 2008, Professor of Accounting at the Graduate School of Business, Stanford University. Prior thereto, Ernst & Young Professor of Accounting at The Wharton School, University of Pennsylvania from 1985 to 2005. | | Asset Allocation Trust |
| | | | | | |
| Other information (unaudited) | | Wells Fargo Dynamic Target Date Funds | | | 109 | |
| | | | | | |
Name and
year of birth | | Position held and
length of service* | | Principal occupations during past five years or longer | | Current other public
company or investment
company directorships |
| Olivia S. Mitchell (Born 1953) | | Trustee, since 2006 | | International Foundation of Employee Benefit Plans Professor, Wharton School of the University of Pennsylvania since 1993. Director of Wharton’s Pension Research Council and Boettner Center on Pensions & Retirement Research, and Research Associate at the National Bureau of Economic Research. Previously, Cornell University Professor from 1978 to 1993. | | Asset Allocation Trust |
| Timothy J. Penny (Born 1951) | | Trustee, since 1996 | | President and Chief Executive Officer of Southern Minnesota Initiative Foundation, a non-profit organization, since 2007 and Senior Fellow at the Humphrey Institute Policy Forum at the University of Minnesota since 1995. Member of the Board of Trustees of NorthStar Education Finance, Inc., a non-profit organization, since 2007. | | Asset Allocation Trust |
| Michael S. Scofield (Born 1943) | | Trustee, since 2010 | | Served on the Investment Company Institute’s Board of Governors and Executive Committee from 2008-2011 as well the Governing Council of the Independent Directors Council from 2006-2011 and the Independent Directors Council Executive Committee from 2008-2011. Chairman of the IDC from 2008-2010. Institutional Investor (Fund Directions) Trustee of Year in 2007. Trustee of the Evergreen Funds complex (and its predecessors) from 1984 to 2010. Chairman of the Evergreen Funds from 2000-2010. Former Trustee of the Mentor Funds. Retired Attorney, Law Offices of Michael S. Scofield. | | Asset Allocation Trust |
| * | Length of service dates reflect the Trustee’s commencement of service with the Trust’s predecessor entities, where applicable. |
Officers
| | | | | | |
Name and year of birth | | Position held and length of service | | Principal occupations during past five years or longer | | |
Karla M. Rabusch (Born 1959) | | President, since 2003 | | Executive Vice President of Wells Fargo Bank, N.A. and President of Wells Fargo Funds Management, LLC since 2003. | | |
Jeremy DePalma1 (Born 1974) | | Treasurer, since 2012 | | Senior Vice President of Wells Fargo Funds Management, LLC since 2009. Senior Vice President of Evergreen Investment Management Company, LLC from 2008 to 2010 and head of the Fund Reporting and Control Team within Fund Administration from 2005 to 2010. | | |
C. David Messman (Born 1960) | | Secretary, since 2000; Chief Legal Officer, since 2003 | | Senior Vice President and Secretary of Wells Fargo Funds Management, LLC since 2001. Assistant General Counsel of Wells Fargo Bank, N.A. since 2013 and Vice President and Managing Counsel of Wells Fargo Bank, N.A. from 1996 to 2013. | | |
Michael Whitaker (Born 1967) | | Chief Compliance Officer, since 2016* | | Executive Vice President of Wells Fargo Funds Management, LLC since 2016. Chief Compliance Officer of Fidelity’s Fixed Income Funds and Asset Allocation Funds from 2008 to 2016, Compliance Officer of FMR Co., Inc. from 2014 to 2016, Fidelity Investments Money Management, Inc. from 2014 to 2016, Fidelity Investments from 2007 to 2016. | | |
David Berardi (Born 1975) | | Assistant Treasurer, since 2009 | | Vice President of Wells Fargo Funds Management, LLC since 2009. Vice President of Evergreen Investment Management Company, LLC from 2008 to 2010. Manager of Fund Reporting and Control for Evergreen Investment Management Company, LLC from 2004 to 2010. | | |
| 1 | Jeremy DePalma acts as Treasurer of 69 funds and Assistant Treasurer of 73 funds in the Fund Complex. |
| 2 | The Statement of Additional Information includes additional information about the Trustees and is available, without charge, upon request, by calling 1-800-222-8222 or by visiting the website at wellsfargofunds.com. |
| * | Michael Whitaker became Chief Compliance Officer effective May 16, 2016. |
| | | | |
| 110 | | Wells Fargo Dynamic Target Date Funds | | Other information (unaudited) |
BOARD CONSIDERATION OF INVESTMENT MANAGEMENT AND SUB-ADVISORY AGREEMENTS:
Wells Fargo Dynamic Target Today Fund, Wells Fargo Dynamic Target 2015 Fund, Wells Fargo Dynamic Target 2020 Fund, Wells Fargo Dynamic Target 2025 Fund, Wells Fargo Dynamic Target 2030 Fund, Wells Fargo Dynamic Target 2035 Fund, Wells Fargo Dynamic Target 2040 Fund, Wells Fargo Dynamic Target 2045 Fund, Wells Fargo Dynamic Target 2050 Fund, Wells Fargo Dynamic Target 2055 Fund, and Wells Fargo Dynamic Target 2060 Fund
Under the Investment Company Act of 1940 (the “1940 Act”), the Board of Trustees (the “Board”) of Wells Fargo Funds Trust (the “Trust”), all the members of which have no direct or indirect interest in the investment management and sub-advisory agreements and are not “interested persons” of the Trust, as defined in the 1940 Act (the “Independent Trustees”), reviewed and approved at an in-person meeting held on May 24-25, 2016 (the “Meeting”) an investment management agreement (the “Management Agreement”) with Wells Fargo Funds Management, LLC (“Funds Management”) for Wells Fargo Dynamic Target Today Fund, Wells Fargo Dynamic Target 2015 Fund, Wells Fargo Dynamic Target 2020 Fund, Wells Fargo Dynamic Target 2025 Fund, Wells Fargo Dynamic Target 2030 Fund, Wells Fargo Dynamic Target 2035 Fund, Wells Fargo Dynamic Target 2040 Fund, Wells Fargo Dynamic Target 2045 Fund, Wells Fargo Dynamic Target 2050 Fund, Wells Fargo Dynamic Target 2055 Fund, and Wells Fargo Dynamic Target 2060 Fund (each, a “Fund” and collectively, the “Funds”); and (ii) an investment sub-advisory agreement (the “Sub-Advisory Agreement”) with Wells Capital Management Incorporated (the “Sub-Adviser”) for each of the Funds. The Management Agreement and the Sub-Advisory Agreement are collectively referred to as the “Advisory Agreements.” The Board noted that the Funds commenced operations in 2015.
At the Meeting, the Board considered the factors and reached the conclusions described below relating to the selection of Funds Management and the Sub-Adviser and the approval of the Advisory Agreements. Prior to the Meeting, including at an in-person meeting in April 2016, the Trustees conferred extensively among themselves and with representatives of Funds Management about these matters. Also, the Board has adopted a team-based approach, with each team consisting of a sub-set of Trustees, to assist the full Board in the discharge of its duties in reviewing performance and other matters throughout the year. The Independent Trustees were assisted in their evaluation of the Advisory Agreements by independent legal counsel, from whom they received separate legal advice and with whom they met separately.
In providing information to the Board, Funds Management and the Sub-Adviser were guided by a detailed set of requests for information submitted to them by independent legal counsel on behalf of the Independent Trustees at the start of the Board’s annual contract renewal process earlier in 2016. In considering and approving the Advisory Agreements, the Trustees considered the information they believed relevant, including but not limited to the information discussed below. The Board considered not only the specific information presented in connection with the Meeting, but also the knowledge gained over time through interaction with Funds Management and the Sub-Adviser about various topics. In this regard, the Board reviewed reports of Funds Management at each of its quarterly meetings, which included, among other things, portfolio reviews and performance reports. In addition, the Board and the teams mentioned above confer with portfolio managers at various times throughout the year. The Board did not identify any particular information or consideration that was all-important or controlling, and each individual Trustee may have attributed different weights to various factors.
After its deliberations, the Board unanimously approved the continuation of the Advisory Agreements for a one-year term and determined that the compensation payable to Funds Management and the Sub-Adviser under each of the Advisory Agreements was reasonable. The Board considered the approval of the Advisory Agreements for the Fund as part of its consideration of agreements for funds across the complex, but its approvals were made on a fund-by-fund basis. The following summarizes a number of important, but not necessarily all, factors considered by the Board in support of its approvals.
Nature, Extent and Quality of Services
The Board received and considered various information regarding the nature, extent and quality of services provided to the Fund by Funds Management and the Sub-Adviser under the Advisory Agreements. This information included a description of the investment advisory services and Fund-level administrative services covered by the Management Agreement, as well as, among other things, a summary of the background and experience of senior management of Funds Management, and the qualifications, background, tenure and responsibilities of each of the portfolio managers primarily responsible for the day-to-day portfolio management of the Fund.
| | | | | | |
| Other information (unaudited) | | Wells Fargo Dynamic Target Date Funds | | | 111 | |
The Board evaluated the ability of Funds Management and the Sub-Adviser to attract and retain qualified investment professionals, including research, advisory and supervisory personnel. The Board further considered the compliance programs and compliance records of Funds Management and the Sub-Adviser. In addition, the Board took into account the full range of services provided to the Fund by Funds Management and its affiliates.
Fund Performance and Expenses
The Board acknowledged that the Funds had commenced operations in 2015 and have no performance record. The Board noted that it would have the opportunity to review performance information relating to the Funds on an on-going basis and in connection with future annual reviews of advisory agreements.
The Board also received and considered information regarding the Funds’ net operating expense ratios and their various components, including actual management fees, custodian and other non-management fees, and Rule 12b-1 and non-Rule 12b-1 shareholder service fees. The Board considered these ratios in comparison to the median ratios of funds in class-specific expense groups that were determined by Broadridge to be similar to the Funds (the “Groups”). The Board received a description of the methodology used by Broadridge to select the mutual funds in the expense Groups and an explanation of how funds comprising expense groups and their expense ratios may vary from year-to-year. Based on the Broadridge reports, the Board noted that: 1) the net operating expense ratios of the Wells Fargo Target Today Fund were lower than the median net operating expense ratios of the expense Groups for all share classes except Class R and Class A; 2) the net operating expense ratios of the Wells Fargo Target 2015 Fund were lower than or in range of the median net operating expense ratios of the expense Groups for all share classes except Class R; 3) the net operating expense ratios of the Wells Fargo Target 2020 Fund were lower than or in range of the median net operating expense ratios of the expense Groups for all share classes; 4) the net operating expense ratios of the Wells Fargo Target 2025 Fund were lower than, equal to or in range of the median net operating expense ratios of the expense Groups for all share classes; 5) the net operating expense ratios of the Wells Fargo Target 2030 Fund were lower than or in range of the median net operating expense ratios of the expense Groups for all share classes; 6) the net operating expense ratios of the Wells Fargo Target 2035 Fund were lower than or in range of the median net operating expense ratios of the expense Groups for all share classes; 7) the net operating expense ratios of the Wells Fargo Target 2040 Fund were lower than or equal to the median net operating expense ratios of the expense Groups for all share classes; 8) the net operating expense ratios of the Wells Fargo Target 2045 Fund were lower than, equal to or in range of the median net operating expense ratios of the expense Groups for all share classes; 9) the net operating expense ratios of the Wells Fargo Target 2050 Fund were lower than or equal to the median net operating expense ratios of the expense Groups for all share classes; 10) the net operating expense ratios of the Wells Fargo Target 2055 Fund were lower than or in range of the median net operating expense ratios of the expense Groups for all share classes; and 11) the net operating expense ratios of the Wells Fargo Target 2060 Fund were lower than or equal to the median net operating expense ratios of the expense Groups for all share classes.
The Board took into account the Funds’ performance and expense information provided to it among the factors considered in deciding to re-approve the Advisory Agreements.
Investment Management Fee Rates
The Board reviewed and considered the contractual fee rates payable by the Funds to Funds Management under the Management Agreement, as well as the contractual fee rates payable by the Funds to Funds Management for class-level administrative services under a Class-Level Administration Agreement, which include class-level transfer agency and sub-transfer agency costs (collectively, the “Management Rates”). The Board also reviewed and considered the contractual investment sub-advisory fee rates that are payable by Funds Management to the Sub-Adviser for investment sub-advisory services.
Among other information reviewed by the Board was a comparison of the Funds’ Management Rates with the average contractual investment management fee rates of funds in the expense Groups at a common asset level as well as transfer agency costs of the funds in the expense Groups. The Board noted that the Management Rates of the Funds were in range of the sum of these average rates for the Fund’s expense Groups for all share classes except Class R and Class A.
The Board also received and considered information about the portion of the total management fee that was retained by Funds Management after payment of the fee to the Sub-Adviser for sub-advisory services. In assessing the reasonableness of this amount, the Board received and evaluated information about the nature and extent of responsibilities retained and risks assumed by Funds Management and not delegated to or assumed by the Sub-Adviser, and about Funds Management’s on-going oversight services. However, given the affiliation between Funds Management and the Sub-Adviser, the Board ascribed limited relevance to the allocation of the fees between them.
| | | | |
| 112 | | Wells Fargo Dynamic Target Date Funds | | Other information (unaudited) |
Based on its consideration of the factors and information it deemed relevant, including those described here, the Board determined that the compensation payable to Funds Management under the Management Agreement and to the Sub-Adviser under the Sub-Advisory Agreement was reasonable, in light of the services covered by the Advisory Agreements.
Profitability
The Board received and considered information concerning the profitability of Funds Management, as well as the profitability of Wells Fargo as a whole, from providing services to the Funds and the fund family as a whole. The Board also received and considered information concerning the profitability of the Sub-Adviser from providing services to the fund family as a whole, noting that the Sub-Adviser’s profitability information with respect to providing services to the Funds was subsumed in the Wells Fargo and Funds Management profitability analysis.
Funds Management reported on the methodologies and estimates used in calculating profitability. Among other things, the Board noted that the levels of profitability reported on a fund-by-fund basis varied widely, depending on factors such as the size and type of fund. Based on its review, the Board did not deem the profits reported by Funds Management or Wells Fargo from its services to the Funds to be at a level that would prevent it from approving the continuation of the Advisory Agreements.
Economies of Scale
With respect to possible economies of scale, the Board noted the existence of breakpoints in the Funds’ management fee structure, which operate generally to reduce the Funds’ expense ratios as the Funds grow in size. It considered that, for a small fund or a fund that shrinks in size, breakpoints conversely can result in higher fee levels. The Board also considered that fee waiver and expense reimbursement arrangements and competitive fee rates at the outset are means of sharing potential economies of scale with shareholders of the Funds and the fund family as a whole. The Board considered Funds Management’s view that any analyses of potential economies of scale in managing a particular fund are inherently limited in light of the joint and common costs and investments that Funds Management incurs across the fund family as a whole.
The Board concluded that the Funds’ fee and expense arrangements, including contractual breakpoints, constituted a reasonable approach to sharing potential economies of scale with the Funds and their shareholders.
Other Benefits to Funds Management and the Sub-Adviser
The Board received and considered information regarding potential “fall-out” or ancillary benefits received by Funds Management and its affiliates, including the Sub-Adviser, as a result of their relationships with the Funds. Ancillary benefits could include, among others, benefits directly attributable to other relationships with the Funds and benefits potentially derived from an increase in Funds Management’s and the Sub-Adviser’s business as a result of their relationships with the Funds. The Board noted that various affiliates of Funds Management may receive distribution-related fees, shareholder servicing payments and sub-transfer agency fees in respect of shares sold or held through them and services provided.
The Board also reviewed information about soft dollar credits earned and utilized by the Sub-Adviser, fees earned by Funds Management and the Sub-Adviser from managing a private investment vehicle for the fund family’s securities lending collateral and commissions earned by an affiliated broker from portfolio transactions.
Based on its consideration of the factors and information it deemed relevant, including those described here, the Board did not find that any ancillary benefits received by Funds Management and its affiliates, including the Sub-Adviser, were unreasonable.
Conclusion
At the Meeting, after considering the above-described factors and based on its deliberations and its evaluation of the information described above, the Board unanimously approved the continuation of the Advisory Agreements for a one-year term and determined that the compensation payable to Funds Management and the Sub-Adviser under each of the Advisory Agreements was reasonable.
| | | | | | |
| List of abbreviations | | Wells Fargo Dynamic Target Date Funds | | | 113 | |
The following is a list of common abbreviations for terms and entities that may have appeared in this report.
| ACA | — ACA Financial Guaranty Corporation |
| ADR | — American depositary receipt |
| ADS | — American depositary shares |
| AGC | — Assured Guaranty Corporation |
| AGM | — Assured Guaranty Municipal |
| Ambac | — Ambac Financial Group Incorporated |
| AMT | — Alternative minimum tax |
| BAN | — Bond anticipation notes |
| BHAC | — Berkshire Hathaway Assurance Corporation |
| CAB | — Capital appreciation bond |
| CCAB | — Convertible capital appreciation bond |
| CDA | — Community Development Authority |
| CDO | — Collateralized debt obligation |
| DRIVER | — Derivative inverse tax-exempt receipts |
| DW&P | — Department of Water & Power |
| DWR | — Department of Water Resources |
| ECFA | — Educational & Cultural Facilities Authority |
| EDA | — Economic Development Authority |
| EDFA | — Economic Development Finance Authority |
| ETF | — Exchange-traded fund |
| FDIC | — Federal Deposit Insurance Corporation |
| FFCB | — Federal Farm Credit Banks |
| FGIC | — Financial Guaranty Insurance Corporation |
| FHA | — Federal Housing Administration |
| FHLB | — Federal Home Loan Bank |
| FHLMC | — Federal Home Loan Mortgage Corporation |
| FICO | — The Financing Corporation |
| FNMA | — Federal National Mortgage Association |
| GDR | — Global depositary receipt |
| GNMA | — Government National Mortgage Association |
| HCFR | — Healthcare facilities revenue |
| HEFA | — Health & Educational Facilities Authority |
| HEFAR | — Higher education facilities authority revenue |
| HFA | — Housing Finance Authority |
| HFFA | — Health Facilities Financing Authority |
| HUD | — Department of Housing and Urban Development |
| IDA | — Industrial Development Authority |
| IDAG | — Industrial Development Agency |
| KRW | — Republic of Korea won |
| LIBOR | — London Interbank Offered Rate |
| LIFER | — Long Inverse Floating Exempt Receipts |
| LLC | — Limited liability company |
| LLLP | — Limited liability limited partnership |
| LLP | — Limited liability partnership |
| MBIA | — Municipal Bond Insurance Association |
| MFHR | — Multifamily housing revenue |
| MSTR | — Municipal securities trust receipts |
| MUD | — Municipal Utility District |
| National | — National Public Finance Guarantee Corporation |
| PCFA | — Pollution Control Financing Authority |
| PCL | — Public Company Limited |
| PCR | — Pollution control revenue |
| PFA | — Public Finance Authority |
| PFFA | — Public Facilities Financing Authority |
| PFOTER | — Puttable floating option tax-exempt receipts |
| plc | — Public limited company |
| PUTTER | — Puttable tax-exempt receipts |
| R&D | — Research & development |
| Radian | — Radian Asset Assurance |
| RAN | — Revenue anticipation notes |
| RDA | — Redevelopment Authority |
| RDFA | — Redevelopment Finance Authority |
| REIT | — Real estate investment trust |
| ROC | — Reset option certificates |
| SAVRS | — Select auction variable rate securities |
| SBA | — Small Business Authority |
| SDR | — Swedish depositary receipt |
| SFHR | — Single-family housing revenue |
| SFMR | — Single-family mortgage revenue |
| SPA | — Standby purchase agreement |
| SPDR | — Standard & Poor’s Depositary Receipts |
| SPEAR | — Short Puttable Exempt Adjustable Receipts |
| STRIPS | — Separate trading of registered interest and |
| TAN | — Tax anticipation notes |
| TIPS | — Treasury inflation-protected securities |
| TRAN | — Tax revenue anticipation notes |
| TTFA | — Transportation Trust Fund Authority |
| TVA | — Tennessee Valley Authority |
This page is intentionally left blank.
This page is intentionally left blank.
This page is intentionally left blank.

For more information
More information about Wells Fargo Funds is available free upon request. To obtain literature, please write, email, visit the Funds’ website, or call:
Wells Fargo Funds
P.O. Box 8266
Boston, MA 02266-8266
Email: fundservice@wellsfargo.com
Website: wellsfargofunds.com
Individual investors: 1-800-222-8222
Retail investment professionals: 1-888-877-9275
Institutional investment professionals: 1-866-765-0778
This report and the financial statements contained herein are submitted for the general information of the shareholders of the Funds. If this report is used for promotional purposes, distribution of the report must be accompanied or preceded by a current prospectus. Before investing, please consider the investment objectives, risks, charges, and expenses of the investment. For a current prospectus and, if available, a summary prospectus, containing this information, call 1-800-222-8222 or visit the Funds’ website at wellsfargofunds.com. Read the prospectus carefully before you invest or send money.
Wells Fargo Asset Management (WFAM) is a trade name used by the asset management businesses of Wells Fargo & Company. Wells Fargo Funds Management, LLC, a wholly owned subsidiary of Wells Fargo & Company, provides investment advisory and administrative services for Wells Fargo Funds. Other affiliates of Wells Fargo & Company provide subadvisory and other services for the funds. The funds are distributed by Wells Fargo Funds Distributor, LLC, Member FINRA, an affiliate of Wells Fargo & Company.
NOT FDIC INSURED ¡ NO BANK GUARANTEE ¡ MAY LOSE VALUE
© 2016 Wells Fargo Funds Management, LLC. All rights reserved.
| | |
 | | 243140 07-16 ADTD/AR104 05-16 |
ITEM 2. CODE OF ETHICS
(a) As of the end of the period covered by the report, Wells Fargo Funds Trust has adopted a code of ethics that applies to its President and Treasurer. A copy of the code of ethics is filed as an exhibit to this Form N-CSR.
(c) During the period covered by this report, there were no amendments to the provisions of the code of ethics adopted in Item 2(a) above.
(d) During the period covered by this report, there were no implicit or explicit waivers to the provisions of the code of ethics adopted in Item 2(a) above.
ITEM 3. AUDIT COMMITTEE FINANCIAL EXPERT
The Board of Trustees of Wells Fargo Funds Trust has determined that Judith Johnson is an audit committee financial expert, as defined in Item 3 of Form N-CSR. Mrs. Johnson is independent for purposes of Item 3 of Form N-CSR.
ITEM 4. PRINCIPAL ACCOUNTANT FEES AND SERVICES
(a), (b), (c), (d) The following table presents aggregate fees billed in each of the last two fiscal years for services rendered to the Registrant by the Registrant’s principal accountant. These fees were billed to the registrant and were approved by the Registrant’s audit committee.
| | | | | | | | |
| | | Fiscal | | | Fiscal | |
| | | year ended | | | year ended | |
| | | May 31, 2016 | | | May 31, 2015 | |
Audit fees | | $ | 412,495 | | | $ | 238,000 | |
Audit-related fees | | | — | | | | — | |
Tax fees (1) | | | 83,035 | | | | 64,760 | |
All other fees | | | — | | | | — | |
| | | | | | | | |
| | $ | 495,530 | | | $ | 302,760 | |
| | | | | | | | |
| | | | | | | | |
| (1) | Tax fees consist of fees for tax compliance, tax advice, tax planning and excise tax. |
(e) The Chairman of the Audit Committees is authorized to pre-approve: (1) audit services for the mutual funds of Wells Fargo Funds Trust; (2) non-audit tax or compliance consulting or training services provided to the Funds by the independent auditors (“Auditors”) if the fees for any particular engagement are not anticipated to exceed $50,000; and (3) non-audit tax or compliance consulting or training services provided by the Auditors to a Fund’s investment adviser and its controlling entities (where pre-approval is required because the engagement relates directly to the operations and financial reporting of the Fund) if the fee to the Auditors for any particular engagement is not anticipated to exceed $50,000. For any such pre-approval sought from the Chairman, Management shall prepare a brief description of the proposed services. If the Chairman approves of such service, he or she shall sign the statement prepared by Management. Such written statement shall be presented to the full Committees at their next regularly scheduled meetings.
(f) Not applicable
(g) Not applicable
(h) Not applicable
ITEM 5. AUDIT COMMITTEE OF LISTED REGISTRANTS
Not applicable.
ITEM 6. INVESTMENTS
A Portfolio of Investments for each series of Wells Fargo Funds Trust is included as part of the report to shareholders filed under Item 1 of this Form.
ITEM 7. DISCLOSURE OF PROXY VOTING POLICIES AND PROCEDURES FOR CLOSED-END MANAGEMENT INVESTMENT COMPANIES
Not applicable.
ITEM 8. PORTFOLIO MANAGERS OF CLOSED-END MANAGEMENT INVESTMENT COMPANIES
Not applicable.
ITEM 9. PURCHASES OF EQUITY SECURITIES BY CLOSED-END MANAGEMENT INVESTMENT COMPANY AND AFFILIATED PURCHASERS
Not applicable.
ITEM 10. SUBMISSION OF MATTERS TO A VOTE OF SECURITY HOLDERS
There have been no material changes to the procedures by which shareholders may recommend nominees to the registrant’s Board of Trustees that have been implemented since the registrant’s last provided disclosure in response to the requirements of this Item.
ITEM 11. CONTROLS AND PROCEDURES
(a) The President and Treasurer have concluded that the Wells Fargo Funds Trust (the “Trust”) disclosure controls and procedures (as defined in Rule 30a-3(c) under the Investment Company Act of 1940) provide reasonable assurances that material information relating to the Trust is made known to them by the appropriate persons based on their evaluation of these controls and procedures as of a date within 90 days of the filing of this report.
(b) There were no significant changes in the Trust’s internal controls over financial reporting (as defined in Rule 30a-3(d) under the Investment Company Act of 1940) that occurred during the second fiscal quarter of the period covered by this report that materially affected, or is reasonably likely to materially affect, the registrant’s internal control over financial reporting.
ITEM 12. EXHIBITS
(a)(1) Code of Ethics pursuant to Item 2 of Form N-CSR is filed and attached hereto as Exhibit COE.
(a)(2) Certification pursuant to Rule 30a-2(a) under the Investment Company Act of 1940 (17 CFR 270.30a-2(a)) is filed and attached hereto as Exhibit 99.CERT.
(a)(3) Not applicable.
(b) Certification pursuant to Rule 30a-2(b) under the Investment Company Act of 1940 (17 CFR 270.30a-2(b)) is filed and attached hereto as Exhibit 99.906CERT.
SIGNATURES
Pursuant to the requirements of the Securities Exchange Act of 1934 and the Investment Company Act of 1940, the registrant has duly caused this report to be signed on its behalf by the undersigned, thereunto duly authorized.
| | |
| Wells Fargo Funds Trust |
| |
| By: | | /s/ Karla M. Rabusch |
| | Karla M. Rabusch |
| | President |
|
| Date: July, 27, 2016 |
Pursuant to the requirements of the Securities Exchange Act of 1934 and the Investment Company Act of 1940, this report has been signed below by the following persons on behalf of the registrant and in the capacities and on the date indicated.
| | |
| Wells Fargo Funds Trust |
| |
| By: | | /s/ Karla M. Rabusch |
| | Karla M. Rabusch |
| | President |
|
| Date: July 27, 2016 |
| |
| By: | | /s/ Nancy Wiser |
| | Nancy Wiser |
| | Treasurer |
|
| Date: July 27, 2016 |
| |
| By: | | /s/ Jeremy DePalma |
| | Jeremy DePalma |
| | Treasurer |
|
| Date: July 27, 2016 |