
UNITED STATES
SECURITIES AND EXCHANGE COMMISSION
Washington, D.C. 20549
FORM N-CSR
CERTIFIED SHAREHOLDER REPORT OF REGISTERED
MANAGEMENT INVESTMENT COMPANIES
Investment Company Act file number: 811-09253
Wells Fargo Funds Trust
(Exact name of registrant as specified in charter)
525 Market St., San Francisco, CA 94105
(Address of principal executive offices) (Zip code)
C. David Messman
Wells Fargo Funds Management, LLC
525 Market St., San Francisco, CA 94105
(Name and address of agent for service)
Registrant’s telephone number, including area code: 800-222-8222
Date of fiscal year end: March 31
Registrant is making a filing for 9 of its series:
Wells Fargo Intrinsic Small Cap Value Fund, Wells Fargo Small Cap Opportunities Fund, Wells Fargo Small Cap Value Fund, Wells Fargo Small/Mid Cap Value Fund, Wells Fargo Special Small Cap Value Fund, Wells Fargo Traditional Small Cap Growth Fund, Wells Fargo Precious Metals Fund, Wells Fargo Specialized Technology Fund, and Wells Fargo Utility and Telecommunications Fund.
Date of reporting period: March 31, 2016
| ITEM 1. | REPORT TO STOCKHOLDERS |
Annual Report
March 31, 2016

Wells Fargo Intrinsic Small Cap Value Fund


Reduce clutter. Save trees.
Sign up for electronic delivery of prospectuses and shareholder reports at wellsfargo.com/advantagedelivery
Contents
The views expressed and any forward-looking statements are as of March 31, 2016, unless otherwise noted, and are those of the Fund managers and/or Wells Fargo Funds Management, LLC. Discussions of individual securities, or the markets generally, or any Wells Fargo Fund are not intended as individual recommendations. Future events or results may vary significantly from those expressed in any forward-looking statements. The views expressed are subject to change at any time in response to changing circumstances in the market. Wells Fargo Funds Management, LLC and the Fund disclaim any obligation to publicly update or revise any views expressed or forward-looking statements.
NOT FDIC INSURED ¡ NO BANK GUARANTEE ¡ MAY LOSE VALUE
| | | | |
| 2 | | Wells Fargo Intrinsic Small Cap Value Fund | | Letter to shareholders (unaudited) |

Karla M. Rabusch
President
Wells Fargo Funds
Throughout the period, stock performance was highly volatile.
Stock values recovered during the second half of the first quarter of 2016.
Dear Valued Shareholder:
We are pleased to offer you this annual report for the Wells Fargo Intrinsic Small Cap Value Fund for the 12-month period that ended March 31, 2016. Throughout the period, stock performance was highly volatile. Investors reacted to slowing economic growth, moderating corporate earnings, weakening commodity prices, increasing central-bank intervention, and shifts in currency values. During the last four weeks of the period, investor sentiment appeared to move beyond these concerns as economic data firmed and stocks gained across the capitalization spectrum.
As investors grew concerned about global issues, volatility increased.
A common measure of investors’ stock volatility expectations—the Chicago Board Options Exchange (CBOE) Volatility Index (VIX)1—illustrated the shifts in investor sentiment. The VIX spiked to readings above 40 in August 2015, indicating increased investor anxiety. During a comparatively calm autumn, VIX readings trended to the midteens and closer to their five-year average. Then stock markets grew volatile again as the winter months arrived. After the new year began, VIX readings spiked to the high 20s as U.S. equity markets posted their worst start to a calendar year on record. Stock values recovered during the second half of the first quarter of 2016. Investors appeared to be encouraged by improving economic data and the reassurances of central bankers that they remain committed to spurring growth through policy initiatives.
However, business, economic, and central-bank policy development had countervailing influences. For example, while a stronger dollar benefited consumer purchasing power, it tended to negatively affect corporate earnings and investment gains earned overseas when translated to U.S. dollars. Lower energy costs helped consumers’ budgets but hampered the profits and stock performance in the energy sector. While lower interest rates encouraged spending, the potential for interest-rate increases caused uncertainty.
Central bankers responded with policy initiatives in response to shifting economic conditions.
In December 2015, the U.S. Federal Reserve (Fed) increased the federal funds rate, the first interest-rate increase since 2006. The Fed also expressed its intention to increase the rate several times during 2016. After the new year began, as data weakened and volatility increased, the Fed retrenched, which injected additional uncertainty into the markets. In the eurozone, the European Central Bank continued to encourage lending and investing by making funds available to banks at low interest rates, imposing a negative interest rate on bank deposits, and purchasing bonds through its quantitative easing program. In Japan, the central bank also implemented a negative interest-rate policy intended to spur lending and investment. In China, the People’s Bank of China lowered interest rates and bank reserve requirements, in addition to devaluing the country’s currency to support exports.
| 1 | The Chicago Board Options Exchange (CBOE) Volatility Index (VIX) is a key measure of market expectations of near-term volatility conveyed by the S&P 500 stock index option prices. Since its introduction in 1993, VIX has been considered by many to be the world’s premier barometer of investor sentiment and market volatility. Several investors expressed interest in trading instruments related to the market’s expectation of future volatility, and so VIX futures were introduced in 2004, and VIX options were introduced in 2006. |
| | | | | | |
| Letter to shareholders (unaudited) | | Wells Fargo Intrinsic Small Cap Value Fund | | | 3 | |
Volatility and recoveries highlighted the value of a long-term investment strategy.
The experience of the past 12 months demonstrated the value of maintaining a disciplined, long-term investment strategy despite short-term volatility. Broad U.S. equity indexes trimmed their worst losses measured to the midpoint of the period to recover all or a portion of their lost values by the end of the period. For example, the S&P 500 Index,2 a commonly referenced gauge of large-cap stock performance, gained 1.78% for the 12-month period that ended March 31, 2016, after recording a 6.18% loss for the six-month period that ended September 30, 2015. Some observers attributed the S&P 500 Index’s relative outperformance to investors who moved their equity allocations higher in the capitalization structure in pursuit of the perceived safety of large-cap stocks. The Russell Midcap® Index3 lost 4.04% for the 12-month period that ended March 31, 2016, regaining more than half of the 9.42% loss it had recorded for the six-month period that ended September 30, 2015. For the 12-month period that ended March 31, 2016, the Russell 2000® Index,4 a common small-cap stock index, lost 9.76%, an improvement from the 11.55% loss it had recorded during the six-month period that ended September 30, 2015.
Don’t let short-term uncertainty derail long-term investment goals.
Periods of investment uncertainty can present challenges, but experience has taught us that maintaining long-term investment goals can be an effective way to plan for the future. To help you create a sound strategy based on your personal goals and risk tolerance, Wells Fargo Funds offers more than 100 mutual funds spanning a wide range of asset classes and investment styles. Although diversification cannot guarantee an investment profit or prevent losses, we believe it can be an effective way to manage investment risk and potentially smooth out overall portfolio performance. We encourage investors to know their investments and to understand that appropriate levels of risk-taking may unlock opportunities.
Thank you for choosing to invest with Wells Fargo Funds. We appreciate your confidence in us and remain committed to helping you meet your financial needs.
Sincerely,

Karla M. Rabusch
President
Wells Fargo Funds
Notice to shareholders
At a meeting held on February 17-18, 2016, the Board of Trustees approved a change to the subadviser for the Fund to Wells Capital Management Incorporated (“WellsCap”) in connection with the merger of Metropolitan West Capital Management, LLC (“MetWest”), the Fund’s current subadviser, into WellsCap (the “Merger”). The Merger is expected to take place on or about July 1, 2016. With the completion of the Merger, MetWest personnel will become exclusively personnel of WellsCap. The Merger will not result in any change to the services provided to the Fund or to the Fund’s strategies or fees and expenses.
For further information about your Fund, contact your investment professional, visit our website at wellsfargofunds.com, or call us directly at 1-800-222-8222. We are available 24 hours a day, 7 days a week.
| 2 | The S&P 500 Index consists of 500 stocks chosen for market size, liquidity, and industry group representation. It is a market-value-weighted index with each stock’s weight in the index proportionate to its market value. You cannot invest directly in an index. |
| 3 | The Russell Midcap® Index measures the performance of the 800 smallest companies in the Russell 1000® Index, which represent approximately 25% of the total market capitalization of the Russell 1000® Index. You cannot invest directly in an index. |
| 4 | The Russell 2000® Index measures the performance of the 2,000 smallest companies in the Russell 3000® Index, which represents approximately 8% of the total market capitalization of the Russell 3000® Index. You cannot invest directly in an index. |
| | | | |
| 4 | | Wells Fargo Intrinsic Small Cap Value Fund | | Performance highlights (unaudited) |
Investment objective
The Fund seeks long-term capital appreciation.
Manager
Wells Fargo Funds Management, LLC
Subadviser
Metropolitan West Capital Management, LLC
Portfolio managers
Alex Alvarez, CFA®
Samir Sikka, CFA®
Average annual total returns (%) as of March 31, 20161
| | | | | | | | | | | | | | | | | | | | | | | | | | | | | | | | | | |
| | | | | Including sales charge | | | Excluding sales charge | | | Expense ratios2 (%) | |
| | | Inception date | | 1 year | | | 5 year | | | 10 year | | | 1 year | | | 5 year | | | 10 year | | | Gross | | | Net3 | |
| Class A (WFSMX) | | 3-31-2008 | | | (12.70 | ) | | | 6.26 | | | | 3.43 | | | | (7.36 | ) | | | 7.52 | | | | 4.04 | | | | 1.42 | | | | 1.36 | |
| Class C (WSCDX) | | 3-31-2008 | | | (9.03 | ) | | | 6.72 | | | | 3.29 | | | | (8.03 | ) | | | 6.72 | | | | 3.29 | | | | 2.17 | | | | 2.11 | |
| Administrator Class (WFSDX) | | 4-8-2005 | | | – | | | | – | | | | – | | | | (7.17 | ) | | | 7.75 | | | | 4.31 | | | | 1.34 | | | | 1.21 | |
| Institutional Class (WFSSX) | | 4-8-2005 | | | – | | | | – | | | | – | | | | (7.02 | ) | | | 7.98 | | | | 4.52 | | | | 1.09 | | | | 1.01 | |
| Russell 2000® Value Index4 | | – | | | – | | | | – | | | | – | | | | (7.72 | ) | | | 6.67 | | | | 4.42 | | | | – | | | | – | |
Figures quoted represent past performance, which is no guarantee of future results, and do not reflect taxes that a shareholder may pay on fund distributions or the redemption of fund shares. Investment return and principal value of an investment will fluctuate so that an investor’s shares, when redeemed, may be worth more or less than their original cost. Performance shown without sales charges would be lower if sales charges were reflected. Current performance may be lower or higher than the performance data quoted, which assumes the reinvestment of dividends and capital gains. Current month-end performance is available on the Fund’s website, wellsfargofunds.com.
Index returns do not include transaction costs associated with buying and selling securities, any mutual fund fees or expenses, or any taxes. It is not possible to invest directly in an index.
For Class A shares, the maximum front-end sales charge is 5.75%. For Class C shares, the maximum contingent deferred sales charge is 1.00%. Performance including a contingent deferred sales charge assumes the sales charge for the corresponding time period. Administrator Class and Institutional Class shares are sold without a front-end sales charge or contingent deferred sales charge.
Stock values fluctuate in response to the activities of individual companies and general market and economic conditions. Smaller-company stocks tend to be more volatile and less liquid than those of larger companies. Certain investment strategies tend to increase the total risk of an investment (relative to the broader market). Consult the Fund’s prospectus for additional information on these and other risks.
Please see footnotes on page 5.
| | | | | | |
| Performance highlights (unaudited) | | Wells Fargo Intrinsic Small Cap Value Fund | | | 5 | |
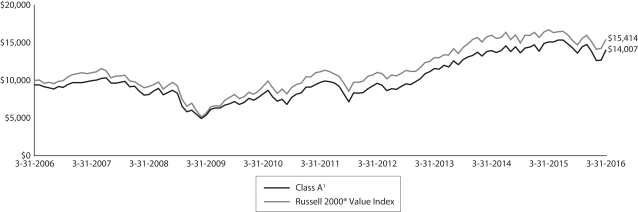
|
| Growth of $10,000 investment as of March 31, 20165 |
|
 |
| 1 | Historical performance shown for Class A, Administrator Class, and Institutional Class shares prior to their inception reflects the performance of the former Investor Class shares, and includes the higher expenses applicable to the former Investor Class shares. If these expenses had not been included, returns would be higher. Historical performance shown for Class C shares prior to their inception reflects the performance of the former Investor Class shares and has been adjusted to reflect the higher expenses applicable to Class C shares. Prior to June 1, 2010, the Fund was named Wells Fargo Advantage Small Cap Disciplined Fund. Metropolitan West Capital Management, LLC replaced Wells Capital Management as a subadviser for the Fund effective June 1, 2010. Accordingly, performance figures shown prior to June 1, 2010, do not reflect the principal investment strategies or performance of Metropolitan West Capital Management, LLC. |
| 2 | Reflects the expense ratios as stated in the most recent prospectuses, which include the impact of 0.01% in acquired fund fees and expenses. The expense ratios shown are subject to change and may differ from the annualized expense ratios shown in the financial highlights of this report, which do not include acquired fund fees and expenses. |
| 3 | The manager has contractually committed through July 31, 2016, to waive fees and/or reimburse expenses to the extent necessary to cap the Fund’s Total Annual Fund Operating Expenses After Fee Waiver at 1.35% for Class A, 2.10% for Class C, 1.20% for Administrator Class, and 1.00% for Institutional Class. After this time, the cap may be increased or the commitment to maintain the cap may be terminated only with the approval of the Board of Trustees. Brokerage commissions, stamp duty fees, interest, taxes, acquired fund fees and expenses, and extraordinary expenses are excluded from the cap. Without this cap, the Fund’s returns would have been lower. |
| 4 | The Russell 2000® Value Index measures the performance of those Russell 2000 companies with lower price/book ratios and lower forecasted growth values. You cannot invest directly in an index. |
| 5 | The chart compares the performance of Class A shares for the most recent ten years with the Russell 2000® Value Index. The chart assumes a hypothetical investment of $10,000 in Class A shares and reflects all operating expenses and assumes the maximum initial sales charge of 5.75%. |
| 6 | The Russell 1000® Index measures the performance of the 1,000 largest companies in the Russell 3000® Index, which represents approximately 92% of the total market capitalization of the Russell 3000® Index. You cannot invest directly in an index. |
| 7 | The Russell Midcap® Index measures the performance of the 800 smallest companies in the Russell 1000® Index, which represent approximately 25% of the total market capitalization of the Russell 1000® Index. You cannot invest directly in an index. |
| 8 | The ten largest holdings, excluding cash and cash equivalents, are calculated based on the value of the investments divided by total net assets of the Fund. Holdings are subject to change and may have changed since the date specified. |
| 9 | Amounts are calculated based on the total long-term investments of the Fund. These amounts are subject to change and may have changed since the date specified. |
| * | This security was not held in the Fund at the end of the reporting period |
| | | | |
| 6 | | Wells Fargo Intrinsic Small Cap Value Fund | | Performance highlights (unaudited) |
MANAGER’S DISCUSSION
Fund highlights
| n | | Amidst a volatile period for the markets in which small-cap stocks were more negatively affected than their large- and mid-cap peers, the Fund (Class A, excluding sales charges) outperformed its benchmark, the Russell 2000® Value Index, for the 12-month period that ended March 31, 2016. |
| n | | Stock selection accounted for all of the Fund’s outperformance. |
| n | | Relative sector weightings, which are a by-product of our bottom-up security selection process, had a minor negative impact during the period. |
We remain focused on identifying companies with sustainable business models and attractive quality characteristics.
Looking at the broader market, large-cap stocks (as measured by the Russell 1000® Index)6 outperformed their mid-cap (as measured by the Russell Midcap® Index)7 and small-cap (as measured by the Russell 2000® Value Index) counterparts for the period. In a reversal from the prior 12-month period, value stocks outperformed growth stocks in the small-capitalization range. Consistent with our long-term investment perspective, we adhere to a fundamentally based investment process. We do not predict the direction of the market or the implications of macroeconomic events. As a result, we remain focused on identifying companies with sustainable business models that possess attractive quality characteristics, trade at discounts to our estimates of intrinsic value, and possess value drivers that we expect to cause stock price appreciation over the next two to four years.
| | | | |
| Ten largest holdings (%) as of March 31, 20168 | |
KAR Auction Services Incorporated | | | 2.99 | |
WEX Incorporated | | | 2.39 | |
Ascena Retail Group Incorporated | | | 2.28 | |
Party City Holdco Incorporated | | | 2.20 | |
EVERTEC Incorporated | | | 2.14 | |
AMN Healthcare Services Incorporated | | | 2.14 | |
Zions Bancorporation | | | 2.11 | |
Armstrong World Industries Incorporated | | | 2.10 | |
Pier 1 Imports Incorporated | | | 2.07 | |
SeaWorld Entertainment Incorporated | | | 1.96 | |
Compared with the Russell 2000® Value Index, stock selection in the energy, health care, industrials, and consumer staples sectors were the largest contributors to relative performance. However, an overweight in the worst-performing energy sector partially offset the benefit of strong security selection in this sector. In these sectors, respectively, natural gas and oil producer Encana Corporation; health care staffing provider AMN Healthcare Services, Incorporated; building products company Armstrong World Industries, Incorporated; and wine company Treasury Wine Estates Limited* enhanced value relative to the index.
Conversely, weak relative stock selection in both the financials and information technology (IT) sector detracted the most value during the period. Ocwen Financial Corporation*, a mortgage loan originator and servicer, was the primary detractor in financials, while film and editing solutions provider Avid Technology, Incorporated, was the worst performer in the IT sector.
During the period, we made changes to the Fund’s portfolio based upon our fundamental research.
As a result of trades, stock price movements, and the annual reconstitution of the Russell indexes in June, the Fund’s positioning relative to the Russell 2000® Value Index shifted moderately during the period. The most notable change in sector allocation was the shift from an underweight to an overweight in the IT sector. During the period, we made four new investments and sold one position in the IT sector for the Fund. The consumer discretionary sector also shifted from an underweight to an overweight; however, this was primarily driven by the index’s reconstitution. The Fund remains overweight industrials, health care, energy, and consumer staples and underweight financials and utilities relative to the Russell 2000® Value Index. All sector weights are the result of individual stock selection rather than tactical allocation decisions.
Despite potentially distracting macroeconomic events, we remained focused on our investment strategy.
While we do not predict the direction of the market or the implications of macro events, we do believe volatility will persist for the foreseeable future. This volatility should, as it has done in previous quarters, generate dislocations that may create attractive investment opportunities. In addition, companies that previously sheltered investors with their perceived safety, whether derived from quality characteristics or momentum, may not continue to offer this security in the future. Stock selection coupled with valuation will be increasingly more important for investors to consider. Neither quality alone nor market-based investing will serve as a mechanism for protection or performance results.
Please see footnotes on page 5.
| | | | | | |
| Performance highlights (unaudited) | | Wells Fargo Intrinsic Small Cap Value Fund | | | 7 | |
As always, the adherence to our investment process remains paramount to our team. Through our bottom-up, fundamental, rigorous, company-focused research, we strive to add value for the Fund. We believe the consistent application of our disciplined investment approach should allow us to achieve this goal.
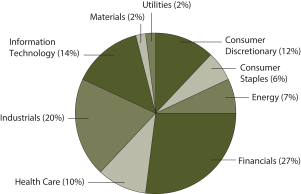
|
| Sector distribution as of March 31, 20169 |
|
|
Please see footnotes on page 5.
| | | | |
| 8 | | Wells Fargo Intrinsic Small Cap Value Fund | | Fund expenses (unaudited) |
As a shareholder of the Fund, you incur two types of costs: (1) transaction costs, including sales charges (loads) on purchase payments and contingent deferred sales charges (if any) on redemptions and (2) ongoing costs, including management fees, distribution (12b-1) and/or shareholder servicing fees, and other Fund expenses. This example is intended to help you understand your ongoing costs (in dollars) of investing in the Fund and to compare these costs with the ongoing costs of investing in other mutual funds.
The example is based on an investment of $1,000 invested at the beginning of the six-month period and held for the entire period from October 1, 2015 to March 31, 2016.
Actual expenses
The “Actual” line of the table below provides information about actual account values and actual expenses. You may use the information in this line, together with the amount you invested, to estimate the expenses that you paid over the period. Simply divide your account value by $1,000 (for example, an $8,600 account value divided by $1,000 = 8.6), then multiply the result by the number in the “Actual” line under the heading entitled “Expenses paid during period” for your applicable class of shares to estimate the expenses you paid on your account during this period.
Hypothetical example for comparison purposes
The “Hypothetical” line of the table below provides information about hypothetical account values and hypothetical expenses based on the Fund’s actual expense ratio and an assumed rate of return of 5% per year before expenses, which is not the Fund’s actual return. The hypothetical account values and expenses may not be used to estimate the actual ending account balance or expenses you paid for the period. You may use this information to compare the ongoing costs of investing in the Fund and other funds. To do so, compare this 5% hypothetical example with the 5% hypothetical examples that appear in the shareholder reports of the other funds.
Please note that the expenses shown in the table are meant to highlight your ongoing costs only and do not reflect any transactional costs, such as sales charges (loads) and contingent deferred sales charges. Therefore, the “Hypothetical” line of the table is useful in comparing ongoing costs only and will not help you determine the relative total costs of owning different funds. In addition, if these transactional costs were included, your costs would have been higher.
| | | | | | | | | | | | | | | | |
| | | Beginning
account value
10-1-2015 | | | Ending
account value
3-31-2016 | | | Expenses
paid during
the period¹ | | | Net annualized
expense ratio | |
Class A | | | | | | | | | | | | | | | | |
Actual | | $ | 1,000.00 | | | $ | 1,029.83 | | | $ | 6.85 | | | | 1.35 | % |
Hypothetical (5% return before expenses) | | $ | 1,000.00 | | | $ | 1,018.25 | | | $ | 6.81 | | | | 1.35 | % |
Class C | | | | | | | | | | | | | | | | |
Actual | | $ | 1,000.00 | | | $ | 1,026.46 | | | $ | 10.64 | | | | 2.10 | % |
Hypothetical (5% return before expenses) | | $ | 1,000.00 | | | $ | 1,014.50 | | | $ | 10.58 | | | | 2.10 | % |
Administrator Class | | | | | | | | | | | | | | | | |
Actual | | $ | 1,000.00 | | | $ | 1,030.73 | | | $ | 6.09 | | | | 1.20 | % |
Hypothetical (5% return before expenses) | | $ | 1,000.00 | | | $ | 1,019.00 | | | $ | 6.06 | | | | 1.20 | % |
Institutional Class | | | | | | | | | | | | | | | | |
Actual | | $ | 1,000.00 | | | $ | 1,031.69 | | | $ | 5.08 | | | | 1.00 | % |
Hypothetical (5% return before expenses) | | $ | 1,000.00 | | | $ | 1,020.00 | | | $ | 5.05 | | | | 1.00 | % |
| 1 | Expenses paid is equal to the annualized expense ratio of each class multiplied by the average account value over the period, multiplied by the number of days in the most recent fiscal half-year divided by the number of days in the fiscal year (to reflect the one-half-year period). |
| | | | | | |
| Portfolio of investments—March 31, 2016 | | Wells Fargo Intrinsic Small Cap Value Fund | | | 9 | |
| | | | | | | | | | | | |
| Security name | | | | | | Shares | | | Value | |
| | | | |
Common Stocks: 91.54% | | | | | | | | | | | | |
| | | | |
Consumer Discretionary: 11.22% | | | | | | | | | | | | |
| | | | |
| Hotels, Restaurants & Leisure: 3.02% | | | | | | | | | | | | |
Interval Leisure Group Incorporated « | | | | | | | 92,944 | | | $ | 1,342,112 | |
SeaWorld Entertainment Incorporated « | | | | | | | 117,350 | | | | 2,471,391 | |
| | | | |
| | | | | | | | | | | 3,813,503 | |
| | | | | | | | | | | | |
| | | | |
| Specialty Retail: 8.20% | | | | | | | | | | | | |
Ascena Retail Group Incorporated Ǡ | | | | | | | 260,160 | | | | 2,877,370 | |
DSW Incorporated Class A | | | | | | | 75,000 | | | | 2,073,000 | |
Party City Holdco Incorporated Ǡ | | | | | | | 184,500 | | | | 2,774,880 | |
Pier 1 Imports Incorporated | | | | | | | 372,500 | | | | 2,611,225 | |
| | | | |
| | | | | | | | | | | 10,336,475 | |
| | | | | | | | | | | | |
| | | | |
Consumer Staples: 5.57% | | | | | | | | | | | | |
| | | | |
| Food Products: 5.57% | | | | | | | | | | | | |
J & J Snack Foods Corporation | | | | | | | 11,600 | | | | 1,256,048 | |
Post Holdings Incorporated † | | | | | | | 15,950 | | | | 1,096,882 | |
Snyders Lance Incorporated | | | | | | | 75,062 | | | | 2,362,952 | |
TreeHouse Foods Incorporated † | | | | | | | 26,638 | | | | 2,310,847 | |
| | | | |
| | | | | | | | | | | 7,026,729 | |
| | | | | | | | | | | | |
| | | | |
Energy: 6.84% | | | | | | | | | | | | |
| | | | |
| Energy Equipment & Services: 1.30% | | | | | | | | | | | | |
Forum Energy Technologies Incorporated † | | | | | | | 124,030 | | | | 1,637,196 | |
| | | | | | | | | | | | |
| | | | |
| Oil, Gas & Consumable Fuels: 5.54% | | | | | | | | | | | | |
Diamondback Energy Incorporated † | | | | | | | 25,046 | | | | 1,933,050 | |
Encana Corporation | | | | | | | 302,520 | | | | 1,842,347 | |
Oasis Petroleum Incorporated Ǡ | | | | | | | 165,740 | | | | 1,206,587 | |
RSP Permian Incorporated † | | | | | | | 69,005 | | | | 2,003,905 | |
| | | | |
| | | | | | | | | | | 6,985,889 | |
| | | | | | | | | | | | |
| | | | |
Financials: 24.24% | | | | | | | | | | | | |
| | | | |
| Banks: 7.88% | | | | | | | | | | | | |
Glacier Bancorp Incorporated | | | | | | | 50,400 | | | | 1,281,168 | |
Hancock Holding Company | | | | | | | 73,000 | | | | 1,676,080 | |
Sterling BanCorp | | | | | | | 126,500 | | | | 2,015,145 | |
Webster Financial Corporation | | | | | | | 64,178 | | | | 2,303,990 | |
Zions Bancorporation | | | | | | | 109,930 | | | | 2,661,405 | |
| | | | |
| | | | | | | | | | | 9,937,788 | |
| | | | | | | | | | | | |
| | | | |
| Capital Markets: 2.45% | | | | | | | | | | | | |
Artisan Partners Asset Management Incorporated Class A | | | | | | | 47,000 | | | | 1,449,480 | |
Stifel Financial Corporation † | | | | | | | 55,190 | | | | 1,633,624 | |
| | | | |
| | | | | | | | | | | 3,083,104 | |
| | | | | | | | | | | | |
The accompanying notes are an integral part of these financial statements.
| | | | |
| 10 | | Wells Fargo Intrinsic Small Cap Value Fund | | Portfolio of investments—March 31, 2016 |
| | | | | | | | | | | | |
| Security name | | | | | | Shares | | | Value | |
| | | | |
| Consumer Finance: 1.26% | | | | | | | | | | | | |
Encore Capital Group Incorporated Ǡ | | | | | | | 61,804 | | | $ | 1,590,835 | |
| | | | | | | | | | | | |
| | | | |
| Insurance: 2.84% | | | | | | | | | | | | |
Endurance Specialty Holdings Limited | | | | | | | 33,700 | | | | 2,201,958 | |
Selective Insurance Group Incorporated | | | | | | | 37,700 | | | | 1,380,197 | |
| | | | |
| | | | | | | | | | | 3,582,155 | |
| | | | | | | | | | | | |
| | | | |
| REITs: 8.22% | | | | | | | | | | | | |
Equity Commonwealth † | | | | | | | 48,300 | | | | 1,363,026 | |
Hudson Pacific Properties Incorporated | | | | | | | 65,345 | | | | 1,889,777 | |
Ladder Capital Corporation | | | | | | | 81,306 | | | | 1,012,260 | |
Mack-Cali Realty Corporation | | | | | | | 91,103 | | | | 2,140,921 | |
Parkway Properties Incorporated | | | | | | | 152,800 | | | | 2,392,848 | |
PennyMac Mortgage Investment Trust | | | | | | | 115,350 | | | | 1,573,374 | |
| | | | |
| | | | | | | | | | | 10,372,206 | |
| | | | | | | | | | | | |
| | | | |
| Thrifts & Mortgage Finance: 1.59% | | | | | | | | | | | | |
Essent Group Limited † | | | | | | | 96,500 | | | | 2,007,200 | |
| | | | | | | | | | | | |
| | | | |
Health Care: 9.27% | | | | | | | | | | | | |
| | | | |
| Health Care Equipment & Supplies: 3.56% | | | | | | | | | | | | |
Haemonetics Corporation † | | | | | | | 35,200 | | | | 1,231,296 | |
Integra LifeSciences Holdings Corporation | | | | | | | 22,050 | | | | 1,485,288 | |
Steris Corporation | | | | | | | 25,000 | | | | 1,776,250 | |
| | | | |
| | | | | | | | | | | 4,492,834 | |
| | | | | | | | | | | | |
| | | | |
| Health Care Providers & Services: 4.81% | | | | | | | | | | | | |
AMN Healthcare Services Incorporated † | | | | | | | 80,300 | | | | 2,698,883 | |
AmSurg Corporation † | | | | | | | 19,300 | | | | 1,439,780 | |
HealthSouth Corporation | | | | | | | 51,296 | | | | 1,930,268 | |
| | | | |
| | | | | | | | | | | 6,068,931 | |
| | | | | | | | | | | | |
| | | | |
| Life Sciences Tools & Services: 0.90% | | | | | | | | | | | | |
Bio-Rad Laboratories Incorporated Class A † | | | | | | | 8,250 | | | | 1,127,940 | |
| | | | | | | | | | | | |
| | | | |
Industrials: 17.83% | | | | | | | | | | | | |
| | | | |
| Building Products: 2.10% | | | | | | | | | | | | |
Armstrong World Industries Incorporated † | | | | | | | 54,693 | | | | 2,645,500 | |
| | | | | | | | | | | | |
| | | | |
| Commercial Services & Supplies: 6.31% | | | | | | | | | | | | |
Essendant Incorporated | | | | | | | 72,350 | | | | 2,310,136 | |
KAR Auction Services Incorporated | | | | | | | 98,950 | | | | 3,773,953 | |
Tetra Tech Incorporated | | | | | | | 62,750 | | | | 1,871,205 | |
| | | | |
| | | | | | | | | | | 7,955,294 | |
| | | | | | | | | | | | |
The accompanying notes are an integral part of these financial statements.
| | | | | | |
| Portfolio of investments—March 31, 2016 | | Wells Fargo Intrinsic Small Cap Value Fund | | | 11 | |
| | | | | | | | | | | | |
| Security name | | | | | | Shares | | | Value | |
| | | | |
| Machinery: 2.55% | | | | | | | | | | | | |
Actuant Corporation Class A « | | | | | | | 56,361 | | | $ | 1,392,680 | |
IDEX Corporation | | | | | | | 22,100 | | | | 1,831,648 | |
| | | | |
| | | | | | | | | | | 3,224,328 | |
| | | | | | | | | | | | |
| | | | |
| Marine: 1.67% | | | | | | | | | | | | |
Kirby Corporation † | | | | | | | 34,953 | | | | 2,107,316 | |
| | | | | | | | | | | | |
| | | | |
| Professional Services: 2.79% | | | | | | | | | | | | |
Korn/Ferry International | | | | | | | 52,210 | | | | 1,477,021 | |
Resources Connection Incorporated | | | | | | | 131,145 | | | | 2,040,616 | |
| | | | |
| | | | | | | | | | | 3,517,637 | |
| | | | | | | | | | | | |
| | | | |
| Road & Rail: 1.54% | | | | | | | | | | | | |
Landstar System Incorporated | | | | | | | 30,030 | | | | 1,940,238 | |
| | | | | | | | | | | | |
| | | | |
| Trading Companies & Distributors: 0.87% | | | | | | | | | | | | |
Beacon Roofing Supply Incorporated † | | | | | | | 26,950 | | | | 1,105,220 | |
| | | | | | | | | | | | |
| | | | |
Information Technology: 12.84% | | | | | | | | | | | | |
| | | | |
| Electronic Equipment, Instruments & Components: 2.76% | | | | | | | | | | | | |
Jabil Circuit Incorporated | | | | | | | 64,500 | | | | 1,242,915 | |
Zebra Technologies Corporation Class A † | | | | | | | 32,491 | | | | 2,241,879 | |
| | | | |
| | | | | | | | | | | 3,484,794 | |
| | | | | | | | | | | | |
| | | | |
| Internet Software & Services: 1.36% | | | | | | | | | | | | |
Endurance International Group Holdings Ǡ | | | | | | | 163,338 | | | | 1,719,949 | |
| | | | | | | | | | | | |
| | | | |
| IT Services: 6.08% | | | | | | | | | | | | |
CoreLogic Incorporated † | | | | | | | 56,281 | | | | 1,952,951 | |
EVERTEC Incorporated | | | | | | | 193,100 | | | | 2,699,538 | |
WEX Incorporated † | | | | | | | 36,200 | | | | 3,017,632 | |
| | | | |
| | | | | | | | | | | 7,670,121 | |
| | | | | | | | | | | | |
| | | | |
| Technology Hardware, Storage & Peripherals: 2.64% | | | | | | | | | | | | |
Avid Technology Incorporated † | | | | | | | 179,000 | | | | 1,210,040 | |
Wincor Nixdorf AG ADR † | | | | | | | 172,000 | | | | 2,112,521 | |
| | | | |
| | | | | | | | | | | 3,322,561 | |
| | | | | | | | | | | | |
| | | | |
Materials: 2.13% | | | | | | | | | | | | |
| | | | |
| Chemicals: 0.99% | | | | | | | | | | | | |
Huntsman Corporation | | | | | | | 94,060 | | | | 1,250,998 | |
| | | | | | | | | | | | |
| | | | |
| Containers & Packaging: 1.14% | | | | | | | | | | | | |
Silgan Holdings Incorporated | | | | | | | 27,100 | | | | 1,440,907 | |
| | | | | | | | | | | | |
The accompanying notes are an integral part of these financial statements.
| | | | |
| 12 | | Wells Fargo Intrinsic Small Cap Value Fund | | Portfolio of investments—March 31, 2016 |
| | | | | | | | | | | | | | |
| Security name | | | | | | | Shares | | | Value | |
| | | | |
Utilities: 1.60% | | | | | | | | | | | | | | |
| | | | |
| Electric Utilities: 1.60% | | | | | | | | | | | | | | |
Westar Energy Incorporated | | | | | | | | | 40,725 | | | $ | 2,020,367 | |
| | | | | | | | | | | | | | |
| | | | |
Total Common Stocks (Cost $107,479,911) | | | | | | | | | | | | | 115,468,015 | |
| | | | | | | | | | | | | | |
| | | | |
| | | Yield | | | | | | | | | |
| Short-Term Investments: 16.77% | | | | | | | | | | | | | | |
| | | | |
| Investment Companies: 16.77% | | | | | | | | | | | | | | |
Securities Lending Cash Investments LLC (l)(r)(u) | | | 0.43 | % | | | | | 10,432,100 | | | | 10,432,100 | |
Wells Fargo Cash Investment Money Market Fund Select Class (l)(u) | | | 0.44 | | | | | | 10,727,108 | | | | 10,727,108 | |
| | | | |
Total Short-Term Investments (Cost $21,159,208) | | | | | | | | | | | | | 21,159,208 | |
| | | | | | | | | | | | | | |
| | | | | | | | |
| Total investments in securities (Cost $128,639,119) * | | | 108.31 | % | | | 136,627,223 | |
Other assets and liabilities, net | | | (8.31 | ) | | | (10,478,918 | ) |
| | | | | | | | |
| Total net assets | | | 100.00 | % | | $ | 126,148,305 | |
| | | | | | | | |
| « | All or a portion of this security is on loan. |
| † | Non-income-earning security |
| (l) | The issuer of the security is an affiliated person of the Fund as defined in the Investment Company Act of 1940. |
| (r) | The investment is a non-registered investment vehicle purchased with cash collateral received from securities on loan. |
| (u) | The rate represents the 7-day annualized yield at period end. |
| * | Cost for federal income tax purposes is $129,175,074 and unrealized gains (losses) consists of: |
| | | | |
Gross unrealized gains | | $ | 19,311,066 | |
Gross unrealized losses | | | (11,858,917 | ) |
| | | | |
Net unrealized gains | | $ | 7,452,149 | |
The accompanying notes are an integral part of these financial statements.
| | | | | | |
| Statement of assets and liabilities—March 31, 2016 | | Wells Fargo Intrinsic Small Cap Value Fund | | | 13 | |
| | | | |
| | | | |
| |
Assets | | | | |
Investments | | | | |
In unaffiliated securities (including $10,308,487 of securities loaned), at value (cost $107,479,911) | | $ | 115,468,015 | |
In affiliated securities, at value (cost $21,159,208) | | | 21,159,208 | |
| | | | |
Total investments, at value (cost $128,639,119) | | | 136,627,223 | |
Receivable for Fund shares sold | | | 594 | |
Receivable for dividends | | | 136,364 | |
Receivable for securities lending income | | | 5,215 | |
Prepaid expenses and other assets | | | 30,439 | |
| | | | |
Total assets | | | 136,799,835 | |
| | | | |
| |
Liabilities | | | | |
Payable for Fund shares redeemed | | | 79,052 | |
Payable upon receipt of securities loaned | | | 10,432,100 | |
Management fee payable | | | 79,153 | |
Distribution fee payable | | | 174 | |
Administration fees payable | | | 16,715 | |
Accrued expenses and other liabilities | | | 44,336 | |
| | | | |
Total liabilities | | | 10,651,530 | |
| | | | |
Total net assets | | $ | 126,148,305 | |
| | | | |
| |
NET ASSETS CONSIST OF | | | | |
Paid-in capital | | $ | 172,340,693 | |
Undistributed net investment income | | | 84,714 | |
Accumulated net realized losses on investments | | | (54,265,206 | ) |
Net unrealized gains on investments | | | 7,988,104 | |
| | | | |
Total net assets | | $ | 126,148,305 | |
| | | | |
| |
COMPUTATION OF NET ASSET VALUE AND OFFERING PRICE PER SHARE | | | | |
Net assets – Class A | | $ | 49,898,246 | |
Shares outstanding – Class A1 | | | 2,124,220 | |
Net asset value per share – Class A | | | $23.49 | |
Maximum offering price per share – Class A2 | | | $24.92 | |
Net assets – Class C | | $ | 285,278 | |
Shares outstanding – Class C1 | | | 12,905 | |
Net asset value per share – Class C | | | $22.11 | |
Net assets – Administrator Class | | $ | 4,892,653 | |
Shares outstanding – Administrator Class1 | | | 204,800 | |
Net asset value per share – Administrator Class | | | $23.89 | |
Net assets – Institutional Class | | $ | 71,072,128 | |
Shares outstanding – Institutional Class1 | | | 2,944,776 | |
Net asset value per share – Institutional Class | | | $24.13 | |
| 1 | The Fund has an unlimited number of authorized shares. |
| 2 | Maximum offering price is computed as 100/94.25 of net asset value. On investments of $50,000 or more, the offering price is reduced. |
The accompanying notes are an integral part of these financial statements.
| | | | |
| 14 | | Wells Fargo Intrinsic Small Cap Value Fund | | Statement of operations—year ended March 31, 2016 |
| | | | |
| | | | |
| |
Investment income | | | | |
Dividends (net of foreign withholding taxes of $4,962) | | $ | 2,668,663 | |
Securities lending income, net | | | 197,790 | |
Income from affiliated securities | | | 14,935 | |
| | | | |
Total investment income | | | 2,881,388 | |
| | | | |
| |
Expenses | | | | |
Management fee | | | 1,165,825 | |
Administration fees | | | | |
Class A | | | 45,782 | |
Class C | | | 673 | |
Administrator Class | | | 6,108 | |
Institutional Class | | | 90,716 | |
Investor Class | | | 102,596 | 1 |
Shareholder servicing fees | | | | |
Class A | | | 54,377 | |
Class C | | | 754 | |
Administrator Class | | | 12,511 | |
Investor Class | | | 80,154 | 1 |
Distribution fee | | | | |
Class C | | | 2,262 | |
Custody and accounting fees | | | 18,493 | |
Professional fees | | | 42,493 | |
Registration fees | | | 84,444 | |
Shareholder report expenses | | | 36,107 | |
Trustees’ fees and expenses | | | 14,495 | |
Other fees and expenses | | | 11,342 | |
| | | | |
Total expenses | | | 1,769,132 | |
Less: Fee waivers and/or expense reimbursements | | | (160,435 | ) |
| | | | |
Net expenses | | | 1,608,697 | |
| | | | |
Net investment income | | | 1,272,691 | |
| | | | |
| |
REALIZED AND UNREALIZED GAINS (LOSSES) ON INVESTMENTS | | | | |
Net realized losses on investments | | | (1,665,408 | ) |
Net change in unrealized gains (losses) on investments | | | (10,385,846 | ) |
| | | | |
Net realized and unrealized gains (losses) on investments | | | (12,051,254 | ) |
| | | | |
Net decrease in net assets resulting from operations | | $ | (10,778,563 | ) |
| | | | |
| 1 | For the period from April 1, 2015 to October 23, 2015. Effective at the close of business on October 23, 2015, Investor Class shares were converted to Class A shares and are no longer offered by the Fund. |
The accompanying notes are an integral part of these financial statements.
| | | | | | |
| Statement of changes in net assets | | Wells Fargo Intrinsic Small Cap Value Fund | | | 15 | |
| | | | | | | | | | | | | | | | |
| | | Year ended March 31, 2016 | | | Year ended March 31, 2015 | |
| | | | |
Operations | | | | | | | | | | | | | | | | |
Net investment income | | | | | | $ | 1,272,691 | | | | | | | $ | 537,231 | |
Net realized gains (losses) on investments | | | | | | | (1,665,408 | ) | | | | | | | 18,094,620 | |
Net change in unrealized gains (losses) on investments | | | | | | | (10,385,846 | ) | | | | | | | (6,365,605 | ) |
| | | | |
Net increase (decrease) in net assets resulting from operations | | | | | | | (10,778,563 | ) | | | | | | | 12,266,246 | |
| | | | |
| | | | |
Distributions to shareholders from | | | | | | | | | | | | | | | | |
Net investment income | | | | | | | | | | | | | | | | |
Class A | | | | | | | (294,808 | ) | | | | | | | 0 | |
Administrator Class | | | | | | | (41,643 | ) | | | | | | | 0 | |
Institutional Class | | | | | | | (746,490 | ) | | | | | | | (328,545 | ) |
| | | | |
Total distributions to shareholders | | | | | | | (1,082,941 | ) | | | | | | | (328,545 | ) |
| | | | |
| | | | |
Capital share transactions | | | Shares | | | | | | | | Shares | | | | | |
Proceeds from shares sold | | | | | | | | | | | | | | | | |
Class A | | | 2,209,930 | | | | 53,774,520 | | | | 9,617 | | | | 235,725 | |
Class C | | | 3,943 | | | | 90,523 | | | | 3,365 | | | | 77,441 | |
Administrator Class | | | 49,058 | | | | 1,237,272 | | | | 25,631 | | | | 625,437 | |
Institutional Class | | | 169,210 | | | | 4,119,915 | | | | 303,417 | | | | 7,622,405 | |
Investor Class | | | 44,383 | 1 | | | 1,114,922 | 1 | | | 128,639 | | | | 3,066,856 | |
| | | | |
| | | | | | | 60,337,152 | | | | | | | | 11,627,864 | |
| | | | |
Reinvestment of distributions | | | | | | | | | | | | | | | | |
Class A | | | 12,141 | | | | 286,176 | | | | 0 | | | | 0 | |
Administrator Class | | | 975 | | | | 23,360 | | | | 0 | | | | 0 | |
Institutional Class | | | 25,479 | | | | 616,346 | | | | 10,900 | | | | 263,886 | |
| | | | |
| | | | | | | 925,882 | | | | | | | | 263,886 | |
| | | | |
Payment for shares redeemed | | | | | | | | | | | | | | | | |
Class A | | | (129,895 | ) | | | (2,936,083 | ) | | | (16,182 | ) | | | (388,997 | ) |
Class C | | | (3,674 | ) | | | (79,514 | ) | | | (9,910 | ) | | | (221,282 | ) |
Administrator Class | | | (42,116 | ) | | | (1,034,521 | ) | | | (268,033 | ) | | | (6,673,609 | ) |
Institutional Class | | | (474,967 | ) | | | (11,461,359 | ) | | | (367,323 | ) | | | (9,277,448 | ) |
Investor Class | | | (2,369,816 | )1 | | | (57,215,074 | )1 | | | (486,009 | ) | | | (11,447,508 | ) |
| | | | |
| | | | | | | (72,726,551 | ) | | | | | | | (28,008,844 | ) |
| | | | |
Net decrease in net assets resulting from capital share transactions | | | | | | | (11,463,517 | ) | | | | | | | (16,117,094 | ) |
| | | | |
Total decrease in net assets | | | | | | | (23,325,021 | ) | | | | | | | (4,179,393 | ) |
| | | | |
| | | | |
Net assets | | | | | | | | | | | | | | | | |
Beginning of period | | | | | | | 149,473,326 | | | | | | | | 153,652,719 | |
| | | | |
End of period | | | | | | $ | 126,148,305 | | | | | | | $ | 149,473,326 | |
| | | | |
Undistributed net investment income | | | | | | $ | 84,714 | | | | | | | $ | 238,026 | �� |
| | | | |
| 1 | For the period from April 1, 2015 to October 23, 2015. Effective at the close of business on October 23, 2015, Investor Class shares were converted to Class A shares and are no longer offered by the Fund. |
The accompanying notes are an integral part of these financial statements.
| | | | |
| 16 | | Wells Fargo Intrinsic Small Cap Value Fund | | Financial highlights |
(For a share outstanding throughout each period)
| | | | | | | | | | | | | | | | | | | | | | | | |
| | | Year ended March 31 | | | Year ended October 31 | |
| CLASS A | | 2016 | | | 2015 | | | 20141 | | | 2013 | | | 2012 | | | 2011 | |
Net asset value, beginning of period | | | $25.50 | | | | $23.53 | | | | $22.16 | | | | $15.96 | | | | $14.06 | | | | $13.81 | |
Net investment income (loss) | | | 0.22 | 2 | | | 0.04 | | | | 0.02 | | | | 0.03 | | | | (0.06 | )2 | | | (0.06 | )2 |
Net realized and unrealized gains (losses) on investments | | | (2.09 | ) | | | 1.93 | | | | 1.35 | | | | 6.17 | | | | 1.96 | | | | 0.31 | |
| | | | | | | | | | | | | | | | | | | | | | | | |
Total from investment operations | | | (1.87 | ) | | | 1.97 | | | | 1.37 | | | | 6.20 | | | | 1.90 | | | | 0.25 | |
Distributions to shareholders from | | | | | | | | | | | | | | | | | | | | | | | | |
Net investment income | | | (0.14 | ) | | | 0.00 | | | | 0.00 | | | | 0.00 | | | | 0.00 | | | | 0.00 | |
Net asset value, end of period | | | $23.49 | | | | $25.50 | | | | $23.53 | | | | $22.16 | | | | $15.96 | | | | $14.06 | |
Total return3 | | | (7.36 | )% | | | 8.37 | % | | | 6.33 | % | | | 38.66 | % | | | 13.51 | % | | | 1.81 | % |
Ratios to average net assets (annualized) | | | | | | | | | | | | | | | | | | | | | | | | |
Gross expenses | | | 1.47 | % | | | 1.46 | % | | | 1.57 | % | | | 1.56 | % | | | 1.48 | % | | | 1.44 | % |
Net expenses | | | 1.35 | % | | | 1.40 | % | | | 1.44 | % | | | 1.45 | % | | | 1.45 | % | | | 1.42 | % |
Net investment income (loss) | | | 0.95 | % | | | 0.15 | % | | | 0.19 | % | | | 0.11 | % | | | (0.38 | )% | | | (0.41 | )% |
Supplemental data | | | | | | | | | | | | | | | | | | | | | | | | |
Portfolio turnover rate | | | 66 | % | | | 60 | % | | | 22 | % | | | 75 | % | | | 33 | % | | | 54 | % |
Net assets, end of period (000s omitted) | | | $49,898 | | | | $817 | | | | $908 | | | | $967 | | | | $357 | | | | $189 | |
| 1 | For the five months ended March 31, 2014. The Fund changed its fiscal year end from October 31 to March 31, effective March 31, 2014. |
| 2 | Calculated based upon average shares outstanding |
| 3 | Total return calculations do not include any sales charges. Returns for periods of less than one year are not annualized. |
The accompanying notes are an integral part of these financial statements.
| | | | | | |
| Financial highlights | | Wells Fargo Intrinsic Small Cap Value Fund | | | 17 | |
(For a share outstanding throughout each period)
| | | | | | | | | | | | | | | | | | | | | | | | |
| | | Year ended March 31 | | | Year ended October 31 | |
| CLASS C | | 2016 | | | 2015 | | | 20141 | | | 2013 | | | 2012 | | | 2011 | |
Net asset value, beginning of period | | | $24.04 | | | | $22.35 | | | | $21.12 | | | | $15.32 | | | | $13.60 | | | | $13.45 | |
Net investment loss | | | (0.00 | )2,3 | | | (0.14 | )2 | | | (0.05 | ) | | | (0.13 | )2 | | | (0.16 | )2 | | | (0.17 | )2 |
Net realized and unrealized gains (losses) on investments | | | (1.93 | ) | | | 1.83 | | | | 1.28 | | | | 5.93 | | | | 1.88 | | | | 0.32 | |
| | | | | | | | | | | | | | | | | | | | | | | | |
Total from investment operations | | | (1.93 | ) | | | 1.69 | | | | 1.23 | | | | 5.80 | | | | 1.72 | | | | 0.15 | |
Net asset value, end of period | | | $22.11 | | | | $24.04 | | | | $22.35 | | | | $21.12 | | | | $15.32 | | | | $13.60 | |
Total return4 | | | (8.03 | )% | | | 7.56 | % | | | 6.02 | % | | | 37.60 | % | | | 12.65 | % | | | 1.12 | % |
Ratios to average net assets (annualized) | | | | | | | | | | | | | | | | | | | | | | | | |
Gross expenses | | | 2.22 | % | | | 2.21 | % | | | 2.33 | % | | | 2.30 | % | | | 2.22 | % | | | 2.19 | % |
Net expenses | | | 2.12 | % | | | 2.15 | % | | | 2.19 | % | | | 2.20 | % | | | 2.20 | % | | | 2.17 | % |
Net investment loss | | | (0.00 | )% | | | (0.62 | )% | | | (0.54 | )% | | | (0.66 | )% | | | (1.12 | )% | | | (1.19 | )% |
Supplemental data | | | | | | | | | | | | | | | | | | | | | | | | |
Portfolio turnover rate | | | 66 | % | | | 60 | % | | | 22 | % | | | 75 | % | | | 33 | % | | | 54 | % |
Net assets, end of period (000s omitted) | | | $285 | | | | $304 | | | | $429 | | | | $418 | | | | $89 | | | | $108 | |
| 1 | For the five months ended March 31, 2014. The Fund changed its fiscal year end from October 31 to March 31, effective March 31, 2014. |
| 2 | Calculated based upon average shares outstanding |
| 3 | Amount is less than $0.005. |
| 4 | Total return calculations do not include any sales charges. Returns for periods of less than one year are not annualized. |
The accompanying notes are an integral part of these financial statements.
| | | | |
| 18 | | Wells Fargo Intrinsic Small Cap Value Fund | | Financial highlights |
(For a share outstanding throughout each period)
| | | | | | | | | | | | | | | | | | | | | | | | |
| | | Year ended March 31 | | | Year ended October 31 | |
| ADMINISTRATOR CLASS | | 2016 | | | 2015 | | | 20141 | | | 2013 | | | 2012 | | | 2011 | |
Net asset value, beginning of period | | | $25.95 | | | | $23.90 | | | | $22.49 | | | | $16.16 | | | | $14.20 | | | | $13.91 | |
Net investment income (loss) | | | 0.22 | 2 | | | 0.07 | 2 | | | 0.04 | 2 | | | 0.09 | | | | (0.02 | )2 | | | (0.05 | )2 |
Net realized and unrealized gains (losses) on investments | | | (2.08 | ) | | | 1.98 | | | | 1.37 | | | | 6.24 | | | | 1.98 | | | | 0.34 | |
| | | | | | | | | | | | | | | | | | | | | | | | |
Total from investment operations | | | (1.86 | ) | | | 2.05 | | | | 1.41 | | | | 6.33 | | | | 1.96 | | | | 0.29 | |
Distributions to shareholders from | | | | | | | | | | | | | | | | |
Net investment income | | | (0.20 | ) | | | 0.00 | | | | (0.00 | )3 | | | 0.00 | | | | 0.00 | | | | 0.00 | |
Net asset value, end of period | | | $23.89 | | | | $25.95 | | | | $23.90 | | | | $22.49 | | | | $16.16 | | | | $14.20 | |
Total return4 | | | (7.17 | )% | | | 8.58 | % | | | 6.43 | % | | | 38.99 | % | | | 13.80 | % | | | 2.08 | % |
Ratios to average net assets (annualized) | | | | | | | | | | | | | | | | |
Gross expenses | | | 1.37 | % | | | 1.30 | % | | | 1.42 | % | | | 1.40 | % | | | 1.30 | % | | | 1.22 | % |
Net expenses | | | 1.20 | % | | | 1.20 | % | | | 1.20 | % | | | 1.20 | % | | | 1.20 | % | | | 1.19 | % |
Net investment income (loss) | | | 0.91 | % | | | 0.27 | % | | | 0.45 | % | | | 0.52 | % | | | (0.12 | )% | | | (0.30 | )% |
Supplemental data | | | | | | | | | | | | | | | | |
Portfolio turnover rate | | | 66 | % | | | 60 | % | | | 22 | % | | | 75 | % | | | 33 | % | | | 54 | % |
Net assets, end of period (000s omitted) | | | $4,893 | | | | $5,110 | | | | $10,498 | | | | $11,182 | | | | $6,801 | | | | $9,722 | |
| 1 | For the five months ended March 31, 2014. The Fund changed its fiscal year end from October 31 to March 31, effective March 31, 2014. |
| 2 | Calculated based upon average shares outstanding |
| 3 | Amount is less than $0.005. |
| 4 | Returns for periods of less than one year are not annualized. |
The accompanying notes are an integral part of these financial statements.
| | | | | | |
| Financial highlights | | Wells Fargo Intrinsic Small Cap Value Fund | | | 19 | |
(For a share outstanding throughout each period)
| | | | | | | | | | | | | | | | | | | | | | | | |
| | | Year ended March 31 | | | Year ended October 31 | |
| INSTITUTIONAL CLASS | | 2016 | | | 2015 | | | 20141 | | | 2013 | | | 2012 | | | 2011 | |
Net asset value, beginning of period | | | $26.22 | | | | $24.19 | | | | $22.78 | | | | $16.32 | | | | $14.32 | | | | $14.00 | |
Net investment income | | | 0.33 | | | | 0.14 | 2 | | | 0.06 | 2 | | | 0.12 | 2 | | | 0.01 | 2 | | | 0.00 | 2,3 |
Net realized and unrealized gains (losses) on investments | | | (2.17 | ) | | | 1.99 | | | | 1.39 | | | | 6.34 | | | | 1.99 | | | | 0.32 | |
| | | | | | | | | | | | | | | | | | | | | | | | |
Total from investment operations | | | (1.84 | ) | | | 2.13 | | | | 1.45 | | | | 6.46 | | | | 2.00 | | | | 0.32 | |
Distributions to shareholders from | | | | | | | | | | | | | | | | | | | | | | | | |
Net investment income | | | (0.25 | ) | | | (0.10 | ) | | | (0.04 | ) | | | 0.00 | | | | 0.00 | | | | 0.00 | |
Net asset value, end of period | | | $24.13 | | | | $26.22 | | | | $24.19 | | | | $22.78 | | | | $16.32 | | | | $14.32 | |
Total return4 | | | (7.02 | )% | | | 8.83 | % | | | 6.50 | % | | | 39.40 | % | | | 13.97 | % | | | 2.29 | % |
Ratios to average net assets (annualized) | | | | | | | | | | | | | | | | | | | | | | | | |
Gross expenses | | | 1.12 | % | | | 1.03 | % | | | 1.15 | % | | | 1.10 | % | | | 1.05 | % | | | 1.01 | % |
Net expenses | | | 1.00 | % | | | 1.00 | % | | | 1.00 | % | | | 1.00 | % | | | 1.00 | % | | | 0.98 | % |
Net investment income | | | 1.10 | % | | | 0.57 | % | | | 0.64 | % | | | 0.58 | % | | | 0.07 | % | | | 0.02 | % |
Supplemental data | | | | | | | | | | | | | | | | | | | | | | | | |
Portfolio turnover rate | | | 66 | % | | | 60 | % | | | 22 | % | | | 75 | % | | | 33 | % | | | 54 | % |
Net assets, end of period (000s omitted) | | | $71,072 | | | | $84,563 | | | | $79,312 | | | | $71,934 | | | | $40,073 | | | | $41,861 | |
| 1 | For the five months ended March 31, 2014. The Fund changed its fiscal year end from October 31 to March 31, effective March 31, 2014. |
| 2 | Calculated based upon average shares outstanding |
| 3 | Amount is less than $0.005. |
| 4 | Returns for periods of less than one year are not annualized. |
The accompanying notes are an integral part of these financial statements.
| | | | |
| 20 | | Wells Fargo Intrinsic Small Cap Value Fund | | Notes to financial statements |
1. ORGANIZATION
Wells Fargo Funds Trust (the “Trust”), a Delaware statutory trust organized on March 10, 1999, is an open-end management investment company registered under the Investment Company Act of 1940, as amended (the “1940 Act”). As an investment company, the Trust follows the accounting and reporting guidance in Financial Accounting Standards Board (“FASB”) Accounting Standards Codification Topic 946, Financial Services – Investment Companies. These financial statements report on the Wells Fargo Intrinsic Small Cap Value Fund (the “Fund”) which is a diversified series of the Trust.
Effective at the close of business on October 23, 2015, Investor Class shares became Class A shares in a tax-free conversion. Shareholders of Investor Class received Class A shares at a value equal to the value of their Investor Class shares immediately prior to the conversion. Investor Class shares are no longer offered by the Fund.
2. SIGNIFICANT ACCOUNTING POLICIES
The following significant accounting policies, which are consistently followed in the preparation of the financial statements of the Fund, are in conformity with U.S. generally accepted accounting principles which require management to make estimates and assumptions that affect the reported amounts of assets and liabilities, disclosure of contingent assets and liabilities at the date of the financial statements, and the reported amounts of revenues and expenses during the reporting period. Actual results could differ from those estimates.
Securities valuation
All investments are valued each business day as of the close of regular trading on the New York Stock Exchange (generally 4 p.m. Eastern Time), although the Fund may deviate from this calculation time under unusual or unexpected circumstances.
Equity securities that are listed on a foreign or domestic exchange or market are valued at the official closing price or, if none, the last sales price. If no sale occurs on the principal exchange or market that day, the prior day’s price will be deemed “stale” and a fair value price will be determined in accordance with the Fund’s Valuation Procedures.
Investments in registered open-end investment companies are valued at net asset value. Interests in non-registered investment vehicles that are redeemable at net asset value are fair valued normally at net asset value.
Investments which are not valued using any of the methods discussed above are valued at their fair value, as determined in good faith by the Board of Trustees of the Fund. The Board of Trustees has established a Valuation Committee comprised of the Trustees and has delegated to it the authority to take any actions regarding the valuation of portfolio securities that the Valuation Committee deems necessary or appropriate, including determining the fair value of portfolio securities, unless the determination has been delegated to the Management Valuation Team of Wells Fargo Funds Management, LLC (“Funds Management”). The Board of Trustees retains the authority to make or ratify any valuation decisions or approve any changes to the Valuation Procedures as it deems appropriate. On a quarterly basis, the Board of Trustees receives reports on any valuation actions taken by the Valuation Committee or the Management Valuation Team which may include items for ratification.
Valuations of fair valued securities are compared to the next actual sales price when available, or other appropriate market values, to assess the continued appropriateness of the fair valuation methodologies used. These securities are fair valued on a day-to-day basis, taking into consideration changes to appropriate market information and any significant changes to the inputs considered in the valuation process until there is a readily available price provided on an exchange or by an independent pricing service. Valuations received from an independent pricing service or independent broker-dealer quotes are periodically validated by comparisons to most recent trades and valuations provided by other independent pricing services in addition to the review of prices by the manager and/or subadviser. Unobservable inputs used in determining fair valuations are identified based on the type of security, taking into consideration factors utilized by market participants in valuing the investment, knowledge about the issuer and the current market environment.
Security loans
The Fund may lend its securities from time to time in order to earn additional income in the form of fees or interest on securities received as collateral or the investment of any cash received as collateral. The Fund continues to receive interest or dividends on the securities loaned. The Fund receives collateral in the form of cash or securities with a value at least equal to the value of the securities on loan. The value of the loaned securities is determined at the close of each business day and any additional required collateral is delivered to the Fund on the next business day. In a securities lending transaction, the net asset value of the Fund will be affected by an increase or decrease in the value of the securities loaned and by an increase or decrease in the value of the instrument in which collateral is invested. The amount of securities lending activity undertaken by the Fund fluctuates from time to time. In the event of default or bankruptcy by the borrower, the Fund may be prevented from recovering the loaned securities or gaining access to the collateral or
| | | | | | |
| Notes to financial statements | | Wells Fargo Intrinsic Small Cap Value Fund | | | 21 | |
may experience delays or costs in doing so. In addition, the investment of any cash collateral received may lose all or part of its value. The Fund has the right under the lending agreement to recover the securities from the borrower on demand.
The Fund lends its securities through an unaffiliated securities lending agent. Cash collateral received in connection with its securities lending transactions is invested in Securities Lending Cash Investments, LLC (the “Securities Lending Fund”). The Securities Lending Fund is exempt from registration under Section 3(c)(7) of the 1940 Act and is managed by Funds Management and is subadvised by Wells Capital Management Incorporated (“WellsCap”), an affiliate of Funds Management and an indirect wholly owned subsidiary of Wells Fargo & Company (“Wells Fargo”). Funds Management receives an advisory fee starting at 0.05% and declining to 0.01% as the average. Funds Management receives an advisory fee starting at 0.05% and declining to 0.01% as the average daily net assets of the Securities Lending Fund increase. All of the fees received by Funds Management are paid to WellsCap for its services as subadviser. The Securities Lending Fund seeks to provide a positive return compared to the daily Fed Funds Open rate by investing in high-quality, U.S. dollar-denominated short-term money market instruments. Securities Lending Fund investments are fair valued based upon the amortized cost valuation technique. Income earned from investment in the Securities Lending Fund is included in securities lending income on the Statement of Operations.
Security transactions and income recognition
Securities transactions are recorded on a trade date basis. Realized gains or losses are recorded on the basis of identified cost.
Dividend income is recognized on the ex-dividend date. Dividend income is recorded net of foreign taxes withheld where recovery of such taxes is not assured.
Distributions to shareholders
Distributions to shareholders from net investment income and net realized gains, if any, are recorded on the ex-dividend date. Such distributions are determined in conformity with federal income tax regulations, which may differ in amount or character from net investment income and realized gains recognized for purposes of U.S. generally accepted accounting principles.
Federal and other taxes
The Fund intends to continue to qualify as a regulated investment company by distributing substantially all of its investment company taxable income and any net realized capital gains (after reduction for capital loss carryforwards) sufficient to relieve it from all, or substantially all, federal income taxes. Accordingly, no provision for federal income taxes was required.
The Fund’s income and federal excise tax returns and all financial records supporting those returns for the prior three fiscal years are subject to examination by the federal and Delaware revenue authorities. Management has analyzed the Fund’s tax positions taken on federal, state, and foreign tax returns for all open tax years and does not believe that there are any uncertain tax positions that require recognition of a tax liability.
Reclassifications are made to the Fund’s capital accounts for permanent tax differences to reflect income and gains available for distribution (or available capital loss carryforwards) under federal income tax regulations. U.S. generally accepted accounting principles require that certain components of net assets be adjusted to reflect permanent differences between financial and tax reporting. These reclassifications have no effect on net assets or net asset values per share. The primary permanent difference causing such reclassifications is due to dividends from certain securities. At March 31, 2016, as a result of permanent book-to-tax differences, the following reclassification adjustments were made on the Statement of Assets and Liabilities:
| | |
Undistributed net
investment income | | Accumulated net
realized losses
on investments |
| $(343,062) | | $343,062 |
As of March 31, 2016, the Fund had capital loss carryforwards available to offset future net realized capital gains in the amount of $45,345,000 with $37,655,290 expiring in 2018 and $7,689,710 expiring in 2019.
| | | | |
| 22 | | Wells Fargo Intrinsic Small Cap Value Fund | | Notes to financial statements |
As of March 31, 2016, the Fund had current year deferred post-October capital losses consisting of $5,946,083 in short-term losses and $2,438,168 in long-term losses which will be recognized on the first day of the following fiscal year.
Class allocations
The separate classes of shares offered by the Fund differ principally in applicable sales charges, distribution, shareholder servicing, and administration fees. Class specific expenses are charged directly to that share class. Investment income, common expenses, and realized and unrealized gains (losses) on investments are allocated daily to each class of shares based on the relative proportion of net assets of each class.
3. FAIR VALUATION MEASUREMENTS
Fair value measurements of investments are determined within a framework that has established a fair value hierarchy based upon the various data inputs utilized in determining the value of the Fund’s investments. The three-level hierarchy gives the highest priority to unadjusted quoted prices in active markets for identical assets or liabilities (Level 1) and the lowest priority to significant unobservable inputs (Level 3). The Fund’s investments are classified within the fair value hierarchy based on the lowest level of input that is significant to the fair value measurement. The inputs are summarized into three broad levels as follows:
| n | | Level 1 – quoted prices in active markets for identical securities |
| n | | Level 2 – other significant observable inputs (including quoted prices for similar securities, interest rates, prepayment speeds, credit risk, use of amortized cost, etc.) |
| n | | Level 3 – significant unobservable inputs (including the Fund’s own assumptions in determining the fair value of investments) |
The inputs or methodologies used for valuing investments in securities are not necessarily an indication of the risk associated with investing in those securities.
The following is a summary of the inputs used in valuing the Fund’s assets and liabilities as of March 31, 2016:
| | | | | | | | | | | | | | | | |
| | | Quoted prices
(Level 1) | | | Other significant
observable inputs
(Level 2) | | | Significant
unobservable inputs
(Level 3) | | | Total | |
Assets | | | | | | | | | | | | | | | | |
Investments in: | | | | | | | | | | | | | | | | |
| | | | |
Common stocks | | | | | | | | | | | | | | | | |
Consumer discretionary | | $ | 14,149,978 | | | $ | 0 | | | $ | 0 | | | $ | 14,149,978 | |
Consumer staples | | | 7,026,729 | | | | 0 | | | | 0 | | | | 7,026,729 | |
Energy | | | 8,623,085 | | | | 0 | | | | 0 | | | | 8,623,085 | |
Financials | | | 30,573,288 | | | | 0 | | | | 0 | | | | 30,573,288 | |
Health care | | | 11,689,705 | | | | 0 | | | | 0 | | | | 11,689,705 | |
Industrials | | | 22,495,533 | | | | 0 | | | | 0 | | | | 22,495,533 | |
Information technology | | | 14,084,904 | | | | 2,112,521 | | | | 0 | | | | 16,197,425 | |
Materials | | | 2,691,905 | | | | 0 | | | | 0 | | | | 2,691,905 | |
Utilities | | | 2,020,367 | | | | 0 | | | | 0 | | | | 2,020,367 | |
| | | | |
Short-term investments | | | | | | | | | | | | | | | | |
Investment companies | | | 10,727,108 | | | | 0 | | | | 0 | | | | 10,727,108 | |
Investments measured at net asset value* | | | | | | | | | | | | | | | 10,432,100 | |
Total assets | | $ | 124,082,602 | | | $ | 2,112,521 | | | $ | 0 | | | $ | 136,627,223 | |
| * | Investments that are measured at fair value using the net asset value per share (or its equivalent) as a practical expedient have not been categorized in the fair value hierarchy. The fair value amount presented in the table is intended to permit reconciliation of the fair value hierarchy to the amounts presented in the Statement of Assets and Liabilities. The Fund’s investment in Securities Lending Cash Investments, LLC valued at $10,432,100 does not have a redemption period notice, can be redeemed daily and does not have any unfunded commitments. |
The Fund recognizes transfers between levels within the fair value hierarchy at the end of the reporting period. At March 31, 2016, the Fund did not have any transfers into/out of Level 1, Level 2, or Level 3.
| | | | | | |
| Notes to financial statements | | Wells Fargo Intrinsic Small Cap Value Fund | | | 23 | |
4. TRANSACTIONS WITH AFFILIATES
Management fee
Funds Management, an indirect wholly owned subsidiary of Wells Fargo, is the manager of the Fund and provides advisory and fund-level administrative services under an investment management agreement. Under the investment management agreement, Funds Management is responsible for, among other services, implementing the investment objectives and strategies of the Fund, supervising the applicable subadviser, providing fund-level administrative services in connection with the Fund’s operations, and providing any other fund-level administrative services reasonably necessary for the operation of the Fund. As compensation for its services under the investment management agreement, Funds Management is entitled to receive an annual management fee starting at 0.85% and declining to 0.71% as the average daily net assets of the Fund increase.
Prior to July 1, 2015, Funds Management provided advisory services pursuant to an investment advisory agreement and was entitled to receive an annual fee which started at 0.80% and declined to 0.68% as the average daily net assets of the Fund increased. In addition, fund-level administrative services were provided by Funds Management under a separate administration agreement at an annual fee which started at 0.05% and declined to 0.03% as the average daily net assets of the Fund increased. For financial statement purposes, the advisory fee and fund-level administration fee for the year ended March 31, 2016 have been included in management fee on the Statement of Operations.
For the year ended March 31, 2016, the management fee was equivalent to an annual rate of 0.85% of the Fund’s average daily net assets.
Funds Management has retained the services of a subadviser to provide daily portfolio management to the Fund. The fee for subadvisory services is borne by Funds Management. Metropolitan West Capital Management, LLC, an affiliate of Funds Management and an indirect wholly owned subsidiary of Wells Fargo, is the subadviser to the Fund and is entitled to receive a fee from Funds Management at an annual rate starting at 0.55% and declining to 0.40% as the average daily net assets of the Fund increase.
Administration fees
Under a class-level administration agreement, Funds Management provides class-level administrative services to the Fund, which includes paying fees and expenses for services provided by the transfer agent, sub-transfer agents, omnibus account servicers and record-keepers. As compensation for its services under the class-level administration agreement, Funds Management receives an annual fee which is calculated based on the average daily net assets of each class as follows:
| | | | | | | | |
| | | Class-level administration fee | |
| | | Current rate | | | Rate prior to
July 1, 2015 | |
Class A, Class C | | | 0.21 | % | | | 0.26 | % |
Administrator Class | | | 0.13 | | | | 0.10 | |
Institutional Class | | | 0.13 | | | | 0.08 | |
Investor Class | | | 0.32 | | | | 0.32 | |
Funds Management has contractually waived and/or reimbursed management and administration fees to the extent necessary to maintain certain net operating expense ratios for the Fund. Waiver of fees and/or reimbursement of expenses by Funds Management were made first from fund level expenses on a proportionate basis and then from class specific expenses. Funds Management has committed through July 31, 2016 to waive fees and/or reimburse expenses to the extent necessary to cap the Fund’s expenses at 1.35% for Class A shares, 2.10% for Class C shares, 1.20% for Class Administrator shares, and 1.00% for Institutional Class shares. After this time, the cap may be increased or the commitment to maintain the cap may be terminated only with the approval of the Board of Trustees.
Distribution fee
The Trust has adopted a distribution plan for Class C shares of the Fund pursuant to Rule 12b-1 under the 1940 Act. A distribution fee is charged to Class C shares and paid to Wells Fargo Funds Distributor, LLC (“Funds Distributor”), the principal underwriter, at an annual rate of 0.75% of the average daily net assets of Class C shares.
| | | | |
| 24 | | Wells Fargo Intrinsic Small Cap Value Fund | | Notes to financial statements |
In addition, Funds Distributor is entitled to receive the front-end sales charge from the purchase of Class A shares and a contingent deferred sales charge on the redemption of certain Class A shares. Funds Distributor is also entitled to receive the contingent deferred sales charges from redemptions of Class C shares. For the year ended March 31, 2016, Funds Distributor received $462 from the sale of Class A shares.
Shareholder servicing fees
The Trust has entered into contracts with one or more shareholder servicing agents, whereby Class A, Class C, Administrator Class, and Investor Class of the Fund are charged a fee at an annual rate of 0.25% of the average daily net assets of each respective class.
A portion of these total shareholder servicing fees were paid to affiliates of Wells Fargo.
5. INVESTMENT PORTFOLIO TRANSACTIONS
Purchases and sales of investments, excluding U.S. government obligations (if any) and short-term securities, for the year ended March 31, 2016 were $85,215,682 and $97,389,610, respectively.
6. BANK BORROWINGS
The Trust (excluding the money market funds and certain other funds) and Wells Fargo Variable Trust are parties to a $200,000,000 revolving credit agreement whereby the Fund is permitted to use bank borrowings for temporary or emergency purposes, such as to fund shareholder redemption requests. Interest under the credit agreement is charged to the Fund based on a borrowing rate equal to the higher of the Federal Funds rate in effect on that day plus 1.25% or the overnight LIBOR rate in effect on that day plus 1.25%. In addition, an annual commitment fee equal to 0.20% of the unused balance is allocated to each participating fund. Prior to September 1, 2015, the revolving credit agreement amount was $150,000,000 and the annual commitment fee was equal to 0.10% of the unused balance is allocated to each participating fund.
For the year ended March 31, 2016, there were no borrowings by the Fund under the agreement.
7. CONCENTRATION RISK
Concentration risks result from exposure to a limited number of sectors. A fund that invests a substantial portion of its assets in any sector may be more affected by changes in that sector than would be a fund whose investments are not heavily weighted in any sector.
8. DISTRIBUTIONS TO SHAREHOLDERS
The tax character of distributions paid was $1,082,941 and $328,545 of ordinary income for the years ended March 31, 2016 and March 31, 2015, respectively.
As of March 31, 2016, the components of distributable earnings on a tax basis were as follows:
| | | | | | |
Undistributed ordinary income | | Unrealized gains | | Post-October capital losses deferred | | Capital loss carryforward |
| $84,714 | | $7,452,149 | | $(8,384,251) | | $(45,345,000) |
9. INDEMNIFICATION
Under the Trust’s organizational documents, the officers and Trustees have been granted certain indemnification rights against certain liabilities that may arise out of performance of their duties to the Trust. Additionally, in the normal course of business, the Trust may enter into contracts with service providers that contain a variety of indemnification clauses. The Trust’s maximum exposure under these arrangements is dependent on future claims that may be made against the Fund and, therefore, cannot be estimated.
| | | | | | |
| Report of independent registered public accounting firm | | Wells Fargo Intrinsic Small Cap Value Fund | | | 25 | |
BOARD OF TRUSTEES AND SHAREHOLDERS OF WELLS FARGO FUNDS TRUST:
We have audited the accompanying statement of assets and liabilities, including the portfolio of investments, of the Wells Fargo Intrinsic Small Cap Value Fund (formerly known as Wells Fargo Advantage Intrinsic Small Cap Value Fund) (the “Fund”), one of the funds constituting the Wells Fargo Funds Trust, as of March 31, 2016, and the related statement of operations for the year then ended, the statements of changes in net assets for each of the years in the two-year period then ended and the financial highlights for each of the years in the two-year period then ended, the period from November 1, 2013 to March 31, 2014, and each of the years in the three-year period ended October 31, 2013. These financial statements and financial highlights are the responsibility of the Fund’s management. Our responsibility is to express an opinion on these financial statements and financial highlights based on our audits.
We conducted our audits in accordance with the standards of the Public Company Accounting Oversight Board (United States). Those standards require that we plan and perform the audit to obtain reasonable assurance about whether the financial statements and financial highlights are free of material misstatement. An audit includes examining, on a test basis, evidence supporting the amounts and disclosures in the financial statements. Our procedures included confirmation of securities owned as of March 31, 2016, by correspondence with the custodian and brokers or by other appropriate auditing procedures. An audit also includes assessing the accounting principles used and significant estimates made by management, as well as evaluating the overall financial statement presentation. We believe that our audits provide a reasonable basis for our opinion.
In our opinion, the financial statements and financial highlights referred to above present fairly, in all material respects, the financial position of the Wells Fargo Intrinsic Small Cap Value Fund as of March 31, 2016, the results of its operations for the year then ended, the changes in its net assets for each of the years in the two-year period then ended, and the financial highlights for each of the years or periods noted in the first paragraph above, in conformity with U.S. generally accepted accounting principles.

Boston, Massachusetts
May 25, 2016
| | | | |
| 26 | | Wells Fargo Intrinsic Small Cap Value Fund | | Other information (unaudited) |
TAX INFORMATION
For corporate shareholders, pursuant to Section 854 of the Internal Revenue Code, 100% of ordinary income dividends qualify for the corporate dividends-received deduction for the fiscal year ended March 31, 2016.
Pursuant to Section 854 of the Internal Revenue Code, $1,082,941 of income dividends paid during the fiscal year ended March 31, 2016 has been designated as qualified dividend income (QDI).
PROXY VOTING INFORMATION
A description of the policies and procedures that the Fund uses to determine how to vote proxies relating to portfolio securities is available, upon request, by calling 1-800-222-8222, visiting our website at wellsfargofunds.com, or visiting the SEC website at sec.gov. Information regarding how the Fund voted proxies relating to portfolio securities during the most recent 12-month period ended June 30 is available on the Fund’s website at wellsfargofunds.com or by visiting the SEC website at sec.gov.
PORTFOLIO HOLDINGS INFORMATION
The complete portfolio holdings for the Fund are publicly available monthly on the Fund’s website (wellsfargofunds.com), on a one-month delayed basis. In addition, top ten holdings information (excluding derivative positions) for the Fund is publicly available on the Fund’s website on a monthly, seven-day or more delayed basis. The Fund files its complete schedule of portfolio holdings with the SEC for the first and third quarters of each fiscal year on Form N-Q, which is available by visiting the SEC website at sec.gov. In addition, the Fund’s Form N-Q may be reviewed and copied at the SEC’s Public Reference Room in Washington, DC, and at regional offices in New York City, at 233 Broadway, and in Chicago, at 175 West Jackson Boulevard, Suite 900. Information about the Public Reference Room may be obtained by calling 1-800-SEC-0330.
| | | | | | |
| Other information (unaudited) | | Wells Fargo Intrinsic Small Cap Value Fund | | | 27 | |
BOARD OF TRUSTEES AND OFFICERS
Each of the Trustees and Officers1 listed in the table below acts in identical capacities for each fund in the Wells Fargo family of funds, which consists of 144 mutual funds comprising the Wells Fargo Funds Trust, Wells Fargo Variable Trust, Wells Fargo Master Trust and four closed-end funds (collectively the “Fund Complex”). This table should be read in conjunction with the Prospectus and the Statement of Additional Information2. The mailing address of each Trustee and Officer is 525 Market Street, 12th Floor, San Francisco, CA 94105. Each Trustee and Officer serves an indefinite term, however, each Trustee serves such term until reaching the mandatory retirement age established by the Trustees.
Independent Trustees
| | | | | | |
Name and year of birth | | Position held and length of service* | | Principal occupations during past five years or longer | | Current other public
company or investment
company directorships |
| William R. Ebsworth (Born 1957) | | Trustee, since 2015 | | Retired. From 1984 to 2013, equities analyst, portfolio manager, research director and chief financial officer at Fidelity Management and Research Company in Boston, Tokyo, and Hong Kong and retired in 2013 as Chief Investment Officer of Fidelity Strategic Advisers, Inc. where he lead a team of investment professionals managing client assets. Prior thereto, Board member of Hong Kong Securities Clearing Co., Hong Kong Options Clearing Corp., the Thailand International Fund, Ltd., Fidelity Investments Life Insurance Company, and Empire Fidelity Investments Life Insurance Company. Mr. Ebsworth is a CFA® charterholder and an Adjunct Lecturer, Finance, at Babson College. | | Asset Allocation Trust |
| Jane A. Freeman (Born 1953) | | Trustee, since 2015 | | Retired. From 2012 to 2014 and 1999 to 2008, Chief Financial Officer of Scientific Learning Corporation. From 2008 to 2012, Ms. Freeman provided consulting services related to strategic business projects. Prior to 1999, Portfolio Manager at Rockefeller & Co. and Scudder, Stevens & Clark. Board member of the Harding Loevner Funds from 1996 to 2014, serving as both Lead Independent Director and chair of the Audit Committee. Board member of the Russell Exchange Traded Funds Trust from 2011 to 2012 and the chair of the Audit Committee. Ms. Freeman is Chair of Taproot Foundation (non-profit organization), a Board Member of Ruth Bancroft Garden (non-profit organization) and an inactive chartered financial analyst. | | Asset Allocation Trust |
| Peter G. Gordon (Born 1942) | | Trustee, since 1998; Chairman, since 2005 | | Co-Founder, Retired Chairman, President and CEO of Crystal Geyser Water Company. Trustee Emeritus, Colby College. | | Asset Allocation Trust |
| Isaiah Harris, Jr. (Born 1952) | | Trustee, since 2009 | | Retired. Chairman of the Board of CIGNA Corporation since 2009, and Director since 2005. From 2003 to 2011, Director of Deluxe Corporation. Prior thereto, President and CEO of BellSouth Advertising and Publishing Corp. from 2005 to 2007, President and CEO of BellSouth Enterprises from 2004 to 2005 and President of BellSouth Consumer Services from 2000 to 2003. Emeritus member of the Iowa State University Foundation Board of Governors. Emeritus Member of the Advisory Board of Iowa State University School of Business. Advisory Board Member, Palm Harbor Academy (charter school). Advisory Board Member, Child Evangelism Fellowship (non-profit). Mr. Harris is a certified public accountant (inactive status). | | CIGNA Corporation; Asset Allocation Trust |
| Judith M. Johnson (Born 1949) | | Trustee, since 2008; Audit Committee Chairman, since 2008 | | Retired. Prior thereto, Chief Executive Officer and Chief Investment Officer of Minneapolis Employees Retirement Fund from 1996 to 2008. Ms. Johnson is an attorney, certified public accountant and a certified managerial accountant. | | Asset Allocation Trust |
| David F. Larcker (Born 1950) | | Trustee, since 2009 | | James Irvin Miller Professor of Accounting at the Graduate School of Business, Stanford University, Director of the Corporate Governance Research Initiative and Senior Faculty of The Rock Center for Corporate Governance since 2006. From 2005 to 2008, Professor of Accounting at the Graduate School of Business, Stanford University. Prior thereto, Ernst & Young Professor of Accounting at The Wharton School, University of Pennsylvania from 1985 to 2005. | | Asset Allocation Trust |
| | | | |
| 28 | | Wells Fargo Intrinsic Small Cap Value Fund | | Other information (unaudited) |
| | | | | | |
Name and year of birth | | Position held and length of service* | | Principal occupations during past five years or longer | | Current other public
company or investment
company directorships |
| Olivia S. Mitchell (Born 1953) | | Trustee, since 2006 | | International Foundation of Employee Benefit Plans Professor, Wharton School of the University of Pennsylvania since 1993. Director of Wharton’s Pension Research Council and Boettner Center on Pensions & Retirement Research, and Research Associate at the National Bureau of Economic Research. Previously, Cornell University Professor from 1978 to 1993. | | Asset Allocation Trust |
| Timothy J. Penny (Born 1951) | | Trustee, since 1996 | | President and Chief Executive Officer of Southern Minnesota Initiative Foundation, a non-profit organization, since 2007 and Senior Fellow at the Humphrey Institute Policy Forum at the University of Minnesota since 1995. Member of the Board of Trustees of NorthStar Education Finance, Inc., a non-profit organization, since 2007. | | Asset Allocation Trust |
| Michael S. Scofield (Born 1943) | | Trustee, since 2010 | | Served on the Investment Company Institute’s Board of Governors and Executive Committee from 2008-2011 as well the Governing Council of the Independent Directors Council from 2006-2011 and the Independent Directors Council Executive Committee from 2008-2011. Chairman of the IDC from 2008-2010. Institutional Investor (Fund Directions) Trustee of Year in 2007. Trustee of the Evergreen Funds complex (and its predecessors) from 1984 to 2010. Chairman of the Evergreen Funds from 2000-2010. Former Trustee of the Mentor Funds. Retired Attorney, Law Offices of Michael S. Scofield. | | Asset Allocation Trust |
| * | Length of service dates reflect the Trustee’s commencement of service with the Trust’s predecessor entities, where applicable. |
Officers
| | | | | | |
Name and year of birth | | Position held and length of service | | Principal occupations during past five years or longer | | |
Karla M. Rabusch (Born 1959) | | President, since 2003 | | Executive Vice President of Wells Fargo Bank, N.A. and President of Wells Fargo Funds Management, LLC since 2003. | | |
| Nancy Wiser1 (Born 1967) | | Treasurer, since 2012 | | Executive Vice President of Wells Fargo Funds Management, LLC since 2011. Chief Operating Officer and Chief Compliance Officer at LightBox Capital Management LLC, from 2008 to 2011. | | |
C. David Messman (Born 1960) | | Secretary, since 2000; Chief Legal Officer, since 2003 | | Senior Vice President and Secretary of Wells Fargo Funds Management, LLC since 2001. Assistant General Counsel of Wells Fargo Bank, N.A. since 2013 and Vice President and Managing Counsel of Wells Fargo Bank, N.A. from 1996 to 2013. | | |
| Debra Ann Early (Born 1964) | | Chief Compliance Officer, since 2007 | | Executive Vice President of Wells Fargo Funds Management, LLC since 2014, Senior Vice President and Chief Compliance Officer from 2007 to 2014. | | |
| David Berardi (Born 1975) | | Assistant Treasurer, since 2009 | | Vice President of Wells Fargo Funds Management, LLC since 2009. Vice President of Evergreen Investment Management Company, LLC from 2008 to 2010. Manager of Fund Reporting and Control for Evergreen Investment Management Company, LLC from 2004 to 2010. | | |
Jeremy DePalma1 (Born 1974) | | Assistant Treasurer, since 2009 | | Senior Vice President of Wells Fargo Funds Management, LLC since 2009. Senior Vice President of Evergreen Investment Management Company, LLC from 2008 to 2010 and head of the Fund Reporting and Control Team within Fund Administration from 2005 to 2010. | | |
| 1 | Nancy Wiser acts as Treasurer of 72 funds in the Fund Complex. Jeremy DePalma acts as Treasurer of 72 funds and Assistant Treasurer of 72 funds in the Fund Complex. |
| 2 | The Statement of Additional Information includes additional information about the Trustees and is available, without charge, upon request, by calling 1-800-222-8222 or by visiting the website at wellsfargofunds.com. |
| | | | | | |
| List of abbreviations | | Wells Fargo Intrinsic Small Cap Value Fund | | | 29 | |
The following is a list of common abbreviations for terms and entities that may have appeared in this report.
| ACA | — ACA Financial Guaranty Corporation |
| ADR | — American depositary receipt |
| ADS | — American depositary shares |
| AGC | — Assured Guaranty Corporation |
| AGM | — Assured Guaranty Municipal |
| Ambac | — Ambac Financial Group Incorporated |
| AMT | — Alternative minimum tax |
| BAN | — Bond anticipation notes |
| BHAC | — Berkshire Hathaway Assurance Corporation |
| CAB | — Capital appreciation bond |
| CCAB | — Convertible capital appreciation bond |
| CDA | — Community Development Authority |
| CDO | — Collateralized debt obligation |
| DRIVER | — Derivative inverse tax-exempt receipts |
| DW&P | — Department of Water & Power |
| DWR | — Department of Water Resources |
| ECFA | — Educational & Cultural Facilities Authority |
| EDA | — Economic Development Authority |
| EDFA | — Economic Development Finance Authority |
| ETF | — Exchange-traded fund |
| FDIC | — Federal Deposit Insurance Corporation |
| FFCB | — Federal Farm Credit Banks |
| FGIC | — Financial Guaranty Insurance Corporation |
| FHA | — Federal Housing Administration |
| FHLB | — Federal Home Loan Bank |
| FHLMC | — Federal Home Loan Mortgage Corporation |
| FICO | — The Financing Corporation |
| FNMA | — Federal National Mortgage Association |
| GDR | — Global depositary receipt |
| GNMA | — Government National Mortgage Association |
| HCFR | — Healthcare facilities revenue |
| HEFA | — Health & Educational Facilities Authority |
| HEFAR | — Higher education facilities authority revenue |
| HFA | — Housing Finance Authority |
| HFFA | — Health Facilities Financing Authority |
| HUD | — Department of Housing and Urban Development |
| IDA | — Industrial Development Authority |
| IDAG | — Industrial Development Agency |
| KRW | — Republic of Korea won |
| LIBOR | — London Interbank Offered Rate |
| LIFER | — ��Long Inverse Floating Exempt Receipts |
| LLC | — Limited liability company |
| LLLP | — Limited liability limited partnership |
| LLP | — Limited liability partnership |
| MBIA | — Municipal Bond Insurance Association |
| MFHR | — Multifamily housing revenue |
| MSTR | — Municipal securities trust receipts |
| MUD | — Municipal Utility District |
| National | — National Public Finance Guarantee Corporation |
| PCFA | — Pollution Control Financing Authority |
| PCL | — Public Company Limited |
| PCR | — Pollution control revenue |
| PFA | — Public Finance Authority |
| PFFA | — Public Facilities Financing Authority |
| PFOTER | — Puttable floating option tax-exempt receipts |
| plc | — Public limited company |
| PUTTER | — Puttable tax-exempt receipts |
| R&D | — Research & development |
| Radian | — Radian Asset Assurance |
| RAN | — Revenue anticipation notes |
| RDA | — Redevelopment Authority |
| RDFA | — Redevelopment Finance Authority |
| REIT | — Real estate investment trust |
| ROC | — Reset option certificates |
| SAVRS | — Select auction variable rate securities |
| SBA | — Small Business Authority |
| SDR | — Swedish depositary receipt |
| SFHR | — Single-family housing revenue |
| SFMR | — Single-family mortgage revenue |
| SPA | — Standby purchase agreement |
| SPDR | — Standard & Poor’s Depositary Receipts |
| SPEAR | — Short Puttable Exempt Adjustable Receipts |
| STRIPS | — Separate trading of registered interest and |
| TAN | — Tax anticipation notes |
| TIPS | — Treasury inflation-protected securities |
| TRAN | — Tax revenue anticipation notes |
| TTFA | — Transportation Trust Fund Authority |
| TVA | — Tennessee Valley Authority |
This page is intentionally left blank.
This page is intentionally left blank.
This page is intentionally left blank.

For more information
More information about Wells Fargo Funds is available free upon request. To obtain literature, please write, email, visit the Fund’s website, or call:
Wells Fargo Funds
P.O. Box 8266
Boston, MA 02266-8266
Email: fundservice@wellsfargo.com
Website: wellsfargofunds.com
Individual investors: 1-800-222-8222
Retail investment professionals: 1-888-877-9275
Institutional investment professionals: 1-866-765-0778
This report and the financial statements contained herein are submitted for the general information of the shareholders of the Fund. If this report is used for promotional purposes, distribution of the report must be accompanied or preceded by a current prospectus. Before investing, please consider the investment objectives, risks, charges, and expenses of the investment. For a current prospectus and, if available, a summary prospectus, containing this information, call 1-800-222-8222 or visit the Fund’s website at wellsfargofunds.com. Read the prospectus carefully before you invest or send money.
Wells Fargo Asset Management (WFAM) is a trade name used by the asset management businesses of Wells Fargo & Company. Wells Fargo Funds Management, LLC, a wholly owned subsidiary of Wells Fargo & Company, provides investment advisory and administrative services for Wells Fargo Funds. Other affiliates of Wells Fargo & Company provide subadvisory and other services for the funds. The funds are distributed by Wells Fargo Funds Distributor, LLC, Member FINRA, an affiliate of Wells Fargo & Company.
NOT FDIC INSURED ¡ NO BANK GUARANTEE ¡ MAY LOSE VALUE
© 2016 Wells Fargo Funds Management, LLC. All rights reserved.
| | |
 | | 241815 05-16 A242/AR242 03-16 |
Annual Report
March 31, 2016

Wells Fargo Small Cap Opportunities Fund


Reduce clutter. Save trees.
Sign up for electronic delivery of prospectuses and shareholder reports at wellsfargo.com/advantagedelivery
Contents
The views expressed and any forward-looking statements are as of March 31, 2016, unless otherwise noted, and are those of the Fund managers and/or Wells Fargo Funds Management, LLC. Discussions of individual securities, or the markets generally, or any Wells Fargo Fund are not intended as individual recommendations. Future events or results may vary significantly from those expressed in any forward-looking statements. The views expressed are subject to change at any time in response to changing circumstances in the market. Wells Fargo Funds Management, LLC and the Fund disclaim any obligation to publicly update or revise any views expressed or forward-looking statements.
NOT FDIC INSURED ¡ NO BANK GUARANTEE ¡ MAY LOSE VALUE
| | | | |
| 2 | | Wells Fargo Small Cap Opportunities Fund | | Letter to shareholders (unaudited) |

Karla M. Rabusch
President
Wells Fargo Funds
Throughout the period, stock performance was highly volatile.
Stock values recovered during the second half of the first quarter of 2016.
Dear Valued Shareholder:
We are pleased to offer you this annual report for the Wells Fargo Small Cap Opportunities Fund for the 12-month period that ended March 31, 2016. Throughout the period, stock performance was highly volatile. Investors reacted to slowing economic growth, moderating corporate earnings, weakening commodity prices, increasing central-bank intervention, and shifts in currency values. During the last four weeks of the period, investor sentiment appeared to move beyond these concerns as economic data firmed and stocks gained across the capitalization spectrum.
As investors grew concerned about global issues, volatility increased.
A common measure of investors’ stock volatility expectations—the Chicago Board Options Exchange (CBOE) Volatility Index (VIX)1—illustrated the shifts in investor sentiment. The VIX spiked to readings above 40 in August 2015, indicating increased investor anxiety. During a comparatively calm autumn, VIX readings trended to the midteens and closer to their five-year average. Then stock markets grew volatile again as the winter months arrived. After the new year began, VIX readings spiked to the high 20s as U.S. equity markets posted their worst start to a calendar year on record. Stock values recovered during the second half of the first quarter of 2016. Investors appeared to be encouraged by improving economic data and the reassurances of central bankers that they remain committed to spurring growth through policy initiatives.
However, business, economic, and central-bank policy development had countervailing influences. For example, while a stronger dollar benefited consumer purchasing power, it tended to negatively affect corporate earnings and investment gains earned overseas when translated to U.S. dollars. Lower energy costs helped consumers’ budgets but hampered the profits and stock performance in the energy sector. While lower interest rates encouraged spending, the potential for interest-rate increases caused uncertainty.
Central bankers responded with policy initiatives in response to shifting economic conditions.
In December 2015, the U.S. Federal Reserve (Fed) increased the federal funds rate, the first interest-rate increase since 2006. The Fed also expressed its intention to increase the rate several times during 2016. After the new year began, as data weakened and volatility increased, the Fed retrenched, which injected additional uncertainty into the markets. In the eurozone, the European Central Bank continued to encourage lending and investing by making funds available to banks at low interest rates, imposing a negative interest rate on bank deposits, and purchasing bonds through its quantitative easing program. In Japan, the central bank also implemented a negative interest-rate policy intended to spur lending and investment. In China, the People’s Bank of China lowered interest rates and bank reserve requirements, in addition to devaluing the country’s currency to support exports.
| 1 | The Chicago Board Options Exchange (CBOE) Volatility Index (VIX) is a key measure of market expectations of near-term volatility conveyed by the S&P 500 stock index option prices. Since its introduction in 1993, VIX has been considered by many to be the world’s premier barometer of investor sentiment and market volatility. Several investors expressed interest in trading instruments related to the market’s expectation of future volatility, and so VIX futures were introduced in 2004, and VIX options were introduced in 2006. |
| | | | | | |
| Letter to shareholders (unaudited) | | Wells Fargo Small Cap Opportunities Fund | | | 3 | |
Volatility and recoveries highlighted the value of a long-term investment strategy.
The experience of the past 12 months demonstrated the value of maintaining a disciplined, long-term investment strategy despite short-term volatility. Broad U.S. equity indexes trimmed their worst losses measured to the midpoint of the period to recover all or a portion of their lost values by the end of the period. For example, the S&P 500 Index,2 a commonly referenced gauge of large-cap stock performance, gained 1.78% for the 12-month period that ended March 31, 2016, after recording a 6.18% loss for the six-month period that ended September 30, 2015. Some observers attributed the S&P 500 Index’s relative outperformance to investors who moved their equity allocations higher in the capitalization structure in pursuit of the perceived safety of large-cap stocks. The Russell Midcap® Index3 lost 4.04% for the 12-month period that ended March 31, 2016, regaining more than half of the 9.42% loss it had recorded for the six-month period that ended September 30, 2015. For the 12-month period that ended March 31, 2016, the Russell 2000® Index,4 a common small-cap stock index, lost 9.76%, an improvement from the 11.55% loss it had recorded during the six-month period that ended September 30, 2015.
Don’t let short-term uncertainty derail long-term investment goals.
Periods of investment uncertainty can present challenges, but experience has taught us that maintaining long-term investment goals can be an effective way to plan for the future. To help you create a sound strategy based on your personal goals and risk tolerance, Wells Fargo Funds offers more than 100 mutual funds spanning a wide range of asset classes and investment styles. Although diversification cannot guarantee an investment profit or prevent losses, we believe it can be an effective way to manage investment risk and potentially smooth out overall portfolio performance. We encourage investors to know their investments and to understand that appropriate levels of risk-taking may unlock opportunities.
Thank you for choosing to invest with Wells Fargo Funds. We appreciate your confidence in us and remain committed to helping you meet your financial needs.
Sincerely,

Karla M. Rabusch
President
Wells Fargo Funds
For further information about your Fund, contact your investment professional, visit our website at wellsfargofunds.com, or call us directly at 1-800-222-8222. We are available 24 hours a day, 7 days a week.
| 2 | The S&P 500 Index consists of 500 stocks chosen for market size, liquidity, and industry group representation. It is a market-value-weighted index with each stock’s weight in the index proportionate to its market value. You cannot invest directly in an index. |
| 3 | The Russell Midcap® Index measures the performance of the 800 smallest companies in the Russell 1000® Index, which represent approximately 25% of the total market capitalization of the Russell 1000® Index. You cannot invest directly in an index. |
| 4 | The Russell 2000® Index measures the performance of the 2,000 smallest companies in the Russell 3000® Index, which represents approximately 8% of the total market capitalization of the Russell 3000® Index. You cannot invest directly in an index. |
| | | | |
| 4 | | Wells Fargo Small Cap Opportunities Fund | | Performance highlights (unaudited) |
Investment objective
The Fund seeks long-term capital appreciation.
Manager
Wells Fargo Funds Management, LLC
Subadviser
Schroder Investment Management North America Inc.
Portfolio manager
Jenny B. Jones
Average annual total returns (%) as of March 31, 20161
| | | | | | | | | | | | | | | | | | | | | | |
| | | | | | | | Expense ratios2 (%) | |
| | | Inception date | | 1 year | | | 5 year | | | 10 year | | | Gross | | | Net3 | |
| Administrator Class (NVSOX) | | 8-1-1993 | | | (4.39 | ) | | | 8.21 | | | | 7.50 | | | | 1.28 | | | | 1.21 | |
| Institutional Class (WSCOX) | | 10-31-2014 | | | (4.12 | ) | | | 8.29 | | | | 7.54 | | | | 1.03 | | | | 0.96 | |
| Russell 2000TM Index4 | | – | | | (9.76) | | | | 7.20 | | | | 5.26 | | | | – | | | | – | |
Figures quoted represent past performance, which is no guarantee of future results, and do not reflect taxes that a shareholder may pay on fund distributions or the redemption of fund shares. Investment return and principal value of an investment will fluctuate so that an investor’s shares, when redeemed, may be worth more or less than their original cost. Current performance may be lower or higher than the performance data quoted, which assumes the reinvestment of dividends and capital gains. Current month-end performance is available on the Fund’s website, wellsfargofunds.com.
Index returns do not include transaction costs associated with buying and selling securities, any mutual fund fees or expenses, or any taxes. It is not possible to invest directly in an index.
Administrator Class and Institutional Class shares are sold without a front-end sales charge or contingent deferred sales charge.
Stock values fluctuate in response to the activities of individual companies and general market and economic conditions. Smaller-company stocks tend to be more volatile and less liquid than those of larger companies. The use of derivatives may reduce returns and/or increase volatility. Consult the Fund’s prospectus for additional information on these and other risks.
Please see footnotes on page 5.
| | | | | | |
| Performance highlights (unaudited) | | Wells Fargo Small Cap Opportunities Fund | | | 5 | |
|
| Growth of $1,000,000 investment as of March 31, 20165 |
|
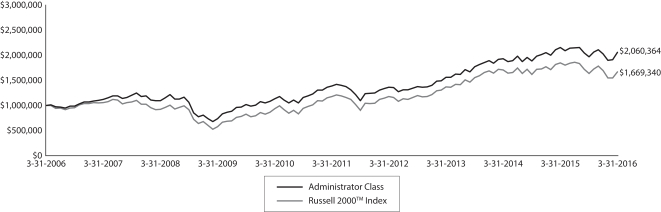 |
| 1 | Historical performance shown for the Institutional Class shares prior to their inception reflects the performance of the Administrator Class shares, and is not adjusted to reflect the Institutional Class expenses. If these expenses had been included, returns for the Institutional Class would be higher. |
| 2 | Reflects the expense ratios as stated in the most recent prospectuses, which include the impact of 0.01% in acquired fund fees and expenses. The expense ratios shown are subject to change and may differ from the annualized expense ratios shown in the financial highlights of this report, which do not include acquired fund fees and expenses. |
| 3 | The manager has contractually committed through July 31, 2016, to waive fees and/or reimburse expenses to the extent necessary to cap the Fund’s Total Annual Fund Operating Expenses After Fee Waiver at 1.20% for Administrator Class and 0.95% for Institutional Class. After this time, the cap may be increased or the commitment to maintain the cap may be terminated only with the approval of the Board of Trustees. Brokerage commissions, stamp duty fees, interest, taxes, acquired fund fees and expenses, and extraordinary expenses are excluded from the cap. Without this cap, the Fund’s returns would have been lower. |
| 4 | The Russell 2000TM Index measures the performance of the 2,000 smallest companies in the Russell 3000TM Index, which represents approximately 8% of the total market capitalization of the Russell 3000TM Index. You cannot invest directly in an index |
| 5 | The chart compares the performance of Administrator Class shares for the most recent ten years with the Russell 2000TM Index. The chart assumes a hypothetical investment of $1,000,000 in Administrator Class shares and reflects all operating expenses. |
| 6 | The S&P 500 Index consists of 500 stocks chosen for market size, liquidity, and industry group representation. It is a market-value-weighted index with each stock’s weight in the index proportionate to its market value. You cannot invest directly in an index. |
| 7 | The ten largest holdings, excluding cash and cash equivalents, are calculated based on the value of the investments divided by total net assets of the Fund. Holdings are subject to change and may have changed since the date specified. |
| 8 | Amounts are calculated based on the total long-term investments of the Fund. These amounts are subject to change and may have changed since the date specified. |
| * | This security was not held in the Fund at the end of the reporting period. |
| | | | |
| 6 | | Wells Fargo Small Cap Opportunities Fund | | Performance highlights (unaudited) |
MANAGER’S DISCUSSION
Fund highlights
| n | | The Fund outperformed its benchmark, the Russell 2000TM Index, for the 12-month period that ended March 31, 2016. |
| n | | The Fund benefited from positive stock selection in 7 of the 10 sectors, led by holdings in the industrials and health care sectors. An underweight to and stock selection within the energy sector proved helpful as well. |
| n | | Certain holdings in the information technology (IT) and financials sectors hindered performance. |
In a year of uncertainty, strength in housing remained consistent.
A number of unforeseen developments occurred during the 12-month period that ended March 31, 2016. The price of oil fell by more than 20%; the U.S. Federal Reserve finally answered the question of when interest rates would increase by raising the federal funds rate 25 basis points (bps; 100 bps equals 1.00%) in December 2015; and the S&P 500 Index6 significantly outperformed the Russell 2000TM Index for the second calendar year in a row, leading large-cap stocks to outperform small-cap stocks on a cumulative basis for the 1-, 3-, 5-, and 10-year periods (as of December 31, 2015; S&P 500 Index versus Russell 2000TM Index). This last point reflects a stunning shift over a short time frame: At the end of 2013, small caps had beaten large caps in 7 of the 10 previous calendar years.
The U.S. housing recovery has remained a good story. One related theme that has proven to be especially fruitful for small-cap stocks is the acceleration in household formation—due partly to Millennials’ efforts to become established financially following the Great Recession—and its impact on the housing market. Housing has been in recovery mode since 2011, and new-home starts now have passed the 1 million mark. To us, the housing uptrend appears to be on a sustainable path, and importantly, it has not shown any of the frenetic, speculative characteristics of a bubble.
| | | | |
| Ten largest holdings (%) as of March 31, 20167 | |
VWR Corporation | | | 1.80 | |
Steven Madden Limited | | | 1.49 | |
Kennedy Wilson Holdings Incorporated | | | 1.49 | |
Terreno Realty Corporation | | | 1.48 | |
Cadence Design Systems Incorporated | | | 1.46 | |
CoreLogic Incorporated | | | 1.44 | |
Fortinet Incorporated | | | 1.41 | |
Hexcel Corporation | | | 1.37 | |
Catalent Incorporated | | | 1.36 | |
iShares Russell 2000 Index ETF | | | 1.35 | |
Stock selection proved key to the Fund’s outperformance for the period.
Strong stock selection drove much of the Fund’s outperformance during the period; holdings within the industrials and health care sectors delivered the best relative results. Within industrials, scientific control and filter instruments manufacturer IDEX Corporation and pollution-control company Waste Connections, Incorporated, boosted results. In the health care sector, the Fund benefited from lack of exposure to many biotechnology stocks that plummeted over the period. A position in dental supplier Sirona Dental Systems, Incorporated,* also added significant value due to its well-received announcement during the period that it would be merging with DENTSPLY International Incorporated.
An underweight to and stock selection within the energy sector aided relative performance. We avoided exposure to a number of the weakest-performing oil exploration and production companies, which helped the Fund’s energy holdings outperform the index’s energy sector by roughly 15%.
Select IT and financials holdings detracted from the Fund’s overall results.
Within the Fund’s IT sector, holdings in the communications-equipment, software, and electronic-equipment industries hindered Fund performance the most. One key detractor, electronic-components company Belden Incorporated,* dropped more than 48% during the period. Fortunately, some of the sector’s losses were offset by top-performing optical-equipment manufacturer Fabrinet, which rose more than 70% for the period. Within the financials sector, securities-brokerage firm Stifel Financial Corporation caused a notable lag relative to the index. The company struggled due to weak commissions and a bleaker-than-expected management outlook.
Please see footnotes on page 5.
| | | | | | |
| Performance highlights (unaudited) | | Wells Fargo Small Cap Opportunities Fund | | | 7 | |
|
| Sector distribution as of March 31, 20168 |
|
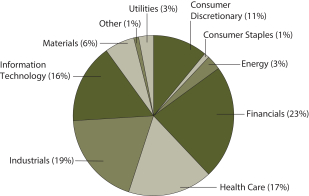 |
Housing remains a key area of investment for us.
Because of the economic-multiplier effect, housing remains important. When a new home is purchased, a host of products and services need to be bought, ranging from building materials and heating/air conditioning systems to mortgage services, insurance products, and home furnishings. While we have been investing in housing for several years, we importantly have avoided investment in homebuilders; we feel the better business models are found in housing-related industries. Given the demographic trends and importance of the housing market within the U.S. economy, we continue to find it a good area for investment and one that disproportionately favors smaller-cap companies.
While the strength of the U.S. dollar has negatively affected many U.S. companies, we continue to invest in select firms that may have been challenged as a result of the dollar’s strength and their foreign exposure. We also look for new ideas within the consumer sectors because valuations of many of these companies appear reasonable to us; in our view, attractive businesses can be found that may have been pressured simply because consumer stocks as a whole were out of favor.
Please see footnotes on page 5.
| | | | |
| 8 | | Wells Fargo Small Cap Opportunities Fund | | Fund expenses (unaudited) |
As a shareholder of the Fund, you incur ongoing costs and other Fund expenses. This example is intended to help you understand your ongoing costs (in dollars) of investing in the Fund and to compare these costs with the ongoing costs of investing in other mutual funds.
This example is based on an investment of $1,000 invested at the beginning of the six-month period and held for the entire period from October 1, 2015 to March 31, 2016.
Actual expenses
The “Actual” line of the table below provides information about actual account values and actual expenses. You may use the information in this line, together with the amount you invested, to estimate the expenses that you paid over the period. Simply divide your account value by $1,000 (for example, an $8,600 account value divided by $1,000 = 8.6), then multiply the result by the number in the “Actual” line under the heading entitled “Expenses paid during period” for your applicable class of shares to estimate the expenses you paid on your account during this period.
Hypothetical example for comparison purposes
The “Hypothetical” line of the table below provides information about hypothetical account values and hypothetical expenses based on the Fund’s actual expense ratio and an assumed rate of return of 5% per year before expenses, which is not the Fund’s actual return. The hypothetical account values and expenses may not be used to estimate the actual ending account balance or expenses you paid for the period. You may use this information to compare the ongoing costs of investing in the Fund and other funds. To do so, compare this 5% hypothetical example with the 5% hypothetical examples that appear in the shareholder reports of the other funds.
Please note that the expenses shown in the table are meant to highlight your ongoing costs only and do not reflect any transactional costs, such as sales charges (loads) and contingent deferred sales charges. Therefore, the “Hypothetical” line of the table is useful in comparing ongoing costs only and will not help you determine the relative total costs of owning different funds. In addition, if these transactional costs were included, your costs would have been higher.
| | | | | | | | | | | | | | | | |
| | | Beginning
account value
10-1-2015 | | | Ending
account value
3-31-2016 | | | Expenses
paid during
the period¹ | | | Net annualized
expense ratio | |
Administrator Class | | | | | | | | | | | | | | | | |
Actual | | $ | 1,000.00 | | | $ | 1,046.20 | | | $ | 6.14 | | | | 1.20 | % |
Hypothetical (5% return before expenses) | | $ | 1,000.00 | | | $ | 1,019.00 | | | $ | 6.06 | | | | 1.20 | % |
Institutional Class | | | | | | | | | | | | | | | | |
Actual | | $ | 1,000.00 | | | $ | 1,047.66 | | | $ | 4.86 | | | | 0.95 | % |
Hypothetical (5% return before expenses) | | $ | 1,000.00 | | | $ | 1,020.25 | | | $ | 4.80 | | | | 0.95 | % |
| 1 | Expenses paid is equal to the annualized expense ratio of each class multiplied by the average account value over the period, multiplied by the number of days in the most recent fiscal half-year divided by the number of days in the fiscal year (to reflect the one-half-year period). |
| | | | | | |
| Portfolio of investments—March 31, 2016 | | Wells Fargo Small Cap Opportunities Fund | | | 9 | |
| | | | | | | | | | | | |
| Security name | | | | | | Shares | | | Value | |
| | | | |
Common Stocks: 91.58% | | | | | | | | | | | | |
| | | | |
Consumer Discretionary: 10.26% | | | | | | | | | | | | |
| | | | |
| Auto Components: 0.38% | | | | | | | | | | | | |
Standard Motor Products Incorporated | | | | | | | 29,192 | | | $ | 1,011,503 | |
| | | | | | | | | | | | |
| | | | |
| Diversified Consumer Services: 1.01% | | | | | | | | | | | | |
Graham Holdings Company Class B | | | | | | | 5,600 | | | | 2,688,000 | |
| | | | | | | | | | | | |
| | | | |
| Hotels, Restaurants & Leisure: 3.21% | | | | | | | | | | | | |
Domino’s Pizza Incorporated | | | | | | | 5,900 | | | | 777,974 | |
Homeinns Hotel Group ADR Ǡ | | | | | | | 37,700 | | | | 1,344,005 | |
Interval Leisure Group Incorporated « | | | | | | | 146,300 | | | | 2,112,572 | |
Jack in the Box Incorporated | | | | | | | 19,400 | | | | 1,239,078 | |
The Cheesecake Factory Incorporated | | | | | | | 56,800 | | | | 3,015,512 | |
| | | | |
| | | | | | | | | | | 8,489,141 | |
| | | | | | | | | | | | |
| | | | |
| Household Durables: 2.03% | | | | | | | | | | | | |
Cavco Industries Incorporated † | | | | | | | 22,510 | | | | 2,103,785 | |
Helen of Troy Limited † | | | | | | | 31,600 | | | | 3,276,602 | |
| | | | |
| | | | | | | | | | | 5,380,387 | |
| | | | | | | | | | | | |
| | | | |
| Leisure Products: 1.04% | | | | | | | | | | | | |
Brunswick Corporation | | | | | | | 57,200 | | | | 2,744,456 | |
| | | | | | | | | | | | |
| | | | |
| Media: 1.10% | | | | | | | | | | | | |
AMC Entertainment Holdings Class A | | | | | | | 44,150 | | | | 1,235,759 | |
Hemisphere Media Group Incorporated Ǡ | | | | | | | 78,534 | | | | 1,031,151 | |
John Wiley & Sons Incorporated Class A | | | | | | | 13,000 | | | | 635,570 | |
| | | | |
| | | | | | | | | | | 2,902,480 | |
| | | | | | | | | | | | |
| | | | |
| Textiles, Apparel & Luxury Goods: 1.49% | | | | | | | | | | | | |
Steven Madden Limited † | | | | | | | 106,600 | | | | 3,948,464 | |
| | | | | | | | | | | | |
| | | | |
Consumer Staples: 1.34% | | | | | | | | | | | | |
| | | | |
| Food Products: 1.34% | | | | | | | | | | | | |
Darling Ingredients Incorporated † | | | | | | | 146,557 | | | | 1,930,156 | |
Dean Foods Company « | | | | | | | 93,250 | | | | 1,615,090 | |
| | | | |
| | | | | | | | | | | 3,545,246 | |
| | | | | | | | | | | | |
| | | | |
Energy: 2.56% | | | | | | | | | | | | |
| | | | |
| Energy Equipment & Services: 0.82% | | | | | | | | | | | | |
RPC Incorporated « | | | | | | | 152,000 | | | | 2,155,360 | |
| | | | | | | | | | | | |
| | | | |
| Oil, Gas & Consumable Fuels: 1.74% | | | | | | | | | | | | |
PDC Energy Incorporated † | | | | | | | 23,200 | | | | 1,379,240 | |
Synergy Resources Corporation † | | | | | | | 416,700 | | | | 3,237,759 | |
| | | | |
| | | | | | | | | | | 4,616,999 | |
| | | | | | | | | | | | |
The accompanying notes are an integral part of these financial statements.
| | | | |
| 10 | | Wells Fargo Small Cap Opportunities Fund | | Portfolio of investments—March 31, 2016 |
| | | | | | | | | | | | |
| Security name | | | | | | Shares | | | Value | |
| | | | |
Financials: 21.32% | | | | | | | | | | | | |
| | | | |
| Banks: 6.44% | | | | | | | | | | | | |
Chemical Financial Corporation | | | | | | | 62,330 | | | $ | 2,224,558 | |
First Citizens BancShares Corporation Class A | | | | | | | 10,791 | | | | 2,709,296 | |
Heritage Financial Corporation | | | | | | | 82,697 | | | | 1,452,986 | |
Lakeland Financial Corporation | | | | | | | 27,900 | | | | 1,277,262 | |
PrivateBancorp Incorporated | | | | | | | 50,800 | | | | 1,960,880 | |
Simmons First National Corporation Class A | | | | | | | 33,700 | | | | 1,518,859 | |
Westamerica Bancorporation « | | | | | | | 44,900 | | | | 2,187,079 | |
Western Alliance Bancorp † | | | | | | | 74,100 | | | | 2,473,458 | |
Wintrust Financial Corporation | | | | | | | 28,157 | | | | 1,248,481 | |
| | | | |
| | | | | | | | | | | 17,052,859 | |
| | | | | | | | | | | | |
| | | | |
| Capital Markets: 2.35% | | | | | | | | | | | | |
Golub Capital BDC Incorporated « | | | | | | | 178,295 | | | | 3,086,286 | |
HFF Incorporated Class A | | | | | | | 60,000 | | | | 1,651,800 | |
Stifel Financial Corporation † | | | | | | | 50,631 | | | | 1,498,678 | |
| | | | |
| | | | | | | | | | | 6,236,764 | |
| | | | | | | | | | | | |
| | | | |
| Diversified Financial Services: 0.55% | | | | | | | | | | | | |
Compass Diversified Holdings | | | | | | | 93,900 | | | | 1,469,535 | |
| | | | | | | | | | | | |
| | | | |
| Insurance: 4.58% | | | | | | | | | | | | |
Amerisafe Incorporated | | | | | | | 53,500 | | | | 2,810,890 | |
Brown & Brown Incorporated | | | | | | | 90,700 | | | | 3,247,060 | |
ProAssurance Corporation | | | | | | | 61,329 | | | | 3,103,247 | |
Reinsurance Group of America Incorporated | | | | | | | 30,700 | | | | 2,954,875 | |
| | | | |
| | | | | | | | | | | 12,116,072 | |
| | | | | | | | | | | | |
| | | | |
| Real Estate Management & Development: 1.49% | | | | | | | | | | | | |
Kennedy Wilson Holdings Incorporated | | | | | | | 179,600 | | | | 3,933,240 | |
| | | | | | | | | | | | |
| | | | |
| REITs: 4.91% | | | | | | | | | | | | |
Douglas Emmett Incorporated | | | | | | | 94,400 | | | | 2,842,384 | |
Equity Lifestyle Properties Incorporated | | | | | | | 43,332 | | | | 3,151,536 | |
Gramercy Property Trust Incorporated | | | | | | | 133,300 | | | | 1,126,385 | |
Mid-America Apartment Communities Incorporated | | | | | | | 19,403 | | | | 1,983,181 | |
Terreno Realty Corporation | | | | | | | 166,875 | | | | 3,913,219 | |
| | | | |
| | | | | | | | | | | 13,016,705 | |
| | | | | | | | | | | | |
| | | | |
| Thrifts & Mortgage Finance: 1.00% | | | | | | | | | | | | |
Kearny Financial Corporation | | | | | | | 137,900 | | | | 1,703,065 | |
Radian Group Incorporated | | | | | | | 75,800 | | | | 939,920 | |
| | | | |
| | | | | | | | | | | 2,642,985 | |
| | | | | | | | | | | | |
| | | | |
Health Care: 15.65% | | | | | | | | | | | | |
| | | | |
| Biotechnology: 1.85% | | | | | | | | | | | | |
Cepheid Incorporated † | | | | | | | 67,500 | | | | 2,251,800 | |
Flexion Therapeutics Incorporated † | | | | | | | 46,035 | | | | 423,522 | |
The accompanying notes are an integral part of these financial statements.
| | | | | | |
| Portfolio of investments—March 31, 2016 | | Wells Fargo Small Cap Opportunities Fund | | | 11 | |
| | | | | | | | | | | | |
| Security name | | | | | | Shares | | | Value | |
| | | | |
| Biotechnology (continued) | | | | | | | | | | | | |
Otonomy Incorporated † | | | | | | | 49,500 | | | $ | 738,540 | |
Repligen Corporation † | | | | | | | 55,700 | | | | 1,493,874 | |
| | | | |
| | | | | | | | | | | 4,907,736 | |
| | | | | | | | | | | | |
| | | | |
| Health Care Equipment & Supplies: 4.54% | | | | | | | | | | | | |
Dentsply Sirona Incorporated | | | | | | | 57,329 | | | | 3,533,186 | |
K2M Group Holdings Incorporated † | | | | | | | 72,591 | | | | 1,076,525 | |
Masimo Corporation † | | | | | | | 30,600 | | | | 1,280,304 | |
The Cooper Companies Incorporated | | | | | | | 17,000 | | | | 2,617,490 | |
Trinity Biotech plc ADR | | | | | | | 60,000 | | | | 699,600 | |
West Pharmaceutical Services Incorporated | | | | | | | 40,500 | | | | 2,807,460 | |
| | | | |
| | | | | | | | | | | 12,014,565 | |
| | | | | | | | | | | | |
| | | | |
| Health Care Providers & Services: 3.12% | | | | | | | | | | | | |
Centene Corporation † | | | | | | | 44,700 | | | | 2,752,179 | |
HealthSouth Corporation | | | | | | | 32,382 | | | | 1,218,535 | |
LifePoint Hospitals Incorporated † | | | | | | | 30,000 | | | | 2,077,500 | |
Surgical Care Affiliates Incorporated † | | | | | | | 47,700 | | | | 2,207,556 | |
| | | | |
| | | | | | | | | | | 8,255,770 | |
| | | | | | | | | | | | |
| | | | |
| Health Care Technology: 0.25% | | | | | | | | | | | | |
Inovalon Holdings Incorporated Class A Ǡ | | | | | | | 35,900 | | | | 664,868 | |
| | | | | | | | | | | | |
| | | | |
| Life Sciences Tools & Services: 3.73% | | | | | | | | | | | | |
INC Research Holdings Incorporated Class A † | | | | | | | 51,804 | | | | 2,134,843 | |
PAREXEL International Corporation † | | | | | | | 47,500 | | | | 2,979,675 | |
VWR Corporation † | | | | | | | 176,480 | | | | 4,775,549 | |
| | | | |
| | | | | | | | | | | 9,890,067 | |
| | | | | | | | | | | | |
| | | | |
| Pharmaceuticals: 2.16% | | | | | | | | | | | | |
Akorn Incorporated † | | | | | | | 27,200 | | | | 640,016 | |
Catalent Incorporated † | | | | | | | 134,690 | | | | 3,592,182 | |
Intersect ENT Incorporated † | | | | | | | 42,400 | | | | 805,600 | |
KemPharm Incorporated Ǡ | | | | | | | 47,600 | | | | 690,200 | |
| | | | |
| | | | | | | | | | | 5,727,998 | |
| | | | | | | | | | | | |
| | | | |
Industrials: 17.42% | | | | | | | | | | | | |
| | | | |
| Aerospace & Defense: 1.82% | | | | | | | | | | | | |
DigitalGlobe Incorporated † | | | | | | | 68,700 | | | | 1,188,510 | |
Hexcel Corporation | | | | | | | 82,800 | | | | 3,619,188 | |
| | | | |
| | | | | | | | | | | 4,807,698 | |
| | | | | | | | | | | | |
| | | | |
| Airlines: 1.04% | | | | | | | | | | | | |
Allegiant Travel Company | | | | | | | 15,492 | | | | 2,758,506 | |
| | | | | | | | | | | | |
| | | | |
| Building Products: 2.28% | | | | | | | | | | | | |
Fortune Brands Home & Security Incorporated | | | | | | | 52,800 | | | | 2,958,912 | |
Simpson Manufacturing Company Incorporated | | | | | | | 80,703 | | | | 3,080,434 | |
| | | | |
| | | | | | | | | | | 6,039,346 | |
| | | | | | | | | | | | |
The accompanying notes are an integral part of these financial statements.
| | | | |
| 12 | | Wells Fargo Small Cap Opportunities Fund | | Portfolio of investments—March 31, 2016 |
| | | | | | | | | | | | |
| Security name | | | | | | Shares | | | Value | |
| | | | |
| Commercial Services & Supplies: 2.82% | | | | | | | | | | | | |
Herman Miller Incorporated | | | | | | | 3,383 | | | $ | 104,501 | |
Knoll Incorporated | | | | | | | 67,100 | | | | 1,452,715 | |
Matthews International Corporation Class A | | | | | | | 46,700 | | | | 2,403,649 | |
Waste Connections Incorporated | | | | | | | 54,490 | | | | 3,519,509 | |
| | | | |
| | | | | | | | | | | 7,480,374 | |
| | | | | | | | | | | | |
| | | | |
| Construction & Engineering: 1.56% | | | | | | | | | | | | |
Dycom Industries Incorporated † | | | | | | | 23,800 | | | | 1,539,146 | |
Valmont Industries Incorporated | | | | | | | 20,900 | | | | 2,588,256 | |
| | | | |
| | | | | | | | | | | 4,127,402 | |
| | | | | | | | | | | | |
| | | | |
| Electrical Equipment: 1.03% | | | | | | | | | | | | |
Generac Holdings Incorporated Ǡ | | | | | | | 73,100 | | | | 2,722,244 | |
| | | | | | | | | | | | |
| | | | |
| Machinery: 3.76% | | | | | | | | | | | | |
CLARCOR Incorporated | | | | | | | 39,900 | | | | 2,305,821 | |
ESCO Technologies Incorporated | | | | | | | 75,400 | | | | 2,939,092 | |
IDEX Corporation | | | | | | | 34,373 | | | | 2,848,834 | |
Kornit Digital Limited Ǡ | | | | | | | 126,289 | | | | 1,256,576 | |
Proto Labs Incorporated Ǡ | | | | | | | 7,800 | | | | 601,302 | |
| | | | |
| | | | | | | | | | | 9,951,625 | |
| | | | | | | | | | | | |
| | | | |
| Professional Services: 0.52% | | | | | | | | | | | | |
On Assignment Incorporated † | | | | | | | 37,600 | | | | 1,388,192 | |
| | | | | | | | | | | | |
| | | | |
| Road & Rail: 0.87% | | | | | | | | | | | | |
Ryder System Incorporated | | | | | | | 35,500 | | | | 2,299,690 | |
| | | | | | | | | | | | |
| | | | |
| Trading Companies & Distributors: 1.72% | | | | | | | | | | | | |
Beacon Roofing Supply Incorporated † | | | | | | | 44,200 | | | | 1,812,642 | |
MSC Industrial Direct Company Class A | | | | | | | 35,900 | | | | 2,739,529 | |
| | | | |
| | | | | | | | | | | 4,552,171 | |
| | | | | | | | | | | | |
| | | | |
Information Technology: 14.91% | | | | | | | | | | | | |
| | | | |
| Communications Equipment: 1.19% | | | | | | | | | | | | |
Ciena Corporation † | | | | | | | 165,900 | | | | 3,155,418 | |
| | | | | | | | | | | | |
| | | | |
| Electronic Equipment, Instruments & Components: 2.62% | | | | | | | | | | | | |
Fabrinet † | | | | | | | 62,823 | | | | 2,032,324 | |
FARO Technologies Incorporated † | | | | | | | 28,200 | | | | 908,322 | |
MTS Systems Corporation | | | | | | | 30,500 | | | | 1,855,925 | |
OSI Systems Incorporated † | | | | | | | 32,700 | | | | 2,141,523 | |
| | | | |
| | | | | | | | | | | 6,938,094 | |
| | | | | | | | | | | | |
| | | | |
| Internet Software & Services: 0.85% | | | | | | | | | | | | |
Match Group Incorporated Ǡ | | | | | | | 132,962 | | | | 1,470,560 | |
Shutterstock Incorporated Ǡ | | | | | | | 21,500 | | | | 789,695 | |
| | | | |
| | | | | | | | | | | 2,260,255 | |
| | | | | | | | | | | | |
The accompanying notes are an integral part of these financial statements.
| | | | | | |
| Portfolio of investments—March 31, 2016 | | Wells Fargo Small Cap Opportunities Fund | | | 13 | |
| | | | | | | | | | | | |
| Security name | | | | | | Shares | | | Value | |
| | | | |
| IT Services: 2.66% | | | | | | | | | | | | |
CoreLogic Incorporated † | | | | | | | 109,537 | | | $ | 3,800,934 | |
EPAM Systems Incorporated † | | | | | | | 18,600 | | | | 1,388,862 | |
Leidos Holdings Incorporated « | | | | | | | 36,900 | | | | 1,856,808 | |
| | | | |
| | | | | | | | | | | 7,046,604 | |
| | | | | | | | | | | | |
| | | | |
| Semiconductors & Semiconductor Equipment: 3.52% | | | | | | | | | | | | |
Entegris Incorporated † | | | | | | | 239,200 | | | | 3,257,904 | |
Integrated Device Technology Incorporated † | | | | | | | 83,100 | | | | 1,698,564 | |
MA-COM Technology Solutions Holdings Incorporated Ǡ | | | | | | | 58,454 | | | | 2,559,701 | |
ON Semiconductor Corporation † | | | | | | | 187,200 | | | | 1,795,248 | |
| | | | |
| | | | | | | | | | | 9,311,417 | |
| | | | | | | | | | | | |
| | | | |
| Software: 4.07% | | | | | | | | | | | | |
Cadence Design Systems Incorporated † | | | | | | | 164,300 | | | | 3,874,194 | |
Fortinet Incorporated † | | | | | | | 121,800 | | | | 3,730,734 | |
PTC Incorporated † | | | | | | | 61,500 | | | | 2,039,340 | |
Verint Systems Incorporated † | | | | | | | 33,866 | | | | 1,130,447 | |
| | | | |
| | | | | | | | | | | 10,774,715 | |
| | | | | | | | | | | | |
| | | | |
Materials: 5.35% | | | | | | | | | | | | |
| | | | |
| Chemicals: 1.15% | | | | | | | | | | | | |
Balchem Corporation | | | | | | | 28,500 | | | | 1,767,570 | |
Minerals Technologies Incorporated | | | | | | | 22,600 | | | | 1,284,810 | |
| | | | |
| | | | | | | | | | | 3,052,380 | |
| | | | | | | | | | | | |
| | | | |
| Containers & Packaging: 1.14% | | | | | | | | | | | | |
Packaging Corporation of America | | | | | | | 50,100 | | | | 3,026,040 | |
| | | | | | | | | | | | |
| | | | |
| Metals & Mining: 2.53% | | | | | | | | | | | | |
Compass Minerals International Incorporated | | | | | | | 49,500 | | | | 3,507,570 | |
Pretium Resources Incorporated Ǡ | | | | | | | 123,600 | | | | 661,260 | |
Steel Dynamics Incorporated | | | | | | | 112,700 | | | | 2,536,877 | |
| | | | |
| | | | | | | | | | | 6,705,707 | |
| | | | | | | | | | | | |
| | | | |
| Paper & Forest Products: 0.53% | | | | | | | | | | | | |
Louisiana-Pacific Corporation † | | | | | | | 81,200 | | | | 1,390,144 | |
| | | | | | | | | | | | |
| | | | |
Utilities: 2.77% | | | | | | | | | | | | |
| | | | |
| Electric Utilities: 1.56% | | | | | | | | | | | | |
IDACORP Incorporated | | | | | | | 39,600 | | | | 2,953,764 | |
Portland General Electric Company | | | | | | | 29,400 | | | | 1,161,006 | |
| | | | |
| | | | | | | | | | | 4,114,770 | |
| | | | | | | | | | | | |
| | | | |
| Multi-Utilities: 1.02% | | | | | | | | | | | | |
Northwestern Corporation | | | | | | | 3,997 | | | | 246,815 | |
Vectren Corporation | | | | | | | 48,672 | | | | 2,460,856 | |
| | | | |
| | | | | | | | | | | 2,707,671 | |
| | | | | | | | | | | | |
The accompanying notes are an integral part of these financial statements.
| | | | |
| 14 | | Wells Fargo Small Cap Opportunities Fund | | Portfolio of investments—March 31, 2016 |
| | | | | | | | | | | | | | |
| Security name | | | | | | | Shares | | | Value | |
| | | | |
| Water Utilities: 0.19% | | | | | | | | | | | | | | |
SJW Corporation | | | | | | | | | 14,100 | | | $ | 512,535 | |
| | | | | | | | | | | | | | |
| | | | |
Total Common Stocks (Cost $204,190,182) | | | | | | | | | | | | | 242,534,198 | |
| | | | | | | | | | | | | | |
| | | | |
Exchange-Traded Funds: 1.35% | | | | | | | | | | | | | | |
iShares Russell 2000 Index ETF « | | | | | | | | | 32,300 | | | | 3,573,026 | |
| | | | | | | | | | | | | | |
| | | | |
Total Exchange-Traded Funds (Cost $3,481,793) | | | | | | | | | | | | | 3,573,026 | |
| | | | | | | | | | | | | | |
| | | | |
| | | Yield | | | | | | | | | |
| Short-Term Investments: 16.45% | | | | | | | | | | | | | | |
| | | | |
| Investment Companies: 16.45% | | | | | | | | | | | | | | |
Securities Lending Cash Investments LLC (l)(r)(u) | | | 0.43 | % | | | | | 24,100,539 | | | | 24,100,539 | |
Wells Fargo Cash Investment Money Market Fund Select Class (l)(u) | | | 0.44 | | | | | | 19,464,202 | | | | 19,464,202 | |
| | | | |
Total Short-Term Investments (Cost $43,564,741) | | | | | | | | | | | | | 43,564,741 | |
| | | | | | | | | | | | | | |
| | | | | | | | |
| Total investments in securities (Cost $251,236,716) * | | | 109.38 | % | | | 289,671,965 | |
Other assets and liabilities, net | | | (9.38 | ) | | | (24,848,548 | ) |
| | | | | | | | |
| Total net assets | | | 100.00 | % | | $ | 264,823,417 | |
| | | | | | | | |
| « | All or a portion of this security is on loan. |
| † | Non-income-earning security |
| (l) | The issuer of the security is an affiliated person of the Fund as defined in the Investment Company Act of 1940. |
| (r) | The investment is a non-registered investment vehicle purchased with cash collateral received from securities on loan. |
| (u) | The rate represents the 7-day annualized yield at period end. |
| * | Cost for federal income tax purposes is $251,914,851 and unrealized gains (losses) consists of: |
| | | | |
Gross unrealized gains | | $ | 43,846,450 | |
Gross unrealized losses | | | (6,089,336 | ) |
| | | | |
Net unrealized gains | | $ | 37,757,114 | |
The accompanying notes are an integral part of these financial statements.
| | | | | | |
| Statement of assets and liabilities—March 31, 2016 | | Wells Fargo Small Cap Opportunities Fund | | | 15 | |
| | | | |
| | | | |
| |
Assets | | | | |
Investments | | | | |
In unaffiliated securities (including $23,423,462 of securities loaned), at value (cost $207,671,975) | | $ | 246,107,224 | |
In affiliated securities, at value (cost $43,564,741) | | | 43,564,741 | |
| | | | |
Total investments, at value (cost $251,236,716) | | | 289,671,965 | |
Receivable for investments sold | | | 1,939,762 | |
Receivable for Fund shares sold | | | 286,941 | |
Receivable for dividends | | | 252,065 | |
Receivable for securities lending income | | | 27,580 | |
Prepaid expenses and other assets | | | 12,053 | |
| | | | |
Total assets | | | 292,190,366 | |
| | | | |
| |
Liabilities | | | | |
Payable for investments purchased | | | 2,646,115 | |
Payable for Fund shares redeemed | | | 351,286 | |
Payable upon receipt of securities loaned | | | 24,100,539 | |
Management fee payable | | | 162,729 | |
Administration fees payable | | | 28,435 | |
Accrued expenses and other liabilities | | | 77,845 | |
| | | | |
Total liabilities | | | 27,366,949 | |
| | | | |
Total net assets | | $ | 264,823,417 | |
| | | | |
| |
NET ASSETS CONSIST OF | | | | |
Paid-in capital | | $ | 216,123,063 | |
Undistributed net investment income | | | 149,952 | |
Accumulated net realized gains on investments | | | 10,115,153 | |
Net unrealized gains on investments | | | 38,435,249 | |
| | | | |
Total net assets | | $ | 264,823,417 | |
| | | | |
| |
COMPUTATION OF NET ASSET VALUE | | | | |
Net assets – Administrator Class | | $ | 264,560,047 | |
Shares outstanding – Administrator Class1 | | | 12,507,330 | |
Net asset value per share – Administrator Class | | | $21.15 | |
Net assets – Institutional Class | | $ | 263,370 | |
Shares outstanding – Institutional Class1 | | | 12,435 | |
Net asset value per share – Institutional Class | | | $21.18 | |
| 1 | The Fund has an unlimited number of authorized shares. |
The accompanying notes are an integral part of these financial statements.
| | | | |
| 16 | | Wells Fargo Small Cap Opportunities Fund | | Statement of operations—year ended March 31, 2016 |
| | | | |
| | | | |
| |
Investment income | | | | |
Dividends | | $ | 3,752,778 | |
Securities lending income, net | | | 261,580 | |
Income from affiliated securities | | | 43,206 | |
| | | | |
Total investment income | | | 4,057,564 | |
| | | | |
| |
Expenses | | | | |
Management fee | | | 2,373,368 | |
Administration fees | | | | |
Administrator Class | | | 340,067 | |
Institutional Class | | | 218 | |
Shareholder servicing fees | | | | |
Administrator Class | | | 697,346 | |
Custody and accounting fees | | | 28,339 | |
Professional fees | | | 41,283 | |
Registration fees | | | 59,603 | |
Shareholder report expenses | | | 25,610 | |
Trustees’ fees and expenses | | | 17,212 | |
Other fees and expenses | | | 14,362 | |
| | | | |
Total expenses | | | 3,597,408 | |
Less: Fee waivers and/or expense reimbursements | | | (247,194 | ) |
| | | | |
Net expenses | | | 3,350,214 | |
| | | | |
Net investment income | | | 707,350 | |
| | | | |
| |
REALIZED AND UNREALIZED GAINS (LOSSES) ON INVESTMENTS | | | | |
| |
Net realized gains (losses) on: | | | | |
Unaffiliated securities | | | 18,085,939 | |
Futures transactions | | | (79,563 | ) |
| | | | |
Net realized gains on investments | | | 18,006,376 | |
| | | | |
| |
Net change in unrealized gains (losses) on: | | | | |
Unaffiliated securities | | | (32,282,192 | ) |
Futures transactions | | | 326 | |
| | | | |
Net change in unrealized gains (losses) on investments | | | (32,281,866 | ) |
| | | | |
Net realized and unrealized gains (losses) on investments | | | (14,275,490 | ) |
| | | | |
Net decrease in net assets resulting from operations | | $ | (13,568,140 | ) |
| | | | |
The accompanying notes are an integral part of these financial statements.
| | | | | | |
| Statement of changes in net assets | | Wells Fargo Small Cap Opportunities Fund | | | 17 | |
| | | | | | | | | | | | | | | | |
| | | Year ended
March 31, 2016 | | | Year ended
March 31, 2015 | |
| | | | |
Operations | | | | | | | | | | | | | | | | |
Net investment income | | | | | | $ | 707,350 | | | | | | | $ | 202,195 | |
Net realized gains on investments | | | | | | | 18,006,376 | | | | | | | | 74,856,998 | |
Net change in unrealized gains (losses) on investments | | | | | | | (32,281,866 | ) | | | | | | | (39,409,715 | ) |
| | | | |
Net increase (decrease) in net assets resulting from operations | | | | | | | (13,568,140 | ) | | | | | | | 35,649,478 | |
| | | | |
| | | | |
Distributions to shareholders from | | | | | | | | | | | | | | | | |
Net investment income | | | | | | | | | | | | | | | | |
Administrator Class | | | | | | | (247,987 | ) | | | | | | | 0 | |
Institutional Class | | | | | | | (986 | ) | | | | | | | 0 | 1 |
Net realized gains | | | | | | | | | | | | | | | | |
Administrator Class | | | | | | | (32,197,145 | ) | | | | | | | (132,976,135 | ) |
Institutional Class | | | | | | | (29,514 | ) | | | | | | | (4,069 | )1 |
| | | | |
Total distributions to shareholders | | | | | | | (32,475,632 | ) | | | | | | | (132,980,204 | ) |
| | | | |
| | | | |
Capital share transactions | | | Shares | | | | | | | | Shares | | | | | |
Proceeds from shares sold | | | | | | | | | | | | | | | | |
Administrator Class | | | 1,434,836 | | | | 32,820,441 | | | | 2,307,138 | | | | 64,652,442 | |
Institutional Class | | | 10,971 | | | | 273,479 | | | | 256 | 1 | | | 10,000 | 1 |
| | | | |
| | | | | | | 33,093,920 | | | | | | | | 64,662,442 | |
| | | | |
Reinvestment of distributions | | | | | | | | | | | | | | | | |
Administrator Class | | | 1,555,730 | | | | 32,052,257 | | | | 5,627,220 | | | | 130,945,409 | |
Institutional Class | | | 1,474 | | | | 30,500 | | | | 175 | 1 | | | 4,069 | 1 |
| | | | |
| | | | | | | 32,082,757 | | | | | | | | 130,949,478 | |
| | | | |
Payment for shares redeemed | | | | | | | | | | | | | | | | |
Administrator Class | | | (2,655,872 | ) | | | (60,937,965 | ) | | | (8,188,457 | ) | | | (262,972,511 | ) |
Institutional Class | | | (441 | ) | | | (10,552 | ) | | | 0 | 1 | | | 0 | 1 |
| | | | |
| | | | | | | (60,948,517 | ) | | | | | | | (262,972,511 | ) |
| | | | |
Net increase (decrease) in net assets resulting from capital share transactions | | | | | | | 4,228,160 | | | | | | | | (67,360,591 | ) |
| | | | |
Total decrease in net assets | | | | | | | (41,815,612 | ) | | | | | | | (164,691,317 | ) |
| | | | |
| | | | |
Net assets | | | | | | | | | | | | | | | | |
Beginning of period | | | | | | | 306,639,029 | | | | | | | | 471,330,346 | |
| | | | |
End of period | | | | | | $ | 264,823,417 | | | | | | | $ | 306,639,029 | |
| | | | |
Undistributed net investment income | | | | | | $ | 149,952 | | | | | | | $ | 0 | |
| | | | |
| 1 | For the period from October 31, 2014 (commencement of class operations) to March 31, 2015 |
The accompanying notes are an integral part of these financial statements.
| | | | |
| 18 | | Wells Fargo Small Cap Opportunities Fund | | Financial highlights |
(For a share outstanding throughout each period)
| | | | | | | | | | | | | | | | | | | | | | | | |
| | | Year ended March 31 | | | Year ended October 31 | |
| ADMINISTRATOR CLASS | | 2016 | | | 2015 | | | 20141 | | | 2013 | | | 2012 | | | 2011 | |
Net asset value, beginning of period | | | $25.19 | | | | $37.93 | | | | $42.43 | | | | $34.45 | | | | $32.50 | | | | $31.33 | |
Net investment income | | | 0.06 | | | | 0.02 | | | | 0.02 | | | | 0.11 | | | | 0.05 | | | | 0.00 | 2 |
Net realized and unrealized gains (losses) on investments | | | (1.24 | ) | | | 3.13 | | | | 2.33 | | | | 10.48 | | | | 3.13 | | | | 1.17 | |
| | | | | | | | | | | | | | | | | | | | | | | | |
Total from investment operations | | | (1.18 | ) | | | 3.15 | | | | 2.35 | | | | 10.59 | | | | 3.18 | | | | 1.17 | |
Distributions to shareholders from | | | | | | | | | | | | | | | | | | | | | | | | |
Net investment income | | | (0.02 | ) | | | 0.00 | | | | (0.02 | ) | | | (0.08 | ) | | | 0.00 | | | | 0.00 | |
Net realized gains | | | (2.84 | ) | | | (15.89 | ) | | | (6.83 | ) | | | (2.53 | ) | | | (1.23 | ) | | | 0.00 | |
| | | | | | | | | | | | | | | | | | | | | | | | |
Total distributions to shareholders | | | (2.86 | ) | | | (15.89 | ) | | | (6.85 | ) | | | (2.61 | ) | | | (1.23 | ) | | | 0.00 | |
Net asset value, end of period | | | $21.15 | | | | $25.19 | | | | $37.93 | | | | $42.43 | | | | $34.45 | | | | $32.50 | |
Total return3 | | | (4.39 | )% | | | 11.75 | % | | | 6.26 | % | | | 33.19 | % | | | 10.12 | % | | | 3.73 | % |
Ratios to average net assets (annualized) | | | | | | | | | | | | | | | | | | | | | | | | |
Gross expenses | | | 1.29 | % | | | 1.24 | % | | | 1.24 | % | | | 1.22 | % | | | 1.22 | % | | | 1.22 | % |
Net expenses | | | 1.20 | % | | | 1.20 | % | | | 1.20 | % | | | 1.20 | % | | | 1.20 | % | | | 1.20 | % |
Net investment income | | | 0.25 | % | | | 0.06 | % | | | 0.11 | % | | | 0.31 | % | | | 0.13 | % | | | 0.00 | % |
Supplemental data | | | | | | | | | | | | | | | | | | | | | | | | |
Portfolio turnover rate | | | 59 | % | | | 60 | % | | | 26 | % | | | 76 | % | | | 78 | % | | | 100 | % |
Net assets, end of period (000s omitted) | | | $264,560 | | | | $306,628 | | | | $471,330 | | | | $705,671 | | | | $624,844 | | | | $656,720 | |
| 1 | For the five months ended March 31, 2014. The Fund changed its fiscal year end from October 31 to March 31, effective March 31, 2014. |
| 2 | Amount is less than $0.005. |
| 3 | Returns for periods of less than one year are not annualized. |
The accompanying notes are an integral part of these financial statements.
| | | | | | |
| Financial highlights | | Wells Fargo Small Cap Opportunities Fund | | | 19 | |
(For a share outstanding throughout each period)
| | | | | | | | |
| | | Year ended March 31 | |
| INSTITUTIONAL CLASS | | 2016 | | | 20151 | |
Net asset value, beginning of period | | | $25.22 | | | | $39.04 | |
Net investment income | | | 0.16 | 2 | | | 0.06 | |
Net realized and unrealized gains (losses) on investments | | | (1.28 | ) | | | 2.01 | |
| | | | | | | | |
Total from investment operations | | | (1.12 | ) | | | 2.07 | |
Distributions to shareholders from | | | | | | | | |
Net investment income | | | (0.08 | ) | | | 0.00 | |
Net realized gains | | | (2.84 | ) | | | (15.89 | ) |
| | | | | | | | |
Total distributions to shareholders | | | (2.92 | ) | | | (15.89 | ) |
Net asset value, end of period | | | $21.18 | | | | $25.22 | |
Total return3 | | | (4.12 | )% | | | 8.68 | % |
Ratios to average net assets (annualized) | | | | | | | | |
Gross expenses | | | 1.05 | % | | | 0.92 | % |
Net expenses | | | 0.95 | % | | | 0.92 | % |
Net investment income | | | 0.71 | % | | | 0.59 | % |
Supplemental data | | | | | | | | |
Portfolio turnover rate | | | 59 | % | | | 60 | % |
Net assets, end of period (000s omitted) | | | $263 | | | | $11 | |
| 1 | For the period from October 31, 2014 (commencement of class operations) to March 31, 2015 |
| 2 | Calculated based upon average shares outstanding |
| 3 | Returns for periods of less than one year are not annualized. |
The accompanying notes are an integral part of these financial statements.
| | | | |
| 20 | | Wells Fargo Small Cap Opportunities Fund | | Notes to financial statements |
1. ORGANIZATION
Wells Fargo Funds Trust (the “Trust”), a Delaware statutory trust organized on March 10, 1999, is an open-end management investment company registered under the Investment Company Act of 1940, as amended (the “1940 Act”). As an investment company, the Trust follows the accounting and reporting guidance in Financial Accounting Standards Board (“FASB”) Accounting Standards Codification Topic 946, Financial Services – Investment Companies. These financial statements report on the Wells Fargo Small Cap Opportunities Fund (the “Fund”) which is a diversified series of the Trust.
2. SIGNIFICANT ACCOUNTING POLICIES
The following significant accounting policies, which are consistently followed in the preparation of the financial statements of the Fund, are in conformity with U.S. generally accepted accounting principles which require management to make estimates and assumptions that affect the reported amounts of assets and liabilities, disclosure of contingent assets and liabilities at the date of the financial statements, and the reported amounts of revenues and expenses during the reporting period. Actual results could differ from those estimates.
Securities valuation
All investments are valued each business day as of the close of regular trading on the New York Stock Exchange (generally 4 p.m. Eastern Time), although the Fund may deviate from this calculation time under unusual or unexpected circumstances.
Equity securities and futures that are listed on a foreign or domestic exchange or market are valued at the official closing price or, if none, the last sales price. If no sale occurs on the principal exchange or market that day, the prior day’s price will be deemed “stale” and a fair value price will be determined in accordance with the Fund’s Valuation Procedures.
Investments in registered open-end investment companies are valued at net asset value. Interests in non-registered investment vehicles that are redeemable at net asset value are fair valued normally at net asset value.
Investments which are not valued using any of the methods discussed above are valued at their fair value, as determined in good faith by the Board of Trustees of the Fund. The Board of Trustees has established a Valuation Committee comprised of the Trustees and has delegated to it the authority to take any actions regarding the valuation of portfolio securities that the Valuation Committee deems necessary or appropriate, including determining the fair value of portfolio securities, unless the determination has been delegated to the Management Valuation Team of Wells Fargo Funds Management, LLC (“Funds Management”). The Board of Trustees retains the authority to make or ratify any valuation decisions or approve any changes to the Valuation Procedures as it deems appropriate. On a quarterly basis, the Board of Trustees receives reports on any valuation actions taken by the Valuation Committee or the Management Valuation Team which may include items for ratification.
Valuations of fair valued securities are compared to the next actual sales price when available, or other appropriate market values, to assess the continued appropriateness of the fair valuation methodologies used. These securities are fair valued on a day-to-day basis, taking into consideration changes to appropriate market information and any significant changes to the inputs considered in the valuation process until there is a readily available price provided on an exchange or by an independent pricing service. Valuations received from an independent pricing service or independent broker-dealer quotes are periodically validated by comparisons to most recent trades and valuations provided by other independent pricing services in addition to the review of prices by the manager and/or subadviser. Unobservable inputs used in determining fair valuations are identified based on the type of security, taking into consideration factors utilized by market participants in valuing the investment, knowledge about the issuer and the current market environment.
Security loans
The Fund may lend its securities from time to time in order to earn additional income in the form of fees or interest on securities received as collateral or the investment of any cash received as collateral. The Fund continues to receive interest or dividends on the securities loaned. The Fund receives collateral in the form of cash or securities with a value at least equal to the value of the securities on loan. The value of the loaned securities is determined at the close of each business day and any additional required collateral is delivered to the Fund on the next business day. In a securities lending transaction, the net asset value of the Fund will be affected by an increase or decrease in the value of the securities loaned and by an increase or decrease in the value of the instrument in which collateral is invested. The amount of securities lending activity undertaken by the Fund fluctuates from time to time. In the event of default or bankruptcy by the borrower, the Fund may be prevented from recovering the loaned securities or gaining access to the collateral or may experience delays or costs in doing so. In addition, the investment of any cash collateral received may lose all or part of its value. The Fund has the right under the lending agreement to recover the securities from the borrower on demand.
| | | | | | |
| Notes to financial statements | | Wells Fargo Small Cap Opportunities Fund | | | 21 | |
The Fund lends its securities through an unaffiliated securities lending agent. Cash collateral received in connection with its securities lending transactions is invested in Securities Lending Cash Investments, LLC (the “Securities Lending Fund”). The Securities Lending Fund is exempt from registration under Section 3(c)(7) of the 1940 Act and is managed by Funds Management and is subadvised by Wells Capital Management Incorporated (“WellsCap”), an affiliate of Funds Management and an indirect wholly owned subsidiary of Wells Fargo & Company (“Wells Fargo”). Funds Management receives an advisory fee starting at 0.05% and declining to 0.01% as the average daily net assets of the Securities Lending Fund increase. All of the fees received by Funds Management are paid to WellsCap for its services as subadviser. The Securities Lending Fund seeks to provide a positive return compared to the daily Fed Funds Open rate by investing in high-quality, U.S. dollar-denominated short-term money market instruments. Securities Lending Fund investments are fair valued based upon the amortized cost valuation technique. Income earned from investment in the Securities Lending Fund is included in securities lending income on the Statement of Operations.
Futures contracts
The Fund is subject to equity price risk in the normal course of pursuing its investment objectives. The Fund may buy and sell futures contracts in order to gain exposure to, or protect against, changes in security values and interest rates. The primary risks associated with the use of futures contracts are the imperfect correlation between changes in market values of securities held by the Fund and the prices of futures contracts, and the possibility of an illiquid market.
The aggregate principal amounts of the contracts are not recorded in the financial statements. Fluctuations in the value of the contracts are recorded in the Statement of Assets and Liabilities as an asset or liability and in the Statement of Operations as unrealized gains or losses until the contracts are closed, at which point they are recorded as net realized gains or losses on futures contracts. With futures contracts, there is minimal counterparty risk to the Fund since futures are exchange traded and the exchange’s clearinghouse, as counterparty to all exchange traded futures, guarantees the futures against default.
Security transactions and income recognition
Securities transactions are recorded on a trade date basis. Realized gains or losses are recorded on the basis of identified cost.
Dividend income is recognized on the ex-dividend date.
Distributions to shareholders
Distributions to shareholders from net investment income and net realized gains, if any, are recorded on the ex-dividend date. Such distributions are determined in conformity with federal income tax regulations, which may differ in amount or character from net investment income and realized gains recognized for purposes of U.S. generally accepted accounting principles.
Federal and other taxes
The Fund intends to continue to qualify as a regulated investment company by distributing substantially all of its investment company taxable income and any net realized capital gains (after reduction for capital loss carryforwards) sufficient to relieve it from all, or substantially all, federal income taxes. Accordingly, no provision for federal income taxes was required.
The Fund’s income and federal excise tax returns and all financial records supporting those returns for the prior three fiscal years are subject to examination by the federal and Delaware revenue authorities. Management has analyzed the Fund’s tax positions taken on federal, state, and foreign tax returns for all open tax years and does not believe that there are any uncertain tax positions that require recognition of a tax liability.
Reclassifications are made to the Fund’s capital accounts for permanent tax differences to reflect income and gains available for distribution (or available capital loss carryforwards) under federal income tax regulations. U.S. generally accepted accounting principles require that certain components of net assets be adjusted to reflect permanent differences between financial and tax reporting. These reclassifications have no effect on net assets or net asset values per share. The primary permanent differences causing such reclassifications are due to dividends from certain securities and recognition of partnership income. At March 31, 2016, as a result of permanent book-to-tax differences, the following reclassification adjustments were made on the Statement of Assets and Liabilities:
| | |
Undistributed net
investment income | | Accumulated net
realized gains
on investments |
| $(308,425) | | $308,425 |
| | | | |
| 22 | | Wells Fargo Small Cap Opportunities Fund | | Notes to financial statements |
Class allocations
The separate classes of shares offered by the Fund differ principally in applicable sales charges, distribution, shareholder servicing, and administration fees. Class specific expenses are charged directly to that share class. Investment income, common expenses, and realized and unrealized gains (losses) on investments are allocated daily to each class of shares based on the relative proportion of net assets of each class.
3. FAIR VALUATION MEASUREMENTS
Fair value measurements of investments are determined within a framework that has established a fair value hierarchy based upon the various data inputs utilized in determining the value of the Fund’s investments. The three-level hierarchy gives the highest priority to unadjusted quoted prices in active markets for identical assets or liabilities (Level 1) and the lowest priority to significant unobservable inputs (Level 3). The Fund’s investments are classified within the fair value hierarchy based on the lowest level of input that is significant to the fair value measurement. The inputs are summarized into three broad levels as follows:
| n | | Level 1 – quoted prices in active markets for identical securities |
| n | | Level 2 – other significant observable inputs (including quoted prices for similar securities, interest rates, prepayment speeds, credit risk, use of amortized cost, etc.) |
| n | | Level 3 – significant unobservable inputs (including the Fund’s own assumptions in determining the fair value of investments) |
The inputs or methodologies used for valuing investments in securities are not necessarily an indication of the risk associated with investing in those securities.
The following is a summary of the inputs used in valuing the Fund’s assets and liabilities as of March 31, 2016:
| | | | | | | | | | | | | | | | |
| | | Quoted prices
(Level 1) | | | Other significant
observable inputs
(Level 2) | | | Significant
unobservable inputs (Level 3) | | | Total | |
Assets | | | | | | | | | | | | | | | | |
Investments in : | | | | | | | | | | | | | | | | |
| | | | |
Common stocks | | | | | | | | | | | | | | | | |
Consumer discretionary | | $ | 27,164,431 | | | $ | 0 | | | $ | 0 | | | $ | 27,164,431 | |
Consumer staples | | | 3,545,246 | | | | 0 | | | | 0 | | | | 3,545,246 | |
Energy | | | 6,772,359 | | | | 0 | | | | 0 | | | | 6,772,359 | |
Financials | | | 56,468,160 | | | | 0 | | | | 0 | | | | 56,468,160 | |
Health care | | | 41,461,004 | | | | 0 | | | | 0 | | | | 41,461,004 | |
Industrials | | | 46,127,248 | | | | 0 | | | | 0 | | | | 46,127,248 | |
Information technology | | | 39,486,503 | | | | 0 | | | | 0 | | | | 39,486,503 | |
Materials | | | 14,174,271 | | | | 0 | | | | 0 | | | | 14,174,271 | |
Utilities | | | 7,334,976 | | | | 0 | | | | 0 | | | | 7,334,976 | |
| | | | |
Exchange-traded funds | | | 3,573,026 | | | | 0 | | | | 0 | | | | 3,573,026 | |
| | | | |
Short-term investments | | | | | | | | | | | | | | | | |
Investment companies | | | 19,464,202 | | | | 0 | | | | 0 | | | | 19,464,202 | |
Investments measured at net asset value* | | | | | | | | | | | | | | | 24,100,539 | |
Total assets | | $ | 265,571,426 | | | $ | 0 | | | $ | 0 | | | $ | 289,671,965 | |
| * | Investments that are measured at fair value using the net asset value per share (or its equivalent) as a practical expedient have not been categorized in the fair value hierarchy. The fair value amount presented in the table is intended to permit reconciliation of the fair value hierarchy to the amounts presented in the Statement of Assets and Liabilities. The Fund’s investment in Securities Lending Cash Investments, LLC valued at $24,100,539 does not have a redemption period notice, can be redeemed daily and does not have any unfunded commitments. |
The Fund recognizes transfers between levels within the fair value hierarchy at the end of the reporting period. At March 31, 2016, the Fund did not have any transfers into/out of Level 1, Level 2, or Level 3.
| | | | | | |
| Notes to financial statements | | Wells Fargo Small Cap Opportunities Fund | | | 23 | |
4. TRANSACTIONS WITH AFFILIATES AND OTHER EXPENSES
Management fee
Funds Management, an indirect wholly owned subsidiary of Wells Fargo, is the manager of the Fund and provides advisory and fund-level administrative services under an investment management agreement. Under the investment management agreement, Funds Management is responsible for, among other services, implementing the investment objectives and strategies of the Fund, supervising the applicable subadviser, providing fund-level administrative services in connection with the Fund’s operations, and providing any other fund-level administrative services reasonably necessary for the operation of the Fund. As compensation for its services under the investment management agreement, Funds Management is entitled to receive an annual management fee starting at 0.85% and declining to 0.71% as the average daily net assets of the Fund increase.
Prior to July 1, 2015, Funds Management provided advisory services pursuant to an investment advisory agreement and was entitled to receive an annual fee which started at 0.80% and declined to 0.68% as the average daily net assets of the Fund increased. In addition, fund-level administrative services were provided by Funds Management under a separate administration agreement at an annual fee which started at 0.05% and declined to 0.03% as the average daily net assets of the Fund increased. For financial statement purposes, the advisory fee and fund-level administration fee for the year ended March 31, 2016 have been included in management fee on the Statement of Operations.
For the year ended March 31, 2016, the management fee was equivalent to an annual rate of 0.85% of the Fund’s average daily net assets.
Funds Management has retained the services of a subadviser to provide daily portfolio management to the Fund. The fee for subadvisory services is borne by Funds Management. Schroder Investment Management North America Inc. is the subadviser to the Fund and is entitled to receive a fee from Funds Management at an annual rate starting at 0.50% and declining to 0.45% as the average daily net assets of the Fund increase.
Administration fees
Under a class-level administration agreement, Funds Management provides class-level administrative services to the Fund, which includes paying fees and expenses for services provided by the transfer agent, sub-transfer agents, omnibus account servicers and record-keepers. As compensation for its services under the class-level administration agreement, Funds Management receives an annual fee which is calculated based on the average daily net assets of each class as follows:
| | | | | | | | |
| | | Class-level administration fee | |
| | | Current rate | | | Rate prior to
July 1, 2015 | |
Administrator Class | | | 0.13 | % | | | 0.10 | % |
Institutional Class | | | 0.13 | | | | 0.08 | |
Funds Management has contractually waived and/or reimbursed management and administration fees to the extent necessary to maintain certain net operating expense ratios for the Fund. Waiver of fees and/or reimbursement of expenses by Funds Management were made first from fund level expenses on a proportionate basis and then from class specific expenses. Funds Management has committed through July 31, 2016 to waive fees and/or reimburse expenses to the extent necessary to cap the Fund’s expenses at 1.20 % for Administrator Class shares and 0.95 % for Institutional Class shares. After this time, the cap may be increased or the commitment to maintain the cap may be terminated only with the approval of the Board of Trustees.
Shareholder servicing fees
The Trust has entered into contracts with one or more shareholder servicing agents, whereby Administrator Class of the Fund is charged a fee at an annual rate of 0.25% of its average daily net assets.
A portion of these total shareholder servicing fees were paid to affiliates of Wells Fargo.
5. INVESTMENT PORTFOLIO TRANSACTIONS
Purchases and sales of investments, excluding U.S. government obligations (if any) and short-term securities, for the year ended March 31, 2016 were $154,015,727 and $186,823,555, respectively.
6. DERIVATIVE TRANSACTIONS
During the year ended March 31, 2016, the Fund entered into futures contracts for to gain market exposure.
| | | | |
| 24 | | Wells Fargo Small Cap Opportunities Fund | | Notes to financial statements |
As of March 31, 2016, the Fund did not have any open futures contracts. The Fund had an average notional amount of $37,536 in futures contracts during the year ended March 31, 2016.
The fair value, realized gains or losses and change in unrealized gains or losses, if any, on derivative instruments are reflected in the appropriate financial statements.
7. BANK BORROWINGS
The Trust (excluding the money market funds and certain other funds) and Wells Fargo Variable Trust are parties to a $200,000,000 revolving credit agreement whereby the Fund is permitted to use bank borrowings for temporary or emergency purposes, such as to fund shareholder redemption requests. Interest under the credit agreement is charged to the Fund based on a borrowing rate equal to the higher of the Federal Funds rate in effect on that day plus 1.25% or the overnight LIBOR rate in effect on that day plus 1.25%. In addition, an annual commitment fee equal to 0.20% of the unused balance is allocated to each participating fund. Prior to September 1, 2015, the revolving credit agreement amount was $150,000,000 and the annual commitment fee was equal to 0.10% of the unused balance which was allocated to each participating fund.
For the year ended March 31, 2016, there were no borrowings by the Fund under the agreement.
8. DISTRIBUTIONS TO SHAREHOLDERS
The tax character of distributions paid during the years ended March 31, 2016 and March 31, 2015 were as follows:
| | | | | | | | |
| | | Year ended March 31 | |
| | | 2016 | | | 2015 | |
Ordinary income | | $ | 248,973 | | | $ | 11,962,811 | |
Long-term capital gain | | | 32,226,659 | | | | 121,017,393 | |
As of March 31, 2016, the components of distributable earnings on a tax basis were as follows:
| | | | |
Undistributed
ordinary
income | | Undistributed
long-term
gain | | Unrealized
gains |
| $149,952 | | $10,793,288 | | $37,757,114 |
9. INDEMNIFICATION
Under the Trust’s organizational documents, the officers and Trustees have been granted certain indemnification rights against certain liabilities that may arise out of performance of their duties to the Trust. Additionally, in the normal course of business, the Trust may enter into contracts with service providers that contain a variety of indemnification clauses. The Trust’s maximum exposure under these arrangements is dependent on future claims that may be made against the Fund and, therefore, cannot be estimated.
| | | | | | |
| Report of independent registered public accounting firm | | Wells Fargo Small Cap Opportunities Fund | | | 25 | |
BOARD OF TRUSTEES AND SHAREHOLDERS OF WELLS FARGO FUNDS TRUST:
We have audited the accompanying statement of assets and liabilities, including the portfolio of investments, of the Wells Fargo Small Cap Opportunities Fund (formerly known as Wells Fargo Advantage Small Cap Opportunities Fund) (the “Fund”), one of the funds constituting the Wells Fargo Funds Trust, as of March 31, 2016, and the related statement of operations for the year then ended, the statements of changes in net assets for each of the years in the two-year period then ended and the financial highlights for each of the years in the two-year period then ended, the period from November 1, 2013 to March 31, 2014 and each of the years in the three-year period ended October 31, 2013. These financial statements and financial highlights are the responsibility of the Fund’s management. Our responsibility is to express an opinion on these financial statements and financial highlights based on our audits.
We conducted our audits in accordance with the standards of the Public Company Accounting Oversight Board (United States). Those standards require that we plan and perform the audit to obtain reasonable assurance about whether the financial statements and financial highlights are free of material misstatement. An audit includes examining, on a test basis, evidence supporting the amounts and disclosures in the financial statements. Our procedures included confirmation of securities owned as of March 31, 2016, by correspondence with the custodian and brokers or by other appropriate auditing procedures. An audit also includes assessing the accounting principles used and significant estimates made by management, as well as evaluating the overall financial statement presentation. We believe that our audits provide a reasonable basis for our opinion.
In our opinion, the financial statements and financial highlights referred to above present fairly, in all material respects, the financial position of the Wells Fargo Small Cap Opportunities Fund as of March 31, 2016, the results of its operations for the year then ended, the changes in its net assets for each of the years in the two-year period then ended, and the financial highlights for each of the years or periods noted in the first paragraph above, in conformity with U.S. generally accepted accounting principles.

Boston, Massachusetts
May 25, 2016
| | | | |
| 26 | | Wells Fargo Small Cap Opportunities Fund | | Other information (unaudited) |
TAX INFORMATION
For corporate shareholders, pursuant to Section 854 of the Internal Revenue Code, 100% of ordinary income dividends qualify for the corporate dividends-received deduction for the fiscal year ended March 31, 2016.
Pursuant to Section 852 of the Internal Revenue Code, $32,226,659 was designated as long-term capital gain distributions for the fiscal year ended March 31, 2016.
Pursuant to Section 854 of the Internal Revenue Code, $248,973 of income dividends paid during the fiscal year ended March 31, 2016 has been designated as qualified dividend income (QDI).
PROXY VOTING INFORMATION
A description of the policies and procedures that the Fund uses to determine how to vote proxies relating to portfolio securities is available, upon request, by calling 1-800-222-8222, visiting our website at wellsfargofunds.com, or visiting the SEC website at sec.gov. Information regarding how the Fund voted proxies relating to portfolio securities during the most recent 12-month period ended June 30 is available on the Fund’s website at wellsfargofunds.com or by visiting the SEC website at sec.gov.
PORTFOLIO HOLDINGS INFORMATION
The complete portfolio holdings for the Fund are publicly available monthly on the Fund’s website (wellsfargofunds.com), on a one-month delayed basis. In addition, top ten holdings information (excluding derivative positions) for the Fund is publicly available on the Fund’s website on a monthly, seven-day or more delayed basis. The Fund files its complete schedule of portfolio holdings with the SEC for the first and third quarters of each fiscal year on Form N-Q, which is available by visiting the SEC website at sec.gov. In addition, the Fund’s Form N-Q may be reviewed and copied at the SEC’s Public Reference Room in Washington, DC, and at regional offices in New York City, at 233 Broadway, and in Chicago, at 175 West Jackson Boulevard, Suite 900. Information about the Public Reference Room may be obtained by calling 1-800-SEC-0330.
| | | | | | |
| Other information (unaudited) | | Wells Fargo Small Cap Opportunities Fund | | | 27 | |
BOARD OF TRUSTEES AND OFFICERS
Each of the Trustees and Officers1 listed in the table below acts in identical capacities for each fund in the Wells Fargo family of funds, which consists of 144 mutual funds comprising the Wells Fargo Funds Trust, Wells Fargo Variable Trust, Wells Fargo Master Trust and four closed-end funds (collectively the “Fund Complex”). This table should be read in conjunction with the Prospectus and the Statement of Additional Information2. The mailing address of each Trustee and Officer is 525 Market Street, 12th Floor, San Francisco, CA 94105. Each Trustee and Officer serves an indefinite term, however, each Trustee serves such term until reaching the mandatory retirement age established by the Trustees.
Independent Trustees
| | | | | | |
Name and year of birth | | Position held and length of service* | | Principal occupations during past five years or longer | | Current other public
company or investment
company directorships |
William R. Ebsworth (Born 1957) | | Trustee, since 2015 | | Retired. From 1984 to 2013, equities analyst, portfolio manager, research director and chief financial officer at Fidelity Management and Research Company in Boston, Tokyo, and Hong Kong and retired in 2013 as Chief Investment Officer of Fidelity Strategic Advisers, Inc. where he lead a team of investment professionals managing client assets. Prior thereto, Board member of Hong Kong Securities Clearing Co., Hong Kong Options Clearing Corp., the Thailand International Fund, Ltd., Fidelity Investments Life Insurance Company, and Empire Fidelity Investments Life Insurance Company. Mr. Ebsworth is a CFA® charterholder and an Adjunct Lecturer, Finance, at Babson College. | | Asset Allocation Trust |
Jane A. Freeman (Born 1953) | | Trustee, since 2015 | | Retired. From 2012 to 2014 and 1999 to 2008, Chief Financial Officer of Scientific Learning Corporation. From 2008 to 2012, Ms. Freeman provided consulting services related to strategic business projects. Prior to 1999, Portfolio Manager at Rockefeller & Co. and Scudder, Stevens & Clark. Board member of the Harding Loevner Funds from 1996 to 2014, serving as both Lead Independent Director and chair of the Audit Committee. Board member of the Russell Exchange Traded Funds Trust from 2011 to 2012 and the chair of the Audit Committee. Ms. Freeman is Chair of Taproot Foundation (non-profit organization), a Board Member of Ruth Bancroft Garden (non-profit organization) and an inactive chartered financial analyst. | | Asset Allocation Trust |
Peter G. Gordon (Born 1942) | | Trustee, since 1998; Chairman, since 2005 | | Co-Founder, Retired Chairman, President and CEO of Crystal Geyser Water Company. Trustee Emeritus, Colby College. | | Asset Allocation Trust |
Isaiah Harris, Jr. (Born 1952) | | Trustee, since 2009 | | Retired. Chairman of the Board of CIGNA Corporation since 2009, and Director since 2005. From 2003 to 2011, Director of Deluxe Corporation. Prior thereto, President and CEO of BellSouth Advertising and Publishing Corp. from 2005 to 2007, President and CEO of BellSouth Enterprises from 2004 to 2005 and President of BellSouth Consumer Services from 2000 to 2003. Emeritus member of the Iowa State University Foundation Board of Governors. Emeritus Member of the Advisory Board of Iowa State University School of Business. Advisory Board Member, Palm Harbor Academy (charter school). Advisory Board Member, Child Evangelism Fellowship (non-profit). Mr. Harris is a certified public accountant (inactive status). | | CIGNA Corporation; Asset Allocation Trust |
Judith M. Johnson (Born 1949) | | Trustee, since 2008; Audit Committee Chairman, since 2008 | | Retired. Prior thereto, Chief Executive Officer and Chief Investment Officer of Minneapolis Employees Retirement Fund from 1996 to 2008. Ms. Johnson is an attorney, certified public accountant and a certified managerial accountant. | | Asset Allocation Trust |
David F. Larcker (Born 1950) | | Trustee, since 2009 | | James Irvin Miller Professor of Accounting at the Graduate School of Business, Stanford University, Director of the Corporate Governance Research Initiative and Senior Faculty of The Rock Center for Corporate Governance since 2006. From 2005 to 2008, Professor of Accounting at the Graduate School of Business, Stanford University. Prior thereto,
Ernst & Young Professor of Accounting at The Wharton School, University of Pennsylvania from 1985 to 2005. | | Asset Allocation Trust |
| | | | |
| 28 | | Wells Fargo Small Cap Opportunities Fund | | Other information (unaudited) |
| | | | | | |
Name and year of birth | | Position held and length of service* | | Principal occupations during past five years or longer | | Current other public
company or investment
company directorships |
Olivia S. Mitchell (Born 1953) | | Trustee, since 2006 | | International Foundation of Employee Benefit Plans Professor, Wharton School of the University of Pennsylvania since 1993. Director of Wharton’s Pension Research Council and Boettner Center on Pensions & Retirement Research, and Research Associate at the National Bureau of Economic Research. Previously, Cornell University Professor from 1978 to 1993. | | Asset Allocation Trust |
Timothy J. Penny (Born 1951) | | Trustee, since 1996 | | President and Chief Executive Officer of Southern Minnesota Initiative Foundation, a non-profit organization, since 2007 and Senior Fellow at the Humphrey Institute Policy Forum at the University of Minnesota since 1995. Member of the Board of Trustees of NorthStar Education Finance, Inc., a non-profit organization, since 2007. | | Asset Allocation Trust |
Michael S. Scofield (Born 1943) | | Trustee, since 2010 | | Served on the Investment Company Institute’s Board of Governors and Executive Committee from 2008-2011 as well the Governing Council of the Independent Directors Council from 2006-2011 and the Independent Directors Council Executive Committee from 2008-2011. Chairman of the IDC from 2008-2010. Institutional Investor (Fund Directions) Trustee of Year in 2007. Trustee of the Evergreen Funds complex (and its predecessors) from 1984 to 2010. Chairman of the Evergreen Funds from 2000-2010. Former Trustee of the Mentor Funds. Retired Attorney, Law Offices of Michael S. Scofield. | | Asset Allocation Trust |
| * | Length of service dates reflect the Trustee’s commencement of service with the Trust’s predecessor entities, where applicable. |
Officers
| | | | | | |
Name and year of birth | | Position held and length of service | | Principal occupations during past five years or longer | | |
Karla M. Rabusch (Born 1959) | | President, since 2003 | | Executive Vice President of Wells Fargo Bank, N.A. and President of Wells Fargo Funds Management, LLC since 2003. | | |
Nancy Wiser1 (Born 1967) | | Treasurer, since 2012 | | Executive Vice President of Wells Fargo Funds Management, LLC since 2011. Chief Operating Officer and Chief Compliance Officer at LightBox Capital Management LLC, from 2008 to 2011. | | |
C. David Messman (Born 1960) | | Secretary, since 2000; Chief Legal Officer, since 2003 | | Senior Vice President and Secretary of Wells Fargo Funds Management, LLC since 2001. Assistant General Counsel of Wells Fargo Bank, N.A. since 2013 and Vice President and Managing Counsel of Wells Fargo Bank, N.A. from 1996 to 2013. | | |
Debra Ann Early (Born 1964) | | Chief Compliance Officer, since 2007 | | Executive Vice President of Wells Fargo Funds Management, LLC since 2014, Senior Vice President and Chief Compliance Officer from 2007 to 2014. | | |
David Berardi (Born 1975) | | Assistant Treasurer, since 2009 | | Vice President of Wells Fargo Funds Management, LLC since 2009. Vice President of Evergreen Investment Management Company, LLC from 2008 to 2010. Manager of Fund Reporting and Control for Evergreen Investment Management Company, LLC from 2004 to 2010. | | |
Jeremy DePalma1 (Born 1974) | | Assistant Treasurer, since 2009 | | Senior Vice President of Wells Fargo Funds Management, LLC since 2009. Senior Vice President of Evergreen Investment Management Company, LLC from 2008 to 2010 and head of the Fund Reporting and Control Team within Fund Administration from 2005 to 2010. | | |
| 1 | Nancy Wiser acts as Treasurer of 72 funds in the Fund Complex. Jeremy DePalma acts as Treasurer of 72 funds and Assistant Treasurer of 72 funds in the Fund Complex. |
| 2 | The Statement of Additional Information includes additional information about the Trustees and is available, without charge, upon request, by calling
1-800-222-8222 or by visiting the website at wellsfargofunds.com. |
| | | | | | |
| List of abbreviations | | Wells Fargo Small Cap Opportunities Fund | | | 29 | |
The following is a list of common abbreviations for terms and entities that may have appeared in this report.
| ACA | — ACA Financial Guaranty Corporation |
| ADR | — American depositary receipt |
| ADS | — American depositary shares |
| AGC | — Assured Guaranty Corporation |
| AGM | — Assured Guaranty Municipal |
| Ambac | — Ambac Financial Group Incorporated |
| AMT | — Alternative minimum tax |
| BAN | — Bond anticipation notes |
| BHAC | — Berkshire Hathaway Assurance Corporation |
| CAB | — Capital appreciation bond |
| CCAB | — Convertible capital appreciation bond |
| CDA | — Community Development Authority |
| CDO | — Collateralized debt obligation |
| DRIVER | — Derivative inverse tax-exempt receipts |
| DW&P | — Department of Water & Power |
| DWR | — Department of Water Resources |
| ECFA | — Educational & Cultural Facilities Authority |
| EDA | — Economic Development Authority |
| EDFA | — Economic Development Finance Authority |
| ETF | — Exchange-traded fund |
| FDIC | — Federal Deposit Insurance Corporation |
| FFCB | — Federal Farm Credit Banks |
| FGIC | — Financial Guaranty Insurance Corporation |
| FHA | — Federal Housing Administration |
| FHLB | — Federal Home Loan Bank |
| FHLMC | — Federal Home Loan Mortgage Corporation |
| FICO | — The Financing Corporation |
| FNMA | — Federal National Mortgage Association |
| GDR | — Global depositary receipt |
| GNMA | — Government National Mortgage Association |
| HCFR | — Healthcare facilities revenue |
| HEFA | — Health & Educational Facilities Authority |
| HEFAR | — Higher education facilities authority revenue |
| HFA | — Housing Finance Authority |
| HFFA | — Health Facilities Financing Authority |
| HUD | — Department of Housing and Urban Development |
| IDA | — Industrial Development Authority |
| IDAG | — Industrial Development Agency |
| KRW | — Republic of Korea won |
| LIBOR | — London Interbank Offered Rate |
| LIFER | — Long Inverse Floating Exempt Receipts |
| LLC | — Limited liability company |
| LLLP | — Limited liability limited partnership |
| LLP | — Limited liability partnership |
| MBIA | — Municipal Bond Insurance Association |
| MFHR | — Multifamily housing revenue |
| MSTR | — Municipal securities trust receipts |
| MUD | — Municipal Utility District |
| National | — National Public Finance Guarantee Corporation |
| PCFA | — Pollution Control Financing Authority |
| PCL | — Public Company Limited |
| PCR | — Pollution control revenue |
| PFA | — Public Finance Authority |
| PFFA | — Public Facilities Financing Authority |
| PFOTER | — Puttable floating option tax-exempt receipts |
| plc | — Public limited company |
| PUTTER | — Puttable tax-exempt receipts |
| R&D | — Research & development |
| Radian | — Radian Asset Assurance |
| RAN | — Revenue anticipation notes |
| RDA | — Redevelopment Authority |
| RDFA | — Redevelopment Finance Authority |
| REIT | — Real estate investment trust |
| ROC | — Reset option certificates |
| SAVRS | — Select auction variable rate securities |
| SBA | — Small Business Authority |
| SDR | — Swedish depositary receipt |
| SFHR | — Single-family housing revenue |
| SFMR | — Single-family mortgage revenue |
| SPA | — Standby purchase agreement |
| SPDR | — Standard & Poor’s Depositary Receipts |
| SPEAR | — Short Puttable Exempt Adjustable Receipts |
| STRIPS | — Separate trading of registered interest and |
| TAN | — Tax anticipation notes |
| TIPS | — Treasury inflation-protected securities |
| TRAN | — Tax revenue anticipation notes |
| TTFA | — Transportation Trust Fund Authority |
| TVA | — Tennessee Valley Authority |
This page is intentionally left blank.
This page is intentionally left blank.
This page is intentionally left blank.

For more information
More information about Wells Fargo Funds is available free upon request. To obtain literature, please write, email, visit the Fund’s website, or call:
Wells Fargo Funds
P.O. Box 8266
Boston, MA 02266-8266
Email: fundservice@wellsfargo.com
Website: wellsfargofunds.com
Individual investors: 1-800-222-8222
Retail investment professionals: 1-888-877-9275
Institutional investment professionals: 1-866-765-0778
This report and the financial statements contained herein are submitted for the general information of the shareholders of the Fund. If this report is used for promotional purposes, distribution of the report must be accompanied or preceded by a current prospectus. Before investing, please consider the investment objectives, risks, charges, and expenses of the investment. For a current prospectus and, if available, a summary prospectus, containing this information, call 1-800-222-8222 or visit the Fund’s website at wellsfargofunds.com. Read the prospectus carefully before you invest or send money.
Wells Fargo Asset Management (WFAM) is a trade name used by the asset management businesses of Wells Fargo & Company. Wells Fargo Funds Management, LLC, a wholly owned subsidiary of Wells Fargo & Company, provides investment advisory and administrative services for Wells Fargo Funds. Other affiliates of Wells Fargo & Company provide subadvisory and other services for the funds. The funds are distributed by Wells Fargo Funds Distributor, LLC, Member FINRA, an affiliate of Wells Fargo & Company.
NOT FDIC INSURED ¡ NO BANK GUARANTEE ¡ MAY LOSE VALUE
© 2016 Wells Fargo Funds Management, LLC. All rights reserved.
| | |
 | | 241816 05-16 A243/AR243 03-16 |
Annual Report
March 31, 2016

Wells Fargo Small Cap Value Fund


Reduce clutter. Save trees.
Sign up for electronic delivery of prospectuses and shareholder reports at wellsfargo.com/advantagedelivery
Contents
The views expressed and any forward-looking statements are as of March 31, 2016, unless otherwise noted, and are those of the Fund managers and/or Wells Fargo Funds Management, LLC. Discussions of individual securities, or the markets generally, or any Wells Fargo Fund are not intended as individual recommendations. Future events or results may vary significantly from those expressed in any forward-looking statements. The views expressed are subject to change at any time in response to changing circumstances in the market. Wells Fargo Funds Management, LLC and the Fund disclaim any obligation to publicly update or revise any views expressed or forward-looking statements.
NOT FDIC INSURED ¡ NO BANK GUARANTEE ¡ MAY LOSE VALUE
| | | | |
| 2 | | Wells Fargo Small Cap Value Fund | | Letter to shareholders (unaudited) |

Karla M. Rabusch
President
Wells Fargo Funds
Throughout the period, stock performance was highly volatile.
Stock values recovered during the second half of the first quarter of 2016.
Dear Valued Shareholder:
We are pleased to offer you this annual report for the Wells Fargo Small Cap Value Fund for the 12-month period that ended March 31, 2016. Throughout the period, stock performance was highly volatile. Investors reacted to slowing economic growth, moderating corporate earnings, weakening commodity prices, increasing central-bank intervention, and shifts in currency values. During the last four weeks of the period, investor sentiment appeared to move beyond these concerns as economic data firmed and stocks gained across the capitalization spectrum.
As investors grew concerned about global issues, volatility increased.
A common measure of investors’ stock volatility expectations—the Chicago Board Options Exchange (CBOE) Volatility Index (VIX)1—illustrated the shifts in investor sentiment. The VIX spiked to readings above 40 in August 2015, indicating increased investor anxiety. During a comparatively calm autumn, VIX readings trended to the midteens and closer to their five-year average. Then stock markets grew volatile again as the winter months arrived. After the new year began, VIX readings spiked to the high 20s as U.S. equity markets posted their worst start to a calendar year on record. Stock values recovered during the second half of the first quarter of 2016. Investors appeared to be encouraged by improving economic data and the reassurances of central bankers that they remain committed to spurring growth through policy initiatives.
However, business, economic, and central-bank policy development had countervailing influences. For example, while a stronger dollar benefited consumer purchasing power, it tended to negatively affect corporate earnings and investment gains earned overseas when translated to U.S. dollars. Lower energy costs helped consumers’ budgets but hampered the profits and stock performance in the energy sector. While lower interest rates encouraged spending, the potential for interest-rate increases caused uncertainty.
Central bankers responded with policy initiatives in response to shifting economic conditions.
In December 2015, the U.S. Federal Reserve (Fed) increased the federal funds rate, the first interest-rate increase since 2006. The Fed also expressed its intention to increase the rate several times during 2016. After the new year began, as data weakened and volatility increased, the Fed retrenched, which injected additional uncertainty into the markets. In the eurozone, the European Central Bank continued to encourage lending and investing by making funds available to banks at low interest rates, imposing a negative interest rate on bank deposits, and purchasing bonds through its quantitative easing program. In Japan, the central bank also implemented a negative interest-rate policy intended to spur lending and investment. In China, the People’s Bank of China lowered interest rates and bank reserve requirements, in addition to devaluing the country’s currency to support exports.
| 1 | The Chicago Board Options Exchange (CBOE) Volatility Index (VIX) is a key measure of market expectations of near-term volatility conveyed by the S&P 500 stock index option prices. Since its introduction in 1993, VIX has been considered by many to be the world’s premier barometer of investor sentiment and market volatility. Several investors expressed interest in trading instruments related to the market’s expectation of future volatility, and so VIX futures were introduced in 2004, and VIX options were introduced in 2006. |
| | | | | | |
| Letter to shareholders (unaudited) | | Wells Fargo Small Cap Value Fund | | | 3 | |
Volatility and recoveries highlighted the value of a long-term investment strategy.
The experience of the past 12 months demonstrated the value of maintaining a disciplined, long-term investment strategy despite short-term volatility. Broad U.S. equity indexes trimmed their worst losses measured to the midpoint of the period to recover all or a portion of their lost values by the end of the period. For example, the S&P 500 Index,2 a commonly referenced gauge of large-cap stock performance, gained 1.78% for the 12-month period that ended March 31, 2016, after recording a 6.18% loss for the six-month period that ended September 30, 2015. Some observers attributed the S&P 500 Index’s relative outperformance to investors who moved their equity allocations higher in the capitalization structure in pursuit of the perceived safety of large-cap stocks. The Russell Midcap® Index3 lost 4.04% for the 12-month period that ended March 31, 2016, regaining more than half of the 9.42% loss it had recorded for the six-month period that ended September 30, 2015. For the 12-month period that ended March 31, 2016, the Russell 2000® Index,4 a common small-cap stock index, lost 9.76%, an improvement from the 11.55% loss it had recorded during the six-month period that ended September 30, 2015.
Don’t let short-term uncertainty derail long-term investment goals.
Periods of investment uncertainty can present challenges, but experience has taught us that maintaining long-term investment goals can be an effective way to plan for the future. To help you create a sound strategy based on your personal goals and risk tolerance, Wells Fargo Funds offers more than 100 mutual funds spanning a wide range of asset classes and investment styles. Although diversification cannot guarantee an investment profit or prevent losses, we believe it can be an effective way to manage investment risk and
potentially smooth out overall portfolio performance. We encourage investors to know their investments and to understand that appropriate levels of risk-taking may unlock opportunities.
Thank you for choosing to invest with Wells Fargo Funds. We appreciate your confidence in us and remain committed to helping you meet your financial needs.
Sincerely,

Karla M. Rabusch
President
Wells Fargo Funds
For further information about your Fund, contact your investment professional, visit our website at wellsfargofunds.com, or call us directly at 1-800-222-8222. We are available 24 hours a day, 7 days a week.
| 2 | The S&P 500 Index consists of 500 stocks chosen for market size, liquidity, and industry group representation. It is a market-value-weighted index with each stock’s weight in the index proportionate to its market value. You cannot invest directly in an index. |
| 3 | The Russell Midcap® Index measures the performance of the 800 smallest companies in the Russell 1000® Index, which represent approximately 25% of the total market capitalization of the Russell 1000® Index. You cannot invest directly in an index. |
| 4 | The Russell 2000® Index measures the performance of the 2,000 smallest companies in the Russell 3000® Index, which represents approximately 8% of the total market capitalization of the Russell 3000® Index. You cannot invest directly in an index. |
| | | | |
| 4 | | Wells Fargo Small Cap Value Fund | | Performance highlights (unaudited) |
Investment objective
The Fund seeks long-term capital appreciation.
Manager
Wells Fargo Funds Management, LLC
Subadviser
Wells Capital Management Incorporated
Portfolio managers
Erik C. Astheimre
I. Charles Rinaldi
Michael Schneider, CFA®
Average annual total returns (%) as of March 31, 20161
| | | | | | | | | | | | | | | | | | | | | | | | | | | | | | | | | | |
| | | | | Including sales charge | | | Excluding sales charge | | | Expense ratios2 (%) | |
| | | Inception date | | 1 year | | | 5 year | | | 10 year | | | 1 year | | | 5 year | | | 10 year | | | Gross | | | Net3 | |
| Class A (SMVAX) | | 11-30-2000 | | | (8.49 | ) | | | 1.23 | | | | 3.53 | | | | (2.90 | ) | | | 2.43 | | | | 4.14 | | | | 1.32 | | | | 1.30 | |
| Class B (SMVBX)* | | 11-30-2000 | | | (8.58 | ) | | | 1.30 | | | | 3.60 | | | | (3.58 | ) | | | 1.68 | | | | 3.60 | | | | 2.07 | | | | 2.05 | |
| Class C (SMVCX) | | 11-30-2000 | | | (4.58 | ) | | | 1.67 | | | | 3.37 | | | | (3.58 | ) | | | 1.67 | | | | 3.37 | | | | 2.07 | | | | 2.05 | |
| Class R6 (SMVRX) | | 6-28-2013 | | | – | | | | – | | | | – | | | | (2.43 | ) | | | 2.88 | | | | 4.56 | | | | 0.89 | | | | 0.85 | |
| Administrator Class (SMVDX) | | 7-30-2010 | | | – | | | | – | | | | – | | | | (2.70 | ) | | | 2.63 | | | | 4.35 | | | | 1.24 | | | | 1.10 | |
| Institutional Class (WFSVX) | | 7-31-2007 | | | – | | | | – | | | | – | | | | (2.46 | ) | | | 2.85 | | | | 4.55 | | | | 0.99 | | | | 0.90 | |
| Russell 2000® Value Index4 | | – | | | – | | | | – | | | | – | | | | (7.72 | ) | | | 6.67 | | | | 4.42 | | | | – | | | | – | |
| * | | Class B shares are closed to investment, except in connection with the reinvestment of any distributions. |
Figures quoted represent past performance, which is no guarantee of future results, and do not reflect taxes that a shareholder may pay on fund distributions or the redemption of fund shares. Investment return and principal value of an investment will fluctuate so that an investor’s shares, when redeemed, may be worth more or less than their original cost. Performance shown without sales charges would be lower if sales charges were reflected. Current performance may be lower or higher than the performance data quoted, which assumes the reinvestment of dividends and capital gains. Current month-end performance is available on the Fund’s website, wellsfargofunds.com.
Index returns do not include transaction costs associated with buying and selling securities, any mutual fund fees or expenses, or any taxes. It is not possible to invest directly in an index.
For Class A shares, the maximum front-end sales charge is 5.75%. For Class B shares, the maximum contingent deferred sales charge is 5.00%. For Class C shares, the maximum contingent deferred sales charge is 1.00%. Performance including a contingent deferred sales charge assumes the sales charge for the corresponding time period. Class R6, Administrator Class, and Institutional Class shares are sold without a front-end sales charge or contingent deferred sales charge.
Stock values fluctuate in response to the activities of individual companies and general market and economic conditions. Smaller-company stocks tend to be more volatile and less liquid than those of larger companies. The use of derivatives may reduce returns and/or increase volatility. Certain investment strategies tend to increase the total risk of an investment (relative to the broader market). The Fund is exposed to foreign investment risk. Consult the Fund’s prospectus for additional information on these and other risks.
Please see footnotes on page 5.
| | | | | | |
| Performance highlights (unaudited) | | Wells Fargo Small Cap Value Fund | | | 5 | |
|
| Growth of $10,000 investment as of March 31, 20165 |
|
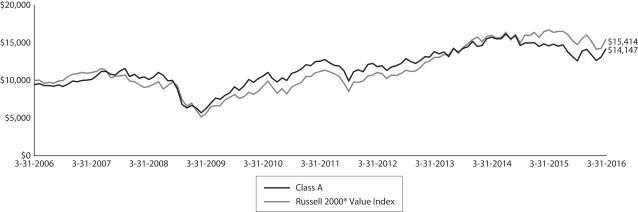
|
| 1 | Historical performance shown for Class R6 shares prior to their inception reflects the performance of Institutional Class shares and includes the higher expenses applicable to Institutional Class shares. If these expenses had not been included, returns would be higher. Historical performance shown for Administrator Class shares prior to their inception reflects the performance of Institutional Class shares and has been adjusted to reflect the higher expenses applicable to Administrator Class shares. Historical performance shown for Institutional Class shares prior to their inception reflects the performance of the former Investor Class shares, and includes the higher expenses applicable to the former Investor Class shares. If these expenses had not been included, returns would be higher. |
| 2 | Reflects the expense ratios as stated in the most recent prospectuses, which include the impact of 0.02% in acquired fund fees and expenses. The expense ratios shown are subject to change and may differ from the annualized expense ratios shown in the financial highlights of this report, which do not include acquired fund fees and expenses. |
| 3 | The manager has contractually committed through July 31, 2016, to waive fees and/or reimburse expenses to the extent necessary to cap the Fund’s Total Annual Fund Operating Expenses After Fee Waiver at 1.28% for Class A, 2.03% for Class B, 2.03% for Class C, 0.83% for Class R6, 1.08% for Administrator Class and 0.88% for Institutional Class. After this time, the cap may be increased or the commitment to maintain the cap may be terminated only with the approval of the Board of Trustees. Brokerage commissions, stamp duty fees, interest, taxes, acquired fund fees and expenses, and extraordinary expenses are excluded from the cap. Without this cap, the Fund’s returns would have been lower. |
| 4 | The Russell 2000® Value Index measures the performance of those Russell 2000 companies with lower price/book ratios and lower forecasted growth values. You cannot invest directly in an index. |
| 5 | The chart compares the performance of Class A shares for the most recent ten years with the Russell 2000® Value Index. The chart assumes a hypothetical investment of $10,000 in Class A shares and reflects all operating expenses. |
| 6 | The ten largest holdings, excluding cash and cash equivalents, are calculated based on the value of the investments divided by total net assets of the Fund. Holdings are subject to change and may have changed since the date specified. |
| 7 | Amounts are calculated based on the total long-term investments of the Fund. These amounts are subject to change and may have changed since the date specified. |
| | | | |
| 6 | | Wells Fargo Small Cap Value Fund | | Performance highlights (unaudited) |
MANAGER’S DISCUSSION
Fund highlights
| n | | The Fund outperformed its benchmark, the Russell 2000® Value Index, for the 12-month period that ended March 31, 2016. |
| n | | The Fund benefited from an overweight to materials, particularly gold-mining companies. |
| n | | Strong stock selection in the consumer discretionary, information technology (IT), and industrials sectors also drove the outperformance. |
| n | | The Fund’s underweight to the financials sector and weakness in our energy holdings detracted from performance. |
We believe positions in gold miners improve the Fund’s diversification due to lower correlation.
Equities declined during the 12-month period that ended March 31, 2016, as measured by the Russell 2000® Value Index. The disappointing economic recovery in the U.S., slowing growth in emerging markets, heightened geopolitical risks, and uncertainty regarding global central bank actions presented a difficult environment for equities. This backdrop was more positive for gold, which rose over 4% during this time. Most gold-related equities outperformed the gold price. Oil declined approximately 25% for the period given the oversupply environment, with most energy-related equities underperforming the commodity during that time.
| | | | |
| Ten largest holdings (%) as of March 31, 20166 | |
InterOil Corporation | | | 6.70 | |
Cavco Industries Incorporated | | | 6.27 | |
Randgold Resources Limited ADR | | | 6.08 | |
Cray Incorporated | | | 5.06 | |
Coherent Incorporated | | | 3.30 | |
Argo Group International Holdings Limited | | | 2.87 | |
Delta Air Lines Incorporated | | | 2.73 | |
Cincinnati Bell Incorporated | | | 2.70 | |
OraSure Technologies Incorporated | | | 2.21 | |
OSI Systems Incorporated | | | 2.11 | |
An overweight to the materials sector, specifically gold-mining companies, contributed to relative performance. We hold positions in gold miners in part because we believe they improve the Fund’s diversification given their lower correlation to the broad market. This proved true during the period, as gold and the shares of most gold miners performed strongly in the face of a weak equity market. We expect global mine supply to decline, which, coupled with the uncertain macroeconomic backdrop, should bode well for the price of gold. Randgold Resources Limited, one of the Fund’s largest holdings, gained more than 30%. Randgold is profitable and has disciplined management, a strong balance sheet, and high-quality mining assets. It continues to be a core Fund holding.
Consumer discretionary and information technology stocks contributed to performance.
Strong stock selection in the consumer discretionary sector helped Fund performance. The Fund’s manufactured housing producers, Cavco Industries, Incorporated, and Skyline Corporation, returned more than 24% and 160%, respectively. The manufactured housing industry is slowly recovering after a major downturn. As industry volumes increase, Cavco and Skyline are generating improved results. We believe the industry is in the early stages of a recovery and the outlook for these companies is very positive.
Within IT, Cray Incorporated, and Coherent, Incorporated, had strong performances during the period. Cray, the leader in supercomputers, continues to grow at two times the market rate. Cray’s backlog remains at record levels, and we expect the company to continue to gain share and expand into new client markets. Coherent is a leading provider of laser-based tools and products to the commercial and scientific markets. The company is at the front end of the cycle for laser solutions for the flat panel display market, and we believe it will be able to expand margins over the next several years.
Please see footnotes on page 5.
| | | | | | |
| Performance highlights (unaudited) | | Wells Fargo Small Cap Value Fund | | | 7 | |
|
| Sector distribution as of March 31, 20167 |
|
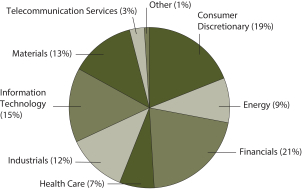 |
The Fund’s energy stocks detracted from performance during the period. Our largest energy holding, InterOil Corporation, declined 31%. Even though the company, a natural gas exploration concern, is not directly tied to oil, the weak sector sentiment negatively influenced the stock. InterOil’s transaction with Total S.A. regarding the Elk/Antelope natural gas resource remains on track and is expected to close in the third quarter. At certification of the transaction, InterOil will receive a large certification payment tied to the amount of gas present rather than based on commodity prices. The deal will further de-risk the company’s financial position and allow it to advance its drilling program on multiple fields.
The portfolio’s underweight to the financials sector detracted from the Fund’s relative performance. In terms of individual positions, Bancorp, Incorporated, was the largest performance detractor. The company continues to report disappointing financial results. We believe that results will improve in the year ahead and that the stock is undervalued. Our largest sector holding, Argo Group International Holdings, Limited, performed well, returning 16%. Argo Group has repurchased a significant amount of its stock over the past several years, and the company continues to report good earnings.
We remain focused on companies whose businesses are likely to benefit in the long-term.
We are cautious on the overall market. Corporate profit margins are high and valuation multiples are not cheap. It is possible that profit margins revert to more historical levels and the share-price multiples that investors put on those earnings also could move lower. The interaction of these two events could lead to lower stock prices. In addition, the hesitancy of the U.S. Federal Reserve to raise interest rates in the U.S. and the move by some central banks overseas to negative interest-rate regimes suggest that global economic growth is not yet robust. Given these factors, we believe it’s prudent to remain cautious. We continue to focus on company-specific fundamentals to guide our decisions. We believe our diversified approach, which includes exposure to gold miners, leaves the Fund well positioned to meet the various challenges that may lie ahead.
Please see footnotes on page 5.
| | | | |
| 8 | | Wells Fargo Small Cap Value Fund | | Fund expenses (unaudited) |
As a shareholder of the Fund, you incur two types of costs: (1) transaction costs, including sales charges (loads) on purchase payments and contingent deferred sales charges (if any) on redemptions and (2) ongoing costs, including management fees, distribution (12b-1) and/or shareholder servicing fees, and other Fund expenses. This example is intended to help you understand your ongoing costs (in dollars) of investing in the Fund and to compare these costs with the ongoing costs of investing in other mutual funds.
The example is based on an investment of $1,000 invested at the beginning of the six-month period and held for the entire period from October 1, 2015 to March 31, 2016.
Actual expenses
The “Actual” line of the table below provides information about actual account values and actual expenses. You may use the information in this line, together with the amount you invested, to estimate the expenses that you paid over the period. Simply divide your account value by $1,000 (for example, an $8,600 account value divided by $1,000 = 8.6), then multiply the result by the number in the “Actual” line under the heading entitled “Expenses paid during period” for your applicable class of shares to estimate the expenses you paid on your account during this period.
Hypothetical example for comparison purposes
The “Hypothetical” line of the table below provides information about hypothetical account values and hypothetical expenses based on the Fund’s actual expense ratio and an assumed rate of return of 5% per year before expenses, which is not the Fund’s actual return. The hypothetical account values and expenses may not be used to estimate the actual ending account balance or expenses you paid for the period. You may use this information to compare the ongoing costs of investing in the Fund and other funds. To do so, compare this 5% hypothetical example with the 5% hypothetical examples that appear in the shareholder reports of the other funds.
Please note that the expenses shown in the table are meant to highlight your ongoing costs only and do not reflect any transactional costs, such as sales charges (loads) and contingent deferred sales charges. Therefore, the “Hypothetical” line of the table is useful in comparing ongoing costs only and will not help you determine the relative total costs of owning different funds. In addition, if these transactional costs were included, your costs would have been higher.
| | | | | | | | | | | | | | | | |
| | | Beginning
account value
10-1-2015 | | | Ending
account value
3-31-2016 | | | Expenses
paid during
the period¹ | | | Net annualized
expense ratio | |
Class A | | | | | | | | | | | | | | | | |
Actual | | $ | 1,000.00 | | | $ | 1,124.67 | | | $ | 6.80 | | | | 1.28 | % |
Hypothetical (5% return before expenses) | | $ | 1,000.00 | | | $ | 1,018.60 | | | $ | 6.46 | | | | 1.28 | % |
Class B | | | | | | | | | | | | | | | | |
Actual | | $ | 1,000.00 | | | $ | 1,121.26 | | | $ | 10.77 | | | | 2.03 | % |
Hypothetical (5% return before expenses) | | $ | 1,000.00 | | | $ | 1,014.85 | | | $ | 10.23 | | | | 2.03 | % |
Class C | | | | | | | | | | | | | | | | |
Actual | | $ | 1,000.00 | | | $ | 1,121.01 | | | $ | 10.76 | | | | 2.03 | % |
Hypothetical (5% return before expenses) | | $ | 1,000.00 | | | $ | 1,014.85 | | | $ | 10.23 | | | | 2.03 | % |
Class R6 | | | | | | | | | | | | | | | | |
Actual | | $ | 1,000.00 | | | $ | 1,127.59 | | | $ | 4.41 | | | | 0.83 | % |
Hypothetical (5% return before expenses) | | $ | 1,000.00 | | | $ | 1,020.85 | | | $ | 4.19 | | | | 0.83 | % |
Administrator Class | | | | | | | | | | | | | | | | |
Actual | | $ | 1,000.00 | | | $ | 1,125.78 | | | $ | 5.74 | | | | 1.08 | % |
Hypothetical (5% return before expenses) | | $ | 1,000.00 | | | $ | 1,019.60 | | | $ | 5.45 | | | | 1.08 | % |
Institutional Class | | | | | | | | | | | | | | | | |
Actual | | $ | 1,000.00 | | | $ | 1,127.20 | | | $ | 4.68 | | | | 0.88 | % |
Hypothetical (5% return before expenses) | | $ | 1,000.00 | | | $ | 1,020.60 | | | $ | 4.45 | | | | 0.88 | % |
| 1 | Expenses paid is equal to the annualized expense ratio of each class multiplied by the average account value over the period, multiplied by the number of days in the most recent fiscal half-year divided by the number of days in the fiscal year (to reflect the one-half-year period). |
| | | | | | |
| Portfolio of investments—March 31, 2016 | | Wells Fargo Small Cap Value Fund | | | 9 | |
| | | | | | | | | | | | |
| Security name | | | | | | Shares | | | Value | |
| | | | |
Common Stocks: 96.44% | | | | | | | | | | | | |
| | | | |
Consumer Discretionary: 18.38% | | | | | | | | | | | | |
| | | | |
| Auto Components: 1.65% | | | | | | | | | | | | |
Fox Factory Holding Corporation † | | | | | | | 514,200 | | | $ | 8,129,502 | |
Gentex Corporation | | | | | | | 407,000 | | | | 6,385,830 | |
| | | | |
| | | | | | | | | | | 14,515,332 | |
| | | | | | | | | | | | |
| | | | |
| Hotels, Restaurants & Leisure: 6.06% | | | | | | | | | | | | |
Bloomin’ Brands Incorporated | | | | | | | 260,700 | | | | 4,398,009 | |
Century Casinos Incorporated †(l) | | | | | | | 1,476,500 | | | | 9,095,240 | |
Denny’s Corporation † | | | | | | | 1,448,000 | | | | 15,001,280 | |
Peak Resorts Incorporated | | | | | | | 527,600 | | | | 1,793,840 | |
Scientific Games Corporation Class A † | | | | | | | 903,500 | | | | 8,520,005 | |
The Wendy’s Company | | | | | | | 1,313,000 | | | | 14,298,570 | |
| | | | |
| | | | | | | | | | | 53,106,944 | |
| | | | | | | | | | | | |
| | | | |
| Household Durables: 9.65% | | | | | | | | | | | | |
Cavco Industries Incorporated †(l) | | | | | | | 587,800 | | | | 54,935,788 | |
Harman International Industries Incorporated | | | | | | | 42,600 | | | | 3,793,104 | |
KB Home Incorporated | | | | | | | 523,900 | | | | 7,481,292 | |
Skyline Corporation †(l) | | | | | | | 626,200 | | | | 5,804,874 | |
Taylor Morrison Home Corporation Class A † | | | | | | | 356,000 | | | | 5,026,720 | |
The New Home Company Incorporated † | | | | | | | 618,400 | | | | 7,581,584 | |
| | | | |
| | | | | | | | | | | 84,623,362 | |
| | | | | | | | | | | | |
| | | | |
| Media: 0.33% | | | | | | | | | | | | |
MSG Networks Incorporated Class A | | | | | | | 170,200 | | | | 2,942,758 | |
| | | | | | | | | | | | |
| | | | |
| Multiline Retail: 0.30% | | | | | | | | | | | | |
Fred’s Incorporated Class A | | | | | | | 174,300 | | | | 2,598,813 | |
| | | | | | | | | | | | |
| | | | |
| Specialty Retail: 0.39% | | | | | | | | | | | | |
Vitamin Shoppe Incorporated † | | | | | | | 109,900 | | | | 3,402,504 | |
| | | | | | | | | | | | |
| | | | |
Energy: 8.90% | | | | | | | | | | | | |
| | | | |
| Energy Equipment & Services: 1.12% | | | | | | | | | | | | |
Newpark Resources Incorporated † | | | | | | | 981,700 | | | | 4,240,944 | |
Parker Drilling Company † | | | | | | | 1,122,700 | | | | 2,380,124 | |
PHI Incorporated (non-voting) † | | | | | | | 170,300 | | | | 3,216,967 | |
| | | | |
| | | | | | | | | | | 9,838,035 | |
| | | | | | | | | | | | |
| | | | |
| Oil, Gas & Consumable Fuels: 7.78% | | | | | | | | | | | | |
InterOil Corporation † | | | | | | | 1,844,400 | | | | 58,707,252 | |
Range Resources Corporation | | | | | | | 120,100 | | | | 3,888,838 | |
Sanchez Energy Corporation † | | | | | | | 458,500 | | | | 2,517,165 | |
Trilogy Energy Corporation †(a) | | | | | | | 1,127,500 | | | | 3,104,006 | |
| | | | |
| | | | | | | | | | | 68,217,261 | |
| | | | | | | | | | | | |
The accompanying notes are an integral part of these financial statements.
| | | | |
| 10 | | Wells Fargo Small Cap Value Fund | | Portfolio of investments—March 31, 2016 |
| | | | | | | | | | | | |
| Security name | | | | | | Shares | | | Value | |
| | | | |
Financials: 20.43% | | | | | | | | | | | | |
| | | | |
| Banks: 9.94% | | | | | | | | | | | | |
Ameris Bancorp | | | | | | | 260,600 | | | $ | 7,708,548 | |
BBCN Bancorp Incorporated | | | | | | | 537,700 | | | | 8,167,663 | |
CenterState Banks Incorporated | | | | | | | 765,400 | | | | 11,396,806 | |
First Horizon National Corporation | | | | | | | 825,300 | | | | 10,811,430 | |
Hanmi Financial Corporation | | | | | | | 119,100 | | | | 2,622,582 | |
Hilltop Holdings Incorporated † | | | | | | | 390,400 | | | | 7,370,752 | |
IBERIABANK Corporation | | | | | | | 239,200 | | | | 12,263,784 | |
LegacyTexas Financial Group | | | | | | | 44,500 | | | | 874,425 | |
Park Sterling Corporation | | | | | | | 820,100 | | | | 5,470,067 | |
Sterling BanCorp | | | | | | | 200,900 | | | | 3,200,337 | |
The Bancorp Incorporated † | | | | | | | 1,285,500 | | | | 7,353,060 | |
Valley National Bancorp | | | | | | | 311,800 | | | | 2,974,572 | |
Wilshire Bancorp Incorporated | | | | | | | 676,200 | | | | 6,964,860 | |
| | | | |
| | | | | | | | | | | 87,178,886 | |
| | | | | | | | | | | | |
| | | | |
| Capital Markets: 0.43% | | | | | | | | | | | | |
Medley Management Incorporated Class A (l) | | | | | | | 689,100 | | | | 3,790,050 | |
| | | | | | | | | | | | |
| | | | |
| Consumer Finance: 0.30% | | | | | | | | | | | | |
Enova International Incorporated † | | | | | | | 416,100 | | | | 2,625,591 | |
| | | | | | | | | | | | |
| | | | |
| Insurance: 5.41% | | | | | | | | | | | | |
Argo Group International Holdings Limited | | | | | | | 438,400 | | | | 25,159,776 | |
James River Group Holdings Limited | | | | | | | 119,200 | | | | 3,845,392 | |
National General Holdings Corporation | | | | | | | 427,600 | | | | 9,231,884 | |
OneBeacon Insurance Group Limited Class A | | | | | | | 724,515 | | | | 9,223,076 | |
| | | | |
| | | | | | | | | | | 47,460,128 | |
| | | | | | | | | | | | |
| | | | |
| REITs: 3.52% | | | | | | | | | | | | |
Potlatch Corporation | | | | | | | 264,500 | | | | 8,331,750 | |
Redwood Trust Incorporated | | | | | | | 1,133,100 | | | | 14,820,948 | |
UMH Properties Incorporated | | | | | | | 775,600 | | | | 7,693,952 | |
| | | | |
| | | | | | | | | | | 30,846,650 | |
| | | | | | | | | | | | |
| | | | |
| Thrifts & Mortgage Finance: 0.83% | | | | | | | | | | | | |
Essent Group Limited † | | | | | | | 47,600 | | | | 990,080 | |
Northwest Bancshares Incorporated | | | | | | | 461,000 | | | | 6,228,110 | |
| | | | |
| | | | | | | | | | | 7,218,190 | |
| | | | | | | | | | | | |
| | | | |
Health Care: 7.37% | | | | | | | | | | | | |
| | | | |
| Health Care Equipment & Supplies: 3.33% | | | | | | | | | | | | |
Allied Healthcare Products Incorporated †(l) | | | | | | | 588,600 | | | | 411,961 | |
Cerus Corporation † | | | | | | | 466,100 | | | | 2,763,973 | |
Hologic Incorporated † | | | | | | | 193,900 | | | | 6,689,550 | |
OraSure Technologies Incorporated † | | | | | | | 2,675,800 | | | | 19,346,034 | |
| | | | |
| | | | | | | | | | | 29,211,518 | |
| | | | | | | | | | | | |
The accompanying notes are an integral part of these financial statements.
| | | | | | |
| Portfolio of investments—March 31, 2016 | | Wells Fargo Small Cap Value Fund | | | 11 | |
| | | | | | | | | | | | |
| Security name | | | | | | Shares | | | Value | |
| | | | |
| Health Care Providers & Services: 2.70% | | | | | | | | | | | | |
Air Methods Corporation † | | | | | | | 104,000 | | | $ | 3,766,880 | |
Cross Country Healthcare Incorporated † | | | | | | | 1,326,848 | | | | 15,431,242 | |
Healthways Incorporated † | | | | | | | 444,400 | | | | 4,483,996 | |
| | | | |
| | | | | | | | | | | 23,682,118 | |
| | | | | | | | | | | | |
| | | | |
| Health Care Technology: 0.73% | | | | | | | | | | | | |
Allscripts Healthcare Solutions Incorporated † | | | | | | | 482,800 | | | | 6,377,788 | |
| | | | | | | | | | | | |
| | | | |
| Life Sciences Tools & Services: 0.41% | | | | | | | | | | | | |
PAREXEL International Corporation † | | | | | | | 56,900 | | | | 3,569,337 | |
| | | | | | | | | | | | |
| | | | |
| Pharmaceuticals: 0.20% | | | | | | | | | | | | |
Prestige Brands Holdings Incorporated † | | | | | | | 32,800 | | | | 1,751,192 | |
| | | | | | | | | | | | |
| | | | |
Industrials: 11.29% | | | | | | | | | | | | |
| | | | |
| Airlines: 5.81% | | | | | | | | | | | | |
American Airlines Group Incorporated | | | | | | | 182,400 | | | | 7,480,224 | |
Delta Air Lines Incorporated | | | | | | | 491,400 | | | | 23,921,352 | |
Latam Airlines Group SP ADR † | | | | | | | 630,100 | | | | 4,410,700 | |
United Continental Holdings Incorporated † | | | | | | | 252,300 | | | | 15,102,678 | |
| | | | |
| | | | | | | | | | | 50,914,954 | |
| | | | | | | | | | | | |
| | | | |
| Commercial Services & Supplies: 2.50% | | | | | | | | | | | | |
ABM Industries Incorporated | | | | | | | 2,700 | | | | 87,237 | |
ACCO Brands Corporation † | | | | | | | 1,739,800 | | | | 15,623,404 | |
Healthcare Services Group Incorporated | | | | | | | 169,400 | | | | 6,235,614 | |
| | | | |
| | | | | | | | | | | 21,946,255 | |
| | | | | | | | | | | | |
| | | | |
| Construction & Engineering: 0.82% | | | | | | | | | | | | |
Tutor Perini Corporation † | | | | | | | 460,900 | | | | 7,162,386 | |
| | | | | | | | | | | | |
| | | | |
| Machinery: 0.65% | | | | | | | | | | | | |
Actuant Corporation Class A | | | | | | | 115,500 | | | | 2,854,005 | |
Mueller Water Products Incorporated | | | | | | | 288,400 | | | | 2,849,392 | |
| | | | |
| | | | | | | | | | | 5,703,397 | |
| | | | | | | | | | | | |
| | | | |
| Professional Services: 0.58% | | | | | | | | | | | | |
Hill International Incorporated † | | | | | | | 1,500,000 | | | | 5,055,000 | |
| | | | | | | | | | | | |
| | | | |
| Road & Rail: 0.23% | | | | | | | | | | | | |
Covenant Transport Incorporated Class A † | | | | | | | 83,300 | | | | 2,015,027 | |
| | | | | | | | | | | | |
| | | | |
| Trading Companies & Distributors: 0.70% | | | | | | | | | | | | |
Applied Industrial Technologies Incorporated | | | | | | | 142,700 | | | | 6,193,180 | |
| | | | | | | | | | | | |
| | | | |
Information Technology: 15.00% | | | | | | | | | | | | |
| | | | |
| Communications Equipment: 0.93% | | | | | | | | | | | | |
Harmonic Incorporated † | | | | | | | 836,300 | | | | 2,734,701 | |
Ruckus Wireless Incorporated † | | | | | | | 554,000 | | | | 5,434,740 | |
| | | | |
| | | | | | | | | | | 8,169,441 | |
| | | | | | | | | | | | |
The accompanying notes are an integral part of these financial statements.
| | | | |
| 12 | | Wells Fargo Small Cap Value Fund | | Portfolio of investments—March 31, 2016 |
| | | | | | | | | | | | |
| Security name | | | | | | Shares | | | Value | |
| | | | |
| Electronic Equipment, Instruments & Components: 7.21% | | | | | | | | | | | | |
Checkpoint Systems Incorporated | | | | | | | 758,500 | | | $ | 7,676,020 | |
Cognex Corporation | | | | | | | 206,800 | | | | 8,054,860 | |
Coherent Incorporated † | | | | | | | 315,000 | | | | 28,948,500 | |
OSI Systems Incorporated † | | | | | | | 282,800 | | | | 18,520,572 | |
| | | | |
| | | | | | | | | | | 63,199,952 | |
| | | | | | | | | | | | |
| | | | |
| IT Services: 0.43% | | | | | | | | | | | | |
TeleTech Holdings Incorporated | | | | | | | 134,700 | | | | 3,739,272 | |
| | | | | | | | | | | | |
| | | | |
| Semiconductors & Semiconductor Equipment: 0.47% | | | | | | | | | | | | |
Kulicke & Soffa Industries Incorporated † | | | | | | | 365,600 | | | | 4,138,592 | |
| | | | | | | | | | | | |
| | | | |
| Software: 0.25% | | | | | | | | | | | | |
Synchronoss Technologies Incorporated † | | | | | | | 67,900 | | | | 2,195,886 | |
| | | | | | | | | | | | |
| | | | |
| Technology Hardware, Storage & Peripherals: 5.71% | | | | | | | | | | | | |
Cray Incorporated † | | | | | | | 1,057,700 | | | | 44,328,207 | |
Diebold Incorporated | | | | | | | 117,420 | | | | 3,394,612 | |
Quantum Corporation † | | | | | | | 3,865,000 | | | | 2,357,650 | |
| | | | |
| | | | | | | | | | | 50,080,469 | |
| | | | | | | | | | | | |
| | | | |
Materials: 12.37% | | | | | | | | | | | | |
| | | | |
| Chemicals: 0.17% | | | | | | | | | | | | |
Calgon Carbon Corporation | | | | | | | 109,000 | | | | 1,528,180 | |
| | | | | | | | | | | | |
| | | | |
| Containers & Packaging: 0.32% | | | | | | | | | | | | |
Intertape Polymer Group Incorporated | | | | | | | 195,500 | | | | 2,789,785 | |
| | | | | | | | | | | | |
| | | | |
| Metals & Mining: 11.40% | | | | | | | | | | | | |
Agnico-Eagle Mines Limited | | | | | | | 258,800 | | | | 9,358,208 | |
Carpenter Technology Corporation | | | | | | | 65,400 | | | | 2,238,642 | |
NovaGold Resources Incorporated † | | | | | | | 959,600 | | | | 4,836,384 | |
Randgold Resources Limited ADR | | | | | | | 587,400 | | | | 53,341,794 | |
Royal Gold Incorporated | | | | | | | 142,100 | | | | 7,288,309 | |
Sandstorm Gold Limited † | | | | | | | 1,309,500 | | | | 4,308,255 | |
Silver Standard Resources Incorporated † | | | | | | | 1,062,600 | | | | 5,897,430 | |
Steel Dynamics Incorporated | | | | | | | 465,700 | | | | 10,482,907 | |
Webco Industries Incorporated †(a)(i)(l) | | | | | | | 55,400 | | | | 2,221,540 | |
| | | | |
| | | | | | | | | | | 99,973,469 | |
| | | | | | | | | | | | |
| | | | |
| Paper & Forest Products: 0.48% | | | | | | | | | | | | |
Deltic Timber Corporation | | | | | | | 69,400 | | | | 4,174,410 | |
| | | | | | | | | | | | |
| | | | |
Telecommunication Services: 2.70% | | | | | | | | | | | | |
| | | | |
| Diversified Telecommunication Services: 2.70% | | | | | | | | | | | | |
Cincinnati Bell Incorporated † | | | | | | | 6,118,200 | | | | 23,677,435 | |
| | | | | | | | | | | | |
| | | | |
Total Common Stocks (Cost $576,237,009) | | | | | | | | | | | 845,613,547 | |
| | | | | | | | | | | | |
The accompanying notes are an integral part of these financial statements.
| | | | | | |
| Portfolio of investments—March 31, 2016 | | Wells Fargo Small Cap Value Fund | | | 13 | |
| | | | | | | | | | | | | | |
| Security name | | | | | | | Shares | | | Value | |
| | | | |
Exchange-Traded Funds: 1.70% | | | | | | | | | | | | | | |
Market Vectors Gold Miners ETF | | | | | | | | | 386,020 | | | $ | 7,712,680 | |
Market Vectors Junior Gold Miners ETF | | | | | | | | | 110,206 | | | | 3,069,237 | |
SPDR S&P Regional Banking ETF | | | | | | | | | 109,900 | | | | 4,136,636 | |
| | | | |
Total Exchange-Traded Funds (Cost $17,729,602) | | | | | | | | | | | | | 14,918,553 | |
| | | | | | | | | | | | | | |
| | | | |
| | | Yield | | | | | | | | | |
| Short-Term Investments: 1.64% | | | | | | | | | | | | | | |
| | | | |
| Investment Companies: 1.64% | | | | | | | | | | | | | | |
Wells Fargo Cash Investment Money Market Fund Select Class (l)(u) | | | 0.44 | % | | | | | 14,417,507 | | | | 14,417,507 | |
| | | | | | | | | | | | | | |
| | | | |
Total Short-Term Investments (Cost $14,417,507) | | | | | | | | | | | | | 14,417,507 | |
| | | | | | | | | | | | | | |
| | | | | | | | |
| Total investments in securities (Cost $608,384,118) * | | | 99.78 | % | | | 874,949,607 | |
Other assets and liabilities, net | | | 0.22 | | | | 1,918,193 | |
| | | | | | | | |
| Total net assets | | | 100.00 | % | | $ | 876,867,800 | |
| | | | | | | | |
| † | Non-income-earning security |
| (l) | The issuer of the security is an affiliated person of the Fund as defined in the Investment Company Act of 1940. |
| (a) | The security is fair valued in accordance with procedures approved by the Board of Trustees. |
| (i) | Illiquid security for which the designation as illiquid is unaudited. |
| (u) | The rate represents the 7-day annualized yield at period end. |
| * | Cost for federal income tax purposes is $621,118,816 and unrealized gains (losses) consists of: |
| | | | |
Gross unrealized gains | | $ | 343,744,411 | |
Gross unrealized losses | | | (89,913,620 | ) |
| | | | |
Net unrealized gains | | $ | 253,830,791 | |
The accompanying notes are an integral part of these financial statements.
| | | | |
| 14 | | Wells Fargo Small Cap Value Fund | | Statement of assets and liabilities—March 31, 2016 |
| | | | |
| | | | |
| |
Assets | | | | |
Investments | | | | |
In unaffiliated securities, at value (cost $542,423,331) | | $ | 784,272,647 | |
In affiliated securities, at value (cost $65,960,787) | | | 90,676,960 | |
| | | | |
Total investments, at value (cost $608,384,118) | | | 874,949,607 | |
Foreign currency, at value (cost $44) | | | 40 | |
Receivable for investments sold | | | 4,824,470 | |
Receivable for Fund shares sold | | | 757,242 | |
Receivable for dividends | | | 761,917 | |
Prepaid expenses and other assets | | | 54,570 | |
| | | | |
Total assets | | | 881,347,846 | |
| | | | |
| |
Liabilities | | | | |
Payable for investments purchased | | | 1,560,269 | |
Payable for Fund shares redeemed | | | 1,697,901 | |
Management fee payable | | | 560,611 | |
Distribution fees payable | | | 21,007 | |
Administration fees payable | | | 118,392 | |
Shareholder report expenses payable | | | 367,531 | |
Accrued expenses and other liabilities | | | 154,335 | |
| | | | |
Total liabilities | | | 4,480,046 | |
| | | | |
Total net assets | | $ | 876,867,800 | |
| | | | |
| |
NET ASSETS CONSIST OF | | | | |
Paid-in capital | | $ | 545,383,427 | |
Accumulated net investment loss | | | (2,315,780 | ) |
Accumulated net realized gains on investments | | | 67,234,668 | |
Net unrealized gains on investments | | | 266,565,485 | |
| | | | |
Total net assets | | $ | 876,867,800 | |
| | | | |
| |
COMPUTATION OF NET ASSET VALUE AND OFFERING PRICE PER SHARE | | | | |
Net assets – Class A | | $ | 441,678,759 | |
Shares outstanding – Class A1 | | | 23,439,798 | |
Net asset value per share – Class A | | | $18.84 | |
Maximum offering price per share – Class A2 | | | $19.99 | |
Net assets – Class B | | $ | 4,313 | |
Shares outstanding – Class B1 | | | 285 | |
Net asset value per share – Class B | | | $15.13 | |
Net assets – Class C | | $ | 33,600,999 | |
Shares outstanding – Class C1 | | | 2,227,279 | |
Net asset value per share – Class C | | | $15.09 | |
Net assets – Class R6 | | $ | 92,928,682 | |
Shares outstanding – Class R61 | | | 4,713,135 | |
Net asset value per share – Class R6 | | | $19.72 | |
Net assets – Administrator Class | | $ | 24,926,956 | |
Shares outstanding – Administrator Class1 | | | 1,267,594 | |
Net asset value per share – Administrator Class | | | $19.66 | |
Net assets – Institutional Class | | $ | 283,728,091 | |
Shares outstanding – Institutional Class1 | | | 14,396,481 | |
Net asset value per share – Institutional Class | | | $19.71 | |
| 1 | The Fund has an unlimited number of authorized shares. |
| 2 | Maximum offering price is computed as 100/94.25 of net asset value. On investments of $50,000 or more, the offering price is reduced. |
The accompanying notes are an integral part of these financial statements.
| | | | | | |
| Statement of operations—year ended March 31, 2016 | | Wells Fargo Small Cap Value Fund | | | 15 | |
| | | | |
| | | | |
| |
Investment income | | | | |
Dividends (net of foreign withholding taxes of $31,965) | | $ | 9,553,727 | |
Income from affiliated securities | | | 677,446 | |
| | | | |
Total investment income | | | 10,231,173 | |
| | | | |
| |
Expenses | | | | |
Management fee | | | 9,695,926 | |
Administration fees | | | | |
Class A | | | 749,729 | |
Class B | | | 192 | |
Class C | | | 121,514 | |
Class R6 | | | 28,823 | |
Administrator Class | | | 52,007 | |
Institutional Class | | | 438,968 | |
Investor Class | | | 747,872 | 1 |
Shareholder servicing fees | | | | |
Class A | | | 849,582 | |
Class B | | | 209 | |
Class C | | | 133,042 | |
Administrator Class | | | 109,275 | |
Investor Class | | | 580,296 | 1 |
Distribution fees | | | | |
Class B | | | 627 | |
Class C | | | 399,125 | |
Custody and accounting fees | | | 104,927 | |
Professional fees | | | 52,782 | |
Registration fees | | | 93,766 | |
Shareholder report expenses | | | 324,813 | |
Trustees’ fees and expenses | | | 11,522 | |
Other fees and expenses | | | 25,715 | |
| | | | |
Total expenses | | | 14,520,712 | |
Less: Fee waivers and/or expense reimbursements | | | (1,282,344 | ) |
| | | | |
Net expenses | | | 13,238,368 | |
| | | | |
Net investment loss | | | (3,007,195 | ) |
| | | | |
| |
REALIZED AND UNREALIZED GAINS (LOSSES) ON INVESTMENTS | | | | |
| |
Net realized gains on: | | | | |
Unaffiliated securities | | | 151,432,974 | |
Affiliated securities | | | 25,261,687 | |
| | | | |
Net realized gains on investments | | | 176,694,661 | |
| | | | |
| |
Net change in unrealized gains (losses) on: | | | | |
Unaffiliated securities | | | (168,374,425 | ) |
Affiiliated securities | | | (54,528,754 | ) |
| | | | |
Net change in unrealized gains (losses) on investments | | | (222,903,179 | ) |
| | | | |
Net realized and unrealized gains (losses) on investments | | | (46,208,518 | ) |
| | | | |
Net decrease in net assets resulting from operations | | $ | (49,215,713 | ) |
| | | | |
| 1 | For the period from April 1, 2015 to October 23, 2015. Effective at the close of business on October 23, 2015, Investor Class shares were converted to Class A shares and are no longer offered by the Fund. |
The accompanying notes are an integral part of these financial statements.
| | | | |
| 16 | | Wells Fargo Small Cap Value Fund | | Statement of changes in net assets |
| | | | | | | | | | | | | | | | |
| | | Year ended
March 31, 2016 | | | Year ended
March 31, 2015 | |
| | | | |
Operations | | | | | | | | | | | | | | | | |
Net investment income (loss) | | | | | | $ | (3,007,195 | ) | | | | | | $ | 4,712,137 | |
Net realized gains on investments | | | | | | | 176,694,661 | | | | | | | | 297,123,395 | |
Net change in unrealized gains (losses) on investments | | | | | | | (222,903,179 | ) | | | | | | | (486,933,435 | ) |
| | | | |
Net decrease in net assets resulting from operations | | | | | | | (49,215,713 | ) | | | | | | | (185,097,903 | ) |
| | | | |
| | | | |
Distributions to shareholders from | | | | | | | | | | | | | | | | |
Net investment income | | | | | | | | | | | | | | | | |
Class A | | | | | | | 0 | | | | | | | | (1,523,233 | ) |
Class C | | | | | | | 0 | | | | | | | | (221,004 | ) |
Class R6 | | | | | | | 0 | | | | | | | | (333,506 | ) |
Institutional Class | | | | | | | 0 | | | | | | | | (8,076,528 | ) |
Investor Class | | | | | | | 0 | 1 | | | | | | | (2,166,037 | ) |
Net realized gains | | | | | | | | | | | | | | | | |
Class A | | | | | | | (147,582,801 | ) | | | | | | | (55,676,351 | ) |
Class B | | | | | | | (11,299 | ) | | | | | | | (47,217 | ) |
Class C | | | | | | | (12,940,580 | ) | | | | | | | (16,838,250 | ) |
Class R6 | | | | | | | (26,184,650 | ) | | | | | | | (7,568,540 | ) |
Administrator Class | | | | | | | (7,973,394 | ) | | | | | | | (15,392,983 | ) |
Institutional Class | | | | | | | (84,638,041 | ) | | | | | | | (192,333,937 | ) |
Investor Class | | | | | | | 0 | 1 | | | | | | | (90,968,444 | ) |
| | | | |
Total distributions to shareholders | | | | | | | (279,330,765 | ) | | | | | | | (391,146,030 | ) |
| | | | |
| | | | |
Capital share transactions | | | Shares | | | | | | | | Shares | | | | | |
Proceeds from shares sold | | | | | | | | | | | | | | | | |
Class A | | | 14,405,645 | | | | 371,383,963 | | | | 1,004,915 | | | | 32,650,378 | |
Class C | | | 213,694 | | | | 3,522,236 | | | | 208,610 | | | | 5,701,764 | |
Class R6 | | | 4,913,663 | | | | 136,781,653 | | | | 1,795,825 | | | | 62,081,868 | |
Administrator Class | | | 246,541 | | | | 5,884,855 | | | | 2,670,173 | | | | 93,659,025 | |
Institutional Class | | | 1,822,908 | | | | 45,991,897 | | | | 22,555,891 | | | | 768,995,626 | |
Investor Class | | | 341,179 | 1 | | | 9,252,444 | 1 | | | 1,134,358 | | | | 38,165,162 | |
| | | | |
| | | | | | | 572,817,048 | | | | | | | | 1,001,253,823 | |
| | | | |
Reinvestment of distributions | | | | | | | | | | | | | | | | |
Class A | | | 8,140,152 | | | | 144,569,098 | | | | 1,960,105 | | | | 54,762,197 | |
Class B | | | 791 | | | | 11,299 | | | | 1,945 | | | | 47,030 | |
Class C | | | 767,463 | | | | 10,936,351 | | | | 619,555 | | | | 14,985,444 | |
Class R6 | | | 1,410,811 | | | | 26,184,650 | | | | 274,897 | | | | 7,902,046 | |
Administrator Class | | | 392,943 | | | | 7,277,303 | | | | 510,536 | | | | 14,611,549 | |
Institutional Class | | | 4,322,403 | | | | 80,180,580 | | | | 3,727,964 | | | | 107,172,323 | |
Investor Class | | | 0 | 1 | | | 0 | 1 | | | 3,198,137 | | | | 91,570,270 | |
| | | | |
| | | | | | | 269,159,281 | | | | | | | | 291,050,859 | |
| | | | |
Payment for shares redeemed | | | | | | | | | | | | | | | | |
Class A | | | (9,636,099 | ) | | | (207,634,531 | ) | | | (4,847,855 | ) | | | (156,671,667 | ) |
Class B | | | (7,052 | ) | | | (145,392 | ) | | | (12,058 | ) | | | (350,936 | ) |
Class C | | | (2,155,888 | ) | | | (45,177,913 | ) | | | (728,251 | ) | | | (20,122,577 | ) |
Class R6 | | | (3,471,014 | ) | | | (92,765,963 | ) | | | (221,939 | ) | | | (7,157,233 | ) |
Administrator Class | | | (2,015,328 | ) | | | (51,849,956 | ) | | | (20,096,449 | ) | | | (705,338,775 | ) |
Institutional Class | | | (27,696,737 | ) | | | (767,867,077 | ) | | | (17,298,268 | ) | | | (567,191,934 | ) |
Investor Class | | | (17,354,006 | )1 | | | (466,375,638 | )1 | | | (8,864,914 | ) | | | (296,658,045 | ) |
| | | | |
| | | | | | | (1,631,816,470 | ) | | | | | | | (1,753,491,167 | ) |
| | | | |
Net decrease in net assets resulting from capital share transactions | | | | | | | (789,840,141 | ) | | | | | | | (461,186,485 | ) |
| | | | |
Total decrease in net assets | | | | | | | (1,118,386,619 | ) | | | | | | | (1,037,430,418 | ) |
| | | | |
| | | | |
Net assets | | | | | | | | | | | | | | | | |
Beginning of period | | | | | | | 1,995,254,419 | | | | | | | | 3,032,684,837 | |
| | | | |
End of period | | | | | | $ | 876,867,800 | | | | | | | $ | 1,995,254,419 | |
| | | | |
Overdistributed/accumulated net investment income (loss) | | | | | | $ | (2,315,780 | ) | | | | | | $ | (455,328 | ) |
| | | | |
| 1 | For the period from April 1, 2015 to October 23, 2015. Effective at the close of business on October 23, 2015, Investor Class shares were converted to Class A shares and are no longer offered by the Fund. |
The accompanying notes are an integral part of these financial statements.
| | | | | | |
| Financial highlights | | Wells Fargo Small Cap Value Fund | | | 17 | |
(For a share outstanding throughout each period)
| | | | | | | | | | | | | | | | | | | | | | | | |
| | | Year ended March 31 | | | Year ended October 31 | |
| CLASS A | | 2016 | | | 2015 | | | 20141 | | | 2013 | | | 2012 | | | 2011 | |
Net asset value, beginning of period | | | $27.51 | | | | $35.74 | | | | $36.33 | | | | $32.87 | | | | $29.56 | | | | $29.71 | |
Net investment income (loss) | | | (0.06 | )2 | | | 0.01 | 2 | | | 0.18 | | | | 0.23 | | | | 0.19 | | | | 0.16 | |
Net realized and unrealized gains (losses) on investments | | | (1.19 | ) | | | (2.55 | ) | | | 2.71 | | | | 4.68 | | | | 3.39 | | | | (0.11 | ) |
| | | | | | | | | | | | | | | | | | | | | | | | |
Total from investment operations | | | (1.25 | ) | | | (2.54 | ) | | | 2.89 | | | | 4.91 | | | | 3.58 | | | | 0.05 | |
Distributions to shareholders from | | | | | | | | | | | | | | | | | | | | | | | | |
Net investment income | | | 0.00 | | | | (0.13 | ) | | | (0.11 | ) | | | (0.24 | ) | | | (0.12 | ) | | | (0.20 | ) |
Net realized gains | | | (7.42 | ) | | | (5.56 | ) | | | (3.37 | ) | | | (1.21 | ) | | | (0.15 | ) | | | 0.00 | |
| | | | | | | | | | | | | | | | | | | | | | | | |
Total distributions to shareholders | | | (7.42 | ) | | | (5.69 | ) | | | (3.48 | ) | | | (1.45 | ) | | | (0.27 | ) | | | (0.20 | ) |
Net asset value, end of period | | | $18.84 | | | | $27.51 | | | | $35.74 | | | | $36.33 | | | | $32.87 | | | | $29.56 | |
Total return3 | | | (2.90 | )% | | | (7.29 | )% | | | 8.87 | % | | | 15.67 | % | | | 12.22 | % | | | 0.11 | % |
Ratios to average net assets (annualized) | | | | | | | | | | | | | | | | | | | | | | | | |
Gross expenses | | | 1.36 | % | | | 1.35 | % | | | 1.33 | % | | | 1.33 | % | | | 1.34 | % | | | 1.32 | % |
Net expenses | | | 1.28 | % | | | 1.29 | % | | | 1.30 | % | | | 1.30 | % | | | 1.30 | % | | | 1.30 | % |
Net investment income (loss) | | | (0.27 | )% | | | 0.02 | % | | | 1.26 | % | | | 0.72 | % | | | 0.61 | % | | | 0.50 | % |
Supplemental data | | | | | | | | | | | | | | | | | | | | | | | | |
Portfolio turnover rate | | | 16 | % | | | 9 | % | | | 7 | % | | | 18 | % | | | 16 | % | | | 17 | % |
Net assets, end of period (000s omitted) | | | $441,679 | | | | $289,669 | | | | $443,671 | | | | $482,677 | | | | $603,622 | | | | $596,741 | |
| 1 | For the five months ended March 31, 2014. The Fund changed its fiscal year end from October 31 to March 31, effective March 31, 2014. |
| 2 | Calculated based upon average shares outstanding |
| 3 | Total return calculations do not include any sales charges. Returns for periods of less than one year are not annualized. |
The accompanying notes are an integral part of these financial statements.
| | | | |
| 18 | | Wells Fargo Small Cap Value Fund | | Financial highlights |
(For a share outstanding throughout each period)
| | | | | | | | | | | | | | | | | | | | | | | | |
| | | Year ended March 31 | | | Year ended October 31 | |
| CLASS B | | 2016 | | | 2015 | | | 20141 | | | 2013 | | | 2012 | | | 2011 | |
Net asset value, beginning of period | | | $23.84 | | | | $31.87 | | | | $32.75 | | | | $29.74 | | | | $26.85 | | | | $27.02 | |
Net investment income (loss) | | | (0.28 | )2 | | | (0.25 | )2 | | | 0.06 | 2 | | | 0.01 | 2 | | | (0.03 | )2 | | | (0.16 | )2 |
Net realized and unrealized gains (losses) on investments | | | (1.01 | ) | | | (2.22 | ) | | | 2.43 | | | | 4.21 | | | | 3.07 | | | | (0.01 | ) |
| | | | | | | | | | | | | | | | | | | | | | | | |
Total from investment operations | | | (1.29 | ) | | | (2.47 | ) | | | 2.49 | | | | 4.22 | | | | 3.04 | | | | (0.17 | ) |
Distributions to shareholders from | | | | | | | | | | | | | | | | | | | | | | | | |
Net realized gains | | | (7.42 | ) | | | (5.56 | ) | | | (3.37 | ) | | | (1.21 | ) | | | (0.15 | ) | | | 0.00 | |
Net asset value, end of period | | | $15.13 | | | | $23.84 | | | | $31.87 | | | | $32.75 | | | | $29.74 | | | | $26.85 | |
Total return3 | | | (3.58 | )% | | | (8.01 | )% | | | 8.53 | % | | | 14.86 | % | | | 11.37 | % | | | (0.63 | )% |
Ratios to average net assets (annualized) | | | | | | | | | | | | | | | | | | | | | | | | |
Gross expenses | | | 2.11 | % | | | 2.10 | % | | | 2.08 | % | | | 2.06 | % | | | 2.08 | % | | | 2.06 | % |
Net expenses | | | 2.03 | % | | | 2.04 | % | | | 2.05 | % | | | 2.03 | % | | | 2.05 | % | | | 2.04 | % |
Net investment income (loss) | | | (1.26 | )% | | | (0.83 | )% | | | 0.50 | % | | | 0.02 | % | | | (0.12 | )% | | | (0.57 | )% |
Supplemental data | | | | | | | | | | | | | | | | | | | | | | | | |
Portfolio turnover rate | | | 16 | % | | | 9 | % | | | 7 | % | | | 18 | % | | | 16 | % | | | 17 | % |
Net assets, end of period (000s omitted) | | | $4 | | | | $156 | | | | $531 | | | | $647 | | | | $1,310 | | | | $3,928 | |
| 1 | For the five months ended March 31, 2014. The Fund changed its fiscal year end from October 31 to March 31, effective March 31, 2014. |
| 2 | Calculated based upon average shares outstanding |
| 3 | Total return calculations do not include any sales charges. Returns for periods of less than one year are not annualized. |
The accompanying notes are an integral part of these financial statements.
| | | | | | |
| Financial highlights | | Wells Fargo Small Cap Value Fund | | | 19 | |
(For a share outstanding throughout each period)
| | | | | | | | | | | | | | | | | | | | | | | | |
| | | Year ended March 31 | | | Year ended October 31 | |
| CLASS C | | 2016 | | | 2015 | | | 20141 | | | 2013 | | | 2012 | | | 2011 | |
Net asset value, beginning of period | | | $23.80 | | | | $31.89 | | | | $32.77 | | | | $29.82 | | | | $26.92 | | | | $27.11 | |
Net investment income (loss) | | | (0.24 | )2 | | | (0.20 | )2 | | | 0.07 | 2 | | | (0.02 | )2 | | | (0.04 | )2 | | | (0.07 | )2 |
Net realized and unrealized gains (losses) on investments | | | (1.05 | ) | | | (2.27 | ) | | | 2.42 | | | | 4.23 | | | | 3.09 | | | | (0.10 | ) |
| | | | | | | | | | | | | | | | | | | | | | | | |
Total from investment operations | | | (1.29 | ) | | | (2.47 | ) | | | 2.49 | | | | 4.21 | | | | 3.05 | | | | (0.17 | ) |
Distributions to shareholders from | | | | | | | | | | | | | | | | | | | | | | | | |
Net investment income | | | 0.00 | | | | (0.06 | ) | | | 0.00 | | | | (0.05 | ) | | | 0.00 | | | | (0.02 | ) |
Net realized gains | | | (7.42 | ) | | | (5.56 | ) | | | (3.37 | ) | | | (1.21 | ) | | | (0.15 | ) | | | 0.00 | |
| | | | | | | | | | | | | | | | | | | | | | | | |
Total distributions to shareholders | | | (7.42 | ) | | | (5.62 | ) | | | (3.37 | ) | | | (1.26 | ) | | | (0.15 | ) | | | (0.02 | ) |
Net asset value, end of period | | | $15.09 | | | | $23.80 | | | | $31.89 | | | | $32.77 | | | | $29.82 | | | | $26.92 | |
Total return3 | | | (3.58 | )% | | | (8.00 | )% | | | 8.53 | % | | | 14.80 | % | | | 11.38 | % | | | (0.62 | )% |
Ratios to average net assets (annualized) | | | | | | | | | | | | | | | | | | | | | | | | |
Gross expenses | | | 2.11 | % | | | 2.10 | % | | | 2.08 | % | | | 2.08 | % | | | 2.09 | % | | | 2.07 | % |
Net expenses | | | 2.03 | % | | | 2.04 | % | | | 2.05 | % | | | 2.05 | % | | | 2.05 | % | | | 2.05 | % |
Net investment income (loss) | | | (1.18 | )% | | | (0.70 | )% | | | 0.52 | % | | | (0.06 | )% | | | (0.14 | )% | | | (0.24 | )% |
Supplemental data | | | | | | | | | | | | | | | | | | | | | | | | |
Portfolio turnover rate | | | 16 | % | | | 9 | % | | | 7 | % | | | 18 | % | | | 16 | % | | | 17 | % |
Net assets, end of period (000s omitted) | | | $33,601 | | | | $80,969 | | | | $105,309 | | | | $105,491 | | | | $102,663 | | | | $100,032 | |
| 1 | For the five months ended March 31, 2014. The Fund changed its fiscal year end from October 31 to March 31, effective March 31, 2014. |
| 2 | Calculated based upon average shares outstanding |
| 3 | Total return calculations do not include any sales charges. Returns for periods of less than one year are not annualized. |
The accompanying notes are an integral part of these financial statements.
| | | | |
| 20 | | Wells Fargo Small Cap Value Fund | | Financial highlights |
(For a share outstanding throughout each period)
| | | | | | | | | | | | | | | | |
| | | Year ended March 31 | | | Year ended October 31, 20132 | |
| CLASS R6 | | 2016 | | | 2015 | | | 20141 | | |
Net asset value, beginning of period | | | $28.29 | | | | $36.52 | | | | $37.13 | | | | $33.69 | |
Net investment income | | | 0.03 | 3 | | | 0.23 | 3 | | | 0.35 | | | | 0.07 | 3 |
Net realized and unrealized gains (losses) on investments | | | (1.18 | ) | | | (2.69 | ) | | | 2.67 | | | | 3.37 | |
| | | | | | | | | | | | | | | | |
Total from investment operations | | | (1.15 | ) | | | (2.46 | ) | | | 3.02 | | | | 3.44 | |
Distributions to shareholders from | | | | | | | | | | | | | | | | |
Net investment income | | | 0.00 | | | | (0.21 | ) | | | (0.26 | ) | | | 0.00 | |
Net realized gains | | | (7.42 | ) | | | (5.56 | ) | | | (3.37 | ) | | | 0.00 | |
| | | | | | | | | | | | | | | | |
Total distributions to shareholders | | | (7.42 | ) | | | (5.77 | ) | | | (3.63 | ) | | | 0.00 | |
Net asset value, end of period | | | $19.72 | | | | $28.29 | | | | $36.52 | | | | $37.13 | |
Total return4 | | | (2.43 | )% | | | (6.90 | )% | | | 9.07 | % | | | 10.21 | % |
Ratios to average net assets (annualized) | | | | | | | | | | | | | | | | |
Gross expenses | | | 0.92 | % | | | 0.87 | % | | | 0.85 | % | | | 0.85 | % |
Net expenses | | | 0.83 | % | | | 0.83 | % | | | 0.85 | % | | | 0.85 | % |
Net investment income | | | 0.12 | % | | | 0.72 | % | | | 2.82 | % | | | 0.60 | % |
Supplemental data | | | | | | | | | | | | | | | | |
Portfolio turnover rate | | | 16 | % | | | 9 | % | | | 7 | % | | | 18 | % |
Net assets, end of period (000s omitted) | | | $92,929 | | | | $52,613 | | | | $398 | | | | $28 | |
| 1 | For the five months ended March 31, 2014. The Fund changed its fiscal year end from October 31 to March 31, effective March 31, 2014. |
| 2 | For the period from June 28, 2013 (commencement of class operations) to October 31, 2013. |
| 3 | Calculated based upon average shares outstanding |
| 4 | Total return calculations do not include any sales charges. |
The accompanying notes are an integral part of these financial statements.
| | | | | | |
| Financial highlights | | Wells Fargo Small Cap Value Fund | | | 21 | |
(For a share outstanding throughout each period)
| | | | | | | | | | | | | | | | | | | | | | | | |
| | | Year ended March 31 | | | Year ended October 31 | |
| ADMINISTRATOR CLASS | | 2016 | | | 2015 | | | 20141 | | | 2013 | | | 2012 | | | 2011 | |
Net asset value, beginning of period | | | $28.30 | | | | $36.40 | | | | $36.98 | | | | $33.45 | | | | $30.12 | | | | $30.32 | |
Net investment income (loss) | | | (0.06 | )2 | | | 0.01 | 2 | | | 0.21 | | | | 0.31 | | | | 0.25 | 2 | | | 0.29 | 2 |
Net realized and unrealized gains (losses) on investments | | | (1.16 | ) | | | (2.55 | ) | | | 2.77 | | | | 4.75 | | | | 3.44 | | | | (0.17 | ) |
| | | | | | | | | | | | | | | | | | | | | | | | |
Total from investment operations | | | (1.22 | ) | | | (2.54 | ) | | | 2.98 | | | | 5.06 | | | | 3.69 | | | | 0.12 | |
Distributions to shareholders from | | | | | | | | | | | | | | | | | | | | | | | | |
Net investment income | | | 0.00 | | | | 0.00 | | | | (0.19 | ) | | | (0.32 | ) | | | (0.21 | ) | | | (0.32 | ) |
Net realized gains | | | (7.42 | ) | | | (5.56 | ) | | | (3.37 | ) | | | (1.21 | ) | | | (0.15 | ) | | | 0.00 | |
| | | | | | | | | | | | | | | | | | | | | | | | |
Total distributions to shareholders | | | (7.42 | ) | | | (5.56 | ) | | | (3.56 | ) | | | (1.53 | ) | | | (0.36 | ) | | | (0.32 | ) |
Net asset value, end of period | | | $19.66 | | | | $28.30 | | | | $36.40 | | | | $36.98 | | | | $33.45 | | | | $30.12 | |
Total return3 | | | (2.70 | )% | | | (7.16 | )% | | | 8.97 | % | | | 15.92 | % | | | 12.42 | % | | | 0.32 | % |
Ratios to average net assets (annualized) | | | | | | | | | | | | | | | | | | | | | | | | |
Gross expenses | | | 1.25 | % | | | 1.19 | % | | | 1.17 | % | | | 1.17 | % | | | 1.17 | % | | | 1.15 | % |
Net expenses | | | 1.08 | % | | | 1.09 | % | | | 1.10 | % | | | 1.10 | % | | | 1.10 | % | | | 1.10 | % |
Net investment income (loss) | | | (0.24 | )% | | | 0.03 | % | | | 1.48 | % | | | 0.87 | % | | | 0.80 | % | | | 0.91 | % |
Supplemental data | | | | | | | | | | | | | | | | | | | | | | | | |
Portfolio turnover rate | | | 16 | % | | | 9 | % | | | 7 | % | | | 18 | % | | | 16 | % | | | 17 | % |
Net assets, end of period (000s omitted) | | | $24,927 | | | | $74,820 | | | | $711,869 | | | | $666,812 | | | | $543,683 | | | | $390,266 | |
| 1 | For the five months ended March 31, 2014. The Fund changed its fiscal year end from October 31 to March 31, effective March 31, 2014. |
| 2 | Calculated based upon average shares outstanding |
| 3 | Returns for periods of less than one year are not annualized. |
The accompanying notes are an integral part of these financial statements.
| | | | |
| 22 | | Wells Fargo Small Cap Value Fund | | Financial highlights |
(For a share outstanding throughout each period)
| | | | | | | | | | | | | | | | | | | | | | | | |
| | | Year ended March 31 | | | Year ended October 31 | |
| INSTITUTIONAL CLASS | | 2016 | | | 2015 | | | 20141 | | | 2013 | | | 2012 | | | 2011 | |
Net asset value, beginning of period | | | $28.29 | | | | $36.53 | | | | $37.12 | | | | $33.56 | | | | $30.21 | | | | $30.33 | |
Net investment income (loss) | | | (0.01 | )2 | | | 0.17 | 2 | | | 0.26 | | | | 0.38 | 2 | | | 0.34 | | | | 0.31 | |
Net realized and unrealized gains (losses) on investments | | | (1.15 | ) | | | (2.65 | ) | | | 2.76 | | | | 4.76 | | | | 3.42 | | | | (0.12 | ) |
| | | | | | | | | | | | | | | | | | | | | | | | |
Total from investment operations | | | (1.16 | ) | | | (2.48 | ) | | | 3.02 | | | | 5.14 | | | | 3.76 | | | | 0.19 | |
Distributions to shareholders from | | | | | | | | | | | | | | | | | | | | | | | | |
Net investment income | | | 0.00 | | | | (0.20 | ) | | | (0.24 | ) | | | (0.37 | ) | | | (0.26 | ) | | | (0.31 | ) |
Net realized gains | | | (7.42 | ) | | | (5.56 | ) | | | (3.37 | ) | | | (1.21 | ) | | | (0.15 | ) | | | 0.00 | |
| | | | | | | | | | | | | | | | | | | | | | | | |
Total distributions to shareholders | | | (7.42 | ) | | | (5.76 | ) | | | (3.61 | ) | | | (1.58 | ) | | | (0.41 | ) | | | (0.31 | ) |
Net asset value, end of period | | | $19.71 | | | | $28.29 | | | | $36.53 | | | | $37.12 | | | | $33.56 | | | | $30.21 | |
Total return3 | | | (2.46 | )% | | | (6.95 | )% | | | 9.05 | % | | | 16.15 | % | | | 12.68 | % | | | 0.52 | % |
Ratios to average net assets (annualized) | | | | | | | | | | | | | | | | | | | | | | | | |
Gross expenses | | | 0.99 | % | | | 0.92 | % | | | 0.90 | % | | | 0.90 | % | | | 0.91 | % | | | 0.89 | % |
Net expenses | | | 0.88 | % | | | 0.89 | % | | | 0.90 | % | | | 0.90 | % | | | 0.90 | % | | | 0.89 | % |
Net investment income (loss) | | | (0.03 | )% | | | 0.52 | % | | | 1.66 | % | | | 1.08 | % | | | 1.01 | % | | | 0.97 | % |
Supplemental data | | | | | | | | | | | | | | | | | | | | | | | | |
Portfolio turnover rate | | | 16 | % | | | 9 | % | | | 7 | % | | | 18 | % | | | 16 | % | | | 17 | % |
Net assets, end of period (000s omitted) | | | $283,728 | | | | $1,017,115 | | | | $984,881 | | | | $1,081,869 | | | | $1,143,730 | | | | $1,073,943 | |
| 1 | For the five months ended March 31, 2014. The Fund changed its fiscal year end from October 31 to March 31, effective March 31, 2014. |
| 2 | Calculated based upon average shares outstanding |
| 3 | Returns for periods of less than one year are not annualized. |
The accompanying notes are an integral part of these financial statements.
| | | | | | |
| Notes to financial statements | | Wells Fargo Small Cap Value Fund | | | 23 | |
1. ORGANIZATION
Wells Fargo Funds Trust (the “Trust”), a Delaware statutory trust organized on March 10, 1999, is an open-end management investment company registered under the Investment Company Act of 1940, as amended (the “1940 Act”). As an investment company, the Trust follows the accounting and reporting guidance in Financial Accounting Standards Board (“FASB”) Accounting Standards Codification Topic 946, Financial Services – Investment Companies. These financial statements report on the Wells Fargo Small Cap Value Fund (the “Fund”) which is a diversified series of the Trust.
Effective at the close of business on October 23, 2015, Investor Class shares became Class A shares in a tax-free conversion. Shareholders of Investor Class received Class A shares at a value equal to the value of their Investor Class shares immediately prior to the conversion. Investor Class shares are no longer offered by the Fund.
2. SIGNIFICANT ACCOUNTING POLICIES
The following significant accounting policies, which are consistently followed in the preparation of the financial statements of the Fund, are in conformity with U.S. generally accepted accounting principles which require management to make estimates and assumptions that affect the reported amounts of assets and liabilities, disclosure of contingent assets and liabilities at the date of the financial statements, and the reported amounts of revenues and expenses during the reporting period. Actual results could differ from those estimates.
Securities valuation
All investments are valued each business day as of the close of regular trading on the New York Stock Exchange (generally 4 p.m. Eastern Time), although the Fund may deviate from this calculation time under unusual or unexpected circumstances.
Equity securities and options that are listed on a foreign or domestic exchange or market are valued at the official closing price or, if none, the last sales price. If no sale occurs on the principal exchange or market that day, the prior day’s price will be deemed “stale” and a fair value price will be determined in accordance with the Fund’s Valuation Procedures.
Non-listed options are valued at the evaluated price provided by an independent pricing service or, if a reliable price is not available, the quoted bit price from and independent broker-dealer.
The values of securities denominated in foreign currencies are translated into U.S. dollars at rates provided by an independent foreign currency pricing source at a time each business day specified by the Management Valuation Team of Wells Fargo Funds Management, LLC (“Funds Management”).
Many securities markets and exchanges outside the U.S. close prior to the close of the New York Stock Exchange and therefore may not fully reflect trading or events that occur after the close of the principal exchange in which the foreign securities are traded, but before the close of the New York Stock Exchange. If such trading or events are expected to materially affect the value of such securities, then fair value pricing procedures approved by the Board of Trustees of the Fund are applied. These procedures take into account multiple factors including movements in U.S. securities markets after foreign exchanges close. Foreign securities that are fair valued under these procedures are categorized as Level 2 and the application of these procedures may result in transfers between Level 1 and Level 2. Depending on market activity, such fair valuations may be frequent. Such fair value pricing may result in net asset values that are higher or lower than net asset values based on the last reported sales price or latest quoted bid price. On March 31, 2016, such fair value pricing was not used in pricing foreign securities.
Investments in registered open-end investment companies are valued at net asset value.
Investments which are not valued using any of the methods discussed above are valued at their fair value, as determined in good faith by the Board of Trustees of the Fund. The Board of Trustees has established a Valuation Committee comprised of the Trustees and has delegated to it the authority to take any actions regarding the valuation of portfolio securities that the Valuation Committee deems necessary or appropriate, including determining the fair value of portfolio securities, unless the determination has been delegated to the Management Valuation Team. The Board of Trustees retains the authority to make or ratify any valuation decisions or approve any changes to the Valuation Procedures as it deems appropriate. On a quarterly basis, the Board of Trustees receives reports on any valuation actions taken by the Valuation Committee or the Management Valuation Team which may include items for ratification.
Valuations of fair valued securities are compared to the next actual sales price when available, or other appropriate market values, to assess the continued appropriateness of the fair valuation methodologies used. These securities are fair valued on a day-to-day basis, taking into consideration changes to appropriate market information and any significant changes to the inputs considered in the valuation process until there is a readily available price provided on an exchange
| | | | |
| 24 | | Wells Fargo Small Cap Value Fund | | Notes to financial statements |
or by an independent pricing service. Valuations received from an independent pricing service or independent broker-dealer quotes are periodically validated by comparisons to most recent trades and valuations provided by other independent pricing services in addition to the review of prices by the manager and/or subadviser. Unobservable inputs used in determining fair valuations are identified based on the type of security, taking into consideration factors utilized by market participants in valuing the investment, knowledge about the issuer and the current market environment.
Foreign currency translation
The accounting records of the Fund are maintained in U.S. dollars. The values of other assets and liabilities denominated in foreign currencies are translated into U.S. dollars at rates provided by an independent foreign currency pricing source at a time each business day specified by the Management Valuation Team. Purchases and sales of securities, and income and expenses are converted at the rate of exchange on the respective dates of such transactions. Net realized foreign exchange gains or losses arise from sales of foreign currencies, currency gains or losses realized between the trade and settlement dates on securities transactions, and the difference between the amounts of dividends, interest and foreign withholding taxes recorded and the U.S. dollar equivalent of the amounts actually paid or received. Net unrealized foreign exchange gains and losses arise from changes in the fair value of assets and liabilities other than investments in securities resulting from changes in exchange rates. The changes in net assets arising from changes in exchange rates and the changes in net assets resulting from changes in market prices of securities are not separately presented. Such changes are included in net realized and unrealized gains or losses from investments.
Options
The Fund is subject to equity price risk in the normal course of pursuing its investment objectives. The Fund may write covered call options or secured put options on individual securities and/or indexes. When the Fund writes an option, an amount equal to the premium received is recorded as a liability and is subsequently adjusted to the current market value of the written option. Premiums received from written options that expire unexercised are recognized as realized gains on the expiration date. For exercised options, the difference between the premium received and the amount paid on effecting a closing purchase transaction, including brokerage commissions, is treated as a realized gain or loss. If a call option is exercised, the premium is added to the proceeds from the sale of the underlying security in calculating the realized gain or loss on the sale. If a put option is exercised, the premium reduces the cost of the security purchased. The Fund, as a writer of an option, bears the market risk of an unfavorable change in the price of the security and/or index underlying the written option.
The Fund may also purchase call or put options. The premium is included in the Statement of Assets and Liabilities as an investment, the value of which is subsequently adjusted based on the current market value of the option. Premiums paid for purchased options that expire are recognized as realized losses on the expiration date. Premiums paid for purchased options that are exercised or closed are added to the amount paid or offset against the proceeds received for the underlying security to determine the realized gain or loss. The risk of loss associated with purchased options is limited to the premium paid.
Options traded on an exchange are regulated and terms of the options are standardized. Purchased options traded over-the-counter expose the Fund to counterparty risk in the event the counterparty does not perform. This risk can be mitigated by having a master netting arrangement between the Fund and the counterparty and by having the counterparty post collateral to cover the Fund’s exposure to the counterparty.
Security transactions and income recognition
Securities transactions are recorded on a trade date basis. Realized gains or losses are recorded on the basis of identified cost.
Dividend income is recognized on the ex-dividend date, except for certain dividends from foreign securities, which are recorded as soon as the custodian verifies the ex-dividend date. Dividend income from foreign securities is recorded net of foreign taxes withheld where recovery of such taxes is not assured.
Distributions to shareholders
Distributions to shareholders from net investment income and net realized gains, if any, are recorded on the ex-dividend date. Such distributions are determined in conformity with federal income tax regulations, which may differ in amount or character from net investment income and realized gains recognized for purposes of U.S. generally accepted accounting principles.
| | | | | | |
| Notes to financial statements | | Wells Fargo Small Cap Value Fund | | | 25 | |
Federal and other taxes
The Fund intends to continue to qualify as a regulated investment company by distributing substantially all of its investment company taxable income and any net realized capital gains (after reduction for capital loss carryforwards) sufficient to relieve it from all, or substantially all, federal income taxes. Accordingly, no provision for federal income taxes was required.
The Fund’s income and federal excise tax returns and all financial records supporting those returns for the prior three fiscal years are subject to examination by the federal and Delaware revenue authorities. Management has analyzed the Fund’s tax positions taken on federal, state, and foreign tax returns for all open tax years and does not believe that there are any uncertain tax positions that require recognition of a tax liability.
Reclassifications are made to the Fund’s capital accounts for permanent tax differences to reflect income and gains available for distribution (or available capital loss carryforwards) under federal income tax regulations. U.S. generally accepted accounting principles require that certain components of net assets be adjusted to reflect permanent differences between financial and tax reporting. These reclassifications have no effect on net assets or net asset values per share. The primary permanent differences causing such reclassifications are due to dividends from certain securities, net operating losses, and passive foreign investment companies. At March 31, 2016, as a result of permanent book-to-tax differences, the following reclassification adjustments were made on the Statement of Assets and Liabilities:
| | | | |
| Paid-in capital | | Accumulated net
investment loss | | Accumulated net
realized gains
on investments |
| $(1,477,934) | | $1,146,743 | | $331,191 |
Class allocations
The separate classes of shares offered by the Fund differ principally in applicable sales charges, distribution, shareholder servicing, and administration fees. Class specific expenses are charged directly to that share class. Investment income, common expenses, and realized and unrealized gains (losses) on investments are allocated daily to each class of shares based on the relative proportion of net assets of each class.
3. FAIR VALUATION MEASUREMENTS
Fair value measurements of investments are determined within a framework that has established a fair value hierarchy based upon the various data inputs utilized in determining the value of the Fund’s investments. The three-level hierarchy gives the highest priority to unadjusted quoted prices in active markets for identical assets or liabilities (Level 1) and the lowest priority to significant unobservable inputs (Level 3). The Fund’s investments are classified within the fair value hierarchy based on the lowest level of input that is significant to the fair value measurement. The inputs are summarized into three broad levels as follows:
| n | | Level 1 – quoted prices in active markets for identical securities |
| n | | Level 2 – other significant observable inputs (including quoted prices for similar securities, interest rates, prepayment speeds, credit risk, use of amortized cost, etc.) |
| n | | Level 3 – significant unobservable inputs (including the Fund’s own assumptions in determining the fair value of investments) |
The inputs or methodologies used for valuing investments in securities are not necessarily an indication of the risk associated with investing in those securities.
| | | | |
| 26 | | Wells Fargo Small Cap Value Fund | | Notes to financial statements |
The following is a summary of the inputs used in valuing the Fund’s assets and liabilities as of March 31, 2016:
| | | | | | | | | | | | | | | | |
| | | Quoted prices
(Level 1) | | | Other significant
observable inputs
(Level 2) | | | Significant
unobservable inputs (Level 3) | | | Total | |
Assets | | | | | | | | | | | | | | | | |
Investments in: | | | | | | | | | | | | | | | | |
| | | | |
Common stocks | | | | | | | | | | | | | | | | |
Consumer discretionary | | $ | 161,189,713 | | | $ | 0 | | | $ | 0 | | | $ | 161,189,713 | |
Energy | | | 74,951,290 | | | | 3,104,006 | | | | 0 | | | | 78,055,296 | |
Financials | | | 179,119,495 | | | | 0 | | | | 0 | | | | 179,119,495 | |
Health care | | | 64,591,953 | | | | 0 | | | | 0 | | | | 64,591,953 | |
Industrials | | | 98,990,199 | | | | 0 | | | | 0 | | | | 98,990,199 | |
Information technology | | | 131,523,612 | | | | 0 | | | | 0 | | | | 131,523,612 | |
Materials | | | 103,454,519 | | | | 5,011,325 | | | | 0 | | | | 108,465,844 | |
Telecommunication services | | | 23,677,435 | | | | 0 | | | | 0 | | | | 23,677,435 | |
| | | | |
Exchange-traded funds | | | 14,918,553 | | | | 0 | | | | 0 | | | | 14,918,553 | |
| | | | |
Short-term investments | | | | | | | | | | | | | | | | |
Investment companies | | | 14,417,507 | | | | 0 | | | | 0 | | | | 14,417,507 | |
Total assets | | $ | 866,834,276 | | | $ | 8,115,331 | | | $ | 0 | | | $ | 874,949,607 | |
The Fund recognizes transfers between levels within the fair value hierarchy at the end of the reporting period. At March 31, 2016, the Fund did not have any transfers into/out of Level 1, Level 2, or Level 3.
4. TRANSACTIONS WITH AFFILIATES
Management fee
Funds Management, an indirect wholly owned subsidiary of Wells Fargo & Company (“Wells Fargo”), is the manager of the Fund and provides advisory and fund-level administrative services under an investment management agreement. Under the investment management agreement, Funds Management is responsible for, among other services, implementing the investment objectives and strategies of the Fund, supervising the applicable subadviser, providing fund-level administrative services in connection with the Fund’s operations, and providing any other fund-level administrative services reasonably necessary for the operation of the Fund. As compensation for its services under the investment management agreement, Funds Management is entitled to receive an annual management fee starting at 0.85% and declining to 0.71% as the average daily net assets of the Fund increase.
Prior to July 1, 2015, Funds Management provided advisory services pursuant to an investment advisory agreement and was entitled to receive an annual fee which started at 0.80% and declined to 0.68% as the average daily net assets of the Fund increased. In addition, fund-level administrative services were provided by Funds Management under a separate administration agreement at an annual fee which started at 0.05% and declined to 0.03% as the average daily net assets of the Fund increased. For financial statement purposes, the advisory fee and fund-level administration fee for the year ended March 31, 2016 have been included in management fee on the Statement of Operations.
For the year ended March 31, 2016, the management fee was equivalent to an annual rate of 0.83% of the Fund’s average daily net assets.
Funds Management has retained the services of a subadviser to provide daily portfolio management to the Fund. The fee for subadvisory services is borne by Funds Management. Wells Capital Management Incorporated, an affiliate of Funds Management and an indirect wholly owned subsidiary of Wells Fargo, is the subadviser to the Fund and is entitled to receive a fee from Funds Management at an annual rate starting at 0.55% and declining to 0.40% as the average daily net assets of the Fund increase.
Administration fees
Under a class-level administration agreement, Funds Management provides class-level administrative services to the Fund, which includes paying fees and expenses for services provided by the transfer agent, sub-transfer agents, omnibus
| | | | | | |
| Notes to financial statements | | Wells Fargo Small Cap Value Fund | | | 27 | |
account servicers and record-keepers. As compensation for its services under the class-level administration agreement, Funds Management receives an annual fee which is calculated based on the average daily net assets of each class as follows:
| | | | | | | | |
| | | Class-level administration fee | |
| | | Current rate | | | Rate prior to
July 1, 2015 | |
Class A, Class B, Class C | | | 0.21 | % | | | 0.26 | % |
Class R6 | | | 0.03 | | | | 0.03 | |
Administrator Class | | | 0.13 | | | | 0.10 | |
Institutional Class | | | 0.13 | | | | 0.08 | |
Investor Class | | | 0.32 | | | | 0.32 | |
Funds Management has contractually waived and/or reimbursed management and administration fees to the extent necessary to maintain certain net operating expense ratios for the Fund. Waiver of fees and/or reimbursement of expenses by Funds Management were made first from fund level expenses on a proportionate basis and then from class specific expenses. Funds Management has committed through July 31, 2016 to waive fees and/or reimburse expenses to the extent necessary to cap the Fund’s expenses at 1.28% for Class A shares, 2.03% for Class B shares, 2.03% for Class C shares, 0.83% for Class R6 shares, 1.08% for Administrator Class shares, and 0.88% for Institutional Class shares. After this time, the cap may be increased or the commitment to maintain the cap may be terminated only with the approval of the Board of Trustees.
Distribution fees
The Trust has adopted a distribution plan for Class B and Class C shares of the Fund pursuant to Rule 12b-1 under the 1940 Act. Distribution fees are charged to Class B and Class C shares and paid to Wells Fargo Funds Distributor, LLC (“Funds Distributor”), the principal underwriter, at an annual rate of 0.75% of the average daily net assets of Class B and Class C shares.
In addition, Funds Distributor is entitled to receive the front-end sales charge from the purchase of Class A shares and a contingent deferred sales charge on the redemption of certain Class A shares. Funds Distributor is also entitled to receive the contingent deferred sales charges from redemptions of Class B and Class C shares. For the year ended March 31, 2016, Funds Distributor received $1,553 from the sale of Class A shares and $179 in contingent deferred sales charges from redemptions of Class C shares.
Shareholder servicing fees
The Trust has entered into contracts with one or more shareholder servicing agents, whereby Class A, Class B, Class C, Administrator Class, and Investor Class of the Fund are charged a fee at an annual rate of 0.25% of the average daily net assets of each respective class.
A portion of these total shareholder servicing fees were paid to affiliates of Wells Fargo.
5. INVESTMENT PORTFOLIO TRANSACTIONS
Purchases and sales of investments, excluding U.S. government obligations (if any) and short-term securities, for the year ended March 31, 2016 were $179,654,228 and $832,867,516, respectively.
| | | | |
| 28 | | Wells Fargo Small Cap Value Fund | | Notes to financial statements |
6. INVESTMENTS IN AFFILIATES
An affiliated investment is a company which is under common ownership or control of the Fund or which the Fund has ownership of at least 5% of the outstanding voting shares. The following is a summary of transactions for the long-term holdings of issuers that were either affiliates of the Fund at the beginning of the period or the end of the period.
| | | | | | | | | | | | | | | | | | | | | | | | | | | | |
| | | Shares,
beginning
of period | | | Shares
purchased | | | Shares
sold | | | Shares, end of period | | | Value, end of period | | | Income from
affiliated securities | | | Realized gains (losses) | |
Allied Healthcare Products Incorporated | | | 780,500 | | | | 26,000 | | | | 217,900 | | | | 588,600 | | | $ | 411,961 | | | $ | 0 | | | $ | (325,472 | ) |
Cavco Industries Incorporated | | | 635,300 | | | | 31,900 | | | | 79,400 | | | | 587,800 | | | | 54,935,788 | | | | 0 | | | | 1,843,337 | |
Century Casinos Incorporated | | | 1,220,300 | | | | 309,300 | | | | 53,100 | | | | 1,476,500 | | | | 9,095,240 | | | | 0 | | | | (23,411 | ) |
Cross Country Healthcare Incorporated* | | | 1,640,500 | | | | 129,949 | | | | 443,601 | | | | 1,326,848 | | | | 15,431,242 | | | | 0 | | | | (1,391,638 | ) |
lnterOil Corporation* | | | 3,601,700 | | | | 183,600 | | | | 1,940,900 | | | | 1,844,400 | | | | 58,707,252 | | | | 0 | | | | 30,440,724 | |
Medley Management Incorporated Class A | | | 753,200 | | | | 24,404 | | | | 88,504 | | | | 689,100 | | | | 3,790,050 | | | | 574,559 | | | | (621,385 | ) |
OraSure Technologies Incorporated* | | | 4,218,600 | | | | 0 | | | | 1,542,800 | | | | 2,675,800 | | | | 19,346,034 | | | | 0 | | | | (3,605,701 | ) |
Skyline Corporation | | | 550,900 | | | | 75,300 | | | | 0 | | | | 626,200 | | | | 5,804,874 | | | | 0 | | | | 0 | |
Webco Industries Incorporated | | | 81,000 | | | | 0 | | | | 25,600 | | | | 55,400 | | | | 2,221,540 | | | | 0 | | | | (1,054,767 | ) |
| | | | | | | | | | | | | | | | | | | | | | | $ | 574,559 | | | $ | 25,261,687 | |
| * | No longer an affiliate of the Fund at the end of the period. |
7. BANK BORROWINGS
The Trust (excluding the money market funds and certain other funds) and Wells Fargo Variable Trust are parties to a $200,000,000 revolving credit agreement whereby the Fund is permitted to use bank borrowings for temporary or emergency purposes, such as to fund shareholder redemption requests. Interest under the credit agreement is charged to the Fund based on a borrowing rate equal to the higher of the Federal Funds rate in effect on that day plus 1.25% or the overnight LIBOR rate in effect on that day plus 1.25%. In addition, an annual commitment fee equal to 0.20% of the unused balance is allocated to each participating fund. Prior to September 1, 2015, the revolving credit agreement amount was $150,000,000 and the annual commitment fee was equal to 0.10% of the unused balance which was allocated to each participating fund.
For the year ended March 31, 2016, there were no borrowings by the Fund under the agreement.
8. DISTRIBUTIONS TO SHAREHOLDERS
The tax character of distributions paid during the years ended March 31, 2016 and March 31, 2015 were as follows:
| | | | | | | | |
| | | Year ended March 31 | |
| | | 2016 | | | 2015 | |
Ordinary income | | $ | 0 | | | $ | 30,981,316 | |
Long-term capital gain | | | 279,330,765 | | | | 360,164,714 | |
As of March 31, 2016, the components of distributable earnings on a tax basis were as follows:
| | |
Undistributed long-term gain | | Unrealized gains |
| $77,653,586 | | $253,830,787 |
9. INDEMNIFICATION
Under the Trust’s organizational documents, the officers and Trustees have been granted certain indemnification rights against certain liabilities that may arise out of performance of their duties to the Trust. Additionally, in the normal course of business, the Trust may enter into contracts with service providers that contain a variety of indemnification clauses. The Trust’s maximum exposure under these arrangements is dependent on future claims that may be made against the Fund and, therefore, cannot be estimated.
| | | | | | |
| Report of independent registered public accounting firm | | Wells Fargo Small Cap Value Fund | | | 29 | |
BOARD OF TRUSTEES AND SHAREHOLDERS OF WELLS FARGO FUNDS TRUST:
We have audited the accompanying statement of assets and liabilities, including the portfolio of investments, of the Wells Fargo Small Cap Value Fund (formerly known as Wells Fargo Advantage Small Cap Value Fund) (the “Fund”), one of the funds constituting the Wells Fargo Funds Trust, as of March 31, 2016, and the related statements of operations for the year then ended, the statements of changes in net assets for each of the years in the two-year period then ended, and the financial highlights for the each of the years in the two-year period then ended, the period from November 1, 2013 to March 31, 2014, and each of the years or periods in the three-year period ended October 31, 2013. These financial statements and financial highlights are the responsibility of the Fund’s management. Our responsibility is to express an opinion on these financial statements and financial highlights based on our audits.
We conducted our audits in accordance with the standards of the Public Company Accounting Oversight Board (United States). Those standards require that we plan and perform the audit to obtain reasonable assurance about whether the financial statements and financial highlights are free of material misstatement. An audit includes examining, on a test basis, evidence supporting the amounts and disclosures in the financial statements. Our procedures included confirmation of securities owned as of March 31, 2016, by correspondence with the custodian and brokers or by other appropriate auditing procedures. An audit also includes assessing the accounting principles used and significant estimates made by management, as well as evaluating the overall financial statement presentation. We believe that our audits provide a reasonable basis for our opinion.
In our opinion, the financial statements and financial highlights referred to above present fairly, in all material respects, the financial position of the Wells Fargo Small Cap Value Fund as of March 31, 2016, the results of its operations for the year then ended, the changes in its net assets for each of the years in the two-year period then ended, and the financial highlights for each of the years or periods noted in the first paragraph above, in conformity with U.S. generally accepted accounting principles.

Boston, Massachusetts
May 25, 2016
| | | | |
| 30 | | Wells Fargo Small Cap Value Fund | | Other information (unaudited) |
TAX INFORMATION
Pursuant to Section 852 of the Internal Revenue Code, $279,330,765 was designated as long-term capital gain distributions for the fiscal year ended March 31, 2016.
PROXY VOTING INFORMATION
A description of the policies and procedures that the Fund uses to determine how to vote proxies relating to portfolio securities is available, upon request, by calling 1-800-222-8222, visiting our website at wellsfargofunds.com, or visiting the SEC website at sec.gov. Information regarding how the Fund voted proxies relating to portfolio securities during the most recent 12-month period ended June 30 is available on the Fund’s website at wellsfargofunds.com or by visiting the SEC website at sec.gov.
PORTFOLIO HOLDINGS INFORMATION
The complete portfolio holdings for the Fund are publicly available monthly on the Fund’s website (wellsfargofunds.com), on a one-month delayed basis. In addition, top ten holdings information (excluding derivative positions) for the Fund is publicly available on the Fund’s website on a monthly, seven-day or more delayed basis. The Fund files its complete schedule of portfolio holdings with the SEC for the first and third quarters of each fiscal year on Form N-Q, which is available by visiting the SEC website at sec.gov. In addition, the Fund’s Form N-Q may be reviewed and copied at the SEC’s Public Reference Room in Washington, DC, and at regional offices in New York City, at 233 Broadway, and in Chicago, at 175 West Jackson Boulevard, Suite 900. Information about the Public Reference Room may be obtained by calling 1-800-SEC-0330.
| | | | | | |
| Other information (unaudited) | | Wells Fargo Small Cap Value Fund | | | 31 | |
BOARD OF TRUSTEES AND OFFICERS
Each of the Trustees and Officers1 listed in the table below acts in identical capacities for each fund in the Wells Fargo family of funds, which consists of 144 mutual funds comprising the Wells Fargo Funds Trust, Wells Fargo Variable Trust, Wells Fargo Master Trust and four closed-end funds (collectively the “Fund Complex”). This table should be read in conjunction with the Prospectus and the Statement of Additional Information2. The mailing address of each Trustee and Officer is 525 Market Street, 12th Floor, San Francisco, CA 94105. Each Trustee and Officer serves an indefinite term, however, each Trustee serves such term until reaching the mandatory retirement age established by the Trustees.
Independent Trustees
| | | | | | |
Name and year of birth | | Position held and length of service* | | Principal occupations during past five years or longer | | Current other public company or
investment company
directorships |
| William R. Ebsworth (Born 1957) | | Trustee, since 2015 | | Retired. From 1984 to 2013, equities analyst, portfolio manager, research director and chief financial officer at Fidelity Management and Research Company in Boston, Tokyo, and Hong Kong and retired in 2013 as Chief Investment Officer of Fidelity Strategic Advisers, Inc. where he lead a team of investment professionals managing client assets. Prior thereto, Board member of Hong Kong Securities Clearing Co., Hong Kong Options Clearing Corp., the Thailand International Fund, Ltd., Fidelity Investments Life Insurance Company, and Empire Fidelity Investments Life Insurance Company. Mr. Ebsworth is a CFA® charterholder and an Adjunct Lecturer, Finance, at Babson College. | | Asset Allocation Trust |
| Jane A. Freeman (Born 1953) | | Trustee, since 2015 | | Retired. From 2012 to 2014 and 1999 to 2008, Chief Financial Officer of Scientific Learning Corporation. From 2008 to 2012, Ms. Freeman provided consulting services related to strategic business projects. Prior to 1999, Portfolio Manager at Rockefeller & Co. and Scudder, Stevens & Clark. Board member of the Harding Loevner Funds from 1996 to 2014, serving as both Lead Independent Director and chair of the Audit Committee. Board member of the Russell Exchange Traded Funds Trust from 2011 to 2012 and the chair of the Audit Committee. Ms. Freeman is Chair of Taproot Foundation (non-profit organization), a Board Member of Ruth Bancroft Garden (non-profit organization) and an inactive chartered financial analyst. | | Asset Allocation Trust |
Peter G. Gordon (Born 1942) | | Trustee, since 1998; Chairman, since 2005 | | Co-Founder, Retired Chairman, President and CEO of Crystal Geyser Water Company. Trustee Emeritus, Colby College. | | Asset Allocation Trust |
Isaiah Harris, Jr. (Born 1952) | | Trustee, since 2009 | | Retired. Chairman of the Board of CIGNA Corporation since 2009, and Director since 2005. From 2003 to 2011, Director of Deluxe Corporation. Prior thereto, President and CEO of BellSouth Advertising and Publishing Corp. from 2005 to 2007, President and CEO of BellSouth Enterprises from 2004 to 2005 and President of BellSouth Consumer Services from 2000 to 2003. Emeritus member of the Iowa State University Foundation Board of Governors. Emeritus Member of the Advisory Board of Iowa State University School of Business. Advisory Board Member, Palm Harbor Academy (charter school). Advisory Board Member, Child Evangelism Fellowship (non-profit). Mr. Harris is a certified public accountant (inactive status). | | CIGNA Corporation; Asset Allocation Trust |
| Judith M. Johnson (Born 1949) | | Trustee, since 2008; Audit Committee Chairman, since 2008 | | Retired. Prior thereto, Chief Executive Officer and Chief Investment Officer of Minneapolis Employees Retirement Fund from 1996 to 2008. Ms. Johnson is an attorney, certified public accountant and a certified managerial accountant. | | Asset Allocation Trust |
David F. Larcker (Born 1950) | | Trustee, since 2009 | | James Irvin Miller Professor of Accounting at the Graduate School of Business, Stanford University, Director of the Corporate Governance Research Initiative and Senior Faculty of The Rock Center for Corporate Governance since 2006. From 2005 to 2008, Professor of Accounting at the Graduate School of Business, Stanford University. Prior thereto, Ernst & Young Professor of Accounting at The Wharton School, University of Pennsylvania from 1985 to 2005. | | Asset Allocation Trust |
| | | | |
| 32 | | Wells Fargo Small Cap Value Fund | | Other information (unaudited) |
| | | | | | |
Name and year of birth | | Position held and length of service* | | Principal occupations during past five years or longer | | Current other public company or
investment company
directorships |
| Olivia S. Mitchell (Born 1953) | | Trustee, since 2006 | | International Foundation of Employee Benefit Plans Professor, Wharton School of the University of Pennsylvania since 1993. Director of Wharton’s Pension Research Council and Boettner Center on Pensions & Retirement Research, and Research Associate at the National Bureau of Economic Research. Previously, Cornell University Professor from 1978 to 1993. | | Asset Allocation Trust |
| Timothy J. Penny (Born 1951) | | Trustee, since 1996 | | President and Chief Executive Officer of Southern Minnesota Initiative Foundation, a non-profit organization, since 2007 and Senior Fellow at the Humphrey Institute Policy Forum at the University of Minnesota since 1995. Member of the Board of Trustees of NorthStar Education Finance, Inc., a non-profit organization, since 2007. | | Asset Allocation Trust |
| Michael S. Scofield (Born 1943) | | Trustee, since 2010 | | Served on the Investment Company Institute’s Board of Governors and Executive Committee from 2008-2011 as well the Governing Council of the Independent Directors Council from 2006-2011 and the Independent Directors Council Executive Committee from 2008-2011. Chairman of the IDC from 2008-2010. Institutional Investor (Fund Directions) Trustee of Year in 2007. Trustee of the Evergreen Funds complex (and its predecessors) from 1984 to 2010. Chairman of the Evergreen Funds from 2000-2010. Former Trustee of the Mentor Funds. Retired Attorney, Law Offices of Michael S. Scofield. | | Asset Allocation Trust |
| * | Length of service dates reflect the Trustee’s commencement of service with the Trust’s predecessor entities, where applicable. |
Officers
| | | | | | |
Name and year of birth | | Position held and
length of service | | Principal occupations during past five years or longer | | |
| Karla M. Rabusch (Born 1959) | | President, since 2003 | | Executive Vice President of Wells Fargo Bank, N.A. and President of Wells Fargo Funds Management, LLC since 2003. | | |
Nancy Wiser1 (Born 1967) | | Treasurer, since 2012 | | Executive Vice President of Wells Fargo Funds Management, LLC since 2011. Chief Operating Officer and Chief Compliance Officer at LightBox Capital Management LLC, from 2008 to 2011. | | |
| C. David Messman (Born 1960) | | Secretary, since 2000; Chief Legal Officer, since 2003 | | Senior Vice President and Secretary of Wells Fargo Funds Management, LLC since 2001. Assistant General Counsel of Wells Fargo Bank, N.A. since 2013 and Vice President and Managing Counsel of Wells Fargo Bank, N.A. from 1996 to 2013. | | |
Debra Ann Early (Born 1964) | | Chief Compliance Officer, since 2007 | | Executive Vice President of Wells Fargo Funds Management, LLC since 2014, Senior Vice President and Chief Compliance Officer from 2007 to 2014. | | |
David Berardi (Born 1975) | | Assistant Treasurer, since 2009 | | Vice President of Wells Fargo Funds Management, LLC since 2009. Vice President of Evergreen Investment Management Company, LLC from 2008 to 2010. Manager of Fund Reporting and Control for Evergreen Investment Management Company, LLC from 2004 to 2010. | | |
| Jeremy DePalma1 (Born 1974) | | Assistant Treasurer, since 2009 | | Senior Vice President of Wells Fargo Funds Management, LLC since 2009. Senior Vice President of Evergreen Investment Management Company, LLC from 2008 to 2010 and head of the Fund Reporting and Control Team within Fund Administration from 2005 to 2010. | | |
| 1 | Nancy Wiser acts as Treasurer of 72 funds in the Fund Complex. Jeremy DePalma acts as Treasurer of 72 funds and Assistant Treasurer of 72 funds in the Fund Complex. |
| 2 | The Statement of Additional Information includes additional information about the Trustees and is available, without charge, upon request, by calling 1-800-222-8222 or by visiting the website at wellsfargofunds.com. |
| | | | | | |
| List of abbreviations | | Wells Fargo Small Cap Value Fund | | | 33 | |
The following is a list of common abbreviations for terms and entities that may have appeared in this report.
| ACA | — ACA Financial Guaranty Corporation |
| ADR | — American depositary receipt |
| ADS | — American depositary shares |
| AGC | — Assured Guaranty Corporation |
| AGM | — Assured Guaranty Municipal |
| Ambac | — Ambac Financial Group Incorporated |
| AMT | — Alternative minimum tax |
| BAN | — Bond anticipation notes |
| BHAC | — Berkshire Hathaway Assurance Corporation |
| CAB | — Capital appreciation bond |
| CCAB | — Convertible capital appreciation bond |
| CDA | — Community Development Authority |
| CDO | — Collateralized debt obligation |
| DRIVER | — Derivative inverse tax-exempt receipts |
| DW&P | — Department of Water & Power |
| DWR | — Department of Water Resources |
| ECFA | — Educational & Cultural Facilities Authority |
| EDA | — Economic Development Authority |
| EDFA | — Economic Development Finance Authority |
| ETF | — Exchange-traded fund |
| FDIC | — Federal Deposit Insurance Corporation |
| FFCB | — Federal Farm Credit Banks |
| FGIC | — Financial Guaranty Insurance Corporation |
| FHA | — Federal Housing Administration |
| FHLB | — Federal Home Loan Bank |
| FHLMC | — Federal Home Loan Mortgage Corporation |
| FICO | — The Financing Corporation |
| FNMA | — Federal National Mortgage Association |
| GDR | — Global depositary receipt |
| GNMA | — Government National Mortgage Association |
| HCFR | — Healthcare facilities revenue |
| HEFA | — Health & Educational Facilities Authority |
| HEFAR | — Higher education facilities authority revenue |
| HFA | — Housing Finance Authority |
| HFFA | — Health Facilities Financing Authority |
| HUD | — Department of Housing and Urban Development |
| IDA | — Industrial Development Authority |
| IDAG | — Industrial Development Agency |
| KRW | — Republic of Korea won |
| LIBOR | — London Interbank Offered Rate |
| LIFER | — Long Inverse Floating Exempt Receipts |
| LLC | — Limited liability company |
| LLLP | — Limited liability limited partnership |
| LLP | — Limited liability partnership |
| MBIA | — Municipal Bond Insurance Association |
| MFHR | — Multifamily housing revenue |
| MSTR | — Municipal securities trust receipts |
| MUD | — Municipal Utility District |
| National | — National Public Finance Guarantee Corporation |
| PCFA | — Pollution Control Financing Authority |
| PCL | — Public Company Limited |
| PCR | — Pollution control revenue |
| PFA | — Public Finance Authority |
| PFFA | — Public Facilities Financing Authority |
| PFOTER | — Puttable floating option tax-exempt receipts |
| plc | — Public limited company |
| PUTTER | — Puttable tax-exempt receipts |
| R&D | — Research & development |
| Radian | — Radian Asset Assurance |
| RAN | — Revenue anticipation notes |
| RDA | — Redevelopment Authority |
| RDFA | — Redevelopment Finance Authority |
| REIT | — Real estate investment trust |
| ROC | — Reset option certificates |
| SAVRS | — Select auction variable rate securities |
| SBA | — Small Business Authority |
| SDR | — Swedish depositary receipt |
| SFHR | — Single-family housing revenue |
| SFMR | — Single-family mortgage revenue |
| SPA | — Standby purchase agreement |
| SPDR | — Standard & Poor’s Depositary Receipts |
| SPEAR | — Short Puttable Exempt Adjustable Receipts |
| STRIPS | — Separate trading of registered interest and |
| TAN | — Tax anticipation notes |
| TIPS | — Treasury inflation-protected securities |
| TRAN | — Tax revenue anticipation notes |
| TTFA | — Transportation Trust Fund Authority |
| TVA | — Tennessee Valley Authority |
This page is intentionally left blank.
This page is intentionally left blank.
This page is intentionally left blank.

For more information
More information about Wells Fargo Funds is available free upon request. To obtain literature, please write, email, visit the Fund’s website, or call:
Wells Fargo Funds
P.O. Box 8266
Boston, MA 02266-8266
Email: fundservice@wellsfargo.com
Website: wellsfargofunds.com
Individual investors: 1-800-222-8222
Retail investment professionals: 1-888-877-9275
Institutional investment professionals: 1-866-765-0778
This report and the financial statements contained herein are submitted for the general information of the shareholders of the Fund. If this report is used for promotional purposes, distribution of the report must be accompanied or preceded by a current prospectus. Before investing, please consider the investment objectives, risks, charges, and expenses of the investment. For a current prospectus and, if available, a summary prospectus, containing this information, call 1-800-222-8222 or visit the Fund’s website at wellsfargofunds.com. Read the prospectus carefully before you invest or send money.
Wells Fargo Asset Management (WFAM) is a trade name used by the asset management businesses of Wells Fargo & Company. Wells Fargo Funds Management, LLC, a wholly owned subsidiary of Wells Fargo & Company, provides investment advisory and administrative services for Wells Fargo Funds. Other affiliates of Wells Fargo & Company provide subadvisory and other services for the funds. The funds are distributed by Wells Fargo Funds Distributor, LLC, Member FINRA, an affiliate of Wells Fargo & Company.
NOT FDIC INSURED ¡ NO BANK GUARANTEE ¡ MAY LOSE VALUE
© 2016 Wells Fargo Funds Management, LLC. All rights reserved.
| | |
 | | 241817 05-16 A244/AR244 03-16 |
Annual Report
March 31, 2016

Wells Fargo Small/Mid Cap Value Fund


Reduce clutter. Save trees.
Sign up for electronic delivery of prospectuses and shareholder reports at wellsfargo.com/advantagedelivery
Contents
The views expressed and any forward-looking statements are as of March 31, 2016, unless otherwise noted, and are those of the Fund managers and/or Wells Fargo Funds Management, LLC. Discussions of individual securities, or the markets generally, or any Wells Fargo Fund are not intended as individual recommendations. Future events or results may vary significantly from those expressed in any forward-looking statements. The views expressed are subject to change at any time in response to changing circumstances in the market. Wells Fargo Funds Management, LLC and the Fund disclaim any obligation to publicly update or revise any views expressed or forward-looking statements.
NOT FDIC INSURED ¡ NO BANK GUARANTEE ¡ MAY LOSE VALUE
| | | | |
| 2 | | Wells Fargo Small/Mid Cap Value Fund | | Letter to shareholders (unaudited) |

Karla M. Rabusch
President
Wells Fargo Funds
Throughout the period, stock performance was highly volatile.
Stock values recovered during the second half of the first quarter of 2016.
Dear Valued Shareholder:
We are pleased to offer you this annual report for the Wells Fargo Small/Mid Cap Value Fund for the 12-month period that ended March 31, 2016. Throughout the period, stock performance was highly volatile. Investors reacted to slowing economic growth, moderating corporate earnings, weakening commodity prices, increasing central-bank intervention, and shifts in currency values. During the last four weeks of the period, investor sentiment appeared to move beyond these concerns as economic data firmed and stocks gained across the capitalization spectrum.
As investors grew concerned about global issues, volatility increased.
A common measure of investors’ stock volatility expectations—the Chicago Board Options Exchange (CBOE) Volatility Index (VIX)1—illustrated the shifts in investor sentiment. The VIX spiked to readings above 40 in August 2015, indicating increased investor anxiety. During a comparatively calm autumn, VIX readings trended to the midteens and closer to their five-year average. Then stock markets grew volatile again as the winter months arrived. After the new year began, VIX readings spiked to the high 20s as U.S. equity markets posted their worst start to a calendar year on record. Stock values recovered during the second half of the first quarter of 2016. Investors appeared to be encouraged by improving economic data and the reassurances of central bankers that they remain committed to spurring growth through policy initiatives.
However, business, economic, and central-bank policy development had countervailing influences. For example, while a stronger dollar benefited consumer purchasing power, it tended to negatively affect corporate earnings and investment gains earned overseas when translated to U.S. dollars. Lower energy costs helped consumers’ budgets but hampered the profits and stock performance in the energy sector. While lower interest rates encouraged spending, the potential for interest-rate increases caused uncertainty.
Central bankers responded with policy initiatives in response to shifting economic conditions.
In December 2015, the U.S. Federal Reserve (Fed) increased the federal funds rate, the first interest-rate increase since 2006. The Fed also expressed its intention to increase the rate several times during 2016. After the new year began, as data weakened and volatility increased, the Fed retrenched, which injected additional uncertainty into the markets. In the eurozone, the European Central Bank continued to encourage lending and investing by making funds available to banks at low interest rates, imposing a negative interest rate on bank deposits, and purchasing bonds through its quantitative easing program. In Japan, the central bank also implemented a negative interest-rate policy intended to spur lending and investment. In China, the People’s Bank of China lowered interest rates and bank reserve requirements, in addition to devaluing the country’s currency to support exports.
| 1 | The Chicago Board Options Exchange (CBOE) Volatility Index (VIX) is a key measure of market expectations of near-term volatility conveyed by the S&P 500 stock index option prices. Since its introduction in 1993, VIX has been considered by many to be the world’s premier barometer of investor sentiment and market volatility. Several investors expressed interest in trading instruments related to the market’s expectation of future volatility, and so VIX futures were introduced in 2004, and VIX options were introduced in 2006. |
| | | | | | |
| Letter to shareholders (unaudited) | | Wells Fargo Small/Mid Cap Value Fund | | | 3 | |
Volatility and recoveries highlighted the value of a long-term investment strategy.
The experience of the past 12 months demonstrated the value of maintaining a disciplined, long-term investment strategy despite short-term volatility. Broad U.S. equity indexes trimmed their worst losses measured to the midpoint of the period to recover all or a portion of their lost values by the end of the period. For example, the S&P 500 Index,2 a commonly referenced gauge of large-cap stock performance, gained 1.78% for the 12-month period that ended March 31, 2016, after recording a 6.18% loss for the six-month period that ended September 30, 2015. Some observers attributed the S&P 500 Index’s relative outperformance to investors who moved their equity allocations higher in the capitalization structure in pursuit of the perceived safety of large-cap stocks. The Russell Midcap® Index3 lost 4.04% for the 12-month period that ended March 31, 2016, regaining more than half of the 9.42% loss it had recorded for the six-month period that ended September 30, 2015. For the 12-month period that ended March 31, 2016, the Russell 2000® Index,4 a common small-cap stock index, lost 9.76%, an improvement from the 11.55% loss it had recorded during the six-month period that ended September 30, 2015.
Don’t let short-term uncertainty derail long-term investment goals.
Periods of investment uncertainty can present challenges, but experience has taught us that maintaining long-term investment goals can be an effective way to plan for the future. To help you create a sound strategy based on your personal goals and risk tolerance, Wells Fargo Funds offers more than 100 mutual funds spanning a wide range of asset classes and investment styles. Although diversification cannot guarantee an investment profit or prevent losses, we believe it can be an effective way to manage investment risk and potentially smooth out overall portfolio performance. We encourage investors to know their investments and to understand that appropriate levels of risk-taking may unlock opportunities.
Thank you for choosing to invest with Wells Fargo Funds. We appreciate your confidence in us and remain committed to helping you meet your financial needs.
Sincerely,

Karla M. Rabusch
President
Wells Fargo Funds
For further information about your Fund, contact your investment professional, visit our website at wellsfargofunds.com, or call us directly at 1-800-222-8222. We are available 24 hours a day, 7 days a week.
| 2 | The S&P 500 Index consists of 500 stocks chosen for market size, liquidity, and industry group representation. It is a market-value-weighted index with each stock’s weight in the index proportionate to its market value. You cannot invest directly in an index. |
| 3 | The Russell Midcap® Index measures the performance of the 800 smallest companies in the Russell 1000® Index, which represent approximately 25% of the total market capitalization of the Russell 1000® Index. You cannot invest directly in an index. |
| 4 | The Russell 2000® Index measures the performance of the 2,000 smallest companies in the Russell 3000® Index, which represents approximately 8% of the total market capitalization of the Russell 3000® Index. You cannot invest directly in an index. |
| | | | |
| 4 | | Wells Fargo Small/Mid Cap Value Fund | | Performance highlights (unaudited) |
Investment objective
The Fund seeks long-term capital appreciation.
Manager
Wells Fargo Funds Management, LLC
Subadviser
Wells Capital Management Incorporated
Portfolio managers
Erik C. Astheimer
I. Charles Rinaldi
Michael Schneider, CFA®
Average annual total returns (%) as of March 31, 20161
| | | | | | | | | | | | | | | | | | | | | | | | | | | | | | | | | | |
| | | | | Including sales charge | | | Excluding sales charge | | | Expense ratios2 (%) | |
| | | Inception date | | 1 year | | | 5 year | | | 10 year | | | 1 year | | | 5 year | | | 10 year | | | Gross | | | Net3 | |
| Class A (WFVAX) | | 7-31-2007 | | | (1.84 | ) | | | (0.09 | ) | | | 1.28 | | | | 4.13 | | | | 1.10 | | | | 1.89 | | | | 1.43 | | | | 1.36 | |
| Class C (WFCVX) | | 7-31-2007 | | | 2.32 | | | | 0.34 | | | | 1.16 | | | | 3.32 | | | | 0.34 | | | | 1.16 | | | | 2.18 | | | | 2.11 | |
| Administrator Class (WWMDX) | | 4-8-2005 | | | – | | | | – | | | | – | | | | 4.35 | | | | 1.34 | | | | 2.15 | | | | 1.35 | | | | 1.16 | |
| Institutional Class (WWMSX) | | 8-31-2006 | | | – | | | | – | | | | – | | | | 4.49 | | | | 1.51 | | | | 2.33 | | | | 1.10 | | | | 0.96 | |
| Russell 2500TM Value Index4 | | – | | | – | | | | – | | | | – | | | | (5.20 | ) | | | 8.33 | | | | 5.80 | | | | – | | | | – | |
Figures quoted represent past performance, which is no guarantee of future results, and do not reflect taxes that a shareholder may pay on fund distributions or the redemption of fund shares. Investment return and principal value of an investment will fluctuate so that an investor’s shares, when redeemed, may be worth more or less than their original cost. Performance shown without sales charges would be lower if sales charges were reflected. Current performance may be lower or higher than the performance data quoted, which assumes the reinvestment of dividends and capital gains. Current month-end performance is available on the Fund’s website, wellsfargofunds.com.
Index returns do not include transaction costs associated with buying and selling securities, any mutual fund fees or expenses, or any taxes. It is not possible to invest directly in an index.
For Class A shares, the maximum front-end sales charge is 5.75%. For Class C shares, the maximum contingent deferred sales charge is 1.00%. Performance including a contingent deferred sales charge assumes the sales charge for the corresponding time period. Administrator Class and Institutional Class shares are sold without a front-end sales charge or contingent deferred sales charge.
Stock values fluctuate in response to the activities of individual companies and general market and economic conditions. Smaller-company stocks tend to be more volatile and less liquid than those of larger companies. The use of derivatives may reduce returns and/or increase volatility. Certain investment strategies tend to increase the total risk of an investment (relative to the broader market). The Fund is exposed to foreign investment risk. Consult the Fund’s prospectus for additional information on these and other risks.
Please see footnotes on page 5.
| | | | | | |
| Performance highlights (unaudited) | | Wells Fargo Small/Mid Cap Value Fund | | | 5 | |
|
| Growth of $10,000 investment as of March 31, 20165 |
|
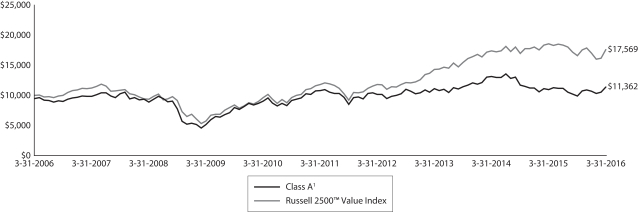 |
| 1 | Historical performance shown for Class A shares prior to their inception reflects the performance of the former Investor Class shares, and includes the higher expenses applicable to the former Investor Class shares. If these expenses had not been included, returns would be higher. Historical performance shown for Class C shares prior to their inception reflects the performance of the former Investor Class shares, and has been adjusted to reflect the higher expenses applicable to Class C shares. Historical performance shown for Institutional Class shares prior to their inception reflects the performance of Administrator Class shares, and includes the higher expenses applicable to Administrator Class shares. If these expenses had not been included, returns would be higher. |
| 2 | Reflects the expense ratios as stated in the most recent prospectuses, which include the impact of 0.01% in acquired fund fees and expenses. The expense ratios shown are subject to change and may differ from the annualized expense ratios shown in the financial highlights of this report, which do not include acquired fund fees and expenses. |
| 3 | The manager has contractually committed through July 31, 2016, to waive fees and/or reimburse expenses to the extent necessary to cap the Fund’s Total Annual Fund Operating Expenses After Fee Waiver at 1.35% for Class A, 2.10% for Class C, 1.15% Administrator Class and 0.95% for Institutional Class. After this time, the cap may be increased or the commitment to maintain the cap may be terminated only with the approval of the Board of Trustees. Brokerage commissions, stamp duty fees, interest, taxes, acquired fund fees and expenses, and extraordinary expenses are excluded from the cap. Without this cap, the Fund’s returns would have been lower. |
| 4 | The Russell 2500TM Value Index measures the performance of those Russell 2500TM companies with lower price-to-book ratios and lower forecasted growth values. You cannot invest directly in an index. |
| 5 | The chart compares the performance of Class A shares for the most recent ten years with the Russell 2500TM Value Index. The chart assumes a hypothetical investment of $10,000 in Class A shares and reflects all operating expenses and assumes the maximum initial sales charge of 5.75%. |
| 6 | The ten largest holdings, excluding cash and cash equivalents, are calculated based on the value of the investments divided by total net assets of the Fund. Holdings are subject to change and may have changed since the date specified. |
| 7 | Amounts are calculated based on the total long-term investments of the Fund. These amounts are subject to change and may have changed since the date specified. |
| | | | |
| 6 | | Wells Fargo Small/Mid Cap Value Fund | | Performance highlights (unaudited) |
MANAGER’S DISCUSSION
Fund highlights
| n | | The Fund outperformed its benchmark, the Russell 2500TM Value Index, for the 12-month period that ended March 31, 2016. |
| n | | The Fund benefited from an overweight to materials, particularly gold-mining companies. |
| n | | Strong stock selection in the consumer discretionary and industrials sectors also drove the outperformance. |
| n | | The Fund’s underweight to the utilities sector and weakness within some of our health care holdings detracted from performance. |
Equities declined during the 12-month period that ended March 31, 2016, as measured by the Russell 2500TM Value Index. The disappointing economic recovery in the U.S., slowing growth in emerging markets, heightened geopolitical risks, and uncertainty regarding global central bank actions presented a difficult environment for equities. This backdrop was more positive for gold, which rose over 4% during this time. Most gold-related equities outperformed the gold price. Despite the macro headwinds over the past 12 months, our Fund generated a positive absolute return versus the benchmark, which finished down for the period.
| | | | |
| Ten largest holdings (%) as of March 31, 20166 | |
Randgold Resources Limited ADR | | | 6.03 | |
Cavco Industries Incorporated | | | 5.70 | |
UMH Properties Incorporated | | | 5.52 | |
Integrated Electrical Services Incorporated | | | 5.37 | |
InterOil Corporation | | | 5.31 | |
Skyline Corporation | | | 2.95 | |
Century Casinos Incorporated | | | 2.17 | |
Cray Incorporated | | | 1.94 | |
Sandvine Corporation | | | 1.68 | |
Sierra Bancorp | | | 1.62 | |
Gold and the shares of most gold miners performed strongly in a weak equity market.
An overweight to the materials sector, specifically gold-mining companies, contributed to relative performance. We hold positions in gold miners in part because we believe they improve the Fund’s diversification given their lower correlation to the broad market. This proved true during the period, as gold and the shares of most gold miners performed strongly in the face of a weak equity market. We expect global mine supply to decline, which, coupled with the uncertain macroeconomic backdrop, should bode well for the price of gold. Randgold Resources Limited, one of the Fund’s largest holdings, gained more than 30%. Randgold is profitable and has disciplined management, a strong
balance sheet, and high-quality mining assets. It continues to be a core Fund holding.
Strong stock selection in the consumer discretionary sector helped Fund performance. The Fund’s manufactured housing producers, Cavco Industries, Incorporated, and Skyline Corporation, returned more than 24% and 160%, respectively. The manufactured housing industry is slowly recovering after a major downturn. As industry volumes increase, Cavco and Skyline are generating improved results. We believe the industry is in the early stages of a recovery and the outlook for these companies is very positive. Century Casinos, Incorporated, another strong performer, benefited from a successful new property in Canada and improved margins at its operations in Poland.
Integrated Electrical Services, Incorporated, drove the strong performance in the industrials sector. This company primarily provides electrical construction and contracting services to the residential, communications, and commercial and industrial industries. Integrated Electrical Services reported strong earnings over the past year, driven by growth in the residential and communications divisions. Integrated Electrical Services has a strong balance sheet with a net cash position, and the outlook for the company’s end markets remains positive.
Please see footnotes on page 5.
| | | | | | |
| Performance highlights (unaudited) | | Wells Fargo Small/Mid Cap Value Fund | | | 7 | |
|
| Sector distribution as of March 31, 20167 |
|
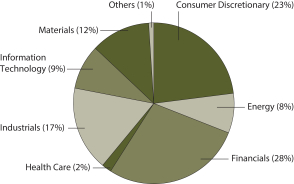 |
Despite weakness in oil, the Fund’s energy stocks contributed to relative performance.
Despite the weakness in oil, the Fund’s energy stocks were a modest contributor to relative performance. Our largest energy holding, InterOil Corporation, outperformed the energy sector within the benchmark despite the stock’s 31% loss during the period. Even though the company, a natural gas exploration concern, isn’t directly tied to oil, the weak sector sentiment negatively influenced the stock. InterOil’s transaction with Total S.A. regarding the Elk/Antelope natural gas resource remains on track and is expected to close in the third quarter. At certification of the transaction, InterOil will receive a large certification payment tied to the
amount of gas present rather than based on commodity prices. The deal will further de-risk the company’s financial position and allow it to advance its drilling programs on multiple fields.
Our underweight to the utilities sector, one of the best performers for the 12-month period, was a detractor. Weakness within our health care holdings negatively affected performance. While there was a positive influence due to the acquisition of Merge Healthcare Incorporated by IBM Corporation, it was not enough to offset the underperformance of EnteroMedics Incorporated. EnteroMedics is a medical device company that has developed a neuro-blocking technology to treat obesity that is less invasive than alternate procedures. Despite receiving the approval of the U.S. Food and Drug Administration, ramp-up of the device that was slower than anticipated and subsequent equity offerings negatively affected the price of the stock.
We remain focused on companies whose businesses are likely to benefit in the long-term.
We are cautious on the overall market. Corporate profit margins are high and valuation multiples are not cheap. It is possible that profit margins revert to more historical levels and the share-price multiple that investors put on those earnings also could move lower. The interaction of these two influences could lead to lower stock prices. In addition, the hesitancy of the U.S. Federal Reserve to raise interest rates in the U.S. and the move by some central banks overseas to negative interest-rate regimes suggest that global economic growth is not yet robust. Given these factors, we believe it’s prudent to remain cautious. We continue to focus on company-specific fundamentals to guide our decisions. We believe our diversified approach, which includes exposure to gold miners, leaves the Fund well positioned to meet the various challenges that may lie ahead.
Please see footnotes on page 5.
| | | | |
| 8 | | Wells Fargo Small/Mid Cap Value Fund | | Fund expenses (unaudited) |
As a shareholder of the Fund, you incur two types of costs: (1) transaction costs, including sales charges (loads) on purchase payments and contingent deferred sales charges (if any) on redemptions and (2) ongoing costs, including management fees, distribution (12b-1) and/or shareholder servicing fees, and other Fund expenses. This example is intended to help you understand your ongoing costs (in dollars) of investing in the Fund and to compare these costs with the ongoing costs of investing in other mutual funds.
The example is based on an investment of $1,000 invested at the beginning of the six-month period and held for the entire period from October 1, 2015 to March 31, 2016.
Actual expenses
The “Actual” line of the table below provides information about actual account values and actual expenses. You may use the information in this line, together with the amount you invested, to estimate the expenses that you paid over the period. Simply divide your account value by $1,000 (for example, an $8,600 account value divided by $1,000 = 8.6), then multiply the result by the number in the “Actual” line under the heading entitled “Expenses paid during period” for your applicable class of shares to estimate the expenses you paid on your account during this period.
Hypothetical example for comparison purposes
The “Hypothetical” line of the table below provides information about hypothetical account values and hypothetical expenses based on the Fund’s actual expense ratio and an assumed rate of return of 5% per year before expenses, which is not the Fund’s actual return. The hypothetical account values and expenses may not be used to estimate the actual ending account balance or expenses you paid for the period. You may use this information to compare the ongoing costs of investing in the Fund and other funds. To do so, compare this 5% hypothetical example with the 5% hypothetical examples that appear in the shareholder reports of the other funds.
Please note that the expenses shown in the table are meant to highlight your ongoing costs only and do not reflect any transactional costs, such as sales charges (loads) and contingent deferred sales charges. Therefore, the “Hypothetical” line of the table is useful in comparing ongoing costs only and will not help you determine the relative total costs of owning different funds. In addition, if these transactional costs were included, your costs would have been higher.
| | | | | | | | | | | | | | | | |
| | | Beginning
account value
10-1-2015 | | | Ending
account value
3-31-2016 | | | Expenses
paid during
the period¹ | | | Net annualized
expense ratio | |
Class A | | | | | | | | | | | | | | | | |
Actual | | $ | 1,000.00 | | | $ | 1,152.91 | | | $ | 7.27 | | | | 1.35 | % |
Hypothetical (5% return before expenses) | | $ | 1,000.00 | | | $ | 1,018.25 | | | $ | 6.81 | | | | 1.35 | % |
Class C | | | | | | | | | | | | | | | | |
Actual | | $ | 1,000.00 | | | $ | 1,148.14 | | | $ | 11.28 | | | | 2.10 | % |
Hypothetical (5% return before expenses) | | $ | 1,000.00 | | | $ | 1,014.50 | | | $ | 10.58 | | | | 2.10 | % |
Administrator Class | | | | | | | | | | | | | | | | |
Actual | | $ | 1,000.00 | | | $ | 1,153.96 | | | $ | 6.19 | | | | 1.15 | % |
Hypothetical (5% return before expenses) | | $ | 1,000.00 | | | $ | 1,019.25 | | | $ | 5.81 | | | | 1.15 | % |
Institutional Class | | | | | | | | | | | | | | | | |
Actual | | $ | 1,000.00 | | | $ | 1,154.54 | | | $ | 5.12 | | | | 0.95 | % |
Hypothetical (5% return before expenses) | | $ | 1,000.00 | | | $ | 1,020.25 | | | $ | 4.80 | | | | 0.95 | % |
| 1 | Expenses paid is equal to the annualized expense ratio of each class multiplied by the average account value over the period, multiplied by the number of days in the most recent fiscal half-year divided by the number of days in the fiscal year (to reflect the one-half-year period). |
| | | | | | |
| Portfolio of investments—March 31, 2016 | | Wells Fargo Small/Mid Cap Value Fund | | | 9 | |
| | | | | | | | | | | | |
| Security name | | | | | | Shares | | | Value | |
| | | | |
Common Stocks: 93.49% | | | | | | | | | | | | |
| | | | |
Consumer Discretionary: 21.66% | | | | | | | | | | | | |
| | | | |
| Auto Components: 1.24% | | | | | | | | | | | | |
Fox Factory Holding Corporation † | | | | | | | 38,570 | | | $ | 609,792 | |
| | | | | | | | | | | | |
| | | | |
| Hotels, Restaurants & Leisure: 2.57% | | | | | | | | | | | | |
Century Casinos Incorporated † | | | | | | | 173,700 | | | | 1,069,992 | |
Peak Resorts Incorporated | | | | | | | 57,600 | | | | 195,840 | |
| | | | |
| | | | | | | | | | | 1,265,832 | |
| | | | | | | | | | | | |
| | | | |
| Household Durables: 14.22% | | | | | | | | | | | | |
Cavco Industries Incorporated † | | | | | | | 30,013 | | | | 2,805,015 | |
D.R. Horton Incorporated | | | | | | | 24,500 | | | | 740,635 | |
Nobility Homes Incorporated †(a) | | | | | | | 28,200 | | | | 394,800 | |
Skyline Corporation † | | | | | | | 156,482 | | | | 1,450,588 | |
Taylor Morrison Home Corporation Class A † | | | | | | | 40,009 | | | | 564,927 | |
The New Home Company Incorporated † | | | | | | | 25,800 | | | | 316,308 | |
WCI Communities Incorporated † | | | | | | | 39,202 | | | | 728,373 | |
| | | | |
| | | | | | | | | | | 7,000,646 | |
| | | | | | | | | | | | |
| | | | |
| Media: 3.63% | | | | | | | | | | | | |
Cinemark Holdings Incorporated | | | | | | | 12,300 | | | | 440,709 | |
Entravision Communications Corporation Class A | | | | | | | 95,975 | | | | 714,054 | |
Interpublic Group of Companies Incorporated | | | | | | | 7,300 | | | | 167,535 | |
News Corporation Class A | | | | | | | 36,321 | | | | 463,819 | |
| | | | |
| | | | | | | | | | | 1,786,117 | |
| | | | | | | | | | | | |
| | | | |
Energy: 7.22% | | | | | | | | | | | | |
| | | | |
| Oil, Gas & Consumable Fuels: 7.22% | | | | | | | | | | | | |
Canadian Natural Resources Limited | | | | | | | 7,267 | | | | 196,209 | |
InterOil Corporation † | | | | | | | 82,189 | | | | 2,616,076 | |
Raging River Exploration Incorporated † | | | | | | | 29,400 | | | | 205,545 | |
Range Resources Corporation | | | | | | | 8,100 | | | | 262,278 | |
Sanchez Energy Corporation † | | | | | | | 49,968 | | | | 274,324 | |
| | | | |
| | | | | | | | | | | 3,554,432 | |
| | | | | | | | | | | | |
| | | | |
Financials: 26.34% | | | | | | | | | | | | |
| | | | |
| Banks: 12.82% | | | | | | | | | | | | |
American River Bankshares † | | | | | | | 54,700 | | | | 555,752 | |
Ameris Bancorp | | | | | | | 13,656 | | | | 403,944 | |
BBCN Bancorp Incorporated | | | | | | | 45,006 | | | | 683,641 | |
Hilltop Holdings Incorporated † | | | | | | | 29,844 | | | | 563,455 | |
IBERIABANK Corporation | | | | | | | 12,985 | | | | 665,741 | |
Midsouth Bancorp Incorporated | | | | | | | 41,574 | | | | 317,210 | |
Pacific Premier Bancorp Incorporated † | | | | | | | 30,819 | | | | 658,602 | |
Sierra Bancorp | | | | | | | 43,900 | | | | 796,785 | |
The Bancorp Incorporated † | | | | | | | 87,345 | | | | 499,613 | |
Valley National Bancorp | | | | | | | 48,165 | | | | 459,494 | |
Wilshire Bancorp Incorporated | | | | | | | 68,381 | | | | 704,324 | |
| | | | |
| | | | | | | | | | | 6,308,561 | |
| | | | | | | | | | | | |
The accompanying notes are an integral part of these financial statements.
| | | | |
| 10 | | Wells Fargo Small/Mid Cap Value Fund | | Portfolio of investments—March 31, 2016 |
| | | | | | | | | | | | |
| Security name | | | | | | Shares | | | Value | |
| | | | |
| Capital Markets: 0.36% | | | | | | | | | | | | |
Safeguard Scientifics Incorporated † | | | | | | | 13,500 | | | $ | 178,875 | |
| | | | | | | | | | | | |
| | | | |
| Consumer Finance: 0.82% | | | | | | | | | | | | |
Enova International Incorporated † | | | | | | | 64,015 | | | | 403,935 | |
| | | | | | | | | | | | |
| | | | |
| Insurance: 2.49% | | | | | | | | | | | | |
Conifer Holdings Incorporated † | | | | | | | 52,900 | | | | 345,437 | |
First Acceptance Corporation † | | | | | | | 192,321 | | | | 346,178 | |
Health Insurance Innovations Incorporated Class A † | | | | | | | 34,972 | | | | 213,679 | |
James River Group Holdings Limited | | | | | | | 9,900 | | | | 319,374 | |
| | | | |
| | | | | | | | | | | 1,224,668 | |
| | | | | | | | | | | | |
| | | | |
| REITs: 8.75% | | | | | | | | | | | | |
Owens Realty Mortgage Incorporated | | | | | | | 28,200 | | | | 450,354 | |
Potlatch Corporation | | | | | | | 18,006 | | | | 567,189 | |
Redwood Trust Incorporated | | | | | | | 43,600 | | | | 570,288 | |
UMH Properties Incorporated | | | | | | | 273,900 | | | | 2,717,088 | |
| | | | |
| | | | | | | | | | | 4,304,919 | |
| | | | | | | | | | | | |
| | | | |
| Thrifts & Mortgage Finance: 1.10% | | | | | | | | | | | | |
Northwest Bancshares Incorporated | | | | | | | 40,283 | | | | 544,223 | |
| | | | | | | | | | | | |
| | | | |
Health Care: 2.12% | | | | | | | | | | | | |
| | | | |
| Health Care Equipment & Supplies: 0.19% | | | | | | | | | | | | |
Allied Healthcare Products Incorporated † | | | | | | | 33,100 | | | | 23,167 | |
EnteroMedics Incorporated † | | | | | | | 71,193 | | | | 68,844 | |
| | | | |
| | | | | | | | | | | 92,011 | |
| | | | | | | | | | | | |
| | | | |
| Health Care Providers & Services: 0.93% | | | | | | | | | | | | |
Cross Country Healthcare Incorporated † | | | | | | | 39,481 | | | | 459,164 | |
| | | | | | | | | | | | |
| | | | |
| Health Care Technology: 1.00% | | | | | | | | | | | | |
Allscripts Healthcare Solutions Incorporated † | | | | | | | 21,222 | | | | 280,343 | |
Omnicell Incorporated † | | | | | | | 7,600 | | | | 211,812 | |
| | | | |
| | | | | | | | | | | 492,155 | |
| | | | | | | | | | | | |
| | | | |
Industrials: 15.57% | | | | | | | | | | | | |
| | | | |
| Airlines: 3.40% | | | | | | | | | | | | |
American Airlines Group Incorporated | | | | | | | 7,741 | | | | 317,458 | |
JetBlue Airways Corporation † | | | | | | | 26,548 | | | | 560,694 | |
LATAM Airlines Group ADR † | | | | | | | 53,766 | | | | 376,362 | |
United Continental Holdings Incorporated † | | | | | | | 7,000 | | | | 419,020 | |
| | | | |
| | | | | | | | | | | 1,673,534 | |
| | | | | | | | | | | | |
| | | | |
| Commercial Services & Supplies: 2.35% | | | | | | | | | | | | |
ACCO Brands Corporation † | | | | | | | 28,430 | | | | 255,301 | |
Healthcare Services Group Incorporated | | | | | | | 14,636 | | | | 538,751 | |
SP Plus Corporation † | | | | | | | 15,139 | | | | 364,244 | |
| | | | |
| | | | | | | | | | | 1,158,296 | |
| | | | | | | | | | | | |
The accompanying notes are an integral part of these financial statements.
| | | | | | |
| Portfolio of investments—March 31, 2016 | | Wells Fargo Small/Mid Cap Value Fund | | | 11 | |
| | | | | | | | | | | | |
| Security name | | | | | | Shares | | | Value | |
| | | | |
| Construction & Engineering: 6.32% | | | | | | | | | | | | |
Integrated Electrical Services Incorporated † | | | | | | | 180,100 | | | $ | 2,642,067 | |
Sterling Construction Company Incorporated † | | | | | | | 91,200 | | | | 469,680 | |
| | | | |
| | | | | | | | | | | 3,111,747 | |
| | | | | | | | | | | | |
| | | | |
| Machinery: 2.57% | | | | | | | | | | | | |
Actuant Corporation Class A | | | | | | | 12,823 | | | | 316,856 | |
Graco Incorporated | | | | | | | 3,600 | | | | 302,256 | |
Kennametal Incorporated | | | | | | | 4,928 | | | | 110,831 | |
Xylem Incorporated | | | | | | | 13,023 | | | | 532,641 | |
| | | | |
| | | | | | | | | | | 1,262,584 | |
| | | | | | | | | | | | |
| | | | |
| Trading Companies & Distributors: 0.93% | | | | | | | | | | | | |
Applied Industrial Technologies Incorporated | | | | | | | 10,600 | | | | 460,040 | |
| | | | | | | | | | | | |
| | | | |
Information Technology: 8.68% | | | | | | | | | | | | |
| | | | |
| Communications Equipment: 3.72% | | | | | | | | | | | | |
Applied Optoelectronics Incorporated † | | | | | | | 36,413 | | | | 542,918 | |
Ruckus Wireless Incorporated † | | | | | | | 47,100 | | | | 462,051 | |
Sandvine Corporation (a)† | | | | | | | 385,900 | | | | 824,979 | |
| | | | |
| | | | | | | | | | | 1,829,948 | |
| | | | | | | | | | | | |
| | | | |
| Electronic Equipment, Instruments & Components: 2.12% | | | | | | | | | | | | |
Coherent Incorporated † | | | | | | | 2,100 | | | | 192,990 | |
Knowles Corporation † | | | | | | | 21,181 | | | | 279,166 | |
Mercury Computer Systems Incorporated † | | | | | | | 28,022 | | | | 568,847 | |
| | | | |
| | | | | | | | | | | 1,041,003 | |
| | | | | | | | | | | | |
| | | | |
| Semiconductors & Semiconductor Equipment: 0.90% | | | | | | | | | | | | |
FormFactor Incorporated † | | | | | | | 61,120 | | | | 444,342 | |
| | | | | | | | | | | | |
| | | | |
| Technology Hardware, Storage & Peripherals: 1.94% | | | | | | | | | | | | |
Cray Incorporated † | | | | | | | 22,800 | | | | 955,548 | |
| | | | | | | | | | | | |
| | | | |
Materials: 11.49% | | | | | | | | | | | | |
| | | | |
| Metals & Mining: 11.49% | | | | | | | | | | | | |
Agnico-Eagle Mines Limited – U.S. Exchange Traded Shares | | | | | | | 11,635 | | | | 420,722 | |
Endeavour Mining Corporation † | | | | | | | 60,600 | | | | 514,663 | |
Lucara Diamond Corporation – U.S. Exchange Traded Shares | | | | | | | 295,144 | | | | 619,507 | |
Randgold Resources Limited ADR | | | | | | | 32,700 | | | | 2,969,487 | |
Rockwell Diamonds Incorporated †(a)(i) | | | | | | | 490,000 | | | | 28,261 | |
Rockwell Diamonds Incorporated – Legend Shares (i) | | | | | | | 701,000 | | | | 40,481 | |
Royal Gold Incorporated | | | | | | | 6,900 | | | | 353,901 | |
Sandstorm Gold Limited † | | | | | | | 115,700 | | | | 380,652 | |
Silver Wheaton Corporation – U.S. Exchange Traded Shares | | | | | | | 19,769 | | | | 327,770 | |
| | | | |
| | | | | | | | | | | 5,655,444 | |
| | | | | | | | | | | | |
The accompanying notes are an integral part of these financial statements.
| | | | |
| 12 | | Wells Fargo Small/Mid Cap Value Fund | | Portfolio of investments—March 31, 2016 |
| | | | | | | | | | | | | | | | |
| Security name | | | | | | | | Shares | | | Value | |
| | | | |
Telecommunication Services: 0.41% | | | | | | | | | | | | | | | | |
| | | | |
| Diversified Telecommunication Services: 0.41% | | | | | | | | | | | | | | | | |
Cincinnati Bell Incorporated † | | | | | | | | | | | 51,800 | | | $ | 200,466 | |
| | | | | | | | | | | | | | | | |
| | | | |
Total Common Stocks (Cost $32,275,592) | | | | | | | | | | | | | | | 46,018,282 | |
| | | | | | | | | | | | | | | | |
| | | | |
Exchange-Traded Funds: 0.87% | | | | | | | | | | | | | | | | |
Market Vectors Junior Gold Miners ETF | | | | | | | | | | | 15,454 | | | | 430,394 | |
| | | | | | | | | | | | | | | | |
| | | | |
Total Exchange-Traded Funds (Cost $464,456) | | | | | | | | | | | | | | | 430,394 | |
| | | | | | | | | | | | | | | | |
| | | | |
| | | | | | Expiration date | | | | | | | |
| Warrants: 0.02% | | | | | | | | | | | | | | | | |
| | | | |
Health Care: 0.02% | | | | | | | | | | | | | | | | |
| | | | |
| Health Care Equipment & Supplies: 0.02% | | | | | | | | | | | | | | | | |
EnteroMedics Incorporated †(a)(i) | | | | | | | 5-14-2016 | | | | 270,908 | | | | 280 | |
EnteroMedics Incorporated †(a)(i) | | | | | | | 9-28-2016 | | | | 13,680 | | | | 1,964 | |
EnteroMedics Incorporated †(a)(i) | | | | | | | 2-27-2018 | | | | 48,280 | | | | 9,346 | |
| | | | |
Total Warrants (Cost $0) | | | | | | | | | | | | | | | 11,590 | |
| | | | | | | | | | | | | | | | |
| | | | |
| | | Yield | | | | | | | | | | |
| Short-Term Investments: 5.38% | | | | | | | | | | | | | | | | |
| | | | |
| Investment Companies: 5.38% | | | | | | | | | | | | | | | | |
Wells Fargo Cash Investment Money Market Fund Select Class (l)(u) | | | 0.44 | % | | | | | | | 2,646,493 | | | | 2,646,493 | |
| | | | | | | | | | | | | | | | |
| | | | |
Total Short-Term Investments (Cost $2,646,493) | | | | | | | | | | | | | | | 2,646,493 | |
| | | | | | | | | | | | | | | | |
| | | | | | | | |
| Total investments in securities (Cost $35,386,541) * | | | 99.76 | % | | | 49,106,759 | |
Other assets and liabilities, net | | | 0.24 | | | | 116,233 | |
| | | | | | | | |
| Total net assets | | | 100.00 | % | | $ | 49,222,992 | |
| | | | | | | | |
| † | Non-income-earning security |
| (a) | The security is fair valued in accordance with procedures approved by the Board of Trustees. |
| (i) | Illiquid security for which the designation as illiquid is unaudited. |
| (l) | The issuer of the security is an affiliated person of the Fund as defined in the Investment Company Act of 1940. |
| (u) | The rate represents the 7-day annualized yield at period end. |
| * | Cost for federal income tax purposes is $36,849,473 and unrealized gains (losses) consists of: |
| | | | |
Gross unrealized gains | | $ | 18,347,130 | |
Gross unrealized losses | | | (6,089,844 | ) |
| | | | |
Net unrealized gains | | $ | 12,257,286 | |
The accompanying notes are an integral part of these financial statements.
| | | | | | |
| Statement of assets and liabilities—March 31, 2016 | | Wells Fargo Small/Mid Cap Value Fund | | | 13 | |
| | | | |
| | | | |
| |
Assets | | | | |
Investments | | | | |
In unaffiliated securities, at value (cost $32,740,048) | | $ | 46,460,266 | |
In affiliated securities, at value (cost $2,646,493) | | | 2,646,493 | |
| | | | |
Total investments, at value (cost $35,386,541) | | | 49,106,759 | |
Cash | | | 2,899 | |
Receivable for investments sold | | | 362,424 | |
Receivable for Fund shares sold | | | 42,018 | |
Receivable for dividends | | | 51,786 | |
Prepaid expenses and other assets | | | 23,854 | |
| | | | |
Total assets | | | 49,589,740 | |
| | | | |
| |
Liabilities | | | | |
Payable for investments purchased | | | 218,598 | |
Payable for Fund shares redeemed | | | 77,294 | |
Management fee payable | | | 21,984 | |
Distribution fee payable | | | 1,823 | |
Administration fees payable | | | 8,271 | |
Professional fees payable | | | 4,145 | |
Shareholder report expenses payable | | | 18,452 | |
Accrued expenses and other liabilities | | | 16,181 | |
| | | | |
Total liabilities | | | 366,748 | |
| | | | |
Total net assets | | $ | 49,222,992 | |
| | | | |
| |
NET ASSETS CONSIST OF | | | | |
Paid-in capital | | $ | 34,835,431 | |
Accumulated net realized gains on investments | | | 667,312 | |
Net unrealized gains on investments | | | 13,720,249 | |
| | | | |
Total net assets | | $ | 49,222,992 | |
| | | | |
| |
COMPUTATION OF NET ASSET VALUE AND OFFERING PRICE PER SHARE | | | | |
Net assets – Class A | | $ | 41,542,681 | |
Shares outstanding – Class A1 | | | 3,579,604 | |
Net asset value per share – Class A | | | $11.61 | |
Maximum offering price per share – Class A2 | | | $12.32 | |
Net assets – Class C | | $ | 2,965,229 | |
Shares outstanding – Class C1 | | | 271,410 | |
Net asset value per share – Class C | | | $10.93 | |
Net assets – Administrator Class | | $ | 2,665,138 | |
Shares outstanding – Administrator Class1 | | | 222,297 | |
Net asset value per share – Administrator Class | | | $11.99 | |
Net assets – Institutional Class | | $ | 2,049,944 | |
Shares outstanding – Institutional Class1 | | | 169,369 | |
Net asset value per share – Institutional Class | | | $12.10 | |
| 1 | The Fund has an unlimited number of authorized shares. |
| 2 | Maximum offering price is computed as 100/94.25 of net asset value. On investments of $50,000 or more, the offering price is reduced. |
The accompanying notes are an integral part of these financial statements.
| | | | |
| 14 | | Wells Fargo Small/Mid Cap Value Fund | | Statement of operations—year ended March 31, 2016 |
| | | | |
| | | | |
| |
Investment income | | | | |
Dividends (net of foreign withholding taxes of $6,556) | | $ | 675,772 | |
Income from affiliated securities | | | 3,610 | |
| | | | |
Total investment income | | | 679,382 | |
| | | | |
| |
Expenses | | | | |
Management fee | | | 426,275 | |
Administration fees | | | | |
Class A | | | 48,832 | |
Class C | | | 7,490 | |
Administrator Class | | | 3,456 | |
Institutional Class | | | 3,562 | |
Investor Class | | | 68,181 | 1 |
Shareholder servicing fees | | | | |
Class A | | | 56,552 | |
Class C | | | 8,316 | |
Administrator Class | | | 7,206 | |
Investor Class | | | 53,267 | 1 |
Distribution fee | | | | |
Class C | | | 24,949 | |
Custody and accounting fees | | | 15,837 | |
Professional fees | | | 42,748 | |
Registration fees | | | 75,921 | |
Shareholder report expenses | | | 36,534 | |
Trustees’ fees and expenses | | | 20,232 | |
Other fees and expenses | | | 8,968 | |
| | | | |
Total expenses | | | 908,326 | |
Less: Fee waivers and/or expense reimbursements | | | (169,611 | ) |
| | | | |
Net expenses | | | 738,715 | |
| | | | |
Net investment loss | | | (59,333 | ) |
| | | | |
| |
REALIZED AND UNREALIZED GAINS (LOSSES) ON INVESTMENTS | | | | |
Net realized gains on investments | | | 3,124,491 | |
Net change in unrealized gains (losses) on investments | | | (1,511,993 | ) |
| | | | |
Net realized and unrealized gains (losses) on investments | | | 1,612,498 | |
| | | | |
Net increase in net assets resulting from operations | | $ | 1,553,165 | |
| | | | |
| 1 | For the period from April 1, 2015 to October 23, 2015. Effective at the close of business on October 23, 2015, Investor Class shares were converted to Class A shares and are no longer offered by the Fund. |
The accompanying notes are an integral part of these financial statements.
| | | | | | |
| Statement of changes in net assets | | Wells Fargo Small/Mid Cap Value Fund | | | 15 | |
| | | | | | | | | | | | | | | | |
| | | Year ended
March 31, 2016 | | | Year ended
March 31, 2015 | |
| | | | |
Operations | | | | | | | | | | | | | | | | |
Net investment loss | | | | | | $ | (59,333 | ) | | | | | | $ | (154,084 | ) |
Net realized gains on investments | | | | | | | 3,124,491 | | | | | | | | 10,733,260 | |
Net change in unrealized gains (losses) on investments | | | | | | | (1,511,993 | ) | | | | | | | (29,960,089 | ) |
| | | | |
Net increase (decrease) in net assets resulting from operations | | | | | | | 1,553,165 | | | | | | | | (19,380,913 | ) |
| | | | |
| | | | |
Distributions to shareholders from | | | | | | | | | | | | | | | | |
Net realized gains | | | | | | | | | | | | | | | | |
Class A | | | | | | | (753,888 | ) | | | | | | | (3,859,460 | ) |
Class C | | | | | | | (57,077 | ) | | | | | | | (2,021,715 | ) |
Administrator Class | | | | | | | (44,503 | ) | | | | | | | (1,576,683 | ) |
Institutional Class | | | | | | | (57,749 | ) | | | | | | | (1,605,351 | ) |
Investor Class | | | | | | | 0 | 1 | | | | | | | (12,209,745 | ) |
| | | | |
Total distributions to shareholders | | | | | | | (913,217 | ) | | | | | | | (21,272,954 | ) |
| | | | |
| | | | |
Capital share transactions | | | Shares | | | | | | | | Shares | | | | | |
Proceeds from shares sold | | | | | | | | | | | | | | | | |
Class A | | | 3,305,207 | | | | 36,992,488 | | | | 273,650 | | | | 4,672,524 | |
Class C | | | 32,518 | | | | 336,975 | | | | 113,449 | | | | 1,504,201 | |
Administrator Class | | | 52,107 | | | | 607,564 | | | | 115,653 | | | | 2,005,080 | |
Institutional Class | | | 193,995 | | | | 2,262,265 | | | | 506,801 | | | | 8,494,369 | |
Investor Class | | | 133,107 | 1 | | | 1,492,267 | 1 | | | 607,478 | | | | 10,486,522 | |
| | | | |
| | | | | | | 41,691,559 | | | | | | | | 27,162,696 | |
| | | | |
Reinvestment of distributions | | | | | | | | | | | | | | | | |
Class A | | | 69,118 | | | | 741,633 | | | | 339,370 | | | | 3,824,702 | |
Class C | | | 4,991 | | | | 50,509 | | | | 108,994 | | | | 1,168,410 | |
Administrator Class | | | 3,654 | | | | 40,485 | | | | 128,628 | | | | 1,492,081 | |
Institutional Class | | | 4,919 | | | | 55,000 | | | | 72,544 | | | | 847,311 | |
Investor Class | | | 0 | 1 | | | 0 | 1 | | | 1,069,774 | | | | 12,099,144 | |
| | | | |
| | | | | | | 887,627 | | | | | | | | 19,431,648 | |
| | | | |
Payment for shares redeemed | | | | | | | | | | | | | | | | |
Class A | | | (788,500 | ) | | | (8,715,874 | ) | | | (725,009 | ) | | | (10,498,924 | ) |
Class C | | | (181,133 | ) | | | (1,922,252 | ) | | | (360,815 | ) | | | (4,563,950 | ) |
Administrator Class | | | (184,506 | ) | | | (2,168,373 | ) | | | (1,127,021 | ) | | | (19,233,321 | ) |
Institutional Class | | | (408,823 | ) | | | (4,578,247 | ) | | | (977,958 | ) | | | (15,827,735 | ) |
Investor Class | | | (3,670,314 | )1 | | | (41,284,417 | )1 | | | (1,533,274 | ) | | | (23,460,698 | ) |
| | | | |
| | | | | | | (58,669,163 | ) | | | | | | | (73,584,628 | ) |
| | | | |
Net decrease in net assets resulting from capital share transactions | | | | | | | (16,089,977 | ) | | | | | | | (26,990,284 | ) |
| | | | |
Total decrease in net assets | | | | | | | (15,450,029 | ) | | | | | | | (67,644,151 | ) |
| | | | |
| | | | |
Net assets | | | | | | | | | | | | | | | | |
Beginning of period | | | | | | | 64,673,021 | | | | | | | | 132,317,172 | |
| | | | |
End of period | | | | | | $ | 49,222,992 | | | | | | | $ | 64,673,021 | |
| | | | |
Undistributed (accumulated) net investment income (loss) | | | | | | $ | 0 | | | | | | | $ | (9,164 | ) |
| | | | |
| 1 | For the period from April 1, 2015 to October 23, 2015. Effective at the close of business on October 23, 2015, Investor Class shares were converted to Class A shares and are no longer offered by the Fund. |
The accompanying notes are an integral part of these financial statements.
| | | | |
| 16 | | Wells Fargo Small/Mid Cap Value Fund | | Financial highlights |
(For a share outstanding throughout each period)
| | | | | | | | | | | | | | | | | | | | | | | | |
| | | Year ended March 31 | | | Year ended October 31 | |
| CLASS A | | 2016 | | | 2015 | | | 20141 | | | 2013 | | | 2012 | | | 2011 | |
Net asset value, beginning of period | | | $11.36 | | | | $18.63 | | | | $17.66 | | | | $16.17 | | | | $14.61 | | | | $14.33 | |
Net investment income (loss) | | | 0.01 | 2 | | | (0.01 | ) | | | 0.09 | 2 | | | 0.11 | 2 | | | 0.07 | | | | 0.06 | |
Net realized and unrealized gains (losses) on investments | | | 0.44 | | | | (3.13 | ) | | | 1.93 | | | | 1.42 | | | | 1.55 | | | | 0.35 | |
| | | | | | | | | | | | | | | | | | | | | | | | |
Total from investment operations | | | 0.45 | | | | (3.14 | ) | | | 2.02 | | | | 1.53 | | | | 1.62 | | | | 0.41 | |
Distributions to shareholders from | | | | | | | | | | | | | | | | |
Net investment income | | | 0.00 | | | | 0.00 | | | | 0.00 | | | | (0.04 | ) | | | (0.06 | ) | | | (0.13 | ) |
Net realized gains | | | (0.20 | ) | | | (4.13 | ) | | | (1.05 | ) | | | 0.00 | | | | 0.00 | | | | 0.00 | |
| | | | | | | | | | | | | | | | | | | | | | | | |
Total distributions to shareholders | | | (0.20 | ) | | | (4.13 | ) | | | (1.05 | ) | | | (0.04 | ) | | | (0.06 | ) | | | (0.13 | ) |
Net asset value, end of period | | | $11.61 | | | | $11.36 | | | | $18.63 | | | | $17.66 | | | | $16.17 | | | | $14.61 | |
Total return3 | | | 4.13 | % | | | (16.66 | )% | | | 12.22 | % | | | 9.47 | % | | | 11.13 | % | | | 2.76 | % |
Ratios to average net assets (annualized) | | | | | | | | | | | | | | | | |
Gross expenses | | | 1.66 | % | | | 1.47 | % | | | 1.57 | % | | | 1.41 | % | | | 1.41 | % | | | 1.40 | % |
Net expenses | | | 1.35 | % | | | 1.35 | % | | | 1.39 | % | | | 1.40 | % | | | 1.40 | % | | | 1.40 | % |
Net investment income (loss) | | | 0.12 | % | | | (0.11 | )% | | | 1.20 | % | | | 0.68 | % | | | 0.37 | % | | | 0.37 | % |
Supplemental data | | | | | | | | | | | | | | | | |
Portfolio turnover rate | | | 34 | % | | | 33 | % | | | 24 | % | | | 29 | % | | | 32 | % | | | 34 | % |
Net assets, end of period (000s omitted) | | | $41,543 | | | | $11,288 | | | | $20,599 | | | | $19,659 | | | | $25,612 | | | | $34,642 | |
| 1 | For the five months ended March 31, 2014. The Fund changed its fiscal year end from October 31 to March 31, effective March 31, 2014. |
| 2 | Calculated based upon average shares outstanding |
| 3 | Total return calculations do not include any sales charges. Returns for periods of less than one year are not annualized. |
The accompanying notes are an integral part of these financial statements.
| | | | | | |
| Financial highlights | | Wells Fargo Small/Mid Cap Value Fund | | | 17 | |
(For a share outstanding throughout each period)
| | | | | | | | | | | | | | | | | | | | | | | | |
| | | Year ended March 31 | | | Year ended October 31 | |
| CLASS C | | 2016 | | | 2015 | | | 20141 | | | 2013 | | | 2012 | | | 2011 | |
Net asset value, beginning of period | | | $10.79 | | | | $18.07 | | | | $17.21 | | | | $15.84 | | | | $14.36 | | | | $14.10 | |
Net investment income (loss) | | | (0.09 | )2 | | | (0.13 | )2 | | | 0.03 | 2 | | | (0.01 | )2 | | | (0.08 | ) | | | (0.06 | ) |
Net realized and unrealized gains (losses) on investments | | | 0.43 | | | | (3.02 | ) | | | 1.88 | | | | 1.38 | | | | 1.56 | | | | 0.35 | |
| | | | | | | | | | | | | | | | | | | | | | | | |
Total from investment operations | | | 0.34 | | | | (3.15 | ) | | | 1.91 | | | | 1.37 | | | | 1.48 | | | | 0.29 | |
Distributions to shareholders from | | | | | | | | | | | | | | | | |
Net investment income | | | 0.00 | | | | 0.00 | | | | 0.00 | | | | 0.00 | | | | 0.00 | | | | (0.03 | ) |
Net realized gains | | | (0.20 | ) | | | (4.13 | ) | | | (1.05 | ) | | | 0.00 | | | | 0.00 | | | | 0.00 | |
| | | | | | | | | | | | | | | | | | | | | | | | |
Total distributions to shareholders | | | (0.20 | ) | | | (4.13 | ) | | | (1.05 | ) | | | 0.00 | | | | 0.00 | | | | (0.03 | ) |
Net asset value, end of period | | | $10.93 | | | | $10.79 | | | | $18.07 | | | | $17.21 | | | | $15.84 | | | | $14.36 | |
Total return3 | | | 3.32 | % | | | (17.26 | )% | | | 11.88 | % | | | 8.65 | % | | | 10.31 | % | | | 2.05 | % |
Ratios to average net assets (annualized) | | | | | | | | | | | | | | | | |
Gross expenses | | | 2.40 | % | | | 2.22 | % | | | 2.32 | % | | | 2.17 | % | | | 2.16 | % | | | 2.15 | % |
Net expenses | | | 2.10 | % | | | 2.10 | % | | | 2.14 | % | | | 2.15 | % | | | 2.15 | % | | | 2.15 | % |
Net investment income (loss) | | | (0.84 | )% | | | (0.87 | )% | | | 0.46 | % | | | (0.07 | )% | | | (0.40 | )% | | | (0.38 | )% |
Supplemental data | | | | | | | | | | | | | | | | |
Portfolio turnover rate | | | 34 | % | | | 33 | % | | | 24 | % | | | 29 | % | | | 32 | % | | | 34 | % |
Net assets, end of period (000s omitted) | | | $2,965 | | | | $4,476 | | | | $9,999 | | | | $9,347 | | | | $10,763 | | | | $12,204 | |
| 1 | For the five months ended March 31, 2014. The Fund changed its fiscal year end from October 31 to March 31, effective March 31, 2014. |
| 2 | Calculated based upon average shares outstanding |
| 3 | Total return calculations do not include any sales charges. Returns for periods of less than one year are not annualized. |
The accompanying notes are an integral part of these financial statements.
| | | | |
| 18 | | Wells Fargo Small/Mid Cap Value Fund | | Financial highlights |
(For a share outstanding throughout each period)
| | | | | | | | | | | | | | | | | | | | | | | | |
| | | Year ended March 31 | | | Year ended October 31 | |
| ADMINISTRATOR CLASS | | 2016 | | | 2015 | | | 20141 | | | 2013 | | | 2012 | | | 2011 | |
Net asset value, beginning of period | | | $11.70 | | | | $19.00 | | | | $17.97 | | | | $16.46 | | | | $14.89 | | | | $14.60 | |
Net investment income (loss) | | | 0.01 | 2 | | | (0.00 | )2,3 | | | 0.11 | 2 | | | 0.15 | 2 | | | 0.10 | | | | 0.09 | |
Net realized and unrealized gains (losses) on investments | | | 0.48 | | | | (3.17 | ) | | | 1.97 | | | | 1.44 | | | | 1.58 | | | | 0.36 | |
| | | | | | | | | | | | | | | | | | | | | | | | |
Total from investment operations | | | 0.49 | | | | (3.17 | ) | | | 2.08 | | | | 1.59 | | | | 1.68 | | | | 0.45 | |
Distributions to shareholders from | | | | | | | | | | | | | | | | |
Net investment income | | | 0.00 | | | | 0.00 | | | | 0.00 | | | | (0.08 | ) | | | (0.11 | ) | | | (0.16 | ) |
Net realized gains | | | (0.20 | ) | | | (4.13 | ) | | | (1.05 | ) | | | 0.00 | | | | 0.00 | | | | 0.00 | |
| | | | | | | | | | | | | | | | | | | | | | | | |
Total distributions to shareholders | | | (0.20 | ) | | | (4.13 | ) | | | (1.05 | ) | | | (0.08 | ) | | | (0.11 | ) | | | (0.16 | ) |
Net asset value, end of period | | | $11.99 | | | | $11.70 | | | | $19.00 | | | | $17.97 | | | | $16.46 | | | | $14.89 | |
Total return4 | | | 4.35 | % | | | (16.48 | )% | | | 12.34 | % | | | 9.75 | % | | | 11.33 | % | | | 3.13 | % |
Ratios to average net assets (annualized) | | | | | | | | | | | | | | | | |
Gross expenses | | | 1.54 | % | | | 1.28 | % | | | 1.39 | % | | | 1.24 | % | | | 1.24 | % | | | 1.24 | % |
Net expenses | | | 1.15 | % | | | 1.14 | % | | | 1.15 | % | | | 1.15 | % | | | 1.15 | % | | | 1.15 | % |
Net investment income (loss) | | | 0.13 | % | | | (0.02 | )% | | | 1.44 | % | | | 0.91 | % | | | 0.59 | % | | | 0.61 | % |
Supplemental data | | | | | | | | | | | | | | | | |
Portfolio turnover rate | | | 34 | % | | | 33 | % | | | 24 | % | | | 29 | % | | | 32 | % | | | 34 | % |
Net assets, end of period (000s omitted) | | | $2,665 | | | | $4,107 | | | | $23,445 | | | | $24,127 | | | | $68,857 | | | | $76,668 | |
| 1 | For the five months ended March 31, 2014. The Fund changed its fiscal year end from October 31 to March 31, effective March 31, 2014. |
| 2 | Calculated based upon average shares outstanding |
| 3 | Amount is less than $0.005. |
| 4 | Returns for periods of less than one year are not annualized. |
The accompanying notes are an integral part of these financial statements.
| | | | | | |
| Financial highlights | | Wells Fargo Small/Mid Cap Value Fund | | | 19 | |
(For a share outstanding throughout each period)
| | | | | | | | | | | | | | | | | | | | | | | | |
| | | Year ended March 31 | | | Year ended October 31 | |
| INSTITUTIONAL CLASS | | 2016 | | | 2015 | | | 20141 | | | 2013 | | | 2012 | | | 2011 | |
Net asset value, beginning of period | | | $11.79 | | | | $19.08 | | | | $18.06 | | | | $16.54 | | | | $14.97 | | | | $14.67 | |
Net investment income | | | 0.03 | 2 | | | 0.04 | 2 | | | 0.12 | 2 | | | 0.18 | 2 | | | 0.11 | | | | 0.11 | |
Net realized and unrealized gains (losses) on investments | | | 0.48 | | | | (3.20 | ) | | | 1.98 | | | | 1.46 | | | | 1.60 | | | | 0.38 | |
| | | | | | | | | | | | | | | | | | | | | | | | |
Total from investment operations | | | 0.51 | | | | (3.16 | ) | | | 2.10 | | | | 1.64 | | | | 1.71 | | | | 0.49 | |
Distributions to shareholders from | | | | | | | | | | | | | | | | |
Net investment income | | | 0.00 | | | | 0.00 | | | | (0.03 | ) | | | (0.12 | ) | | | (0.14 | ) | | | (0.19 | ) |
Net realized gains | | | (0.20 | ) | | | (4.13 | ) | | | (1.05 | ) | | | 0.00 | | | | 0.00 | | | | 0.00 | |
| | | | | | | | | | | | | | | | | | | | | | | | |
Total distributions to shareholders | | | (0.20 | ) | | | (4.13 | ) | | | (1.08 | ) | | | (0.12 | ) | | | (0.14 | ) | | | (0.19 | ) |
Net asset value, end of period | | | $12.10 | | | | $11.79 | | | | $19.08 | | | | $18.06 | | | | $16.54 | | | | $14.97 | |
Total return3 | | | 4.49 | % | | | (16.34 | )% | | | 12.46 | % | | | 9.94 | % | | | 11.61 | % | | | 3.28 | % |
Ratios to average net assets (annualized) | | | | | | | | | | | | | | | | |
Gross expenses | | | 1.28 | % | | | 1.03 | % | | | 1.12 | % | | | 0.99 | % | | | 0.98 | % | | | 0.97 | % |
Net expenses | | | 0.95 | % | | | 0.95 | % | | | 0.95 | % | | | 0.95 | % | | | 0.95 | % | | | 0.95 | % |
Net investment income | | | 0.27 | % | | | 0.24 | % | | | 1.65 | % | | | 1.10 | % | | | 0.74 | % | | | 0.79 | % |
Supplemental data | | | | | | | | | | | | | | | | |
Portfolio turnover rate | | | 34 | % | | | 33 | % | | | 24 | % | | | 29 | % | | | 32 | % | | | 34 | % |
Net assets, end of period (000s omitted) | | | $2,050 | | | | $4,473 | | | | $14,842 | | | | $37,671 | | | | $47,737 | | | | $29,881 | |
| 1 | For the five months ended March 31, 2014. The Fund changed its fiscal year end from October 31 to March 31, effective March 31, 2014. |
| 2 | Calculated based upon average shares outstanding |
| 3 | Returns for periods of less than one year are not annualized. |
The accompanying notes are an integral part of these financial statements.
| | | | |
| 20 | | Wells Fargo Small/Mid Cap Value Fund | | Notes to financial statements |
1. ORGANIZATION
Wells Fargo Funds Trust (the “Trust”), a Delaware statutory trust organized on March 10, 1999, is an open-end management investment company registered under the Investment Company Act of 1940, as amended (the “1940 Act”). As an investment company, the Trust follows the accounting and reporting guidance in Financial Accounting Standards Board (“FASB”) Accounting Standards Codification Topic 946, Financial Services – Investment Companies. These financial statements report on the Wells Fargo Small/Mid Cap Value Fund (the “Fund”) which is a diversified series of the Trust.
Effective at the close of business on October 23, 2015, Investor Class shares became Class A shares in a tax-free conversion. Shareholders of Investor Class received Class A shares at a value equal to the value of their Investor Class shares immediately prior to the conversion. Investor Class shares are no longer offered by the Fund.
2. SIGNIFICANT ACCOUNTING POLICIES
The following significant accounting policies, which are consistently followed in the preparation of the financial statements of the Fund, are in conformity with U.S. generally accepted accounting principles which require management to make estimates and assumptions that affect the reported amounts of assets and liabilities, disclosure of contingent assets and liabilities at the date of the financial statements, and the reported amounts of revenues and expenses during the reporting period. Actual results could differ from those estimates.
Securities valuation
All investments are valued each business day as of the close of regular trading on the New York Stock Exchange (generally 4 p.m. Eastern Time), although the Fund may deviate from this calculation time under unusual or unexpected circumstances.
Equity securities that are listed on a foreign or domestic exchange or market are valued at the official closing price or, if none, the last sales price. If no sale occurs on the principal exchange or market that day, the prior day’s price will be deemed “stale” and a fair value price will be determined in accordance with the Fund’s Valuation Procedures.
The values of securities denominated in foreign currencies are translated into U.S. dollars at rates provided by an independent foreign currency pricing source at a time each business day specified by the Management Valuation Team of Wells Fargo Funds Management, LLC (“Funds Management”).
Many securities markets and exchanges outside the U.S. close prior to the close of the New York Stock Exchange and therefore may not fully reflect trading or events that occur after the close of the principal exchange in which the foreign securities are traded, but before the close of the New York Stock Exchange. If such trading or events are expected to materially affect the value of such securities, then fair value pricing procedures approved by the Board of Trustees of the Fund are applied. These procedures take into account multiple factors including movements in U.S. securities markets after foreign exchanges close. Foreign securities that are fair valued under these procedures are categorized as Level 2 and the application of these procedures may result in transfers between Level 1 and Level 2. Depending on market activity, such fair valuations may be frequent. Such fair value pricing may result in net asset values that are higher or lower than net asset values based on the last reported sales price or latest quoted bid price. On March 31, 2016, such fair value pricing was not used in pricing foreign securities.
Investments in registered open-end investment companies are valued at net asset value.
Investments which are not valued using any of the methods discussed above are valued at their fair value, as determined in good faith by the Board of Trustees. The Board of Trustees has established a Valuation Committee comprised of the Trustees and has delegated to it the authority to take any actions regarding the valuation of portfolio securities that the Valuation Committee deems necessary or appropriate, including determining the fair value of portfolio securities, unless the determination has been delegated to the Management Valuation Team. The Board of Trustees retains the authority to make or ratify any valuation decisions or approve any changes to the Valuation Procedures as it deems appropriate. On a quarterly basis, the Board of Trustees receives reports on any valuation actions taken by the Valuation Committee or the Management Valuation Team which may include items for ratification.
Valuations of fair valued securities are compared to the next actual sales price when available, or other appropriate market values, to assess the continued appropriateness of the fair valuation methodologies used. These securities are fair valued on a day-to-day basis, taking into consideration changes to appropriate market information and any significant changes to the inputs considered in the valuation process until there is a readily available price provided on an exchange or by an independent pricing service. Valuations received from an independent pricing service or independent broker-dealer quotes are periodically validated by comparisons to most recent trades and valuations provided by other independent pricing services in addition to the review of prices by the manager and/or subadviser. Unobservable inputs
| | | | | | |
| Notes to financial statements | | Wells Fargo Small/Mid Cap Value Fund | | | 21 | |
used in determining fair valuations are identified based on the type of security, taking into consideration factors utilized by market participants in valuing the investment, knowledge about the issuer and the current market environment.
Foreign currency translation
The accounting records of the Fund are maintained in U.S. dollars. The values of other assets and liabilities denominated in foreign currencies are translated into U.S. dollars at rates provided by an independent foreign currency pricing source at a time each business day specified by the Management Valuation Team. Purchases and sales of securities, and income and expenses are converted at the rate of exchange on the respective dates of such transactions. Net realized foreign exchange gains or losses arise from sales of foreign currencies, currency gains or losses realized between the trade and settlement dates on securities transactions, and the difference between the amounts of dividends, interest and foreign withholding taxes recorded and the U.S. dollar equivalent of the amounts actually paid or received. Net unrealized foreign exchange gains and losses arise from changes in the fair value of assets and liabilities other than investments in securities resulting from changes in exchange rates. The changes in net assets arising from changes in exchange rates and the changes in net assets resulting from changes in market prices of securities are not separately presented. Such changes are included in net realized and unrealized gains or losses from investments.
Security transactions and income recognition
Securities transactions are recorded on a trade date basis. Realized gains or losses are recorded on the basis of identified cost.
Dividend income is recognized on the ex-dividend date, except for certain dividends from foreign securities, which are recorded as soon as the custodian verifies the ex-dividend date. Dividend income from foreign securities is recorded net of foreign taxes withheld where recovery of such taxes is not assured.
Distributions to shareholders
Distributions to shareholders from net investment income and net realized gains, if any, are recorded on the ex-dividend date. Such distributions are determined in conformity with federal income tax regulations, which may differ in amount or character from net investment income and realized gains recognized for purposes of U.S. generally accepted accounting principles.
Federal and other taxes
The Fund intends to continue to qualify as a regulated investment company by distributing substantially all of its investment company taxable income and any net realized capital gains (after reduction for capital loss carryforwards) sufficient to relieve it from all, or substantially all, federal income taxes. Accordingly, no provision for federal income taxes was required.
The Fund’s income and federal excise tax returns and all financial records supporting those returns for the prior three fiscal years are subject to examination by the federal and Delaware revenue authorities. Management has analyzed the Fund’s tax positions taken on federal, state, and foreign tax returns for all open tax years and does not believe that there are any uncertain tax positions that require recognition of a tax liability.
Reclassifications are made to the Fund’s capital accounts for permanent tax differences to reflect income and gains available for distribution (or available capital loss carryforwards) under federal income tax regulations. U.S. generally accepted accounting principles require that certain components of net assets be adjusted to reflect permanent differences between financial and tax reporting. In addition, the Fund may utilize equalization accounting for tax purposes and designate earnings and profits, including net realized gains distributed to shareholders on redemption of shares, as a part of the dividends paid deduction for income tax purposes. These reclassifications have no effect on net assets or net asset values per share. The primary permanent differences causing such reclassifications are due to dividends from certain securities, and net operating losses. At March 31, 2016, as a result of permanent book-to-tax differences, the following reclassification adjustments were made on the Statement of Assets and Liabilities:
| | | | |
| Paid-in capital | | Accumulated net
investment loss | | Accumulated net
realized gains
on investments |
| $(280,947) | | $68,497 | | $212,450 |
| | | | |
| 22 | | Wells Fargo Small/Mid Cap Value Fund | | Notes to financial statements |
Class allocations
The separate classes of shares offered by the Fund differ principally in applicable sales charges, distribution, shareholder servicing, and administration fees. Class specific expenses are charged directly to that share class. Investment income, common expenses, and realized and unrealized gains (losses) on investments are allocated daily to each class of shares based on the relative proportion of net assets of each class.
3. FAIR VALUATION MEASUREMENTS
Fair value measurements of investments are determined within a framework that has established a fair value hierarchy based upon the various data inputs utilized in determining the value of the Fund’s investments. The three-level hierarchy gives the highest priority to unadjusted quoted prices in active markets for identical assets or liabilities (Level 1) and the lowest priority to significant unobservable inputs (Level 3). The Fund’s investments are classified within the fair value hierarchy based on the lowest level of input that is significant to the fair value measurement. The inputs are summarized into three broad levels as follows:
| n | | Level 1 – quoted prices in active markets for identical securities |
| n | | Level 2 – other significant observable inputs (including quoted prices for similar securities, interest rates, prepayment speeds, credit risk, use of amortized cost, etc.) |
| n | | Level 3 – significant unobservable inputs (including the Fund’s own assumptions in determining the fair value of investments) |
The inputs or methodologies used for valuing investments in securities are not necessarily an indication of the risk associated with investing in those securities.
The following is a summary of the inputs used in valuing the Fund’s assets and liabilities as of March 31, 2016:
| | | | | | | | | | | | | | | | |
| | | Quoted prices
(Level 1) | | | Other significant
observable inputs
(Level 2) | | | Significant
unobservable inputs (Level 3) | | | Total | |
Assets | | | | | | | | | | | | | | | | |
Investments in: | | | | |
| | | | |
Common stock | | | | | | | | | | | | | | | | |
Consumer discretionary | | $ | 10,267,587 | | | $ | 394,800 | | | $ | 0 | | | $ | 10,662,387 | |
Energy | | | 3,554,432 | | | | 0 | | | | 0 | | | | 3,554,432 | |
Financials | | | 12,965,181 | | | | 0 | | | | 0 | | | | 12,965,181 | |
Health care | | | 1,043,330 | | | | 0 | | | | 0 | | | | 1,043,330 | |
Industrials | | | 7,666,201 | | | | 0 | | | | 0 | | | | 7,666,201 | |
Information technology | | | 3,445,862 | | | | 824,979 | | | | 0 | | | | 4,270,841 | |
Materials | | | 4,967,195 | | | | 688,249 | | | | 0 | | | | 5,655,444 | |
Telecommunication services | | | 200,466 | | | | 0 | | | | 0 | | | | 200,466 | |
| | | | |
Exchange-traded funds | | | 430,394 | | | | 0 | | | | 0 | | | | 430,394 | |
| | | | |
Warrants | | | | | | | | | | | 0 | | | | | |
Health care | | | 0 | | | | 11,590 | | | | 0 | | | | 11,590 | |
| | | | |
Short-term investments | | | | | | | | | | | 0 | | | | | |
Investment companies | | | 2,646,493 | | | | 0 | | | | 0 | | | | 2,646,493 | |
Total assets | | $ | 47,187,141 | | | $ | 1,919,618 | | | $ | 0 | | | $ | 49,106,759 | |
The Fund recognizes transfers between levels within the fair value hierarchy at the end of the reporting period. At March 31, 2016, the Fund did not have any transfers into/out of Level 1, Level 2, or Level 3.
4. TRANSACTIONS WITH AFFILIATES
Management fee
Funds Management, an indirect wholly owned subsidiary of Wells Fargo & Company (“Wells Fargo”), is the manager of the Fund and provides advisory and fund-level administrative services under an investment management agreement. Under the investment management agreement, Funds Management is responsible for, among other services,
| | | | | | |
| Notes to financial statements | | Wells Fargo Small/Mid Cap Value Fund | | | 23 | |
implementing the investment objectives and strategies of the Fund, supervising the applicable subadviser, providing fund-level administrative services in connection with the Fund’s operations, and providing any other fund-level administrative services reasonably necessary for the operation of the Fund. As compensation for its services under the investment management agreement, Funds Management is entitled to receive an annual management fee starting at 0.80% and declining to 0.63% as the average daily net assets of the Fund increase.
Prior to July 1, 2015, Funds Management provided advisory services pursuant to an investment advisory agreement and was entitled to receive an annual fee which started at 0.75% and declined to 0.60% as the average daily net assets of the Fund increased. In addition, fund-level administrative services were provided by Funds Management under a separate administration agreement at an annual fee which started at 0.05% and declined to 0.03% as the average daily net assets of the Fund increased. For financial statement purposes, the advisory fee and fund-level administration fee for the year ended March 31, 2016 have been included in management fee on the Statement of Operations.
For the year ended March 31, 2016, the management fee was equivalent to an annual rate of 0.80% of the Fund’s average daily net assets.
Funds Management has retained the services of a subadviser to provide daily portfolio management to the Fund. The fee for subadvisory services is borne by Funds Management. Wells Capital Management Incorporated, an affiliate of Funds Management and an indirect wholly owned subsidiary of Wells Fargo, is the subadviser to the Fund and is entitled to receive a fee from Funds Management at an annual rate starting at 0.45% and declining to 0.35% as the average daily net assets of the Fund increase.
Administration fees
Under a class-level administration agreement, Funds Management provides class-level administrative services to the Fund, which includes paying fees and expenses for services provided by the transfer agent, sub-transfer agents, omnibus account servicers and record-keepers. As compensation for its services under the class-level administration agreement, Funds Management receives an annual fee which is calculated based on the average daily net assets of each class as follows:
| | | | | | | | |
| | | Class-level administration fee | |
| | | Current rate | | | Rate prior to
July 1, 2015 | |
Class A, Class C | | | 0.21 | % | | | 0.26 | % |
Administrator Class | | | 0.13 | | | | 0.10 | |
Institutional Class | | | 0.13 | | | | 0.08 | |
Investor Class | | | 0.32 | | | | 0.32 | |
Funds Management has contractually waived and/or reimbursed management and administration fees to the extent necessary to maintain certain net operating expense ratios for the Fund. Waiver of fees and/or reimbursement of expenses by Funds Management were made first from fund level expenses on a proportionate basis and then from class specific expenses. Funds Management has committed through July 31, 2016 to waive fees and/or reimburse expenses to the extent necessary to cap the Fund’s expenses at 1.35% for Class A shares, 2.10% for Class C shares, 1.15% for Administrator Class shares, and 0.95% for Institutional Class shares. After this time, the cap may be increased or the commitment to maintain the cap may be terminated only with the approval of the Board of Trustees.
Distribution fee
The Trust has adopted a distribution plan for Class C shares of the Fund pursuant to Rule 12b-1 under the 1940 Act. A distribution fee is charged to Class C shares and paid to Wells Fargo Funds Distributor, LLC (“Funds Distributor”), the principal underwriter, at an annual rate of 0.75% of the average daily net assets of Class C shares.
In addition, Funds Distributor is entitled to receive the front-end sales charge from the purchase of Class A shares and a contingent deferred sales charge on the redemption of certain Class A shares. Funds Distributor is also entitled to receive the contingent deferred sales charges from redemptions of Class B and Class C shares. For the year ended March 31, 2016, Funds Distributor received $525 from the sale of Class A shares and $14 in contingent deferred sales charges from redemptions of Class C shares.
| | | | |
| 24 | | Wells Fargo Small/Mid Cap Value Fund | | Notes to financial statements |
Shareholder servicing fees
The Trust has entered into contracts with one or more shareholder servicing agents, whereby Class A, Class C, Administrator Class, and Investor Class of the Fund are charged a fee at an annual rate of 0.25% of the average daily net assets of each respective class.
A portion of these total shareholder servicing fees were paid to affiliates of Wells Fargo.
5. INVESTMENT PORTFOLIO TRANSACTIONS
Purchases and sales of investments, excluding U.S. government obligations (if any) and short-term securities, for the year ended March 31, 2016 were $17,818,738 and $34,167,101, respectively.
6. BANK BORROWINGS
The Trust (excluding the money market funds and certain other funds) and Wells Fargo Variable Trust are parties to a $200,000,000 revolving credit agreement whereby the Fund is permitted to use bank borrowings for temporary or emergency purposes, such as to fund shareholder redemption requests. Interest under the credit agreement is charged to the Fund based on a borrowing rate equal to the higher of the Federal Funds rate in effect on that day plus 1.25% or the overnight LIBOR rate in effect on that day plus 1.25%. In addition, an annual commitment fee equal to 0.20% of the unused balance is allocated to each participating fund. Prior to September 1, 2015, the revolving credit agreement amount was $150,000,000 and the annual commitment fee was equal to 0.10% of the unused balance which was allocated to each participating fund.
For the year ended March 31, 2016, there were no borrowings by the Fund under the agreement.
7. DISTRIBUTIONS TO SHAREHOLDERS
The tax character of distributions paid during the years ended March 31, 2016 and March 31, 2015 were as follows:
| | | | | | | | |
| | | Year ended March 31 | |
| | | 2016 | | | 2015 | |
Ordinary income | | $ | 0 | | | $ | 3,167,177 | |
Long-term capital gain | | | 913,217 | | | | 18,105,777 | |
As of March 31, 2016, the components of distributable earnings on a tax basis were as follows:
| | |
Undistributed long-term gain | | Unrealized
gains |
| $2,149,357 | | $12,238,204 |
8. CONCENTRATION RISK
Concentration risks result from exposure to a limited number of sectors. A fund that invests a substantial portion of its assets in any sector may be more affected by changes in that sector than would be a fund whose investments are not heavily weighted in any sector.
9. INDEMNIFICATION
Under the Trust’s organizational documents, the officers and Trustees have been granted certain indemnification rights against certain liabilities that may arise out of performance of their duties to the Trust. Additionally, in the normal course of business, the Trust may enter into contracts with service providers that contain a variety of indemnification clauses. The Trust’s maximum exposure under these arrangements is dependent on future claims that may be made against the Fund and, therefore, cannot be estimated.
10. REORGANIZATION
At a regular meeting of the Board of Trustees held on February 17-18, 2016, the Trustees of the Fund approved a Plan of Reorganization (the “Plan”). Under the Plan, Wells Fargo Small Cap Value Fund will acquire the assets and assume the liabilities of the Fund in exchange for shares of Wells Fargo Small Cap Value Fund.
A Special Meeting of Shareholders of the Fund will be held on June 28, 2016 to consider and vote on the Plan. On May 6, 2016, materials for this meeting were mailed to shareholders of record on April 15, 2016.
| | | | | | |
| Report of independent registered public accounting firm | | Wells Fargo Small/Mid Cap Value Fund | | | 25 | |
BOARD OF TRUSTEES AND SHAREHOLDERS OF WELLS FARGO FUNDS TRUST:
We have audited the accompanying statement of assets and liabilities, including the portfolio of investments, of the Wells Fargo Small/Mid Cap Value Fund (formerly known as Wells Fargo Advantage Small/Mid Cap Value Fund) (the “Fund”), one of the funds constituting the Wells Fargo Funds Trust, as of March 31, 2016, and the related statement of operations for the year then ended, the statements of changes in net assets for each of the years in the two-year period then ended, and the financial highlights for each of the years in the two-year period then ended, the period from November 1, 2013 to March 31, 2014 and each of the years in the three-year period ended October 31, 2013. These financial statements and financial highlights are the responsibility of the Fund’s management. Our responsibility is to express an opinion on these financial statements and financial highlights based on our audits.
We conducted our audits in accordance with the standards of the Public Company Accounting Oversight Board (United States). Those standards require that we plan and perform the audit to obtain reasonable assurance about whether the financial statements and financial highlights are free of material misstatement. An audit includes examining, on a test basis, evidence supporting the amounts and disclosures in the financial statements. Our procedures included confirmation of securities owned as of March 31, 2016, by correspondence with the custodian and brokers or by other appropriate auditing procedures. An audit also includes assessing the accounting principles used and significant estimates made by management, as well as evaluating the overall financial statement presentation. We believe that our audits provide a reasonable basis for our opinion.
In our opinion, the financial statements and financial highlights referred to above present fairly, in all material respects, the financial position of the Wells Fargo Small/Mid Cap Value Fund as of March 31, 2016, the results of its operations for the year then ended, the changes in its net assets for each of the years in the two-year period then ended, and the financial highlights for each of the years or periods noted in the first paragraph above, in conformity with U.S. generally accepted accounting principles.

Boston, Massachusetts
May 25, 2016
| | | | |
| 26 | | Wells Fargo Small/Mid Cap Value Fund | | Other information (unaudited) |
TAX INFORMATION
Pursuant to Section 852 of the Internal Revenue Code, $913,217 was designated as long-term capital gain distributions for the fiscal year ended March 31, 2016.
PROXY VOTING INFORMATION
A description of the policies and procedures that the Fund uses to determine how to vote proxies relating to portfolio securities is available, upon request, by calling 1-800-222-8222, visiting our website at wellsfargofunds.com, or visiting the SEC website at sec.gov. Information regarding how the Fund voted proxies relating to portfolio securities during the most recent 12-month period ended June 30 is available on the Fund’s website at wellsfargofunds.com or by visiting the SEC website at sec.gov.
PORTFOLIO HOLDINGS INFORMATION
The complete portfolio holdings for the Fund are publicly available monthly on the Fund’s website (wellsfargofunds.com), on a one-month delayed basis. In addition, top ten holdings information (excluding derivative positions) for the Fund is publicly available on the Fund’s website on a monthly, seven-day or more delayed basis. The Fund files its complete schedule of portfolio holdings with the SEC for the first and third quarters of each fiscal year on Form N-Q, which is available by visiting the SEC website at sec.gov. In addition, the Fund’s Form N-Q may be reviewed and copied at the SEC’s Public Reference Room in Washington, DC, and at regional offices in New York City, at 233 Broadway, and in Chicago, at 175 West Jackson Boulevard, Suite 900. Information about the Public Reference Room may be obtained by calling 1-800-SEC-0330.
| | | | | | |
| Other information (unaudited) | | Wells Fargo Small/Mid Cap Value Fund | | | 27 | |
BOARD OF TRUSTEES AND OFFICERS
Each of the Trustees and Officers1 listed in the table below acts in identical capacities for each fund in the Wells Fargo family of funds, which consists of 144 mutual funds comprising the Wells Fargo Funds Trust, Wells Fargo Variable Trust, Wells Fargo Master Trust and four closed-end funds (collectively the “Fund Complex”). This table should be read in conjunction with the Prospectus and the Statement of Additional Information2. The mailing address of each Trustee and Officer is 525 Market Street, 12th Floor, San Francisco, CA 94105. Each Trustee and Officer serves an indefinite term, however, each Trustee serves such term until reaching the mandatory retirement age established by the Trustees.
Independent Trustees
| | | | | | |
Name and year of birth | | Position held and length of service* | | Principal occupations during past five years or longer | | Current other public
company or investment
company directorships |
| William R. Ebsworth (Born 1957) | | Trustee, since 2015 | | Retired. From 1984 to 2013, equities analyst, portfolio manager, research director and chief financial officer at Fidelity Management and Research Company in Boston, Tokyo, and Hong Kong and retired in 2013 as Chief Investment Officer of Fidelity Strategic Advisers, Inc. where he lead a team of investment professionals managing client assets. Prior thereto, Board member of Hong Kong Securities Clearing Co., Hong Kong Options Clearing Corp., the Thailand International Fund, Ltd., Fidelity Investments Life Insurance Company, and Empire Fidelity Investments Life Insurance Company. Mr. Ebsworth is a CFA® charterholder and an Adjunct Lecturer, Finance, at Babson College. | | Asset Allocation Trust |
| Jane A. Freeman (Born 1953) | | Trustee, since 2015 | | Retired. From 2012 to 2014 and 1999 to 2008, Chief Financial Officer of Scientific Learning Corporation. From 2008 to 2012, Ms. Freeman provided consulting services related to strategic business projects. Prior to 1999, Portfolio Manager at Rockefeller & Co. and Scudder, Stevens & Clark. Board member of the Harding Loevner Funds from 1996 to 2014, serving as both Lead Independent Director and chair of the Audit Committee. Board member of the Russell Exchange Traded Funds Trust from 2011 to 2012 and the chair of the Audit Committee. Ms. Freeman is Chair of Taproot Foundation (non-profit organization), a Board Member of Ruth Bancroft Garden (non-profit organization) and an inactive chartered financial analyst. | | Asset Allocation Trust |
| Peter G. Gordon (Born 1942) | | Trustee, since 1998; Chairman, since 2005 | | Co-Founder, Retired Chairman, President and CEO of Crystal Geyser Water Company. Trustee Emeritus, Colby College. | | Asset Allocation Trust |
| Isaiah Harris, Jr. (Born 1952) | | Trustee, since 2009 | | Retired. Chairman of the Board of CIGNA Corporation since 2009, and Director since 2005. From 2003 to 2011, Director of Deluxe Corporation. Prior thereto, President and CEO of BellSouth Advertising and Publishing Corp. from 2005 to 2007, President and CEO of BellSouth Enterprises from 2004 to 2005 and President of BellSouth Consumer Services from 2000 to 2003. Emeritus member of the Iowa State University Foundation Board of Governors. Emeritus Member of the Advisory Board of Iowa State University School of Business. Advisory Board Member, Palm Harbor Academy (charter school). Advisory Board Member, Child Evangelism Fellowship (non-profit). Mr. Harris is a certified public accountant (inactive status). | | CIGNA Corporation; Asset Allocation Trust |
| Judith M. Johnson (Born 1949) | | Trustee, since 2008; Audit Committee Chairman, since 2008 | | Retired. Prior thereto, Chief Executive Officer and Chief Investment Officer of Minneapolis Employees Retirement Fund from 1996 to 2008. Ms. Johnson is an attorney, certified public accountant and a certified managerial accountant. | | Asset Allocation Trust |
| David F. Larcker (Born 1950) | | Trustee, since 2009 | | James Irvin Miller Professor of Accounting at the Graduate School of Business, Stanford University, Director of the Corporate Governance Research Initiative and Senior Faculty of The Rock Center for Corporate Governance since 2006. From 2005 to 2008, Professor of Accounting at the Graduate School of Business, Stanford University. Prior thereto, Ernst & Young Professor of Accounting at The Wharton School, University of Pennsylvania from 1985 to 2005. | | Asset Allocation Trust |
| | | | |
| 28 | | Wells Fargo Small/Mid Cap Value Fund | | Other information (unaudited) |
| | | | | | |
Name and year of birth | | Position held and length of service* | | Principal occupations during past five years or longer | | Current other public
company or investment
company directorships |
| Olivia S. Mitchell (Born 1953) | | Trustee, since 2006 | | International Foundation of Employee Benefit Plans Professor, Wharton School of the University of Pennsylvania since 1993. Director of Wharton’s Pension Research Council and Boettner Center on Pensions & Retirement Research, and Research Associate at the National Bureau of Economic Research. Previously, Cornell University Professor from 1978 to 1993. | | Asset Allocation Trust |
| Timothy J. Penny (Born 1951) | | Trustee, since 1996 | | President and Chief Executive Officer of Southern Minnesota Initiative Foundation, a non-profit organization, since 2007 and Senior Fellow at the Humphrey Institute Policy Forum at the University of Minnesota since 1995. Member of the Board of Trustees of NorthStar Education Finance, Inc., a non-profit organization, since 2007. | | Asset Allocation Trust |
| Michael S. Scofield (Born 1943) | | Trustee, since 2010 | | Served on the Investment Company Institute’s Board of Governors and Executive Committee from 2008-2011 as well the Governing Council of the Independent Directors Council from 2006-2011 and the Independent Directors Council Executive Committee from 2008-2011. Chairman of the IDC from 2008-2010. Institutional Investor (Fund Directions) Trustee of Year in 2007. Trustee of the Evergreen Funds complex (and its predecessors) from 1984 to 2010. Chairman of the Evergreen Funds from 2000-2010. Former Trustee of the Mentor Funds. Retired Attorney, Law Offices of Michael S. Scofield. | | Asset Allocation Trust |
| * | Length of service dates reflect the Trustee’s commencement of service with the Trust’s predecessor entities, where applicable. |
Officers
| | | | | | |
Name and year of birth | | Position held and
length of service | | Principal occupations during past five years or longer | | |
Karla M. Rabusch
(Born 1959) | | President, since 2003 | | Executive Vice President of Wells Fargo Bank, N.A. and President of Wells Fargo Funds Management, LLC since 2003. | | |
Nancy Wiser1
(Born 1967) | | Treasurer, since 2012 | | Executive Vice President of Wells Fargo Funds Management, LLC since 2011. Chief Operating Officer and Chief Compliance Officer at LightBox Capital Management LLC, from 2008 to 2011. | | |
C. David Messman
(Born 1960) | | Secretary, since 2000; Chief Legal Officer, since 2003 | | Senior Vice President and Secretary of Wells Fargo Funds Management, LLC since 2001. Assistant General Counsel of Wells Fargo Bank, N.A. since 2013 and Vice President and Managing Counsel of Wells Fargo Bank, N.A. from 1996 to 2013. | | |
Debra Ann Early
(Born 1964) | | Chief Compliance Officer, since 2007 | | Executive Vice President of Wells Fargo Funds Management, LLC since 2014, Senior Vice President and Chief Compliance Officer from 2007 to 2014. | | |
David Berardi
(Born 1975) | | Assistant Treasurer, since 2009 | | Vice President of Wells Fargo Funds Management, LLC since 2009. Vice President of Evergreen Investment Management Company, LLC from 2008 to 2010. Manager of Fund Reporting and Control for Evergreen Investment Management Company, LLC from 2004 to 2010. | | |
Jeremy DePalma1
(Born 1974) | | Assistant Treasurer, since 2009 | | Senior Vice President of Wells Fargo Funds Management, LLC since 2009. Senior Vice President of Evergreen Investment Management Company, LLC from 2008 to 2010 and head of the Fund Reporting and Control Team within Fund Administration from 2005 to 2010. | | |
| 1 | Nancy Wiser acts as Treasurer of 72 funds in the Fund Complex. Jeremy DePalma acts as Treasurer of 72 funds and Assistant Treasurer of 72 funds in the Fund Complex. |
| 2 | The Statement of Additional Information includes additional information about the Trustees and is available, without charge, upon request, by calling 1-800-222-8222 or by visiting the website at wellsfargofunds.com. |
| | | | | | |
| List of abbreviations | | Wells Fargo Small/Mid Cap Value Fund | | | 29 | |
The following is a list of common abbreviations for terms and entities that may have appeared in this report.
| ACA | — ACA Financial Guaranty Corporation |
| ADR | — American depositary receipt |
| ADS | — American depositary shares |
| AGC | — Assured Guaranty Corporation |
| AGM | — Assured Guaranty Municipal |
| Ambac | — Ambac Financial Group Incorporated |
| AMT | — Alternative minimum tax |
| BAN | — Bond anticipation notes |
| BHAC | — Berkshire Hathaway Assurance Corporation |
| CAB | — Capital appreciation bond |
| CCAB | — Convertible capital appreciation bond |
| CDA | — Community Development Authority |
| CDO | — Collateralized debt obligation |
| DRIVER | — Derivative inverse tax-exempt receipts |
| DW&P | — Department of Water & Power |
| DWR | — Department of Water Resources |
| ECFA | — Educational & Cultural Facilities Authority |
| EDA | — Economic Development Authority |
| EDFA | — Economic Development Finance Authority |
| ETF | — Exchange-traded fund |
| FDIC | — Federal Deposit Insurance Corporation |
| FFCB | — Federal Farm Credit Banks |
| FGIC | — Financial Guaranty Insurance Corporation |
| FHA | — Federal Housing Administration |
| FHLB | — Federal Home Loan Bank |
| FHLMC | — Federal Home Loan Mortgage Corporation |
| FICO | — The Financing Corporation |
| FNMA | — Federal National Mortgage Association |
| GDR | — Global depositary receipt |
| GNMA | — Government National Mortgage Association |
| HCFR | — Healthcare facilities revenue |
| HEFA | — Health & Educational Facilities Authority |
| HEFAR | — Higher education facilities authority revenue |
| HFA | — Housing Finance Authority |
| HFFA | — Health Facilities Financing Authority |
| HUD | — Department of Housing and Urban Development |
| IDA | — Industrial Development Authority |
| IDAG | — Industrial Development Agency |
| KRW | — Republic of Korea won |
| LIBOR | — London Interbank Offered Rate |
| LIFER | — Long Inverse Floating Exempt Receipts |
| LLC | — Limited liability company |
| LLLP | — Limited liability limited partnership |
| LLP | — Limited liability partnership |
| MBIA | — Municipal Bond Insurance Association |
| MFHR | — Multifamily housing revenue |
| MSTR | — Municipal securities trust receipts |
| MUD | — Municipal Utility District |
| National | — National Public Finance Guarantee Corporation |
| PCFA | — Pollution Control Financing Authority |
| PCL | — Public Company Limited |
| PCR | — Pollution control revenue |
| PFA | — Public Finance Authority |
| PFFA | — Public Facilities Financing Authority |
| PFOTER | — Puttable floating option tax-exempt receipts |
| plc | — Public limited company |
| PUTTER | — Puttable tax-exempt receipts |
| R&D | — Research & development |
| Radian | — Radian Asset Assurance |
| RAN | — Revenue anticipation notes |
| RDA | — Redevelopment Authority |
| RDFA | — Redevelopment Finance Authority |
| REIT | — Real estate investment trust |
| ROC | — Reset option certificates |
| SAVRS | — Select auction variable rate securities |
| SBA | — Small Business Authority |
| SDR | — Swedish depositary receipt |
| SFHR | — Single-family housing revenue |
| SFMR | — Single-family mortgage revenue |
| SPA | — Standby purchase agreement |
| SPDR | — Standard & Poor’s Depositary Receipts |
| SPEAR | — Short Puttable Exempt Adjustable Receipts |
| STRIPS | — Separate trading of registered interest and |
| TAN | — Tax anticipation notes |
| TIPS | — Treasury inflation-protected securities |
| TRAN | — Tax revenue anticipation notes |
| TTFA | — Transportation Trust Fund Authority |
| TVA | — Tennessee Valley Authority |
This page is intentionally left blank.
This page is intentionally left blank.
This page is intentionally left blank.

For more information
More information about Wells Fargo Funds is available free upon request. To obtain literature, please write, email, visit the Fund’s website, or call:
Wells Fargo Funds
P.O. Box 8266
Boston, MA 02266-8266
Email: fundservice@wellsfargo.com
Website: wellsfargofunds.com
Individual investors: 1-800-222-8222
Retail investment professionals: 1-888-877-9275
Institutional investment professionals: 1-866-765-0778
This report and the financial statements contained herein are submitted for the general information of the shareholders of the Fund. If this report is used for promotional purposes, distribution of the report must be accompanied or preceded by a current prospectus. Before investing, please consider the investment objectives, risks, charges, and expenses of the investment. For a current prospectus and, if available, a summary prospectus, containing this information, call 1-800-222-8222 or visit the Fund’s website at wellsfargofunds.com. Read the prospectus carefully before you invest or send money.
Wells Fargo Asset Management (WFAM) is a trade name used by the asset management businesses of Wells Fargo & Company. Wells Fargo Funds Management, LLC, a wholly owned subsidiary of Wells Fargo & Company, provides investment advisory and administrative services for Wells Fargo Funds. Other affiliates of Wells Fargo & Company provide subadvisory and other services for the funds. The funds are distributed by Wells Fargo Funds Distributor, LLC, Member FINRA, an affiliate of Wells Fargo & Company.
NOT FDIC INSURED ¡ NO BANK GUARANTEE ¡ MAY LOSE VALUE
© 2016 Wells Fargo Funds Management, LLC. All rights reserved.
| | |
 | | 241818 05-16 A245/AR245 03-16 |
Annual Report
March 31, 2016

Wells Fargo Special Small Cap Value Fund


Reduce clutter. Save trees.
Sign up for electronic delivery of prospectuses and shareholder reports at wellsfargo.com/advantagedelivery
Contents
The views expressed and any forward-looking statements are as of March 31, 2016, unless otherwise noted, and are those of the Fund managers and/or Wells Fargo Funds Management, LLC. Discussions of individual securities, or the markets generally, or any Wells Fargo Fund are not intended as individual recommendations. Future events or results may vary significantly from those expressed in any forward-looking statements. The views expressed are subject to change at any time in response to changing circumstances in the market. Wells Fargo Funds Management, LLC and the Fund disclaim any obligation to publicly update or revise any views expressed or forward-looking statements.
NOT FDIC INSURED ¡ NO BANK GUARANTEE ¡ MAY LOSE VALUE
| | | | |
| 2 | | Wells Fargo Special Small Cap Value Fund | | Letter to shareholders (unaudited) |

Karla M. Rabusch
President
Wells Fargo Funds
Throughout the period, stock performance was highly volatile.
Stock values recovered during the second half of the first quarter of 2016.
Dear Valued Shareholder:
We are pleased to offer you this annual report for the Wells Fargo Special Small Cap Value Fund for the 12-month period that ended March 31, 2016. Throughout the period, stock performance was highly volatile. Investors reacted to slowing economic growth, moderating corporate earnings, weakening commodity prices, increasing central-bank intervention, and shifts in currency values. During the last four weeks of the period, investor sentiment appeared to move beyond these concerns as economic data firmed and stocks gained across the capitalization spectrum.
As investors grew concerned about global issues, volatility increased.
A common measure of investors’ stock volatility expectations—the Chicago Board Options Exchange (CBOE) Volatility Index (VIX)1—illustrated the shifts in investor sentiment. The VIX spiked to readings above 40 in August 2015, indicating increased investor anxiety. During a comparatively calm autumn, VIX readings trended to the midteens and closer to their five-year average. Then stock markets grew volatile again as the winter months arrived. After the new year began, VIX readings spiked to the high 20s as U.S. equity markets posted their worst start to a calendar year on record. Stock values recovered during the second half of the first quarter of 2016. Investors appeared to be encouraged by improving economic data and the reassurances of central bankers that they remain committed to spurring growth through policy initiatives.
However, business, economic, and central-bank policy development had countervailing influences. For example, while a stronger dollar benefited consumer purchasing power, it tended to negatively affect corporate earnings and investment gains earned overseas when translated to U.S. dollars. Lower energy costs helped consumers’ budgets but hampered the profits and stock performance in the energy sector. While lower interest rates encouraged spending, the potential for interest-rate increases caused uncertainty.
Central bankers responded with policy initiatives in response to shifting economic conditions.
In December 2015, the U.S. Federal Reserve (Fed) increased the federal funds rate, the first interest-rate increase since 2006. The Fed also expressed its intention to increase the rate several times during 2016. After the new year began, as data weakened and volatility increased, the Fed retrenched, which injected additional uncertainty into the markets. In the eurozone, the European Central Bank continued to encourage lending and investing by making funds available to banks at low interest rates, imposing a negative interest rate on bank deposits, and purchasing bonds through its quantitative easing program. In Japan, the central bank also implemented a negative interest-rate policy intended to spur lending and investment. In China, the People’s Bank of China lowered interest rates and bank reserve requirements, in addition to devaluing the country’s currency to support exports.
| 1 | The Chicago Board Options Exchange (CBOE) Volatility Index (VIX) is a key measure of market expectations of near-term volatility conveyed by the S&P 500 stock index option prices. Since its introduction in 1993, VIX has been considered by many to be the world’s premier barometer of investor sentiment and market volatility. Several investors expressed interest in trading instruments related to the market’s expectation of future volatility, and so VIX futures were introduced in 2004, and VIX options were introduced in 2006. |
| | | | | | |
| Letter to shareholders (unaudited) | | Wells Fargo Special Small Cap Value Fund | | | 3 | |
Volatility and recoveries highlighted the value of a long-term investment strategy.
The experience of the past 12 months demonstrated the value of maintaining a disciplined, long-term investment strategy despite short-term volatility. Broad U.S. equity indexes trimmed their worst losses measured to the midpoint of the period to recover all or a portion of their lost values by the end of the period. For example, the S&P 500 Index,2 a commonly referenced gauge of large-cap stock performance, gained 1.78% for the 12-month period that ended March 31, 2016, after recording a 6.18% loss for the six-month period that ended September 30, 2015. Some observers attributed the S&P 500 Index’s relative outperformance to investors who moved their equity allocations higher in the capitalization structure in pursuit of the perceived safety of large-cap stocks. The Russell Midcap® Index3 lost 4.04% for the 12-month period that ended March 31, 2016, regaining more than half of the 9.42% loss it had recorded for the six-month period that ended September 30, 2015. For the 12-month period that ended March 31, 2016, the Russell 2000® Index,4 a common small-cap stock index, lost 9.76%, an improvement from the 11.55% loss it had recorded during the six-month period that ended September 30, 2015.
Don’t let short-term uncertainty derail long-term investment goals.
Periods of investment uncertainty can present challenges, but experience has taught us that maintaining long-term investment goals can be an effective way to plan for the future. To help you create a sound strategy based on your personal goals and risk tolerance, Wells Fargo Funds offers more than 100 mutual funds spanning a wide range of asset classes and investment styles. Although diversification cannot guarantee an investment profit or prevent losses, we believe it can be an effective way to manage investment risk and potentially smooth out overall portfolio performance. We encourage investors to know their investments and to understand that appropriate levels of risk-taking may unlock opportunities.
Thank you for choosing to invest with Wells Fargo Funds. We appreciate your confidence in us and remain committed to helping you meet your financial needs.
Sincerely,

Karla M. Rabusch
President
Wells Fargo Funds
For further information about your Fund, contact your investment professional, visit our website at wellsfargofunds.com, or call us directly at 1-800-222-8222. We are available 24 hours a day, 7 days a week.
| 2 | The S&P 500 Index consists of 500 stocks chosen for market size, liquidity, and industry group representation. It is a market-value-weighted index with each stock’s weight in the index proportionate to its market value. You cannot invest directly in an index. |
| 3 | The Russell Midcap® Index measures the performance of the 800 smallest companies in the Russell 1000® Index, which represent approximately 25% of the total market capitalization of the Russell 1000® Index. You cannot invest directly in an index. |
| 4 | The Russell 2000® Index measures the performance of the 2,000 smallest companies in the Russell 3000® Index, which represents approximately 8% of the total market capitalization of the Russell 3000® Index. You cannot invest directly in an index. |
| | | | |
| 4 | | Wells Fargo Special Small Cap Value Fund | | Performance highlights (unaudited) |
Investment objective
The Fund seeks long-term capital appreciation.
Manager
Wells Fargo Funds Management, LLC
Subadviser
Wells Capital Management Incorporated
Portfolio managers
Robert Rifkin, CFA®
James M. Tringas, CFA®, CPA
Bruant VanCronkhite, CFA®, CPA
Average annual total returns (%) as of March 31, 20161
| | | | | | | | | | | | | | | | | | | | | | | | | | | | | | | | | | |
| | | | | Including sales charge | | | Excluding sales charge | | | Expense ratios2 (%) | |
| | | Inception date | | 1 year | | | 5 year | | | 10 year | | | 1 year | | | 5 year | | | 10 year | | | Gross | | | Net3 | |
| Class A (ESPAX) | | 5-7-1993 | | | (9.73 | ) | | | 8.22 | | | | 5.24 | | | | (4.21 | ) | | | 9.51 | | | | 5.86 | | | | 1.35 | | | | 1.35 | |
| Class B (ESPBX)* | | 3-26-1999 | | | (9.59 | ) | | | 8.41 | | | | 5.31 | | | | (4.92 | ) | | | 8.70 | | | | 5.31 | | | | 2.10 | | | | 2.10 | |
| Class C (ESPCX) | | 12-12-2000 | | | (5.93 | ) | | | 8.70 | | | | 5.08 | | | | (4.93 | ) | | | 8.70 | | | | 5.08 | | | | 2.10 | | | | 2.10 | |
| Class R (ESPHX) | | 9-30-2015 | | | – | | | | – | | | | – | | | | (4.44 | ) | | | 9.13 | | | | 5.47 | | | | 1.60 | | | | 1.60 | |
| Class R6 (ESPRX) | | 10-31-2014 | | | – | | | | – | | | | – | | | | (3.78 | ) | | | 9.96 | | | | 6.23 | | | | 0.92 | | | | 0.90 | |
| Administrator Class (ESPIX) | | 7-23-1996 | | | – | | | | – | | | | – | | | | (4.04 | ) | | | 9.77 | | | | 6.13 | | | | 1.27 | | | | 1.21 | |
| Institutional Class (ESPNX) | | 7-30-2010 | | | – | | | | – | | | | – | | | | (3.79 | ) | | | 9.96 | | | | 6.22 | | | | 1.02 | | | | 0.95 | |
| Russell 2000® Value Index4 | | – | | | – | | | | – | | | | – | | | | (7.72 | ) | | | 6.67 | | | | 4.42 | | | | – | | | | – | |
| * | | Class B shares are closed to investment, except in connection with the reinvestment of any distributions and permitted exchanges. |
Figures quoted represent past performance, which is no guarantee of future results, and do not reflect taxes that a shareholder may pay on fund distributions or the redemption of fund shares. Investment return and principal value of an investment will fluctuate so that an investor’s shares, when redeemed, may be worth more or less than their original cost. Performance shown without sales charges would be lower if sales charges were reflected. Current performance may be lower or higher than the performance data quoted, which assumes the reinvestment of dividends and capital gains. Current month-end performance is available on the Fund’s website, wellsfargofunds.com.
Index returns do not include transaction costs associated with buying and selling securities, any mutual fund fees or expenses, or any taxes. It is not possible to invest directly in an index.
For Class A shares, the maximum front-end sales charge is 5.75%. For Class B shares, the maximum contingent deferred sales charge is 5.00%. For Class C shares, the maximum contingent deferred sales charge is 1.00%. Performance including a contingent deferred sales charge assumes the sales charge for the corresponding time period. Class R, Class R6, Administrator Class, and Institutional Class shares are sold without a front-end sales charge or contingent deferred sales charge.
Stock values fluctuate in response to the activities of individual companies and general market and economic conditions. Smaller-company stocks tend to be more volatile and less liquid than those of larger companies. Consult the Fund’s prospectus for additional information on these and other risks.
Please see footnotes on page 5.
| | | | | | |
| Performance highlights (unaudited) | | Wells Fargo Special Small Cap Value Fund | | | 5 | |
|
| Growth of $10,000 investment as of March 31, 20165 |
|
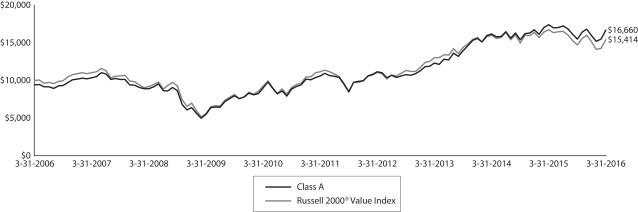 |
| 1 | Historical performance shown for Class R shares prior to their inception reflects the performance of the Institutional Class shares adjusted to reflect the higher expenses applicable to Class R. Historical performance for Class R6 shares prior to their inception reflects the performance of the Institutional Class shares, and includes the higher expenses applicable to Institutional Class shares. If these expenses had not been included, returns would be higher. Historical performance shown for Institutional Class shares prior to their inception reflects the performance of Administrator Class shares, and includes the higher expenses applicable to Administrator Class shares. If these expenses had not been included, returns would be higher. Historical performance shown for all classes of the Fund prior to July 19, 2010, is based on the performance of the Fund’s predecessor, Evergreen Special Values Fund. |
| 2 | Reflects the expense ratios as stated in the most recent prospectuses, which include the impact of 0.01% in acquired fund fees and expenses. The expense ratios shown are subject to change and may differ from the annualized expense ratios shown in the financial highlights of this report, which do not include acquired fund fees and expenses. |
| 3 | The manager has contractually committed through July 31, 2016, to waive fees and/or reimburse expenses to the extent necessary to cap the Fund’s Total Annual Fund Operating Expenses After Fee Waiver at 1.34% for Class A, 2.09% for Class B, 2.09% for Class C, 1.59% for Class R, 0.89% for Class R6, 1.20% for Administrator Class and 0.94% for Institutional Class. After this time, the cap may be increased or the commitment to maintain the cap may be terminated only with the approval of the Board of Trustees. Brokerage commissions, stamp duty fees, interest, taxes, acquired fund fees and expenses, and extraordinary expenses are excluded from the cap. Without this cap, the Fund’s returns would have been lower. |
| 4 | The Russell 2000® Value Index measures the performance of those Russell 2000 companies with lower price/book ratios and lower forecasted growth values. You cannot invest directly in an index. |
| 5 | The chart compares the performance of Class A shares for the most recent ten years with the Russell 2000® Value Index. The chart assumes a hypothetical investment of $10,000 in Class A shares and reflects all operating expenses and assumes the maximum initial sales charge of 5.75%. |
| 6 | The ten largest holdings, excluding cash and cash equivalents, are calculated based on the value of the investments divided by total net assets of the Fund. Holdings are subject to change and may have changed since the date specified. |
| 7 | Amounts are calculated based on the total long-term investments of the Fund. These amounts are subject to change and may have changed since the date specified. |
| | | | |
| 6 | | Wells Fargo Special Small Cap Value Fund | | Performance highlights (unaudited) |
MANAGER’S DISCUSSION
Fund highlights
| n | | The Fund outperformed its benchmark, the Russell 2000® Value Index, for the 12-month period that ended March 31, 2016. |
| n | | Stock selection in the industrials, consumer staples, and health care sectors contributed to relative performance. |
| n | | Underweights to utilities and financials, particularly banks and real estate investment trusts, detracted from performance. |
The Fund outperformed through strong stock selection in an uncertain economic environment.
Over the past 12 months, we faced an extremely volatile U.S. equity market. Headlines about the U.S. Federal Reserve’s (the Fed’s) monetary policy dominated the news. In a long-awaited move, the Fed raised its target federal funds interest rate for the first time in nearly a decade. Other news that made headlines was the Greek debt crisis, a strong U.S. dollar, and oil and commodity weakness. China’s slowing growth and its potential repercussions also kept the market on edge. The past 12 months were filled with economic uncertainty and investor uneasiness; in an increasingly connected global economy, we have seen few signs of this abating.
| | | | |
| Ten largest holdings (%) as of March 31, 20166 | |
Eagle Materials Incorporated | | | 2.65 | |
First Citizens BancShares Corporation Class A | | | 2.46 | |
Mueller Industries Incorporated | | | 1.97 | |
Brown & Brown Incorporated | | | 1.81 | |
Simpson Manufacturing Company Incorporated | | | 1.74 | |
TreeHouse Foods Incorporated | | | 1.70 | |
Franklin Electric Company Incorporated | | | 1.68 | |
GSI Group Incorporated | | | 1.66 | |
Analogic Corporation | | | 1.51 | |
Quaker Chemical Corporation | | | 1.51 | |
Stock selection in consumer staples contributed to performance. Within consumer staples, Cott Corporation was the best performer. Cott is one of the world’s largest producers of beverages, including carbonated soft drinks and juices. Recently, the company expanded into home and office distribution for water and coffee with the acquisition of DS Services Holdings, Incorporated. The acquisition closed at the end of 2014, and the company has already increased the expected synergy targets, which will culminate in better-than-expected margins. Over the past several months, Cott has closed on several acquisitions in the water and coffee business, including AquaTerra Corporation, the leading Canadian supplier. These deals are accretive and most of them come with cost synergies, as the businesses are rolled into DS
Services’ existing infrastructure. Cott is now earning over $1 per share in free cash flow, which is primarily being used for additional acquisitions and debt retirement. Cott’s risk/reward ratio remains attractive, and we continue to hold a meaningful position in the portfolio.
Many health care companies have been trading at lofty valuations because of their growth characteristics. By sticking to our process, which focuses on strong cash flows and a flexible balance sheet, the Fund has been able to benefit from strong stock selection within the pricey health care space during the period. An example of one such company is Owens & Minor, Incorporated, a domestic distributor of medical and surgical supplies to acute-care hospitals. A new chief executive officer, Cody Phipps, came on board in the summer of 2015 with plans to more effectively monetize the core domestic business and expand international operations. Given the renewed focus on improving efficiency and cost controls, the company reported better-than-expected fourth-quarter results, rewarding shareholders. At an investor meeting in December, management reiterated its commitment to long-term earnings-per-share growth of 8% to 10% while acknowledging lower growth in 2016 as the transition continues and further steps are taken to realign the cost structure. We are encouraged by the progress made thus far, but we will continue to monitor the risk/reward ratio and appropriately manage the size of our position in the company.
Please see footnotes on page 5.
| | | | | | |
| Performance highlights (unaudited) | | Wells Fargo Special Small Cap Value Fund | | | 7 | |
|
| Sector distribution as of March 31, 20167 |
|
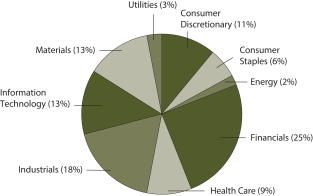 |
An underweight to utilities detracted from performance as growth concerns fueled a perceived flight to safety, leading to the sector’s outperformance versus the benchmark. Utilities also had benefited from low interest rates and investors’ desire for dividend yield. Despite their stable cash-flow-generating ability, utilities typically do not have the balance sheet flexibility we desire. Because of their significant debt profiles, we have found their downside risk in a rising rate environment to be substantial, leading to less attractive risk/reward opportunities. We continue to remain underweight.
Both stock selection and a relative underweight in the banking industry detracted from performance. More specifically, TCF Financial Corporation, a Minneapolis-based regional bank, has experienced significant pressures relative to its industry peers, as the company’s aggressive consumer fee structure continues to be scrutinized by regulators. Additionally, high growth in potentially risky auto lending and recent changes to cash reserves related to that loan portfolio generated investor concerns. In our view, TCF Financial has adequately addressed many of the fee-related issues and has a respectable credit culture, which should serve it well in any elevated credit-loss environments. We believe that many of the concerns are adequately priced into the shares of TCF Financial, and we continue to hold the stock.
We continue to believe our risk/reward investment process will provide strong risk-adjusted returns.
The beginning of 2016 was tumultuous, and we believe equity market volatility will continue in the quarters to come as the current environment seems to have an unusual amount of dispersion regarding investor views on the state of the U.S. economy. Domestically, investors will continue to speculate about the path of future Fed rate hikes, as well as potential market influences associated with this year’s presidential and congressional elections. Globally, oil prices, currency fluctuations, monetary policy, and actions of extremist groups will be top of mind. Additionally, the U.K. referendum in June on whether Britain should remain a member of the European Union has the potential to disrupt many parts of the global economy. Our focus is not on forecasting future macroeconomic news and the short-term direction of the market. Through our bottom-up stock selection process, our focus is on making investments in companies that generate strong cash flows and have the balance sheet flexibility to make intelligent investment decisions at times when other companies are too skittish to invest in the future, which should better position our investments to reap outsized rewards relative to other stocks in any market environment. Because of this disciplined investment process, we remain confident in our ability to navigate all economic environments over the long term.
Please see footnotes on page 5.
| | | | |
| 8 | | Wells Fargo Special Small Cap Value Fund | | Fund expenses (unaudited) |
As a shareholder of the Fund, you incur two types of costs: (1) transaction costs, including sales charges (loads) on purchase payments and contingent deferred sales charges (if any) on redemptions and (2) ongoing costs, including management fees, distribution (12b-1) and/or shareholder servicing fees, and other Fund expenses. This example is intended to help you understand your ongoing costs (in dollars) of investing in the Fund and to compare these costs with the ongoing costs of investing in other mutual funds.
The example is based on an investment of $1,000 invested at the beginning of the six-month period and held for the entire period from October 1, 2015 to March 31, 2016.
Actual expenses
The “Actual” line of the table below provides information about actual account values and actual expenses. You may use the information in this line, together with the amount you invested, to estimate the expenses that you paid over the period. Simply divide your account value by $1,000 (for example, an $8,600 account value divided by $1,000 = 8.6), then multiply the result by the number in the “Actual” line under the heading entitled “Expenses paid during period” for your applicable class of shares to estimate the expenses you paid on your account during this period.
Hypothetical example for comparison purposes
The “Hypothetical” line of the table below provides information about hypothetical account values and hypothetical expenses based on the Fund’s actual expense ratio and an assumed rate of return of 5% per year before expenses, which is not the Fund’s actual return. The hypothetical account values and expenses may not be used to estimate the actual ending account balance or expenses you paid for the period. You may use this information to compare the ongoing costs of investing in the Fund and other funds. To do so, compare this 5% hypothetical example with the 5% hypothetical examples that appear in the shareholder reports of the other funds.
Please note that the expenses shown in the table are meant to highlight your ongoing costs only and do not reflect any transactional costs, such as sales charges (loads) and contingent deferred sales charges. Therefore, the “Hypothetical” line of the table is useful in comparing ongoing costs only and will not help you determine the relative total costs of owning different funds. In addition, if these transactional costs were included, your costs would have been higher.
| | | | | | | | | | | | | | | | |
| | | Beginning
account value
10-1-2015 | | | Ending
account value
3-31-2016 | | | Expenses
paid during
the period¹ | | | Net annualized
expense ratio | |
Class A | | | | | | | | | | | | | | | | |
Actual | | $ | 1,000.00 | | | $ | 1,075.07 | | | $ | 6.95 | | | | 1.34 | % |
Hypothetical (5% return before expenses) | | $ | 1,000.00 | | | $ | 1,018.30 | | | $ | 6.76 | | | | 1.34 | % |
Class B | | | | | | | | | | | | | | | | |
Actual | | $ | 1,000.00 | | | $ | 1,071.26 | | | $ | 10.81 | | | | 2.09 | % |
Hypothetical (5% return before expenses) | | $ | 1,000.00 | | | $ | 1,014.56 | | | $ | 10.52 | | | | 2.09 | % |
Class C | | | | | | | | | | | | | | | | |
Actual | | $ | 1,000.00 | | | $ | 1,070.92 | | | $ | 10.82 | | | | 2.09 | % |
Hypothetical (5% return before expenses) | | $ | 1,000.00 | | | $ | 1,014.55 | | | $ | 10.52 | | | | 2.09 | % |
Class R | | | | | | | | | | | | | | | | |
Actual | | $ | 1,000.00 | | | $ | 1,073.95 | | | $ | 8.21 | | | | 1.58 | % |
Hypothetical (5% return before expenses) | | $ | 1,000.00 | | | $ | 1,017.08 | | | $ | 7.98 | | | | 1.58 | % |
Class R6 | | | | | | | | | | | | | | | | |
Actual | | $ | 1,000.00 | | | $ | 1,077.48 | | | $ | 4.62 | | | | 0.89 | % |
Hypothetical (5% return before expenses) | | $ | 1,000.00 | | | $ | 1,020.55 | | | $ | 4.50 | | | | 0.89 | % |
Administrator Class | | | | | | | | | | | | | | | | |
Actual | | $ | 1,000.00 | | | $ | 1,076.01 | | | $ | 6.23 | | | | 1.20 | % |
Hypothetical (5% return before expenses) | | $ | 1,000.00 | | | $ | 1,019.00 | | | $ | 6.06 | | | | 1.20 | % |
Institutional Class | | | | | | | | | | | | | | | | |
Actual | | $ | 1,000.00 | | | $ | 1,077.64 | | | $ | 4.88 | | | | 0.94 | % |
Hypothetical (5% return before expenses) | | $ | 1,000.00 | | | $ | 1,020.30 | | | $ | 4.75 | | | | 0.94 | % |
| 1 | Expenses paid is equal to the annualized expense ratio of each class multiplied by the average account value over the period, multiplied by the number of days in the most recent fiscal half-year divided by the number of days in the fiscal year (to reflect the one-half-year period). |
| | | | | | |
| Portfolio of investments—March 31, 2016 | | Wells Fargo Special Small Cap Value Fund | | | 9 | |
| | | | | | | | | | | | |
| Security name | | | | | | Shares | | | Value | |
| | | | |
Common Stocks: 92.67% | | | | | | | | | | | | |
| | | | |
Consumer Discretionary: 10.49% | | | | | | | | | | | | |
| | | | |
| Diversified Consumer Services: 0.48% | | | | | | | | | | | | |
Liberty Tax Incorporated « | | | | | | | 207,847 | | | $ | 4,071,723 | |
| | | | | | | | | | | | |
| | | | |
| Hotels, Restaurants & Leisure: 5.01% | | | | | | | | | | | | |
Denny’s Corporation † | | | | | | | 561,874 | | | | 5,821,015 | |
DineEquity Incorporated | | | | | | | 133,250 | | | | 12,449,548 | |
Krispy Kreme Doughnuts Incorporated † | | | | | | | 695,600 | | | | 10,844,404 | |
Ruby Tuesday Incorporated † | | | | | | | 600,900 | | | | 3,232,842 | |
The Wendy’s Company | | | | | | | 919,900 | | | | 10,017,711 | |
| | | | |
| | | | | | | | | | | 42,365,520 | |
| | | | | | | | | | | | |
| | | | |
| Household Durables: 1.40% | | | | | | | | | | | | |
Dixie Group Incorporated † | | | | | | | 420,964 | | | | 1,772,258 | |
Helen of Troy Limited † | | | | | | | 97,100 | | | | 10,068,299 | |
| | | | |
| | | | | | | | | | | 11,840,557 | |
| | | | | | | | | | | | |
| | | | |
| Media: 1.67% | | | | | | | | | | | | |
A.H. Belo Corporation Class A | | | | | | | 939,929 | | | | 4,521,058 | |
New Media Investment Group Incorporated | | | | | | | 255,242 | | | | 4,247,227 | |
Time Incorporated | | | | | | | 349,300 | | | | 5,393,192 | |
| | | | |
| | | | | | | | | | | 14,161,477 | |
| | | | | | | | | | | | |
| | | | |
| Specialty Retail: 1.37% | | | | | | | | | | | | |
Christopher & Banks Corporation † | | | | | | | 642,420 | | | | 1,535,384 | |
Guess? Incorporated | | | | | | | 116,500 | | | | 2,186,705 | |
The Buckle Incorporated « | | | | | | | 232,500 | | | | 7,874,775 | |
| | | | |
| | | | | | | | | | | 11,596,864 | |
| | | | | | | | | | | | |
| | | | |
| Textiles, Apparel & Luxury Goods: 0.56% | | | | | | | | | | | | |
Delta Apparel Incorporated † | | | | | | | 248,339 | | | | 4,753,208 | |
| | | | | | | | | | | | |
| | | | |
Consumer Staples: 5.87% | | | | | | | | | | | | |
| | | | |
| Beverages: 1.00% | | | | | | | | | | | | |
Cott Corporation | | | | | | | 611,100 | | | | 8,488,179 | |
| | | | | | | | | | | | |
| | | | |
| Food & Staples Retailing: 0.53% | | | | | | | | | | | | |
SUPERVALU Incorporated † | | | | | | | 771,000 | | | | 4,440,960 | |
| | | | | | | | | | | | |
| | | | |
| Food Products: 2.50% | | | | | | | | | | | | |
Nomad Foods Limited † | | | | | | | 328,100 | | | | 2,956,181 | |
Snyders Lance Incorporated | | | | | | | 121,785 | | | | 3,833,792 | |
TreeHouse Foods Incorporated † | | | | | | | 165,885 | | | | 14,390,524 | |
| | | | |
| | | | | | | | | | | 21,180,497 | |
| | | | | | | | | | | | |
| | | | |
| Household Products: 1.84% | | | | | | | | | | | | |
Central Garden & Pet Company † | | | | | | | 407,392 | | | | 6,656,785 | |
Central Garden & Pet Company Class A † | | | | | | | 74,700 | | | | 1,216,863 | |
Spectrum Brands Holdings Incorporated | | | | | | | 70,600 | | | | 7,715,168 | |
| | | | |
| | | | | | | | | | | 15,588,816 | |
| | | | | | | | | | | | |
The accompanying notes are an integral part of these financial statements.
| | | | |
| 10 | | Wells Fargo Special Small Cap Value Fund | | Portfolio of investments—March 31, 2016 |
| | | | | | | | | | | | |
| Security name | | | | | | Shares | | | Value | |
| | | | |
Energy: 2.31% | | | | | | | | | | | | |
| | | | |
| Energy Equipment & Services: 1.66% | | | | | | | | | | | | |
Atwood Oceanics Incorporated « | | | | | | | 238,400 | | | $ | 2,186,128 | |
CARBO Ceramics Incorporated « | | | | | | | 190,800 | | | | 2,709,360 | |
Patterson-UTI Energy Incorporated | | | | | | | 327,800 | | | | 5,775,836 | |
Steel Excel Incorporated † | | | | | | | 346,013 | | | | 3,359,786 | |
| | | | |
| | | | | | | | | | | 14,031,110 | |
| | | | | | | | | | | | |
| | | | |
| Oil, Gas & Consumable Fuels: 0.65% | | | | | | | | | | | | |
Energen Corporation | | | | | | | 152,000 | | | | 5,561,680 | |
| | | | | | | | | | | | |
| | | | |
Financials: 23.42% | | | | | | | | | | | | |
| | | | |
| Banks: 9.46% | | | | | | | | | | | | |
Associated Banc-Corp | | | | | | | 508,000 | | | | 9,113,520 | |
BBCN Bancorp Incorporated | | | | | | | 243,100 | | | | 3,692,689 | |
First Citizens BancShares Corporation Class A | | | | | | | 83,100 | | | | 20,863,917 | |
First Niagara Financial Group Incorporated | | | | | | | 1,051,400 | | | | 10,177,552 | |
FirstMerit Corporation | | | | | | | 386,900 | | | | 8,144,245 | |
Hancock Holding Company | | | | | | | 311,500 | | | | 7,152,040 | |
TCF Financial Corporation | | | | | | | 718,936 | | | | 8,814,155 | |
UMB Financial Corporation | | | | | | | 234,563 | | | | 12,110,488 | |
| | | | |
| | | | | | | | | | | 80,068,606 | |
| | | | | | | | | | | | |
| | | | |
| Capital Markets: 2.33% | | | | | | | | | | | | |
Apollo Investment Corporation « | | | | | | | 622,000 | | | | 3,452,100 | |
CIFC Corporation « | | | | | | | 179,685 | | | | 1,275,764 | |
New Mountain Finance Corporation « | | | | | | | 265,100 | | | | 3,350,864 | |
Westwood Holdings Group Incorporated | | | | | | | 198,812 | | | | 11,660,324 | |
| | | | |
| | | | | | | | | | | 19,739,052 | |
| | | | | | | | | | | | |
| | | | |
| Insurance: 7.86% | | | | | | | | | | | | |
Allied World Assurance Company | | | | | | | 165,400 | | | | 5,779,076 | |
Brown & Brown Incorporated | | | | | | | 427,500 | | | | 15,304,500 | |
Endurance Specialty Holdings Limited | | | | | | | 113,100 | | | | 7,389,954 | |
ProAssurance Corporation | | | | | | | 244,100 | | | | 12,351,460 | |
RenaissanceRe Holdings Limited | | | | | | | 55,100 | | | | 6,602,633 | |
Stewart Information Services Corporation | | | | | | | 185,500 | | | | 6,729,940 | |
Validus Holdings Limited | | | | | | | 263,100 | | | | 12,415,689 | |
| | | | |
| | | | | | | | | | | 66,573,252 | |
| | | | | | | | | | | | |
| | | | |
| REITs: 3.77% | | | | | | | | | | | | |
Apollo Commercial Real Estate Finance Incorporated « | | | | | | | 228,200 | | | | 3,719,660 | |
Apollo Residential Mortgage | | | | | | | 302,800 | | | | 4,063,576 | |
Gramercy Property Trust Incorporated | | | | | | | 799,816 | | | | 6,758,445 | |
Hatteras Financial Corporation | | | | | | | 698,408 | | | | 9,987,234 | |
LaSalle Hotel Properties | | | | | | | 290,900 | | | | 7,362,679 | |
| | | | |
| | | | | | | | | | | 31,891,594 | |
| | | | | | | | | | | | |
The accompanying notes are an integral part of these financial statements.
| | | | | | |
| Portfolio of investments—March 31, 2016 | | Wells Fargo Special Small Cap Value Fund | | | 11 | |
| | | | | | | | | | | | |
| Security name | | | | | | Shares | | | Value | |
| | | | |
Health Care: 8.11% | | | | | | | | | | | | |
| | | | |
| Health Care Equipment & Supplies: 4.24% | | | | | | | | | | | | |
Analogic Corporation | | | | | | | 162,183 | | | $ | 12,814,079 | |
CryoLife Incorporated | | | | | | | 252,300 | | | | 2,712,225 | |
Haemonetics Corporation † | | | | | | | 201,600 | | | | 7,051,968 | |
Halyard Health Incorporated † | | | | | | | 187,600 | | | | 5,389,748 | |
Steris Corporation | | | | | | | 111,300 | | | | 7,907,865 | |
| | | | |
| | | | | | | | | | | 35,875,885 | |
| | | | | | | | | | | | |
| | | | |
| Health Care Providers & Services: 1.87% | | | | | | | | | | | | |
Owens & Minor Incorporated | | | | | | | 141,000 | | | | 5,699,220 | |
Patterson Companies Incorporated | | | | | | | 218,500 | | | | 10,166,805 | |
| | | | |
| | | | | | | | | | | 15,866,025 | |
| | | | | | | | | | | | |
| | | | |
| Health Care Technology: 0.57% | | | | | | | | | | | | |
HMS Holdings Corporation † | | | | | | | 336,500 | | | | 4,828,775 | |
| | | | | | | | | | | | |
| | | | |
| Life Sciences Tools & Services: 0.87% | | | | | | | | | | | | |
Bio-Rad Laboratories Incorporated Class A † | | | | | | | 53,600 | | | | 7,328,192 | |
| | | | | | | | | | | | |
| | | | |
| Pharmaceuticals: 0.56% | | | | | | | | | | | | |
Innoviva Incorporated « | | | | | | | 377,983 | | | | 4,758,806 | |
| | | | | | | | | | | | |
| | | | |
Industrials: 16.56% | | | | | | | | | | | | |
| | | | |
| Building Products: 1.74% | | | | | | | | | | | | |
Simpson Manufacturing Company Incorporated | | | | | | | 385,718 | | | | 14,722,856 | |
| | | | | | | | | | | | |
| | | | |
| Commercial Services & Supplies: 3.55% | | | | | | | | | | | | |
ACCO Brands Corporation † | | | | | | | 1,167,769 | | | | 10,486,566 | |
Brady Corporation Class A | | | | | | | 249,200 | | | | 6,688,528 | |
Matthews International Corporation Class A | | | | | | | 86,898 | | | | 4,472,640 | |
Viad Corporation | | | | | | | 288,200 | | | | 8,403,912 | |
| | | | |
| | | | | | | | | | | 30,051,646 | |
| | | | | | | | | | | | |
| | | | |
| Construction & Engineering: 0.67% | | | | | | | | | | | | |
EMCOR Group Incorporated | | | | | | | 116,300 | | | | 5,652,180 | |
| | | | | | | | | | | | |
| | | | |
| Electrical Equipment: 2.46% | | | | | | | | | | | | |
EnerSys | | | | | | | 117,000 | | | | 6,519,240 | |
Franklin Electric Company Incorporated | | | | | | | 443,187 | | | | 14,257,326 | |
| | | | |
| | | | | | | | | | | 20,776,566 | |
| | | | | | | | | | | | |
| | | | |
| Machinery: 7.18% | | | | | | | | | | | | |
Douglas Dynamics Incorporated | | | | | | | 545,527 | | | | 12,498,024 | |
ESCO Technologies Incorporated | | | | | | | 261,700 | | | | 10,201,066 | |
Hillenbrand Incorporated | | | | | | | 293,602 | | | | 8,793,380 | |
Kadant Incorporated | | | | | | | 279,144 | | | | 12,606,143 | |
Mueller Industries Incorporated | | | | | | | 568,240 | | | | 16,717,621 | |
| | | | |
| | | | | | | | | | | 60,816,234 | |
| | | | | | | | | | | | |
The accompanying notes are an integral part of these financial statements.
| | | | |
| 12 | | Wells Fargo Special Small Cap Value Fund | | Portfolio of investments—March 31, 2016 |
| | | | | | | | | | | | |
| Security name | | | | | | Shares | | | Value | |
| | | | |
| Professional Services: 0.96% | | | | | | | | | | | | |
Korn/Ferry International | | | | | | | 287,646 | | | $ | 8,137,505 | |
| | | | | | | | | | | | |
| | | | |
Information Technology: 11.76% | | | | | | | | | | | | |
| | | | |
| Communications Equipment: 1.67% | | | | | | | | | | | | |
Aviat Networks Incorporated † | | | | | | | 840,247 | | | | 596,575 | |
NETGEAR Incorporated † | | | | | | | 165,400 | | | | 6,677,198 | |
NetScout Systems Incorporated † | | | | | | | 298,300 | | | | 6,851,951 | |
| | | | |
| | | | | | | | | | | 14,125,724 | |
| | | | | | | | | | | | |
| | | | |
| Electronic Equipment, Instruments & Components: 5.01% | | | | | | | | | | | | |
AVX Corporation | | | | | | | 505,698 | | | | 6,356,624 | |
Coherent Incorporated † | | | | | | | 27,100 | | | | 2,490,490 | |
GSI Group Incorporated † | | | | | | | 994,645 | | | | 14,084,173 | |
Orbotech Limited † | | | | | | | 294,130 | | | | 6,994,411 | |
Vishay Intertechnology Incorporated « | | | | | | | 1,024,101 | | | | 12,504,273 | |
| | | | |
| | | | | | | | | | | 42,429,971 | |
| | | | | | | | | | | | |
| | | | |
| IT Services: 2.65% | | | | | | | | | | | | |
DST Systems Incorporated | | | | | | | 85,000 | | | | 9,585,450 | |
Sykes Enterprises Incorporated † | | | | | | | 277,900 | | | | 8,387,022 | |
Teradata Corporation † | | | | | | | 170,000 | | | | 4,460,800 | |
| | | | |
| | | | | | | | | | | 22,433,272 | |
| | | | | | | | | | | | |
| | | | |
| Semiconductors��& Semiconductor Equipment: 0.67% | | | | | | | | | | | | |
DSP Group Incorporated † | | | | | | | 360,915 | | | | 3,291,545 | |
Exar Corporation † | | | | | | | 407,152 | | | | 2,341,124 | |
| | | | |
| | | | | | | | | | | 5,632,669 | |
| | | | | | | | | | | | |
| | | | |
| Software: 1.41% | | | | | | | | | | | | |
ACI Worldwide Incorporated † | | | | | | | 228,652 | | | | 4,753,675 | |
Progress Software Corporation † | | | | | | | 295,951 | | | | 7,138,338 | |
| | | | |
| | | | | | | | | | | 11,892,013 | |
| | | | | | | | | | | | |
| | | | |
| Technology Hardware, Storage & Peripherals: 0.35% | | | | | | | | | | | | |
Imation Corporation †(l) | | | | | | | 1,929,730 | | | | 2,991,082 | |
| | | | | | | | | | | | |
| | | | |
Materials: 11.69% | | | | | | | | | | | | |
| | | | |
| Chemicals: 6.08% | | | | | | | | | | | | |
A. Schulman Incorporated | | | | | | | 144,358 | | | | 3,929,425 | |
Axiall Corporation | | | | | | | 100,200 | | | | 2,188,368 | |
HB Fuller Company | | | | | | | 129,000 | | | | 5,476,050 | |
Innospec Incorporated | | | | | | | 208,905 | | | | 9,058,121 | |
Quaker Chemical Corporation | | | | | | | 150,890 | | | | 12,804,525 | |
Scotts Miracle-Gro Company Class A | | | | | | | 111,300 | | | | 8,099,301 | |
Sensient Technologies Corporation | | | | | | | 156,900 | | | | 9,956,874 | |
| | | | |
| | | | | | | | | | | 51,512,664 | |
| | | | | | | | | | | | |
| | | | |
| Construction Materials: 2.65% | | | | | | | | | | | | |
Eagle Materials Incorporated | | | | | | | 319,600 | | | | 22,407,156 | |
| | | | | | | | | | | | |
The accompanying notes are an integral part of these financial statements.
| | | | | | |
| Portfolio of investments—March 31, 2016 | | Wells Fargo Special Small Cap Value Fund | | | 13 | |
| | | | | | | | | | | | | | |
| Security name | | | | | | | Shares | | | Value | |
| | | | |
| Containers & Packaging: 0.68% | | | | | | | | | | | | | | |
Silgan Holdings Incorporated | | | | | | | | | 107,600 | | | $ | 5,721,092 | |
| | | | | | | | | | | | | | |
| | | | |
| Metals & Mining: 0.32% | | | | | | | | | | | | | | |
Real Industry Incorporated † | | | | | | | | | 140,100 | | | | 1,218,870 | |
Royal Gold Incorporated | | | | | | | | | 28,500 | | | | 1,461,765 | |
| | | | |
| | | | | | | | | | | | | 2,680,635 | |
| | | | | | | | | | | | | | |
| | | | |
| Paper & Forest Products: 1.96% | | | | | | | | | | | | | | |
Neenah Paper Incorporated | | | | | | | | | 131,471 | | | | 8,369,444 | |
Schweitzer-Mauduit International Incorporated | | | | | | | | | 262,587 | | | | 8,266,239 | |
| | | | |
| | | | | | | | | | | | | 16,635,683 | |
| | | | | | | | | | | | | | |
| | | | |
Utilities: 2.46% | | | | | | | | | | | | | | |
| | | | |
| Electric Utilities: 2.46% | | | | | | | | | | | | | | |
Cleco Corporation | | | | | | | | | 86,000 | | | | 4,748,060 | |
Empire District Electric Company | | | | | | | | | 175,600 | | | | 5,803,580 | |
Hawaiian Electric Industries Incorporated | | | | | | | | | 316,600 | | | | 10,257,837 | |
| | | | |
| | | | | | | | | | | | | 20,809,477 | |
| | | | | | | | | | | | | | |
| | | | |
Total Common Stocks (Cost $712,862,745) | | | | | | | | | | | | | 784,439,203 | |
| | | | | | | | | | | | | | |
| | | | |
Exchange-Traded Funds: 0.75% | | | | | | | | | | | | | | |
iShares Russell 2000 Value Index ETF | | | | | | | | | 68,429 | | | | 6,378,267 | |
| | | | | | | | | | | | | | |
| | | | |
Total Exchange-Traded Funds (Cost $6,205,859) | | | | | | | | | | | | | 6,378,267 | |
| | | | | | | | | | | | | | |
| | | Yield | | | | | | | | | |
| | | | |
Short-Term Investments: 9.34% | | | | | | | | | | | | | | |
| | | | |
| Investment Companies: 9.34% | | | | | | | | | | | | | | |
Securities Lending Cash Investments LLC (l)(r)(u) | | | 0.43 | % | | | | | 25,503,775 | | | | 25,503,775 | |
Wells Fargo Cash Investment Money Market Fund Select Class (l)(u) | | | 0.44 | | | | | | 53,578,187 | | | | 53,578,187 | |
| | | | |
Total Short-Term Investments (Cost $79,081,962) | | | | | | | | | | | | | 79,081,962 | |
| | | | | | | | | | | | | | |
| | | | | | | | |
| Total investments in securities (Cost $798,150,566) * | | | 102.76 | % | | | 869,899,432 | |
Other assets and liabilities, net | | | (2.76 | ) | | | (23,375,027 | ) |
| | | | | | | | |
| Total net assets | | | 100.00 | % | | $ | 846,524,405 | |
| | | | | | | | |
| « | All or a portion of this security is on loan. |
| † | Non-income-earning security |
| (l) | The issuer of the security is an affiliated person of the Fund as defined in the Investment Company Act of 1940. |
| (r) | The investment is a non-registered investment vehicle purchased with cash collateral received from securities on loan. |
| (u) | The rate represents the 7-day annualized yield at period end. |
| * | Cost for federal income tax purposes is $808,621,486 and unrealized gains (losses) consists of: |
| | | | |
Gross unrealized gains | | $ | 136,227,297 | |
Gross unrealized losses | | | (74,949,351 | ) |
| | | | |
Net unrealized gains | | $ | 61,277,946 | |
The accompanying notes are an integral part of these financial statements.
| | | | |
| 14 | | Wells Fargo Special Small Cap Value Fund | | Statement of assets and liabilities—March 31, 2016 |
| | | | |
| | | | |
| |
Assets | | | | |
Investments | | | | |
In unaffiliated securities (including $24,831,116 of securities loaned), at value (cost $691,879,292) | | $ | 787,826,388 | |
In affiliated securities, at value (cost $106,271,274) | | | 82,073,044 | |
| | | | |
Total investments, at value (cost $798,150,566) | | | 869,899,432 | |
Receivable for investments sold | | | 1,484,111 | |
Receivable for Fund shares sold | | | 2,797,596 | |
Receivable for dividends | | | 1,527,566 | |
Receivable for securities lending income | | | 51,038 | |
Prepaid expenses and other assets | | | 57,504 | |
| | | | |
Total assets | | | 875,817,247 | |
| | | | |
| |
Liabilities | | | | |
Payable for investments purchased | | | 1,896,292 | |
Payable for Fund shares redeemed | | | 979,995 | |
Payable upon receipt of securities loaned | | | 25,503,775 | |
Due to custodian bank | | | 27,953 | |
Management fee payable | | | 524,237 | |
Distribution fees payable | | | 25,722 | |
Administration fees payable | | | 115,780 | |
Accrued expenses and other liabilities | | | 219,088 | |
| | | | |
Total liabilities | | | 29,292,842 | |
| | | | |
Total net assets | | $ | 846,524,405 | |
| | | | |
| |
NET ASSETS CONSIST OF | | | | |
Paid-in capital | | $ | 780,377,476 | |
Undistributed net investment income | | | 2,063,843 | |
Accumulated net realized losses on investments | | | (7,665,780 | ) |
Net unrealized gains on investments | | | 71,748,866 | |
| | | | |
Total net assets | | $ | 846,524,405 | |
| | | | |
| |
COMPUTATION OF NET ASSET VALUE AND OFFERING PRICE PER SHARE | | | | |
Net assets – Class A | | $ | 417,160,817 | |
Shares outstanding – Class A1 | | | 15,222,588 | |
Net asset value per share – Class A | | | $27.40 | |
Maximum offering price per share – Class A2 | | | $29.07 | |
Net assets – Class B | | $ | 1,261,588 | |
Shares outstanding – Class B1 | | | 50,589 | |
Net asset value per share – Class B | | | $24.94 | |
Net assets – Class C | | $ | 40,511,691 | |
Shares outstanding – Class C1 | | | 1,617,118 | |
Net asset value per share – Class C | | | $25.05 | |
Net assets – Class R | | $ | 26,852 | |
Shares outstanding – Class R1 | | | 960 | |
Net asset value per share – Class R | | | $27.97 | |
Net assets – Class R6 | | $ | 36,344,338 | |
Shares outstanding – Class R61 | | | 1,297,604 | |
Net asset value per share – Class R6 | | | $28.01 | |
Net assets – Administrator Class | | $ | 95,029,609 | |
Shares outstanding – Administrator Class1 | | | 3,391,550 | |
Net asset value per share – Administrator Class | | | $28.02 | |
Net assets – Institutional Class | | $ | 256,189,510 | |
Shares outstanding – Institutional Class1 | | | 9,141,224 | |
Net asset value per share – Institutional Class | | | $28.03 | |
| 1 | The Fund has an unlimited number of authorized shares. |
| 2 | Maximum offering price is computed as 100/94.25 of net asset value. On investments of $50,000 or more, the offering price is reduced. |
The accompanying notes are an integral part of these financial statements.
| | | | | | |
| Statement of operations—year ended March 31, 2016 | | Wells Fargo Special Small Cap Value Fund | | | 15 | |
| | | | |
| | | | |
| |
Investment income | | | | |
Dividends (net of foreign withholding taxes of $24,074) | | $ | 14,749,338 | |
Securities lending income, net | | | 779,214 | |
Income from affiliated securities | | | 79,379 | |
| | | | |
Total investment income | | | 15,607,931 | |
| | | | |
| |
Expenses | | | | |
Management fee | | | 6,285,726 | |
Administration fees | | | | |
Class A | | | 932,348 | |
Class B | | | 4,265 | |
Class C | | | 91,518 | |
Class R | | | 28 | 1 |
Class R6 | | | 3,314 | |
Administrator Class | | | 92,298 | |
Institutional Class | | | 236,278 | |
Shareholder servicing fees | | | | |
Class A | | | 1,043,962 | |
Class B | | | 4,714 | |
Class C | | | 102,409 | |
Class R | | | 34 | 1 |
Administrator Class | | | 185,931 | |
Distribution fees | | | | |
Class B | | | 14,143 | |
Class C | | | 307,228 | |
Class R | | | 34 | 1 |
Custody and accounting fees | | | 74,958 | |
Professional fees | | | 51,168 | |
Registration fees | | | 115,012 | |
Shareholder report expenses | | | 87,625 | |
Trustees’ fees and expenses | | | 9,310 | |
Other fees and expenses | | | 16,613 | |
| | | | |
Total expenses | | | 9,658,916 | |
Less: Fee waivers and/or expense reimbursements | | | (312,131 | ) |
| | | | |
Net expenses | | | 9,346,785 | |
| | | | |
Net investment income | | | 6,261,146 | |
| | | | |
| |
REALIZED AND UNREALIZED GAINS (LOSSES) ON INVESTMENTS | | | | |
| |
Net realized gains on investments | | | 22,808,664 | |
| |
Net change in unrealized gains (losses) on: | | | | |
Unaffiliated securities | | | (31,032,469 | ) |
Affiiliated securities | | | (24,198,231 | ) |
| | | | |
Net change in unrealized gains (losses) on investments | | | (55,230,700 | ) |
| | | | |
Net realized and unrealized gains (losses) on investments | | | (32,422,036 | ) |
| | | | |
Net decrease in net assets resulting from operations | | $ | (26,160,890 | ) |
| | | | |
| 1 | For the period from September 30, 2015 (commencement of class operations) to March 31, 2016. |
The accompanying notes are an integral part of these financial statements.
| | | | |
| 16 | | Wells Fargo Special Small Cap Value Fund | | Statement of changes in net assets |
| | | | | | | | | | | | | | | | |
| | | Year ended
March 31, 2016 | | | Year ended
March 31, 2015 | |
| | | | |
Operations | | | | | | | | | | | | | | | | |
Net investment income | | | | | | $ | 6,261,146 | | | | | | | $ | 6,802,567 | |
Net realized gains on investments | | | | | | | 22,808,664 | | | | | | | | 45,004,416 | |
Net change in unrealized gains (losses) on investments | | | | | | | (55,230,700 | ) | | | | | | | 1,853,024 | |
| | | | |
Net increase (decrease) in net assets resulting from operations | | | | | | | (26,160,890 | ) | | | | | | | 53,660,007 | |
| | | | |
| | | | |
Distributions to shareholders from | | | | | | | | | | | | | | | | |
Net investment income | | | | | | | | | | | | | | | | |
Class A | | | | | | | (2,938,290 | ) | | | | | | | (3,226,001 | ) |
Class C | | | | | | | 0 | | | | | | | | (11,114 | ) |
Class R | | | | | | | (265 | )1 | | | | | | | N/A | |
Class R6 | | | | | | | (217,106 | ) | | | | | | | (306 | )2 |
Administrator Class | | | | | | | (835,904 | ) | | | | | | | (558,514 | ) |
Institutional Class | | | | | | | (2,207,665 | ) | | | | | | | (2,040,765 | ) |
Net realized gains | | | | | | | | | | | | | | | | |
Class A | | | | | | | (6,366,306 | ) | | | | | | | (66,808,530 | ) |
Class B | | | | | | | (27,232 | ) | | | | | | | (508,991 | ) |
Class C | | | | | | | (685,591 | ) | | | | | | | (7,206,152 | ) |
Class R | | | | | | | (393 | )1 | | | | | | | N/A | |
Class R6 | | | | | | | (270,846 | ) | | | | | | | (3,880 | )2 |
Administrator Class | | | | | | | (1,261,351 | ) | | | | | | | (9,100,902 | ) |
Institutional Class | | | | | | | (2,891,540 | ) | | | | | | | (27,568,111 | ) |
| | | | |
Total distributions to shareholders | | | | | | | (17,702,489 | ) | | | | | | | (117,033,266 | ) |
| | | | |
| | | | |
Capital share transactions | | | Shares | | | | | | | | Shares | | | | | |
Proceeds from shares sold | | | | | | | | | | | | | | | | |
Class A | | | 2,676,891 | | | | 72,673,241 | | | | 2,415,533 | | | | 73,079,829 | |
Class B | | | 311 | | | | 7,784 | | | | 831 | | | | 22,261 | |
Class C | | | 213,185 | | | | 5,190,192 | | | | 146,593 | | | | 4,105,094 | |
Class R | | | 936 | 1 | | | 24,829 | 1 | | | N/A | | | | N/A | |
Class R6 | | | 1,344,998 | | | | 37,189,066 | | | | 749 | 2 | | | 25,000 | 2 |
Administrator Class | | | 2,198,004 | | | | 61,025,708 | | | | 1,104,188 | | | | 34,033,327 | |
Institutional Class | | | 4,632,711 | | | | 126,970,664 | | | | 2,320,193 | | | | 73,297,899 | |
| | | | |
| | | | | | | 303,081,484 | | | | | | | | 184,563,410 | |
| | | | |
Reinvestment of distributions | | | | | | | | | | | | | | | | |
Class A | | | 341,445 | | | | 9,032,174 | | | | 2,471,872 | | | | 67,960,767 | |
Class B | | | 1,077 | | | | 25,725 | | | | 19,500 | | | | 486,712 | |
Class C | | | 25,222 | | | | 605,329 | | | | 256,095 | | | | 6,422,643 | |
Class R | | | 24 | 1 | | | 658 | 1 | | | N/A | | | | N/A | |
Class R6 | | | 18,009 | | | | 487,952 | | | | 149 | 2 | | | 4,186 | 2 |
Administrator Class | | | 76,324 | | | | 2,067,731 | | | | 331,510 | | | �� | 9,331,809 | |
Institutional Class | | | 143,387 | | | | 3,887,014 | | | | 795,610 | | | | 22,416,688 | |
| | | | |
| | | | | | | 16,106,583 | | | | | | | | 106,622,805 | |
| | | | |
Payment for shares redeemed | | | | | | | | | | | | | | | | |
Class A | | | (3,135,092 | ) | | | (84,541,811 | ) | | | (2,712,534 | ) | | | (83,101,895 | ) |
Class B | | | (53,053 | ) | | | (1,328,642 | ) | | | (57,981 | ) | | | (1,660,897 | ) |
Class C | | | (274,875 | ) | | | (6,736,107 | ) | | | (161,778 | ) | | | (4,569,660 | ) |
Class R6 | | | (66,301 | ) | | | (1,738,734 | ) | | | 0 | 2 | | | 0 | 2 |
Administrator Class | | | (1,223,745 | ) | | | (34,959,438 | ) | | | (1,460,618 | ) | | | (46,782,017 | ) |
Institutional Class | | | (1,981,648 | ) | | | (55,623,071 | ) | | | (1,170,774 | ) | | | (36,425,234 | ) |
| | | | |
| | | | | | | (184,927,803 | ) | | | | | | | (172,539,703 | ) |
| | | | |
Net increase in net assets resulting from capital share transactions | | | | | | | 134,260,264 | | | | | | | | 118,646,512 | |
| | | | |
Total increase in net assets | | | | | | | 90,396,885 | | | | | | | | 55,273,253 | |
| | | | |
| | | | |
Net assets | | | | | | | | | | | | | | | | |
Beginning of period | | | | | | | 756,127,520 | | | | | | | | 700,854,267 | |
| | | | |
End of period | | | | | | $ | 846,524,405 | | | | | | | $ | 756,127,520 | |
| | | | |
Undistributed net investment income | | | | | | $ | 2,063,843 | | | | | | | $ | 2,076,705 | |
| | | | |
| 1 | For the period from September 30, 2015 (commencement of class operations) to March 31, 2016. |
| 2 | For the period from October 31, 2014 (commencement of class operations) to March 31, 2015 |
The accompanying notes are an integral part of these financial statements.
| | | | | | |
| Financial highlights | | Wells Fargo Special Small Cap Value Fund | | | 17 | |
(For a share outstanding throughout each period)
| | | | | | | | | | | | | | | | | | | | | | | | |
| | | Year ended March 31 | | | Year ended October 31 | |
| CLASS A | | 2016 | | | 2015 | | | 20141 | | | 2013 | | | 2012 | | | 2011 | |
Net asset value, beginning of period | | | $29.27 | | | | $32.59 | | | | $31.35 | | | | $22.97 | | | | $20.97 | | | | $19.78 | |
Net investment income (loss) | | | 0.20 | | | | 0.26 | | | | 0.10 | | | | (0.01 | )2 | | | (0.05 | ) | | | (0.05 | ) |
Net realized and unrealized gains (losses) on investments | | | (1.46 | ) | | | 1.81 | | | | 3.14 | | | | 8.37 | | | | 2.05 | | | | 1.24 | |
| | | | | | | | | | | | | | | | | | | | | | | | |
Total from investment operations | | | (1.26 | ) | | | 2.07 | | | | 3.24 | | | | 8.38 | | | | 2.00 | | | | 1.19 | |
Distributions to shareholders from | | | | | | | | | | | | | | | | | | | | | | | | |
Net investment income | | | (0.19 | ) | | | (0.21 | ) | | | (0.03 | ) | | | 0.00 | | | | 0.00 | | | | 0.00 | |
Net realized gains | | | (0.42 | ) | | | (5.18 | ) | | | (1.97 | ) | | | 0.00 | | | | 0.00 | | | | 0.00 | |
| | | | | | | | | | | | | | | | | | | | | | | | |
Total distributions to shareholders | | | (0.61 | ) | | | (5.39 | ) | | | (2.00 | ) | | | 0.00 | | | | 0.00 | | | | 0.00 | |
Net asset value, end of period | | | $27.40 | | | | $29.27 | | | | $32.59 | | | | $31.35 | | | | $22.97 | | | | $20.97 | |
Total return3 | | | (4.21 | )% | | | 7.56 | % | | | 10.74 | % | | | 36.48 | % | | | 9.54 | % | | | 6.02 | % |
Ratios to average net assets (annualized) | | | | | | | | | | | | | | | | | | | | | | | | |
Gross expenses | | | 1.36 | % | | | 1.39 | % | | | 1.41 | % | | | 1.40 | % | | | 1.38 | % | | | 1.37 | % |
Net expenses | | | 1.34 | % | | | 1.34 | % | | | 1.34 | % | | | 1.34 | % | | | 1.34 | % | | | 1.34 | % |
Net investment income (loss) | | | 0.73 | % | | | 0.90 | % | | | 0.75 | % | | | 0.04 | % | | | (0.16 | )% | | | (0.14 | )% |
Supplemental data | | | | | | | | | | | | | | | | | | | | | | | | |
Portfolio turnover rate | | | 46 | % | | | 79 | % | | | 37 | % | | | 65 | % | | | 69 | % | | | 54 | % |
Net assets, end of period (000s omitted) | | | $417,161 | | | | $448,980 | | | | $429,089 | | | | $409,557 | | | | $366,320 | | | | $387,767 | |
| 1 | For the five months ended March 31, 2014. The Fund changed its fiscal year end from October 31 to March 31, effective March 31, 2014. |
| 2 | Calculated based upon average shares outstanding |
| 3 | Total return calculations do not include any sales charges. Returns for periods of less than one year are not annualized. |
The accompanying notes are an integral part of these financial statements.
| | | | |
| 18 | | Wells Fargo Special Small Cap Value Fund | | Financial highlights |
(For a share outstanding throughout each period)
| | | | | | | | | | | | | | | | | | | | | | | | |
| | | Year ended March 31 | | | Year ended October 31 | |
| CLASS B | | 2016 | | | 2015 | | | 20141 | | | 2013 | | | 2012 | | | 2011 | |
Net asset value, beginning of period | | | $26.69 | | | | $30.19 | | | | $29.23 | | | | $21.58 | | | | $19.85 | | | | $18.87 | |
Net investment income (loss) | | | (0.02 | )2 | | | 0.03 | 2 | | | 0.00 | 2,3 | | | (0.16 | )2 | | | (0.19 | )2 | | | (0.18 | )2 |
Net realized and unrealized gains (losses) on investments | | | (1.31 | ) | | | 1.65 | | | | 2.93 | | | | 7.81 | | | | 1.92 | | | | 1.16 | |
| | | | | | | | | | | | | | | | | | | | | | | | |
Total from investment operations | | | (1.33 | ) | | | 1.68 | | | | 2.93 | | | | 7.65 | | | | 1.73 | | | | 0.98 | |
Distributions to shareholders from | | | | | | | | | | | | | | | | | | | | | | | | |
Net realized gains | | | (0.42 | ) | | | (5.18 | ) | | | (1.97 | ) | | | 0.00 | | | | 0.00 | | | | 0.00 | |
Net asset value, end of period | | | $24.94 | | | | $26.69 | | | | $30.19 | | | | $29.23 | | | | $21.58 | | | | $19.85 | |
Total return4 | | | (4.92 | )% | | | 6.76 | % | | | 10.42 | % | | | 35.45 | % | | | 8.72 | % | | | 5.19 | % |
Ratios to average net assets (annualized) | | | | | | | | | | | | | | | | | | | | | | | | |
Gross expenses | | | 2.11 | % | | | 2.14 | % | | | 2.16 | % | | | 2.14 | % | | | 2.12 | % | | | 2.13 | % |
Net expenses | | | 2.09 | % | | | 2.09 | % | | | 2.09 | % | | | 2.09 | % | | | 2.09 | % | | | 2.09 | % |
Net investment income (loss) | | | (0.08 | )% | | | 0.09 | % | | | 0.02 | % | | | (0.64 | )% | | | (0.89 | )% | | | (0.88 | )% |
Supplemental data | | | | | | | | | | | | | | | | | | | | | | | | |
Portfolio turnover rate | | | 46 | % | | | 79 | % | | | 37 | % | | | 65 | % | | | 69 | % | | | 54 | % |
Net assets, end of period (000s omitted) | | | $1,262 | | | | $2,729 | | | | $4,224 | | | | $4,770 | | | | $9,171 | | | | $22,053 | |
| 1 | For the five months ended March 31, 2014. The Fund changed its fiscal year end from October 31 to March 31, effective March 31, 2014. |
| 2 | Calculated based upon average shares outstanding |
| 3 | Amount is less than $0.005. |
| 4 | Total return calculations do not include any sales charges. Returns for periods of less than one year are not annualized. |
The accompanying notes are an integral part of these financial statements.
| | | | | | |
| Financial highlights | | Wells Fargo Special Small Cap Value Fund | | | 19 | |
(For a share outstanding throughout each period)
| | | | | | | | | | | | | | | | | | | | | | | | |
| | | Year ended March 31 | | | Year ended October 31 | |
| CLASS C | | 2016 | | | 2015 | | | 20141 | | | 2013 | | | 2012 | | | 2011 | |
Net asset value, beginning of period | | | $26.81 | | | | $30.31 | | | | $29.34 | | | | $21.66 | | | | $19.92 | | | | $18.94 | |
Net investment income (loss) | | | (0.03 | ) | | | 0.04 | 2 | | | 0.00 | 2,3 | | | (0.18 | )2 | | | (0.19 | )2 | | | (0.18 | )2 |
Net realized and unrealized gains (losses) on investments | | | (1.31 | ) | | | 1.65 | | | | 2.94 | | | | 7.86 | | | | 1.93 | | | | 1.16 | |
| | | | | | | | | | | | | | | | | | | | | | | | |
Total from investment operations | | | (1.34 | ) | | | 1.69 | | | | 2.94 | | | | 7.68 | | | | 1.74 | | | | 0.98 | |
Distributions to shareholders from | | | | | | | | | | | | | | | | | | | | | | | | |
Net investment income | | | 0.00 | | | | (0.01 | ) | | | 0.00 | | | | 0.00 | | | | 0.00 | | | | 0.00 | |
Net realized gains | | | (0.42 | ) | | | (5.18 | ) | | | (1.97 | ) | | | 0.00 | | | | 0.00 | | | | 0.00 | |
| | | | | | | | | | | | | | | | | | | | | | | | |
Total distributions to shareholders | | | (0.42 | ) | | | (5.19 | ) | | | (1.97 | ) | | | 0.00 | | | | 0.00 | | | | 0.00 | |
Net asset value, end of period | | | $25.05 | | | | $26.81 | | | | $30.31 | | | | $29.34 | | | | $21.66 | | | | $19.92 | |
Total return4 | | | (4.93 | )% | | | 6.75 | % | | | 10.42 | % | | | 35.46 | % | | | 8.73 | % | | | 5.17 | % |
Ratios to average net assets (annualized) | | | | | | | | | | | | | | | | | | | | | | | | |
Gross expenses | | | 2.11 | % | | | 2.14 | % | | | 2.16 | % | | | 2.15 | % | | | 2.13 | % | | | 2.13 | % |
Net expenses | | | 2.09 | % | | | 2.09 | % | | | 2.09 | % | | | 2.09 | % | | | 2.09 | % | | | 2.09 | % |
Net investment income (loss) | | | (0.02 | )% | | | 0.15 | % | | | 0.00 | % | | | (0.71 | )% | | | (0.91 | )% | | | (0.89 | )% |
Supplemental data | | | | | | | | | | | | | | | | | | | | | | | | |
Portfolio turnover rate | | | 46 | % | | | 79 | % | | | 37 | % | | | 65 | % | | | 69 | % | | | 54 | % |
Net assets, end of period (000s omitted) | | | $40,512 | | | | $44,327 | | | | $42,816 | | | | $39,620 | | | | $33,478 | | | | $34,270 | |
| 1 | For the five months ended March 31, 2014. The Fund changed its fiscal year end from October 31 to March 31, effective March 31, 2014. |
| 2 | Calculated based upon average shares outstanding |
| 3 | Amount is less than $0.005. |
| 4 | Total return calculations do not include any sales charges. Returns for periods of less than one year are not annualized. |
The accompanying notes are an integral part of these financial statements.
| | | | |
| 20 | | Wells Fargo Special Small Cap Value Fund | | Financial highlights |
(For a share outstanding throughout the period)
| | | | |
| CLASS R | | Year ended
March 31 20161 | |
Net asset value, beginning of period | | | $26.72 | |
Net investment income | | | 0.08 | 2 |
Net realized and unrealized gains (losses) on investments | | | 1.87 | |
| | | | |
Total from investment operations | | | 1.95 | |
Distributions to shareholders from | | | | |
Net investment income | | | (0.28 | ) |
Net realized gains | | | (0.42 | ) |
| | | | |
Total distributions to shareholders | | | (0.70 | ) |
Net asset value, end of period | | | $27.97 | |
Total return3 | | | 7.40 | % |
Ratios to average net assets (annualized) | | | | |
Gross expenses | | | 1.59 | % |
Net expenses | | | 1.58 | % |
Net investment income | | | 0.56 | % |
Supplemental data | | | | |
Portfolio turnover rate | | | 46 | % |
Net assets, end of period (000s omitted) | | | $27 | |
| 1 | For the period from September 30, 2015 (commencement of class operations) to March 31, 2016. |
| 2 | Calculated based upon average shares outstanding |
| 3 | Returns for periods of less than one year are not annualized. |
The accompanying notes are an integral part of these financial statements.
| | | | | | |
| Financial highlights | | Wells Fargo Special Small Cap Value Fund | | | 21 | |
(For a share outstanding throughout each period)
| | | | | | | | |
| | | Year ended March 31 | |
| CLASS R6 | | 2016 | | | 20151 | |
Net asset value, beginning of period | | | $29.91 | | | | $33.38 | |
Net investment income | | | 0.39 | | | | 0.26 | 2 |
Net realized and unrealized gains (losses) on investments | | | (1.54 | ) | | | 1.80 | |
| | | | | | | | |
Total from investment operations | | | (1.15 | ) | | | 2.06 | |
Distributions to shareholders from | | | | | | | | |
Net investment income | | | (0.33 | ) | | | (0.35 | ) |
Net realized gains | | | (0.42 | ) | | | (5.18 | ) |
| | | | | | | | |
Total distributions to shareholders | | | (0.75 | ) | | | (5.53 | ) |
Net asset value, end of period | | | $28.01 | | | | $29.91 | |
Total return3 | | | (3.74 | )% | | | 7.42 | % |
Ratios to average net assets (annualized) | | | | | | | | |
Gross expenses | | | 0.93 | % | | | 0.89 | % |
Net expenses | | | 0.89 | % | | | 0.89 | % |
Net investment income | | | 1.56 | % | | | 2.19 | % |
Supplemental data | | | | | | | | |
Portfolio turnover rate | | | 46 | % | | | 79 | % |
Net assets, end of period (000s omitted) | | | $36,344 | | | | $27 | |
| 1 | For the period from October 31, 2014 (commencement of class operations) to March 31, 2015. |
| 2 | Calculated based upon average shares outstanding |
| 3 | Returns for periods of less than one year are not annualized. |
The accompanying notes are an integral part of these financial statements.
| | | | |
| 22 | | Wells Fargo Special Small Cap Value Fund | | Financial highlights |
(For a share outstanding throughout each period)
| | | | | | | | | | | | | | | | | | | | | | | | |
| | | Year ended March 31 | | | Year ended October 31 | |
| ADMINISTRATOR CLASS | | 2016 | | | 2015 | | | 20141 | | | 2013 | | | 2012 | | | 2011 | |
Net asset value, beginning of period | | | $29.94 | | | | $33.21 | | | | $31.85 | | | | $23.28 | | | | $21.21 | | | | $19.96 | |
Net investment income | | | 0.26 | 2 | | | 0.35 | 2 | | | 0.14 | 2 | | | 0.08 | 2 | | | 0.02 | 2 | | | 0.02 | 2 |
Net realized and unrealized gains (losses) on investments | | | (1.49 | ) | | | 1.83 | | | | 3.21 | | | | 8.49 | | | | 2.05 | | | | 1.23 | |
| | | | | | | | | | | | | | | | | | | | | | | | |
Total from investment operations | | | (1.23 | ) | | | 2.18 | | | | 3.35 | | | | 8.57 | | | | 2.07 | | | | 1.25 | |
Distributions to shareholders from | | | | | | | | | | | | | | | | | | | | | | | | |
Net investment income | | | (0.27 | ) | | | (0.27 | ) | | | (0.02 | ) | | | (0.00 | )3 | | | 0.00 | | | | 0.00 | |
Net realized gains | | | (0.42 | ) | | | (5.18 | ) | | | (1.97 | ) | | | 0.00 | | | | 0.00 | | | | 0.00 | |
| | | | | | | | | | | | | | | | | | | | | | | | |
Total distributions to shareholders | | | (0.69 | ) | | | (5.45 | ) | | | (1.99 | ) | | | (0.00 | )3 | | | 0.00 | | | | 0.00 | |
Net asset value, end of period | | | $28.02 | | | | $29.94 | | | | $33.21 | | | | $31.85 | | | | $23.28 | | | | $21.21 | |
Total return4 | | | (4.01 | )% | | | 7.78 | % | | | 10.91 | % | | | 36.82 | % | | | 9.76 | % | | | 6.26 | % |
Ratios to average net assets (annualized) | | | | | | | | | | | | | | | | | | | | | | | | |
Gross expenses | | | 1.26 | % | | | 1.23 | % | | | 1.24 | % | | | 1.23 | % | | | 1.22 | % | | | 1.22 | % |
Net expenses | | | 1.17 | % | | | 1.09 | % | | | 1.09 | % | | | 1.09 | % | | | 1.09 | % | | | 1.09 | % |
Net investment income | | | 0.95 | % | | | 1.10 | % | | | 1.04 | % | | | 0.30 | % | | | 0.10 | % | | | 0.12 | % |
Supplemental data | | | | | | | | | | | | | | | | | | | | | | | | |
Portfolio turnover rate | | | 46 | % | | | 79 | % | | | 37 | % | | | 65 | % | | | 69 | % | | | 54 | % |
Net assets, end of period (000s omitted) | | | $95,030 | | | | $70,100 | | | | $78,563 | | | | $96,940 | | | | $232,283 | | | | $273,510 | |
| 1 | For the five months ended March 31, 2014. The Fund changed its fiscal year end from October 31 to March 31, effective March 31, 2014. |
| 2 | Calculated based upon average shares outstanding |
| 3 | Amount is less than $0.005. |
| 4 | Returns for periods of less than one year are not annualized. |
The accompanying notes are an integral part of these financial statements.
| | | | | | |
| Financial highlights | | Wells Fargo Special Small Cap Value Fund | | | 23 | |
(For a share outstanding throughout each period)
| | | | | | | | | | | | | | | | | | | | | | | | |
| | | Year ended March 31 | | | Year ended October 31 | |
| INSTITUTIONAL CLASS | | 2016 | | | 2015 | | | 20141 | | | 2013 | | | 2012 | | | 2011 | |
Net asset value, beginning of period | | | $29.93 | | | | $33.21 | | | | $31.94 | | | | $23.36 | | | | $21.24 | | | | $19.96 | |
Net investment income | | | 0.30 | | | | 0.43 | 2 | | | 0.15 | | | | 0.10 | | | | 0.05 | 2 | | | 0.04 | |
Net realized and unrealized gains (losses) on investments | | | (1.46 | ) | | | 1.80 | | | | 3.22 | | | | 8.53 | | | | 2.07 | | | | 1.24 | |
| | | | | | | | | | | | | | | | | | | | | | | | |
Total from investment operations | | | (1.16 | ) | | | 2.23 | | | | 3.37 | | | | 8.63 | | | | 2.12 | | | | 1.28 | |
Distributions to shareholders from | | | | | | | | | | | | | | | | | | | | | | | | |
Net investment income | | | (0.32 | ) | | | (0.33 | ) | | | (0.13 | ) | | | (0.05 | ) | | | 0.00 | | | | 0.00 | |
Net realized gains | | | (0.42 | ) | | | (5.18 | ) | | | (1.97 | ) | | | 0.00 | | | | 0.00 | | | | 0.00 | |
| | | | | | | | | | | | | | | | | | | | | | | | |
Total distributions to shareholders | | | (0.74 | ) | | | (5.51 | ) | | | (2.10 | ) | | | (0.05 | ) | | | 0.00 | | | | 0.00 | |
Net asset value, end of period | | | $28.03 | | | | $29.93 | | | | $33.21 | | | | $31.94 | | | | $23.36 | | | | $21.24 | |
Total return3 | | | (3.79 | )% | | | 7.96 | % | | | 10.97 | % | | | 37.02 | % | | | 9.98 | % | | | 6.41 | % |
Ratios to average net assets (annualized) | | | | | | | | | | | | | | | | | | | | | | | | |
Gross expenses | | | 1.01 | % | | | 0.96 | % | | | 0.98 | % | | | 0.97 | % | | | 0.95 | % | | | 0.94 | % |
Net expenses | | | 0.94 | % | | | 0.94 | % | | | 0.94 | % | | | 0.94 | % | | | 0.94 | % | | | 0.93 | % |
Net investment income | | | 1.17 | % | | | 1.36 | % | | | 1.15 | % | | | 0.42 | % | | | 0.21 | % | | | 0.19 | % |
Supplemental data | | | | | | | | | | | | | | | | | | | | | | | | |
Portfolio turnover rate | | | 46 | % | | | 79 | % | | | 37 | % | | | 65 | % | | | 69 | % | | | 54 | % |
Net assets, end of period (000s omitted) | | | $256,190 | | | | $189,965 | | | | $146,162 | | | | $138,638 | | | | $88,067 | | | | $27,217 | |
| 1 | For the five months ended March 31, 2014. The Fund changed its fiscal year end from October 31 to March 31, effective March 31, 2014. |
| 2 | Calculated based upon average shares outstanding |
| 3 | Returns for periods of less than one year are not annualized. |
The accompanying notes are an integral part of these financial statements.
| | | | |
| 24 | | Wells Fargo Special Small Cap Value Fund | | Notes to financial statements |
1. ORGANIZATION
Wells Fargo Funds Trust (the “Trust”), a Delaware statutory trust organized on March 10, 1999, is an open-end management investment company registered under the Investment Company Act of 1940, as amended (the “1940 Act”). As an investment company, the Trust follows the accounting and reporting guidance in Financial Accounting Standards Board (“FASB”) Accounting Standards Codification Topic 946, Financial Services – Investment Companies. These financial statements report on the Wells Fargo Special Small Cap Value Fund (the “Fund”) which is a diversified series of the Trust.
2. SIGNIFICANT ACCOUNTING POLICIES
The following significant accounting policies, which are consistently followed in the preparation of the financial statements of the Fund, are in conformity with U.S. generally accepted accounting principles which require management to make estimates and assumptions that affect the reported amounts of assets and liabilities, disclosure of contingent assets and liabilities at the date of the financial statements, and the reported amounts of revenues and expenses during the reporting period. Actual results could differ from those estimates.
Securities valuation
All investments are valued each business day as of the close of regular trading on the New York Stock Exchange (generally 4 p.m. Eastern Time), although the Fund may deviate from this calculation time under unusual or unexpected circumstances.
Equity securities that are listed on a foreign or domestic exchange or market are valued at the official closing price or, if none, the last sales price. If no sale occurs on the principal exchange or market that day, the prior day’s price will be deemed “stale” and a fair value price will be determined in accordance with the Fund’s Valuation Procedures.
Investments in registered open-end investment companies are valued at net asset value. Interests in non-registered investment vehicles that are redeemable at net asset value are fair valued normally at net asset value.
Investments which are not valued using any of the methods discussed above are valued at their fair value, as determined in good faith by the Board of Trustees of the Fund. The Board of Trustees has established a Valuation Committee comprised of the Trustees and has delegated to it the authority to take any actions regarding the valuation of portfolio securities that the Valuation Committee deems necessary or appropriate, including determining the fair value of portfolio securities, unless the determination has been delegated to the Management Valuation Team of Wells Fargo Funds Management, LLC (“Funds Management”). The Board of Trustees retains the authority to make or ratify any valuation decisions or approve any changes to the Valuation Procedures as it deems appropriate. On a quarterly basis, the Board of Trustees receives reports on any valuation actions taken by the Valuation Committee or the Management Valuation Team which may include items for ratification.
Valuations of fair valued securities are compared to the next actual sales price when available, or other appropriate market values, to assess the continued appropriateness of the fair valuation methodologies used. These securities are fair valued on a day-to-day basis, taking into consideration changes to appropriate market information and any significant changes to the inputs considered in the valuation process until there is a readily available price provided on an exchange or by an independent pricing service. Valuations received from an independent pricing service or independent broker-dealer quotes are periodically validated by comparisons to most recent trades and valuations provided by other independent pricing services in addition to the review of prices by the manager and/or subadviser. Unobservable inputs used in determining fair valuations are identified based on the type of security, taking into consideration factors utilized by market participants in valuing the investment, knowledge about the issuer and the current market environment.
Security loans
The Fund may lend its securities from time to time in order to earn additional income in the form of fees or interest on securities received as collateral or the investment of any cash received as collateral. The Fund continues to receive interest or dividends on the securities loaned. The Fund receives collateral in the form of cash or securities with a value at least equal to the value of the securities on loan. The value of the loaned securities is determined at the close of each business day and any additional required collateral is delivered to the Fund on the next business day. In a securities lending transaction, the net asset value of the Fund will be affected by an increase or decrease in the value of the securities loaned and by an increase or decrease in the value of the instrument in which collateral is invested. The amount of securities lending activity undertaken by the Fund fluctuates from time to time. In the event of default or bankruptcy by the borrower, the Fund may be prevented from recovering the loaned securities or gaining access to the collateral or may experience delays or costs in doing so. In addition, the investment of any cash collateral received may lose all or part of its value. The Fund has the right under the lending agreement to recover the securities from the borrower on demand.
| | | | | | |
| Notes to financial statements | | Wells Fargo Special Small Cap Value Fund | | | 25 | |
The Fund lends its securities through an unaffiliated securities lending agent. Cash collateral received in connection with its securities lending transactions is invested in Securities Lending Cash Investments, LLC (the “Securities Lending Fund”). The Securities Lending Fund is exempt from registration under Section 3(c)(7) of the 1940 Act and is managed by Funds Management and is subadvised by Wells Capital Management Incorporated (“WellsCap”), an affiliate of Funds Management and an indirect wholly owned subsidiary of Wells Fargo & Company (“Wells Fargo”). Funds Management receives an advisory fee starting at 0.05% and declining to 0.01% as the average daily net assets of the Securities Lending Fund increase. All of the fees received by Funds Management are paid to WellsCap for its services as subadviser. The Securities Lending Fund seeks to provide a positive return compared to the daily Fed Funds Open rate by investing in high-quality, U.S. dollar-denominated short-term money market instruments. Securities Lending Fund investments are fair valued based upon the amortized cost valuation technique. Income earned from investment in the Securities Lending Fund is included in securities lending income on the Statement of Operations.
Security transactions and income recognition
Securities transactions are recorded on a trade date basis. Realized gains or losses are recorded on the basis of identified cost.
Dividend income is recognized on the ex-dividend date. Dividend income is recorded net of foreign taxes withheld where recovery of such taxes is not assured.
Distributions to shareholders
Distributions to shareholders from net investment income and net realized gains, if any, are recorded on the ex-dividend date. Such distributions are determined in conformity with federal income tax regulations, which may differ in amount or character from net investment income and realized gains recognized for purposes of U.S. generally accepted accounting principles.
Federal and other taxes
The Fund intends to continue to qualify as a regulated investment company by distributing substantially all of its investment company taxable and any net realized capital gains (after reduction for capital loss carryforwards) sufficient to relieve it from all, or substantially all, federal income taxes. Accordingly, no provision for federal income taxes was required.
The Fund’s income and federal excise tax returns and all financial records supporting those returns for the prior three fiscal years are subject to examination by the federal and Delaware revenue authorities. Management has analyzed the Fund’s tax positions taken on federal, state, and foreign tax returns for all open tax years and does not believe that there are any uncertain tax positions that require recognition of a tax liability.
Reclassifications are made to the Fund’s capital accounts for permanent tax differences to reflect income and gains available for distribution (or available capital loss carryforwards) under federal income tax regulations. U.S. generally accepted accounting principles require that certain components of net assets be adjusted to reflect permanent differences between financial and tax reporting. These reclassifications have no effect on net assets or net asset values per share. At March 31, 2016, as a result of permanent book-to-tax differences, the following reclassification adjustments were made on the Statement of Assets and Liabilities:
| | |
Undistributed net
investment income | | Accumulated net
realized losses
on investments |
| $(74,778) | | $74,778 |
As of March 31, 2016, the Fund had capital loss carryforwards available to offset future net realized capital gains in the amount of $1,418,962 expiring in 2017.
Class allocations
The separate classes of shares offered by the Fund differ principally in applicable sales charges, distribution, shareholder servicing, and administration fees. Class specific expenses are charged directly to that share class. Investment income, common expenses, and realized and unrealized gains (losses) on investments are allocated daily to each class of shares based on the relative proportion of net assets of each class.
3. FAIR VALUATION MEASUREMENTS
Fair value measurements of investments are determined within a framework that has established a fair value hierarchy based upon the various data inputs utilized in determining the value of the Fund’s investments. The three-level hierarchy gives the highest priority to unadjusted quoted prices in active markets for identical assets or liabilities (Level 1) and the
| | | | |
| 26 | | Wells Fargo Special Small Cap Value Fund | | Notes to financial statements |
lowest priority to significant unobservable inputs (Level 3). The Fund’s investments are classified within the fair value hierarchy based on the lowest level of input that is significant to the fair value measurement. The inputs are summarized into three broad levels as follows:
| n | | Level 1 – quoted prices in active markets for identical securities |
| n | | Level 2 – other significant observable inputs (including quoted prices for similar securities, interest rates, prepayment speeds, credit risk, use of amortized cost, etc.) |
| n | | Level 3 – significant unobservable inputs (including the Fund’s own assumptions in determining the fair value of investments) |
The inputs or methodologies used for valuing investments in securities are not necessarily an indication of the risk associated with investing in those securities.
The following is a summary of the inputs used in valuing the Fund’s assets and liabilities as of March 31, 2016:
| | | | | | | | | | | | | | | | |
| | | Quoted prices
(Level 1) | | | Other significant
observable inputs
(Level 2) | | | Significant
unobservable inputs
(Level 3) | | | Total | |
Assets | | | | | | | | | | | | | | | | |
Investments in : | | | | | | | | | | | | | | | | |
| | | | |
Common stocks | | | | | | | | | | | | | | | | |
Consumer discretionary | | $ | 88,789,349 | | | $ | 0 | | | $ | 0 | | | $ | 88,789,349 | |
Consumer staples | | | 49,698,452 | | | | 0 | | | | 0 | | | | 49,698,452 | |
Energy | | | 16,233,004 | | | | 3,359,786 | | | | 0 | | | | 19,592,790 | |
Financials | | | 198,272,504 | | | | 0 | | | | 0 | | | | 198,272,504 | |
Health care | | | 68,657,683 | | | | 0 | | | | 0 | | | | 68,657,683 | |
Industrials | | | 140,156,987 | | | | 0 | | | | 0 | | | | 140,156,987 | |
Information technology | | | 99,504,731 | | | | 0 | | | | 0 | | | | 99,504,731 | |
Materials | | | 98,957,230 | | | | 0 | | | | 0 | | | | 98,957,230 | |
Utilities | | | 20,809,477 | | | | 0 | | | | 0 | | | | 20,809,477 | |
| | | | |
Exchange-traded funds | | | 6,378,267 | | | | 0 | | | | 0 | | | | 6,378,267 | |
| | | | |
Short-term investments | | | | | | | | | | | | | | | | |
Investment companies | | | 53,578,187 | | | | 0 | | | | 0 | | | | 53,578,187 | |
Investments measured at net asset value* | | | | | | | | | | | | | | | 25,503,775 | |
Total assets | | $ | 841,035,871 | | | $ | 3,359,786 | | | $ | 0 | | | $ | 869,899,432 | |
| * | Investments that are measured at fair value using the net asset value per share (or its equivalent) as a practical expedient have not been categorized in the fair value hierarchy. The fair value amount presented in the table is intended to permit reconciliation of the fair value hierarchy to the amounts presented in the Statement of Assets and Liabilities. The Fund’s investment in Securities Lending Cash Investments, LLC valued at $25,503,775 does not have a redemption period notice, can be redeemed daily and does not have any unfunded commitments. |
The Fund recognizes transfers between levels within the fair value hierarchy at the end of the reporting period. At March 31, 2016, the Fund did not have any transfers into/out of Level 1, Level 2, or Level 3.
4. TRANSACTIONS WITH AFFILIATES
Management fee
Funds Management, an indirect wholly owned subsidiary of Wells Fargo, is the manager of the Fund and provides advisory and fund-level administrative services under an investment management agreement. Under the investment management agreement, Funds Management is responsible for, among other services, implementing the investment objectives and strategies of the Fund, supervising the applicable subadviser, providing fund-level administrative services in connection with the Fund’s operations, and providing any other fund-level administrative services reasonably necessary for the operation of the Fund. As compensation for its services under the investment management agreement, Funds Management is entitled to receive an annual management fee starting at 0.85% and declining to 0.71% as the average daily net assets of the Fund increase.
Prior to July 1, 2015, Funds Management provided advisory services pursuant to an investment advisory agreement and was entitled to receive an annual fee which started at 0.80% and declined to 0.68% as the average daily net assets of the
| | | | | | |
| Notes to financial statements | | Wells Fargo Special Small Cap Value Fund | | | 27 | |
Fund increased. In addition, fund-level administrative services were provided by Funds Management under a separate administration agreement at an annual fee which started at 0.05% and declined to 0.03% as the average daily net assets of the Fund increased. For financial statement purposes, the advisory fee and fund-level administration fee for the year ended March 31, 2016 have been included in management fee on the Statement of Operations.
For the year ended March 31, 2016, the management fee was equivalent to an annual rate of 0.84% of the Fund’s average daily net assets.
Funds Management has retained the services of a subadviser to provide daily portfolio management to the Fund. The fee for subadvisory services is borne by Funds Management. WellsCap, is the subadviser to the Fund and is entitled to receive a fee from Funds Management at an annual rate starting at 0.55% and declining to 0.40% as the average daily net assets of the Fund increase.
Administration fees
Under a class-level administration agreement, Funds Management provides class-level administrative services to the Fund, which includes paying fees and expenses for services provided by the transfer agent, sub-transfer agents, omnibus account servicers and record-keepers. As compensation for its services under the class-level administration agreement, Funds Management receives an annual fee which is calculated based on the average daily net assets of each class as follows:
| | | | | | | | |
| | | Class-level administration fee | |
| | | Current rate | | | Rate prior to
July 1, 2015 | |
Class A, Class B, Class C | | | 0.21 | % | | | 0.26 | % |
Class R | | | 0.21 | | | | N/A | |
Class R6 | | | 0.03 | | | | 0.03 | |
Administrator Class | | | 0.13 | | | | 0.10 | |
Institutional Class | | | 0.13 | | | | 0.08 | |
Funds Management has contractually waived and/or reimbursed management and administration fees to the extent necessary to maintain certain net operating expense ratios for the Fund. Waiver of fees and/or reimbursement of expenses by Funds Management were made first from fund level expenses on a proportionate basis and then from class specific expenses. Funds Management has committed to waive fees and/or reimburse expenses to the extent necessary to cap expenses as follows:
| | | | | | | | |
| | | Expense
ratio cap | | | Expiration date | |
Class A | | | 1.34 | % | | | July 31, 2016 | |
Class B | | | 2.09 | % | | | July 31, 2016 | |
Class C | | | 2.09 | % | | | July 31, 2016 | |
Class R | | | 1.59 | % | | | July 31, 2017 | |
Class R6 | | | 0.89 | % | | | July 31, 2016 | |
Administrator Class | | | 1.20 | % | | | July 31, 2016 | * |
Institutional Class | | | 0.94 | % | | | July 31, 2016 | |
| * | Prior to August 1, 2015, the Fund’s expenses were capped at 1.09% for Administrator Class shares. |
After this time, the cap may be increased or the commitment to maintain the cap may be terminated only with the approval of the Board of Trustees.
Distribution fees
The Trust has adopted a distribution plan for Class B, Class C, and Class R shares of the Fund pursuant to Rule 12b-1 under the 1940 Act. Distribution fees are charged to Class B, Class C, and Class R shares and paid to Wells Fargo Funds Distributor, LLC (“Funds Distributor”), the principal underwriter, at an annual rate of 0.75% of the average daily net assets of Class B and Class C shares and 0.25% of the average daily net assets of Class R shares.
| | | | |
| 28 | | Wells Fargo Special Small Cap Value Fund | | Notes to financial statements |
In addition, Funds Distributor is entitled to receive the front-end sales charge from the purchase of Class A shares and a contingent deferred sales charge on the redemption of certain Class A shares. Funds Distributor is also entitled to receive the contingent deferred sales charges from redemptions of Class B and Class C shares. For the year ended March 31, 2016, Funds Distributor received $7,690 from the sale of Class A shares and $84 in contingent deferred sales charges from redemptions of Class C shares, respectively.
Shareholder servicing fees
The Trust has entered into contracts with one or more shareholder servicing agents, whereby Class A, Class B, Class C, Class R, and Administrator Class of the Fund are charged a fee at an annual rate of 0.25% of the average daily net assets of each respective class.
A portion of these total shareholder servicing fees were paid to affiliates of Wells Fargo.
5. INVESTMENT PORTFOLIO TRANSACTIONS
Purchases and sales of investments, excluding U.S. government obligations (if any) and short-term securities, for the year ended March 31, 2016 were $446,218,395 and $329,076,656, respectively.
6. INVESTMENTS IN AFFILIATES
An affiliated investment is a company which is under common ownership or control of the Fund or which the Fund has ownership of at least 5% of the outstanding voting shares. The following is a summary of transactions for the long-term holdings of issuers that were either affiliates of the Fund at the beginning of the period or the end of the period.
| | | | | | | | | | | | | | | | | | | | | | | | | | |
| | | Shares,
beginning
of period | | Shares
purchased | | | Shares
sold | | | Shares, end of period | | | Value, end of period | | | Income from
affiliated securities | | | Realized losses | |
Imation Corporation | | 1,929,730 | | | 0 | | | | 0 | | | | 1,929,730 | | | $ | 2,991,082 | | | $ | 0 | | | $ | 0 | |
7. BANK BORROWINGS
The Trust (excluding the money market funds and certain other funds) and Wells Fargo Variable Trust are parties to a $200,000,000 revolving credit agreement whereby the Fund is permitted to use bank borrowings for temporary or emergency purposes, such as to fund shareholder redemption requests. Interest under the credit agreement is charged to the Fund based on a borrowing rate equal to the higher of the Federal Funds rate in effect on that day plus 1.25% or the overnight LIBOR rate in effect on that day plus 1.25%. In addition, an annual commitment fee equal to 0.20% of the unused balance is allocated to each participating fund. Prior to September 1, 2015, the revolving credit agreement amount was $150,000,000 and the annual commitment fee was equal to 0.10% of the unused balance which was allocated to each participating fund.
For the year ended March 31, 2016, there were no borrowings by the Fund under the agreement
8. DISTRIBUTIONS TO SHAREHOLDERS
The tax character of distributions paid during the years ended March 31, 2016 and March 31, 2015 were as follows:
| | | | | | | | |
| | | Year ended March 31 | |
| | | 2016 | | | 2015 | |
Ordinary income | | $ | 6,199,230 | | | $ | 30,012,386 | |
Long-term capital gain | | | 11,503,259 | | | | 87,020,880 | |
As of March 31, 2016, the components of distributable earnings on a tax basis were as follows:
| | | | | | |
Undistributed
ordinary
income | | Undistributed
long-term
gain | | Unrealized
gains | | Capital loss
carryforward |
| $2,100,930 | | $4,224,105 | | $61,277,946 | | $(1,418,962) |
| | | | | | |
| Notes to financial statements | | Wells Fargo Special Small Cap Value Fund | | | 29 | |
9. CONCENTRATION RISK
Concentration risks result from exposure to a limited number of sectors. A fund that invests a substantial portion of its assets in any sector may be more affected by changes in that sector than would be a fund whose investments are not heavily weighted in any sector.
10. INDEMNIFICATION
Under the Trust’s organizational documents, the officers and Trustees have been granted certain indemnification rights against certain liabilities that may arise out of performance of their duties to the Trust. Additionally, in the normal course of business, the Trust may enter into contracts with service providers that contain a variety of indemnification clauses. The Trust’s maximum exposure under these arrangements is dependent on future claims that may be made against the Fund and, therefore, cannot be estimated.
| | | | |
| 30 | | Wells Fargo Special Small Cap Value Fund | | Report of independent registered public accounting firm |
BOARD OF TRUSTEES AND SHAREHOLDERS OF WELLS FARGO FUNDS TRUST:
We have audited the accompanying statement of assets and liabilities, including the portfolio of investments, of the Wells Fargo Special Small Cap Value Fund (formerly known as Wells Fargo Advantage Special Small Cap Value Fund) (the “Fund”), one of the funds constituting the Wells Fargo Funds Trust, as of March 31, 2016, and the related statement of operations for the year then ended, the statements of changes in net assets for each of the years in the two-year period then ended, and the financial highlights for each of the years or periods in the two-year period then ended, the period from November 1, 2013 to March 31, 2014, and each of the years in the three-year period ended October 31, 2013. These financial statements and financial highlights are the responsibility of the Fund’s management. Our responsibility is to express an opinion on these financial statements and financial highlights based on our audits.
We conducted our audits in accordance with the standards of the Public Company Accounting Oversight Board (United States). Those standards require that we plan and perform the audit to obtain reasonable assurance about whether the financial statements and financial highlights are free of material misstatement. An audit includes examining, on a test basis, evidence supporting the amounts and disclosures in the financial statements. Our procedures included confirmation of securities owned as of March 31, 2016, by correspondence with the custodian and brokers or by other appropriate auditing procedures. An audit also includes assessing the accounting principles used and significant estimates made by management, as well as evaluating the overall financial statement presentation. We believe that our audits provide a reasonable basis for our opinion.
In our opinion, the financial statements and financial highlights referred to above present fairly, in all material respects, the financial position of the Wells Fargo Special Small Cap Value Fund as of March 31, 2016, the results of its operations for the year then ended, the changes in its net assets for each of the years in the two-year period then ended, and the financial highlights for each of the years or periods noted in the first paragraph above, in conformity with U.S. generally accepted accounting principles.

Boston, Massachusetts
May 25, 2016
| | | | | | |
| Other information (unaudited) | | Wells Fargo Special Small Cap Value Fund | | | 31 | |
TAX INFORMATION
For corporate shareholders, pursuant to Section 854 of the Internal Revenue Code, 90.42% of ordinary income dividends qualify for the corporate dividends-received deduction for the fiscal year ended March 31, 2016.
Pursuant to Section 852 of the Internal Revenue Code, $11,503,259 was designated as long-term capital gain distributions for the fiscal year ended March 31, 2016.
Pursuant to Section 854 of the Internal Revenue Code, $5,861,449 of income dividends paid during the fiscal year ended March 31, 2016 has been designated as qualified dividend income (QDI).
PROXY VOTING INFORMATION
A description of the policies and procedures that the Fund uses to determine how to vote proxies relating to portfolio securities is available, upon request, by calling 1-800-222-8222, visiting our website at wellsfargofunds.com, or visiting the SEC website at sec.gov. Information regarding how the Fund voted proxies relating to portfolio securities during the most recent 12-month period ended June 30 is available on the Fund’s website at wellsfargofunds.com or by visiting the SEC website at sec.gov.
PORTFOLIO HOLDINGS INFORMATION
The complete portfolio holdings for the Fund are publicly available monthly on the Fund’s website (wellsfargofunds.com), on a one-month delayed basis. In addition, top ten holdings information (excluding derivative positions) for the Fund is publicly available on the Fund’s website on a monthly, seven-day or more delayed basis. The Fund files its complete schedule of portfolio holdings with the SEC for the first and third quarters of each fiscal year on Form N-Q, which is available by visiting the SEC website at sec.gov. In addition, the Fund’s Form N-Q may be reviewed and copied at the SEC’s Public Reference Room in Washington, DC, and at regional offices in New York City, at 233 Broadway, and in Chicago, at 175 West Jackson Boulevard, Suite 900. Information about the Public Reference Room may be obtained by calling 1-800-SEC-0330.
| | | | |
| 32 | | Wells Fargo Special Small Cap Value Fund | | Other information (unaudited) |
BOARD OF TRUSTEES AND OFFICERS
Each of the Trustees and Officers1 listed in the table below acts in identical capacities for each fund in the Wells Fargo family of funds, which consists of 144 mutual funds comprising the Wells Fargo Funds Trust, Wells Fargo Variable Trust, Wells Fargo Master Trust and four closed-end funds (collectively the “Fund Complex”). This table should be read in conjunction with the Prospectus and the Statement of Additional Information2. The mailing address of each Trustee and Officer is 525 Market Street, 12th Floor, San Francisco, CA 94105. Each Trustee and Officer serves an indefinite term, however, each Trustee serves such term until reaching the mandatory retirement age established by the Trustees.
Independent Trustees
| | | | | | |
Name and year of birth | | Position held and length of service* | | Principal occupations during past five years or longer | | Current other public
company or investment
company directorships |
William R. Ebsworth (Born 1957) | | Trustee, since 2015 | | Retired. From 1984 to 2013, equities analyst, portfolio manager, research director and chief financial officer at Fidelity Management and Research Company in Boston, Tokyo, and Hong Kong and retired in 2013 as Chief Investment Officer of Fidelity Strategic Advisers, Inc. where he lead a team of investment professionals managing client assets. Prior thereto, Board member of Hong Kong Securities Clearing Co., Hong Kong Options Clearing Corp., the Thailand International Fund, Ltd., Fidelity Investments Life Insurance Company, and Empire Fidelity Investments Life Insurance Company. Mr. Ebsworth is a CFA® charterholder and an Adjunct Lecturer, Finance, at Babson College. | | Asset Allocation Trust |
Jane A. Freeman (Born 1953) | | Trustee, since 2015 | | Retired. From 2012 to 2014 and 1999 to 2008, Chief Financial Officer of Scientific Learning Corporation. From 2008 to 2012, Ms. Freeman provided consulting services related to strategic business projects. Prior to 1999, Portfolio Manager at Rockefeller & Co. and Scudder, Stevens & Clark. Board member of the Harding Loevner Funds from 1996 to 2014, serving as both Lead Independent Director and chair of the Audit Committee. Board member of the Russell Exchange Traded Funds Trust from 2011 to 2012 and the chair of the Audit Committee. Ms. Freeman is Chair of Taproot Foundation (non-profit organization), a Board Member of Ruth Bancroft Garden (non-profit organization) and an inactive chartered financial analyst. | | Asset Allocation Trust |
Peter G. Gordon (Born 1942) | | Trustee, since 1998; Chairman, since 2005 | | Co-Founder, Retired Chairman, President and CEO of Crystal Geyser Water Company. Trustee Emeritus, Colby College. | | Asset Allocation Trust |
Isaiah Harris, Jr. (Born 1952) | | Trustee, since 2009 | | Retired. Chairman of the Board of CIGNA Corporation since 2009, and Director since 2005. From 2003 to 2011, Director of Deluxe Corporation. Prior thereto, President and CEO of BellSouth Advertising and Publishing Corp. from 2005 to 2007, President and CEO of BellSouth Enterprises from 2004 to 2005 and President of BellSouth Consumer Services from 2000 to 2003. Emeritus member of the Iowa State University Foundation Board of Governors. Emeritus Member of the Advisory Board of Iowa State University School of Business. Advisory Board Member, Palm Harbor Academy (charter school). Advisory Board Member, Child Evangelism Fellowship (non-profit). Mr. Harris is a certified public accountant (inactive status). | | CIGNA Corporation; Asset Allocation Trust |
Judith M. Johnson (Born 1949) | | Trustee, since 2008; Audit Committee Chairman, since 2008 | | Retired. Prior thereto, Chief Executive Officer and Chief Investment Officer of Minneapolis Employees Retirement Fund from 1996 to 2008. Ms. Johnson is an attorney, certified public accountant and a certified managerial accountant. | | Asset Allocation Trust |
David F. Larcker (Born 1950) | | Trustee, since 2009 | | James Irvin Miller Professor of Accounting at the Graduate School of Business, Stanford University, Director of the Corporate Governance Research Initiative and Senior Faculty of The Rock Center for Corporate Governance since 2006. From 2005 to 2008, Professor of Accounting at the Graduate School of Business, Stanford University. Prior thereto, Ernst & Young Professor of Accounting at The Wharton School, University of Pennsylvania from 1985 to 2005. | | Asset Allocation Trust |
| | | | | | |
| Other information (unaudited) | | Wells Fargo Special Small Cap Value Fund | | | 33 | |
| | | | | | |
Name and year of birth | | Position held and length of service* | | Principal occupations during past five years or longer | | Current other public company or
investment company
directorships |
Olivia S. Mitchell (Born 1953) | | Trustee, since 2006 | | International Foundation of Employee Benefit Plans Professor, Wharton School of the University of Pennsylvania since 1993. Director of Wharton’s Pension Research Council and Boettner Center on Pensions & Retirement Research, and Research Associate at the National Bureau of Economic Research. Previously, Cornell University Professor from 1978 to 1993. | | Asset Allocation Trust |
Timothy J. Penny (Born 1951) | | Trustee, since 1996 | | President and Chief Executive Officer of Southern Minnesota Initiative Foundation, a non-profit organization, since 2007 and Senior Fellow at the Humphrey Institute Policy Forum at the University of Minnesota since 1995. Member of the Board of Trustees of NorthStar Education Finance, Inc., a non-profit organization, since 2007. | | Asset Allocation Trust |
| Michael S. Scofield (Born 1943) | | Trustee, since 2010 | | Served on the Investment Company Institute’s Board of Governors and Executive Committee from 2008-2011 as well the Governing Council of the Independent Directors Council from 2006-2011 and the Independent Directors Council Executive Committee from 2008-2011. Chairman of the IDC from 2008-2010. Institutional Investor (Fund Directions) Trustee of Year in 2007. Trustee of the Evergreen Funds complex (and its predecessors) from 1984 to 2010. Chairman of the Evergreen Funds from 2000-2010. Former Trustee of the Mentor Funds. Retired Attorney, Law Offices of Michael S. Scofield. | | Asset Allocation Trust |
| * | Length of service dates reflect the Trustee’s commencement of service with the Trust’s predecessor entities, where applicable. |
Officers
| | | | | | |
Name and year of birth | | Position held and length of service | | Principal occupations during past five years or longer | | |
Karla M. Rabusch (Born 1959) | | President, since 2003 | | Executive Vice President of Wells Fargo Bank, N.A. and President of Wells Fargo Funds Management, LLC since 2003. | | |
Nancy Wiser1 (Born 1967) | | Treasurer, since 2012 | | Executive Vice President of Wells Fargo Funds Management, LLC since 2011. Chief Operating Officer and Chief Compliance Officer at LightBox Capital Management LLC, from 2008 to 2011. | | |
C. David Messman (Born 1960) | | Secretary, since 2000; Chief Legal Officer, since 2003 | | Senior Vice President and Secretary of Wells Fargo Funds Management, LLC since 2001. Assistant General Counsel of Wells Fargo Bank, N.A. since 2013 and Vice President and Managing Counsel of Wells Fargo Bank, N.A. from 1996 to 2013. | | |
Debra Ann Early (Born 1964) | | Chief Compliance Officer, since 2007 | | Executive Vice President of Wells Fargo Funds Management, LLC since 2014, Senior Vice President and Chief Compliance Officer from 2007 to 2014. | | |
David Berardi (Born 1975) | | Assistant Treasurer, since 2009 | | Vice President of Wells Fargo Funds Management, LLC since 2009. Vice President of Evergreen Investment Management Company, LLC from 2008 to 2010. Manager of Fund Reporting and Control for Evergreen Investment Management Company, LLC from 2004 to 2010. | | |
Jeremy DePalma1 (Born 1974) | | Assistant Treasurer, since 2009 | | Senior Vice President of Wells Fargo Funds Management, LLC since 2009. Senior Vice President of Evergreen Investment Management Company, LLC from 2008 to 2010 and head of the Fund Reporting and Control Team within Fund Administration from 2005 to 2010. | | |
| 1 | Nancy Wiser acts as Treasurer of 72 funds in the Fund Complex. Jeremy DePalma acts as Treasurer of 72 funds and Assistant Treasurer of 72 funds in the Fund Complex. |
| 2 | The Statement of Additional Information includes additional information about the Trustees and is available, without charge, upon request, by calling 1-800-222-8222 or by visiting the website at wellsfargofunds.com. |
| | | | |
| 34 | | Wells Fargo Special Small Cap Value Fund | | List of abbreviations |
The following is a list of common abbreviations for terms and entities that may have appeared in this report.
| ACA | — ACA Financial Guaranty Corporation |
| ADR | — American depositary receipt |
| ADS | — American depositary shares |
| AGC | — Assured Guaranty Corporation |
| AGM | — Assured Guaranty Municipal |
| Ambac | — Ambac Financial Group Incorporated |
| AMT | — Alternative minimum tax |
| BAN | — Bond anticipation notes |
| BHAC | — Berkshire Hathaway Assurance Corporation |
| CAB | — Capital appreciation bond |
| CCAB | — Convertible capital appreciation bond |
| CDA | — Community Development Authority |
| CDO | — Collateralized debt obligation |
| DRIVER | — Derivative inverse tax-exempt receipts |
| DW&P | — Department of Water & Power |
| DWR | — Department of Water Resources |
| ECFA | — Educational & Cultural Facilities Authority |
| EDA | — Economic Development Authority |
| EDFA | — Economic Development Finance Authority |
| ETF | — Exchange-traded fund |
| FDIC | — Federal Deposit Insurance Corporation |
| FFCB | — Federal Farm Credit Banks |
| FGIC | — Financial Guaranty Insurance Corporation |
| FHA | — Federal Housing Administration |
| FHLB | — Federal Home Loan Bank |
| FHLMC | — Federal Home Loan Mortgage Corporation |
| FICO | — The Financing Corporation |
| FNMA | — Federal National Mortgage Association |
| GDR | — Global depositary receipt |
| GNMA | — Government National Mortgage Association |
| HCFR | — Healthcare facilities revenue |
| HEFA | — Health & Educational Facilities Authority |
| HEFAR | — Higher education facilities authority revenue |
| HFA | — Housing Finance Authority |
| HFFA | — Health Facilities Financing Authority |
| HUD | — Department of Housing and Urban Development |
| IDA | — Industrial Development Authority |
| IDAG | — Industrial Development Agency |
| KRW | — Republic of Korea won |
| LIBOR | — London Interbank Offered Rate |
| LIFER | — Long Inverse Floating Exempt Receipts |
| LLC | — Limited liability company |
| LLLP | — Limited liability limited partnership |
| LLP | — Limited liability partnership |
| MBIA | — Municipal Bond Insurance Association |
| MFHR | — Multifamily housing revenue |
| MSTR | — Municipal securities trust receipts |
| MUD | — Municipal Utility District |
| National | — National Public Finance Guarantee Corporation |
| PCFA | — Pollution Control Financing Authority |
| PCL | — Public Company Limited |
| PCR | — Pollution control revenue |
| PFA | — Public Finance Authority |
| PFFA | — Public Facilities Financing Authority |
| PFOTER | — Puttable floating option tax-exempt receipts |
| plc | — Public limited company |
| PUTTER | — Puttable tax-exempt receipts |
| R&D | — Research & development |
| Radian | — Radian Asset Assurance |
| RAN | — Revenue anticipation notes |
| RDA | — Redevelopment Authority |
| RDFA | — Redevelopment Finance Authority |
| REIT | — Real estate investment trust |
| ROC | — Reset option certificates |
| SAVRS | — Select auction variable rate securities |
| SBA | — Small Business Authority |
| SDR | — Swedish depositary receipt |
| SFHR | — Single-family housing revenue |
| SFMR | — Single-family mortgage revenue |
| SPA | — Standby purchase agreement |
| SPDR | — Standard & Poor’s Depositary Receipts |
| SPEAR | — Short Puttable Exempt Adjustable Receipts |
| STRIPS | — Separate trading of registered interest and |
| TAN | — Tax anticipation notes |
| TIPS | — Treasury inflation-protected securities |
| TRAN | — Tax revenue anticipation notes |
| TTFA | — Transportation Trust Fund Authority |
| TVA | — Tennessee Valley Authority |
This page is intentionally left blank.
This page is intentionally left blank.

For more information
More information about Wells Fargo Funds is available free upon request. To obtain literature, please write, email, visit the Fund’s website, or call:
Wells Fargo Funds
P.O. Box 8266
Boston, MA 02266-8266
Email: fundservice@wellsfargo.com
Website: wellsfargofunds.com
Individual investors: 1-800-222-8222
Retail investment professionals: 1-888-877-9275
Institutional investment professionals: 1-866-765-0778
This report and the financial statements contained herein are submitted for the general information of the shareholders of the Fund. If this report is used for promotional purposes, distribution of the report must be accompanied or preceded by a current prospectus. Before investing, please consider the investment objectives, risks, charges, and expenses of the investment. For a current prospectus and, if available, a summary prospectus, containing this information, call 1-800-222-8222 or visit the Fund’s website at wellsfargofunds.com. Read the prospectus carefully before you invest or send money.
Wells Fargo Asset Management (WFAM) is a trade name used by the asset management businesses of Wells Fargo & Company. Wells Fargo Funds Management, LLC, a wholly owned subsidiary of Wells Fargo & Company, provides investment advisory and administrative services for Wells Fargo Funds. Other affiliates of Wells Fargo & Company provide subadvisory and other services for the funds. The funds are distributed by Wells Fargo Funds Distributor, LLC, Member FINRA, an affiliate of Wells Fargo & Company.
NOT FDIC INSURED ¡ NO BANK GUARANTEE ¡ MAY LOSE VALUE
© 2016 Wells Fargo Funds Management, LLC. All rights reserved.
| | |
 | | 241819 05-16 A246/AR246 03-16 |
Annual Report
March 31, 2016

Wells Fargo Traditional Small Cap Growth Fund


Reduce clutter. Save trees.
Sign up for electronic delivery of prospectuses and shareholder reports at wellsfargo.com/advantagedelivery
Contents
The views expressed and any forward-looking statements are as of March 31, 2016, unless otherwise noted, and are those of the Fund managers and/or Wells Fargo Funds Management, LLC. Discussions of individual securities, or the markets generally, or any Wells Fargo Fund are not intended as individual recommendations. Future events or results may vary significantly from those expressed in any forward-looking statements. The views expressed are subject to change at any time in response to changing circumstances in the market. Wells Fargo Funds Management, LLC and the Fund disclaim any obligation to publicly update or revise any views expressed or forward-looking statements.
NOT FDIC INSURED ¡ NO BANK GUARANTEE ¡ MAY LOSE VALUE
| | | | |
| 2 | | Wells Fargo Traditional Small Cap Growth Fund | | Letter to shareholders (unaudited) |

Karla M. Rabusch
President
Wells Fargo Funds
Throughout the period, stock performance was highly volatile.
Stock values recovered during the second half of the first quarter of 2016.
Dear Valued Shareholder:
We are pleased to offer you this annual report for the Wells Fargo Traditional Small Cap Growth Fund for the 12-month period that ended March 31, 2016. Throughout the period, stock performance was highly volatile. Investors reacted to slowing economic growth, moderating corporate earnings, weakening commodity prices, increasing central-bank intervention, and shifts in currency values. During the last four weeks of the period, investor sentiment appeared to move beyond these concerns as economic data firmed and stocks gained across the capitalization spectrum.
As investors grew concerned about global issues, volatility increased.
A common measure of investors’ stock volatility expectations—the Chicago Board Options Exchange (CBOE) Volatility Index (VIX)1—illustrated the shifts in investor sentiment. The VIX spiked to readings above 40 in August 2015, indicating increased investor anxiety. During a comparatively calm autumn, VIX readings trended to the midteens and closer to their five-year average. Then stock markets grew volatile again as the winter months arrived. After the new year began, VIX readings spiked to the high 20s as U.S. equity markets posted their worst start to a calendar year on record. Stock values recovered during the second half of the first quarter of 2016. Investors appeared to be encouraged by improving economic data and the reassurances of central bankers that they remain committed to spurring growth through policy initiatives.
However, business, economic, and central-bank policy development had countervailing influences. For example, while a stronger dollar benefited consumer purchasing power, it tended to negatively affect corporate earnings and investment gains earned overseas when translated to U.S. dollars. Lower energy costs helped consumers’ budgets but hampered the profits and stock performance in the energy sector. While lower interest rates encouraged spending, the potential for interest-rate increases caused uncertainty.
Central bankers responded with policy initiatives in response to shifting economic conditions.
In December 2015, the U.S. Federal Reserve (Fed) increased the federal funds rate, the first interest-rate increase since 2006. The Fed also expressed its intention to increase the rate several times during 2016. After the new year began, as data weakened and volatility increased, the Fed retrenched, which injected additional uncertainty into the markets. In the eurozone, the European Central Bank continued to encourage lending and investing by making funds available to banks at low interest rates, imposing a negative interest rate on bank deposits, and purchasing bonds through its quantitative easing program. In Japan, the central bank also implemented a negative interest-rate policy intended to spur lending and investment. In China, the People’s Bank of China lowered interest rates and bank reserve requirements, in addition to devaluing the country’s currency to support exports.
| 1 | The Chicago Board Options Exchange (CBOE) Volatility Index (VIX) is a key measure of market expectations of near-term volatility conveyed by the S&P 500 stock index option prices. Since its introduction in 1993, VIX has been considered by many to be the world’s premier barometer of investor sentiment and market volatility. Several investors expressed interest in trading instruments related to the market’s expectation of future volatility, and so VIX futures were introduced in 2004, and VIX options were introduced in 2006. |
| | | | | | |
| Letter to shareholders (unaudited) | | Wells Fargo Traditional Small Cap Growth Fund | | | 3 | |
Volatility and recoveries highlighted the value of a long-term investment strategy.
The experience of the past 12 months demonstrated the value of maintaining a disciplined, long-term investment strategy despite short-term volatility. Broad U.S. equity indexes trimmed their worst losses measured to the midpoint of the period to recover all or a portion of their lost values by the end of the period. For example, the S&P 500 Index,2 a commonly referenced gauge of large-cap stock performance, gained 1.78% for the 12-month period that ended March 31, 2016, after recording a 6.18% loss for the six-month period that ended September 30, 2015. Some observers attributed the S&P 500 Index’s relative outperformance to investors who moved their equity allocations higher in the capitalization structure in pursuit of the perceived safety of large-cap stocks. The Russell Midcap® Index3 lost 4.04% for the 12-month period that ended March 31, 2016, regaining more than half of the 9.42% loss it had recorded for the six-month period that ended September 30, 2015. For the 12-month period that ended March 31, 2016, the Russell 2000® Index,4 a common small-cap stock index, lost 9.76%, an improvement from the 11.55% loss it had recorded during the six-month period that ended September 30, 2015.
Don’t let short-term uncertainty derail long-term investment goals.
Periods of investment uncertainty can present challenges, but experience has taught us that maintaining long-term investment goals can be an effective way to plan for the future. To help you create a sound strategy based on your personal goals and risk tolerance, Wells Fargo Funds offers more than 100 mutual funds spanning a wide range of asset classes and investment styles. Although diversification cannot guarantee an investment profit or prevent losses, we believe it can be an effective way to manage investment risk and potentially smooth out overall portfolio performance. We encourage investors to know their investments and to understand that appropriate levels of risk-taking may unlock opportunities.
Thank you for choosing to invest with Wells Fargo Funds. We appreciate your confidence in us and remain committed to helping you meet your financial needs.
Sincerely,

Karla M. Rabusch
President
Wells Fargo Funds
For further information about your Fund, contact your investment professional, visit our website at wellsfargofunds.com, or call us directly at 1-800-222-8222. We are available 24 hours a day, 7 days a week.
| 2 | The S&P 500 Index consists of 500 stocks chosen for market size, liquidity, and industry group representation. It is a market-value-weighted index with each stock’s weight in the index proportionate to its market value. You cannot invest directly in an index. |
| 3 | The Russell Midcap® Index measures the performance of the 800 smallest companies in the Russell 1000® Index, which represent approximately 25% of the total market capitalization of the Russell 1000® Index. You cannot invest directly in an index. |
| 4 | The Russell 2000® Index measures the performance of the 2,000 smallest companies in the Russell 3000® Index, which represents approximately 8% of the total market capitalization of the Russell 3000® Index. You cannot invest directly in an index. |
| | | | |
| 4 | | Wells Fargo Traditional Small Cap Growth Fund | | Performance highlights (unaudited) |
Investment objective
The Fund seeks long-term capital appreciation.
Manager
Wells Fargo Funds Management, LLC
Subadviser
Wells Capital Management Incorporated
Portfolio manager
Alexi Makkas
Average annual total returns (%) as of March 31, 20161
| | | | | | | | | | | | | | | | | | | | | | | | | | | | | | | | | | |
| | | | | Including sales charge | | | Excluding sales charge | | | Expense ratios2 (%) | |
| | | Inception date | | 1 year | | | 5 year | | | 10 year | | | 1 year | | | 5 year | | | 10 year | | | Gross | | | Net3 | |
| Class A (EGWAX) | | 6-5-1995 | | | (17.87 | ) | | | 4.22 | | | | 4.01 | | | | (12.86 | ) | | | 5.46 | | | | 4.63 | | | | 1.42 | | | | 1.33 | |
| Class C (EGWCX) | | 7-30-2010 | | | (14.55 | ) | | | 4.66 | | | | 3.85 | | | | (13.55 | ) | | | 4.66 | | | | 3.85 | | | | 2.17 | | | | 2.08 | |
| Administrator Class (EGWDX) | | 7-30-2010 | | | – | | | | – | | | | – | | | | (12.76 | ) | | | 5.61 | | | | 4.73 | | | | 1.34 | | | | 1.20 | |
| Institutional Class (EGRYX) | | 11-19-1997 | | | – | | | | – | | | | – | | | | (12.58 | ) | | | 5.82 | | | | 4.96 | | | | 1.09 | | | | 0.98 | |
| Russell 2000® Growth Index4 | | – | | | – | | | | – | | | | – | | | | (11.84 | ) | | | 7.70 | | | | 6.00 | | | | – | | | | – | |
Figures quoted represent past performance, which is no guarantee of future results, and do not reflect taxes that a shareholder may pay on fund distributions or the redemption of fund shares. Investment return and principal value of an investment will fluctuate so that an investor’s shares, when redeemed, may be worth more or less than their original cost. Performance shown without sales charges would be lower if sales charges were reflected. Current performance may be lower or higher than the performance data quoted, which assumes the reinvestment of dividends and capital gains. Current month-end performance is available on the Fund’s website, wellsfargofunds.com.
Index returns do not include transaction costs associated with buying and selling securities, any mutual fund fees or expenses, or any taxes. It is not possible to invest directly in an index.
For Class A shares, the maximum front-end sales charge is 5.75%. For Class C shares, the maximum contingent deferred sales charge is 1.00%. Performance including a contingent deferred sales charge assumes the sales charge for the corresponding time period. Administrator Class and Institutional Class shares are sold without a front-end sales charge or contingent deferred sales charge.
Stock values fluctuate in response to the activities of individual companies and general market and economic conditions. Smaller-company stocks tend to be more volatile and less liquid than those of larger companies. Consult the Fund’s prospectus for additional information on these and other risks.
Please see footnotes on page 5.
| | | | | | |
| Performance highlights (unaudited) | | Wells Fargo Traditional Small Cap Growth Fund | | | 5 | |
|
| Growth of $10,000 investment as of March 31, 20165 |
|
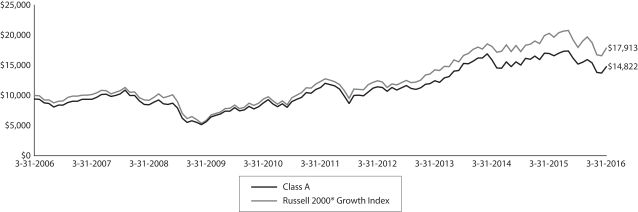 |
| 1 | Historical performance shown for Class C shares prior to their inception reflects the performance of Class A shares and has been adjusted to reflect the higher expenses applicable to Class C shares. Historical performance shown for Administrator Class shares prior to their inception reflects the performance of Institutional Class shares and has been adjusted to reflect the higher expenses applicable to Administrator Class shares. Historical performance shown for all classes of the Fund prior to July 19, 2010, is based on the performance of the Fund’s predecessor, Evergreen Growth Fund. |
| 2 | Reflects the expense ratios as stated in the most recent prospectuses. The expense ratios shown are subject to change and may differ from the annualized expense ratios shown in the financial highlights of this report. |
| 3 | The manager has contractually committed through July 31, 2016, to waive fees and/or reimburse expenses to the extent necessary to cap the Fund’s Total Annual Fund Operating Expenses After Fee Waiver at the amounts shown. After this time, the cap may be increased or the commitment to maintain the cap may be terminated only with the approval of the Board of Trustees. Brokerage commissions, stamp duty fees, interest, taxes, acquired fund fees and expenses, and extraordinary expenses are excluded from the cap. Without this cap, the Fund’s returns would have been lower. |
| 4 | The Russell 2000® Growth Index measures the performance of those Russell 2000 companies with higher price-to-book ratios and higher forecasted growth values. You cannot invest directly in an index. |
| 5 | The chart compares the performance of Class A shares for the most recent ten years with the Russell 2000® Growth Index. The chart assumes a hypothetical investment of $10,000 in Class A shares and reflects all operating expenses and assumes the maximum initial sales charge of 5.75%. |
| 6 | The ten largest holdings, excluding cash and cash equivalents, are calculated based on the value of the investments divided by total net assets of the Fund. Holdings are subject to change and may have changed since the date specified. |
| 7 | Amounts are calculated based on the total long-term investments of the Fund. These amounts are subject to change and may have changed since the date specified. |
| * | This security was not held in the Fund at the end of the reporting period. |
| | | | |
| 6 | | Wells Fargo Traditional Small Cap Growth Fund | | Performance highlights (unaudited) |
MANAGER’S DISCUSSION
Fund highlights
| n | | The Fund underperformed its benchmark, the Russell 2000® Growth Index, for the 12-month period that ended March 31, 2016. |
| n | | Relative weakness within the health care, industrials, and financials sectors constrained Fund performance. |
| n | | Holdings within the consumer discretionary and information technology (IT) sectors generated strong relative performance; underweights to the energy and materials sectors also contributed positively. |
A variety of stock-specific and macro factors contributed to the Fund’s underperformance,. Throughout the period, we made strategic investment decisions that we believe could prove beneficial through similar periods of volatility. We increased the Fund’s exposure to profitable companies with strong balance sheets and cash-flow metrics that we believe may provide less volatile and more sustained returns over the mid and long term.
The Fund’s health care holdings detracted from overall results.
In early 2015, high-momentum and high-valuation stocks outperformed in an ongoing low-growth environment, negatively affecting the Fund’s relative performance. The health care sector’s strength at the time continued to be powered by biotechnology stocks, and we increased the Fund’s underweights to lower-quality, unprofitable companies in the sector while raising exposure to companies in outsourced care, such as IPC Healthcare, Incorporated,* and Surgical Care Affiliates Incorporated, two strong contributors throughout the period of sector volatility. Headlines about Valeant Pharmaceuticals International, Incorporated,* and the concurrent focus on drug pricing negatively affected holdings in specialty drugs, such as AMAG Pharmaceuticals, Incorporated, and Akorn, Incorporated. The Fund’s relative sector positioning and exposures to select individual stocks, including Emergent BioSolutions, Incorporated, and Globus Medical, Incorporated, improved the Fund’s health care performance as the months progressed.
Industrials holdings hindered relative performance.
The ongoing decline in commodities throughout the period negatively affected the Fund’s holdings of cyclical industrial companies, such as H&E Equipment Services, Incorporated; Mobile Mini, Incorporated; and Generac Holdings, Incorporated, despite minimal direct or indirect exposure to oil.
The Fund’s financials exposure contributed negatively to performance.
While the Fund held a slight overweight to the broad financials sector throughout the period, it lacked exposure to real estate investment trusts (REITs). That allocation decision drove sizable underperformance. The low-growth and low-interest-rate environment over the period encouraged a broad pursuit of yield, which favored REITs. While we continued to search for opportunities within REITs, their relative valuations, limited growth prospects, and interest-rate sensitivity generally led us into other areas for financials exposure. Also, our position in PRA Group, Incorporated, constrained performance; the stock struggled in the second half of the period.
Our focus on positive trends led to success in the consumer discretionary sector.
Within the consumer discretionary sector, the Fund’s overweight to consumer experiences and underweight to riskier fashion and specialty-retail trends contributed to performance. Also, we identified two companies within the broader automotive end market that we believed could perform well in the existing economic environment: Motorcar Parts of America, Incorporated, a remanufacturer of mission-critical vehicle parts, such as alternators and starters, and Cooper-Standard Holding Incorporated, a global supplier to original-equipment manufacturers. Motorcar generated one of the Fund’s better results within the consumer discretionary sector. The company’s success has been powered largely by the increased number of miles being driven and the ongoing trend of keeping cars on the road longer—in the U.S., the average age of cars on the road has continued to exceed 11 years. Cooper-Standard benefited from having a new management team focused on both returns of the business and returns to shareholders.
The Fund’s IT holdings contributed positively, as did underweights to the materials and energy sectors.
The IT sector delivered outperformance for the Fund, driven largely by investments in the secular evolution of payments via companies such as Bottomline Technologies (de), Incorporated; Heartland Payment Systems, Incorporated;* and Euronet Worldwide, Incorporated, and by reducing exposure to higher-valued software-as-a-service firms. Declines in oil
Please see footnotes on page 5.
| | | | | | |
| Performance highlights (unaudited) | | Wells Fargo Traditional Small Cap Growth Fund | | | 7 | |
and other commodities accelerated throughout 2015, leading us to substantially reduce the Fund’s underweights to the energy and materials sectors. Despite the volatility, we managed to opportunistically add positions in companies with unique growth drivers, such as Summit Materials, Incorporated, and Carpenter Technology Corporation.
While we recognize potential risks, our outlook remains optimistic.
We view the current economic environment as improving and feel optimistic about the potential for unexpected global and domestic economic strength in 2016. The U.S. dollar’s strength has begun to ease in the past few months, and comparisons with one-year-ago levels have become considerably less daunting. Also, U.S. manufacturing has shown signs of improvement, and a prolonged and disappointing U.S. economic outlook could reverse course. In our view, the Fund may be better positioned than its index to benefit from improving business and market environments. As of March 31, 2016, the Fund held underweights to the materials and industrials sectors, and its overweight to the IT sector included a sizable allocation toward companies influenced by cyclical factors. Also, we maintained an existing underweight to the more defensive consumer staples sector as this sector has tended to underperform in an improving economic environment.
Looking ahead over the next 12 months, if economic strength fails to materialize, the Fund’s defensive underweight to consumer staples could become challenging for Fund performance and would be reevaluated. Also, continued flattening of the U.S. yield curve could create a challenging environment for the financials sector, excluding real estate investment trusts (REITs) as they have tended to outperform in a falling-rate environment. Because we typically maintain an underweight to REITs in the Fund, performance of the Fund’s financials sector may suffer in a falling-rate environment.
On the positive side, we believe that, excluding an economic shock, long-term interest rates could stabilize and possibly begin to trade higher, decreasing interest-rate volatility and creating a potentially favorable environment for generating excess returns. We retain conviction in our belief that fundamentally sound companies may outperform in a market environment that offers reasonable growth expectations and normalized interest-rate volatility, and we feel the next 6 to 12 months could provide an opportune time for investing in high-quality, small-cap growth stocks.
| | | | |
| Ten largest holdings (%) as of March 31, 20166 | |
Bottomline Technologies (de) Incorporated | | | 4.14 | |
Euronet Worldwide Incorporated | | | 4.03 | |
Surgical Care Affiliates Incorporated | | | 3.24 | |
Krispy Kreme Doughnuts Incorporated | | | 2.93 | |
Stewart Information Services Corporation | | | 2.84 | |
Cooper-Standard Holdings Incorporated | | | 2.78 | |
Imprivata Incorporated | | | 2.64 | |
Nautilus Group Incorporated | | | 2.62 | |
Motorcar Parts of America Incorporated | | | 2.58 | |
Littelfuse Incorporated | | | 2.57 | |
| | |
| Sector distribution as of March 31, 20167 |
|
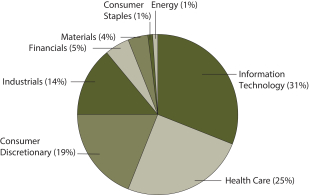 |
Please see footnotes on page 5.
| | | | |
| 8 | | Wells Fargo Traditional Small Cap Growth Fund | | Fund expenses (unaudited) |
As a shareholder of the Fund, you incur two types of costs: (1) transaction costs, including sales charges (loads) on purchase payments and contingent deferred sales charges (if any) on redemptions and (2) ongoing costs, including management fees, distribution (12b-1) and/or shareholder servicing fees, and other Fund expenses. This example is intended to help you understand your ongoing costs (in dollars) of investing in the Fund and to compare these costs with the ongoing costs of investing in other mutual funds.
The example is based on an investment of $1,000 invested at the beginning of the six-month period and held for the entire period from October 1, 2015 to March 31, 2016.
Actual expenses
The “Actual” line of the table below provides information about actual account values and actual expenses. You may use the information in this line, together with the amount you invested, to estimate the expenses that you paid over the period. Simply divide your account value by $1,000 (for example, an $8,600 account value divided by $1,000 = 8.6), then multiply the result by the number in the “Actual” line under the heading entitled “Expenses paid during period” for your applicable class of shares to estimate the expenses you paid on your account during this period.
Hypothetical example for comparison purposes
The “Hypothetical” line of the table below provides information about hypothetical account values and hypothetical expenses based on the Fund’s actual expense ratio and an assumed rate of return of 5% per year before expenses, which is not the Fund’s actual return. The hypothetical account values and expenses may not be used to estimate the actual ending account balance or expenses you paid for the period. You may use this information to compare the ongoing costs of investing in the Fund and other funds. To do so, compare this 5% hypothetical example with the 5% hypothetical examples that appear in the shareholder reports of the other funds.
Please note that the expenses shown in the table are meant to highlight your ongoing costs only and do not reflect any transactional costs, such as sales charges (loads) and contingent deferred sales charges. Therefore, the “Hypothetical” line of the table is useful in comparing ongoing costs only and will not help you determine the relative total costs of owning different funds. In addition, if these transactional costs were included, your costs would have been higher.
| | | | | | | | | | | | | | | | |
| | | Beginning
account value
10-1-2015 | | | Ending
account value
3-31-2016 | | | Expenses
paid during
the period¹ | | | Net annualized
expense ratio | |
Class A | | | | | | | | | | | | | | | | |
Actual | | $ | 1,000.00 | | | $ | 973.38 | | | $ | 6.56 | | | | 1.33 | % |
Hypothetical (5% return before expenses) | | $ | 1,000.00 | | | $ | 1,018.35 | | | $ | 6.71 | | | | 1.33 | % |
Class C | | | | | | | | | | | | | | | | |
Actual | | $ | 1,000.00 | | | $ | 969.27 | | | $ | 10.24 | | | | 2.08 | % |
Hypothetical (5% return before expenses) | | $ | 1,000.00 | | | $ | 1,014.60 | | | $ | 10.48 | | | | 2.08 | % |
Administrator Class | | | | | | | | | | | | | | | | |
Actual | | $ | 1,000.00 | | | $ | 973.51 | | | $ | 5.92 | | | | 1.20 | % |
Hypothetical (5% return before expenses) | | $ | 1,000.00 | | | $ | 1,019.00 | | | $ | 6.06 | | | | 1.20 | % |
Institutional Class | | | | | | | | | | | | | | | | |
Actual | | $ | 1,000.00 | | | $ | 974.67 | | | $ | 4.84 | | | | 0.98 | % |
Hypothetical (5% return before expenses) | | $ | 1,000.00 | | | $ | 1,020.10 | | | $ | 4.95 | | | | 0.98 | % |
| 1 | Expenses paid is equal to the annualized expense ratio of each class multiplied by the average account value over the period, multiplied by the number of days in the most recent fiscal half-year divided by the number of days in the fiscal year (to reflect the one-half-year period). |
| | | | | | |
| Portfolio of investments—March 31, 2016 | | Wells Fargo Traditional Small Cap Growth Fund | | | 9 | |
| | | | | | | | | | | | |
| Security name | | | | | | Shares | | | Value | |
| | | | |
Common Stocks: 97.59% | | | | | | | | | | | | |
| | | | | | | | | | | | |
| | | |
Consumer Discretionary: 18.90% | | | | | | | | | | |
| | | |
| Auto Components: 5.36% | | | | | | | | | | |
Cooper-Standard Holdings Incorporated † | | | | | | | 37,000 | | | $ | 2,658,080 | |
Motorcar Parts of America Incorporated † | | | | | | | 65,000 | | | | 2,468,700 | |
| | | | |
| | | | | | | | | | | 5,126,780 | |
| | | | | | | | | | | | |
| | | |
| Hotels, Restaurants & Leisure: 9.07% | | | | | | | | | | |
ClubCorp Holdings Incorporated | | | | | | | 160,000 | | | | 2,246,400 | |
Krispy Kreme Doughnuts Incorporated † | | | | | | | 180,000 | | | | 2,806,200 | |
Sonic Corporation | | | | | | | 70,000 | | | | 2,461,200 | |
Zoe’s Kitchen Incorporated «† | | | | | | | 30,000 | | | | 1,169,700 | |
| | | | |
| | | | | | | | | | | 8,683,500 | |
| | | | | | | | | | | | |
| | | |
| Internet & Catalog Retail: 1.84% | | | | | | | | | | |
Shutterfly Incorporated † | | | | | | | 38,000 | | | | 1,762,060 | |
| | | | | | | | | | | | |
| | | |
| Leisure Products: 2.63% | | | | | | | | | | |
Nautilus Group Incorporated † | | | | | | | 130,000 | | | | 2,511,600 | |
| | | | | | | | | | | | |
| | | | |
Consumer Staples: 0.76% | | | | | | | | | | | | |
| | | | |
| Food Products: 0.76% | | | | | | | | | | | | |
Freshpet Incorporated Ǡ | | | | | | | 100,000 | | | | 733,000 | |
| | | | | | | | | | | | |
| | | | |
Energy: 0.66% | | | | | | | | | | | | |
| | | | |
| Energy Equipment & Services: 0.66% | | | | | | | | | | | | |
Aspen Aerogels Incorporated † | | | | | | | 140,000 | | | | 630,000 | |
| | | | | | | | | | | | |
| | | | |
Financials: 5.18% | | | | | | | | | | | | |
| | | | |
| Insurance: 2.84% | | | | | | | | | | | | |
Stewart Information Services Corporation | | | | | | | 75,000 | | | | 2,721,000 | |
| | | | | | | | | | | | |
| | | | |
| Thrifts & Mortgage Finance: 2.34% | | | | | | | | | | | | |
Bofi Holding Incorporated Ǡ | | | | | | | 105,000 | | | | 2,240,700 | |
| | | | | | | | | | | | |
| | | | |
Health Care: 24.47% | | | | | | | | | | | | |
| | | | |
| Biotechnology: 5.40% | | | | | | | | | | | | |
AMAG Pharmaceuticals Incorporated Ǡ | | | | | | | 75,000 | | | | 1,755,000 | |
Emergent BioSolutions Incorporated † | | | | | | | 55,000 | | | | 1,999,250 | |
Novavax Incorporated Ǡ | | | | | | | 80,000 | | | | 412,800 | |
Repligen Corporation † | | | | | | | 37,200 | | | | 997,704 | |
| | | | |
| | | | | | | | | | | 5,164,754 | |
| | | | | | | | | | | | |
| | | | |
| Health Care Equipment & Supplies: 4.64% | | | | | | | | | | | | |
Globus Medical Incorporated † | | | | | | | 100,000 | | | | 2,375,000 | |
Inogen Incorporated † | | | | | | | 40,000 | | | | 1,799,200 | |
Zeltiq Aesthetics Incorporated † | | | | | | | 10,000 | | | | 271,600 | |
| | | | |
| | | | | | | | | | | 4,445,800 | |
| | | | | | | | | | | | |
The accompanying notes are an integral part of these financial statements.
| | | | |
| 10 | | Wells Fargo Traditional Small Cap Growth Fund | | Portfolio of investments—March 31, 2016 |
| | | | | | | | | | | | |
| Security name | | | | | | Shares | | | Value | |
| | | | |
| Health Care Providers & Services: 4.55% | | | | | | | | | | | | |
Capital Senior Living Corporation † | | | | | | | 10,400 | | | $ | 192,608 | |
Ensign Group Incorporated | | | | | | | 46,800 | | | | 1,059,552 | |
Surgical Care Affiliates Incorporated † | | | | | | | 67,000 | | | | 3,100,760 | |
| | | | |
| | | | | | | | | | | 4,352,920 | |
| | | | | | | | | | | | |
| | | | |
| Health Care Technology: 3.43% | | | | | | | | | | | | |
Imprivata Incorporated † | | | | | | | 200,000 | | | | 2,526,000 | |
Medidata Solutions Incorporated † | | | | | | | 19,500 | | | | 754,845 | |
| | | | |
| | | | | | | | | | | 3,280,845 | |
| | | | | | | | | | | | |
| | | | | |
| | | |
| Life Sciences Tools & Services: 2.18% | | | | | | | | | | |
Charles River Laboratories International Incorporated † | | | | | | | 27,500 | | | | 2,088,350 | |
| | | | | | | | | | | | |
| | | |
| Pharmaceuticals: 4.27% | | | | | | | | | | |
Akorn Incorporated † | | | | | | | 20,000 | | | | 470,600 | |
Horizon Pharma plc Ǡ | | | | | | | 65,000 | | | | 1,077,050 | |
Intersect ENT Incorporated † | | | | | | | 85,000 | | | | 1,615,000 | |
TherapeuticsMD Incorporated Ǡ | | | | | | | 143,700 | | | | 919,680 | |
| | | | |
| | | | | | | | | | | 4,082,330 | |
| | | | | | | | | | | | |
| | | | |
Industrials: 13.82% | | | | | | | | | | | | |
| | | |
| Air Freight & Logistics: 2.27% | | | | | | | | | | |
Echo Global Logistics Incorporated † | | | | | | | 80,000 | | | | 2,172,800 | |
| | | | | | | | | | | | |
| | | |
| Building Products: 1.11% | | | | | | | | | | |
Apogee Enterprises Incorporated | | | | | | | 24,100 | | | | 1,057,749 | |
| | | | | | | | | | | | |
| | | |
| Commercial Services & Supplies: 1.90% | | | | | | | | | | |
Mobile Mini Incorporated | | | | | | | 55,000 | | | | 1,816,100 | |
| | | | | | | | | | | | |
| | | |
| Electrical Equipment: 2.33% | | | | | | | | | | |
Generac Holdings Incorporated † | | | | | | | 60,000 | | | | 2,234,400 | |
| | | | | | | | | | | | |
| | | |
| Machinery: 2.32% | | | | | | | | | | |
Rexnord Corporation † | | | | | | | 110,000 | | | | 2,224,200 | |
| | | | | | | | | | | | |
| | | |
| Professional Services: 2.33% | | | | | | | | | | |
Wageworks Incorporated † | | | | | | | 44,020 | | | | 2,227,852 | |
| | | | | | | | | | | | |
| | | |
| Trading Companies & Distributors: 1.56% | | | | | | | | | | |
H&E Equipment Services Incorporated | | | | | | | 85,000 | | | | 1,490,050 | |
| | | | | | | | | | | | |
| | | | |
Information Technology: 30.11% | | | | | | | | | | | | |
| | | |
| Electronic Equipment, Instruments & Components: 2.57% | | | | | | | | | | |
Littelfuse Incorporated | | | | | | | 20,000 | | | | 2,462,200 | |
| | | | | | | | | | | | |
| | | | |
| Internet Software & Services: 4.01% | | | | | | | | | | | | |
Cimpress N.V. Ǡ | | | | | | | 20,000 | | | | 1,813,800 | |
LogMeIn Incorporated † | | | | | | | 40,000 | | | | 2,018,400 | |
| | | | |
| | | | | | | | | | | 3,832,200 | |
| | | | | | | | | | | | |
The accompanying notes are an integral part of these financial statements.
| | | | | | |
| Portfolio of investments—March 31, 2016 | | Wells Fargo Traditional Small Cap Growth Fund | | | 11 | |
| | | | | | | | | | | | | | |
| Security name | | | | | | | Shares | | | Value | |
| | | | |
| IT Services: 5.61% | | | | | | | | | | | | | | |
Blackhawk Network Incorporated † | | | | | | | | | 15,000 | | | $ | 514,500 | |
Euronet Worldwide Incorporated † | | | | | | | | | 52,000 | | | | 3,853,720 | |
WEX Incorporated † | | | | | | | | | 12,000 | | | | 1,000,320 | |
| | | | |
| | | | | | | | | | | | | 5,368,540 | |
| | | | | | | | | | | | | | |
| | | | |
| Semiconductors & Semiconductor Equipment: 4.37% | | | | | | | | | | | | | | |
Advanced Energy Industries Incorporated † | | | | | | | | | 27,000 | | | | 939,330 | |
Cavium Incorporated † | | | | | | | | | 8,000 | | | | 489,280 | |
Integrated Device Technology Incorporated † | | | | | | | | | 85,000 | | | | 1,737,400 | |
Monolithic Power Systems Incorporated | | | | | | | | | 16,000 | | | | 1,018,240 | |
| | | | |
| | | | | | | | | | | | | 4,184,250 | |
| | | | | | | | | | | | | | |
| | | | |
| Software: 13.55% | | | | | | | | | | | | | | |
AVG Technologies N.V. † | | | | | | | | | 70,000 | | | | 1,452,500 | |
Bottomline Technologies (de) Incorporated † | | | | | | | | | 130,000 | | | | 3,963,700 | |
Ellie Mae Incorporated † | | | | | | | | | 20,000 | | | | 1,812,800 | |
Fleetmatics Group plc † | | | | | | | | | 59,212 | | | | 2,410,521 | |
Guidewire Software Incorporated † | | | | | | | | | 22,000 | | | | 1,198,560 | |
PTC Incorporated † | | | | | | | | | 7,000 | | | | 232,120 | |
Rapid7 Incorporated Ǡ | | | | | | | | | 70,000 | | | | 914,900 | |
Ultimate Software Group Incorporated † | | | | | | | | | 5,074 | | | | 981,819 | |
| | | | |
| | | | | | | | | | | | | 12,966,920 | |
| | | | | | | | | | | | | | |
| | | | |
Materials: 3.69% | | | | | | | | | | | | | | |
| | | | |
| Construction Materials: 2.37% | | | | | | | | | | | | | | |
Summit Materials Incorporated Class A † | | | | | | | | | 116,350 | | | | 2,263,008 | |
| | | | | | | | | | | | | | |
| | | | |
| Metals & Mining: 1.32% | | | | | | | | | | | | | | |
Carpenter Technology Corporation | | | | | | | | | 37,000 | | | | 1,266,509 | |
| | | | | | | | | | | | | | |
| | | |
Total Common Stocks (Cost $89,493,656) | | | | | | | | | | 93,390,417 | |
| | | | | | | | | | | | | | |
| | | | |
| | | Yield | | | | | | | | | |
| Short-Term Investments: 13.03% | | | | | | | | | | | | | | |
| | | | |
| Investment Companies: 13.03% | | | | | | | | | | | | | | |
Securities Lending Cash Investments LLC (l)(u)(r) | | | 0.43 | % | | | | | 9,814,825 | | | | 9,814,825 | |
Wells Fargo Cash Investment Money Market Fund Select Class (l)(u) | | | 0.44 | | | | | | 2,648,261 | | | | 2,648,261 | |
| | | |
Total Short-Term Investments (Cost $12,463,086) | | | | | | | | | | 12,463,086 | |
| | | | | | | | | | | | | | |
| | | | | | | | |
| Total investments in securities (Cost $101,956,742) * | | | 110.62 | % | | | 105,853,503 | |
Other assets and liabilities, net | | | (10.62 | ) | | | (10,159,160 | ) |
| | | | | | | | |
| Total net assets | | | 100.00 | % | | | $95,694,343 | |
| | | | | | | | |
| † | Non-income-earning security |
| « | All or a portion of this security is on loan. |
| (l) | The issuer of the security is an affiliated person of the Fund as defined in the Investment Company Act of 1940. |
| (u) | The rate represents the 7-day annualized yield at period end. |
| (r) | The investment is a non-registered investment vehicle purchased with cash collateral received from securities on loan. |
| * | Cost for federal income tax purposes is $103,112,687 and unrealized gains (losses) consists of: |
| | | | |
Gross unrealized gains | | $ | 10,291,772 | |
Gross unrealized losses | | | (7,550,956 | ) |
| | | | |
Net unrealized gains | | $ | 2,740,816 | |
The accompanying notes are an integral part of these financial statements.
| | | | |
| 12 | | Wells Fargo Traditional Small Cap Growth Fund | | Statement of assets and liabilities—March 31, 2016 |
| | | | |
| | | | |
| |
Assets | | | | |
Investments | | | | |
In unaffiliated securities (including $9,615,672 of securities loaned), at value (cost $89,493,656) | | $ | 93,390,417 | |
In affiliated securities, at value (cost $12,463,086) | | | 12,463,086 | |
| | | | |
Total investments, at value (cost $101,956,742) | | | 105,853,503 | |
Receivable for investments sold | | | 946,868 | |
Receivable for Fund shares sold | | | 20,618 | |
Receivable for dividends | | | 6,002 | |
Receivable for securities lending income | | | 13,742 | |
Prepaid expenses and other assets | | | 18,694 | |
| | | | |
Total assets | | | 106,859,427 | |
| | | | |
| |
Liabilities | | | | |
Payable for investments purchased | | | 807,850 | |
Payable for Fund shares redeemed | | | 425,816 | |
Payable upon receipt of securities loaned | | | 9,814,825 | |
Management fee payable | | | 48,222 | |
Distribution fee payable | | | 99 | |
Administration fees payable | | | 15,719 | |
Accrued expenses and other liabilities | | | 52,553 | |
| | | | |
Total liabilities | | | 11,165,084 | |
| | | | |
Total net assets | | $ | 95,694,343 | |
| | | | |
| |
NET ASSETS CONSIST OF | | | | |
Paid-in capital | | $ | 93,095,660 | |
Accumulated net investment loss | | | (147,798 | ) |
Accumulated net realized losses on investments | | | (1,150,280 | ) |
Net unrealized gains on investments | | | 3,896,761 | |
| | | | |
Total net assets | | $ | 95,694,343 | |
| | | | |
| |
COMPUTATION OF NET ASSET VALUE AND OFFERING PRICE PER SHARE | | | | |
Net assets – Class A | | $ | 84,138,920 | |
Shares outstanding – Class A1 | | | 6,983,373 | |
Net asset value per share – Class A | | | $12.05 | |
Maximum offering price per share – Class A2 | | | $12.79 | |
Net assets – Class C | | $ | 162,164 | |
Shares outstanding – Class C1 | | | 14,449 | |
Net asset value per share – Class C | | | $11.22 | |
Net assets – Administrator Class | | $ | 2,412,921 | |
Shares outstanding – Administrator Class1 | | | 181,516 | |
Net asset value per share – Administrator Class | | | $13.29 | |
Net assets – Institutional Class | | $ | 8,980,338 | |
Shares outstanding – Institutional Class1 | | | 663,083 | |
Net asset value per share – Institutional Class | | | $13.54 | |
| 1 | The Fund has an unlimited number of authorized shares. |
| 2 | Maximum offering price is computed as 100/94.25 of net asset value. On investments of $50,000 or more, the offering price is reduced. |
The accompanying notes are an integral part of these financial statements.
| | | | | | |
| Statement of operations—year ended March 31, 2016 | | Wells Fargo Traditional Small Cap Growth Fund | | | 13 | |
| | | | |
| | | | |
| |
Investment income | | | | |
Dividends | | $ | 507,056 | |
Securities lending income, net | | | 182,072 | |
Income from affiliated securities | | | 5,791 | |
| | | | |
Total investment income | | | 694,919 | |
| | | | |
| |
Expenses | | | | |
Management fee | | | 1,002,701 | |
Administration fees | | | | |
Class A | | | 234,390 | |
Class C | | | 459 | |
Administrator Class | | | 3,743 | |
Institutional Class | | | 11,884 | |
Shareholder servicing fees | | | | |
Class A | | | 261,017 | |
Class C | | | 512 | |
Administrator Class | | | 7,697 | |
Distribution fee | | | | |
Class C | | | 1,536 | |
Custody and accounting fees | | | 17,955 | |
Professional fees | | | 46,722 | |
Registration fees | | | 71,789 | |
Shareholder report expenses | | | 39,280 | |
Trustees’ fees and expenses | | | 19,953 | |
Other fees and expenses | | | 7,033 | |
| | | | |
Total expenses | | | 1,726,671 | |
Less: Fee waivers and/or expense reimbursements | | | (196,166 | ) |
| | | | |
Net expenses | | | 1,530,505 | |
| | | | |
Net investment loss | | | (835,586 | ) |
| | | | |
| |
REALIZED AND UNREALIZED GAINS (LOSSES) ON INVESTMENTS | | | | |
Net realized gains on investments | | | 16,977,555 | |
Net change in unrealized gains (losses) on investments | | | (32,455,316 | ) |
| | | | |
Net realized and unrealized gains (losses) on investments | | | (15,477,761 | ) |
| | | | |
Net decrease in net assets resulting from operations | | $ | (16,313,347 | ) |
| | | | |
The accompanying notes are an integral part of these financial statements.
| | | | |
| 14 | | Wells Fargo Traditional Small Cap Growth Fund | | Statement of changes in net assets |
| | | | | | | | | | | | | | | | |
| | | Year ended March 31, 2016 | | | Year ended March 31, 2015 | |
| | | |
Operations | | | | | | | | | | | | |
Net investment loss | | | | | | $ | (835,586 | ) | | | | | | $ | (1,186,546 | ) |
Net realized gains on investments | | | | | | | 16,977,555 | | | | | | | | 16,249,777 | |
Net change in unrealized gains (losses) on investments | | | | | | | (32,455,316 | ) | | | | | | | (6,954,098 | ) |
| | | | |
Net increase (decrease) in net assets resulting from operations | | | | | | | (16,313,347 | ) | | | | | | | 8,109,133 | |
| | | | |
| | | |
Distributions to shareholders from | | | | | | | | | | | | |
Net realized gains | | | | | | | | | | | | | | | | |
Class A | | | | | | | (21,823,283 | ) | | | | | | | (20,918,267 | ) |
Class C | | | | | | | (43,293 | ) | | | | | | | (64,164 | ) |
Administrator Class | | | | | | | (612,282 | ) | | | | | | | (489,047 | ) |
Institutional Class | | | | | | | (2,120,374 | ) | | | | | | | (2,109,310 | ) |
| | | | |
Total distributions to shareholders | | | | | | | (24,599,232 | ) | | | | | | | (23,580,788 | ) |
| | | | |
| | | | |
Capital share transactions | | | Shares | | | | | | | | Shares | | | | | |
Proceeds from shares sold | | | | | | | | | | | | | | | | |
Class A | | | 205,629 | | | | 2,995,422 | | | | 166,240 | | | | 3,105,325 | |
Class C | | | 3,267 | | | | 48,895 | | | | 4,689 | | | | 87,580 | |
Administrator Class | | | 41,278 | | | | 790,645 | | | | 18,974 | | | | 376,286 | |
Institutional Class | | | 170,790 | | | | 2,840,853 | | | | 145,847 | | | | 2,948,534 | |
| | | | |
| | | | | | | 6,675,815 | | | | | | | | 6,517,725 | |
| | | | |
Reinvestment of distributions | | | | | | | | | | | | | | | | |
Class A | | | 1,707,521 | | | | 20,985,437 | | | | 1,187,647 | | | | 20,118,743 | |
Class C | | | 3,346 | | | | 38,407 | | | | 3,495 | | | | 56,625 | |
Administrator Class | | | 44,979 | | | | 609,919 | | | | 26,596 | | | | 485,372 | |
Institutional Class | | | 128,519 | | | | 1,773,561 | | | | 93,024 | | | | 1,718,153 | |
| | | | |
| | | | | | | 23,407,324 | | | | | | | | 22,378,893 | |
| | | | |
Payment for shares redeemed | | | | | | | | | | | | | | | | |
Class A | | | (1,788,888 | ) | | | (27,309,379 | ) | | | (1,439,029 | ) | | | (27,107,396 | ) |
Class C | | | (5,663 | ) | | | (84,188 | ) | | | (15,128 | ) | | | (267,013 | ) |
Administrator Class | | | (65,656 | ) | | | (1,048,305 | ) | | | (64,575 | ) | | | (1,331,123 | ) |
Institutional Class | | | (236,206 | ) | | | (3,918,807 | ) | | | (421,031 | ) | | | (8,665,650 | ) |
| | | | |
| | | | | | | (32,360,679 | ) | | | | | | | (37,371,182 | ) |
| | | | |
Net decrease in net assets resulting from capital share transactions | | | | | | | (2,277,540 | ) | | | | | | | (8,474,564 | ) |
| | | | |
Total decrease in net assets | | | | | | | (43,190,119 | ) | | | | | | | (23,946,219 | ) |
| | | | |
| | |
Net assets | | | | | | | | |
Beginning of period | | | | | | | 138,884,462 | | | | | | | | 162,830,681 | |
| | | | |
End of period | | | | | | $ | 95,694,343 | | | | | | | $ | 138,884,462 | |
| | | | |
Accumulated net investment loss | | | | | | $ | (147,798 | ) | | | | | | $ | (321,280 | ) |
| | | | |
The accompanying notes are an integral part of these financial statements.
| | | | | | |
| Financial highlights | | Wells Fargo Traditional Small Cap Growth Fund | | | 15 | |
(For a share outstanding throughout each period)
| | | | | | | | | | | | | | | | | | | | | | | | |
| | | Year ended March 31 | | | Year ended October 31 | |
| CLASS A | | 2016 | | | 2015 | | | 20141 | | | 2013 | | | 2012 | | | 2011 | |
Net asset value, beginning of period | | | $18.04 | | | | $20.37 | | | | $23.11 | | | | $17.08 | | | | $15.31 | | | | $14.31 | |
Net investment loss | | | (0.12 | )2 | | | (0.18 | ) | | | (0.09 | )2 | | | (0.11 | )2 | | | (0.11 | )2 | | | (0.16 | )2 |
Net realized and unrealized gains (losses) on investments | | | (2.13 | ) | | | 1.33 | | | | 0.96 | | | | 6.34 | | | | 1.88 | | | | 1.16 | |
| | | | | | | | | | | | | | | | | | | | | | | | |
Total from investment operations | | | (2.25 | ) | | | 1.15 | | | | 0.87 | | | | 6.23 | | | | 1.77 | | | | 1.00 | |
Distributions to shareholders from | | | | | | | | | | | | | | | | |
Net realized gains | | | (3.74 | ) | | | (3.48 | ) | | | (3.61 | ) | | | (0.20 | ) | | | 0.00 | | | | 0.00 | |
Net asset value, end of period | | | $12.05 | | | | $18.04 | | | | $20.37 | | | | $23.11 | | | | $17.08 | | | | $15.31 | |
Total return3 | | | (12.86 | )% | | | 6.77 | % | | | 4.14 | % | | | 36.98 | % | | | 11.56 | % | | | 6.99 | % |
Ratios to average net assets (annualized) | | | | | | | | | | | | | | | | |
Gross expenses | | | 1.50 | % | | | 1.47 | % | | | 1.54 | % | | | 1.48 | % | | | 1.48 | % | | | 1.43 | % |
Net expenses | | | 1.33 | % | | | 1.33 | % | | | 1.33 | % | | | 1.33 | % | | | 1.33 | % | | | 1.33 | % |
Net investment loss | | | (0.74 | )% | | | (0.87 | )% | | | (1.04 | )% | | | (0.58 | )% | | | (0.69 | )% | | | (0.96 | )% |
Supplemental data | | | | | | | | | | | | | | | | |
Portfolio turnover rate | | | 123 | % | | | 73 | % | | | 36 | % | | | 77 | % | | | 57 | % | | | 123 | % |
Net assets, end of period (000s omitted) | | | $84,139 | | | | $123,712 | | | | $141,446 | | | | $141,933 | | | | $119,490 | | | | $123,063 | |
| 1 | For the five months ended March 31, 2014. The Fund changed its fiscal year end from October 31 to March 31, effective March 31, 2014. |
| 2 | Calculated based upon average shares outstanding |
| 3 | Total return calculations do not include any sales charges. Returns for periods of less than one year are not annualized. |
The accompanying notes are an integral part of these financial statements.
| | | | |
| 16 | | Wells Fargo Traditional Small Cap Growth Fund | | Financial highlights |
(For a share outstanding throughout each period)
| | | | | | | | | | | | | | | | | | | | | | | | |
| | | Year ended March 31 | | | Year ended October 31 | |
| CLASS C | | 2016 | | | 2015 | | | 20141 | | | 2013 | | | 2012 | | | 2011 | |
Net asset value, beginning of period | | | $17.21 | | | | $19.73 | | | | $22.56 | | | | $16.80 | | | | $15.18 | | | | $14.29 | |
Net investment loss | | | (0.18 | ) | | | (0.29 | )2 | | | (0.15 | )2 | | | (0.26 | ) | | | (0.25 | ) | | | (0.27 | )2 |
Net realized and unrealized gains (losses) on investments | | | (2.07 | ) | | | 1.25 | | | | 0.93 | | | | 6.22 | | | | 1.87 | | | | 1.16 | |
| | | | | | | | | | | | | | | | | | | | | | | | |
Total from investment operations | | | (2.25 | ) | | | 0.96 | | | | 0.78 | | | | 5.96 | | | | 1.62 | | | | 0.89 | |
Distributions to shareholders from | | | | | | | | | | | | | | | | |
Net realized gains | | | (3.74 | ) | | | (3.48 | ) | | | (3.61 | ) | | | (0.20 | ) | | | 0.00 | | | | 0.00 | |
Net asset value, end of period | | | $11.22 | | | | $17.21 | | | | $19.73 | | | | $22.56 | | | | $16.80 | | | | $15.18 | |
Total return3 | | | (13.55 | )% | | | 5.98 | % | | | 3.85 | % | | | 35.92 | % | | | 10.74 | % | | | 6.16 | % |
Ratios to average net assets (annualized) | | | | | | | | | | | | | | | | |
Gross expenses | | | 2.25 | % | | | 2.22 | % | | | 2.30 | % | | | 2.23 | % | | | 2.23 | % | | | 2.18 | % |
Net expenses | | | 2.08 | % | | | 2.08 | % | | | 2.08 | % | | | 2.08 | % | | | 2.08 | % | | | 2.08 | % |
Net investment loss | | | (1.49 | )% | | | (1.61 | )% | | | (1.81 | )% | | | (1.36 | )% | | | (1.44 | )% | | | (1.72 | )% |
Supplemental data | | | | | | | | | | | | | | | | |
Portfolio turnover rate | | | 123 | % | | | 73 | % | | | 36 | % | | | 77 | % | | | 57 | % | | | 123 | % |
Net assets, end of period (000s omitted) | | | $162 | | | | $232 | | | | $403 | | | | $150 | | | | $116 | | | | $115 | |
| 1 | For the five months ended March 31, 2014. The Fund changed its fiscal year end from October 31 to March 31, effective March 31, 2014. |
| 2 | Calculated based upon average shares outstanding |
| 3 | Total return calculations do not include any sales charges. Returns for periods of less than one year are not annualized. |
The accompanying notes are an integral part of these financial statements.
| | | | | | |
| Financial highlights | | Wells Fargo Traditional Small Cap Growth Fund | | | 17 | |
(For a share outstanding throughout each period)
| | | | | | | | | | | | | | | | | | | | | | | | |
| | | Year ended March 31 | | | Year ended October 31 | |
| ADMINISTRATOR CLASS | | 2016 | | | 2015 | | | 20141 | | | 2013 | | | 2012 | | | 2011 | |
Net asset value, beginning of period | | | $19.44 | | | | $21.65 | | | | $24.33 | | | | $17.94 | | | | $16.06 | | | | $14.99 | |
Net investment loss | | | (0.10 | )2 | | | (0.15 | )2 | | | (0.08 | )2 | | | (0.09 | )2 | | | (0.09 | )2 | | | (0.14 | )2 |
Net realized and unrealized gains (losses) on investments | | | (2.31 | ) | | | 1.42 | | | | 1.01 | | | | 6.68 | | | | 1.97 | | | | 1.21 | |
| | | | | | | | | | | | | | | | | | | | | | | | |
Total from investment operations | | | (2.41 | ) | | | 1.27 | | | | 0.93 | | | | 6.59 | | | | 1.88 | | | | 1.07 | |
Distributions to shareholders from | | | | | | | | | | | | | | | | |
Net realized gains | | | (3.74 | ) | | | (3.48 | ) | | | (3.61 | ) | | | (0.20 | ) | | | 0.00 | | | | 0.00 | |
Net asset value, end of period | | | $13.29 | | | | $19.44 | | | | $21.65 | | | | $24.33 | | | | $17.94 | | | | $16.06 | |
Total return3 | | | (12.76 | )% | | | 6.93 | % | | | 4.18 | % | | | 37.21 | % | | | 11.71 | % | | | 7.14 | % |
Ratios to average net assets (annualized) | | | | | | | | | | | | | | | | |
Gross expenses | | | 1.39 | % | | | 1.29 | % | | | 1.32 | % | | | 1.26 | % | | | 1.26 | % | | | 1.23 | % |
Net expenses | | | 1.20 | % | | | 1.19 | % | | | 1.19 | % | | | 1.17 | % | | | 1.17 | % | | | 1.19 | % |
Net investment loss | | | (0.61 | )% | | | (0.73 | )% | | | (0.90 | )% | | | (0.43 | )% | | | (0.54 | )% | | | (0.83 | )% |
Supplemental data | | | | | | | | | | | | | | | | |
Portfolio turnover rate | | | 123 | % | | | 73 | % | | | 36 | % | | | 77 | % | | | 57 | % | | | 123 | % |
Net assets, end of period (000s omitted) | | | $2,413 | | | | $3,128 | | | | $3,896 | | | | $3,882 | | | | $3,063 | | | | $3,413 | |
| 1 | For the five months ended March 31, 2014. The Fund changed its fiscal year end from October 31 to March 31, effective March 31, 2014. |
| 2 | Calculated based upon average shares outstanding |
| 3 | Returns for periods of less than one year are not annualized. |
The accompanying notes are an integral part of these financial statements.
| | | | |
| 18 | | Wells Fargo Traditional Small Cap Growth Fund | | Financial highlights |
(For a share outstanding throughout each period)
| | | | | | | | | | | | | | | | | | | | | | | | |
| | | Year ended March 31 | | | Year ended October 31 | |
| INSTITUTIONAL CLASS | | 2016 | | | 2015 | | | 20141 | | | 2013 | | | 2012 | | | 2011 | |
Net asset value, beginning of period | | | $19.69 | | | | $21.84 | | | | $24.50 | | | | $18.03 | | | | $16.11 | | | | $15.01 | |
Net investment income (loss) | | | (0.07 | )2 | | | (0.11 | )2 | | | (0.07 | )2 | | | 0.00 | 2,3 | | | (0.06 | )2 | | | (0.10 | ) |
Net realized and unrealized gains (losses) on investments | | | (2.34 | ) | | | 1.44 | | | | 1.02 | | | | 6.67 | | | | 1.98 | | | | 1.20 | |
| | | | | | | | | | | | | | | | | | | | | | | | |
Total from investment operations | | | (2.41 | ) | | | 1.33 | | | | 0.95 | | | | 6.67 | | | | 1.92 | | | | 1.10 | |
Distributions to shareholders from | | | | | | | | | | | | | | | | |
Net realized gains | | | (3.74 | ) | | | (3.48 | ) | | | (3.61 | ) | | | (0.20 | ) | | | 0.00 | | | | 0.00 | |
Net asset value, end of period | | | $13.54 | | | | $19.69 | | | | $21.84 | | | | $24.50 | | | | $18.03 | | | | $16.11 | |
Total return4 | | | (12.58 | )% | | | 7.16 | % | | | 4.29 | % | | | 37.42 | % | | | 11.92 | % | | | 7.33 | % |
Ratios to average net assets (annualized) | | | | | | | | | | | | | | | | |
Gross expenses | | | 1.14 | % | | | 1.04 | % | | | 1.10 | % | | | 1.04 | % | | | 1.05 | % | | | 1.00 | % |
Net expenses | | | 0.98 | % | | | 0.98 | % | | | 0.98 | % | | | 0.98 | % | | | 0.98 | % | | | 0.98 | % |
Net investment income (loss) | | | (0.39 | )% | | | (0.52 | )% | | | (0.69 | )% | | | 0.01 | % | | | (0.35 | )% | | | (0.61 | )% |
Supplemental data | | | | | | | | | | | | | | | | |
Portfolio turnover rate | | | 123 | % | | | 73 | % | | | 36 | % | | | 77 | % | | | 57 | % | | | 123 | % |
Net assets, end of period (000s omitted) | | | $8,980 | | | | $11,812 | | | | $17,086 | | | | $17,997 | | | | $43,160 | | | | $71,493 | |
| 1 | For the five months ended March 31, 2014. The Fund changed its fiscal year end from October 31 to March 31, effective March 31, 2014. |
| 2 | Calculated based upon average shares outstanding |
| 3 | Amount is less than $0.005. |
| 4 | Returns for periods of less than one year are not annualized. |
The accompanying notes are an integral part of these financial statements.
| | | | | | |
| Notes to financial statements | | Wells Fargo Traditional Small Cap Growth Fund | | | 19 | |
1. ORGANIZATION
Wells Fargo Funds Trust (the “Trust”), a Delaware statutory trust organized on March 10, 1999, is an open-end management investment company registered under the Investment Company Act of 1940, as amended (the “1940 Act”). As an investment company, the Trust follows the accounting and reporting guidance in Financial Accounting Standards Board (“FASB”) Accounting Standards Codification Topic 946, Financial Services – Investment Companies. These financial statements report on the Wells Fargo Traditional Small Cap Growth Fund (the “Fund”) which is a diversified series of the Trust.
2. SIGNIFICANT ACCOUNTING POLICIES
The following significant accounting policies, which are consistently followed in the preparation of the financial statements of the Fund, are in conformity with U.S. generally accepted accounting principles which require management to make estimates and assumptions that affect the reported amounts of assets and liabilities, disclosure of contingent assets and liabilities at the date of the financial statements, and the reported amounts of revenues and expenses during the reporting period. Actual results could differ from those estimates.
Securities valuation
All investments are valued each business day as of the close of regular trading on the New York Stock Exchange (generally 4 p.m. Eastern Time), although the Fund may deviate from this calculation time under unusual or unexpected circumstances.
Equity securities that are listed on a foreign or domestic exchange or market are valued at the official closing price or, if none, the last sales price. If no sale occurs on the principal primary exchange or market that day, the prior day’s price will be deemed “stale” and a fair value price will be determined in accordance with the Fund’s Valuation Procedures.
Investments in registered open-end investment companies are valued at net asset value. Interests in non-registered investment vehicles that are redeemable at net asset value are fair valued normally at net asset value.
Investments which are not valued using any of the methods discussed above are valued at their fair value, as determined in good faith by the Board of Trustees of the Fund. The Board of Trustees has established a Valuation Committee comprised of the Trustees and has delegated to it the authority to take any actions regarding the valuation of portfolio securities that the Valuation Committee deems necessary or appropriate, including determining the fair value of portfolio securities, unless the determination has been delegated to the Management Valuation Team of Wells Fargo Funds Management, LLC (“Funds Management”). The Board of Trustees retains the authority to make or ratify any valuation decisions or approve any changes to the Valuation Procedures as it deems appropriate. On a quarterly basis, the Board of Trustees receives reports on any valuation actions taken by the Valuation Committee or the Management Valuation Team which may include items for ratification.
Valuations of fair valued securities are compared to the next actual sales price when available, or other appropriate market values, to assess the continued appropriateness of the fair valuation methodologies used. These securities are fair valued on a day-to-day basis, taking into consideration changes to appropriate market information and any significant changes to the inputs considered in the valuation process until there is a readily available price provided on an exchange or by an independent pricing service. Valuations received from an independent pricing service or independent broker-dealer quotes are periodically validated by comparisons to most recent trades and valuations provided by other independent pricing services in addition to the review of prices by the manager and/or subadviser. Unobservable inputs used in determining fair valuations are identified based on the type of security, taking into consideration factors utilized by market participants in valuing the investment, knowledge about the issuer and the current market environment.
Security loans
The Fund may lend its securities from time to time in order to earn additional income in the form of fees or interest on securities received as collateral or the investment of any cash received as collateral. The Fund continues to receive interest or dividends on the securities loaned. The Fund receives collateral in the form of cash or securities with a value at least equal to the value of the securities on loan. The value of the loaned securities is determined at the close of each business day and any additional required collateral is delivered to the Fund on the next business day. In a securities lending transaction, the net asset value of the Fund will be affected by an increase or decrease in the value of the securities loaned and by an increase or decrease in the value of the instrument in which collateral is invested. The amount of securities lending activity undertaken by the Fund fluctuates from time to time. In the event of default or bankruptcy by the borrower, the Fund may be prevented from recovering the loaned securities or gaining access to the collateral or may experience delays or costs in doing so. In addition, the investment of any cash collateral received may lose all or part of its value. The Fund has the right under the lending agreement to recover the securities from the borrower on demand.
| | | | |
| 20 | | Wells Fargo Traditional Small Cap Growth Fund | | Notes to financial statements |
The Fund lends its securities through an unaffiliated securities lending agent. Cash collateral received in connection with its securities lending transactions is invested in Securities Lending Cash Investments, LLC (the “Securities Lending Fund”). The Securities Lending Fund is exempt from registration under Section 3(c)(7) of the 1940 Act and is managed by Funds Management and is subadvised by Wells Capital Management Incorporated (“WellsCap”), an affiliate of Funds Management and an indirectly wholly owned subsidiary of Wells Fargo & Company (“Wells Fargo”). Funds Management receives an advisory fee starting at 0.05% and declining to 0.01% as the average daily net assets of the Securities Lending Fund increase. All of the fees received by Funds Management are paid to WellsCap for its services as subadviser. The Securities Lending Fund seeks to provide a positive return compared to the daily Fed Funds Open rate by investing in high-quality, U.S. dollar-denominated short-term money market instruments. Securities Lending Fund investments are fair valued based upon the amortized cost valuation technique. Income earned from investment in the Securities Lending Fund is included in securities lending income on the Statement of Operations.
Security transactions and income recognition
Securities transactions are recorded on a trade date basis. Realized gains or losses are recorded on the basis of identified cost.
Dividend income is recognized on the ex-dividend date.
Distributions to shareholders
Distributions to shareholders from net investment income and net realized gains, if any, are recorded on the ex-dividend date. Such distributions are determined in conformity with federal income tax regulations, which may differ in amount or character from net investment income and realized gains recognized for purposes of U.S. generally accepted accounting principles.
Federal and other taxes
The Fund intends to continue to qualify as a regulated investment company by distributing substantially all of its investment company taxable income and any net realized capital gains (after reduction for capital loss carryforwards) sufficient to relieve it from all, or substantially all, federal income taxes. Accordingly, no provision for federal income taxes was required.
The Fund’s income and federal excise tax returns and all financial records supporting those returns for the prior three fiscal years are subject to examination by the federal and Delaware revenue authorities. Management has analyzed the Fund’s tax positions taken on federal, state, and foreign tax returns for all open tax years and does not believe that there are any uncertain tax positions that require recognition of a tax liability.
Reclassifications are made to the Fund’s capital accounts for permanent tax differences to reflect income and gains available for distribution (or available capital loss carryforwards) under federal income tax regulations. U.S. generally accepted accounting principles require that certain components of net assets be adjusted to reflect permanent differences between financial and tax reporting. These reclassifications have no effect on net assets or net asset values per share. The primary permanent difference causing such reclassifications is due to net operating losses. At March 31, 2016, as a result of permanent book-to-tax differences, the following reclassification adjustments were made on the Statement of Assets and Liabilities:
| | |
| Paid-in capital | | Accumulated net
investment loss |
| $(1,009,068) | | $1,009,068 |
As of March 31, 2016, the Fund had a qualified late-year ordinary loss of $135,230 which will be recognized on the first day of the following fiscal year.
Class allocations
The separate classes of shares offered by the Fund differ principally in applicable sales charges, distribution, shareholder servicing, and administration fees. Class specific expenses are charged directly to that share class. Investment income, common expenses, and realized and unrealized gains (losses) on investments are allocated daily to each class of shares based on the relative proportion of net assets of each class.
3. FAIR VALUATION MEASUREMENTS
Fair value measurements of investments are determined within a framework that has established a fair value hierarchy based upon the various data inputs utilized in determining the value of the Fund’s investments. The three-level hierarchy gives the highest priority to unadjusted quoted prices in active markets for identical assets or liabilities (Level 1) and the
| | | | | | |
| Notes to financial statements | | Wells Fargo Traditional Small Cap Growth Fund | | | 21 | |
lowest priority to significant unobservable inputs (Level 3). The Fund’s investments are classified within the fair value hierarchy based on the lowest level of input that is significant to the fair value measurement. The inputs are summarized into three broad levels as follows:
| n | | Level 1 – quoted prices in active markets for identical securities |
| n | | Level 2 – other significant observable inputs (including quoted prices for similar securities, interest rates, prepayment speeds, credit risk, use of amortized cost, etc.) |
| n | | Level 3 – significant unobservable inputs (including the Fund’s own assumptions in determining the fair value of investments) |
The inputs or methodologies used for valuing investments in securities are not necessarily an indication of the risk associated with investing in those securities.
The following is a summary of the inputs used in valuing the Fund’s assets and liabilities as of March 31, 2016:
| | | | | | | | | | | | | | | | |
| | | Quoted prices
(Level 1) | | | Other significant
observable inputs
(Level 2) | | | Significant
unobservable inputs
(Level 3) | | | Total | |
Assets | | | | | | | | | | | | | | | | |
Investments in: | | | | | | | | | | | | | | | | |
| | | | |
Common stocks | | | | | | | | | | | | | | | | |
Consumer discretionary | | $ | 18,083,940 | | | $ | 0 | | | $ | 0 | | | $ | 18,083,940 | |
Consumer staples | | | 733,000 | | | | 0 | | | | 0 | | | | 733,000 | |
Energy | | | 630,000 | | | | 0 | | | | 0 | | | | 630,000 | |
Financials | | | 4,961,700 | | | | 0 | | | | 0 | | | | 4,961,700 | |
Health care | | | 23,414,999 | | | | 0 | | | | 0 | | | | 23,414,999 | |
Industrials | | | 13,223,151 | | | | 0 | | | | 0 | | | | 13,223,151 | |
Information technology | | | 28,814,110 | | | | 0 | | | | 0 | | | | 28,814,110 | |
Materials | | | 3,529,517 | | | | 0 | | | | 0 | | | | 3,529,517 | |
| | | | |
Short-term investments | | | | | | | | | | | | | | | | |
Investment companies | | | 2,648,261 | | | | 0 | | | | 0 | | | | 2,648,261 | |
Investments measured at net asset value* | | | | | | | | | | | | | | | 9,814,825 | |
Total assets | | $ | 96,038,678 | | | $ | 0 | | | $ | 0 | | | $ | 105,853,503 | |
| * | Investments that are measured at fair value using the net asset value per share (or its equivalent) as a practical expedient have not been categorized in the fair value hierarchy. The fair value amount presented in the table is intended to permit reconciliation of the fair value hierarchy to the amounts presented in the Statement of Assets and Liabilities. The Fund’s investment in Securities Lending Cash Investments, LLC valued at $9,814,825 does not have a redemption period notice, can be redeemed daily and does not have any unfunded commitments. |
The Fund recognizes transfers between levels within the fair value hierarchy at the end of the reporting period. At March 31, 2016, the Fund did not have any transfers into/out of Level 1, Level 2, or Level 3.
4. TRANSACTIONS WITH AFFILIATES
Management fee
Funds Management, an indirect wholly owned subsidiary of Wells Fargo, is the manager of the Fund and provides advisory and fund-level administrative services under an investment management agreement. Under the investment management agreement, Funds Management is responsible for, among other services, implementing the investment objectives and strategies of the Fund, supervising the applicable subadviser, providing fund-level administrative services in connection with the Fund’s operations, and providing any other fund-level administrative services reasonably necessary for the operation of the Fund. As compensation for its services under the investment management agreement, Funds Management is entitled to receive an annual management fee starting at 0.85% and declining to 0.71% as the average daily net assets of the Fund increase.
Prior to July 1, 2015, Funds Management provided advisory services pursuant to an investment advisory agreement and was entitled to receive an annual fee which started at 0.80% and declined to 0.68% as the average daily net assets of the Fund increased. In addition, fund-level administrative services were provided by Funds Management under a separate administration agreement at an annual fee which started at 0.05% and declined to 0.03% as the average daily net assets
| | | | |
| 22 | | Wells Fargo Traditional Small Cap Growth Fund | | Notes to financial statements |
of the Fund increased. For financial statement purposes, the advisory fee and fund-level administration fee for the year ended March 31, 2016 have been included in management fee on the Statement of Operations.
For the year ended March 31, 2016, the management fee was equivalent to an annual rate of 0.85% of the Fund’s average daily net assets.
Funds Management has retained the services of a subadviser to provide daily portfolio management to the Fund. The fee for subadvisory services is borne by Funds Management. WellsCap is the subadviser to the Fund and is entitled to receive a fee from Funds Management at an annual rate starting at 0.55% and declining to 0.40% as the average daily net assets of the Fund increase.
Administration fees
The Trust has entered into an administration agreement with Funds Management. Under this agreement, for providing administrative services, which includes paying fees and expenses for services provided by the transfer agent, sub-transfer agents, omnibus account servicers and record-keepers, Funds Management is entitled to receive from the Fund an annual fund level administration fee starting at 0.05% and declining to 0.03% as the average daily net assets of the Fund increase and a class level administration fee which is calculated based on the average daily net assets of each class as follows:
| | | | | | | | |
| | | Class-level administration fee | |
| | | Current rate | | | Rate prior to
July 1, 2015 | |
Class A, Class C | | | 0.21 | % | | | 0.26 | % |
Administrator Class | | | 0.13 | | | | 0.10 | |
Institutional Class | | | 0.13 | | | | 0.08 | |
Funds Management has contractually waived and/or reimbursed advisory and administration fees to the extent necessary to maintain certain net operating expense ratios for the Fund. Waiver of fees and/or reimbursement of expenses by Funds Management were made first from fund level expenses on a proportionate basis and then from class specific expenses. Funds Management has committed through July 31, 2016 to waive fees and/or reimburse expenses to the extent necessary to cap the Fund’s expenses at 1.33% for Class A shares, 2.08% for Class C shares, 1.20% for Administrator Class shares, and 0.98% for Institutional Class shares. After this time, the cap may be increased or the commitment to maintain the cap may be terminated only with the approval of the Board of Trustees.
Distribution fee
The Trust has adopted a distribution plan for Class C shares of the Fund pursuant to Rule 12b-1 under the 1940 Act. A distribution fee is charged to Class C shares and paid to Wells Fargo Funds Distributor, LLC (“Funds Distributor”), the principal underwriter, at an annual rate of 0.75% of the average daily net assets of Class C shares.
In addition, Funds Distributor is entitled to receive the front-end sales charge from the purchase of Class A shares and a contingent deferred sales charge on the redemption of certain Class A shares. Funds Distributor is also entitled to receive the contingent deferred sales charges from redemptions of Class C shares. For the year ended March 31, 2016, Funds Distributor received $1,066 from the sale of Class A shares.
Shareholder servicing fees
The Trust has entered into contracts with one or more shareholder servicing agents, whereby Class A, Class C, and Administrator Class of the Fund are charged a fee at an annual rate of 0.25% of the average daily net assets of each respective class.
A portion of these total shareholder servicing fees were paid to affiliates of Wells Fargo.
5. INVESTMENT PORTFOLIO TRANSACTIONS
Purchases and sales of investments, excluding U.S. government obligations (if any) and short-term securities, for the year ended March 31, 2016 were $141,326,953 and $167,621,672, respectively.
6. BANK BORROWINGS
The Trust (excluding the money market funds and certain other funds) and Wells Fargo Variable Trust are parties to a $200,000,000 revolving credit agreement whereby the Fund is permitted to use bank borrowings for temporary or emergency purposes, such as to fund shareholder redemption requests. Interest under the credit agreement is charged
| | | | | | |
| Notes to financial statements | | Wells Fargo Traditional Small Cap Growth Fund | | | 23 | |
to the Fund based on a borrowing rate equal to the higher of the Federal Funds rate in effect on that day plus 1.25% or the overnight LIBOR rate in effect on that day plus 1.25%. In addition, an annual commitment fee equal to 0.20% of the unused balance is allocated to each participating fund. Prior to September 1, 2015, the revolving credit agreement was $150,000,000 and the annual commitment fee was equal to 0.10% of the unused balance which was allocated to each participating fund.
For the year ended March 31, 2016, there were no borrowings by the Fund under the agreement.
7. DISTRIBUTIONS TO SHAREHOLDERS
The tax character of distributions paid during the years ended March 31, 2016 and March 31, 2015 were as follows:
| | | | | | | | |
| | | Year ended March 31 | |
| | | 2016 | | | 2015 | |
Ordinary income | | $ | 0 | | | $ | 5,316,703 | |
Long-term capital gain | | | 24,599,232 | | | | 18,264,085 | |
As of March 31, 2016, the components of distributable earnings on a tax basis were as follows:
| | | | |
Undistributed long-term
gain | | Unrealized gains | | Late-year ordinary losses deferred |
| $5,666 | | $2,740,816 | | $(135,230) |
8. CONCENTRATION RISK
Concentration risks result from exposure to a limited number of sectors. A fund that invests a substantial portion of its assets in any sector may be more affected by changes in that sector than would be a fund whose investments are not heavily weighted in any sector.
9. INDEMNIFICATION
Under the Trust’s organizational documents, the officers and Trustees have been granted certain indemnification rights against certain liabilities that may arise out of performance of their duties to the Trust. Additionally, in the normal course of business, the Trust may enter into contracts with service providers that contain a variety of indemnification clauses. The Trust’s maximum exposure under these arrangements is dependent on future claims that may be made against the Fund and, therefore, cannot be estimated.
| | | | |
| 24 | | Wells Fargo Traditional Small Cap Growth Fund | | Report of independent registered public accounting firm |
BOARD OF TRUSTEES AND SHAREHOLDERS OF WELLS FARGO FUNDS TRUST:
We have audited the accompanying statement of assets and liabilities, including the portfolio of investments, of the Wells Fargo Traditional Small Cap Growth Fund (formerly known as Wells Fargo Advantage Traditional Small Cap Growth Fund) (the “Fund”), one of the funds constituting the Wells Fargo Funds Trust, as of March 31, 2016, and the related statement of operations for the year then ended, the statements of changes in net assets for each of the years in the two-year period then ended, and the financial highlights for each of the years in the two-year period then ended, the period from November 1, 2013 to March 31, 2014, and each of the years in the three-year period ended October 31, 2013. These financial statements and financial highlights are the responsibility of the Fund’s management. Our responsibility is to express an opinion on these financial statements and financial highlights based on our audits.
We conducted our audits in accordance with the standards of the Public Company Accounting Oversight Board (United States). Those standards require that we plan and perform the audit to obtain reasonable assurance about whether the financial statements and financial highlights are free of material misstatement. An audit includes examining, on a test basis, evidence supporting the amounts and disclosures in the financial statements. Our procedures included confirmation of securities owned as of March 31, 2016, by correspondence with the custodian and brokers or by other appropriate auditing procedures. An audit also includes assessing the accounting principles used and significant estimates made by management, as well as evaluating the overall financial statement presentation. We believe that our audits provide a reasonable basis for our opinion.
In our opinion, the financial statements and financial highlights referred to above present fairly, in all material respects, the financial position of the Wells Fargo Traditional Small Cap Growth Fund as of March 31, 2016, the results of its operations for the year then ended, the changes in its net assets for each of the years in the two-year period then ended, and the financial highlights for each of the years or periods noted in the first paragraph above, in conformity with U.S. generally accepted accounting principles.

Boston, Massachusetts
May 25, 2016
| | | | | | |
| Other information (unaudited) | | Wells Fargo Traditional Small Cap Growth Fund | | | 25 | |
TAX INFORMATION
Pursuant to Section 852 of the Internal Revenue Code, $24,599,232 was designated as long-term capital gain distributions for the fiscal year ended March 31, 2016.
PROXY VOTING INFORMATION
A description of the policies and procedures that the Fund uses to determine how to vote proxies relating to portfolio securities is available, upon request, by calling 1-800-222-8222, visiting our website at wellsfargofunds.com, or visiting the SEC website at sec.gov. Information regarding how the Fund voted proxies relating to portfolio securities during the most recent 12-month period ended June 30 is available on the Fund’s website at wellsfargofunds.com or by visiting the SEC website at sec.gov.
PORTFOLIO HOLDINGS INFORMATION
The complete portfolio holdings for the Fund are publicly available monthly on the Fund’s website (wellsfargofunds.com), on a one-month delayed basis. In addition, top ten holdings information (excluding derivative positions) for the Fund is publicly available on the Fund’s website on a monthly, seven-day or more delayed basis. The Fund files its complete schedule of portfolio holdings with the SEC for the first and third quarters of each fiscal year on Form N-Q, which is available by visiting the SEC website at sec.gov. In addition, the Fund’s Form N-Q may be reviewed and copied at the SEC’s Public Reference Room in Washington, DC, and at regional offices in New York City, at 233 Broadway, and in Chicago, at 175 West Jackson Boulevard, Suite 900. Information about the Public Reference Room may be obtained by calling 1-800-SEC-0330.
| | | | |
| 26 | | Wells Fargo Traditional Small Cap Growth Fund | | Other information (unaudited) |
BOARD OF TRUSTEES AND OFFICERS
Each of the Trustees and Officers1 listed in the table below acts in identical capacities for each fund in the Wells Fargo family of funds, which consists of 144 mutual funds comprising the Wells Fargo Funds Trust, Wells Fargo Variable Trust, Wells Fargo Master Trust and four closed-end funds (collectively the “Fund Complex”). This table should be read in conjunction with the Prospectus and the Statement of Additional Information2. The mailing address of each Trustee and Officer is 525 Market Street, 12th Floor, San Francisco, CA 94105. Each Trustee and Officer serves an indefinite term, however, each Trustee serves such term until reaching the mandatory retirement age established by the Trustees.
Independent Trustees
| | | | | | |
Name and year of birth | | Position held and length of service* | | Principal occupations during past five years or longer | | Current other public
company or investment
company directorships |
| William R. Ebsworth (Born 1957) | | Trustee, since 2015 | | Retired. From 1984 to 2013, equities analyst, portfolio manager, research director and chief financial officer at Fidelity Management and Research Company in Boston, Tokyo, and Hong Kong and retired in 2013 as Chief Investment Officer of Fidelity Strategic Advisers, Inc. where he lead a team of investment professionals managing client assets. Prior thereto, Board member of Hong Kong Securities Clearing Co., Hong Kong Options Clearing Corp., the Thailand International Fund, Ltd., Fidelity Investments Life Insurance Company, and Empire Fidelity Investments Life Insurance Company. Mr. Ebsworth is a CFA® charterholder and an Adjunct Lecturer, Finance, at Babson College. | | Asset Allocation Trust |
| Jane A. Freeman (Born 1953) | | Trustee, since 2015 | | Retired. From 2012 to 2014 and 1999 to 2008, Chief Financial Officer of Scientific Learning Corporation. From 2008 to 2012, Ms. Freeman provided consulting services related to strategic business projects. Prior to 1999, Portfolio Manager at Rockefeller & Co. and Scudder, Stevens & Clark. Board member of the Harding Loevner Funds from 1996 to 2014, serving as both Lead Independent Director and chair of the Audit Committee. Board member of the Russell Exchange Traded Funds Trust from 2011 to 2012 and the chair of the Audit Committee. Ms. Freeman is Chair of Taproot Foundation (non-profit organization), a Board Member of Ruth Bancroft Garden (non-profit organization) and an inactive chartered financial analyst. | | Asset Allocation Trust |
| Peter G. Gordon (Born 1942) | | Trustee, since 1998; Chairman, since 2005 | | Co-Founder, Retired Chairman, President and CEO of Crystal Geyser Water Company. Trustee Emeritus, Colby College. | | Asset Allocation Trust |
| Isaiah Harris, Jr. (Born 1952) | | Trustee, since 2009 | | Retired. Chairman of the Board of CIGNA Corporation since 2009, and Director since 2005. From 2003 to 2011, Director of Deluxe Corporation. Prior thereto, President and CEO of BellSouth Advertising and Publishing Corp. from 2005 to 2007, President and CEO of BellSouth Enterprises from 2004 to 2005 and President of BellSouth Consumer Services from 2000 to 2003. Emeritus member of the Iowa State University Foundation Board of Governors. Emeritus Member of the Advisory Board of Iowa State University School of Business. Advisory Board Member, Palm Harbor Academy (charter school). Advisory Board Member, Child Evangelism Fellowship (non-profit). Mr. Harris is a certified public accountant (inactive status). | | CIGNA Corporation; Asset Allocation Trust |
| Judith M. Johnson (Born 1949) | | Trustee, since 2008; Audit Committee Chairman, since 2008 | | Retired. Prior thereto, Chief Executive Officer and Chief Investment Officer of Minneapolis Employees Retirement Fund from 1996 to 2008. Ms. Johnson is an attorney, certified public accountant and a certified managerial accountant. | | Asset Allocation Trust |
| David F. Larcker (Born 1950) | | Trustee, since 2009 | | James Irvin Miller Professor of Accounting at the Graduate School of Business, Stanford University, Director of the Corporate Governance Research Initiative and Senior Faculty of The Rock Center for Corporate Governance since 2006. From 2005 to 2008, Professor of Accounting at the Graduate School of Business, Stanford University. Prior thereto, Ernst & Young Professor of Accounting at The Wharton School, University of Pennsylvania from 1985 to 2005. | | Asset Allocation Trust |
| | | | | | |
| Other information (unaudited) | | Wells Fargo Traditional Small Cap Growth Fund | | | 27 | |
| | | | | | |
Name and year of birth | | Position held and length of service* | | Principal occupations during past five years or longer | | Current other public
company or investment
company directorships |
| Olivia S. Mitchell (Born 1953) | | Trustee, since 2006 | | International Foundation of Employee Benefit Plans Professor, Wharton School of the University of Pennsylvania since 1993. Director of Wharton’s Pension Research Council and Boettner Center on Pensions & Retirement Research, and Research Associate at the National Bureau of Economic Research. Previously, Cornell University Professor from 1978 to 1993. | | Asset Allocation Trust |
| Timothy J. Penny (Born 1951) | | Trustee, since 1996 | | President and Chief Executive Officer of Southern Minnesota Initiative Foundation, a non-profit organization, since 2007 and Senior Fellow at the Humphrey Institute Policy Forum at the University of Minnesota since 1995. Member of the Board of Trustees of NorthStar Education Finance, Inc., a non-profit organization, since 2007. | | Asset Allocation Trust |
| Michael S. Scofield (Born 1943) | | Trustee, since 2010 | | Served on the Investment Company Institute’s Board of Governors and Executive Committee from 2008-2011 as well the Governing Council of the Independent Directors Council from 2006-2011 and the Independent Directors Council Executive Committee from 2008-2011. Chairman of the IDC from 2008-2010. Institutional Investor (Fund Directions) Trustee of Year in 2007. Trustee of the Evergreen Funds complex (and its predecessors) from 1984 to 2010. Chairman of the Evergreen Funds from 2000-2010. Former Trustee of the Mentor Funds. Retired Attorney, Law Offices of Michael S. Scofield. | | Asset Allocation Trust |
| * | Length of service dates reflect the Trustee’s commencement of service with the Trust’s predecessor entities, where applicable. |
Officers
| | | | | | |
Name and year of birth | | Position held and
length of service | | Principal occupations during past five years or longer | | |
Karla M. Rabusch
(Born 1959) | | President, since 2003 | | Executive Vice President of Wells Fargo Bank, N.A. and President of Wells Fargo Funds Management, LLC since 2003. | | |
Nancy Wiser1
(Born 1967) | | Treasurer, since 2012 | | Executive Vice President of Wells Fargo Funds Management, LLC since 2011. Chief Operating Officer and Chief Compliance Officer at LightBox Capital Management LLC, from 2008 to 2011. | | |
C. David Messman
(Born 1960) | | Secretary, since 2000; Chief Legal Officer, since 2003 | | Senior Vice President and Secretary of Wells Fargo Funds Management, LLC since 2001. Assistant General Counsel of Wells Fargo Bank, N.A. since 2013 and Vice President and Managing Counsel of Wells Fargo Bank, N.A. from 1996 to 2013. | | |
Debra Ann Early
(Born 1964) | | Chief Compliance Officer, since 2007 | | Executive Vice President of Wells Fargo Funds Management, LLC since 2014, Senior Vice President and Chief Compliance Officer from 2007 to 2014. | | |
David Berardi
(Born 1975) | | Assistant Treasurer, since 2009 | | Vice President of Wells Fargo Funds Management, LLC since 2009. Vice President of Evergreen Investment Management Company, LLC from 2008 to 2010. Manager of Fund Reporting and Control for Evergreen Investment Management Company, LLC from 2004 to 2010. | | |
Jeremy DePalma1
(Born 1974) | | Assistant Treasurer, since 2009 | | Senior Vice President of Wells Fargo Funds Management, LLC since 2009. Senior Vice President of Evergreen Investment Management Company, LLC from 2008 to 2010 and head of the Fund Reporting and Control Team within Fund Administration from 2005 to 2010. | | |
| 1 | Nancy Wiser acts as Treasurer of 72 funds in the Fund Complex. Jeremy DePalma acts as Treasurer of 72 funds and Assistant Treasurer of 72 funds in the Fund Complex. |
| 2 | The Statement of Additional Information includes additional information about the Trustees and is available, without charge, upon request, by calling 1-800-222-8222 or by visiting the website at wellsfargofunds.com. |
| | | | |
| 28 | | Wells Fargo Traditional Small Cap Growth Fund | | List of abbreviations |
The following is a list of common abbreviations for terms and entities that may have appeared in this report.
| ACA | — ACA Financial Guaranty Corporation |
| ADR | — American depositary receipt |
| ADS | — American depositary shares |
| AGC | — Assured Guaranty Corporation |
| AGM | — Assured Guaranty Municipal |
| Ambac | — Ambac Financial Group Incorporated |
| AMT | — Alternative minimum tax |
| BAN | — Bond anticipation notes |
| BHAC | — Berkshire Hathaway Assurance Corporation |
| CAB | — Capital appreciation bond |
| CCAB | — Convertible capital appreciation bond |
| CDA | — Community Development Authority |
| CDO | — Collateralized debt obligation |
| DRIVER | — Derivative inverse tax-exempt receipts |
| DW&P | — Department of Water & Power |
| DWR | — Department of Water Resources |
| ECFA | — Educational & Cultural Facilities Authority |
| EDA | — Economic Development Authority |
| EDFA | — Economic Development Finance Authority |
| ETF | — Exchange-traded fund |
| FDIC | — Federal Deposit Insurance Corporation |
| FFCB | — Federal Farm Credit Banks |
| FGIC | — Financial Guaranty Insurance Corporation |
| FHA | — Federal Housing Administration |
| FHLB | — Federal Home Loan Bank |
| FHLMC | — Federal Home Loan Mortgage Corporation |
| FICO | — The Financing Corporation |
| FNMA | — Federal National Mortgage Association |
| GDR | — Global depositary receipt |
| GNMA | — Government National Mortgage Association |
| HCFR | — Healthcare facilities revenue |
| HEFA | — Health & Educational Facilities Authority |
| HEFAR | — Higher education facilities authority revenue |
| HFA | — Housing Finance Authority |
| HFFA | — Health Facilities Financing Authority |
| HUD | — Department of Housing and Urban Development |
| IDA | — Industrial Development Authority |
| IDAG | — Industrial Development Agency |
| KRW | — Republic of Korea won |
| LIBOR | — London Interbank Offered Rate |
| LIFER | — Long Inverse Floating Exempt Receipts |
| LLC | — Limited liability company |
| LLLP | — Limited liability limited partnership |
| LLP | — Limited liability partnership |
| MBIA | — Municipal Bond Insurance Association |
| MFHR | — Multifamily housing revenue |
| MSTR | — Municipal securities trust receipts |
| MUD | — Municipal Utility District |
| National | — National Public Finance Guarantee Corporation |
| PCFA | — Pollution Control Financing Authority |
| PCL | — Public Company Limited |
| PCR | — Pollution control revenue |
| PFA | — Public Finance Authority |
| PFFA | — Public Facilities Financing Authority |
| PFOTER | — Puttable floating option tax-exempt receipts |
| plc | — Public limited company |
| PUTTER | — Puttable tax-exempt receipts |
| R&D | — Research & development |
| Radian | — Radian Asset Assurance |
| RAN | — Revenue anticipation notes |
| RDA | — Redevelopment Authority |
| RDFA | — Redevelopment Finance Authority |
| REIT | — Real estate investment trust |
| ROC | — Reset option certificates |
| SAVRS | — Select auction variable rate securities |
| SBA | — Small Business Authority |
| SDR | — Swedish depositary receipt |
| SFHR | — Single-family housing revenue |
| SFMR | — Single-family mortgage revenue |
| SPA | — Standby purchase agreement |
| SPDR | — Standard & Poor’s Depositary Receipts |
| SPEAR | — Short Puttable Exempt Adjustable Receipts |
| STRIPS | — Separate trading of registered interest and |
| TAN | — Tax anticipation notes |
| TIPS | — Treasury inflation-protected securities |
| TRAN | — Tax revenue anticipation notes |
| TTFA | — Transportation Trust Fund Authority |
| TVA | — Tennessee Valley Authority |

For more information
More information about Wells Fargo Funds is available free upon request. To obtain literature, please write, email, visit the Fund’s website, or call:
Wells Fargo Funds
P.O. Box 8266
Boston, MA 02266-8266
Email: fundservice@wellsfargo.com
Website: wellsfargofunds.com
Individual investors: 1-800-222-8222
Retail investment professionals: 1-888-877-9275
Institutional investment professionals: 1-866-765-0778
This report and the financial statements contained herein are submitted for the general information of the shareholders of the Fund. If this report is used for promotional purposes, distribution of the report must be accompanied or preceded by a current prospectus. Before investing, please consider the investment objectives, risks, charges, and expenses of the investment. For a current prospectus and, if available, a summary prospectus, containing this information, call 1-800-222-8222 or visit the Fund’s website at wellsfargofunds.com. Read the prospectus carefully before you invest or send money.
Wells Fargo Asset Management (WFAM) is a trade name used by the asset management businesses of Wells Fargo & Company. Wells Fargo Funds Management, LLC, a wholly owned subsidiary of Wells Fargo & Company, provides investment advisory and administrative services for Wells Fargo Funds. Other affiliates of Wells Fargo & Company provide subadvisory and other services for the funds. The funds are distributed by Wells Fargo Funds Distributor, LLC, Member FINRA, an affiliate of Wells Fargo & Company.
NOT FDIC INSURED ¡ NO BANK GUARANTEE ¡ MAY LOSE VALUE
© 2016 Wells Fargo Funds Management, LLC. All rights reserved.
| | |
 | | 241820 05-16 A247/AR247 03-16 |
Annual Report
March 31, 2016

Wells Fargo Precious Metals Fund


Reduce clutter. Save trees.
Sign up for electronic delivery of prospectuses and shareholder reports at wellsfargo.com/advantagedelivery
Contents
The views expressed and any forward-looking statements are as of March 31, 2016, unless otherwise noted, and are those of the Fund managers and/or Wells Fargo Funds Management, LLC. Discussions of individual securities, or the markets generally, or any Wells Fargo Fund are not intended as individual recommendations. Future events or results may vary significantly from those expressed in any forward-looking statements. The views expressed are subject to change at any time in response to changing circumstances in the market. Wells Fargo Funds Management, LLC and the Fund disclaim any obligation to publicly update or revise any views expressed or forward-looking statements.
NOT FDIC INSURED ¡ NO BANK GUARANTEE ¡ MAY LOSE VALUE
| | | | |
| 2 | | Wells Fargo Precious Metals Fund | | Letter to shareholders (unaudited) |

Karla M. Rabusch
President
Wells Fargo Funds
Dear Valued Shareholder:
We are pleased to offer you this annual report for the Wells Fargo Precious Metals Fund for the 12-month period that ended March 31, 2016. During this period, which began with the second quarter of 2015, U.S. and international stock markets experienced heightened volatility, with intermittent rebounds interspersed with sell-offs. The U.S. economy displayed resilience throughout the period, although growth stayed modest amid ongoing pressures such as slowing growth in China, a strengthening U.S. dollar, and uncertainty regarding interest-rate increases by the U.S. Federal Reserve (Fed). International economies faced deeper ongoing challenges.
U.S. stocks experienced challenges during the second quarter of 2015.
The broad U.S. stock market fluctuated widely, eventually eking out a small quarterly gain. Mid- and large-cap stocks at times were pressured by investor concerns over the potentially negative effects of financially troubled overseas economies and of a strengthening U.S. dollar on the profits of U.S. multinational firms. The U.S. economy picked up traction during the quarter, and U.S. Fed officials, who kept interest rates low while waiting for the U.S. jobs market to sufficiently improve and for inflation to approach their 2% target, made clear they could take action soon. Throughout the quarter, non-U.S. markets also experienced volatility, triggered by uncertainty over the potential impact of financial challenges in other locations—most notably in Greece and Puerto Rico. Questions over slower growth in China caused investor concern as well.
In the third quarter of 2015, China’s slowdown took a toll on economies and markets worldwide.
U.S. stocks sagged during the quarter, experiencing the most volatility since 2011. Economic data released during the quarter suggested the U.S. economy remained solid but had lost some steam, burdened by the drag of the U.S. dollar’s strength coupled with global economic turmoil. The fact that the Fed left the federal funds interest rate unchanged at its September 2015 meeting surprised investors and fueled increased uncertainty about the U.S. economy’s stamina to remain healthy while facing the challenges of slowing in China and troubles elsewhere in the world. Outside the U.S., markets were even more volatile and delivered generally weaker quarterly results, also largely due to investors’ increasing anxiety over China’s weakened economy. Because China is the world’s largest importer of many commodities, a number of emerging markets—key commodities exporters—struggled under the dual strains of reduced demand for commodities and, because of weaker demand, lower prices for the commodities they did sell. In the eurozone, however, where only about 3% of exports are sent to China, household spending and business investment appeared relatively unaffected by troubles elsewhere. The European Central Bank (ECB) warned, though, that China’s slowing could lead to slower growth and lower inflation rates in the eurozone than previously forecast and indicated additional stimulus could be provided should this occur.
Despite ongoing concerns, U.S. stocks generally rose in the fourth quarter of 2015; international markets lagged.
While the broad U.S. stock market bounced back in the quarter, stock markets outside the U.S. failed to keep pace as economic concerns, including China’s slowdown, continued to negatively affect many countries. U.S. economic data released during the quarter indicated the economy remained solid, with modest growth, although the strong U.S. dollar and weakness in international economies
| | | | | | |
| Letter to shareholders (unaudited) | | Wells Fargo Precious Metals Fund | | | 3 | |
continued to be headwinds. In December, the Fed, as expected, raised its target interest rate by 25 basis points (bps; 100 bps equals 1.00%) after keeping it near zero for seven years. The move reflected confidence in the U.S. economy’s ability to stay healthy with less central-bank support. The Fed also clarified that future interest-rate increases would be gradual.
In the first quarter of 2016, market volatility increased globally amid ongoing concerns.
Stock markets worldwide fluctuated widely in the first quarter of 2016. Most sold off sharply in the first six weeks of the year on concerns such as weak global growth, falling commodity prices, and uncertainty over the timing and impact of Fed interest-rate increases. As the quarter progressed, fears abated somewhat and global markets generally rallied back. The U.S. economy ended the quarter on a positive note as much of the quarter’s data reflected resiliency. With ongoing uncertainties about global growth and financial markets, however, the Fed held off from raising the target interest rate during the quarter. Outside the U.S., the eurozone fell into deflation in February; in response, the ECB announced an expansion of its stimulus program. In China, the government in March set a growth rate of 6.5% to 7.0% for 2016, an acknowledgment that the country’s growth has been slowing. In emerging markets, although central-bank stimulus and improved prices for oil and other commodities led to stock-market rallies in the quarter, many of these countries’ economies face credit downgrades due to challenges such as the likelihood of a stronger U.S. dollar, which would make dollar-denominated debt more expensive.
Gold prices rose 4% during the reporting period; the share prices of precious metals stocks rose more sharply.
In the second quarter of 2015, gold and gold-related stocks delivered relatively flat results, with minor price changes. Gold prices fluctuated within a narrow trading range in the third quarter of 2015, ultimately falling nearly 5% in those three months; gold-related stocks declined significantly more. Historically, gold-related stocks often have surpassed movements in underlying gold prices, both up or down, which is an unfavorable characteristic when investors expect the price of gold to decline but favorable when they expect gold to rise. In the fourth quarter of 2015, gold fell nearly 5%; as the U.S. dollar strengthened, gold sold off, partly in anticipation of a Fed interest-rate increase. Precious metals stocks generally performed much better than gold prices during this quarter. In the first quarter of 2016, gold rose more than 16% as global economic and financial concerns led many investors to turn to assets perceived as safe, such as gold. Gold stocks appreciated roughly three times more than gold during the quarter.
Don’t let short-term uncertainty derail long-term investment goals.
Periods of uncertainty can present challenges, but experience has taught us that maintaining long-term investment goals can be an effective way to plan for the future. To help you create a sound strategy based on your personal goals and risk tolerance, Wells Fargo Funds offers more than 100 mutual funds spanning a wide range of asset classes and investment styles. Although diversification cannot guarantee an investment profit or prevent losses, we believe it can be an effective way to manage investment risk and potentially smooth out overall portfolio performance. We encourage investors to know their investments and to understand that appropriate levels of risk-taking may unlock opportunities.
Gold prices rose 4% during the reporting period; the share prices of precious metals stocks rose more sharply.
We encourage investors to know their investments and to understand that appropriate levels of risk-taking may unlock opportunities.
| | | | |
| 4 | | Wells Fargo Precious Metals Fund | | Letter to shareholders (unaudited) |
Thank you for choosing to invest in Wells Fargo Funds. We appreciate your confidence in us and remain committed to helping you meet your financial needs.
Sincerely,

Karla M. Rabusch
President
Wells Fargo Funds
For further information about your Fund, contact your investment professional, visit our website at wellsfargofunds.com, or call us directly at 1-800-222-8222. We are available 24 hours a day, 7 days a week.
This page is intentionally left blank.
| | | | |
| 6 | | Wells Fargo Precious Metals Fund | | Performance highlights (unaudited) |
Investment objective
The Fund seeks long-term capital appreciation.
Manager
Wells Fargo Funds Management, LLC
Subadviser
Wells Capital Management Incorporated
Portfolio managers
Michael Bradshaw, CFA®
Oleg Makhorine
Average annual total returns (%) as of March 31, 20161
| | | | | | | | | | | | | | | | | | | | | | | | | | | | | | |
| | | | | Including sales charge | | | Excluding sales charge | | | Expense ratios2 (%) |
| | | Inception date | | 1 year | | | 5 year | | | 10 year | | | 1 year | | | 5 year | | | 10 year | | | Gross | | Net3 |
| Class A (EKWAX) | | 1-20-1998 | | | 6.40 | | | | (17.42 | ) | | | (1.96 | ) | | | 12.90 | | | | (16.44 | ) | | | (1.38 | ) | | 1.17 | | 1.09 |
| Class B (EKWBX)* | | 1-30-1978 | | | 7.04 | | | | (17.39 | ) | | | (1.89 | ) | | | 12.04 | | | | (17.07 | ) | | | (1.89 | ) | | 1.92 | | 1.84 |
| Class C (EKWCX) | | 1-29-1998 | | | 11.05 | | | | (17.06 | ) | | | (2.11 | ) | | | 12.05 | | | | (17.06 | ) | | | (2.11 | ) | | 1.92 | | 1.84 |
| Administrator Class (EKWDX) | | 7-30-2010 | | | – | | | | – | | | | – | | | | 13.06 | | | | (16.31 | ) | | | (1.25 | ) | | 1.09 | | 0.95 |
| Institutional Class (EKWYX) | | 2-29-2000 | | | – | | | | – | | | | – | | | | 13.23 | | | | (16.17 | ) | | | (1.08 | ) | | 0.84 | | 0.79 |
| FTSE Gold Mines Index4 | | – | | | – | | | | – | | | | – | | | | 20.65 | | | | (17.69 | ) | | | (4.42 | ) | | – | | – |
| S&P 500 Index5 | | – | | | – | | | | – | | | | – | | | | 1.78 | | | | 11.58 | | | | 7.01 | | | – | | – |
| * | | Class B shares are closed to investment, except in connection with the reinvestment of any distributions and permitted exchanges. |
Figures quoted represent past performance, which is no guarantee of future results, and do not reflect taxes that a shareholder may pay on fund distributions or the redemption of fund shares. Investment return and principal value of an investment will fluctuate so that an investor’s shares, when redeemed, may be worth more or less than their original cost. Performance shown without sales charges would be lower if sales charges were reflected. Current performance may be lower or higher than the performance data quoted, which assumes the reinvestment of dividends and capital gains. Current month-end performance is available on the Fund’s website, wellsfargofunds.com.
While the S&P 500 Index is comprised of U.S. equity securities of companies diversified across ten sectors, the Fund’s holdings are concentrated primarily in precious metals-related stocks. Therefore, the performance of the S&P 500 Index is displayed only to show how the concentrated Fund performed compared with a diversified selection of U.S. equity securities.
Index returns do not include transaction costs associated with buying and selling securities, any mutual fund fees or expenses, or any taxes. It is not possible to invest directly in an index.
For Class A shares, the maximum front-end sales charge is 5.75%. For Class B shares, the maximum contingent deferred sales charge is 5.00%. For Class C shares, the maximum contingent deferred sales charge is 1.00%. Performance including a contingent deferred sales charge assumes the sales charge for the corresponding time period. Administrator Class and Institutional Class shares are sold without a front-end sales charge or contingent deferred sales charge.
Stock values fluctuate in response to the activities of individual companies and general market and economic conditions. Bond values fluctuate in response to the financial condition of individual issuers, general market and economic conditions, and changes in interest rates. Changes in market conditions and government policies may lead to periods of heightened volatility in the bond market and reduced liquidity for certain bonds held by the Fund. In general, when interest rates rise, bond values fall and investors may lose principal value. Interest-rate changes and their impact on the Fund and its share price can be sudden and unpredictable. Funds that concentrate their investments in limited sectors, such as gold-related investments, are more vulnerable to adverse market, economic, regulatory, political, or other developments affecting those sectors. Certain investment strategies tend to increase the total risk of an investment (relative to the broader market). The Fund is exposed to foreign investment risk, geographic, nondiversification risk, smaller-company securities risk, and subsidiary risk. Consult the Fund’s prospectus for additional information on these and other risks.
Please see footnotes on page 7.
| | | | | | |
| Performance highlights (unaudited) | | Wells Fargo Precious Metals Fund | | | 7 | |
|
| Growth of $10,000 investment as of March 31, 20166 |
|
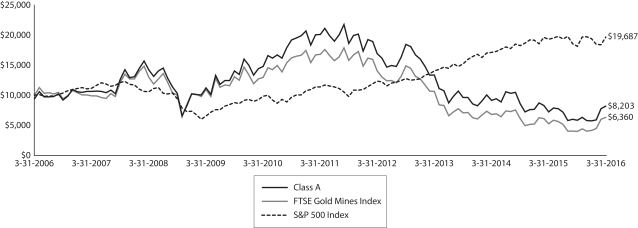 |
| 1 | Historical performance shown for Administrator Class shares prior to their inception reflects the performance of Institutional Class shares and has been adjusted to reflect the higher expenses applicable to Administrator Class shares. Historical performance shown for all classes of the Fund prior July 19, 2010, is based on the Fund’s predecessor Evergreen Precious Metals Fund. |
| 2 | Reflect the expense ratios as stated in the most recent prospectuses. The expense ratios are subject to change and may differ from the annualized expense ratio shown in the financial highlights of this report. |
| 3 | The manager has contractually committed through July 31, 2016, to waive fees and/or reimburse expenses to the extent necessary to cap the Fund’s Total Annual Fund Operating Expenses After Fee Waiver at the amounts shown. After this time, the cap may be increased or the commitment to maintain the cap may be terminated only with the approval of the Board of Trustees. Brokerage commissions, stamp duty fees, interest, taxes, acquired fund fees and expenses, fees and expenses of its wholly-owned subsidiary, and extraordinary expenses are excluded from the cap. Without this cap, the Fund’s returns would have been lower. |
| 4 | FTSE Gold Mines Index is an unmanaged, open-ended index designed to reflect the performance of the worldwide market in the shares of companies whose principal activity is the mining of gold. You cannot invest directly in an index. |
| 5 | The S&P 500 Index consists of 500 stocks chosen for market size, liquidity, and industry group representation. It is a market-value weighted index with each stock’s weight in the index proportionate to its market value. You cannot invest directly in an index. |
| 6 | The chart compares the performance of Class A shares for the most recent ten years with the FTSE Gold Mines Index and the S&P 500 Index. The chart assumes a hypothetical investment of $10,000 in Class A shares and reflects all operating expenses and assumes the maximum initial sales charge of 5.75%. |
| 7 | The ten largest holdings, excluding cash and cash equivalents, are calculated based on the value of the investments divided by total net assets of the Fund. Holdings are subject to change and may have changed since the date specified. |
| 8 | Amounts are calculated based on the total long-term investments of the Fund. These amounts are subject to change and may have changed since the date specified. |
| ** | This security was not held in the Fund at the end of the reporting period. |
| | | | |
| 8 | | Wells Fargo Precious Metals Fund | | Performance highlights (unaudited) |
MANAGER’S DISCUSSION
Fund highlights
| n | | The Fund underperformed the FTSE Gold Mines Index for the 12-month period that ended March 31, 2016. |
| n | | The Fund’s positions in Tahoe Resources Incorporated; Royal Gold, Incorporated; Silver Wheaton Corporation; and Aureus Mining Incorporated** detracted from results, as did its underweight to Barrick Gold Corporation. |
| n | | The Fund’s holdings in Lake Shore Gold Corporation and Torex Gold Resources Incorporated aided results during the period. Overweights to Randgold Resources Limited ADR and Detour Gold Corporation also helped results. |
| n | | The price of gold rose 4% during the 12-month period, and the share prices of precious metals stocks rose more sharply. |
Gold prices declined 10% during the first three quarters of the reporting period as a stronger-than-expected economy caused the Federal Open Market Committee (FOMC) to announce that interest-rate increases would begin by the end of 2015. On December 16, 2015, the FOMC raised the federal funds rate by 25 basis points (bps; 100 bps equals 1.00%); the following day, the price of gold dropped to a low for the 12-month reporting period. During the final quarter of the reporting period (the first quarter of 2016), the price of gold rose 16% as weaker-than-expected economic growth and below-target inflation caused the FOMC to delay further interest-rate increases.
Purchases and sales of gold exchange-traded funds (ETFs) have an impact on gold prices. Sales of gold ETFs increased during the third quarter of the reporting period, negatively affecting the prices of gold and gold stocks. During the final quarter of the reporting period, gold-backed ETF purchases accelerated as investors worried about slowing economic growth in China and falling stock and bond markets worldwide.
| | | | |
| Ten largest holdings (%) as of March 31, 20167 | |
Randgold Resources Limited ADR | | | 9.28 | |
Agnico-Eagle Mines Limited-U.S. Exchange Traded Shares | | | 5.33 | |
Gold Bullion | | | 5.27 | |
Newmont Mining Corporation | | | 5.13 | |
Kinross Gold Corporation | | | 4.51 | |
AngloGold Ashanti Limited ADR | | | 4.29 | |
Royal Gold Incorporated | | | 4.19 | |
Goldcorp Incorporated | | | 4.15 | |
Fresnillo plc | | | 4.08 | |
Barrick Gold Corporation | | | 3.83 | |
Gold-mining stocks outperformed relative to the price of gold.
The prices of gold-mining stocks typically rise or fall more sharply than the price of gold. This remained the case during the 12-month reporting period; higher-cost, financially leveraged companies fared the best. Companies with assets domiciled in jurisdictions experiencing depreciating currencies, such as Australia, South Africa, and Canada, also outperformed.
Two of the Fund’s most noteworthy detractors were Royal Gold and Silver Wheaton. Royal Gold declined after the firm reported disappointing results for the first quarter of its fiscal year; Silver Wheaton dropped on news that the Canadian government would be imposing a
higher-than-expected tax rate on the company’s foreign revenue. The Fund’s underweight to Barrick Gold also detracted from performance as the company benefited from a successful asset-disposal program.
Torex Gold Resources was among the Fund’s best contributors. The company benefited from the successful commissioning of its Mexico-based El Limon mine. Randgold Resources Limited ADR generated the Fund’s strongest contribution to relative results out of all of the securities held; the company, which has mining operations in West Africa, benefited from the expansion of its Kibali Mine. Other key contributors included Canada-based Detour Gold and Lake Shore Gold. Detour Gold pleased investors by delivering higher production and lower costs than expected; Lake Shore outperformed on news of a discovery at its Timmins West mine and a subsequent announcement that the company would be acquired by Tahoe Resources.
Please see footnotes on page 7.
| | | | | | |
| Performance highlights (unaudited) | | Wells Fargo Precious Metals Fund | | | 9 | |
|
| Country allocation as of March 31, 20168 |
|
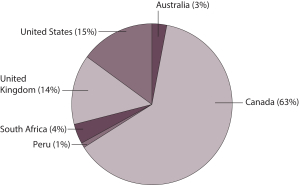 |
In our view, investment in gold and precious metals companies is likely to remain a perceived hedge against inflation.
We believe the short-term outlook for gold prices depends largely on economic data and their resulting impact on U.S. interest rates and the U.S. dollar. If the current period of weaker-than-expected U.S. economic growth continues beyond the first quarter of 2016, the U.S. Federal Reserve could delay interest-rate increases until the end of 2016. Should this occur, we believe the economic environment would continue to support gold prices and gold stocks. We also believe gold prices may benefit from strong Chinese demand for physical gold as well as continued purchases of gold ETFs by U.S. investors.
Over the longer term, eventual inflationary pressures could bode well for precious metals prices. In addition, gold prices could benefit from emerging markets investors’ investments in gold rather than in their local currencies or securities denominated in their local currencies. At the other end of the spectrum, Chinese investors could continue to diversify their U.S. dollar exposure into gold.
We believe gold-related stocks have better appreciation potential than the metal itself. However, stock selection will remain important because company fundamentals tend to drive stock prices; higher-quality companies with internal growth catalysts, such as effective execution of business plans and mining successes, are most likely to outperform. We also favor production companies over exploration or development firms because production companies are more established, generally have positive cash flow, and are at less risk of needing to raise capital.
Please see footnotes on page 7.
| | | | |
| 10 | | Wells Fargo Precious Metals Fund | | Fund expenses (unaudited) |
As a shareholder of the Fund, you incur two types of costs: (1) transaction costs, including sales charges (loads) on purchase payments and contingent deferred sales charges (if any) on redemptions and (2) ongoing costs, including management fees, distribution (12b-1) and/or shareholder servicing fees, and other Fund expenses. This example is intended to help you understand your ongoing costs (in dollars) of investing in the Fund and to compare these costs with the ongoing costs of investing in other mutual funds.
The example is based on an investment of $1,000 invested at the beginning of the six-month period and held for the entire period from October 1, 2015 to March 31, 2016.
Actual expenses
The “Actual” line of the table below provides information about actual account values and actual expenses. You may use the information in this line, together with the amount you invested, to estimate the expenses that you paid over the period. Simply divide your account value by $1,000 (for example, an $8,600 account value divided by $1,000 = 8.6), then multiply the result by the number in the “Actual” line under the heading entitled “Expenses paid during period” for your applicable class of shares to estimate the expenses you paid on your account during this period.
Hypothetical example for comparison purposes
The “Hypothetical” line of the table below provides information about hypothetical account values and hypothetical expenses based on the Fund’s actual expense ratio and an assumed rate of return of 5% per year before expenses, which is not the Fund’s actual return. The hypothetical account values and expenses may not be used to estimate the actual ending account balance or expenses you paid for the period. You may use this information to compare the ongoing costs of investing in the Fund and other funds. To do so, compare this 5% hypothetical example with the 5% hypothetical examples that appear in the shareholder reports of the other funds.
Please note that the expenses shown in the table are meant to highlight your ongoing costs only and do not reflect any transactional costs, such as sales charges (loads) and contingent deferred sales charges. Therefore, the “Hypothetical” line of the table is useful in comparing ongoing costs only and will not help you determine the relative total costs of owning different funds. In addition, if these transactional costs were included, your costs would have been higher.
| | | | | | | | | | | | | | | | |
| | | Beginning account value 10-1-2015 | | | Ending account value 3-31-2016 | | | Expenses paid during the period¹ | | | Net annualized expense ratio | |
Class A | | | | | | | | | | | | | | | | |
Actual | | $ | 1,000.00 | | | $ | 1,401.71 | | | $ | 6.61 | | | | 1.10 | % |
Hypothetical (5% return before expenses) | | $ | 1,000.00 | | | $ | 1,019.50 | | | $ | 5.56 | | | | 1.10 | % |
Class B | | | | | | | | | | | | | | | | |
Actual | | $ | 1,000.00 | | | $ | 1,396.12 | | | $ | 11.09 | | | | 1.85 | % |
Hypothetical (5% return before expenses) | | $ | 1,000.00 | | | $ | 1,015.75 | | | $ | 9.33 | | | | 1.85 | % |
Class C | | | | | | | | | | | | | | | | |
Actual | | $ | 1,000.00 | | | $ | 1,396.35 | | | $ | 11.09 | | | | 1.85 | % |
Hypothetical (5% return before expenses) | | $ | 1,000.00 | | | $ | 1,015.75 | | | $ | 9.33 | | | | 1.85 | % |
Administrator Class | | | | | | | | | | | | | | | | |
Actual | | $ | 1,000.00 | | | $ | 1,402.81 | | | $ | 5.77 | | | | 0.96 | % |
Hypothetical (5% return before expenses) | | $ | 1,000.00 | | | $ | 1,020.20 | | | $ | 4.85 | | | | 0.96 | % |
Institutional Class | | | | | | | | | | | | | | | | |
Actual | | $ | 1,000.00 | | | $ | 1,403.63 | | | $ | 4.81 | | | | 0.80 | % |
Hypothetical (5% return before expenses) | | $ | 1,000.00 | | | $ | 1,021.00 | | | $ | 4.04 | | | | 0.80 | % |
| 1 | Expenses paid is equal to the annualized expense ratio of each class multiplied by the average account value over the period, multiplied by the number of days in the most recent fiscal half-year divided by the number of days in the fiscal year (to reflect the one-half-year period). |
| | | | | | |
| Consolidated portfolio of investments—March 31, 2016 | | Wells Fargo Precious Metals Fund | | | 11 | |
| | | | | | | | | | | | |
| Security name | | | | | | Shares | | | Value | |
| | | | |
Common Stocks: 91.69% | | | | | | | | | | | | |
| | | | |
| Australia: 3.15% | | | | | | | | | | | | |
Newcrest Mining Limited (Materials, Metals & Mining) † | | | | | | | 888,440 | | | $ | 11,550,334 | |
| | | | | | | | | | | | |
| | | | |
| Canada: 60.59% | | | | | | | | | | | | |
Agnico-Eagle Mines Limited (Materials, Metals & Mining) | | | | | | | 266,370 | | | | 9,637,518 | |
Agnico-Eagle Mines Limited-Legend Shares (Materials, Metals & Mining) | | | | | | | 35,000 | | | | 1,265,600 | |
Agnico-Eagle Mines Limited-U.S. Exchange Traded Shares (Materials, Metals & Mining) | | | | | | | 540,164 | | | | 19,532,330 | |
Alamos Gold Incorporated Class A (Materials, Metals & Mining) | | | | | | | 1,738,980 | | | | 9,212,075 | |
AuRico Metals Incorporated (Materials, Metals & Mining) † | | | | | | | 610,742 | | | | 352,690 | |
B2Gold Corporation (Materials, Metals & Mining) † | | | | | | | 5,590,000 | | | | 9,296,939 | |
Barrick Gold Corporation (Materials, Metals & Mining) | | | | | | | 1,034,083 | | | | 14,042,847 | |
Centerra Gold Incorporated (Materials, Metals & Mining) | | | | | | | 460,000 | | | | 2,135,746 | |
Centerra Gold Incorporated (Materials, Metals & Mining) 144A | | | | | | | 350,000 | | | | 1,625,024 | |
Detour Gold Corporation (Materials, Metals & Mining) † | | | | | | | 491,057 | | | | 7,732,139 | |
Detour Gold Corporation (Materials, Metals & Mining) †144A | | | | | | | 525,000 | | | | 8,266,603 | |
Detour Gold Corporation-Legend Shares (Materials, Metals & Mining) † | | | | | | | 90,000 | | | | 1,417,132 | |
Eldorado Gold Corporation (Materials, Metals & Mining) | | | | | | | 2,226,044 | | | | 6,993,078 | |
Entree Gold Incorporated-Legend Shares (Materials, Metals & Mining)(i) | | | | | | | 1,275,000 | | | | 377,960 | |
Exeter Resource Corporation-Legend Shares (Materials, Metals & Mining) | | | | | | | 585,000 | | | | 324,312 | |
Franco-Nevada Corporation (Materials, Metals & Mining) 144A | | | | | | | 142,500 | | | | 8,751,338 | |
Franco-Nevada Corporation (Materials, Metals & Mining) | | | | | | | 112,000 | | | | 6,878,244 | |
Goldcorp Incorporated (Materials, Metals & Mining) | | | | | | | 937,254 | | | | 15,205,345 | |
Goldcorp Incorporated-U.S. Exchange Traded Shares (Materials, Metals & Mining) | | | | | | | 646,694 | | | | 10,495,844 | |
Kinross Gold Corporation (Materials, Metals & Mining) † | | | | | | | 4,850,553 | | | | 16,545,101 | |
Lake Shore Gold Corporation (Materials, Metals & Mining) † | | | | | | | 4,600,000 | | | | 6,694,129 | |
Mag Silver Corporation (Materials, Metals & Mining) † | | | | | | | 870,000 | | | | 8,212,666 | |
Mag Silver Corporation-Legend Shares (Materials, Metals & Mining) † | | | | | | | 100,000 | | | | 943,985 | |
Osisko Gold Royalties Limited (Materials, Metals & Mining) | | | | | | | 366,700 | | | | 3,916,172 | |
Platinum Group Metals Limited (Materials, Metals & Mining) † | | | | | | | 345,000 | | | | 1,306,949 | |
Platinum Group Metals Limited-Legend Shares (Materials, Metals & Mining) † | | | | | | | 80,000 | | | | 301,829 | |
Platinum Group Metals Limited-U.S. Exchange Traded Shares (Materials, Metals & Mining) † | | | | | | | 144,000 | | | | 547,200 | |
Semafo Incorporated (Materials, Metals & Mining) † | | | | | | | 3,660,400 | | | | 13,049,203 | |
Silver Wheaton Corporation (Materials, Metals & Mining) | | | | | | | 12,950 | | | | 214,878 | |
Silver Wheaton Corporation-U.S. Exchange Traded Shares (Materials, Metals & Mining) | | | | | | | 605,000 | | | | 10,030,900 | |
Tahoe Resources Incorporated (Materials, Metals & Mining) | | | | | | | 920,000 | | | | 9,223,022 | |
Tahoe Resources Incorporated-Legend Shares (Materials, Metals & Mining) | | | | | | | 280,000 | | | | 2,807,007 | |
Torex Gold Resources Incorporated (Materials, Metals & Mining) † | | | | | | | 2,200,000 | | | | 3,082,964 | |
Torex Gold Resources Incorporated (Materials, Metals & Mining) †144A(i) | | | | | | | 1,850,000 | | | | 2,592,493 | |
Torex Gold Resources Incorporated-Legend Shares (Materials, Metals & Mining) †(i) | | | | | | | 2,662,500 | | | | 3,731,088 | |
Yamana Gold Incorporated (Materials, Metals & Mining) | | | | | | | 1,162,731 | | | | 3,527,361 | |
Yamana Gold Incorporated-U.S. Exchange Traded Shares (Materials, Metals & Mining) | | | | | | | 640,537 | | | | 1,947,232 | |
| | | | |
| | | | | | | | | | | 222,216,943 | |
| | | | | | | | | | | | |
| | | | |
| Peru: 0.61% | | | | | | | | | | | | |
Compania de Minas Buenaventura SA ADR (Materials, Metals & Mining) † | | | | | | | 304,644 | | | | 2,242,180 | |
| | | | | | | | | | | | |
| | | | |
| South Africa: 4.30% | | | | | | | | | | | | |
AngloGold Ashanti Limited ADR (Materials, Metals & Mining) † | | | | | | | 1,150,591 | | | | 15,751,591 | |
| | | | | | | | | | | | |
The accompanying notes are an integral part of these financial statements.
| | | | |
| 12 | | Wells Fargo Precious Metals Fund | | Consolidated portfolio of investments—March 31, 2016 |
| | | | | | | | | | | | | | |
| Security name | | | | | | | Shares | | | Value | |
| | | | |
| United Kingdom: 13.72% | | | | | | | | | | | | | | |
Fresnillo plc (Materials, Metals & Mining) | | | | | | | | | 1,095,000 | | | $ | 14,979,900 | |
Hochschild Mining plc (Materials, Metals & Mining) † | | | | | | | | | 986,470 | | | | 1,303,471 | |
Randgold Resources Limited ADR (Materials, Metals & Mining) | | | | | | | | | 375,000 | | | | 34,053,750 | |
| | | | |
| | | | | | | | | | | | | 50,337,121 | |
| | | | | | | | | | | | | | |
| | | | |
| United States: 9.32% | | | | | | | | | | | | | | |
Newmont Mining Corporation (Materials, Metals & Mining) | | | | | | | | | 708,455 | | | | 18,830,734 | |
Royal Gold Incorporated (Materials, Metals & Mining) | | | | | | | | | 299,436 | | | | 15,358,071 | |
| | | | |
| | | | | | | | | | | | | 34,188,805 | |
| | | | | | | | | | | | | | |
| | | | |
Total Common Stocks (Cost $303,163,086) | | | | | | | | | | | | | 336,286,974 | |
| | | | | | | | | | | | | | |
| | | | |
| | | | | | | | Troy ounces | | | | |
| Commodities: 5.27% | | | | | | | | | | | | | | |
Gold Bullion †** | | | | | | | | | 15,691 | | | | 19,316,430 | |
| | | | | | | | | | | | | | |
| | | | |
Total Commodities (Cost $9,550,295) | | | | | | | | | | | | | 19,316,430 | |
| | | | | | | | | | | | | | |
| | | | |
| | | Yield | | | | | Shares | | | | |
| Short-Term Investments: 2.80% | | | | | | | | | | | | | | |
| | | | |
| Investment Companies: 2.80% | | | | | | | | | | | | | | |
Wells Fargo Cash Investment Money Market Fund Select Class (l)(u) | | | 0.43 | % | | | | | 10,291,007 | | | | 10,291,007 | |
| | | | | | | | | | | | | | |
| | | | |
Total Short-Term Investments (Cost $10,291,007) | | | | | | | | | | | | | 10,291,007 | |
| | | | | | | | | | | | | | |
| | | | | | | | |
| Total investments in securities (Cost $323,004,388) * | | | 99.76 | % | | | 365,894,411 | |
Other assets and liabilities, net | | | 0.24 | | | | 883,466 | |
| | | | | | | | |
| Total net assets | | | 100.00 | % | | $ | 366,777,877 | |
| | | | | | | | |
| † | Non-income-earning security |
| 144A | The security may be resold in transactions exempt from registration, normally to qualified institutional buyers, pursuant to Rule 144A under the Securities Act of 1933. |
| (i) | Illiquid security for which the designation as illiquid is unaudited. |
| ** | Represents an investment held in Wells Fargo Special Investments (Cayman) SPC, the consolidated entity. |
| (l) | The issuer of the security is an affiliated person of the Fund as defined in the Investment Company Act of 1940. |
| (u) | The rate represents the 7-day annualized yield at period end. |
| * | Cost for federal income tax purposes is $341,582,665 and unrealized gains (losses) consists of: |
| | | | |
Gross unrealized gains | | $ | 108,167,719 | |
Gross unrealized losses | | | (83,855,973 | ) |
| | | | |
Net unrealized gains | | $ | 24,311,746 | |
The accompanying notes are an integral part of these financial statements.
| | | | | | |
| Consolidated statement of assets and liabilities—March 31, 2016 | | Wells Fargo Precious Metals Fund | | | 13 | |
| | | | |
| | | | |
| |
Assets | | | | |
Investments | | | | |
In unaffiliated securities, at value (cost $303,163,086) | | $ | 336,286,974 | |
In commodities, at value (cost $9,550,295) | | | 19,316,430 | |
In affiliated securities, at value (cost $10,291,007) | | | 10,291,007 | |
| | | | |
Total investments, at value (cost $323,004,388) | | | 365,894,411 | |
Cash | | | 56,585 | |
Foreign currency, at value (cost $596,028) | | | 595,912 | |
Receivable for Fund shares sold | | | 1,314,864 | |
Receivable for dividends | | | 363,807 | |
Prepaid expenses and other assets | | | 69,876 | |
| | | | |
Total assets | | | 368,295,455 | |
| | | | |
| |
Liabilities | | | | |
Payable for Fund shares redeemed | | | 1,081,175 | |
Management fee payable | | | 169,255 | |
Distribution fees payable | | | 34,006 | |
Administration fees payable | | | 59,103 | |
Accrued expenses and other liabilities | | | 174,039 | |
| | | | |
Total liabilities | | | 1,517,578 | |
| | | | |
Total net assets | | $ | 366,777,877 | |
| | | | |
| |
NET ASSETS CONSIST OF | | | | |
Paid-in capital | | $ | 488,925,512 | |
Undistributed net investment income | | | 2,431,266 | |
Accumulated net realized losses on investments | | | (167,468,930 | ) |
Net unrealized gains on investments | | | 42,890,029 | |
| | | | |
Total net assets | | $ | 366,777,877 | |
| | | | |
| |
COMPUTATION OF NET ASSET VALUE AND OFFERING PRICE PER SHARE | | | | |
Net assets – Class A | | $ | 236,309,683 | |
Shares outstanding – Class A1 | | | 7,219,211 | |
Net asset value per share – Class A | | | $32.73 | |
Maximum offering price per share – Class A2 | | | $34.73 | |
Net assets – Class B | | $ | 1,550,174 | |
Shares outstanding – Class B1 | | | 52,538 | |
Net asset value per share – Class B | | | $29.51 | |
Net assets – Class C | | $ | 52,648,341 | |
Shares outstanding – Class C1 | | | 1,808,946 | |
Net asset value per share – Class C | | | $29.10 | |
Net assets – Administrator Class | | $ | 16,114,148 | |
Shares outstanding – Administrator Class1 | | | 488,576 | |
Net asset value per share – Administrator Class | | | $32.98 | |
Net assets – Institutional Class | | | $60,155,531 | |
Shares outstanding – Institutional Class1 | | | 1,811,410 | |
Net asset value per share – Institutional Class | | | $33.21 | |
| 1 | The Fund has an unlimited number of authorized shares. |
| 2 | Maximum offering price is computed as 100/94.25 of net asset value. On investments of $50,000 or more, the offering price is reduced. |
The accompanying notes are an integral part of these financial statements.
| | | | |
| 14 | | Wells Fargo Precious Metals Fund | | Consolidated statement of operations—year eded March 31, 2016 |
| | | | |
| | | | |
| |
Investment income | | | | |
Dividends (net of foreign withholding taxes of $277,282) | | $ | 2,587,835 | |
Income from affiliated securities | | | 14,042 | |
Interest | | | 184 | |
| | | | |
Total investment income | | | 2,602,061 | |
| | | | |
| |
Expenses | | | | |
Management fee | | | 1,960,041 | |
Administration fees | | | | |
Class A | | | 430,473 | |
Class B | | | 4,297 | |
Class C | | | 108,429 | |
Administrator Class | | | 20,458 | |
Institutional Class | | | 49,906 | |
Shareholder servicing fees | | | | |
Class A | | | 479,692 | |
Class B | | | 4,724 | |
Class C | | | 120,080 | |
Administrator Class | | | 42,648 | |
Distribution fees | | | | |
Class B | | | 14,173 | |
Class C | | | 360,242 | |
Custody and accounting fees | | | 43,528 | |
Professional fees | | | 69,396 | |
Registration fees | | | 62,191 | |
Shareholder report expenses | | | 98,029 | |
Trustees’ fees and expenses | | | 17,010 | |
Other fees and expenses | | | 41,666 | |
| | | | |
Total expenses | | | 3,926,983 | |
Less: Fee waivers and/or expense reimbursements | | | (387,348 | ) |
| | | | |
Net expenses | | | 3,539,635 | |
| | | | |
Net investment loss | | | (937,574 | ) |
| | | | |
| |
REALIZED AND UNREALIZED GAINS (LOSSES) ON INVESTMENTS | | | | |
| |
Net realized gains (losses) on: | | | | |
Unaffiliated securities | | | (16,254,516 | ) |
Commodities | | | 660,379 | |
| | | | |
Net realized losses on investments | | | (15,594,137 | ) |
| | | | |
| |
Net change in unrealized gains (losses) on: | | | | |
Unaffiliated securities | | | 55,899,684 | |
Commodities | | | (22,925 | ) |
| | | | |
Net change in unrealized gains (losses) on investments | | | 55,876,759 | |
| | | | |
Net realized and unrealized gains (losses) on investments | | | 40,282,622 | |
| | | | |
Net increase in net assets resulting from operations | | $ | 39,345,048 | |
| | | | |
The accompanying notes are an integral part of these financial statements.
| | | | | | |
| Consolidated statement of changes in net assets | | Wells Fargo Precious Metals Fund | | | 15 | |
| | | | | | | | | | | | | | | | |
| | | Year ended
March 31, 2016 | | | Year ended
March 31, 2015 | |
| | | |
Operations | | | | | | | | | | | | |
Net investment loss | | | | | | $ | (937,574 | ) | | | | | | $ | (1,850,832 | ) |
Net realized losses on investments | | | | | | | (15,594,137 | ) | | | | | | | (8,544,605 | ) |
Net change in unrealized gains (losses) on investments | | | | | | | 55,876,759 | | | | | | | | (84,220,889 | ) |
| | | | |
Net increase (decrease) in net assets resulting from operations | | | | | | | 39,345,048 | | | | | | | | (94,616,326 | ) |
| | | | |
| | | |
Capital share transactions | | | Shares | | | | Shares | | | | | |
Proceeds from shares sold | | | | | | | | | | | | | | | | |
Class A | | | 2,573,064 | | | | 68,840,471 | | | | 2,090,045 | | | | 74,515,784 | |
Class B | | | 564 | | | | 12,571 | | | | 1,003 | | | | 31,925 | |
Class C | | | 240,087 | | | | 5,729,445 | | | | 216,694 | | | | 6,828,594 | |
Administrator Class | | | 339,710 | | | | 9,337,859 | | | | 759,290 | | | | 28,093,290 | |
Institutional Class | | | 1,329,839 | | | | 35,409,488 | | | | 1,064,094 | | | | 38,355,131 | |
| | | | |
| | | | | | | 119,329,834 | | | | | | | | 147,824,724 | |
| | | | |
Payment for shares redeemed | | | | | | | | | | | | | | | | |
Class A | | | (2,647,478 | ) | | | (70,141,452 | ) | | | (3,006,178 | ) | | | (108,551,283 | ) |
Class B | | | (54,779 | ) | | | (1,360,269 | ) | | | (111,993 | ) | | | (3,694,954 | ) |
Class C | | | (705,445 | ) | | | (16,527,142 | ) | | | (810,107 | ) | | | (24,887,063 | ) |
Administrator Class | | | (602,465 | ) | | | (15,285,251 | ) | | | (883,304 | ) | | | (29,469,517 | ) |
Institutional Class | | | (985,059 | ) | | | (26,874,701 | ) | | | (733,544 | ) | | | (25,611,256 | ) |
| | | | |
| | | | | | | (130,188,815 | ) | | | | | | | (192,214,073 | ) |
| | | | |
Net decrease in net assets resulting from capital share transactions | | | | | | | (10,858,981 | ) | | | | | | | (44,389,349 | ) |
| | | | |
Total increase (decrease) in net assets | | | | | | | 28,486,067 | | | | | | | | (139,005,675 | ) |
| | | | |
| | |
Net assets | | | | | | | | |
Beginning of period | | | | | | | 338,291,810 | | | | | | | | 477,297,485 | |
| | | | |
End of period | | | | | | $ | 366,777,877 | | | | | | | $ | 338,291,810 | |
| | | | |
Undistributed (accumulated) net investment income (loss) | | | | | | $ | 2,431,266 | | | | | | | $ | (594,242 | ) |
| | | | |
The accompanying notes are an integral part of these financial statements.
| | | | |
| 16 | | Wells Fargo Precious Metals Fund | | Consolidated financial highlights |
(For a share outstanding throughout each period)
| | | | | | | | | | | | | | | | | | | | |
| | | Year ended March 31 | |
| CLASS A | | 2016 | | | 2015 | | | 20141 | | | 20131 | | | 20121 | |
Net asset value, beginning of period | | | $28.99 | | | | $36.65 | | | | $53.59 | | | | $70.30 | | | | $85.64 | |
Net investment income (loss) | | | (0.05 | ) | | | (0.11 | )2 | | | 0.05 | 2 | | | (0.01 | )2 | | | (0.19 | )2 |
Net realized and unrealized gains (losses) on investments | | | 3.79 | | | | (7.55 | ) | | | (16.78 | ) | | | (14.47 | ) | | | (13.39 | ) |
| | | | | | | | | | | | | | | | | | | | |
Total from investment operations | | | 3.74 | | | | (7.66 | ) | | | (16.73 | ) | | | (14.48 | ) | | | (13.58 | ) |
Distributions to shareholders from | | | | | | | | | | | | | | | | | | | | |
Net investment income | | | 0.00 | | | | 0.00 | | | | 0.00 | | | | 0.00 | | | | (1.27 | ) |
Net realized gains | | | 0.00 | | | | 0.00 | | | | (0.21 | ) | | | (2.23 | ) | | | (0.49 | ) |
| | | | | | | | | | | | | | | | | | | | |
Total distributions to shareholders | | | 0.00 | | | | 0.00 | | | | (0.21 | ) | | | (2.23 | ) | | | (1.76 | ) |
Net asset value, end of period | | | $32.73 | | | | $28.99 | | | | $36.65 | | | | $53.59 | | | | $70.30 | |
Total return3 | | | 12.90 | % | | | (20.90 | )% | | | (31.17 | )% | | | (21.14 | )% | | | (15.95 | )% |
Ratios to average net assets (annualized) | | | | | | | | | | | | | | | | | | | | |
Gross expenses | | | 1.23 | % | | | 1.23 | % | | | 1.22 | % | | | 1.18 | % | | | 1.14 | % |
Net expenses | | | 1.10 | % | | | 1.10 | % | | | 1.09 | % | | | 1.09 | % | | | 1.09 | % |
Net investment income (loss) | | | (0.24 | )% | | | (0.30 | )% | | | 0.12 | % | | | (0.02 | )% | | | (0.24 | )% |
Supplemental data | | | | | | | | | | | | | | | | | | | | |
Portfolio turnover rate | | | 18 | %4 | | | 9 | %4 | | | 16 | % | | | 6 | % | | | 4 | % |
Net assets, end of period (000s omitted) | | | $236,310 | | | | $211,477 | | | | $300,906 | | | | $498,874 | | | | $699,773 | |
| 1 | Amounts do not reflect the consolidated financial results of its wholly-owned subsidiary. |
| 2 | Calculated based upon average shares outstanding |
| 3 | Total return calculations do not include any sales charges. |
| 4 | Portfolio turnover rate includes the purchases and sales transactions of its wholly-owned subsidiary. |
The accompanying notes are an integral part of these financial statements.
| | | | | | |
| Consolidated financial highlights | | Wells Fargo Precious Metals Fund | | | 17 | |
(For a share outstanding throughout each period)
| | | | | | | | | | | | | | | | | | | | |
| | | Year ended March 31 | |
| CLASS B | | 2016 | | | 2015 | | | 20141 | | | 20131 | | | 20121 | |
Net asset value, beginning of period | | | $26.33 | | | | $33.54 | | | | $49.44 | | | | $65.53 | | | | $79.20 | |
Net investment loss | | | (0.25 | )2 | | | (0.36 | )2 | | | (0.22 | )2 | | | (0.47 | )2 | | | (0.77 | )2 |
Net realized and unrealized gains (losses) on investments | | | 3.43 | | | | (6.85 | ) | | | (15.47 | ) | | | (13.39 | ) | | | (12.29 | ) |
| | | | | | | | | | | | | | | | | | | | |
Total from investment operations | | | 3.18 | | | | (7.21 | ) | | | (15.69 | ) | | | (13.86 | ) | | | (13.06 | ) |
Distributions to shareholders from | | | | | | | | | | | | | | | | | | | | |
Net investment income | | | 0.00 | | | | 0.00 | | | | 0.00 | | | | 0.00 | | | | (0.12 | ) |
Net realized gains | | | 0.00 | | | | 0.00 | | | | (0.21 | ) | | | (2.23 | ) | | | (0.49 | ) |
| | | | | | | | | | | | | | | | | | | | |
Total distributions to shareholders | | | 0.00 | | | | 0.00 | | | | (0.21 | ) | | | (2.23 | ) | | | (0.61 | ) |
Net asset value, end of period | | | $29.51 | | | | $26.33 | | | | $33.54 | | | | $49.44 | | | | $65.53 | |
Total return3 | | | 12.08 | %4 | | | (21.50 | )% | | | (31.68 | )% | | | (21.74 | )% | | | (16.58 | )% |
Ratios to average net assets (annualized) | | | | | | | | | | | | | | | | | | | | |
Gross expenses | | | 1.99 | % | | | 1.98 | % | | | 1.96 | % | | | 1.93 | % | | | 1.89 | % |
Net expenses | | | 1.85 | % | | | 1.85 | % | | | 1.84 | % | | | 1.84 | % | | | 1.84 | % |
Net investment loss | | | (1.01 | )% | | | (1.08 | )% | | | (0.60 | )% | | | (0.78 | )% | | | (1.01 | )% |
Supplemental data | | | | | | | | | | | | | | | | | | | | |
Portfolio turnover rate | | | 18 | %5 | | | 9 | %5 | | | 16 | % | | | 6 | % | | | 4 | % |
Net assets, end of period (000s omitted) | | | $1,550 | | | | $2,811 | | | | $7,304 | | | | $20,570 | | | | $39,046 | |
| 1 | Amounts do not reflect the consolidated financial results of its wholly-owned subsidiary. |
| 2 | Calculated based upon average shares outstanding |
| 3 | Total return calculations do not include any sales charges. |
| 4 | Total return reflects adjustments to conform with generally accepted accounting principles. |
| 5 | Portfolio turnover rate includes the purchases and sales transactions of its wholly-owned subsidiary. |
The accompanying notes are an integral part of these financial statements.
| | | | |
| 18 | | Wells Fargo Precious Metals Fund | | Consolidated financial highlights |
(For a share outstanding throughout each period)
| | | | | | | | | | | | | | | | | | | | |
| | | Year ended March 31 | |
| CLASS C | | 2016 | | | 2015 | | | 20141 | | | 20131 | | | 20121 | |
Net asset value, beginning of period | | | $25.97 | | | | $33.08 | | | | $48.76 | | | | $64.66 | | | | $78.43 | |
Net investment loss | | | (0.24 | )2 | | | (0.35 | )2 | | | (0.22 | )2 | | | (0.46 | )2 | | | (0.75 | )2 |
Net realized and unrealized gains (losses) on investments | | | 3.37 | | | | (6.76 | ) | | | (15.25 | ) | | | (13.21 | ) | | | (12.18 | ) |
| | | | | | | | | | | | | | | | | | | | |
Total from investment operations | | | 3.13 | | | | (7.11 | ) | | | (15.47 | ) | | | (13.67 | ) | | | (12.93 | ) |
Distributions to shareholders from | | | | | | | | | | | | | | | | | | | | |
Net investment income | | | 0.00 | | | | 0.00 | | | | 0.00 | | | | 0.00 | | | | (0.35 | ) |
Net realized gains | | | 0.00 | | | | 0.00 | | | | (0.21 | ) | | | (2.23 | ) | | | (0.49 | ) |
| | | | | | | | | | | | | | | | | | | | |
Total distributions to shareholders | | | 0.00 | | | | 0.00 | | | | (0.21 | ) | | | (2.23 | ) | | | (0.84 | ) |
Net asset value, end of period | | | $29.10 | | | | $25.97 | | | | $33.08 | | | | $48.76 | | | | $64.66 | |
Total return3 | | | 12.05 | % | | | (21.49 | )% | | | (31.67 | )% | | | (21.74 | )% | | | (16.58 | )% |
Ratios to average net assets (annualized) | | | | | | | | | | | | | | | | | | | | |
Gross expenses | | | 1.99 | % | | | 1.98 | % | | | 1.97 | % | | | 1.93 | % | | | 1.89 | % |
Net expenses | | | 1.85 | % | | | 1.85 | % | | | 1.84 | % | | | 1.84 | % | | | 1.84 | % |
Net investment loss | | | (0.99 | )% | | | (1.06 | )% | | | (0.62 | )% | | | (0.77 | )% | | | (0.99 | )% |
Supplemental data | | | | | | | | | | | | | | | | | | | | |
Portfolio turnover rate | | | 18 | %4 | | | 9 | %4 | | | 16 | % | | | 6 | % | | | 4 | % |
Net assets, end of period (000s omitted) | | | $52,648 | | | | $59,074 | | | | $94,865 | | | | $191,782 | | | | $290,513 | |
| 1 | Amounts do not reflect the consolidated financial results of its wholly-owned subsidiary. |
| 2 | Calculated based upon average shares outstanding |
| 3 | Total return calculations do not include any sales charges. |
| 4 | Portfolio turnover rate includes the purchases and sales transactions of its wholly-owned subsidiary. |
The accompanying notes are an integral part of these financial statements.
| | | | | | |
| Consolidated financial highlights | | Wells Fargo Precious Metals Fund | | | 19 | |
(For a share outstanding throughout each period)
| | | | | | | | | | | | | | | | | | | | |
| | | Year ended March 31 | |
| ADMINISTRATOR CLASS | | 2016 | | | 2015 | | | 20141 | | | 20131 | | | 20121 | |
Net asset value, beginning of period | | | $29.17 | | | | $36.82 | | | | $53.75 | | | | $70.42 | | | | $85.70 | |
Net investment income (loss) | | | (0.03 | )2 | | | (0.06 | )2 | | | 0.10 | 2 | | | 0.08 | 2 | | | (0.06 | )2 |
Net realized and unrealized gains (losses) on investments | | | 3.84 | | | | (7.59 | ) | | | (16.82 | ) | | | (14.52 | ) | | | (13.41 | ) |
| | | | | | | | | | | | | | | | | | | | |
Total from investment operations | | | 3.81 | | | | (7.65 | ) | | | (16.72 | ) | | | (14.44 | ) | | | (13.47 | ) |
Distributions to shareholders from | | | | | | | | | | | | | | | | | | | | |
Net investment income | | | 0.00 | | | | 0.00 | | | | 0.00 | | | | 0.00 | | | | (1.32 | ) |
Net realized gains | | | 0.00 | | | | 0.00 | | | | (0.21 | ) | | | (2.23 | ) | | | (0.49 | ) |
| | | | | | | | | | | | | | | | | | | | |
Total distributions to shareholders | | | 0.00 | | | | 0.00 | | | | (0.21 | ) | | | (2.23 | ) | | | (1.81 | ) |
Net asset value, end of period | | | $32.98 | | | | $29.17 | | | | $36.82 | | | | $53.75 | | | | $70.42 | |
Total return | | | 13.06 | % | | | (20.78 | )% | | | (31.06 | )% | | | (21.05 | )% | | | (15.81 | )% |
Ratios to average net assets (annualized) | | | | | | | | | | | | | | | | | | | | |
Gross expenses | | | 1.13 | % | | | 1.07 | % | | | 1.04 | % | | | 1.01 | % | | | 0.94 | % |
Net expenses | | | 0.96 | % | | | 0.96 | % | | | 0.95 | % | | | 0.95 | % | | | 0.92 | % |
Net investment income (loss) | | | (0.10 | )% | | | (0.17 | )% | | | 0.26 | % | | | 0.13 | % | | | (0.08 | )% |
Supplemental data | | | | | | | | | | | | | | | | | | | | |
Portfolio turnover rate | | | 18 | %3 | | | 9 | %3 | | | 16 | % | | | 6 | % | | | 4 | % |
Net assets, end of period (000s omitted) | | | $16,114 | | | | $21,917 | | | | $32,230 | | | | $53,142 | | | | $53,497 | |
| 1 | Amounts do not reflect the consolidated financial results of its wholly-owned subsidiary. |
| 2 | Calculated based upon average shares outstanding |
| 3 | Portfolio turnover rate includes the purchases and sales transactions of its wholly-owned subsidiary. |
The accompanying notes are an integral part of these financial statements.
| | | | |
| 20 | | Wells Fargo Precious Metals Fund | | Consolidated financial highlights |
(For a share outstanding throughout each period)
| | | | | | | | | | | | | | | | | | | | |
| | | Year ended March 31 | |
| INSTITUTIONAL CLASS | | 2016 | | | 2015 | | | 20141 | | | 20131 | | | 20121 | |
Net asset value, beginning of period | | | $29.33 | | | | $36.96 | | | | $53.87 | | | | $70.43 | | | | $85.84 | |
Net investment income | | | 0.02 | 2 | | | 0.01 | 2 | | | 0.16 | 2 | | | 0.19 | | | | 0.12 | |
Net realized and unrealized gains (losses) on investments | | | 3.86 | | | | (7.64 | ) | | | (16.86 | ) | | | (14.52 | ) | | | (13.45 | ) |
| | | | | | | | | | | | | | | | | | | | |
Total from investment operations | | | 3.88 | | | | (7.63 | ) | | | (16.70 | ) | | | (14.33 | ) | | | (13.33 | ) |
Distributions to shareholders from | | | | | | | | | | | | | | | | | | | | |
Net investment income | | | 0.00 | | | | 0.00 | | | | 0.00 | | | | 0.00 | | | | (1.59 | ) |
Net realized gains | | | 0.00 | | | | 0.00 | | | | (0.21 | ) | | | (2.23 | ) | | | (0.49 | ) |
| | | | | | | | | | | | | | | | | | | | |
Total distributions to shareholders | | | 0.00 | | | | 0.00 | | | | (0.21 | ) | | | (2.23 | ) | | | (2.08 | ) |
Net asset value, end of period | | | $33.21 | | | | $29.33 | | | | $36.96 | | | | $53.87 | | | | $70.43 | |
Total return | | | 13.23 | % | | | (20.64 | )% | | | (30.95 | )% | | | (20.89 | )% | | | (15.64 | )% |
Ratios to average net assets (annualized) | | | | | | | | | | | | | | | | | | | | |
Gross expenses | | | 0.88 | % | | | 0.80 | % | | | 0.79 | % | | | 0.75 | % | | | 0.71 | % |
Net expenses | | | 0.80 | % | | | 0.79 | % | | | 0.78 | % | | | 0.75 | % | | | 0.71 | % |
Net investment income | | | 0.06 | % | | | 0.03 | % | | | 0.41 | % | | | 0.32 | % | | | 0.14 | % |
Supplemental data | | | | | | | | | | | | | | | | | | | | |
Portfolio turnover rate | | | 18 | %3 | | | 9 | %3 | | | 16 | % | | | 6 | % | | | 4 | % |
Net assets, end of period (000s omitted) | | | $60,156 | | | | $43,014 | | | | $41,993 | | | | $59,349 | | | | $78,846 | |
| 1 | Amounts do not reflect the consolidated financial results of its wholly-owned subsidiary. |
| 2 | Calculated based upon average shares outstanding |
| 3 | Portfolio turnover rate includes the purchases and sales transactions of its wholly-owned subsidiary. |
The accompanying notes are an integral part of these financial statements.
| | | | | | |
| Notes to consolidated financial statements | | Wells Fargo Precious Metals Fund | | | 21 | |
1. ORGANIZATION
Wells Fargo Funds Trust (the “Trust”), a Delaware statutory trust organized on March 10, 1999, is an open-end management investment company registered under the Investment Company Act of 1940, as amended (the “1940 Act”). As an investment company, the Trust follows the accounting and reporting guidance in Financial Accounting Standards Board (“FASB”) Accounting Standards Codification Topic 946, Financial Services – Investment Companies. These financial statements report on the Wells Fargo Precious Metals Fund (the “Fund”) which is a non-diversified series of the Trust.
2. INVESTMENT IN SUBSIDIARY
The Fund invests in precious metals and minerals through Wells Fargo Special Investments (Cayman) SPC (the “Subsidiary”), a wholly owned subsidiary incorporated on May 3, 2005 under the laws of the Cayman Islands as an exempted segregated portfolio company with limited liability. As of March 31, 2016, the Subsidiary held $19,316,430 in gold bullion representing 99.99% of its net assets. The Fund is the sole shareholder of the Subsidiary. As of March 31, 2016, the Fund held $19,317,430 in the Subsidiary, representing 5.27% of the Fund’s net assets.
The consolidated financial statements of the Fund include the financial results of its wholly-owned subsidiary. The Consolidated Portfolio of Investments includes positions of the Fund and the Subsidiary and the consolidated financial statements include the accounts of the Fund and the Subsidiary. Accordingly, all interfund balances and transactions between the Fund and the Subsidiary have been eliminated in consolidation.
3. SIGNIFICANT ACCOUNTING POLICIES
The following significant accounting policies, which are consistently followed in the preparation of the financial statements of the Fund, are in conformity with U.S. generally accepted accounting principles which require management to make estimates and assumptions that affect the reported amounts of assets and liabilities, disclosure of contingent assets and liabilities at the date of the financial statements, and the reported amounts of revenues and expenses during the reporting period. Actual results could differ from those estimates.
Securities valuation
All investments are valued each business day as of the close of regular trading on the New York Stock Exchange (generally 4 p.m. Eastern Time), although the Fund may deviate from this calculation time under unusual or unexpected circumstances.
Equity securities that are listed on a foreign or domestic exchange or market are valued at the official closing price or, if none, the last sales price. If no sale occurs on the principal exchange or market that day, the prior day’s price will be deemed “stale” and a fair value price will be determined in accordance with the Fund’s Valuation Procedures.
Investments in commodities are valued at their last traded price.
The values of securities denominated in foreign currencies are translated into U.S. dollars at rates provided by an independent foreign currency pricing source at a time each business day specified by the Management Valuation Team of Wells Fargo Funds Management, LLC (“Funds Management”).
Many securities markets and exchanges outside the U.S. close prior to the close of the New York Stock Exchange and therefore may not fully reflect trading or events that occur after the close of the principal exchange in which the foreign securities are traded, but before the close of the New York Stock Exchange. If such trading or events are expected to materially affect the value of such securities, then fair value pricing procedures approved by the Board of Trustees of the Fund are applied. These procedures take into account multiple factors including movements in U.S. securities markets after foreign exchanges close. Foreign securities that are fair valued under these procedures are categorized as Level 2 and the application of these procedures may result in transfers between Level 1 and Level 2. Depending on market activity, such fair valuations may be frequent. Such fair value pricing may result in net asset values that are higher or lower than net asset values based on the last reported sales price or latest quoted bid price. On March 31, 2016, such fair value pricing was not used in pricing foreign securities.
Investments in registered open-end investment companies are valued at net asset value.
Investments which are not valued using any of the methods discussed above are valued at their fair value, as determined in good faith by the Board of Trustees. The Board of Trustees has established a Valuation Committee comprised of the Trustees and has delegated to it the authority to take any actions regarding the valuation of portfolio securities that the Valuation Committee deems necessary or appropriate, including determining the fair value of portfolio securities, unless the determination has been delegated to the Management Valuation Team. The Board of Trustees retains the authority to
| | | | |
| 22 | | Wells Fargo Precious Metals Fund | | Notes to consolidated financial statements |
make or ratify any valuation decisions or approve any changes to the Valuation Procedures as it deems appropriate. On a quarterly basis, the Board of Trustees receives reports on any valuation actions taken by the Valuation Committee or the Management Valuation Team which may include items for ratification.
Valuations of fair valued securities are compared to the next actual sales price when available, or other appropriate market values, to assess the continued appropriateness of the fair valuation methodologies used. These securities are fair valued on a day-to-day basis, taking into consideration changes to appropriate market information and any significant changes to the inputs considered in the valuation process until there is a readily available price provided on an exchange or by an independent pricing service. Valuations received from an independent pricing service or independent broker-dealer quotes are periodically validated by comparisons to most recent trades and valuations provided by other independent pricing services in addition to the review of prices by the manager and/or subadviser. Unobservable inputs used in determining fair valuations are identified based on the type of security, taking into consideration factors utilized by market participants in valuing the investment, knowledge about the issuer and the current market environment.
Foreign currency translation
The accounting records of the Fund are maintained in U.S. dollars. The values of other assets and liabilities denominated in foreign currencies are translated into U.S. dollars at rates provided by an independent foreign currency pricing source at a time each business day specified by the Management Valuation Team. Purchases and sales of securities, and income and expenses are converted at the rate of exchange on the respective dates of such transactions. Net realized foreign exchange gains or losses arise from sales of foreign currencies, currency gains or losses realized between the trade and settlement dates on securities transactions, and the difference between the amounts of dividends, interest and foreign withholding taxes recorded and the U.S. dollar equivalent of the amounts actually paid or received. Net unrealized foreign exchange gains and losses arise from changes in the fair value of assets and liabilities other than investments in securities resulting from changes in exchange rates. The changes in net assets arising from changes in exchange rates and the changes in net assets resulting from changes in market prices of securities are not separately presented. Such changes are included in net realized and unrealized gains or losses from investments.
Security transactions and income recognition
Securities transactions are recorded on a trade date basis. Realized gains or losses are recorded on the basis of identified cost.
Dividend income is recognized on the ex-dividend date, except for certain dividends from foreign securities, which are recorded as soon as the custodian verifies the ex-dividend date. Dividend income from foreign securities is recorded net of foreign taxes withheld where recovery of such taxes is not assured.
Distributions to shareholders
Distributions to shareholders from net investment income and net realized gains, if any, are recorded on the ex-dividend date. Such distributions are determined in conformity with federal income tax regulations, which may differ in amount or character from net investment income and realized gains recognized for purposes of U.S. generally accepted accounting principles.
Federal and other taxes
The Fund intends to continue to qualify as a regulated investment company by distributing substantially all of its investment company taxable income and any net realized capital gains (after reduction for capital loss carryforwards) sufficient to relieve it from all, or substantially all, federal income taxes. Accordingly, no provision for federal income taxes was required.
The Subsidiary is classified as a controlled foreign corporation under Subchapter N of the Internal Revenue Code. Therefore, the Fund is required to increase its taxable income by its share of the Subsidiary’s income. Net investment losses of the Subsidiary cannot be deducted by the Fund in the current period nor carried forward to offset taxable income in future periods.
The Fund’s income and federal excise tax returns and all financial records supporting those returns for the prior three fiscal years are subject to examination by the federal and Delaware revenue authorities. Management has analyzed the Fund’s tax positions taken on federal, state, and foreign tax returns for all open tax years and does not believe that there are any uncertain tax positions that require recognition of a tax liability.
Reclassifications are made to the Fund’s capital accounts for permanent tax differences to reflect income and gains available for distribution (or available capital loss carryforwards) under federal income tax regulations. U.S. generally accepted accounting principles require that certain components of net assets be adjusted to reflect permanent
| | | | | | |
| Notes to consolidated financial statements | | Wells Fargo Precious Metals Fund | | | 23 | |
differences between financial and tax reporting. These reclassifications have no effect on net assets or net asset values per share. The primary permanent differences causing such reclassifications are due to certain distributions paid, dividends from certain securities and passive foreign investment companies. At March 31, 2016, as a result of permanent book-to-tax differences, the following reclassification adjustments were made on the Consolidated Statement of Assets and Liabilities:
| | | | |
| Paid-in capital | | Undistributed net
investment income | | Accumulated net
realized losses
on investments |
| $(454,619) | | $3,963,082 | | $(3,508,463) |
As of March 31, 2016, the Fund had capital loss carryforwards which consist of $10,143,468 in short-term capital losses and $138,747,186 in long-term capital losses.
Class allocations
The separate classes of shares offered by the Fund differ principally in applicable sales charges, distribution, shareholder servicing, and administration fees. Class specific expenses are charged directly to that share class. Investment income, common expenses, and realized and unrealized gains (losses) on investments are allocated daily to each class of shares based on the relative proportion of net assets of each class.
4. FAIR VALUATION MEASUREMENTS
Fair value measurements of investments are determined within a framework that has established a fair value hierarchy based upon the various data inputs utilized in determining the value of the Fund’s investments. The three-level hierarchy gives the highest priority to unadjusted quoted prices in active markets for identical assets or liabilities (Level 1) and the lowest priority to significant unobservable inputs (Level 3). The Fund’s investments are classified within the fair value hierarchy based on the lowest level of input that is significant to the fair value measurement. The inputs are summarized into three broad levels as follows:
| n | | Level 1 – quoted prices in active markets for identical securities |
| n | | Level 2 – other significant observable inputs (including quoted prices for similar securities, interest rates, prepayment speeds, credit risk, use of amortized cost, etc.) |
| n | | Level 3 – significant unobservable inputs (including the Fund’s own assumptions in determining the fair value of investments) |
The inputs or methodologies used for valuing investments in securities are not necessarily an indication of the risk associated with investing in those securities.
The following is a summary of the inputs used in valuing the Fund’s assets and liabilities as of March 31, 2016:
| | | | | | | | | | | | | | | | |
| | | Quoted prices (Level 1) | | | Other significant observable inputs (Level 2) | | | Significant unobservable inputs (Level 3) | | | Total | |
Assets | | | | | | | | | | | | | | | | |
| | | | |
Common stocks | | | | | | | | | | | | | | | | |
Australia | | $ | 11,550,334 | | | $ | 0 | | | $ | 0 | | | $ | 11,550,334 | |
Canada | | | 189,812,572 | | | | 32,404,371 | | | | 0 | | | | 222,216,943 | |
Peru | | | 2,242,180 | | | | 0 | | | | 0 | | | | 2,242,180 | |
South Africa | | | 15,751,591 | | | | 0 | | | | 0 | | | | 15,751,591 | |
United Kingdom | | | 50,337,121 | | | | 0 | | | | 0 | | | | 50,337,121 | |
United States | | | 34,188,805 | | | | 0 | | | | 0 | | | | 34,188,805 | |
| | | | |
Commodities | | | 19,316,430 | | | | 0 | | | | 0 | | | | 19,316,430 | |
| | | | |
Short-term investments | | | | | | | | | | | | | | | | |
Investment companies | | | 10,291,007 | | | | 0 | | | | 0 | | | | 10,291,007 | |
Total assets | | $ | 333,490,040 | | | $ | 32,404,371 | | | $ | 0 | | | $ | 365,894,411 | |
| | | | |
| 24 | | Wells Fargo Precious Metals Fund | | Notes to consolidated financial statements |
The Fund recognizes transfers between levels within the fair value hierarchy at the end of the reporting period. At March 31, 2016, the Fund did not have any transfers into/out of Level 1, Level 2, or Level 3.
5. TRANSACTIONS WITH AFFILIATES
Management fee
Funds Management, an indirect wholly owned subsidiary of Wells Fargo & Company (“Wells Fargo”), is the manager of the Fund and provides advisory and fund-level administrative services under an investment management agreement. Under the investment management agreement, Funds Management is responsible for, among other services, implementing the investment objectives and strategies of the Fund, supervising the applicable subadviser, providing fund-level administrative services in connection with the Fund’s operations, and providing any other fund-level administrative services reasonably necessary for the operation of the Fund. As compensation for its services under the investment management agreement, Funds Management is entitled to receive an annual management fee starting at 0.65% and declining to 0.48% as the average daily net assets of the Fund increase.
Prior to July 1, 2015, Funds Management provided advisory services pursuant to an investment advisory agreement and was entitled to receive an annual fee which started at 0.60% and declined to 0.45% as the average daily net assets of the Fund increased. In addition, fund-level administrative services were provided by Funds Management under a separate administration agreement at an annual fee which started at 0.05% and declined to 0.03% as the average daily net assets of the Fund increased. For financial statement purposes, the advisory fee and fund-level administration fee for the year ended March 31, 2016 have been included in management fee on the Consolidated Statement of Operations.
For the year ended March 31, 2016, the management fee was equivalent to an annual rate of 0.65% of the Fund’s average daily net assets.
The Subsidiary has entered into separate advisory contract with Funds Management to manage the investment and reinvestment of its assets in conformity with its investment objectives and restrictions. Under this agreement, the Subsidiary does not pay Funds Management a fee for its services.
Funds Management has retained the services of a subadviser to provide daily portfolio management to the Fund. The fee for subadvisory services is borne by Funds Management. Wells Capital Management Incorporated, an affiliate of Funds Management and an indirect wholly owned subsidiary of Wells Fargo, is the subadviser to the Fund and is entitled to receive a fee from Funds Management at an annual rate starting at 0.40% and declining to 0.30% as the average daily net assets of the Fund increase.
Administration fees
Under a class-level administration agreement, Funds Management provides class-level administrative services to the Fund, which includes paying fees and expenses for services provided by the transfer agent, sub-transfer agents, omnibus account servicers and record-keepers. As compensation for its services under the class-level administration agreement, Funds Management receives an annual fee which is calculated based on the average daily net assets of each class as follows:
| | | | | | | | |
| | | Class-level administration fee | |
| | | Current rate | | | Rate prior to July 1, 2015 | |
Class A, Class B, Class C | | | 0.21 | % | | | 0.26 | % |
Administrator Class | | | 0.13 | | | | 0.10 | |
Institutional Class | | | 0.13 | | | | 0.08 | |
Funds Management has contractually waived and/or reimbursed management and administration fees to the extent necessary to maintain certain net operating expense ratios for the Fund. Waiver of fees and/or reimbursement of expenses by Funds Management were made first from fund level expenses on a proportionate basis and then from class specific expenses. Funds Management has committed through July 31, 2016 to waive fees and/or reimburse expenses to the extent necessary to cap the Fund’s expenses before consolidation of its wholly-owned subsidiary at 1.09% for Class A shares, 1.84% for Class B shares, 1.84% for Class C shares, 0.95% for Administrator Class shares, and 0.79% for Institutional Class shares. After this time, the cap may be increased or the commitment to maintain the cap may be terminated only with the approval of the Board of Trustees.
| | | | | | |
| Notes to consolidated financial statements | | Wells Fargo Precious Metals Fund | | | 25 | |
Distribution fees
The Trust has adopted a distribution plan for Class B and Class C shares of the Fund pursuant to Rule 12b-1 under the 1940 Act. Distribution fees are charged to Class B and Class C shares and paid to Wells Fargo Funds Distributor, LLC (“Funds Distributor”), the principal underwriter, at an annual rate of 0.75% of the average daily net assets of Class B and Class C shares.
In addition, Funds Distributor is entitled to receive the front-end sales charge from the purchase of Class A shares and a contingent deferred sales charge on the redemption of certain Class A shares. Funds Distributor is also entitled to receive the contingent deferred sales charges from redemptions of Class B and Class C shares. For the year ended March 31, 2016, Funds Distributor received $16,199 from the sale of Class A shares and $1,476 in contingent deferred sales charges from redemptions of Class C shares.
Shareholder servicing fees
The Trust has entered into contracts with one or more shareholder servicing agents, whereby Class A, Class B, Class C and Administrator Class of the Fund are charged a fee at an annual rate of 0.25% of the average daily net assets of each respective class.
A portion of these total shareholder servicing fees were paid to affiliates of Wells Fargo.
6. INVESTMENT PORTFOLIO TRANSACTIONS
Purchases and sales of investments, excluding U.S. government obligations (if any) and short-term securities, for the year ended March 31, 2016 were $51,709,887 and $76,858,603, respectively. These amounts include purchases and sales transactions of the Subsidiary.
7. BANK BORROWINGS
The Trust (excluding the money market funds and certain other funds) and Wells Fargo Variable Trust are parties to a $200,000,000 revolving credit agreement whereby the Fund is permitted to use bank borrowings for temporary or emergency purposes, such as to fund shareholder redemption requests. Interest under the credit agreement is charged to the Fund based on a borrowing rate equal to the higher of the Federal Funds rate in effect on that day plus 1.25% or the overnight LIBOR rate in effect on that day plus 1.25%. In addition, an annual commitment fee equal to 0.20% of the unused balance is allocated to each participating fund. Prior to September 1, 2015, the revolving credit agreement amount was $150,000,000 and the annual commitment fee was equal to 0.10% of the unused balance which was allocated to each participating fund.
For the year ended March 31, 2016, there were no borrowings by the Fund under the agreement.
8. DISTRIBUTIONS TO SHAREHOLDERS
For the years ended March 31, 2016 and March 31, 2015, the Fund did not have any distributions paid to shareholders.
As of March 31, 2016, the components of distributable earnings on a tax basis were as follows:
| | | | |
Undistributed ordinary income | | Unrealized gains | | Capital loss carryforward |
| $2,444,356 | | $24,311,752 | | $(148,890,654) |
9. CONCENTRATION RISK
Concentration risks result from exposure to a limited number of sectors or geographic region. A fund that invests a substantial portion of its assets in any sector or geographic region may be more affected by changes in that sector or geographic region than would be a fund whose investments are not heavily weighted in any sector or geographic region.
10. INDEMNIFICATION
Under the Trust’s organizational documents, the officers and Trustees have been granted certain indemnification rights against certain liabilities that may arise out of performance of their duties to the Trust. Additionally, in the normal course of business, the Trust may enter into contracts with service providers that contain a variety of indemnification clauses. The Trust’s maximum exposure under these arrangements is dependent on future claims that may be made against the Fund and, therefore, cannot be estimated.
| | | | |
| 26 | | Wells Fargo Precious Metals Fund | | Report of independent registered public accounting firm |
BOARD OF TRUSTEES AND SHAREHOLDERS OF WELLS FARGO FUNDS TRUST:
We have audited the accompanying consolidated statement of assets and liabilities, including the consolidated portfolio of investments, of the Wells Fargo Precious Metals Fund (formerly known as Wells Fargo Advantage Precious Metals Fund) (the “Fund”), one of the funds constituting the Wells Fargo Funds Trust, as of March 31, 2016, and the related consolidated statement of operations for the year then ended, the consolidated statements of changes in net assets for each of the years in the two-year period then ended, and the consolidated financial highlights for each of the years in the five-year period then ended. These financial statements and financial highlights are the responsibility of the Fund’s management. Our responsibility is to express an opinion on these financial statements and financial highlights based on our audits.
We conducted our audits in accordance with the standards of the Public Company Accounting Oversight Board (United States). Those standards require that we plan and perform the audit to obtain reasonable assurance about whether the financial statements and financial highlights are free of material misstatement. An audit includes examining, on a test basis, evidence supporting the amounts and disclosures in the financial statements. Our procedures included confirmation of securities owned as of March 31, 2016, by correspondence with custodian and brokers, or by other appropriate auditing procedures. An audit also includes assessing the accounting principles used and significant estimates made by management, as well as evaluating the overall financial statement presentation. We believe that our audits provide a reasonable basis for our opinion.
In our opinion, the financial statements and financial highlights referred to above present fairly, in all material respects, the financial position of the Wells Fargo Precious Metals Fund as of March 31, 2016, the results of its operations for the year then ended, the changes in its net assets for each of the years in the two-year period then ended, and the financial highlights for each of the years in the five-year period then ended, in conformity with U.S. generally accepted accounting principles.

Boston, Massachusetts
May 25, 2016
| | | | | | |
| Other information (unaudited) | | Wells Fargo Precious Metals Fund | | | 27 | |
TAX INFORMATION
For corporate shareholders, pursuant to Section 854 of the Internal Revenue Code, 100% of ordinary income dividends qualify for the corporate dividends-received deduction for the fiscal year ended March 31, 2016.
Pursuant to Section 854 of the Internal Revenue Code, $277,282 of income dividends paid during the fiscal year ended March 31, 2016 has been designated as qualified dividend income (QDI).
Pursuant to Section 853 of the Internal Revenue Code, the following amounts were designated as foreign taxes paid for the fiscal year ended March 31, 2016. These amounts may be less than the actual foreign taxes paid for financial statement purposes. Foreign taxes paid or withheld should be included in taxable income with an offsetting deduction from gross income or as a credit for taxes paid to foreign governments. None of the income was derived from ineligible foreign sources as defined under Section 901(j) of the Internal Revenue Code.
| | | | |
Creditable foreign
taxes paid | | Per share amount | | Foreign income as % of ordinary income distributions |
| $277,282 | | $0.0244 | | 100% |
PROXY VOTING INFORMATION
A description of the policies and procedures that the Fund uses to determine how to vote proxies relating to portfolio securities is available, upon request, by calling 1-800-222-8222, visiting our website at wellsfargofunds.com, or visiting the SEC website at sec.gov. Information regarding how the Fund voted proxies relating to portfolio securities during the most recent 12-month period ended June 30 is available on the Fund’s website at wellsfargofunds.com or by visiting the SEC website at sec.gov.
PORTFOLIO HOLDINGS INFORMATION
The complete portfolio holdings for the Fund are publicly available monthly on the Fund’s website (wellsfargofunds.com), on a one-month delayed basis. In addition, top ten holdings information (excluding derivative positions) for the Fund is publicly available on the Fund’s website on a monthly, seven-day or more delayed basis. The Fund files its complete schedule of portfolio holdings with the SEC for the first and third quarters of each fiscal year on Form N-Q, which is available by visiting the SEC website at sec.gov. In addition, the Fund’s Form N-Q may be reviewed and copied at the SEC’s Public Reference Room in Washington, DC, and at regional offices in New York City, at 233 Broadway, and in Chicago, at 175 West Jackson Boulevard, Suite 900. Information about the Public Reference Room may be obtained by calling 1-800-SEC-0330.
| | | | |
| 28 | | Wells Fargo Precious Metals Fund | | Other information (unaudited) |
BOARD OF TRUSTEES AND OFFICERS
Each of the Trustees and Officers1 listed in the table below acts in identical capacities for each fund in the Wells Fargo family of funds, which consists of 144 mutual funds comprising the Wells Fargo Funds Trust, Wells Fargo Variable Trust, Wells Fargo Master Trust and four closed-end funds (collectively the “Fund Complex”). This table should be read in conjunction with the Prospectus and the Statement of Additional Information2. The mailing address of each Trustee and Officer is 525 Market Street, 12th Floor, San Francisco, CA 94105. Each Trustee and Officer serves an indefinite term, however, each Trustee serves such term until reaching the mandatory retirement age established by the Trustees.
Independent Trustees
| | | | | | |
Name and year of birth | | Position held and length of service* | | Principal occupations during past five years or longer | | Current other public
company or investment
company directorships |
| William R. Ebsworth (Born 1957) | | Trustee, since 2015 | | Retired. From 1984 to 2013, equities analyst, portfolio manager, research director and chief financial officer at Fidelity Management and Research Company in Boston, Tokyo, and Hong Kong and retired in 2013 as Chief Investment Officer of Fidelity Strategic Advisers, Inc. where he lead a team of investment professionals managing client assets. Prior thereto, Board member of Hong Kong Securities Clearing Co., Hong Kong Options Clearing Corp., the Thailand International Fund, Ltd., Fidelity Investments Life Insurance Company, and Empire Fidelity Investments Life Insurance Company. Mr. Ebsworth is a CFA® charterholder and an Adjunct Lecturer, Finance, at Babson College. | | Asset Allocation Trust |
| Jane A. Freeman (Born 1953) | | Trustee, since 2015 | | Retired. From 2012 to 2014 and 1999 to 2008, Chief Financial Officer of Scientific Learning Corporation. From 2008 to 2012, Ms. Freeman provided consulting services related to strategic business projects. Prior to 1999, Portfolio Manager at Rockefeller & Co. and Scudder, Stevens & Clark. Board member of the Harding Loevner Funds from 1996 to 2014, serving as both Lead Independent Director and chair of the Audit Committee. Board member of the Russell Exchange Traded Funds Trust from 2011 to 2012 and the chair of the Audit Committee. Ms. Freeman is Chair of Taproot Foundation (non-profit organization), a Board Member of Ruth Bancroft Garden (non-profit organization) and an inactive chartered financial analyst. | | Asset Allocation Trust |
| Peter G. Gordon (Born 1942) | | Trustee, since 1998; Chairman, since 2005 | | Co-Founder, Retired Chairman, President and CEO of Crystal Geyser Water Company. Trustee Emeritus, Colby College. | | Asset Allocation Trust |
| Isaiah Harris, Jr. (Born 1952) | | Trustee, since 2009 | | Retired. Chairman of the Board of CIGNA Corporation since 2009, and Director since 2005. From 2003 to 2011, Director of Deluxe Corporation. Prior thereto, President and CEO of BellSouth Advertising and Publishing Corp. from 2005 to 2007, President and CEO of BellSouth Enterprises from 2004 to 2005 and President of BellSouth Consumer Services from 2000 to 2003. Emeritus member of the Iowa State University Foundation Board of Governors. Emeritus Member of the Advisory Board of Iowa State University School of Business. Advisory Board Member, Palm Harbor Academy (charter school). Advisory Board Member, Child Evangelism Fellowship (non-profit). Mr. Harris is a certified public accountant (inactive status). | | CIGNA Corporation; Asset Allocation Trust |
| Judith M. Johnson (Born 1949) | | Trustee, since 2008; Audit Committee Chairman, since 2008 | | Retired. Prior thereto, Chief Executive Officer and Chief Investment Officer of Minneapolis Employees Retirement Fund from 1996 to 2008. Ms. Johnson is an attorney, certified public accountant and a certified managerial accountant. | | Asset Allocation Trust |
| David F. Larcker (Born 1950) | | Trustee, since 2009 | | James Irvin Miller Professor of Accounting at the Graduate School of Business, Stanford University, Director of the Corporate Governance Research Initiative and Senior Faculty of The Rock Center for Corporate Governance since 2006. From 2005 to 2008, Professor of Accounting at the Graduate School of Business, Stanford University. Prior thereto, Ernst & Young Professor of Accounting at The Wharton School, University of Pennsylvania from 1985 to 2005. | | Asset Allocation Trust |
| | | | | | |
| Other information (unaudited) | | Wells Fargo Precious Metals Fund | | | 29 | |
| | | | | | |
Name and year of birth | | Position held and length of service* | | Principal occupations during past five years or longer | | Current other public
company or investment
company directorships |
| Olivia S. Mitchell (Born 1953) | | Trustee, since 2006 | | International Foundation of Employee Benefit Plans Professor, Wharton School of the University of Pennsylvania since 1993. Director of Wharton’s Pension Research Council and Boettner Center on Pensions & Retirement Research, and Research Associate at the National Bureau of Economic Research. Previously, Cornell University Professor from 1978 to 1993. | | Asset Allocation Trust |
| Timothy J. Penny (Born 1951) | | Trustee, since 1996 | | President and Chief Executive Officer of Southern Minnesota Initiative Foundation, a non-profit organization, since 2007 and Senior Fellow at the Humphrey Institute Policy Forum at the University of Minnesota since 1995. Member of the Board of Trustees of NorthStar Education Finance, Inc., a non-profit organization, since 2007. | | Asset Allocation Trust |
| Michael S. Scofield (Born 1943) | | Trustee, since 2010 | | Served on the Investment Company Institute’s Board of Governors and Executive Committee from 2008-2011 as well the Governing Council of the Independent Directors Council from 2006-2011 and the Independent Directors Council Executive Committee from 2008-2011. Chairman of the IDC from 2008-2010. Institutional Investor (Fund Directions) Trustee of Year in 2007. Trustee of the Evergreen Funds complex (and its predecessors) from 1984 to 2010. Chairman of the Evergreen Funds from 2000-2010. Former Trustee of the Mentor Funds. Retired Attorney, Law Offices of Michael S. Scofield. | | Asset Allocation Trust |
| * | Length of service dates reflect the Trustee’s commencement of service with the Trust’s predecessor entities, where applicable. |
Officers
| | | | | | |
Name and year of birth | | Position held and
length of service | | Principal occupations during past five years or longer | | |
Karla M. Rabusch (Born 1959) | | President, since 2003 | | Executive Vice President of Wells Fargo Bank, N.A. and President of Wells Fargo Funds Management, LLC since 2003. | | |
Nancy Wiser1 (Born 1967) | | Treasurer, since 2012 | | Executive Vice President of Wells Fargo Funds Management, LLC since 2011. Chief Operating Officer and Chief Compliance Officer at LightBox Capital Management LLC, from 2008 to 2011. | | |
C. David Messman (Born 1960) | | Secretary, since 2000; Chief Legal Officer, since 2003 | | Senior Vice President and Secretary of Wells Fargo Funds Management, LLC since 2001. Assistant General Counsel of Wells Fargo Bank, N.A. since 2013 and Vice President and Managing Counsel of Wells Fargo Bank, N.A. from 1996 to 2013. | | |
Debra Ann Early (Born 1964) | | Chief Compliance Officer, since 2007 | | Executive Vice President of Wells Fargo Funds Management, LLC since 2014, Senior Vice President and Chief Compliance Officer from 2007 to 2014. | | |
David Berardi (Born 1975) | | Assistant Treasurer, since 2009 | | Vice President of Wells Fargo Funds Management, LLC since 2009. Vice President of Evergreen Investment Management Company, LLC from 2008 to 2010. Manager of Fund Reporting and Control for Evergreen Investment Management Company, LLC from 2004 to 2010. | | |
Jeremy DePalma1 (Born 1974) | | Assistant Treasurer, since 2009 | | Senior Vice President of Wells Fargo Funds Management, LLC since 2009. Senior Vice President of Evergreen Investment Management Company, LLC from 2008 to 2010 and head of the Fund Reporting and Control Team within Fund Administration from 2005 to 2010. | | |
| 1 | Nancy Wiser acts as Treasurer of 72 funds in the Fund Complex. Jeremy DePalma acts as Treasurer of 72 funds and Assistant Treasurer of 72 funds in the Fund Complex. |
| 2 | The Statement of Additional Information includes additional information about the Trustees and is available, without charge, upon request, by calling 1-800-222-8222 or by visiting the website at wellsfargofunds.com. |
| | | | |
| 30 | | Wells Fargo Precious Metals Fund | | List of abbreviations |
The following is a list of common abbreviations for terms and entities that may have appeared in this report.
| ACA | — ACA Financial Guaranty Corporation |
| ADR | — American depositary receipt |
| ADS | — American depositary shares |
| AGC | — Assured Guaranty Corporation |
| AGM | — Assured Guaranty Municipal |
| Ambac | — Ambac Financial Group Incorporated |
| AMT | — Alternative minimum tax |
| BAN | — Bond anticipation notes |
| BHAC | — Berkshire Hathaway Assurance Corporation |
| CAB | — Capital appreciation bond |
| CCAB | — Convertible capital appreciation bond |
| CDA | — Community Development Authority |
| CDO | — Collateralized debt obligation |
| DRIVER | — Derivative inverse tax-exempt receipts |
| DW&P | — Department of Water & Power |
| DWR | — Department of Water Resources |
| ECFA | — Educational & Cultural Facilities Authority |
| EDA | — Economic Development Authority |
| EDFA | — Economic Development Finance Authority |
| ETF | — Exchange-traded fund |
| FDIC | — Federal Deposit Insurance Corporation |
| FFCB | — Federal Farm Credit Banks |
| FGIC | — Financial Guaranty Insurance Corporation |
| FHA | — Federal Housing Administration |
| FHLB | — Federal Home Loan Bank |
| FHLMC | — Federal Home Loan Mortgage Corporation |
| FICO | — The Financing Corporation |
| FNMA | — Federal National Mortgage Association |
| GDR | — Global depositary receipt |
| GNMA | — Government National Mortgage Association |
| HCFR | — Healthcare facilities revenue |
| HEFA | — Health & Educational Facilities Authority |
| HEFAR | — Higher education facilities authority revenue |
| HFA | — Housing Finance Authority |
| HFFA | — Health Facilities Financing Authority |
| HUD | — Department of Housing and Urban Development |
| IDA | — Industrial Development Authority |
| IDAG | — Industrial Development Agency |
| KRW | — Republic of Korea won |
| LIBOR | — London Interbank Offered Rate |
| LIFER | — Long Inverse Floating Exempt Receipts |
| LLC | — Limited liability company |
| LLLP | — Limited liability limited partnership |
| LLP | — Limited liability partnership |
| MBIA | — Municipal Bond Insurance Association |
| MFHR | — Multifamily housing revenue |
| MSTR | — Municipal securities trust receipts |
| MUD | — Municipal Utility District |
| National | — National Public Finance Guarantee Corporation |
| PCFA | — Pollution Control Financing Authority |
| PCL | — Public Company Limited |
| PCR | — Pollution control revenue |
| PFA | — Public Finance Authority |
| PFFA | — Public Facilities Financing Authority |
| PFOTER | — Puttable floating option tax-exempt receipts |
| plc | — Public limited company |
| PUTTER | — Puttable tax-exempt receipts |
| R&D | — Research & development |
| Radian | — Radian Asset Assurance |
| RAN | — Revenue anticipation notes |
| RDA | — Redevelopment Authority |
| RDFA | — Redevelopment Finance Authority |
| REIT | — Real estate investment trust |
| ROC | — Reset option certificates |
| SAVRS | — Select auction variable rate securities |
| SBA | — Small Business Authority |
| SDR | — Swedish depositary receipt |
| SFHR | — Single-family housing revenue |
| SFMR | — Single-family mortgage revenue |
| SPA | — Standby purchase agreement |
| SPDR | — Standard & Poor’s Depositary Receipts |
| SPEAR | — Short Puttable Exempt Adjustable Receipts |
| STRIPS | — Separate trading of registered interest and |
| TAN | — Tax anticipation notes |
| TIPS | — Treasury inflation-protected securities |
| TRAN | — Tax revenue anticipation notes |
| TTFA | — Transportation Trust Fund Authority |
| TVA | — Tennessee Valley Authority |
This page is intentionally left blank.
This page is intentionally left blank.

For more information
More information about Wells Fargo Funds is available free upon request. To obtain literature, please write, email, visit the Fund’s website, or call:
Wells Fargo Funds
P.O. Box 8266
Boston, MA 02266-8266
Email: fundservice@wellsfargo.com
Website: wellsfargofunds.com
Individual investors: 1-800-222-8222
Retail investment professionals: 1-888-877-9275
Institutional investment professionals: 1-866-765-0778
This report and the financial statements contained herein are submitted for the general information of the shareholders of the Fund. If this report is used for promotional purposes, distribution of the report must be accompanied or preceded by a current prospectus. Before investing, please consider the investment objectives, risks, charges, and expenses of the investment. For a current prospectus and, if available, a summary prospectus, containing this information, call 1-800-222-8222 or visit the Fund’s website at wellsfargofunds.com. Read the prospectus carefully before you invest or send money.
Wells Fargo Asset Management (WFAM) is a trade name used by the asset management businesses of Wells Fargo & Company. Wells Fargo Funds Management, LLC, a wholly owned subsidiary of Wells Fargo & Company, provides investment advisory and administrative services for Wells Fargo Funds. Other affiliates of Wells Fargo & Company provide subadvisory and other services for the funds. The funds are distributed by Wells Fargo Funds Distributor, LLC, Member FINRA, an affiliate of Wells Fargo & Company.
NOT FDIC INSURED ¡ NO BANK GUARANTEE ¡ MAY LOSE VALUE
© 2016 Wells Fargo Funds Management, LLC. All rights reserved.
| | |
 | | 241821 05-16 A316/AR316 03-16 |
Annual Report
March 31, 2016

Wells Fargo Specialized Technology Fund


Reduce clutter. Save trees.
Sign up for electronic delivery of prospectuses and shareholder reports at wellsfargo.com/advantagedelivery
Contents
The views expressed and any forward-looking statements are as of March 31, 2016, unless otherwise noted, and are those of the Fund managers and/or Wells Fargo Funds Management, LLC. Discussions of individual securities, or the markets generally, or any Wells Fargo Fund are not intended as individual recommendations. Future events or results may vary significantly from those expressed in any forward-looking statements. The views expressed are subject to change at any time in response to changing circumstances in the market. Wells Fargo Funds Management, LLC and the Fund disclaim any obligation to publicly update or revise any views expressed or forward-looking statements.
NOT FDIC INSURED ¡ NO BANK GUARANTEE ¡ MAY LOSE VALUE
| | | | |
| 2 | | Wells Fargo Specialized Technology Fund | | Letter to shareholders (unaudited) |

Karla M. Rabusch
President
Wells Fargo Funds
Dear Valued Shareholder:
We are pleased to offer you this annual report for the Wells Fargo Specialized Technology Fund for the 12-month period that ended March 31, 2016. During this period, which began with the second quarter of 2015, U.S. and international stock markets experienced heightened volatility, with intermittent rebounds interspersed with sell-offs. The U.S. economy displayed resilience throughout the period, although growth stayed modest amid ongoing pressures such as slowing growth in China, a strengthening U.S. dollar, and uncertainty regarding interest-rate increases by the U.S. Federal Reserve (Fed). International economies faced deeper ongoing challenges.
U.S. stocks experienced challenges during the second quarter of 2015.
The broad U.S. stock market fluctuated widely, eventually eking out a small quarterly gain. Mid- and large-cap stocks at times were pressured by investor concerns over the potentially negative effects of financially troubled overseas economies and of a strengthening U.S. dollar on the profits of U.S. multinational firms. The U.S. economy picked up traction during the quarter, and U.S. Fed officials, who kept interest rates low while waiting for the U.S. jobs market to sufficiently improve and for inflation to approach their 2% target, made clear they could take action soon. Throughout the quarter, non-U.S. markets also experienced volatility, triggered by uncertainty over the potential impact of financial challenges in other locations—most notably in Greece and Puerto Rico. Questions over slower growth in China caused investor concern as well.
In the third quarter of 2015, China’s slowdown took a toll on economies and markets worldwide.
U.S. stocks sagged during the quarter, experiencing the most volatility since 2011. Economic data released during the quarter suggested the U.S. economy remained solid but had lost some steam, burdened by the drag of the U.S. dollar’s strength coupled with global economic turmoil. The fact that the Fed left the federal funds interest rate unchanged at its September 2015 meeting surprised investors and fueled increased uncertainty about the U.S. economy’s stamina to remain healthy while facing the challenges of slowing in China and troubles elsewhere in the world. Outside the U.S., markets were even more volatile and delivered generally weaker quarterly results, also largely due to investors’ increasing anxiety over China’s weakened economy. Because China is the world’s largest importer of many commodities, a number of emerging markets—key commodities exporters—struggled under the dual strains of reduced demand for commodities and, because of weaker demand, lower prices for the commodities they did sell. In the eurozone, however, where only about 3% of exports are sent to China, household spending and business investment appeared relatively unaffected by troubles elsewhere. The European Central Bank (ECB) warned, though, that China’s slowing could lead to slower growth and lower inflation rates in the eurozone than previously forecast and indicated additional stimulus could be provided should this occur.
Despite ongoing concerns, U.S. stocks generally rose in the fourth quarter of 2015; international markets lagged.
While the broad U.S. stock market bounced back in the quarter, stock markets outside the U.S. failed to keep pace as economic concerns, including China’s slowdown, continued to negatively affect many countries. U.S. economic data released during the quarter indicated the economy remained solid, with modest growth, although the strong U.S. dollar and weakness in international economies remained headwinds. In December, the Fed, as expected, raised its target interest rate by 25 basis points (bps; 100 bps equals 1.00%) after keeping it near zero for seven years. The move reflected confidence in the U.S. economy’s ability to stay healthy with less central-bank support. The Fed also clarified that future interest-rate increases would be gradual.
In the first quarter of 2016, market volatility increased globally amid ongoing concerns.
Stock markets worldwide fluctuated widely in the first quarter of 2016. Most sold off sharply in the first six weeks of the year on concerns such as weak global growth,
| | | | | | |
| Letter to shareholders (unaudited) | | Wells Fargo Specialized Technology Fund | | | 3 | |
falling commodity prices, and uncertainty over the timing and impact of Fed interest-rate increases. As the quarter progressed, fears abated somewhat and global markets generally rallied back. The U.S. economy ended the quarter on a positive note as much of the quarter’s data reflected resiliency. With ongoing uncertainties about global growth and financial markets, however, the Fed held off from raising the target interest rate during the quarter. Outside the U.S., the eurozone fell into deflation in February; in response, the ECB announced an expansion of its stimulus program. In China, the government in March set a growth rate of 6.5% to 7.0% for 2016, an acknowledgment that the country’s growth has been slowing. In emerging markets, although central-bank stimulus and improved prices for oil and other commodities led to stock-market rallies in the quarter, many of these countries’ economies face credit downgrades due to challenges such as the likelihood of a stronger U.S. dollar, which would make dollar-denominated debt more expensive.
Information technology (IT) stocks delivered positive results overall for the 12-month reporting period.
During the second quarter of 2015, the IT sector performed roughly in line with the broad U.S. stock market, pressured by similar investor concerns. In the third quarter of 2015, IT stocks declined overall, although less than the broader market; worried investors gravitated toward more defensive sectors as commodity prices weakened, the timing of a Fed interest-rate increase became less certain, and economies in emerging markets continued to struggle. IT stocks generally rebounded in the third quarter of 2015, aided by moderation of investors’ concerns about global growth and favorable earnings reports from a number of IT companies. In the first quarter of 2016, however, investors displayed a heavily defensive posture, primarily earlier in the quarter as oil prices continued to decline. Roughly halfway through the quarter, encouraging economic data led to a market rally. Within IT, investors tended to favor a select group of mega-cap stocks throughout much of the reporting period, reflecting ongoing risk aversion. Despite volatility within IT stocks over the 12-month period, the IT sector as a whole outperformed the broader U.S. stock market.
Don’t let short-term uncertainty derail long-term investment goals.
Periods of uncertainty can present challenges, but experience has taught us that maintaining long-term investment goals can be an effective way to plan for the future. To help you create a sound strategy based on your personal goals and risk tolerance, Wells Fargo Funds offers more than 100 mutual funds spanning a wide range of asset classes and investment styles. Although diversification cannot guarantee an investment profit or prevent losses, we believe it can be an effective way to manage investment risk and potentially smooth out overall portfolio performance. We encourage investors to know their investments and to understand that appropriate levels of risk-taking may unlock opportunities.
Thank you for choosing to invest in Wells Fargo Funds. We appreciate your confidence in us and remain committed to helping you meet your financial needs.
Sincerely,

Karla M. Rabusch
President
Wells Fargo Funds
Despite volatility within IT stocks over the 12-month period, the IT sector as a whole outperformed the broader U.S. stock market.
We encourage investors to know their investments and to understand that appropriate levels of risk-taking may unlock opportunities.
For further information about your Fund, contact your investment professional, visit our website at wellsfargofunds.com, or call us directly at 1-800-222-8222. We are available 24 hours a day, 7 days a week.
| | | | |
| 4 | | Wells Fargo Specialized Technology Fund | | Performance highlights (unaudited) |
Investment objective
The Fund seeks long-term capital appreciation.
Manager
Wells Fargo Funds Management, LLC
Subadviser
Allianz Global Investors U.S. LLC
Portfolio managers
Huachen Chen, CFA®
Walter C. Price, Jr., CFA®
Average annual total returns (%) as of March 31, 20161
| | | | | | | | | | | | | | | | | | | | | | | | | | | | | | | | | | |
| | | | | Including sales charge | | | Excluding sales charge | | | Expense ratios2 (%) | |
| | | Inception date | | 1 year | | | 5 year | | | 10 year | | | 1 year | | | 5 year | | | 10 year | | | Gross | | | Net3 | |
| Class A (WFSTX) | | 9-18-2000 | | | (6.41 | ) | | | 7.60 | | | | 8.22 | | | | (0.66 | ) | | | 8.88 | | | | 8.86 | | | | 1.45 | | | | 1.45 | |
| Class B (WFTBX)* | | 9-18-2000 | | | (6.44 | ) | | | 7.76 | | | | 8.30 | | | | (1.44 | ) | | | 8.05 | | | | 8.30 | | | | 2.20 | | | | 2.20 | |
| Class C (WFTCX) | | 9-18-2000 | | | (2.45 | ) | | | 8.05 | | | | 8.04 | | | | (1.45 | ) | | | 8.05 | | | | 8.04 | | | | 2.20 | | | | 2.20 | |
| Administrator Class (WFTDX) | | 7-30-2010 | | | – | | | | – | | | | – | | | | (0.56 | ) | | | 9.08 | | | | 8.97 | | | | 1.37 | | | | 1.34 | |
| S&P North American Technology Index4 | | – | | | – | | | | – | | | | – | | | | 8.79 | | | | 13.41 | | | | 9.54 | | | | – | | | | – | |
| S&P 500 Index5 | | – | | | – | | | | – | | | | – | | | | 1.78 | | | | 11.58 | | | | 7.01 | | | | – | | | | – | |
| * | | Class B shares are closed to investment, except in connection with reinvestment of any distributions and permitted exchanges. |
While the S&P 500 Index is comprised of U.S. equity securities of companies diversified across ten sectors, the Fund’s holdings are concentrated primarily in technology-related stocks. Therefore, the performance of the S&P 500 Index is displayed only to show how the concentrated Fund performed compared with a diversified selection of U.S. equity securities.
Figures quoted represent past performance, which is no guarantee of future results, and do not reflect taxes that a shareholder may pay on fund distributions or the redemption of fund shares. Investment return and principal value of an investment will fluctuate so that an investor’s shares, when redeemed, may be worth more or less than their original cost. Performance shown without sales charges would be lower if sales charges were reflected. Current performance may be lower or higher than the performance data quoted, which assumes the reinvestment of dividends and capital gains. Current month-end performance is available on the Fund’s website, wellsfargofunds.com.
Index returns do not include transaction costs associated with buying and selling securities, any mutual fund fees or expenses, or any taxes. It is not possible to invest directly in an index.
For Class A shares, the maximum front-end sales charge is 5.75%. For Class B shares, the maximum contingent deferred sales charge is 5.00%. For Class C shares, the maximum contingent deferred sales charge is 1.00%. Performance including a contingent deferred sales charge assumes the sales charge for the corresponding time period. Administrator Class shares are sold without a front-end sales charge or contingent deferred sales charge.
Stock values fluctuate in response to the activities of individual companies and general market and economic conditions. Funds that concentrate their investments in limited sectors, such as information technology, are more vulnerable to adverse market, economic, regulatory, political, or other developments affecting those sectors. Certain investment strategies tend to increase the total risk of an investment (relative to the broader market). The Fund is exposed to convertible securities risk, foreign investment risk, nondiversification risk, and smaller-company securities risk. Consult the Fund’s prospectus for additional information on these and other risks.
Please see footnotes on page 5.
| | | | | | |
| Performance highlights (unaudited) | | Wells Fargo Specialized Technology Fund | | | 5 | |
|
| Growth of $10,000 investment as of March 31, 20166 |
|
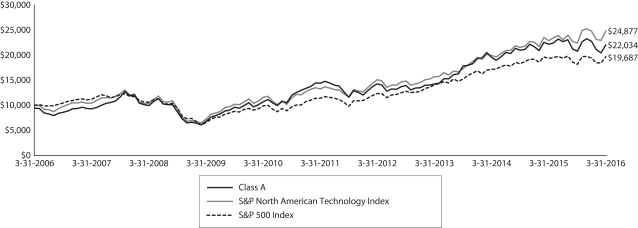 |
| 1 | Historical performance shown for Administrator Class shares prior to their inception reflects the performance of Class A shares, and includes the higher expenses applicable to Class A shares. If these expenses had not been included, returns would be higher. |
| 2 | Reflects the expense ratios as stated in the most recent prospectuses, which include the impact of 0.01% in acquired fund fees and expenses. The expense ratios shown are subject to change and may differ from the annualized expense ratios shown in the financial highlights of this report, which do not include acquired fund fees and expenses. |
| 3 | The manager has contractually committed through July 31, 2016, to waive fees and/or reimburse expenses to the extent necessary to cap the Fund’s Total Annual Fund Operating Expenses After Fee Waiver at 1.50% for Class A, 2.25% for Class B, 2.25% for Class C, and 1.33% for Administrator Class. After this time, the cap may be increased or the commitment to maintain the cap may be terminated only with the approval of the Board of Trustees. Brokerage commissions, stamp duty fees, interest, taxes, acquired fund fees and expenses, and extraordinary expenses are excluded from the cap. Without this cap, the Fund’s returns would have been lower. |
| 4 | The S&P North American Technology Index (formerly the Goldman Sachs Technology Index) is a modified market-capitalization-weighted index of selected technology stocks. You cannot invest directly in an index. |
| 5 | The S&P 500 Index consists of 500 stocks chosen for market size, liquidity, and industry group representation. It is a market-value weighted index with each stock’s weight in the index proportionate to its market value. You cannot invest directly in an index. |
| 6 | The chart compares the performance of Class A shares for the most recent ten years with the S&P North American Technology Index and the S&P 500 Index. The chart assumes a hypothetical investment of $10,000 in Class A shares and reflects all operating expenses and assumes the maximum initial sales charge of 5.75%. |
| 7 | The ten largest holdings, excluding cash and cash equivalents, are calculated based on the value of the investments divided by total net assets of the Fund. Holdings are subject to change and may have changed since the date specified. |
| 8 | Amounts are calculated based on the total long-term investments of the Fund. These amounts are subject to change and may have changed since the date specified. |
| ** | This security was not held in the Fund at the end of the reporting period. |
| | | | |
| 6 | | Wells Fargo Specialized Technology Fund | | Performance highlights (unaudited) |
MANAGER’S DISCUSSION
Fund highlights
| n | | The Fund underperformed the S&P North American Technology Index for the 12-month period that ended March 31, 2016. |
| n | | The Fund’s underweights or lack of exposure to select mega-cap stocks detracted from performance, as did its positioning in certain companies that were pressured during the period. Our selection of stocks experiencing unique growth drivers and the Fund’s relative weightings to certain stocks positively contributed to the Fund’s absolute and relative performance. |
| n | | Stock-market volatility increased during the second half of the period, and investors shifted assets to investments with fewer perceived risks. In general, investors sold off stocks with high-growth expectations and high valuations in favor of larger companies with stable free-cash-flow generation and dividend yields. |
We believe one of the most attractive qualities of the information technology (IT) sector is the regular emergence of new and disruptive trends. Many of these new technologies could potentially expand the influence of technology into other areas of the economy as well as draw value from predecessor technologies within the sector. Our primary goal always has been to identify these major trends ahead of the crowd and invest in the emerging leaders.
The Fund’s underweights to mega- and large-cap companies hindered performance; its exposures to certain pressured companies also detracted.
Historically, we have maintained a sizable underweight to mega-cap/large-cap companies, generally found in the traditional hardware and software markets, that tend to lack the robust growth rates advocated by our strategy. We since have moderated our view on mega caps and large caps largely because some of them have adapted to transition into new technology markets, which could accelerate their growth and lead to higher valuations. In general, we reduce our underweight to mega caps/large caps during periods of high investor risk aversion; however, the transition to new technology markets caused us to increase our exposure to mega caps and large caps even more than we typically would.
Semiconductor maker Skyworks Solutions, Incorporated, which makes semiconductors for smartphones and is a key supplier for Apple Incorporated’s iPhone, was among the Fund’s top detractors. The company’s shares declined as several smartphone-component suppliers lowered their guidance due to reduced demand. We believe Skyworks’ diversified exposure to the broader market coupled with the increasing content needs for most major smartphone platforms may generate attractive growth over time; besides smartphone semiconductors, the company supplies chips for the connected-home, smart-energy, wearables, and automotive markets.
The Fund’s largest detractors from relative performance included its underweight to Alphabet Incorporated (also known as Google). The company has been demonstrating an ability to capture some of the growth in mobile/video ads as advertisers shift spending away from traditional and internet media. Also, during the period, Google’s new chief financial officer emphasized that the company will focus more on maximizing shareholder value, which boosted investors’ optimism. We added to our position in Google during the period based on its progress in mobile/video ads and improved visibility into its operations. Overweights to Vipshop Holdings Limited** and Criteo S.A. and an underweight to Microsoft Corporation detracted from relative returns as well.
Also during the period, we continued to maintain large positions in several mid-cap companies that we believe could be future winners, especially in the mobile/consumer internet, data/network security, and cloud-computing groups. Our strategy can be somewhat disadvantaged in environments characterized by heightened macroeconomic uncertainty, when investors tend to value cash and yield over growth.
Select stocks contributed positively to the Fund’s performance, as did decisions to underweight or eliminate exposure to certain benchmark holdings.
Chinese online-gaming service provider NetEase, Incorporated, was among the Fund’s top contributors. NetEase, China’s leading online-games company, has exposure to a variety of internet segments, including news, email, and e-commerce. We believe investors may not be fully appreciating the potential upside from the company’s transition to mobile games, which have emerged as the driving force behind China’s online-gaming industry, and NetEase’s rich mobile-game pipeline.
Please see footnotes on page 5.
| | | | | | |
| Performance highlights (unaudited) | | Wells Fargo Specialized Technology Fund | | | 7 | |
The Fund’s lack of exposure to IBM Corporation and underweights to certain holdings added to relative returns. In addition to the negative effects of the broad market sell-off, IBM continues to face company-specific challenges. The company’s disappointing 2016 forecast indicates ongoing issues as a shift to new technologies has not yet offset a persistent decline in demand for IBM’s traditional products. While the company’s new technologies include offerings in attractive growth areas such as cloud computing and data analytics, we believe the company’s transition started too late; its competitors have massive leads in these areas. IBM faces multiple challenges, and we believe it may take a considerable amount of time for the company to become competitive in new technology markets. Additionally, the Fund’s underweights to QUALCOMM Incorporated, Intel Corporation, and Hewlett-Packard Company boosted relative returns.
We retain an optimistic outlook for the sector and the Fund.
Looking forward, we continue to believe the IT sector can provide some of the stock markets’ best absolute- and relative-return opportunities, especially for bottom-up stock pickers like us. We have observed a wave of innovation within the sector that we believe could produce attractive returns for companies offering best-in-class solutions. We also see a number of companies with present valuations that in our view do not fully reflect positive company- and/or industry-specific tailwinds.
| | | | |
| Ten largest holdings (%) as of March 31, 20167 | |
Microsoft Corporation | | | 7.91 | |
Facebook Incorporated Class A | | | 7.58 | |
Apple Incorporated | | | 6.32 | |
Amazon.com Incorporated | | | 4.50 | |
Visa Incorporated Class A | | | 4.24 | |
Alphabet Incorporated Class A | | | 4.04 | |
Alphabet Incorporated Class C | | | 4.00 | |
Cisco Systems Incorporated | | | 3.64 | |
Oracle Corporation | | | 3.47 | |
Skyworks Solutions Incorporated | | | 2.72 | |
|
| Industry distribution as of March 31, 20168 |
|
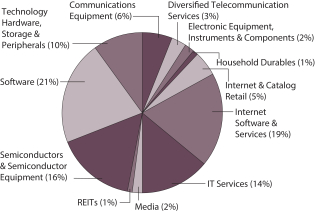 |
Please see footnotes on page 5.
| | | | |
| 8 | | Wells Fargo Specialized Technology Fund | | Fund expenses (unaudited) |
As a shareholder of the Fund, you incur two types of costs: (1) transaction costs, including sales charges (loads) on purchase payments and contingent deferred sales charges (if any) on redemptions and (2) ongoing costs, including management fees, distribution (12b-1) and/or shareholder servicing fees, and other Fund expenses. This example is intended to help you understand your ongoing costs (in dollars) of investing in the Fund and to compare these costs with the ongoing costs of investing in other mutual funds.
The example is based on an investment of $1,000 invested at the beginning of the six-month period and held for the entire period from October 1, 2015 to March 31, 2016.
Actual expenses
The “Actual” line of the table below provides information about actual account values and actual expenses. You may use the information in this line, together with the amount you invested, to estimate the expenses that you paid over the period. Simply divide your account value by $1,000 (for example, an $8,600 account value divided by $1,000 = 8.6), then multiply the result by the number in the “Actual” line under the heading entitled “Expenses paid during period” for your applicable class of shares to estimate the expenses you paid on your account during this period.
Hypothetical example for comparison purposes
The “Hypothetical” line of the table below provides information about hypothetical account values and hypothetical expenses based on the Fund’s actual expense ratio and an assumed rate of return of 5% per year before expenses, which is not the Fund’s actual return. The hypothetical account values and expenses may not be used to estimate the actual ending account balance or expenses you paid for the period. You may use this information to compare the ongoing costs of investing in the Fund and other funds. To do so, compare this 5% hypothetical example with the 5% hypothetical examples that appear in the shareholder reports of the other funds.
Please note that the expenses shown in the table are meant to highlight your ongoing costs only and do not reflect any transactional costs, such as sales charges (loads) and contingent deferred sales charges. Therefore, the “Hypothetical” line of the table is useful in comparing ongoing costs only and will not help you determine the relative total costs of owning different funds. In addition, if these transactional costs were included, your costs would have been higher.
| | | | | | | | | | | | | | | | |
| | | Beginning
account value
10-1-2015 | | | Ending
account value
3-31-2016 | | | Expenses
paid during
the period¹ | | | Net annualized
expense ratio | |
Class A | | | | | | | | | | | | | | | | |
Actual | | $ | 1,000.00 | | | $ | 1,059.48 | | | $ | 7.45 | | | | 1.45 | % |
Hypothetical (5% return before expenses) | | $ | 1,000.00 | | | $ | 1,017.76 | | | $ | 7.30 | | | | 1.45 | % |
Class B | | | | | | | | | | | | | | | | |
Actual | | $ | 1,000.00 | | | $ | 1,055.49 | | | $ | 11.29 | | | | 2.20 | % |
Hypothetical (5% return before expenses) | | $ | 1,000.00 | | | $ | 1,014.02 | | | $ | 11.06 | | | | 2.20 | % |
Class C | | | | | | | | | | | | | | | | |
Actual | | $ | 1,000.00 | | | $ | 1,055.66 | | | $ | 11.29 | | | | 2.20 | % |
Hypothetical (5% return before expenses) | | $ | 1,000.00 | | | $ | 1,014.02 | | | $ | 11.06 | | | | 2.20 | % |
Administrator Class | | | | | | | | | | | | | | | | |
Actual | | $ | 1,000.00 | | | $ | 1,060.84 | | | $ | 6.85 | | | | 1.33 | % |
Hypothetical (5% return before expenses) | | $ | 1,000.00 | | | $ | 1,018.35 | | | $ | 6.71 | | | | 1.33 | % |
| 1 | Expenses paid is equal to the annualized expense ratio of each class multiplied by the average account value over the period, multiplied by the number of days in the most recent fiscal half-year divided by the number of days in the fiscal year (to reflect the one-half-year period). |
| | | | | | |
| Portfolio of investments—March 31, 2016 | | Wells Fargo Specialized Technology Fund | | | 9 | |
| | | | | | | | | | | | |
Security name
| | | | | | Shares | | | Value | |
| | | |
Common Stocks: 98.50% | | | | | | | | | | |
| | | | |
Consumer Discretionary: 8.78% | | | | | | | | | | | | |
| | | |
| Household Durables: 1.21% | | | | | | | | | | |
Garmin Limited « | | | | | | | 95,206 | | | $ | 3,804,432 | |
| | | | | | | | | | | | |
| | | |
| Internet & Catalog Retail: 5.28% | | | | | | | | | | |
Amazon.com Incorporated † | | | | | | | 23,822 | | | | 14,141,692 | |
Expedia Incorporated | | | | | | | 1,412 | | | | 152,242 | |
Netflix Incorporated † | | | | | | | 7,412 | | | | 757,729 | |
The Priceline Group Incorporated † | | | | | | | 1,192 | | | | 1,536,440 | |
| | | | |
| | | | | | | | | | | 16,588,103 | |
| | | | | | | | | | | | |
| | | |
| Media: 2.29% | | | | | | | | | | |
Comcast Corporation Class A | | | | | | | 117,482 | | | | 7,175,801 | |
| | | | | | | | | | | | |
| | | |
Financials: 0.47% | | | | | | | | | | |
| | | |
| REITs: 0.47% | | | | | | | | | | |
American Tower Corporation | | | | | | | 14,368 | | | | 1,470,852 | |
| | | | | | | | | | | | |
| | | |
Information Technology: 86.56% | | | | | | | | | | |
| | | |
| Communications Equipment: 5.89% | | | | | | | | | | |
Cisco Systems Incorporated | | | | | | | 401,708 | | | | 11,436,627 | |
Palo Alto Networks Incorporated † | | | | | | | 16,367 | | | | 2,670,112 | |
QUALCOMM Incorporated | | | | | | | 86,263 | | | | 4,411,490 | |
| | | | |
| | | | | | | | | | | 18,518,229 | |
| | | | | | | | | | | | |
| | | |
| Electronic Equipment, Instruments & Components: 1.91% | | | | | | | | | | |
CDW Corporation of Delaware | | | | | | | 11,648 | | | | 483,392 | |
Corning Incorporated | | | | | | | 172,765 | | | | 3,609,061 | |
Ingram Micro Incorporated Class A | | | | | | | 48,828 | | | | 1,753,413 | |
Tech Data Corporation † | | | | | | | 1,960 | | | | 150,469 | |
| | | | |
| | | | | | | | | | | 5,996,335 | |
| | | | | | | | | | | | |
| | | |
| Internet Software & Services: 19.11% | | | | | | | | | | |
Alphabet Incorporated Class A † | | | | | | | 16,625 | | | | 12,683,213 | |
Alphabet Incorporated Class C † | | | | | | | 16,885 | | | | 12,578,481 | |
Criteo SA ADR † | | | | | | | 64,664 | | | | 2,678,383 | |
Facebook Incorporated Class A † | | | | | | | 208,544 | | | | 23,794,870 | |
NetEase Incorporated ADR | | | | | | | 16,008 | | | | 2,298,429 | |
Tencent Holdings Limited | | | | | | | 159,700 | | | | 3,260,969 | |
Youku.com Incorporated ADR † | | | | | | | 99,365 | | | | 2,731,544 | |
| | | | |
| | | | | | | | | | | 60,025,889 | |
| | | | | | | | | | | | |
| | | |
| IT Services: 14.18% | | | | | | | | | | |
Accenture plc Class A | | | | | | | 28,485 | | | | 3,287,169 | |
Automatic Data Processing Incorporated | | | | | | | 51,856 | | | | 4,652,002 | |
Cognizant Technology Solutions Corporation Class A † | | | | | | | 33,853 | | | | 2,122,583 | |
Computer Sciences Corporation | | | | | | | 38,376 | | | | 1,319,751 | |
Fidelity National Information Services Incorporated | | | | | | | 29,935 | | | | 1,895,185 | |
The accompanying notes are an integral part of these financial statements.
| | | | |
| 10 | | Wells Fargo Specialized Technology Fund | | Portfolio of investments—March 31, 2016 |
| | | | | | | | | | | | |
Security name
| | | | | | Shares | | | Value | |
| | | |
| IT Services (continued) | | | | | | | | | | |
Fiserv Incorporated † | | | | | | | 28,025 | | | $ | 2,874,805 | |
Global Payments Incorporated | | | | | | | 32,255 | | | | 2,106,252 | |
MasterCard Incorporated Class A | | | | | | | 12,895 | | | | 1,218,578 | |
Paychex Incorporated | | | | | | | 14,854 | | | | 802,265 | |
PayPal Holdings Incorporated † | | | | | | | 108,326 | | | | 4,181,384 | |
Sabre Corporation | | | | | | | 65,200 | | | | 1,885,584 | |
Total System Services Incorporated | | | | | | | 54,565 | | | | 2,596,203 | |
Vantiv Incorporated Class A † | | | | | | | 41,945 | | | | 2,259,997 | |
Visa Incorporated Class A | | | | | | | 174,294 | | | | 13,330,005 | |
| | | | |
| | | | | | | | | | | 44,531,763 | |
| | | | | | | | | | | | |
| | | |
| Semiconductors & Semiconductor Equipment: 15.19% | | | | | | | | | | |
Analog Devices Incorporated | | | | | | | 18,290 | | | | 1,082,585 | |
Applied Materials Incorporated | | | | | | | 239,105 | | | | 5,064,244 | |
Atmel Corporation | | | | | | | 513,750 | | | | 4,171,650 | |
Broadcom Limited | | | | | | | 55,001 | | | | 8,497,655 | |
Intel Corporation | | | | | | | 47,985 | | | | 1,552,315 | |
KLA-Tencor Corporation | | | | | | | 23,496 | | | | 1,710,744 | |
Lam Research Corporation | | | | | | | 86,918 | | | | 7,179,427 | |
Maxim Integrated Products Incorporated | | | | | | | 51,430 | | | | 1,891,595 | |
Microchip Technology Incorporated « | | | | | | | 70,380 | | | | 3,392,316 | |
Micron Technology Incorporated † | | | | | | | 54,055 | | | | 565,956 | |
Skyworks Solutions Incorporated | | | | | | | 109,612 | | | | 8,538,775 | |
Taiwan Semiconductor Manufacturing Company Limited ADR | | | | | | | 78,610 | | | | 2,059,582 | |
Texas Instruments Incorporated | | | | | | | 24,820 | | | | 1,425,164 | |
Xilinx Incorporated | | | | | | | 12,220 | | | | 579,595 | |
| | | | |
| | | | | | | | | | | 47,711,603 | |
| | | | | | | | | | | | |
| | | |
| Software: 20.60% | | | | | | | | | | |
Activision Blizzard Incorporated | | | | | | | 56,333 | | | | 1,906,309 | |
Adobe Systems Incorporated † | | | | | | | 35,137 | | | | 3,295,851 | |
Electronic Arts Incorporated † | | | | | | | 35,904 | | | | 2,373,613 | |
Fortinet Incorporated † | | | | | | | 7,140 | | | | 218,698 | |
Imperva Incorporated † | | | | | | | 82,738 | | | | 4,178,269 | |
Intuit Incorporated | | | | | | | 61,170 | | | | 6,362,292 | |
Microsoft Corporation | | | | | | | 449,735 | | | | 24,838,864 | |
Oracle Corporation | | | | | | | 266,497 | | | | 10,902,392 | |
Proofpoint Incorporated Ǡ | | | | | | | 33,002 | | | | 1,774,848 | |
Salesforce.com Incorporated † | | | | | | | 74,765 | | | | 5,519,900 | |
Tableau Software Incorporated Class A † | | | | | | | 37,575 | | | | 1,723,565 | |
The Sage Group plc | | | | | | | 177,985 | | | | 1,607,912 | |
| | | | |
| | | | | | | | | | | 64,702,513 | |
| | | | | | | | | | | | |
| | | |
| Technology Hardware, Storage & Peripherals: 9.68% | | | | | | | | | | |
Apple Incorporated | | | | | | | 182,173 | | | | 19,855,035 | |
EMC Corporation | | | | | | | 156,190 | | | | 4,162,464 | |
Hewlett Packard Enterprise Company | | | | | | | 229,640 | | | | 4,071,517 | |
NetApp Incorporated | | | | | | | 79,320 | | | | 2,164,643 | |
Western Digital Corporation | | | | | | | 3,360 | | | | 158,726 | |
| | | | |
| | | | | | | | | | | 30,412,385 | |
| | | | | | | | | | | | |
The accompanying notes are an integral part of these financial statements.
| | | | | | |
| Portfolio of investments—March 31, 2016 | | Wells Fargo Specialized Technology Fund | | | 11 | |
| | | | | | | | | | | | | | |
Security name
| | | | | | | Shares | | | Value | |
| | | |
Telecommunication Services: 2.69% | | | | | | | | | | | |
| | | |
| Diversified Telecommunication Services: 2.69% | | | | | | | | | | | |
AT&T Incorporated | | | | | | | | | 123,339 | | | $ | 4,831,189 | |
Verizon Communications Incorporated | | | | | | | | | 66,971 | | | | 3,621,792 | |
| | | | |
| | | | | | | | | | | | | 8,452,981 | |
| | | | | | | | | | | | | | |
| | | | |
Total Common Stocks (Cost $242,733,193) | | | | | | | | | | | | | 309,390,886 | |
| | | | | | | | | | | | | | |
| | | | |
| | | Yield | | | | | | | | | |
| Short-Term Investments: 4.07% | | | | | | | | | | | | | | |
| | | | |
| Investment Companies: 4.07% | | | | | | | | | | | | | | |
Securities Lending Cash Investments LLC (l)(r)(u) | | | 0.43 | % | | | | | 8,260,400 | | | | 8,260,400 | |
Wells Fargo Cash Investment Money Market Fund Select Class (l)(u) | | | 0.44 | | | | | | 4,530,239 | | | | 4,530,239 | |
| | | | |
Total Short-Term Investments (Cost $12,790,639) | | | | | | | | | | | | | 12,790,639 | |
| | | | | | | | | | | | | | |
| | | | | | | | |
| Total investments in securities (Cost $255,523,832) * | | | 102.57 | % | | | 322,181,525 | |
Other assets and liabilities, net | | | (2.57 | ) | | | (8,077,755 | ) |
| | | | | | | | |
| Total net assets | | | 100.00 | % | | $ | 314,103,770 | |
| | | | | | | | |
| « | All or a portion of this security is on loan. |
| † | Non-income-earning security |
| (l) | The issuer of the security is an affiliated person of the Fund as defined in the Investment Company Act of 1940. |
| (r) | The investment is a non-registered investment vehicle purchased with cash collateral received from securities on loan. |
| (u) | The rate represents the 7-day annualized yield at period end. |
| * | Cost for federal income tax purposes is $259,864,431 and unrealized gains (losses) consists of: |
| | | | |
Gross unrealized gains | | $ | 67,097,192 | |
Gross unrealized losses | | | (4,780,098 | ) |
| | | | |
Net unrealized gains | | $ | 62,317,094 | |
The accompanying notes are an integral part of these financial statements.
| | | | |
| 12 | | Wells Fargo Specialized Technology Fund | | Statement of assets and liabilities—March 31, 2016 |
| | | | |
| | | | |
| |
Assets | | | | |
Investments | | | | |
In unaffiliated securities (including $8,074,518 of securities loaned), at value (cost $242,733,193) | | $ | 309,390,886 | |
In affiliated securities, at value (cost $12,790,639) | | | 12,790,639 | |
| | | | |
Total investments, at value (cost $255,523,832) | | | 322,181,525 | |
Cash | | | 16,994 | |
Foreign currency, at value (cost $14) | | | 13 | |
Receivable for investments sold | | | 1,715,226 | |
Receivable for Fund shares sold | | | 458,372 | |
Receivable for dividends | | | 89,599 | |
Receivable for securities lending income | | | 2,310 | |
Prepaid expenses and other assets | | | 16,659 | |
| | | | |
Total assets | | | 324,480,698 | |
| | | | |
| |
Liabilities | | | | |
Payable for investments purchased | | | 1,648,054 | |
Payable for Fund shares redeemed | | | 83,183 | |
Payable upon receipt of securities loaned | | | 8,260,400 | |
Management fee payable | | | 230,426 | |
Distribution fees payable | | | 8,558 | |
Administration fees payable | | | 51,976 | |
Accrued expenses and other liabilities | | | 94,331 | |
| | | | |
Total liabilities | | | 10,376,928 | |
| | | | |
Total net assets | | $ | 314,103,770 | |
| | | | |
| |
NET ASSETS CONSIST OF | | | | |
Paid-in capital | | $ | 234,303,815 | |
Accumulated net investment loss | | | (250,851 | ) |
Accumulated net realized gains on investments | | | 13,393,114 | |
Net unrealized gains on investments | | | 66,657,692 | |
| | | | |
Total net assets | | $ | 314,103,770 | |
| | | | |
| |
COMPUTATION OF NET ASSET VALUE AND OFFERING PRICE PER SHARE | | | | |
Net assets – Class A | | $ | 267,811,347 | |
Shares outstanding – Class A1 | | | 28,524,681 | |
Net asset value per share – Class A | | | $9.39 | |
Maximum offering price per share – Class A2 | | | $9.96 | |
Net assets – Class B | | $ | 122,276 | |
Shares outstanding – Class B1 | | | 15,382 | |
Net asset value per share – Class B | | | $7.95 | |
Net assets – Class C | | $ | 13,797,110 | |
Shares outstanding – Class C1 | | | 1,741,448 | |
Net asset value per share – Class C | | | $7.92 | |
Net assets – Administrator Class | | $ | 32,373,037 | |
Shares outstanding – Administrator Class1 | | | 3,401,546 | |
Net asset value per share – Administrator Class | | | $9.52 | |
| 1 | The Fund has an unlimited number of authorized shares. |
| 2 | Maximum offering price is computed as 100/94.25 of net asset value. On investments of $50,000 or more, the offering price is reduced. |
The accompanying notes are an integral part of these financial statements.
| | | | | | |
| Statement of operations—year ended March 31, 2016 | | Wells Fargo Specialized Technology Fund | | | 13 | |
| | | | |
| | | | |
| |
Investment income | | | | |
Dividends (net of foreign withholding taxes of $10,462) | | $ | 2,643,652 | |
Securities lending income, net | | | 100,520 | |
Income from affiliated securities | | | 39,298 | |
| | | | |
Total investment income | | | 2,783,470 | |
| | | | |
| |
Expenses | | | | |
Management fee | | | 2,937,314 | |
Administration fees | | | | |
Class A | | | 466,252 | |
Class B | | | 335 | |
Class C | | | 32,011 | |
Administrator Class | | | 38,906 | |
Investor Class | | | 218,304 | 1 |
Shareholder servicing fees | | | | |
Class A | | | 529,441 | |
Class B | | | 371 | |
Class C | | | 35,925 | |
Administrator Class | | | 79,526 | |
Investor Class | | | 170,334 | 1 |
Distribution fees | | | | |
Class B | | | 1,113 | |
Class C | | | 107,775 | |
Custody and accounting fees | | | 48,088 | |
Professional fees | | | 43,449 | |
Registration fees | | | 68,175 | |
Shareholder report expenses | | | 64,961 | |
Trustees’ fees and expenses | | | 18,659 | |
Other fees and expenses | | | 13,940 | |
| | | | |
Total expenses | | | 4,874,879 | |
Less: Fee waivers and/or expense reimbursements | | | (15,252 | ) |
| | | | |
Net expenses | | | 4,859,627 | |
| | | | |
Net investment loss | | | (2,076,157 | ) |
| | | | |
| |
REALIZED AND UNREALIZED GAINS (LOSSES) ON INVESTMENTS | | | | |
| |
Net realized gains on: | | | | |
Unaffiliated securities | | | 14,442,549 | |
Forward foreign currency contract transactions | | | 79,310 | |
| | | | |
Net realized gains on investments | | | 14,521,859 | |
Net change in unrealized gains (losses) on investments | | | (15,139,717 | ) |
| | | | |
Net realized and unrealized gains (losses) on investments | | | (617,858 | ) |
| | | | |
Net decrease in net assets resulting from operations | | $ | (2,694,015 | ) |
| | | | |
| 1 | For the period from April 1, 2015 to October 23, 2015. Effective at the close of business on October 23, 2015, Investor Class shares were converted to Class A shares and are no longer offered by the Fund. |
The accompanying notes are an integral part of these financial statements.
| | | | |
| 14 | | Wells Fargo Specialized Technology Fund | | Statement of changes in net assets |
| | | | | | | | | | | | | | | | |
| | | Year ended
March 31, 2016 | | | Year ended
March 31, 2015 | |
| | | | |
Operations | | | | | | | | | | | | | | | | |
Net investment loss | | | | | | $ | (2,076,157 | ) | | | | | | $ | (1,928,741 | ) |
Net realized gains on investments | | | | | | | 14,521,859 | | | | | | | | 39,950,258 | |
Net change in unrealized gains (losses) on investments | | | | | | | (15,139,717 | ) | | | | | | | 1,502,311 | |
| | | | |
Net increase (decrease) in net assets resulting from operations | | | | | | | (2,694,015 | ) | | | | | | | 39,523,828 | |
| | | | |
| | | | |
Distributions to shareholders from | | | | | | | | | | | | | | | | |
Net realized gains | | | | | | | | | | | | | | | | |
Class A | | | | | | | (33,866,092 | ) | | | | | | | (18,125,259 | ) |
Class B | | | | | | | (18,254 | ) | | | | | | | (22,156 | ) |
Class C | | | | | | | (2,084,431 | ) | | | | | | | (1,636,338 | ) |
Administrator Class | | | | | | | (3,712,334 | ) | | | | | | | (3,932,263 | ) |
Investor Class | | | | | | | 0 | 1 | | | | | | | (12,824,710 | ) |
| | | | |
Total distributions to shareholders | | | | | | | (39,681,111 | ) | | | | | | | (36,540,726 | ) |
| | | | |
| | | | |
Capital share transactions | | | Shares | | | | | | | | Shares | | | | | |
Proceeds from shares sold | | | | | | | | | | | | | | | | |
Class A | | | 12,556,326 | | | | 135,884,127 | | | | 1,762,029 | | | | 19,362,721 | |
Class B | | | 2,502 | | | | 23,835 | | | | 2,720 | | | | 25,600 | |
Class C | | | 330,874 | | | | 3,019,167 | | | | 408,438 | | | | 3,904,420 | |
Administrator Class | | | 964,355 | | | | 9,840,317 | | | | 967,647 | | | | 10,482,691 | |
Investor Class | | | 822,710 | 1 | | | 8,868,739 | 1 | | | 1,543,345 | | | | 16,797,703 | |
| | | | |
| | | | | | | 157,636,185 | | | | | | | | 50,573,135 | |
| | | | |
Reinvestment of distributions | | | | | | | | | | | | | | | | |
Class A | | | 3,418,828 | | | | 32,889,128 | | | | 1,669,631 | | | | 17,397,551 | |
Class B | | | 2,234 | | | | 18,254 | | | | 2,371 | | | | 21,580 | |
Class C | | | 233,582 | | | | 1,901,356 | | | | 156,108 | | | | 1,415,903 | |
Administrator Class | | | 335,670 | | | | 3,272,786 | | | | 336,308 | | | | 3,541,324 | |
Investor Class | | | 0 | 1 | | | 0 | 1 | | | 1,223,851 | | | | 12,617,907 | |
| | | | |
| | | | | | | 38,081,524 | | | | | | | | 34,994,265 | |
| | | | |
Payment for shares redeemed | | | | | | | | | | | | | | | | |
Class A | | | (3,097,245 | ) | | | (30,864,012 | ) | | | (2,321,229 | ) | | | (25,436,134 | ) |
Class B | | | (9,094 | ) | | | (82,246 | ) | | | (22,695 | ) | | | (223,733 | ) |
Class C | | | (338,441 | ) | | | (2,967,650 | ) | | | (200,360 | ) | | | (1,924,869 | ) |
Administrator Class | | | (830,486 | ) | | | (8,685,149 | ) | | | (1,322,475 | ) | | | (14,127,800 | ) |
Investor Class | | | (12,028,498 | )1 | | | (129,965,727 | )1 | | | (1,422,163 | ) | | | (15,304,661 | ) |
| | | | |
| | | | | | | (172,564,784 | ) | | | | | | | (57,017,197 | ) |
| | | | |
Net increase in net assets resulting from capital share transactions | | | | | | | 23,152,925 | | | | | | | | 28,550,203 | |
| | | | |
Total increase (decrease) in net assets | | | | | | | (19,222,201 | ) | | | | | | | 31,533,305 | |
| | | | |
| | | | |
Net assets | | | | | | | | | | | | | | | | |
Beginning of period | | | | | | | 333,325,971 | | | | | | | | 301,792,666 | |
| | | | |
End of period | | | | | | $ | 314,103,770 | | | | | | | $ | 333,325,971 | |
| | | | |
Accumulated net investment loss | | | | | | $ | (250,851 | ) | | | | | | $ | (539,030 | ) |
| | | | |
| 1 | For the period from April 1, 2015 to October 23, 2015. Effective at the close of business on October 23, 2015, Investor Class shares were converted to Class A shares and are no longer offered by the Fund. |
The accompanying notes are an integral part of these financial statements.
| | | | | | |
| Financial highlights | | Wells Fargo Specialized Technology Fund | | | 15 | |
(For a share outstanding throughout each period)
| | | | | | | | | | | | | | | | | | | | |
| | | Year ended March 31 | |
| CLASS A | | 2016 | | | 2015 | | | 2014 | | | 2013 | | | 2012 | |
Net asset value, beginning of period | | | $10.74 | | | | $10.65 | | | | $8.15 | | | | $8.40 | | | | $8.88 | |
Net investment loss | | | (0.06 | ) | | | (0.06 | ) | | | (0.06 | ) | | | (0.03 | )1 | | | (0.07 | ) |
Net realized and unrealized gains (losses) on investments | | | 0.02 | | | | 1.43 | | | | 3.07 | | | | (0.00 | )2 | | | (0.05 | ) |
| | | | | | | | | | | | | | | | | | | | |
Total from investment operations | | | (0.04 | ) | | | 1.37 | | | | 3.01 | | | | (0.03 | ) | | | (0.12 | ) |
Distributions to shareholders from | | | | | | | | | | | | | | | | | | | | |
Net realized gains | | | (1.31 | ) | | | (1.28 | ) | | | (0.51 | ) | | | (0.22 | ) | | | (0.36 | ) |
Net asset value, end of period | | | $9.39 | | | | $10.74 | | | | $10.65 | | | | $8.15 | | | | $8.40 | |
Total return3 | | | (0.66 | )% | | | 13.24 | % | | | 37.27 | % | | | (0.17 | )% | | | (0.74 | )% |
Ratios to average net assets (annualized) | | | | | | | | | | | | | | | | | | | | |
Gross expenses | | | 1.45 | % | | | 1.52 | % | | | 1.60 | % | | | 1.64 | % | | | 1.70 | % |
Net expenses | | | 1.45 | % | | | 1.51 | % | | | 1.56 | % | | | 1.63 | % | | | 1.70 | % |
Net investment loss | | | (0.53 | )% | | | (0.58 | )% | | | (0.63 | )% | | | (0.34 | )% | | | (0.92 | )% |
Supplemental data | | | | | | | | | | | | | | | | | | | | |
Portfolio turnover rate | | | 153 | % | | | 119 | % | | | 132 | % | | | 127 | % | | | 169 | % |
Net assets, end of period (000s omitted) | | | $267,811 | | | | $168,108 | | | | $154,833 | | | | $115,145 | | | | $144,308 | |
| 1 | Calculated based upon average shares outstanding |
| 2 | Amount is less than $0.005. |
| 3 | Total return calculations do not include any sales charges. |
The accompanying notes are an integral part of these financial statements.
| | | | |
| 16 | | Wells Fargo Specialized Technology Fund | | Financial highlights |
(For a share outstanding throughout each period)
| | | | | | | | | | | | | | | | | | | | |
| | | Year ended March 31 | |
| CLASS B | | 2016 | | | 2015 | | | 2014 | | | 2013 | | | 2012 | |
Net asset value, beginning of period | | | $9.36 | | | | $9.50 | | | | $7.37 | | | | $7.67 | | | | $8.20 | |
Net investment loss | | | (0.12 | )1 | | | (0.13 | )1 | | | (0.12 | )1 | | | (0.08 | )1 | | | (0.13 | )1 |
Net realized and unrealized gains (losses) on investments | | | 0.02 | | | | 1.27 | | | | 2.76 | | | | (0.00 | )2 | | | (0.04 | ) |
| | | | | | | | | | | | | | | | | | | | |
Total from investment operations | | | (0.10 | ) | | | 1.14 | | | | 2.64 | | | | (0.08 | ) | | | (0.17 | ) |
Distributions to shareholders from | | | | | | | | | | | | | | | | | | | | |
Net realized gains | | | (1.31 | ) | | | (1.28 | ) | | | (0.51 | ) | | | (0.22 | ) | | | (0.36 | ) |
Net asset value, end of period | | | $7.95 | | | | $9.36 | | | | $9.50 | | | | $7.37 | | | | $7.67 | |
Total return3 | | | (1.44 | )% | | | 12.40 | % | | | 36.18 | % | | | (0.84 | )% | | | (1.54 | )% |
Ratios to average net assets (annualized) | | | | | | | | | | | | | | | | | | | | |
Gross expenses | | | 2.20 | % | | | 2.28 | % | | | 2.35 | % | | | 2.39 | % | | | 2.45 | % |
Net expenses | | | 2.20 | % | | | 2.27 | % | | | 2.32 | % | | | 2.38 | % | | | 2.45 | % |
Net investment loss | | | (1.37 | )% | | | (1.34 | )% | | | (1.36 | )% | | | (1.09 | )% | | | (1.69 | )% |
Supplemental data | | | | | | | | | | | | | | | | | | | | |
Portfolio turnover rate | | | 153 | % | | | 119 | % | | | 132 | % | | | 127 | % | | | 169 | % |
Net assets, end of period (000s omitted) | | | $122 | | | | $185 | | | | $355 | | | | $473 | | | | $851 | |
| 1 | Calculated based upon average shares outstanding |
| 2 | Amount is less than $0.005. |
| 3 | Total return calculations do not include any sales charges. |
The accompanying notes are an integral part of these financial statements.
| | | | | | |
| Financial highlights | | Wells Fargo Specialized Technology Fund | | | 17 | |
(For a share outstanding throughout each period)
| | | | | | | | | | | | | | | | | | | | |
| | | Year ended March 31 | |
| CLASS C | | 2016 | | | 2015 | | | 2014 | | | 2013 | | | 2012 | |
Net asset value, beginning of period | | | $9.33 | | | | $9.47 | | | | $7.35 | | | | $7.65 | | | | $8.18 | |
Net investment loss | | | (0.12 | )1 | | | (0.13 | )1 | | | (0.12 | )1 | | | (0.08 | )1 | | | (0.12 | )1 |
Net realized and unrealized gains (losses) on investments | | | 0.02 | | | | 1.27 | | | | 2.75 | | | | (0.00 | )2 | | | (0.05 | ) |
| | | | | | | | | | | | | | | | | | | | |
Total from investment operations | | | (0.10 | ) | | | 1.14 | | | | 2.63 | | | | (0.08 | ) | | | (0.17 | ) |
Distributions to shareholders from | | | | | | | | | | | | | | | | | | | | |
Net realized gains | | | (1.31 | ) | | | (1.28 | ) | | | (0.51 | ) | | | (0.22 | ) | | | (0.36 | ) |
Net asset value, end of period | | | $7.92 | | | | $9.33 | | | | $9.47 | | | | $7.35 | | | | $7.65 | |
Total return3 | | | (1.45 | )% | | | 12.44 | % | | | 36.14 | % | | | (0.84 | )% | | | (1.55 | )% |
Ratios to average net assets (annualized) | | | | | | | | | | | | | | | | | | | | |
Gross expenses | | | 2.20 | % | | | 2.27 | % | | | 2.35 | % | | | 2.39 | % | | | 2.45 | % |
Net expenses | | | 2.20 | % | | | 2.26 | % | | | 2.31 | % | | | 2.38 | % | | | 2.45 | % |
Net investment loss | | | (1.34 | )% | | | (1.33 | )% | | | (1.38 | )% | | | (1.09 | )% | | | (1.66 | )% |
Supplemental data | | | | | | | | | | | | | | | | | | | | |
Portfolio turnover rate | | | 153 | % | | | 119 | % | | | 132 | % | | | 127 | % | | | 169 | % |
Net assets, end of period (000s omitted) | | | $13,797 | | | | $14,143 | | | | $10,907 | | | | $6,563 | | | | $7,194 | |
| 1 | Calculated based upon average shares outstanding |
| 2 | Amount is less than $0.005. |
| 3 | Total return calculations do not include any sales charges. |
The accompanying notes are an integral part of these financial statements.
| | | | |
| 18 | | Wells Fargo Specialized Technology Fund | | Financial highlights |
(For a share outstanding throughout each period)
| | | | | | | | | | | | | | | | | | | | |
| | | Year ended March 31 | |
| ADMINISTRATOR CLASS | | 2016 | | | 2015 | | | 2014 | | | 2013 | | | 2012 | |
Net asset value, beginning of period | | | $10.86 | | | | $10.74 | | | | $8.20 | | | | $8.43 | | | | $8.88 | |
Net investment loss | | | (0.05 | ) | | | (0.05 | ) | | | (0.05 | ) | | | (0.01 | )1 | | | (0.06 | ) |
Net realized and unrealized gains (losses) on investments | | | 0.02 | | | | 1.45 | | | | 3.10 | | | | (0.00 | )2 | | | (0.03 | ) |
| | | | | | | | | | | | | | | | | | | | |
Total from investment operations | | | (0.03 | ) | | | 1.40 | | | | 3.05 | | | | (0.01 | ) | | | (0.09 | ) |
Distributions to shareholders from | | | | | | | | | | | | | | | | | | | | |
Net realized gains | | | (1.31 | ) | | | (1.28 | ) | | | (0.51 | ) | | | (0.22 | ) | | | (0.36 | ) |
Net asset value, end of period | | | $9.52 | | | | $10.86 | | | | $10.74 | | | | $8.20 | | | | $8.43 | |
Total return | | | (0.56 | )% | | | 13.42 | % | | | 37.54 | % | | | 0.07 | % | | | (0.51 | )% |
Ratios to average net assets (annualized) | | | | | | | | | | | | | | | | | | | | |
Gross expenses | | | 1.35 | % | | | 1.36 | % | | | 1.44 | % | | | 1.48 | % | | | 1.53 | % |
Net expenses | | | 1.33 | % | | | 1.35 | % | | | 1.40 | % | | | 1.42 | % | | | 1.50 | % |
Net investment loss | | | (0.48 | )% | | | (0.42 | )% | | | (0.48 | )% | | | (0.14 | )% | | | (0.64 | )% |
Supplemental data | | | | | | | | | | | | | | | | | | | | |
Portfolio turnover rate | | | 153 | % | | | 119 | % | | | 132 | % | | | 127 | % | | | 169 | % |
Net assets, end of period (000s omitted) | | | $32,373 | | | | $31,842 | | | | $31,681 | | | | $17,008 | | | | $7,546 | |
| 1 | Calculated based upon average shares outstanding |
| 2 | Amount is less than $0.005. |
The accompanying notes are an integral part of these financial statements.
| | | | | | |
| Notes to financial statements | | Wells Fargo Specialized Technology Fund | | | 19 | |
1. ORGANIZATION
Wells Fargo Funds Trust (the “Trust”), a Delaware statutory trust organized on March 10, 1999, is an open-end management investment company registered under the Investment Company Act of 1940, as amended (the “1940 Act”). As an investment company, the Trust follows the accounting and reporting guidance in Financial Accounting Standards Board (“FASB”) Accounting Standards Codification Topic 946, Financial Services – Investment Companies. These financial statements report on the Wells Fargo Specialized Technology Fund (the “Fund”) which is a non-diversified series of the Trust.
Effective at the close of business on October 23, 2015, Investor Class shares became Class A shares in a tax-free conversion. Shareholders of Investor Class received Class A shares at a value equal to the value of their Investor Class shares immediately prior to the conversion. Investor Class shares are no longer offered by the Fund.
2. SIGNIFICANT ACCOUNTING POLICIES
The following significant accounting policies, which are consistently followed in the preparation of the financial statements of the Fund, are in conformity with U.S. generally accepted accounting principles which require management to make estimates and assumptions that affect the reported amounts of assets and liabilities, disclosure of contingent assets and liabilities at the date of the financial statements, and the reported amounts of revenues and expenses during the reporting period. Actual results could differ from those estimates.
Securities valuation
All investments are valued each business day as of the close of regular trading on the New York Stock Exchange (generally 4 p.m. Eastern Time), although the Fund may deviate from this calculation time under unusual or unexpected circumstances.
Equity securities that are listed on a foreign or domestic exchange or market are valued at the official closing price or, if none, the last sales price. If no sale occurs on the principal exchange or market that day, the prior day’s price will be deemed “stale” and a fair value price will be determined in accordance with the Fund’s Valuation Procedures.
The values of securities denominated in foreign currencies are translated into U.S. dollars at rates provided by an independent foreign currency pricing source at a time each business day specified by the Management Valuation Team of Wells Fargo Funds Management, LLC (“Funds Management”).
Many securities markets and exchanges outside the U.S. close prior to the close of the New York Stock Exchange and therefore may not fully reflect trading or events that occur after the close of the principal exchange in which the foreign securities are traded, but before the close of the New York Stock Exchange. If such trading or events are expected to materially affect the value of such securities, then fair value pricing procedures approved by the Board of Trustees of the Fund are applied. These procedures take into account multiple factors including movements in U.S. securities markets after foreign exchanges close. Foreign securities that are fair valued under these procedures are categorized as Level 2 and the application of these procedures may result in transfers between Level 1 and Level 2. Depending on market activity, such fair valuations may be frequent. Such fair value pricing may result in net asset values that are higher or lower than net asset values based on the last reported sales price or latest quoted bid price. On March 31, 2016, such fair value pricing was not used in pricing foreign securities.
Investments in registered open-end investment companies are valued at net asset value. Interests in non-registered investment vehicles that are redeemable at net asset value are fair valued normally at net asset value.
Investments which are not valued using any of the methods discussed above are valued at their fair value, as determined in good faith by the Board of Trustees. The Board of Trustees has established a Valuation Committee comprised of the Trustees and has delegated to it the authority to take any actions regarding the valuation of portfolio securities that the Valuation Committee deems necessary or appropriate, including determining the fair value of portfolio securities, unless the determination has been delegated to the Management Valuation Team. The Board of Trustees retains the authority to make or ratify any valuation decisions or approve any changes to the Valuation Procedures as it deems appropriate. On a quarterly basis, the Board of Trustees receives reports on any valuation actions taken by the Valuation Committee or the Management Valuation Team which may include items for ratification.
Valuations of fair valued securities are compared to the next actual sales price when available, or other appropriate market values, to assess the continued appropriateness of the fair valuation methodologies used. These securities are fair valued on a day-to-day basis, taking into consideration changes to appropriate market information and any significant changes to the inputs considered in the valuation process until there is a readily available price provided on an exchange or by an independent pricing service. Valuations received from an independent pricing service or independent
| | | | |
| 20 | | Wells Fargo Specialized Technology Fund | | Notes to financial statements |
broker-dealer quotes are periodically validated by comparisons to most recent trades and valuations provided by other independent pricing services in addition to the review of prices by the manager and/or subadviser. Unobservable inputs used in determining fair valuations are identified based on the type of security, taking into consideration factors utilized by market participants in valuing the investment, knowledge about the issuer and the current market environment.
Foreign currency translation
The accounting records of the Fund are maintained in U.S. dollars. The values of other assets and liabilities denominated in foreign currencies are translated into U.S. dollars at rates provided by an independent foreign currency pricing source at a time each business day specified by the Management Valuation Team. Purchases and sales of securities, and income and expenses are converted at the rate of exchange on the respective dates of such transactions. Net realized foreign exchange gains or losses arise from sales of foreign currencies, currency gains or losses realized between the trade and settlement dates on securities transactions, and the difference between the amounts of dividends, interest and foreign withholding taxes recorded and the U.S. dollar equivalent of the amounts actually paid or received. Net unrealized foreign exchange gains and losses arise from changes in the fair value of assets and liabilities other than investments in securities resulting from changes in exchange rates. The changes in net assets arising from changes in exchange rates and the changes in net assets resulting from changes in market prices of securities are not separately presented. Such changes are included in net realized and unrealized gains or losses from investments.
Forward foreign currency contracts
The Fund is subject to foreign currency exchange rate risk in the normal course of pursuing its investment objectives. A forward foreign currency contract is an agreement between two parties to purchase or sell a specific currency for an agreed-upon price at a future date. The Fund enters into forward foreign currency contracts to facilitate transactions in foreign-denominated securities and to attempt to minimize the risk to the Fund from adverse changes in the relationship between currencies. Forward foreign currency contracts are recorded at the forward rate and marked-to-market daily. When the contracts are closed, realized gains and losses arising from such transactions are recorded as realized gains or losses on forward foreign currency contract transactions. The Fund could be exposed to risks if the counterparties to the contracts are unable to meet the terms of their contracts or if the value of the foreign currency changes unfavorably. The Fund’s maximum risk of loss from counterparty credit risk is the unrealized gains on the contracts. This risk may be mitigated if there is a master netting arrangement between the Fund and the counterparty.
Security loans
The Fund may lend its securities from time to time in order to earn additional income in the form of fees or interest on securities received as collateral or the investment of any cash received as collateral. The Fund continues to receive interest or dividends on the securities loaned. The Fund receives collateral in the form of cash or securities with a value at least equal to the value of the securities on loan. The value of the loaned securities is determined at the close of each business day and any additional required collateral is delivered to the Fund on the next business day. In a securities lending transaction, the net asset value of the Fund will be affected by an increase or decrease in the value of the securities loaned and by an increase or decrease in the value of the instrument in which collateral is invested. The amount of securities lending activity undertaken by the Fund fluctuates from time to time. In the event of default or bankruptcy by the borrower, the Fund may be prevented from recovering the loaned securities or gaining access to the collateral or may experience delays or costs in doing so. In addition, the investment of any cash collateral received may lose all or part of its value. The Fund has the right under the lending agreement to recover the securities from the borrower on demand.
The Fund lends its securities through an unaffiliated securities lending agent. Cash collateral received in connection with its securities lending transactions is invested in Securities Lending Cash Investments, LLC (the “Securities Lending Fund”). The Securities Lending Fund is exempt from registration under Section 3(c)(7) of the 1940 Act and is managed by Funds Management and is subadvised by Wells Capital Management Incorporated (“WellsCap”), an affiliate of Funds Management and an indirect wholly owned subsidiary of Wells Fargo & Company (“Wells Fargo”). Funds Management receives an advisory fee starting at 0.05% and declining to 0.01% as the average daily net assets of the Securities Lending Fund increase. All of the fees received by Funds Management are paid to WellsCap for its services as subadviser. The Securities Lending Fund seeks to provide a positive return compared to the daily Fed Funds Open rate by investing in high-quality, U.S. dollar-denominated short-term money market instruments. Securities Lending Fund investments are fair valued based upon the amortized cost valuation technique. Income earned from investment in the Securities Lending Fund is included in securities lending income on the Statement of Operations.
Security transactions and income recognition
Securities transactions are recorded on a trade date basis. Realized gains or losses are recorded on the basis of identified cost.
| | | | | | |
| Notes to financial statements | | Wells Fargo Specialized Technology Fund | | | 21 | |
Dividend income is recognized on the ex-dividend date, except for certain dividends from foreign securities, which are recorded as soon as the custodian verifies the ex-dividend date. Dividend income from foreign securities is recorded net of foreign taxes withheld where recovery of such taxes is not assured.
Distributions to shareholders
Distributions to shareholders from net investment income and net realized gains, if any, are recorded on the ex-dividend date. Such distributions are determined in conformity with federal income tax regulations, which may differ in amount or character from net investment income and realized gains recognized for purposes of U.S. generally accepted accounting principles.
Federal and other taxes
The Fund intends to continue to qualify as a regulated investment company by distributing substantially all of its investment company taxable income and any net realized capital gains (after reduction for capital loss carryforwards) sufficient to relieve it from all, or substantially all, federal income taxes. Accordingly, no provision for federal income taxes was required.
The Fund’s income and federal excise tax returns and all financial records supporting those returns for the prior three fiscal years are subject to examination by the federal and Delaware revenue authorities. Management has analyzed the Fund’s tax positions taken on federal, state, and foreign tax returns for all open tax years and does not believe that there are any uncertain tax positions that require recognition of a tax liability.
Reclassifications are made to the Fund’s capital accounts for permanent tax differences to reflect income and gains available for distribution (or available capital loss carryforwards) under federal income tax regulations. U.S. generally accepted accounting principles require that certain components of net assets be adjusted to reflect permanent differences between financial and tax reporting. These reclassifications have no effect on net assets or net asset values per share. The primary permanent difference causing such reclassifications is due to net operating losses. At March 31, 2016, as a result of permanent book-to-tax differences, the following reclassification adjustments were made on the Statement of Assets and Liabilities:
| | | | |
| Paid-in capital | | Accumulated net
investment loss | | Accumulated net
realized gains
on investments |
| $(2,418,981) | | $2,364,336 | | $54,645 |
As of March 31, 2016, the Fund had a qualified late-year ordinary loss of $250,851 which will be recognized on the first day of the following fiscal year.
Class allocations
The separate classes of shares offered by the Fund differ principally in applicable sales charges, distribution, shareholder servicing, and administration fees. Class specific expenses are charged directly to that share class. Investment income, common expenses, and realized and unrealized gains (losses) on investments are allocated daily to each class of shares based on the relative proportion of net assets of each class.
3. FAIR VALUATION MEASUREMENTS
Fair value measurements of investments are determined within a framework that has established a fair value hierarchy based upon the various data inputs utilized in determining the value of the Fund’s investments. The three-level hierarchy gives the highest priority to unadjusted quoted prices in active markets for identical assets or liabilities (Level 1) and the lowest priority to significant unobservable inputs (Level 3). The Fund’s investments are classified within the fair value hierarchy based on the lowest level of input that is significant to the fair value measurement. The inputs are summarized into three broad levels as follows:
| n | | Level 1 – quoted prices in active markets for identical securities |
| n | | Level 2 – other significant observable inputs (including quoted prices for similar securities, interest rates, prepayment speeds, credit risk, use of amortized cost, etc.) |
| n | | Level 3 – significant unobservable inputs (including the Fund’s own assumptions in determining the fair value of investments) |
The inputs or methodologies used for valuing investments in securities are not necessarily an indication of the risk associated with investing in those securities.
| | | | |
| 22 | | Wells Fargo Specialized Technology Fund | | Notes to financial statements |
The following is a summary of the inputs used in valuing the Fund’s assets and liabilities as of March 31, 2016:
| | | | | | | | | | | | | | | | |
| | | Quoted prices
(Level 1) | | | Other significant
observable inputs
(Level 2) | | | Significant
unobservable inputs (Level 3) | | | Total | |
Assets | | | | | | | | | | | | | | | | |
Investments in: | | | | | | | | | | | | | | | | |
| | | | |
Common stocks | | | | | | | | | | | | | | | | |
Consumer discretionary | | $ | 27,568,336 | | | $ | 0 | | | $ | 0 | | | $ | 27,568,336 | |
Financials | | | 1,470,852 | | | | 0 | | | | 0 | | | | 1,470,852 | |
Information technology | | | 271,898,717 | | | | 0 | | | | 0 | | | | 271,898,717 | |
Telecommunication Services | | | 8,452,981 | | | | 0 | | | | 0 | | | | 8,452,981 | |
| | | | |
Short-term investments | | | | | | | | | | | | | | | | |
Investment companies | | | 4,530,239 | | | | 0 | | | | 0 | | | | 4,530,239 | |
Investments measured at net asset value* | | | | | | | | | | | | | | | 8,260,400 | |
| | | $ | 313,921,125 | | | $ | 0 | | | $ | 0 | | | $ | 322,181,525 | |
| * | Investments that are measured at fair value using the net asset value per share (or its equivalent) as a practical expedient have not been categorized in the fair value hierarchy. The fair value amount presented in the table is intended to permit reconciliation of the fair value hierarchy to the amounts presented in the Statement of Assets and Liabilities. The Fund’s investment in Securities Lending Cash Investments, LLC valued at $8,260,400 does not have a redemption period notice, can be redeemed daily and does not have any unfunded commitments. |
The Fund recognizes transfers between levels within the fair value hierarchy at the end of the reporting period. At March 31, 2016, the Fund did not have any transfers into/out of Level 1, Level 2, or Level 3.
4. TRANSACTIONS WITH AFFILIATES AND OTHER EXPENSES
Management fee
Funds Management, an indirect wholly owned subsidiary of Wells Fargo, is the manager of the Fund and provides advisory and fund-level administrative services under an investment management agreement. Under the investment management agreement, Funds Management is responsible for, among other services, implementing the investment objectives and strategies of the Fund, supervising the applicable subadviser, providing fund-level administrative services in connection with the Fund’s operations, and providing any other fund-level administrative services reasonably necessary for the operation of the Fund. As compensation for its services under the investment management agreement, Funds Management is entitled to receive an annual management fee starting at 0.90% and declining to 0.78% as the average daily net assets of the Fund increase.
Prior to July 1, 2015, Funds Management provided advisory services pursuant to an investment advisory agreement and was entitled to receive an annual fee which started at 0.85% and declined to 0.75% as the average daily net assets of the Fund increased. In addition, fund-level administrative services were provided by Funds Management under a separate administration agreement at an annual fee which started at 0.05% and declined to 0.03% as the average daily net assets of the Fund increased. For financial statement purposes, the advisory fee and fund-level administration fee for the year ended March 31, 2016 have been included in management fee on the Statement of Operations.
For the year ended March 31, 2016, the management fee was equivalent to an annual rate of 0.90% of the Fund’s average daily net assets.
Funds Management has retained the services of a subadviser to provide daily portfolio management to the Fund. The fee for subadvisory services is borne by Funds Management. Allianz Global Investors U.S. LLC, is the subadviser to the Fund and is entitled to receive a fee from Funds Management at an annual rate starting at 0.80% and declining to 0.55% as the average daily net assets of the Fund increase. Prior to July 1, 2015, the subadviser received a fee at an annual rate which started at 0.90% and declined to 0.55% as the average daily net assets of the Fund increased.
| | | | | | |
| Notes to financial statements | | Wells Fargo Specialized Technology Fund | | | 23 | |
Administration fees
Under a class-level administration agreement, Funds Management provides class-level administrative services to the Fund, which includes paying fees and expenses for services provided by the transfer agent, sub-transfer agents, omnibus account servicers and record-keepers. As compensation for its services under the class-level administration agreement, Funds Management receives an annual fee which is calculated based on the average daily net assets of each class as follows:
| | | | | | | | |
| | | Class-level administration fee | |
| | | Current rate | | | Rate prior to
July 1, 2015 | |
Class A, Class B, Class C | | | 0.21 | % | | | 0.26 | % |
Administrator Class | | | 0.13 | | | | 0.10 | |
Investor Class | | | 0.32 | | | | 0.32 | |
Funds Management has contractually waived and/or reimbursed management and administration fees to the extent necessary to maintain certain net operating expense ratios for the Fund. Waiver of fees and/or reimbursement of expenses by Funds Management were made first from fund level expenses on a proportionate basis and then from class specific expenses. Funds Management has committed through July 31, 2016 to waive fees and/or reimburse expenses to the extent necessary to cap the Fund’s expenses at 1.50% for Class A shares, 2.25% for Class B shares, 2.25% for Class C shares, and 1.33% for Administrator Class shares. After this time, the cap may be increased or the commitment to maintain the cap may be terminated only with the approval of the Board of Trustees. Prior to July 1, 2015, the Fund’s expenses were capped at 1.35% for Administrator Class shares.
Distribution fees
The Trust has adopted a distribution plan for Class B and Class C shares of the Fund pursuant to Rule 12b-1 under the 1940 Act. Distribution fees are charged to Class B and Class C shares and paid to Wells Fargo Funds Distributor, LLC (“Funds Distributor”), the principal underwriter, at an annual rate of 0.75% of the average daily net assets of Class B and Class C shares.
In addition, Funds Distributor is entitled to receive the front-end sales charge from the purchase of Class A shares and a contingent deferred sales charge on the redemption of certain Class A shares. Funds Distributor is also entitled to receive the contingent deferred sales charges from redemptions of Class B and Class C shares. For the year ended March 31, 2016, Funds Distributor received $14,840 from the sale of Class A shares and $40 in contingent deferred sales charges from redemptions of Class C shares.
Shareholder servicing fees
The Trust has entered into contracts with one or more shareholder servicing agents, whereby each class of the Fund are charged a fee at an annual rate of 0.25% of the average daily net assets of each respective class.
A portion of these total shareholder servicing fees were paid to affiliates of Wells Fargo.
5. INVESTMENT PORTFOLIO TRANSACTIONS
Purchases and sales of investments, excluding U.S. government obligations (if any) and short-term securities, for the year ended March 31, 2016 were $478,013,902 and $489,135,033, respectively.
6. DERIVATIVE TRANSACTIONS
During the year ended March 31, 2016, the Fund entered into forward foreign currency contracts for economic hedging purposes.
As of March 31, 2016, the Fund did not have any open forward foreign currency contracts. The Fund had average contract amounts of $15,924 and $166,518 in forward foreign currency contracts to buy and forward foreign currency contracts to sell, respectively, during the year ended March 31, 2016.
The fair value, realized gains or losses and change in unrealized gains or losses, if any, on derivative instruments are reflected in the appropriate financial statements.
| | | | |
| 24 | | Wells Fargo Specialized Technology Fund | | Notes to financial statements |
7. BANK BORROWINGS
The Trust (excluding the money market funds and certain other funds) and Wells Fargo Variable Trust are parties to a $200,000,000 revolving credit agreement whereby the Fund is permitted to use bank borrowings for temporary or emergency purposes, such as to fund shareholder redemption requests. Interest under the credit agreement is charged
to the Fund based on a borrowing rate equal to the higher of the Federal Funds rate in effect on that day plus 1.25% or the overnight LIBOR rate in effect on that day plus 1.25%. In addition, an annual commitment fee equal to 0.20% of the unused balance is allocated to each participating fund. Prior to September 1, 2015, the revolving credit agreement amount was $150,000,000 and the annual commitment fee was equal to 0.10% of the unused balance which was allocated to each participating fund.
For the year ended March 31, 2016, there were no borrowings by the Fund under the agreement.
8. DISTRIBUTIONS TO SHAREHOLDERS
The tax character of distributions paid during the years ended March 31, 2016 and March 31, 2015 were as follows:
| | | | | | | | |
| | | Year ended March 31 | |
| | | 2016 | | | 2015 | |
Ordinary income | | $ | 0 | | | $ | 18,311,647 | |
Long-term capital gain | | | 39,681,111 | | | | 18,229,079 | |
As of March 31, 2016, the components of distributable earnings on a tax basis were as follows:
| | | | |
Undistributed
long-term
gain | | Unrealized
gains | | Late-year
ordinary losses
deferred |
| $17,733,712 | | $62,317,094 | | $(250,851) |
9. CONCENTRATION RISK
The Fund invests a substantial portion of its assets in technology companies and, therefore, would be more affected by changes in the technology sector than would be a fund whose investments are not heavily weighted in the sector.
10. INDEMNIFICATION
Under the Trust’s organizational documents, the officers and Trustees have been granted certain indemnification rights against certain liabilities that may arise out of performance of their duties to the Trust. Additionally, in the normal course of business, the Trust may enter into contracts with service providers that contain a variety of indemnification clauses. The Trust’s maximum exposure under these arrangements is dependent on future claims that may be made against the Fund and, therefore, cannot be estimated.
| | | | | | |
| Report of independent registered public accounting firm | | Wells Fargo Specialized Technology Fund | | | 25 | |
BOARD OF TRUSTEES AND SHAREHOLDERS OF WELLS FARGO FUNDS TRUST:
We have audited the accompanying statement of assets and liabilities, including the portfolio of investments, of the Wells Fargo Specialized Technology Fund (formerly known as Wells Fargo Advantage Specialized Technology Fund) (the “Fund”), one of the funds constituting the Wells Fargo Funds Trust, as of March 31, 2016, and the related statement of operations for the year then ended, the statements of changes in net assets for each of the years in the two-year period then ended, and the financial highlights for each of the years in the five-year period then ended. These financial statements and financial highlights are the responsibility of the Fund’s management. Our responsibility is to express an opinion on these financial statements and financial highlights based on our audits.
We conducted our audits in accordance with the standards of the Public Company Accounting Oversight Board (United States). Those standards require that we plan and perform the audit to obtain reasonable assurance about whether the financial statements and financial highlights are free of material misstatement. An audit includes examining, on a test basis, evidence supporting the amounts and disclosures in the financial statements. Our procedures included confirmation of securities owned as of March 31, 2016, by correspondence with custodian and brokers, or by other appropriate auditing procedures. An audit also includes assessing the accounting principles used and significant estimates made by management, as well as evaluating the overall financial statement presentation. We believe that our audits provide a reasonable basis for our opinion.
In our opinion, the financial statements and financial highlights referred to above present fairly, in all material respects, the financial position of the Wells Fargo Specialized Technology Fund as of March 31, 2016, the results of its operations for the year then ended, the changes in its net assets for each of the years in the two-year period then ended, and the financial highlights for each of the years in the five-year period then ended, in conformity with U.S. generally accepted accounting principles.

Boston, Massachusetts
May 25, 2016
| | | | |
| 26 | | Wells Fargo Specialized Technology Fund | | Other information (unaudited) |
TAX INFORMATION
Pursuant to Section 852 of the Internal Revenue Code, $39,681,111 was designated as long-term capital gain distributions for the fiscal year ended March 31, 2016.
PROXY VOTING INFORMATION
A description of the policies and procedures that the Fund uses to determine how to vote proxies relating to portfolio securities is available, upon request, by calling 1-800-222-8222, visiting our website at wellsfargofunds.com, or visiting the SEC website at sec.gov. Information regarding how the Fund voted proxies relating to portfolio securities during the most recent 12-month period ended June 30 is available on the Fund’s website at wellsfargofunds.com or by visiting the SEC website at sec.gov.
PORTFOLIO HOLDINGS INFORMATION
The complete portfolio holdings for the Fund are publicly available monthly on the Fund’s website (wellsfargofunds.com), on a one-month delayed basis. In addition, top ten holdings information (excluding derivative positions) for the Fund is publicly available on the Fund’s website on a monthly, seven-day or more delayed basis. The Fund files its complete schedule of portfolio holdings with the SEC for the first and third quarters of each fiscal year on Form N-Q, which is available by visiting the SEC website at sec.gov. In addition, the Fund’s Form N-Q may be reviewed and copied at the SEC’s Public Reference Room in Washington, DC, and at regional offices in New York City, at 233 Broadway, and in Chicago, at 175 West Jackson Boulevard, Suite 900. Information about the Public Reference Room may be obtained by calling 1-800-SEC-0330.
| | | | | | |
| Other information (unaudited) | | Wells Fargo Specialized Technology Fund | | | 27 | |
BOARD OF TRUSTEES AND OFFICERS
Each of the Trustees and Officers1 listed in the table below acts in identical capacities for each fund in the Wells Fargo family of funds, which consists of 144 mutual funds comprising the Wells Fargo Funds Trust, Wells Fargo Variable Trust, Wells Fargo Master Trust and four closed-end funds (collectively the “Fund Complex”). This table should be read in conjunction with the Prospectus and the Statement of Additional Information2. The mailing address of each Trustee and Officer is 525 Market Street, 12th Floor, San Francisco, CA 94105. Each Trustee and Officer serves an indefinite term, however, each Trustee serves such term until reaching the mandatory retirement age established by the Trustees.
Independent Trustees
| | | | | | |
Name and
year of birth | | Position held and
length of service* | | Principal occupations during past five years or longer | | Current other
public company or
investment company
directorships |
William R. Ebsworth
(Born 1957) | | Trustee, since 2015 | | Retired. From 1984 to 2013, equities analyst, portfolio manager, research director and chief financial officer at Fidelity Management and Research Company in Boston, Tokyo, and Hong Kong and retired in 2013 as Chief Investment Officer of Fidelity Strategic Advisers, Inc. where he lead a team of investment professionals managing client assets. Prior thereto, Board member of Hong Kong Securities Clearing Co., Hong Kong Options Clearing Corp., the Thailand International Fund, Ltd., Fidelity Investments Life Insurance Company, and Empire Fidelity Investments Life Insurance Company. Mr. Ebsworth is a CFA® charterholder and an Adjunct Lecturer, Finance, at Babson College. | | Asset Allocation Trust |
Jane A. Freeman
(Born 1953) | | Trustee, since 2015 | | Retired. From 2012 to 2014 and 1999 to 2008, Chief Financial Officer of Scientific Learning Corporation. From 2008 to 2012, Ms. Freeman provided consulting services related to strategic business projects. Prior to 1999, Portfolio Manager at Rockefeller & Co. and Scudder, Stevens & Clark. Board member of the Harding Loevner Funds from 1996 to 2014, serving as both Lead Independent Director and chair of the Audit Committee. Board member of the Russell Exchange Traded Funds Trust from 2011 to 2012 and the chair of the Audit Committee. Ms. Freeman is Chair of Taproot Foundation (non-profit organization), a Board Member of Ruth Bancroft Garden (non-profit organization) and an inactive chartered financial analyst. | | Asset Allocation Trust |
Peter G. Gordon
(Born 1942) | | Trustee, since 1998; Chairman, since 2005 | | Co-Founder, Retired Chairman, President and CEO of Crystal Geyser Water Company. Trustee Emeritus, Colby College. | | Asset Allocation Trust |
Isaiah Harris, Jr.
(Born 1952) | | Trustee, since 2009 | | Retired. Chairman of the Board of CIGNA Corporation since 2009, and Director since 2005. From 2003 to 2011, Director of Deluxe Corporation. Prior thereto, President and CEO of BellSouth Advertising and Publishing Corp. from 2005 to 2007, President and CEO of BellSouth Enterprises from 2004 to 2005 and President of BellSouth Consumer Services from 2000 to 2003. Emeritus member of the Iowa State University Foundation Board of Governors. Emeritus Member of the Advisory Board of Iowa State University School of Business. Advisory Board Member, Palm Harbor Academy (charter school). Advisory Board Member, Child Evangelism Fellowship (non-profit). Mr. Harris is a certified public accountant (inactive status). | | CIGNA Corporation; Asset Allocation Trust |
Judith M. Johnson
(Born 1949) | | Trustee, since 2008; Audit Committee Chairman, since 2008 | | Retired. Prior thereto, Chief Executive Officer and Chief Investment Officer of Minneapolis Employees Retirement Fund from 1996 to 2008. Ms. Johnson is an attorney, certified public accountant and a certified managerial accountant. | | Asset Allocation Trust |
David F. Larcker
(Born 1950) | | Trustee, since 2009 | | James Irvin Miller Professor of Accounting at the Graduate School of Business, Stanford University, Director of the Corporate Governance Research Initiative and Senior Faculty of The Rock Center for Corporate Governance since 2006. From 2005 to 2008, Professor of Accounting at the Graduate School of Business, Stanford University. Prior thereto, Ernst & Young Professor of Accounting at The Wharton School, University of Pennsylvania from 1985 to 2005. | | Asset Allocation Trust |
| | | | |
| 28 | | Wells Fargo Specialized Technology Fund | | Other information (unaudited) |
| | | | | | |
Name and
year of birth | | Position held and
length of service* | | Principal occupations during past five years or longer | | Current other
public company or
investment company
directorships |
Olivia S. Mitchell
(Born 1953) | | Trustee, since 2006 | | International Foundation of Employee Benefit Plans Professor, Wharton School of the University of Pennsylvania since 1993. Director of Wharton’s Pension Research Council and Boettner Center on Pensions & Retirement Research, and Research Associate at the National Bureau of Economic Research. Previously, Cornell University Professor from 1978 to 1993. | | Asset Allocation Trust |
Timothy J. Penny
(Born 1951) | | Trustee, since 1996 | | President and Chief Executive Officer of Southern Minnesota Initiative Foundation, a non-profit organization, since 2007 and Senior Fellow at the Humphrey Institute Policy Forum at the University of Minnesota since 1995. Member of the Board of Trustees of NorthStar Education Finance, Inc., a non-profit organization, since 2007. | | Asset Allocation Trust |
Michael S. Scofield
(Born 1943) | | Trustee, since 2010 | | Served on the Investment Company Institute’s Board of Governors and Executive Committee from 2008-2011 as well the Governing Council of the Independent Directors Council from 2006-2011 and the Independent Directors Council Executive Committee from 2008-2011. Chairman of the IDC from 2008-2010. Institutional Investor (Fund Directions) Trustee of Year in 2007. Trustee of the Evergreen Funds complex (and its predecessors) from 1984 to 2010. Chairman of the Evergreen Funds from 2000-2010. Former Trustee of the Mentor Funds. Retired Attorney, Law Offices of Michael S. Scofield. | | Asset Allocation Trust |
| * | Length of service dates reflect the Trustee’s commencement of service with the Trust’s predecessor entities, where applicable. |
Officers
| | | | | | |
Name and
year of birth | | Position held and
length of service | | Principal occupations during past five years or longer | | |
Karla M. Rabusch
(Born 1959) | | President, since 2003 | | Executive Vice President of Wells Fargo Bank, N.A. and President of Wells Fargo Funds Management, LLC since 2003. | | |
Nancy Wiser1
(Born 1967) | | Treasurer, since 2012 | | Executive Vice President of Wells Fargo Funds Management, LLC since 2011. Chief Operating Officer and Chief Compliance Officer at LightBox Capital Management LLC, from 2008 to 2011. | | |
C. David Messman
(Born 1960) | | Secretary, since 2000; Chief Legal Officer, since 2003 | | Senior Vice President and Secretary of Wells Fargo Funds Management, LLC since 2001. Assistant General Counsel of Wells Fargo Bank, N.A. since 2013 and Vice President and Managing Counsel of Wells Fargo Bank, N.A. from 1996 to 2013. | | |
Debra Ann Early
(Born 1964) | | Chief Compliance Officer, since 2007 | | Executive Vice President of Wells Fargo Funds Management, LLC since 2014, Senior Vice President and Chief Compliance Officer from 2007 to 2014. | | |
David Berardi
(Born 1975) | | Assistant Treasurer, since 2009 | | Vice President of Wells Fargo Funds Management, LLC since 2009. Vice President of Evergreen Investment Management Company, LLC from 2008 to 2010. Manager of Fund Reporting and Control for Evergreen Investment Management Company, LLC from 2004 to 2010. | | |
Jeremy DePalma1
(Born 1974) | | Assistant Treasurer, since 2009 | | Senior Vice President of Wells Fargo Funds Management, LLC since 2009. Senior Vice President of Evergreen Investment Management Company, LLC from 2008 to 2010 and head of the Fund Reporting and Control Team within Fund Administration from 2005 to 2010. | | |
| 1 | Nancy Wiser acts as Treasurer of 72 funds in the Fund Complex. Jeremy DePalma acts as Treasurer of 72 funds and Assistant Treasurer of 72 funds in the Fund Complex. |
| 2 | The Statement of Additional Information includes additional information about the Trustees and is available, without charge, upon request, by calling 1-800-222-8222 or by visiting the website at wellsfargofunds.com. |
| | | | | | |
| List of abbreviations | | Wells Fargo Specialized Technology Fund | | | 29 | |
The following is a list of common abbreviations for terms and entities that may have appeared in this report.
| ACA | — ACA Financial Guaranty Corporation |
| ADR | — American depositary receipt |
| ADS | — American depositary shares |
| AGC | — Assured Guaranty Corporation |
| AGM | — Assured Guaranty Municipal |
| Ambac | — Ambac Financial Group Incorporated |
| AMT | — Alternative minimum tax |
| BAN | — Bond anticipation notes |
| BHAC | — Berkshire Hathaway Assurance Corporation |
| CAB | — Capital appreciation bond |
| CCAB | — Convertible capital appreciation bond |
| CDA | — Community Development Authority |
| CDO | — Collateralized debt obligation |
| DRIVER | — Derivative inverse tax-exempt receipts |
| DW&P | — Department of Water & Power |
| DWR | — Department of Water Resources |
| ECFA | — Educational & Cultural Facilities Authority |
| EDA | — Economic Development Authority |
| EDFA | — Economic Development Finance Authority |
| ETF | — Exchange-traded fund |
| FDIC | — Federal Deposit Insurance Corporation |
| FFCB | — Federal Farm Credit Banks |
| FGIC | — Financial Guaranty Insurance Corporation |
| FHA | — Federal Housing Administration |
| FHLB | — Federal Home Loan Bank |
| FHLMC | — Federal Home Loan Mortgage Corporation |
| FICO | — The Financing Corporation |
| FNMA | — Federal National Mortgage Association |
| GDR | — Global depositary receipt |
| GNMA | — Government National Mortgage Association |
| HCFR | — Healthcare facilities revenue |
| HEFA | — Health & Educational Facilities Authority |
| HEFAR | — Higher education facilities authority revenue |
| HFA | — Housing Finance Authority |
| HFFA | — Health Facilities Financing Authority |
| HUD | — Department of Housing and Urban Development |
| IDA | — Industrial Development Authority |
| IDAG | — Industrial Development Agency |
| KRW | — Republic of Korea won |
| LIBOR | — London Interbank Offered Rate |
| LIFER | — Long Inverse Floating Exempt Receipts |
| LLC | — Limited liability company |
| LLLP | — Limited liability limited partnership |
| LLP | — Limited liability partnership |
| MBIA | — Municipal Bond Insurance Association |
| MFHR | — Multifamily housing revenue |
| MSTR | — Municipal securities trust receipts |
| MUD | — Municipal Utility District |
| National | — National Public Finance Guarantee Corporation |
| PCFA | — Pollution Control Financing Authority |
| PCL | — Public Company Limited |
| PCR | — Pollution control revenue |
| PFA | — Public Finance Authority |
| PFFA | — Public Facilities Financing Authority |
| PFOTER | — Puttable floating option tax-exempt receipts |
| plc | — Public limited company |
| PUTTER | — Puttable tax-exempt receipts |
| R&D | — Research & development |
| Radian | — Radian Asset Assurance |
| RAN | — Revenue anticipation notes |
| RDA | — Redevelopment Authority |
| RDFA | — Redevelopment Finance Authority |
| REIT | — Real estate investment trust |
| ROC | — Reset option certificates |
| SAVRS | — Select auction variable rate securities |
| SBA | — Small Business Authority |
| SDR | — Swedish depositary receipt |
| SFHR | — Single-family housing revenue |
| SFMR | — Single-family mortgage revenue |
| SPA | — Standby purchase agreement |
| SPDR | — Standard & Poor’s Depositary Receipts |
| SPEAR | — Short Puttable Exempt Adjustable Receipts |
| STRIPS | — Separate trading of registered interest and |
| TAN | — Tax anticipation notes |
| TIPS | — Treasury inflation-protected securities |
| TRAN | — Tax revenue anticipation notes |
| TTFA | — Transportation Trust Fund Authority |
| TVA | — Tennessee Valley Authority |
This page is intentionally left blank.
This page is intentionally left blank.
This page is intentionally left blank.

For more information
More information about Wells Fargo Funds is available free upon request. To obtain literature, please write, email, visit the Fund’s website, or call:
Wells Fargo Funds
P.O. Box 8266
Boston, MA 02266-8266
Email: fundservice@wellsfargo.com
Website: wellsfargofunds.com
Individual investors: 1-800-222-8222
Retail investment professionals: 1-888-877-9275
Institutional investment professionals: 1-866-765-0778
This report and the financial statements contained herein are submitted for the general information of the shareholders of the Fund. If this report is used for promotional purposes, distribution of the report must be accompanied or preceded by a current prospectus. Before investing, please consider the investment objectives, risks, charges, and expenses of the investment. For a current prospectus and, if available, a summary prospectus, containing this information, call 1-800-222-8222 or visit the Fund’s website at wellsfargofunds.com. Read the prospectus carefully before you invest or send money.
Wells Fargo Asset Management (WFAM) is a trade name used by the asset management businesses of Wells Fargo & Company. Wells Fargo Funds Management, LLC, a wholly owned subsidiary of Wells Fargo & Company, provides investment advisory and administrative services for Wells Fargo Funds. Other affiliates of Wells Fargo & Company provide subadvisory and other services for the funds. The funds are distributed by Wells Fargo Funds Distributor, LLC, Member FINRA, an affiliate of Wells Fargo & Company.
NOT FDIC INSURED ¡ NO BANK GUARANTEE ¡ MAY LOSE VALUE
© 2016 Wells Fargo Funds Management, LLC. All rights reserved.
| | |
 | | 241822 05-16 A317/AR317 03-16 |
Annual Report
March 31, 2016

Wells Fargo Utility and Telecommunications Fund


Reduce clutter. Save trees.
Sign up for electronic delivery of prospectuses and shareholder reports at wellsfargo.com/advantagedelivery
Contents
The views expressed and any forward-looking statements are as of March 31, 2016, unless otherwise noted, and are those of the Fund managers and/or Wells Fargo Funds Management, LLC. Discussions of individual securities, or the markets generally, or any Wells Fargo Fund are not intended as individual recommendations. Future events or results may vary significantly from those expressed in any forward-looking statements. The views expressed are subject to change at any time in response to changing circumstances in the market. Wells Fargo Funds Management, LLC and the Fund disclaim any obligation to publicly update or revise any views expressed or forward-looking statements.
NOT FDIC INSURED ¡ NO BANK GUARANTEE ¡ MAY LOSE VALUE
| | | | |
| 2 | | Wells Fargo Utility and Telecommunications Fund | | Letter to shareholders (unaudited) |

Karla M. Rabusch
President
Wells Fargo Funds
Dear Valued Shareholder:
We are pleased to offer you this annual report for the Wells Fargo Utility and Telecommunications Fund for the 12-month period that ended March 31, 2016. During this period, which began with the second quarter of 2015, U.S. and international stock markets experienced heightened volatility, with intermittent rebounds interspersed with sell-offs. The U.S. economy displayed resilience throughout the period, although growth stayed modest amid ongoing pressures such as slowing growth in China, a strengthening U.S. dollar, and uncertainty regarding interest-rate increases by the U.S. Federal Reserve (Fed). International economies faced deeper ongoing challenges.
U.S. stocks experienced challenges during the second quarter of 2015.
The broad U.S. stock market fluctuated widely, eventually eking out a small quarterly gain. Mid- and large-cap stocks at times were pressured by investor concerns over the potentially negative effects of financially troubled overseas economies and of a strengthening U.S. dollar on the profits of U.S. multinational firms. The U.S. economy picked up traction during the quarter, and U.S. Fed officials, who kept interest rates low while waiting for the U.S. jobs market to sufficiently improve and for inflation to approach their 2% target, made clear they could take action soon. Throughout the quarter, non-U.S. markets also experienced volatility, triggered by uncertainty over the potential impact of financial challenges in other locations—most notably in Greece and Puerto Rico. Questions over slower growth in China caused investor concern as well.
In the third quarter of 2015, China’s slowdown took a toll on economies and markets worldwide.
U.S. stocks sagged during the quarter, experiencing the most volatility since 2011. Economic data released during the quarter suggested the U.S. economy remained solid but had lost some steam, burdened by the drag of the U.S. dollar’s strength coupled with global economic turmoil. The fact that the Fed left the federal funds interest rate unchanged at its September 2015 meeting surprised investors and fueled increased uncertainty about the U.S. economy’s stamina to remain healthy while facing the challenges of slowing in China and troubles elsewhere in the world. Outside the U.S., markets were even more volatile and delivered generally weaker quarterly results, also largely due to investors’ increasing anxiety over China’s weakened economy. Because China is the world’s largest importer of many commodities, a number of emerging markets—key commodities exporters—struggled under the dual strains of reduced demand for commodities and, because of weaker demand, lower prices for the commodities they did sell. In the eurozone, however, where only about 3% of exports are sent to China, household spending and business investment appeared relatively unaffected by troubles elsewhere. The European Central Bank (ECB) warned, though, that China’s slowing could lead to slower growth and lower inflation rates in the eurozone than previously forecast and indicated additional stimulus could be provided should this occur.
Despite ongoing concerns, U.S. stocks generally rose in the fourth quarter of 2015; international markets lagged.
While the broad U.S. stock market bounced back in the quarter, stock markets outside the U.S. failed to keep pace as economic concerns, including China’s slowdown, continued to negatively affect many countries. U.S. economic data released during the quarter indicated the economy remained solid, with modest growth, although the strong U.S. dollar and weakness in international economies
| | | | | | |
| Letter to shareholders (unaudited) | | Wells Fargo Utility and Telecommunications Fund | | | 3 | |
continued to be headwinds. In December, the Fed, as expected, raised its target interest rate by 25 basis points (bps; 100 bps equals 1.00%) after keeping it near zero for seven years. The move reflected confidence in the U.S. economy’s ability to stay healthy with less central-bank support. The Fed also clarified that future interest-rate increases would be gradual.
In the first quarter of 2016, market volatility increased globally amid ongoing concerns.
Stock markets worldwide fluctuated widely in the first quarter of 2016. Most sold off sharply in the first six weeks of the year on concerns such as weak global growth, falling commodity prices, and uncertainty over the timing and impact of Fed interest-rate increases. As the quarter progressed, fears abated somewhat and global markets generally rallied back. The U.S. economy ended the quarter on a positive note as much of the quarter’s data reflected resiliency. With ongoing uncertainties about global growth and financial markets, however, the Fed held off from raising the target interest rate during the quarter. Outside the U.S., the eurozone fell into deflation in February; in response, the ECB announced an expansion of its stimulus program. In China, the government in March set a growth rate of 6.5% to 7.0% for 2016, an acknowledgment that the country’s growth has been slowing. In emerging markets, although central-bank stimulus and improved prices for oil and other commodities led to stock-market rallies in the quarter, many of these countries’ economies face credit downgrades due to challenges such as the likelihood of a stronger U.S. dollar, which would make dollar-denominated debt more expensive.
Utilities and telecommunication services stocks delivered positive results overall for the 12-month reporting period.
During the second quarter of 2015, utilities stocks underperformed the broad U.S. stock market while telecom stocks delivered slightly better results than the broad market. Similar to bonds, utilities stocks are desired for the income they provide and thus are sensitive to interest-rate movements; as a result, they can underperform the broader stock market when investors believe interest rates will be rising soon. During the third quarter, utilities delivered positive results, significantly outperforming the broad U.S. stock market; telecom stocks declined along with the broader stock market. Utilities benefited as investors’ growing anxiety caused them to move toward investments perceived as more stable; utilities in particular are especially desirable in a defensive environment because many tend to deliver steady revenues and profits as a result of their regulated businesses. While telecom stocks rallied along with the broader U.S. stock market in the fourth quarter of 2015, utilities stocks underperformed; investors’ worries over declining prices for oil, natural gas, and other commodities likely influenced utilities’ weakness. However, in the defensive market environment during the first quarter of 2016, utilities and telecom stocks rallied strongly as many investors turned to the perceived stability of these sectors. Despite volatility within utilities and telecom stocks over the 12-month period, both sectors outperformed the broader U.S. stock market.
Despite volatility within utilities and telecom stocks over the 12-month period, both sectors outperformed the broader U.S. stock market.
| | | | |
| 4 | | Wells Fargo Utility and Telecommunications Fund | | Letter to shareholders (unaudited) |
Don’t let short-term uncertainty derail long-term investment goals.
Periods of uncertainty can present challenges, but experience has taught us that maintaining long-term investment goals can be an effective way to plan for the future. To help you create a sound strategy based on your personal goals and risk tolerance, Wells Fargo Funds offers more than 100 mutual funds spanning a wide range of asset classes and investment styles. Although diversification cannot guarantee an investment profit or prevent losses, we believe it can be an effective way to manage investment risk and potentially smooth out overall portfolio performance. We encourage investors to know their investments and to understand that appropriate levels of risk-taking may unlock opportunities.
Thank you for choosing to invest in Wells Fargo Funds. We appreciate your confidence in us and remain committed to helping you meet your financial needs.
Sincerely,

Karla M. Rabusch
President
Wells Fargo Funds
We encourage investors to know their investments and to understand that appropriate levels of risk-taking may unlock opportunities.
For further information about your Fund, contact your investment professional, visit our website at wellsfargofunds.com, or call us directly at 1-800-222-8222. We are available 24 hours a day, 7 days a week.
This page is intentionally left blank.
| | | | |
| 6 | | Wells Fargo Utility and Telecommunications Fund | | Performance highlights (unaudited) |
Investment objective
The Fund seeks total return, consisting of current income and capital appreciation.
Manager
Wells Fargo Funds Management, LLC
Subadviser
Crow Point Partners, LLC
Portfolio manager
Timothy P. O’Brien , CFA®
Average annual total returns (%) as of March 31, 20161
| | | | | | | | | | | | | | | | | | | | | | | | | | | | | | | | | | |
| | | | | Including sales charge | | | Excluding sales charge | | | Expense ratios2 (%) | |
| | | Inception date | | 1 year | | | 5 year | | | 10 year | | | 1 year | | | 5 year | | | 10 year | | | Gross | | | Net3 | |
| Class A (EVUAX) | | 1-4-1994 | | | (1.70 | ) | | | 9.21 | | | | 7.41 | | | | 4.30 | | | | 10.51 | | | | 8.05 | | | | 1.18 | | | | 1.15 | |
| Class B (EVUBX)* | | 1-4-1994 | | | (1.48 | ) | | | 9.42 | | | | 7.48 | | | | 3.52 | | | | 9.69 | | | | 7.48 | | | | 1.93 | | | | 1.90 | |
| Class C (EVUCX) | | 9-2-1994 | | | 2.49 | | | | 9.69 | | | | 7.24 | | | | 3.49 | | | | 9.69 | | | | 7.24 | | | | 1.93 | | | | 1.90 | |
| Administrator Class (EVUDX) | | 7-30-2010 | | | – | | | | – | | | | – | | | | 4.49 | | | | 10.75 | | | | 8.20 | | | | 1.10 | | | | 0.96 | |
| Institutional Class (EVUYX) | | 2-28-1994 | | | – | | | | – | | | | – | | | | 4.63 | | | | 10.87 | | | | 8.35 | | | | 0.85 | | | | 0.79 | |
| S&P Utilities Index4 | | – | | | – | | | | – | | | | – | | | | 15.96 | | | | 13.68 | | | | 9.10 | | | | – | | | | – | |
| S&P 500 Index5 | | – | | | – | | | | – | | | | – | | | | 1.78 | | | | 11.58 | | | | 7.01 | | | | – | | | | – | |
| * | | Class B shares are closed to investment, except in connection with the reinvestment of any distributions and permitted exchanges. |
Figures quoted represent past performance, which is no guarantee of future results, and do not reflect taxes that a shareholder may pay on fund distributions or the redemption of fund shares. Investment return and principal value of an investment will fluctuate so that an investor’s shares, when redeemed, may be worth more or less than their original cost. Performance shown without sales charges would be lower if sales charges were reflected. Current performance may be lower or higher than the performance data quoted, which assumes the reinvestment of dividends and capital gains. Current month-end performance is available on the Fund’s website, wellsfargofunds.com.
While the S&P 500 Index is comprised of U.S. equity securities of companies diversified across ten sectors, the Fund’s holdings are concentrated primarily in utilities and telecommunication services stocks. Therefore, the performance of the S&P 500 Index is displayed only to show how the concentrated Fund performed compared with a diversified selection of U.S. equity securities.
Index returns do not include transaction costs associated with buying and selling securities, any mutual fund fees or expenses, or any taxes. It is not possible to invest directly in an index.
For Class A shares, the maximum front-end sales charge is 5.75%. For Class B shares, the maximum contingent deferred sales charge is 5.00%. For Class C shares, the maximum contingent deferred sales charge is 1.00%. Performance including a contingent deferred sales charge assumes the sales charge for the corresponding time period. Administrator Class and Institutional Class shares are sold without a front-end sales charge or contingent deferred sales charge.
Stock values fluctuate in response to the activities of individual companies and general market and economic conditions. Bond values fluctuate in response to the financial condition of individual issuers, general market and economic conditions, and changes in interest rates. Changes in market conditions and government policies may lead to periods of heightened volatility in the bond market and reduced liquidity for certain bonds held by the Fund. In general, when interest rates rise, bond values fall and investors may lose principal value. Interest-rate changes and their impact on the Fund and its share price can be sudden and unpredictable. The use of derivatives may reduce returns and/or increase volatility. Funds that concentrate their investments in limited sectors, such as utilities and telecommunication services, are more vulnerable to adverse market, economic, regulatory, political, or other developments affecting those sectors. Certain investment strategies tend to increase the total risk of an investment (relative to the broader market). The Fund is exposed to convertible securities risk, foreign investment risk, high-yield securities risk, smaller-company securities risk, non-diversification risk and subsidiary risk. Consult the fund’s prospectus for additional information on these and other risks.
Please see footnotes on page 7.
| | | | | | |
| Performance highlights (unaudited) | | Wells Fargo Utility and Telecommunications Fund | | | 7 | |
|
| Growth of $10,000 investment as of March 31, 20166 |
|
 |
| 1 | Historical performance shown for Administrator Class shares prior to their inception reflects the performance of Institutional Class shares and has been adjusted to reflect the higher expenses applicable to Administrator Class shares. Historical performance shown for all classes of the Fund prior to July 19, 2010, is based on the performance of the Fund’s predecessor, Evergreen Utility and Telecommunications Fund. |
| 2 | Reflects the expense ratios as stated in the most recent prospectuses, which include the impact of 0.01% in acquired fund fees and expenses. The expense ratios shown are subject to change and may differ from the annualized expense ratios shown in the financial highlights of this report, which do not include acquired fund fees and expenses. |
| 3 | The manager has contractually committed through July 31, 2016, to waive fees and/or reimburse expenses to the extent necessary to cap the Fund’s Total Annual Fund Operating Expenses After Fee Waiver at 1.14% for Class A, 1.89% for Class B, 1.89% for Class C, 0.95% for Administrator Class and 0.78% for Institutional Class. After this time, the cap may be increased or the commitment to maintain the cap may be terminated only with the approval of the Board of Trustees. Brokerage commissions, stamp duty fees, interest, taxes, acquired fund fees and expenses, and extraordinary expenses are excluded from the cap. Without this cap, the Fund’s returns would have been lower. |
| 4 | The S&P Utilities Index is a market-value-weighted index, measuring the performance of all stocks within the utility sector of the S&P 500 Index. You cannot invest directly in an index. |
| 5 | The S&P 500 Index consists of 500 stocks chosen for market size, liquidity, and industry group representation. It is a market-value-weighted index with each stock’s weight in the index proportionate to its market value. You cannot invest directly in an index. |
| 6 | The chart compares the performance of Class A shares for the most recent ten years with the S&P Utilities Index and the S&P 500 Index. The chart assumes a hypothetical investment of $10,000 in Class A shares and reflects all operating expenses and assumes the maximum initial sales charge of 5.75%. |
| 7 | The ten largest holdings, excluding cash and cash equivalents, are calculated based on the value of the investments divided by total net assets of the Fund. Holdings are subject to change and may have changed since the date specified. |
| 8 | Amounts are calculated based on the total long-term investments of the Fund. These amounts are subject to change and may have changed since the date specified. |
| | | | |
| 8 | | Wells Fargo Utility and Telecommunications Fund | | Performance highlights (unaudited) |
MANAGER’S DISCUSSION
Fund highlights
| n | | The Fund underperformed the S&P Utilities Index for the 12-month period that ended March 31, 2016. |
| n | | Holdings with greater sensitivity to energy and commodity prices detracted from returns, as did real estate investment trusts (REITs). |
| n | | The Fund benefited from strength in regulated utilities and telecommunication services firms. |
The Fund’s energy and REIT positions negatively affected relative performance
Energy prices continued to decline substantially during the 12-month reporting period. Oil prices fell sharply as weak demand failed to absorb increased production, especially in North America. Gas prices also were weak. High rates of gas production, particularly in the Marcellus and Utica shales and the Permian Basin, depressed prices; mild winter weather didn’t help the situation either. Energy-sensitive holdings that detracted from performance included Energy & Exploration Partners, Incorporated; Veresen Incorporated; Sempra Energy; and The Williams Companies, Incorporated. The Fund’s REIT positions generally dragged on performance. REIT detractors included Chatham Lodging Trust; Ashford Hospitality Trust, Incorporated; and Wheeler Real Estate Investment Trust, Incorporated. The Fund’s relatively large cash position in the first quarter of 2016 hindered performance as well.
Regulated utilities posted strong returns.
Some of the Fund’s best-performing utilities holdings were regulated network companies with little commodities exposure, including CMS Energy Corporation; Eversource Energy; Edison International; Alliant Energy Corporation; and PNM Resources, Incorporated.
We made only moderate changes to the Fund during the reporting period.
The Fund’s composition did not change dramatically during the reporting period, and turnover remained low. We initiated positions in American Campus Communities, Incorporated; CenturyLink, Incorporated; magicJack VocalTec Limited; and Sprint Corporation, among others. Also, positions we eliminated during the period included ITC Holdings Corporation; Ashford Hospitality Trust, Incorporated; Cellcom Israel Limited; Convergys Corporation; Veresen Incorporated; The Williams Companies, Incorporated; Wheeler Real Estate Investment Trust, Incorporated; and National Fuel Gas Company, among others.
Our outlook for utilities remains favorable.
In our view, the fundamentals of regulated network utilities appear strong. Regulated utilities have abundant opportunities to invest in their core business at returns we view as attractive. While the U.S. retains adequate generation capacity, regulatory mandates are requiring utilities to increase renewable-energy sources and reduce the country’s historical reliance on fossil fuels in general and coal in particular. The development of U.S. shale-gas production has been providing us with opportunities to make investments in gas gathering, processing, and transport infrastructure. Overall, utilities may be growing faster than at any time since the 1950s, and their growth could be sustainable for the intermediate term or longer. While our outlook for telecommunication services companies generally is less robust, select stocks do present opportunities.
Please see footnotes on page 7.
| | | | | | |
| Performance highlights (unaudited) | | Wells Fargo Utility and Telecommunications Fund | | | 9 | |
| | | | |
| Ten largest holdings (%) as of March 31, 20167 | |
CMS Energy Corporation | | | 6.40 | |
Eversource Energy | | | 6.24 | |
NextEra Energy Incorporated | | | 5.95 | |
Edison International | | | 5.88 | |
Alliant Energy Corporation | | | 5.42 | |
Sempra Energy | | | 5.23 | |
Visa Incorporated Class A | | | 5.19 | |
PNM Resources Incorporated | | | 5.09 | |
Shenandoah Telecommunications Company | | | 4.37 | |
Chatham Lodging Trust | | | 3.50 | |
|
| Industry distribution as of March 31, 20168 |
|
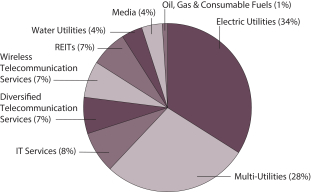 |
Short-term interest rates have begun to normalize at a glacial pace; thus far, the modest tightening at the short end of the yield curve has not visibly affected the longer rates to which utilities stocks are sensitive. A continued low-interest-rate environment should help support the prices of utilities stocks because income-seeking investors favor their relatively generous dividends. Also, the tax environment remains reasonably favorable for utilities investors; the tax rate on qualified dividend income increased to 23.8% from 15.0% in 2013 with little visible impact on utilities-stock performance. However, the fairness of lower taxes on capital compared with the income tax rates paid by individuals and families has become an issue in the current presidential campaign and bears watching. We believe utilities stocks would be negatively affected by the elimination of the preferential tax rate on qualified dividend income. For now, we view the outlook for utilities as reasonably bright, with many important positives outweighing a few limited concerns.
Please see footnotes on page 7.
| | | | |
| 10 | | Wells Fargo Utility and Telecommunications Fund | | Fund expenses (unaudited) |
As a shareholder of the Fund, you incur two types of costs: (1) transaction costs, including sales charges (loads) on purchase payments and contingent deferred sales charges (if any) on redemptions and (2) ongoing costs, including management fees, distribution (12b-1) and/or shareholder servicing fees, and other Fund expenses. This example is intended to help you understand your ongoing costs (in dollars) of investing in the Fund and to compare these costs with the ongoing costs of investing in other mutual funds.
The example is based on an investment of $1,000 invested at the beginning of the six-month period and held for the entire period from October 1, 2015 to March 31, 2016.
Actual expenses
The “Actual” line of the table below provides information about actual account values and actual expenses. You may use the information in this line, together with the amount you invested, to estimate the expenses that you paid over the period. Simply divide your account value by $1,000 (for example, an $8,600 account value divided by $1,000 = 8.6), then multiply the result by the number in the “Actual” line under the heading entitled “Expenses paid during period” for your applicable class of shares to estimate the expenses you paid on your account during this period.
Hypothetical example for comparison purposes
The “Hypothetical” line of the table below provides information about hypothetical account values and hypothetical expenses based on the Fund’s actual expense ratio and an assumed rate of return of 5% per year before expenses, which is not the Fund’s actual return. The hypothetical account values and expenses may not be used to estimate the actual ending account balance or expenses you paid for the period. You may use this information to compare the ongoing costs of investing in the Fund and other funds. To do so, compare this 5% hypothetical example with the 5% hypothetical examples that appear in the shareholder reports of the other funds.
Please note that the expenses shown in the table are meant to highlight your ongoing costs only and do not reflect any transactional costs, such as sales charges (loads) and contingent deferred sales charges. Therefore, the “Hypothetical” line of the table is useful in comparing ongoing costs only and will not help you determine the relative total costs of owning different funds. In addition, if these transactional costs were included, your costs would have been higher.
| | | | | | | | | | | | | | | | |
| | | Beginning
account value
10-1-2015 | | | Ending
account value
3-31-2016 | | | Expenses
paid during
the period¹ | | | Net annualized
expense ratio | |
Class A | | | | | | | | | | | | | | | | |
Actual | | $ | 1,000.00 | | | $ | 1,104.20 | | | $ | 6.00 | | | | 1.14 | % |
Hypothetical (5% return before expenses) | | $ | 1,000.00 | | | $ | 1,019.30 | | | $ | 5.76 | | | | 1.14 | % |
Class B | | | | | | | | | | | | | | | | |
Actual | | $ | 1,000.00 | | | $ | 1,100.35 | | | $ | 9.92 | | | | 1.89 | % |
Hypothetical (5% return before expenses) | | $ | 1,000.00 | | | $ | 1,015.55 | | | $ | 9.52 | | | | 1.89 | % |
Class C | | | | | | | | | | | | | | | | |
Actual | | $ | 1,000.00 | | | $ | 1,099.90 | | | $ | 9.92 | | | | 1.89 | % |
Hypothetical (5% return before expenses) | | $ | 1,000.00 | | | $ | 1,015.55 | | | $ | 9.52 | | | | 1.89 | % |
Administrator Class | | | | | | | | | | | | | | | | |
Actual | | $ | 1,000.00 | | | $ | 1,105.78 | | | $ | 5.00 | | | | 0.95 | % |
Hypothetical (5% return before expenses) | | $ | 1,000.00 | | | $ | 1,020.25 | | | $ | 4.80 | | | | 0.95 | % |
Institutional Class | | | | | | | | | | | | | | | | |
Actual | | $ | 1,000.00 | | | $ | 1,106.22 | | | $ | 4.11 | | | | 0.78 | % |
Hypothetical (5% return before expenses) | | $ | 1,000.00 | | | $ | 1,021.10 | | | $ | 3.94 | | | | 0.78 | % |
| 1 | Expenses paid is equal to the annualized expense ratio of each class multiplied by the average account value over the period, multiplied by the number of days in the most recent fiscal half-year divided by the number of days in the fiscal year (to reflect the one-half-year period). |
| | | | | | |
| Portfolio of investments—March 31, 2016 | | Wells Fargo Utility and Telecommunications Fund | | | 11 | |
| | | | | | | | | | | | |
| Security name | | | | | | Shares | | | Value | |
| | | | |
Common Stocks: 90.06% | | | | | | | | | | | | |
| | | | |
Consumer Discretionary: 3.46% | | | | | | | | | | | | |
| | | | |
| Media: 3.46% | | | | | | | | | | | | |
Comcast Corporation Class A | | | | | | | 225,100 | | | $ | 13,749,108 | |
| | | | | | | | | | | | |
| | | | |
Energy: 0.99% | | | | | | | | | | | | |
| | | | |
| Oil, Gas & Consumable Fuels: 0.99% | | | | | | | | | | | | |
EQT Corporation | | | | | | | 58,600 | | | | 3,941,436 | |
| | | | | | | | | | | | |
| | | | |
Financials: 5.97% | | | | | | | | | | | | |
| | | | |
| REITs: 5.97% | | | | | | | | | | | | |
American Campus Communities Incorporated | | | | | | | 79,000 | | | | 3,720,110 | |
Ashford Hospitality Prime Incorporated | | | | | | | 49,117 | | | | 573,195 | |
Chatham Lodging Trust | | | | | | | 650,000 | | | | 13,929,500 | |
DuPont Fabros Technology Incorporated | | | | | | | 11,000 | | | | 445,830 | |
Preferred Apartment Communities Incorporated | | | | | | | 400,000 | | | | 5,072,000 | |
| | | | |
| | | | | | | | | | | 23,740,635 | |
| | | | | | | | | | | | |
| | | | |
Industrials: 0.04% | | | | | | | | | | | | |
| | | | |
| Construction & Engineering: 0.04% | | | | | | | | | | | | |
Ameresco Incorporated Class A † | | | | | | | 35,000 | | | | 166,950 | |
| | | | | | | | | | | | |
| | | | |
Information Technology: 7.09% | | | | | | | | | | | | |
| | | | |
| IT Services: 7.09% | | | | | | | | | | | | |
MasterCard Incorporated Class A | | | | | | | 80,000 | | | | 7,560,000 | |
Visa Incorporated Class A | | | | | | | 270,000 | | | | 20,649,600 | |
| | | | |
| | | | | | | | | | | 28,209,600 | |
| | | | | | | | | | | | |
| | | | |
Telecommunication Services: 12.09% | | | | | | | | | | | | |
| | | | |
| Diversified Telecommunication Services: 6.10% | | | | | | | | | | | | |
AT&T Incorporated | | | | | | | 150,000 | | | | 5,875,500 | |
CenturyLink Incorporated # | | | | | | | 340,000 | | | | 10,866,400 | |
magicJack VocalTec Limited Ǡ | | | | | | | 320,800 | | | | 2,104,448 | |
Verizon Communications Incorporated | | | | | | | 100,000 | | | | 5,408,000 | |
| | | | |
| | | | | | | | | | | 24,254,348 | |
| | | | | | | | | | | | |
| | | | |
| Wireless Telecommunication Services: 5.99% | | | | | | | | | | | | |
Shenandoah Telecommunications Company | | | | | | | 650,000 | | | | 17,387,500 | |
Sprint Corporation Ǡ# | | | | | | | 1,850,000 | | | | 6,438,000 | |
| | | | |
| | | | | | | | | | | 23,825,500 | |
| | | | | | | | | | | | |
| | | | |
Utilities: 60.42% | | | | | | | | | | | | |
| | | | |
| Electric Utilities: 30.52% | | | | | | | | | | | | |
ALLETE Incorporated | | | | | | | 10,000 | | | | 560,700 | |
American Electric Power Company Incorporated | | | | | | | 175,000 | | | | 11,620,000 | |
Edison International | | | | | | | 325,000 | | | | 23,364,250 | |
Eversource Energy | | | | | | | 425,000 | | | | 24,794,500 | |
The accompanying notes are an integral part of these financial statements.
| | | | |
| 12 | | Wells Fargo Utility and Telecommunications Fund | | Portfolio of investments—March 31, 2016 |
| | | | | | | | | | | | | | | | |
| Security name | | | | | | | | Shares | | | Value | |
| | | | |
| Electric Utilities (continued) | | | | | | | | | | | | | | | | |
Great Plains Energy Incorporated | | | | | | | | | | | 200,000 | | | $ | 6,450,000 | |
IDACORP Incorporated | | | | | | | | | | | 75,000 | | | | 5,594,250 | |
NextEra Energy Incorporated | | | | | | | | | | | 200,000 | | | | 23,668,000 | |
PNM Resources Incorporated | | | | | | | | | | | 600,000 | | | | 20,232,000 | |
Spark Energy Incorporated Class A (l) | | | | | | | | | | | 281,837 | | | | 5,073,066 | |
| | | | |
| | | | | | | | | | | | | | | 121,356,766 | |
| | | | | | | | | | | | | | | | |
| | | | |
| Gas Utilities: 0.79% | | | | | | | | | | | | | | | | |
Snam SpA | | | | | | | | | | | 500,000 | | | | 3,132,069 | |
| | | | | | | | | | | | | | | | |
| | | | |
| Multi-Utilities: 25.64% | | | | | | | | | | | | | | | | |
Alliant Energy Corporation | | | | | | | | | | | 290,000 | | | | 21,541,200 | |
CenterPoint Energy Incorporated | | | | | | | | | | | 250,000 | | | | 5,230,000 | |
CMS Energy Corporation | | | | | | | | | | | 600,000 | | | | 25,464,000 | |
Dominion Resources Incorporated | | | | | | | | | | | 175,000 | | | | 13,146,000 | |
Northwestern Corporation | | | | | | | | | | | 102,411 | | | | 6,323,880 | |
Public Service Enterprise Group Incorporated | | | | | | | | | | | 200,000 | | | | 9,428,000 | |
Sempra Energy | | | | | | | | | | | 200,000 | | | | 20,810,000 | |
| | | | |
| | | | | | | | | | | | | | | 101,943,080 | |
| | | | | | | | | | | | | | | | |
| | | | |
| Water Utilities: 3.47% | | | | | | | | | | | | | | | | |
American Water Works Company Incorporated | | | | | | | | | | | 200,000 | | | | 13,786,000 | |
| | | | | | | | | | | | | | | | |
| | | | |
Total Common Stocks (Cost $183,328,852) | | | | | | | | | | | | | | | 358,105,492 | |
| | | | | | | | | | | | | | | | |
| | | | |
| | | Interest rate | | | Maturity date | | | Principal | | | | |
| Convertible Debentures: 0.00% | | | | | | | | | | | | | | | | |
| | | | |
Energy: 0.00% | | | | | | | | | | | | | | | | |
| | | | |
| Energy Equipment & Services: 0.00% | | | | | | | | | | | | | | | | |
Energy & Exploration Partners Incorporated (s)(i) | | | 8.00 | % | | | 7-1-2019 | | | $ | 5,000,000 | | | | 5,000 | |
| | | | | | | | | | | | | | | | |
| | | | |
Total Convertible Debentures (Cost $5,000,000) | | | | | | | | | | | | | | | 5,000 | |
| | | | | | | | | | | | | | | | |
| | | | |
| | | | | | | | | Shares | | | | |
| Exchange-Traded Funds: 0.12% | | | | | | | | | | | | | | | | |
Recon Capital NASDAQ 100 Covered Call ETF | | | | | | | | | | | 21,500 | | | | 481,170 | |
| | | | | | | | | | | | | | | | |
| | | | |
Total Exchange-Traded Funds (Cost $512,990) | | | | | | | | | | | | | | | 481,170 | |
| | | | | | | | | | | | | | | | |
| | | | |
| | | Dividend yield | | | | | | | | | | |
| Preferred Stocks: 0.19% | | | | | | | | | | | | | | | | |
| | | | |
Utilities: 0.19% | | | | | | | | | | | | | | | | |
| | | | |
| Electric Utilities: 0.19% | | | | | | | | | | | | | | | | |
SCE Trust V ± | | | 5.45 | | | | | | | | 27,500 | | | | 732,875 | |
| | | | | | | | | | | | | | | | |
| | | | |
Total Preferred Stocks (Cost $687,500) | | | | | | | | | | | | | | | 732,875 | |
| | | | | | | | | | | | | | | | |
The accompanying notes are an integral part of these financial statements.
| | | | | | |
| Portfolio of investments—March 31, 2016 | | Wells Fargo Utility and Telecommunications Fund | | | 13 | |
| | | | | | | | | | | | | | | | |
| Security name | | | | | Expiration date | | | Shares | | | Value | |
| | | | |
Warrants: 0.01% | | | | | | | | | | | | | | | | |
| | | | |
Energy: 0.01% | | | | | | | | | | | | | | | | |
| | | | |
| Oil, Gas & Consumable Fuels: 0.01% | | | | | | | | | | | | | | | | |
Kinder Morgan Incorporated † | | | | | | | 5-27-2017 | | | | 496,000 | | | $ | 18,104 | |
Magnum Hunter Resources Corporation Ǡ(a) | | | | | | | 4-15-2016 | | | | 140,000 | | | | 0 | |
| | | | |
Total Warrants (Cost $553,300) | | | | | | | | | | | | | | | 18,104 | |
| | | | | | | | | | | | | | | | |
| | | | |
| | | Yield | | | | | | | | | | |
| Short-Term Investments: 12.26% | | | | | | | | | | | | | | | | |
| | | | |
| Investment Companies: 12.26% | | | | | | | | | | | | | | | | |
Securities Lending Cash Investments LLC (l)(r)(u) | | | 0.43 | % | | | | | | | 7,771,650 | | | | 7,771,650 | |
Wells Fargo Cash Investment Money Market Fund Select Class (l)(u) | | | 0.44 | | | | | | | | 40,990,641 | | | | 40,990,641 | |
| | | | |
Total Short-Term Investments (Cost $48,762,291) | | | | | | | | | | | | | | | 48,762,291 | |
| | | | | | | | | | | | | | | | |
| | | | | | | | |
| Total investments in securities (Cost $238,844,933) * | | | 102.64 | % | | | 408,104,932 | |
Other assets and liabilities, net | | | (2.64 | ) | | | (10,492,425 | ) |
| | | | | | | | |
| Total net assets | | | 100.00 | % | | $ | 397,612,507 | |
| | | | | | | | |
| † | Non-income-earning security |
| « | All or a portion of this security is on loan. |
| (l) | The issuer of the security is an affiliated person of the Fund as defined in the Investment Company Act of 1940. |
| (s) | The security is currently in default with regards to scheduled interest and/or principal payments. The Fund has stopped accruing interest on the security. |
| (i) | Illiquid security for which the designation as illiquid is unaudited. |
| ± | Variable rate investment. The rate shown is the rate in effect at period end. |
| (a) | The security is fair valued in accordance with procedures approved by the Board of Trustees. |
| (r) | The investment is a non-registered investment vehicle purchased with cash collateral received from securities on loan. |
| (u) | The rate represents the 7-day annualized yield at period end. |
| # | All or a portion of this security is segregated as collateral for investments in derivative instruments. |
| * | Cost for federal income tax purposes is $238,908,635 and unrealized gains (losses) consists of: |
| | | | |
Gross unrealized gains | | $ | 176,254,004 | |
Gross unrealized losses | | | (7,057,707 | ) |
| | | | |
Net unrealized gains | | $ | 169,196,297 | |
The accompanying notes are an integral part of these financial statements.
| | | | |
| 14 | | Wells Fargo Utility and Telecommunications Fund | | Statement of assets and liabilities—March 31, 2016 |
| | | | |
| | | | |
| |
Assets | | | | |
Investments | | | | |
In unaffiliated securities (including $7,312,078 of securities loaned), at value (cost $185,009,085) | | $ | 354,269,575 | |
In affiliated securities, at value (cost $53,835,848) | | | 53,835,357 | |
| | | | |
Total investments, at value (cost $238,844,933) | | | 408,104,932 | |
Cash | | | 26,141 | |
Segregated cash | | | 2,000 | |
Foreign currency, at value (cost $342,333) | | | 346,252 | |
Receivable for investments sold | | | 2,234,323 | |
Receivable for Fund shares sold | | | 187,205 | |
Receivable for dividends | | | 479,815 | |
Receivable for securities lending income | | | 16,301 | |
Prepaid expenses and other assets | | | 32,428 | |
| | | | |
Total assets | | | 411,429,397 | |
| | | | |
| |
Liabilities | | | | |
Payable for investments purchased | | | 5,073,557 | |
Payable for Fund shares redeemed | | | 371,971 | |
Payable upon receipt of securities loaned | | | 7,771,650 | |
Written options, at value (premiums received $302,831) | | | 173,334 | |
Management fee payable | | | 189,352 | |
Distribution fees payable | | | 37,511 | |
Administration fees payable | | | 67,493 | |
Accrued expenses and other liabilities | | | 132,022 | |
| | | | |
Total liabilities | | | 13,816,890 | |
| | | | |
Total net assets | | $ | 397,612,507 | |
| | | | |
| |
NET ASSETS CONSIST OF | | | | |
Paid-in capital | | $ | 251,650,353 | |
Undistributed net investment income | | | 646,272 | |
Accumulated net realized losses on investments | | | (24,077,533 | ) |
Net unrealized gains on investments | | | 169,393,415 | |
| | | | |
Total net assets | | $ | 397,612,507 | |
| | | | |
| |
COMPUTATION OF NET ASSET VALUE AND OFFERING PRICE PER SHARE | | | | |
Net assets – Class A | | $ | 315,238,323 | |
Shares outstanding – Class A1 | | | 16,857,997 | |
Net asset value per share – Class A | | | $18.70 | |
Maximum offering price per share – Class A2 | | | $19.84 | |
Net assets – Class B | | $ | 2,909,260 | |
Shares outstanding – Class B1 | | | 155,100 | |
Net asset value per share – Class B | | | $18.76 | |
Net assets – Class C | | $ | 57,430,514 | |
Shares outstanding – Class C1 | | | 3,071,204 | |
Net asset value per share – Class C | | | $18.70 | |
Net assets – Administrator Class | | $ | 6,739,722 | |
Shares outstanding – Administrator Class1 | | | 360,093 | |
Net asset value per share – Administrator Class | | | $18.72 | |
Net assets – Institutional Class | | $ | 15,294,688 | |
Shares outstanding – Institutional Class1 | | | 818,238 | |
Net asset value per share – Institutional Class | | | $18.69 | |
| 1 | The Fund has an unlimited number of authorized shares. |
| 2 | Maximum offering price is computed as 100/94.25 of net asset value. On investments of $50,000 or more, the offering price is reduced. |
The accompanying notes are an integral part of these financial statements.
| | | | | | |
| Statement of operations—year ended March 31, 2016 | | Wells Fargo Utility and Telecommunications Fund | | | 15 | |
| | | | |
| | | | |
| |
Investment income | | | | |
Dividends (net of foreign withholding taxes of $116,855) | | $ | 11,033,691 | |
Interest | | | 98,482 | |
Securities lending income, net | | | 59,712 | |
Income from affiliated securities | | | 52,210 | |
| | | | |
Total investment income | | | 11,244,095 | |
| | | | |
| |
Expenses | | | | |
Management fee | | | 2,542,730 | |
Administration fees | | | | |
Class A | | | 690,826 | |
Class B | | | 9,966 | |
Class C | | | 127,946 | |
Administrator Class | | | 8,292 | |
Institutional Class | | | 15,591 | |
Shareholder servicing fees | | | | |
Class A | | | 773,388 | |
Class B | | | 10,951 | |
Class C | | | 143,177 | |
Administrator Class | | | 17,090 | |
Distribution fees | | | | |
Class B | | | 32,852 | |
Class C | | | 429,531 | |
Custody and accounting fees | | | 36,464 | |
Professional fees | | | 62,942 | |
Registration fees | | | 75,422 | |
Shareholder report expenses | | | 77,761 | |
Trustees’ fees and expenses | | | 19,132 | |
Other fees and expenses | | | 13,590 | |
| | | | |
Total expenses | | | 5,087,651 | |
Less: Fee waivers and/or expense reimbursements | | | (226,756 | ) |
| | | | |
Net expenses | | | 4,860,895 | |
| | | | |
Net investment income | | | 6,383,200 | |
| | | | |
| |
REALIZED AND UNREALIZED GAINS (LOSSES) ON INVESTMENTS | | | | |
| |
Net realized gains on: | | | | |
Unaffiliated securities | | | 257,309 | |
Written options | | | 549,118 | |
| | | | |
Net realized gains on investments | | | 806,427 | |
| | | | |
| |
Net change in unrealized gains (losses) on: | | | | |
Unaffiliated securities | | | 6,746,612 | |
Affiliated securities | | | (491 | ) |
Written options | | | 129,497 | |
| | | | |
Net change in unrealized gains (losses) on investments | | | 6,875,618 | |
| | | | |
Net realized and unrealized gains (losses) on investments | | | 7,682,045 | |
| | | | |
Net increase in net assets resulting from operations | | $ | 14,065,245 | |
| | | | |
The accompanying notes are an integral part of these financial statements.
| | | | |
| 16 | | Wells Fargo Utility and Telecommunications Fund | | Statement of changes in net assets |
| | | | | | | | | | | | | | | | |
| | | Year ended
March 31, 2016 | | | Year ended
March 31, 2015 | |
|
Operations | |
Net investment income | | | | | | $ | 6,383,200 | | | | | | | $ | 6,560,533 | |
Net realized gains (losses) on investments | | | | | | | 806,427 | | | | | | | | 23,373,912 | |
Net change in unrealized gains (losses) on investments | | | | | | | 6,875,618 | | | | | | | | (9,639,771 | ) |
| | | | |
Net increase in net assets resulting from operations | | | | | | | 14,065,245 | | | | | | | | 20,294,674 | |
| | | | |
| | | |
Distributions to shareholders from | | | | | | | | | | | | |
Net investment income | | | | | | | | | | | | | | | | |
Class A | | | | | | | (5,017,303 | ) | | | | | | | (6,403,863 | ) |
Class B | | | | | | | (37,027 | ) | | | | | | | (104,423 | ) |
Class C | | | | | | | (553,510 | ) | | | | | | | (693,137 | ) |
Administrator Class | | | | | | | (117,637 | ) | | | | | | | (183,512 | ) |
Institutional Class | | | | | | | (272,938 | ) | | | | | | | (306,091 | ) |
| | | | |
Total distributions to shareholders | | | | | | | (5,998,415 | ) | | | | | | | (7,691,026 | ) |
| | | | |
| | | | |
Capital share transactions | | | Shares | | | | | | | | Shares | | | | | |
Proceeds from shares sold | | | | | | | | | | | | | | | | |
Class A | | | 921,079 | | | | 16,278,558 | | | | 2,072,323 | | | | 37,834,688 | |
Class B | | | 552 | | | | 9,644 | | | | 1,562 | | | | 29,964 | |
Class C | | | 133,314 | | | | 2,345,310 | | | | 382,365 | | | | 6,988,536 | |
Administrator Class | | | 89,892 | | | | 1,573,242 | | | | 260,834 | | | | 4,786,634 | |
Institutional Class | | | 337,439 | | | | 5,942,211 | | | | 453,039 | | | | 8,303,139 | |
| | | | |
| | | | | | | 26,148,965 | | | | | | | | 57,942,961 | |
| | | | |
Reinvestment of distributions | | | | | | | | | | | | | | | | |
Class A | | | 274,180 | | | | 4,706,483 | | | | 325,162 | | | | 6,016,355 | |
Class B | | | 1,759 | | | | 30,109 | | | | 4,647 | | | | 86,670 | |
Class C | | | 28,775 | | | | 491,914 | | | | 32,978 | | | | 614,675 | |
Administrator Class | | | 6,530 | | | | 112,501 | | | | 8,290 | | | | 153,428 | |
Institutional Class | | | 12,478 | | | | 214,732 | | | | 14,526 | | | | 267,923 | |
| | | | |
| | | | | | | 5,555,739 | | | | | | | | 7,139,051 | |
| | | | |
Payment for shares redeemed | | | | | | | | | | | | | | | | |
Class A | | | (3,057,415 | ) | | | (53,748,727 | ) | | | (3,436,374 | ) | | | (62,486,613 | ) |
Class B | | | (261,426 | ) | | | (4,631,829 | ) | | | (363,882 | ) | | | (6,686,336 | ) |
Class C | | | (577,794 | ) | | | (10,133,822 | ) | | | (387,363 | ) | | | (7,054,107 | ) |
Administrator Class | | | (194,700 | ) | | | (3,370,659 | ) | | | (339,970 | ) | | | (6,214,019 | ) |
Institutional Class | | | (308,285 | ) | | | (5,341,959 | ) | | | (273,028 | ) | | | (4,941,344 | ) |
| | | | |
| | | | | | | (77,226,996 | ) | | | | | | | (87,382,419 | ) |
| | | | |
Net decrease in net assets resulting from capital share transactions | | | | | | | (45,522,292 | ) | | | | | | | (22,300,407 | ) |
| | | | |
Total decrease in net assets | | | | | | | (37,455,462 | ) | | | | | | | (9,696,759 | ) |
| | | | |
| | |
Net assets | | | | | | | | |
Beginning of period | | | | | | | 435,067,969 | | | | | | | | 444,764,728 | |
| | | | |
End of period | | | | | | $ | 397,612,507 | | | | | | | $ | 435,067,969 | |
| | | | |
Undistributed (overdistributed) net investment income | | | | | | $ | 646,272 | | | | | | | $ | (9,772 | ) |
| | | | |
The accompanying notes are an integral part of these financial statements.
| | | | | | |
| Financial highlights | | Wells Fargo Utility and Telecommunications Fund | | | 17 | |
(For a share outstanding throughout each period)
| | | | | | | | | | | | | | | | | | | | |
| | | Year ended March 31 | |
| CLASS A | | 2016 | | | 2015 | | | 2014 | | | 2013 | | | 2012 | |
Net asset value, beginning of period | | | $18.23 | | | | $17.71 | | | | $15.85 | | | | $13.78 | | | | $12.59 | |
Net investment income | | | 0.31 | | | | 0.29 | | | | 0.36 | | | | 0.36 | | | | 0.28 | |
Net realized and unrealized gains (losses) on investments | | | 0.45 | | | | 0.57 | | | | 1.84 | | | | 2.07 | | | | 1.21 | |
| | | | | | | | | | | | | | | | | | | | |
Total from investment operations | | | 0.76 | | | | 0.86 | | | | 2.20 | | | | 2.43 | | | | 1.49 | |
Distributions to shareholders from | | | | | | | | | | | | | | | | | | | | |
Net investment income | | | (0.29 | ) | | | (0.34 | ) | | | (0.34 | ) | | | (0.36 | ) | | | (0.30 | ) |
Net asset value, end of period | | | $18.70 | | | | $18.23 | | | | $17.71 | | | | $15.85 | | | | $13.78 | |
Total return1 | | | 4.30 | % | | | 4.82 | % | | | 14.12 | % | | | 17.94 | % | | | 12.01 | % |
Ratios to average net assets (annualized) | | | | | | | | | | | | | | | | | | | | |
Gross expenses | | | 1.20 | % | | | 1.22 | % | | | 1.22 | % | | | 1.23 | % | | | 1.20 | % |
Net expenses | | | 1.14 | % | | | 1.14 | % | | | 1.14 | % | | | 1.14 | % | | | 1.14 | % |
Net investment income | | | 1.73 | % | | | 1.57 | % | | | 2.21 | % | | | 2.47 | % | | | 2.11 | % |
Supplemental data | | | | | | | | | | | | | | | | | | | | |
Portfolio turnover rate | | | 15 | % | | | 29 | % | | | 20 | % | | | 21 | % | | | 36 | % |
Net assets, end of period (000s omitted) | | | $315,238 | | | | $341,342 | | | | $350,029 | | | | $316,551 | | | | $288,228 | |
| 1 | Total return calculations do not include any sales charges. |
The accompanying notes are an integral part of these financial statements.
| | | | |
| 18 | | Wells Fargo Utility and Telecommunications Fund | | Financial highlights |
(For a share outstanding throughout each period)
| | | | | | | | | | | | | | | | | | | | |
| | | Year ended March 31 | |
| CLASS B | | 2016 | | | 2015 | | | 2014 | | | 2013 | | | 2012 | |
Net asset value, beginning of period | | | $18.28 | | | | $17.75 | | | | $15.87 | | | | $13.79 | | | | $12.59 | |
Net investment income | | | 0.21 | 1 | | | 0.16 | 1 | | | 0.24 | 1 | | | 0.24 | 1 | | | 0.18 | 1 |
Net realized and unrealized gains (losses) on investments | | | 0.42 | | | | 0.55 | | | | 1.85 | | | | 2.09 | | | | 1.22 | |
| | | | | | | | | | | | | | | | | | | | |
Total from investment operations | | | 0.63 | | | | 0.71 | | | | 2.09 | | | | 2.33 | | | | 1.40 | |
Distributions to shareholders from | | | | | | | | | | | | |
Net investment income | | | (0.15 | ) | | | (0.18 | ) | | | (0.21 | ) | | | (0.25 | ) | | | (0.20 | ) |
Net asset value, end of period | | | $18.76 | | | | $18.28 | | | | $17.75 | | | | $15.87 | | | | $13.79 | |
Total return2 | | | 3.52 | % | | | 3.98 | % | | | 13.32 | % | | | 17.08 | % | | | 11.21 | % |
Ratios to average net assets (annualized) | | | | | | | | | | | | |
Gross expenses | | | 1.95 | % | | | 1.97 | % | | | 1.97 | % | | | 1.97 | % | | | 1.95 | % |
Net expenses | | | 1.89 | % | | | 1.89 | % | | | 1.89 | % | | | 1.89 | % | | | 1.89 | % |
Net investment income | | | 1.16 | % | | | 0.86 | % | | | 1.46 | % | | | 1.70 | % | | | 1.35 | % |
Supplemental data | | | | | | | | | | | | |
Portfolio turnover rate | | | 15 | % | | | 29 | % | | | 20 | % | | | 21 | % | | | 36 | % |
Net assets, end of period (000s omitted) | | | $2,909 | | | | $7,573 | | | | $13,698 | | | | $17,240 | | | | $20,613 | |
| 1 | Calculated based upon average shares outstanding |
| 2 | Total return calculations do not include any sales charges. |
The accompanying notes are an integral part of these financial statements.
| | | | | | |
| Financial highlights | | Wells Fargo Utility and Telecommunications Fund | | | 19 | |
(For a share outstanding throughout each period)
| | | | | | | | | | | | | | | | | | | | |
| | | Year ended March 31 | |
| CLASS C | | 2016 | | | 2015 | | | 2014 | | | 2013 | | | 2012 | |
Net asset value, beginning of period | | | $18.25 | | | | $17.73 | | | | $15.86 | | | | $13.79 | | | | $12.59 | |
Net investment income | | | 0.17 | 1 | | | 0.15 | | | | 0.24 | 1 | | | 0.23 | | | | 0.18 | 1 |
Net realized and unrealized gains (losses) on investments | | | 0.45 | | | | 0.57 | | | | 1.85 | | | | 2.09 | | | | 1.22 | |
| | | | | | | | | | | | | | | | | | | | |
Total from investment operations | | | 0.62 | | | | 0.72 | | | | 2.09 | | | | 2.32 | | | | 1.40 | |
Distributions to shareholders from | | | | | | | | | | | | |
Net investment income | | | (0.17 | ) | | | (0.20 | ) | | | (0.22 | ) | | | (0.25 | ) | | | (0.20 | ) |
Net asset value, end of period | | | $18.70 | | | | $18.25 | | | | $17.73 | | | | $15.86 | | | | $13.79 | |
Total return2 | | | 3.49 | % | | | 4.04 | % | | | 13.31 | % | | | 17.03 | % | | | 11.23 | % |
Ratios to average net assets (annualized) | | | | | | | | | | | | |
Gross expenses | | | 1.95 | % | | | 1.97 | % | | | 1.97 | % | | | 1.98 | % | | | 1.95 | % |
Net expenses | | | 1.89 | % | | | 1.89 | % | | | 1.89 | % | | | 1.89 | % | | | 1.89 | % |
Net investment income | | | 0.99 | % | | | 0.82 | % | | | 1.46 | % | | | 1.71 | % | | | 1.36 | % |
Supplemental data | | | | | | | | | | | | |
Portfolio turnover rate | | | 15 | % | | | 29 | % | | | 20 | % | | | 21 | % | | | 36 | % |
Net assets, end of period (000s omitted) | | | $57,431 | | | | $63,632 | | | | $61,329 | | | | $57,431 | | | | $58,555 | |
| 1 | Calculated based upon average shares outstanding |
| 2 | Total return calculations do not include any sales charges. |
The accompanying notes are an integral part of these financial statements.
| | | | |
| 20 | | Wells Fargo Utility and Telecommunications Fund | | Financial highlights |
(For a share outstanding throughout each period)
| | | | | | | | | | | | | | | | | | | | |
| | | Year ended March 31 | |
| ADMINISTRATOR CLASS | | 2016 | | | 2015 | | | 2014 | | | 2013 | | | 2012 | |
Net asset value, beginning of period | | | $18.25 | | | | $17.73 | | | | $15.86 | | | | $13.79 | | | | $12.59 | |
Net investment income | | | 0.34 | | | | 0.33 | | | | 0.40 | | | | 0.39 | | | | 0.30 | 1 |
Net realized and unrealized gains (losses) on investments | | | 0.45 | | | | 0.56 | | | | 1.84 | | | | 2.07 | | | | 1.23 | |
| | | | | | | | | | | | | | | | | | | | |
Total from investment operations | | | 0.79 | | | | 0.89 | | | | 2.24 | | | | 2.46 | | | | 1.53 | |
Distributions to shareholders from | | | | | | | | | | | | |
Net investment income | | | (0.32 | ) | | | (0.37 | ) | | | (0.37 | ) | | | (0.39 | ) | | | (0.33 | ) |
Net asset value, end of period | | | $18.72 | | | | $18.25 | | | | $17.73 | | | | $15.86 | | | | $13.79 | |
Total return | | | 4.49 | % | | | 5.01 | % | | | 14.41 | % | | | 18.16 | % | | | 12.32 | % |
Ratios to average net assets (annualized) | | | | | | | | | | | | |
Gross expenses | | | 1.09 | % | | | 1.06 | % | | | 1.04 | % | | | 1.04 | % | | | 1.01 | % |
Net expenses | | | 0.95 | % | | | 0.95 | % | | | 0.95 | % | | | 0.95 | % | | | 0.94 | % |
Net investment income | | | 1.93 | % | | | 1.79 | % | | | 2.38 | % | | | 2.66 | % | | | 2.32 | % |
Supplemental data | | | | | | | | | | | | |
Portfolio turnover rate | | | 15 | % | | | 29 | % | | | 20 | % | | | 21 | % | | | 36 | % |
Net assets, end of period (000s omitted) | | | $6,740 | | | | $8,365 | | | | $9,383 | | | | $5,803 | | | | $4,945 | |
| 1 | Calculated based upon average shares outstanding |
The accompanying notes are an integral part of these financial statements.
| | | | | | |
| Financial highlights | | Wells Fargo Utility and Telecommunications Fund | | | 21 | |
(For a share outstanding throughout each period)
| | | | | | | | | | | | | | | | | | | | |
| | | Year ended March 31 | |
| INSTITUTIONAL CLASS | | 2016 | | | 2015 | | | 2014 | | | 2013 | | | 2012 | |
Net asset value, beginning of period | | | $18.23 | | | | $17.74 | | | | $15.87 | | | | $13.80 | | | | $12.61 | |
Net investment income | | | 0.36 | 1 | | | 0.35 | 1 | | | 0.42 | | | | 0.46 | | | | 0.33 | |
Net realized and unrealized gains (losses) on investments | | | 0.45 | | | | 0.54 | | | | 1.85 | | | | 2.03 | | | | 1.21 | |
| | | | | | | | | | | | | | | | | | | | |
Total from investment operations | | | 0.81 | | | | 0.89 | | | | 2.27 | | | | 2.49 | | | | 1.54 | |
Distributions to shareholders from | | | | | | | | | | | | |
Net investment income | | | (0.35 | ) | | | (0.40 | ) | | | (0.40 | ) | | | (0.42 | ) | | | (0.35 | ) |
Net asset value, end of period | | | $18.69 | | | | $18.23 | | | | $17.74 | | | | $15.87 | | | | $13.80 | |
Total return | | | 4.63 | % | | | 5.02 | % | | | 14.58 | % | | | 18.34 | % | | | 12.42 | % |
Ratios to average net assets (annualized) | | | | | | | | | | | | |
Gross expenses | | | 0.84 | % | | | 0.79 | % | | | 0.79 | % | | | 0.80 | % | | | 0.77 | % |
Net expenses | | | 0.78 | % | | | 0.78 | % | | | 0.78 | % | | | 0.78 | % | | | 0.77 | % |
Net investment income | | | 2.03 | % | | | 1.89 | % | | | 2.56 | % | | | 2.97 | % | | | 2.50 | % |
Supplemental data | | | | | | | | | | | | |
Portfolio turnover rate | | | 15 | % | | | 29 | % | | | 20 | % | | | 21 | % | | | 36 | % |
Net assets, end of period (000s omitted) | | | $15,295 | | | | $14,156 | | | | $10,325 | | | | $8,317 | | | | $6,918 | |
| 1 | Calculated based upon average shares outstanding |
The accompanying notes are an integral part of these financial statements.
| | | | |
| 22 | | Wells Fargo Utility and Telecommunications Fund | | Notes to financial statements |
1. ORGANIZATION
Wells Fargo Funds Trust (the “Trust”), a Delaware statutory trust organized on March 10, 1999, is an open-end management investment company registered under the Investment Company Act of 1940, as amended (the “1940 Act”). As an investment company, the Trust follows the accounting and reporting guidance in Financial Accounting Standards Board (“FASB”) Accounting Standards Codification Topic 946, Financial Services – Investment Companies. These financial statements report on the Wells Fargo Utility and Telecommunications Fund (the “Fund”) which is a non-diversified series of the Trust.
2. SIGNIFICANT ACCOUNTING POLICIES
The following significant accounting policies, which are consistently followed in the preparation of the financial statements of the Fund, are in conformity with U.S. generally accepted accounting principles which require management to make estimates and assumptions that affect the reported amounts of assets and liabilities, disclosure of contingent assets and liabilities at the date of the financial statements, and the reported amounts of revenues and expenses during the reporting period. Actual results could differ from those estimates.
Securities valuation
All investments are valued each business day as of the close of regular trading on the New York Stock Exchange (generally 4 p.m. Eastern Time), although the Fund may deviate from this calculation time under unusual or unexpected circumstances.
Equity securities and options that are listed on a foreign or domestic exchange or market are valued at the official closing price or, if none, the last sales price. If no sale occurs on the principal exchange or market that day, the prior day’s price will be deemed “stale” and a fair value price will be determined in accordance with the Fund’s Valuation Procedures.
Non-listed options are valued at the evaluated price provided by an independent pricing service or, if a reliable price is not available, the quoted bid price from an independent broker-dealer.
The values of securities denominated in foreign currencies are translated into U.S. dollars at rates provided by an independent foreign currency pricing source at a time each business day specified by the Management Valuation Team of Wells Fargo Funds Management, LLC (“Funds Management”).
Many securities markets and exchanges outside the U.S. close prior to the close of the New York Stock Exchange and therefore may not fully reflect trading or events that occur after the close of the principal exchange in which the foreign securities are traded, but before the close of the New York Stock Exchange. If such trading or events are expected to materially affect the value of such securities, then fair value pricing procedures approved by the Board of Trustees of the Fund are applied. These procedures take into account multiple factors including movements in U.S. securities markets after foreign exchanges close. Foreign securities that are fair valued under these procedures are categorized as Level 2 and the application of these procedures may result in transfers between Level 1 and Level 2. Depending on market activity, such fair valuations may be frequent. Such fair value pricing may result in net asset values that are higher or lower than net asset values based on the last reported sales price or latest quoted bid price. On March 31, 2016, such fair value pricing was not used in pricing foreign securities.
Debt securities are valued at the evaluated bid price provided by an independent pricing service or, if a reliable price is not available, the quoted bid price from an independent broker-dealer.
Investments in registered open-end investment companies are valued at net asset value. Interests in non-registered investment vehicles that are redeemable at net asset value are fair valued normally at net asset value.
Investments which are not valued using any of the methods discussed above are valued at their fair value, as determined in good faith by the Board of Trustees. The Board of Trustees has established a Valuation Committee comprised of the Trustees and has delegated to it the authority to take any actions regarding the valuation of portfolio securities that the Valuation Committee deems necessary or appropriate, including determining the fair value of portfolio securities, unless the determination has been delegated to the Management Valuation Team. The Board of Trustees retains the authority to make or ratify any valuation decisions or approve any changes to the Valuation Procedures as it deems appropriate. On a quarterly basis, the Board of Trustees receives reports on any valuation actions taken by the Valuation Committee or the Management Valuation Team which may include items for ratification.
Valuations of fair valued securities are compared to the next actual sales price when available, or other appropriate market values, to assess the continued appropriateness of the fair valuation methodologies used. These securities are fair valued on a day-to-day basis, taking into consideration changes to appropriate market information and any significant changes to the inputs considered in the valuation process until there is a readily available price provided on an exchange
| | | | | | |
| Notes to financial statements | | Wells Fargo Utility and Telecommunications Fund | | | 23 | |
or by an independent pricing service. Valuations received from an independent pricing service or independent broker-dealer quotes are periodically validated by comparisons to most recent trades and valuations provided by other independent pricing services in addition to the review of prices by the manager and/or subadviser. Unobservable inputs used in determining fair valuations are identified based on the type of security, taking into consideration factors utilized by market participants in valuing the investment, knowledge about the issuer and the current market environment.
Foreign currency translation
The accounting records of the Fund are maintained in U.S. dollars. The values of other assets and liabilities denominated in foreign currencies are translated into U.S. dollars at rates provided by an independent foreign currency pricing source at a time each business day specified by the Management Valuation Team. Purchases and sales of securities, and income and expenses are converted at the rate of exchange on the respective dates of such transactions. Net realized foreign exchange gains or losses arise from sales of foreign currencies, currency gains or losses realized between the trade and settlement dates on securities transactions, and the difference between the amounts of dividends, interest and foreign withholding taxes recorded and the U.S. dollar equivalent of the amounts actually paid or received. Net unrealized foreign exchange gains and losses arise from changes in the fair value of assets and liabilities other than investments in securities resulting from changes in exchange rates. The changes in net assets arising from changes in exchange rates and the changes in net assets resulting from changes in market prices of securities are not separately presented. Such changes are included in net realized and unrealized gains or losses from investments.
Security loans
The Fund may lend its securities from time to time in order to earn additional income in the form of fees or interest on securities received as collateral or the investment of any cash received as collateral. The Fund continues to receive interest or dividends on the securities loaned. The Fund receives collateral in the form of cash or securities with a value at least equal to the value of the securities on loan. The value of the loaned securities is determined at the close of each business day and any additional required collateral is delivered to the Fund on the next business day. In a securities lending transaction, the net asset value of the Fund will be affected by an increase or decrease in the value of the securities loaned and by an increase or decrease in the value of the instrument in which collateral is invested. The amount of securities lending activity undertaken by the Fund fluctuates from time to time. In the event of default or bankruptcy by the borrower, the Fund may be prevented from recovering the loaned securities or gaining access to the collateral or may experience delays or costs in doing so. In addition, the investment of any cash collateral received may lose all or part of its value. The Fund has the right under the lending agreement to recover the securities from the borrower on demand.
The Fund lends its securities through an unaffiliated securities lending agent. Cash collateral received in connection with its securities lending transactions is invested in Securities Lending Cash Investments, LLC (the “Securities Lending Fund”). The Securities Lending Fund is exempt from registration under Section 3(c)(7) of the 1940 Act and is managed by Funds Management and is subadvised by Wells Capital Management Incorporated (“WellsCap”), an affiliate of Funds Management and an indirect wholly owned subsidiary of Wells Fargo & Company (“Wells Fargo”). Funds Management receives an advisory fee starting at 0.05% and declining to 0.01% as the average daily net assets of the Securities Lending Fund increase. All of the fees received by Funds Management are paid to WellsCap for its services as subadviser. The Securities Lending Fund seeks to provide a positive return compared to the daily Fed Funds Open rate by investing in high-quality, U.S. dollar-denominated short-term money market instruments. Securities Lending Fund investments are fair valued based upon the amortized cost valuation technique. Income earned from investment in the Securities Lending Fund is included in securities lending income on the Statement of Operations.
Options
The Fund is subject to equity price risk in the normal course of pursuing its investment objectives. The Fund may write covered call options or secured put options on individual securities and/or indexes. When the Fund writes an option, an amount equal to the premium received is recorded as a liability and is subsequently adjusted to the current market value of the written option. Premiums received from written options that expire unexercised are recognized as realized gains on the expiration date. For exercised options, the difference between the premium received and the amount paid on effecting a closing purchase transaction, including brokerage commissions, is treated as a realized gain or loss. If a call option is exercised, the premium is added to the proceeds from the sale of the underlying security in calculating the realized gain or loss on the sale. If a put option is exercised, the premium reduces the cost of the security purchased. The Fund, as a writer of an option, bears the market risk of an unfavorable change in the price of the security and/or index underlying the written option.
The Fund may also purchase call or put options. The premium is included in the Statement of Assets and Liabilities as an investment, the value of which is subsequently adjusted based on the current market value of the option. Premiums paid
| | | | |
| 24 | | Wells Fargo Utility and Telecommunications Fund | | Notes to financial statements |
for purchased options that expire are recognized as realized losses on the expiration date. Premiums paid for purchased options that are exercised or closed are added to the amount paid or offset against the proceeds received for the underlying security to determine the realized gain or loss. The risk of loss associated with purchased options is limited to the premium paid.
Options traded on an exchange are regulated and terms of the options are standardized. Purchased options traded over-the-counter expose the Fund to counterparty risk in the event the counterparty does not perform. This risk can be mitigated by having a master netting arrangement between the Fund and the counterparty and by having the counterparty post collateral to cover the Fund’s exposure to the counterparty.
Security transactions and income recognition
Securities transactions are recorded on a trade date basis. Realized gains or losses are recorded on the basis of identified cost.
Dividend income is recognized on the ex-dividend date, except for certain dividends from foreign securities, which are recorded as soon as the custodian verifies the ex-dividend date. Dividend income from foreign securities is recorded net of foreign taxes withheld where recovery of such taxes is not assured.
Interest income is accrued daily and bond discounts are accreted and premiums are amortized daily based on the effective interest method. To the extent debt obligations are placed on non-accrual status, any related interest income may be reduced by writing off interest receivables when the collection of all or a portion of interest has become doubtful based on consistently applied procedures. If the issuer subsequently resumes interest payments or when the collectability of interest is reasonably assured, the debt obligation is removed from non-accrual status.
Distributions to shareholders
Distributions to shareholders from net investment income and net realized gains, if any, are recorded on the ex-dividend date. Such distributions are determined in conformity with federal income tax regulations, which may differ in amount or character from net investment income and realized gains recognized for purposes of U.S. generally accepted accounting principles.
Federal and other taxes
The Fund intends to continue to qualify as a regulated investment company by distributing substantially all of its investment company taxable income and any net realized capital gains (after reduction for capital loss carryforwards) sufficient to relieve it from all, or substantially all, federal income taxes. Accordingly, no provision for federal income taxes was required.
The Fund’s income and federal excise tax returns and all financial records supporting those returns for the prior three fiscal years are subject to examination by the federal and Delaware revenue authorities. Management has analyzed the Fund’s tax positions taken on federal, state, and foreign tax returns for all open tax years and does not believe that there are any uncertain tax positions that require recognition of a tax liability.
Reclassifications are made to the Fund’s capital accounts for permanent tax differences to reflect income and gains available for distribution (or available capital loss carryforwards) under federal income tax regulations. U.S. generally accepted accounting principles require that certain components of net assets be adjusted to reflect permanent differences between financial and tax reporting. These reclassifications have no effect on net assets or net asset values per share. The primary permanent differences causing such reclassifications are due to certain distributions paid, foreign currency transactions and recognition of partnership income. At March 31, 2016, as a result of permanent book-to-tax differences, the following reclassification adjustments were made on the Statement of Assets and Liabilities:
| | | | |
| Paid-in capital | | Undistributed net
investment income | | Accumulated net realized losses on investments |
| $44,253 | | $271,259 | | $(315,512) |
As of March 31, 2016, the Fund had capital loss carryforwards available to offset future net realized capital gains in the amount of $12,121,728 expiring in 2017.
As of March 31, 2016, the Fund had current year deferred post-October capital losses consisting of $11,892,103 in long-term losses which will be recognized on the first day of the following fiscal year.
Class allocations
The separate classes of shares offered by the Fund differ principally in applicable sales charges, distribution, shareholder servicing, and administration fees. Class specific expenses are charged directly to that share class. Investment income, common expenses, and realized and unrealized gains (losses) on investments are allocated daily to each class of shares based on the relative proportion of net assets of each class.
| | | | | | |
| Notes to financial statements | | Wells Fargo Utility and Telecommunications Fund | | | 25 | |
3. FAIR VALUATION MEASUREMENTS
Fair value measurements of investments are determined within a framework that has established a fair value hierarchy based upon the various data inputs utilized in determining the value of the Fund’s investments. The three-level hierarchy gives the highest priority to unadjusted quoted prices in active markets for identical assets or liabilities (Level 1) and the lowest priority to significant unobservable inputs (Level 3). The Fund’s investments are classified within the fair value hierarchy based on the lowest level of input that is significant to the fair value measurement. The inputs are summarized into three broad levels as follows:
| n | | Level 1 – quoted prices in active markets for identical securities |
| n | | Level 2 – other significant observable inputs (including quoted prices for similar securities, interest rates, prepayment speeds, credit risk, use of amortized cost, etc.) |
| n | | Level 3 – significant unobservable inputs (including the Fund’s own assumptions in determining the fair value of investments) |
The inputs or methodologies used for valuing investments in securities are not necessarily an indication of the risk associated with investing in those securities.
The following is a summary of the inputs used in valuing the Fund’s assets and liabilities as of March 31, 2016:
| | | | | | | | | | | | | | | | |
| | | Quoted prices (Level 1) | | | Other significant observable inputs
(Level 2) | | | Significant unobservable inputs (Level 3) | | | Total | |
Assets | | | | | | | | | | | | | | | | |
Investments in: | | | | | | | | | | | | | | | | |
| | | | |
Common stocks | | | | | | | | | | | | | | | | |
Consumer discretionary | | $ | 13,749,108 | | | $ | 0 | | | $ | 0 | | | $ | 13,749,108 | |
Energy | | | 3,941,436 | | | | 0 | | | | 0 | | | | 3,941,436 | |
Financials | | | 23,740,635 | | | | 0 | | | | 0 | | | | 23,740,635 | |
Industrials | | | 166,950 | | | | 0 | | | | 0 | | | | 166,950 | |
Information technology | | | 28,209,600 | | | | 0 | | | | 0 | | | | 28,209,600 | |
Telecommunication services | | | 48,079,848 | | | | 0 | | | | 0 | | | | 48,079,848 | |
Utilities | | | 240,217,915 | | | | 0 | | | | 0 | | | | 240,217,915 | |
| | | | |
Convertible debenture | | | 0 | | | | 5,000 | | | | 0 | | | | 5,000 | |
| | | | |
Exchange-traded funds | | | | | | | | | | | | | | | | |
Financials | | | 481,170 | | | | 0 | | | | 0 | | | | 481,170 | |
| | | | |
Preferred stocks | | | | | | | | | | | | | | | | |
Utilities | | | 732,875 | | | | 0 | | | | 0 | | | | 732,875 | |
| | | | |
Warrants | | | | | | | | | | | | | | | | |
Energy | | | 0 | | | | 18,104 | | | | 0 | | | | 18,104 | |
| | | | |
Short-term investments | | | | | | | | | | | | | | | | |
Investment companies | | | 40,990,641 | | | | 0 | | | | 0 | | | | 40,990,641 | |
Investment measured at net asset value* | | | | | | | | | | | | | | | 7,771,650 | |
Total assets | | $ | 400,310,178 | | | $ | 23,104 | | | $ | 0 | | | $ | 408,104,932 | |
Liabilities | | | | | | | | | | | | | | | | |
Written options | | $ | 0 | | | $ | 173,334 | | | $ | 0 | | | $ | 173,334 | |
Total liabilities | | $ | 0 | | | $ | 173,334 | | | $ | 0 | | | $ | 173,334 | |
| * | Investments that are measured at fair value using the net asset value per share (or its equivalent) as a practical expedient have not been categorized in the fair value hierarchy. The fair value amount presented in the table is intended to permit reconciliation of the fair value hierarchy to the amounts presented in the Statement of Assets and Liabilities. The Fund’s investment in Securities Lending Cash Investments, LLC valued at $7,771,650 does not have a redemption period notice, can be redeemed daily and does not have any unfunded commitments. |
The Fund recognizes transfers between levels within the fair value hierarchy at the end of the reporting period. At March 31, 2016, the Fund did not have any transfers into/out of Level 1, Level 2, or Level 3.
| | | | |
| 26 | | Wells Fargo Utility and Telecommunications Fund | | Notes to financial statements |
4. TRANSACTIONS WITH AFFILIATES AND OTHER EXPENSES
Management fee
Funds Management, an indirect wholly owned subsidiary of Wells Fargo, is the manager of the Fund and provides advisory and fund-level administrative services under an investment management agreement. Under the investment management agreement, Funds Management is responsible for, among other services, implementing the investment objectives and strategies of the Fund, supervising the applicable subadviser, providing fund-level administrative services in connection with the Fund’s operations, and providing any other fund-level administrative services reasonably necessary for the operation of the Fund. As compensation for its services under the investment management agreement, Funds Management is entitled to receive an annual management fee starting at 0.65% and declining to 0.48% as the average daily net assets of the Fund increase.
Prior to July 1, 2015, Funds Management provided advisory services pursuant to an investment advisory agreement and was entitled to receive an annual fee which started at 0.60% and declined to 0.45% as the average daily net assets of the Fund increased. In addition, fund-level administrative services were provided by Funds Management under a separate administration agreement at an annual fee which started at 0.05% and declined to 0.03% as the average daily net assets of the Fund increased. For financial statement purposes, the advisory fee and fund-level administration fee for the year ended March 31, 2016 have been included in management fee on the Statement of Operations.
For the year ended March 31, 2016, the management fee was equivalent to an annual rate of 0.65% of the Fund’s average daily net assets.
Funds Management has retained the services of a subadviser to provide daily portfolio management to the Fund. The fee for subadvisory services is borne by Funds Management. Crow Point Partners, LLC is the subadviser to the Fund and is entitled to receive a fee from Funds Management at an annual rate starting at 0.20% and declining to 0.10% as the average daily net assets of the Fund increase.
Administration fees
Under a class-level administration agreement, Funds Management provides class-level administrative services to the Fund, which includes paying fees and expenses for services provided by the transfer agent, sub-transfer agents, omnibus account servicers and record-keepers. As compensation for its services under the class-level administration agreement, Funds Management receives an annual fee which is calculated based on the average daily net assets of each class as follows:
| | | | | | | | |
| | | Class-level administration fee | |
| | | Current rate | | | Rate prior to
July 1, 2015 | |
Class A, Class B, Class C | | | 0.21 | % | | | 0.26 | % |
Administrator Class | | | 0.13 | | | | 0.10 | |
Institutional Class | | | 0.13 | | | | 0.08 | |
Funds Management has contractually waived and/or reimbursed management and administration fees to the extent necessary to maintain certain net operating expense ratios for the Fund. Waiver of fees and/or reimbursement of expenses by Funds Management were made first from fund level expenses on a proportionate basis and then from class specific expenses. Funds Management has committed through July 31, 2016 to waive fees and/or reimburse expenses to the extent necessary to cap the Fund’s expenses at 1.14% for Class A shares, 1.89% for Class B shares, 1.89% for Class C shares, 0.95% for Administrator Class shares, and 0.78% for Institutional Class shares. After this time, the cap may be increased or the commitment to maintain the cap may be terminated only with the approval of the Board of Trustees.
Distribution fees
The Trust has adopted a distribution plan for Class B and Class C shares of the Fund pursuant to Rule 12b-1 under the 1940 Act. Distribution fees are charged to Class B and Class C shares and paid to Wells Fargo Funds Distributor, LLC (“Funds Distributor”), the principal underwriter, at an annual rate of 0.75% of the average daily net assets of Class B and Class C shares.
In addition, Funds Distributor is entitled to receive the front-end sales charge from the purchase of Class A shares and a contingent deferred sales charge on the redemption of certain Class A shares. Funds Distributor is also entitled to receive the contingent deferred sales charges from redemptions of Class B and Class C shares. For the year ended March 31, 2016, Funds Distributor received $12,111 from the sale of Class A shares and $444 in contingent deferred sales charges from redemptions of Class C shares.
| | | | | | |
| Notes to financial statements | | Wells Fargo Utility and Telecommunications Fund | | | 27 | |
Shareholder servicing fees
The Trust has entered into contracts with one or more shareholder servicing agents, whereby Class A, Class B, Class C, and Administrator Class of the Fund are charged a fee at an annual rate of 0.25% of the average daily net assets of each respective class.
A portion of these total shareholder servicing fees were paid to affiliates of Wells Fargo.
5. INVESTMENT PORTFOLIO TRANSACTIONS
Purchases and sales of investments, excluding U.S. government obligations (if any) and short-term securities, for the year ended March 31, 2016 were $57,134,350 and $124,392,480, respectively.
6. INVESTMENTS IN AFFILIATES
An affiliated investment is a company which is under common ownership or control of the Fund or which the Fund has ownership of at least 5% of the outstanding voting shares. The following is a summary of transactions for the long-term holdings of issuers that were either affiliates of the Fund at the beginning of the period or the end of the period.
| | | | | | | | | | | | | | | | | | | | | | | | | | | | |
| | | Shares,
beginning of
period | | | Shares
purchased | | | Shares
sold | | | Shares, end of period | | | Value, end of period | | | Income from affiliated securities | | | Realized gains (losses) | |
Spark Energy Incorporated Class A | | | 0 | | | | 281,837 | | | | 0 | | | | 281,837 | | | $ | 5,073,066 | | | $ | 0 | | | $ | 0 | |
7. DERIVATIVE TRANSACTIONS
During the year ended March 31, 2016, the Fund entered into written options for economic hedging purposes.
During the year ended March 31, 2016, the Fund had written option activities as follows:
| | | | | | | | | | | | | | | | |
| | | Call options | | | Put options | |
| | | Number of
contracts | | | Premiums received | | | Number of
contracts | | | Premiums received | |
Options outstanding at March 31, 2015 | | | 0 | | | $ | 0 | | | | 0 | | | $ | 0 | |
Options written | | | 9,795 | | | | 829,134 | | | | 369 | | | | 49,238 | |
Options expired | | | (1,500 | ) | | | (322,818 | ) | | | (369 | ) | | | (49,238 | ) |
Options closed | | | (3,500 | ) | | | (203,485 | ) | | | 0 | | | | 0 | |
Options exercised | | | 0 | | | | 0 | | | | 0 | | | | 0 | |
Options outstanding at March 31, 2016 | | | 4,795 | | | $ | 302,831 | | | | 0 | | | $ | 0 | |
Open call options written at March 31, 2016 were as follows:
| | | | | | | | | | | | |
| Expiration date | | Counterparty | | Number of contracts | | Strike price | | | Value | |
5-20-2016 | | JPMorgan | | 3,000 | | $ | 4.00 | | | $ | (47,684 | ) |
7-15-2016 | | JPMorgan | | 1,795 | | | 34.00 | | | | (125,650 | ) |
The Fund had an average of 1,240 written option contracts during the year ended March 31, 2016. As of March 31, 2016, the Fund had segregated $2,000 as cash collateral for written options.
At March 31, 2016, the Fund did not have any purchased options but had an average of 790 purchased option contracts during the year ended March 31, 2016.
A summary of derivative instruments by primary risk exposure is outlined in the following table, unless the only primary risk exposure category is already reflected in the appropriate financial statements.
| | | | |
| 28 | | Wells Fargo Utility and Telecommunications Fund | | Notes to financial statements |
The effect of derivative instruments on the Statement of Operations for the year ended March 31, 2016 was as follows for the Fund:
| | | | | | | | | | | | |
| | | Amount of realized gains
on derivatives | | | Change in unrealized gains
(losses) on derivatives | |
| | | Unaffiliated
securities | | Written options | | | Unaffiliated securities | | Written options | |
Equity contracts | | $2,168,192* | | $ | 549,118 | | | $0* | | $ | 129,497 | |
| | * | Amount relates to purchased options | |
For certain types of derivative transactions, the Fund has entered into International Swaps and Derivatives Association, Inc. master agreements (“ISDA Master Agreements”) or similar agreements with approved counterparties. The ISDA Master Agreements or similar agreements may have requirements to deliver/deposit securities or cash to/with an exchange or broker-dealer as collateral and allows the Fund to offset, with each counterparty, certain derivative financial instrument’s assets and/or liabilities with collateral held or pledged. Collateral requirements differ by type of derivative. Collateral or margin requirements are set by the broker or exchange clearing house for exchange traded derivatives while collateral terms are contract specific for over-the-counter traded derivatives. Cash collateral that has been pledged to cover obligations of the Fund under ISDA Master Agreements or similar agreements, if any, are reported separately in the Statement of Assets and Liabilities. Securities pledged as collateral, if any, are noted in the Portfolio of Investments. With respect to balance sheet offsetting, absent an event of default by the counterparty or a termination of the agreement, the reported amounts of financial assets and financial liabilities in the Statement of Assets and Liabilities are not offset across transactions between the Fund and the applicable counterparty. A reconciliation of the gross amounts on the Statement of Assets and Liabilities to the net amounts by derivative type, including any collateral exposure, is as follows:
| | | | | | | | | | | | | | | | |
| Derivative type | | Counterparty | | Gross amounts
of liabilities in the Statement of Assets and Liabilities | | Amounts subject to netting agreements | | | Collateral pledged1 | | | Net amount
of liabilities | |
Written options | | JPMorgan | | $173,334 | | $ | 0 | | | $ | (173,334 | ) | | $ | 0 | |
| | 1 | Collateral pledged within this table is limited to the collateral for the net transaction with the counterparty. | |
8. BANK BORROWINGS
The Trust (excluding the money market funds and certain other funds ) and Wells Fargo Variable Trust are parties to a $200,000,000 revolving credit agreement whereby the Fund is permitted to use bank borrowings for temporary or emergency purposes, such as to fund shareholder redemption requests. Interest under the credit agreement is charged to the Fund based on a borrowing rate equal to the higher of the Federal Funds rate in effect on that day plus 1.25% or the overnight LIBOR rate in effect on that day plus 1.25%. In addition, an annual commitment fee equal to 0.20% of the unused balance is allocated to each participating fund. Prior to September 1, 2015, the revolving credit agreement amount was $150,000,000 and the annual commitment fee was equal to 0.10% of the unused balance which was allocated to each participating fund.
For the year ended March 31, 2016, there were no borrowings by the Fund under the agreement.
9. DISTRIBUTIONS TO SHAREHOLDERS
The tax character of distributions paid was $5,998,415 and $7,691,026 of ordinary income for the years ended March 31, 2016 and March 31, 2015, respectively.
As of March 31, 2016, the components of distributable earnings on a tax basis were as follows:
| | | | | | |
Undistributed
ordinary
income | | Unrealized
gains | | Post-October
capital losses
deferred | | Capital loss carryforward |
| $654,308 | | $169,329,713 | | $(11,892,103) | | $(12,121,728) |
| | | | | | |
| Notes to financial statements | | Wells Fargo Utility and Telecommunications Fund | | | 29 | |
10. CONCENTRATION RISK
The Fund invests a substantial portion of its assets in utility and telecommunications companies and, therefore, may be more affected by changes in the utility and telecommunications sectors than would be a fund whose investments are not heavily weighted in any sector.
11. INDEMNIFICATION
Under the Trust’s organizational documents, the officers and Trustees have been granted certain indemnification rights against certain liabilities that may arise out of performance of their duties to the Trust. Additionally, in the normal course of business, the Trust may enter into contracts with service providers that contain a variety of indemnification clauses. The Trust’s maximum exposure under these arrangements is dependent on future claims that may be made against the Fund and, therefore, cannot be estimated.
| | | | |
| 30 | | Wells Fargo Utility and Telecommunications Fund | | Report of independent registered public accounting firm |
BOARD OF TRUSTEES AND SHAREHOLDERS OF WELLS FARGO FUNDS TRUST:
We have audited the accompanying statement of assets and liabilities, including the portfolio of investments, of the Wells Fargo Utility and Telecommunications Fund (formerly known as Wells Fargo Advantage Utility and Telecommunications Fund) (the “Fund”), one of the funds constituting the Wells Fargo Funds Trust, as of March 31, 2016, and the related statement of operations for the year then ended, the statements of changes in net assets for each of the years in the two-year period then ended, and the financial highlights for each of the years in the five-year period then ended. These financial statements and financial highlights are the responsibility of the Fund’s management. Our responsibility is to express an opinion on these financial statements and financial highlights based on our audits.
We conducted our audits in accordance with the standards of the Public Company Accounting Oversight Board (United States). Those standards require that we plan and perform the audit to obtain reasonable assurance about whether the financial statements and financial highlights are free of material misstatement. An audit includes examining, on a test basis, evidence supporting the amounts and disclosures in the financial statements. Our procedures included confirmation of securities owned as of March 31, 2016, by correspondence with custodian and brokers, or by other appropriate auditing procedures. An audit also includes assessing the accounting principles used and significant estimates made by management, as well as evaluating the overall financial statement presentation. We believe that our audits provide a reasonable basis for our opinion.
In our opinion, the financial statements and financial highlights referred to above present fairly, in all material respects, the financial position of the Wells Fargo Utility and Telecommunications Fund as of March 31, 2016, the results of its operations for the year then ended, the changes in its net assets for each of the years in the two-year period then ended, and the financial highlights for each of the years in the five-year period then ended, in conformity with U.S. generally accepted accounting principles.

Boston, Massachusetts
May 25, 2016
| | | | | | |
| Other information (unaudited) | | Wells Fargo Utility and Telecommunications Fund | | | 31 | |
TAX INFORMATION
For corporate shareholders, pursuant to Section 854 of the Internal Revenue Code, 100% of ordinary income dividends qualify for the corporate dividends-received deduction for the fiscal year ended March 31, 2016.
Pursuant to Section 854 of the Internal Revenue Code, $5,998,428 of income dividends paid during the fiscal year ended March 31, 2016 has been designated as qualified dividend income (QDI).
For the fiscal year ended March 31, 2016, $78,579 has been designated as interest-related dividends for nonresident alien shareholders pursuant to Section 871 of the Internal Revenue Code.
PROXY VOTING INFORMATION
A description of the policies and procedures that the Fund uses to determine how to vote proxies relating to portfolio securities is available, upon request, by calling 1-800-222-8222, visiting our website at wellsfargofunds.com, or visiting the SEC website at sec.gov. Information regarding how the Fund voted proxies relating to portfolio securities during the most recent 12-month period ended June 30 is available on the Fund’s website at wellsfargofunds.com or by visiting the SEC website at sec.gov.
PORTFOLIO HOLDINGS INFORMATION
The complete portfolio holdings for the Fund are publicly available monthly on the Fund’s website (wellsfargofunds.com), on a one-month delayed basis. In addition, top ten holdings information (excluding derivative positions) for the Fund is publicly available on the Fund’s website on a monthly, seven-day or more delayed basis. The Fund files its complete schedule of portfolio holdings with the SEC for the first and third quarters of each fiscal year on Form N-Q, which is available by visiting the SEC website at sec.gov. In addition, the Fund’s Form N-Q may be reviewed and copied at the SEC’s Public Reference Room in Washington, DC, and at regional offices in New York City, at 233 Broadway, and in Chicago, at 175 West Jackson Boulevard, Suite 900. Information about the Public Reference Room may be obtained by calling 1-800-SEC-0330.
| | | | |
| 32 | | Wells Fargo Utility and Telecommunications Fund | | Other information (unaudited) |
BOARD OF TRUSTEES AND OFFICERS
Each of the Trustees and Officers1 listed in the table below acts in identical capacities for each fund in the Wells Fargo family of funds, which consists of 144 mutual funds comprising the Wells Fargo Funds Trust, Wells Fargo Variable Trust, Wells Fargo Master Trust and four closed-end funds (collectively the “Fund Complex”). This table should be read in conjunction with the Prospectus and the Statement of Additional Information2. The mailing address of each Trustee and Officer is 525 Market Street, 12th Floor, San Francisco, CA 94105. Each Trustee and Officer serves an indefinite term, however, each Trustee serves such term until reaching the mandatory retirement age established by the Trustees.
Independent Trustees
| | | | | | |
Name and year of birth | | Position held and length of service* | | Principal occupations during past five years or longer | | Current other public company or investment
company directorships |
William R. Ebsworth
(Born 1957) | | Trustee, since 2015 | | Retired. From 1984 to 2013, equities analyst, portfolio manager, research director and chief financial officer at Fidelity Management and Research Company in Boston, Tokyo, and Hong Kong and retired in 2013 as Chief Investment Officer of Fidelity Strategic Advisers, Inc. where he lead a team of investment professionals managing client assets. Prior thereto, Board member of Hong Kong Securities Clearing Co., Hong Kong Options Clearing Corp., the Thailand International Fund, Ltd., Fidelity Investments Life Insurance Company, and Empire Fidelity Investments Life Insurance Company. Mr. Ebsworth is a CFA® charterholder and an Adjunct Lecturer, Finance, at Babson College. | | Asset Allocation Trust |
| Jane A. Freeman (Born 1953) | | Trustee, since 2015 | | Retired. From 2012 to 2014 and 1999 to 2008, Chief Financial Officer of Scientific Learning Corporation. From 2008 to 2012, Ms. Freeman provided consulting services related to strategic business projects. Prior to 1999, Portfolio Manager at Rockefeller & Co. and Scudder, Stevens & Clark. Board member of the Harding Loevner Funds from 1996 to 2014, serving as both Lead Independent Director and chair of the Audit Committee. Board member of the Russell Exchange Traded Funds Trust from 2011 to 2012 and the chair of the Audit Committee. Ms. Freeman is Chair of Taproot Foundation (non-profit organization), a Board Member of Ruth Bancroft Garden (non-profit organization) and an inactive chartered financial analyst. | | Asset Allocation Trust |
| Peter G. Gordon (Born 1942) | | Trustee, since 1998; Chairman, since 2005 | | Co-Founder, Retired Chairman, President and CEO of Crystal Geyser Water Company. Trustee Emeritus, Colby College. | | Asset Allocation Trust |
| Isaiah Harris, Jr. (Born 1952) | | Trustee, since 2009 | | Retired. Chairman of the Board of CIGNA Corporation since 2009, and Director since 2005. From 2003 to 2011, Director of Deluxe Corporation. Prior thereto, President and CEO of BellSouth Advertising and Publishing Corp. from 2005 to 2007, President and CEO of BellSouth Enterprises from 2004 to 2005 and President of BellSouth Consumer Services from 2000 to 2003. Emeritus member of the Iowa State University Foundation Board of Governors. Emeritus Member of the Advisory Board of Iowa State University School of Business. Advisory Board Member, Palm Harbor Academy (charter school). Advisory Board Member, Child Evangelism Fellowship (non-profit). Mr. Harris is a certified public accountant (inactive status). | | CIGNA Corporation; Asset Allocation Trust |
| Judith M. Johnson (Born 1949) | | Trustee, since 2008; Audit Committee Chairman, since 2008 | | Retired. Prior thereto, Chief Executive Officer and Chief Investment Officer of Minneapolis Employees Retirement Fund from 1996 to 2008. Ms. Johnson is an attorney, certified public accountant and a certified managerial accountant. | | Asset Allocation Trust |
David F. Larcker
(Born 1950) | | Trustee, since 2009 | | James Irvin Miller Professor of Accounting at the Graduate School of Business, Stanford University, Director of the Corporate Governance Research Initiative and Senior Faculty of The Rock Center for Corporate Governance since 2006. From 2005 to 2008, Professor of Accounting at the Graduate School of Business, Stanford University. Prior thereto, Ernst & Young Professor of Accounting at The Wharton School, University of Pennsylvania from 1985 to 2005. | | Asset Allocation Trust |
| | | | | | |
| Other information (unaudited) | | Wells Fargo Utility and Telecommunications Fund | | | 33 | |
| | | | | | |
Name and year of birth | | Position held and length of service* | | Principal occupations during past five years or longer | | Current other public company or investment
company directorships |
Olivia S. Mitchell
(Born 1953) | | Trustee, since 2006 | | International Foundation of Employee Benefit Plans Professor, Wharton School of the University of Pennsylvania since 1993. Director of Wharton’s Pension Research Council and Boettner Center on Pensions & Retirement Research, and Research Associate at the National Bureau of Economic Research. Previously, Cornell University Professor from 1978 to 1993. | | Asset Allocation Trust |
Timothy J. Penny
(Born 1951) | | Trustee, since 1996 | | President and Chief Executive Officer of Southern Minnesota Initiative Foundation, a non-profit organization, since 2007 and Senior Fellow at the Humphrey Institute Policy Forum at the University of Minnesota since 1995. Member of the Board of Trustees of NorthStar Education Finance, Inc., a non-profit organization, since 2007. | | Asset Allocation Trust |
Michael S. Scofield
(Born 1943) | | Trustee, since 2010 | | Served on the Investment Company Institute’s Board of Governors and Executive Committee from 2008-2011 as well the Governing Council of the Independent Directors Council from 2006-2011 and the Independent Directors Council Executive Committee from 2008-2011. Chairman of the IDC from 2008-2010. Institutional Investor (Fund Directions) Trustee of Year in 2007. Trustee of the Evergreen Funds complex (and its predecessors) from 1984 to 2010. Chairman of the Evergreen Funds from 2000-2010. Former Trustee of the Mentor Funds. Retired Attorney, Law Offices of Michael S. Scofield. | | Asset Allocation Trust |
| * | Length of service dates reflect the Trustee’s commencement of service with the Trust’s predecessor entities, where applicable. |
Officers
| | | | | | |
Name and year of birth | | Position held and length of service | | Principal occupations during past five years or longer | | |
Karla M. Rabusch
(Born 1959) | | President, since 2003 | | Executive Vice President of Wells Fargo Bank, N.A. and President of Wells Fargo Funds Management, LLC since 2003. | | |
Nancy Wiser1
(Born 1967) | | Treasurer, since 2012 | | Executive Vice President of Wells Fargo Funds Management, LLC since 2011. Chief Operating Officer and Chief Compliance Officer at LightBox Capital Management LLC, from 2008 to 2011. | | |
C. David Messman
(Born 1960) | | Secretary, since 2000; Chief Legal Officer, since 2003 | | Senior Vice President and Secretary of Wells Fargo Funds Management, LLC since 2001. Assistant General Counsel of Wells Fargo Bank, N.A. since 2013 and Vice President and Managing Counsel of Wells Fargo Bank, N.A. from 1996 to 2013. | | |
Debra Ann Early
(Born 1964) | | Chief Compliance Officer, since 2007 | | Executive Vice President of Wells Fargo Funds Management, LLC since 2014, Senior Vice President and Chief Compliance Officer from 2007 to 2014. | | |
David Berardi
(Born 1975) | | Assistant Treasurer, since 2009 | | Vice President of Wells Fargo Funds Management, LLC since 2009. Vice President of Evergreen Investment Management Company, LLC from 2008 to 2010. Manager of Fund Reporting and Control for Evergreen Investment Management Company, LLC from 2004 to 2010. | | |
Jeremy DePalma1
(Born 1974) | | Assistant Treasurer, since 2009 | | Senior Vice President of Wells Fargo Funds Management, LLC since 2009. Senior Vice President of Evergreen Investment Management Company, LLC from 2008 to 2010 and head of the Fund Reporting and Control Team within Fund Administration from 2005 to 2010. | | |
| 1 | Nancy Wiser acts as Treasurer of 72 funds in the Fund Complex. Jeremy DePalma acts as Treasurer of 72 funds and Assistant Treasurer of 72 funds in the Fund Complex. |
| 2 | The Statement of Additional Information includes additional information about the Trustees and is available, without charge, upon request, by calling
1-800-222-8222 or by visiting the website at wellsfargofunds.com. |
| | | | |
| 34 | | Wells Fargo Utility and Telecommunications Fund | | List of abbreviations |
The following is a list of common abbreviations for terms and entities that may have appeared in this report.
| ACA | — ACA Financial Guaranty Corporation |
| ADR | — American depositary receipt |
| ADS | — American depositary shares |
| AGC | — Assured Guaranty Corporation |
| AGM | — Assured Guaranty Municipal |
| Ambac | — Ambac Financial Group Incorporated |
| AMT | — Alternative minimum tax |
| BAN | — Bond anticipation notes |
| BHAC | — Berkshire Hathaway Assurance Corporation |
| CAB | — Capital appreciation bond |
| CCAB | — Convertible capital appreciation bond |
| CDA | — Community Development Authority |
| CDO | — Collateralized debt obligation |
| DRIVER | — Derivative inverse tax-exempt receipts |
| DW&P | — Department of Water & Power |
| DWR | — Department of Water Resources |
| ECFA | — Educational & Cultural Facilities Authority |
| EDA | — Economic Development Authority |
| EDFA | — Economic Development Finance Authority |
| ETF | — Exchange-traded fund |
| FDIC | — Federal Deposit Insurance Corporation |
| FFCB | — Federal Farm Credit Banks |
| FGIC | — Financial Guaranty Insurance Corporation |
| FHA | — Federal Housing Administration |
| FHLB | — Federal Home Loan Bank |
| FHLMC | — Federal Home Loan Mortgage Corporation |
| FICO | — The Financing Corporation |
| FNMA | — Federal National Mortgage Association |
| GDR | — Global depositary receipt |
| GNMA | — Government National Mortgage Association |
| HCFR | — Healthcare facilities revenue |
| HEFA | — Health & Educational Facilities Authority |
| HEFAR | — Higher education facilities authority revenue |
| HFA | — Housing Finance Authority |
| HFFA | — Health Facilities Financing Authority |
| HUD | — Department of Housing and Urban Development |
| IDA | — Industrial Development Authority |
| IDAG | — Industrial Development Agency |
| KRW | — Republic of Korea won |
| LIBOR | — London Interbank Offered Rate |
| LIFER | — Long Inverse Floating Exempt Receipts |
| LLC | — Limited liability company |
| LLLP | — Limited liability limited partnership |
| LLP | — Limited liability partnership |
| MBIA | — Municipal Bond Insurance Association |
| MFHR | — Multifamily housing revenue |
| MSTR | — Municipal securities trust receipts |
| MUD | — Municipal Utility District |
| National | — National Public Finance Guarantee Corporation |
| PCFA | — Pollution Control Financing Authority |
| PCL | — Public Company Limited |
| PCR | — Pollution control revenue |
| PFA | — Public Finance Authority |
| PFFA | — Public Facilities Financing Authority |
| PFOTER | — Puttable floating option tax-exempt receipts |
| plc | — Public limited company |
| PUTTER | — Puttable tax-exempt receipts |
| R&D | — Research & development |
| Radian | — Radian Asset Assurance |
| RAN | — Revenue anticipation notes |
| RDA | — Redevelopment Authority |
| RDFA | — Redevelopment Finance Authority |
| REIT | — Real estate investment trust |
| ROC | — Reset option certificates |
| SAVRS | — Select auction variable rate securities |
| SBA | — Small Business Authority |
| SDR | — Swedish depositary receipt |
| SFHR | — Single-family housing revenue |
| SFMR | — Single-family mortgage revenue |
| SPA | — Standby purchase agreement |
| SPDR | — Standard & Poor’s Depositary Receipts |
| SPEAR | — Short Puttable Exempt Adjustable Receipts |
| STRIPS | — Separate trading of registered interest and |
| TAN | — Tax anticipation notes |
| TIPS | — Treasury inflation-protected securities |
| TRAN | — Tax revenue anticipation notes |
| TTFA | — Transportation Trust Fund Authority |
| TVA | — Tennessee Valley Authority |
This page is intentionally left blank.
This page is intentionally left blank.

For more information
More information about Wells Fargo Funds is available free upon request. To obtain literature, please write, email, visit the Fund’s website, or call:
Wells Fargo Funds
P.O. Box 8266
Boston, MA 02266-8266
Email: fundservice@wellsfargo.com
Website: wellsfargofunds.com
Individual investors: 1-800-222-8222
Retail investment professionals: 1-888-877-9275
Institutional investment professionals: 1-866-765-0778
This report and the financial statements contained herein are submitted for the general information of the shareholders of the Fund. If this report is used for promotional purposes, distribution of the report must be accompanied or preceded by a current prospectus. Before investing, please consider the investment objectives, risks, charges, and expenses of the investment. For a current prospectus and, if available, a summary prospectus, containing this information, call 1-800-222-8222 or visit the Fund’s website at wellsfargofunds.com. Read the prospectus carefully before you invest or send money.
Wells Fargo Asset Management (WFAM) is a trade name used by the asset management businesses of Wells Fargo & Company. Wells Fargo Funds Management, LLC, a wholly owned subsidiary of Wells Fargo & Company, provides investment advisory and administrative services for Wells Fargo Funds. Other affiliates of Wells Fargo & Company provide subadvisory and other services for the funds. The funds are distributed by Wells Fargo Funds Distributor, LLC, Member FINRA, an affiliate of Wells Fargo & Company.
NOT FDIC INSURED ¡ NO BANK GUARANTEE ¡ MAY LOSE VALUE
© 2016 Wells Fargo Funds Management, LLC. All rights reserved.
| | |
 | | 241823 05-16 A318/AR318 03-16 |
(a) As of the end of the period covered by the report, Wells Fargo Funds Trust has adopted a code of ethics that applies to its President and Treasurer. A copy of the code of ethics is filed as an exhibit to this Form N-CSR.
(c) During the period covered by this report, there were no amendments to the provisions of the code of ethics adopted in Item 2(a) above.
(d) During the period covered by this report, there were no implicit or explicit waivers to the provisions of the code of ethics adopted in Item 2(a) above.
| ITEM 3. | AUDIT COMMITTEE FINANCIAL EXPERT |
The Board of Trustees of Wells Fargo Funds Trust has determined that Judith Johnson is an audit committee financial expert, as defined in Item 3 of Form N-CSR. Mrs. Johnson is independent for purposes of Item 3 of Form N-CSR.
| ITEM 4. | PRINCIPAL ACCOUNTANT FEES AND SERVICES |
(a), (b), (c), (d) The following table presents aggregate fees billed in each of the last two fiscal years for services rendered to the Registrant by the Registrant’s principal accountant. These fees were billed to the registrant and were approved by the Registrant’s audit committee.
| | | | | | | | |
| | | Fiscal
year ended
March 31, 2016 | | | Fiscal
year ended
March 31, 2015 | |
Audit fees | | $ | 267,703 | | | $ | 262,390 | |
Audit-related fees | | | — | | | | 15,000 | |
Tax fees (1) | | | 38,125 | | | | 27,090 | |
All other fees | | | — | | | | — | |
| | | | | | | | |
| | $ | 305,828 | | | $ | 304,480 | |
| | | | | | | | |
| (1) | Tax fees consist of fees for tax compliance, tax advice, tax planning and excise tax. |
(e) The Chairman of the Audit Committees is authorized to pre-approve: (1) audit services for the mutual funds of Wells Fargo Funds Trust; (2) non-audit tax or compliance consulting or training services provided to the Funds by the independent auditors (“Auditors”) if the fees for any particular engagement are not anticipated to exceed $50,000; and (3) non-audit tax or compliance consulting or training services provided by the Auditors to a Fund’s investment adviser and its controlling entities (where pre-approval is required because the engagement relates directly to the operations and financial reporting of the Fund) if the fee to the Auditors for any particular engagement is not anticipated to exceed $50,000. For any such pre-approval sought from the Chairman, Management shall prepare a brief description of the proposed services. If the Chairman approves of such service, he or she shall sign the statement prepared by Management. Such written statement shall be presented to the full Committees at their next regularly scheduled meetings.
(f) Not applicable
(g) Not applicable
(h) Not applicable
| ITEM 5. | AUDIT COMMITTEE OF LISTED REGISTRANTS |
Not applicable.
A Portfolio of Investments for each series of Wells Fargo Funds Trust is included as part of the report to shareholders filed under Item 1 of this Form.
| ITEM 7. | DISCLOSURE OF PROXY VOTING POLICIES AND PROCEDURES FOR CLOSED-END MANAGEMENT INVESTMENT COMPANIES |
Not applicable.
| ITEM 8. | PORTFOLIO MANAGERS OF CLOSED-END MANAGEMENT INVESTMENT COMPANIES |
Not applicable.
| ITEM 9. | PURCHASES OF EQUITY SECURITIES BY CLOSED-END MANAGEMENT INVESTMENT COMPANY AND AFFILIATED PURCHASERS |
Not applicable.
| ITEM 10. | SUBMISSION OF MATTERS TO A VOTE OF SECURITY HOLDERS |
There have been no material changes to the procedures by which shareholders may recommend nominees to the registrant’s Board of Trustees that have been implemented since the registrant’s last provided disclosure in response to the requirements of this Item.
| ITEM 11. | CONTROLS AND PROCEDURES |
(a) The President and Treasurer have concluded that the Wells Fargo Funds Trust (the “Trust”) disclosure controls and procedures (as defined in Rule 30a-3(c) under the Investment Company Act of 1940) provide reasonable assurances that material information relating to the Trust is made known to them by the appropriate persons based on their evaluation of these controls and procedures as of a date within 90 days of the filing of this report.
(b) There were no significant changes in the Trust’s internal controls over financial reporting (as defined in Rule 30a-3(d) under the Investment Company Act of 1940) that occurred during the second fiscal quarter of the period covered by this report that materially affected, or is reasonably likely to materially affect, the registrant’s internal control over financial reporting.
(a)(1) Code of Ethics pursuant to Item 2 of Form N-CSR is filed and attached hereto as Exhibit COE.
(a)(2) Certification pursuant to Rule 30a-2(a) under the Investment Company Act of 1940 (17 CFR 270.30a-2(a)) is filed and attached hereto as Exhibit 99.CERT.
(a)(3) Not applicable.
(b) Certification pursuant to Rule 30a-2(b) under the Investment Company Act of 1940 (17 CFR 270.30a-2(b)) is filed and attached hereto as Exhibit 99.906CERT.
SIGNATURES
Pursuant to the requirements of the Securities Exchange Act of 1934 and the Investment Company Act of 1940, the registrant has duly caused this report to be signed on its behalf by the undersigned, thereunto duly authorized.
| | |
| Wells Fargo Funds Trust |
| |
| By: | | |
| |
| | /s/ Karla M. Rabusch |
| |
| | Karla M. Rabusch |
| | President |
| |
| Date: | | May 25, 2016 |
Pursuant to the requirements of the Securities Exchange Act of 1934 and the Investment Company Act of 1940, this report has been signed below by the following persons on behalf of the registrant and in the capacities and on the date indicated.
| | |
| Wells Fargo Funds Trust |
| |
| By: | | |
| |
| | /s/ Karla M. Rabusch |
| |
| | Karla M. Rabusch |
| | President |
| |
| Date: | | May 25, 2016 |
| |
| By: | | |
| |
| | /s/ Nancy Wiser |
| |
| | Nancy Wiser |
| | Treasurer |
| |
| Date: | | May 25, 2016 |