
UNITED STATES
SECURITIES AND EXCHANGE COMMISSION
Washington, D.C. 20549
FORM N-CSR
CERTIFIED SHAREHOLDER REPORT OF REGISTERED
MANAGEMENT INVESTMENT COMPANIES
Investment Company Act file number: 811-09253
Wells Fargo Funds Trust
(Exact name of registrant as specified in charter)
525 Market St., San Francisco, CA 94105
(Address of principal executive offices) (Zip code)
C. David Messman
Wells Fargo Funds Management, LLC
525 Market St., San Francisco, CA 94105
(Name and address of agent for service)
Registrant’s telephone number, including area code: 800-222-8222
Date of fiscal year end: July 31
Registrant is making a filing for 10 of its series:
Wells Fargo Capital Growth Fund, Wells Fargo Disciplined U.S. Core Fund, Wells Fargo Endeavor Select Fund, Wells Fargo Growth Fund, Wells Fargo Intrinsic Value Fund, Wells Fargo Large Cap Core Fund, Wells Fargo Large Cap Growth Fund, Wells Fargo Large Company Value Fund, Wells Fargo Omega Growth Fund, and Wells Fargo Premier Large Company Growth Fund.
Date of reporting period: July 31, 2016
ITEM 1. REPORT TO STOCKHOLDERS
Annual Report
July 31, 2016

Wells Fargo Capital Growth Fund


Reduce clutter. Save trees.
Sign up for electronic delivery of prospectuses and shareholder reports at wellsfargo.com/advantagedelivery
Contents
The views expressed and any forward-looking statements are as of July 31, 2016, unless otherwise noted, and are those of the Fund managers and/or Wells Fargo Funds Management, LLC. Discussions of individual securities, or the markets generally, or any Wells Fargo Fund are not intended as individual recommendations. Future events or results may vary significantly from those expressed in any forward-looking statements. The views expressed are subject to change at any time in response to changing circumstances in the market. Wells Fargo Funds Management, LLC and the Fund disclaim any obligation to publicly update or revise any views expressed or forward-looking statements.
NOT FDIC INSURED ¡ NO BANK GUARANTEE ¡ MAY LOSE VALUE
| | | | |
| 2 | | Wells Fargo Capital Growth Fund | | Letter to shareholders (unaudited) |

Karla M. Rabusch
President
Wells Fargo Funds
Despite significant market fluctuations over the course of the year, U.S. stocks delivered positive results overall for the 12-month reporting period
Dear Valued Shareholder:
We are pleased to offer you this annual report for the Wells Fargo Capital Growth Fund for the 12-month period that ended July 31, 2016. During this period, which began August 1, 2015, U.S. and international stock markets experienced heightened volatility, with intermittent rebounds interspersed with sell-offs. The U.S. economy displayed resilience throughout the period, although growth was somewhat sluggish amid ongoing pressures that included slowing growth in China, a strengthening U.S. dollar, and uncertainty regarding interest-rate increases by the U.S. Federal Reserve (Fed); international economies faced deeper ongoing challenges. During June 2016, global markets became especially volatile as the U.K.’s vote over whether to leave the European Union (E.U.) approached. However, markets began recovering shortly after the U.K. voted to leave and rallied through July. Despite significant market fluctuations over the course of the year, U.S. stocks delivered positive results overall for the 12-month reporting period, as measured by the Russell 1000® Index.1 International markets generally declined as measured by the Morgan Stanley Capital International (MSCI) Europe, Australasia, Far East (EAFE) Index.2
In the third quarter of 2015, China’s slowdown took a toll on economies and markets worldwide.
U.S. stocks sagged during the quarter, experiencing the most volatility since 2011. Economic data released during the quarter suggested the U.S. economy remained solid but had lost some steam, burdened by the drag of the U.S. dollar’s strength coupled with global economic turmoil. The fact that the Fed left the federal funds interest rate unchanged at its September 2015 meeting surprised investors and fueled increased uncertainty about the U.S. economy’s stamina to remain healthy while facing the challenges of slowing growth in China and troubles elsewhere in the world. Outside the U.S., markets were even more volatile and delivered generally weaker quarterly results, also largely due to investors’ increasing anxiety over China’s weakened economy.
Despite ongoing concerns, U.S. stocks generally rose in the fourth quarter of 2015; international markets lagged.
While the broad U.S. stock market bounced back in the quarter, stock markets outside the U.S. failed to keep pace as economic concerns, including China’s ongoing slowdown, continued to affect many countries. U.S. economic data released during the quarter indicated the economy remained solid, although the strong U.S. dollar and weakness in international economies remained headwinds. In December, the Fed, as expected, raised its target interest rate by 25 basis points (bps; 100 bps equals 1.00%) after keeping it near zero for seven years. The move reflected confidence in the U.S. economy’s ability to stay healthy with less central-bank support. The Fed also clarified that future interest-rate increases would be gradual.
| 1 | The Russell 1000® Index measures the performance of the 1,000 largest companies in the Russell 3000® Index, which represents approximately 92% of the total market capitalization of the Russell 3000® Index. You cannot invest directly in an index. |
| 2 | Morgan Stanley Capital International (MSCI) Europe, Australasia, Far East (EAFE) Index is a free-float-adjusted market-capitalization-weighted index that is designed to measure the equity market performance of developed markets, excluding the United States and Canada. The MSCI EAFE Index consists of the following 21 developed markets country indexes: Australia, Austria, Belgium, Denmark, Finland, France, Germany, Hong Kong, Ireland, Israel, Italy, Japan, the Netherlands, New Zealand, Norway, Portugal, Singapore, Spain, Sweden, Switzerland, and the United Kingdom. You cannot invest directly in an index. |
| | | | | | |
| Letter to shareholders (unaudited) | | Wells Fargo Capital Growth Fund | | | 3 | |
In the first quarter of 2016, market volatility increased globally amid ongoing concerns.
Stock markets worldwide fluctuated widely in the first quarter of 2016. Most sold off sharply in the first six weeks of the year on concerns such as weak global growth, falling commodity prices, and uncertainty over the timing and impact of the Fed’s interest-rate increases. As the quarter progressed, fears abated somewhat and global markets generally rallied back. The U.S. economy ended the quarter on a positive note as much of the quarter’s data reflected resiliency. With ongoing uncertainties about global growth and financial markets, however, the Fed held off from raising the target interest rate during the quarter. Outside the U.S., the eurozone fell into deflation in February; in response, the European Central Bank announced an expansion of its stimulus program. In China, the government in March set a growth rate of 6.5% to 7.0% for 2016, an acknowledgment of weakening growth. In emerging markets, although central-bank stimulus and improved prices for oil and other commodities led to stock-market rallies in the quarter, many of these countries’ economies face credit downgrades due to challenges such as the likelihood of a stronger U.S. dollar, which would make dollar-denominated debt more expensive.
Worries over interest rates and the U.K.’s vote largely drove the markets during the second quarter of 2016.
U.S. stocks began the quarter in positive territory but started to lose steam in early May on worries that a possible June interest-rate increase by the Fed could hurt the market. In mid-May, stocks briefly plunged following comments by Fed officials noting that a June interest-rate increase remained on the table. But once investors had processed this information, stocks again rallied, finishing up for the month. The first three weeks of June brought heightened volatility, spurred largely by a disappointing jobs report and uncertainty over whether the U.K. would remain in the E.U. The U.K.’s Brexit vote on June 23 shocked countries in Europe and much of the rest of the world. Stock markets plummeted as investors worried that the U.K.’s departure from the E.U. would slow global growth and prolong the low-interest-rate environment. Following the initial rout, however, U.S. stocks rallied as investors seemed to decide that any negative effects would be more localized and not create a serious risk for global growth. By quarter-end, the broad U.S. stock market had moved back into positive territory.
Stocks generally posted positive results for July 2016.
U.S. stocks displayed the most momentum during the first two weeks of the month, buoyed partly by an unexpectedly favorable June jobs report that helped strengthen confidence in the U.S. economy. Also, investors perhaps felt that global central banks could extend stimulus measures in the wake of the Brexit vote. Although U.S. market momentum slowed during the second half of July, stocks ended in positive territory for the month. International stocks delivered positive monthly results as well.
| | | | |
| 4 | | Wells Fargo Capital Growth Fund | | Letter to shareholders (unaudited) |
Don’t let short-term uncertainty derail long-term investment goals.
Periods of uncertainty can present challenges, but experience has taught us that maintaining long-term investment goals can be an effective way to plan for the future. To help you create a sound strategy based on your personal goals and risk tolerance, Wells Fargo Funds offers more than 100 mutual funds spanning a wide range of asset classes and investment styles. Although diversification cannot guarantee an investment profit or prevent losses, we believe it can be an effective way to manage investment risk and potentially smooth out overall portfolio performance. We encourage investors to know their investments and to understand that appropriate levels of risk-taking may unlock opportunities.
Thank you for choosing to invest in Wells Fargo Funds. We appreciate your confidence in us and remain committed to helping you meet your financial needs.
Sincerely,

Karla M. Rabusch
President
Wells Fargo Funds
Although diversification cannot guarantee an investment profit or prevent losses, we believe it can be an effective way to manage investment risk and potentially smooth out overall portfolio performance.
For further information about your Fund, contact your investment professional, visit our website at wellsfargofunds.com, or call us directly at 1-800-222-8222. We are available 24 hours a day, 7 days a week.
This page is intentionally left blank.
| | | | |
| 6 | | Wells Fargo Capital Growth Fund | | Performance highlights (unaudited) |
Investment objective
The Fund seeks long-term capital appreciation.
Manager
Wells Fargo Funds Management, LLC
Subadviser
Wells Capital Management Incorporated
Portfolio managers
Michael T. Smith, CFA®
Chris Warner, CFA®
Average annual total returns (%) as of July 31, 20161
| | | | | | | | | | | | | | | | | | | | | | | | | | | | | | | | | | |
| | | | | Including sales charge | | | Excluding sales charge | | | Expense ratios2 (%) | |
| | | Inception date | | 1 year | | | 5 year | | | 10 year | | | 1 year | | | 5 year | | | 10 year | | | Gross | | | Net3 | |
| Class A (WFCGX) | | 7-31-2007 | | | (5.04 | ) | | | 9.34 | | | | 6.01 | | | | 0.75 | | | | 10.64 | | | | 6.64 | | | | 1.22 | | | | 1.11 | |
| Class C (WFCCX) | | 7-31-2007 | | | (1.00 | ) | | | 9.81 | | | | 5.87 | | | | 0.00 | | | | 9.81 | | | | 5.87 | | | | 1.97 | | | | 1.86 | |
| Class R4 (WCGRX) | | 11-30-2012 | | | – | | | | – | | | | – | | | | 1.03 | | | | 11.03 | | | | 7.10 | | | | 0.94 | | | | 0.75 | |
| Class R6 (WFCRX) | | 11-30-2012 | | | – | | | | – | | | | – | | | | 1.20 | | | | 11.17 | | | | 7.17 | | | | 0.79 | | | | 0.60 | |
| Administrator Class (WFCDX) | | 6-30-2003 | | | – | | | | – | | | | – | | | | 0.88 | | | | 10.86 | | | | 6.91 | | | | 1.14 | | | | 0.94 | |
| Institutional Class (WWCIX) | | 4-8-2005 | | | – | | | | – | | | | – | | | | 1.09 | | | | 11.14 | | | | 7.16 | | | | 0.89 | | | | 0.70 | |
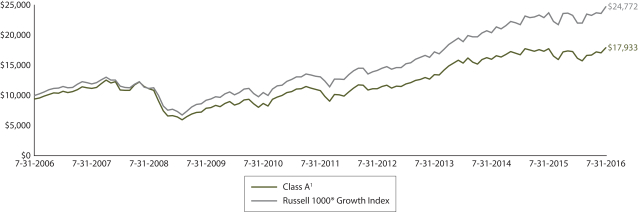
| Russell 1000® Growth Index4 | | – | | | – | | | | – | | | | – | | | | 4.35 | | | | 13.62 | | | | 9.50 | | | | – | | | | – | |
Figures quoted represent past performance, which is no guarantee of future results, and do not reflect taxes that a shareholder may pay on fund distributions or the redemption of fund shares. Investment return and principal value of an investment will fluctuate so that an investor’s shares, when redeemed, may be worth more or less than their original cost. Performance shown without sales charges would be lower if sales charges were reflected. Current performance may be lower or higher than the performance data quoted, which assumes the reinvestment of dividends and capital gains. Current month-end performance is available on the Fund’s website, wellsfargofunds.com.
Index returns do not include transaction costs associated with buying and selling securities, any mutual fund fees or expenses, or any taxes. It is not possible to invest directly in an index.
For Class A shares, the maximum front-end sales charge is 5.75%. For Class C shares, the maximum contingent deferred sales charge is 1.00%. Performance including a contingent deferred sales charge assumes the sales charge for the corresponding time period. Class R4, Class R6, Administrator Class, and Institutional Class shares are sold without a front-end sales charge or contingent deferred sales charge.
Stock values fluctuate in response to the activities of individual companies and general market and economic conditions. Certain investment strategies tend to increase the total risk of an investment (relative to the broader market). The Fund is exposed to foreign investment risk. Consult the Fund’s prospectus for additional information on these and other risks.
Please see footnotes on page 7.
| | | | | | |
| Performance highlights (unaudited) | | Wells Fargo Capital Growth Fund | | | 7 | |
|
| Growth of $10,000 investment as of July 31, 20165 |
|
 |
| 1 | Historical performance shown for Class A shares prior to their inception reflects the performance of the former Investor Class shares, and includes the higher expenses applicable to the former Investor Class shares. If these expenses had not been included, returns would be higher. Historical performance shown for Class C shares prior to their inception reflects the performance of the former Investor Class shares, adjusted to reflect the higher expenses applicable to Class C shares. Historical performance shown for Class R4 shares prior to their inception reflects the performance of Institutional Class shares, adjusted to reflect the higher expenses applicable to Class R4 shares. Historical performance shown for Class R6 shares prior to their inception reflects the performance of Institutional Class shares, and includes the higher expenses applicable to Institutional Class shares. If these expenses had not been included, returns would be higher. |
| 2 | Reflects the expense ratios as stated in the most recent prospectuses. The expense ratios shown are subject to change and may differ from the annualized expense ratios shown in the financial highlights of this report. |
| 3 | The manager has contractually committed through November 30, 2016, to waive fees and/or reimburse expenses to the extent necessary to cap the Fund’s Total Annual Fund Operating Expenses After Fee Waiver at the amounts shown. After this time, the cap may be increased or the commitment to maintain the cap may be terminated only with the approval of the Board of Trustees. Brokerage commissions, stamp duty fees, interest, taxes, acquired fund fees and expenses, and extraordinary expenses are excluded from the cap. Without this cap, the Fund’s returns would have been lower. |
| 4 | The Russell 1000® Growth Index measures the performance of those Russell 1000 companies with higher price-to-book ratios and higher forecasted growth values. You cannot invest directly in an index. |
| 5 | The chart compares the performance of Class A shares for the most recent ten years with the Russell 1000® Growth Index. The chart assumes a hypothetical investment of $10,000 in Class A shares and reflects all operating expenses and assumes the maximum initial sales charge of 5.75%. |
| 6 | The ten largest holdings, excluding cash and cash equivalents, are calculated based on the value of the investments divided by total net assets of the Fund. Holdings are subject to change and may have changed since the date specified. |
| 7 | Amounts are calculated based on the total long-term investments of the Fund. These amounts are subject to change and may have changed since the date specified. |
| | | | |
| 8 | | Wells Fargo Capital Growth Fund | | Performance highlights (unaudited) |
MANAGER’S DISCUSSION
Fund highlights
| n | | The Fund underperformed its benchmark, the Russell 1000® Growth Index, for the 12-month period that ended July 31, 2016. |
| n | | Stock selection in the information technology (IT) and telecommunication services sectors detracted from performance. |
| n | | Stock selection within the health care and consumer discretionary sectors benefited performance. |
Over the 12-month period, an elevated level of uncertainty was visible in the U.S. stock market as global economic data and geopolitical events led many investors to reexamine their tolerance for risk; as a result, U.S. stocks at times traded more on emotion and fear than on company-specific fundamentals. In this environment, investors generally tended to prefer yield and defensive stocks, often referred to as bond proxies. These market dynamics were more pronounced in international markets, where economic activity generally was more tepid and geopolitical events caused greater uncertainty.
| | | | |
| Ten largest holdings (%) as of July 31, 20166 | |
Alphabet Incorporated Class A | | | 6.27 | |
Amazon.com Incorporated | | | 4.83 | |
Facebook Incorporated Class A | | | 4.50 | |
Apple Incorporated | | | 4.05 | |
Visa Incorporated Class A | | | 3.66 | |
The Home Depot Incorporated | | | 3.62 | |
UnitedHealth Group Incorporated | | | 3.14 | |
Bristol-Myers Squibb Company | | | 2.89 | |
Constellation Brands Incorporated Class A | | | 2.59 | |
Starbucks Corporation | | | 2.50 | |
The Fund’s IT and telecommunication services holdings weighed on performance relative to the Russell 1000® Growth Index.
Within the IT sector, stock selection within the semiconductor and semiconductor-equipment industry detracted from returns. Also, a combination of company-specific issues and concerns over corporate IT spending pressured Fund holdings in the software industry. Tableau Software, Incorporated, which develops data-visualization software, reported disappointing results driven by an unexpected decline in licensing revenue. As a result, Tableau’s shares declined sharply. After reevaluating our investment thesis, we exited the position in favor of other opportunities in which we had
higher conviction. Enterprise-security company Palo Alto Networks, Incorporated, also detracted from performance. While network security remains a priority for businesses, companies in this industry, including Palo Alto, have fallen victim to difficult earnings comparisons following the elevated level of growth they experienced in the wake of several high-profile cyberattacks. While Palo Alto reported better-than-expected revenue growth during the period, the company stated that earnings growth likely will decelerate in the near term because macroeconomic challenges have become more pronounced. We sold the Fund’s position in Palo Alto during the period given that the company had approached our valuation target, its fundamentals were likely to decelerate, and we saw few near-term catalysts.
Within the telecommunication services sector, the Fund’s position in SBA Communications Corporation, a cell-tower operator in the U.S. and abroad, detracted from performance. SBA’s growth rate declined due to weaker-than-expected capital spending by large wireless carriers and concerns about the company’s use of debt in a volatile credit market. Given the change in SBA’s fundamentals, we exited the Fund’s position in the stock.
Please see footnotes on page 7.
| | | | | | |
| Performance highlights (unaudited) | | Wells Fargo Capital Growth Fund | | | 9 | |
|
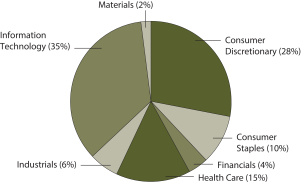
| Sector distribution as of July 31, 20167 |
|
 |
Stock selection in the health care sector aided Fund performance.
Innovative medical-equipment companies delivered favorable results. The Fund’s position in Edwards Lifesciences Corporation, which focuses on technologies to treat heart disease and is a leader in the market for transcatheter heart valves (THV), reported strong results driven by a significant increase in its THV sales. THV, a $3 billion market, is likely to grow as THV is a minimally invasive and effective approach for replacing heart valves. UnitedHealth Group Incorporated, the largest managed-care company, also contributed to performance, delivering earnings that beat expectations. Much of UnitedHealth’s revenue growth has been driven
by its Optum division, which handles pharmacy benefits and health services and enjoys a leadership position in the important field of health care data analytics. Optum helped drive the strong quarterly results by posting a sharp gain in revenue. The managed-care industry has been in flux as several of UnitedHealth’s competitors have been dealing with issues around proposed mergers. UnitedHealth has remained focused on its core business and avoided merger distractions, enabling the company to build market share in a competitive industry.
Recent market dynamics support our confidence in the Fund’s positioning.
The world presently faces a range of complex and substantial issues. As a result, investors often become preoccupied with worries about the global economic and geopolitical outlooks. Because we share many of these concerns, we have taken a cautious approach within the Fund. We have intentionally shifted toward higher-quality companies with stable cash flows; this positioning reflects the impact that macro factors could have on individual holdings. We acknowledge the importance of risk management in an era of uncertainty.
That being said, however, our process will remain focused on the micro. While valuations of the Fund’s holdings can fluctuate, the fundamentals of these companies, in our view, are underpinned by innovation and strong managements as well as by potentially profitable business models and durable growth. We believe these businesses may be relatively immune to economic uncertainty and therefore could be able to command a scarcity premium. These companies also tend to have visible, durable earnings growth, which indicates their stock prices ultimately could follow the same trajectory. We have been encouraged by recent market activity, which has shown signs of this condition playing out.
Scarcity is a key dimension in our view of the investing landscape. We believe the root cause of many of the world’s problems is a lack of healthy economic growth; however, the scarcity premium for secular earnings growth has yet to meaningfully unfold. We believe this time lag creates an attractive opportunity, as many of the Fund’s positions have underperformed relative to their actual earnings-growth rates; if investors are like thirsty desert travelers, the Fund’s fundamentally strong holdings could be viewed as an oasis on the horizon.
We believe the U.S. economy is on stable footing with attractive growth relative to much of the world. However, we remain mindful of the duration of economic cycles and the ongoing challenge for the U.S. economy to find a higher altitude. Therefore, we maintain a healthy allocation to high-quality core holdings and remain underweight stocks with high economic sensitivity. While consumer spending has not been overly robust, strength has continued in areas such as value retailing, ecommerce, leisure, and housing. These consumer themes, along with innovation in high-growth IT and health care, are well represented in the Fund.
Government spending appears poised to expand in areas such as infrastructure and defense. Although corporations remain cautious on capital spending, the severe headwinds of a strong U.S. dollar and low oil prices appear to be easing and could provide for better-than-expected earnings growth. Overall, we believe the U.S. stock market likely will be supported by a slowly improving economy, giving growth stocks a potential opportunity to stand out from the crowd.
Please see footnotes on page 7.
| | | | |
| 10 | | Wells Fargo Capital Growth Fund | | Fund expenses (unaudited) |
As a shareholder of the Fund, you incur two types of costs: (1) transaction costs, including sales charges (loads) on purchase payments and contingent deferred sales charges (if any) on redemptions and (2) ongoing costs, including management fees, distribution (12b-1) and/or shareholder servicing fees, and other Fund expenses. This example is intended to help you understand your ongoing costs (in dollars) of investing in the Fund and to compare these costs with the ongoing costs of investing in other mutual funds.
The example is based on an investment of $1,000 invested at the beginning of the six-month period and held for the entire period from February 1, 2016 to July 31, 2016.
Actual expenses
The “Actual” line of the table below provides information about actual account values and actual expenses. You may use the information in this line, together with the amount you invested, to estimate the expenses that you paid over the period. Simply divide your account value by $1,000 (for example, an $8,600 account value divided by $1,000 = 8.6), then multiply the result by the number in the “Actual” line under the heading entitled “Expenses paid during period” for your applicable class of shares to estimate the expenses you paid on your account during this period.
Hypothetical example for comparison purposes
The “Hypothetical” line of the table below provides information about hypothetical account values and hypothetical expenses based on the Fund’s actual expense ratio and an assumed rate of return of 5% per year before expenses, which is not the Fund’s actual return. The hypothetical account values and expenses may not be used to estimate the actual ending account balance or expenses you paid for the period. You may use this information to compare the ongoing costs of investing in the Fund and other funds. To do so, compare this 5% hypothetical example with the 5% hypothetical examples that appear in the shareholder reports of the other funds.
Please note that the expenses shown in the table are meant to highlight your ongoing costs only and do not reflect any transactional costs, such as sales charges (loads) and contingent deferred sales charges. Therefore, the “Hypothetical” line of the table is useful in comparing ongoing costs only and will not help you determine the relative total costs of owning different funds. In addition, if these transactional costs were included, your costs would have been higher.
| | | | | | | | | | | | | | | | |
| | | Beginning
account value
2-1-2016 | | | Ending
account value
7-31-2016 | | | Expenses
paid during
the period¹ | | | Annualized net
expense ratio | |
Class A | | | | | | | | | | | | | | | | |
Actual | | $ | 1,000.00 | | | $ | 1,107.69 | | | $ | 5.37 | | | | 1.02 | % |
Hypothetical (5% return before expenses) | | $ | 1,000.00 | | | $ | 1,019.77 | | | $ | 5.14 | | | | 1.02 | % |
Class C | | | | | | | | | | | | | | | | |
Actual | | $ | 1,000.00 | | | $ | 1,103.50 | | | $ | 9.18 | | | | 1.75 | % |
Hypothetical (5% return before expenses) | | $ | 1,000.00 | | | $ | 1,016.14 | | | $ | 8.79 | | | | 1.75 | % |
Class R4 | | | | | | | | | | | | | | | | |
Actual | | $ | 1,000.00 | | | $ | 1,108.22 | | | $ | 3.93 | | | | 0.75 | % |
Hypothetical (5% return before expenses) | | $ | 1,000.00 | | | $ | 1,021.13 | | | $ | 3.77 | | | | 0.75 | % |
Class R6 | | | | | | | | | | | | | | | | |
Actual | | $ | 1,000.00 | | | $ | 1,108.90 | | | $ | 3.15 | | | | 0.60 | % |
Hypothetical (5% return before expenses) | | $ | 1,000.00 | | | $ | 1,021.88 | | | $ | 3.02 | | | | 0.60 | % |
Administrator Class | | | | | | | | | | | | | | | | |
Actual | | $ | 1,000.00 | | | $ | 1,108.07 | | | $ | 4.93 | | | | 0.94 | % |
Hypothetical (5% return before expenses) | | $ | 1,000.00 | | | $ | 1,020.19 | | | $ | 4.72 | | | | 0.94 | % |
Institutional Class | | | | | | | | | | | | | | | | |
Actual | | $ | 1,000.00 | | | $ | 1,109.26 | | | $ | 3.67 | | | | 0.70 | % |
Hypothetical (5% return before expenses) | | $ | 1,000.00 | | | $ | 1,021.38 | | | $ | 3.52 | | | | 0.70 | % |
| 1 | Expenses paid is equal to the annualized net expense ratio of each class multiplied by the average account value over the period, multiplied by the number of days in the most recent fiscal half-year divided by the number of days in the fiscal year (to reflect the one-half-year period). |
| | | | | | |
| Portfolio of investments—July 31, 2016 | | Wells Fargo Capital Growth Fund | | | 11 | |
| | | | | | | | | | | | | | | | |
| Security name | | | | | | | | Shares | | | Value | |
| | | | |
Common Stocks: 99.75% | | | | | | | | | | | | | | | | |
| | | | |
Consumer Discretionary: 27.58% | | | | | | | | | | | | | | | | |
| | | | |
| Hotels, Restaurants & Leisure: 8.92% | | | | | | | | | | | | | | | | |
Aramark | | | | | | | | | | | 79,000 | | | $ | 2,832,146 | |
McDonald’s Corporation | | | | | | | | | | | 48,250 | | | | 5,676,613 | |
Starbucks Corporation | | | | | | | | | | | 119,241 | | | | 6,921,940 | |
Wynn Resorts Limited « | | | | | | | | | | | 32,350 | | | | 3,168,683 | |
Yum! Brands Incorporated | | | | | | | | | | | 67,800 | | | | 6,062,676 | |
| |
| | | | 24,662,058 | |
| | | | | |
| | | | |
| Internet & Catalog Retail: 4.83% | | | | | | | | | | | | | | | | |
Amazon.com Incorporated † | | | | | | | | | | | 17,605 | | | | 13,358,850 | |
| | | | | |
| | | | |
| Media: 1.67% | | | | | | | | | | | | | | | | |
Charter Communications Incorporated Class A † | | | | | | | | | | | 19,600 | | | | 4,603,452 | |
| | | | | |
| | | | |
| Multiline Retail: 1.79% | | | | | | | | | | | | | | | | |
Dollar General Corporation | | | | | | | | | | | 52,200 | | | | 4,945,428 | |
| | | | | |
| | | | |
| Specialty Retail: 9.08% | | | | | | | | | | | | | | | | |
O’Reilly Automotive Incorporated † | | | | | | | | | | | 17,300 | | | | 5,027,899 | |
The Home Depot Incorporated | | | | | | | | | | | 72,333 | | | | 9,999,314 | |
The TJX Companies Incorporated | | | | | | | | | | | 74,910 | | | | 6,121,645 | |
ULTA Salon, Cosmetics & Fragrance Incorporated † | | | | | | | | | | | 15,150 | | | | 3,957,332 | |
| |
| | | | 25,106,190 | |
| | | | | |
| | | | |
| Textiles, Apparel & Luxury Goods: 1.29% | | | | | | | | | | | | | | | | |
Coach Incorporated | | | | | | | | | | | 82,500 | | | | 3,556,575 | |
| | | | | |
| | | | |
Consumer Staples: 10.21% | | | | | | | | | | | | | | | | |
| | | | |
| Beverages: 6.91% | | | | | | | | | | | | | | | | |
Constellation Brands Incorporated Class A | | | | | | | | | | | 43,484 | | | | 7,158,771 | |
Dr Pepper Snapple Group Incorporated | | | | | | | | | | | 56,800 | | | | 5,595,368 | |
Monster Beverage Corporation † | | | | | | | | | | | 39,450 | | | | 6,336,854 | |
| |
| | | | 19,090,993 | |
| | | | | |
| | | | |
| Household Products: 0.93% | | | | | | | | | | | | | | | | |
The Procter & Gamble Company | | | | | | | | | | | 30,100 | | | | 2,576,259 | |
| | | | | |
| | | | |
| Tobacco: 2.37% | | | | | | | | | | | | | | | | |
Reynolds American Incorporated | | | | | | | | | | | 130,750 | | | | 6,545,345 | |
| | | | | |
| | | | |
Financials: 3.53% | | | | | | | | | | | | | | | | |
| | | | |
| Diversified Financial Services: 3.53% | | | | | | | | | | | | | | | | |
Intercontinental Exchange Incorporated | | | | | | | | | | | 19,395 | | | | 5,124,159 | |
S&P Global Incorporated | | | | | | | | | | | 37,913 | | | | 4,632,969 | |
| |
| | | | 9,757,128 | |
| | | | | |
The accompanying notes are an integral part of these financial statements.
| | | | |
| 12 | | Wells Fargo Capital Growth Fund | | Portfolio of investments—July 31, 2016 |
| | | | | | | | | | | | | | | | |
| Security name | | | | | | | | Shares | | | Value | |
| | | | |
Health Care: 15.34% | | | | | | | | | | | | | | | | |
| | | | |
| Biotechnology: 2.52% | | | | | | | | | | | | | | | | |
Alexion Pharmaceuticals Incorporated † | | | | | | | | | | | 13,750 | | | $ | 1,768,250 | |
Biogen Incorporated † | | | | | | | | | | | 10,500 | | | | 3,044,265 | |
Celgene Corporation † | | | | | | | | | | | 19,300 | | | | 2,165,267 | |
| |
| | | | 6,977,782 | |
| | | | | |
| | | | |
| Health Care Equipment & Supplies: 4.44% | | | | | | | | | | | | | | | | |
Baxter International Incorporated | | | | | | | | | | | 84,450 | | | | 4,055,289 | |
Boston Scientific Corporation † | | | | | | | | | | | 141,650 | | | | 3,439,262 | |
Intuitive Surgical Incorporated † | | | | | | | | | | | 6,850 | | | | 4,765,956 | |
| | | | |
| | | | | | | | | | | | | | | 12,260,507 | |
| | | | | |
| | | | |
| Health Care Providers & Services: 3.14% | | | | | | | | | | | | | | | | |
UnitedHealth Group Incorporated | | | | | | | | | | | 60,600 | | | | 8,677,920 | |
| | | | | |
| | | | |
| Pharmaceuticals: 5.24% | | | | | | | | | | | | | | | | |
Bristol-Myers Squibb Company | | | | | | | | | | | 106,688 | | | | 7,981,329 | |
Eli Lilly & Company | | | | | | | | | | | 26,250 | | | | 2,175,863 | |
Novo Nordisk A/S ADR | | | | | | | | | | | 75,850 | | | | 4,321,175 | |
| | | | |
| | | | | | | | | | | | | | | 14,478,367 | |
| | | | | |
| | | | |
Industrials: 6.17% | | | | | | | | | | | | | | | | |
| | | | |
| Airlines: 1.02% | | | | | | | | | | | | | | | | |
Delta Air Lines Incorporated | | | | | | | | | | | 72,975 | | | | 2,827,781 | |
| | | | | |
| | | | |
| Electrical Equipment: 1.30% | | | | | | | | | | | | | | | | |
Acuity Brands Incorporated | | | | | | | | | | | 13,650 | | | | 3,582,170 | |
| | | | | |
| | | | |
| Professional Services: 1.15% | | | | | | | | | | | | | | | | |
Verisk Analytics Incorporated † | | | | | | | | | | | 37,200 | | | | 3,172,416 | |
| | | | | |
| | | | |
| Road & Rail: 2.70% | | | | | | | | | | | | | | | | |
J.B. Hunt Transport Services Incorporated | | | | | | | | | | | 32,800 | | | | 2,726,664 | |
Kansas City Southern | | | | | | | | | | | 49,350 | | | | 4,743,029 | |
| | | | |
| | | | | | | | | | | | | | | 7,469,693 | |
| | | | | |
| | | | |
Information Technology: 34.77% | | | | | | | | | | | | | | | | |
| | | | |
| Communications Equipment: 1.83% | | | | | | | | | | | | | | | | |
Harris Corporation | | | | | | | | | | | 58,450 | | | | 5,062,939 | |
| | | | | |
| | | | |
| Internet Software & Services: 12.48% | | | | | | | | | | | | | | | | |
Alphabet Incorporated Class A † | | | | | | | | | | | 21,908 | | | | 17,336,677 | |
Facebook Incorporated Class A † | | | | | | | | | | | 100,274 | | | | 12,427,960 | |
Tencent Holdings Limited ADR | | | | | | | | | | | 195,900 | | | | 4,740,780 | |
| | | | |
| | | | | | | | | | | | | | | 34,505,417 | |
| | | | | |
| | | | |
| IT Services: 7.83% | | | | | | | | | | | | | | | | |
Fidelity National Information Services Incorporated | | | | | | | | | | | 81,300 | | | | 6,465,789 | |
PayPal Holdings Incorporated † | | | | | | | | | | | 136,200 | | | | 5,072,088 | |
The accompanying notes are an integral part of these financial statements.
| | | | | | |
| Portfolio of investments—July 31, 2016 | | Wells Fargo Capital Growth Fund | | | 13 | |
| | | | | | | | | | | | | | | | |
| Security name | | | | | | | | Shares | | | Value | |
| | | | |
| IT Services (continued) | | | | | | | | | | | | | | | | |
Visa Incorporated Class A | | | | | | | | | | | 129,583 | | | $ | 10,113,953 | |
| | | | |
| | | | | | | | | | | | | | | 21,651,830 | |
| | | | | |
| | | | |
| Semiconductors & Semiconductor Equipment: 1.62% | | | | | | | | | | | | | | | | |
Broadcom Limited | | | | | | | | | | | 27,600 | | | | 4,470,648 | |
| | | | | |
| | | | |
| Software: 6.96% | | | | | | | | | | | | | | | | |
Adobe Systems Incorporated † | | | | | | | | | | | 54,050 | | | | 5,289,333 | |
Electronic Arts Incorporated † | | | | | | | | | | | 62,200 | | | | 4,747,104 | |
Salesforce.com Incorporated † | | | | | | | | | | | 56,630 | | | | 4,632,334 | |
ServiceNow Incorporated † | | | | | | | | | | | 60,780 | | | | 4,553,638 | |
| | | | |
| | | | | | | | | | | | | | | 19,222,409 | |
| | | | | |
| | | | |
| Technology Hardware, Storage & Peripherals: 4.05% | | | | | | | | | | | | | | | | |
Apple Incorporated | | | | | | | | | | | 107,326 | | | | 11,184,442 | |
| | | | | |
| | | | |
Materials: 2.15% | | | | | | | | | | | | | | | | |
| | | | |
| Chemicals: 2.15% | | | | | | | | | | | | | | | | |
The Sherwin-Williams Company | | | | | | | | | | | 19,850 | | | | 5,949,641 | |
| | | | | |
| | | | |
Total Common Stocks (Cost $204,082,906) | | | | | | | | | | | | | | | 275,696,240 | |
| | | | | |
| | | | |
| | | Yield | | | | | | | | | | |
| Short-Term Investments: 3.31% | | | | | | | | | | | | | | | | |
| | | | |
| Investment Companies: 3.31% | | | | | | | | | | | | | | | | |
Securities Lending Cash Investments LLC (l)(r)(u) | | | 0.50 | % | | | | | | | 2,439,600 | | | | 2,439,600 | |
Wells Fargo Government Money Market Fund Select Class (l)(u) | | | 0.32 | | | | | | | | 6,708,393 | | | | 6,708,393 | |
| | | | |
Total Short-Term Investments (Cost $9,147,993) | | | | | | | | | | | | | | | 9,147,993 | |
| | | | | | | | | | | | | | | | |
| | | | | | | | |
| Total investments in securities (Cost $213,230,899) * | | | 103.06 | % | | | 284,844,233 | |
Other assets and liabilities, net | | | (3.06 | ) | | | (8,449,782 | ) |
| | | | | | | | |
| Total net assets | | | 100.00 | % | | $ | 276,394,451 | |
| | | | | | | | |
| « | All or a portion of this security is on loan. |
| † | Non-income-earning security |
| (l) | The issuer of the security is an affiliated person of the Fund as defined in the Investment Company Act of 1940. |
| (r) | The investment is a non-registered investment vehicle purchased with cash collateral received from securities on loan. |
| (u) | The rate represents the 7-day annualized yield at period end. |
| * | Cost for federal income tax purposes is $213,936,225 and unrealized gains (losses) consists of: |
| | | | |
Gross unrealized gains | | $ | 72,420,249 | |
Gross unrealized losses | | | (1,512,241 | ) |
| | | | |
Net unrealized gains | | $ | 70,908,008 | |
The accompanying notes are an integral part of these financial statements.
| | | | |
| 14 | | Wells Fargo Capital Growth Fund | | Statement of assets and liabilities—July 31, 2016 |
| | | | |
| | |
| |
Assets | | | | |
Investments | | | | |
In unaffiliated securities (including $2,233,260 of securities loaned), at value (cost $204,082,906) | | $ | 275,696,240 | |
In affiliated securities, at value (cost $9,147,993) | | | 9,147,993 | |
| | | | |
Total investments, at value (cost $213,230,899) | | | 284,844,233 | |
Receivable for Fund shares sold | | | 148,539 | |
Receivable for dividends | | | 96,835 | |
Receivable for securities lending income | | | 1,034 | |
Prepaid expenses and other assets | | | 43,866 | |
| | | | |
Total assets | | | 285,134,507 | |
| | | | |
| |
Liabilities | | | | |
Payable for investments purchased | | | 5,959,071 | |
Payable for Fund shares redeemed | | | 102,153 | |
Payable upon receipt of securities loaned | | | 2,439,600 | |
Management fee payable | | | 120,700 | |
Distribution fee payable | | | 2,133 | |
Administration fees payable | | | 23,658 | |
Accrued expenses and other liabilities | | | 92,741 | |
| | | | |
Total liabilities | | | 8,740,056 | |
| | | | |
Total net assets | | $ | 276,394,451 | |
| | | | |
| |
NET ASSETS CONSIST OF | | | | |
Paid-in capital | | $ | 206,913,226 | |
Accumulated net realized losses on investments | | | (2,132,109 | ) |
Net unrealized gains on investments | | | 71,613,334 | |
| | | | |
Total net assets | | $ | 276,394,451 | |
| | | | |
| |
COMPUTATION OF NET ASSET VALUE AND OFFERING PRICE PER SHARE | | | | |
Net assets – Class A | | $ | 77,648,467 | |
Shares outstanding – Class A1 | | | 5,136,651 | |
Net asset value per share – Class A | | | $15.12 | |
Maximum offering price per share – Class A2 | | | $16.04 | |
Net assets – Class C | | $ | 3,415,181 | |
Shares outstanding – Class C1 | | | 252,254 | |
Net asset value per share – Class C | | | $13.54 | |
Net assets – Class R4 | | $ | 15,723 | |
Share outstanding – Class R41 | | | 948 | |
Net asset value per share – Class R4 | | | $16.59 | |
Net assets – Class R6 | | $ | 140,581,115 | |
Shares outstanding – Class R61 | | | 8,416,156 | |
Net asset value per share – Class R6 | | | $16.70 | |
Net assets – Administrator Class | | $ | 31,063,665 | |
Shares outstanding – Administrator Class1 | | | 1,917,879 | |
Net asset value per share – Administrator Class | | | $16.20 | |
Net assets – Institutional Class | | $ | 23,670,300 | |
Shares outstanding – Institutional Class1 | | | 1,421,568 | |
Net asset value per share – Institutional Class | | | $16.65 | |
| 1 | The Fund has an unlimited number of authorized shares. |
| 2 | Maximum offering price is computed as 100/94.25 of net asset value. On investments of $50,000 or more, the offering price is reduced. |
The accompanying notes are an integral part of these financial statements.
| | | | | | |
| Statement of operations—year ended July 31, 2016 | | Wells Fargo Capital Growth Fund | | | 15 | |
| | | | |
| | |
| |
Investment income | | | | |
Dividends (net of foreign withholding taxes of $10,409) | | $ | 2,325,682 | |
Securities lending income, net | | | 22,146 | |
Income from affiliated securities | | | 12,094 | |
| | | | |
Total investment income | | | 2,359,922 | |
| | | | |
| |
Expenses | | | | |
Management fee | | | 1,984,076 | |
Administration fees | | | | |
Class A | | | 140,288 | |
Class C | | | 7,550 | |
Class R4 | | | 11 | |
Class R6 | | | 42,565 | |
Administrator Class | | | 39,813 | |
Institutional Class | | | 29,974 | |
Investor Class | | | 55,871 | 1 |
Shareholder servicing fees | | | | |
Class A | | | 166,659 | |
Class C | | | 8,987 | |
Class R4 | | | 15 | |
Administrator Class | | | 76,563 | |
Investor Class | | | 43,445 | 1 |
Distribution fee | | | | |
Class C | | | 26,962 | |
Custody and accounting fees | | | 25,646 | |
Professional fees | | | 42,968 | |
Registration fees | | | 98,235 | |
Shareholder report expenses | | | 27,963 | |
Trustees’ fees and expenses | | | 23,176 | |
Other fees and expenses | | | 19,340 | |
| | | | |
Total expenses | | | 2,860,107 | |
Less: Fee waivers and/or expense reimbursements | | | (589,695 | ) |
| | | | |
Net expenses | | | 2,270,412 | |
| | | | |
Net investment income | | | 89,510 | |
| | | | |
| |
REALIZED AND UNREALIZED GAINS (LOSSES) ON INVESTMENTS | | | | |
Net realized losses on investments | | | (424,974 | ) |
Net change in unrealized gains (losses) on investments | | | 701,484 | |
| | | | |
Net realized and unrealized gains (losses) on investments | | | 276,510 | |
| | | | |
Net increase in net assets resulting from operations | | $ | 366,020 | |
| | | | |
| 1 | For the period from August 1, 2015 to October 23, 2015. Effective at the close of business on October 23, 2015, Investor Class shares were converted to Class A shares and are no longer offered by the Fund. |
The accompanying notes are an integral part of these financial statements.
| | | | |
| 16 | | Wells Fargo Capital Growth Fund | | Statement of changes in net assets |
| | | | | | | | | | | | | | | | |
| | | Year ended
July 31, 2016 | | | Year ended
July 31, 2015 | |
| | | |
Operations | | | | | | | | | | | | |
Net investment income (loss) | | | | | | $ | 89,510 | | | | | | | $ | (385,156 | ) |
Net realized gains (losses) on investments | | | | | | | (424,974 | ) | | | | | | | 55,955,753 | |
Net change in unrealized gains (losses) on investments | | | | | | | 701,484 | | | | | | | | (17,785,562 | ) |
| | | | |
Net increase in net assets resulting from operations | | | | | | | 366,020 | | | | | | | | 37,785,035 | |
| | | | |
| | | |
Distributions to shareholders from | | | | | | | | | | | | |
Net realized gains | | | | | | | | | | | | | | | | |
Class A | | | | | | | (12,289,754 | ) | | | | | | | (4,805,732 | ) |
Class C | | | | | | | (556,329 | ) | | | | | | | (1,397,806 | ) |
Class R4 | | | | | | | (1,876 | ) | | | | | | | (3,693 | ) |
Class R6 | | | | | | | (18,521,143 | ) | | | | | | | (36,912,629 | ) |
Administrator Class | | | | | | | (4,001,022 | ) | | | | | | | (9,378,628 | ) |
Institutional Class | | | | | | | (3,150,712 | ) | | | | | | | (12,743,781 | ) |
Investor Class | | | | | | | 0 | 1 | | | | | | | (24,364,369 | ) |
| | | | |
Total distributions to shareholders | | | | | | | (38,520,836 | ) | | | | | | | (89,606,638 | ) |
| | | | |
| | | | |
Capital share transactions | | | Shares | | | | | | | | Shares | | | | | |
Proceeds from shares sold | | | | | | | | | | | | | | | | |
Class A | | | 4,787,904 | | | | 79,683,106 | | | | 91,633 | | | | 1,687,079 | |
Class C | | | 37,860 | | | | 527,959 | | | | 74,996 | | | | 1,252,857 | |
Class R6 | | | 958,376 | | | | 15,871,334 | | | | 698,773 | | | | 13,635,803 | |
Administrator Class | | | 179,863 | | | | 2,841,546 | | | | 196,115 | | | | 3,846,348 | |
Institutional Class | | | 571,120 | | | | 9,788,878 | | | | 569,045 | | | | 11,364,181 | |
Investor Class | | | 45,169 | 1 | | | 724,606 | 1 | | | 429,740 | | | | 7,934,159 | |
| | | | |
| | | | | | | 109,437,429 | | | | | | | | 39,720,427 | |
| | | | |
Reinvestment of distributions | | | | | | | | | | | | | | | | |
Class A | | | 842,773 | | | | 12,076,915 | | | | 283,053 | | | | 4,667,546 | |
Class C | | | 37,294 | | | | 480,716 | | | | 78,077 | | | | 1,185,209 | |
Class R4 | | | 120 | | | | 1,876 | | | | 208 | | | | 3,693 | |
Class R6 | | | 1,172,966 | | | | 18,521,143 | | | | 2,067,934 | | | | 36,912,629 | |
Administrator Class | | | 259,809 | | | | 3,985,470 | | | | 533,599 | | | | 9,316,635 | |
Institutional Class | | | 188,296 | | | | 2,965,655 | | | | 349,997 | | | | 6,236,949 | |
Investor Class | | | 0 | 1 | | | 0 | 1 | | | 1,450,130 | | | | 23,680,615 | |
| | | | |
| | | | | | | 38,031,775 | | | | | | | | 82,003,276 | |
| | | | |
Payment for shares redeemed | | | | | | | | | | | | | | | | |
Class A | | | (1,479,556 | ) | | | (21,274,728 | ) | | | (259,975 | ) | | | (4,889,075 | ) |
Class C | | | (87,529 | ) | | | (1,218,466 | ) | | | (118,419 | ) | | | (1,921,172 | ) |
Class R6 | | | (1,823,127 | ) | | | (29,216,949 | ) | | | (985,710 | ) | | | (19,513,578 | ) |
Administrator Class | | | (415,047 | ) | | | (6,710,672 | ) | | | (1,888,744 | ) | | | (41,533,388 | ) |
Institutional Class | | | (536,405 | ) | | | (8,726,371 | ) | | | (1,930,743 | ) | | | (37,357,917 | ) |
Investor Class | | | (4,836,074 | )1 | | | (80,008,660 | )1 | | | (1,294,319 | ) | | | (23,062,370 | ) |
| | | | |
| | | | | | | (147,155,846 | ) | | | | | | | (128,277,500 | ) |
| | | | |
Net increase (decrease) in net assets resulting from capital share transactions | | | | | | | 313,358 | | | | | | | | (6,553,797 | ) |
| | | | |
Total decrease in net assets | | | | | | | (37,841,458 | ) | | | | | | | (58,375,400 | ) |
| | | | |
| | |
Net assets | | | | | | | | |
Beginning of period | | | | | | | 314,235,909 | | | | | | | | 372,611,309 | |
| | | | |
End of period | | | | | | $ | 276,394,451 | | | | | | | $ | 314,235,909 | |
| | | | |
Undistributed (accumulated) net investment income (loss) | | | | | | $ | 0 | | | | | | | $ | (359,429 | ) |
| | | | |
| 1 | For the period from August 1, 2015 to October 23, 2015. Effective at the close of business on October 23, 2015, Investor Class shares were converted to Class A shares and are no longer offered by the Fund. |
The accompanying notes are an integral part of these financial statements.
| | | | | | |
| Financial highlights | | Wells Fargo Capital Growth Fund | | | 17 | |
(For a share outstanding throughout each period)
| | | | | | | | | | | | | | | | | | | | |
| | | Year ended July 31 | |
| CLASS A | | 2016 | | | 2015 | | | 2014 | | | 2013 | | | 2012 | |
Net asset value, beginning of period | | | $17.38 | | | | $21.31 | | | | $19.87 | | | | $16.74 | | | | $16.25 | |
Net investment income (loss) | | | (0.03 | )1 | | | (0.07 | )1 | | | (0.10 | )1 | | | 0.00 | 1,2 | | | (0.05 | )1 |
Net realized and unrealized gains (losses) on investments | | | 0.04 | | | | 2.09 | | | | 3.79 | | | | 3.43 | | | | 0.54 | |
| | | | | | | | | | | | | | | | | | | | |
Total from investment operations | | | 0.01 | | | | 2.02 | | | | 3.69 | | | | 3.43 | | | | 0.49 | |
Distributions to shareholders from | | | | | | | | | | | | | | | | | | | | |
Net investment income | | | 0.00 | | | | 0.00 | | | | (0.02 | ) | | | 0.00 | | | | 0.00 | |
Net realized gains | | | (2.27 | ) | | | (5.95 | ) | | | (2.23 | ) | | | (0.30 | ) | | | 0.00 | |
| | | | | | | | | | | | | | | | | | | | |
Total distributions to shareholders | | | (2.27 | ) | | | (5.95 | ) | | | (2.25 | ) | | | (0.30 | ) | | | 0.00 | |
Net asset value, end of period | | | $15.12 | | | | $17.38 | | | | $21.31 | | | | $19.87 | | | | $16.74 | |
Total return3 | | | 0.75 | % | | | 11.00 | % | | | 19.09 | % | | | 20.85 | % | | | 3.02 | % |
Ratios to average net assets (annualized) | | | | | | | | | | | | | | | | | | | | |
Gross expenses | | | 1.24 | % | | | 1.27 | % | | | 1.26 | % | | | 1.26 | % | | | 1.21 | % |
Net expenses | | | 1.06 | % | | | 1.11 | % | | | 1.11 | % | | | 1.14 | % | | | 1.20 | % |
Net investment income (loss) | | | (0.18 | )% | | | (0.39 | )% | | | (0.46 | )% | | | 0.01 | % | | | (0.30 | )% |
Supplemental data | | | | | | | | | | | | | | | | | | | | |
Portfolio turnover rate | | | 85 | % | | | 114 | % | | | 94 | % | | | 107 | % | | | 116 | % |
Net assets, end of period (000s omitted) | | | $77,648 | | | | $17,126 | | | | $18,561 | | | | $16,390 | | | | $17,784 | |
| 1 | Calculated based upon average shares outstanding |
| 2 | Amount is less than $0.005. |
| 3 | Total return calculations do not include any sales charges. |
The accompanying notes are an integral part of these financial statements.
| | | | |
| 18 | | Wells Fargo Capital Growth Fund | | Financial highlights |
(For a share outstanding throughout each period)
| | | | | | | | | | | | | | | | | | | | |
| | | Year ended July 31 | |
| CLASS C | | 2016 | | | 2015 | | | 2014 | | | 2013 | | | 2012 | |
Net asset value, beginning of period | | | $15.92 | | | | $20.12 | | | | $18.98 | | | | $16.12 | | | | $15.77 | |
Net investment loss | | | (0.13 | )1 | | | (0.20 | )1 | | | (0.24 | )1 | | | (0.13 | )1 | | | (0.16 | )1 |
Net realized and unrealized gains (losses) on investments | | | 0.02 | | | | 1.95 | | | | 3.61 | | | | 3.29 | | | | 0.51 | |
| | | | | | | | | | | | | | | | | | | | |
Total from investment operations | | | (0.11 | ) | | | 1.75 | | | | 3.37 | | | | 3.16 | | | | 0.35 | |
Distributions to shareholders from | | | | | | | | | | | | | | | | | | | | |
Net realized gains | | | (2.27 | ) | | | (5.95 | ) | | | (2.23 | ) | | | (0.30 | ) | | | 0.00 | |
Net asset value, end of period | | | $13.54 | | | | $15.92 | | | | $20.12 | | | | $18.98 | | | | $16.12 | |
Total return2 | | | 0.00 | % | | | 10.15 | % | | | 18.21 | % | | | 19.97 | % | | | 2.22 | % |
Ratios to average net assets (annualized) | | | | | | | | | | | | | | | | | | | | |
Gross expenses | | | 1.99 | % | | | 2.02 | % | | | 2.01 | % | | | 2.01 | % | | | 1.96 | % |
Net expenses | | | 1.81 | % | | | 1.86 | % | | | 1.86 | % | | | 1.89 | % | | | 1.95 | % |
Net investment loss | | | (0.98 | )% | | | (1.14 | )% | | | (1.20 | )% | | | (0.73 | )% | | | (1.05 | )% |
Supplemental data | | | | | | | | | | | | | | | | | | | | |
Portfolio turnover rate | | | 85 | % | | | 114 | % | | | 94 | % | | | 107 | % | | | 116 | % |
Net assets, end of period (000s omitted) | | | $3,415 | | | | $4,212 | | | | $4,628 | | | | $4,503 | | | | $6,042 | |
| 1 | Calculated based upon average shares outstanding |
| 2 | Total return calculations do not include any sales charges. |
The accompanying notes are an integral part of these financial statements.
| | | | | | |
| Financial highlights | | Wells Fargo Capital Growth Fund | | | 19 | |
(For a share outstanding throughout each period)
| | | | | | | | | | | | | | | | |
| | | Year ended July 31 | |
| CLASS R4 | | 2016 | | | 2015 | | | 2014 | | | 20131 | |
Net asset value, beginning of period | | | $18.79 | | | | $22.52 | | | | $20.83 | | | | $18.22 | |
Net investment income (loss) | | | 0.01 | 2 | | | (0.01 | )2 | | | (0.02 | ) | | | 0.05 | |
Net realized and unrealized gains (losses) on investments | | | 0.06 | | | | 2.23 | | | | 3.99 | | | | 2.95 | |
| | | | | | | | | | | | | | | | |
Total from investment operations | | | 0.07 | | | | 2.22 | | | | 3.97 | | | | 3.00 | |
Distributions to shareholders from | | | | | | | | | | | | | | | | |
Net investment income | | | 0.00 | | | | 0.00 | | | | (0.05 | ) | | | (0.09 | ) |
Net realized gains | | | (2.27 | ) | | | (5.95 | ) | | | (2.23 | ) | | | (0.30 | ) |
| | | | | | | | | | | | | | | | |
Total distributions to shareholders | | | (2.27 | ) | | | (5.95 | ) | | | (2.28 | ) | | | (0.39 | ) |
Net asset value, end of period | | | $16.59 | | | | $18.79 | | | | $22.52 | | | | $20.83 | |
Total return3 | | | 1.03 | % | | | 11.35 | % | | | 19.56 | % | | | 16.86 | % |
Ratios to average net assets (annualized) | | | | | | | | | | | | | | | | |
Gross expenses | | | 0.93 | % | | | 0.91 | % | | | 0.91 | % | | | 0.90 | % |
Net expenses | | | 0.75 | % | | | 0.75 | % | | | 0.75 | % | | | 0.75 | % |
Net investment income (loss) | | | 0.08 | % | | | (0.04 | )% | | | (0.10 | )% | | | 0.37 | % |
Supplemental data | | | | | | | | | | | | | | | | |
Portfolio turnover rate | | | 85 | % | | | 114 | % | | | 94 | % | | | 107 | % |
Net assets, end of period (000s omitted) | | | $16 | | | | $16 | | | | $14 | | | | $12 | |
| 1 | For the period from November 30, 2012 (commencement of class operations) to July 31, 2013 |
| 2 | Calculated based upon average shares outstanding |
| 3 | Returns for periods of less than one year are not annualized. |
The accompanying notes are an integral part of these financial statements.
| | | | |
| 20 | | Wells Fargo Capital Growth Fund | | Financial highlights |
(For a share outstanding throughout each period)
| | | | | | | | | | | | | | | | |
| | | Year ended July 31 | |
| CLASS R6 | | 2016 | | | 2015 | | | 2014 | | | 20131 | |
Net asset value, beginning of period | | | $18.87 | | | | $22.56 | | | | $20.85 | | | | $18.22 | |
Net investment income | | | 0.04 | 2 | | | 0.02 | | | | 0.00 | 2,3 | | | 0.07 | |
Net realized and unrealized gains (losses) on investments | | | 0.06 | | | | 2.24 | | | | 4.00 | | | | 2.95 | |
| | | | | | | | | | | | | | | | |
Total from investment operations | | | 0.10 | | | | 2.26 | | | | 4.00 | | | | 3.02 | |
Distributions to shareholders from | | | | | | | | | | | | | | | | |
Net investment income | | | 0.00 | | | | 0.00 | | | | (0.06 | ) | | | (0.09 | ) |
Net realized gains | | | (2.27 | ) | | | (5.95 | ) | | | (2.23 | ) | | | (0.30 | ) |
| | | | | | | | | | | | | | | | |
Total distributions to shareholders | | | (2.27 | ) | | | (5.95 | ) | | | (2.29 | ) | | | (0.39 | ) |
Net asset value, end of period | | | $16.70 | | | | $18.87 | | | | $22.56 | | | | $20.85 | |
Total return4 | | | 1.20 | % | | | 11.54 | % | | | 19.71 | % | | | 16.99 | % |
Ratios to average net assets (annualized) | | | | | | | | | | | | | | | | |
Gross expenses | | | 0.81 | % | | | 0.79 | % | | | 0.78 | % | | | 0.79 | % |
Net expenses | | | 0.60 | % | | | 0.60 | % | | | 0.60 | % | | | 0.60 | % |
Net investment income | | | 0.23 | % | | | 0.11 | % | | | 0.01 | % | | | 0.52 | % |
Supplemental data | | | | | | | | | | | | | | | | |
Portfolio turnover rate | | | 85 | % | | | 114 | % | | | 94 | % | | | 107 | % |
Net assets, end of period (000s omitted) | | | $140,581 | | | | $153,009 | | | | $142,754 | | | | $58 | |
| 1 | For the period from November 30, 2012 (commencement of class operations) to July 31, 2013 |
| 2 | Calculated based upon average shares outstanding |
| 3 | Amount is less than $0.005 per share. |
| 4 | Returns for periods of less than one year are not annualized. |
The accompanying notes are an integral part of these financial statements.
| | | | | | |
| Financial highlights | | Wells Fargo Capital Growth Fund | | | 21 | |
(For a share outstanding throughout each period)
| | | | | | | | | | | | | | | | | | | | |
| | | Year ended July 31 | |
| ADMINISTRATOR CLASS | | 2016 | | | 2015 | | | 2014 | | | 2013 | | | 2012 | |
Net asset value, beginning of period | | | $18.43 | | | | $22.22 | | | | $20.61 | | | | $17.32 | | | | $16.77 | |
Net investment income (loss) | | | (0.01 | )1 | | | (0.03 | )1 | | | (0.05 | )1 | | | 0.04 | 1 | | | (0.00 | )1,2 |
Net realized and unrealized gains (losses) on investments | | | 0.05 | | | | 2.19 | | | | 3.93 | | | | 3.55 | | | | 0.55 | |
| | | | | | | | | | | | | | | | | | | | |
Total from investment operations | | | 0.04 | | | | 2.16 | | | | 3.88 | | | | 3.59 | | | | 0.55 | |
Distributions to shareholders from | | | | | | | | | | | | | | | | | | | | |
Net investment income | | | 0.00 | | �� | | 0.00 | | | | (0.04 | ) | | | 0.00 | | | | 0.00 | |
Net realized gains | | | (2.27 | ) | | | (5.95 | ) | | | (2.23 | ) | | | (0.30 | ) | | | 0.00 | |
| | | | | | | | | | | | | | | | | | | | |
Total distributions to shareholders | | | (2.27 | ) | | | (5.95 | ) | | | (2.27 | ) | | | (0.30 | ) | | | 0.00 | |
Net asset value, end of period | | | $16.20 | | | | $18.43 | | | | $22.22 | | | | $20.61 | | | | $17.32 | |
Total return | | | 0.88 | % | | | 11.22 | % | | | 19.35 | % | | | 21.15 | % | | | 3.22 | % |
Ratios to average net assets (annualized) | | | | | | | | | | | | | | | | | | | | |
Gross expenses | | | 1.16 | % | | | 1.11 | % | | | 1.09 | % | | | 1.09 | % | | | 1.05 | % |
Net expenses | | | 0.93 | % | | | 0.90 | % | | | 0.90 | % | | | 0.91 | % | | | 0.94 | % |
Net investment income (loss) | | | (0.09 | )% | | | (0.16 | )% | | | (0.24 | )% | | | 0.24 | % | | | (0.01 | )% |
Supplemental data | | | | | | | | | | | | | | | | | | | | |
Portfolio turnover rate | | | 85 | % | | | 114 | % | | | 94 | % | | | 107 | % | | | 116 | % |
Net assets, end of period (000s omitted) | | | $31,064 | | | | $34,886 | | | | $67,830 | | | | $63,786 | | | | $74,529 | |
| 1 | Calculated based upon average shares outstanding |
| 2 | Amount is less than $0.005. |
The accompanying notes are an integral part of these financial statements.
| | | | |
| 22 | | Wells Fargo Capital Growth Fund | | Financial highlights |
(For a share outstanding throughout each period)
| | | | | | | | | | | | | | | | | | | | |
| | | Year ended July 31 | |
| INSTITUTIONAL CLASS | | 2016 | | | 2015 | | | 2014 | | | 2013 | | | 2012 | |
Net asset value, beginning of period | | | $18.84 | | | | $22.54 | | | | $20.84 | | | | $17.56 | | | | $16.96 | |
Net investment income | | | 0.03 | 1 | | | 0.02 | 1 | | | 0.01 | 1 | | | 0.09 | 1 | | | 0.03 | 1 |
Net realized and unrealized gains (losses) on investments | | | 0.05 | | | | 2.23 | | | | 4.00 | | | | 3.58 | | | | 0.57 | |
| | | | | | | | | | | | | | | | | | | | |
Total from investment operations | | | 0.08 | | | | 2.25 | | | | 4.01 | | | | 3.67 | | | | 0.60 | |
Distributions to shareholders from | | | | | | | | | | | | | | | | | | | | |
Net investment income | | | 0.00 | | | | 0.00 | | | | (0.08 | ) | | | (0.09 | ) | | | 0.00 | |
Net realized gains | | | (2.27 | ) | | | (5.95 | ) | | | (2.23 | ) | | | (0.30 | ) | | | 0.00 | |
| | | | | | | | | | | | | | | | | | | | |
Total distributions to shareholders | | | (2.27 | ) | | | (5.95 | ) | | | (2.31 | ) | | | (0.39 | ) | | | 0.00 | |
Net asset value, end of period | | | $16.65 | | | | $18.84 | | | | $22.54 | | | | $20.84 | | | | $17.56 | |
Total return | | | 1.09 | % | | | 11.50 | % | | | 19.76 | % | | | 21.42 | % | | | 3.48 | % |
Ratios to average net assets (annualized) | | | | | | | | | | | | | | | | | | | | |
Gross expenses | | | 0.91 | % | | | 0.84 | % | | | 0.82 | % | | | 0.82 | % | | | 0.78 | % |
Net expenses | | | 0.68 | % | | | 0.65 | % | | | 0.65 | % | | | 0.67 | % | | | 0.70 | % |
Net investment income | | | 0.16 | % | | | 0.09 | % | | | 0.05 | % | | | 0.46 | % | | | 0.21 | % |
Supplemental data | | | | | | | | | | | | | | | | | | | | |
Portfolio turnover rate | | | 85 | % | | | 114 | % | | | 94 | % | | | 107 | % | | | 116 | % |
Net assets, end of period (000s omitted) | | | $23,670 | | | | $22,578 | | | | $49,816 | | | | $331,310 | | | | $543,933 | |
| 1 | Calculated based upon average shares outstanding |
The accompanying notes are an integral part of these financial statements.
| | | | | | |
| Notes to financial statements | | Wells Fargo Capital Growth Fund | | | 23 | |
1. ORGANIZATION
Wells Fargo Funds Trust (the “Trust”), a Delaware statutory trust organized on March 10, 1999, is an open-end management investment company registered under the Investment Company Act of 1940, as amended (the “1940 Act”). As an investment company, the Trust follows the accounting and reporting guidance in Financial Accounting Standards Board (“FASB”) Accounting Standards Codification Topic 946, Financial Services – Investment Companies. These financial statements report on the Wells Fargo Capital Growth Fund (the “Fund”) which is a diversified series of the Trust.
Effective at the close of business on October 23, 2015, Investor Class shares became Class A shares in a tax-free conversion. Shareholders of Investor Class received Class A shares at a value equal to the value of their Investor Class shares immediately prior to the conversion. Investor Class shares are no longer offered by the Fund.
2. SIGNIFICANT ACCOUNTING POLICIES
The following significant accounting policies, which are consistently followed in the preparation of the financial statements of the Fund, are in conformity with U.S. generally accepted accounting principles which require management to make estimates and assumptions that affect the reported amounts of assets and liabilities, disclosure of contingent assets and liabilities at the date of the financial statements, and the reported amounts of revenues and expenses during the reporting period. Actual results could differ from those estimates.
Securities valuation
All investments are valued each business day as of the close of regular trading on the New York Stock Exchange (generally 4 p.m. Eastern Time), although the Fund may deviate from this calculation time under unusual or unexpected circumstances.
Equity securities that are listed on a foreign or domestic exchange or market are valued at the official closing price or, if none, the last sales price. If no sale occurs on the principal exchange or market that day, the prior day’s price will be deemed “stale” and a fair value price will be determined in accordance with the Fund’s Valuation Procedures.
Investments in registered open-end investment companies are valued at net asset value. Interests in non-registered investment vehicles that are redeemable at net asset value are fair valued normally at net asset value.
Investments which are not valued using any of the methods discussed above are valued at their fair value, as determined in good faith by the Board of Trustees of the Fund. The Board of Trustees has established a Valuation Committee comprised of the Trustees and has delegated to it the authority to take any actions regarding the valuation of portfolio securities that the Valuation Committee deems necessary or appropriate, including determining the fair value of portfolio securities, unless the determination has been delegated to the Management Valuation Team of Wells Fargo Funds Management, LLC (“Funds Management”). The Board of Trustees retains the authority to make or ratify any valuation decisions or approve any changes to the Valuation Procedures as it deems appropriate. On a quarterly basis, the Board of Trustees receives reports on any valuation actions taken by the Valuation Committee or the Management Valuation Team which may include items for ratification.
Valuations of fair valued securities are compared to the next actual sales price when available, or other appropriate market values, to assess the continued appropriateness of the fair valuation methodologies used. These securities are fair valued on a day-to-day basis, taking into consideration changes to appropriate market information and any significant changes to the inputs considered in the valuation process until there is a readily available price provided on an exchange or by an independent pricing service. Valuations received from an independent pricing service or independent broker-dealer quotes are periodically validated by comparisons to most recent trades and valuations provided by other independent pricing services in addition to the review of prices by the manager and/or subadviser. Unobservable inputs used in determining fair valuations are identified based on the type of security, taking into consideration factors utilized by market participants in valuing the investment, knowledge about the issuer and the current market environment.
Security loans
The Fund may lend its securities from time to time in order to earn additional income in the form of fees or interest on securities received as collateral or the investment of any cash received as collateral. The Fund continues to receive interest or dividends on the securities loaned. The Fund receives collateral in the form of cash or securities with a value at least equal to the value of the securities on loan. The value of the loaned securities is determined at the close of each business day and any additional required collateral is delivered to the Fund on the next business day. In a securities lending transaction, the net asset value of the Fund will be affected by an increase or decrease in the value of the securities loaned and by an increase or decrease in the value of the instrument in which collateral is invested. The amount of securities lending activity undertaken by the Fund fluctuates from time to time. In the event of default or bankruptcy
| | | | |
| 24 | | Wells Fargo Capital Growth Fund | | Notes to financial statements |
by the borrower, the Fund may be prevented from recovering the loaned securities or gaining access to the collateral or may experience delays or costs in doing so. In addition, the investment of any cash collateral received may lose all or part of its value. The Fund has the right under the lending agreement to recover the securities from the borrower on demand.
The Fund lends its securities through an unaffiliated securities lending agent. Cash collateral received in connection with its securities lending transactions is invested in Securities Lending Cash Investments, LLC (the “Securities Lending Fund”). The Securities Lending Fund is exempt from registration under Section 3(c)(7) of the 1940 Act and is managed by Funds Management and is subadvised by Wells Capital Management Incorporated (“WellsCap”), an affiliate of Funds Management and an indirect wholly owned subsidiary of Wells Fargo & Company (“Wells Fargo”). Funds Management receives an advisory fee starting at 0.05% and declining to 0.01% as the average daily net assets of the Securities Lending Fund increase. All of the fees received by Funds Management are paid to WellsCap for its services as subadviser. The Securities Lending Fund seeks to provide a positive return compared to the daily Fed Funds Open rate by investing in high-quality, U.S. dollar-denominated short-term money market instruments. Securities Lending Fund investments are fair valued based upon the amortized cost valuation technique.
Security transactions and income recognition
Securities transactions are recorded on a trade date basis. Realized gains or losses are recorded on the basis of identified cost.
Dividend income is recognized on the ex-dividend date. Dividend income is recorded net of foreign taxes withheld where recovery of such taxes is not assured.
Distributions to shareholders
Distributions to shareholders from net investment income and net realized gains, if any, are recorded on the ex-dividend date. Such distributions are determined in conformity with federal income tax regulations, which may differ in amount or character from net investment income and realized gains recognized for purposes of U.S. generally accepted accounting principles.
Federal and other taxes
The Fund intends to continue to qualify as a regulated investment company by distributing substantially all of its investment company taxable income and any net realized capital gains (after reduction for capital loss carryforwards) sufficient to relieve it from all, or substantially all, federal income taxes. Accordingly, no provision for federal income taxes was required.
The Fund’s income and federal excise tax returns and all financial records supporting those returns for the prior three fiscal years are subject to examination by the federal and Delaware revenue authorities. Management has analyzed the Fund’s tax positions taken on federal, state, and foreign tax returns for all open tax years and does not believe that there are any uncertain tax positions that require recognition of a tax liability.
Reclassifications are made to the Fund’s capital accounts for permanent tax differences to reflect income and gains available for distribution (or available capital loss carryforwards) under federal income tax regulations. U.S. generally accepted accounting principles require that certain components of net assets be adjusted to reflect permanent differences between financial and tax reporting. These reclassifications have no effect on net assets or net asset values per share. The primary permanent difference causing such reclassification is due to net operating losses. At July 31, 2016, as a result of permanent book-to-tax differences, the following reclassification adjustments were made on the Statement of Assets and Liabilities:
| | | | |
| Paid-in capital | | Overdistributed net investment income | | Accumulated net realized losses on investments |
| $(269,903) | | $269,919 | | $(16) |
As of July 31, 2016, the Fund had current year deferred post-October capital losses consisting of $1,426,783 in short-term losses which will be recognized on the first day of the following fiscal year.
Class allocations
The separate classes of shares offered by the Fund differ principally in applicable sales charges, distribution, shareholder servicing, and administration fees. Class specific expenses are charged directly to that share class. Investment income, common expenses, and realized and unrealized gains (losses) on investments are allocated daily to each class of shares based on the relative proportion of net assets of each class.
| | | | | | |
| Notes to financial statements | | Wells Fargo Capital Growth Fund | | | 25 | |
3. FAIR VALUATION MEASUREMENTS
Fair value measurements of investments are determined within a framework that has established a fair value hierarchy based upon the various data inputs utilized in determining the value of the Fund’s investments. The three-level hierarchy gives the highest priority to unadjusted quoted prices in active markets for identical assets or liabilities (Level 1) and the lowest priority to significant unobservable inputs (Level 3). The Fund’s investments are classified within the fair value hierarchy based on the lowest level of input that is significant to the fair value measurement. The inputs are summarized into three broad levels as follows:
| n | | Level 1 – quoted prices in active markets for identical securities |
| n | | Level 2 – other significant observable inputs (including quoted prices for similar securities, interest rates, prepayment speeds, credit risk, use of amortized cost, etc.) |
| n | | Level 3 – significant unobservable inputs (including the Fund’s own assumptions in determining the fair value of investments) |
The inputs or methodologies used for valuing investments in securities are not necessarily an indication of the risk associated with investing in those securities.
The following is a summary of the inputs used in valuing the Fund’s assets and liabilities as of July 31, 2016:
| | | | | | | | | | | | | | | | |
| | | Quoted prices (Level 1) | | | Other significant observable inputs (Level 2) | | | Significant unobservable inputs (Level 3) | | | Total | |
Assets | | | | | | | | | | | | | | | | |
Investments in: | | | | | | | | | | | | | | | | |
| | | | |
Common stocks | | | | | | | | | | | | | | | | |
Consumer discretionary | | $ | 76,232,553 | | | $ | 0 | | | $ | 0 | | | $ | 76,232,553 | |
Consumer staples | | | 28,212,597 | | | | 0 | | | | 0 | | | | 28,212,597 | |
Financials | | | 9,757,128 | | | | 0 | | | | 0 | | | | 9,757,128 | |
Health care | | | 42,394,576 | | | | 0 | | | | 0 | | | | 42,394,576 | |
Industrials | | | 17,052,060 | | | | 0 | | | | 0 | | | | 17,052,060 | |
Information technology | | | 96,097,685 | | | | 0 | | | | 0 | | | | 96,097,685 | |
Materials | | | 5,949,641 | | | | 0 | | | | 0 | | | | 5,949,641 | |
| | | | |
Short-term investments | | | | | | | | | | | | | | | | |
Investment companies | | | 6,708,393 | | | | 0 | | | | 0 | | | | 6,708,393 | |
Investments measured at net asset value* | | | | | | | | | | | | | | | 2,439,600 | |
Total assets | | $ | 282,404,633 | | | $ | 0 | | | $ | 0 | | | $ | 284,844,233 | |
| * | Investments that are measured at fair value using the net asset value per share (or its equivalent) as a practical expedient have not been categorized in the fair value hierarchy. The fair value amount presented in the table is intended to permit reconciliation of the fair value hierarchy to the amounts presented in the Statement of Assets and Liabilities. The Fund’s investment in Securities Lending Cash Investments, LLC valued at $2,439,600 does not have a redemption period notice, can be redeemed daily and does not have any unfunded commitments. |
The Fund recognizes transfers between levels within the fair value hierarchy at the end of the reporting period. At July 31, 2016, the Fund did not have any transfers into/out of Level 1, Level 2, or Level 3.
4. TRANSACTIONS WITH AFFILIATES
Management fee
Funds Management, an indirect wholly owned subsidiary of Wells Fargo, is the manager of the Fund and provides advisory and fund-level administrative services under an investment management agreement. Under the investment management agreement, Funds Management is responsible for, among other services, implementing the investment objectives and strategies of the Fund, supervising the subadviser, providing fund-level administrative services in connection with the Fund’s operations, and providing any other fund-level administrative services reasonably necessary for the operation of the Fund. As compensation for its services under the investment management agreement, Funds Management is entitled to receive an annual management fee starting at 0.70% and declining to 0.505% as the average daily net assets of the Fund increase. For the year ended July 31, 2016, the management fee was equivalent to an annual rate of 0.70% of the Fund’s average daily net assets.
| | | | |
| 26 | | Wells Fargo Capital Growth Fund | | Notes to financial statements |
Funds Management has retained the services of a subadviser to provide daily portfolio management to the Fund. The fee for subadvisory services is borne by Funds Management. WellsCap is the subadviser to the Fund and is entitled to receive a fee from Funds Management at an annual rate starting at 0.30% and declining to 0.20% as the average daily net assets of the Fund increase.
Administration fees
Under a class-level administration agreement, Funds Management provides class-level administrative services to the Fund, which includes paying fees and expenses for services provided by the transfer agent, sub-transfer agents, omnibus account servicers and record-keepers. As compensation for its services under the class-level administration agreement, Funds Management receives an annual fee which is calculated based on the average daily net assets of each class as follows:
| | | | |
| | | Class-level
administration fee | |
Class A, Class C | | | 0.21 | % |
Class R4 | | | 0.08 | |
Class R6 | | | 0.03 | |
Administrator Class, Institutional Class | | | 0.13 | |
Investor Class | | | 0.32 | |
Funds Management has contractually waived and/or reimbursed management and administration fees to the extent necessary to maintain certain net operating expense ratios for the Fund. Waiver of fees and/or reimbursement of expenses by Funds Management were made first from fund level expenses on a proportionate basis and then from class specific expenses. Funds Management has committed through November 30, 2016 to waive fees and/or reimburse expenses to the extent necessary to cap the Fund’s expenses at 1.11% for Class A shares, 1.86% for Class C shares, 0.75% for Class R4 shares, 0.60% for R6 shares, 0.94% for Administrator Class shares, and 0.70% for Institutional Class shares. After this time, the cap may be increased or the commitment to maintain the cap may be terminated only with the approval of the Board of Trustees. Prior to December 1, 2015, the Fund’s expenses were capped at 0.90% for Administrator Class shares and 0.65% for Institutional Class shares.
Distribution fee
The Trust has adopted a distribution plan for Class C shares of the Fund pursuant to Rule 12b-1 under the 1940 Act. A distribution fee is charged to Class C shares and paid to Wells Fargo Funds Distributor, LLC (“Funds Distributor”), the principal underwriter, at an annual rate of 0.75% of the average daily net assets of Class C shares.
In addition, Funds Distributor is entitled to receive the front-end sales charge from the purchase of Class A shares and a contingent deferred sales charge on the redemption of certain Class A shares. Funds Distributor is also entitled to receive the contingent deferred sales charges from redemptions of Class C shares. For the year ended July 31, 2016, Funds Distributor received $3,222 from the sale of Class A shares.
Shareholder servicing fees
The Trust has entered into contracts with one or more shareholder servicing agents, whereby Class A, Class C, Administrator Class and Investor Class of the Fund are charged a fee at an annual rate of 0.25% of the average daily net assets of each respective class. Class R4 is charged a fee at an annual rate of 0.10% of its average daily net assets.
A portion of these total shareholder servicing fees were paid to affiliates of Wells Fargo.
5. INVESTMENT PORTFOLIO TRANSACTIONS
Purchases and sales of investments, excluding U.S. government obligations (if any) and short-term securities, for the year ended July 31, 2016 were $239,706,418 and $277,600,963, respectively.
The Fund may purchase or sell investment securities to other Wells Fargo funds under procedures adopted by the Board of Trustees. The procedures have been designed to ensure that these interfund transactions, which generally do not incur broker commissions, are effected at current market prices. Interfund trades are included within the respective purchases and sales amounts shown.
| | | | | | |
| Notes to financial statements | | Wells Fargo Capital Growth Fund | | | 27 | |
6. BANK BORROWINGS
The Trust (excluding the money market funds and certain other funds) and Wells Fargo Variable Trust are parties to a $200,000,000 revolving credit agreement whereby the Fund is permitted to use bank borrowings for temporary or emergency purposes, such as to fund shareholder redemption requests. Interest under the credit agreement is charged to the Fund based on a borrowing rate equal to the higher of the Federal Funds rate in effect on that day plus 1.25% or the overnight LIBOR rate in effect on that day plus 1.25%. In addition, an annual commitment fee equal to 0.20% of the unused balance is allocated to each participating fund. Prior to September 1, 2015, the revolving credit agreement amount was $150,000,000 and the annual commitment fee was equal to 0.10% of the unused balance which was allocated to each participating fund.
For the year ended July 31, 2016, there were no borrowings by the Fund under the agreement.
7. DISTRIBUTIONS TO SHAREHOLDERS
The tax character of distributions paid during the years ended July 31, 2016 and July 31, 2015 were as follows:
| | | | | | | | |
| | | Year ended July 31 | |
| | | 2016 | | | 2015 | |
Ordinary income | | $ | 0 | | | $ | 26,099,552 | |
Long-term capital gain | | | 38,520,836 | | | | 63,507,086 | |
As of July 31, 2016, the components of distributable earnings on a tax basis were as follows:
| | |
Unrealized gains | | Post-October capital losses deferred |
| $70,908,008 | | $(1,426,783) |
8. CONCENTRATION RISK
Concentration risks result from exposure to a limited number of sectors. A fund that invests a substantial portion of its assets in any sector may be more affected by changes in that sector than would be a fund whose investments are not heavily weighted in any sector.
9. INDEMNIFICATION
Under the Trust’s organizational documents, the officers and Trustees have been granted certain indemnification rights against certain liabilities that may arise out of performance of their duties to the Trust. Additionally, in the normal course of business, the Trust may enter into contracts with service providers that contain a variety of indemnification clauses. The Trust’s maximum exposure under these arrangements is dependent on future claims that may be made against the Fund and, therefore, cannot be estimated.
| | | | |
| 28 | | Wells Fargo Capital Growth Fund | | Report of independent registered public accounting firm |
BOARD OF TRUSTEES AND SHAREHOLDERS OF WELLS FARGO FUNDS TRUST:
We have audited the accompanying statements of assets and liabilities, including the portfolio of investments, of the Wells Fargo Capital Growth Fund (formerly known as Wells Fargo Advantage Capital Growth Fund) (the “Fund”), one of the funds constituting the Wells Fargo Funds Trust, as of July 31, 2016, and the related statement of operations for the year then ended, the statements of changes in net assets for each of the years in the two-year period then ended, and the financial highlights for each of the years or periods in the five-year period then ended. These financial statements and financial highlights are the responsibility of the Fund’s management. Our responsibility is to express an opinion on these financial statements and financial highlights based on our audits.
We conducted our audits in accordance with the standards of the Public Company Accounting Oversight Board (United States). Those standards require that we plan and perform the audit to obtain reasonable assurance about whether the financial statements and financial highlights are free of material misstatement. An audit includes examining, on a test basis, evidence supporting the amounts and disclosures in the financial statements. Our procedures included confirmation of securities owned as of July 31, 2016, by correspondence with the custodian and brokers, or by other appropriate auditing procedures. An audit also includes assessing the accounting principles used and significant estimates made by management, as well as evaluating the overall financial statement presentation. We believe that our audits provide a reasonable basis for our opinion.
In our opinion, the financial statements and financial highlights referred to above present fairly, in all material respects, the financial position of the Wells Fargo Capital Growth Fund as of July 31, 2016, the results of its operations for the year then ended, the changes in its net assets for each of the years in the two-year period then ended, and the financial highlights for each of the years or periods in the five-year period then ended, in conformity with U.S. generally accepted accounting principles.

Boston, Massachusetts
September 23, 2016
| | | | | | |
| Other information (unaudited) | | Wells Fargo Capital Growth Fund | | | 29 | |
TAX INFORMATION
Pursuant to Section 852 of the Internal Revenue Code, $38,520,836 was designated as a 20% rate gain distributions for the fiscal year ended July 31, 2016.
PROXY VOTING INFORMATION
A description of the policies and procedures that the Fund uses to determine how to vote proxies relating to portfolio securities is available, upon request, by calling 1-800-222-8222, visiting our website at wellsfargofunds.com, or visiting the SEC website at sec.gov. Information regarding how the Fund voted proxies relating to portfolio securities during the most recent 12-month period ended June 30 is available on the Fund’s website at wellsfargofunds.com or by visiting the SEC website at sec.gov.
PORTFOLIO HOLDINGS INFORMATION
The complete portfolio holdings for the Fund are publicly available monthly on the Fund’s website (wellsfargofunds.com), on a one-month delayed basis. In addition, top ten holdings information (excluding derivative positions) for the Fund is publicly available on the Fund’s website on a monthly, seven-day or more delayed basis. The Fund files its complete schedule of portfolio holdings with the SEC for the first and third quarters of each fiscal year on Form N-Q, which is available by visiting the SEC website at sec.gov. In addition, the Fund’s Form N-Q may be reviewed and copied at the SEC’s Public Reference Room in Washington, DC, and at regional offices in New York City, at 233 Broadway, and in Chicago, at 175 West Jackson Boulevard, Suite 900. Information about the Public Reference Room may be obtained by calling 1-800-SEC-0330.
| | | | |
| 30 | | Wells Fargo Capital Growth Fund | | Other information (unaudited) |
BOARD OF TRUSTEES AND OFFICERS
Each of the Trustees and Officers1 listed in the table below acts in identical capacities for each fund in the Wells Fargo family of funds, which consists of 139 mutual funds comprising the Wells Fargo Funds Trust, Wells Fargo Variable Trust, Wells Fargo Master Trust and four closed-end funds (collectively the “Fund Complex”). This table should be read in conjunction with the Prospectus and the Statement of Additional Information2. The mailing address of each Trustee and Officer is 525 Market Street, 12th Floor, San Francisco, CA 94105. Each Trustee and Officer serves an indefinite term, however, each Trustee serves such term until reaching the mandatory retirement age established by the Trustees.
Independent Trustees
| | | | | | |
Name and year of birth | | Position held and length of service* | | Principal occupations during past five years or longer | | Current other
public company or
investment company
directorships |
| William R. Ebsworth (Born 1957) | | Trustee, since 2015 | | Retired. From 1984 to 2013, equities analyst, portfolio manager, research director and chief financial officer at Fidelity Management and Research Company in Boston, Tokyo, and Hong Kong and retired in 2013 as Chief Investment Officer of Fidelity Strategic Advisers, Inc. where he lead a team of investment professionals managing client assets. Prior thereto, Board member of Hong Kong Securities Clearing Co., Hong Kong Options Clearing Corp., the Thailand International Fund, Ltd., Fidelity Investments Life Insurance Company, and Empire Fidelity Investments Life Insurance Company. Mr. Ebsworth is a CFA® charterholder and an Adjunct Lecturer, Finance, at Babson College. | | Asset Allocation Trust |
| Jane A. Freeman (Born 1953) | | Trustee, since 2015 | | Retired. From 2012 to 2014 and 1999 to 2008, Chief Financial Officer of Scientific Learning Corporation. From 2008 to 2012, Ms. Freeman provided consulting services related to strategic business projects. Prior to 1999, Portfolio Manager at Rockefeller & Co. and Scudder, Stevens & Clark. Board member of the Harding Loevner Funds from 1996 to 2014, serving as both Lead Independent Director and chair of the Audit Committee. Board member of the Russell Exchange Traded Funds Trust from 2011 to 2012 and the chair of the Audit Committee. Ms. Freeman is Chair of Taproot Foundation (non-profit organization), a Board Member of Ruth Bancroft Garden (non-profit organization) and an inactive chartered financial analyst. | | Asset Allocation Trust |
| Peter G. Gordon (Born 1942) | | Trustee, since 1998; Chairman, since 2005 | | Co-Founder, Retired Chairman, President and CEO of Crystal Geyser Water Company. Trustee Emeritus, Colby College. | | Asset Allocation Trust |
| Isaiah Harris, Jr. (Born 1952) | | Trustee, since 2009 | | Retired. Chairman of the Board of CIGNA Corporation since 2009, and Director since 2005. From 2003 to 2011, Director of Deluxe Corporation. Prior thereto, President and CEO of BellSouth Advertising and Publishing Corp. from 2005 to 2007, President and CEO of BellSouth Enterprises from 2004 to 2005 and President of BellSouth Consumer Services from 2000 to 2003. Emeritus member of the Iowa State University Foundation Board of Governors. Emeritus Member of the Advisory Board of Iowa State University School of Business. Advisory Board Member, Palm Harbor Academy (charter school). Advisory Board Member, Child Evangelism Fellowship (non-profit). Mr. Harris is a certified public accountant (inactive status). | | CIGNA Corporation; Asset Allocation Trust |
| Judith M. Johnson (Born 1949) | | Trustee, since 2008; Audit Committee Chairman, since 2008 | | Retired. Prior thereto, Chief Executive Officer and Chief Investment Officer of Minneapolis Employees Retirement Fund from 1996 to 2008. Ms. Johnson is an attorney, certified public accountant and a certified managerial accountant. | | Asset Allocation Trust |
| David F. Larcker (Born 1950) | | Trustee, since 2009 | | James Irvin Miller Professor of Accounting at the Graduate School of Business, Stanford University, Director of the Corporate Governance Research Initiative and Senior Faculty of The Rock Center for Corporate Governance since 2006. From 2005 to 2008, Professor of Accounting at the Graduate School of Business, Stanford University. Prior thereto, Ernst & Young Professor of Accounting at The Wharton School, University of Pennsylvania from 1985 to 2005. | | Asset Allocation Trust |
| | | | | | |
| Other information (unaudited) | | Wells Fargo Capital Growth Fund | | | 31 | |
| | | | | | |
Name and year of birth | | Position held and length of service* | | Principal occupations during past five years or longer | | Current other
public company or
investment company
directorships |
| Olivia S. Mitchell (Born 1953) | | Trustee, since 2006 | | International Foundation of Employee Benefit Plans Professor, Wharton School of the University of Pennsylvania since 1993. Director of Wharton’s Pension Research Council and Boettner Center on Pensions & Retirement Research, and Research Associate at the National Bureau of Economic Research. Previously, Cornell University Professor from 1978 to 1993. | | Asset Allocation Trust |
| Timothy J. Penny (Born 1951) | | Trustee, since 1996 | | President and Chief Executive Officer of Southern Minnesota Initiative Foundation, a non-profit organization, since 2007 and Senior Fellow at the Humphrey Institute Policy Forum at the University of Minnesota since 1995. Member of the Board of Trustees of NorthStar Education Finance, Inc., a non-profit organization, since 2007. | | Asset Allocation Trust |
| Michael S. Scofield (Born 1943) | | Trustee, since 2010 | | Served on the Investment Company Institute’s Board of Governors and Executive Committee from 2008-2011 as well the Governing Council of the Independent Directors Council from 2006-2011 and the Independent Directors Council Executive Committee from 2008-2011. Chairman of the IDC from 2008-2010. Institutional Investor (Fund Directions) Trustee of Year in 2007. Trustee of the Evergreen Funds complex (and its predecessors) from 1984 to 2010. Chairman of the Evergreen Funds from 2000-2010. Former Trustee of the Mentor Funds. Retired Attorney, Law Offices of Michael S. Scofield. | | Asset Allocation Trust |
| * | Length of service dates reflect the Trustee’s commencement of service with the Trust’s predecessor entities, where applicable. |
Officers
| | | | | | |
Name and year of birth | | Position held and
length of service | | Principal occupations during past five years or longer | | |
Karla M. Rabusch
(Born 1959) | | President, since 2003 | | Executive Vice President of Wells Fargo Bank, N.A. and President of Wells Fargo Funds Management, LLC since 2003. | | |
Jeremy DePalma1
(Born 1974) | | Treasurer, since 2012 | | Senior Vice President of Wells Fargo Funds Management, LLC since 2009. Senior Vice President of Evergreen Investment Management Company, LLC from 2008 to 2010 and head of the Fund Reporting and Control Team within Fund Administration from 2005 to 2010. | | |
C. David Messman
(Born 1960) | | Secretary, since 2000; Chief Legal Officer, since 2003 | | Senior Vice President and Secretary of Wells Fargo Funds Management, LLC since 2001. Assistant General Counsel of Wells Fargo Bank, N.A. since 2013 and Vice President and Managing Counsel of Wells Fargo Bank, N.A. from 1996 to 2013. | | |
Michael Whitaker
(Born 1967) | | Chief Compliance Officer, since 2016* | | Executive Vice President of Wells Fargo Funds Management, LLC since 2016. Chief Compliance Officer of Fidelity’s Fixed Income Funds and Asset Allocation Funds from 2008 to 2016, Compliance Officer of FMR Co., Inc. from 2014 to 2016, Fidelity Investments Money Management, Inc. from 2014 to 2016, Fidelity Investments from 2007 to 2016. | | |
David Berardi
(Born 1975) | | Assistant Treasurer, since 2009 | | Vice President of Wells Fargo Funds Management, LLC since 2009. Vice President of Evergreen Investment Management Company, LLC from 2008 to 2010. Manager of Fund Reporting and Control for Evergreen Investment Management Company, LLC from 2004 to 2010. | | |
| 1 | Jeremy DePalma acts as Treasurer of 68 funds and Assistant Treasurer of 71 funds in the Fund Complex. |
| 2 | The Statement of Additional Information includes additional information about the Trustees and is available, without charge, upon request, by calling 1-800-222-8222 or by visiting the website at wellsfargofunds.com. |
| * | Michael Whitaker became Chief Compliance Officer effective May 16, 2016. |
| | | | |
| 32 | | Wells Fargo Capital Growth Fund | | Other information (unaudited) |
BOARD CONSIDERATION OF INVESTMENT MANAGEMENT AND SUB-ADVISORY AGREEMENTS:
Under the Investment Company Act of 1940 (the “1940 Act”), the Board of Trustees (the “Board”) of Wells Fargo Funds Trust (the “Trust”) must determine annually whether to approve the continuation of the Trust’s investment management and sub-advisory agreements. In this regard, at an in-person meeting held on May 24-25, 2016 (the “Meeting”), the Board, all the members of which have no direct or indirect interest in the investment management and sub-advisory agreements and are not “interested persons” of the Trust, as defined in the 1940 Act (the “Independent Trustees”), reviewed and approved for Wells Fargo Capital Growth Fund (the “Fund”): (i) an investment management agreement (the “Management Agreement”) with Wells Fargo Funds Management, LLC (“Funds Management”); and (ii) an investment sub-advisory agreement (the “Sub-Advisory Agreement”) with Wells Capital Management Incorporated (the “Sub-Adviser”), an affiliate of Funds Management. The Management Agreement and the Sub-Advisory Agreement are collectively referred to as the “Advisory Agreements.”
At the Meeting, the Board considered the factors and reached the conclusions described below relating to the selection of Funds Management and the Sub-Adviser and the approval of the Advisory Agreements. Prior to the Meeting, including at an in-person meeting in April 2016, the Trustees conferred extensively among themselves and with representatives of Funds Management about these matters. Also, the Board has adopted a team-based approach, with each team consisting of a sub-set of Trustees, to assist the full Board in the discharge of its duties in reviewing performance and other matters throughout the year. The Independent Trustees were assisted in their evaluation of the Advisory Agreements by independent legal counsel, from whom they received separate legal advice and with whom they met separately.
In providing information to the Board, Funds Management and the Sub-Adviser were guided by a detailed set of requests for information submitted to them by independent legal counsel on behalf of the Independent Trustees at the start of the Board’s annual contract renewal process earlier in 2016. In considering and approving the Advisory Agreements, the Trustees considered the information they believed relevant, including but not limited to the information discussed below. The Board considered not only the specific information presented in connection with the Meeting, but also the knowledge gained over time through interaction with Funds Management and the Sub-Adviser about various topics. In this regard, the Board reviewed reports of Funds Management at each of its quarterly meetings, which included, among other things, portfolio reviews and performance reports. In addition, the Board and the teams mentioned above confer with portfolio managers at various times throughout the year. The Board did not identify any particular information or consideration that was all-important or controlling, and each individual Trustee may have attributed different weights to various factors.
After its deliberations, the Board unanimously approved the continuation of the Advisory Agreements for a one-year term and determined that the compensation payable to Funds Management and the Sub-Adviser under each of the Advisory Agreements was reasonable. The Board considered the approval of the Advisory Agreements for the Fund as part of its consideration of agreements for funds across the complex, but its approvals were made on a fund-by-fund basis. The following summarizes a number of important, but not necessarily all, factors considered by the Board in support of its approvals.
Nature, extent and quality of services
The Board received and considered various information regarding the nature, extent and quality of services provided to the Fund by Funds Management and the Sub-Adviser under the Advisory Agreements. This information included a description of the investment advisory services and Fund-level administrative services covered by the Management Agreement, as well as, among other things, a summary of the background and experience of senior management of Funds Management, and the qualifications, background, tenure and responsibilities of each of the portfolio managers primarily responsible for the day-to-day portfolio management of the Fund.
The Board evaluated the ability of Funds Management and the Sub-Adviser to attract and retain qualified investment professionals, including research, advisory and supervisory personnel. The Board further considered the compliance programs and compliance records of Funds Management and the Sub-Adviser. In addition, the Board took into account the full range of services provided to the Fund by Funds Management and its affiliates.
Fund performance and expenses
The Board considered the performance results for the Fund over various time periods ended December 31, 2015. The Board considered these results in comparison to the performance of funds in a universe that was determined by Broadridge Inc. (“Broadridge”) to be similar to the Fund (the “Universe”), and in comparison to the Fund’s benchmark index and to other comparative data. Broadridge is an independent provider of investment company data. The Board received a description of the methodology used by Broadridge to select the mutual funds in the performance Universe.
| | | | | | |
| Other information (unaudited) | | Wells Fargo Capital Growth Fund | | | 33 | |
The Board noted that the performance of the Fund (Administrator Class) was lower than the average performance of the Universe for all periods under review. The Board also noted that the performance of the Fund was lower than its benchmark, the Russell 1000® Growth Index, for all periods under review.
The Board received information concerning, and discussed factors contributing to, the underperformance of the Fund relative to the Universe and benchmark for the periods noted above. The Board took note of the explanations for the relative underperformance in these periods, including with respect to market factors and investment decisions that affected the Fund’s performance.
The Board also received and considered information regarding the Fund’s net operating expense ratios and their various components, including actual management fees, custodian and other non-management fees, and Rule 12b-1 and non-Rule 12b-1 shareholder service fees. The Board considered these ratios in comparison to the median ratios of funds in class-specific expense groups that were determined by Broadridge to be similar to the Fund (the “Groups”). The Board received a description of the methodology used by Broadridge to select the mutual funds in the expense Groups and an explanation of how funds comprising expense groups and their expense ratios may vary from year-to-year. Based on the Broadridge reports, the Board noted that the net operating expense ratios of the Fund were lower than the median net operating expense ratios of the expense Groups.
The Board took into account the Fund performance and expense information provided to it among the factors considered in deciding to re-approve the Advisory Agreements.
Investment management and sub-advisory fee rates
The Board reviewed and considered the contractual fee rates payable by the Fund to Funds Management under the Management Agreement, as well as the contractual fee rates payable by the Fund to Funds Management for class-level administrative services under a Class-Level Administration Agreement, which include class-level transfer agency and sub-transfer agency costs (collectively, the “Management Rates”). The Board also reviewed and considered the contractual investment sub-advisory fee rates that are payable by Funds Management to the Sub-Adviser for investment sub-advisory services.
Among other information reviewed by the Board was a comparison of the Fund’s Management Rates with the average contractual investment management fee rates of funds in the expense Groups at a common asset level as well as transfer agency costs of the funds in the expense Groups. The Board noted that the Management Rates of the Fund were lower than or in range of the sum of these average rates for the Fund’s expense Groups for all share classes.
The Board also received and considered information about the portion of the total management fee that was retained by Funds Management after payment of the fee to the Sub-Adviser for sub-advisory services. In assessing the reasonableness of this amount, the Board received and evaluated information about the nature and extent of responsibilities retained and risks assumed by Funds Management and not delegated to or assumed by the Sub-Adviser, and about Funds Management’s on-going oversight services. However, given the affiliation between Funds Management and the Sub-Adviser, the Board ascribed limited relevance to the allocation of fees between them.
The Board also received and considered information about the nature and extent of services offered and fee rates charged by Funds Management and the Sub-Adviser to other types of clients with investment strategies similar to those of the Fund. In this regard, the Board received information about the significantly greater scope of services, and compliance, reporting and other legal burdens and risks of managing mutual funds compared with those associated with managing assets of non-mutual fund clients such as collective funds or institutional separate accounts.
Based on its consideration of the factors and information it deemed relevant, including those described here, the Board determined that the compensation payable to Funds Management under the Management Agreement and to the Sub-Adviser under the Sub-Advisory Agreement was reasonable, in light of the services covered by the Advisory Agreements.
Profitability
The Board received and considered information concerning the profitability of Funds Management, as well as the profitability of Wells Fargo as a whole, from providing services to the Fund and the fund family as a whole. The Board also received and considered information concerning the profitability of the Sub-Adviser from providing services to the fund family as a whole, noting that the Sub-Adviser’s profitability information with respect to providing services to the Fund was subsumed in the Wells Fargo and Funds Management profitability analysis.
Funds Management reported on the methodologies and estimates used in calculating profitability. Among other things, the Board noted that the levels of profitability reported on a fund-by-fund basis varied widely, depending on factors such
| | | | |
| 34 | | Wells Fargo Capital Growth Fund | | Other information (unaudited) |
as the size and type of fund. Based on its review, the Board did not deem the profits reported by Funds Management or Wells Fargo from its services to the Fund to be at a level that would prevent it from approving the continuation of the Advisory Agreements.
Economies of scale
With respect to possible economies of scale, the Board noted the existence of breakpoints in the Fund’s management fee structure, which operate generally to reduce the Fund’s expense ratios as the Fund grows in size. It considered that, for a small fund or a fund that shrinks in size, breakpoints conversely can result in higher fee levels. The Board also considered that fee waiver and expense reimbursement arrangements and competitive fee rates at the outset are means of sharing potential economies of scale with shareholders of the Fund and the fund family as a whole. The Board considered Funds Management’s view that any analyses of potential economies of scale in managing a particular fund are inherently limited in light of the joint and common costs and investments that Funds Management incurs across the fund family as a whole.
The Board concluded that the Fund’s fee and expense arrangements, including contractual breakpoints, constituted a reasonable approach to sharing potential economies of scale with the Fund and its shareholders.
Other benefits to Funds Management and the Sub-Adviser
The Board received and considered information regarding potential “fall-out” or ancillary benefits received by Funds Management and its affiliates, including the Sub-Adviser, as a result of their relationships with the Fund. Ancillary benefits could include, among others, benefits directly attributable to other relationships with the Fund and benefits potentially derived from an increase in Funds Management’s and the Sub-Adviser’s business as a result of their relationships with the Fund. The Board noted that various affiliates of Funds Management may receive distribution-related fees, shareholder servicing payments and sub-transfer agency fees in respect of shares sold or held through them and services provided.
The Board also reviewed information about soft dollar credits earned and utilized by the Sub-Adviser, fees earned by Funds Management and the Sub-Adviser from managing a private investment vehicle for the fund family’s securities lending collateral and commissions earned by an affiliated broker from portfolio transactions.
Based on its consideration of the factors and information it deemed relevant, including those described here, the Board did not find that any ancillary benefits received by Funds Management and its affiliates, including the Sub-Adviser, were unreasonable.
Conclusion
At the Meeting, after considering the above-described factors and based on its deliberations and its evaluation of the information described above, the Board unanimously approved the continuation of the Advisory Agreements for a one-year term and determined that the compensation payable to Funds Management and the Sub-Adviser under each of the Advisory Agreements was reasonable.
| | | | | | |
| List of abbreviations | | Wells Fargo Capital Growth Fund | | | 35 | |
The following is a list of common abbreviations for terms and entities that may have appeared in this report.
| ACA | �� ACA Financial Guaranty Corporation |
| ADR | — American depositary receipt |
| ADS | — American depositary shares |
| AGC | — Assured Guaranty Corporation |
| AGM | — Assured Guaranty Municipal |
| Ambac | — Ambac Financial Group Incorporated |
| AMT | — Alternative minimum tax |
| BAN | — Bond anticipation notes |
| BHAC | — Berkshire Hathaway Assurance Corporation |
| CAB | — Capital appreciation bond |
| CCAB | — Convertible capital appreciation bond |
| CDA | — Community Development Authority |
| CDO | — Collateralized debt obligation |
| DRIVER | — Derivative inverse tax-exempt receipts |
| DW&P | — Department of Water & Power |
| DWR | — Department of Water Resources |
| ECFA | — Educational & Cultural Facilities Authority |
| EDA | — Economic Development Authority |
| EDFA | — Economic Development Finance Authority |
| ETF | — Exchange-traded fund |
| FDIC | — Federal Deposit Insurance Corporation |
| FFCB | — Federal Farm Credit Banks |
| FGIC | — Financial Guaranty Insurance Corporation |
| FHA | — Federal Housing Administration |
| FHLB | — Federal Home Loan Bank |
| FHLMC | — Federal Home Loan Mortgage Corporation |
| FICO | — The Financing Corporation |
| FNMA | — Federal National Mortgage Association |
| GDR | — Global depositary receipt |
| GNMA | — Government National Mortgage Association |
| HCFR | — Healthcare facilities revenue |
| HEFA | — Health & Educational Facilities Authority |
| HEFAR | — Higher education facilities authority revenue |
| HFA | — Housing Finance Authority |
| HFFA | — Health Facilities Financing Authority |
| HUD | — Department of Housing and Urban Development |
| IDA | — Industrial Development Authority |
| IDAG | — Industrial Development Agency |
| KRW | — Republic of Korea won |
| LIBOR | — London Interbank Offered Rate |
| LIFER | — Long Inverse Floating Exempt Receipts |
| LLC | — Limited liability company |
| LLLP | — Limited liability limited partnership |
| LLP | — Limited liability partnership |
| MBIA | — Municipal Bond Insurance Association |
| MFHR | — Multifamily housing revenue |
| MSTR | — Municipal securities trust receipts |
| MUD | — Municipal Utility District |
| National | — National Public Finance Guarantee Corporation |
| PCFA | — Pollution Control Financing Authority |
| PCL | — Public Company Limited |
| PCR | — Pollution control revenue |
| PFA | — Public Finance Authority |
| PFFA | — Public Facilities Financing Authority |
| PFOTER | — Puttable floating option tax-exempt receipts |
| plc | — Public limited company |
| PUTTER | — Puttable tax-exempt receipts |
| R&D | — Research & development |
| Radian | — Radian Asset Assurance |
| RAN | — Revenue anticipation notes |
| RDA | — Redevelopment Authority |
| RDFA | — Redevelopment Finance Authority |
| REIT | — Real estate investment trust |
| ROC | — Reset option certificates |
| SAVRS | — Select auction variable rate securities |
| SBA | — Small Business Authority |
| SDR | — Swedish depositary receipt |
| SFHR | — Single-family housing revenue |
| SFMR | — Single-family mortgage revenue |
| SPA | — Standby purchase agreement |
| SPDR | — Standard & Poor’s Depositary Receipts |
| SPEAR | — Short Puttable Exempt Adjustable Receipts |
| STRIPS | — Separate trading of registered interest and |
| TAN | — Tax anticipation notes |
| TIPS | — Treasury inflation-protected securities |
| TRAN | — Tax revenue anticipation notes |
| TTFA | — Transportation Trust Fund Authority |
| TVA | — Tennessee Valley Authority |
This page is intentionally left blank.

For more information
More information about Wells Fargo Funds is available free upon request. To obtain literature, please write, email, visit the Fund’s website, or call:
Wells Fargo Funds
P.O. Box 8266
Boston, MA 02266-8266
Email: fundservice@wellsfargo.com
Website: wellsfargofunds.com
Individual investors: 1-800-222-8222
Retail investment professionals: 1-888-877-9275
Institutional investment professionals: 1-866-765-0778
This report and the financial statements contained herein are submitted for the general information of the shareholders of the Fund. If this report is used for promotional purposes, distribution of the report must be accompanied or preceded by a current prospectus. Before investing, please consider the investment objectives, risks, charges, and expenses of the investment. For a current prospectus and, if available, a summary prospectus, containing this information, call 1-800-222-8222 or visit the Fund’s website at wellsfargofunds.com. Read the prospectus carefully before you invest or send money.
Wells Fargo Asset Management (WFAM) is a trade name used by the asset management businesses of Wells Fargo & Company. Wells Fargo Funds Management, LLC, a wholly owned subsidiary of Wells Fargo & Company, provides investment advisory and administrative services for Wells Fargo Funds. Other affiliates of Wells Fargo & Company provide subadvisory and other services for the funds. The funds are distributed by Wells Fargo Funds Distributor, LLC, Member FINRA, an affiliate of Wells Fargo & Company.
NOT FDIC INSURED ¡ NO BANK GUARANTEE ¡ MAY LOSE VALUE
© 2016 Wells Fargo Funds Management, LLC. All rights reserved.
| | |
 | | 245320 09-16 A200/AR200 07-16 |
Annual Report
July 31, 2016

Wells Fargo Disciplined U.S. Core Fund


Reduce clutter. Save trees.
Sign up for electronic delivery of prospectuses and shareholder reports at wellsfargo.com/advantagedelivery
Contents
The views expressed and any forward-looking statements are as of July 31, 2016, unless otherwise noted, and are those of the Fund managers and/or Wells Fargo Funds Management, LLC. Discussions of individual securities, or the markets generally, or any Wells Fargo Fund are not intended as individual recommendations. Future events or results may vary significantly from those expressed in any forward-looking statements. The views expressed are subject to change at any time in response to changing circumstances in the market. Wells Fargo Funds Management, LLC and the Fund disclaim any obligation to publicly update or revise any views expressed or forward-looking statements.
NOT FDIC INSURED ¡ NO BANK GUARANTEE ¡ MAY LOSE VALUE
| | | | |
| 2 | | Wells Fargo Disciplined U.S. Core Fund | | Letter to shareholders (unaudited) |

Karla M. Rabusch
President
Wells Fargo Funds
Despite significant market fluctuations over the course of the year, U.S. stocks delivered positive results overall for the 12-month reporting period
Dear Valued Shareholder:
We are pleased to offer you this annual report for the Wells Fargo Disciplined U.S. Core Fund for the 12-month period that ended July 31, 2016. During this period, which began August 1, 2015, U.S. and international stock markets experienced heightened volatility, with intermittent rebounds interspersed with sell-offs. The U.S. economy displayed resilience throughout the period, although growth was somewhat sluggish amid ongoing pressures that included slowing growth in China, a strengthening U.S. dollar, and uncertainty regarding interest-rate increases by the U.S. Federal Reserve (Fed); international economies faced deeper ongoing challenges. During June 2016, global markets became especially volatile as the U.K.’s vote over whether to leave the European Union (E.U.) approached. However, markets began recovering shortly after the U.K. voted to leave and rallied through July. Despite significant market fluctuations over the course of the year, U.S. stocks delivered positive results overall for the 12-month reporting period, as measured by the Russell 1000® Index.1 International markets generally declined as measured by the Morgan Stanley Capital International (MSCI) Europe, Australasia, Far East (EAFE) Index.2
In the third quarter of 2015, China’s slowdown took a toll on economies and markets worldwide.
U.S. stocks sagged during the quarter, experiencing the most volatility since 2011. Economic data released during the quarter suggested the U.S. economy remained solid but had lost some steam, burdened by the drag of the U.S. dollar’s strength coupled with global economic turmoil. The fact that the Fed left the federal funds interest rate unchanged at its September 2015 meeting surprised investors and fueled increased uncertainty about the U.S. economy’s stamina to remain healthy while facing the challenges of slowing growth in China and troubles elsewhere in the world. Outside the U.S., markets were even more volatile and delivered generally weaker quarterly results, also largely due to investors’ increasing anxiety over China’s weakened economy.
Despite ongoing concerns, U.S. stocks generally rose in the fourth quarter of 2015; international markets lagged.
While the broad U.S. stock market bounced back in the quarter, stock markets outside the U.S. failed to keep pace as economic concerns, including China’s ongoing slowdown, continued to affect many countries. U.S. economic data released during the quarter indicated the economy remained solid, although the strong U.S. dollar and weakness in international economies remained headwinds. In December, the Fed, as expected, raised its target interest rate by 25 basis points (bps; 100 bps equals 1.00%) after keeping it near zero for seven years. The move reflected confidence in the U.S. economy’s ability to stay healthy with less central-bank support. The Fed also clarified that future interest-rate increases would be gradual.
| 1 | The Russell 1000® Index measures the performance of the 1,000 largest companies in the Russell 3000® Index, which represents approximately 92% of the total market capitalization of the Russell 3000® Index. You cannot invest directly in an index. |
| 2 | Morgan Stanley Capital International (MSCI) Europe, Australasia, Far East (EAFE) Index is a free-float-adjusted market-capitalization-weighted index that is designed to measure the equity market performance of developed markets, excluding the United States and Canada. The MSCI EAFE Index consists of the following 21 developed markets country indexes: Australia, Austria, Belgium, Denmark, Finland, France, Germany, Hong Kong, Ireland, Israel, Italy, Japan, the Netherlands, New Zealand, Norway, Portugal, Singapore, Spain, Sweden, Switzerland, and the United Kingdom. You cannot invest directly in an index. |
| | | | | | |
| Letter to shareholders (unaudited) | | Wells Fargo Disciplined U.S. Core Fund | | | 3 | |
In the first quarter of 2016, market volatility increased globally amid ongoing concerns.
Stock markets worldwide fluctuated widely in the first quarter of 2016. Most sold off sharply in the first six weeks of the year on concerns such as weak global growth, falling commodity prices, and uncertainty over the timing and impact of the Fed’s interest-rate increases. As the quarter progressed, fears abated somewhat and global markets generally rallied back. The U.S. economy ended the quarter on a positive note as much of the quarter’s data reflected resiliency. With ongoing uncertainties about global growth and financial markets, however, the Fed held off from raising the target interest rate during the quarter. Outside the U.S., the eurozone fell into deflation in February; in response, the European Central Bank announced an expansion of its stimulus program. In China, the government in March set a growth rate of 6.5% to 7.0% for 2016, an acknowledgment of weakening growth. In emerging markets, although central-bank stimulus and improved prices for oil and other commodities led to stock-market rallies in the quarter, many of these countries’ economies face credit downgrades due to challenges such as the likelihood of a stronger U.S. dollar, which would make dollar-denominated debt more expensive.
Worries over interest rates and the U.K.’s vote largely drove the markets during the second quarter of 2016.
U.S. stocks began the quarter in positive territory but started to lose steam in early May on worries that a possible June interest-rate increase by the Fed could hurt the market. In mid-May, stocks briefly plunged following comments by Fed officials noting that a June interest-rate increase remained on the table. But once investors had processed this information, stocks again rallied, finishing up for the month. The first three weeks of June brought heightened volatility, spurred largely by a disappointing jobs report and uncertainty over whether the U.K. would remain in the E.U. The U.K.’s Brexit vote on June 23 shocked countries in Europe and much of the rest of the world. Stock markets plummeted as investors worried that the U.K.’s departure from the E.U. would slow global growth and prolong the low-interest-rate environment. Following the initial rout, however, U.S. stocks rallied as investors seemed to decide that any negative effects would be more localized and not create a serious risk for global growth. By quarter-end, the broad U.S. stock market had moved back into positive territory.
Stocks generally posted positive results for July 2016.
U.S. stocks displayed the most momentum during the first two weeks of the month, buoyed partly by an unexpectedly favorable June jobs report that helped strengthen confidence in the U.S. economy. Also, investors perhaps felt that global central banks could extend stimulus measures in the wake of the Brexit vote. Although U.S. market momentum slowed during the second half of July, stocks ended in positive territory for the month. International stocks delivered positive monthly results as well.
| | | | |
| 4 | | Wells Fargo Disciplined U.S. Core Fund | | Letter to shareholders (unaudited) |
Don’t let short-term uncertainty derail long-term investment goals.
Periods of uncertainty can present challenges, but experience has taught us that maintaining long-term investment goals can be an effective way to plan for the future. To help you create a sound strategy based on your personal goals and risk tolerance, Wells Fargo Funds offers more than 100 mutual funds spanning a wide range of asset classes and investment styles. Although diversification cannot guarantee an investment profit or prevent losses, we believe it can be an effective way to manage investment risk and potentially smooth out overall portfolio performance. We encourage investors to know their investments and to understand that appropriate levels of risk-taking may unlock opportunities.
Thank you for choosing to invest in Wells Fargo Funds. We appreciate your confidence in us and remain committed to helping you meet your financial needs.
Sincerely,

Karla M. Rabusch
President
Wells Fargo Funds
Although diversification cannot guarantee an investment profit or prevent losses, we believe it can be an effective way to manage investment risk and potentially smooth out overall portfolio performance.
For further information about your Fund, contact your investment professional, visit our website at wellsfargofunds.com, or call us directly at 1-800-222-8222. We are available 24 hours a day, 7 days a week.
This page is intentionally left blank.
| | | | |
| 6 | | Wells Fargo Disciplined U.S. Core Fund | | Performance highlights (unaudited) |
Investment objective
The Fund seeks long-term capital appreciation.
Manager
Wells Fargo Funds Management, LLC
Subadviser
Golden Capital Management, LLC
Portfolio manager
Greg Golden, CFA®
Average annual total returns (%) as of July 31, 20161
| | | | | | | | | | | | | | | | | | | | | | | | | | | | | | | | | | |
| | | | | Including sales charge | | | Excluding sales charge | | | Expense ratios2 (%) | |
| | | Inception date | | 1 year | | | 5 year | | | 10 year | | | 1 year | | | 5 year | | | 10 year | | | Gross | | | Net3 | |
| Class A (EVSAX) | | 2-28-1990 | | | (0.81 | ) | | | 12.30 | | | | 7.17 | | | | 5.22 | | | | 13.64 | | | | 7.81 | | | | 0.84 | | | | 0.84 | |
| Class C (EVSTX) | | 6-30-1999 | | | 3.43 | | | | 12.79 | | | | 7.00 | | | | 4.43 | | | | 12.79 | | | | 7.00 | | | | 1.59 | | | | 1.59 | |
| Class R (EVSHX) | | 9-30-2015 | | | – | | | | – | | | | – | | | | 5.00 | | | | 13.34 | | | | 7.50 | | | | 1.09 | | | | 1.09 | |
| Class R6 (EVSRX) | | 9-30-2015 | | | – | | | | – | | | | – | | | | 5.70 | | | | 14.14 | | | | 8.20 | | | | 0.41 | | | | 0.41 | |
| Administrator Class (EVSYX) | | 2-21-1995 | | | – | | | | – | | | | – | | | | 5.36 | | | | 13.81 | | | | 8.02 | | | | 0.76 | | | | 0.74 | |
| Institutional Class (EVSIX) | | 7-30-2010 | | | – | | | | – | | | | – | | | | 5.64 | | | | 14.13 | | | | 8.20 | | | | 0.51 | | | | 0.48 | |
| S&P 500 Index4 | | – | | | – | | | | – | | | | – | | | | 5.61 | | | | 13.38 | | | | 7.75 | | | | – | | | | – | |
Figures quoted represent past performance, which is no guarantee of future results, and do not reflect taxes that a shareholder may pay on fund distributions or the redemption of fund shares. Investment return and principal value of an investment will fluctuate so that an investor’s shares, when redeemed, may be worth more or less than their original cost. Performance shown without sales charges would be lower if sales charges were reflected. Current performance may be lower or higher than the performance data quoted, which assumes the reinvestment of dividends and capital gains. Current month-end performance is available on the Fund’s website, wellsfargofunds.com.
Index returns do not include transaction costs associated with buying and selling securities, any mutual fund fees or expenses, or any taxes. It is not possible to invest directly in an index.
For Class A shares, the maximum front-end sales charge is 5.75%. For Class C shares, the maximum contingent deferred sales charge is 1.00%. Performance including a contingent deferred sales charge assumes the sales charge for the corresponding time period. Class R, Class R6, Administrator Class, and Institutional Class shares are sold without a front-end sales charge or contingent deferred sales charge.
Stock values fluctuate in response to the activities of individual companies and general market and economic conditions. The use of derivatives may reduce returns and/or increase volatility. Consult the Fund’s prospectus for additional information on these and other risks.
Please see footnotes on page 7.
| | | | | | |
| Performance highlights (unaudited) | | Wells Fargo Disciplined U.S. Core Fund | | | 7 | |
|
| Growth of $10,000 investment as of July 31, 20165 |
|
 |
| 1 | Historical performance shown for Class R shares prior to their inception reflects the performance of Administrator Class shares, adjusted to reflect higher expenses applicable to Class R shares. Historical performance shown for Class R6 shares prior to their inception reflects the performance of Institutional Class shares, and includes the higher expenses applicable to Institutional Class shares. If these expenses had not been included, returns would be higher. Historical performance shown for Institutional Class shares prior to their inception reflects the performance of Administrator Class shares, and includes the higher expenses applicable to Administrator Class shares. If these expenses had not been included, returns would be higher. Historical performance shown for all classes of the Fund prior to July 19, 2010, is based on the performance of the Fund’s predecessor, Evergreen Enhanced S&P 500 Fund. |
| 2 | Reflects the expense ratios as stated in the most recent prospectuses. The expense ratios shown are subject to change and may differ from the annualized expense ratios shown in the financial highlights of this report. |
| 3 | The manager has contractually committed through November 30, 2016, to waive fees and/or reimburse expenses to the extent necessary to cap the Fund’s Total Annual Fund Operating Expenses After Fee Waiver at 0.92% for Class A, 1.67% for Class C, 1.17% for Class R, 0.43% for Class R6, 0.74% for Administrator Class, and 0.48% for Institutional Class. After this time, the cap may be increased or the commitment to maintain the cap may be terminated only with the approval of the Board of Trustees. Brokerage commissions, stamp duty fees, interest, taxes, acquired fund fees and expenses, and extraordinary expenses are excluded from the cap. Without this cap, the Fund’s returns would have been lower. |
| 4 | The S&P 500 Index consists of 500 stocks chosen for market size, liquidity, and industry group representation. It is a market-value weighted index with each stock’s weight in the index proportionate to its market value. You cannot invest directly in an index. |
| 5 | The chart compares the performance of Class A shares for the most recent ten years with the S&P 500 Index. The chart assumes a hypothetical investment of $10,000 in Class A shares and reflects all operating expenses and assumes the maximum initial sales charge of 5.75%. |
| 6 | The ten largest holdings, excluding cash and cash equivalents, are calculated based on the value of the investments divided by total net assets of the Fund. Holdings are subject to change and may have changed since the date specified. |
| 7 | Amounts are calculated based on the total long-term investments of the Fund. These amounts are subject to change and may have changed since the date specified. |
| | | | |
| 8 | | Wells Fargo Disciplined U.S. Core Fund | | Performance highlights (unaudited) |
MANAGER’S DISCUSSION
Fund highlights
| n | | The Fund underperformed its benchmark, the S&P 500 Index, for the 12-month period that ended July 31, 2016. |
| n | | Weak stock selection in the consumer discretionary, industrials, and financials sectors detracted from the Fund’s relative performance. |
| n | | The Fund benefited most significantly from favorable stock selection in the materials, health care, and consumer staples sectors. |
| | | | |
| Ten largest holdings (%) as of July 31, 20166 | | | |
Apple Incorporated | | | 3.57 | |
Microsoft Corporation | | | 2.92 | |
Exxon Mobil Corporation | | | 2.59 | |
Johnson & Johnson | | | 2.55 | |
Pfizer Incorporated | | | 1.82 | |
Chevron Corporation | | | 1.71 | |
General Electric Company | | | 1.65 | |
Intel Corporation | | | 1.58 | |
Cisco Systems Incorporated | | | 1.58 | |
AT&T Incorporated | | | 1.56 | |
U.S. economic growth slowed during the reporting period. While gross domestic product (GDP) grew at an annualized 3.9% rate in the second quarter of 2015, its pace had slipped to an annualized 1.2% rate for the second quarter of 2016. Although the U.S. Federal Reserve (Fed) increased the federal funds target interest rate by 0.25% in December 2015, no further increases occurred during the reporting period, and in June 2016, the Fed lowered its expectations for rate increases in 2017 and 2018. Markets reacted positively to this lower-for-longer stance.
The unexpected Brexit result of the U.K.’s June 2016 referendum on retaining the country’s membership in the European Union injected considerable volatility into
global markets, with significant sell-offs in stock markets; dramatic moves in currency markets; and a flight into sovereign-debt markets that many investors perceive as safe havens, driving yields to historically low levels. Somewhat surprisingly, by the end of the second quarter of 2016, stock markets had recovered most of their losses and continued to rally through July.
|
| Sector distribution as of July 31, 20167 |
|
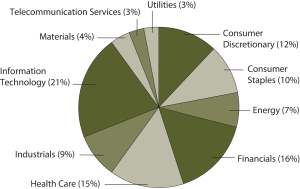 |
Weak stock selection in several sectors hindered the Fund’s relative results.
Within the Fund’s consumer discretionary holdings, an underweight to Amazon.com, Incorporated, and overweights to The Walt Disney Company; Dollar General Corporation; and Staples, Incorporated, were the largest detractors from performance. Within industrials, the Fund’s weak individual performers included airlines United Continental Holdings, Incorporated, and Delta Air Lines, Incorporated. In financials, overweights to Morgan Stanley; CBRE Group, Incorporated; and The Goldman Sachs Group, Incorporated, detracted from Fund performance.
The Fund benefited from stock selection in multiple sectors.
Within the materials sector, the Fund’s strongest individual contributors were metals-and-mining company Newmont Mining Corporation and containers-and-packaging company Avery Dennison Corporation. Stock selection in the health care and consumer staples sectors also delivered strong relative results. Within health care, the Fund benefited from overweights to Medtronic plc and Johnson & Johnson and from lack of exposure to three weak-performing pharmaceutical companies: Mallinckrodt plc; Perrigo Company plc; and Allergan, Incorporated. In consumer staples, the Fund enjoyed double-digit returns across several industries; the food-products industry delivered two of the top-performing companies: Keurig Green Mountain, Incorporated, and Tyson Foods, Incorporated.
Please see footnotes on page 7.
| | | | | | |
| Performance highlights (unaudited) | | Wells Fargo Disciplined U.S. Core Fund | | | 9 | |
Despite recent/future risks, we believe our process will continue to uncover attractive opportunities.
Looking ahead, we believe investors may be most concerned about geopolitical risks and potential contagion in the financials markets. The Brexit vote has set off a new round of global market volatility that likely will remain elevated for a while. Only time will tell if current fears will be realized; historically, many geopolitical shocks have been short term in nature, and economies and markets have adjusted to new realities.
While heightened volatility has been affecting all asset classes, we believe the impact on currencies and central banks’ responses to currency moves are likely to be the most significant factors influencing the U.S. economy and markets over the near term. The British pound already has depreciated significantly in response to the Brexit vote and could weaken further, which would make goods from the U.K. cheaper and thus more attractive to global consumers. In turn, global central banks could be compelled to take steps to make their currencies and goods more competitively priced in global markets. The U.S. dollar’s position as the global reserve currency may lead to flows into dollar-denominated assets, strengthening the dollar. As a result, the Fed could delay interest-rate increases due to the heightened risks and uncertainty in global markets. If the Fed does delay rate increases and other major central banks continue to pursue monetary-stimulus measures, we believe that monetary authorities would be doing the best they can to create a supportive environment for risk assets like stocks.
As a result of the increased volatility, risk aversion, and low-interest-rate environment, we believe investors may have been overpaying for lower-volatility and higher-yielding stocks in recent months. Although the market has not been rewarding companies displaying the traditional value metrics on which we focus, we believe companies with attractive valuations that potentially would benefit from positive economic growth remain the most attractive investment opportunities. We will stick to our investment philosophy centered on a disciplined, objective, and repeatable stock-selection process and emphasize firms we view as attractively valued and most likely to exceed earnings expectations.
We strive to deliver for shareholders.
Within the Fund, we strive to add value relative to the benchmark through a full market cycle, independent of overall market direction or movements by style (growth or value) or size (large or small). Our investment process will continue to focus on building a stock portfolio that emphasizes attractive valuations, earnings growth, earnings and sales momentum, earnings quality, and trading momentum. Based on our research and experience, we believe the Fund provides shareholders the opportunity for meaningful capital appreciation over time.
Please see footnotes on page 7.
| | | | |
| 10 | | Wells Fargo Disciplined U.S. Core Fund | | Fund expenses (unaudited) |
As a shareholder of the Fund, you incur two types of costs: (1) transaction costs, including sales charges (loads) on purchase payments and contingent deferred sales charges (if any) on redemptions and (2) ongoing costs, including management fees, distribution (12b-1) and/or shareholder servicing fees, and other Fund expenses. This example is intended to help you understand your ongoing costs (in dollars) of investing in the Fund and to compare these costs with the ongoing costs of investing in other mutual funds.
The example is based on an investment of $1,000 invested at the beginning of the six-month period and held for the entire period from February 1, 2016 to July 31, 2016.
Actual expenses
The “Actual” line of the table below provides information about actual account values and actual expenses. You may use the information in this line, together with the amount you invested, to estimate the expenses that you paid over the period. Simply divide your account value by $1,000 (for example, an $8,600 account value divided by $1,000 = 8.6), then multiply the result by the number in the “Actual” line under the heading entitled “Expenses paid during period” for your applicable class of shares to estimate the expenses you paid on your account during this period.
Hypothetical example for comparison purposes
The “Hypothetical” line of the table below provides information about hypothetical account values and hypothetical expenses based on the Fund’s actual expense ratio and an assumed rate of return of 5% per year before expenses, which is not the Fund’s actual return. The hypothetical account values and expenses may not be used to estimate the actual ending account balance or expenses you paid for the period. You may use this information to compare the ongoing costs of investing in the Fund and other funds. To do so, compare this 5% hypothetical example with the 5% hypothetical examples that appear in the shareholder reports of the other funds.
Please note that the expenses shown in the table are meant to highlight your ongoing costs only and do not reflect any transactional costs, such as sales charges (loads) and contingent deferred sales charges. Therefore, the “Hypothetical” line of the table is useful in comparing ongoing costs only and will not help you determine the relative total costs of owning different funds. In addition, if these transactional costs were included, your costs would have been higher.
| | | | | | | | | | | | | | | | |
| | | Beginning
account value
2-1-2016 | | | Ending
account value
7-31-2016 | | | Expenses
paid during
the period¹ | | | Annualized net
expense ratio | |
Class A | | | | | | | | | | | | | | | | |
Actual | | $ | 1,000.00 | | | $ | 1,124.90 | | | $ | 4.56 | | | | 0.86 | % |
Hypothetical (5% return before expenses) | | $ | 1,000.00 | | | $ | 1,020.57 | | | $ | 4.34 | | | | 0.86 | % |
Class C | | | | | | | | | | | | | | | | |
Actual | | $ | 1,000.00 | | | $ | 1,119.90 | | | $ | 8.51 | | | | 1.61 | % |
Hypothetical (5% return before expenses) | | $ | 1,000.00 | | | $ | 1,016.84 | | | $ | 8.10 | | | | 1.61 | % |
Class R | | | | | | | | | | | | | | | | |
Actual | | $ | 1,000.00 | | | $ | 1,123.19 | | | $ | 5.92 | | | | 1.12 | % |
Hypothetical (5% return before expenses) | | $ | 1,000.00 | | | $ | 1,019.28 | | | $ | 5.63 | | | | 1.12 | % |
Class R6 | | | | | | | | | | | | | | | | |
Actual | | $ | 1,000.00 | | | $ | 1,127.47 | | | $ | 2.25 | | | | 0.43 | % |
Hypothetical (5% return before expenses) | | $ | 1,000.00 | | | $ | 1,022.75 | | | $ | 2.14 | | | | 0.43 | % |
Administrator Class | | | | | | | | | | | | | | | | |
Actual | | $ | 1,000.00 | | | $ | 1,125.00 | | | $ | 3.91 | | | | 0.74 | % |
Hypothetical (5% return before expenses) | | $ | 1,000.00 | | | $ | 1,021.18 | | | $ | 3.72 | | | | 0.74 | % |
Institutional Class | | | | | | | | | | | | | | | | |
Actual | | $ | 1,000.00 | | | $ | 1,127.11 | | | $ | 2.54 | | | | 0.48 | % |
Hypothetical (5% return before expenses) | | $ | 1,000.00 | | | $ | 1,022.48 | | | $ | 2.41 | | | | 0.48 | % |
| 1 | Expenses paid is equal to the annualized net expense ratio of each class multiplied by the average account value over the period, multiplied by the number of days in the most recent fiscal half-year divided by the number of days in the fiscal year (to reflect the one-half-year period). |
| | | | | | |
| Portfolio of investments—July 31, 2016 | | Wells Fargo Disciplined U.S. Core Fund | | | 11 | |
| | | | | | | | | | | | | | | | |
| Security name | | | | | | | | Shares | | | Value | |
| | | | |
Common Stocks: 98.49% | | | | | | | | | | | | | | | | |
| | | | |
Consumer Discretionary: 11.50% | | | | | | | | | | | | | | | | |
| | | | |
| Auto Components: 0.24% | | | | | | | | | | | | | | | | |
The Goodyear Tire & Rubber Company | | | | | | | | | | | 61,680 | | | $ | 1,768,366 | |
| | | | | | | | | | | | | | | | |
| | | | |
| Automobiles: 1.62% | | | | | | | | | | | | | | | | |
Ford Motor Company | | | | | | | | | | | 486,392 | | | | 6,157,723 | |
General Motors Company | | | | | | | | | | | 188,400 | | | | 5,942,136 | |
| | | | |
| | | | | | | | | | | | | | | 12,099,859 | |
| | | | | | | | | | | | | | | | |
| | | | |
| Hotels, Restaurants & Leisure: 1.71% | | | | | | | | | | | | | | | | |
Darden Restaurants Incorporated | | | | | | | | | | | 81,777 | | | | 5,034,192 | |
McDonald’s Corporation | | | | | | | | | | | 12,000 | | | | 1,411,800 | |
Starbucks Corporation | | | | | | | | | | | 107,723 | | | | 6,253,320 | |
| | | | |
| | | | | | | | | | | | | | | 12,699,312 | |
| | | | | | | | | | | | | | | | |
| | | | |
| Household Durables: 0.30% | | | | | | | | | | | | | | | | |
D.R. Horton Incorporated | | | | | | | | | | | 69,185 | | | | 2,274,803 | |
| | | | | | | | | | | | | | | | |
| | | | |
| Internet & Catalog Retail: 0.99% | | | | | | | | | | | | | | | | |
Amazon.com Incorporated † | | | | | | | | | | | 9,692 | | | | 7,354,387 | |
| | | | | | | | | | | | | | | | |
| | | | |
| Media: 2.45% | | | | | | | | | | | | | | | | |
Comcast Corporation Class A | | | | | | | | | | | 153,207 | | | | 10,303,171 | |
The Walt Disney Company | | | | | | | | | | | 82,525 | | | | 7,918,274 | |
| | | | |
| | | | | | | | | | | | | | | 18,221,445 | |
| | | | | | | | | | | | | | | | |
| | | | |
| Specialty Retail: 3.90% | | | | | | | | | | | | | | | | |
Best Buy Company Incorporated | | | | | | | | | | | 188,134 | | | | 6,321,302 | |
Lowe’s Companies Incorporated | | | | | | | | | | | 96,030 | | | | 7,901,348 | |
Staples Incorporated | | | | | | | | | | | 397,650 | | | | 3,694,169 | |
The Home Depot Incorporated | | | | | | | | | | | 80,165 | | | | 11,082,010 | |
| | | | |
| | | | | | | | | | | | | | | 28,998,829 | |
| | | | | | | | | | | | | | | | |
| | | | |
| Textiles, Apparel & Luxury Goods: 0.29% | | | | | | | | | | | | | | | | |
Nike Incorporated Class B | | | | | | | | | | | 38,638 | | | | 2,144,409 | |
| | | | | | | | | | | | | | | | |
| | | | |
Consumer Staples: 9.68% | | | | | | | | | | | | | | | | |
| | | | |
| Beverages: 2.32% | | | | | | | | | | | | | | | | |
Dr Pepper Snapple Group Incorporated | | | | | | | | | | | 60,081 | | | | 5,918,579 | |
PepsiCo Incorporated | | | | | | | | | | | 68,932 | | | | 7,508,073 | |
The Coca-Cola Company | | | | | | | | | | | 87,590 | | | | 3,821,552 | |
| | | | |
| | | | | | | | | | | | | | | 17,248,204 | |
| | | | | | | | | | | | | | | | |
| | | | |
| Food & Staples Retailing: 3.45% | | | | | | | | | | | | | | | | |
CVS Health Corporation | | | | | | | | | | | 88,140 | | | | 8,172,341 | |
Sysco Corporation | | | | | | | | | | | 109,876 | | | | 5,690,478 | |
The Kroger Company | | | | | | | | | | | 52,928 | | | | 1,809,608 | |
The accompanying notes are an integral part of these financial statements.
| | | | |
| 12 | | Wells Fargo Disciplined U.S. Core Fund | | Portfolio of investments—July 31, 2016 |
| | | | | | | | | | | | | | | | |
| Security name | | | | | | | | Shares | | | Value | |
| | | | |
| Food & Staples Retailing (continued) | | | | | | | | | | | | | | | | |
Wal-Mart Stores Incorporated | | | | | | | | | | | 136,853 | | | $ | 9,986,163 | |
| | | | |
| | | | | | | | | | | | | | | 25,658,590 | |
| | | | | | | | | | | | | | | | |
| | | | |
| Food Products: 0.98% | | | | | | | | | | | | | | | | |
Mondelez International Incorporated Class A | | | | | | | | | | | 35,304 | | | | 1,552,670 | |
Tyson Foods Incorporated Class A | | | | | | | | | | | 78,357 | | | | 5,767,075 | |
| | | | |
| | | | | | | | | | | | | | | 7,319,745 | |
| | | | | | | | | | | | | | | | |
| | | | |
| Household Products: 1.21% | | | | | | | | | | | | | | | | |
The Clorox Company | | | | | | | | | | | 41,281 | | | | 5,410,701 | |
The Procter & Gamble Company | | | | | | | | | | | 42,031 | | | | 3,597,433 | |
| | | | |
| | | | | | | | | | | | | | | 9,008,134 | |
| | | | | | | | | | | | | | | | |
| | | | |
| Tobacco: 1.72% | | | | | | | | | | | | | | | | |
Altria Group Incorporated | | | | | | | | | | | 146,644 | | | | 9,927,799 | |
Philip Morris International | | | | | | | | | | | 28,774 | | | | 2,884,881 | |
| | | | |
| | | | | | | | | | | | | | | 12,812,680 | |
| | | | | | | | | | | | | | | | |
| | | | |
Energy: 7.20% | | | | | | | | | | | | | | | | |
| | | | |
| Energy Equipment & Services: 1.42% | | | | | | | | | | | | | | | | |
Baker Hughes Incorporated | | | | | | | | | | | 45,754 | | | | 2,188,414 | |
FMC Technologies Incorporated † | | | | | | | | | | | 148,156 | | | | 3,760,199 | |
Schlumberger Limited | | | | | | | | | | | 57,236 | | | | 4,608,643 | |
| | | | |
| | | | | | | | | | | | | | | 10,557,256 | |
| | | | | | | | | | | | | | | | |
| | | | |
| Oil, Gas & Consumable Fuels: 5.78% | | | | | | | | | | | | | | | | |
Chevron Corporation | | | | | | | | | | | 124,180 | | | | 12,725,966 | |
Devon Energy Corporation | | | | | | | | | | | 29,403 | | | | 1,125,547 | |
Exxon Mobil Corporation | | | | | | | | | | | 216,763 | | | | 19,281,069 | |
Marathon Oil Corporation | | | | | | | | | | | 46,500 | | | | 634,260 | |
Occidental Petroleum Corporation | | | | | | | | | | | 19,000 | | | | 1,419,870 | |
Tesoro Corporation | | | | | | | | | | | 20,083 | | | | 1,529,320 | |
Valero Energy Corporation | | | | | | | | | | | 120,291 | | | | 6,288,813 | |
| | | | |
| | | | | | | | | | | | | | | 43,004,845 | |
| | | | | | | | | | | | | | | | |
| | | | |
Financials: 15.51% | | | | | | | | | | | | | | | | |
| | | | |
| Banks: 4.17% | | | | | | | | | | | | | | | | |
Bank of America Corporation | | | | | | | | | | | 765,864 | | | | 11,097,369 | |
Citigroup Incorporated | | | | | | | | | | | 83,458 | | | | 3,656,295 | |
Fifth Third Bancorp | | | | | | | | | | | 82,127 | | | | 1,558,770 | |
JPMorgan Chase & Company | | | | | | | | | | | 89,627 | | | | 5,733,439 | |
KeyCorp | | | | | | | | | | | 117,106 | | | | 1,370,140 | |
Regions Financial Corporation | | | | | | | | | | | 626,056 | | | | 5,740,934 | |
SunTrust Banks Incorporated | | | | | | | | | | | 25,348 | | | | 1,071,967 | |
Zions Bancorporation | | | | | | | | | | | 28,500 | | | | 794,580 | |
| | | | |
| | | | | | | | | | | | | | | 31,023,494 | |
| | | | | | | | | | | | | | | | |
The accompanying notes are an integral part of these financial statements.
| | | | | | |
| Portfolio of investments—July 31, 2016 | | Wells Fargo Disciplined U.S. Core Fund | | | 13 | |
| | | | | | | | | | | | | | | | |
| Security name | | | | | | | | Shares | | | Value | |
| | | | |
| Capital Markets: 0.59% | | | | | | | | | | | | | | | | |
Bank of New York Mellon Corporation | | | | | | | | | | | 111,023 | | | $ | 4,374,306 | |
| | | | | | | | | | | | | | | | |
| | | | |
| Consumer Finance: 0.27% | | | | | | | | | | | | | | | | |
Capital One Financial Corporation | | | | | | | | | | | 29,976 | | | | 2,010,790 | |
| | | | | | | | | | | | | | | | |
| | | | |
| Diversified Financial Services: 1.45% | | | | | | | | | | | | | | | | |
Berkshire Hathaway Incorporated Class B † | | | | | | | | | | | 74,753 | | | | 10,784,615 | |
| | | | | | | | | | | | | | | | |
| | | | |
| Insurance: 3.75% | | | | | | | | | | | | | | | | |
AFLAC Incorporated | | | | | | | | | | | 64,402 | | | | 4,654,977 | |
Cincinnati Financial Corporation | | | | | | | | | | | 32,185 | | | | 2,404,220 | |
MetLife Incorporated | | | | | | | | | | | 167,580 | | | | 7,162,369 | |
Principal Financial Group Incorporated | | | | | | | | | | | 77,337 | | | | 3,606,224 | |
Prudential Financial Incorporated | | | | | | | | | | | 89,959 | | | | 6,773,013 | |
The Travelers Companies Incorporated | | | | | | | | | | | 16,219 | | | | 1,884,972 | |
Unum Group | | | | | | | | | | | 42,816 | | | | 1,430,483 | |
| | | | |
| | | | | | | | | | | | | | | 27,916,258 | |
| | | | | | | | | | | | | | | | |
| | | | |
| Real Estate Management & Development: 0.80% | | | | | | | | | | | | | | | | |
CBRE Group Incorporated Class A † | | | | | | | | | | | 208,549 | | | | 5,933,219 | |
| | | | | | | | | | | | | | | | |
| | | | |
| REITs: 4.48% | | | | | | | | | | | | | | | | |
American Tower Corporation | | | | | | | | | | | 65,366 | | | | 7,567,422 | |
Boston Properties Incorporated | | | | | | | | | | | 12,511 | | | | 1,778,188 | |
Crown Castle International Corporation | | | | | | | | | | | 23,463 | | | | 2,276,615 | |
General Growth Properties Incorporated | | | | | | | | | | | 137,891 | | | | 4,405,617 | |
Host Hotels & Resorts Incorporated | | | | | | | | | | | 135,719 | | | | 2,407,655 | |
Prologis Incorporated | | | | | | | | | | | 94,519 | | | | 5,150,340 | |
Simon Property Group Incorporated | | | | | | | | | | | 36,118 | | | | 8,200,231 | |
Vornado Realty Trust | | | | | | | | | | | 14,500 | | | | 1,557,300 | |
| | | | |
| | | | | | | | | | | | | | | 33,343,368 | |
| | | | | | | | | | | | | | | | |
| | | | |
Health Care: 15.18% | | | | | | | | | | | | | | | | |
| | | | |
| Biotechnology: 3.33% | | | | | | | | | | | | | | | | |
AbbVie Incorporated | | | | | | | | | | | 88,665 | | | | 5,872,283 | |
Amgen Incorporated | | | | | | | | | | | 56,802 | | | | 9,771,648 | |
Gilead Sciences Incorporated | | | | | | | | | | | 114,902 | | | | 9,131,262 | |
| | | | |
| | | | | | | | | | | | | | | 24,775,193 | |
| | | | | | | | | | | | | | | | |
| | | | |
| Health Care Equipment & Supplies: 1.82% | | | | | | | | | | | | | | | | |
Boston Scientific Corporation † | | | | | | | | | | | 184,621 | | | | 4,482,598 | |
Medtronic plc | | | | | | | | | | | 102,876 | | | | 9,015,024 | |
| | | | |
| | | | | | | | | | | | | | | 13,497,622 | |
| | | | | | | | | | | | | | | | |
| | | | |
| Health Care Providers & Services: 3.68% | | | | | | | | | | | | | | | | |
Aetna Incorporated | | | | | | | | | | | 38,643 | | | | 4,452,060 | |
AmerisourceBergen Corporation | | | | | | | | | | | 25,925 | | | | 2,208,551 | |
Express Scripts Holding Company † | | | | | | | | | | | 24,632 | | | | 1,873,756 | |
HCA Holdings Incorporated † | | | | | | | | | | | 26,582 | | | | 2,050,270 | |
The accompanying notes are an integral part of these financial statements.
| | | | |
| 14 | | Wells Fargo Disciplined U.S. Core Fund | | Portfolio of investments—July 31, 2016 |
| | | | | | | | | | | | | | | | |
| Security name | | | | | | | | Shares | | | Value | |
| | | | |
| Health Care Providers & Services (continued) | | | | | | | | | | | | | | | | |
McKesson Corporation | | | | | | | | | | | 37,778 | | | $ | 7,350,088 | |
UnitedHealth Group Incorporated | | | | | | | | | | | 66,141 | | | | 9,471,391 | |
| | | | |
| | | | | | | | | | | | | | | 27,406,116 | |
| | | | | | | | | | | | | | | | |
| | | | |
| Pharmaceuticals: 6.35% | | | | | | | | | | | | | | | | |
Bristol-Myers Squibb Company | | | | | | | | | | | 64,519 | | | | 4,826,666 | |
Johnson & Johnson | | | | | | | | | | | 151,367 | | | | 18,955,689 | |
Merck & Company Incorporated | | | | | | | | | | | 169,569 | | | | 9,946,918 | |
Pfizer Incorporated | | | | | | | | | | | 367,156 | | | | 13,544,385 | |
| | | | |
| | | | | | | | | | | | | | | 47,273,658 | |
| | | | | | | | | | | | | | | | |
| | | | |
Industrials: 9.18% | | | | | | | | | | | | | | | | |
| | | | |
| Aerospace & Defense: 1.87% | | | | | | | | | | | | | | | | |
General Dynamics Corporation | | | | | | | | | | | 23,873 | | | | 3,506,705 | |
Raytheon Company | | | | | | | | | | | 5,500 | | | | 767,415 | |
The Boeing Company | | | | | | | | | | | 55,462 | | | | 7,413,051 | |
United Technologies Corporation | | | | | | | | | | | 20,785 | | | | 2,237,505 | |
| | | | |
| | | | | | | | | | | | | | | 13,924,676 | |
| | | | | | | | | | | | | | | | |
| | | | |
| Air Freight & Logistics: 0.94% | | | | | | | | | | | | | | | | |
C.H. Robinson Worldwide Incorporated | | | | | | | | | | | 19,895 | | | | 1,385,090 | |
United Parcel Service Incorporated Class B | | | | | | | | | | | 51,860 | | | | 5,606,066 | |
| | | | |
| | | | | | | | | | | | | | | 6,991,156 | |
| | | | | | | | | | | | | | | | |
| | | | |
| Airlines: 1.64% | | | | | | | | | | | | | | | | |
Delta Air Lines Incorporated | | | | | | | | | | | 106,526 | | | | 4,127,883 | |
Southwest Airlines Company | | | | | | | | | | | 137,949 | | | | 5,105,492 | |
United Continental Holdings Incorporated † | | | | | | | | | | | 63,891 | | | | 2,995,849 | |
| | | | |
| | | | | | | | | | | | | | | 12,229,224 | |
| | | | | | | | | | | | | | | | |
| | | | |
| Commercial Services & Supplies: 0.71% | | | | | | | | | | | | | | | | |
Waste Management Incorporated | | | | | | | | | | | 79,725 | | | | 5,271,417 | |
| | | | | | | | | | | | | | | | |
| | | | |
| Construction & Engineering: 0.60% | | | | | | | | | | | | | | | | |
Jacobs Engineering Group Incorporated † | | | | | | | | | | | 54,986 | | | | 2,942,851 | |
Quanta Services Incorporated † | | | | | | | | | | | 59,821 | | | | 1,531,418 | |
| | | | |
| | | | | | | | | | | | | | | 4,474,269 | |
| | | | | | | | | | | | | | | | |
| | | | |
| Industrial Conglomerates: 1.97% | | | | | | | | | | | | | | | | |
3M Company | | | | | | | | | | | 13,396 | | | | 2,389,311 | |
General Electric Company | | | | | | | | | | | 394,658 | | | | 12,289,650 | |
| | | | |
| | | | | | | | | | | | | | | 14,678,961 | |
| | | | | | | | | | | | | | | | |
| | | | |
| Machinery: 1.28% | | | | | | | | | | | | | | | | |
Caterpillar Incorporated | | | | | | | | | | | 48,571 | | | | 4,019,736 | |
Illinois Tool Works Incorporated | | | | | | | | | | | 19,195 | | | | 2,215,103 | |
Parker-Hannifin Corporation | | | | | | | | | | | 18,757 | | | | 2,141,862 | |
The accompanying notes are an integral part of these financial statements.
| | | | | | |
| Portfolio of investments—July 31, 2016 | | Wells Fargo Disciplined U.S. Core Fund | | | 15 | |
| | | | | | | | | | | | | | | | |
| Security name | | | | | | | | Shares | | | Value | |
| | | | |
| Machinery (continued) | | | | | | | | | | | | | | | | |
Stanley Black & Decker Incorporated | | | | | | | | | | | 9,632 | | | $ | 1,172,214 | |
| | | | |
| | | | | | | | | | | | | | | 9,548,915 | |
| | | | | | | | | | | | | | | | |
| | | | |
| Professional Services: 0.17% | | | | | | | | | | | | | | | | |
Robert Half International Incorporated | | | | | | | | | | | 33,442 | | | | 1,221,971 | |
| | | | | | | | | | | | | | | | |
| | | | |
Information Technology: 20.93% | | | | | | | | | | | | | | | | |
| | | | |
| Communications Equipment: 1.58% | | | | | | | | | | | | | | | | |
Cisco Systems Incorporated | | | | | | | | | | | 384,321 | | | | 11,733,320 | |
| | | | | | | | | | | | | | | | |
| | | | |
| Internet Software & Services: 4.28% | | | | | | | | | | | | | | | | |
Alphabet Incorporated Class A † | | | | | | | | | | | 13,420 | | | | 10,619,783 | |
Alphabet Incorporated Class C † | | | | | | | | | | | 14,096 | | | | 10,836,864 | |
eBay Incorporated † | | | | | | | | | | | 74,834 | | | | 2,331,827 | |
Facebook Incorporated Class A † | | | | | | | | | | | 64,868 | | | | 8,039,740 | |
| | | | |
| | | | | | | | | | | | | | | 31,828,214 | |
| | | | | | | | | | | | | | | | |
| | | | |
| IT Services: 3.39% | | | | | | | | | | | | | | | | |
Accenture plc Class A | | | | | | | | | | | 21,837 | | | | 2,463,432 | |
International Business Machines Corporation | | | | | | | | | | | 35,155 | | | | 5,646,596 | |
Paychex Incorporated | | | | | | | | | | | 39,385 | | | | 2,334,743 | |
The Western Union Company | | | | | | | | | | | 178,248 | | | | 3,564,960 | |
Total System Services Incorporated | | | | | | | | | | | 98,881 | | | | 5,035,021 | |
Xerox Corporation | | | | | | | | | | | 601,578 | | | | 6,196,253 | |
| | | | |
| | | | | | | | | | | | | | | 25,241,005 | |
| | | | | | | | | | | | | | | | |
| | | | |
| Semiconductors & Semiconductor Equipment: 2.89% | | | | | | | | | | | | | | | | |
Intel Corporation | | | | | | | | | | | 338,159 | | | | 11,788,223 | |
Linear Technology Corporation | | | | | | | | | | | 45,158 | | | | 2,709,028 | |
NVIDIA Corporation | | | | | | | | | | | 122,801 | | | | 7,011,937 | |
| | | | |
| | | | | | | | | | | | | | | 21,509,188 | |
| | | | | | | | | | | | | | | | |
| | | | |
| Software: 4.04% | | | | | | | | | | | | | | | | |
Citrix Systems Incorporated † | | | | | | | | | | | 28,667 | | | | 2,555,090 | |
Microsoft Corporation | | | | | | | | | | | 382,935 | | | | 21,704,756 | |
Oracle Corporation | | | | | | | | | | | 141,000 | | | | 5,786,640 | |
| | | | |
| | | | | | | | | | | | | | | 30,046,486 | |
| | | | | | | | | | | | | | | | |
| | | | |
| Technology Hardware, Storage & Peripherals: 4.75% | | | | | | | | | | | | | | | | |
Apple Incorporated | | | | | | | | | | | 255,241 | | | | 26,598,665 | |
EMC Corporation | | | | | | | | | | | 72,605 | | | | 2,053,269 | |
HP Incorporated | | | | | | | | | | | 481,014 | | | | 6,739,006 | |
| | | | |
| | | | | | | | | | | | | | | 35,390,940 | |
| | | | | | | | | | | | | | | | |
| | | | |
Materials: 3.36% | | | | | | | | | | | | | | | | |
| | | | |
| Chemicals: 1.42% | | | | | | | | | | | | | | | | |
LyondellBasell Industries NV Class A | | | | | | | | | | | 59,381 | | | | 4,469,014 | |
The accompanying notes are an integral part of these financial statements.
| | | | |
| 16 | | Wells Fargo Disciplined U.S. Core Fund | | Portfolio of investments—July 31, 2016 |
| | | | | | | | | | | | | | | | |
| Security name | | | | | | | | Shares | | | Value | |
| | | | |
| Chemicals (continued) | | | | | | | | | | | | | | | | |
The Dow Chemical Company | | | | | | | | | | | 114,385 | | | $ | 6,139,043 | |
| | | | |
| | | | | | | | | | | | | | | 10,608,057 | |
| | | | | | | | | | | | | | | | |
| | | | |
| Containers & Packaging: 0.81% | | | | | | | | | | | | | | | | |
Avery Dennison Corporation | | | | | | | | | | | 77,613 | | | | 6,045,277 | |
| | | | | | | | | | | | | | | | |
| | | | |
| Metals & Mining: 1.13% | | | | | | | | | | | | | | | | |
Newmont Mining Corporation | | | | | | | | | | | 190,374 | | | | 8,376,456 | |
| | | | | | | | | | | | | | | | |
| | | | |
Telecommunication Services: 2.81% | | | | | | | | | | | | | | | | |
| | | | |
| Diversified Telecommunication Services: 2.81% | | | | | | | | | | | | | | | | |
AT&T Incorporated | | | | | | | | | | | 268,958 | | | | 11,643,192 | |
Verizon Communications Incorporated | | | | | | | | | | | 166,669 | | | | 9,235,129 | |
| | | | |
| | | | | | | | | | | | | | | 20,878,321 | |
| | | | | | | | | | | | | | | | |
| | | | |
Utilities: 3.14% | | | | | | | | | | | | | | | | |
| | | | |
| Electric Utilities: 2.77% | | | | | | | | | | | | | | | | |
American Electric Power Company Incorporated | | | | | | | | | | | 45,607 | | | | 3,160,565 | |
Edison International | | | | | | | | | | | 38,258 | | | | 2,960,404 | |
Exelon Corporation | | | | | | | | | | | 189,161 | | | | 7,051,922 | |
FirstEnergy Corporation | | | | | | | | | | | 162,883 | | | | 5,687,874 | |
Xcel Energy Incorporated | | | | | | | | | | | 39,543 | | | | 1,739,101 | |
| | | | |
| | | | | | | | | | | | | | | 20,599,866 | |
| | | | | | | | | | | | | | | | |
| | | | |
| Multi-Utilities: 0.37% | | | | | | | | | | | | | | | | |
Public Service Enterprise Group Incorporated | | | | | | | | | | | 60,965 | | | | 2,805,000 | |
| | | | | | | | | | | | | | | | |
| | | | |
Total Common Stocks (Cost $560,839,509) | | | | | | | | | | | | | | | 732,912,222 | |
| | | | | | | | | | | | | | | | |
| | | | |
| | | Yield | | | | | | | | | | |
| Short-Term Investments: 1.21% | | | | | | | | | | | | | | | | |
| | | | |
| Investment Companies: 1.21% | | | | | | | | | | | | | | | | |
Wells Fargo Government Money Market Fund Select Class (l)(u) | | | 0.32 | % | | | | | | | 8,990,434 | | | | 8,990,434 | |
| | | | | | | | | | | | | | | | |
| | | | |
Total Short-Term Investments (Cost $8,990,434) | | | | | | | | | | | | | | | 8,990,434 | |
| | | | | | | | | | | | | | | | |
| | | | | | | | |
| Total investments in securities (Cost $569,829,943) * | | | 99.70 | % | | | 741,902,656 | |
Other assets and liabilities, net | | | 0.30 | | | | 2,232,086 | |
| | | | | | | | |
| Total net assets | | | 100.00 | % | | $ | 744,134,742 | |
| | | | | | | | |
| † | Non-income-earning security |
| (l) | The issuer of the security is an affiliated person of the Fund as defined in the Investment Company Act of 1940. |
| (u) | The rate represents the 7-day annualized yield at period end. |
| * | Cost for federal income tax purposes is $571,760,319 and unrealized gains (losses) consists of: |
| | | | |
Gross unrealized gains | | $ | 181,153,430 | |
Gross unrealized losses | | | (11,011,093 | ) |
| | | | |
Net unrealized gains | | $ | 170,142,337 | |
The accompanying notes are an integral part of these financial statements.
| | | | | | |
| Statement of assets and liabilities—July 31, 2016 | | Wells Fargo Disciplined U.S. Core Fund | | | 17 | |
| | | | |
| | | | |
| |
Assets | | | | |
Investments | | | | |
In unaffiliated securities, at value (cost $560,839,509) | | $ | 732,912,222 | |
In affiliated securities, at value (cost $8,990,434) | | | 8,990,434 | |
| | | | |
Total investments, at value (cost $569,829,943) | | | 741,902,656 | |
Receivable for Fund shares sold | | | 2,211,842 | |
Receivable for dividends | | | 759,311 | |
Prepaid expenses and other assets | | | 75,232 | |
| | | | |
Total assets | | | 744,949,041 | |
| | | | |
| |
Liabilities | | | | |
Payable for Fund shares redeemed | | | 235,792 | |
Management fee payable | | | 196,939 | |
Distribution fees payable | | | 26,248 | |
Administration fees payable | | | 110,002 | |
Trustees’ fees and expenses payable | | | 48,358 | |
Shareholder servicing fees payable | | | 118,168 | |
Professional fees payable | | | 42,486 | |
Accrued expenses and other liabilities | | | 36,306 | |
| | | | |
Total liabilities | | | 814,299 | |
| | | | |
Total net assets | | $ | 744,134,742 | |
| | | | |
| |
NET ASSETS CONSIST OF | | | | |
Paid-in capital | | $ | 553,268,359 | |
Undistributed net investment income | | | 9,238,630 | |
Accumulated net realized gains on investments | | | 9,555,040 | |
Net unrealized gains on investments | | | 172,072,713 | |
| | | | |
Total net assets | | $ | 744,134,742 | |
| | | | |
| |
COMPUTATION OF NET ASSET VALUE AND OFFERING PRICE PER SHARE | | | | |
Net assets – Class A | | $ | 412,628,553 | |
Shares outstanding – Class A1 | | | 28,454,241 | |
Net asset value per share – Class A | | | $14.50 | |
Maximum offering price per share – Class A2 | | | $15.38 | |
Net assets – Class C | | $ | 46,800,830 | |
Shares outstanding – Class C1 | | | 3,478,356 | |
Net asset value per share – Class C | | | $13.45 | |
Net assets – Class R | | $ | 200,795 | |
Shares outstanding – Class R1 | | | 13,595 | |
Net asset value per share – Class R | | | $14.77 | |
Net assets – Class R6 | | $ | 4,023,725 | |
Shares outstanding – Class R61 | | | 270,840 | |
Net asset value per share – Class R6 | | | $14.86 | |
Net assets – Administrator Class | | $ | 116,807,214 | |
Shares outstanding – Administrator Class1 | | | 7,863,882 | |
Net asset value per share – Administrator Class | | | $14.85 | |
Net assets – Institutional Class | | $ | 163,673,625 | |
Shares outstanding – Institutional Class1 | | | 11,122,568 | |
Net asset value per share – Institutional Class | | | $14.72 | |
| 1 | The Fund has an unlimited number of authorized shares. |
| 2 | Maximum offering price is computed as 100/94.25 of net asset value. On investments of $50,000 or more, the offering price is reduced. |
The accompanying notes are an integral part of these financial statements.
| | | | |
| 18 | | Wells Fargo Disciplined U.S. Core Fund | | Statement of operations—year ended July 31, 2016 |
| | | | |
| | | | |
| |
Investment income | | | | |
Dividends | | $ | 14,171,113 | |
Income from affiliated securities | | | 27,446 | |
Securities lending income, net | | | 5,599 | |
| | | | |
Total investment income | | | 14,204,158 | |
| | | | |
| |
Expenses | | | | |
Management fee | | | 2,022,382 | |
Administration fees | | | | |
Class A | | | 725,700 | |
Class C | | | 62,644 | |
Class R | | | 55 | 1 |
Class R6 | | | 282 | 1 |
Administrator Class | | | 111,428 | |
Institutional Class | | | 150,463 | |
Shareholder servicing fees | | | | |
Class A | | | 863,928 | |
Class C | | | 74,576 | |
Class R | | | 66 | 1 |
Administrator Class | | | 209,685 | |
Distribution fees | | | | |
Class C | | | 223,727 | |
Class R | | | 66 | 1 |
Custody and accounting fees | | | 47,994 | |
Professional fees | | | 62,980 | |
Registration fees | | | 75,921 | |
Shareholder report expenses | | | 54,244 | |
Trustees’ fees and expenses | | | 33,600 | |
Interest expense | | | 1,658 | |
Other fees and expenses | | | 52,497 | |
| | | | |
Total expenses | | | 4,773,896 | |
Less: Fee waivers and/or expense reimbursements | | | (101,341 | ) |
| | | | |
Net expenses | | | 4,672,555 | |
| | | | |
Net investment income | | | 9,531,603 | |
| | | | |
| |
REALIZED AND UNREALIZED GAINS (LOSSES) ON INVESTMENTS | | | | |
Net realized gains on investments | | | 10,319,714 | |
Net change in unrealized gains (losses) on investments | | | 22,567,499 | |
| | | | |
Net realized and unrealized gains (losses) on investments | | | 32,887,213 | |
| | | | |
Net increase in net assets resulting from operations | | $ | 42,418,816 | |
| | | | |
| 1 | For the period from September 30, 2015 (commencement of class operations) to July 31, 2016 |
The accompanying notes are an integral part of these financial statements.
| | | | | | |
| Statement of changes in net assets | | Wells Fargo Disciplined U.S. Core Fund | | | 19 | |
| | | | | | | | | | | | | | | | |
| | | Year ended July 31, 2016 | | | Year ended July 31, 2015 | |
| | | |
Operations | | | | | | | | | | | | |
Net investment income | | | | | | $ | 9,531,603 | | | | | | | $ | 7,538,035 | |
Net realized gains on investments | | | | | | | 10,319,714 | | | | | | | | 49,570,546 | |
Net change in unrealized gains (losses) on investments | | | | | | | 22,567,499 | | | | | | | | (1,189,230 | ) |
| | | | |
Net increase in net assets resulting from operations | | | | | | | 42,418,816 | | | | | | | | 55,919,351 | |
| | | | |
| | | |
Distributions to shareholders from | | | | | | | | | | | | |
Net investment income | | | | | | | | | | | | | | | | |
Class A | | | | | | | (4,528,287 | ) | | | | | | | (3,522,119 | ) |
Class C | | | | | | | (257,661 | ) | | | | | | | (84,291 | ) |
Class R | | | | | | | (495 | )1 | | | | | | | N/A | |
Class R6 | | | | | | | (1,177 | )1 | | | | | | | N/A | |
Administrator Class | | | | | | | (1,187,160 | ) | | | | | | | (647,073 | ) |
Institutional Class | | | | | | | (1,510,103 | ) | | | | | | | (1,537,330 | ) |
Net realized gains | | | | | | | | | | | | | | | | |
Class A | | | | | | | (31,556,159 | ) | | | | | | | (46,161,619 | ) |
Class C | | | | | | | (2,500,322 | ) | | | | | | | (2,082,924 | ) |
Class R | | | | | | | (2,461 | )1 | | | | | | | N/A | |
Class R6 | | | | | | | (5,847 | )1 | | | | | | | N/A | |
Administrator Class | | | | | | | (6,952,701 | ) | | | | | | | (7,515,200 | ) |
Institutional Class | | | | | | | (8,572,495 | ) | | | | | | | (15,983,371 | ) |
| | | | |
Total distributions to shareholders | | | | | | | (57,074,868 | ) | | | | | | | (77,533,927 | ) |
| | | | |
| | | | |
Capital share transactions | | | Shares | | | | | | | | Shares | | | | | |
Proceeds from shares sold | | | | | | | | | | | | | | | | |
Class A | | | 9,125,390 | | | | 126,350,368 | | | | 2,148,617 | | | | 33,269,672 | |
Class C | | | 2,429,480 | | | | 31,365,592 | | | | 823,111 | | | | 12,057,914 | |
Class R | | | 13,383 | 1 | | | 196,826 | 1 | | | N/A | | | | N/A | |
Class R6 | | | 289,003 | 1 | | | 4,094,576 | 1 | | | N/A | | | | N/A | |
Administrator Class | | | 5,692,270 | | | | 79,570,117 | | | | 1,319,355 | | | | 20,847,005 | |
Institutional Class | | | 8,264,426 | | | | 115,262,034 | | | | 3,114,670 | | | | 50,079,007 | |
| | | | |
| | | | | | | 356,839,513 | | | | | | | | 116,253,598 | |
| | | | |
Reinvestment of distributions | | | | | | | | | | | | | | | | |
Class A | | | 2,569,607 | | | | 34,920,049 | | | | 3,224,975 | | | | 47,843,154 | |
Class C | | | 155,194 | | | | 1,959,119 | | | | 105,097 | | | | 1,464,972 | |
Class R | | | 212 | 1 | | | 2,956 | 1 | | | N/A | | | | N/A | |
Class R6 | | | 504 | 1 | | | 7,024 | 1 | | | N/A | | | | N/A | |
Administrator Class | | | 553,449 | | | | 7,715,022 | | | | 491,872 | | | | 7,465,466 | |
Institutional Class | | | 369,132 | | | | 5,097,050 | | | | 561,645 | | | | 8,449,624 | |
| | | | |
| | | | | | | 49,701,220 | | | | | | | | 65,223,216 | |
| | | | |
Payment for shares redeemed | | | | | | | | | | | | | | | | |
Class A | | | (4,670,412 | ) | | | (64,993,916 | ) | | | (2,705,765 | ) | | | (42,183,445 | ) |
Class C | | | (532,257 | ) | | | (7,048,689 | ) | | | (207,673 | ) | | | (3,079,680 | ) |
Class R6 | | | (18,667 | )1 | | | (273,006 | )1 | | | N/A | | | | N/A | |
Administrator Class | | | (2,402,412 | ) | | | (34,276,688 | ) | | | (832,349 | ) | | | (13,437,852 | ) |
Institutional Class | | | (4,530,382 | ) | | | (66,406,281 | ) | | | (2,190,447 | ) | | | (34,044,476 | ) |
| | | | |
| | | | | | | (172,998,580 | ) | | | | | | | (92,745,453 | ) |
| | | | |
Net increase in net assets resulting from capital share transactions | | | | | | | 233,542,153 | | | | | | | | 88,731,361 | |
| | | | |
Total increase in net assets | | | | | | | 218,886,101 | | | | | | | | 67,116,785 | |
| | | | |
| | |
Net assets | | | | | | | | |
Beginning of period | | | | | | | 525,248,641 | | | | | | | | 458,131,856 | |
| | | | |
End of period | | | | | | $ | 744,134,742 | | | | | | | $ | 525,248,641 | |
| | | | |
Undistributed net investment income | | | | | | $ | 9,238,630 | | | | | | | $ | 7,431,071 | |
| | | | |
| 1 | For the period from September 30, 2015 (commencement of class operations) to July 31, 2016 |
The accompanying notes are an integral part of these financial statements.
| | | | |
| 20 | | Wells Fargo Disciplined U.S. Core Fund | | Financial highlights |
(For a share outstanding throughout each period)
| | | | | | | | | | | | | | | | | | | | |
| | | Year ended July 31 | |
| CLASS A | | 2016 | | | 2015 | | | 2014 | | | 2013 | | | 2012 | |
Net asset value, beginning of period | | | $15.45 | | | | $16.29 | | | | $16.27 | | | | $14.65 | | | | $14.25 | |
Net investment income | | | 0.21 | | | | 0.21 | | | | 0.19 | | | | 0.24 | | | | 0.20 | |
Net realized and unrealized gains (losses) on investments | | | 0.47 | | | | 1.60 | | | | 2.35 | | | | 3.25 | | | | 0.93 | |
| | | | | | | | | | | | | | | | | | | | |
Total from investment operations | | | 0.68 | | | | 1.81 | | | | 2.54 | | | | 3.49 | | | | 1.13 | |
Distributions to shareholders from | | | | | | | | | | | | | | | | | | | | |
Net investment income | | | (0.19 | ) | | | (0.16 | ) | | | (0.24 | ) | | | (0.24 | ) | | | (0.23 | ) |
Net realized gains | | | (1.44 | ) | | | (2.49 | ) | | | (2.28 | ) | | | (1.63 | ) | | | (0.50 | ) |
| | | | | | | | | | | | | | | | | | | | |
Total distributions to shareholders | | | (1.63 | ) | | | (2.65 | ) | | | (2.52 | ) | | | (1.87 | ) | | | (0.73 | ) |
Net asset value, end of period | | | $14.50 | | | | $15.45 | | | | $16.29 | | | | $16.27 | | | | $14.65 | |
Total return1 | | | 5.22 | % | | | 12.01 | % | | | 17.00 | % | | | 26.62 | % | | | 8.54 | % |
Ratios to average net assets (annualized) | | | | | | | | | | | | | | | | | | | | |
Gross expenses | | | 0.87 | % | | | 0.89 | % | | | 0.93 | % | | | 0.94 | % | | | 0.92 | % |
Net expenses | | | 0.87 | % | | | 0.89 | % | | | 0.92 | % | | | 0.92 | % | | | 0.92 | % |
Net investment income | | | 1.60 | % | | | 1.43 | % | | | 1.27 | % | | | 1.66 | % | | | 1.43 | % |
Supplemental data | | | | | | | | | | | | | | | | | | | | |
Portfolio turnover rate | | | 52 | % | | | 53 | % | | | 71 | % | | | 64 | % | | | 82 | % |
Net assets, end of period (000s omitted) | | | $412,629 | | | | $331,123 | | | | $305,577 | | | | $285,780 | | | | $254,272 | |
| 1 | Total return calculations do not include any sales charges. |
The accompanying notes are an integral part of these financial statements.
| | | | | | |
| Financial highlights | | Wells Fargo Disciplined U.S. Core Fund | | | 21 | |
(For a share outstanding throughout each period)
| | | | | | | | | | | | | | | | | | | | |
| | | Year ended July 31 | |
| CLASS C | | 2016 | | | 2015 | | | 2014 | | | 2013 | | | 2012 | |
Net asset value, beginning of period | | | $14.50 | | | | $15.47 | | | | $15.58 | | | | $14.10 | | | | $13.69 | |
Net investment income | | | 0.14 | | | | 0.13 | | | | 0.08 | | | | 0.12 | | | | 0.09 | |
Net realized and unrealized gains (losses) on investments | | | 0.38 | | | | 1.48 | | | | 2.23 | | | | 3.12 | | | | 0.90 | |
| | | | | | | | | | | | | | | | | | | | |
Total from investment operations | | | 0.52 | | | | 1.61 | | | | 2.31 | | | | 3.24 | | | | 0.99 | |
Distributions to shareholders from | | | | | | | | | | | | | | | | | | | | |
Net investment income | | | (0.13 | ) | | | (0.09 | ) | | | (0.14 | ) | | | (0.13 | ) | | | (0.08 | ) |
Net realized gains | | | (1.44 | ) | | | (2.49 | ) | | | (2.28 | ) | | | (1.63 | ) | | | (0.50 | ) |
| | | | | | | | | | | | | | | | | | | | |
Total distributions to shareholders | | | (1.57 | ) | | | (2.58 | ) | | | (2.42 | ) | | | (1.76 | ) | | | (0.58 | ) |
Net asset value, end of period | | | $13.45 | | | | $14.50 | | | | $15.47 | | | | $15.58 | | | | $14.10 | |
Total return1 | | | 4.43 | % | | | 11.18 | % | | | 16.10 | % | | | 25.65 | % | | | 7.75 | % |
Ratios to average net assets (annualized) | | | | | | | | | | | | | | | | | | | | |
Gross expenses | | | 1.62 | % | | | 1.64 | % | | | 1.68 | % | | | 1.69 | % | | | 1.67 | % |
Net expenses | | | 1.62 | % | | | 1.64 | % | | | 1.67 | % | | | 1.67 | % | | | 1.67 | % |
Net investment income | | | 0.82 | % | | | 0.66 | % | | | 0.51 | % | | | 0.92 | % | | | 0.68 | % |
Supplemental data | | | | | | | | | | | | | | | | | | | | |
Portfolio turnover rate | | | 52 | % | | | 53 | % | | | 71 | % | | | 64 | % | | | 82 | % |
Net assets, end of period (000s omitted) | | | $46,801 | | | | $20,680 | | | | $10,913 | | | | $9,544 | | | | $8,590 | |
| 1 | Total return calculations do not include any sales charges. |
The accompanying notes are an integral part of these financial statements.
| | | | |
| 22 | | Wells Fargo Disciplined U.S. Core Fund | | Financial highlights |
(For a share outstanding throughout the period)
| | | | |
| CLASS R | | Year ended July 31, 20161 | |
Net asset value, beginning of period | | | $14.62 | |
Net investment income | | | 0.13 | 2 |
Net realized and unrealized gains (losses) on investments | | | 1.72 | |
| | | | |
Total from investment operations | | | 1.85 | |
Distributions to shareholders from | | | | |
Net investment income | | | (0.26 | ) |
Net realized gains | | | (1.44 | ) |
| | | | |
Total distributions to shareholders | | | (1.70 | ) |
Net asset value, end of period | | | $14.77 | |
Total return3 | | | 13.56 | % |
Ratios to average net assets (annualized) | | | | |
Gross expenses | | | 1.12 | % |
Net expenses | | | 1.12 | % |
Net investment income | | | 1.12 | % |
Supplemental data | | | | |
Portfolio turnover rate | | | 52 | % |
Net assets, end of period (000s omitted) | | | $201 | |
| 1 | For the period from September 30, 2015 (commencement of class operations) to July 31, 2016 |
| 2 | Calculated based upon average shares outstanding |
| 3 | Returns for periods of less than one year are not annualized. |
The accompanying notes are an integral part of these financial statements.
| | | | | | |
| Financial highlights | | Wells Fargo Disciplined U.S. Core Fund | | | 23 | |
(For a share outstanding throughout the period)
| | | | |
| CLASS R6 | | Year ended July 31, 20161 | |
Net asset value, beginning of period | | | $14.62 | |
Net investment income | | | 0.22 | 2 |
Net realized and unrealized gains (losses) on investments | | | 1.72 | |
| | | | |
Total from investment operations | | | 1.94 | |
Distributions to shareholders from | | | | |
Net investment income | | | (0.26 | ) |
Net realized gains | | | (1.44 | ) |
| | | | |
Total distributions to shareholders | | | (1.70 | ) |
Net asset value, end of period | | | $14.86 | |
Total return3 | | | 14.24 | % |
Ratios to average net assets (annualized) | | | | |
Gross expenses | | | 0.44 | % |
Net expenses | | | 0.43 | % |
Net investment income | | | 1.88 | % |
Supplemental data | | | | |
Portfolio turnover rate | | | 52 | % |
Net assets, end of period (000s omitted) | | | $4,024 | |
| 1 | For the period from September 30, 2015 (commencement of class operations) to July 31, 2016 |
| 2 | Calculated based upon average shares outstanding |
| 3 | Returns for periods of less than one year are not annualized. |
The accompanying notes are an integral part of these financial statements.
| | | | |
| 24 | | Wells Fargo Disciplined U.S. Core Fund | | Financial highlights |
(For a share outstanding throughout each period)
| | | | | | | | | | | | | | | | | | | | |
| | | Year ended July 31 | |
| ADMINISTRATOR CLASS | | 2016 | | | 2015 | | | 2014 | | | 2013 | | | 2012 | |
Net asset value, beginning of period | | | $15.80 | | | | $16.60 | | | | $16.47 | | | | $14.79 | | | | $14.36 | |
Net investment income | | | 0.24 | 1 | | | 0.25 | 1 | | | 0.25 | 1 | | | 0.28 | 1 | | | 0.23 | 1 |
Net realized and unrealized gains (losses) on investments | | | 0.48 | | | | 1.63 | | | | 2.35 | | | | 3.27 | | | | 0.93 | |
| | | | | | | | | | | | | | | | | | | | |
Total from investment operations | | | 0.72 | | | | 1.88 | | | | 2.60 | | | | 3.55 | | | | 1.16 | |
Distributions to shareholders from | | | | | | | | | | | | | | | | | | | | |
Net investment income | | | (0.23 | ) | | | (0.19 | ) | | | (0.19 | ) | | | (0.24 | ) | | | (0.23 | ) |
Net realized gains | | | (1.44 | ) | | | (2.49 | ) | | | (2.28 | ) | | | (1.63 | ) | | | (0.50 | ) |
| | | | | | | | | | | | | | | | | | | | |
Total distributions to shareholders | | | (1.67 | ) | | | (2.68 | ) | | | (2.47 | ) | | | (1.87 | ) | | | (0.73 | ) |
Net asset value, end of period | | | $14.85 | | | | $15.80 | | | | $16.60 | | | | $16.47 | | | | $14.79 | |
Total return | | | 5.36 | % | | | 12.20 | % | | | 17.12 | % | | | 26.82 | % | | | 8.72 | % |
Ratios to average net assets (annualized) | | | | | | | | | | | | | | | | | | | | |
Gross expenses | | | 0.78 | % | | | 0.74 | % | | | 0.76 | % | | | 0.78 | % | | | 0.75 | % |
Net expenses | | | 0.74 | % | | | 0.73 | % | | | 0.74 | % | | | 0.74 | % | | | 0.74 | % |
Net investment income | | | 1.71 | % | | | 1.58 | % | | | 1.56 | % | | | 1.87 | % | | | 1.63 | % |
Supplemental data | | | | | | | | | | | | | | | | | | | | |
Portfolio turnover rate | | | 52 | % | | | 53 | % | | | 71 | % | | | 64 | % | | | 82 | % |
Net assets, end of period (000s omitted) | | | $116,807 | | | | $63,544 | | | | $50,498 | | | | $127,384 | | | | $150,408 | |
| 1 | Calculated based upon average shares outstanding |
The accompanying notes are an integral part of these financial statements.
| | | | | | |
| Financial highlights | | Wells Fargo Disciplined U.S. Core Fund | | | 25 | |
(For a share outstanding throughout each period)
| | | | | | | | | | | | | | | | | | | | |
| | | Year ended July 31 | |
| INSTITUTIONAL CLASS | | 2016 | | | 2015 | | | 2014 | | | 2013 | | | 2012 | |
Net asset value, beginning of period | | | $15.66 | | | | $16.47 | | | | $16.43 | | | | $14.78 | | | | $14.39 | |
Net investment income | | | 0.28 | 1 | | | 0.30 | | | | 0.26 | 1 | | | 0.35 | | | | 0.26 | 1 |
Net realized and unrealized gains (losses) on investments | | | 0.47 | | | | 1.61 | | | | 2.37 | | | | 3.23 | | | | 0.93 | |
| | | | | | | | | | | | | | | | | | | | |
Total from investment operations | | | 0.75 | | | | 1.91 | | | | 2.63 | | | | 3.58 | | | | 1.19 | |
Distributions to shareholders from | | | | | | | | | | | | | | | | | | | | |
Net investment income | | | (0.25 | ) | | | (0.23 | ) | | | (0.31 | ) | | | (0.30 | ) | | | (0.30 | ) |
Net realized gains | | | (1.44 | ) | | | (2.49 | ) | | | (2.28 | ) | | | (1.63 | ) | | | (0.50 | ) |
| | | | | | | | | | | | | | | | | | | | |
Total distributions to shareholders | | | (1.69 | ) | | | (2.72 | ) | | | (2.59 | ) | | | (1.93 | ) | | | (0.80 | ) |
Net asset value, end of period | | | $14.72 | | | | $15.66 | | | | $16.47 | | | | $16.43 | | | | $14.78 | |
Total return | | | 5.64 | % | | | 12.55 | % | | | 17.48 | % | | | 27.16 | % | | | 9.02 | % |
Ratios to average net assets (annualized) | | | | | | | | | | | | | | | | | | | | |
Gross expenses | | | 0.54 | % | | | 0.47 | % | | | 0.50 | % | | | 0.51 | % | | | 0.49 | % |
Net expenses | | | 0.48 | % | | | 0.47 | % | | | 0.48 | % | | | 0.48 | % | | | 0.48 | % |
Net investment income | | | 1.96 | % | | | 1.86 | % | | | 1.63 | % | | | 2.08 | % | | | 1.80 | % |
Supplemental data | | | | | | | | | | | | | | | | | | | | |
Portfolio turnover rate | | | 52 | % | | | 53 | % | | | 71 | % | | | 64 | % | | | 82 | % |
Net assets, end of period (000s omitted) | | | $163,674 | | | | $109,901 | | | | $91,144 | | | | $1,875 | | | | $1,215 | |
| 1 | Calculated based upon average shares outstanding |
The accompanying notes are an integral part of these financial statements.
| | | | |
| 26 | | Wells Fargo Disciplined U.S. Core Fund | | Notes to financial statements |
1. ORGANIZATION
Wells Fargo Funds Trust (the “Trust”), a Delaware statutory trust organized on March 10, 1999, is an open-end management investment company registered under the Investment Company Act of 1940, as amended (the “1940 Act”). As an investment company, the Trust follows the accounting and reporting guidance in Financial Accounting Standards Board (“FASB”) Accounting Standards Codification Topic 946, Financial Services – Investment Companies. These financial statements report on the Wells Fargo Disciplined U.S. Core Fund (the “Fund”) which is a diversified series of the Trust.
2. SIGNIFICANT ACCOUNTING POLICIES
The following significant accounting policies, which are consistently followed in the preparation of the financial statements of the Fund, are in conformity with U.S. generally accepted accounting principles which require management to make estimates and assumptions that affect the reported amounts of assets and liabilities, disclosure of contingent assets and liabilities at the date of the financial statements, and the reported amounts of revenues and expenses during the reporting period. Actual results could differ from those estimates.
Securities valuation
All investments are valued each business day as of the close of regular trading on the New York Stock Exchange (generally 4 p.m. Eastern Time), although the Fund may deviate from this calculation time under unusual or unexpected circumstances.
Equity securities that are listed on a foreign or domestic exchange or market are valued at the official closing price or, if none, the last sales price. If no sale occurs on the principal exchange or market that day, the prior day’s price will be deemed “stale” and a fair value price will be determined in accordance with the Fund’s Valuation Procedures.
Investments in registered open-end investment companies are valued at net asset value. Interests in non-registered investment vehicles that are redeemable at net asset value are fair valued normally at net asset value.
Investments which are not valued using any of the methods discussed above are valued at their fair value, as determined in good faith by the Board of Trustees of the Fund. The Board of Trustees has established a Valuation Committee comprised of the Trustees and has delegated to it the authority to take any actions regarding the valuation of portfolio securities that the Valuation Committee deems necessary or appropriate, including determining the fair value of portfolio securities, unless the determination has been delegated to the Management Valuation Team of Wells Fargo Funds Management, LLC (“Funds Management”). The Board of Trustees retains the authority to make or ratify any valuation decisions or approve any changes to the Valuation Procedures as it deems appropriate. On a quarterly basis, the Board of Trustees receives reports on any valuation actions taken by the Valuation Committee or the Management Valuation Team which may include items for ratification.
Valuations of fair valued securities are compared to the next actual sales price when available, or other appropriate market values, to assess the continued appropriateness of the fair valuation methodologies used. These securities are fair valued on a day-to-day basis, taking into consideration changes to appropriate market information and any significant changes to the inputs considered in the valuation process until there is a readily available price provided on an exchange or by an independent pricing service. Valuations received from an independent pricing service or independent broker-dealer quotes are periodically validated by comparisons to most recent trades and valuations provided by other independent pricing services in addition to the review of prices by the manager and/or subadviser. Unobservable inputs used in determining fair valuations are identified based on the type of security, taking into consideration factors utilized by market participants in valuing the investment, knowledge about the issuer and the current market environment.
Security loans
The Fund may lend its securities from time to time in order to earn additional income in the form of fees or interest on securities received as collateral or the investment of any cash received as collateral. The Fund continues to receive interest or dividends on the securities loaned. The Fund receives collateral in the form of cash or securities with a value at least equal to the value of the securities on loan. The value of the loaned securities is determined at the close of each business day and any additional required collateral is delivered to the Fund on the next business day. In a securities lending transaction, the net asset value of the Fund will be affected by an increase or decrease in the value of the securities loaned and by an increase or decrease in the value of the instrument in which collateral is invested. The amount of securities lending activity undertaken by the Fund fluctuates from time to time. In the event of default or bankruptcy by the borrower, the Fund may be prevented from recovering the loaned securities or gaining access to the collateral or may experience delays or costs in doing so. In addition, the investment of any cash collateral received may lose all or part of its value. The Fund has the right under the lending agreement to recover the securities from the borrower on demand.
| | | | | | |
| Notes to financial statements | | Wells Fargo Disciplined U.S. Core Fund | | | 27 | |
The Fund lends its securities through an unaffiliated securities lending agent. Cash collateral received in connection with its securities lending transactions is invested in Securities Lending Cash Investments, LLC (the “Securities Lending Fund”). The Securities Lending Fund is exempt from registration under Section 3(c)(7) of the 1940 Act and is managed by Funds Management and is subadvised by Wells Capital Management Incorporated (“WellsCap”), an affiliate of Funds Management and an indirect wholly owned subsidiary of Wells Fargo & Company (“Wells Fargo”). Funds Management receives an advisory fee starting at 0.05% and declining to 0.01% as the average daily net assets of the Securities Lending Fund increase. All of the fees received by Funds Management are paid to WellsCap for its services as subadviser. The Securities Lending Fund seeks to provide a positive return compared to the daily Fed Funds Open rate by investing in high-quality, U.S. dollar-denominated short-term money market instruments. Securities Lending Fund investments are fair valued based upon the amortized cost valuation technique. Income earned from investment in the Securities Lending Fund is included in securities lending income on the Statement of Operations.
Security transactions and income recognition
Securities transactions are recorded on a trade date basis. Realized gains or losses are recorded on the basis of identified cost.
Dividend income is recognized on the ex-dividend date.
Distributions to shareholders
Distributions to shareholders from net investment income and net realized gains, if any, are recorded on the ex-dividend date. Such distributions are determined in conformity with federal income tax regulations, which may differ in amount or character from net investment income and realized gains recognized for purposes of U.S. generally accepted accounting principles.
Federal and other taxes
The Fund intends to continue to qualify as a regulated investment company by distributing substantially all of its investment company taxable income and any net realized capital gains (after reduction for capital loss carryforwards) sufficient to relieve it from all, or substantially all, federal income taxes. Accordingly, no provision for federal income taxes was required.
The Fund’s income and federal excise tax returns and all financial records supporting those returns for the prior three fiscal years are subject to examination by the federal and Delaware revenue authorities. Management has analyzed the Fund’s tax positions taken on federal, state, and foreign tax returns for all open tax years and does not believe that there are any uncertain tax positions that require recognition of a tax liability.
Reclassifications are made to the Fund’s capital accounts for permanent tax differences to reflect income and gains available for distribution (or available capital loss carryforwards) under federal income tax regulations. U.S. generally accepted accounting principles require that certain components of net assets be adjusted to reflect permanent differences between financial and tax reporting. These reclassifications have no effect on net assets or net asset values per share. At July 31, 2016, as a result of permanent book-to-tax differences, the following reclassification adjustments were made on the Statement of Assets and Liabilities:
| | | | |
| Paid-in capital | | Undistributed net investment income | | Accumulated net
realized gains
on investments |
| $1,664 | | $(239,161) | | $237,497 |
Class allocations
The separate classes of shares offered by the Fund differ principally in applicable sales charges, distribution, shareholder servicing, and administration fees. Class specific expenses are charged directly to that share class. Investment income, common expenses, and realized and unrealized gains (losses) on investments are allocated daily to each class of shares based on the relative proportion of net assets of each class.
3. FAIR VALUATION MEASUREMENTS
Fair value measurements of investments are determined within a framework that has established a fair value hierarchy based upon the various data inputs utilized in determining the value of the Fund’s investments. The three-level hierarchy gives the highest priority to unadjusted quoted prices in active markets for identical assets or liabilities (Level 1) and the lowest priority to significant unobservable inputs (Level 3). The Fund’s investments are classified within the fair value hierarchy based on the lowest level of input that is significant to the fair value measurement. The inputs are summarized into three broad levels as follows:
| | | | |
| 28 | | Wells Fargo Disciplined U.S. Core Fund | | Notes to financial statements |
| n | | Level 1 – quoted prices in active markets for identical securities |
| n | | Level 2 – other significant observable inputs (including quoted prices for similar securities, interest rates, prepayment speeds, credit risk, use of amortized cost, etc.) |
| n | | Level 3 – significant unobservable inputs (including the Fund’s own assumptions in determining the fair value of investments) |
The inputs or methodologies used for valuing investments in securities are not necessarily an indication of the risk associated with investing in those securities.
The following is a summary of the inputs used in valuing the Fund’s assets and liabilities as of July 31, 2016:
| | | | | | | | | | | | | | | | |
| | | Quoted prices
(Level 1) | | | Other significant
observable inputs
(Level 2) | | | Significant
unobservable inputs
(Level 3) | | | Total | |
Assets | | | | | | | | | | | | | | | | |
Investments in: | | | | | | | | | | | | | | | | |
| | | | |
Common stocks | | | | | | | | | | | | | | | | |
Consumer discretionary | | $ | 85,561,410 | | | $ | 0 | | | $ | 0 | | | $ | 85,561,410 | |
Consumer staples | | | 72,047,353 | | | | 0 | | | | 0 | | | | 72,047,353 | |
Energy | | | 53,562,101 | | | | 0 | | | | 0 | | | | 53,562,101 | |
Financials | | | 115,386,050 | | | | 0 | | | | 0 | | | | 115,386,050 | |
Health care | | | 112,952,589 | | | | 0 | | | | 0 | | | | 112,952,589 | |
Industrials | | | 68,340,589 | | | | 0 | | | | 0 | | | | 68,340,589 | |
Information technology | | | 155,749,153 | | | | 0 | | | | 0 | | | | 155,749,153 | |
Materials | | | 25,029,790 | | | | 0 | | | | 0 | | | | 25,029,790 | |
Telecommunications | | | 20,878,321 | | | | 0 | | | | 0 | | | | 20,878,321 | |
Utilities | | | 23,404,866 | | | | 0 | | | | 0 | | | | 23,404,866 | |
| | | | |
Short-term investments | | | | | | | | | | | | | | | | |
Investment companies | | | 8,990,434 | | | | 0 | | | | 0 | | | | 8,990,434 | |
Total assets | | $ | 741,902,656 | | | $ | 0 | | | $ | 0 | | | $ | 741,902,656 | |
The Fund recognizes transfers between levels within the fair value hierarchy at the end of the reporting period. At July 31, 2016, the Fund did not have any transfers into/out of Level 1, Level 2, or Level 3.
4. TRANSACTIONS WITH AFFILIATES
Management fee
Funds Management, an indirect wholly owned subsidiary of Wells Fargo, is the manager of the Fund and provides advisory and fund-level administrative services under an investment management agreement. Under the investment management agreement, Funds Management is responsible for, among other services, implementing the investment objectives and strategies of the Fund, supervising the subadviser, providing fund-level administrative services in connection with the Fund’s operations, and providing any other fund-level administrative services reasonably necessary for the operation of the Fund. As compensation for its services under the investment management agreement, Funds Management is entitled to receive an annual management fee starting at 0.35% and declining to 0.28% as the average daily net assets of the Fund increase. For the year ended July 31, 2016, the management fee was equivalent to an annual rate of 0.35% of the Fund’s average daily net assets.
Funds Management has retained the services of a subadviser to provide daily portfolio management to the Fund. The fee for subadvisory services is borne by Funds Management. Golden Capital Management, LLC, an affiliate of Funds Management and an indirect wholly owned subsidiary of Wells Fargo, is the subadviser to the Fund and is entitled to receive a fee from Funds Management at an annual rate starting at 0.25% and declining to 0.15% as the average daily net assets of the Fund increase.
| | | | | | |
| Notes to financial statements | | Wells Fargo Disciplined U.S. Core Fund | | | 29 | |
Administration fees
Under a class-level administration agreement, Funds Management provides class-level administrative services to the Fund, which includes paying fees and expenses for services provided by the transfer agent, sub-transfer agents, omnibus account servicers and record-keepers. As compensation for its services under the class-level administration agreement, Funds Management receives an annual fee which is calculated based on the average daily net assets of each class as follows:
| | | | |
| | | Class-level
administration fee | |
Class A, Class C, Class R | | | 0.21 | % |
Class R6 | | | 0.03 | |
Administrator Class, Institutional Class | | | 0.13 | |
Funds Management has contractually waived and/or reimbursed management and administration fees to the extent necessary to maintain certain net operating expense ratios for the Fund. Waiver of fees and/or reimbursement of expenses by Funds Management were made first from fund level expenses on a proportionate basis and then from class specific expenses. Funds Management has committed through November 30, 2016 to waive fees and/or reimburse expenses to the extent necessary to cap the Fund’s expenses at 0.92% for Class A shares, 1.67% for Class C shares, 1.17% for Class R shares, 0.43% for Class R6 shares, 0.74% for Administrator Class shares, and 0.48% for Institutional Class shares. After this time, the cap may be increased or the commitment to maintain the cap may be terminated only with the approval of the Board of Trustees.
Distribution fees
The Trust has adopted a distribution plan for Class C and Class R shares of the Fund pursuant to Rule 12b-1 under the 1940 Act. Distribution fees are charged to Class C and Class R shares and paid to Wells Fargo Funds Distributor, LLC (“Funds Distributor”), the principal underwriter, at an annual rate of 0.75% of the average daily net assets of Class C shares and 0.25% of the average daily net assets of Class R shares.
In addition, Funds Distributor is entitled to receive the front-end sales charge from the purchase of Class A shares and a contingent deferred sales charge on the redemption of certain Class A shares. Funds Distributor is also entitled to receive the contingent deferred sales charges from redemptions of Class C shares. For the year ended July 31, 2016, Funds Distributor received $57,868 from the sale of Class A shares and $434, in contingent deferred sales charges from redemptions of Class C shares.
Shareholder servicing fees
The Trust has entered into contracts with one or more shareholder servicing agents, whereby Class A, Class C, Class R, and Administrator Class of the Fund are charged a fee at an annual rate of 0.25% of the average daily net assets of each respective class.
A portion of these total shareholder servicing fees were paid to affiliates of Wells Fargo.
5. INVESTMENT PORTFOLIO TRANSACTIONS
Purchases and sales of investments, excluding U.S. government obligations (if any) and short-term securities, for the year ended July 31, 2016 were $478,305,949 and $299,169,103, respectively.
The Fund may purchase or sell investment securities to other Wells Fargo funds under procedures adopted by the Board of Trustees. The procedures have been designed to ensure that these interfund transactions, which generally do not incur broker commissions, are effected at current market prices. Interfund trades are included within the respective purchases and sales amounts shown.
6. BANK BORROWINGS
The Trust (excluding the money market funds and certain other funds) and Wells Fargo Variable Trust are parties to a $200,000,000 revolving credit agreement whereby the Fund is permitted to use bank borrowings for temporary or emergency purposes, such as to fund shareholder redemption requests. Interest under the credit agreement is charged to the Fund based on a borrowing rate equal to the higher of the Federal Funds rate in effect on that day plus 1.25% or the overnight LIBOR rate in effect on that day plus 1.25%. In addition, an annual commitment fee equal to 0.20% of the unused balance is allocated to each participating fund. Prior to September 1, 2015, the revolving credit agreement amount was $150,000,000 and the annual commitment fee was equal to 0.10% of the unused balance which was allocated to each participating fund.
| | | | |
| 30 | | Wells Fargo Disciplined U.S. Core Fund | | Notes to financial statements |
During the year ended July 31, 2016, the Fund had average borrowings outstanding of $119,281 at an average rate of 1.39% and paid interest in the amount of $1,658.
7. DISTRIBUTIONS TO SHAREHOLDERS
The tax character of distributions paid during the years ended July 31, 2016 and July 31, 2015 were as follows:
| | | | | | | | |
| | | Year ended July 31 | |
| | | 2016 | | | 2015 | |
Ordinary income | | $ | 14,963,940 | | | $ | 19,437,900 | |
Long-term capital gain | | | 42,110,928 | | | | 58,096,027 | |
As of July 31, 2016, the components of distributable earnings on a tax basis were as follows:
| | | | |
Undistributed ordinary income | | Undistributed long-term gain | | Unrealized gains |
| $9,286,853 | | $11,485,416 | | $170,142,337 |
8. INDEMNIFICATION
Under the Trust’s organizational documents, the officers and Trustees have been granted certain indemnification rights against certain liabilities that may arise out of performance of their duties to the Trust. Additionally, in the normal course of business, the Trust may enter into contracts with service providers that contain a variety of indemnification clauses. The Trust’s maximum exposure under these arrangements is dependent on future claims that may be made against the Fund and, therefore, cannot be estimated.
| | | | | | |
| Report of independent registered public accounting firm | | Wells Fargo Disciplined U.S. Core Fund | | | 31 | |
BOARD OF TRUSTEES AND SHAREHOLDERS OF WELLS FARGO FUNDS TRUST:
We have audited the accompanying statements of assets and liabilities, including the portfolio of investments, of the Wells Fargo Disciplined U.S. Core Fund (formerly known as Wells Fargo Advantage Disciplined U.S. Core Fund) (the “Fund”), one of the funds constituting the Wells Fargo Funds Trust, as of July 31, 2016, and the related statement of operations for the year then ended, the statements of changes in net assets for each of the years in the two-year period then ended, and the financial highlights for each of the years or periods in the five-year period then ended. These financial statements and financial highlights are the responsibility of the Fund’s management. Our responsibility is to express an opinion on these financial statements and financial highlights based on our audits.
We conducted our audits in accordance with the standards of the Public Company Accounting Oversight Board (United States). Those standards require that we plan and perform the audit to obtain reasonable assurance about whether the financial statements and financial highlights are free of material misstatement. An audit includes examining, on a test basis, evidence supporting the amounts and disclosures in the financial statements. Our procedures included confirmation of securities owned as of July 31, 2016, by correspondence with the custodian, or by other appropriate auditing procedures. An audit also includes assessing the accounting principles used and significant estimates made by management, as well as evaluating the overall financial statement presentation. We believe that our audits provide a reasonable basis for our opinion.
In our opinion, the financial statements and financial highlights referred to above present fairly, in all material respects, the financial position of the Wells Fargo Disciplined U.S. Core Fund as of July 31, 2016, the results of its operations for the year then ended, the changes in its net assets for each of the years in the two-year period then ended, and the financial highlights for each of the years or periods in the five-year period then ended, in conformity with U.S. generally accepted accounting principles.

Boston, Massachusetts
September 23, 2016
| | | | |
| 32 | | Wells Fargo Disciplined U.S. Core Fund | | Other information (unaudited) |
TAX INFORMATION
For corporate shareholders, pursuant to Section 854 of the Internal Revenue Code, 66.77% of ordinary income dividends qualify for the corporate dividends-received deduction for the fiscal year ended July 31, 2016.
Pursuant to Section 852 of the Internal Revenue Code, $42,110,928 was designated as a 20% rate gain distribution for the fiscal year ended July 31, 2016.
Pursuant to Section 854 of the Internal Revenue Code, $10,252,643 of income dividends paid during the fiscal year ended July 31, 2016 has been designated as qualified dividend income (QDI).
For the fiscal year ended July 31, 2016, $7,479,004 has been designated as short-term capital gain dividends for nonresident alien shareholders pursuant to Section 871 of the Internal Revenue Code.
PORTFOLIO HOLDINGS INFORMATION
The complete portfolio holdings for the Fund are publicly available monthly on the Fund’s website (wellsfargofunds.com), on a one-month delayed basis. In addition, top ten holdings information (excluding derivative positions) for the Fund is publicly available on the Fund’s website on a monthly, seven-day or more delayed basis. The Fund files its complete schedule of portfolio holdings with the SEC for the first and third quarters of each fiscal year on Form N-Q, which is available by visiting the SEC website at sec.gov. In addition, the Fund’s Form N-Q may be reviewed and copied at the SEC’s Public Reference Room in Washington, DC, and at regional offices in New York City, at 233 Broadway, and in Chicago, at 175 West Jackson Boulevard, Suite 900. Information about the Public Reference Room may be obtained by calling 1-800-SEC-0330.
PROXY VOTING INFORMATION
A description of the policies and procedures that the Fund uses to determine how to vote proxies relating to portfolio securities is available, upon request, by calling 1-800-222-8222, visiting our website at wellsfargofunds.com, or visiting the SEC website at sec.gov. Information regarding how the Fund voted proxies relating to portfolio securities during the most recent 12-month period ended June 30 is available on the Fund’s website at wellsfargofunds.com or by visiting the SEC website at sec.gov.
| | | | | | |
| Other information (unaudited) | | Wells Fargo Disciplined U.S. Core Fund | | | 33 | |
BOARD OF TRUSTEES AND OFFICERS
Each of the Trustees and Officers1 listed in the table below acts in identical capacities for each fund in the Wells Fargo family of funds, which consists of 139 mutual funds comprising the Wells Fargo Funds Trust, Wells Fargo Variable Trust, Wells Fargo Master Trust and four closed-end funds (collectively the “Fund Complex”). This table should be read in conjunction with the Prospectus and the Statement of Additional Information2. The mailing address of each Trustee and Officer is 525 Market Street, 12th Floor, San Francisco, CA 94105. Each Trustee and Officer serves an indefinite term, however, each Trustee serves such term until reaching the mandatory retirement age established by the Trustees.
Independent Trustees
| | | | | | |
Name and
year of birth | | Position held and
length of service* | | Principal occupations during past five years or longer | | Current other
public company or
investment company
directorships |
| William R. Ebsworth (Born 1957) | | Trustee, since 2015 | | Retired. From 1984 to 2013, equities analyst, portfolio manager, research director and chief financial officer at Fidelity Management and Research Company in Boston, Tokyo, and Hong Kong and retired in 2013 as Chief Investment Officer of Fidelity Strategic Advisers, Inc. where he lead a team of investment professionals managing client assets. Prior thereto, Board member of Hong Kong Securities Clearing Co., Hong Kong Options Clearing Corp., the Thailand International Fund, Ltd., Fidelity Investments Life Insurance Company, and Empire Fidelity Investments Life Insurance Company. Mr. Ebsworth is a CFA® charterholder and an Adjunct Lecturer, Finance, at Babson College. | | Asset Allocation Trust |
| Jane A. Freeman (Born 1953) | | Trustee, since 2015 | | Retired. From 2012 to 2014 and 1999 to 2008, Chief Financial Officer of Scientific Learning Corporation. From 2008 to 2012, Ms. Freeman provided consulting services related to strategic business projects. Prior to 1999, Portfolio Manager at Rockefeller & Co. and Scudder, Stevens & Clark. Board member of the Harding Loevner Funds from 1996 to 2014, serving as both Lead Independent Director and chair of the Audit Committee. Board member of the Russell Exchange Traded Funds Trust from 2011 to 2012 and the chair of the Audit Committee. Ms. Freeman is Chair of Taproot Foundation (non-profit organization), a Board Member of Ruth Bancroft Garden (non-profit organization) and an inactive chartered financial analyst. | | Asset Allocation Trust |
| Peter G. Gordon (Born 1942) | | Trustee, since 1998; Chairman, since 2005 | | Co-Founder, Retired Chairman, President and CEO of Crystal Geyser Water Company. Trustee Emeritus, Colby College. | | Asset Allocation Trust |
| Isaiah Harris, Jr. (Born 1952) | | Trustee, since 2009 | | Retired. Chairman of the Board of CIGNA Corporation since 2009, and Director since 2005. From 2003 to 2011, Director of Deluxe Corporation. Prior thereto, President and CEO of BellSouth Advertising and Publishing Corp. from 2005 to 2007, President and CEO of BellSouth Enterprises from 2004 to 2005 and President of BellSouth Consumer Services from 2000 to 2003. Emeritus member of the Iowa State University Foundation Board of Governors. Emeritus Member of the Advisory Board of Iowa State University School of Business. Advisory Board Member, Palm Harbor Academy (charter school). Advisory Board Member, Child Evangelism Fellowship (non-profit). Mr. Harris is a certified public accountant (inactive status). | | CIGNA Corporation; Asset Allocation Trust |
| Judith M. Johnson (Born 1949) | | Trustee, since 2008; Audit Committee Chairman, since 2008 | | Retired. Prior thereto, Chief Executive Officer and Chief Investment Officer of Minneapolis Employees Retirement Fund from 1996 to 2008. Ms. Johnson is an attorney, certified public accountant and a certified managerial accountant. | | Asset Allocation Trust |
| David F. Larcker (Born 1950) | | Trustee, since 2009 | | James Irvin Miller Professor of Accounting at the Graduate School of Business, Stanford University, Director of the Corporate Governance Research Initiative and Senior Faculty of The Rock Center for Corporate Governance since 2006. From 2005 to 2008, Professor of Accounting at the Graduate School of Business, Stanford University. Prior thereto, Ernst & Young Professor of Accounting at The Wharton School, University of Pennsylvania from 1985 to 2005. | | Asset Allocation Trust |
| | | | |
| 34 | | Wells Fargo Disciplined U.S. Core Fund | | Other information (unaudited) |
| | | | | | |
Name and
year of birth | | Position held and
length of service* | | Principal occupations during past five years or longer | | Current other
public company or
investment company
directorships |
| Olivia S. Mitchell (Born 1953) | | Trustee, since 2006 | | International Foundation of Employee Benefit Plans Professor, Wharton School of the University of Pennsylvania since 1993. Director of Wharton’s Pension Research Council and Boettner Center on Pensions & Retirement Research, and Research Associate at the National Bureau of Economic Research. Previously, Cornell University Professor from 1978 to 1993. | | Asset Allocation Trust |
| Timothy J. Penny (Born 1951) | | Trustee, since 1996 | | President and Chief Executive Officer of Southern Minnesota Initiative Foundation, a non-profit organization, since 2007 and Senior Fellow at the Humphrey Institute Policy Forum at the University of Minnesota since 1995. Member of the Board of Trustees of NorthStar Education Finance, Inc., a non-profit organization, since 2007. | | Asset Allocation Trust |
| Michael S. Scofield (Born 1943) | | Trustee, since 2010 | | Served on the Investment Company Institute’s Board of Governors and Executive Committee from 2008-2011 as well the Governing Council of the Independent Directors Council from 2006-2011 and the Independent Directors Council Executive Committee from 2008-2011. Chairman of the IDC from 2008-2010. Institutional Investor (Fund Directions) Trustee of Year in 2007. Trustee of the Evergreen Funds complex (and its predecessors) from 1984 to 2010. Chairman of the Evergreen Funds from 2000-2010. Former Trustee of the Mentor Funds. Retired Attorney, Law Offices of Michael S. Scofield. | | Asset Allocation Trust |
| * | Length of service dates reflect the Trustee’s commencement of service with the Trust’s predecessor entities, where applicable. |
Officers
| | | | | | |
Name and
year of birth | | Position held and
length of service | | Principal occupations during past five years or longer | | |
| Karla M. Rabusch (Born 1959) | | President, since 2003 | | Executive Vice President of Wells Fargo Bank, N.A. and President of Wells Fargo Funds Management, LLC since 2003. | | |
| Jeremy DePalma1 (Born 1974) | | Treasurer, since 2012 | | Senior Vice President of Wells Fargo Funds Management, LLC since 2009. Senior Vice President of Evergreen Investment Management Company, LLC from 2008 to 2010 and head of the Fund Reporting and Control Team within Fund Administration from 2005 to 2010. | | |
| C. David Messman (Born 1960) | | Secretary, since 2000; Chief Legal Officer, since 2003 | | Senior Vice President and Secretary of Wells Fargo Funds Management, LLC since 2001. Assistant General Counsel of Wells Fargo Bank, N.A. since 2013 and Vice President and Managing Counsel of Wells Fargo Bank, N.A. from 1996 to 2013. | | |
| Michael Whitaker (Born 1967) | | Chief Compliance Officer, since 2016* | | Executive Vice President of Wells Fargo Funds Management, LLC since 2016. Chief Compliance Officer of Fidelity’s Fixed Income Funds and Asset Allocation Funds from 2008 to 2016, Compliance Officer of FMR Co., Inc. from 2014 to 2016, Fidelity Investments Money Management, Inc. from 2014 to 2016, Fidelity Investments from 2007 to 2016. | | |
| David Berardi (Born 1975) | | Assistant Treasurer, since 2009 | | Vice President of Wells Fargo Funds Management, LLC since 2009. Vice President of Evergreen Investment Management Company, LLC from 2008 to 2010. Manager of Fund Reporting and Control for Evergreen Investment Management Company, LLC from 2004 to 2010. | | |
| 1 | Jeremy DePalma acts as Treasurer of 68 funds and Assistant Treasurer of 71 funds in the Fund Complex. |
| 2 | The Statement of Additional Information includes additional information about the Trustees and is available, without charge, upon request, by calling 1-800-222-8222 or by visiting the website at wellsfargofunds.com. |
| * | Michael Whitaker became Chief Compliance Officer effective May 16, 2016. |
| | | | | | |
| Other information (unaudited) | | Wells Fargo Disciplined U.S. Core Fund | | | 35 | |
BOARD CONSIDERATION OF INVESTMENT MANAGEMENT AND SUB-ADVISORY AGREEMENTS:
Under the Investment Company Act of 1940 (the “1940 Act”), the Board of Trustees (the “Board”) of Wells Fargo Funds Trust (the “Trust”) must determine annually whether to approve the continuation of the Trust’s investment management and sub-advisory agreements. In this regard, at an in-person meeting held on May 24-25, 2016 (the “Meeting”), the Board, all the members of which have no direct or indirect interest in the investment management and sub-advisory agreements and are not “interested persons” of the Trust, as defined in the 1940 Act (the “Independent Trustees”), reviewed and approved for Wells Fargo Disciplined U.S. Core Fund (the “Fund”): (i) an investment management agreement (the “Management Agreement”) with Wells Fargo Funds Management, LLC (“Funds Management”); and (ii) an investment sub-advisory agreement (the “Sub-Advisory Agreement”) with Golden Capital Management, LLC (the “Sub-Adviser”), an affiliate of Funds Management. The Management Agreement and the Sub-Advisory Agreement are collectively referred to as the “Advisory Agreements.”
At the Meeting, the Board considered the factors and reached the conclusions described below relating to the selection of Funds Management and the Sub-Adviser and the approval of the Advisory Agreements. Prior to the Meeting, including at an in-person meeting in April 2016, the Trustees conferred extensively among themselves and with representatives of Funds Management about these matters. Also, the Board has adopted a team-based approach, with each team consisting of a sub-set of Trustees, to assist the full Board in the discharge of its duties in reviewing performance and other matters throughout the year. The Independent Trustees were assisted in their evaluation of the Advisory Agreements by independent legal counsel, from whom they received separate legal advice and with whom they met separately.
In providing information to the Board, Funds Management and the Sub-Adviser were guided by a detailed set of requests for information submitted to them by independent legal counsel on behalf of the Independent Trustees at the start of the Board’s annual contract renewal process earlier in 2016. In considering and approving the Advisory Agreements, the Trustees considered the information they believed relevant, including but not limited to the information discussed below. The Board considered not only the specific information presented in connection with the Meeting, but also the knowledge gained over time through interaction with Funds Management and the Sub-Adviser about various topics. In this regard, the Board reviewed reports of Funds Management at each of its quarterly meetings, which included, among other things, portfolio reviews and performance reports. In addition, the Board and the teams mentioned above confer with portfolio managers at various times throughout the year. The Board did not identify any particular information or consideration that was all-important or controlling, and each individual Trustee may have attributed different weights to various factors.
After its deliberations, the Board unanimously approved the continuation of the Advisory Agreements for a one-year term and determined that the compensation payable to Funds Management and the Sub-Adviser under each of the Advisory Agreements was reasonable. The Board considered the approval of the Advisory Agreements for the Fund as part of its consideration of agreements for funds across the complex, but its approvals were made on a fund-by-fund basis. The following summarizes a number of important, but not necessarily all, factors considered by the Board in support of its approvals.
Nature, extent and quality of services
The Board received and considered various information regarding the nature, extent and quality of services provided to the Fund by Funds Management and the Sub-Adviser under the Advisory Agreements. This information included a description of the investment advisory services and Fund-level administrative services covered by the Management Agreement, as well as, among other things, a summary of the background and experience of senior management of Funds Management, and the qualifications, background, tenure and responsibilities of each of the portfolio managers primarily responsible for the day-to-day portfolio management of the Fund.
The Board evaluated the ability of Funds Management and the Sub-Adviser to attract and retain qualified investment professionals, including research, advisory and supervisory personnel. The Board further considered the compliance programs and compliance records of Funds Management and the Sub-Adviser. In addition, the Board took into account the full range of services provided to the Fund by Funds Management and its affiliates.
Fund performance and expenses
The Board considered the performance results for the Fund over various time periods ended December 31, 2015. The Board considered these results in comparison to the performance of funds in a universe that was determined by Broadridge Inc. (“Broadridge”) to be similar to the Fund (the “Universe”), and in comparison to the Fund’s benchmark index and to other comparative data. Broadridge is an independent provider of investment company data. The Board received a description of the methodology used by Broadridge to select the mutual funds in the performance Universe.
| | | | |
| 36 | | Wells Fargo Disciplined U.S. Core Fund | | Other information (unaudited) |
The Board noted that the performance of the Fund (Administrator Class) was higher than the average performance of the Universe for all periods under review. The Board also noted that the performance of the Fund was higher than its benchmark, the S&P 500 Index, for all periods under review.
The Board also received and considered information regarding the Fund’s net operating expense ratios and their various components, including actual management fees, custodian and other non-management fees, and Rule 12b-1 and non-Rule 12b-1 shareholder service fees. The Board considered these ratios in comparison to the median ratios of funds in class-specific expense groups that were determined by Broadridge to be similar to the Fund (the “Groups”). The Board received a description of the methodology used by Broadridge to select the mutual funds in the expense Groups and an explanation of how funds comprising expense groups and their expense ratios may vary from year-to-year. Based on the Broadridge reports, the Board noted that the net operating expense ratios of the Fund were lower than or equal to the median net operating expense ratios of the expense Groups. The Board discussed and accepted Funds Management’s proposal to reduce the net operating expense ratio caps for the Class A, Class C and Class R.
The Board took into account the Fund performance and expense information provided to it among the factors considered in deciding to re-approve the Advisory Agreements.
Investment management and sub-advisory fee rates
The Board reviewed and considered the contractual fee rates payable by the Fund to Funds Management under the Management Agreement, as well as the contractual fee rates payable by the Fund to Funds Management for class-level administrative services under a Class-Level Administration Agreement, which include class-level transfer agency and sub-transfer agency costs (collectively, the “Management Rates”). The Board also reviewed and considered the contractual investment sub-advisory fee rates that are payable by Funds Management to the Sub-Adviser for investment sub-advisory services.
Among other information reviewed by the Board was a comparison of the Fund’s Management Rates with the average contractual investment management fee rates of funds in the expense Groups at a common asset level as well as transfer agency costs of the funds in the expense Groups. The Board noted that the Management Rates of the Fund were lower than the sum of these average rates for the Fund’s expense Groups for all share classes.
The Board also received and considered information about the portion of the total management fee that was retained by Funds Management after payment of the fee to the Sub-Adviser for sub-advisory services. In assessing the reasonableness of this amount, the Board received and evaluated information about the nature and extent of responsibilities retained and risks assumed by Funds Management and not delegated to or assumed by the Sub-Adviser, and about Funds Management’s on-going oversight services. However, given the affiliation between Funds Management and the Sub-Adviser, the Board ascribed limited relevance to the allocation of fees between them.
The Board also received and considered information about the nature and extent of services offered and fee rates charged by Funds Management and the Sub-Adviser to other types of clients with investment strategies similar to those of the Fund. In this regard, the Board received information about the significantly greater scope of services, and compliance, reporting and other legal burdens and risks of managing mutual funds compared with those associated with managing assets of non-mutual fund clients such as collective funds or institutional separate accounts.
Based on its consideration of the factors and information it deemed relevant, including those described here, the Board determined that the compensation payable to Funds Management under the Management Agreement and to the Sub-Adviser under the Sub-Advisory Agreement was reasonable, in light of the services covered by the Advisory Agreements.
Profitability
The Board received and considered information concerning the profitability of Funds Management, as well as the profitability of Wells Fargo as a whole, from providing services to the Fund and the fund family as a whole. The Board also received and considered information concerning the profitability of the Sub-Adviser, if any, from providing services to the fund family as a whole, noting that the Sub-Adviser’s profitability information with respect to providing services to the Fund was subsumed in the Wells Fargo and Funds Management profitability analysis.
Funds Management reported on the methodologies and estimates used in calculating profitability. Among other things, the Board noted that the levels of profitability reported on a fund-by-fund basis varied widely, depending on factors such as the size and type of fund. Based on its review, the Board did not deem the profits reported by Funds Management or Wells Fargo from its services to the Fund to be at a level that would prevent it from approving the continuation of the Advisory Agreements.
| | | | | | |
| Other information (unaudited) | | Wells Fargo Disciplined U.S. Core Fund | | | 37 | |
Economies of scale
With respect to possible economies of scale, the Board noted the existence of breakpoints in the Fund’s management fee structure, which operate generally to reduce the Fund’s expense ratios as the Fund grows in size. It considered that, for a small fund or a fund that shrinks in size, breakpoints conversely can result in higher fee levels. The Board also considered that fee waiver and expense reimbursement arrangements and competitive fee rates at the outset are means of sharing potential economies of scale with shareholders of the Fund and the fund family as a whole. The Board discussed and accepted Funds Management’s proposal to reduce the net operating expense ratio caps for the Class A, Class C and Class R. The Board considered Funds Management’s view that any analyses of potential economies of scale in managing a particular fund are inherently limited in light of the joint and common costs and investments that Funds Management incurs across the fund family as a whole.
The Board concluded that the Fund’s fee and expense arrangements, including contractual breakpoints, constituted a reasonable approach to sharing potential economies of scale with the Fund and its shareholders.
Other benefits to Funds Management and the Sub-Adviser
The Board received and considered information regarding potential “fall-out” or ancillary benefits received by Funds Management and its affiliates, including the Sub-Adviser, as a result of their relationships with the Fund. Ancillary benefits could include, among others, benefits directly attributable to other relationships with the Fund and benefits potentially derived from an increase in Funds Management’s and the Sub-Adviser’s business as a result of their relationships with the Fund. The Board noted that various affiliates of Funds Management may receive distribution-related fees, shareholder servicing payments and sub-transfer agency fees in respect of shares sold or held through them and services provided.
The Board also reviewed information about soft dollar credits earned and utilized by the Sub-Adviser, fees earned by Funds Management from managing a private investment vehicle for the fund family’s securities lending collateral and commissions earned by an affiliated broker from portfolio transactions.
Based on its consideration of the factors and information it deemed relevant, including those described here, the Board did not find that any ancillary benefits received by Funds Management and its affiliates, including the Sub-Adviser, were unreasonable.
Conclusion
At the Meeting, after considering the above-described factors and based on its deliberations and its evaluation of the information described above, the Board unanimously approved the continuation of the Advisory Agreements for a one-year term and determined that the compensation payable to Funds Management and the Sub-Adviser under each of the Advisory Agreements was reasonable.
| | | | |
| 38 | | Wells Fargo Disciplined U.S. Core Fund | | List of abbreviations |
The following is a list of common abbreviations for terms and entities that may have appeared in this report.
| ACA | — ACA Financial Guaranty Corporation |
| ADR | — American depositary receipt |
| ADS | — American depositary shares |
| AGC | — Assured Guaranty Corporation |
| AGM | — Assured Guaranty Municipal |
| Ambac | — Ambac Financial Group Incorporated |
| AMT | — Alternative minimum tax |
| BAN | — Bond anticipation notes |
| BHAC | — Berkshire Hathaway Assurance Corporation |
| CAB | — Capital appreciation bond |
| CCAB | — Convertible capital appreciation bond |
| CDA | — Community Development Authority |
| CDO | — Collateralized debt obligation |
| DRIVER | — Derivative inverse tax-exempt receipts |
| DW&P | — Department of Water & Power |
| DWR | — Department of Water Resources |
| ECFA | — Educational & Cultural Facilities Authority |
| EDA | — Economic Development Authority |
| EDFA | — Economic Development Finance Authority |
| ETF | — Exchange-traded fund |
| FDIC | — Federal Deposit Insurance Corporation |
| FFCB | — Federal Farm Credit Banks |
| FGIC | — Financial Guaranty Insurance Corporation |
| FHA | — Federal Housing Administration |
| FHLB | — Federal Home Loan Bank |
| FHLMC | — Federal Home Loan Mortgage Corporation |
| FICO | — The Financing Corporation |
| FNMA | — Federal National Mortgage Association |
| GDR | — Global depositary receipt |
| GNMA | — Government National Mortgage Association |
| HCFR | — Healthcare facilities revenue |
| HEFA | — Health & Educational Facilities Authority |
| HEFAR | — Higher education facilities authority revenue |
| HFA | — Housing Finance Authority |
| HFFA | — Health Facilities Financing Authority |
| HUD | — Department of Housing and Urban Development |
| IDA | — Industrial Development Authority |
| IDAG | — Industrial Development Agency |
| KRW | — Republic of Korea won |
| LIBOR | — London Interbank Offered Rate |
| LIFER | — Long Inverse Floating Exempt Receipts |
| LLC | — Limited liability company |
| LLLP | — Limited liability limited partnership |
| LLP | — Limited liability partnership |
| MBIA | — Municipal Bond Insurance Association |
| MFHR | — Multifamily housing revenue |
| MSTR | — Municipal securities trust receipts |
| MUD | — Municipal Utility District |
| National | — National Public Finance Guarantee Corporation |
| PCFA | — Pollution Control Financing Authority |
| PCL | — Public Company Limited |
| PCR | — Pollution control revenue |
| PFA | — Public Finance Authority |
| PFFA | — Public Facilities Financing Authority |
| PFOTER | — Puttable floating option tax-exempt receipts |
| plc | — Public limited company |
| PUTTER | — Puttable tax-exempt receipts |
| R&D | — Research & development |
| Radian | — Radian Asset Assurance |
| RAN | — Revenue anticipation notes |
| RDA | — Redevelopment Authority |
| RDFA | — Redevelopment Finance Authority |
| REIT | — Real estate investment trust |
| ROC | — Reset option certificates |
| SAVRS | — Select auction variable rate securities |
| SBA | — Small Business Authority |
| SDR | — Swedish depositary receipt |
| SFHR | — Single-family housing revenue |
| SFMR | — Single-family mortgage revenue |
| SPA | — Standby purchase agreement |
| SPDR | — Standard & Poor’s Depositary Receipts |
| SPEAR | — Short Puttable Exempt Adjustable Receipts |
| STRIPS | — Separate trading of registered interest and |
| TAN | — Tax anticipation notes |
| TIPS | — Treasury inflation-protected securities |
| TRAN | — Tax revenue anticipation notes |
| TTFA | — Transportation Trust Fund Authority |
| TVA | — Tennessee Valley Authority |
This page is intentionally left blank.
This page is intentionally left blank.

For more information
More information about Wells Fargo Funds is available free upon request. To obtain literature, please write, email, visit the Fund’s website, or call:
Wells Fargo Funds
P.O. Box 8266
Boston, MA 02266-8266
Email: fundservice@wellsfargo.com
Website: wellsfargofunds.com
Individual investors: 1-800-222-8222
Retail investment professionals: 1-888-877-9275
Institutional investment professionals: 1-866-765-0778
This report and the financial statements contained herein are submitted for the general information of the shareholders of the Fund. If this report is used for promotional purposes, distribution of the report must be accompanied or preceded by a current prospectus. Before investing, please consider the investment objectives, risks, charges, and expenses of the investment. For a current prospectus and, if available, a summary prospectus, containing this information, call 1-800-222-8222 or visit the Fund’s website at wellsfargofunds.com. Read the prospectus carefully before you invest or send money.
Wells Fargo Asset Management (WFAM) is a trade name used by the asset management businesses of Wells Fargo & Company. Wells Fargo Funds Management, LLC, a wholly owned subsidiary of Wells Fargo & Company, provides investment advisory and administrative services for Wells Fargo Funds. Other affiliates of Wells Fargo & Company provide subadvisory and other services for the funds. The funds are distributed by Wells Fargo Funds Distributor, LLC, Member FINRA, an affiliate of Wells Fargo & Company.
NOT FDIC INSURED ¡ NO BANK GUARANTEE ¡ MAY LOSE VALUE
© 2016 Wells Fargo Funds Management, LLC. All rights reserved.
| | |
 | | 245321 09-16 A203/AR203 07-16 |
Annual Report
July 31, 2016

Wells Fargo Endeavor Select Fund


Reduce clutter. Save trees.
Sign up for electronic delivery of prospectuses and shareholder reports at wellsfargo.com/advantagedelivery
Contents
The views expressed and any forward-looking statements are as of July 31, 2016, unless otherwise noted, and are those of the Fund managers and/or Wells Fargo Funds Management, LLC. Discussions of individual securities, or the markets generally, or any Wells Fargo Fund are not intended as individual recommendations. Future events or results may vary significantly from those expressed in any forward-looking statements. The views expressed are subject to change at any time in response to changing circumstances in the market. Wells Fargo Funds Management, LLC and the Fund disclaim any obligation to publicly update or revise any views expressed or forward-looking statements.
NOT FDIC INSURED ¡ NO BANK GUARANTEE ¡ MAY LOSE VALUE
| | | | |
| 2 | | Wells Fargo Endeavor Select Fund | | Letter to shareholders (unaudited) |

Karla M. Rabusch
President
Wells Fargo Funds
Despite significant market fluctuations over the course of the year, U.S. stocks delivered positive results overall for the 12-month reporting period
Dear Valued Shareholder:
We are pleased to offer you this annual report for the Wells Fargo Endeavor Select Fund for the 12-month period that ended July 31, 2016. During this period, which began August 1, 2015, U.S. and international stock markets experienced heightened volatility, with intermittent rebounds interspersed with sell-offs. The U.S. economy displayed resilience throughout the period, although growth was somewhat sluggish amid ongoing pressures that included slowing growth in China, a strengthening U.S. dollar, and uncertainty regarding interest-rate increases by the U.S. Federal Reserve (Fed); international economies faced deeper ongoing challenges. During June 2016, global markets became especially volatile as the U.K.’s vote over whether to leave the European Union (E.U.) approached. However, markets began recovering shortly after the U.K. voted to leave and rallied through July. Despite significant market fluctuations over the course of the year, U.S. stocks delivered positive results overall for the 12-month reporting period, as measured by the Russell 1000® Index.1 International markets generally declined as measured by the Morgan Stanley Capital International (MSCI) Europe, Australasia, Far East (EAFE) Index.2
In the third quarter of 2015, China’s slowdown took a toll on economies and markets worldwide.
U.S. stocks sagged during the quarter, experiencing the most volatility since 2011. Economic data released during the quarter suggested the U.S. economy remained solid but had lost some steam, burdened by the drag of the U.S. dollar’s strength coupled with global economic turmoil. The fact that the Fed left the federal funds interest rate unchanged at its September 2015 meeting surprised investors and fueled increased uncertainty about the U.S. economy’s stamina to remain healthy while facing the challenges of slowing growth in China and troubles elsewhere in the world. Outside the U.S., markets were even more volatile and delivered generally weaker quarterly results, also largely due to investors’ increasing anxiety over China’s weakened economy.
Despite ongoing concerns, U.S. stocks generally rose in the fourth quarter of 2015; international markets lagged.
While the broad U.S. stock market bounced back in the quarter, stock markets outside the U.S. failed to keep pace as economic concerns, including China’s ongoing slowdown, continued to affect many countries. U.S. economic data released during the quarter indicated the economy remained solid, although the strong U.S. dollar and weakness in international economies remained headwinds. In December, the Fed, as expected, raised its target interest rate by 25 basis points (bps; 100 bps equals 1.00%) after keeping it near zero for seven years. The move reflected confidence in the U.S. economy’s ability to stay healthy with less central-bank support. The Fed also clarified that future interest-rate increases would be gradual.
| 1 | The Russell 1000® Index measures the performance of the 1,000 largest companies in the Russell 3000® Index, which represents approximately 92% of the total market capitalization of the Russell 3000® Index. You cannot invest directly in an index. |
| 2 | Morgan Stanley Capital International (MSCI) Europe, Australasia, Far East (EAFE) Index is a free-float-adjusted market-capitalization-weighted index that is designed to measure the equity market performance of developed markets, excluding the United States and Canada. The MSCI EAFE Index consists of the following 21 developed markets country indexes: Australia, Austria, Belgium, Denmark, Finland, France, Germany, Hong Kong, Ireland, Israel, Italy, Japan, the Netherlands, New Zealand, Norway, Portugal, Singapore, Spain, Sweden, Switzerland, and the United Kingdom. You cannot invest directly in an index. |
| | | | | | |
| Letter to shareholders (unaudited) | | Wells Fargo Endeavor Select Fund | | | 3 | |
In the first quarter of 2016, market volatility increased globally amid ongoing concerns.
Stock markets worldwide fluctuated widely in the first quarter of 2016. Most sold off sharply in the first six weeks of the year on concerns such as weak global growth, falling commodity prices, and uncertainty over the timing and impact of the Fed’s interest-rate increases. As the quarter progressed, fears abated somewhat and global markets generally rallied back. The U.S. economy ended the quarter on a positive note as much of the quarter’s data reflected resiliency. With ongoing uncertainties about global growth and financial markets, however, the Fed held off from raising the target interest rate during the quarter. Outside the U.S., the eurozone fell into deflation in February; in response, the European Central Bank announced an expansion of its stimulus program. In China, the government in March set a growth rate of 6.5% to 7.0% for 2016, an acknowledgment of weakening growth. In emerging markets, although central-bank stimulus and improved prices for oil and other commodities led to stock-market rallies in the quarter, many of these countries’ economies face credit downgrades due to challenges such as the likelihood of a stronger U.S. dollar, which would make dollar-denominated debt more expensive.
Worries over interest rates and the U.K.’s vote largely drove the markets during the second quarter of 2016.
U.S. stocks began the quarter in positive territory but started to lose steam in early May on worries that a possible June interest-rate increase by the Fed could hurt the market. In mid-May, stocks briefly plunged following comments by Fed officials noting that a June interest-rate increase remained on the table. But once investors had processed this information, stocks again rallied, finishing up for the month. The first three weeks of June brought heightened volatility, spurred largely by a disappointing jobs report and uncertainty over whether the U.K. would remain in the E.U. The U.K.’s Brexit vote on June 23 shocked countries in Europe and much of the rest of the world. Stock markets plummeted as investors worried that the U.K.’s departure from the E.U. would slow global growth and prolong the low-interest-rate environment. Following the initial rout, however, U.S. stocks rallied as investors seemed to decide that any negative effects would be more localized and not create a serious risk for global growth. By quarter-end, the broad U.S. stock market had moved back into positive territory.
Stocks generally posted positive results for July 2016.
U.S. stocks displayed the most momentum during the first two weeks of the month, buoyed partly by an unexpectedly favorable June jobs report that helped strengthen confidence in the U.S. economy. Also, investors perhaps felt that global central banks could extend stimulus measures in the wake of the Brexit vote. Although U.S. market momentum slowed during the second half of July, stocks ended in positive territory for the month. International stocks delivered positive monthly results as well.
| | | | |
| 4 | | Wells Fargo Endeavor Select Fund | | Letter to shareholders (unaudited) |
Don’t let short-term uncertainty derail long-term investment goals.
Periods of uncertainty can present challenges, but experience has taught us that maintaining long-term investment goals can be an effective way to plan for the future. To help you create a sound strategy based on your personal goals and risk tolerance, Wells Fargo Funds offers more than 100 mutual funds spanning a wide range of asset classes and investment styles. Although diversification cannot guarantee an investment profit or prevent losses, we believe it can be an effective way to manage investment risk and potentially smooth out overall portfolio performance. We encourage investors to know their investments and to understand that appropriate levels of risk-taking may unlock opportunities.
Thank you for choosing to invest in Wells Fargo Funds. We appreciate your confidence in us and remain committed to helping you meet your financial needs.
Sincerely,

Karla M. Rabusch
President
Wells Fargo Funds
Although diversification cannot guarantee an investment profit or prevent losses, we believe it can be an effective way to manage investment risk and potentially smooth out overall portfolio performance.
For further information about your Fund, contact your investment professional, visit our website at wellsfargofunds.com, or call us directly at 1-800-222-8222. We are available 24 hours a day, 7 days a week.
This page is intentionally left blank.
| | | | |
| 6 | | Wells Fargo Endeavor Select Fund | | Performance highlights (unaudited) |
Investment objective
The Fund seeks long-term capital appreciation.
Manager
Wells Fargo Funds Management, LLC
Subadviser
Wells Capital Management Incorporated
Portfolio managers
Michael C. Smith, CFA®
Chris Warner, CFA®
Average annual total returns (%) as of July 31, 2016
| | | | | | | | | | | | | | | | | | | | | | | | | | | | | | | | | | |
| | | | | Including sales charge | | | Excluding sales charge | | | Expense ratios1 (%) | |
| | | Inception date | | 1 year | | | 5 year | | | 10 year | | | 1 year | | | 5 year | | | 10 year | | | Gross | | | Net2 | |
| Class A (STAEX) | | 12-29-2000 | | | (5.82 | ) | | | 9.11 | | | | 5.82 | | | | (0.07 | ) | | | 10.42 | | | | 6.45 | | | | 1.19 | | | | 1.19 | |
| Class B (WECBX)* | | 12-29-2000 | | | (5.76 | ) | | | 9.33 | | | | 5.88 | | | | (0.76 | ) | | | 9.61 | | | | 5.88 | | | | 1.94 | | | | 1.94 | |
| Class C (WECCX) | | 12-29-2000 | | | (1.76 | ) | | | 9.60 | | | | 5.66 | | | | (0.76 | ) | | | 9.60 | | | | 5.66 | | | | 1.94 | | | | 1.94 | |
| Administrator Class (WECDX) | | 4-8-2005 | | | – | | | | – | | | | – | | | | 0.16 | | | | 10.70 | | | | 6.73 | | | | 1.11 | | | | 1.00 | |
| Institutional Class (WFCIX) | | 4-8-2005 | | | – | | | | – | | | | – | | | | 0.27 | | | | 10.89 | | | | 6.91 | | | | 0.86 | | | | 0.80 | |
| Russell 1000® Growth Index3 | | – | | | – | | | | – | | | | – | | | | 4.35 | | | | 13.62 | | | | 9.50 | | | | – | | | | – | |
| * | | Effective September 9, 2016, Class B shares are no longer offered by the Fund. |
Figures quoted represent past performance, which is no guarantee of future results, and do not reflect taxes that a shareholder may pay on fund distributions or the redemption of fund shares. Investment return and principal value of an investment will fluctuate so that an investor’s shares, when redeemed, may be worth more or less than their original cost. Performance shown without sales charges would be lower if sales charges were reflected. Current performance may be lower or higher than the performance data quoted, which assumes the reinvestment of dividends and capital gains. Current month-end performance is available on the Fund’s website, wellsfargofunds.com.
Index returns do not include transaction costs associated with buying and selling securities, any mutual fund fees or expenses, or any taxes. It is not possible to invest directly in an index.
For Class A shares, the maximum front-end sales charge is 5.75%. For Class B shares, the maximum contingent deferred sales charge is 5.00%. For Class C shares, the maximum contingent deferred sales charge is 1.00%. Performance including a contingent deferred sales charge assumes the sales charge for the corresponding time period. Administrator Class and Institutional Class shares are sold without a front-end sales charge or contingent deferred sales charge.
Stock values fluctuate in response to the activities of individual companies and general market and economic conditions. Certain investment strategies tend to increase the total risk of an investment (relative to the broader market). The Fund is exposed to foreign investment risk, focused portfolio risk, and smaller-company securities risk. Consult the Fund’s prospectus for additional information on these and other risks.
Please see footnotes on page 7.
| | | | | | |
| Performance highlights (unaudited) | | Wells Fargo Endeavor Select Fund | | | 7 | |
|
| Growth of $10,000 investment as of July 31, 20164 |
|
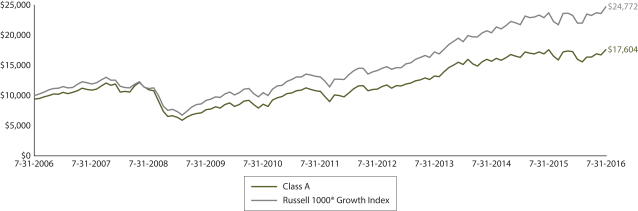 |
| 1 | Reflects the expense ratios as stated in the most recent prospectuses. The expense ratios shown are subject to change and may differ from the annualized expense ratios shown in the financial highlights of this report. |
| 2 | The manager has contractually committed through November 30, 2016, to waive fees and/or reimburse expenses to the extent necessary to cap the Fund’s Total Annual Fund Operating Expenses After Fee Waiver at 1.20% for Class A, 1.95% for Class B, 1.95% for Class C, 1.00% for Administrator Class, and 0.80% for Institutional Class. After this time, the cap may be increased or the commitment to maintain the cap may be terminated only with the approval of the Board of Trustees. Brokerage commissions, stamp duty fees, interest, taxes, acquired fund fees and expenses, and extraordinary expenses are excluded from the expense cap. Without this cap, the Fund’s returns would have been lower. |
| 3 | The Russell 1000® Growth Index measures the performance of those Russell 1000 companies with higher price-to-book ratios and higher forecasted growth values. You cannot invest directly in an index. |
| 4 | The chart compares the performance of Class A shares for the most recent ten years with the Russell 1000® Growth Index. The chart assumes a hypothetical investment of $10,000 in Class A shares and reflects all operating expenses and assumes the maximum initial sales charge of 5.75%. |
| 5 | The ten largest holdings, excluding cash and cash equivalents, are calculated based on the value of the investments divided by total net assets of the Fund. Holdings are subject to change and may have changed since the date specified. |
| 6 | Amounts are calculated based on the total long-term investments of the Fund. These amounts are subject to change and may have changed since the date specified. |
| | | | |
| 8 | | Wells Fargo Endeavor Select Fund | | Performance highlights (unaudited) |
MANAGER’S DISCUSSION
Fund highlights
| n | | The Fund underperformed its benchmark, the Russell 1000® Growth Index, for the 12-month period that ended July 31, 2016. |
| n | | Stock selection in the information technology (IT) and telecommunication services sectors detracted from performance. |
| n | | Stock selection within the consumer discretionary sector benefited performance. |
Over the 12-month period, an elevated level of uncertainty was visible in the U.S. stock market as global economic data and geopolitical events led many investors to reexamine their tolerance for risk; as a result, U.S. stocks at times traded more on emotion and fear than on company-specific fundamentals. In this environment, investors generally tended to prefer yield and defensive stocks, often referred to as bond proxies. These market dynamics were more pronounced in international markets, where economic activity generally was more tepid and geopolitical events caused greater uncertainty.
| | | | |
| Ten largest holdings (%) as of July 31, 20165 | |
Amazon.com Incorporated | | | 5.33 | |
Alphabet Incorporated Class A | | | 5.33 | |
Facebook Incorporated Class A | | | 4.74 | |
Visa Incorporated Class A | | | 4.22 | |
The Home Depot Incorporated | | | 4.16 | |
Apple Incorporated | | | 4.11 | |
UnitedHealth Group Incorporated | | | 3.63 | |
Bristol-Myers Squibb Company | | | 3.48 | |
Fidelity National Information Services Incorporated | | | 2.90 | |
Constellation Brands Incorporated Class A | | | 2.83 | |
The Fund’s telecommunication services and IT holdings weighed on performance relative to the Russell 1000® Growth Index.
Within the telecommunication services sector, the Fund’s position in SBA Communications Corporation, a cell-tower operator in the U.S. and abroad, detracted from performance. SBA’s growth rate declined due to weaker-than-expected capital spending by large wireless carriers and concerns about the company’s use of debt in a volatile credit market. Given the change in SBA’s fundamentals, we exited the Fund’s position in the stock.
Within the IT sector, enterprise-security company Palo Alto Networks, Incorporated, detracted from performance. While network security remains a priority for businesses, companies in this industry, including
Palo Alto, have fallen victim to difficult earnings comparisons following the elevated level of growth they experienced in the wake of several high-profile cyberattacks. While Palo Alto reported better-than-expected revenue growth during the period, the company stated that earnings growth likely will decelerate in the near term because macroeconomic challenges have become more pronounced. We sold the Fund’s position in Palo Alto during the period given that the company had approached our valuation target, its fundamentals were likely to decelerate, and we saw few near-term catalysts.
|
| Sector distribution as of July 31, 20166 |
|
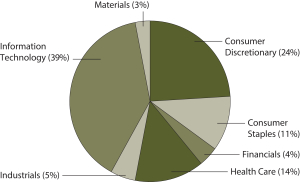 |
Stock selection in the consumer discretionary sector aided results.
The Fund benefited from its position in internet retail giant Amazon.com, Incorporated, as the company’s shares posted strong gains over the reporting period. Amazon enjoyed better-than-expected revenue growth from each of its business segments. Amazon’s strategy of providing low prices, an efficient retail-logistics network, and a strong customer-loyalty plan has resulted in continued market-share gains from traditional brick-and-mortar retailers. With an estimated 50 million subscribers, Amazon Prime has continued to grow sharply, while results from the company’s Amazon Web Services (AWS) segment have shown remarkable
Please see footnotes on page 7.
| | | | | | |
| Performance highlights (unaudited) | | Wells Fargo Endeavor Select Fund | | | 9 | |
growth. A multi-billion-dollar cloud-computing business, AWS has been generating a significant portion of Amazon’s operating income and is a key component of the company’s future growth.
The Fund’s position in The Home Depot, Incorporated, also contributed to performance. As a leading home improvement retailer in the U.S., Home Depot has benefited from several tailwinds. Most importantly, the U.S. housing recovery has been strengthening in terms of price appreciation, transaction volumes, and housing starts. Household formations, which have been rising, have been another catalyst for the company’s growth. As consumers regain confidence that their homes may appreciate in value, home-improvement spending should continue to improve. Strengthening labor markets also have helped consumers feel increasingly secure in their employment. Despite a cautious overall consumer environment, spending on home-related durable goods has been trending positively for several years; we have observed a secular trend of consumers shifting away from spending on apparel and luxury items and toward home improvement. In addition, Home Depot has improved store operations and inventory management; these efforts have translated into strong traffic growth and market-share gains compared with competitors and have helped send Home Depot’s stock price higher over the past 12 months.
Recent market dynamics support our confidence in the Fund’s positioning.
The world presently faces a range of complex and substantial issues. As a result, investors often become preoccupied with worries about the global economic and geopolitical outlooks. Because we share many of these concerns, we have taken a cautious approach within the Fund. We have intentionally shifted toward higher-quality companies with stable cash flows; this positioning reflects the impact that macro factors could have on individual holdings. We acknowledge the importance of risk management in an era of uncertainty.
That being said, however, our process will remain focused on the micro. While valuations of the Fund’s holdings can fluctuate, the fundamentals of these companies, in our view, are underpinned by innovation and strong managements as well as by potentially profitable business models and durable growth. We believe these businesses may be relatively immune to economic uncertainty and therefore could be able to command a scarcity premium. These companies also tend to have visible, durable earnings growth, which indicates their stock prices ultimately could follow the same trajectory. We have been encouraged by recent market activity, which has shown signs of this condition playing out.
Scarcity is a key dimension in our view of the investing landscape. We believe the root cause of many of the world’s problems is a lack of healthy economic growth; however, the scarcity premium for secular earnings growth has yet to meaningfully unfold. We believe this time lag creates an attractive opportunity, as many of the Fund’s positions have underperformed relative to their actual earnings-growth rates; if investors are like thirsty desert travelers, the Fund’s fundamentally strong holdings could be viewed as an oasis on the horizon.
We believe the U.S. economy is on stable footing with attractive growth relative to much of the world. However, we remain mindful of the duration of economic cycles and the ongoing challenge for the U.S. economy to find a higher altitude. Therefore, we maintain a healthy allocation to high-quality core holdings and remain underweight stocks with high economic sensitivity. While consumer spending has not been overly robust, strength has continued in areas such as value retailing, ecommerce, leisure, and housing. These consumer themes, along with innovation in high-growth IT and health care, are well represented in the Fund.
Government spending appears poised to expand in areas such as infrastructure and defense. Although corporations remain cautious on capital spending, the severe headwinds of a strong U.S. dollar and low oil prices appear to be easing and could provide for better-than-expected earnings growth. Overall, we believe the U.S. stock market likely will be supported by a slowly improving economy, giving growth stocks a potential opportunity to stand out from the crowd.
Please see footnotes on page 7.
| | | | |
| 10 | | Wells Fargo Endeavor Select Fund | | Fund expenses (unaudited) |
As a shareholder of the Fund, you incur two types of costs: (1) transaction costs, including sales charges (loads) on purchase payments and contingent deferred sales charges (if any) on redemptions and (2) ongoing costs, including management fees, distribution (12b-1) and/or shareholder servicing fees, and other Fund expenses. This example is intended to help you understand your ongoing costs (in dollars) of investing in the Fund and to compare these costs with the ongoing costs of investing in other mutual funds.
The example is based on an investment of $1,000 invested at the beginning of the six-month period and held for the
entire period from February 1, 2016 to July 31, 2016.
Actual expenses
The “Actual” line of the table below provides information about actual account values and actual expenses. You may use the information in this line, together with the amount you invested, to estimate the expenses that you paid over the period. Simply divide your account value by $1,000 (for example, an $8,600 account value divided by $1,000 = 8.6), then multiply the result by the number in the “Actual” line under the heading entitled “Expenses paid during period” for your applicable class of shares to estimate the expenses you paid on your account during this period.
Hypothetical example for comparison purposes
The “Hypothetical” line of the table below provides information about hypothetical account values and hypothetical expenses based on the Fund’s actual expense ratio and an assumed rate of return of 5% per year before expenses, which is not the Fund’s actual return. The hypothetical account values and expenses may not be used to estimate the actual ending account balance or expenses you paid for the period. You may use this information to compare the ongoing costs of investing in the Fund and other funds. To do so, compare this 5% hypothetical example with the 5% hypothetical examples that appear in the shareholder reports of the other funds.
Please note that the expenses shown in the table are meant to highlight your ongoing costs only and do not reflect any transactional costs, such as sales charges (loads) and contingent deferred sales charges. Therefore, the “Hypothetical” line of the table is useful in comparing ongoing costs only and will not help you determine the relative total costs of owning different funds. In addition, if these transactional costs were included, your costs would have been higher.
| | | | | | | | | | | | | | | | |
| | | Beginning
account value
2-1-2016 | | | Ending
account value
7-31-2016 | | | Expenses
paid during
the period¹ | | | Annualized net expense ratio | |
Class A | | | | | | | | | | | | | | | | |
Actual | | $ | 1,000.00 | | | $ | 1,099.39 | | | $ | 6.26 | | | | 1.20 | % |
Hypothetical (5% return before expenses) | | $ | 1,000.00 | | | $ | 1,018.90 | | | $ | 6.02 | | | | 1.20 | % |
Class B | | | | | | | | | | | | | | | | |
Actual | | $ | 1,000.00 | | | $ | 1,095.83 | | | $ | 10.16 | | | | 1.95 | % |
Hypothetical (5% return before expenses) | | $ | 1,000.00 | | | $ | 1,015.17 | | | $ | 9.77 | | | | 1.95 | % |
Class C | | | | | | | | | | | | | | | | |
Actual | | $ | 1,000.00 | | | $ | 1,095.83 | | | $ | 10.16 | | | | 1.95 | % |
Hypothetical (5% return before expenses) | | $ | 1,000.00 | | | $ | 1,015.17 | | | $ | 9.77 | | | | 1.95 | % |
Administrator Class | | | | | | | | | | | | | | | | |
Actual | | $ | 1,000.00 | | | $ | 1,100.94 | | | $ | 5.22 | | | | 1.00 | % |
Hypothetical (5% return before expenses) | | $ | 1,000.00 | | | $ | 1,019.89 | | | $ | 5.02 | | | | 1.00 | % |
Institutional Class | | | | | | | | | | | | | | | | |
Actual | | $ | 1,000.00 | | | $ | 1,101.60 | | | $ | 4.18 | | | | 0.80 | % |
Hypothetical (5% return before expenses) | | $ | 1,000.00 | | | $ | 1,020.89 | | | $ | 4.02 | | | | 0.80 | % |
| 1 | Expenses paid is equal to the annualized net expense ratio of each class multiplied by the average account value over the period, multiplied by the number of days in the most recent fiscal half-year divided by the number of days in the fiscal year (to reflect the one-half-year period). |
| | | | | | |
| Portfolio of investments—July 31, 2016 | | Wells Fargo Endeavor Select Fund | | | 11 | |
| | | | | | | | | | | | | | | | |
| Security name | | | | | | | | Shares | | | Value | |
| | | | |
Common Stocks: 100.58% | | | | | | | | | | | | | | | | |
| | | | |
Consumer Discretionary: 24.65% | | | | | | | | | | | | | | | | |
| | | | |
| Hotels, Restaurants & Leisure: 5.23% | | | | | | | | | | | | | | | | |
Starbucks Corporation | | | | | | | | | | | 83,400 | | | $ | 4,841,370 | |
Yum! Brands Incorporated | | | | | | | | | | | 58,000 | | | | 5,186,360 | |
| | | | |
| | | | | | | | | | | | | | | 10,027,730 | |
| | | | | | | | | | | | | | | | |
| | | | |
| Internet & Catalog Retail: 5.33% | | | | | | | | | | | | | | | | |
Amazon.com Incorporated † | | | | | | | | | | | 13,453 | | | | 10,208,271 | |
| | | | | | | | | | | | | | | | |
| | | | |
| Media: 1.91% | | | | | | | | | | | | | | | | |
Charter Communications Incorporated Class A † | | | | | | | | | | | 15,600 | | | | 3,663,972 | |
| | | | | | | | | | | | | | | | |
| | | | |
| Multiline Retail: 2.14% | | | | | | | | | | | | | | | | |
Dollar General Corporation | | | | | | | | | | | 43,200 | | | | 4,092,768 | |
| | | | | | | | | | | | | | | | |
| | | | |
| Specialty Retail: 8.56% | | | | | | | | | | | | | | | | |
O’Reilly Automotive Incorporated † | | | | | | | | | | | 11,900 | | | | 3,458,497 | |
The Home Depot Incorporated | | | | | | | | | | | 57,583 | | | | 7,960,274 | |
The TJX Companies Incorporated | | | | | | | | | | | 60,917 | | | | 4,978,137 | |
| | | | |
| | | | | | | | | | | | | | | 16,396,908 | |
| | | | | | | | | | | | | | | | |
| | | | |
| Textiles, Apparel & Luxury Goods: 1.48% | | | | | | | | | | | | | | | | |
Coach Incorporated | | | | | | | | | | | 65,600 | | | | 2,828,016 | |
| | | | | | | | | | | | | | | | |
| | | | |
Consumer Staples: 10.85% | | | | | | | | | | | | | | | | |
| | | | |
| Beverages: 8.25% | | | | | | | | | | | | | | | | |
Constellation Brands Incorporated Class A | | | | | | | | | | | 32,915 | | | | 5,418,796 | |
Dr Pepper Snapple Group Incorporated | | | | | | | | | | | 51,200 | | | | 5,043,712 | |
Monster Beverage Corporation † | | | | | | | | | | | 33,300 | | | | 5,348,979 | |
| | | | |
| | | | | | | | | | | | | | | 15,811,487 | |
| | | | | | | | | | | | | | | | |
| | | | |
| Tobacco: 2.60% | | | | | | | | | | | | | | | | |
Reynolds American Incorporated | | | | | | | | | | | 99,400 | | | | 4,975,964 | |
| | | | | | | | | | | | | | | | |
| | | | |
Financials: 4.47% | | | | | | | | | | | | | | | | |
| | | | |
| Diversified Financial Services: 4.47% | | | | | | | | | | | | | | | | |
Intercontinental Exchange Incorporated | | | | | | | | | | | 16,883 | | | | 4,460,489 | |
S&P Global Incorporated | | | | | | | | | | | 33,578 | | | | 4,103,232 | |
| | | | |
| | | | | | | | | | | | | | | 8,563,721 | |
| | | | | | | | | | | | | | | | |
| | | | |
Health Care: 13.68% | | | | | | | | | | | | | | | | |
| | | | |
| Biotechnology: 1.88% | | | | | | | | | | | | | | | | |
Biogen Incorporated † | | | | | | | | | | | 7,300 | | | | 2,116,489 | |
Celgene Corporation † | | | | | | | | | | | 13,279 | | | | 1,489,771 | |
| | | | |
| | | | | | | | | | | | | | | 3,606,260 | |
| | | | | | | | | | | | | | | | |
| | | | |
| Health Care Equipment & Supplies: 2.11% | | | | | | | | | | | | | | | | |
Intuitive Surgical Incorporated † | | | | | | | | | | | 5,800 | | | | 4,035,408 | |
| | | | | | | | | | | | | | | | |
The accompanying notes are an integral part of these financial statements.
| | | | |
| 12 | | Wells Fargo Endeavor Select Fund | | Portfolio of investments—July 31, 2016 |
| | | | | | | | | | | | | | | | |
| Security name | | | | | | | | Shares | | | Value | |
| | | | |
| Health Care Providers & Services: 3.63% | | | | | | | | | | | | | | | | |
UnitedHealth Group Incorporated | | | | | | | | | | | 48,600 | | | $ | 6,959,520 | |
| | | | | | | | | | | | | | | | |
| | | | |
| Pharmaceuticals: 6.06% | | | | | | | | | | | | | | | | |
Bristol-Myers Squibb Company | | | | | | | | | | | 89,000 | | | | 6,658,090 | |
Eli Lilly & Company | | | | | | | | | | | 17,700 | | | | 1,467,153 | |
Novo Nordisk A/S ADR | | | | | | | | | | | 61,100 | | | | 3,480,867 | |
| | | | |
| | | | | | | | | | | | | | | 11,606,110 | |
| | | | | | | | | | | | | | | | |
| | | | |
Industrials: 4.64% | | | | | | | | | | | | | | | | |
| | | | |
| Airlines: 1.07% | | | | | | | | | | | | | | | | |
Delta Air Lines Incorporated | | | | | | | | | | | 52,752 | | | | 2,044,140 | |
| | | | | | | | | | | | | | | | |
| | | | |
| Professional Services: 1.36% | | | | | | | | | | | | | | | | |
Verisk Analytics Incorporated † | | | | | | | | | | | 30,700 | | | | 2,618,096 | |
| | | | | | | | | | | | | | | | |
| | | | |
| Road & Rail: 2.21% | | | | | | | | | | | | | | | | |
Kansas City Southern | | | | | | | | | | | 44,000 | | | | 4,228,840 | |
| | | | | | | | | | | | | | | | |
| | | | |
Information Technology: 39.69% | | | | | | | | | | | | | | | | |
| | | | |
| Communications Equipment: 2.24% | | | | | | | | | | | | | | | | |
Harris Corporation | | | | | | | | | | | 49,500 | | | | 4,287,690 | |
| | | | | | | | | | | | | | | | |
| | | | |
| Internet Software & Services: 14.22% | | | | | | | | | | | | | | | | |
Alphabet Incorporated Class A † | | | | | | | | | | | 12,899 | | | | 10,207,495 | |
Alphabet Incorporated Class C † | | | | | | | | | | | 4,900 | | | | 3,767,071 | |
Facebook Incorporated Class A † | | | | | | | | | | | 73,249 | | | | 9,078,481 | |
Tencent Holdings Limited ADR | | | | | | | | | | | 173,200 | | | | 4,191,440 | |
| | | | |
| | | | | | | | | | | | | | | 27,244,487 | |
| | | | | | | | | | | | | | | | |
| | | | |
| IT Services: 9.26% | | | | | | | | | | | | | | | | |
Fidelity National Information Services Incorporated | | | | | | | | | | | 69,800 | | | | 5,551,193 | |
PayPal Holdings Incorporated † | | | | | | | | | | | 109,900 | | | | 4,092,676 | |
Visa Incorporated Class A | | | | | | | | | | | 103,658 | | | | 8,090,507 | |
| | | | |
| | | | | | | | | | | | | | | 17,734,376 | |
| | | | | | | | | | | | | | | | |
| | | | |
| Semiconductors & Semiconductor Equipment: 1.83% | | | | | | | | | | | | | | | | |
Broadcom Limited | | | | | | | | | | | 21,600 | | | | 3,498,768 | |
| | | | | | | | | | | | | | | | |
| | | | |
| Software: 8.03% | | | | | | | | | | | | | | | | |
Adobe Systems Incorporated † | | | | | | | | | | | 38,100 | | | | 3,728,466 | |
Electronic Arts Incorporated † | | | | | | | | | | | 55,300 | | | | 4,220,496 | |
Salesforce.com Incorporated † | | | | | | | | | | | 46,600 | | | | 3,811,880 | |
ServiceNow Incorporated † | | | | | | | | | | | 48,468 | | | | 3,631,223 | |
| | | | |
| | | | | | | | | | | | | | | 15,392,065 | |
| | | | | | | | | | | | | | | | |
| | | | |
| Technology Hardware, Storage & Peripherals: 4.11% | | | | | | | | | | | | | | | | |
Apple Incorporated | | | | | | | | | | | 75,583 | | | | 7,876,504 | |
| | | | | | | | | | | | | | | | |
The accompanying notes are an integral part of these financial statements.
| | | | | | |
| Portfolio of investments—July 31, 2016 | | Wells Fargo Endeavor Select Fund | | | 13 | |
| | | | | | | | | | | | | | | | |
| Security name | | | | | | | | Shares | | | Value | |
| | | | |
Materials: 2.60% | | | | | | | | | | | | | | | | |
| | | | |
| Chemicals: 2.60% | | | | | | | | | | | | | | | | |
The Sherwin-Williams Company | | | | | | | | | | | 16,600 | | | $ | 4,975,518 | |
| | | | | | | | | | | | | | | | |
| | | | |
Total Common Stocks (Cost $139,411,050) | | | | | | | | | | | | | | | 192,676,619 | |
| | | | | | | | | | | | | | | | |
| | | | |
| | | Yield | | | | | | | | | | |
| Short-Term Investments: 2.26% | | | | | | | | | | | | | | | | |
| | | | |
| Investment Companies: 2.26% | | | | | | | | | | | | | | | | |
Wells Fargo Government Money Market Fund Select Class (l)(u) | | | 0.32 | % | | | | | | | 4,327,746 | | | | 4,327,746 | |
| | | | | | | | | | | | | | | | |
| | | | |
Total Short-Term Investments (Cost $4,327,746) | | | | | | | | | | | | | | | 4,327,746 | |
| | | | | | | | | | | | | | | | |
| | | | | | | | |
| Total investments in securities (Cost $143,738,796) * | | | 102.84 | % | | | 197,004,365 | |
Other assets and liabilities, net | | | (2.84 | ) | | | (5,449,097 | ) |
| | | | | | | | |
| Total net assets | | | 100.00 | % | | $ | 191,555,268 | |
| | | | | | | | |
| † | Non-income-earning security |
| (l) | The issuer of the security is an affiliated person of the Fund as defined in the Investment Company Act of 1940. |
| (u) | The rate represents the 7-day annualized yield at period end. |
| * | Cost for federal income tax purposes is $144,267,812 and unrealized gains (losses) consists of: |
| | | | |
Gross unrealized gains | | $ | 53,613,275 | |
Gross unrealized losses | | | (876,722 | ) |
| | | | |
Net unrealized gains | | $ | 52,736,553 | |
The accompanying notes are an integral part of these financial statements.
| | | | |
| 14 | | Wells Fargo Endeavor Select Fund | | Statement of assets and liabilities—July 31, 2016 |
| | | | |
| | | | |
| |
Assets | | | | |
Investments | | | | |
In unaffiliated securities, at value (cost $139,411,050) | | $ | 192,676,619 | |
In affiliated securities, at value (cost $4,327,746) | | | 4,327,746 | |
| | | | |
Total investments, at value (cost $143,738,796) | | | 197,004,365 | |
Receivable for Fund shares sold | | | 9,221 | |
Receivable for dividends | | | 87,767 | |
Prepaid expenses and other assets | | | 37,017 | |
| | | | |
Total assets | | | 197,138,370 | |
| | | | |
| |
Liabilities | | | | |
Payable for investments purchased | | | 4,778,574 | |
Payable for Fund shares redeemed | | | 535,796 | |
Management fee payable | | | 87,298 | |
Distribution fees payable | | | 3,066 | |
Administration fees payable | | | 22,703 | |
Accrued expenses and other liabilities | | | 155,665 | |
| | | | |
Total liabilities | | | 5,583,102 | |
| | | | |
Total net assets | | $ | 191,555,268 | |
| | | | |
| |
NET ASSETS CONSIST OF | | | | |
Paid-in capital | | $ | 121,862,909 | |
Accumulated net realized gains on investments | | | 16,426,790 | |
Net unrealized gains on investments | | | 53,265,569 | |
| | | | |
Total net assets | | $ | 191,555,268 | |
| | | | |
| |
COMPUTATION OF NET ASSET VALUE AND OFFERING PRICE PER SHARE | | | | |
Net assets – Class A | | $ | 18,497,912 | |
Shares outstanding – Class A1 | | | 2,065,381 | |
Net asset value per share – Class A | | | $8.96 | |
Maximum offering price per share – Class A2 | | | $9.51 | |
Net assets – Class B | | $ | 22,695 | |
Shares outstanding – Class B1 | | | 3,203 | |
Net asset value per share – Class B | | | $7.09 | |
Net assets – Class C | | $ | 4,845,340 | |
Shares outstanding – Class C1 | | | 683,872 | |
Net asset value per share – Class C | | | $7.09 | |
Net assets – Administrator Class | | $ | 5,254,002 | |
Shares outstanding – Administrator Class1 | | | 560,187 | |
Net asset value per share – Administrator Class | | | $9.38 | |
Net assets – Institutional Class | | $ | 162,935,319 | |
Shares outstanding – Institutional Class1 | | | 16,882,356 | |
Net asset value per share – Institutional Class | | | $9.65 | |
| 1 | The Fund has an unlimited number of authorized shares. |
| 2 | Maximum offering price is computed as 100/94.25 of net asset value. On investments of $50,000 or more, the offering price is reduced. |
The accompanying notes are an integral part of these financial statements.
| | | | | | |
| Statement of operations—year ended July 31, 2016 | | Wells Fargo Endeavor Select Fund | | | 15 | |
| | | | |
| | | | |
| |
Investment income | | | | |
Dividends (net of foreign withholding taxes of $80,317) | | $ | 1,938,933 | |
Income from affiliated securities | | | 11,811 | |
Securities lending income, net | | | 445 | |
| | | | |
Total investment income | | | 1,951,189 | |
| | | | |
| |
Expenses | | | | |
Management fee | | | 1,606,299 | |
Administration fees | | | | |
Class A | | | 44,433 | |
Class B | | | 90 | |
Class C | | | 11,550 | |
Administrator Class | | | 12,126 | |
Institutional Class | | | 251,475 | |
Shareholder servicing fees | | | | |
Class A | | | 52,896 | |
Class B | | | 107 | |
Class C | | | 13,750 | |
Administrator Class | | | 18,710 | |
Distribution fees | | | | |
Class B | | | 321 | |
Class C | | | 41,251 | |
Custody and accounting fees | | | 20,824 | |
Professional fees | | | 40,016 | |
Registration fees | | | 63,758 | |
Shareholder report expenses | | | 109,135 | |
Trustees’ fees and expenses | | | 24,535 | |
Other fees and expenses | | | 17,753 | |
| | | | |
Total expenses | | | 2,329,029 | |
Less: Fee waivers and/or expense reimbursements | | | (326,445 | ) |
| | | | |
Net expenses | | | 2,002,584 | |
| | | | |
Net investment loss | | | (51,395 | ) |
| | | | |
| |
REALIZED AND UNREALIZED GAINS (LOSSES) ON INVESTMENTS | | | | |
Net realized gains on investments | | | 23,772,212 | |
Net change in unrealized gains (losses) on investments | | | (28,678,764 | ) |
| | | | |
Net realized and unrealized gains (losses) on investments | | | (4,906,552 | ) |
| | | | |
Net decrease in net assets resulting from operations | | $ | (4,957,947 | ) |
| | | | |
The accompanying notes are an integral part of these financial statements.
| | | | |
| 16 | | Wells Fargo Endeavor Select Fund | | Statement of changes in net assets |
| | | | | | | | | | | | | | | | |
| | | Year ended
July 31, 2016 | | | Year ended
July 31, 2015 | |
| | | | |
Operations | | | | | | | | | | | | | | | | |
Net investment loss | | | | | | $ | (51,395 | ) | | | | | | $ | (880,977 | ) |
Net realized gains on investments | | | | | | | 23,772,212 | | | | | | | | 133,384,136 | |
Net change in unrealized gains (losses) on investments | | | | | | | (28,678,764 | ) | | | | | | | (60,133,598 | ) |
| | | | |
Net increase (decrease) in net assets resulting from operations | | | | | | | (4,957,947 | ) | | | | | | | 72,369,561 | |
| | | | |
| | | | |
Distributions to shareholders from | | | | | | | | | | | | | | | | |
Net realized gains | | | | | | | | | | | | | | | | |
Class A | | | | | | | (8,268,795 | ) | | | | | | | (4,180,367 | ) |
Class B | | | | | | | (16,431 | ) | | | | | | | (29,782 | ) |
Class C | | | | | | | (2,442,837 | ) | | | | | | | (1,041,460 | ) |
Administrator Class | | | | | | | (2,258,097 | ) | | | | | | | (6,299,282 | ) |
Institutional Class | | | | | | | (70,034,159 | ) | | | | | | | (81,434,953 | ) |
| | | | |
Total distributions to shareholders | | | | | | | (83,020,319 | ) | | | | | | | (92,985,844 | ) |
| | | | |
| | | | |
Capital share transactions | | | Shares | | | | | | | | Shares | | | | | |
Proceeds from shares sold | | | | | | | | | | | | | | | | |
Class A | | | 272,747 | | | | 2,727,507 | | | | 155,038 | | | | 2,127,588 | |
Class C | | | 32,097 | | | | 275,581 | | | | 80,725 | | | | 950,480 | |
Administrator Class | | | 48,161 | | | | 477,125 | | | | 353,463 | | | | 4,955,910 | |
Institutional Class | | | 3,567,469 | | | | 43,696,914 | | | | 4,502,805 | | | | 64,783,218 | |
| | | | |
| | | | | | | 47,177,127 | | | | | | | | 72,817,196 | |
| | | | |
Reinvestment of distributions | | | | | | | | | | | | | | | | |
Class A | | | 899,011 | | | | 7,758,473 | | | | 314,153 | | | | 4,011,740 | |
Class B | | | 2,395 | | | | 16,431 | | | | 2,673 | | | | 29,782 | |
Class C | | | 348,974 | | | | 2,393,965 | | | | 91,245 | | | | 1,017,377 | |
Administrator Class | | | 241,051 | | | | 2,176,690 | | | | 479,088 | | | | 6,280,838 | |
Institutional Class | | | 7,234,603 | | | | 67,137,120 | | | | 5,829,180 | | | | 77,761,267 | |
| | | | |
| | | | | | | 79,482,679 | | | | | | | | 89,101,004 | |
| | | | |
Payment for shares redeemed | | | | | | | | | | | | | | | | |
Class A | | | (1,012,779 | ) | | | (9,431,420 | ) | | | (1,513,775 | ) | | | (21,046,656 | ) |
Class B | | | (7,902 | ) | | | (76,962 | ) | | | (13,638 | ) | | | (161,929 | ) |
Class C | | | (276,572 | ) | | | (2,145,911 | ) | | | (127,822 | ) | | | (1,483,495 | ) |
Administrator Class | | | (2,756,526 | ) | | | (35,152,614 | ) | | | (1,166,520 | ) | | | (16,155,945 | ) |
Institutional Class | | | (9,332,927 | ) | | | (98,111,368 | ) | | | (37,137,527 | ) | | | (520,427,263 | ) |
| | | | |
| | | | | | | (144,918,275 | ) | | | | | | | (559,275,288 | ) |
| | | | |
Net decrease in net assets resulting from capital share transactions | | | | | | | (18,258,469 | ) | | | | | | | (397,357,088 | ) |
| | | | |
Total decrease in net assets | | | | | | | (106,236,735 | ) | | | | | | | (417,973,371 | ) |
| | | | |
| | | | |
Net assets | | | | | | | | | | | | | | | | |
Beginning of period | | | | | | | 297,792,003 | | | | | | | | 715,765,374 | |
| | | | |
End of period | | | | | | $ | 191,555,268 | | | | | | | $ | 297,792,003 | |
| | | | |
Undistributed net investment income | | | | | | $ | 0 | | | | | | | $ | 0 | |
| | | | |
The accompanying notes are an integral part of these financial statements.
| | | | | | |
| Financial highlights | | Wells Fargo Endeavor Select Fund | | | 17 | |
(For a share outstanding throughout each period)
| | | | | | | | | | | | | | | | | | | | |
| | | Year ended July 31 | |
| CLASS A | | 2016 | | | 2015 | | | 2014 | | | 2013 | | | 2012 | |
Net asset value, beginning of period | | | $13.74 | | | | $14.13 | | | | $12.52 | | | | $10.45 | | | | $10.12 | |
Net investment income (loss) | | | (0.04 | )1 | | | (0.08 | )1 | | | (0.09 | )1 | | | 0.00 | 1,2 | | | (0.05 | )1 |
Net realized and unrealized gains (losses) on investments | | | (0.14 | ) | | | 1.65 | | | | 2.37 | | | | 2.07 | | | | 0.38 | |
| | | | | | | | | | | | | | | | | | | | |
Total from investment operations | | | (0.18 | ) | | | 1.57 | | | | 2.28 | | | | 2.07 | | | | 0.33 | |
Distributions to shareholders from | | | | | | | | | | | | | | | | | | | | |
Net realized gains | | | (4.60 | ) | | | (1.96 | ) | | | (0.67 | ) | | | 0.00 | | | | 0.00 | |
Net asset value, end of period | | | $8.96 | | | | $13.74 | | | | $14.13 | | | | $12.52 | | | | $10.45 | |
Total return3 | | | (0.07 | )% | | | 12.14 | % | | | 18.40 | % | | | 19.81 | % | | | 3.26 | % |
Ratios to average net assets (annualized) | | | | | | | | | | | | | | | | | | | | |
Gross expenses | | | 1.28 | % | | | 1.24 | % | | | 1.25 | % | | | 1.26 | % | | | 1.23 | % |
Net expenses | | | 1.20 | % | | | 1.23 | % | | | 1.24 | % | | | 1.25 | % | | | 1.23 | % |
Net investment income (loss) | | | (0.36 | )% | | | (0.55 | )% | | | (0.66 | )% | | | 0.03 | % | | | (0.49 | )% |
Supplemental data | | | | | | | | | | | | | | | | | | | | |
Portfolio turnover rate | | | 79 | % | | | 126 | % | | | 100 | % | | | 97 | % | | | 94 | % |
Net assets, end of period (000s omitted) | | | $18,498 | | | | $26,197 | | | | $41,708 | | | | $44,041 | | | | $47,233 | |
| 1 | Calculated based upon average shares outstanding |
| 2 | Amount is less than $0.005. |
| 3 | Total return calculations do not include any sales charges. |
The accompanying notes are an integral part of these financial statements.
| | | | |
| 18 | | Wells Fargo Endeavor Select Fund | | Financial highlights |
(For a share outstanding throughout each period)
| | | | | | | | | | | | | | | | | | | | |
| | | Year ended July 31 | |
| CLASS B | | 2016 | | | 2015 | | | 2014 | | | 2013 | | | 2012 | |
Net asset value, beginning of period | | | $11.93 | | | | $12.60 | | | | $11.31 | | | | $9.51 | | | | $9.28 | |
Net investment loss | | | (0.10 | )1 | | | (0.16 | )1 | | | (0.17 | )1 | | | (0.07 | )1 | | | (0.11 | )1 |
Net realized and unrealized gains (losses) on investments | | | (0.14 | ) | | | 1.45 | | | | 2.13 | | | | 1.87 | | | | 0.34 | |
| | | | | | | | | | | | | | | | | | | | |
Total from investment operations | | | (0.24 | ) | | | 1.29 | | | | 1.96 | | | | 1.80 | | | | 0.23 | |
Distributions to shareholders from | | | | | | | | | | | | | | | | | | | | |
Net realized gains | | | (4.60 | ) | | | (1.96 | ) | | | (0.67 | ) | | | 0.00 | | | | 0.00 | |
Net asset value, end of period | | | $7.09 | | | | $11.93 | | | | $12.60 | | | | $11.31 | | | | $9.51 | |
Total return2 | | | (0.76 | )% | | | 11.31 | % | | | 17.50 | % | | | 18.93 | % | | | 2.48 | % |
Ratios to average net assets (annualized) | | | | | | | | | | | | | | | | | | | | |
Gross expenses | | | 2.02 | % | | | 1.99 | % | | | 2.00 | % | | | 2.00 | % | | | 1.98 | % |
Net expenses | | | 1.95 | % | | | 1.98 | % | | | 1.99 | % | | | 2.00 | % | | | 1.98 | % |
Net investment loss | | | (1.13 | )% | | | (1.29 | )% | | | (1.41 | )% | | | (0.67 | )% | | | (1.24 | )% |
Supplemental data | | | | | | | | | | | | | | | | | | | | |
Portfolio turnover rate | | | 79 | % | | | 126 | % | | | 100 | % | | | 97 | % | | | 94 | % |
Net assets, end of period (000s omitted) | | | $23 | | | | $104 | | | | $248 | | | | $495 | | | | $1,095 | |
| 1 | Calculated based upon average shares outstanding |
| 2 | Total return calculations do not include any sales charges. |
The accompanying notes are an integral part of these financial statements.
| | | | | | |
| Financial highlights | | Wells Fargo Endeavor Select Fund | | | 19 | |
(For a share outstanding throughout each period)
| | | | | | | | | | | | | | | | | | | | |
| | | Year ended July 31 | |
| CLASS C | | 2016 | | | 2015 | | | 2014 | | | 2013 | | | 2012 | |
Net asset value, beginning of period | | | $11.93 | | | | $12.61 | | | | $11.32 | | | | $9.51 | | | | $9.28 | |
Net investment loss | | | (0.09 | )1 | | | (0.16 | )1 | | | (0.17 | )1 | | | (0.07 | )1 | | | (0.11 | )1 |
Net realized and unrealized gains (losses) on investments | | | (0.15 | ) | | | 1.44 | | | | 2.13 | | | | 1.88 | | | | 0.34 | |
| | | | | | | | | | | | | | | | | | | | |
Total from investment operations | | | (0.24 | ) | | | 1.28 | | | | 1.96 | | | | 1.81 | | | | 0.23 | |
Distributions to shareholders from | | | | | | | | | | | | | | | | | | | | |
Net realized gains | | | (4.60 | ) | | | (1.96 | ) | | | (0.67 | ) | | | 0.00 | | | | 0.00 | |
Net asset value, end of period | | | $7.09 | | | | $11.93 | | | | $12.61 | | | | $11.32 | | | | $9.51 | |
Total return2 | | | (0.76 | )% | | | 11.21 | % | | | 17.60 | % | | | 18.93 | % | | | 2.48 | % |
Ratios to average net assets (annualized) | | | | | | | | | | | | | | | | | | | | |
Gross expenses | | | 2.03 | % | | | 1.99 | % | | | 2.00 | % | | | 2.01 | % | | | 1.98 | % |
Net expenses | | | 1.95 | % | | | 1.99 | % | | | 1.99 | % | | | 2.00 | % | | | 1.98 | % |
Net investment loss | | | (1.11 | )% | | | (1.32 | )% | | | (1.41 | )% | | | (0.72 | )% | | | (1.25 | )% |
Supplemental data | | | | | | | | | | | | | | | | | | | | |
Portfolio turnover rate | | | 79 | % | | | 126 | % | | | 100 | % | | | 97 | % | | | 94 | % |
Net assets, end of period (000s omitted) | | | $4,845 | | | | $6,914 | | | | $6,747 | | | | $6,320 | | | | $6,199 | |
| 1 | Calculated based upon average shares outstanding |
| 2 | Total return calculations do not include any sales charges. |
The accompanying notes are an integral part of these financial statements.
| | | | |
| 20 | | Wells Fargo Endeavor Select Fund | | Financial highlights |
(For a share outstanding throughout each period)
| | | | | | | | | | | | | | | | | | | | |
| | | Year ended July 31 | |
| ADMINISTRATOR CLASS | | 2016 | | | 2015 | | | 2014 | | | 2013 | | | 2012 | |
Net asset value, beginning of period | | | $14.13 | | | | $14.45 | | | | $12.78 | | | | $10.63 | | | | $10.26 | |
Net investment income (loss) | | | 0.01 | 1 | | | (0.05 | )1 | | | (0.06 | )1 | | | 0.03 | 1 | | | (0.03 | )1 |
Net realized and unrealized gains (losses) on investments | | | (0.16 | ) | | | 1.69 | | | | 2.42 | | | | 2.12 | | | | 0.40 | |
| | | | | | | | | | | | | | | | | | | | |
Total from investment operations | | | (0.15 | ) | | | 1.64 | | | | 2.36 | | | | 2.15 | | | | 0.37 | |
Distributions to shareholders from | | | | | | | | | | | | | | | | | | | | |
Net investment income | | | 0.00 | | | | 0.00 | | | | (0.02 | ) | | | 0.00 | | | | 0.00 | |
Net realized gains | | | (4.60 | ) | | | (1.96 | ) | | | (0.67 | ) | | | 0.00 | | | | 0.00 | |
| | | | | | | | | | | | | | | | | | | | |
Total distributions to shareholders | | | (4.60 | ) | | | (1.96 | ) | | | (0.69 | ) | | | 0.00 | | | | 0.00 | |
Net asset value, end of period | | | $9.38 | | | | $14.13 | | | | $14.45 | | | | $12.78 | | | | $10.63 | |
Total return | | | 0.16 | % | | | 12.38 | % | | | 18.77 | % | | | 20.13 | % | | | 3.51 | % |
Ratios to average net assets (annualized) | | | | | | | | | | | | | | | | | | | | |
Gross expenses | | | 1.14 | % | | | 1.05 | % | | | 1.06 | % | | | 1.08 | % | | | 1.07 | % |
Net expenses | | | 1.00 | % | | | 0.99 | % | | | 1.00 | % | | | 1.00 | % | | | 1.00 | % |
Net investment income (loss) | | | 0.06 | % | | | (0.32 | )% | | | (0.42 | )% | | | 0.23 | % | | | (0.27 | )% |
Supplemental data | | | | | | | | | | | | | | | | | | | | |
Portfolio turnover rate | | | 79 | % | | | 126 | % | | | 100 | % | | | 97 | % | | | 94 | % |
Net assets, end of period (000s omitted) | | | $5,254 | | | | $42,776 | | | | $48,560 | | | | $68,611 | | | | $57,533 | |
| 1 | Calculated based upon average shares outstanding |
The accompanying notes are an integral part of these financial statements.
| | | | | | |
| Financial highlights | | Wells Fargo Endeavor Select Fund | | | 21 | |
(For a share outstanding throughout each period)
| | | | | | | | | | | | | | | | | | | | |
| | | Year ended July 31 | |
| INSTITUTIONAL CLASS | | 2016 | | | 2015 | | | 2014 | | | 2013 | | | 2012 | |
Net asset value, beginning of period | | | $14.39 | | | | $14.65 | | | | $12.95 | | | | $10.75 | | | | $10.37 | |
Net investment income (loss) | | | 0.00 | 1,2 | | | (0.01 | )1 | | | (0.03 | )1 | | | 0.06 | 1 | | | (0.01 | )1 |
Net realized and unrealized gains (losses) on investments | | | (0.14 | ) | | | 1.71 | | | | 2.45 | | | | 2.14 | | | | 0.39 | |
| | | | | | | | | | | | | | | | | | | | |
Total from investment operations | | | (0.14 | ) | | | 1.70 | | | | 2.42 | | | | 2.20 | | | | 0.38 | |
Distributions to shareholders from | | | | | | | | | | | | | | | | | | | | |
Net investment income | | | 0.00 | | | | 0.00 | | | | (0.05 | ) | | | 0.00 | | | | 0.00 | |
Net realized gains | | | (4.60 | ) | | | (1.96 | ) | | | (0.67 | ) | | | 0.00 | | | | 0.00 | |
| | | | | | | | | | | | | | | | | | | | |
Total distributions to shareholders | | | (4.60 | ) | | | (1.96 | ) | | | (0.72 | ) | | | 0.00 | | | | 0.00 | |
Net asset value, end of period | | | $9.65 | | | | $14.39 | | | | $14.65 | | | | $12.95 | | | | $10.75 | |
Total return | | | 0.27 | % | | | 12.63 | % | | | 18.98 | % | | | 20.37 | % | | | 3.66 | % |
Ratios to average net assets (annualized) | | | | | | | | | | | | | | | | | | | | |
Gross expenses | | | 0.95 | % | | | 0.81 | % | | | 0.82 | % | | | 0.83 | % | | | 0.80 | % |
Net expenses | | | 0.80 | % | | | 0.80 | % | | | 0.80 | % | | | 0.80 | % | | | 0.79 | % |
Net investment income (loss) | | | 0.04 | % | | | (0.09 | )% | | | (0.22 | )% | | | 0.50 | % | | | (0.06 | )% |
Supplemental data | | | | | | | | | | | | | | | | | | | | |
Portfolio turnover rate | | | 79 | % | | | 126 | % | | | 100 | % | | | 97 | % | | | 94 | % |
Net assets, end of period (000s omitted) | | | $162,935 | | | | $221,801 | | | | $618,502 | | | | $508,685 | | | | $735,633 | |
| 1 | Calculated based upon average shares outstanding |
| 2 | Amount is less than $0.005. |
The accompanying notes are an integral part of these financial statements.
| | | | |
| 22 | | Wells Fargo Endeavor Select Fund | | Notes to financial statements |
1. ORGANIZATION
Wells Fargo Funds Trust (the “Trust”), a Delaware statutory trust organized on March 10, 1999, is an open-end management investment company registered under the Investment Company Act of 1940, as amended (the “1940 Act”). As an investment company, the Trust follows the accounting and reporting guidance in Financial Accounting Standards Board (“FASB”) Accounting Standards Codification Topic 946, Financial Services – Investment Companies. These financial statements report on the Wells Fargo Endeavor Select Fund (the “Fund”) which is a diversified series of the Trust.
2. SIGNIFICANT ACCOUNTING POLICIES
The following significant accounting policies, which are consistently followed in the preparation of the financial statements of the Fund, are in conformity with U.S. generally accepted accounting principles which require management to make estimates and assumptions that affect the reported amounts of assets and liabilities, disclosure of contingent assets and liabilities at the date of the financial statements, and the reported amounts of revenues and expenses during the reporting period. Actual results could differ from those estimates.
Securities valuation
All investments are valued each business day as of the close of regular trading on the New York Stock Exchange (generally 4 p.m. Eastern Time), although the Fund may deviate from this calculation time under unusual or unexpected circumstances.
Equity securities that are listed on a foreign or domestic exchange or market are valued at the official closing price or, if none, the last sales price. If no sale occurs on the principal exchange or market that day, the prior day’s price will be deemed “stale” and a fair value price will be determined in accordance with the Fund’s Valuation Procedures.
Investments in registered open-end investment companies are valued at net asset value. Interests in non-registered investment vehicles that are redeemable at net asset value are fair valued normally at net asset value.
Investments which are not valued using any of the methods discussed above are valued at their fair value, as determined in good faith by the Board of Trustees of the Fund. The Board of Trustees has established a Valuation Committee comprised of the Trustees and has delegated to it the authority to take any actions regarding the valuation of portfolio securities that the Valuation Committee deems necessary or appropriate, including determining the fair value of portfolio securities, unless the determination has been delegated to the Management Valuation Team of Wells Fargo Funds Management, LLC (“Funds Management”). The Board of Trustees retains the authority to make or ratify any valuation decisions or approve any changes to the Valuation Procedures as it deems appropriate. On a quarterly basis, the Board of Trustees receives reports on any valuation actions taken by the Valuation Committee or the Management Valuation Team which may include items for ratification.
Valuations of fair valued securities are compared to the next actual sales price when available, or other appropriate market values, to assess the continued appropriateness of the fair valuation methodologies used. These securities are fair valued on a day-to-day basis, taking into consideration changes to appropriate market information and any significant changes to the inputs considered in the valuation process until there is a readily available price provided on an exchange or by an independent pricing service. Valuations received from an independent pricing service or independent broker-dealer quotes are periodically validated by comparisons to most recent trades and valuations provided by other independent pricing services in addition to the review of prices by the manager and/or subadviser. Unobservable inputs used in determining fair valuations are identified based on the type of security, taking into consideration factors utilized by market participants in valuing the investment, knowledge about the issuer and the current market environment.
Security loans
The Fund may lend its securities from time to time in order to earn additional income in the form of fees or interest on securities received as collateral or the investment of any cash received as collateral. The Fund continues to receive interest or dividends on the securities loaned. The Fund receives collateral in the form of cash or securities with a value at least equal to the value of the securities on loan. The value of the loaned securities is determined at the close of each business day and any additional required collateral is delivered to the Fund on the next business day. In a securities lending transaction, the net asset value of the Fund will be affected by an increase or decrease in the value of the securities loaned and by an increase or decrease in the value of the instrument in which collateral is invested. The amount of securities lending activity undertaken by the Fund fluctuates from time to time. In the event of default or bankruptcy by the borrower, the Fund may be prevented from recovering the loaned securities or gaining access to the collateral or may experience delays or costs in doing so. In addition, the investment of any cash collateral received may lose all or part of its value. The Fund has the right under the lending agreement to recover the securities from the borrower on demand.
| | | | | | |
| Notes to financial statements | | Wells Fargo Endeavor Select Fund | | | 23 | |
The Fund lends its securities through an unaffiliated securities lending agent. Cash collateral received in connection with its securities lending transactions is invested in Securities Lending Cash Investments, LLC (the “Securities Lending Fund”). The Securities Lending Fund is exempt from registration under Section 3(c)(7) of the 1940 Act and is managed by Funds Management and is subadvised by Wells Capital Management Incorporated (“WellsCap”), an affiliate of Funds Management and an indirect wholly owned subsidiary of Wells Fargo & Company (“Wells Fargo”). Funds Management receives an advisory fee starting at 0.05% and declining to 0.01% as the average daily net assets of the Securities Lending Fund increase. All of the fees received by Funds Management are paid to WellsCap for its services as subadviser. The Securities Lending Fund seeks to provide a positive return compared to the daily Fed Funds Open rate by investing in high-quality, U.S. dollar-denominated short-term money market instruments. Securities Lending Fund investments are fair valued based upon the amortized cost valuation technique. Income earned from investment in the Securities Lending Fund is included in securities lending income on the Statement of Operations.
Security transactions and income recognition
Securities transactions are recorded on a trade date basis. Realized gains or losses are recorded on the basis of identified cost.
Dividend income is recognized on the ex-dividend date. Dividend income is recorded net of foreign taxes withheld where recovery of such taxes is not assured.
Distributions to shareholders
Distributions to shareholders from net investment income and net realized gains, if any, are recorded on the ex-dividend date. Such distributions are determined in conformity with federal income tax regulations, which may differ in amount or character from net investment income and realized gains recognized for purposes of U.S. generally accepted accounting principles.
Federal and other taxes
The Fund intends to continue to qualify as a regulated investment company by distributing substantially all of its investment company taxable income and any net realized capital gains (after reduction for capital loss carryforwards) sufficient to relieve it from all, or substantially all, federal income taxes. Accordingly, no provision for federal income taxes was required.
The Fund’s income and federal excise tax returns and all financial records supporting those returns for the prior three fiscal years are subject to examination by the federal and Delaware revenue authorities. Management has analyzed the Fund’s tax positions taken on federal, state, and foreign tax returns for all open tax years and does not believe that there are any uncertain tax positions that require recognition of a tax liability.
Reclassifications are made to the Fund’s capital accounts for permanent tax differences to reflect income and gains available for distribution (or available capital loss carryforwards) under federal income tax regulations. U.S. generally accepted accounting principles require that certain components of net assets be adjusted to reflect permanent differences between financial and tax reporting. In addition, the Fund may utilize equalization accounting for tax purposes and designate earnings and profits, including net realized gains distributed to shareholders on redemption of shares, as a part of the dividends paid deduction for income tax purposes. These reclassifications have no effect on net assets or net asset values per share. The primary permanent differences causing such reclassifications are due to net operating losses and equalization payments. At July 31, 2016, as a result of permanent book-to-tax differences, the following reclassification adjustments were made on the Statement of Assets and Liabilities:
| | | | |
| Paid-in capital | | Accumulated net
investment loss | | Accumulated net
realized gains
on investments |
| $508,605 | | $51,395 | | $(560,000) |
Class allocations
The separate classes of shares offered by the Fund differ principally in applicable sales charges, distribution, shareholder servicing, and administration fees. Class specific expenses are charged directly to that share class. Investment income, common expenses, and realized and unrealized gains (losses) on investments are allocated daily to each class of shares based on the relative proportion of net assets of each class.
3. FAIR VALUATION MEASUREMENTS
Fair value measurements of investments are determined within a framework that has established a fair value hierarchy based upon the various data inputs utilized in determining the value of the Fund’s investments. The three-level hierarchy
| | | | |
| 24 | | Wells Fargo Endeavor Select Fund | | Notes to financial statements |
gives the highest priority to unadjusted quoted prices in active markets for identical assets or liabilities (Level 1) and the lowest priority to significant unobservable inputs (Level 3). The Fund’s investments are classified within the fair value hierarchy based on the lowest level of input that is significant to the fair value measurement. The inputs are summarized into three broad levels as follows:
| n | | Level 1 – quoted prices in active markets for identical securities |
| n | | Level 2 – other significant observable inputs (including quoted prices for similar securities, interest rates, prepayment speeds, credit risk, use of amortized cost, etc.) |
| n | | Level 3 – significant unobservable inputs (including the Fund’s own assumptions in determining the fair value of investments) |
The inputs or methodologies used for valuing investments in securities are not necessarily an indication of the risk associated with investing in those securities.
The following is a summary of the inputs used in valuing the Fund’s assets and liabilities as of July 31, 2016:
| | | | | | | | | | | | | | | | |
| | | Quoted prices
(Level 1) | | | Other significant
observable inputs
(Level 2) | | | Significant
unobservable inputs (Level 3) | | | Total | |
Assets | | | | | | | | | | | | | | | | |
Investments in: | | | | | | | | | | | | | | | | |
| | | | |
Common stocks | | | | | | | | | | | | | | | | |
Consumer discretionary | | $ | 47,217,665 | | | $ | 0 | | | $ | 0 | | | $ | 47,217,665 | |
Consumer staples | | | 20,787,451 | | | | 0 | | | | 0 | | | | 20,787,451 | |
Financials | | | 8,563,721 | | | | 0 | | | | 0 | | | | 8,563,721 | |
Health care | | | 26,207,298 | | | | 0 | | | | 0 | | | | 26,207,298 | |
Industrials | | | 8,891,076 | | | | 0 | | | | 0 | | | | 8,891,076 | |
Information technology | | | 76,033,890 | | | | 0 | | | | 0 | | | | 76,033,890 | |
Materials | | | 4,975,518 | | | | 0 | | | | 0 | | | | 4,975,518 | |
| | | | |
Short-term investments | | | | | | | | | | | | | | | | |
Investment companies | | | 4,327,746 | | | | 0 | | | | 0 | | | | 4,327,746 | |
Total assets | | $ | 197,004,365 | | | $ | 0 | | | $ | 0 | | | $ | 197,004,365 | |
The Fund recognizes transfers between levels within the fair value hierarchy at the end of the reporting period. At July 31, 2016, the Fund did not have any transfers into/out of Level 1, Level 2, or Level 3.
4. TRANSACTIONS WITH AFFILIATES
Management fee
Funds Management, an indirect wholly owned subsidiary of Wells Fargo, is the manager of the Fund and provides advisory and fund-level administrative services under an investment management agreement. Under the investment management agreement, Funds Management is responsible for, among other services, implementing the investment objectives and strategies of the Fund, supervising the subadviser, providing fund-level administrative services in connection with the Fund’s operations, and providing any other fund-level administrative services reasonably necessary for the operation of the Fund. As compensation for its services under the investment management agreement, Funds Management is entitled to receive an annual management fee starting at 0.70% and declining to 0.505% as the average daily net assets of the Fund increase. For the year ended July 31, 2016, the management fee was equivalent to an annual rate of 0.70% of the Fund’s average daily net assets.
Funds Management has retained the services of a subadviser to provide daily portfolio management to the Fund. The fee for subadvisory services is borne by Funds Management. Wells Cap is the subadviser to the Fund and is entitled to receive a fee from Funds Management at an annual rate starting at 0.30% and declining to 0.20% as the average daily net assets of the Fund increase.
| | | | | | |
| Notes to financial statements | | Wells Fargo Endeavor Select Fund | | | 25 | |
Administration fees
Under a class-level administration agreement, Funds Management provides class-level administrative services to the Fund, which includes paying fees and expenses for services provided by the transfer agent, sub-transfer agents, omnibus account servicers and record-keepers. As compensation for its services under the class-level administration agreement, Funds Management receives an annual fee which is calculated based on the average daily net assets of each class as follows:
| | | | |
| | | Class-level
administration fee | |
Class A, Class B, Class C | | | 0.21 | % |
Administrator Class, Institutional Class | | | 0.13 | |
Funds Management has contractually waived and/or reimbursed management and administration fees to the extent necessary to maintain certain net operating expense ratios for the Fund. Waiver of fees and/or reimbursement of expenses by Funds Management were made first from fund level expenses on a proportionate basis and then from class specific expenses. Funds Management has committed through November 30, 2016 to waive fees and/or reimburse expenses to the extent necessary to cap the Fund’s expenses at 1.20% for Class A shares, 1.95% for Class B shares, 1.95% for Class C shares, 1.00% for Administrator Class shares, and 0.80% for Institutional Class shares. After this time, the cap may be increased or the commitment to maintain the cap may be terminated only with the approval of the Board of Trustees
Distribution fees
The Trust has adopted a distribution plan for Class B and Class C shares of the Fund pursuant to Rule 12b-1 under the 1940 Act. Distribution fees are charged to Class B and Class C shares and paid to Wells Fargo Funds Distributor, LLC (“Funds Distributor”), the principal underwriter, at an annual rate of 0.75% of the average daily net assets of Class B and Class C shares.
In addition, Funds Distributor is entitled to receive the front-end sales charge from the purchase of Class A shares and a contingent deferred sales charge on the redemption of certain Class A shares. Funds Distributor is also entitled to receive the contingent deferred sales charges from redemptions of Class B and Class C shares. For the year ended July 31, 2016, Funds Distributor received $3,831 from the sale of Class A shares.
Shareholder servicing fees
The Trust has entered into contracts with one or more shareholder servicing agents, whereby Class A, Class B, Class C, and Administrator Class of the Fund are charged a fee at an annual rate of 0.25% of the average daily net assets of each respective class.
A portion of these total shareholder servicing fees were paid to affiliates of Wells Fargo.
5. INVESTMENT PORTFOLIO TRANSACTIONS
Purchases and sales of investments, excluding U.S. government obligations (if any) and short-term securities, for the year ended July 31, 2016 were $180,143,688 and $270,722,728, respectively.
The Fund may purchase or sell investment securities to other Wells Fargo funds under procedures adopted by the Board of Trustees. The procedures have been designed to ensure that these interfund transactions, which generally do not incur broker commissions, are effected at current market prices. Interfund trades are included within the respective purchases and sales amounts shown.
6. BANK BORROWINGS
The Trust (excluding the money market funds and certain other funds) and Wells Fargo Variable Trust are parties to a $200,000,000 revolving credit agreement whereby the Fund is permitted to use bank borrowings for temporary or emergency purposes, such as to fund shareholder redemption requests. Interest under the credit agreement is charged to the Fund based on a borrowing rate equal to the higher of the Federal Funds rate in effect on that day plus 1.25% or the overnight LIBOR rate in effect on that day plus 1.25%. In addition, an annual commitment fee equal to 0.20% of the unused balance is allocated to each participating fund. Prior to September 1, 2015, the revolving credit agreement amount was $150,000,000 and the annual commitment fee was equal to 0.10% of the unused balance which was allocated to each participating fund.
For the year ended July 31, 2016, there were no borrowings by the Fund under the agreement.
| | | | |
| 26 | | Wells Fargo Endeavor Select Fund | | Notes to financial statements |
7. DISTRIBUTIONS TO SHAREHOLDERS
The tax character of distributions paid during the years ended July 31, 2016 and July 31, 2015 were as follows:
| | | | | | | | |
| | | Year ended July 31 | |
| | | 2016 | | | 2015 | |
Ordinary income | | $ | 7,366,840 | | | $ | 31,666,488 | |
Long-term capital gain | | | 75,653,479 | | | | 61,319,356 | |
As of July 31, 2016, the components of distributable earnings on a tax basis were as follows:
| | |
Undistributed
long-term
gain | | Unrealized
gains |
| $16,955,806 | | $52,736,553 |
8. CONCENTRATION RISK
Concentration risks result from exposure to a limited number of sectors. A fund that invests a substantial portion of its assets in any sector may be more affected by changes in that sector than would be a fund whose investments are not heavily weighted in any sector.
9. INDEMNIFICATION
Under the Trust’s organizational documents, the officers and Trustees have been granted certain indemnification rights against certain liabilities that may arise out of performance of their duties to the Trust. Additionally, in the normal course of business, the Trust may enter into contracts with service providers that contain a variety of indemnification clauses. The Trust’s maximum exposure under these arrangements is dependent on future claims that may be made against the Fund and, therefore, cannot be estimated.
| | | | | | |
| Report of independent registered public accounting firm | | Wells Fargo Endeavor Select Fund | | | 27 | |
BOARD OF TRUSTEES AND SHAREHOLDERS OF WELLS FARGO FUNDS TRUST:
We have audited the accompanying statements of assets and liabilities, including the portfolio of investments, of the Wells Fargo Endeavor Select Fund (formerly known as Wells Fargo Advantage Endeavor Select Fund) (the “Fund”), one of the funds constituting the Wells Fargo Funds Trust, as of July 31, 2016, and the related statement of operations for the year then ended, the statements of changes in net assets for each of the years in the two-year period then ended, and the financial highlights for each of the years in the five-year period then ended. These financial statements and financial highlights are the responsibility of the Fund’s management. Our responsibility is to express an opinion on these financial statements and financial highlights based on our audits.
We conducted our audits in accordance with the standards of the Public Company Accounting Oversight Board (United States). Those standards require that we plan and perform the audit to obtain reasonable assurance about whether the financial statements and financial highlights are free of material misstatement. An audit includes examining, on a test basis, evidence supporting the amounts and disclosures in the financial statements. Our procedures included confirmation of securities owned as of July 31, 2016, by correspondence with the custodian and brokers, or by other appropriate auditing procedures. An audit also includes assessing the accounting principles used and significant estimates made by management, as well as evaluating the overall financial statement presentation. We believe that our audits provide a reasonable basis for our opinion.
In our opinion, the financial statements and financial highlights referred to above present fairly, in all material respects, the financial position of the Wells Fargo Endeavor Select Fund as of July 31, 2016, the results of its operations for the year then ended, the changes in its net assets for each of the years in the two-year period then ended, and the financial highlights for each of the years in the five-year period then ended, in conformity with U.S. generally accepted accounting principles.

Boston, Massachusetts
September 23, 2016
| | | | |
| 28 | | Wells Fargo Endeavor Select Fund | | Other information (unaudited) |
TAX INFORMATION
For corporate shareholders, pursuant to Section 854 of the Internal Revenue Code, 43.53% of ordinary income dividends qualify for the corporate dividends-received deduction for the fiscal year ended July 31, 2016.
Pursuant to Section 852 of the Internal Revenue Code, $76,213,479 was designated as a 20% rate gain distribution for the fiscal year ended July 31, 2016. Long-term capital gains in the amount of $560,000 were distributed in connection with Fund share redemptions.
Pursuant to Section 854 of the Internal Revenue Code, $3,625,959 of income dividends paid during the fiscal year ended July 31, 2016 has been designated as qualified dividend income (QDI).
For the fiscal year ended July 31, 2016, $7,366,840 has been designated as short-term capital gain dividends for nonresident alien shareholders pursuant to Section 871 of the Internal Revenue Code.
PROXY VOTING INFORMATION
A description of the policies and procedures that the Fund uses to determine how to vote proxies relating to portfolio securities is available, upon request, by calling 1-800-222-8222, visiting our website at wellsfargofunds.com, or visiting the SEC website at sec.gov. Information regarding how the Fund voted proxies relating to portfolio securities during the most recent 12-month period ended June 30 is available on the Fund’s website at wellsfargofunds.com or by visiting the SEC website at sec.gov.
PORTFOLIO HOLDINGS INFORMATION
The complete portfolio holdings for the Fund are publicly available monthly on the Fund’s website (wellsfargofunds.com), on a one-month delayed basis. In addition, top ten holdings information (excluding derivative positions) for the Fund is publicly available on the Fund’s website on a monthly, seven-day or more delayed basis. The Fund files its complete schedule of portfolio holdings with the SEC for the first and third quarters of each fiscal year on Form N-Q, which is available by visiting the SEC website at sec.gov. In addition, the Fund’s Form N-Q may be reviewed and copied at the SEC’s Public Reference Room in Washington, DC, and at regional offices in New York City, at 233 Broadway, and in Chicago, at 175 West Jackson Boulevard, Suite 900. Information about the Public Reference Room may be obtained by calling 1-800-SEC-0330.
| | | | | | |
| Other information (unaudited) | | Wells Fargo Endeavor Select Fund | | | 29 | |
BOARD OF TRUSTEES AND OFFICERS
Each of the Trustees and Officers1 listed in the table below acts in identical capacities for each fund in the Wells Fargo family of funds, which consists of 139 mutual funds comprising the Wells Fargo Funds Trust, Wells Fargo Variable Trust, Wells Fargo Master Trust and four closed-end funds (collectively the “Fund Complex”). This table should be read in conjunction with the Prospectus and the Statement of Additional Information2. The mailing address of each Trustee and Officer is 525 Market Street, 12th Floor, San Francisco, CA 94105. Each Trustee and Officer serves an indefinite term, however, each Trustee serves such term until reaching the mandatory retirement age established by the Trustees.
Independent Trustees
| | | | | | |
Name and year of birth | | Position held and length of service* | | Principal occupations during past five years or longer | | Current other public company or
investment company
directorships |
William R. Ebsworth (Born 1957) | | Trustee, since 2015 | | Retired. From 1984 to 2013, equities analyst, portfolio manager, research director and chief financial officer at Fidelity Management and Research Company in Boston, Tokyo, and Hong Kong and retired in 2013 as Chief Investment Officer of Fidelity Strategic Advisers, Inc. where he lead a team of investment professionals managing client assets. Prior thereto, Board member of Hong Kong Securities Clearing Co., Hong Kong Options Clearing Corp., the Thailand International Fund, Ltd., Fidelity Investments Life Insurance Company, and Empire Fidelity Investments Life Insurance Company. Mr. Ebsworth is a CFA® charterholder and an Adjunct Lecturer, Finance, at Babson College. | | Asset Allocation Trust |
Jane A. Freeman (Born 1953) | | Trustee, since 2015 | | Retired. From 2012 to 2014 and 1999 to 2008, Chief Financial Officer of Scientific Learning Corporation. From 2008 to 2012, Ms. Freeman provided consulting services related to strategic business projects. Prior to 1999, Portfolio Manager at Rockefeller & Co. and Scudder, Stevens & Clark. Board member of the Harding Loevner Funds from 1996 to 2014, serving as both Lead Independent Director and chair of the Audit Committee. Board member of the Russell Exchange Traded Funds Trust from 2011 to 2012 and the chair of the Audit Committee. Ms. Freeman is Chair of Taproot Foundation (non-profit organization), a Board Member of Ruth Bancroft Garden (non-profit organization) and an inactive chartered financial analyst. | | Asset Allocation Trust |
Peter G. Gordon (Born 1942) | | Trustee, since 1998; Chairman, since 2005 | | Co-Founder, Retired Chairman, President and CEO of Crystal Geyser Water Company. Trustee Emeritus, Colby College. | | Asset Allocation Trust |
Isaiah Harris, Jr. (Born 1952) | | Trustee, since 2009 | | Retired. Chairman of the Board of CIGNA Corporation since 2009, and Director since 2005. From 2003 to 2011, Director of Deluxe Corporation. Prior thereto, President and CEO of BellSouth Advertising and Publishing Corp. from 2005 to 2007, President and CEO of BellSouth Enterprises from 2004 to 2005 and President of BellSouth Consumer Services from 2000 to 2003. Emeritus member of the Iowa State University Foundation Board of Governors. Emeritus Member of the Advisory Board of Iowa State University School of Business. Advisory Board Member, Palm Harbor Academy (charter school). Advisory Board Member, Child Evangelism Fellowship (non-profit). Mr. Harris is a certified public accountant (inactive status). | | CIGNA Corporation; Asset Allocation Trust |
Judith M. Johnson (Born 1949) | | Trustee, since 2008; Audit Committee Chairman, since 2008 | | Retired. Prior thereto, Chief Executive Officer and Chief Investment Officer of Minneapolis Employees Retirement Fund from 1996 to 2008. Ms. Johnson is an attorney, certified public accountant and a certified managerial accountant. | | Asset Allocation Trust |
David F. Larcker (Born 1950) | | Trustee, since 2009 | | James Irvin Miller Professor of Accounting at the Graduate School of Business, Stanford University, Director of the Corporate Governance Research Initiative and Senior Faculty of The Rock Center for Corporate Governance since 2006. From 2005 to 2008, Professor of Accounting at the Graduate School of Business, Stanford University. Prior thereto, Ernst & Young Professor of Accounting at The Wharton School, University of Pennsylvania from 1985 to 2005. | | Asset Allocation Trust |
| | | | |
| 30 | | Wells Fargo Endeavor Select Fund | | Other information (unaudited) |
| | | | | | |
Name and year of birth | | Position held and length of service* | | Principal occupations during past five years or longer | | Current other public company or
investment company
directorships |
Olivia S. Mitchell (Born 1953) | | Trustee, since 2006 | | International Foundation of Employee Benefit Plans Professor, Wharton School of the University of Pennsylvania since 1993. Director of Wharton’s Pension Research Council and Boettner Center on Pensions & Retirement Research, and Research Associate at the National Bureau of Economic Research. Previously, Cornell University Professor from 1978 to 1993. | | Asset Allocation Trust |
Timothy J. Penny (Born 1951) | | Trustee, since 1996 | | President and Chief Executive Officer of Southern Minnesota Initiative Foundation, a non-profit organization, since 2007 and Senior Fellow at the Humphrey Institute Policy Forum at the University of Minnesota since 1995. Member of the Board of Trustees of NorthStar Education Finance, Inc., a non-profit organization, since 2007. | | Asset Allocation Trust |
Michael S. Scofield (Born 1943) | | Trustee, since 2010 | | Served on the Investment Company Institute’s Board of Governors and Executive Committee from 2008-2011 as well the Governing Council of the Independent Directors Council from 2006-2011 and the Independent Directors Council Executive Committee from 2008-2011. Chairman of the IDC from 2008-2010. Institutional Investor (Fund Directions) Trustee of Year in 2007. Trustee of the Evergreen Funds complex (and its predecessors) from 1984 to 2010. Chairman of the Evergreen Funds from 2000-2010. Former Trustee of the Mentor Funds. Retired Attorney, Law Offices of Michael S. Scofield. | | Asset Allocation Trust |
| * | Length of service dates reflect the Trustee’s commencement of service with the Trust’s predecessor entities, where applicable. |
Officers
| | | | | | |
Name and year of birth | | Position held and
length of service | | Principal occupations during past five years or longer | | |
Karla M. Rabusch (Born 1959) | | President, since 2003 | | Executive Vice President of Wells Fargo Bank, N.A. and President of Wells Fargo Funds Management, LLC since 2003. | | |
Jeremy DePalma1 (Born 1974) | | Treasurer, since 2012 | | Senior Vice President of Wells Fargo Funds Management, LLC since 2009. Senior Vice President of Evergreen Investment Management Company, LLC from 2008 to 2010 and head of the Fund Reporting and Control Team within Fund Administration from 2005 to 2010. | | |
C. David Messman (Born 1960) | | Secretary, since 2000; Chief Legal Officer, since 2003 | | Senior Vice President and Secretary of Wells Fargo Funds Management, LLC since 2001. Assistant General Counsel of Wells Fargo Bank, N.A. since 2013 and Vice President and Managing Counsel of Wells Fargo Bank, N.A. from 1996 to 2013. | | |
Michael Whitaker (Born 1967) | | Chief Compliance Officer, since 2016* | | Executive Vice President of Wells Fargo Funds Management, LLC since 2016. Chief Compliance Officer of Fidelity’s Fixed Income Funds and Asset Allocation Funds from 2008 to 2016, Compliance Officer of FMR Co., Inc. from 2014 to 2016, Fidelity Investments Money Management, Inc. from 2014 to 2016, Fidelity Investments from 2007 to 2016. | | |
David Berardi (Born 1975) | | Assistant Treasurer, since 2009 | | Vice President of Wells Fargo Funds Management, LLC since 2009. Vice President of Evergreen Investment Management Company, LLC from 2008 to 2010. Manager of Fund Reporting and Control for Evergreen Investment Management Company, LLC from 2004 to 2010. | | |
| 1 | Jeremy DePalma acts as Treasurer of 68 funds and Assistant Treasurer of 71 funds in the Fund Complex. |
| 2 | The Statement of Additional Information includes additional information about the Trustees and is available, without charge, upon request, by calling 1-800-222-8222 or by visiting the website at wellsfargofunds.com. |
| * | Michael Whitaker became Chief Compliance Officer effective May 16, 2016. |
| | | | | | |
| Other information (unaudited) | | Wells Fargo Endeavor Select Fund | | | 31 | |
BOARD CONSIDERATION OF INVESTMENT MANAGEMENT AND SUB-ADVISORY AGREEMENTS:
Under the Investment Company Act of 1940 (the “1940 Act”), the Board of Trustees (the “Board”) of Wells Fargo Funds Trust (the “Trust”) must determine annually whether to approve the continuation of the Trust’s investment management and sub-advisory agreements. In this regard, at an in-person meeting held on May 24-25, 2016 (the “Meeting”), the Board, all the members of which have no direct or indirect interest in the investment management and sub-advisory agreements and are not “interested persons” of the Trust, as defined in the 1940 Act (the “Independent Trustees”), reviewed and approved for Wells Fargo Endeavor Select Fund (the “Fund”): (i) an investment management agreement (the “Management Agreement”) with Wells Fargo Funds Management, LLC (“Funds Management”); and (ii) an investment sub-advisory agreement (the “Sub-Advisory Agreement”) with Wells Capital Management Incorporated (the “Sub-Adviser”), an affiliate of Funds Management. The Management Agreement and the Sub-Advisory Agreement are collectively referred to as the “Advisory Agreements.”
At the Meeting, the Board considered the factors and reached the conclusions described below relating to the selection of Funds Management and the Sub-Adviser and the approval of the Advisory Agreements. Prior to the Meeting, including at an in-person meeting in April 2016, the Trustees conferred extensively among themselves and with representatives of Funds Management about these matters. Also, the Board has adopted a team-based approach, with each team consisting of a sub-set of Trustees, to assist the full Board in the discharge of its duties in reviewing performance and other matters throughout the year. The Independent Trustees were assisted in their evaluation of the Advisory Agreements by independent legal counsel, from whom they received separate legal advice and with whom they met separately.
In providing information to the Board, Funds Management and the Sub-Adviser were guided by a detailed set of requests for information submitted to them by independent legal counsel on behalf of the Independent Trustees at the start of the Board’s annual contract renewal process earlier in 2016. In considering and approving the Advisory Agreements, the Trustees considered the information they believed relevant, including but not limited to the information discussed below. The Board considered not only the specific information presented in connection with the Meeting, but also the knowledge gained over time through interaction with Funds Management and the Sub-Adviser about various topics. In this regard, the Board reviewed reports of Funds Management at each of its quarterly meetings, which included, among other things, portfolio reviews and performance reports. In addition, the Board and the teams mentioned above confer with portfolio managers at various times throughout the year. The Board did not identify any particular information or consideration that was all-important or controlling, and each individual Trustee may have attributed different weights to various factors.
After its deliberations, the Board unanimously approved the continuation of the Advisory Agreements for a one-year term and determined that the compensation payable to Funds Management and the Sub-Adviser under each of the Advisory Agreements was reasonable. The Board considered the approval of the Advisory Agreements for the Fund as part of its consideration of agreements for funds across the complex, but its approvals were made on a fund-by-fund basis. The following summarizes a number of important, but not necessarily all, factors considered by the Board in support of its approvals.
Nature, extent and quality of services
The Board received and considered various information regarding the nature, extent and quality of services provided to the Fund by Funds Management and the Sub-Adviser under the Advisory Agreements. This information included a description of the investment advisory services and Fund-level administrative services covered by the Management Agreement, as well as, among other things, a summary of the background and experience of senior management of Funds Management, and the qualifications, background, tenure and responsibilities of each of the portfolio managers primarily responsible for the day-to-day portfolio management of the Fund.
The Board evaluated the ability of Funds Management and the Sub-Adviser to attract and retain qualified investment professionals, including research, advisory and supervisory personnel. The Board further considered the compliance programs and compliance records of Funds Management and the Sub-Adviser. In addition, the Board took into account the full range of services provided to the Fund by Funds Management and its affiliates.
Fund performance and expenses
The Board considered the performance results for the Fund over various time periods ended December 31, 2015. The Board considered these results in comparison to the performance of funds in a universe that was determined by Broadridge Inc. (“Broadridge”) to be similar to the Fund (the “Universe”), and in comparison to the Fund’s benchmark index and to other comparative data. Broadridge is an independent provider of investment company data. The Board received a description of the methodology used by Broadridge to select the mutual funds in the performance Universe. The Board noted that the performance of the Fund (Administrator Class) was lower than the average performance of the Universe for all periods under review. The Board also noted that the performance of the Fund was lower than its benchmark, the Russell 1000® Growth Index, for all periods under review.
| | | | |
| 32 | | Wells Fargo Endeavor Select Fund | | Other information (unaudited) |
The Board received information concerning, and discussed factors contributing to, the underperformance of the Fund relative to the Universe and benchmark for the periods noted above. The Board took note of the explanations for the relative underperformance in these periods, including with respect to market factors and investment decisions that affected the Fund’s performance.
The Board also received and considered information regarding the Fund’s net operating expense ratios and their various components, including actual management fees, custodian and other non-management fees, and Rule 12b-1 and non-Rule 12b-1 shareholder service fees. The Board considered these ratios in comparison to the median ratios of funds in class-specific expense groups that were determined by Broadridge to be similar to the Fund (the “Groups”). The Board received a description of the methodology used by Broadridge to select the mutual funds in the expense Groups and an explanation of how funds comprising expense groups and their expense ratios may vary from year-to-year. Based on the Broadridge reports, the Board noted that the net operating expense ratios of the Fund were lower than the median net operating expense ratios of the expense Groups.
The Board took into account the Fund performance and expense information provided to it among the factors considered in deciding to re-approve the Advisory Agreements.
Investment management and sub-advisory fee rates
The Board reviewed and considered the contractual fee rates payable by the Fund to Funds Management under the Management Agreement, as well as the contractual fee rates payable by the Fund to Funds Management for class-level administrative services under a Class-Level Administration Agreement, which include class-level transfer agency and sub-transfer agency costs (collectively, the “Management Rates”). The Board also reviewed and considered the contractual investment sub-advisory fee rates that are payable by Funds Management to the Sub-Adviser for investment sub-advisory services.
Among other information reviewed by the Board was a comparison of the Fund’s Management Rates with the average contractual investment management fee rates of funds in the expense Groups at a common asset level as well as transfer agency costs of the funds in the expense Groups. The Board noted that the Management Rates of the Fund were in range of the sum of these average rates for the Fund’s expense Groups for all share classes.
The Board also received and considered information about the portion of the total management fee that was retained by Funds Management after payment of the fee to the Sub-Adviser for sub-advisory services. In assessing the reasonableness of this amount, the Board received and evaluated information about the nature and extent of responsibilities retained and risks assumed by Funds Management and not delegated to or assumed by the Sub-Adviser, and about Funds Management’s on-going oversight services. However, given the affiliation between Funds Management and the Sub-Adviser, the Board ascribed limited relevance to the allocation of fees between them.
The Board also received and considered information about the nature and extent of services offered and fee rates charged by Funds Management and the Sub-Adviser to other types of clients with investment strategies similar to those of the Fund. In this regard, the Board received information about the significantly greater scope of services, and compliance, reporting and other legal burdens and risks of managing mutual funds compared with those associated with managing assets of non-mutual fund clients such as collective funds or institutional separate accounts.
Based on its consideration of the factors and information it deemed relevant, including those described here, the Board determined that the compensation payable to Funds Management under the Management Agreement and to the Sub-Adviser under the Sub-Advisory Agreement was reasonable, in light of the services covered by the Advisory Agreements.
Profitability
The Board received and considered information concerning the profitability of Funds Management, as well as the profitability of Wells Fargo as a whole, from providing services to the Fund and the fund family as a whole. The Board also received and considered information concerning the profitability of the Sub-Adviser from providing services to the fund family as a whole, noting that the Sub-Adviser’s profitability information with respect to providing services to the Fund was subsumed in the Wells Fargo and Funds Management profitability analysis.
Funds Management reported on the methodologies and estimates used in calculating profitability. Among other things, the Board noted that the levels of profitability reported on a fund-by-fund basis varied widely, depending on factors such as the size and type of fund. Based on its review, the Board did not deem the profits reported by Funds Management or Wells Fargo from its services to the Fund to be at a level that would prevent it from approving the continuation of the Advisory Agreements.
| | | | | | |
| Other information (unaudited) | | Wells Fargo Endeavor Select Fund | | | 33 | |
Economies of scale
With respect to possible economies of scale, the Board noted the existence of breakpoints in the Fund’s management fee structure, which operate generally to reduce the Fund’s expense ratios as the Fund grows in size. It considered that, for a small fund or a fund that shrinks in size, breakpoints conversely can result in higher fee levels. The Board also considered that fee waiver and expense reimbursement arrangements and competitive fee rates at the outset are means of sharing potential economies of scale with shareholders of the Fund and the fund family as a whole. The Board considered Funds Management’s view that any analyses of potential economies of scale in managing a particular fund are inherently limited in light of the joint and common costs and investments that Funds Management incurs across the fund family as a whole.
The Board concluded that the Fund’s fee and expense arrangements, including contractual breakpoints, constituted a reasonable approach to sharing potential economies of scale with the Fund and its shareholders.
Other benefits to Funds Management and the Sub-Adviser
The Board received and considered information regarding potential “fall-out” or ancillary benefits received by Funds Management and its affiliates, including the Sub-Adviser, as a result of their relationships with the Fund. Ancillary benefits could include, among others, benefits directly attributable to other relationships with the Fund and benefits potentially derived from an increase in Funds Management’s and the Sub-Adviser’s business as a result of their relationships with the Fund. The Board noted that various affiliates of Funds Management may receive distribution-related fees, shareholder servicing payments and sub-transfer agency fees in respect of shares sold or held through them and services provided.
The Board also reviewed information about soft dollar credits earned and utilized by the Sub-Adviser, fees earned by Funds Management and the Sub-Adviser from managing a private investment vehicle for the fund family’s securities lending collateral and commissions earned by an affiliated broker from portfolio transactions.
Based on its consideration of the factors and information it deemed relevant, including those described here, the Board did not find that any ancillary benefits received by Funds Management and its affiliates, including the Sub-Adviser, were unreasonable.
Conclusion
At the Meeting, after considering the above-described factors and based on its deliberations and its evaluation of the information described above, the Board unanimously approved the continuation of the Advisory Agreements for a one-year term and determined that the compensation payable to Funds Management and the Sub-Adviser under each of the Advisory Agreements was reasonable.
| | | | |
| 34 | | Wells Fargo Endeavor Select Fund | | List of abbreviations |
The following is a list of common abbreviations for terms and entities that may have appeared in this report.
| ACA | — ACA Financial Guaranty Corporation |
| ADR | — American depositary receipt |
| ADS | — American depositary shares |
| AGC | — Assured Guaranty Corporation |
| AGM | — Assured Guaranty Municipal |
| Ambac | — Ambac Financial Group Incorporated |
| AMT | — Alternative minimum tax |
| BAN | — Bond anticipation notes |
| BHAC | — Berkshire Hathaway Assurance Corporation |
| CAB | — Capital appreciation bond |
| CCAB | — Convertible capital appreciation bond |
| CDA | — Community Development Authority |
| CDO | — Collateralized debt obligation |
| DRIVER | — Derivative inverse tax-exempt receipts |
| DW&P | — Department of Water & Power |
| DWR | — Department of Water Resources |
| ECFA | — Educational & Cultural Facilities Authority |
| EDA | — Economic Development Authority |
| EDFA | — Economic Development Finance Authority |
| ETF | — Exchange-traded fund |
| FDIC | — Federal Deposit Insurance Corporation |
| FFCB | — Federal Farm Credit Banks |
| FGIC | — Financial Guaranty Insurance Corporation |
| FHA | — Federal Housing Administration |
| FHLB | — Federal Home Loan Bank |
| FHLMC | — Federal Home Loan Mortgage Corporation |
| FICO | — The Financing Corporation |
| FNMA | — Federal National Mortgage Association |
| GDR | — Global depositary receipt |
| GNMA | — Government National Mortgage Association |
| HCFR | — Healthcare facilities revenue |
| HEFA | — Health & Educational Facilities Authority |
| HEFAR | — Higher education facilities authority revenue |
| HFA | — Housing Finance Authority |
| HFFA | — Health Facilities Financing Authority |
| HUD | — Department of Housing and Urban Development |
| IDA | — Industrial Development Authority |
| IDAG | — Industrial Development Agency |
| KRW | — Republic of Korea won |
| LIBOR | — London Interbank Offered Rate |
| LIFER | — Long Inverse Floating Exempt Receipts |
| LLC | — Limited liability company |
| LLLP | — Limited liability limited partnership |
| LLP | — Limited liability partnership |
| MBIA | — Municipal Bond Insurance Association |
| MFHR | — Multifamily housing revenue |
| MSTR | — Municipal securities trust receipts |
| MUD | — Municipal Utility District |
| National | — National Public Finance Guarantee Corporation |
| PCFA | — Pollution Control Financing Authority |
| PCL | — Public Company Limited |
| PCR | — Pollution control revenue |
| PFA | — Public Finance Authority |
| PFFA | — Public Facilities Financing Authority |
| PFOTER | — Puttable floating option tax-exempt receipts |
| plc | — Public limited company |
| PUTTER | — Puttable tax-exempt receipts |
| R&D | — Research & development |
| Radian | — Radian Asset Assurance |
| RAN | — Revenue anticipation notes |
| RDA | — Redevelopment Authority |
| RDFA | — Redevelopment Finance Authority |
| REIT | — Real estate investment trust |
| ROC | — Reset option certificates |
| SAVRS | — Select auction variable rate securities |
| SBA | — Small Business Authority |
| SDR | — Swedish depositary receipt |
| SFHR | — Single-family housing revenue |
| SFMR | — Single-family mortgage revenue |
| SPA | — Standby purchase agreement |
| SPDR | — Standard & Poor’s Depositary Receipts |
| SPEAR | — Short Puttable Exempt Adjustable Receipts |
| STRIPS | — Separate trading of registered interest and |
| TAN | — Tax anticipation notes |
| TIPS | — Treasury inflation-protected securities |
| TRAN | — Tax revenue anticipation notes |
| TTFA | — Transportation Trust Fund Authority |
| TVA | — Tennessee Valley Authority |
This page is intentionally left blank.
This page is intentionally left blank.

For more information
More information about Wells Fargo Funds is available free upon request. To obtain literature, please write, email, visit the Fund’s website, or call:
Wells Fargo Funds
P.O. Box 8266
Boston, MA 02266-8266
Email: fundservice@wellsfargo.com
Website: wellsfargofunds.com
Individual investors: 1-800-222-8222
Retail investment professionals: 1-888-877-9275
Institutional investment professionals: 1-866-765-0778
This report and the financial statements contained herein are submitted for the general information of the shareholders of the Fund. If this report is used for promotional purposes, distribution of the report must be accompanied or preceded by a current prospectus. Before investing, please consider the investment objectives, risks, charges, and expenses of the investment. For a current prospectus and, if available, a summary prospectus, containing this information, call 1-800-222-8222 or visit the Fund’s website at wellsfargofunds.com. Read the prospectus carefully before you invest or send money.
Wells Fargo Asset Management (WFAM) is a trade name used by the asset management businesses of Wells Fargo & Company. Wells Fargo Funds Management, LLC, a wholly owned subsidiary of Wells Fargo & Company, provides investment advisory and administrative services for Wells Fargo Funds. Other affiliates of Wells Fargo & Company provide subadvisory and other services for the funds. The funds are distributed by Wells Fargo Funds Distributor, LLC, Member FINRA, an affiliate of Wells Fargo & Company.
NOT FDIC INSURED ¡ NO BANK GUARANTEE ¡ MAY LOSE VALUE
© 2016 Wells Fargo Funds Management, LLC. All rights reserved.
| | |
 | | 245322 09-16 A205/AR205 07-16 |
Annual Report
July 31, 2016

Wells Fargo Growth Fund


Reduce clutter. Save trees.
Sign up for electronic delivery of prospectuses and shareholder reports at wellsfargo.com/advantagedelivery
Contents
The views expressed and any forward-looking statements are as of July 31, 2016, unless otherwise noted, and are those of the Fund managers and/or Wells Fargo Funds Management, LLC. Discussions of individual securities, or the markets generally, or any Wells Fargo Fund are not intended as individual recommendations. Future events or results may vary significantly from those expressed in any forward-looking statements. The views expressed are subject to change at any time in response to changing circumstances in the market. Wells Fargo Funds Management, LLC and the Fund disclaim any obligation to publicly update or revise any views expressed or forward-looking statements.
NOT FDIC INSURED ¡ NO BANK GUARANTEE ¡ MAY LOSE VALUE
| | | | |
| 2 | | Wells Fargo Growth Fund | | Letter to shareholders (unaudited) |

Karla M. Rabusch
President
Wells Fargo Funds
Despite significant market fluctuations over the course of the year, U.S. stocks delivered positive results overall for the 12-month reporting period
Dear Valued Shareholder:
We are pleased to offer you this annual report for the Wells Fargo Growth Fund for the 12-month period that ended July 31, 2016. During this period, which began August 1, 2015, U.S. and international stock markets experienced heightened volatility, with intermittent rebounds interspersed with sell-offs. The U.S. economy displayed resilience throughout the period, although growth was somewhat sluggish amid ongoing pressures that included slowing growth in China, a strengthening U.S. dollar, and uncertainty regarding interest-rate increases by the U.S. Federal Reserve (Fed); international economies faced deeper ongoing challenges. During June 2016, global markets became especially volatile as the U.K.’s vote over whether to leave the European Union (E.U.) approached. However, markets began recovering shortly after the U.K. voted to leave and rallied through July. Despite significant market fluctuations over the course of the year, U.S. stocks delivered positive results overall for the 12-month reporting period, as measured by the Russell 1000® Index.1 International markets generally declined as measured by the Morgan Stanley Capital International (MSCI) Europe, Australasia, Far East (EAFE) Index.2
In the third quarter of 2015, China’s slowdown took a toll on economies and markets worldwide.
U.S. stocks sagged during the quarter, experiencing the most volatility since 2011. Economic data released during the quarter suggested the U.S. economy remained solid but had lost some steam, burdened by the drag of the U.S. dollar’s strength coupled with global economic turmoil. The fact that the Fed left the federal funds interest rate unchanged at its September 2015 meeting surprised investors and fueled increased uncertainty about the U.S. economy’s stamina to remain healthy while facing the challenges of slowing growth in China and troubles elsewhere in the world. Outside the U.S., markets were even more volatile and delivered generally weaker quarterly results, also largely due to investors’ increasing anxiety over China’s weakened economy.
Despite ongoing concerns, U.S. stocks generally rose in the fourth quarter of 2015; international markets lagged.
While the broad U.S. stock market bounced back in the quarter, stock markets outside the U.S. failed to keep pace as economic concerns, including China’s ongoing slowdown, continued to affect many countries. U.S. economic data released during the quarter indicated the economy remained solid, although the strong U.S. dollar and weakness in international economies remained headwinds. In December, the Fed, as expected, raised its target interest rate by 25 basis points (bps; 100 bps equals 1.00%) after keeping it near zero for seven years. The move reflected confidence in the U.S. economy’s ability to stay healthy with less central-bank support. The Fed also clarified that future interest-rate increases would be gradual.
| 1 | The Russell 1000® Index measures the performance of the 1,000 largest companies in the Russell 3000® Index, which represents approximately 92% of the total market capitalization of the Russell 3000® Index. You cannot invest directly in an index. |
| 2 | Morgan Stanley Capital International (MSCI) Europe, Australasia, Far East (EAFE) Index is a free-float-adjusted market-capitalization-weighted index that is designed to measure the equity market performance of developed markets, excluding the United States and Canada. The MSCI EAFE Index consists of the following 21 developed markets country indexes: Australia, Austria, Belgium, Denmark, Finland, France, Germany, Hong Kong, Ireland, Israel, Italy, Japan, the Netherlands, New Zealand, Norway, Portugal, Singapore, Spain, Sweden, Switzerland, and the United Kingdom. You cannot invest directly in an index. |
| | | | | | |
| Letter to shareholders (unaudited) | | Wells Fargo Growth Fund | | | 3 | |
In the first quarter of 2016, market volatility increased globally amid ongoing concerns.
Stock markets worldwide fluctuated widely in the first quarter of 2016. Most sold off sharply in the first six weeks of the year on concerns such as weak global growth, falling commodity prices, and uncertainty over the timing and impact of the Fed’s interest-rate increases. As the quarter progressed, fears abated somewhat and global markets generally rallied back. The U.S. economy ended the quarter on a positive note as much of the quarter’s data reflected resiliency. With ongoing uncertainties about global growth and financial markets, however, the Fed held off from raising the target interest rate during the quarter. Outside the U.S., the eurozone fell into deflation in February; in response, the European Central Bank announced an expansion of its stimulus program. In China, the government in March set a growth rate of 6.5% to 7.0% for 2016, an acknowledgment of weakening growth. In emerging markets, although central-bank stimulus and improved prices for oil and other commodities led to stock-market rallies in the quarter, many of these countries’ economies face credit downgrades due to challenges such as the likelihood of a stronger U.S. dollar, which would make dollar-denominated debt more expensive.
Worries over interest rates and the U.K.’s vote largely drove the markets during the second quarter of 2016.
U.S. stocks began the quarter in positive territory but started to lose steam in early May on worries that a possible June interest-rate increase by the Fed could hurt the market. In mid-May, stocks briefly plunged following comments by Fed officials noting that a June interest-rate increase remained on the table. But once investors had processed this information, stocks again rallied, finishing up for the month. The first three weeks of June brought heightened volatility, spurred largely by a disappointing jobs report and uncertainty over whether the U.K. would remain in the E.U. The U.K.’s Brexit vote on June 23 shocked countries in Europe and much of the rest of the world. Stock markets plummeted as investors worried that the U.K.’s departure from the E.U. would slow global growth and prolong the low-interest-rate environment. Following the initial rout, however, U.S. stocks rallied as investors seemed to decide that any negative effects would be more localized and not create a serious risk for global growth. By quarter-end, the broad U.S. stock market had moved back into positive territory.
Stocks generally posted positive results for July 2016.
U.S. stocks displayed the most momentum during the first two weeks of the month, buoyed partly by an unexpectedly favorable June jobs report that helped strengthen confidence in the U.S. economy. Also, investors perhaps felt that global central banks could extend stimulus measures in the wake of the Brexit vote. Although U.S. market momentum slowed during the second half of July, stocks ended in positive territory for the month. International stocks delivered positive monthly results as well.
| | | | |
| 4 | | Wells Fargo Growth Fund | | Letter to shareholders (unaudited) |
Don’t let short-term uncertainty derail long-term investment goals.
Periods of uncertainty can present challenges, but experience has taught us that maintaining long-term investment goals can be an effective way to plan for the future. To help you create a sound strategy based on your personal goals and risk tolerance, Wells Fargo Funds offers more than 100 mutual funds spanning a wide range of asset classes and investment styles. Although diversification cannot guarantee an investment profit or prevent losses, we believe it can be an effective way to manage investment risk and potentially smooth out overall portfolio performance. We encourage investors to know their investments and to understand that appropriate levels of risk-taking may unlock opportunities.
Thank you for choosing to invest in Wells Fargo Funds. We appreciate your confidence in us and remain committed to helping you meet your financial needs.
Sincerely,

Karla M. Rabusch
President
Wells Fargo Funds
Although diversification cannot guarantee an investment profit or prevent losses, we believe it can be an effective way to manage investment risk and potentially smooth out overall portfolio performance.
For further information about your Fund, contact your investment professional, visit our website at wellsfargofunds.com, or call us directly at 1-800-222-8222. We are available 24 hours a day, 7 days a week.
This page is intentionally left blank.
| | | | |
| 6 | | Wells Fargo Growth Fund | | Performance highlights (unaudited) |
Investment objective
The Fund seeks long-term capital appreciation.
Manager
Wells Fargo Funds Management, LLC
Subadviser
Wells Capital Management Incorporated
Portfolio managers
Joseph M. Eberhardy, CFA®, CPA
Thomas C. Ognar, CFA®
Bruce C. Olson, CFA®
Average annual total returns (%) as of July 31, 20161
| | | | | | | | | | | | | | | | | | | | | | | | | | | | | | | | | | |
| | | | | Including sales charge | | | Excluding sales charge | | | Expense ratios2 (%) | |
| | | Inception date | | 1 year | | | 5 year | | | 10 year | | | 1 year | | | 5 year | | | 10 year | | | Gross | | | Net3 | |
| Class A (SGRAX) | | 2-24-2000 | | | (7.34 | ) | | | 9.28 | | | | 10.58 | | | | (1.69 | ) | | | 10.58 | | | | 11.24 | | | | 1.13 | | | | 1.13 | |
| Class C (WGFCX) | | 12-26-2002 | | | (3.44 | ) | | | 9.76 | | | | 10.41 | | | | (2.44 | ) | | | 9.76 | | | | 10.41 | | | | 1.88 | | | | 1.88 | |
| Class R6 (SGRHX) | | 9-30-2015 | | | – | | | | – | | | | – | | | | (1.25 | ) | | | 11.07 | | | | 11.75 | | | | 0.70 | | | | 0.70 | |
| Administrator Class (SGRKX) | | 8-30-2002 | | | – | | | | – | | | | – | | | | (1.53 | ) | | | 10.82 | | | | 11.54 | | | | 1.05 | | | | 0.96 | |
| Institutional Class (SGRNX) | | 2-24-2000 | | | – | | | | – | | | | – | | | | (1.31 | ) | | | 11.05 | | | | 11.74 | | | | 0.80 | | | | 0.75 | |
| Russell 3000® Growth Index4 | | – | | | – | | | | – | | | | – | | | | 3.57 | | | | 13.39 | | | | 9.41 | | | | – | | | | – | |
Figures quoted represent past performance, which is no guarantee of future results, and do not reflect taxes that a shareholder may pay on fund distributions or the redemption of fund shares. Investment return and principal value of an investment will fluctuate so that an investor’s shares, when redeemed, may be worth more or less than their original cost. Performance shown without sales charges would be lower if sales charges were reflected. Current performance may be lower or higher than the performance data quoted, which assumes the reinvestment of dividends and capital gains. Current month-end performance is available on the Fund’s website, wellsfargofunds.com.
Index returns do not include transaction costs associated with buying and selling securities, any mutual fund fees or expenses, or any taxes. It is not possible to invest directly in an index.
For Class A shares, the maximum front-end sales charge is 5.75%. For Class C shares, the maximum contingent deferred sales charge is 1.00%. Performance including a contingent deferred sales charge assumes the sales charge for the corresponding time period. Class R6, Administrator Class, and Institutional Class shares are sold without a front-end sales charge or contingent deferred sales charge.
Stock values fluctuate in response to the activities of individual companies and general market and economic conditions. Certain investment strategies tend to increase the total risk of an investment (relative to the broader market). The Fund is exposed to foreign investment risk and smaller-company securities risk. Consult the Fund’s prospectus for additional information on these and other risks.
Please see footnotes on page 7.
| | | | | | |
| Performance highlights (unaudited) | | Wells Fargo Growth Fund | | | 7 | |
|
| Growth of $10,000 investment as of July 31, 20165 |
|
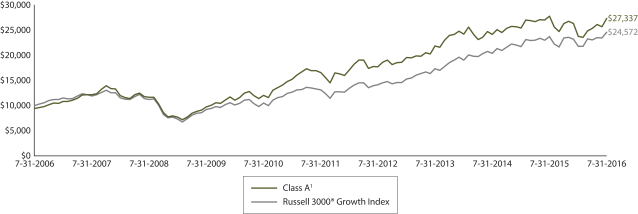 |
| 1 | Effective June 20, 2008, Advisor Class was renamed Class A and modified to assume the features and attributes of Class A. Historical performance shown for Class A shares through June 20, 2008, includes Advisor Class expenses. Historical performance shown for Class R6 shares prior to their inception reflects the performance of Institutional Class shares, and includes the higher expenses applicable to Institutional Class shares. If these expenses had not been included, returns would be higher. |
| 2 | Reflects the expense ratios as stated in the most recent prospectuses. The expense ratios shown are subject to change and may differ from the annualized expense ratios shown in the financial highlights of this report. |
| 3 | The manager has contractually committed through November 30, 2016, to waive fees and/or reimburse expenses to the extent necessary to cap the Fund’s Total Annual Fund Operating Expenses After Fee Waiver at 1.21% for Class A, 1.96% for Class C, 0.70% for Class R6, 0.96% for Administrator Class, and 0.75% for Institutional Class. After this time, the cap may be increased or the commitment to maintain the cap may be terminated only with the approval of the Board of Trustees. Brokerage commissions, stamp duty fees, interest, taxes, acquired fund fees and expenses, and extraordinary expenses are excluded from the expense cap. Without this cap, the Fund’s returns would have been lower. |
| 4 | The Russell 3000® Growth Index measures the performance of those Russell 3000 companies with higher price-to-book ratios and higher forecasted growth values. The stocks in this index are also members of either the Russell 1000® Growth Index or the Russell 2000® Growth Index. You cannot invest directly in an index. |
| 5 | The chart compares the performance of Class A shares for the most recent ten years with the Russell 3000® Growth Index. The chart assumes a hypothetical investment of $10,000 in Class A shares and reflects all operating expenses and assumes the maximum initial sales charge of 5.75%. |
| 6 | The ten largest holdings, excluding cash and cash equivalents, are calculated based on the value of the investments divided by total net assets of the Fund. Holdings are subject to change and may have changed since the date specified. |
| 7 | Amounts are calculated based on the total long-term investments of the Fund. These amounts are subject to change and may have changed since the date specified. |
| | | | |
| 8 | | Wells Fargo Growth Fund | | Performance highlights (unaudited) |
MANAGER’S DISCUSSION
Fund highlights
| n | | The Fund underperformed its benchmark, the Russell 3000® Growth Index, for the 12-month period that ended July 31, 2016. |
| n | | Holdings within the health care and information technology (IT) sectors contributed to the Fund’s underperformance for the period. An underweight to slower-growing stocks in the consumer staples sector also detracted from results as investors sought higher-yielding stocks. |
| n | | The market environment often was influenced by investor sentiment rather than by fundamentals during the period, which presented a general challenge for our emphasis on adding value through bottom-up stock selection. |
Small-cap stocks struggled during the period.
Over the course of the 12 months, investors demonstrated a strong preference for the perceived safety of mega-cap stocks as uncertainty continued about the prospects for global growth. As a result, small-cap growth stocks experienced elevated volatility for much of the period and detracted from the Fund’s performance. While small-cap growth stocks recovered slightly by the end of the period, they significantly underperformed their large-cap counterparts for the 12-month period that ended July 31, 2016.
The ongoing low-interest-rate environment drove investors’ demand for dividend yield, hindering Fund results.
Faced with the prospect of historically low interest rates and, in some countries, negative interest rates, investors continued to seek alternative sources of income via dividend-paying stocks. Stocks paying a dividend yield larger than 2% contributed disproportionately to the total return of the Russell 3000® Growth Index for the period. Due to its focus on faster-growing stocks, the Fund tends to be significantly underweight dividend-paying stocks compared with the index; this characteristic significantly contributed to the Fund’s underperformance for the period. While investors’ preference for dividend yield challenged our investment process at times during the period, it also led to historically attractive relative valuations for faster-growing stocks, which could bode well for future Fund performance.
| | | | |
| Ten largest holdings (%) as of July 31, 20166 | |
Alphabet Incorporated Class A | | | 5.20 | |
Facebook Incorporated Class A | | | 5.16 | |
Amazon.com Incorporated | | | 4.44 | |
Visa Incorporated Class A | | | 3.07 | |
Microchip Technology Incorporated | | | 2.87 | |
Dollar Tree Incorporated | | | 2.55 | |
Burlington Stores Incorporated | | | 2.49 | |
MarketAxess Holdings Incorporated | | | 2.48 | |
Acadia Healthcare Company Incorporated | | | 2.47 | |
MasterCard Incorporated Class A | | | 2.45 | |
Results from the Fund’s health care and IT holdings detracted from performance.
Within health care, biotechnology holdings detracted notably over the period. Although these companies tended to experience solid demand for existing medical solutions, their stocks suffered significant declines in the first half of 2016. Multiple factors drove the share-price weakness, including the negative effects of ongoing political rhetoric concerning potential drug-pricing controls and less-robust fundamental outlooks for several companies.
Within the IT sector, several holdings with significant market opportunities within faster-growing areas, such as cloud services, data analytics, and network security,
displayed weakness. Although these holdings generally delivered solid growth fundamentals, they experienced significant volatility as investors reacted to global economic uncertainties. At times during the period, investors preferred select mega-cap IT stocks, often at the expense of many small- and mid-cap IT companies that were actively reinvesting in their businesses to expand their market share.
Holdings within the consumer discretionary, energy, and materials sectors contributed positively to performance.
Within the consumer discretionary sector, the Fund benefited from solid performance by holdings with strong secular growth. Retail companies focused on the lower-end consumer continued to perform well as their business models tend to be more resistant to the pressures of Amazon.com, Incorporated, and other online retailers. Among the Fund’s energy holdings, exploration and production company Concho Resources Incorporated, which has fracking operations in the
Please see footnotes on page 7.
| | | | | | |
| Performance highlights (unaudited) | | Wells Fargo Growth Fund | | | 9 | |
Permian Basin, delivered favorable results as oil prices rallied off their February 2016 lows. Within the materials sector, Airgas, Incorporated, performed well as investors rewarded companies with proven business models that offered consistent results.
|
| Sector distribution as of July 31, 20167 |
|
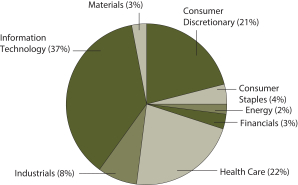 |
We continue to focus on consistently implementing our process.
Over the course of the 12-month period, we made modest adjustments to the Fund to potentially capitalize on opportunities and position for the future. Using our bottom-up research process, we added IT companies that met our criteria for robust, sustainable growth that appears underappreciated by the market. We funded these purchases primarily with the proceeds from sales of holdings in the health care and consumer discretionary sectors.
Given the abundant political and economic headlines dominating the media in the U.S. and worldwide, we
expect to see continued market volatility heading into the summer of 2016 and likely through the U.S. general election in November 2016. As this volatility occurs, we intend to take advantage of potential opportunities as the valuation gaps of the companies held within the Fund widen and contract. We maintain strong conviction for the rapidly growing companies within the portfolio; many holdings have been trading at or near multiyear-low valuations relative to the broad market. Our investment strategy—seeking robust growth companies with sustainable business models that are underappreciated by investors—should position us, going forward, to take advantage of opportunities within the market for the benefit of Fund shareholders.
Please see footnotes on page 7.
| | | | |
| 10 | | Wells Fargo Growth Fund | | Fund expenses (unaudited) |
As a shareholder of the Fund, you incur two types of costs: (1) transaction costs, including sales charges (loads) on purchase payments and contingent deferred sales charges (if any) on redemptions and (2) ongoing costs, including management fees, distribution (12b-1) and/or shareholder servicing fees, and other Fund expenses. This example is intended to help you understand your ongoing costs (in dollars) of investing in the Fund and to compare these costs with the ongoing costs of investing in other mutual funds.
The example is based on an investment of $1,000 invested at the beginning of the six-month period and held for the entire period from February 1, 2016 to July 31, 2016.
Actual expenses
The “Actual” line of the table below provides information about actual account values and actual expenses. You may use the information in this line, together with the amount you invested, to estimate the expenses that you paid over the period. Simply divide your account value by $1,000 (for example, an $8,600 account value divided by $1,000 = 8.6), then multiply the result by the number in the “Actual” line under the heading entitled “Expenses paid during period” for your applicable class of shares to estimate the expenses you paid on your account during this period.
Hypothetical example for comparison purposes
The “Hypothetical” line of the table below provides information about hypothetical account values and hypothetical expenses based on the Fund’s actual expense ratio and an assumed rate of return of 5% per year before expenses, which is not the Fund’s actual return. The hypothetical account values and expenses may not be used to estimate the actual ending account balance or expenses you paid for the period. You may use this information to compare the ongoing costs of investing in the Fund and other funds. To do so, compare this 5% hypothetical example with the 5% hypothetical examples that appear in the shareholder reports of the other funds.
Please note that the expenses shown in the table are meant to highlight your ongoing costs only and do not reflect any transactional costs, such as sales charges (loads) and contingent deferred sales charges. Therefore, the “Hypothetical” line of the table is useful in comparing ongoing costs only and will not help you determine the relative total costs of owning different funds. In addition, if these transactional costs were included, your costs would have been higher.
| | | | | | | | | | | | | | | | |
| | | Beginning
account value
2-1-2016 | | | Ending
account value
7-31-2016 | | | Expenses
paid during
the period¹ | | | Annualized net
expense ratio | |
Class A | | | | | | | | | | | | | | | | |
Actual | | $ | 1,000.00 | | | $ | 1,149.54 | | | $ | 6.11 | | | | 1.14 | % |
Hypothetical (5% return before expenses) | | $ | 1,000.00 | | | $ | 1,019.18 | | | $ | 5.74 | | | | 1.14 | % |
Class C | | | | | | | | | | | | | | | | |
Actual | | $ | 1,000.00 | | | $ | 1,145.20 | | | $ | 10.07 | | | | 1.89 | % |
Hypothetical (5% return before expenses) | | $ | 1,000.00 | | | $ | 1,015.47 | | | $ | 9.46 | | | | 1.89 | % |
Class R6 | | | | | | | | | | | | | | | | |
Actual | | $ | 1,000.00 | | | $ | 1,152.00 | | | $ | 3.75 | | | | 0.70 | % |
Hypothetical (5% return before expenses) | | $ | 1,000.00 | | | $ | 1,021.38 | | | $ | 3.52 | | | | 0.70 | % |
Administrator Class | | | | | | | | | | | | | | | | |
Actual | | $ | 1,000.00 | | | $ | 1,150.42 | | | $ | 5.13 | | | | 0.96 | % |
Hypothetical (5% return before expenses) | | $ | 1,000.00 | | | $ | 1,020.09 | | | $ | 4.82 | | | | 0.96 | % |
Institutional Class | | | | | | | | | | | | | | | | |
Actual | | $ | 1,000.00 | | | $ | 1,151.55 | | | $ | 4.01 | | | | 0.75 | % |
Hypothetical (5% return before expenses) | | $ | 1,000.00 | | | $ | 1,021.13 | | | $ | 3.77 | | | | 0.75 | % |
| 1 | Expenses paid is equal to the annualized net expense ratio of each class multiplied by the average account value over the period, multiplied by the number of days in the most recent fiscal half-year divided by the number of days in the fiscal year (to reflect the one-half-year period). |
| | | | | | |
| Portfolio of investments—July 31, 2016 | | Wells Fargo Growth Fund | | | 11 | |
| | | | | | | | | | | | | | | | |
| Security name | | | | | | | | Shares | | | Value | |
| | | | |
Common Stocks: 99.72% | | | | | | | | | | | | | | | | |
| | | | |
Consumer Discretionary: 20.52% | | | | | | | | | | | | | | | | |
| | | | |
| Auto Components: 0.20% | | | | | | | | | | | | | | | | |
Delphi Automotive plc | | | | | | | | | | | 199,610 | | | $ | 13,537,550 | |
| | | | | | | | | | | | | | | | |
| | | | |
| Distributors: 1.52% | | | | | | | | | | | | | | | | |
LKQ Corporation † | | | | | | | | | | | 3,027,810 | | | | 104,126,386 | |
| | | | | | | | | | | | | | | | |
| | | | |
| Diversified Consumer Services: 0.72% | | | | | | | | | | | | | | | | |
Grand Canyon Education Incorporated † | | | | | | | | | | | 1,172,575 | | | | 49,318,505 | |
| | | | | | | | | | | | | | | | |
| | | | |
| Hotels, Restaurants & Leisure: 2.52% | | | | | | | | | | | | | | | | |
Fiesta Restaurant Group Incorporated † | | | | | | | | | | | 38,700 | | | | 864,558 | |
Starbucks Corporation | | | | | | | | | | | 2,605,960 | | | | 151,275,978 | |
The Habit Restaurants Incorporated Class A †«(l) | | | | | | | | | | | 1,299,600 | | | | 21,105,504 | |
| | | | |
| | | | | | | | | | | | | | | 173,246,040 | |
| | | | | | | | | | | | | | | | |
| | | | |
| Internet & Catalog Retail: 4.44% | | | | | | | | | | | | | | | | |
Amazon.com Incorporated † | | | | | | | | | | | 401,150 | | | | 304,396,632 | |
| | | | | | | | | | | | | | | | |
| | | | |
| Media: 0.36% | | | | | | | | | | | | | | | | |
The Walt Disney Company | | | | | | | | | | | 261,510 | | | | 25,091,885 | |
| | | | | | | | | | | | | | | | |
| | | | |
| Multiline Retail: 2.92% | | | | | | | | | | | | | | | | |
Dollar General Corporation | | | | | | | | | | | 268,600 | | | | 25,447,164 | |
Dollar Tree Incorporated † | | | | | | | | | | | 1,818,250 | | | | 175,079,293 | |
| | | | |
| | | | | | | | | | | | | | | 200,526,457 | |
| | | | | | | | | | | | | | | | |
| | | | |
| Specialty Retail: 6.48% | | | | | | | | | | | | | | | | |
Burlington Stores Incorporated † | | | | | | | | | | | 2,231,320 | | | | 170,718,293 | |
CarMax Incorporated †« | | | | | | | | | | | 34,480 | | | | 2,008,805 | |
Five Below Incorporated † | | | | | | | | | | | 976,813 | | | | 49,827,231 | |
The Home Depot Incorporated | | | | | | | | | | | 427,300 | | | | 59,069,952 | |
Tractor Supply Company | | | | | | | | | | | 1,370,695 | | | | 125,624,197 | |
ULTA Salon, Cosmetics and Fragrance Incorporated † | | | | | | | | | | | 142,000 | | | | 37,091,820 | |
| | | | |
| | | | | | | | | | | | | | | 444,340,298 | |
| | | | | | | | | | | | | | | | |
| | | | |
| Textiles, Apparel & Luxury Goods: 1.36% | | | | | | | | | | | | | | | | |
Under Armour Incorporated Class A †« | | | | | | | | | | | 1,497,800 | | | | 59,103,188 | |
Under Armour Incorporated Class C † | | | | | | | | | | | 966,663 | | | | 34,509,869 | |
| | | | |
| | | | | | | | | | | | | | | 93,613,057 | |
| | | | | | | | | | | | | | | | |
| | | | |
Consumer Staples: 4.53% | | | | | | | | | | | | | | | | |
| | | | |
| Beverages: 0.65% | | | | | | | | | | | | | | | | |
Constellation Brands Incorporated Class A | | | | | | | | | | | 270,000 | | | | 44,450,100 | |
| | | | | | | | | | | | | | | | |
| | | | |
| Food & Staples Retailing: 3.28% | | | | | | | | | | | | | | | | |
Costco Wholesale Corporation | | | | | | | | | | | 549,900 | | | | 91,954,278 | |
Sprouts Farmers Market Incorporated † | | | | | | | | | | | 5,764,800 | | | | 133,339,824 | |
| | | | |
| | | | | | | | | | | | | | | 225,294,102 | |
| | | | | | | | | | | | | | | | |
| | | | |
| Personal Products: 0.60% | | | | | | | | | | | | | | | | |
The Estee Lauder Companies Incorporated Class A | | | | | | | | | | | 443,320 | | | | 41,184,428 | |
| | | | | | | | | | | | | | | | |
The accompanying notes are an integral part of these financial statements.
| | | | |
| 12 | | Wells Fargo Growth Fund | | Portfolio of investments—July 31, 2016 |
| | | | | | | | | | | | | | | | |
| Security name | | | | | | | | Shares | | | Value | |
| | | | |
Energy: 1.58% | | | | | | | | | | | | | | | | |
| | | | |
| Energy Equipment & Services: 0.48% | | | | | | | | | | | | | | | | |
Halliburton Company | | | | | | | | | | | 137,000 | | | $ | 5,981,420 | |
Schlumberger Limited | | | | | | | | | | | 333,600 | | | | 26,861,472 | |
| | | | |
| | | | | | | | | | | | | | | 32,842,892 | |
| | | | | | | | | | | | | | | | |
| | | | |
| Oil, Gas & Consumable Fuels: 1.10% | | | | | | | | | | | | | | | | |
Concho Resources Incorporated † | | | | | | | | | | | 608,570 | | | | 75,584,394 | |
| | | | | | | | | | | | | | | | |
| | | | |
Financials: 2.81% | | | | | | | | | | | | | | | | |
| | | | |
| Capital Markets: 0.34% | | | | | | | | | | | | | | | | |
Raymond James Financial Incorporated | | | | | | | | | | | 253,200 | | | | 13,900,680 | |
TD Ameritrade Holding Corporation | | | | | | | | | | | 301,600 | | | | 9,156,576 | |
| | | | |
| | | | | | | | | | | | | | | 23,057,256 | |
| | | | | | | | | | | | | | | | |
| | | | |
| Diversified Financial Services: 2.47% | | | | | | | | | | | | | | | | |
MarketAxess Holdings Incorporated | | | | | | | | | | | 1,050,650 | | | | 169,848,079 | |
| | | | | | | | | | | | | | | | |
| | | | |
Health Care: 22.09% | | | | | | | | | | | | | | | | |
| | | | |
| Biotechnology: 6.60% | | | | | | | | | | | | | | | | |
Alexion Pharmaceuticals Incorporated † | | | | | | | | | | | 1,004,078 | | | | 129,124,431 | |
BioMarin Pharmaceutical Incorporated † | | | | | | | | | | | 563,800 | | | | 56,052,996 | |
Celgene Corporation † | | | | | | | | | | | 1,063,860 | | | | 119,354,453 | |
Incyte Corporation † | | | | | | | | | | | 164,500 | | | | 14,839,545 | |
Regeneron Pharmaceuticals Incorporated † | | | | | | | | | | | 161,610 | | | | 68,703,643 | |
Ultragenyx Pharmaceutical Incorporated † | | | | | | | | | | | 442,600 | | | | 28,007,728 | |
Vertex Pharmaceuticals Incorporated † | | | | | | | | | | | 381,200 | | | | 36,976,400 | |
| | | | |
| | | | | | | | | | | | | | | 453,059,196 | |
| | | | | | | | | | | | | | | | |
| | | | |
| Health Care Equipment & Supplies: 4.26% | | | | | | | | | | | | | | | | |
Becton Dickinson & Company | | | | | | | | | | | 87,600 | | | | 15,417,600 | |
Intuitive Surgical Incorporated † | | | | | | | | | | | 60,100 | | | | 41,815,176 | |
Medtronic plc | | | | | | | | | | | 1,404,551 | | | | 123,080,804 | |
NuVasive Incorporated † | | | | | | | | | | | 687,911 | | | | 42,788,064 | |
Steris Corporation | | | | | | | | | | | 973,060 | | | | 69,038,607 | |
| | | | |
| | | | | | | | | | | | | | | 292,140,251 | |
| | | | | | | | | | | | | | | | |
| | | | |
| Health Care Providers & Services: 5.32% | | | | | | | | | | | | | | | | |
Acadia Healthcare Company Incorporated † | | | | | | | | | | | 2,995,842 | | | | 169,265,073 | |
Centene Corporation † | | | | | | | | | | | 248,400 | | | | 17,524,620 | |
Diplomat Pharmacy Incorporated †« | | | | | | | | | | | 1,430,300 | | | | 51,390,679 | |
Laboratory Corporation of America Holdings † | | | | | | | | | | | 151,800 | | | | 21,185,208 | |
VCA Incorporated † | | | | | | | | | | | 1,484,170 | | | | 105,880,688 | |
| | | | |
| | | | | | | | | | | | | | | 365,246,268 | |
| | | | | | | | | | | | | | | | |
| | | | |
| Health Care Technology: 3.47% | | | | | | | | | | | | | | | | |
Cerner Corporation † | | | | | | | | | | | 1,992,200 | | | | 124,293,358 | |
Veeva Systems Incorporated Class A † | | | | | | | | | | | 2,990,300 | | | | 113,601,497 | |
| | | | |
| | | | | | | | | | | | | | | 237,894,855 | |
| | | | | | | | | | | | | | | | |
The accompanying notes are an integral part of these financial statements.
| | | | | | |
| Portfolio of investments—July 31, 2016 | | Wells Fargo Growth Fund | | | 13 | |
| | | | | | | | | | | | | | | | |
| Security name | | | | | | | | Shares | | | Value | |
| | | | |
| Life Sciences Tools & Services: 0.30% | | | | | | | | | | | | | | | | |
Mettler-Toledo International Incorporated † | | | | | | | | | | | 35,600 | | | $ | 14,639,076 | |
Patheon NV † | | | | | | | | | | | 216,987 | | | | 5,611,284 | |
| | | | |
| | | | | | | | | | | | | | | 20,250,360 | |
| | | | | | | | | | | | | | | | |
| | | | |
| Pharmaceuticals: 2.14% | | | | | | | | | | | | | | | | |
Bristol-Myers Squibb Company | | | | | | | | | | | 1,024,250 | | | | 76,624,143 | |
Zoetis Incorporated | | | | | | | | | | | 1,390,304 | | | | 70,168,643 | |
| | | | |
| | | | | | | | | | | | | | | 146,792,786 | |
| | | | | | | | | | | | | | | | |
| | | | |
Industrials: 8.17% | | | | | | | | | | | | | | | | |
| | | | |
| Aerospace & Defense: 0.71% | | | | | | | | | | | | | | | | |
The Boeing Company | | | | | | | | | | | 364,950 | | | | 48,779,217 | |
| | | | | | | | | | | | | | | | |
| | | | |
| Air Freight & Logistics: 0.96% | | | | | | | | | | | | | | | | |
United Parcel Service Incorporated Class B | | | | | | | | | | | 607,260 | | | | 65,644,806 | |
| | | | | | | | | | | | | | | | |
| | | | |
| Commercial Services & Supplies: 2.47% | | | | | | | | | | | | | | | | |
KAR Auction Services Incorporated | | | | | | | | | | | 1,557,400 | | | | 66,609,998 | |
Waste Connections Incorporated | | | | | | | | | | | 1,379,220 | | | | 102,724,306 | |
| | | | |
| | | | | | | | | | | | | | | 169,334,304 | |
| | | | | | | | | | | | | | | | |
| | | | |
| Machinery: 0.49% | | | | | | | | | | | | | | | | |
Fortive Corporation † | | | | | | | | | | | 76,000 | | | | 3,663,960 | |
ITT Incorporated | | | | | | | | | | | 955,400 | | | | 30,295,734 | |
| | | | |
| | | | | | | | | | | | | | | 33,959,694 | |
| | | | | | | | | | | | | | | | |
| | | | |
| Road & Rail: 3.54% | | | | | | | | | | | | | | | | |
Kansas City Southern | | | | | | | | | | | 588,380 | | | | 56,549,202 | |
Norfolk Southern Corporation | | | | | | | | | | | 530,000 | | | | 47,583,400 | |
Union Pacific Corporation | | | | | | | | | | | 1,488,140 | | | | 138,471,427 | |
| | | | |
| | | | | | | | | | | | | | | 242,604,029 | |
| | | | | | | | | | | | | | | | |
| | | | |
Information Technology: 37.05% | | | | | | | | | | | | | | | | |
| | | | |
| Internet Software & Services: 14.09% | | | | | | | | | | | | | | | | |
Alphabet Incorporated Class A † | | | | | | | | | | | 450,800 | | | | 356,736,072 | |
Alphabet Incorporated Class C † | | | | | | | | | | | 56,781 | | | | 43,652,665 | |
CoStar Group Incorporated † | | | | | | | | | | | 450,620 | | | | 93,683,898 | |
Envestnet Incorporated †(l) | | | | | | | | | | | 2,909,831 | | | | 111,068,249 | |
Facebook Incorporated Class A † | | | | | | | | | | | 2,859,190 | | | | 354,368,009 | |
New Relic Incorporated †« | | | | | | | | | | | 216,700 | | | | 7,463,148 | |
| | | | |
| | | | | | | | | | | | | | | 966,972,041 | |
| | | | | | | | | | | | | | | | |
| | | | |
| IT Services: 8.03% | | | | | | | | | | | | | | | | |
Cognizant Technology Solutions Corporation Class A † | | | | | | | | | | | 175,386 | | | | 10,082,941 | |
Euronet Worldwide Incorporated † | | | | | | | | | | | 53,183 | | | | 4,055,736 | |
Global Payments Incorporated | | | | | | | | | | | 811,200 | | | | 60,564,192 | |
MasterCard Incorporated Class A | | | | | | | | | | | 1,763,050 | | | | 167,912,882 | |
Vantiv Incorporated Class A † | | | | | | | | | | | 1,786,793 | | | | 97,862,653 | |
Visa Incorporated Class A | | | | | | | | | | | 2,696,680 | | | | 210,475,874 | |
| | | | |
| | | | | | | | | | | | | | | 550,954,278 | |
| | | | | | | | | | | | | | | | |
The accompanying notes are an integral part of these financial statements.
| | | | |
| 14 | | Wells Fargo Growth Fund | | Portfolio of investments—July 31, 2016 |
| | | | | | | | | | | | | | | | |
| Security name | | | | | | | | Shares | | | Value | |
| | | | |
| Semiconductors & Semiconductor Equipment: 3.91% | | | | | | | | | | | | | | | | |
Broadcom Limited | | | | | | | | | | | 216,000 | | | $ | 34,987,680 | |
Microchip Technology Incorporated « | | | | | | | | | | | 3,536,450 | | | | 196,768,078 | |
Monolithic Power Systems Incorporated | | | | | | | | | | | 227,191 | | | | 16,521,330 | |
Texas Instruments Incorporated | | | | | | | | | | | 289,800 | | | | 20,213,550 | |
| | | | |
| | | | | | | | | | | | | | | 268,490,638 | |
| | | | | | | | | | | | | | | | |
| | | | |
| Software: 9.25% | | | | | | | | | | | | | | | | |
Adobe Systems Incorporated † | | | | | | | | | | | 340,580 | | | | 33,329,159 | |
Fortinet Incorporated † | | | | | | | | | | | 1,738,910 | | | | 60,322,788 | |
Microsoft Corporation | | | | | | | | | | | 673,400 | | | | 38,168,312 | |
Paycom Software Incorporated † | | | | | | | | | | | 1,732,772 | | | | 81,804,166 | |
Paylocity Holding Corporation †« | | | | | | | | | | | 1,187,425 | | | | 53,006,652 | |
Proofpoint Incorporated † | | | | | | | | | | | 1,361,800 | | | | 103,319,766 | |
Red Hat Incorporated † | | | | | | | | | | | 279,926 | | | | 21,075,629 | |
Salesforce.com Incorporated † | | | | | | | | | | | 462,300 | | | | 37,816,140 | |
ServiceNow Incorporated † | | | | | | | | | | | 359,310 | | | | 26,919,505 | |
Splunk Incorporated † | | | | | | | | | | | 1,893,761 | | | | 118,435,813 | |
Tableau Software Incorporated Class A † | | | | | | | | | | | 537,995 | | | | 30,402,097 | |
Ultimate Software Group Incorporated † | | | | | | | | | | | 142,730 | | | | 29,844,843 | |
| | | | |
| | | | | | | | | | | | | | | 634,444,870 | |
| | | | | | | | | | | | | | | | |
| | | | |
| Technology Hardware, Storage & Peripherals: 1.77% | | | | | | | | | | | | | | | | |
Apple Incorporated | | | | | | | | | | | 1,165,000 | | | | 121,404,650 | |
| | | | | | | | | | | | | | | | |
| | | | |
Materials: 2.97% | | | | | | | | | | | | | | | | |
| | | | |
| Chemicals: 2.97% | | | | | | | | | | | | | | | | |
Ecolab Incorporated | | | | | | | | | | | 994,600 | | | | 117,740,748 | |
Praxair Incorporated | | | | | | | | | | | 741,030 | | | | 86,359,632 | |
| | | | |
| | | | | | | | | | | | | | | 204,100,380 | |
| | | | | | | | | | | | | | | | |
| | | | |
Total Common Stocks (Cost $4,159,006,172) | | | | | | | | | | | | | | | 6,842,530,684 | |
| | | | | | | | | | | | | | | | |
| | | | |
| | | Yield | | | | | | | | | | |
| Short-Term Investments: 1.88% | | | | | | | | | | | | | | | | |
| | | | |
| Investment Companies: 1.88% | | | | | | | | | | | | | | | | |
Securities Lending Cash Investments LLC (l)(r)(u) | | | 0.50 | % | | | | | | | 124,859,525 | | | | 124,859,525 | |
Wells Fargo Government Money Market Fund Select Class (l)(u) | | | 0.32 | | | | | | | | 3,981,324 | | | | 3,981,324 | |
| | | | |
Total Short-Term Investments (Cost $128,840,849) | | | | | | | | | | | | | | | 128,840,849 | |
| | | | | | | | | | | | | | | | |
| | | | | | | | |
| Total investments in securities (Cost $4,287,847,021) * | | | 101.60 | % | | | 6,971,371,533 | |
Other assets and liabilities, net | | | (1.60 | ) | | | (110,056,964 | ) |
| | | | | | | | |
| Total net assets | | | 100.00 | % | | $ | 6,861,314,569 | |
| | | | | | | | |
The accompanying notes are an integral part of these financial statements.
| | | | | | |
| Portfolio of investments—July 31, 2016 | | Wells Fargo Growth Fund | | | 15 | |
| † | Non-income-earning security |
| « | All or a portion of this security is on loan. |
| (l) | The issuer of the security is an affiliated person of the Fund as defined in the Investment Company Act of 1940. |
| (r) | The investment is a non-registered investment vehicle purchased with cash collateral received from securities on loan. |
| (u) | The rate represents the 7-day annualized yield at period end. |
| * | Cost for federal income tax purposes is $4,312,714,114 and unrealized gains (losses) consists of: |
| | | | |
Gross unrealized gains | | $ | 2,763,469,544 | |
Gross unrealized losses | | | (104,812,125 | ) |
| | | | |
Net unrealized gains | | $ | 2,658,657,419 | |
The accompanying notes are an integral part of these financial statements.
| | | | |
| 16 | | Wells Fargo Growth Fund | | Statement of assets and liabilities—July 31, 2016 |
| | | | |
| | | | |
| |
Assets | | | | |
Investments | | | | |
In unaffiliated securities (including $121,236,359 of securities loaned), at value (cost $4,015,929,147) | | $ | 6,710,356,931 | |
In affiliated securities, at value (cost $271,917,874) | | | 261,014,602 | |
| | | | |
Total investments, at value (cost $4,287,847,021) | | | 6,971,371,533 | |
Receivable for investments sold | | | 29,636,730 | |
Receivable for Fund shares sold | | | 7,103,217 | |
Receivable for dividends | | | 1,152,017 | |
Receivable for securities lending income | | | 83,833 | |
Prepaid expenses and other assets | | | 70,524 | |
| | | | |
Total assets | | | 7,009,417,854 | |
| | | | |
| |
Liabilities | | | | |
Payable for investments purchased | | | 4,286,206 | |
Payable for Fund shares redeemed | | | 12,922,722 | |
Payable upon receipt of securities loaned | | | 124,859,525 | |
Management fee payable | | | 3,320,045 | |
Distribution fee payable | | | 200,982 | |
Administration fees payable | | | 943,864 | |
Accrued expenses and other liabilities | | | 1,569,941 | |
| | | | |
Total liabilities | | | 148,103,285 | |
| | | | |
Total net assets | | $ | 6,861,314,569 | |
| | | | |
| |
NET ASSETS CONSIST OF | | | | |
Paid-in capital | | $ | 3,644,189,129 | |
Accumulated net investment loss | | | (15,954,981 | ) |
Accumulated net realized gains on investments | | | 549,555,909 | |
Net unrealized gains on investments | | | 2,683,524,512 | |
| | | | |
Total net assets | | $ | 6,861,314,569 | |
| | | | |
| |
COMPUTATION OF NET ASSET VALUE AND OFFERING PRICE PER SHARE | | | | |
Net assets – Class A | | $ | 2,582,954,780 | |
Shares outstanding – Class A1 | | | 61,097,794 | |
Net asset value per share – Class A | | | $42.28 | |
Maximum offering price per share – Class A2 | | | $44.86 | |
Net assets – Class C | | $ | 321,032,304 | |
Shares outstanding – Class C1 | | | 8,659,861 | |
Net asset value per share – Class C | | | $37.07 | |
Net assets – Class R6 | | $ | 30,905,538 | |
Shares outstanding – Class R61 | | | 645,258 | |
Net asset value per share – Class R6 | | | $47.90 | |
Net assets – Administrator Class | | $ | 1,528,287,834 | |
Shares outstanding – Administrator Class1 | | | 33,472,520 | |
Net asset value per share – Administrator Class | | | $45.66 | |
Net assets – Institutional Class | | $ | 2,398,134,113 | |
Shares outstanding – Institutional Class1 | | | 50,097,285 | |
Net asset value per share – Institutional Class | | | $47.87 | |
| 1 | The Fund has an unlimited number of authorized shares. |
| 2 | Maximum offering price is computed as 100/94.25 of net asset value. On investments of $50,000 or more, the offering price is reduced. |
The accompanying notes are an integral part of these financial statements.
| | | | | | |
| Statement of operations—year ended July 31, 2016 | | Wells Fargo Growth Fund | | | 17 | |
| | | | |
| | | | |
| |
Investment income | | | | |
Dividends (net of foreign withholding taxes of $29,998) | | $ | 50,830,392 | |
Securities lending income, net | | | 1,334,969 | |
Income from affiliated securities | | | 199,955 | |
| | | | |
Total investment income | | | 52,365,316 | |
| | | | |
| |
Expenses | | | | |
Management fee | | | 54,253,854 | |
Administration fees | | | | |
Class A | | | 5,032,918 | |
Class C | | | 771,068 | |
Class R6 | | | 1,607 | 1 |
Administrator Class | | | 2,375,203 | |
Institutional Class | | | 3,944,489 | |
Investor Class | | | 1,413,072 | 2 |
Shareholder servicing fees | | | | |
Class A | | | 5,989,825 | |
Class C | | | 917,938 | |
Administrator Class | | | 4,548,056 | |
Investor Class | | | 1,102,754 | 2 |
Distribution fee | | | | |
Class C | | | 2,753,815 | |
Custody and accounting fees | | | 449,900 | |
Professional fees | | | 45,951 | |
Registration fees | | | 160,455 | |
Shareholder report expenses | | | 699,005 | |
Trustees’ fees and expenses | | | 23,190 | |
Other fees and expenses | | | 125,871 | |
| | | | |
Total expenses | | | 84,608,971 | |
Less: Fee waivers and/or expense reimbursements | | | (4,428,719 | ) |
| | | | |
Net expenses | | | 80,180,252 | |
| | | | |
Net investment loss | | | (27,814,936 | ) |
| | | | |
| |
REALIZED AND UNREALIZED GAINS (LOSSES) ON INVESTMENTS | | | | |
| |
Net realized gains (losses) on: | | | | |
Unaffiliated securities | | | 1,030,994,593 | |
Affiliated securities | | | (154,799,118 | ) |
| | | | |
Net realized gains on investments | | | 876,195,475 | |
| | | | |
| |
Net change in unrealized gains (losses) on: | | | | |
Unaffiliated securities | | | (1,279,818,188 | ) |
Affiiliated securities | | | (11,243,557 | ) |
| | | | |
Net change in unrealized gains (losses) on investments | | | (1,291,061,745 | ) |
| | | | |
Net realized and unrealized gains (losses) on investments | | | (414,866,270 | ) |
| | | | |
Net decrease in net assets resulting from operations | | $ | (442,681,206 | ) |
| | | | |
| 1 | For the period from September 30, 2015 (commencement of class operations) to July 31, 2016 |
| 2 | For the period from August 1, 2015 to October 23, 2015. Effective at the close of business on October 23, 2015, Investor Class shares were converted to Class A shares and are no longer offered by the Fund. |
The accompanying notes are an integral part of these financial statements.
| | | | |
| 18 | | Wells Fargo Growth Fund | | Statement of changes in net assets |
| | | | | | | | | | | | | | | | |
| | | Year ended
July 31, 2016 | | | Year ended
July 31, 2015 | |
| | | | |
Operations | | | | | | | | | | | | | | | | |
Net investment loss | | | | | | $ | (27,814,936 | ) | | | | | | $ | (46,794,164 | ) |
Net realized gains on investments | | | | | | | 876,195,475 | | | | | | | | 1,219,370,154 | |
Net change in unrealized gains (losses) on investments | | | | | | | (1,291,061,745 | ) | | | | | | | 328,837,984 | |
| | | | |
Net increase (decrease) in net assets resulting from operations | | | | | | | (442,681,206 | ) | | | | | | | 1,501,413,974 | |
| | | | |
| | | | |
Distributions to shareholders from | | | | | | | | | | | | | | | | |
Net realized gains | | | | | | | | | | | | | | | | |
Class A | | | | | | | (399,298,978 | ) | | | | | | | (231,582,982 | ) |
Class C | | | | | | | (58,938,406 | ) | | | | | | | (75,250,933 | ) |
Class R6 | | | | | | | (3,078 | )1 | | | | | | | N/A | |
Administrator Class | | | | | | | (246,890,849 | ) | | | | | | | (343,165,487 | ) |
Institutional Class | | | | | | | (415,951,081 | ) | | | | | | | (470,228,817 | ) |
Investor Class | | | | | | | 0 | 2 | | | | | | | (300,177,941 | ) |
| | | | |
Total distributions to shareholders | | | | | | | (1,121,082,392 | ) | | | | | | | (1,420,406,160 | ) |
| | | | |
| | | | |
Capital share transactions | | | Shares | | | | | | | | Shares | | | | | |
Proceeds from shares sold | | | | | | | | | | | | | | | | |
Class A | | | 43,995,297 | | | | 2,023,515,239 | | | | 3,096,946 | | | | 149,093,930 | |
Class C | | | 581,792 | | | | 20,816,141 | | | | 687,649 | | | | 28,728,045 | |
Class R6 | | | 809,874 | 1 | | | 36,393,640 | 1 | | | N/A | | | | N/A | |
Administrator Class | | | 7,124,750 | | | | 320,564,136 | | | | 7,685,162 | | | | 396,601,510 | |
Institutional Class | | | 13,079,635 | | | | 610,815,781 | | | | 29,073,710 | | | | 1,572,598,987 | |
Investor Class | | | 481,943 | 2 | | | 22,113,995 | 2 | | | 1,516,862 | | | | 73,282,154 | |
| | | | |
| | | | | | | 3,034,218,932 | | | | | | | | 2,220,304,626 | |
| | | | |
Reinvestment of distributions | | | | | | | | | | | | | | | | |
Class A | | | 9,441,799 | | | | 377,011,011 | | | | 4,653,339 | | | | 208,236,915 | |
Class C | | | 1,219,230 | | | | 42,892,540 | | | | 1,331,646 | | | | 53,838,455 | |
Class R6 | | | 68 | 1 | | | 3,078 | 1 | | | N/A | | | | N/A | |
Administrator Class | | | 5,707,643 | | | | 245,828,196 | | | | 6,824,589 | | | | 325,601,120 | |
Institutional Class | | | 8,792,866 | | | | 396,558,261 | | | | 9,196,950 | | | | 455,984,759 | |
Investor Class | | | 0 | 2 | | | 0 | 2 | | | 6,596,013 | | | | 293,918,329 | |
| | | | |
| | | | | | | 1,062,293,086 | | | | | | | | 1,337,579,578 | |
| | | | |
Payment for shares redeemed | | | | | | | | | | | | | | | | |
Class A | | | (21,946,636 | ) | | | (888,004,129 | ) | | | (19,102,932 | ) | | | (941,145,013 | ) |
Class C | | | (3,607,488 | ) | | | (128,227,500 | ) | | | (3,749,283 | ) | | | (167,465,881 | ) |
Class R6 | | | (164,684 | )1 | | | (7,572,255 | )1 | | | N/A | | | | N/A | |
Administrator Class | | | (23,808,569 | ) | | | (1,051,831,735 | ) | | | (33,692,681 | ) | | | (1,742,600,427 | ) |
Institutional Class | | | (42,021,779 | ) | | | (1,850,525,284 | ) | | | (22,580,802 | ) | | | (1,219,410,764 | ) |
Investor Class | | | (43,198,360 | )2 | | | (1,994,219,513 | )2 | | | (10,699,627 | ) | | | (519,360,449 | ) |
| | | | |
| | | | | | | (5,920,380,416 | ) | | | | | | | (4,589,982,534 | ) |
| | | | |
Net decrease in net assets resulting from capital share transactions | | | | | | | (1,823,868,398 | ) | | | | | | | (1,032,098,330 | ) |
| | | | |
Total decrease in net assets | | | | | | | (3,387,631,996 | ) | | | | | | | (951,090,516 | ) |
| | | | |
| | | | |
Net assets | | | | | | | | | | | | | | | | |
Beginning of period | | | | | | | 10,248,946,565 | | | | | | | | 11,200,037,081 | |
| | | | |
End of period | | | | | | $ | 6,861,314,569 | | | | | | | $ | 10,248,946,565 | |
| | | | |
Undistributed (accumulated) net investment income (loss) | | | | | | $ | (15,954,981 | ) | | | | | | $ | 0 | |
| | | | |
| 1 | For the period from September 30, 2015 (commencement of class operations) to July 31, 2016 |
| 2 | For the period from August 1, 2015 to October 23, 2015. Effective at the close of business on October 23, 2015, Investor Class shares were converted to Class A shares and are no longer offered by the Fund. |
The accompanying notes are an integral part of these financial statements.
| | | | | | |
| Financial highlights | | Wells Fargo Growth Fund | | | 19 | |
(For a share outstanding throughout each period)
| | | | | | | | | | | | | | | | | | | | |
| | | Year ended July 31 | |
| CLASS A | | 2016 | | | 2015 | | | 2014 | | | 2013 | | | 2012 | |
Net asset value, beginning of period | | | $49.50 | | | | $49.99 | | | | $46.74 | | | | $37.85 | | | | $35.88 | |
Net investment loss | | | (0.20 | )1 | | | (0.29 | )1 | | | (0.32 | )1 | | | (0.17 | )1 | | | (0.21 | )1 |
Net realized and unrealized gains (losses) on investments | | | (0.99 | ) | | | 7.03 | | | | 5.34 | | | | 9.06 | | | | 2.65 | |
| | | | | | | | | | | | | | | | | | | | |
Total from investment operations | | | (1.19 | ) | | | 6.74 | | | | 5.02 | | | | 8.89 | | | | 2.44 | |
Distributions to shareholders from | | | | | | | | | | | | | | | | | | | | |
Net realized gains | | | (6.03 | ) | | | (7.23 | ) | | | (1.77 | ) | | | 0.00 | | | | (0.47 | ) |
Net asset value, end of period | | | $42.28 | | | | $49.50 | | | | $49.99 | | | | $46.74 | | | | $37.85 | |
Total return2 | | | (1.69 | )% | | | 15.01 | % | | | 10.77 | % | | | 23.49 | % | | | 6.93 | % |
Ratios to average net assets (annualized) | | | | | | | | | | | | | | | | | | | | |
Gross expenses | | | 1.15 | % | | | 1.18 | % | | | 1.18 | % | | | 1.19 | % | | | 1.20 | % |
Net expenses | | | 1.14 | % | | | 1.18 | % | | | 1.18 | % | | | 1.19 | % | | | 1.20 | % |
Net investment loss | | | (0.49 | )% | | | (0.59 | )% | | | (0.64 | )% | | | (0.41 | )% | | | (0.56 | )% |
Supplemental data | | | | | | | | | | | | | | | | | | | | |
Portfolio turnover rate | | | 38 | % | | | 35 | % | | | 42 | % | | | 38 | % | | | 47 | % |
Net assets, end of period (000s omitted) | | | $2,582,955 | | | | $1,465,643 | | | | $2,047,410 | | | | $2,464,533 | | | | $2,265,845 | |
| 1 | Calculated based upon average shares outstanding |
| 2 | Total return calculations do not include any sales charges. |
The accompanying notes are an integral part of these financial statements.
| | | | |
| 20 | | Wells Fargo Growth Fund | | Financial highlights |
(For a share outstanding throughout each period)
| | | | | | | | | | | | | | | | | | | | |
| | | Year ended July 31 | |
| CLASS C | | 2016 | | | 2015 | | | 2014 | | | 2013 | | | 2012 | |
Net asset value, beginning of period | | | $44.51 | | | | $45.95 | | | | $43.41 | | | | $35.42 | | | | $33.86 | |
Net investment loss | | | (0.46 | )1 | | | (0.60 | )1 | | | (0.64 | )1 | | | (0.45 | )1 | | | (0.46 | )1 |
Net realized and unrealized gains (losses) on investments | | | (0.95 | ) | | | 6.39 | | | | 4.95 | | | | 8.44 | | | | 2.49 | |
| | | | | | | | | | | | | | | | | | | | |
Total from investment operations | | | (1.41 | ) | | | 5.79 | | | | 4.31 | | | | 7.99 | | | | 2.03 | |
Distributions to shareholders from | | | | | | | | | | | | | | | | | | | | |
Net realized gains | | | (6.03 | ) | | | (7.23 | ) | | | (1.77 | ) | | | 0.00 | | | | (0.47 | ) |
Net asset value, end of period | | | $37.07 | | | | $44.51 | | | | $45.95 | | | | $43.41 | | | | $35.42 | |
Total return2 | | | (2.44 | )% | | | 14.16 | % | | | 9.96 | % | | | 22.56 | % | | | 6.12 | % |
Ratios to average net assets (annualized) | | | | | | | | | | | | | | | | | | | | |
Gross expenses | | | 1.90 | % | | | 1.93 | % | | | 1.93 | % | | | 1.94 | % | | | 1.95 | % |
Net expenses | | | 1.89 | % | | | 1.93 | % | | | 1.93 | % | | | 1.94 | % | | | 1.95 | % |
Net investment loss | | | (1.24 | )% | | | (1.34 | )% | | | (1.39 | )% | | | (1.16 | )% | | | (1.32 | )% |
Supplemental data | | | | | | | | | | | | | | | | | | | | |
Portfolio turnover rate | | | 38 | % | | | 35 | % | | | 42 | % | | | 38 | % | | | 47 | % |
Net assets, end of period (000s omitted) | | | $321,032 | | | | $465,833 | | | | $560,481 | | | | $589,402 | | | | $525,285 | |
| 1 | Calculated based upon average shares outstanding |
| 2 | Total return calculations do not include any sales charges. |
The accompanying notes are an integral part of these financial statements.
| | | | | | |
| Financial highlights | | Wells Fargo Growth Fund | | | 21 | |
(For a share outstanding throughout the period)
| | | | |
| CLASS R6 | | Year ended
July 31, 20161 | |
Net asset value, beginning of period | | | $48.97 | |
Net investment loss | | | (0.02 | ) |
Net realized and unrealized gains (losses) on investments | | | 4.98 | |
| | | | |
Total from investment operations | | | 4.96 | |
Distributions to shareholders from | | | | |
Net realized gains | | | (6.03 | ) |
Net asset value, end of period | | | $47.90 | |
Total return2 | | | 10.89 | % |
Ratios to average net assets (annualized) | | | | |
Gross expenses | | | 0.74 | % |
Net expenses | | | 0.70 | % |
Net investment loss | | | (0.23 | )% |
Supplemental data | | | | |
Portfolio turnover rate | | | 38 | % |
Net assets, end of period (000s omitted) | | | $30,906 | |
| 1 | For the period from September 30, 2015 (commencement of class operations) to July 31, 2016 |
| 2 | Returns for periods of less than one year are not annualized. |
The accompanying notes are an integral part of these financial statements.
| | | | |
| 22 | | Wells Fargo Growth Fund | | Financial highlights |
(For a share outstanding throughout each period)
| | | | | | | | | | | | | | | | | | | | |
| | | Year ended July 31 | |
| ADMINISTRATOR CLASS | | 2016 | | | 2015 | | | 2014 | | | 2013 | | | 2012 | |
Net asset value, beginning of period | | | $52.86 | | | | $52.80 | | | | $49.16 | | | | $39.72 | | | | $37.54 | |
Net investment loss | | | (0.14 | )1 | | | (0.20 | )1 | | | (0.23 | ) | | | (0.08 | )1 | | | (0.13 | )1 |
Net realized and unrealized gains (losses) on investments | | | (1.03 | ) | | | 7.49 | | | | 5.64 | | | | 9.52 | | | | 2.78 | |
| | | | | | | | | | | | | | | | | | | | |
Total from investment operations | | | (1.17 | ) | | | 7.29 | | | | 5.41 | | | | 9.44 | | | | 2.65 | |
Distributions to shareholders from | | | | | | | | | | | | | | | | | | | | |
Net realized gains | | | (6.03 | ) | | | (7.23 | ) | | | (1.77 | ) | | | 0.00 | | | | (0.47 | ) |
Net asset value, end of period | | | $45.66 | | | | $52.86 | | | | $52.80 | | | | $49.16 | | | | $39.72 | |
Total return | | | (1.53 | )% | | | 15.28 | % | | | 11.04 | % | | | 23.77 | % | | | 7.15 | % |
Ratios to average net assets (annualized) | | | | | | | | | | | | | | | | | | | | |
Gross expenses | | | 1.07 | % | | | 1.02 | % | | | 1.02 | % | | | 1.03 | % | | | 1.03 | % |
Net expenses | | | 0.96 | % | | | 0.96 | % | | | 0.96 | % | | | 0.96 | % | | | 0.96 | % |
Net investment loss | | | (0.31 | )% | | | (0.37 | )% | | | (0.42 | )% | | | (0.18 | )% | | | (0.33 | )% |
Supplemental data | | | | | | | | | | | | | | | | | | | | |
Portfolio turnover rate | | | 38 | % | | | 35 | % | | | 42 | % | | | 38 | % | | | 47 | % |
Net assets, end of period (000s omitted) | | | $1,528,288 | | | | $2,349,359 | | | | $3,359,480 | | | | $3,309,683 | | | | $2,984,775 | |
| 1 | Calculated based upon average shares outstanding |
The accompanying notes are an integral part of these financial statements.
| | | | | | |
| Financial highlights | | Wells Fargo Growth Fund | | | 23 | |
(For a share outstanding throughout each period)
| | | | | | | | | | | | | | | | | | | | |
| | | Year ended July 31 | |
| INSTITUTIONAL CLASS | | 2016 | | | 2015 | | | 2014 | | | 2013 | | | 2012 | |
Net asset value, beginning of period | | | $54.99 | | | | $54.54 | | | | $50.63 | | | | $40.83 | | | | $38.49 | |
Net investment income (loss) | | | (0.05 | )1 | | | (0.09 | )1 | | | (0.13 | ) | | | 0.01 | 1 | | | (0.05 | )1 |
Net realized and unrealized gains (losses) on investments | | | (1.04 | ) | | | 7.77 | | | | 5.81 | | | | 9.79 | | | | 2.86 | |
| | | | | | | | | | | | | | | | | | | | |
Total from investment operations | | | (1.09 | ) | | | 7.68 | | | | 5.68 | | | | 9.80 | | | | 2.81 | |
Distributions to shareholders from | | | | | | | | | | | | | | | | | | | | |
Net realized gains | | | (6.03 | ) | | | (7.23 | ) | | | (1.77 | ) | | | 0.00 | | | | (0.47 | ) |
Net asset value, end of period | | | $47.87 | | | | $54.99 | | | | $54.54 | | | | $50.63 | | | | $40.83 | |
Total return | | | (1.31 | )% | | | 15.53 | % | | | 11.26 | % | | | 24.03 | % | | | 7.37 | % |
Ratios to average net assets (annualized) | | | | | | | | | | | | | | | | | | | | |
Gross expenses | | | 0.82 | % | | | 0.76 | % | | | 0.75 | % | | | 0.76 | % | | | 0.77 | % |
Net expenses | | | 0.75 | % | | | 0.75 | % | | | 0.75 | % | | | 0.75 | % | | | 0.76 | % |
Net investment income (loss) | | | (0.10 | )% | | | (0.17 | )% | | | (0.21 | )% | | | 0.02 | % | | | (0.13 | )% |
Supplemental data | | | | | | | | | | | | | | | | | | | | |
Portfolio turnover rate | | | 38 | % | | | 35 | % | | | 42 | % | | | 38 | % | | | 47 | % |
Net assets, end of period (000s omitted) | | | $2,398,134 | | | | $3,863,196 | | | | $2,975,721 | | | | $2,649,095 | | | | $2,312,074 | |
| 1 | Calculated based upon average shares outstanding |
The accompanying notes are an integral part of these financial statements.
| | | | |
| 24 | | Wells Fargo Growth Fund | | Notes to financial statements |
1. ORGANIZATION
Wells Fargo Funds Trust (the “Trust”), a Delaware statutory trust organized on March 10, 1999, is an open-end management investment company registered under the Investment Company Act of 1940, as amended (the “1940 Act”). As an investment company, the Trust follows the accounting and reporting guidance in Financial Accounting Standards Board (“FASB”) Accounting Standards Codification Topic 946, Financial Services – Investment Companies. These financial statements report on the Wells Fargo Growth Fund (the “Fund”) which is a diversified series of the Trust.
Effective at the close of business on October 23, 2015, Investor Class shares became Class A shares in a tax-free conversion. Shareholders of Investor Class received Class A shares at a value equal to the value of their Investor Class shares immediately prior to the conversion. Investor Class shares are no longer offered by the Fund.
2. SIGNIFICANT ACCOUNTING POLICIES
The following significant accounting policies, which are consistently followed in the preparation of the financial statements of the Fund, are in conformity with U.S. generally accepted accounting principles which require management to make estimates and assumptions that affect the reported amounts of assets and liabilities, disclosure of contingent assets and liabilities at the date of the financial statements, and the reported amounts of revenues and expenses during the reporting period. Actual results could differ from those estimates.
Securities valuation
All investments are valued each business day as of the close of regular trading on the New York Stock Exchange (generally 4 p.m. Eastern Time), although the Fund may deviate from this calculation time under unusual or unexpected circumstances.
Equity securities that are listed on a foreign or domestic exchange or market are valued at the official closing price or, if none, the last sales price. If no sale occurs on the principal exchange or market that day, the prior day’s price will be deemed “stale” and a fair value price will be determined in accordance with the Fund’s Valuation Procedures.
Investments in registered open-end investment companies are valued at net asset value. Interests in non-registered investment vehicles that are redeemable at net asset value are fair valued normally at net asset value.
Investments which are not valued using any of the methods discussed above are valued at their fair value, as determined in good faith by the Board of Trustees of the Fund. The Board of Trustees has established a Valuation Committee comprised of the Trustees and has delegated to it the authority to take any actions regarding the valuation of portfolio securities that the Valuation Committee deems necessary or appropriate, including determining the fair value of portfolio securities, unless the determination has been delegated to the Management Valuation Team of Wells Fargo Funds Management, LLC (“Funds Management”). The Board of Trustees retains the authority to make or ratify any valuation decisions or approve any changes to the Valuation Procedures as it deems appropriate. On a quarterly basis, the Board of Trustees receives reports on any valuation actions taken by the Valuation Committee or the Management Valuation Team which may include items for ratification.
Valuations of fair valued securities are compared to the next actual sales price when available, or other appropriate market values, to assess the continued appropriateness of the fair valuation methodologies used. These securities are fair valued on a day-to-day basis, taking into consideration changes to appropriate market information and any significant changes to the inputs considered in the valuation process until there is a readily available price provided on an exchange or by an independent pricing service. Valuations received from an independent pricing service or independent broker-dealer quotes are periodically validated by comparisons to most recent trades and valuations provided by other independent pricing services in addition to the review of prices by the manager and/or subadviser. Unobservable inputs used in determining fair valuations are identified based on the type of security, taking into consideration factors utilized by market participants in valuing the investment, knowledge about the issuer and the current market environment.
Security loans
The Fund may lend its securities from time to time in order to earn additional income in the form of fees or interest on securities received as collateral or the investment of any cash received as collateral. The Fund continues to receive interest or dividends on the securities loaned. The Fund receives collateral in the form of cash or securities with a value at least equal to the value of the securities on loan. The value of the loaned securities is determined at the close of each business day and any additional required collateral is delivered to the Fund on the next business day. In a securities lending transaction, the net asset value of the Fund will be affected by an increase or decrease in the value of the securities loaned and by an increase or decrease in the value of the instrument in which collateral is invested. The amount
| | | | | | |
| Notes to financial statements | | Wells Fargo Growth Fund | | | 25 | |
of securities lending activity undertaken by the Fund fluctuates from time to time. In the event of default or bankruptcy by the borrower, the Fund may be prevented from recovering the loaned securities or gaining access to the collateral or may experience delays or costs in doing so. In addition, the investment of any cash collateral received may lose all or part of its value. The Fund has the right under the lending agreement to recover the securities from the borrower on demand.
The Fund lends its securities through an unaffiliated securities lending agent. Cash collateral received in connection with its securities lending transactions is invested in Securities Lending Cash Investments, LLC (the “Securities Lending Fund”). The Securities Lending Fund is exempt from registration under Section 3(c)(7) of the 1940 Act and is managed by Funds Management and is subadvised by Wells Capital Management Incorporated (“WellsCap”), an affiliate of Funds Management and an indirect wholly owned subsidiary of Wells Fargo & Company (“Wells Fargo”). Funds Management receives an advisory fee starting at 0.05% and declining to 0.01% as the average daily net assets of the Securities Lending Fund increase. All of the fees received by Funds Management are paid to WellsCap for its services as subadviser. The Securities Lending Fund seeks to provide a positive return compared to the daily Fed Funds Open rate by investing in high-quality, U.S. dollar-denominated short-term money market instruments. Securities Lending Fund investments are fair valued based upon the amortized cost valuation technique. Income earned from investment in the Securities Lending Fund is included in securities lending income on the Statement of Operations.
Security transactions and income recognition
Securities transactions are recorded on a trade date basis. Realized gains or losses are recorded on the basis of identified cost.
Dividend income is recognized on the ex-dividend date. Dividend income is recorded net of foreign taxes withheld where recovery of such taxes is not assured.
Distributions to shareholders
Distributions to shareholders from net investment income and net realized gains, if any, are recorded on the ex-dividend date. Such distributions are determined in conformity with federal income tax regulations, which may differ in amount or character from net investment income and realized gains recognized for purposes of U.S. generally accepted accounting principles.
Federal and other taxes
The Fund intends to continue to qualify as a regulated investment company by distributing substantially all of its investment company taxable income and any net realized capital gains (after reduction for capital loss carryforwards) sufficient to relieve it from all, or substantially all, federal income taxes. Accordingly, no provision for federal income taxes was required.
The Fund’s income and federal excise tax returns and all financial records supporting those returns for the prior three fiscal years are subject to examination by the federal and Delaware revenue authorities. Management has analyzed the Fund’s tax positions taken on federal, state, and foreign tax returns for all open tax years and does not believe that there are any uncertain tax positions that require recognition of a tax liability.
Reclassifications are made to the Fund’s capital accounts for permanent tax differences to reflect income and gains available for distribution (or available capital loss carryforwards) under federal income tax regulations. U.S. generally accepted accounting principles require that certain components of net assets be adjusted to reflect permanent differences between financial and tax reporting. These reclassifications have no effect on net assets or net asset values per share. The primary permanent differences causing such reclassifications are due to dividends from certain securities and net operating losses. At July 31, 2016, as a result of permanent book-to-tax differences, the following reclassification adjustments were made on the Statement of Assets and Liabilities:
| | | | |
| Paid-in capital | | Accumulated net
investment loss | | Accumulated net
realized gains
on investments |
| $(14,010,179) | | $11,859,955 | | $2,150,224 |
As of July 31, 2016, the Fund had a qualified late-year ordinary loss of $15,954,981 which will be recognized on the first day of the following fiscal year.
Class allocations
The separate classes of shares offered by the Fund differ principally in applicable sales charges, distribution, shareholder servicing, and administration fees. Class specific expenses are charged directly to that share class. Investment income, common expenses, and realized and unrealized gains (losses) on investments are allocated daily to each class of shares based on the relative proportion of net assets of each class.
| | | | |
| 26 | | Wells Fargo Growth Fund | | Notes to financial statements |
3. FAIR VALUATION MEASUREMENTS
Fair value measurements of investments are determined within a framework that has established a fair value hierarchy based upon the various data inputs utilized in determining the value of the Fund’s investments. The three-level hierarchy gives the highest priority to unadjusted quoted prices in active markets for identical assets or liabilities (Level 1) and the lowest priority to significant unobservable inputs (Level 3). The Fund’s investments are classified within the fair value hierarchy based on the lowest level of input that is significant to the fair value measurement. The inputs are summarized into three broad levels as follows:
| n | | Level 1 – quoted prices in active markets for identical securities |
| n | | Level 2 – other significant observable inputs (including quoted prices for similar securities, interest rates, prepayment speeds, credit risk, use of amortized cost, etc.) |
| n | | Level 3 – significant unobservable inputs (including the Fund’s own assumptions in determining the fair value of investments) |
The inputs or methodologies used for valuing investments in securities are not necessarily an indication of the risk associated with investing in those securities.
The following is a summary of the inputs used in valuing the Fund’s assets and liabilities as of July 31, 2016:
| | | | | | | | | | | | | | | | |
| | | Quoted prices (Level 1) | | | Other significant
observable inputs
(Level 2) | | | Significant
unobservable inputs (Level 3) | | | Total | |
Assets | | | | | | | | | | | | | | | | |
Investments in: | | | | | | | | | | | | | | | | |
| | | | |
Common stocks | | | | | | | | | | | | | | | | |
Consumer discretionary | | $ | 1,408,196,810 | | | $ | 0 | | | $ | 0 | | | $ | 1,408,196,810 | |
Consumer staples | | | 310,928,630 | | | | 0 | | | | 0 | | | | 310,928,630 | |
Energy | | | 108,427,286 | | | | 0 | | | | 0 | | | | 108,427,286 | |
Financials | | | 192,905,335 | | | | 0 | | | | 0 | | | | 192,905,335 | |
Health care | | | 1,515,383,716 | | | | 0 | | | | 0 | | | | 1,515,383,716 | |
Industrials | | | 560,322,050 | | | | 0 | | | | 0 | | | | 560,322,050 | |
Information technology | | | 2,542,266,477 | | | | 0 | | | | 0 | | | | 2,542,266,477 | |
Materials | | | 204,100,380 | | | | 0 | | | | 0 | | | | 204,100,380 | |
| | | | |
Short-term investments | | | | | | | | | | | | | | | | |
Investment companies | | | 3,981,324 | | | | 0 | | | | 0 | | | | 3,981,324 | |
Investments measured at net asset value* | | | | | | | | | | | | | | | 124,859,525 | |
Total assets | | $ | 6,846,512,008 | | | $ | 0 | | | $ | 0 | | | $ | 6,971,371,533 | |
| * | Investments that are measured at fair value using the net asset value per share (or its equivalent) as a practical expedient have not been categorized in the fair value hierarchy. The fair value amount presented in the table is intended to permit reconciliation of the fair value hierarchy to the amounts presented in the Statement of Assets and Liabilities. The Fund’s investment in Securities Lending Cash Investments, LLC valued at $124,859,525 does not have a redemption period notice, can be redeemed daily and does not have any unfunded commitments. |
The Fund recognizes transfers between levels within the fair value hierarchy at the end of the reporting period. At July 31, 2016, the Fund did not have any transfers into/out of Level 1, Level 2, or Level 3.
4. TRANSACTIONS WITH AFFILIATES
Management fee
Funds Management, an indirect wholly owned subsidiary of Wells Fargo, is the manager of the Fund and provides advisory and fund-level administrative services under an investment management agreement. Under the investment management agreement, Funds Management is responsible for, among other services, implementing the investment objectives and strategies of the Fund, supervising the subadviser, providing fund-level administrative services in connection with the Fund’s operations, and providing any other fund-level administrative services reasonably necessary for the operation of the Fund. As compensation for its services under the investment management agreement, Funds
| | | | | | |
| Notes to financial statements | | Wells Fargo Growth Fund | | | 27 | |
Management is entitled to receive an annual management fee starting at 0.80% and declining to 0.555% as the average daily net assets of the Fund increase. For the year ended July 31, 2016, the management fee was equivalent to an annual rate of 0.67% of the Fund’s average daily net assets.
Funds Management has retained the services of a subadviser to provide daily portfolio management to the Fund. The fee for subadvisory services is borne by Funds Management. WellsCap is the subadviser to the Fund and is entitled to receive a fee from Funds Management at an annual rate starting at 0.45% and declining to 0.30% as the average daily net assets of the Fund increase.
Administration fees
Under a class-level administration agreement, Funds Management provides class-level administrative services to the Fund, which includes paying fees and expenses for services provided by the transfer agent, sub-transfer agents, omnibus account servicers and record-keepers. As compensation for its services under the class-level administration agreement, Funds Management receives an annual fee which is calculated based on the average daily net assets of each class as follows:
| | | | |
| | | Class-level
administration fee | |
Class A, Class C | | | 0.21 | % |
Class R6 | | | 0.03 | |
Administrator Class, Institutional Class | | | 0.13 | |
Investor Class | | | 0.32 | |
Funds Management has contractually waived and/or reimbursed management and administration fees to the extent necessary to maintain certain net operating expense ratios for the Fund. Waiver of fees and/or reimbursement of expenses by Funds Management were made first from fund level expenses on a proportionate basis and then from class specific expenses. Funds Management has committed through November 30, 2016 to waive fees and/or reimburse expenses to the extent necessary to cap the Fund’s expenses at 1.21% for Class A shares, 1.96% for Class C shares, 0.70% for Class R6 shares, 0.96% for Administrator Class shares, and 0.75% for Institutional Class shares. After this time, the cap may be increased or the commitment to maintain the cap may be terminated only with the approval of the Board of Trustees.
Distribution fee
The Trust has adopted a distribution plan for Class C shares of the Fund pursuant to Rule 12b-1 under the 1940 Act. A distribution fee is charged to Class C shares and paid to Wells Fargo Funds Distributor, LLC, the principal underwriter, at an annual rate of 0.75% of the average daily net assets of Class C shares.
In addition, Funds Distributor is entitled to receive the front-end sales charge from the purchase of Class A shares and a contingent deferred sales charge on the redemption of certain Class A shares. Funds Distributor is also entitled to receive the contingent deferred sales charges from redemptions of Class C shares. For the year ended July 31, 2016, Funds Distributor received $16,733 from the sale of Class A shares and $24 and $3,651 in contingent deferred sales charges from redemptions of Class A and Class C shares, respectively.
Shareholder servicing fees
The Trust has entered into contracts with one or more shareholder servicing agents, whereby Class A, Class C, Administrator Class, and Investor Class of the Fund are charged a fee at an annual rate of 0.25% of the average daily net assets of each respective class.
A portion of these total shareholder servicing fees were paid to affiliates of Wells Fargo.
5. INVESTMENT PORTFOLIO TRANSACTIONS
Purchases and sales of investments, excluding U.S. government obligations (if any) and short-term securities, for the year ended July 31, 2016 were $3,094,366,097 and $5,868,422,189, respectively.
The Fund may purchase or sell investment securities to other Wells Fargo funds under procedures adopted by the Board of Trustees. The procedures have been designed to ensure that these interfund transactions, which generally do not incur broker commissions, are effected at current market prices. Interfund trades are included within the respective purchases and sales amounts shown.
| | | | |
| 28 | | Wells Fargo Growth Fund | | Notes to financial statements |
6. INVESTMENTS IN AFFILIATES
An affiliated investment is a company which is under common ownership or control of the Fund or which the Fund has ownership of at least 5% of the outstanding voting shares. The following is a summary of transactions for the long-term holdings of issuers that were either affiliates of the Fund at the beginning of the period or the end of the period.
| | | | | | | | | | | | | | | | | | | | | | | | | | | | |
| | | Shares,
beginning
of period | | | Shares
purchased | | | Shares
sold | | | Shares,
end of period | | | Value, end of period | | | Income from
affiliated securities | | | Realized losses | |
Envestnet Incorporated | | | 3,268,908 | | | | 7,823 | | | | 366,900 | | | | 2,909,831 | | | $ | 111,068,249 | | | $ | 0 | | | $ | (5,001,083 | ) |
Fiesta Restaurant Group Incorporated* | | | 2,098,000 | | | | 527,000 | | | | 2,586,300 | | | | 38,700 | | | | 864,558 | | | | 0 | | | | (65,804,887 | ) |
Grand Canyon Education Incorporated* | | | 3,903,000 | | | | 0 | | | | 2,730,425 | | | | 1,172,575 | | | | 49,318,505 | | | | 0 | | | | (10,401,062 | ) |
Inovalon Holdings Incorporated* | | | 1,629,037 | | | | 0 | | | | 1,629,037 | | | | 0 | | | | 0 | | | | 0 | | | | (13,372,108 | ) |
Shutterstock Incorporated* | | | 2,028,000 | | | | 0 | | | | 2,028,000 | | | | 0 | | | | 0 | | | | 0 | | | | (58,443,242 | |
The Habit Restaurants Incorporated Class A | | | 0 | | | | 1,531,000 | | | | 231,400 | | | | 1,299,600 | | | | 21,105,504 | | | | 0 | | | | (1,776,736 | ) |
| | | | | | | | | | | | | | | | | | | | | | $ | 0 | | | $ | (154,799,118 | ) |
| * | No longer an affiliate of the Fund at the end of the period. |
7. BANK BORROWINGS
The Trust (excluding the money market funds and certain other funds) and Wells Fargo Variable Trust are parties to a $200,000,000 revolving credit agreement whereby the Fund is permitted to use bank borrowings for temporary or emergency purposes, such as to fund shareholder redemption requests. Interest under the credit agreement is charged to the Fund based on a borrowing rate equal to the higher of the Federal Funds rate in effect on that day plus 1.25% or the overnight LIBOR rate in effect on that day plus 1.25%. In addition, an annual commitment fee equal to 0.20% of the unused balance is allocated to each participating fund. Prior to September 1, 2015, the revolving credit agreement amount was $150,000,000 and the annual commitment fee was equal to 0.10% of the unused balance which was allocated to each participating fund.
For the year ended July 31, 2016, there were no borrowings by the Fund under the agreement.
8. DISTRIBUTIONS TO SHAREHOLDERS
The tax character of distributions paid during the years ended July 31, 2016 and July 31, 2015 were as follows:
| | | | | | | | |
| | | Year ended July 31 | |
| | | 2016 | | | 2015 | |
Ordinary income | | $ | 22,940,734 | | | $ | 0 | |
Long-term capital gain | | | 1,098,141,658 | | | | 1,420,406,160 | |
As of July 31, 2016, the components of distributable earnings on a tax basis were as follows:
| | | | |
Undistributed long-term
gain | | Unrealized
gains | | Late-year
ordinary losses deferred |
| $574,423,002 | | $2,658,657,419 | | $(15,954,981) |
9. CONCENTRATION RISK
Concentration risks result from exposure to a limited number of sectors. A fund that invests a substantial portion of its assets in any sector may be more affected by changes in that sector than would be a fund whose investments are not heavily weighted in any sector.
10. INDEMNIFICATION
Under the Trust’s organizational documents, the officers and Trustees have been granted certain indemnification rights against certain liabilities that may arise out of performance of their duties to the Trust. Additionally, in the normal course of business, the Trust may enter into contracts with service providers that contain a variety of indemnification clauses. The Trust’s maximum exposure under these arrangements is dependent on future claims that may be made against the Fund and, therefore, cannot be estimated.
| | | | | | |
| Report of independent registered public accounting firm | | Wells Fargo Growth Fund | | | 29 | |
BOARD OF TRUSTEES AND SHAREHOLDERS OF WELLS FARGO FUNDS TRUST:
We have audited the accompanying statements of assets and liabilities, including the portfolio of investments, of the Wells Fargo Growth Fund (formerly known as Wells Fargo Advantage Growth Fund) (the “Fund”), one of the funds constituting the Wells Fargo Funds Trust, as of July 31, 2016, and the related statement of operations for the year then ended, the statements of changes in net assets for each of the years in the two-year period then ended, and the financial highlights for each of the years or periods in the five-year period then ended. These financial statements and financial highlights are the responsibility of the Fund’s management. Our responsibility is to express an opinion on these financial statements and financial highlights based on our audits.
We conducted our audits in accordance with the standards of the Public Company Accounting Oversight Board (United States). Those standards require that we plan and perform the audit to obtain reasonable assurance about whether the financial statements and financial highlights are free of material misstatement. An audit includes examining, on a test basis, evidence supporting the amounts and disclosures in the financial statements. Our procedures included confirmation of securities owned as of July 31, 2016, by correspondence with the custodian and brokers, or by other appropriate auditing procedures. An audit also includes assessing the accounting principles used and significant estimates made by management, as well as evaluating the overall financial statement presentation. We believe that our audits provide a reasonable basis for our opinion.
In our opinion, the financial statements and financial highlights referred to above present fairly, in all material respects, the financial position of the Wells Fargo Growth Fund as of July 31, 2016, the results of its operations for the year then ended, the changes in its net assets for each of the years in the two-year period then ended, and the financial highlights for each of the years or periods in the five-year period then ended, in conformity with U.S. generally accepted accounting principles.

Boston, Massachusetts
September 23, 2016
| | | | |
| 30 | | Wells Fargo Growth Fund | | Other information (unaudited) |
TAX INFORMATION
For corporate shareholders, pursuant to Section 854 of the Internal Revenue Code, 100% of ordinary income dividends qualify for the corporate dividends-received deduction for the fiscal year ended July 31, 2016.
Pursuant to Section 852 of the Internal Revenue Code, $1,098,141,658 was designated as a 20% rate gain distribution for the fiscal year ended July 31, 2016.
Pursuant to Section 854 of the Internal Revenue Code, $22,940,734 of income dividends paid during the fiscal year ended July 31, 2016 has been designated as qualified dividend income (QDI).
For the fiscal year ended July 31, 2016, $22,940,734 has been designated as short-term capital gain dividends for nonresident alien shareholders pursuant to Section 871 of the Internal Revenue Code.
PROXY VOTING INFORMATION
A description of the policies and procedures that the Fund uses to determine how to vote proxies relating to portfolio securities is available, upon request, by calling 1-800-222-8222, visiting our website at wellsfargofunds.com, or visiting the SEC website at sec.gov. Information regarding how the Fund voted proxies relating to portfolio securities during the most recent 12-month period ended June 30 is available on the Fund’s website at wellsfargofunds.com or by visiting the SEC website at sec.gov.
PORTFOLIO HOLDINGS INFORMATION
The complete portfolio holdings for the Fund are publicly available monthly on the Fund’s website (wellsfargofunds.com), on a one-month delayed basis. In addition, top ten holdings information (excluding derivative positions) for the Fund is publicly available on the Fund’s website on a monthly, seven-day or more delayed basis. The Fund files its complete schedule of portfolio holdings with the SEC for the first and third quarters of each fiscal year on Form N-Q, which is available by visiting the SEC website at sec.gov. In addition, the Fund’s Form N-Q may be reviewed and copied at the SEC’s Public Reference Room in Washington, DC, and at regional offices in New York City, at 233 Broadway, and in Chicago, at 175 West Jackson Boulevard, Suite 900. Information about the Public Reference Room may be obtained by calling 1-800-SEC-0330.
| | | | | | |
| Other information (unaudited) | | Wells Fargo Growth Fund | | | 31 | |
BOARD OF TRUSTEES AND OFFICERS
Each of the Trustees and Officers1 listed in the table below acts in identical capacities for each fund in the Wells Fargo family of funds, which consists of 139 mutual funds comprising the Wells Fargo Funds Trust, Wells Fargo Variable Trust, Wells Fargo Master Trust and four closed-end funds (collectively the “Fund Complex”). This table should be read in conjunction with the Prospectus and the Statement of Additional Information2. The mailing address of each Trustee and Officer is 525 Market Street, 12th Floor, San Francisco, CA 94105. Each Trustee and Officer serves an indefinite term, however, each Trustee serves such term until reaching the mandatory retirement age established by the Trustees.
Independent Trustees
| | | | | | |
Name and year of birth | | Position held and length of service* | | Principal occupations during past five years or longer | | Current other public
company or
investment company
directorships |
William R. Ebsworth (Born 1957) | | Trustee, since 2015 | | Retired. From 1984 to 2013, equities analyst, portfolio manager, research director and chief financial officer at Fidelity Management and Research Company in Boston, Tokyo, and Hong Kong and retired in 2013 as Chief Investment Officer of Fidelity Strategic Advisers, Inc. where he lead a team of investment professionals managing client assets. Prior thereto, Board member of Hong Kong Securities Clearing Co., Hong Kong Options Clearing Corp., the Thailand International Fund, Ltd., Fidelity Investments Life Insurance Company, and Empire Fidelity Investments Life Insurance Company. Mr. Ebsworth is a CFA® charterholder and an Adjunct Lecturer, Finance, at Babson College. | | Asset Allocation Trust |
Jane A. Freeman (Born 1953) | | Trustee, since 2015 | | Retired. From 2012 to 2014 and 1999 to 2008, Chief Financial Officer of Scientific Learning Corporation. From 2008 to 2012, Ms. Freeman provided consulting services related to strategic business projects. Prior to 1999, Portfolio Manager at Rockefeller & Co. and Scudder, Stevens & Clark. Board member of the Harding Loevner Funds from 1996 to 2014, serving as both Lead Independent Director and chair of the Audit Committee. Board member of the Russell Exchange Traded Funds Trust from 2011 to 2012 and the chair of the Audit Committee. Ms. Freeman is Chair of Taproot Foundation (non-profit organization), a Board Member of Ruth Bancroft Garden (non-profit organization) and an inactive chartered financial analyst. | | Asset Allocation Trust |
Peter G. Gordon (Born 1942) | | Trustee, since 1998; Chairman, since 2005 | | Co-Founder, Retired Chairman, President and CEO of Crystal Geyser Water Company. Trustee Emeritus, Colby College. | | Asset Allocation Trust |
Isaiah Harris, Jr. (Born 1952) | | Trustee, since 2009 | | Retired. Chairman of the Board of CIGNA Corporation since 2009, and Director since 2005. From 2003 to 2011, Director of Deluxe Corporation. Prior thereto, President and CEO of BellSouth Advertising and Publishing Corp. from 2005 to 2007, President and CEO of BellSouth Enterprises from 2004 to 2005 and President of BellSouth Consumer Services from 2000 to 2003. Emeritus member of the Iowa State University Foundation Board of Governors. Emeritus Member of the Advisory Board of Iowa State University School of Business. Advisory Board Member, Palm Harbor Academy (charter school). Advisory Board Member, Child Evangelism Fellowship (non-profit). Mr. Harris is a certified public accountant (inactive status). | | CIGNA Corporation; Asset Allocation Trust |
Judith M. Johnson (Born 1949) | | Trustee, since 2008; Audit Committee Chairman, since 2008 | | Retired. Prior thereto, Chief Executive Officer and Chief Investment Officer of Minneapolis Employees Retirement Fund from 1996 to 2008. Ms. Johnson is an attorney, certified public accountant and a certified managerial accountant. | | Asset Allocation Trust |
David F. Larcker (Born 1950) | | Trustee, since 2009 | | James Irvin Miller Professor of Accounting at the Graduate School of Business, Stanford University, Director of the Corporate Governance Research Initiative and Senior Faculty of The Rock Center for Corporate Governance since 2006. From 2005 to 2008, Professor of Accounting at the Graduate School of Business, Stanford University. Prior thereto, Ernst & Young Professor of Accounting at The Wharton School, University of Pennsylvania from 1985 to 2005. | | Asset Allocation Trust |
| | | | |
| 32 | | Wells Fargo Growth Fund | | Other information (unaudited) |
| | | | | | |
Name and year of birth | | Position held and length of service* | | Principal occupations during past five years or longer | | Current other public
company or
investment company
directorships |
Olivia S. Mitchell (Born 1953) | | Trustee, since 2006 | | International Foundation of Employee Benefit Plans Professor, Wharton School of the University of Pennsylvania since 1993. Director of Wharton’s Pension Research Council and Boettner Center on Pensions & Retirement Research, and Research Associate at the National Bureau of Economic Research. Previously, Cornell University Professor from 1978 to 1993. | | Asset Allocation Trust |
Timothy J. Penny (Born 1951) | | Trustee, since 1996 | | President and Chief Executive Officer of Southern Minnesota Initiative Foundation, a non-profit organization, since 2007 and Senior Fellow at the Humphrey Institute Policy Forum at the University of Minnesota since 1995. Member of the Board of Trustees of NorthStar Education Finance, Inc., a non-profit organization, since 2007. | | Asset Allocation Trust |
Michael S. Scofield (Born 1943) | | Trustee, since 2010 | | Served on the Investment Company Institute’s Board of Governors and Executive Committee from 2008-2011 as well the Governing Council of the Independent Directors Council from 2006-2011 and the Independent Directors Council Executive Committee from 2008-2011. Chairman of the IDC from 2008-2010. Institutional Investor (Fund Directions) Trustee of Year in 2007. Trustee of the Evergreen Funds complex (and its predecessors) from 1984 to 2010. Chairman of the Evergreen Funds from 2000-2010. Former Trustee of the Mentor Funds. Retired Attorney, Law Offices of Michael S. Scofield. | | Asset Allocation Trust |
| * | Length of service dates reflect the Trustee’s commencement of service with the Trust’s predecessor entities, where applicable. |
Officers
| | | | | | |
Name and year of birth | | Position held and length of service | | Principal occupations during past five years or longer | | |
Karla M. Rabusch (Born 1959) | | President, since 2003 | | Executive Vice President of Wells Fargo Bank, N.A. and President of Wells Fargo Funds Management, LLC since 2003. | | |
Jeremy DePalma1 (Born 1974) | | Treasurer, since 2012 | | Senior Vice President of Wells Fargo Funds Management, LLC since 2009. Senior Vice President of Evergreen Investment Management Company, LLC from 2008 to 2010 and head of the Fund Reporting and Control Team within Fund Administration from 2005 to 2010. | | |
C. David Messman (Born 1960) | | Secretary, since 2000; Chief Legal Officer, since 2003 | | Senior Vice President and Secretary of Wells Fargo Funds Management, LLC since 2001. Assistant General Counsel of Wells Fargo Bank, N.A. since 2013 and Vice President and Managing Counsel of Wells Fargo Bank, N.A. from 1996 to 2013. | | |
Michael Whitaker (Born 1967) | | Chief Compliance Officer, since 2016* | | Executive Vice President of Wells Fargo Funds Management, LLC since 2016. Chief Compliance Officer of Fidelity’s Fixed Income Funds and Asset Allocation Funds from 2008 to 2016, Compliance Officer of FMR Co., Inc. from 2014 to 2016, Fidelity Investments Money Management, Inc. from 2014 to 2016, Fidelity Investments from 2007 to 2016. | | |
David Berardi (Born 1975) | | Assistant Treasurer, since 2009 | | Vice President of Wells Fargo Funds Management, LLC since 2009. Vice President of Evergreen Investment Management Company, LLC from 2008 to 2010. Manager of Fund Reporting and Control for Evergreen Investment Management Company, LLC from 2004 to 2010. | | |
| 1 | Jeremy DePalma acts as Treasurer of 68 funds and Assistant Treasurer of 71 funds in the Fund Complex. |
| 2 | The Statement of Additional Information includes additional information about the Trustees and is available, without charge, upon request, by calling
1-800-222-8222 or by visiting the website at wellsfargofunds.com. |
| * | Michael Whitaker became Chief Compliance Officer effective May 16, 2016. |
| | | | | | |
| Other information (unaudited) | | Wells Fargo Growth Fund | | | 33 | |
BOARD CONSIDERATION OF INVESTMENT MANAGEMENT AND SUB-ADVISORY AGREEMENTS:
Under the Investment Company Act of 1940 (the “1940 Act”), the Board of Trustees (the “Board”) of Wells Fargo Funds Trust (the “Trust”) must determine annually whether to approve the continuation of the Trust’s investment management and sub-advisory agreements. In this regard, at an in-person meeting held on May 24-25, 2016 (the “Meeting”), the Board, all the members of which have no direct or indirect interest in the investment management and sub-advisory agreements and are not “interested persons” of the Trust, as defined in the 1940 Act (the “Independent Trustees”), reviewed and approved for Wells Fargo Growth Fund (the “Fund”): (i) an investment management agreement (the “Management Agreement”) with Wells Fargo Funds Management, LLC (“Funds Management”); and (ii) an investment sub-advisory agreement (the “Sub-Advisory Agreement”) with Wells Capital Management Incorporated (the “Sub-Adviser”), an affiliate of Funds Management. The Management Agreement and the Sub-Advisory Agreement are collectively referred to as the “Advisory Agreements.”
At the Meeting, the Board considered the factors and reached the conclusions described below relating to the selection of Funds Management and the Sub-Adviser and the approval of the Advisory Agreements. Prior to the Meeting, including at an in-person meeting in April 2016, the Trustees conferred extensively among themselves and with representatives of Funds Management about these matters. Also, the Board has adopted a team-based approach, with each team consisting of a sub-set of Trustees, to assist the full Board in the discharge of its duties in reviewing performance and other matters throughout the year. The Independent Trustees were assisted in their evaluation of the Advisory Agreements by independent legal counsel, from whom they received separate legal advice and with whom they met separately.
In providing information to the Board, Funds Management and the Sub-Adviser were guided by a detailed set of requests for information submitted to them by independent legal counsel on behalf of the Independent Trustees at the start of the Board’s annual contract renewal process earlier in 2016. In considering and approving the Advisory Agreements, the Trustees considered the information they believed relevant, including but not limited to the information discussed below. The Board considered not only the specific information presented in connection with the Meeting, but also the knowledge gained over time through interaction with Funds Management and the Sub-Adviser about various topics. In this regard, the Board reviewed reports of Funds Management at each of its quarterly meetings, which included, among other things, portfolio reviews and performance reports. In addition, the Board and the teams mentioned above confer with portfolio managers at various times throughout the year. The Board did not identify any particular information or consideration that was all-important or controlling, and each individual Trustee may have attributed different weights to various factors.
After its deliberations, the Board unanimously approved the continuation of the Advisory Agreements for a one-year term and determined that the compensation payable to Funds Management and the Sub-Adviser under each of the Advisory Agreements was reasonable. The Board considered the approval of the Advisory Agreements for the Fund as part of its consideration of agreements for funds across the complex, but its approvals were made on a fund-by-fund basis. The following summarizes a number of important, but not necessarily all, factors considered by the Board in support of its approvals.
Nature, extent and quality of services
The Board received and considered various information regarding the nature, extent and quality of services provided to the Fund by Funds Management and the Sub-Adviser under the Advisory Agreements. This information included a description of the investment advisory services and Fund-level administrative services covered by the Management Agreement, as well as, among other things, a summary of the background and experience of senior management of Funds Management, and the qualifications, background, tenure and responsibilities of each of the portfolio managers primarily responsible for the day-to-day portfolio management of the Fund.
The Board evaluated the ability of Funds Management and the Sub-Adviser to attract and retain qualified investment professionals, including research, advisory and supervisory personnel. The Board further considered the compliance programs and compliance records of Funds Management and the Sub-Adviser. In addition, the Board took into account the full range of services provided to the Fund by Funds Management and its affiliates.
Fund performance and expenses
The Board considered the performance results for the Fund over various time periods ended December 31, 2015. The Board considered these results in comparison to the performance of funds in a universe that was determined by Broadridge Inc. (“Broadridge”) to be similar to the Fund (the “Universe”), and in comparison to the Fund’s benchmark index and to other comparative data. Broadridge is an independent provider of investment company data. The Board received a description of the methodology used by Broadridge to select the mutual funds in the performance Universe.
| | | | |
| 34 | | Wells Fargo Growth Fund | | Other information (unaudited) |
The Board noted that the performance of the Fund (Administrator Class) was higher than the average performance of the Universe for all periods under review except the three-year period under review. The Board also noted that the performance of the Fund was lower than its benchmark, the Russell 3000® Growth Index, for all periods under review except the ten-year period.
The Board received information concerning, and discussed factors contributing to, the underperformance of the Fund relative to the Universe and benchmark for the periods noted above. The Board took note of the explanations for the relative underperformance in these periods, including with respect to market factors and investment decisions that affected the Fund’s performance.
The Board also received and considered information regarding the Fund’s net operating expense ratios and their various components, including actual management fees, custodian and other non-management fees, and Rule 12b-1 and non-Rule 12b-1 shareholder service fees. The Board considered these ratios in comparison to the median ratios of funds in class-specific expense groups that were determined by Broadridge to be similar to the Fund (the “Groups”). The Board received a description of the methodology used by Broadridge to select the mutual funds in the expense Groups and an explanation of how funds comprising expense groups and their expense ratios may vary from year-to-year. Based on the Broadridge reports, the Board noted that the net operating expense ratios of the Fund were lower than or in range of the median net operating expense ratios of the expense Groups. The Board discussed and accepted Funds Management’s proposal to reduce the net operating expense ratio caps for the Class A and Class C.
The Board took into account the Fund performance and expense information provided to it among the factors considered in deciding to re-approve the Advisory Agreements.
Investment management and sub-advisory fee rates
The Board reviewed and considered the contractual fee rates payable by the Fund to Funds Management under the Management Agreement, as well as the contractual fee rates payable by the Fund to Funds Management for class-level administrative services under a Class-Level Administration Agreement, which include class-level transfer agency and sub-transfer agency costs (collectively, the “Management Rates”). The Board also reviewed and considered the contractual investment sub-advisory fee rates that are payable by Funds Management to the Sub-Adviser for investment sub-advisory services.
Among other information reviewed by the Board was a comparison of the Fund’s Management Rates with the average contractual investment management fee rates of funds in the expense Groups at a common asset level as well as transfer agency costs of the funds in the expense Groups. The Board noted that the Management Rates of the Fund were lower than or in range of the sum of these average rates for the Fund’s expense Groups for all share classes.
The Board also received and considered information about the portion of the total management fee that was retained by Funds Management after payment of the fee to the Sub-Adviser for sub-advisory services. In assessing the reasonableness of this amount, the Board received and evaluated information about the nature and extent of responsibilities retained and risks assumed by Funds Management and not delegated to or assumed by the Sub-Adviser, and about Funds Management’s on-going oversight services. However, given the affiliation between Funds Management and the Sub-Adviser, the Board ascribed limited relevance to the allocation of fees between them.
The Board also received and considered information about the nature and extent of services offered and fee rates charged by Funds Management and the Sub-Adviser to other types of clients with investment strategies similar to those of the Fund. In this regard, the Board received information about the significantly greater scope of services, and compliance, reporting and other legal burdens and risks of managing mutual funds compared with those associated with managing assets of non-mutual fund clients such as collective funds or institutional separate accounts.
Based on its consideration of the factors and information it deemed relevant, including those described here, the Board determined that the compensation payable to Funds Management under the Management Agreement and to the Sub-Adviser under the Sub-Advisory Agreement was reasonable, in light of the services covered by the Advisory Agreements.
Profitability
The Board received and considered information concerning the profitability of Funds Management, as well as the profitability of Wells Fargo as a whole, from providing services to the Fund and the fund family as a whole. The Board also received and considered information concerning the profitability of the Sub-Adviser from providing services to the fund family as a whole, noting that the Sub-Adviser’s profitability information with respect to providing services to the Fund was subsumed in the Wells Fargo and Funds Management profitability analysis.
| | | | | | |
| Other information (unaudited) | | Wells Fargo Growth Fund | | | 35 | |
Funds Management reported on the methodologies and estimates used in calculating profitability. Among other things, the Board noted that the levels of profitability reported on a fund-by-fund basis varied widely, depending on factors such as the size and type of fund. Based on its review, the Board did not deem the profits reported by Funds Management or Wells Fargo from its services to the Fund to be at a level that would prevent it from approving the continuation of the Advisory Agreements.
Economies of scale
With respect to possible economies of scale, the Board noted the existence of breakpoints in the Fund’s management fee structure, which operate generally to reduce the Fund’s expense ratios as the Fund grows in size. It considered that, for a small fund or a fund that shrinks in size, breakpoints conversely can result in higher fee levels. The Board also considered that fee waiver and expense reimbursement arrangements and competitive fee rates at the outset are means of sharing potential economies of scale with shareholders of the Fund and the fund family as a whole. The Board discussed and accepted Funds Management’s proposal to reduce the net operating expense ratio caps for the Class A and Class C. The Board considered Funds Management’s view that any analyses of potential economies of scale in managing a particular fund are inherently limited in light of the joint and common costs and investments that Funds Management incurs across the fund family as a whole.
The Board concluded that the Fund’s fee and expense arrangements, including contractual breakpoints, constituted a reasonable approach to sharing potential economies of scale with the Fund and its shareholders.
Other benefits to Funds Management and the Sub-Adviser
The Board received and considered information regarding potential “fall-out” or ancillary benefits received by Funds Management and its affiliates, including the Sub-Adviser, as a result of their relationships with the Fund. Ancillary benefits could include, among others, benefits directly attributable to other relationships with the Fund and benefits potentially derived from an increase in Funds Management’s and the Sub-Adviser’s business as a result of their relationships with the Fund. The Board noted that various affiliates of Funds Management may receive distribution-related fees, shareholder servicing payments and sub-transfer agency fees in respect of shares sold or held through them and services provided.
The Board also reviewed information about soft dollar credits earned and utilized by the Sub-Adviser, fees earned by Funds Management and the Sub-Adviser from managing a private investment vehicle for the fund family’s securities lending collateral and commissions earned by an affiliated broker from portfolio transactions.
Based on its consideration of the factors and information it deemed relevant, including those described here, the Board did not find that any ancillary benefits received by Funds Management and its affiliates, including the Sub-Adviser, were unreasonable.
Conclusion
At the Meeting, after considering the above-described factors and based on its deliberations and its evaluation of the information described above, the Board unanimously approved the continuation of the Advisory Agreements for a one-year term and determined that the compensation payable to Funds Management and the Sub-Adviser under each of the Advisory Agreements was reasonable.
| | | | |
| 36 | | Wells Fargo Growth Fund | | List of abbreviations |
The following is a list of common abbreviations for terms and entities that may have appeared in this report.
| ACA | — ACA Financial Guaranty Corporation |
| ADR | — American depositary receipt |
| ADS | — American depositary shares |
| AGC | — Assured Guaranty Corporation |
| AGM | — Assured Guaranty Municipal |
| Ambac | — Ambac Financial Group Incorporated |
| AMT | — Alternative minimum tax |
| BAN | — Bond anticipation notes |
| BHAC | — Berkshire Hathaway Assurance Corporation |
| CAB | — Capital appreciation bond |
| CCAB | — Convertible capital appreciation bond |
| CDA | — Community Development Authority |
| CDO | — Collateralized debt obligation |
| DRIVER | — Derivative inverse tax-exempt receipts |
| DW&P | — Department of Water & Power |
| DWR | — Department of Water Resources |
| ECFA | — Educational & Cultural Facilities Authority |
| EDA | — Economic Development Authority |
| EDFA | — Economic Development Finance Authority |
| ETF | — Exchange-traded fund |
| FDIC | — Federal Deposit Insurance Corporation |
| FFCB | — Federal Farm Credit Banks |
| FGIC | — Financial Guaranty Insurance Corporation |
| FHA | — Federal Housing Administration |
| FHLB | — Federal Home Loan Bank |
| FHLMC | — Federal Home Loan Mortgage Corporation |
| FICO | — The Financing Corporation |
| FNMA | — Federal National Mortgage Association |
| GDR | — Global depositary receipt |
| GNMA | — Government National Mortgage Association |
| HCFR | — Healthcare facilities revenue |
| HEFA | — Health & Educational Facilities Authority |
| HEFAR | — Higher education facilities authority revenue |
| HFA | — Housing Finance Authority |
| HFFA | — Health Facilities Financing Authority |
| HUD | — Department of Housing and Urban Development |
| IDA | — Industrial Development Authority |
| IDAG | — Industrial Development Agency |
| KRW | — Republic of Korea won |
| LIBOR | — London Interbank Offered Rate |
| LIFER | — Long Inverse Floating Exempt Receipts |
| LLC | — Limited liability company |
| LLLP | — Limited liability limited partnership |
| LLP | — Limited liability partnership |
| MBIA | — Municipal Bond Insurance Association |
| MFHR | — Multifamily housing revenue |
| MSTR | — Municipal securities trust receipts |
| MUD | — Municipal Utility District |
| National | — National Public Finance Guarantee Corporation |
| PCFA | — Pollution Control Financing Authority |
| PCL | — Public Company Limited |
| PCR | — Pollution control revenue |
| PFA | — Public Finance Authority |
| PFFA | — Public Facilities Financing Authority |
| PFOTER | — Puttable floating option tax-exempt receipts |
| plc | — Public limited company |
| PUTTER | — Puttable tax-exempt receipts |
| R&D | — Research & development |
| Radian | — Radian Asset Assurance |
| RAN | — Revenue anticipation notes |
| RDA | — Redevelopment Authority |
| RDFA | — Redevelopment Finance Authority |
| REIT | — Real estate investment trust |
| ROC | — Reset option certificates |
| SAVRS | — Select auction variable rate securities |
| SBA | — Small Business Authority |
| SDR | — Swedish depositary receipt |
| SFHR | — Single-family housing revenue |
| SFMR | — Single-family mortgage revenue |
| SPA | — Standby purchase agreement |
| SPDR | — Standard & Poor’s Depositary Receipts |
| SPEAR | — Short Puttable Exempt Adjustable Receipts |
| STRIPS | — Separate trading of registered interest and |
| TAN | — Tax anticipation notes |
| TIPS | — Treasury inflation-protected securities |
| TRAN | — Tax revenue anticipation notes |
| TTFA | — Transportation Trust Fund Authority |
| TVA | — Tennessee Valley Authority |

For more information
More information about Wells Fargo Funds is available free upon request. To obtain literature, please write, email, visit the Fund’s website, or call:
Wells Fargo Funds
P.O. Box 8266
Boston, MA 02266-8266
Email: fundservice@wellsfargo.com
Website: wellsfargofunds.com
Individual investors: 1-800-222-8222
Retail investment professionals: 1-888-877-9275
Institutional investment professionals: 1-866-765-0778
This report and the financial statements contained herein are submitted for the general information of the shareholders of the Fund. If this report is used for promotional purposes, distribution of the report must be accompanied or preceded by a current prospectus. Before investing, please consider the investment objectives, risks, charges, and expenses of the investment. For a current prospectus and, if available, a summary prospectus, containing this information, call
1-800-222-8222 or visit the Fund’s website at wellsfargofunds.com. Read the prospectus carefully before you invest or send money.
Wells Fargo Asset Management (WFAM) is a trade name used by the asset management businesses of Wells Fargo & Company. Wells Fargo Funds Management, LLC, a wholly owned subsidiary of Wells Fargo & Company, provides investment advisory and administrative services for Wells Fargo Funds. Other affiliates of Wells Fargo & Company provide subadvisory and other services for the funds. The funds are distributed by Wells Fargo Funds Distributor, LLC, Member FINRA, an affiliate of Wells Fargo & Company.
NOT FDIC INSURED ¡ NO BANK GUARANTEE ¡ MAY LOSE VALUE
© 2016 Wells Fargo Funds Management, LLC. All rights reserved.
| | |
 | | 245323 09-16 A206/AR206 07-16 |
Annual Report
July 31, 2016

Wells Fargo Intrinsic Value Fund


Reduce clutter. Save trees.
Sign up for electronic delivery of prospectuses and shareholder reports at wellsfargo.com/advantagedelivery
Contents
The views expressed and any forward-looking statements are as of July 31, 2016, unless otherwise noted, and are those of the Fund managers and/or Wells Fargo Funds Management, LLC. Discussions of individual securities, or the markets generally, or any Wells Fargo Fund are not intended as individual recommendations. Future events or results may vary significantly from those expressed in any forward-looking statements. The views expressed are subject to change at any time in response to changing circumstances in the market. Wells Fargo Funds Management, LLC and the Fund disclaim any obligation to publicly update or revise any views expressed or forward-looking statements.
NOT FDIC INSURED ¡ NO BANK GUARANTEE ¡ MAY LOSE VALUE
| | | | |
| 2 | | Wells Fargo Intrinsic Value Fund | | Letter to shareholders (unaudited) |

Karla M. Rabusch
President
Wells Fargo Funds
Despite significant market fluctuations over the course of the year, U.S. stocks delivered positive results overall for the 12-month reporting period
Dear Valued Shareholder:
We are pleased to offer you this annual report for the Wells Fargo Intrinsic Value Fund for the 12-month period that ended July 31, 2016. During this period, which began August 1, 2015, U.S. and international stock markets experienced heightened volatility, with intermittent rebounds interspersed with sell-offs. The U.S. economy displayed resilience throughout the period, although growth was somewhat sluggish amid ongoing pressures that included slowing growth in China, a strengthening U.S. dollar, and uncertainty regarding interest-rate increases by the U.S. Federal Reserve (Fed); international economies faced deeper ongoing challenges. During June 2016, global markets became especially volatile as the U.K.’s vote over whether to leave the European Union (E.U.) approached. However, markets began recovering shortly after the U.K. voted to leave and rallied through July. Despite significant market fluctuations over the course of the year, U.S. stocks delivered positive results overall for the 12-month reporting period, as measured by the Russell 1000® Index.1 International markets generally declined as measured by the Morgan Stanley Capital International (MSCI) Europe, Australasia, Far East (EAFE) Index.2
In the third quarter of 2015, China’s slowdown took a toll on economies and markets worldwide.
U.S. stocks sagged during the quarter, experiencing the most volatility since 2011. Economic data released during the quarter suggested the U.S. economy remained solid but had lost some steam, burdened by the drag of the U.S. dollar’s strength coupled with global economic turmoil. The fact that the Fed left the federal funds interest rate unchanged at its September 2015 meeting surprised investors and fueled increased uncertainty about the U.S. economy’s stamina to remain healthy while facing the challenges of slowing growth in China and troubles elsewhere in the world. Outside the U.S., markets were even more volatile and delivered generally weaker quarterly results, also largely due to investors’ increasing anxiety over China’s weakened economy.
Despite ongoing concerns, U.S. stocks generally rose in the fourth quarter of 2015; international markets lagged.
While the broad U.S. stock market bounced back in the quarter, stock markets outside the U.S. failed to keep pace as economic concerns, including China’s ongoing slowdown, continued to affect many countries. U.S. economic data released during the quarter indicated the economy remained solid, although the strong U.S. dollar and weakness in international economies remained headwinds. In December, the Fed, as expected, raised its target interest rate by 25 basis points (bps; 100 bps equals 1.00%) after keeping it near zero for seven years. The move reflected confidence in the U.S. economy’s ability to stay healthy with less central-bank support. The Fed also clarified that future interest-rate increases would be gradual.
| 1 | The Russell 1000® Index measures the performance of the 1,000 largest companies in the Russell 3000® Index, which represents approximately 92% of the total market capitalization of the Russell 3000® Index. You cannot invest directly in an index. |
| 2 | Morgan Stanley Capital International (MSCI) Europe, Australasia, Far East (EAFE) Index is a free-float-adjusted market-capitalization-weighted index that is designed to measure the equity market performance of developed markets, excluding the United States and Canada. The MSCI EAFE Index consists of the following 21 developed markets country indexes: Australia, Austria, Belgium, Denmark, Finland, France, Germany, Hong Kong, Ireland, Israel, Italy, Japan, the Netherlands, New Zealand, Norway, Portugal, Singapore, Spain, Sweden, Switzerland, and the United Kingdom. You cannot invest directly in an index. |
| | | | | | |
| Letter to shareholders (unaudited) | | Wells Fargo Intrinsic Value Fund | | | 3 | |
In the first quarter of 2016, market volatility increased globally amid ongoing concerns.
Stock markets worldwide fluctuated widely in the first quarter of 2016. Most sold off sharply in the first six weeks of the year on concerns such as weak global growth, falling commodity prices, and uncertainty over the timing and impact of the Fed’s interest-rate increases. As the quarter progressed, fears abated somewhat and global markets generally rallied back. The U.S. economy ended the quarter on a positive note as much of the quarter’s data reflected resiliency. With ongoing uncertainties about global growth and financial markets, however, the Fed held off from raising the target interest rate during the quarter. Outside the U.S., the eurozone fell into deflation in February; in response, the European Central Bank announced an expansion of its stimulus program. In China, the government in March set a growth rate of 6.5% to 7.0% for 2016, an acknowledgment of weakening growth. In emerging markets, although central-bank stimulus and improved prices for oil and other commodities led to stock-market rallies in the quarter, many of these countries’ economies face credit downgrades due to challenges such as the likelihood of a stronger U.S. dollar, which would make dollar-denominated debt more expensive.
Worries over interest rates and the U.K.’s vote largely drove the markets during the second quarter of 2016.
U.S. stocks began the quarter in positive territory but started to lose steam in early May on worries that a possible June interest-rate increase by the Fed could hurt the market. In mid-May, stocks briefly plunged following comments by Fed officials noting that a June interest-rate increase remained on the table. But once investors had processed this information, stocks again rallied, finishing up for the month. The first three weeks of June brought heightened volatility, spurred largely by a disappointing jobs report and uncertainty over whether the U.K. would remain in the E.U. The U.K.’s Brexit vote on June 23 shocked countries in Europe and much of the rest of the world. Stock markets plummeted as investors worried that the U.K.’s departure from the E.U. would slow global growth and prolong the low-interest-rate environment. Following the initial rout, however, U.S. stocks rallied as investors seemed to decide that any negative effects would be more localized and not create a serious risk for global growth. By quarter-end, the broad U.S. stock market had moved back into positive territory.
Stocks generally posted positive results for July 2016.
U.S. stocks displayed the most momentum during the first two weeks of the month, buoyed partly by an unexpectedly favorable June jobs report that helped strengthen confidence in the U.S. economy. Also, investors perhaps felt that global central banks could extend stimulus measures in the wake of the Brexit vote. Although U.S. market momentum slowed during the second half of July, stocks ended in positive territory for the month. International stocks delivered positive monthly results as well.
| | | | |
| 4 | | Wells Fargo Intrinsic Value Fund | | Letter to shareholders (unaudited) |
Don’t let short-term uncertainty derail long-term investment goals.
Periods of uncertainty can present challenges, but experience has taught us that maintaining long-term investment goals can be an effective way to plan for the future. To help you create a sound strategy based on your personal goals and risk tolerance, Wells Fargo Funds offers more than 100 mutual funds spanning a wide range of asset classes and investment styles. Although diversification cannot guarantee an investment profit or prevent losses, we believe it can be an effective way to manage investment risk and potentially smooth out overall portfolio performance. We encourage investors to know their investments and to understand that appropriate levels of risk-taking may unlock opportunities.
Thank you for choosing to invest in Wells Fargo Funds. We appreciate your confidence in us and remain committed to helping you meet your financial needs.
Sincerely,

Karla M. Rabusch
President
Wells Fargo Funds
Although diversification cannot guarantee an investment profit or prevent losses, we believe it can be an effective way to manage investment risk and potentially smooth out overall portfolio performance.
For further information about your Fund, contact your investment professional, visit our website at wellsfargofunds.com, or call us directly at 1-800-222-8222. We are available 24 hours a day, 7 days a week.
This page is intentionally left blank.
| | | | |
| 6 | | Wells Fargo Intrinsic Value Fund | | Performance highlights (unaudited) |
Investment objective
The Fund seeks long-term capital appreciation.
Manager
Wells Fargo Funds Management, LLC
Subadviser
Wells Capital Management Incorporated
Portfolio managers
Miguel E. Giaconi, CFA®
Jean-Baptiste Nadal, CFA®
Jeffrey Peck
Average annual total returns (%) as of July 31, 20161
| | | | | | | | | | | | | | | | | | | | | | | | | | | | | | | | | | |
| | | | | Including sales charge | | | Excluding sales charge | | | Expense ratios2 (%) | |
| | | Inception date | | 1 year | | | 5 year | | | Since
inception | | | 1 year | | | 5 year | | | Since
inception | | | Gross | | | Net3 | |
| Class A (EIVAX) | | 8-1-2006 | | | (7.38 | ) | | | 8.94 | | | | 6.61 | | | | (1.73 | ) | | | 10.24 | | | | 7.24 | | | | 1.17 | | | | 1.11 | |
| Class B (EIVBX)* | | 8-1-2006 | | | (6.84 | ) | | | 9.12 | | | | 6.69 | | | | (2.47 | ) | | | 9.40 | | | | 6.69 | | | | 1.92 | | | | 1.86 | |
| Class C (EIVCX) | | 8-1-2006 | | | (3.47 | ) | | | 9.42 | | | | 6.45 | | | | (2.47 | ) | | | 9.42 | | | | 6.45 | | | | 1.92 | | | | 1.86 | |
| Class R (EIVTX) | | 3-1-2013 | | | – | | | | – | | | | – | | | | (1.99 | ) | | | 9.98 | | | | 7.00 | | | | 1.42 | | | | 1.36 | |
| Class R4 (EIVRX) | | 11-30-2012 | | | – | | | | – | | | | – | | | | (1.39 | ) | | | 10.61 | | | | 7.56 | | | | 0.89 | | | | 0.80 | |
| Class R6 (EIVFX) | | 11-30-2012 | | | – | | | | – | | | | – | | | | (1.30 | ) | | | 10.62 | | | | 7.57 | | | | 0.74 | | | | 0.65 | |
| Administrator Class (EIVDX) | | 7-30-2010 | | | – | | | | – | | | | – | | | | (1.58 | ) | | | 10.45 | | | | 7.43 | | | | 1.09 | | | | 0.95 | |
| Institutional Class (EIVIX) | | 8-1-2006 | | | – | | | | – | | | | – | | | | (1.27 | ) | | | 10.70 | | | | 7.60 | | | | 0.84 | | | | 0.70 | |
| Russell 1000® Value Index4 | | – | | | – | | | | – | | | | – | | | | 5.38 | | | | 12.75 | | | | 6.20 | | | | – | | | | – | |
| * | | Class B shares are closed to investment, except in connection with the reinvestment of any distributions and permitted exchanges. |
Figures quoted represent past performance, which is no guarantee of future results, and do not reflect taxes that a shareholder may pay on fund distributions or the redemption of fund shares. Investment return and principal value of an investment will fluctuate so that an investor’s shares, when redeemed, may be worth more or less than their original cost. Performance shown without sales charges would be lower if sales charges were reflected. Current performance may be lower or higher than the performance data quoted, which assumes the reinvestment of dividends and capital gains. Current month-end performance is available on the Fund’s website, wellsfargofunds.com.
Index returns do not include transaction costs associated with buying and selling securities, any mutual fund fees or expenses, or any taxes. It is not possible to invest directly in an index.
For Class A shares, the maximum front-end sales charge is 5.75%. For Class B shares, the maximum contingent deferred sales charge is 5.00%. For Class C shares, the maximum contingent deferred sales charge is 1.00%. Performance including a contingent deferred sales charge assumes the sales charge for the corresponding time period. Class R, Class R4, Class R6, Administrator Class, and Institutional Class shares are sold without a front-end sales charge or contingent deferred sales charge.
Stock values fluctuate in response to the activities of individual companies and general market and economic conditions. Certain investment strategies tend to increase the total risk of an investment (relative to the broader market). The Fund is exposed to foreign investment risk and focused portfolio risk. Consult the Fund’s prospectus for additional information on these and other risks.
Please see footnotes on page 7.
| | | | | | |
| Performance highlights (unaudited) | | Wells Fargo Intrinsic Value Fund | | | 7 | |
|
| Growth of $10,000 investment as of July 31, 20165 |
|
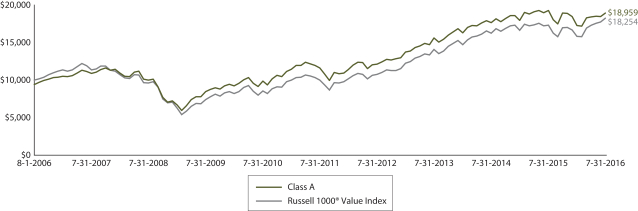 |
| 1 | Historical performance shown for Class R shares prior to their inception reflects the performance of Institutional Class shares, adjusted to reflect the higher expenses applicable to Class R shares. Historical performance shown for Class R4 shares prior to their inception reflects the performance of Institutional Class shares, adjusted to reflect the higher expenses applicable to Class R4 shares. Historical performance shown for Class R6 shares prior to their inception reflects the performance of Institutional Class shares, and includes the higher expenses applicable to Institutional Class shares. If these expenses had not been included, returns would be higher. Historical performance shown for Administrator Class shares prior to their inception reflects the performance of Institutional Class shares, adjusted to reflect the higher expenses applicable to Administrator Class shares. Historical performance shown for all classes of the Fund prior to July 19, 2010, is based on the performance of the Fund’s predecessor, Evergreen Intrinsic Value Fund. |
| 2 | Reflects the expense ratios as stated in the most recent prospectuses. The expense ratios shown are subject to change and may differ from the annualized expense ratios shown in the financial highlights of this report. |
| 3 | The manager has contractually committed through November 30, 2016, to waive fees and/or reimburse expenses to the extent necessary to cap the Fund’s Total Annual Fund Operating Expenses After Fee Waiver at the amounts shown. After this time, the cap may be increased or the commitment to maintain the cap may be terminated only with the approval of the Board of Trustees. Brokerage commissions, stamp duty fees, interest, taxes, acquired fund fees and expenses, and extraordinary expenses are excluded from the expense cap. Without this cap, the Fund’s returns would have been lower. |
| 4 | The Russell 1000® Value Index measures the performance of those Russell 1000 companies with lower price-to-book ratios and lower forecasted growth values. You cannot invest directly in an index. |
| 5 | The chart compares the performance of Class A shares for the most recent ten years with the Russell 1000® Value Index. The chart assumes a hypothetical investment of $10,000 in Class A shares and reflects all operating expenses and assumes the maximum initial sales charge of 5.75%. |
| 6 | The ten largest holdings, excluding cash and cash equivalents, are calculated based on the value of the investments divided by total net assets of the Fund. Holdings are subject to change and may have changed since the date specified. |
| 7 | Amounts are calculated based on the total long-term investments of the Fund. These amounts are subject to change and may have changed since the date specified. |
| | | | |
| 8 | | Wells Fargo Intrinsic Value Fund | | Performance highlights (unaudited) |
MANAGER’S DISCUSSION
Fund highlights
| n | | The Fund underperformed its benchmark, the Russell 1000® Value Index, for the 12-month period that ended July 31, 2016. |
| n | | Security selection in the health care, industrials, financials, and information technology (IT) sectors was the primary detractor from relative performance. The negative impact of stock selection was partially offset by the Fund’s underweight to financials, the worst-performing sector, and overweights to IT and industrials, two strong-performing sectors. Also, stock selection in consumer staples aided the Fund’s relative performance. |
| n | | Strong market performance in the Russell 1000® Value Index was principally driven by investor demand for bond-like-yielding stocks. We continued to adhere to our disciplined investment process that relies predominantly on discounted free cash flow. We focus on individual companies rather than on broad, top-down economic or sector forecasts. To manage risk, we maintained the Fund’s broad diversification by sector, industry, and position. |
| | | | |
| Ten largest holdings (%) as of July 31, 20166 | |
The TJX Companies Incorporated | | | 3.04 | |
BB&T Corporation | | | 3.02 | |
NextEra Energy Incorporated | | | 2.99 | |
Microsoft Corporation | | | 2.97 | |
EOG Resources Incorporated | | | 2.95 | |
The Allstate Corporation | | | 2.93 | |
Anheuser-Busch InBev NV ADR | | | 2.92 | |
Honeywell International Incorporated | | | 2.85 | |
Lockheed Martin Corporation | | | 2.81 | |
Alphabet Incorporated Class C | | | 2.69 | |
The Fund underperformed its benchmark for the reporting period.
On the negative side, stock selection in health care, industrials, financials, and IT detracted from relative return. Two of the most significant detractors were biopharmaceutical leader Gilead Sciences, Incorporated, and pharmacy benefit management organization Express Scripts Holding Company within health care. In the industrials sector, sensor producer Sensata Technologies Holding N.V. and aircraft lessor AerCap Holdings N.V. subtracted value. Meanwhile, the most significant negative contributors in IT and financials were consumer electronics innovator Apple Incorporated and wealth management servicer UBS AG, respectively.
Security selection in consumer staples contributed to the Fund’s performance, with the largest contributor being global beverage and snack producer PepsiCo, Incorporated.
During the period, we made changes to the Fund’s portfolio based upon our fundamental research.
As a result of trades, stock price movements, and the annual reconstitution of the Russell Indexes, the Fund’s positioning relative to its benchmark shifted noticeably during the period. The Fund’s overweight to IT increased due to our purchases of networking equipment producer Cisco Systems, Incorporated, and technology consulting and business outsourcing servicer Accenture plc, as well as of Alphabet Incorporated, a premier internet company with world-renowned brand Google. We also added to positions in specialized public safety communications provider Motorola Solutions, Incorporated, and money transfer agent The Western Union Company. These purchases were partially offset by the sale of semiconductor producers Texas Instruments Incorporated and QUALCOMM Incorporated, as well as of corporate storage company EMC Corporation.
The Fund reduced its sizable overweight to the consumer discretionary sector through the divestment of media and entertainment provider Time Warner Incorporated and hospitality company Marriott International, Incorporated. Meanwhile, the Fund’s slight overweight to industrials augmented with the purchase of aircraft lessor AerCap Holdings, along with adds to sensor producer Sensata Technologies. A decrease in the Fund’s consumer staples sector overweight resulted from the sale of household/personal care company Unilever N.V. and global leader in premium spirits Diageo plc. In all cases, trades were made based on fundamental, bottom-up research rather than top-down sector allocation decisions.
Please see footnotes on page 7.
| | | | | | |
| Performance highlights (unaudited) | | Wells Fargo Intrinsic Value Fund | | | 9 | |
|
| Sector distribution as of July 31, 20167 |
|
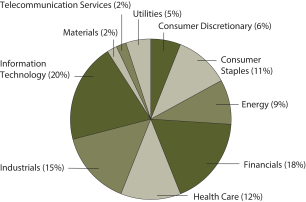 |
We continue to focus on our investment strategy and process.
In the current environment of low interest rates, investors are demanding bond-like equity investments with high dividend yields. As such, investors are principally focused on macroeconomic events, not company fundamentals. In our view, this trend is not sustainable because these sectors and companies become overvalued and momentum driven.
In an environment where investors are solely focused on dividend yields, our approach will almost certainly lag the market. While free cash flow may be used to pay dividends, we rely on the company’s management to identify the most appropriate uses of this cash. These uses may include
restructuring of the balance sheet, share repurchases, new products, acquisitions, or marketing. We remain confident in the portfolio’s holdings and are adding to some of these investments on weakness. In particular, we believe that industry trends in enterprise computing, health care, and financials favor the companies we selected for the portfolio.
We continue to believe that our long-term focus on company fundamentals, our determination to seek out mispricing opportunities in the marketplace, and our ability to identify catalysts that create or unlock value over our investment time horizon should return value for shareholders over a complete market cycle.
Please see footnotes on page 7.
| | | | |
| 10 | | Wells Fargo Intrinsic Value Fund | | Fund expenses (unaudited) |
As a shareholder of the Fund, you incur two types of costs: (1) transaction costs, including sales charges (loads) on purchase payments and contingent deferred sales charges (if any) on redemptions and (2) ongoing costs, including management fees, distribution (12b-1) and/or shareholder servicing fees, and other Fund expenses. This example is intended to help you understand your ongoing costs (in dollars) of investing in the Fund and to compare these costs with the ongoing costs of investing in other mutual funds.
The example is based on an investment of $1,000 invested at the beginning of the six-month period and held for the entire period from February 1, 2016 to July 31, 2016.
Actual expenses
The “Actual” line of the table below provides information about actual account values and actual expenses. You may use the information in this line, together with the amount you invested, to estimate the expenses that you paid over the period. Simply divide your account value by $1,000 (for example, an $8,600 account value divided by $1,000 = 8.6), then multiply the result by the number in the “Actual” line under the heading entitled “Expenses paid during period” for your applicable class of shares to estimate the expenses you paid on your account during this period.
Hypothetical example for comparison purposes
The “Hypothetical” line of the table below provides information about hypothetical account values and hypothetical expenses based on the Fund’s actual expense ratio and an assumed rate of return of 5% per year before expenses, which is not the Fund’s actual return. The hypothetical account values and expenses may not be used to estimate the actual ending account balance or expenses you paid for the period. You may use this information to compare the ongoing costs of investing in the Fund and other funds. To do so, compare this 5% hypothetical example with the 5% hypothetical examples that appear in the shareholder reports of the other funds.
Please note that the expenses shown in the table are meant to highlight your ongoing costs only and do not reflect any transactional costs, such as sales charges (loads) and contingent deferred sales charges. Therefore, the “Hypothetical” line of the table is useful in comparing ongoing costs only and will not help you determine the relative total costs of owning different funds. In addition, if these transactional costs were included, your costs would have been higher.
| | | | | | | | | | | | | | | | |
| | | Beginning
account value
2-1-2016 | | | Ending
account value
7-31-2016 | | | Expenses
paid during
the period¹ | | | Annualized net
expense ratio | |
Class A | | | | | | | | | | | | | | | | |
Actual | | $ | 1,000.00 | | | $ | 1,096.80 | | | $ | 5.68 | | | | 1.09 | % |
Hypothetical (5% return before expenses) | | $ | 1,000.00 | | | $ | 1,019.45 | | | $ | 5.47 | | | | 1.09 | % |
Class B | | | | | | | | | | | | | | | | |
Actual | | $ | 1,000.00 | | | $ | 1,092.25 | | | $ | 9.68 | | | | 1.86 | % |
Hypothetical (5% return before expenses) | | $ | 1,000.00 | | | $ | 1,015.61 | | | $ | 9.32 | | | | 1.86 | % |
Class C | | | | | | | | | | | | | | | | |
Actual | | $ | 1,000.00 | | | $ | 1,093.11 | | | $ | 9.68 | | | | 1.86 | % |
Hypothetical (5% return before expenses) | | $ | 1,000.00 | | | $ | 1,015.61 | | | $ | 9.32 | | | | 1.86 | % |
Class R | | | | | | | | | | | | | | | | |
Actual | | $ | 1,000.00 | | | $ | 1,095.11 | | | $ | 7.09 | | | | 1.36 | % |
Hypothetical (5% return before expenses) | | $ | 1,000.00 | | | $ | 1,018.10 | | | $ | 6.83 | | | | 1.36 | % |
Class R4 | | | | | | | | | | | | | | | | |
Actual | | $ | 1,000.00 | | | $ | 1,098.36 | | | $ | 4.17 | | | | 0.80 | % |
Hypothetical (5% return before expenses) | | $ | 1,000.00 | | | $ | 1,020.89 | | | $ | 4.02 | | | | 0.80 | % |
Class R6 | | | | | | | | | | | | | | | | |
Actual | | $ | 1,000.00 | | | $ | 1,098.80 | | | $ | 3.39 | | | | 0.65 | % |
Hypothetical (5% return before expenses) | | $ | 1,000.00 | | | $ | 1,021.63 | | | $ | 3.27 | | | | 0.65 | % |
Administrator Class | | | | | | | | | | | | | | | | |
Actual | | $ | 1,000.00 | | | $ | 1,097.37 | | | $ | 4.95 | | | | 0.95 | % |
Hypothetical (5% return before expenses) | | $ | 1,000.00 | | | $ | 1,020.14 | | | $ | 4.77 | | | | 0.95 | % |
Institutional Class | | | | | | | | | | | | | | | | |
Actual | | $ | 1,000.00 | | | $ | 1,099.18 | | | $ | 3.65 | | | | 0.70 | % |
Hypothetical (5% return before expenses) | | $ | 1,000.00 | | | $ | 1,021.38 | | | $ | 3.52 | | | | 0.70 | % |
| 1 | Expenses paid is equal to the annualized net expense ratio of each class multiplied by the average account value over the period, multiplied by the number of days in the most recent fiscal half-year divided by the number of days in the fiscal year (to reflect the one-half-year period). |
| | | | | | |
| Portfolio of investments—July 31, 2016 | | Wells Fargo Intrinsic Value Fund | | | 11 | |
| | | | | | | | | | | | | | | | |
| Security name | | | | | | | | Shares | | | Value | |
| | | | |
Common Stocks: 96.24% | | | | | | | | | | | | | | | | |
| | | | |
Consumer Discretionary: 6.29% | | | | | | | | | | | | | | | | |
| | | | |
| Media: 2.53% | | | | | | | | | | | | | | | | |
The Walt Disney Company | | | | | | | | | | | 272,962 | | | $ | 26,190,704 | |
| | | | | | | | | | | | | | | | |
| | | | |
| Specialty Retail: 3.76% | | | | | | | | | | | | | | | | |
Advance Auto Parts Incorporated | | | | | | | | | | | 43,856 | | | | 7,449,380 | |
The TJX Companies Incorporated | | | | | | | | | | | 386,042 | | | | 31,547,352 | |
| | | | |
| | | | | | | | | | | | | | | 38,996,732 | |
| | | | | | | | | | | | | | | | |
| | | | |
Consumer Staples: 10.35% | | | | | | | | | | | | | | | | |
| | | | |
| Beverages: 5.36% | | | | | | | | | | | | | | | | |
Anheuser-Busch InBev NV ADR | | | | | | | | | | | 233,667 | | | | 30,245,856 | |
PepsiCo Incorporated | | | | | | | | | | | 232,680 | | | | 25,343,506 | |
| | | | |
| | | | | | | | | | | | | | | 55,589,362 | |
| | | | | | | | | | | | | | | | |
| | | | |
| Food Products: 2.49% | | | | | | | | | | | | | | | | |
Nestle SA ADR | | | | | | | | | | | 321,286 | | | | 25,776,776 | |
| | | | | | | | | | | | | | | | |
| | | | |
| Household Products: 2.50% | | | | | | | | | | | | | | | | |
The Procter & Gamble Company | | | | | | | | | | | 302,669 | | | | 25,905,440 | |
| | | | | | | | | | | | | | | | |
| | | | |
Energy: 8.47% | | | | | | | | | | | | | | | | |
| | | | |
| Energy Equipment & Services: 3.15% | | | | | | | | | | | | | | | | |
FMC Technologies Incorporated † | | | | | | | | | | | 471,082 | | | | 11,956,061 | |
Schlumberger Limited | | | | | | | | | | | 257,540 | | | | 20,737,121 | |
| | | | |
| | | | | | | | | | | | | | | 32,693,182 | |
| | | | | | | | | | | | | | | | |
| | | | |
| Oil, Gas & Consumable Fuels: 5.32% | | | | | | | | | | | | | | | | |
Concho Resources Incorporated † | | | | | | | | | | | 42,713 | | | | 5,304,955 | |
EOG Resources Incorporated | | | | | | | | | | | 373,923 | | | | 30,549,509 | |
Occidental Petroleum Corporation | | | | | | | | | | | 92,663 | | | | 6,924,706 | |
Royal Dutch Shell plc ADR Class A | | | | | | | | | | | 237,441 | | | | 12,297,069 | |
| | | | |
| | | | | | | | | | | | | | | 55,076,239 | |
| | | | | | | | | | | | | | | | |
| | | | |
Financials: 17.10% | | | | | | | | | | | | | | | | |
| | | | |
| Banks: 7.41% | | | | | | | | | | | | | | | | |
BB&T Corporation | | | | | | | | | | | 848,614 | | | | 31,288,398 | |
CIT Group Incorporated | | | | | | | | | | | 564,777 | | | | 19,518,693 | |
US Bancorp | | | | | | | | | | | 615,355 | | | | 25,949,520 | |
| | | | |
| | | | | | | | | | | | | | | 76,756,611 | |
| | | | | | | | | | | | | | | | |
| | | | |
| Capital Markets: 2.88% | | | | | | | | | | | | | | | | |
Charles Schwab Corporation | | | | | | | | | | | 578,549 | | | | 16,442,363 | |
UBS Group AG « | | | | | | | | | | | 971,454 | | | | 13,386,636 | |
| | | | |
| | | | | | | | | | | | | | | 29,828,999 | |
| | | | | | | | | | | | | | | | |
| | | | |
| Consumer Finance: 1.89% | | | | | | | | | | | | | | | | |
Synchrony Financial | | | | | | | | | | | 701,816 | | | | 19,566,630 | |
| | | | | | | | | | | | | | | | |
The accompanying notes are an integral part of these financial statements.
| | | | |
| 12 | | Wells Fargo Intrinsic Value Fund | | Portfolio of investments—July 31, 2016 |
| | | | | | | | | | | | | | | | |
| Security name | | | | | | | | Shares | | | Value | |
| | | | |
| Insurance: 2.93% | | | | | | | | | | | | | | | | |
The Allstate Corporation | | | | | | | | | | | 444,469 | | | $ | 30,370,567 | |
| | | | | | | | | | | | | | | | |
| | | | |
| REITs: 1.99% | | | | | | | | | | | | | | | | |
Crown Castle International Corporation | | | | | | | | | | | 212,582 | | | | 20,626,831 | |
| | | | | | | | | | | | | | | | |
| | | | |
Health Care: 11.56% | | | | | | | | | | | | | | | | |
| | | | |
| Biotechnology: 2.50% | | | | | | | | | | | | | | | | |
Gilead Sciences Incorporated | | | | | | | | | | | 326,413 | | | | 25,940,041 | |
| | | | | | | | | | | | | | | | |
| | | | |
| Health Care Equipment & Supplies: 2.46% | | | | | | | | | | | | | | | | |
Abbott Laboratories | | | | | | | | | | | 569,947 | | | | 25,505,128 | |
| | | | | | | | | | | | | | | | |
| | | | |
| Health Care Providers & Services: 4.15% | | | | | | | | | | | | | | | | |
Cigna Corporation | | | | | | | | | | | 174,038 | | | | 22,443,940 | |
Express Scripts Holding Company † | | | | | | | | | | | 269,337 | | | | 20,488,466 | |
| | | | |
| | | | | | | | | | | | | | | 42,932,406 | |
| | | | | | | | | | | | | | | | |
| | | | |
| Pharmaceuticals: 2.45% | | | | | | | | | | | | | | | | |
Merck & Company Incorporated | | | | | | | | | | | 432,393 | | | | 25,364,173 | |
| | | | | | | | | | | | | | | | |
| | | | |
Industrials: 14.14% | | | | | | | | | | | | | | | | |
| | | | |
| Aerospace & Defense: 7.76% | | | | | | | | | | | | | | | | |
Honeywell International Incorporated | | | | | | | | | | | 253,529 | | | | 29,493,029 | |
Lockheed Martin Corporation | | | | | | | | | | | 115,224 | | | | 29,120,562 | |
The Boeing Company | | | | | | | | | | | 163,077 | | | | 21,796,872 | |
| | | | |
| | | | | | | | | | | | | | | 80,410,463 | |
| | | | | | | | | | | | | | | | |
| | | | |
| Air Freight & Logistics: 1.89% | | | | | | | | | | | | | | | | |
United Parcel Service Incorporated Class B | | | | | | | | | | | 181,588 | | | | 19,629,663 | |
| | | | | | | | | | | | | | | | |
| | | | |
| Electrical Equipment: 1.96% | | | | | | | | | | | | | | | | |
Sensata Technologies Holding NV † | | | | | | | | | | | 534,663 | | | | 20,274,421 | |
| | | | | | | | | | | | | | | | |
| | | | |
| Trading Companies & Distributors: 2.53% | | | | | | | | | | | | | | | | |
AerCap Holdings NV † | | | | | | | | | | | 717,495 | | | | 26,195,742 | |
| | | | | | | | | | | | | | | | |
| | | | |
Information Technology: 19.68% | | | | | | | | | | | | | | | | |
| | | | |
| Communications Equipment: 5.08% | | | | | | | | | | | | | | | | |
Cisco Systems Incorporated | | | | | | | | | | | 820,001 | | | | 25,034,631 | |
Motorola Solutions Incorporated | | | | | | | | | | | 398,503 | | | | 27,648,138 | |
| | | | |
| | | | | | | | | | | | | | | 52,682,769 | |
| | | | | | | | | | | | | | | | |
| | | | |
| Internet Software & Services: 2.69% | | | | | | | | | | | | | | | | |
Alphabet Incorporated Class C † | | | | | | | | | | | 36,313 | | | | 27,917,071 | |
| | | | | | | | | | | | | | | | |
| | | | |
| IT Services: 4.89% | | | | | | | | | | | | | | | | |
Accenture plc Class A | | | | | | | | | | | 231,822 | | | | 26,151,840 | |
The Western Union Company | | | | | | | | | | | 1,223,588 | | | | 24,471,760 | |
| | | | |
| | | | | | | | | | | | | | | 50,623,600 | |
| | | | | | | | | | | | | | | | |
The accompanying notes are an integral part of these financial statements.
| | | | | | |
| Portfolio of investments—July 31, 2016 | | Wells Fargo Intrinsic Value Fund | | | 13 | |
| | | | | | | | | | | | | | | | |
| Security name | | | | | | | | Shares | | | Value | |
| | | | |
| Software: 5.22% | | | | | | | | | | | | | | | | |
Microsoft Corporation | | | | | | | | | | | 543,242 | | | $ | 30,790,957 | |
Oracle Corporation | | | | | | | | | | | 568,338 | | | | 23,324,592 | |
| | | | |
| | | | | | | | | | | | | | | 54,115,549 | |
| | | | | | | | | | | | | | | | |
| | | | |
| Technology Hardware, Storage & Peripherals: 1.80% | | | | | | | | | | | | | | | | |
Apple Incorporated | | | | | | | | | | | 178,521 | | | | 18,603,673 | |
| | | | | | | | | | | | | | | | |
| | | | |
Materials: 1.50% | | | | | | | | | | | | | | | | |
| | | | |
| Construction Materials: 1.50% | | | | | | | | | | | | | | | | |
Vulcan Materials Company | | | | | | | | | | | 125,059 | | | | 15,504,815 | |
| | | | | | | | | | | | | | | | |
| | | | |
Telecommunication Services: 1.93% | | | | | | | | | | | | | | | | |
| | | | |
| Diversified Telecommunication Services: 1.93% | | | | | | | | | | | | | | | | |
Verizon Communications Incorporated | | | | | | | | | | | 359,938 | | | | 19,944,165 | |
| | | | | | | | | | | | | | | | |
| | | | |
Utilities: 5.22% | | | | | | | | | | | | | | | | |
| | | | |
| Electric Utilities: 2.99% | | | | | | | | | | | | | | | | |
NextEra Energy Incorporated | | | | | | | | | | | 241,281 | | | | 30,953,939 | |
| | | | | | | | | | | | | | | | |
| | | | |
| Multi-Utilities: 2.23% | | | | | | | | | | | | | | | | |
WEC Energy Group Incorporated | | | | | | | | | | | 357,021 | | | | 23,174,233 | |
| | | | | | | | | | | | | | | | |
| | | | |
Total Common Stocks (Cost $856,314,033) | | | | | | | | | | | | | | | 997,149,924 | |
| | | | | | | | | | | | | | | | |
| | | | |
| | | Yield | | | | | | | | | | |
| Short-Term Investments: 5.15% | | | | | | | | | | | | | | | | |
| | | | |
| Investment Companies: 5.15% | | | | | | | | | | | | | | | | |
Securities Lending Cash Investments LLC (l)(r)(u) | | | 0.50 | % | | | | | | | 13,536,600 | | | | 13,536,600 | |
Wells Fargo Government Money Market Fund Select Class (l)(u) | | | 0.32 | | | | | | | | 39,814,811 | | | | 39,814,811 | |
| | | | |
Total Short-Term Investments (Cost $53,351,411) | | | | | | | | | | | | | | | 53,351,411 | |
| | | | | | | | | | | | | | | | |
| | | | | | | | |
| Total investments in securities (Cost $909,665,444) * | | | 101.39 | % | | | 1,050,501,335 | |
Other assets and liabilities, net | | | (1.39 | ) | | | (14,430,380 | ) |
| | | | | | | | |
| Total net assets | | | 100.00 | % | | $ | 1,036,070,955 | |
| | | | | | | | |
| † | Non-income-earning security |
| « | All or a portion of this security is on loan. |
| (l) | The issuer of the security is an affiliated person of the Fund as defined in the Investment Company Act of 1940. |
| (r) | The investment is a non-registered investment vehicle purchased with cash collateral received from securities on loan. |
| (u) | The rate represents the 7-day annualized yield at period end. |
| * | Cost for federal income tax purposes is $910,240,853 and unrealized gains (losses) consists of: |
| | | | |
Gross unrealized gains | | $ | 173,358,116 | |
Gross unrealized losses | | | (33,097,634 | ) |
| | | | |
Net unrealized gains | | $ | 140,260,482 | |
The accompanying notes are an integral part of these financial statements.
| | | | |
| 14 | | Wells Fargo Intrinsic Value Fund | | Statement of assets and liabilities—July 31, 2016 |
| | | | |
| | | | |
| |
Assets | | | | |
Investments | | | | |
In unaffiliated securities (including $13,323,882 of securities loaned), at value (cost $856,314,033) | | $ | 997,149,924 | |
In affiliated securities, at value (cost $53,351,411) | | | 53,351,411 | |
| | | | |
Total investments, at value (cost $909,665,444) | | | 1,050,501,335 | |
Receivable for Fund shares sold | | | 340,797 | |
Receivable for dividends | | | 844,659 | |
Receivable for securities lending income | | | 3,922 | |
Prepaid expenses and other assets | | | 76,576 | |
| | | | |
Total assets | | | 1,051,767,289 | |
| | | | |
| |
Liabilities | | | | |
Payable for Fund shares redeemed | | | 1,133,917 | |
Payable upon receipt of securities loaned | | | 13,536,600 | |
Management fee payable | | | 468,247 | |
Distribution fees payable | | | 18,597 | |
Administration fees payable | | | 137,033 | |
Accrued expenses and other liabilities | | | 401,940 | |
| | | | |
Total liabilities | | | 15,696,334 | |
| | | | |
Total net assets | | $ | 1,036,070,955 | |
| | | | |
| |
NET ASSETS CONSIST OF | | | | |
Paid-in capital | | $ | 854,488,601 | |
Undistributed net investment income | | | 7,090,465 | |
Accumulated net realized gains on investments | | | 33,655,998 | |
Net unrealized gains on investments | | | 140,835,891 | |
| | | | |
Total net assets | | $ | 1,036,070,955 | |
| | | | |
| |
COMPUTATION OF NET ASSET VALUE AND OFFERING PRICE PER SHARE | | | | |
Net assets – Class A | | $ | 318,542,811 | |
Shares outstanding – Class A1 | | | 26,524,905 | |
Net asset value per share – Class A | | | $12.01 | |
Maximum offering price per share – Class A2 | | | $12.74 | |
Net assets – Class B | | $ | 543,933 | |
Shares outstanding – Class B1 | | | 45,932 | |
Net asset value per share – Class B | | | $11.84 | |
Net assets – Class C | | $ | 28,756,213 | |
Shares outstanding – Class C1 | | | 2,449,598 | |
Net asset value per share – Class C | | | $11.74 | |
Net assets – Class R | | $ | 42,691 | |
Shares outstanding – Class R1 | | | 3,530 | |
Net asset value per share – Class R | | | $12.09 | |
Net assets – Class R4 | | $ | 14,926 | |
Share outstanding – Class R41 | | | 1,238 | |
Net asset value per share – Class R4 | | | $12.06 | |
Net assets – Class R6 | | $ | 2,842,447 | |
Shares outstanding – Class R61 | | | 238,831 | |
Net asset value per share – Class R6 | | | $11.90 | |
Net assets – Administrator Class | | $ | 470,152,490 | |
Shares outstanding – Administrator Class1 | | | 37,576,004 | |
Net asset value per share – Administrator Class | | | $12.51 | |
Net assets – Institutional Class | | $ | 215,175,444 | |
Shares outstanding – Institutional Class1 | | | 17,816,684 | |
Net asset value per share – Institutional Class | | | $12.08 | |
| 1 | The Fund has an unlimited number of authorized shares. |
| 2 | Maximum offering price is computed as 100/94.25 of net asset value. On investments of $50,000 or more, the offering price is reduced. |
The accompanying notes are an integral part of these financial statements.
| | | | | | |
| Statement of operations—year ended July 31, 2016 | | Wells Fargo Intrinsic Value Fund | | | 15 | |
| | | | |
| | | | |
| |
Investment income | | | | |
Dividends (net of foreign withholding taxes of $299,171) | | $ | 23,330,582 | |
Securities lending income, net | | | 229,519 | |
Income from affiliated securities | | | 89,346 | |
| | | | |
Total investment income | | | 23,649,447 | |
| | | | |
| |
Expenses | | | | |
Management fee | | | 7,288,415 | |
Administration fees | | | | |
Class A | | | 688,487 | |
Class B | | | 2,326 | |
Class C | | | 65,458 | |
Class R | | | 76 | |
Class R4 | | | 11 | |
Class R6 | | | 611 | |
Administrator Class | | | 617,608 | |
Institutional Class | | | 294,687 | |
Shareholder servicing fees | | | | |
Class A | | | 785,711 | |
Class B | | | 2,769 | |
Class C | | | 77,926 | |
Class R | | | 91 | |
Class R4 | | | 15 | |
Administrator Class | | | 1,187,502 | |
Distribution fees | | | | |
Class B | | | 8,307 | |
Class C | | | 233,777 | |
Class R | | | 91 | |
Custody and accounting fees | | | 62,663 | |
Professional fees | | | 40,338 | |
Registration fees | | | 105,093 | |
Shareholder report expenses | | | 99,334 | |
Trustees’ fees and expenses | | | 22,545 | |
Other fees and expenses | | | 17,653 | |
| | | | |
Total expenses | | | 11,601,494 | |
Less: Fee waivers and/or expense reimbursements | | | (1,280,150 | ) |
| | | | |
Net expenses | | | 10,321,344 | |
| | | | |
Net investment income | | | 13,328,103 | |
| | | | |
| |
REALIZED AND UNREALIZED GAINS (LOSSES) ON INVESTMENTS | | | | |
Net realized gains on investments | | | 65,259,600 | |
Net change in unrealized gains (losses) on investments | | | (102,914,738 | ) |
| | | | |
Net realized and unrealized gains (losses) on investments | | | (37,655,138 | ) |
| | | | |
Net decrease in net assets resulting from operations | | $ | (24,327,035 | ) |
| | | | |
The accompanying notes are an integral part of these financial statements.
| | | | |
| 16 | | Wells Fargo Intrinsic Value Fund | | Statement of changes in net assets |
| | | | | | | | | | | | | | | | |
| | | Year ended
July 31, 2016 | | | Year ended
July 31, 2015 | |
| | | | |
Operations | | | | | | | | | | | | | | | | |
Net investment income | | | | | | $ | 13,328,103 | | | | | | | $ | 11,044,365 | |
Net realized gains on investments | | | | | | | 65,259,600 | | | | | | | | 129,111,859 | |
Net change in unrealized gains (losses) on investments | | | | | | | (102,914,738 | ) | | | | | | | (31,816,136 | ) |
| | | | |
Net increase (decrease) in net assets resulting from operations | | | | | | | (24,327,035 | ) | | | | | | | 108,340,088 | |
| | | | |
| | | | |
Distributions to shareholders from | | | | | | | | | | | | | | | | |
Net investment income | | | | | | | | | | | | | | | | |
Class A | | | | | | | (3,169,347 | ) | | | | | | | (2,172,530 | ) |
Class C | | | | | | | (37,447 | ) | | | | | | | 0 | |
Class R | | | | | | | (201 | ) | | | | | | | (81 | ) |
Class R4 | | | | | | | (186 | ) | | | | | | | (130 | ) |
Class R6 | | | | | | | (38,287 | ) | | | | | | | (2,896 | ) |
Administrator Class | | | | | | | (5,583,834 | ) | | | | | | | (4,135,495 | ) |
Institutional Class | | | | | | | (3,324,787 | ) | | | | | | | (2,556,860 | ) |
Net realized gains | | | | | | | | | | | | | | | | |
Class A | | | | | | | (34,464,666 | ) | | | | | | | (27,285,622 | ) |
Class B | | | | | | | (132,772 | ) | | | | | | | (212,769 | ) |
Class C | | | | | | | (3,405,696 | ) | | | | | | | (2,625,365 | ) |
Class R | | | | | | | (3,205 | ) | | | | | | | (2,211 | ) |
Class R4 | | | | | | | (1,451 | ) | | | | | | | (1,003 | ) |
Class R6 | | | | | | | (277,898 | ) | | | | | | | (11,038 | ) |
Administrator Class | | | | | | | (47,759,263 | ) | | | | | | | (36,136,386 | ) |
Institutional Class | | | | | | | (24,324,139 | ) | | | | | | | (17,741,411 | ) |
| | | | |
Total distributions to shareholders | | | | | | | (122,523,179 | ) | | | | | | | (92,883,797 | ) |
| | | | |
| | | | |
Capital share transactions | | | Shares | | | | | | | | Shares | | | | | |
Proceeds from shares sold | | | | | | | | | | | | | | | | |
Class A | | | 642,824 | | | | 7,569,378 | | | | 624,836 | | | | 8,481,516 | |
Class B | | | 538 | | | | 6,161 | | | | 2,136 | | | | 28,654 | |
Class C | | | 196,351 | | | | 2,323,822 | | | | 209,050 | | | | 2,773,670 | |
Class R | | | 1,207 | | | | 14,440 | | | | 1,217 | | | | 16,683 | |
Class R6 | | | 217,137 | | | | 2,885,275 | | | | 339 | | | | 4,595 | |
Administrator Class | | | 505,633 | | | | 6,457,967 | | | | 690,160 | | | | 9,705,283 | |
Institutional Class | | | 2,739,487 | | | | 33,654,265 | | | | 2,658,478 | | | | 36,641,333 | |
| | | | |
| | | | | | | 52,911,308 | | | | | | | | 57,651,734 | |
| | | | |
Reinvestment of distributions | | | | | | | | | | | | | | | | |
Class A | | | 3,054,047 | | | | 35,698,868 | | | | 2,128,410 | | | | 27,919,064 | |
Class B | | | 11,006 | | | | 126,021 | | | | 15,779 | | | | 204,498 | |
Class C | | | 256,273 | | | | 2,914,692 | | | | 174,638 | | | | 2,247,594 | |
Class R | | | 290 | | | | 3,406 | | | | 174 | | | | 2,292 | |
Class R4 | | | 139 | | | | 1,637 | | | | 87 | | | | 1,132 | |
Class R6 | | | 27,254 | | | | 316,185 | | | | 1,068 | | | | 13,934 | |
Administrator Class | | | 4,139,213 | | | | 50,467,672 | | | | 2,786,857 | | | | 37,930,250 | |
Institutional Class | | | 2,026,547 | | | | 23,875,792 | | | | 1,210,532 | | | | 15,960,088 | |
| | | | |
| | | | | | | 113,404,273 | | | | | | | | 84,278,852 | |
| | | | | | | | | | | | | | | | |
Payment for shares redeemed | | | | | | | | | | | | | | | | |
Class A | | | (4,303,060 | ) | | | (51,494,497 | ) | | | (4,381,343 | ) | | | (59,669,917 | ) |
Class B | | | (109,356 | ) | | | (1,315,058 | ) | | | (163,321 | ) | | | (2,207,079 | ) |
Class C | | | (687,305 | ) | | | (8,016,477 | ) | | | (442,242 | ) | | | (5,907,017 | ) |
Class R | | | (938 | ) | | | (12,248 | ) | | | (470 | ) | | | (6,451 | ) |
Class R4 | | | 0 | | | | 0 | | | | (111 | ) | | | (1,553 | ) |
Class R6 | | | (17,996 | ) | | | (211,641 | ) | | | 0 | | | | 0 | |
Administrator Class | | | (4,210,029 | ) | | | (52,406,894 | ) | | | (4,305,966 | ) | | | (60,992,273 | ) |
Institutional Class | | | (5,462,371 | ) | | | (65,509,014 | ) | | | (3,233,572 | ) | | | (43,813,596 | ) |
| | | | |
| | | | | | | (178,965,829 | ) | | | | | | | (172,597,886 | ) |
| | | | |
Net decrease in net assets resulting from capital share transactions | | | | | | | (12,650,248 | ) | | | | | | | (30,667,300 | ) |
| | | | |
Total decrease in net assets | | | | | | | (159,500,462 | ) | | | | | | | (15,211,009 | ) |
| | | | |
| | |
Net assets | | | | | | | | |
Beginning of period | | | | | | | 1,195,571,417 | | | | | | | | 1,210,782,426 | |
| | | | |
End of period | | | | | | $ | 1,036,070,955 | | | | | | | $ | 1,195,571,417 | |
| | | | |
Undistributed net investment income | | | | | | $ | 7,090,465 | | | | | | | $ | 6,065,222 | |
| | | | |
The accompanying notes are an integral part of these financial statements.
| | | | | | |
| Financial highlights | | Wells Fargo Intrinsic Value Fund | | | 17 | |
(For a share outstanding throughout each period)
| | | | | | | | | | | | | | | | | | | | |
| | | Year ended July 31 | |
| CLASS A | | 2016 | | | 2015 | | | 2014 | | | 2013 | | | 2012 | |
Net asset value, beginning of period | | | $13.73 | | | | $13.60 | | | | $12.52 | | | | $10.44 | | | | $11.50 | |
Net investment income | | | 0.13 | | | | 0.10 | | | | 0.07 | | | | 0.07 | 1 | | | 0.11 | 1 |
Net realized and unrealized gains (losses) on investments | | | (0.42 | ) | | | 1.09 | | | | 1.53 | | | | 2.75 | | | | 0.24 | |
| | | | | | | | | | | | | | | | | | | | |
Total from investment operations | | | (0.29 | ) | | | 1.19 | | | | 1.60 | | | | 2.82 | | | | 0.35 | |
Distributions to shareholders from | | | | | | | | | | | | | | | | | | | | |
Net investment income | | | (0.11 | ) | | | (0.07 | ) | | | (0.06 | ) | | | (0.10 | ) | | | (0.28 | ) |
Net realized gains | | | (1.32 | ) | | | (0.99 | ) | | | (0.46 | ) | | | (0.64 | ) | | | (1.13 | ) |
| | | | | | | | | | | | | | | | | | | | |
Total distributions to shareholders | | | (1.43 | ) | | | (1.06 | ) | | | (1.52 | ) | | | (0.74 | ) | | | (1.41 | ) |
Net asset value, end of period | | | $12.01 | | | | $13.73 | | | | $13.60 | | | | $12.52 | | | | $10.44 | |
Total return2 | | | (1.73 | )% | | | 9.19 | % | | | 13.09 | % | | | 28.53 | % | | | 4.38 | % |
Ratios to average net assets (annualized) | | | | | | | | | | | | | | | | | | | | |
Gross expenses | | | 1.17 | % | | | 1.20 | % | | | 1.21 | % | | | 1.20 | % | | | 1.24 | % |
Net expenses | | | 1.10 | % | | | 1.16 | % | | | 1.16 | % | | | 1.16 | % | | | 1.17 | % |
Net investment income | | | 1.12 | % | | | 0.75 | % | | | 0.53 | % | | | 0.57 | % | | | 1.05 | % |
Supplemental data | | | | | | | | | | | | | | | | | | | | |
Portfolio turnover rate | | | 34 | % | | | 29 | % | | | 23 | % | | | 28 | % | | | 34 | % |
Net assets, end of period (000s omitted) | | | $318,543 | | | | $372,443 | | | | $391,028 | | | | $386,655 | | | | $87,784 | |
| 1 | Calculated based upon average shares outstanding |
| 2 | Total return calculations do not include any sales charges. |
The accompanying notes are an integral part of these financial statements.
| | | | |
| 18 | | Wells Fargo Intrinsic Value Fund | | Financial highlights |
(For a share outstanding throughout each period)
| | | | | | | | | | | | | | | | | | | | |
| | | Year ended July 31 | |
| CLASS B | | 2016 | | | 2015 | | | 2014 | | | 2013 | | | 2012 | |
Net asset value, beginning of period | | | $13.54 | | | | $13.45 | | | | $12.42 | | | | $10.34 | | | | $11.37 | |
Net investment income (loss) | | | 0.05 | 1 | | | 0.00 | 1,2 | | | (0.03 | )1 | | | (0.02 | ) | | | 0.03 | 1 |
Net realized and unrealized gains (losses) on investments | | | (0.43 | ) | | | 1.08 | | | | 1.52 | | | | 2.74 | | | | 0.24 | |
| | | | | | | | | | | | | | | | | | | | |
Total from investment operations | | | (0.38 | ) | | | 1.08 | | | | 1.49 | | | | 2.72 | | | | 0.27 | |
Distributions to shareholders from | | | | | | | | | | | | | | | | | | | | |
Net investment income | | | 0.00 | | | | 0.00 | | | | 0.00 | | | | 0.00 | | | | (0.17 | ) |
Net realized gains | | | (1.32 | ) | | | (0.99 | ) | | | (0.46 | ) | | | (0.64 | ) | | | (1.13 | ) |
| | | | | | | | | | | | | | | | | | | | |
Total distributions to shareholders | | | (1.32 | ) | | | (0.99 | ) | | | (0.46 | ) | | | (0.64 | ) | | | (1.30 | ) |
Net asset value, end of period | | | $11.84 | | | | $13.54 | | | | $13.45 | | | | $12.42 | | | | $10.34 | |
Total return3 | | | (2.47 | )% | | | 8.36 | % | | | 12.25 | % | | | 27.57 | % | | | 3.56 | % |
Ratios to average net assets (annualized) | | | | | | | | | | | | | | | | | | | | |
Gross expenses | | | 1.92 | % | | | 1.96 | % | | | 1.97 | % | | | 1.97 | % | | | 2.01 | % |
Net expenses | | | 1.86 | % | | | 1.91 | % | | | 1.91 | % | | | 1.91 | % | | | 1.92 | % |
Net investment income (loss) | | | 0.38 | % | | | 0.00 | % | | | (0.20 | )% | | | (0.03 | )% | | | 0.27 | % |
Supplemental data | | | | | | | | | | | | | | | | | | | | |
Portfolio turnover rate | | | 34 | % | | | 29 | % | | | 23 | % | | | 28 | % | | | 34 | % |
Net assets, end of period (000s omitted) | | | $544 | | | | $1,947 | | | | $3,889 | | | | $5,589 | | | | $4,323 | |
| 1 | Calculated based upon average shares outstanding |
| 2 | Amount is less than $0.005. |
| 3 | Total return calculations do not include any sales charges. |
The accompanying notes are an integral part of these financial statements.
| | | | | | |
| Financial highlights | | Wells Fargo Intrinsic Value Fund | | | 19 | |
(For a share outstanding throughout each period)
| | | | | | | | | | | | | | | | | | | | |
| | | Year ended July 31 | |
| CLASS C | | 2016 | | | 2015 | | | 2014 | | | 2013 | | | 2012 | |
Net asset value, beginning of period | | | $13.45 | | | | $13.36 | | | | $12.35 | | | | $10.30 | | | | $11.35 | |
Net investment income (loss) | | | 0.03 | | | | 0.00 | 1 | | | (0.03 | ) | | | (0.01 | )2 | | | 0.03 | 2 |
Net realized and unrealized gains (losses) on investments | | | (0.41 | ) | | | 1.08 | | | | 1.50 | | | | 2.72 | | | | 0.24 | |
| | | | | | | | | | | | | | | | | | | | |
Total from investment operations | | | (0.38 | ) | | | 1.08 | | | | 1.47 | | | | 2.71 | | | | 0.27 | |
Distributions to shareholders from | | | | | | | | | | | | | | | | | | | | |
Net investment income | | | (0.01 | ) | | | 0.00 | | | | 0.00 | | | | (0.02 | ) | | | (0.19 | ) |
Net realized gains | | | (1.32 | ) | | | (0.99 | ) | | | (0.46 | ) | | | (0.64 | ) | | | (1.13 | ) |
| | | | | | | | | | | | | | | | | | | | |
Total distributions to shareholders | | | (1.33 | ) | | | (0.99 | ) | | | (0.46 | ) | | | (0.66 | ) | | | (1.32 | ) |
Net asset value, end of period | | | $11.74 | | | | $13.45 | | | | $13.36 | | | | $12.35 | | | | $10.30 | |
Total return3 | | | (2.47 | )% | | | 8.42 | % | | | 12.24 | % | | | 27.50 | % | | | 3.62 | % |
Ratios to average net assets (annualized) | | | | | | | | | | | | | | | | | | | | |
Gross expenses | | | 1.93 | % | | | 1.96 | % | | | 1.97 | % | | | 1.97 | % | | | 2.01 | % |
Net expenses | | | 1.86 | % | | | 1.91 | % | | | 1.91 | % | | | 1.91 | % | | | 1.92 | % |
Net investment income (loss) | | | 0.37 | % | | | 0.00 | % | | | (0.22 | )% | | | (0.05 | )% | | | 0.26 | % |
Supplemental data | | | | | | | | | | | | | | | | | | | | |
Portfolio turnover rate | | | 34 | % | | | 29 | % | | | 23 | % | | | 28 | % | | | 34 | % |
Net assets, end of period (000s omitted) | | | $28,756 | | | | $36,098 | | | | $36,654 | | | | $35,616 | | | | $20,187 | |
| 1 | Amount is less than $0.005. |
| 2 | Calculated based upon average shares outstanding |
| 3 | Total return calculations do not include any sales charges. |
The accompanying notes are an integral part of these financial statements.
| | | | |
| 20 | | Wells Fargo Intrinsic Value Fund | | Financial highlights |
(For a share outstanding throughout each period)
| | | | | | | | | | | | | | | | |
| | | Year ended July 31 | |
| CLASS R | | 2016 | | | 2015 | | | 2014 | | | 20131 | |
Net asset value, beginning of period | | | $13.81 | | | | $13.66 | | | | $12.55 | | | | $11.20 | |
Net investment income | | | 0.10 | | | | 0.05 | | | | 0.03 | | | | 0.00 | 2 |
Net realized and unrealized gains (losses) on investments | | | (0.43 | ) | | | 1.12 | | | | 1.54 | | | | 1.35 | |
| | | | | | | | | | | | | | | | |
Total from investment operations | | | (0.33 | ) | | | 1.17 | | | | 1.57 | | | | 1.35 | |
Distributions to shareholders from | | | | | | | | | | | | | | | | |
Net investment income | | | (0.07 | ) | | | (0.03 | ) | | | 0.00 | | | | 0.00 | |
Net realized gains | | | (1.32 | ) | | | (0.99 | ) | | | (0.46 | ) | | | 0.00 | |
| | | | | | | | | | | | | | | | |
Total distributions to shareholders | | | (1.39 | ) | | | (1.02 | ) | | | (0.46 | ) | | | 0.00 | |
Net asset value, end of period | | | $12.09 | | | | $13.81 | | | | $13.66 | | | | $12.55 | |
Total return3 | | | (1.99 | )% | | | 8.96 | % | | | 12.77 | % | | | 12.05 | % |
Ratios to average net assets (annualized) | | | | | | | | | | | | | | | | |
Gross expenses | | | 1.44 | % | | | 1.47 | % | | | 1.49 | % | | | 1.46 | % |
Net expenses | | | 1.36 | % | | | 1.40 | % | | | 1.41 | % | | | 1.41 | % |
Net investment income | | | 0.86 | % | | | 0.50 | % | | | 0.26 | % | | | 0.01 | % |
Supplemental data | | | | | | | | | | | | | | | | |
Portfolio turnover rate | | | 34 | % | | | 29 | % | | | 23 | % | | | 28 | % |
Net assets, end of period (000s omitted) | | | $43 | | | | $41 | | | | $28 | | | | $18 | |
| 1 | For the period from March 1, 2013 (commencement of class operations) to July 31, 2013 |
| 2 | Amount is less than $0.005. |
| 3 | Returns for periods of less than one year are not annualized. |
The accompanying notes are an integral part of these financial statements.
| | | | | | |
| Financial highlights | | Wells Fargo Intrinsic Value Fund | | | 21 | |
(For a share outstanding throughout each period)
| | | | | | | | | | | | | | | | |
| | | Year ended July 31 | |
| CLASS R4 | | 2016 | | | 2015 | | | 2014 | | | 20131 | |
Net asset value, beginning of period | | | $13.78 | | | | $13.65 | | | | $12.55 | | | | $11.10 | |
Net investment income | | | 0.17 | | | | 0.15 | | | | 0.12 | | | | 0.09 | |
Net realized and unrealized gains (losses) on investments | | | (0.42 | ) | | | 1.09 | | | | 1.54 | | | | 2.15 | |
| | | | | | | | | | | | | | | | |
Total from investment operations | | | (0.25 | ) | | | 1.24 | | | | 1.66 | | | | 2.24 | |
Distributions to shareholders from | | | | | | | | | | | | | | | | |
Net investment income | | | (0.15 | ) | | | (0.12 | ) | | | (0.10 | ) | | | (0.15 | ) |
Net realized gains | | | (1.32 | ) | | | (0.99 | ) | | | (0.46 | ) | | | (0.64 | ) |
| | | | | | | | | | | | | | | | |
Total distributions to shareholders | | | (1.47 | ) | | | (1.11 | ) | | | (0.56 | ) | | | (0.79 | ) |
Net asset value, end of period | | | $12.06 | | | | $13.78 | | | | $13.65 | | | | $12.55 | |
Total return2 | | | (1.39 | )% | | | 9.53 | % | | | 13.55 | % | | | 21.73 | % |
Ratios to average net assets (annualized) | | | | | | | | | | | | | | | | |
Gross expenses | | | 0.88 | % | | | 0.86 | % | | | 0.87 | % | | | 0.88 | % |
Net expenses | | | 0.80 | % | | | 0.80 | % | | | 0.80 | % | | | 0.80 | % |
Net investment income | | | 1.41 | % | | | 1.11 | % | | | 0.88 | % | | | 0.99 | % |
Supplemental data | | | | | | | | | | | | | | | | |
Portfolio turnover rate | | | 34 | % | | | 29 | % | | | 23 | % | | | 28 | % |
Net assets, end of period (000s omitted) | | | $15 | | | | $15 | | | | $15 | | | | $14 | |
| 1 | For the period from November 30, 2012 (commencement of class operations) to July 31, 2013 |
| 2 | Returns for periods of less than one year are not annualized. |
The accompanying notes are an integral part of these financial statements.
| | | | |
| 22 | | Wells Fargo Intrinsic Value Fund | | Financial highlights |
(For a share outstanding throughout each period)
| | | | | | | | | | | | | | | | |
| | | Year ended July 31 | |
| CLASS R6 | | 2016 | | | 2015 | | | 2014 | | | 20131 | |
Net asset value, beginning of period | | | $13.62 | | | | $13.60 | | | | $12.56 | | | | $11.10 | |
Net investment income | | | 0.17 | | | | 0.17 | 2 | | | 0.14 | 2 | | | 0.19 | |
Net realized and unrealized gains (losses) on investments | | | (0.40 | ) | | | 1.08 | | | | 1.47 | | | | 2.06 | |
| | | | | | | | | | | | | | | | |
Total from investment operations | | | (0.23 | ) | | | 1.25 | | | | 1.61 | | | | 2.25 | |
Distributions to shareholders from | | | | | | | | | | | | | | | | |
Net investment income | | | (0.17 | ) | | | (0.24 | ) | | | (0.11 | ) | | | (0.15 | ) |
Net realized gains | | | (1.32 | ) | | | (0.99 | ) | | | (0.46 | ) | | | (0.64 | ) |
| | | | | | | | | | | | | | | | |
Total distributions to shareholders | | | (1.49 | ) | | | (1.23 | ) | | | (0.57 | ) | | | (0.79 | ) |
Net asset value, end of period | | | $11.90 | | | | $13.62 | | | | $13.60 | | | | $12.56 | |
Total return3 | | | (1.30 | )% | | | 9.74 | % | | | 13.19 | % | | | 21.84 | % |
Ratios to average net assets (annualized) | | | | | | | | | | | | | | | | |
Gross expenses | | | 0.75 | % | | | 0.74 | % | | | 0.74 | % | | | 0.73 | % |
Net expenses | | | 0.65 | % | | | 0.65 | % | | | 0.65 | % | | | 0.65 | % |
Net investment income | | | 1.47 | % | | | 1.25 | % | | | 1.10 | % | | | 0.85 | % |
Supplemental data | | | | | | | | | | | | | | | | |
Portfolio turnover rate | | | 34 | % | | | 29 | % | | | 23 | % | | | 28 | % |
Net assets, end of period (000s omitted) | | | $2,842 | | | | $169 | | | | $150 | | | | $3,359 | |
| 1 | For the period from November 30, 2012 (commencement of class operations) to July 31, 2013 |
| 2 | Calculated based upon average shares outstanding |
| 3 | Returns for periods of less than one year are not annualized. |
The accompanying notes are an integral part of these financial statements.
| | | | | | |
| Financial highlights | | Wells Fargo Intrinsic Value Fund | | | 23 | |
(For a share outstanding throughout each period)
| | | | | | | | | | | | | | | | | | | | |
| | | Year ended July 31 | |
| ADMINISTRATOR CLASS | | 2016 | | | 2015 | | | 2014 | | | 2013 | | | 2012 | |
Net asset value, beginning of period | | | $14.25 | | | | $14.08 | | | | $12.95 | | | | $10.78 | | | | $11.55 | |
Net investment income | | | 0.15 | | | | 0.13 | | | | 0.10 | | | | 0.08 | 1 | | | 0.12 | 1 |
Net realized and unrealized gains (losses) on investments | | | (0.43 | ) | | | 1.14 | | | | 1.58 | | | | 2.87 | | | | 0.28 | |
| | | | | | | | | | | | | | | | | | | | |
Total from investment operations | | | (0.28 | ) | | | 1.27 | | | | 1.68 | | | | 2.95 | | | | 0.40 | |
Distributions to shareholders from | | | | | | | | | | | | | | | | | | | | |
Net investment income | | | (0.14 | ) | | | (0.11 | ) | | | (0.09 | ) | | | (0.14 | ) | | | (0.04 | ) |
Net realized gains | | | (1.32 | ) | | | (0.99 | ) | | | (0.46 | ) | | | (0.64 | ) | | | (1.13 | ) |
| | | | | | | | | | | | | | | | | | | | |
Total distributions to shareholders | | | (1.46 | ) | | | (1.10 | ) | | | (0.55 | ) | | | (0.78 | ) | | | (1.17 | ) |
Net asset value, end of period | | | $12.51 | | | | $14.25 | | | | $14.08 | | | | $12.95 | | | | $10.78 | |
Total return | | | (1.58 | )% | | | 9.42 | % | | | 13.36 | % | | | 28.77 | % | | | 4.57 | % |
Ratios to average net assets (annualized) | | | | | | | | | | | | | | | | | | | | |
Gross expenses | | | 1.10 | % | | | 1.06 | % | | | 1.06 | % | | | 1.05 | % | | | 1.09 | % |
Net expenses | | | 0.95 | % | | | 0.95 | % | | | 0.95 | % | | | 0.95 | % | | | 0.95 | % |
Net investment income | | | 1.27 | % | | | 0.95 | % | | | 0.74 | % | | | 0.68 | % | | | 1.13 | % |
Supplemental data | | | | | | | | | | | | | | | | | | | | |
Portfolio turnover rate | | | 34 | % | | | 29 | % | | | 23 | % | | | 28 | % | | | 34 | % |
Net assets, end of period (000s omitted) | | | $470,152 | | | | $529,293 | | | | $534,641 | | | | $515,012 | | | | $26,687 | |
| 1 | Calculated based upon average shares outstanding |
The accompanying notes are an integral part of these financial statements.
| | | | |
| 24 | | Wells Fargo Intrinsic Value Fund | | Financial highlights |
(For a share outstanding throughout each period)
| | | | | | | | | | | | | | | | | | | | |
| | | Year ended July 31 | |
| INSTITUTIONAL CLASS | | 2016 | | | 2015 | | | 2014 | | | 2013 | | | 2012 | |
Net asset value, beginning of period | | | $13.80 | | | | $13.67 | | | | $12.58 | | | | $10.48 | | | | $11.56 | |
Net investment income | | | 0.18 | | | | 0.15 | | | | 0.13 | | | | 0.16 | | | | 0.14 | 1 |
Net realized and unrealized gains (losses) on investments | | | (0.41 | ) | | | 1.11 | | | | 1.53 | | | | 2.73 | | | | 0.24 | |
| | | | | | | | | | | | | | | | | | | | |
Total from investment operations | | | (0.23 | ) | | | 1.26 | | | | 1.66 | | | | 2.89 | | | | 0.38 | |
Distributions to shareholders from | | | | | | | | | | | | | | | | | | | | |
Net investment income | | | (0.17 | ) | | | (0.14 | ) | | | (1.11 | ) | | | (0.15 | ) | | | (0.33 | ) |
Net realized gains | | | (1.32 | ) | | | (0.99 | ) | | | (0.46 | ) | | | (0.64 | ) | | | (1.13 | ) |
| | | | | | | | | | | | | | | | | | | | |
Total distributions to shareholders | | | (1.49 | ) | | | (1.13 | ) | | | (0.57 | ) | | | (0.79 | ) | | | (1.46 | ) |
Net asset value, end of period | | | $12.08 | | | | $13.80 | | | | $13.67 | | | | $12.58 | | | | $10.48 | |
Total return | | | (1.27 | )% | | | 9.66 | % | | | 13.64 | % | | | 29.04 | % | | | 4.71 | % |
Ratios to average net assets (annualized) | | | | | | | | | | | | | | | | | | | | |
Gross expenses | | | 0.85 | % | | | 0.79 | % | | | 0.79 | % | | | 0.79 | % | | | 0.83 | % |
Net expenses | | | 0.70 | % | | | 0.70 | % | | | 0.70 | % | | | 0.73 | % | | | 0.82 | % |
Net investment income | | | 1.52 | % | | | 1.20 | % | | | 0.99 | % | | | 1.21 | % | | | 1.35 | % |
Supplemental data | | | | | | | | | | | | | | | | | | | | |
Portfolio turnover rate | | | 34 | % | | | 29 | % | | | 23 | % | | | 28 | % | | | 34 | % |
Net assets, end of period (000s omitted) | | | $215,175 | | | | $255,565 | | | | $244,378 | | | | $221,128 | | | | $222,949 | |
| 1 | Calculated based upon average shares outstanding |
The accompanying notes are an integral part of these financial statements.
| | | | | | |
| Notes to financial statements | | Wells Fargo Intrinsic Value Fund | | | 25 | |
1. ORGANIZATION
Wells Fargo Funds Trust (the “Trust”), a Delaware statutory trust organized on March 10, 1999, is an open-end management investment company registered under the Investment Company Act of 1940, as amended (the “1940 Act”). As an investment company, the Trust follows the accounting and reporting guidance in Financial Accounting Standards Board (“FASB”) Accounting Standards Codification Topic 946, Financial Services – Investment Companies. These financial statements report on the Wells Fargo Intrinsic Value Fund (the “Fund”) which is a diversified series of the Trust.
2. SIGNIFICANT ACCOUNTING POLICIES
The following significant accounting policies, which are consistently followed in the preparation of the financial statements of the Fund, are in conformity with U.S. generally accepted accounting principles which require management to make estimates and assumptions that affect the reported amounts of assets and liabilities, disclosure of contingent assets and liabilities at the date of the financial statements, and the reported amounts of revenues and expenses during the reporting period. Actual results could differ from those estimates.
Securities valuation
All investments are valued each business day as of the close of regular trading on the New York Stock Exchange (generally 4 p.m. Eastern Time), although the Fund may deviate from this calculation time under unusual or unexpected circumstances.
Equity securities that are listed on a foreign or domestic exchange or market are valued at the official closing price or, if none, the last sales price. If no sale occurs on the principal exchange or market that day, the prior day’s price will be deemed “stale” and a fair value price will be determined in accordance with the Fund’s Valuation Procedures.
Investments in registered open-end investment companies are valued at net asset value. Interests in non-registered investment vehicles that are redeemable at net asset value are fair valued normally at net asset value.
Investments which are not valued using any of the methods discussed above are valued at their fair value, as determined in good faith by the Board of Trustees of the Fund. The Board of Trustees has established a Valuation Committee comprised of the Trustees and has delegated to it the authority to take any actions regarding the valuation of portfolio securities that the Valuation Committee deems necessary or appropriate, including determining the fair value of portfolio securities, unless the determination has been delegated to the Management Valuation Team of Wells Fargo Funds Management, LLC (“Funds Management”). The Board of Trustees retains the authority to make or ratify any valuation decisions or approve any changes to the Valuation Procedures as it deems appropriate. On a quarterly basis, the Board of Trustees receives reports on any valuation actions taken by the Valuation Committee or the Management Valuation Team which may include items for ratification.
Valuations of fair valued securities are compared to the next actual sales price when available, or other appropriate market values, to assess the continued appropriateness of the fair valuation methodologies used. These securities are fair valued on a day-to-day basis, taking into consideration changes to appropriate market information and any significant changes to the inputs considered in the valuation process until there is a readily available price provided on an exchange or by an independent pricing service. Valuations received from an independent pricing service or independent broker-dealer quotes are periodically validated by comparisons to most recent trades and valuations provided by other independent pricing services in addition to the review of prices by the manager and/or subadviser. Unobservable inputs used in determining fair valuations are identified based on the type of security, taking into consideration factors utilized by market participants in valuing the investment, knowledge about the issuer and the current market environment.
Security loans
The Fund may lend its securities from time to time in order to earn additional income in the form of fees or interest on securities received as collateral or the investment of any cash received as collateral. The Fund continues to receive interest or dividends on the securities loaned. The Fund receives collateral in the form of cash or securities with a value at least equal to the value of the securities on loan. The value of the loaned securities is determined at the close of each business day and any additional required collateral is delivered to the Fund on the next business day. In a securities lending transaction, the net asset value of the Fund will be affected by an increase or decrease in the value of the securities loaned and by an increase or decrease in the value of the instrument in which collateral is invested. The amount of securities lending activity undertaken by the Fund fluctuates from time to time. In the event of default or bankruptcy by the borrower, the Fund may be prevented from recovering the loaned securities or gaining access to the collateral or may experience delays or costs in doing so. In addition, the investment of any cash collateral received may lose all or part of its value. The Fund has the right under the lending agreement to recover the securities from the borrower on demand.
| | | | |
| 26 | | Wells Fargo Intrinsic Value Fund | | Notes to financial statements |
The Fund lends its securities through an unaffiliated securities lending agent. Cash collateral received in connection with its securities lending transactions is invested in Securities Lending Cash Investments, LLC (the “Securities Lending Fund”). The Securities Lending Fund is exempt from registration under Section 3(c)(7) of the 1940 Act and is managed by Funds Management and is subadvised by Wells Capital Management Incorporated (“WellsCap”), an affiliate of Funds Management and an indirect wholly owned subsidiary of Wells Fargo & Company (“Wells Fargo”). Funds Management receives an advisory fee starting at 0.05% and declining to 0.01% as the average daily net assets of the Securities Lending Fund increase. All of the fees received by Funds Management are paid to WellsCap for its services as subadviser. The Securities Lending Fund seeks to provide a positive return compared to the daily Fed Funds Open rate by investing in high-quality, U.S. dollar-denominated short-term money market instruments. Securities Lending Fund investments are fair valued based upon the amortized cost valuation technique. Income earned from investment in the Securities Lending Fund is included in securities lending income on the Statement of Operations.
Security transactions and income recognition
Securities transactions are recorded on a trade date basis. Realized gains or losses are recorded on the basis of identified cost.
Dividend income is recognized on the ex-dividend date. Dividend income is recorded net of foreign taxes withheld where recovery of such taxes is not assured.
Distributions to shareholders
Distributions to shareholders from net investment income and net realized gains, if any, are recorded on the ex-dividend date. Such distributions are determined in conformity with federal income tax regulations, which may differ in amount or character from net investment income and realized gains recognized for purposes of U.S. generally accepted accounting principles.
Federal and other taxes
The Fund intends to continue to qualify as a regulated investment company by distributing substantially all of its investment company taxable income and any net realized capital gains (after reduction for capital loss carryforwards) sufficient to relieve it from all, or substantially all, federal income taxes. Accordingly, no provision for federal income taxes was required.
The Fund’s income and federal excise tax returns and all financial records supporting those returns for the prior three fiscal years are subject to examination by the federal and Delaware revenue authorities. Management has analyzed the Fund’s tax positions taken on federal, state, and foreign tax returns for all open tax years and does not believe that there are any uncertain tax positions that require recognition of a tax liability.
Reclassifications are made to the Fund’s capital accounts for permanent tax differences to reflect income and gains available for distribution (or available capital loss carryforwards) under federal income tax regulations. U.S. generally accepted accounting principles require that certain components of net assets be adjusted to reflect permanent differences between financial and tax reporting. These reclassifications have no effect on net assets or net asset values per share. At July 31, 2016, as a result of permanent book-to-tax differences, the following reclassification adjustments were made on the Statement of Assets and Liabilities:
| | | | |
| Paid-in capital | | Undistributed net
investment income | | Accumulated net
realized gains
on investments |
| $359 | | $(148,771) | | $148,412 |
As of July 31, 2016, the Fund had capital loss carryforwards available to offset future net realized capital gains in the amount of $4,849,228 expiring in 2017.
Class allocations
The separate classes of shares offered by the Fund differ principally in applicable sales charges, distribution, shareholder servicing, and administration fees. Class specific expenses are charged directly to that share class. Investment income, common expenses, and realized and unrealized gains (losses) on investments are allocated daily to each class of shares based on the relative proportion of net assets of each class.
3. FAIR VALUATION MEASUREMENTS
Fair value measurements of investments are determined within a framework that has established a fair value hierarchy based upon the various data inputs utilized in determining the value of the Fund’s investments. The three-level hierarchy gives the highest priority to unadjusted quoted prices in active markets for identical assets or liabilities (Level 1) and the
| | | | | | |
| Notes to financial statements | | Wells Fargo Intrinsic Value Fund | | | 27 | |
lowest priority to significant unobservable inputs (Level 3). The Fund’s investments are classified within the fair value hierarchy based on the lowest level of input that is significant to the fair value measurement. The inputs are summarized into three broad levels as follows:
| n | | Level 1 – quoted prices in active markets for identical securities |
| n | | Level 2 – other significant observable inputs (including quoted prices for similar securities, interest rates, prepayment speeds, credit risk, use of amortized cost, etc.) |
| n | | Level 3 – significant unobservable inputs (including the Fund’s own assumptions in determining the fair value of investments) |
The inputs or methodologies used for valuing investments in securities are not necessarily an indication of the risk associated with investing in those securities.
The following is a summary of the inputs used in valuing the Fund’s assets and liabilities as of July 31, 2016:
| | | | | | | | | | | | | | | | |
| | | Quoted prices
(Level 1) | | | Other significant
observable inputs
(Level 2) | | | Significant
unobservable inputs (Level 3) | | | Total | |
Assets | | | | | | | | | | | | | | | | |
Investments in: | | | | | | | | | | | | | | | | |
| | | | |
Common stocks | | | | | | | | | | | | | | | | |
Consumer discretionary | | $ | 65,187,436 | | | $ | 0 | | | $ | 0 | | | $ | 65,187,436 | |
Consumer staples | | | 107,271,578 | | | | 0 | | | | 0 | | | | 107,271,578 | |
Energy | | | 87,769,421 | | | | 0 | | | | 0 | | | | 87,769,421 | |
Financials | | | 177,149,638 | | | | 0 | | | | 0 | | | | 177,149,638 | |
Health care | | | 119,741,748 | | | | 0 | | | | 0 | | | | 119,741,748 | |
Industrials | | | 146,510,289 | | | | 0 | | | | 0 | | | | 146,510,289 | |
Information technology | | | 203,942,662 | | | | 0 | | | | 0 | | | | 203,942,662 | |
Materials | | | 15,504,815 | | | | 0 | | | | 0 | | | | 15,504,815 | |
Telecommunication services | | | 19,944,165 | | | | 0 | | | | 0 | | | | 19,944,165 | |
Utilities | | | 54,128,172 | | | | 0 | | | | 0 | | | | 54,128,172 | |
| | | | |
Short-term investments | | | | | | | | | | | | | | | | |
Investment companies | | | 39,814,811 | | | | 0 | | | | 0 | | | | 39,814,811 | |
Investments measured at net asset value* | | | | | | | | | | | | | | | 13,536,600 | |
Total assets | | $ | 1,036,964,735 | | | $ | 0 | | | $ | 0 | | | $ | 1,050,501,335 | |
| * | Investments that are measured at fair value using the net asset value per share (or its equivalent) as a practical expedient have not been categorized in the fair value hierarchy. The fair value amount presented in the table is intended to permit reconciliation of the fair value hierarchy to the amounts presented in the Statement of Assets and Liabilities. The Fund’s investment in Securities Lending Cash Investments, LLC valued at $13,536,600 does not have a redemption period notice, can be redeemed daily and does not have any unfunded commitments. |
The Fund recognizes transfers between levels within the fair value hierarchy at the end of the reporting period. At July 31, 2016, the Fund did not have any transfers into/out of Level 1, Level 2, or Level 3.
4. TRANSACTIONS WITH AFFILIATES
Management fee
Funds Management, an indirect wholly owned subsidiary of Wells Fargo, is the manager of the Fund and provides advisory and fund-level administrative services under an investment management agreement. Under the investment management agreement, Funds Management is responsible for, among other services, implementing the investment objectives and strategies of the Fund, supervising the subadviser, providing fund-level administrative services in connection with the Fund’s operations, and providing any other fund-level administrative services reasonably necessary for the operation of the Fund. As compensation for its services under the investment management agreement, Funds Management is entitled to receive an annual management fee starting at 0.70% and declining to 0.505% as the average daily net assets of the Fund increase. For the year ended July 31, 2016, the management fee was equivalent to an annual rate of 0.69% of the Fund’s average daily net assets.
| | | | |
| 28 | | Wells Fargo Intrinsic Value Fund | | Notes to financial statements |
Funds Management has retained the services of a subadviser to provide daily portfolio management to the Fund. The fee for subadvisory services is borne by Funds Management. WellsCap is the subadviser to the Fund and is entitled to receive a fee from Funds Management at an annual rate starting at 0.35% and declining to 0.25% as the average daily net assets of the Fund increase. Prior to July 1, 2016, Metropolitan West Capital Management, LLC (“MetWest”), an affiliate of Funds Management and an indirect wholly owned subsidiary of Wells Fargo, served as the subadviser to the Fund and received a fee for its services at the same rates. MetWest merged with WellsCap on July, 1, 2016 and WellsCap became the subadviser to the Fund.
Administration fees
Under a class-level administration agreement, Funds Management provides class-level administrative services to the Fund, which includes paying fees and expenses for services provided by the transfer agent, sub-transfer agents, omnibus account servicers and record-keepers. As compensation for its services under the class-level administration agreement, Funds Management receives an annual fee which is calculated based on the average daily net assets of each class as follows:
| | | | |
| | | Class-level
administration fee | |
Class A, Class B, Class C, Class R | | | 0.21 | % |
Class R4 | | | 0.08 | |
Class R6 | | | 0.03 | |
Administrator Class, Institutional Class | | | 0.13 | |
Funds Management has contractually waived and/or reimbursed management and administration fees to the extent necessary to maintain certain net operating expense ratios for the Fund. Waiver of fees and/or reimbursement of expenses by Funds Management were made first from fund level expenses on a proportionate basis and then from class specific expenses. Funds Management has committed through November 30, 2016 to waive fees and/or reimburse expenses to the extent necessary to cap the Fund’s expenses at 1.11% for Class A shares, 1.86% for Class B shares, 1.86% for Class C shares, 1.36% for Class R shares, 0.80% for class R4 shares, 0.65% for class R6 shares, 0.95% for Administrator Class shares and 0.70% for Institutional Class shares. After this time, the cap may be increased or the commitment to maintain the cap may be terminated only with the approval of the Board of Trustees.
Distribution fees
The Trust has adopted a distribution plan for Class B, Class C, and Class R shares of the Fund pursuant to Rule 12b-1 under the 1940 Act. Distribution fees are charged to Class B, Class C, and Class R shares and paid to Wells Fargo Funds Distributor, LLC (“Funds Distributor”), the principal underwriter, at an annual rate of 0.75% of the average daily net assets of Class B and Class C shares and 0.25% of the average daily net assets of Class R shares.
In addition, Funds Distributor is entitled to receive the front-end sales charge from the purchase of Class A shares and a contingent deferred sales charge on the redemption of certain Class A shares. Funds Distributor is also entitled to receive the contingent deferred sales charges from redemptions of Class B and Class C shares. For the year ended July 31, 2016, Funds Distributor received $6,474 from the sale of Class A shares and $12 and $742 in contingent deferred sales charges from redemptions of Class A and Class C shares, respectively.
Shareholder servicing fees
The Trust has entered into contracts with one or more shareholder servicing agents, whereby Class A, Class B, Class C, Class R and Administrator Class of the Fund are charged a fee at an annual rate of 0.25% of the average daily net assets of each respective class. Class R4 is charged a fee at an annual rate of 0.10% of its average daily net assets.
A portion of these total shareholder servicing fees were paid to affiliates of Wells Fargo.
5. INVESTMENT PORTFOLIO TRANSACTIONS
Purchases and sales of investments, excluding U.S. government obligations (if any) and short-term securities, for the year ended July 31, 2016 were $350,907,070 and $455,095,742, respectively.
The Fund may purchase or sell investment securities to other Wells Fargo funds under procedures adopted by the Board of Trustees. The procedures have been designed to ensure that these interfund transactions, which generally do not incur broker commissions, are effected at current market prices. Interfund trades are included within the respective purchases and sales amounts shown.
| | | | | | |
| Notes to financial statements | | Wells Fargo Intrinsic Value Fund | | | 29 | |
6. BANK BORROWINGS
The Trust (excluding the money market funds and certain other funds) and Wells Fargo Variable Trust are parties to a $200,000,000 revolving credit agreement whereby the Fund is permitted to use bank borrowings for temporary or emergency purposes, such as to fund shareholder redemption requests. Interest under the credit agreement is charged to the Fund based on a borrowing rate equal to the higher of the Federal Funds rate in effect on that day plus 1.25% or the overnight LIBOR rate in effect on that day plus 1.25%. In addition, an annual commitment fee equal to 0.20% of the unused balance is allocated to each participating fund. Prior to September 1, 2015, the revolving credit agreement amount was $150,000,000 and the annual commitment fee was equal to 0.10% of the unused balance which was allocated to each participating fund.
For the year ended July 31, 2016, there were no borrowings by the Fund under the agreement.
7. DISTRIBUTIONS TO SHAREHOLDERS
The tax character of distributions paid during the years ended July 31, 2016 and July 31, 2015 were as follows:
| | | | | | | | |
| | | Year ended July 31 | |
| | | 2016 | | | 2015 | |
Ordinary income | | $ | 12,154,089 | | | $ | 12,000,998 | |
Long-term capital gain | | | 110,369,090 | | | | 80,882,799 | |
As of July 31, 2016, the components of distributable earnings on a tax basis were as follows:
| | | | | | |
Undistributed
ordinary
income | | Undistributed
long-term gain | | Unrealized
gains | | Capital loss
carryforward |
| $7,212,314 | | $39,080,637 | | $140,260,482 | | $(4,849,228) |
8. INDEMNIFICATION
Under the Trust’s organizational documents, the officers and Trustees have been granted certain indemnification rights against certain liabilities that may arise out of performance of their duties to the Trust. Additionally, in the normal course of business, the Trust may enter into contracts with service providers that contain a variety of indemnification clauses. The Trust’s maximum exposure under these arrangements is dependent on future claims that may be made against the Fund and, therefore, cannot be estimated.
| | | | |
| 30 | | Wells Fargo Intrinsic Value Fund | | Report of independent registered public accounting firm |
BOARD OF TRUSTEES AND SHAREHOLDERS OF WELLS FARGO FUNDS TRUST:
We have audited the accompanying statements of assets and liabilities, including the portfolio of investments, of the Wells Fargo Intrinsic Value Fund (formerly known as Wells Fargo Advantage Intrinsic Value Fund) (the “Fund”), one of the funds constituting the Wells Fargo Funds Trust, as of July 31, 2016, and the related statement of operations for the year then ended, the statements of changes in net assets for each of the years in the two-year period then ended, and the financial highlights for each of the years or periods in the five-year period then ended. These financial statements and financial highlights are the responsibility of the Fund’s management. Our responsibility is to express an opinion on these financial statements and financial highlights based on our audits.
We conducted our audits in accordance with the standards of the Public Company Accounting Oversight Board (United States). Those standards require that we plan and perform the audit to obtain reasonable assurance about whether the financial statements and financial highlights are free of material misstatement. An audit includes examining, on a test basis, evidence supporting the amounts and disclosures in the financial statements. Our procedures included confirmation of securities owned as of July 31, 2016, by correspondence with the custodian, or by other appropriate auditing procedures. An audit also includes assessing the accounting principles used and significant estimates made by management, as well as evaluating the overall financial statement presentation. We believe that our audits provide a reasonable basis for our opinion.
In our opinion, the financial statements and financial highlights referred to above present fairly, in all material respects, the financial position of the Wells Fargo Intrinsic Value Fund as of July 31, 2016, the results of its operations for the year then ended, the changes in its net assets for each of the years in the two-year period then ended, and the financial highlights for each of the years or periods in the five-year period then ended, in conformity with U.S. generally accepted accounting principles.

Boston, Massachusetts
September 23, 2016
| | | | | | |
| Other information (unaudited) | | Wells Fargo Intrinsic Value Fund | | | 31 | |
TAX INFORMATION
For corporate shareholders, pursuant to Section 854 of the Internal Revenue Code, 100% of ordinary income dividends qualify for the corporate dividends-received deduction for the fiscal year ended July 31, 2016.
Pursuant to Section 852 of the Internal Revenue Code, $110,369,090 was designated as a 20% rate gain distribution for the fiscal year ended July 31, 2016.
Pursuant to Section 854 of the Internal Revenue Code, $12,154,089 of income dividends paid during the fiscal year ended July 31, 2016 has been designated as qualified dividend income (QDI).
PROXY VOTING INFORMATION
A description of the policies and procedures that the Fund uses to determine how to vote proxies relating to portfolio securities is available, upon request, by calling 1-800-222-8222, visiting our website at wellsfargofunds.com, or visiting the SEC website at sec.gov. Information regarding how the Fund voted proxies relating to portfolio securities during the most recent 12-month period ended June 30 is available on the Fund’s website at wellsfargofunds.com or by visiting the SEC website at sec.gov.
PORTFOLIO HOLDINGS INFORMATION
The complete portfolio holdings for the Fund are publicly available monthly on the Fund’s website (wellsfargofunds.com), on a one-month delayed basis. In addition, top ten holdings information (excluding derivative positions) for the Fund is publicly available on the Fund’s website on a monthly, seven-day or more delayed basis. The Fund files its complete schedule of portfolio holdings with the SEC for the first and third quarters of each fiscal year on Form N-Q, which is available by visiting the SEC website at sec.gov. In addition, the Fund’s Form N-Q may be reviewed and copied at the SEC’s Public Reference Room in Washington, DC, and at regional offices in New York City, at 233 Broadway, and in Chicago, at 175 West Jackson Boulevard, Suite 900. Information about the Public Reference Room may be obtained by calling 1-800-SEC-0330.
| | | | |
| 32 | | Wells Fargo Intrinsic Value Fund | | Other information (unaudited) |
BOARD OF TRUSTEES AND OFFICERS
Each of the Trustees and Officers1 listed in the table below acts in identical capacities for each fund in the Wells Fargo family of funds, which consists of 139 mutual funds comprising the Wells Fargo Funds Trust, Wells Fargo Variable Trust, Wells Fargo Master Trust and four closed-end funds (collectively the “Fund Complex”). This table should be read in conjunction with the Prospectus and the Statement of Additional Information2. The mailing address of each Trustee and Officer is 525 Market Street, 12th Floor, San Francisco, CA 94105. Each Trustee and Officer serves an indefinite term, however, each Trustee serves such term until reaching the mandatory retirement age established by the Trustees.
Independent Trustees
| | | | | | |
Name and year of birth | | Position held and length of service* | | Principal occupations during past five years or longer | | Current other public
company or
investment company
directorships |
| William R. Ebsworth (Born 1957) | | Trustee, since 2015 | | Retired. From 1984 to 2013, equities analyst, portfolio manager, research director and chief financial officer at Fidelity Management and Research Company in Boston, Tokyo, and Hong Kong and retired in 2013 as Chief Investment Officer of Fidelity Strategic Advisers, Inc. where he lead a team of investment professionals managing client assets. Prior thereto, Board member of Hong Kong Securities Clearing Co., Hong Kong Options Clearing Corp., the Thailand International Fund, Ltd., Fidelity Investments Life Insurance Company, and Empire Fidelity Investments Life Insurance Company. Mr. Ebsworth is a CFA® charterholder and an Adjunct Lecturer, Finance, at Babson College. | | Asset Allocation Trust |
| Jane A. Freeman (Born 1953) | | Trustee, since 2015 | | Retired. From 2012 to 2014 and 1999 to 2008, Chief Financial Officer of Scientific Learning Corporation. From 2008 to 2012, Ms. Freeman provided consulting services related to strategic business projects. Prior to 1999, Portfolio Manager at Rockefeller & Co. and Scudder, Stevens & Clark. Board member of the Harding Loevner Funds from 1996 to 2014, serving as both Lead Independent Director and chair of the Audit Committee. Board member of the Russell Exchange Traded Funds Trust from 2011 to 2012 and the chair of the Audit Committee. Ms. Freeman is Chair of Taproot Foundation (non-profit organization), a Board Member of Ruth Bancroft Garden (non-profit organization) and an inactive chartered financial analyst. | | Asset Allocation Trust |
| Peter G. Gordon (Born 1942) | | Trustee, since 1998; Chairman, since 2005 | | Co-Founder, Retired Chairman, President and CEO of Crystal Geyser Water Company. Trustee Emeritus, Colby College. | | Asset Allocation Trust |
| Isaiah Harris, Jr. (Born 1952) | | Trustee, since 2009 | | Retired. Chairman of the Board of CIGNA Corporation since 2009, and Director since 2005. From 2003 to 2011, Director of Deluxe Corporation. Prior thereto, President and CEO of BellSouth Advertising and Publishing Corp. from 2005 to 2007, President and CEO of BellSouth Enterprises from 2004 to 2005 and President of BellSouth Consumer Services from 2000 to 2003. Emeritus member of the Iowa State University Foundation Board of Governors. Emeritus Member of the Advisory Board of Iowa State University School of Business. Advisory Board Member, Palm Harbor Academy (charter school). Advisory Board Member, Child Evangelism Fellowship (non-profit). Mr. Harris is a certified public accountant (inactive status). | | CIGNA Corporation; Asset Allocation Trust |
| Judith M. Johnson (Born 1949) | | Trustee, since 2008; Audit Committee Chairman, since 2008 | | Retired. Prior thereto, Chief Executive Officer and Chief Investment Officer of Minneapolis Employees Retirement Fund from 1996 to 2008. Ms. Johnson is an attorney, certified public accountant and a certified managerial accountant. | | Asset Allocation Trust |
| David F. Larcker (Born 1950) | | Trustee, since 2009 | | James Irvin Miller Professor of Accounting at the Graduate School of Business, Stanford University, Director of the Corporate Governance Research Initiative and Senior Faculty of The Rock Center for Corporate Governance since 2006. From 2005 to 2008, Professor of Accounting at the Graduate School of Business, Stanford University. Prior thereto, Ernst & Young Professor of Accounting at The Wharton School, University of Pennsylvania from 1985 to 2005. | | Asset Allocation Trust |
| | | | | | |
| Other information (unaudited) | | Wells Fargo Intrinsic Value Fund | | | 33 | |
| | | | | | |
Name and year of birth | | Position held and length of service* | | Principal occupations during past five years or longer | | Current other public
company or
investment company
directorships |
| Olivia S. Mitchell (Born 1953) | | Trustee, since 2006 | | International Foundation of Employee Benefit Plans Professor, Wharton School of the University of Pennsylvania since 1993. Director of Wharton’s Pension Research Council and Boettner Center on Pensions & Retirement Research, and Research Associate at the National Bureau of Economic Research. Previously, Cornell University Professor from 1978 to 1993. | | Asset Allocation Trust |
| Timothy J. Penny (Born 1951) | | Trustee, since 1996 | | President and Chief Executive Officer of Southern Minnesota Initiative Foundation, a non-profit organization, since 2007 and Senior Fellow at the Humphrey Institute Policy Forum at the University of Minnesota since 1995. Member of the Board of Trustees of NorthStar Education Finance, Inc., a non-profit organization, since 2007. | | Asset Allocation Trust |
| Michael S. Scofield (Born 1943) | | Trustee, since 2010 | | Served on the Investment Company Institute’s Board of Governors and Executive Committee from 2008-2011 as well the Governing Council of the Independent Directors Council from 2006-2011 and the Independent Directors Council Executive Committee from 2008-2011. Chairman of the IDC from 2008-2010. Institutional Investor (Fund Directions) Trustee of Year in 2007. Trustee of the Evergreen Funds complex (and its predecessors) from 1984 to 2010. Chairman of the Evergreen Funds from 2000-2010. Former Trustee of the Mentor Funds. Retired Attorney, Law Offices of Michael S. Scofield. | | Asset Allocation Trust |
| * | Length of service dates reflect the Trustee’s commencement of service with the Trust’s predecessor entities, where applicable. |
Officers
| | | | | | |
Name and year of birth | | Position held and
length of service | | Principal occupations during past five years or longer | | |
| Karla M. Rabusch (Born 1959) | | President, since 2003 | | Executive Vice President of Wells Fargo Bank, N.A. and President of Wells Fargo Funds Management, LLC since 2003. | | |
| Jeremy DePalma1 (Born 1974) | | Treasurer, since 2012 | | Senior Vice President of Wells Fargo Funds Management, LLC since 2009. Senior Vice President of Evergreen Investment Management Company, LLC from 2008 to 2010 and head of the Fund Reporting and Control Team within Fund Administration from 2005 to 2010. | | |
| C. David Messman (Born 1960) | | Secretary, since 2000; Chief Legal Officer, since 2003 | | Senior Vice President and Secretary of Wells Fargo Funds Management, LLC since 2001. Assistant General Counsel of Wells Fargo Bank, N.A. since 2013 and Vice President and Managing Counsel of Wells Fargo Bank, N.A. from 1996 to 2013. | | |
| Michael Whitaker (Born 1967) | | Chief Compliance Officer, since 2016* | | Executive Vice President of Wells Fargo Funds Management, LLC since 2016. Chief Compliance Officer of Fidelity’s Fixed Income Funds and Asset Allocation Funds from 2008 to 2016, Compliance Officer of FMR Co., Inc. from 2014 to 2016, Fidelity Investments Money Management, Inc. from 2014 to 2016, Fidelity Investments from 2007 to 2016. | | |
| David Berardi (Born 1975) | | Assistant Treasurer, since 2009 | | Vice President of Wells Fargo Funds Management, LLC since 2009. Vice President of Evergreen Investment Management Company, LLC from 2008 to 2010. Manager of Fund Reporting and Control for Evergreen Investment Management Company, LLC from 2004 to 2010. | | |
| 1 | Jeremy DePalma acts as Treasurer of 68 funds and Assistant Treasurer of 71 funds in the Fund Complex. |
| 2 | The Statement of Additional Information includes additional information about the Trustees and is available, without charge, upon request, by calling 1-800-222-8222 or by visiting the website at wellsfargofunds.com. |
| * | Michael Whitaker became Chief Compliance Officer effective May 16, 2016. |
| | | | |
| 34 | | Wells Fargo Intrinsic Value Fund | | Other information (unaudited) |
BOARD CONSIDERATION OF INVESTMENT MANAGEMENT AND SUB-ADVISORY AGREEMENTS:
Under the Investment Company Act of 1940 (the “1940 Act”), the Board of Trustees (the “Board”) of Wells Fargo Funds Trust (the “Trust”) must determine annually whether to approve the continuation of the Trust’s investment management and sub-advisory agreements. In this regard, at an in-person meeting held on May 24-25, 2016 (the “Meeting”), the Board, all the members of which have no direct or indirect interest in the investment management and sub-advisory agreements and are not “interested persons” of the Trust, as defined in the 1940 Act (the “Independent Trustees”), reviewed and approved for Wells Fargo Intrinsic Value Fund (the “Fund”): (i) an investment management agreement (the “Management Agreement”) with Wells Fargo Funds Management, LLC (“Funds Management”); and (ii) an investment sub-advisory agreement (the “Sub-Advisory Agreement”) with Metropolitan West Capital Management, LLC (the “Sub-Adviser”), an affiliate of Funds Management. The Management Agreement and the Sub-Advisory Agreement are collectively referred to as the “Advisory Agreements.”
At the Meeting, the Board considered the factors and reached the conclusions described below relating to the selection of Funds Management and the Sub-Adviser and the approval of the Advisory Agreements. Prior to the Meeting, including at an in-person meeting in April 2016, the Trustees conferred extensively among themselves and with representatives of Funds Management about these matters. Also, the Board has adopted a team-based approach, with each team consisting of a sub-set of Trustees, to assist the full Board in the discharge of its duties in reviewing performance and other matters throughout the year. The Independent Trustees were assisted in their evaluation of the Advisory Agreements by independent legal counsel, from whom they received separate legal advice and with whom they met separately.
In providing information to the Board, Funds Management and the Sub-Adviser were guided by a detailed set of requests for information submitted to them by independent legal counsel on behalf of the Independent Trustees at the start of the Board’s annual contract renewal process earlier in 2016. In considering and approving the Advisory Agreements, the Trustees considered the information they believed relevant, including but not limited to the information discussed below. The Board considered not only the specific information presented in connection with the Meeting, but also the knowledge gained over time through interaction with Funds Management and the Sub-Adviser about various topics. In this regard, the Board reviewed reports of Funds Management at each of its quarterly meetings, which included, among other things, portfolio reviews and performance reports. In addition, the Board and the teams mentioned above confer with portfolio managers at various times throughout the year. The Board did not identify any particular information or consideration that was all-important or controlling, and each individual Trustee may have attributed different weights to various factors.
After its deliberations, the Board unanimously approved the continuation of the Advisory Agreements for a one-year term and determined that the compensation payable to Funds Management and the Sub-Adviser under each of the Advisory Agreements was reasonable. The Board considered the approval of the Advisory Agreements for the Fund as part of its consideration of agreements for funds across the complex, but its approvals were made on a fund-by-fund basis. The following summarizes a number of important, but not necessarily all, factors considered by the Board in support of its approvals.
Nature, extent and quality of services
The Board received and considered various information regarding the nature, extent and quality of services provided to the Fund by Funds Management and the Sub-Adviser under the Advisory Agreements. This information included a description of the investment advisory services and Fund-level administrative services covered by the Management Agreement, as well as, among other things, a summary of the background and experience of senior management of Funds Management, and the qualifications, background, tenure and responsibilities of each of the portfolio managers primarily responsible for the day-to-day portfolio management of the Fund.
The Board evaluated the ability of Funds Management and the Sub-Adviser to attract and retain qualified investment professionals, including research, advisory and supervisory personnel. The Board further considered the compliance programs and compliance records of Funds Management and the Sub-Adviser. In addition, the Board took into account the full range of services provided to the Fund by Funds Management and its affiliates.
Fund performance and expenses
The Board considered the performance results for the Fund over various time periods ended December 31, 2015. The Board considered these results in comparison to the performance of funds in a universe that was determined by Broadridge Inc. (“Broadridge”) to be similar to the Fund (the “Universe”), and in comparison to the Fund’s benchmark index and to other comparative data. Broadridge is an independent provider of investment company data. The Board received a description of the methodology used by Broadridge to select the mutual funds in the performance Universe.
| | | | | | |
| Other information (unaudited) | | Wells Fargo Intrinsic Value Fund | | | 35 | |
The Board noted that the performance of the Fund (Class A) was in range of the average performance of the Universe for all periods under review except the three-year period under review. The Board also noted that the performance of the Fund was higher than its benchmark, the Russell 1000® Value Index, for all periods under review except the three- and five-year periods.
The Board received information concerning, and discussed factors contributing to, the underperformance of the Fund relative to the Universe and benchmark for the periods noted above. The Board took note of the explanations for the relative underperformance in these periods, including with respect to market factors and investment decisions that affected the Fund’s performance.
The Board also received and considered information regarding the Fund’s net operating expense ratios and their various components, including actual management fees, custodian and other non-management fees, and Rule 12b-1 and non-Rule 12b-1 shareholder service fees. The Board considered these ratios in comparison to the median ratios of funds in class-specific expense groups that were determined by Broadridge to be similar to the Fund (the “Groups”).
The Board received a description of the methodology used by Broadridge to select the mutual funds in the expense Groups and an explanation of how funds comprising expense groups and their expense ratios may vary from year-to-year. Based on the Broadridge reports, the Board noted that the net operating expense ratios of the Fund were lower than or equal to the median net operating expense ratios of the expense Groups.
The Board took into account the Fund performance and expense information provided to it among the factors considered in deciding to re-approve the Advisory Agreements.
Investment management and sub-advisory fee rates
The Board reviewed and considered the contractual fee rates payable by the Fund to Funds Management under the Management Agreement, as well as the contractual fee rates payable by the Fund to Funds Management for class-level administrative services under a Class-Level Administration Agreement, which include class-level transfer agency and sub-transfer agency costs (collectively, the “Management Rates”). The Board also reviewed and considered the contractual investment sub-advisory fee rates that are payable by Funds Management to the Sub-Adviser for investment sub-advisory services.
Among other information reviewed by the Board was a comparison of the Fund’s Management Rates with the average contractual investment management fee rates of funds in the expense Groups at a common asset level as well as transfer agency costs of the funds in the expense Groups. The Board noted that the Management Rates of the Fund were lower than, in range of, or equal to the sum of these average rates for the Fund’s expense Groups for all share classes.
The Board also received and considered information about the portion of the total management fee that was retained by Funds Management after payment of the fee to the Sub-Adviser for sub-advisory services. In assessing the reasonableness of this amount, the Board received and evaluated information about the nature and extent of responsibilities retained and risks assumed by Funds Management and not delegated to or assumed by the Sub-Adviser, and about Funds Management’s on-going oversight services. However, given the affiliation between Funds Management and the Sub-Adviser, the Board ascribed limited relevance to the allocation of fees between them.
The Board also received and considered information about the nature and extent of services offered and fee rates charged by Funds Management and the Sub-Adviser to other types of clients with investment strategies similar to those of the Fund. In this regard, the Board received information about the significantly greater scope of services, and compliance, reporting and other legal burdens and risks of managing mutual funds compared with those associated with managing assets of non-mutual fund clients such as collective funds or institutional separate accounts.
Based on its consideration of the factors and information it deemed relevant, including those described here, the Board determined that the compensation payable to Funds Management under the Management Agreement and to the Sub-Adviser under the Sub-Advisory Agreement was reasonable, in light of the services covered by the Advisory Agreements.
Profitability
The Board received and considered information concerning the profitability of Funds Management, as well as the profitability of Wells Fargo as a whole, from providing services to the Fund and the fund family as a whole. The Board also received and considered information concerning the profitability of the Sub-Adviser from providing services to the fund family as a whole, noting that the Sub-Adviser’s profitability information with respect to providing services to the Fund was subsumed in the Wells Fargo and Funds Management profitability analysis.
| | | | |
| 36 | | Wells Fargo Intrinsic Value Fund | | Other information (unaudited) |
Funds Management reported on the methodologies and estimates used in calculating profitability. Among other things, the Board noted that the levels of profitability reported on a fund-by-fund basis varied widely, depending on factors such as the size and type of fund. Based on its review, the Board did not deem the profits reported by Funds Management or Wells Fargo from its services to the Fund to be at a level that would prevent it from approving the continuation of the Advisory Agreements.
Economies of scale
With respect to possible economies of scale, the Board noted the existence of breakpoints in the Fund’s management fee structure, which operate generally to reduce the Fund’s expense ratios as the Fund grows in size. It considered that, for a small fund or a fund that shrinks in size, breakpoints conversely can result in higher fee levels. The Board also considered that fee waiver and expense reimbursement arrangements and competitive fee rates at the outset are means of sharing potential economies of scale with shareholders of the Fund and the fund family as a whole. The Board considered Funds Management’s view that any analyses of potential economies of scale in managing a particular fund are inherently limited in light of the joint and common costs and investments that Funds Management incurs across the fund family as a whole.
The Board concluded that the Fund’s fee and expense arrangements, including contractual breakpoints, constituted a reasonable approach to sharing potential economies of scale with the Fund and its shareholders.
Other benefits to Funds Management and the Sub-Adviser
The Board received and considered information regarding potential “fall-out” or ancillary benefits received by Funds Management and its affiliates, including the Sub-Adviser, as a result of their relationships with the Fund. Ancillary benefits could include, among others, benefits directly attributable to other relationships with the Fund and benefits potentially derived from an increase in Funds Management’s and the Sub-Adviser’s business as a result of their relationships with the Fund. The Board noted that various affiliates of Funds Management may receive distribution-related fees, shareholder servicing payments and sub-transfer agency fees in respect of shares sold or held through them and services provided.
The Board also reviewed information about soft dollar credits earned and utilized by the Sub-Adviser, fees earned by Funds Management from managing a private investment vehicle for the fund family’s securities lending collateral and commissions earned by an affiliated broker from portfolio transactions.
Based on its consideration of the factors and information it deemed relevant, including those described here, the Board did not find that any ancillary benefits received by Funds Management and its affiliates, including the Sub-Adviser, were unreasonable.
Conclusion
At the Meeting, after considering the above-described factors and based on its deliberations and its evaluation of the information described above, the Board unanimously approved the continuation of the Advisory Agreements for a one-year term and determined that the compensation payable to Funds Management and the Sub-Adviser under each of the Advisory Agreements was reasonable.
| | | | | | |
| List of abbreviations | | Wells Fargo Intrinsic Value Fund | | | 37 | |
The following is a list of common abbreviations for terms and entities that may have appeared in this report.
| ACA | — ACA Financial Guaranty Corporation |
| ADR | — American depositary receipt |
| ADS | — American depositary shares |
| AGC | — Assured Guaranty Corporation |
| AGM | — Assured Guaranty Municipal |
| Ambac | — Ambac Financial Group Incorporated |
| AMT | — Alternative minimum tax |
| BAN | — Bond anticipation notes |
| BHAC | — Berkshire Hathaway Assurance Corporation |
| CAB | — Capital appreciation bond |
| CCAB | — Convertible capital appreciation bond |
| CDA | — Community Development Authority |
| CDO | — Collateralized debt obligation |
| DRIVER | — Derivative inverse tax-exempt receipts |
| DW&P | — Department of Water & Power |
| DWR | — Department of Water Resources |
| ECFA | — Educational & Cultural Facilities Authority |
| EDA | — Economic Development Authority |
| EDFA | — Economic Development Finance Authority |
| ETF | — Exchange-traded fund |
| FDIC | — Federal Deposit Insurance Corporation |
| FFCB | — Federal Farm Credit Banks |
| FGIC | — Financial Guaranty Insurance Corporation |
| FHA | — Federal Housing Administration |
| FHLB | — Federal Home Loan Bank |
| FHLMC | — Federal Home Loan Mortgage Corporation |
| FICO | — The Financing Corporation |
| FNMA | — Federal National Mortgage Association |
| GDR | — Global depositary receipt |
| GNMA | — Government National Mortgage Association |
| HCFR | — Healthcare facilities revenue |
| HEFA | — Health & Educational Facilities Authority |
| HEFAR | — Higher education facilities authority revenue |
| HFA | — Housing Finance Authority |
| HFFA | — Health Facilities Financing Authority |
| HUD | — Department of Housing and Urban Development |
| IDA | — Industrial Development Authority |
| IDAG | — Industrial Development Agency |
| KRW | — Republic of Korea won |
| LIBOR | — London Interbank Offered Rate |
| LIFER | — Long Inverse Floating Exempt Receipts |
| LLC | — Limited liability company |
| LLLP | — Limited liability limited partnership |
| LLP | — Limited liability partnership |
| MBIA | — Municipal Bond Insurance Association |
| MFHR | — Multifamily housing revenue |
| MSTR | — Municipal securities trust receipts |
| MUD | — Municipal Utility District |
| National | — National Public Finance Guarantee Corporation |
| PCFA | — Pollution Control Financing Authority |
| PCL | — Public Company Limited |
| PCR | — Pollution control revenue |
| PFA | — Public Finance Authority |
| PFFA | — Public Facilities Financing Authority |
| PFOTER | — Puttable floating option tax-exempt receipts |
| plc | — Public limited company |
| PUTTER | — Puttable tax-exempt receipts |
| R&D | — Research & development |
| Radian | — Radian Asset Assurance |
| RAN | — Revenue anticipation notes |
| RDA | — Redevelopment Authority |
| RDFA | — Redevelopment Finance Authority |
| REIT | — Real estate investment trust |
| ROC | — Reset option certificates |
| SAVRS | — Select auction variable rate securities |
| SBA | — Small Business Authority |
| SDR | — Swedish depositary receipt |
| SFHR | — Single-family housing revenue |
| SFMR | — Single-family mortgage revenue |
| SPA | — Standby purchase agreement |
| SPDR | — Standard & Poor’s Depositary Receipts |
| SPEAR | — Short Puttable Exempt Adjustable Receipts |
| STRIPS | — Separate trading of registered interest and |
| TAN | — Tax anticipation notes |
| TIPS | — Treasury inflation-protected securities |
| TRAN | — Tax revenue anticipation notes |
| TTFA | — Transportation Trust Fund Authority |
| TVA | — Tennessee Valley Authority |
This page is intentionally left blank.
This page is intentionally left blank.
This page is intentionally left blank.

For more information
More information about Wells Fargo Funds is available free upon request. To obtain literature, please write, email, visit the Fund’s website, or call:
Wells Fargo Funds
P.O. Box 8266
Boston, MA 02266-8266
Email: fundservice@wellsfargo.com
Website: wellsfargofunds.com
Individual investors: 1-800-222-8222
Retail investment professionals: 1-888-877-9275
Institutional investment professionals: 1-866-765-0778
This report and the financial statements contained herein are submitted for the general information of the shareholders of the Fund. If this report is used for promotional purposes, distribution of the report must be accompanied or preceded by a current prospectus. Before investing, please consider the investment objectives, risks, charges, and expenses of the investment. For a current prospectus and, if available, a summary prospectus, containing this information, call 1-800-222-8222 or visit the Fund’s website at wellsfargofunds.com. Read the prospectus carefully before you invest or send money.
Wells Fargo Asset Management (WFAM) is a trade name used by the asset management businesses of Wells Fargo & Company. Wells Fargo Funds Management, LLC, a wholly owned subsidiary of Wells Fargo & Company, provides investment advisory and administrative services for Wells Fargo Funds. Other affiliates of Wells Fargo & Company provide subadvisory and other services for the funds. The funds are distributed by Wells Fargo Funds Distributor, LLC, Member FINRA, an affiliate of Wells Fargo & Company.
NOT FDIC INSURED ¡ NO BANK GUARANTEE ¡ MAY LOSE VALUE
© 2016 Wells Fargo Funds Management, LLC. All rights reserved.
| | |
 | | 245324 09-16 A207/AR207 07-16 |
Annual Report
July 31, 2016

Wells Fargo Large Cap Core Fund


Reduce clutter. Save trees.
Sign up for electronic delivery of prospectuses and shareholder reports at wellsfargo.com/advantagedelivery
Contents
The views expressed and any forward-looking statements are as of July 31, 2016, unless otherwise noted, and are those of the Fund managers and/or Wells Fargo Funds Management, LLC. Discussions of individual securities, or the markets generally, or any Wells Fargo Fund are not intended as individual recommendations. Future events or results may vary significantly from those expressed in any forward-looking statements. The views expressed are subject to change at any time in response to changing circumstances in the market. Wells Fargo Funds Management, LLC and the Fund disclaim any obligation to publicly update or revise any views expressed or forward-looking statements.
NOT FDIC INSURED ¡ NO BANK GUARANTEE ¡ MAY LOSE VALUE
| | | | |
| 2 | | Wells Fargo Large Cap Core Fund | | Letter to shareholders (unaudited) |

Karla M. Rabusch
President
Wells Fargo Funds
Despite significant market fluctuations over the course of the year, U.S. stocks delivered positive results overall for the 12-month reporting period
Dear Valued Shareholder:
We are pleased to offer you this annual report for the Wells Fargo Large Cap Core Fund for the 12-month period that ended July 31, 2016. During this period, which began August 1, 2015, U.S. and international stock markets experienced heightened volatility, with intermittent rebounds interspersed with sell-offs. The U.S. economy displayed resilience throughout the period, although growth was somewhat sluggish amid ongoing pressures that included slowing growth in China, a strengthening U.S. dollar, and uncertainty regarding interest-rate increases by the U.S. Federal Reserve (Fed); international economies faced deeper ongoing challenges. During June 2016, global markets became especially volatile as the U.K.’s vote over whether to leave the European Union (E.U.) approached. However, markets began recovering shortly after the U.K. voted to leave and rallied through July. Despite significant market fluctuations over the course of the year, U.S. stocks delivered positive results overall for the 12-month reporting period, as measured by the Russell 1000® Index.1 International markets generally declined as measured by the Morgan Stanley Capital International (MSCI) Europe, Australasia, Far East (EAFE) Index.2
In the third quarter of 2015, China’s slowdown took a toll on economies and markets worldwide.
U.S. stocks sagged during the quarter, experiencing the most volatility since 2011. Economic data released during the quarter suggested the U.S. economy remained solid but had lost some steam, burdened by the drag of the U.S. dollar’s strength coupled with global economic turmoil. The fact that the Fed left the federal funds interest rate unchanged at its September 2015 meeting surprised investors and fueled increased uncertainty about the U.S. economy’s stamina to remain healthy while facing the challenges of slowing growth in China and troubles elsewhere in the world. Outside the U.S., markets were even more volatile and delivered generally weaker quarterly results, also largely due to investors’ increasing anxiety over China’s weakened economy.
Despite ongoing concerns, U.S. stocks generally rose in the fourth quarter of 2015; international markets lagged.
While the broad U.S. stock market bounced back in the quarter, stock markets outside the U.S. failed to keep pace as economic concerns, including China’s ongoing slowdown, continued to affect many countries. U.S. economic data released during the quarter indicated the economy remained solid, although the strong U.S. dollar and weakness in international economies remained headwinds. In December, the Fed, as expected, raised its target interest rate by 25 basis points (bps; 100 bps equals 1.00%) after keeping it near zero for seven years. The move reflected confidence in the U.S. economy’s ability to stay healthy with less central-bank support. The Fed also clarified that future interest-rate increases would be gradual.
| 1 | The Russell 1000® Index measures the performance of the 1,000 largest companies in the Russell 3000® Index, which represents approximately 92% of the total market capitalization of the Russell 3000® Index. You cannot invest directly in an index. |
| 2 | Morgan Stanley Capital International (MSCI) Europe, Australasia, Far East (EAFE) Index is a free-float-adjusted market-capitalization-weighted index that is designed to measure the equity market performance of developed markets, excluding the United States and Canada. The MSCI EAFE Index consists of the following 21 developed markets country indexes: Australia, Austria, Belgium, Denmark, Finland, France, Germany, Hong Kong, Ireland, Israel, Italy, Japan, the Netherlands, New Zealand, Norway, Portugal, Singapore, Spain, Sweden, Switzerland, and the United Kingdom. You cannot invest directly in an index. |
| | | | | | |
| Letter to shareholders (unaudited) | | Wells Fargo Large Cap Core Fund | | | 3 | |
In the first quarter of 2016, market volatility increased globally amid ongoing concerns.
Stock markets worldwide fluctuated widely in the first quarter of 2016. Most sold off sharply in the first six weeks of the year on concerns such as weak global growth, falling commodity prices, and uncertainty over the timing and impact of the Fed’s interest-rate increases. As the quarter progressed, fears abated somewhat and global markets generally rallied back. The U.S. economy ended the quarter on a positive note as much of the quarter’s data reflected resiliency. With ongoing uncertainties about global growth and financial markets, however, the Fed held off from raising the target interest rate during the quarter. Outside the U.S., the eurozone fell into deflation in February; in response, the European Central Bank announced an expansion of its stimulus program. In China, the government in March set a growth rate of 6.5% to 7.0% for 2016, an acknowledgment of weakening growth. In emerging markets, although central-bank stimulus and improved prices for oil and other commodities led to stock-market rallies in the quarter, many of these countries’ economies face credit downgrades due to challenges such as the likelihood of a stronger U.S. dollar, which would make dollar-denominated debt more expensive.
Worries over interest rates and the U.K.’s vote largely drove the markets during the second quarter of 2016.
U.S. stocks began the quarter in positive territory but started to lose steam in early May on worries that a possible June interest-rate increase by the Fed could hurt the market. In mid-May, stocks briefly plunged following comments by Fed officials noting that a June interest-rate increase remained on the table. But once investors had processed this information, stocks again rallied, finishing up for the month. The first three weeks of June brought heightened volatility, spurred largely by a disappointing jobs report and uncertainty over whether the U.K. would remain in the E.U. The U.K.’s Brexit vote on June 23 shocked countries in Europe and much of the rest of the world. Stock markets plummeted as investors worried that the U.K.’s departure from the E.U. would slow global growth and prolong the low-interest-rate environment. Following the initial rout, however, U.S. stocks rallied as investors seemed to decide that any negative effects would be more localized and not create a serious risk for global growth. By quarter-end, the broad U.S. stock market had moved back into positive territory.
Stocks generally posted positive results for July 2016.
U.S. stocks displayed the most momentum during the first two weeks of the month, buoyed partly by an unexpectedly favorable June jobs report that helped strengthen confidence in the U.S. economy. Also, investors perhaps felt that global central banks could extend stimulus measures in the wake of the Brexit vote. Although U.S. market momentum slowed during the second half of July, stocks ended in positive territory for the month. International stocks delivered positive monthly results as well.
| | | | |
| 4 | | Wells Fargo Large Cap Core Fund | | Letter to shareholders (unaudited) |
Don’t let short-term uncertainty derail long-term investment goals.
Periods of uncertainty can present challenges, but experience has taught us that maintaining long-term investment goals can be an effective way to plan for the future. To help you create a sound strategy based on your personal goals and risk tolerance, Wells Fargo Funds offers more than 100 mutual funds spanning a wide range of asset classes and investment styles. Although diversification cannot guarantee an investment profit or prevent losses, we believe it can be an effective way to manage investment risk and potentially smooth out overall portfolio performance. We encourage investors to know their investments and to understand that appropriate levels of risk-taking may unlock opportunities.
Thank you for choosing to invest in Wells Fargo Funds. We appreciate your confidence in us and remain committed to helping you meet your financial needs.
Sincerely,

Karla M. Rabusch
President
Wells Fargo Funds
Although diversification cannot guarantee an investment profit or prevent losses, we believe it can be an effective way to manage investment risk and potentially smooth out overall portfolio performance.
For further information about your Fund, contact your investment professional, visit our website at wellsfargofunds.com, or call us directly at 1-800-222-8222. We are available 24 hours a day, 7 days a week.
This page is intentionally left blank.
| | | | |
| 6 | | Wells Fargo Large Cap Core Fund | | Performance highlights (unaudited) |
Investment objective
The Fund seeks long-term capital appreciation.
Manager
Wells Fargo Funds Management, LLC
Subadviser
Golden Capital Management, LLC
Portfolio managers
John Campbell, CFA®
Jeff C. Moser, CFA®
Average annual total returns (%) as of July 31, 20161
| | | | | | | | | | | | | | | | | | | | | | | | | | | | | | | | | | |
| | | | | Including sales charge | | | Excluding sales charge | | | Expense ratios2 (%) | |
| | | Inception date | | 1 year | | | 5 year | | | Since inception | | | 1 year | | | 5 year | | | Since inception | | | Gross | | | Net3 | |
| Class A (EGOAX) | | 12-17-2007 | | | (8.73 | ) | | | 11.07 | | | | 4.99 | | | | (3.18 | ) | | | 12.39 | | | | 5.71 | | | | 1.21 | | | | 1.14 | |
| Class C (EGOCX) | | 12-17-2007 | | | (4.90 | ) | | | 11.57 | | | | 4.95 | | | | (3.90 | ) | | | 11.57 | | | | 4.95 | | | | 1.96 | | | | 1.89 | |
| Class R (EGOHX) | | 9-30-2015 | | | – | | | | – | | | | – | | | | (3.44 | ) | | | 12.11 | | | | 5.46 | | | | 1.46 | | | | 1.39 | |
| Class R6 (EGORX) | | 9-30-2015 | | | – | | | | – | | | | – | | | | (2.73 | ) | | | 12.93 | | | | 6.16 | | | | 0.78 | | | | 0.68 | |
| Administrator Class (WFLLX) | | 7-16-2010 | | | – | | | | – | | | | – | | | | (2.98 | ) | | | 12.67 | | | | 5.92 | | | | 1.13 | | | | 1.00 | |
| Institutional Class (EGOIX) | | 12-17-2007 | | | – | | | | – | | | | – | | | | (2.75 | ) | | | 12.94 | | | | 6.16 | | | | 0.88 | | | | 0.70 | |
| S&P 500 Index4 | | – | | | – | | | | – | | | | – | | | | 5.61 | | | | 13.38 | | | | 7.15 | | | | – | | | | – | |
Figures quoted represent past performance, which is no guarantee of future results, and do not reflect taxes that a shareholder may pay on fund distributions or the redemption of fund shares. Investment return and principal value of an investment will fluctuate so that an investor’s shares, when redeemed, may be worth more or less than their original cost. Performance shown without sales charges would be lower if sales charges were reflected. Current performance may be lower or higher than the performance data quoted, which assumes the reinvestment of dividends and capital gains. Current month-end performance is available on the Fund’s website, wellsfargofunds.com.
Index returns do not include transaction costs associated with buying and selling securities, any mutual fund fees or expenses, or any taxes. It is not possible to invest directly in an index.
For Class A shares, the maximum front-end sales charge is 5.75%. For Class C shares, the maximum contingent deferred sales charge is 1.00%. Performance including a contingent deferred sales charge assumes the sales charge for the corresponding time period. Class R, Class R6, Administrator Class, and Institutional Class shares are sold without a front-end sales charge or contingent deferred sales charge.
Stock values fluctuate in response to the activities of individual companies and general market and economic conditions. Certain investment strategies tend to increase the total risk of an investment (relative to the broader market). The Fund is exposed to foreign investment risk and focused portfolio risk. Consult the Fund’s prospectus for additional information on these and other risks.
Please see footnotes on page 7.
| | | | | | |
| Performance highlights (unaudited) | | Wells Fargo Large Cap Core Fund | | | 7 | |
|
| Growth of $10,000 investment as of July 31, 20165 |
|
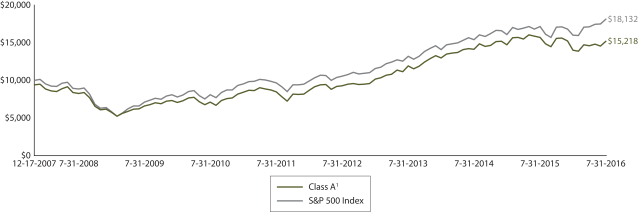 |
| 1 | Historical performance shown for Administrator Class shares prior to their inception reflects the performance of Institutional Class shares, adjusted to reflect higher expenses applicable to Administrator Class shares. Historical performance shown for Class R shares prior to their inception reflects the performance of Administrator Class shares, adjusted to reflect higher expenses applicable to Class R shares. Historical performance shown for Class R6 shares prior to their inception reflects the performance of Institutional Class shares, and adjusted to reflect higher expenses applicable to Class R6 shares. Historical performance shown for all classes of the Fund prior to July 19, 2010, is based on the performance of the Fund’s predecessor, Evergreen Golden Large Cap Core Fund. |
| 2 | Reflects the expense ratios as stated in the most recent prospectuses. The expense ratios shown are subject to change and may differ from the annualized expense ratios shown in the financial highlights of this report. |
| 3 | The manager has contractually committed through November 30, 2016, to waive fees and/or reimburse expenses to the extent necessary to cap the Fund’s Total Annual Fund Operating Expenses After Fee Waiver at the amounts shown. After this time, the cap may be increased or the commitment to maintain the cap may be terminated only with the approval of the Board of Trustees. Brokerage commissions, stamp duty fees, interest, taxes, acquired fund fees and expenses, and extraordinary expenses are excluded from the expense cap. Without this cap, the Fund’s returns would have been lower. |
| 4 | The S&P 500 Index consists of 500 stocks chosen for market size, liquidity, and industry group representation. It is a market-value weighted index with each stock’s weight in the index proportionate to its market value. You cannot invest directly in an index. |
| 5 | The chart compares the performance of Class A shares since inception with the S&P 500 Index. The chart assumes a hypothetical investment of $10,000 in Class A shares and reflects all operating expenses and assumes the maximum initial sales charge of 5.75%. |
| 6 | The ten largest holdings, excluding cash and cash equivalents, are calculated based on the value of the investments divided by total net assets of the Fund. Holdings are subject to change and may have changed since the date specified. |
| 7 | Amounts are calculated based on the total long-term investments of the Fund. These amounts are subject to change and may have changed since the date specified. |
| 8 | P/E is the price of a share of a stock divided by earnings per share, usually calculated using the latest year’s earnings. |
| | | | |
| 8 | | Wells Fargo Large Cap Core Fund | | Performance highlights (unaudited) |
MANAGER’S DISCUSSION
Fund highlights
| n | | The Fund underperformed its benchmark, the S&P 500 Index, for the 12-month period that ended July 31, 2016. |
| n | | A number of issues contributed to the poor results, including stock selection, sector and industry exposures, and certain risk exposures. |
| n | | Investors often tended to avoid risk and prefer less volatile and higher-yielding investments during the period, which challenged the Fund’s positioning. |
| | | | |
| Ten largest holdings (%) as of July 31, 20166 | |
NVIDIA Corporation | | | 3.00 | |
Linear Technology Corporation | | | 2.55 | |
Lowe’s Companies Incorporated | | | 2.54 | |
Pinnacle Foods Incorporated | | | 2.51 | |
Microsoft Corporation | | | 2.46 | |
The Home Depot Incorporated | | | 2.38 | |
DST Systems Incorporated | | | 2.32 | |
Centene Corporation | | | 2.27 | |
Comcast Corporation Class A | | | 2.27 | |
Aetna Incorporated | | | 2.26 | |
Macro themes played key roles in market movements and Fund results during the 12-month period.
Two macro themes in particular affected the markets and Fund performance: Oil prices enjoyed significant rebounds, and low interest rates drove many stock investors toward investments with higher dividend yields and away from investments perceived as higher risk.
Supply, demand, and production data created a bullish environment for oil prices during the period. The price per barrel of Brent crude oil rose 33% in the first six months of 2016, including a 23% increase during the second quarter of the year. While rising oil prices benefited companies involved in upstream oil activities, such as exploration and production, they were detrimental to companies involved
in downstream activities, such as refining. Also, stronger crude-oil prices positively influenced commodities-oriented stocks in general, especially those in the materials and capital goods industries. Within the energy sector, the Fund’s underweight to companies involved in upstream activities and overweight to companies involved in downstream activities, which were out of sync with the market, hindered performance over the period.
Interest rates significantly influenced U.S. stocks over the period. In addition to driving investors toward higher-yielding stocks, low interest rates led investors to generally favor stocks with lower volatility and to question the strength of the U.S. and global economies. These conditions contributed to a risk-off stock-market environment, which benefited sectors generally perceived as more defensive, such as utilities and consumer staples. The U.K.’s Brexit vote in late June 2016 further accentuated the market’s emphases on interest-rate expectations and dividend yield and led to increased uncertainty about global economic growth. The Fund’s underweights to the more defensive, slower-growth, higher-yielding consumer staples, utilities, and telecommunication services sectors detracted from performance relative to the S&P 500 Index.
|
| Sector distribution as of July 31, 20167 |
|
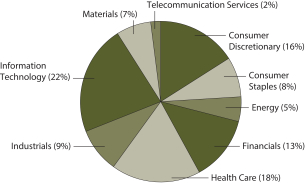 |
Companies with low price/earnings (P/E) ratios held back Fund performance.
Five stocks that were among the largest individual detractors from Fund performance—Western Refining, Incorporated; Magna International Incorporated; Spirit AeroSystems Holdings, Incorporated; Voya Financial, Incorporated; and Skyworks Solutions, Incorporated—are companies in five different economic sectors that shared one thing in common during the period: low P/E ratios.8 The Fund’s positions in Western Refining, Magna International, Voya Financial, and Skyworks Solutions were eliminated during the reporting period. At the time of sale, the average P/E ratio for these four stocks, 10.1, was similar to the P/E ratio for Spirit AeroSystems as of
the end of the reporting period (Spirit AeroSystems was not sold from the Fund). By way of comparison, the P/E ratio for the S&P 500 Index at the end of the reporting period was slightly above 17. As these varying P/E ratios indicate, many companies were unrewarded for their relatively low valuations during the period.
Please see footnotes on page 7.
| | | | | | |
| Performance highlights (unaudited) | | Wells Fargo Large Cap Core Fund | | | 9 | |
Our outlook remains optimistic.
Although this has been the weakest period of relative performance in the Fund’s history, it is not the first time we have experienced a significant period of underperformance. While the underperformance is painful in the moment, experience shows us that even the Fund’s weakest periods have not marred performance over the longer term. We have deep conviction in our investment process and believe in adhering to it. Sticking to our discipline does not mean we ignore what happens around us; we monitor the Fund, markets, economy, and political and other events around the world. We also continue to seek undervalued companies that have what we believe are superior earnings fundamentals and favorable investor sentiment, remaining true to our convictions for the benefit of Fund shareholders.
Please see footnotes on page 7.
| | | | |
| 10 | | Wells Fargo Large Cap Core Fund | | Fund expenses (unaudited) |
As a shareholder of the Fund, you incur two types of costs: (1) transaction costs, including sales charges (loads) on purchase payments and contingent deferred sales charges (if any) on redemptions and (2) ongoing costs, including management fees, distribution (12b-1) and/or shareholder servicing fees, and other Fund expenses. This example is intended to help you understand your ongoing costs (in dollars) of investing in the Fund and to compare these costs with the ongoing costs of investing in other mutual funds.
The example is based on an investment of $1,000 invested at the beginning of the six-month period and held for the entire period from February 1, 2016 to July 31, 2016.
Actual expenses
The “Actual” line of the table below provides information about actual account values and actual expenses. You may use the information in this line, together with the amount you invested, to estimate the expenses that you paid over the period. Simply divide your account value by $1,000 (for example, an $8,600 account value divided by $1,000 = 8.6), then multiply the result by the number in the “Actual” line under the heading entitled “Expenses paid during period” for your applicable class of shares to estimate the expenses you paid on your account during this period.
Hypothetical example for comparison purposes
The “Hypothetical” line of the table below provides information about hypothetical account values and hypothetical expenses based on the Fund’s actual expense ratio and an assumed rate of return of 5% per year before expenses, which is not the Fund’s actual return. The hypothetical account values and expenses may not be used to estimate the actual ending account balance or expenses you paid for the period. You may use this information to compare the ongoing costs of investing in the Fund and other funds. To do so, compare this 5% hypothetical example with the 5% hypothetical examples that appear in the shareholder reports of the other funds.
Please note that the expenses shown in the table are meant to highlight your ongoing costs only and do not reflect any transactional costs, such as sales charges (loads) and contingent deferred sales charges. Therefore, the “Hypothetical” line of the table is useful in comparing ongoing costs only and will not help you determine the relative total costs of owning different funds. In addition, if these transactional costs were included, your costs would have been higher.
| | | | | | | | | | | | | | | | |
| | | Beginning account value 2-1-2016 | | | Ending account value 7-31-2016 | | | Expenses paid during the period¹ | | | Annualized net expense ratio | |
Class A | | | | | | | | | | | | | | | | |
Actual | | $ | 1,000.00 | | | $ | 1,085.37 | | | $ | 5.91 | | | | 1.14 | % |
Hypothetical (5% return before expenses) | | $ | 1,000.00 | | | $ | 1,019.19 | | | $ | 5.73 | | | | 1.14 | % |
Class C | | | | | | | | | | | | | | | | |
Actual | | $ | 1,000.00 | | | $ | 1,081.45 | | | $ | 9.78 | | | | 1.89 | % |
Hypothetical (5% return before expenses) | | $ | 1,000.00 | | | $ | 1,015.46 | | | $ | 9.47 | | | | 1.89 | % |
Class R | | | | | | | | | | | | | | | | |
Actual | | $ | 1,000.00 | | | $ | 1,083.57 | | | $ | 7.20 | | | | 1.39 | % |
Hypothetical (5% return before expenses) | | $ | 1,000.00 | | | $ | 1,017.95 | | | $ | 6.97 | | | | 1.39 | % |
Class R6 | | | | | | | | | | | | | | | | |
Actual | | $ | 1,000.00 | | | $ | 1,087.79 | | | $ | 3.53 | | | | 0.68 | % |
Hypothetical (5% return before expenses) | | $ | 1,000.00 | | | $ | 1,021.48 | | | $ | 3.42 | | | | 0.68 | % |
Administrator Class | | | | | | | | | | | | | | | | |
Actual | | $ | 1,000.00 | | | $ | 1,085.84 | | | $ | 5.19 | | | | 1.00 | % |
Hypothetical (5% return before expenses) | | $ | 1,000.00 | | | $ | 1,019.89 | | | $ | 5.02 | | | | 1.00 | % |
Institutional Class | | | | | | | | | | | | | | | | |
Actual | | $ | 1,000.00 | | | $ | 1,087.86 | | | $ | 3.64 | | | | 0.70 | % |
Hypothetical (5% return before expenses) | | $ | 1,000.00 | | | $ | 1,021.38 | | | $ | 3.52 | | | | 0.70 | % |
| 1 | Expenses paid is equal to the annualized net expense ratio of each class multiplied by the average account value over the period, multiplied by the number of days in the most recent fiscal half-year divided by the number of days in the fiscal year (to reflect the one-half-year period). |
| | | | | | |
| Portfolio of investments—July 31, 2016 | | Wells Fargo Large Cap Core Fund | | | 11 | |
| | | | | | | | | | | | | | | | |
| Security name | | | | | | | | Shares | | | Value | |
| | | | |
Common Stocks: 99.77% | | | | | | | | | | | | | | | | |
| | | | |
Consumer Discretionary: 16.01% | | | | | | | | | | | | | | | | |
| | | | |
| Auto Components: 1.99% | | | | | | | | | | | | | | | | |
Lear Corporation | | | | | | | | | | | 158,785 | | | $ | 18,014,158 | |
| | | | | | | | | | | | | | | | |
| | | | |
| Automobiles: 3.09% | | | | | | | | | | | | | | | | |
Ford Motor Company | | | | | | | | | | | 810,899 | | | | 10,265,981 | |
General Motors Company | | | | | | | | | | | 561,153 | | | | 17,698,766 | |
| | | | |
| | | | | | | | | | | | | | | 27,964,747 | |
| | | | | | | | | | | | | | | | |
| | | | |
| Media: 2.27% | | | | | | | | | | | | | | | | |
Comcast Corporation Class A | | | | | | | | | | | 305,074 | | | | 20,516,227 | |
| | | | | | | | | | | | | | | | |
| | | | |
| Multiline Retail: 1.86% | | | | | | | | | | | | | | | | |
Target Corporation | | | | | | | | | | | 222,835 | | | | 16,786,161 | |
| | | | | | | | | | | | | | | | |
| | | | |
| Specialty Retail: 6.80% | | | | | | | | | | | | | | | | |
Foot Locker Incorporated | | | | | | | | | | | 284,379 | | | | 16,954,676 | |
Lowe’s Companies Incorporated | | | | | | | | | | | 279,513 | | | | 22,998,330 | |
The Home Depot Incorporated | | | | | | | | | | | 156,000 | | | | 21,565,440 | |
| | | | |
| | | | | | | | | | | | | | | 61,518,446 | |
| | | | | | | | | | | | | | | | |
| | | | |
Consumer Staples: 8.22% | | | | | | | | | | | | | | | | |
| | | | |
| Food & Staples Retailing: 5.71% | | | | | | | | | | | | | | | | |
CVS Health Corporation | | | | | | | | | | | 207,361 | | | | 19,226,512 | |
Sysco Corporation | | | | | | | | | | | 350,726 | | | | 18,164,100 | |
The Kroger Company | | | | | | | | | | | 417,088 | | | | 14,260,239 | |
| | | | |
| | | | | | | | | | | | | | | 51,650,851 | |
| | | | | | | | | | | | | | | | |
| | | | |
| Food Products: 2.51% | | | | | | | | | | | | | | | | |
Pinnacle Foods Incorporated | | | | | | | | | | | 451,410 | | | | 22,665,296 | |
| | | | | | | | | | | | | | | | |
| | | | |
Energy: 4.95% | | | | | | | | | | | | | | | | |
| | | | |
| Oil, Gas & Consumable Fuels: 4.95% | | | | | | | | | | | | | | | | |
Chevron Corporation | | | | | | | | | | | 169,594 | | | | 17,379,993 | |
Exxon Mobil Corporation | | | | | | | | | | | 148,888 | | | | 13,243,588 | |
Valero Energy Corporation | | | | | | | | | | | 271,520 | | | | 14,195,066 | |
| | | | |
| | | | | | | | | | | | | | | 44,818,647 | |
| | | | | | | | | | | | | | | | |
| | | | |
Financials: 12.91% | | | | | | | | | | | | | | | | |
| | | | |
| Banks: 5.65% | | | | | | | | | | | | | | | | |
Huntington Bancshares Incorporated | | | | | | | | | | | 1,554,362 | | | | 14,766,439 | |
JPMorgan Chase & Company | | | | | | | | | | | 280,398 | | | | 17,937,060 | |
SunTrust Banks Incorporated | | | | | | | | | | | 434,151 | | | | 18,360,246 | |
| | | | |
| | | | | | | | | | | | | | | 51,063,745 | |
| | | | | | | | | | | | | | | | |
| | | | |
| Capital Markets: 1.72% | | | | | | | | | | | | | | | | |
Goldman Sachs Group Incorporated | | | | | | | | | | | 97,714 | | | | 15,517,960 | |
| | | | | | | | | | | | | | | | |
The accompanying notes are an integral part of these financial statements.
| | | | |
| 12 | | Wells Fargo Large Cap Core Fund | | Portfolio of investments—July 31, 2016 |
| | | | | | | | | | | | | | | | |
| Security name | | | | | | | | Shares | | | Value | |
| | | | |
| Insurance: 5.54% | | | | | | | | | | | | | | | | |
AFLAC Incorporated | | | | | | | | | | | 247,913 | | | $ | 17,919,152 | |
Lincoln National Corporation | | | | | | | | | | | 389,059 | | | | 16,990,207 | |
Prudential Financial Incorporated | | | | | | | | | | | 202,436 | | | | 15,241,406 | |
| | | | |
| | | | | | | | | | | | | | | 50,150,765 | |
| | | | | | | | | | | | | | | | |
| | | | |
Health Care: 17.93% | | | | | | | | | | | | | | | | |
| | | | |
| Biotechnology: 3.87% | | | | | | | | | | | | | | | | |
Amgen Incorporated | | | | | | | | | | | 111,473 | | | | 19,176,700 | |
Gilead Sciences Incorporated | | | | | | | | | | | 199,001 | | | | 15,814,609 | |
| | | | |
| | | | | | | | | | | | | | | 34,991,309 | |
| | | | | | | | | | | | | | | | |
| | | | |
| Health Care Providers & Services: 12.21% | | | | | | | | | | | | | | | | |
Aetna Incorporated | | | | | | | | | | | 177,190 | | | | 20,414,060 | |
AmSurg Corporation † | | | | | | | | | | | 219,413 | | | | 16,458,169 | |
Centene Corporation † | | | | | | | | | | | 290,945 | | | | 20,526,170 | |
HCA Holdings Incorporated † | | | | | | | | | | | 211,917 | | | | 16,345,158 | |
McKesson Corporation | | | | | | | | | | | 95,352 | | | | 18,551,685 | |
UnitedHealth Group Incorporated | | | | | | | | | | | 126,803 | | | | 18,158,190 | |
| | | | |
| | | | | | | | | | | | | | | 110,453,432 | |
| | | | | | | | | | | | | | | | |
| | | | |
| Pharmaceuticals: 1.85% | | | | | | | | | | | | | | | | |
Merck & Company Incorporated | | | | | | | | | | | 285,346 | | | | 16,738,396 | |
| | | | | | | | | | | | | | | | |
| | | | |
Industrials: 9.15% | | | | | | | | | | | | | | | | |
| | | | |
| Aerospace & Defense: 5.95% | | | | | | | | | | | | | | | | |
Northrop Grumman Corporation | | | | | | | | | | | 89,455 | | | | 19,378,637 | |
Orbital ATK Incorporated | | | | | | | | | | | 210,563 | | | | 18,344,249 | |
Spirit AeroSystems Holdings Incorporated Class A † | | | | | | | | | | | 371,499 | | | | 16,115,627 | |
| | | | |
| | | | | | | | | | | | | | | 53,838,513 | |
| | | | | | | | | | | | | | | | |
| | | | |
| Airlines: 3.20% | | | | | | | | | | | | | | | | |
Delta Air Lines Incorporated | | | | | | | | | | | 385,083 | | | | 14,921,966 | |
Southwest Airlines Company | | | | | | | | | | | 378,408 | | | | 14,004,880 | |
| | | | |
| | | | | | | | | | | | | | | 28,926,846 | |
| | | | | | | | | | | | | | | | |
| | | | |
Information Technology: 22.01% | | | | | | | | | | | | | | | | |
| | | | |
| Electronic Equipment, Instruments & Components: 3.71% | | | | | | | | | | | | | | | | |
CDW Corporation of Delaware | | | | | | | | | | | 428,118 | | | | 18,379,106 | |
Jabil Circuit Incorporated | | | | | | | | | | | 746,515 | | | | 15,191,580 | |
| | | | |
| | | | | | | | | | | | | | | 33,570,686 | |
| | | | | | | | | | | | | | | | |
| | | | |
| Internet Software & Services: 1.93% | | | | | | | | | | | | | | | | |
Alphabet Incorporated Class C † | | | | | | | | | | | 22,656 | | | | 17,417,706 | |
| | | | | | | | | | | | | | | | |
| | | | |
| IT Services: 2.32% | | | | | | | | | | | | | | | | |
DST Systems Incorporated | | | | | | | | | | | 170,096 | | | | 20,977,940 | |
| | | | | | | | | | | | | | | | |
The accompanying notes are an integral part of these financial statements.
| | | | | | |
| Portfolio of investments—July 31, 2016 | | Wells Fargo Large Cap Core Fund | | | 13 | |
| | | | | | | | | | | | | | | | |
| Security name | | | | | | | | Shares | | | Value | |
| | | | |
| Semiconductors & Semiconductor Equipment: 7.43% | | | | | | | | | | | | | | | | |
Intel Corporation | | | | | | | | | | | 486,807 | | | $ | 16,970,092 | |
Linear Technology Corporation | | | | | | | | | | | 384,370 | | | | 23,058,356 | |
NVIDIA Corporation | | | | | | | | | | | 475,620 | | | | 27,157,900 | |
| | | | |
| | | | | | | | | | | | | | | 67,186,348 | |
| | | | | | | | | | | | | | | | |
| | | | |
| Software: 4.46% | | | | | | | | | | | | | | | | |
Electronic Arts Incorporated † | | | | | | | | | | | 237,479 | | | | 18,124,397 | |
Microsoft Corporation | | | | | | | | | | | 392,603 | | | | 22,252,738 | |
| | | | |
| | | | | | | | | | | | | | | 40,377,135 | |
| | | | | | | | | | | | | | | | |
| | | | |
| Technology Hardware, Storage & Peripherals: 2.16% | | | | | | | | | | | | | | | | |
Apple Incorporated | | | | | | | | | | | 187,855 | | | | 19,576,370 | |
| | | | | | | | | | | | | | | | |
| | | | |
Materials: 6.49% | | | | | | | | | | | | | | | | |
| | | | |
| Chemicals: 4.31% | | | | | | | | | | | | | | | | |
Air Products & Chemicals Incorporated | | | | | | | | | | | 134,433 | | | | 20,086,979 | |
The Dow Chemical Company | | | | | | | | | | | 352,641 | | | | 18,926,242 | |
| | | | |
| | | | | | | | | | | | | | | 39,013,221 | |
| | | | | | | | | | | | | | | | |
| | | | |
| Containers & Packaging: 2.18% | | | | | | | | | | | | | | | | |
Avery Dennison Corporation | | | | | | | | | | | 253,097 | | | | 19,713,725 | |
| | | | | | | | | | | | | | | | |
| | | | |
Telecommunication Services: 2.10% | | | | | | | | | | | | | | | | |
| | | | |
| Diversified Telecommunication Services: 2.10% | | | | | | | | | | | | | | | | |
AT&T Incorporated | | | | | | | | | | | 438,473 | | | | 18,981,496 | |
| | | | | | | | | | | | | | | | |
| | | | |
Total Common Stocks (Cost $788,715,495) | | | | | | | | | | | | | | | 902,430,126 | |
| | | | | | | | | | | | | | | | |
| | | | |
| | | Yield | | | | | | | | | | |
| Short-Term Investments: 0.46% | | | | | | | | | | | | | | | | |
| | | | |
| Investment Companies: 0.46% | | | | | | | | | | | | | | | | |
Wells Fargo Government Money Market Fund Select Class (l)(u) | | | 0.32 | % | | | | | | | 4,155,161 | | | | 4,155,161 | |
| | | | | | | | | | | | | | | | |
| | | | |
Total Short-Term Investments (Cost $4,155,161) | | | | | | | | | | | | | | | 4,155,161 | |
| | | | | | | | | | | | | | | | |
| | | | | | | | |
| Total investments in securities (Cost $792,870,656) * | | | 100.23 | % | | | 906,585,287 | |
Other assets and liabilities, net | | | (0.23 | ) | | | (2,069,166 | ) |
| | | | | | | | |
| Total net assets | | | 100.00 | % | | $ | 904,516,121 | |
| | | | | | | | |
| † | Non-income-earning security |
| (l) | The issuer of the security is an affiliated person of the Fund as defined in the Investment Company Act of 1940. |
| (u) | The rate represents the 7-day annualized yield at period end. |
| * | Cost for federal income tax purposes is $795,590,386 and unrealized gains (losses) consists of: |
| | | | |
Gross unrealized gains | | $ | 133,813,730 | |
Gross unrealized losses | | | (22,818,829 | ) |
| | | | |
Net unrealized gains | | $ | 110,994,901 | |
The accompanying notes are an integral part of these financial statements.
| | | | |
| 14 | | Wells Fargo Large Cap Core Fund | | Statement of assets and liabilities—July 31, 2016 |
| | | | |
| | | | |
| |
Assets | | | | |
Investments | | | | |
In unaffiliated securities, at value (cost $788,715,495) | | $ | 902,430,126 | |
In affiliated securities, at value (cost $4,155,161) | | | 4,155,161 | |
| | | | |
Total investments, at value (cost $792,870,656) | | | 906,585,287 | |
Receivable for investments sold | | | 217,826 | |
Receivable for Fund shares sold | | | 868,498 | |
Receivable for dividends | | | 888,871 | |
Prepaid expenses and other assets | | | 64,976 | |
| | | | |
Total assets | | | 908,625,458 | |
| | | | |
| |
Liabilities | | | | |
Payable for Fund shares redeemed | | | 3,336,916 | |
Management fee payable | | | 429,233 | |
Distribution fees payable | | | 46,286 | |
Administration fees payable | | | 129,240 | |
Accrued expenses and other liabilities | | | 167,662 | |
| | | | |
Total liabilities | | | 4,109,337 | |
| | | | |
Total net assets | | $ | 904,516,121 | |
| | | | |
| |
NET ASSETS CONSIST OF | | | | |
Paid-in capital | | $ | 837,093,485 | |
Undistributed net investment income | | | 5,083,557 | |
Accumulated net realized losses on investments | | | (51,375,552 | ) |
Net unrealized gains on investments | | | 113,714,631 | |
| | | | |
Total net assets | | $ | 904,516,121 | |
| | | | |
| |
COMPUTATION OF NET ASSET VALUE AND OFFERING PRICE PER SHARE | | | | |
Net assets – Class A | | $ | 359,971,350 | |
Shares outstanding – Class A1 | | | 23,788,449 | |
Net asset value per share – Class A | | | $15.13 | |
Maximum offering price per share – Class A2 | | | $16.05 | |
Net assets – Class C | | $ | 71,512,352 | |
Shares outstanding – Class C1 | | | 4,809,334 | |
Net asset value per share – Class C | | | $14.87 | |
Net assets – Class R | | $ | 26,231 | |
Shares outstanding – Class R1 | | | 1,729 | |
Net asset value per share – Class R | | | $15.17 | |
Net assets – Class R6 | | $ | 2,449,104 | |
Shares outstanding – Class R61 | | | 160,732 | |
Net asset value per share – Class R6 | | | $15.24 | |
Net assets – Administrator Class | | $ | 57,879,406 | |
Shares outstanding – Administrator Class1 | | | 3,813,535 | |
Net asset value per share – Administrator Class | | | $15.18 | |
Net assets – Institutional Class | | $ | 412,677,678 | |
Shares outstanding – Institutional Class1 | | | 27,094,649 | |
Net asset value per share – Institutional Class | | | $15.23 | |
| 1 | The Fund has an unlimited number of authorized shares. |
| 2 | Maximum offering price is computed as 100/94.25 of net asset value. On investments of $50,000 or more, the offering price is reduced. |
The accompanying notes are an integral part of these financial statements.
| | | | | | |
| Statement of operations—year ended July 31, 2016 | | Wells Fargo Large Cap Core Fund | | | 15 | |
| | | | |
| | | | |
| |
Investment income | | | | |
Dividends (net of foreign withholding taxes of $17,592) | | $ | 14,884,248 | |
Income from affiliated securities | | | 31,686 | |
Securities lending income, net | | | 5,707 | |
| | | | |
Total investment income | | | 14,921,641 | |
| | | | |
| |
Expenses | | | | |
Management fee | | | 5,401,830 | |
Administration fees | |
Class A | | | 679,455 | |
Class C | | | 144,245 | |
Class R | | | 45 | 1 |
Class R6 | | | 348 | 1 |
Administrator Class | | | 115,133 | |
Institutional Class | | | 308,634 | |
Investor Class | | | 199,867 | 2 |
Shareholder servicing fees | |
Class A | | | 806,522 | |
Class C | | | 171,720 | |
Class R | | | 53 | 1 |
Administrator Class | | | 220,465 | |
Investor Class | | | 150,680 | 2 |
Distribution fees | |
Class C | | | 515,159 | |
Class R | | | 53 | 1 |
Custody and accounting fees | | | 57,332 | |
Professional fees | | | 46,374 | |
Registration fees | | | 161,709 | |
Shareholder report expenses | | | 102,373 | |
Trustees’ fees and expenses | | | 24,325 | |
Interest expense | | | 3,257 | |
Other fees and expenses | | | 11,609 | |
| | | | |
Total expenses | | | 9,121,188 | |
Less: Fee waivers and/or expense reimbursements | | | (873,931 | ) |
| | | | |
Net expenses | | | 8,247,257 | |
| | | | |
Net investment income | | | 6,674,384 | |
| | | | |
| |
REALIZED AND UNREALIZED GAINS (LOSSES) ON INVESTMENTS | | | | |
Net realized losses on investments | | | (46,422,704 | ) |
Net change in unrealized gains (losses) on investments | | | 27,105,014 | |
| | | | |
Net realized and unrealized gains (losses) on investments | | | (19,317,690 | ) |
| | | | |
Net decrease in net assets resulting from operations | | $ | (12,643,306 | ) |
| | | | |
| 1 | For the period from September 30, 2015 (commencement of class operations) to July 31, 2016 |
| 2 | For the period from August 1, 2015 to October 23, 2015. Effective at the close of business on October 23, 2015, Investor Class shares were converted to Class A shares and are no longer offered by the Fund. |
The accompanying notes are an integral part of these financial statements.
| | | | |
| 16 | | Wells Fargo Large Cap Core Fund | | Statement of changes in net assets |
| | | | | | | | | | | | | | | | |
| | | Year ended
July 31, 2016 | | | Year ended
July 31, 2015 | |
| | | | |
Operations | | | | | | | | | | | | | | | | |
Net investment income | | | | | | $ | 6,674,384 | | | | | | | $ | 1,288,942 | |
Net realized gains (losses) on investments | | | | | | | (46,422,704 | ) | | | | | | | 23,591,082 | |
Net change in unrealized gains (losses) on investments | | | | | | | 27,105,014 | | | | | | | | 11,901,160 | |
| | | | |
Net increase (decrease) in net assets resulting from operations | | | | | | | (12,643,306 | ) | | | | | | | 36,781,184 | |
| | | | |
| | | | |
Distributions to shareholders from | | | | | | | | | | | | | | | | |
Net investment income | | | | | | | | | | | | | | | | |
Class A | | | | | | | (1,280,167 | ) | | | | | | | (183,035 | ) |
Class R | | | | | | | (136 | )1 | | | | | | | N/A | |
Class R6 | | | | | | | (184 | )1 | | | | | | | N/A | |
Administrator Class | | | | | | | (617,773 | ) | | | | | | | (122,314 | ) |
Institutional Class | | | | | | | (732,443 | ) | | | | | | | (94,797 | ) |
Investor Class | | | | | | | 0 | 2 | | | | | | | (308,152 | ) |
Net realized gains | | | | | | | | | | | | | | | | |
Class A | | | | | | | (3,571,260 | ) | | | | | | | 0 | |
Class C | | | | | | | (613,350 | ) | | | | | | | 0 | |
Class R | | | | | | | (222 | )1 | | | | | | | N/A | |
Class R6 | | | | | | | (222 | )1 | | | | | | | N/A | |
Administrator Class | | | | | | | (908,858 | ) | | | | | | | 0 | |
Institutional Class | | | | | | | (831,664 | ) | | | | | | | 0 | |
| | | | |
Total distributions to shareholders | | | | | | | (8,556,279 | ) | | | | | | | (708,298 | ) |
| | | | |
| | | | |
Capital share transactions | | | Shares | | | | | | | | Shares | | | | | |
Proceeds from shares sold | | | | | | | | | | | | | | | | |
Class A | | | 25,918,673 | | | | 399,364,361 | | | | 5,820,072 | | | | 89,378,472 | |
Class C | | | 2,898,348 | | | | 42,984,877 | | | | 3,114,897 | | | | 47,430,665 | |
Class R | | | 1,706 | 1 | | | 25,000 | 1 | | | N/A | | | | N/A | |
Class R6 | | | 171,642 | 1 | | | 2,413,783 | 1 | | | N/A | | | | N/A | |
Administrator Class | | | 4,428,450 | | | | 66,283,791 | | | | 5,744,427 | | | | 89,108,080 | |
Institutional Class | | | 25,684,762 | | | | 381,059,292 | | | | 3,978,349 | | | | 62,377,535 | |
Investor Class | | | 508,724 | 2 | | | 7,701,975 | 2 | | | 3,949,960 | | | | 61,216,814 | |
| | | | |
| | | | | | | 899,833,079 | | | | | | | | 349,511,566 | |
| | | | |
Reinvestment of distributions | | | | | | | | | | | | | | | | |
Class A | | | 311,622 | | | | 4,725,942 | | | | 11,869 | | | | 173,408 | |
Class C | | | 32,452 | | | | 481,595 | | | | 0 | | | | 0 | |
Class R | | | 23 | 1 | | | 358 | 1 | | | N/A | | | | N/A | |
Class R6 | | | 27 | 1 | | | 406 | 1 | | | N/A | | | | N/A | |
Administrator Class | | | 99,938 | | | | 1,525,664 | | | | 8,331 | | | | 122,042 | |
Institutional Class | | | 63,053 | | | | 966,052 | | | | 5,103 | | | | 74,803 | |
Investor Class | | | 0 | 2 | | | 0 | 2 | | | 20,620 | | | | 302,078 | |
| | | | |
| | | | | | | 7,700,017 | | | | | | | | 672,331 | |
| | | | |
Payment for shares redeemed | | | | | | | | | | | | | | | | |
Class A | | | (8,578,334 | ) | | | (125,072,291 | ) | | | (1,561,861 | ) | | | (24,219,042 | ) |
Class C | | | (1,521,640 | ) | | | (21,894,194 | ) | | | (323,242 | ) | | | (4,921,172 | ) |
Class R6 | | | (10,937 | )1 | | | (158,688 | )1 | | | N/A | | | | N/A | |
Administrator Class | | | (5,987,164 | ) | | | (87,751,181 | ) | | | (958,200 | ) | | | (14,722,079 | ) |
Institutional Class | | | (9,789,487 | ) | | | (144,146,531 | ) | | | (411,020 | ) | | | (6,506,688 | ) |
Investor Class | | | (18,604,700 | )2 | | | (290,535,816 | )2 | | | (1,941,756 | ) | | | (29,909,371 | ) |
| | | | |
| | | | | | | (669,558,701 | ) | | | | | | | (80,278,352 | ) |
| | | | |
Net asset value of shares issued in acquisition | | | | | | | | | | | | | | | | |
Institutional Class | | | 7,161,519 | | | | 103,887,609 | | | | 0 | | | | 0 | |
| | | | |
Net increase in net assets resulting from capital share transactions | | | | | | | 341,862,004 | | | | | | | | 269,905,545 | |
| | | | |
Total increase in net assets | | | | | | | 320,662,419 | | | | | | | | 305,978,431 | |
| | | | |
| | | | |
Net assets | | | | | | | | | | | | | | | | |
Beginning of period | | | | | | | 583,853,702 | | | | | | | | 277,875,271 | |
| | | | |
End of period | | | | | | $ | 904,516,121 | | | | | | | $ | 583,853,702 | |
| | | | |
Undistributed net investment income | | | | | | $ | 5,083,557 | | | | | | | $ | 1,025,908 | |
| | | | |
| 1 | For the period from September 30, 2015 (commencement of class operations) to July 31, 2016 |
| 2 | For the period from August 1, 2015 to October 23, 2015. Effective at the close of business on October 23, 2015, Investor Class shares were converted to Class A shares and are no longer offered by the Fund. |
The accompanying notes are an integral part of these financial statements.
| | | | | | |
| Financial highlights | | Wells Fargo Large Cap Core Fund | | | 17 | |
(For a share outstanding throughout each period)
| | | | | | | | | | | | | | | | | | | | |
| | | Year ended July 31 | |
| CLASS A | | 2016 | | | 2015 | | | 2014 | | | 2013 | | | 2012 | |
Net asset value, beginning of period | | | $15.81 | | | | $14.30 | | | | $12.13 | | | | $9.50 | | | | $8.75 | |
Net investment income | | | 0.10 | | | | 0.06 | | | | 0.06 | 1 | | | 0.07 | | | | 0.06 | |
Net realized and unrealized gains (losses) on investments | | | (0.60 | ) | | | 1.50 | | | | 2.20 | | | | 2.64 | | | | 0.74 | |
| | | | | | | | | | | | | | | | | | | | |
Total from investment operations | | | (0.50 | ) | | | 1.56 | | | | 2.26 | | | | 2.71 | | | | 0.80 | |
Distributions to shareholders from | | | | | | | | | | | | | | | | | | | | |
Net investment income | | | (0.05 | ) | | | (0.05 | ) | | | (0.09 | ) | | | (0.08 | ) | | | (0.05 | ) |
Net realized gains | | | (0.13 | ) | | | 0.00 | | | | 0.00 | | | | 0.00 | | | | 0.00 | |
| | | | | | | | | | | | | | | | | | | | |
Total distributions to shareholders | | | (0.18 | ) | | | (0.05 | ) | | | (0.09 | ) | | | (0.08 | ) | | | (0.05 | ) |
Net asset value, end of period | | | $15.13 | | | | $15.81 | | | | $14.30 | | | | $12.13 | | | | $9.50 | |
Total return2 | | | (3.18 | )% | | | 10.99 | % | | | 18.58 | % | | | 28.76 | % | | | 9.27 | % |
Ratios to average net assets (annualized) | | | | | | | | | | | | | | | | | | | | |
Gross expenses | | | 1.20 | % | | | 1.26 | % | | | 1.29 | % | | | 1.33 | % | | | 1.37 | % |
Net expenses | | | 1.14 | % | | | 1.14 | % | | | 1.14 | % | | | 1.14 | % | | | 1.14 | % |
Net investment income | | | 0.80 | % | | | 0.35 | % | | | 0.47 | % | | | 0.75 | % | | | 0.71 | % |
Supplemental data | | | | | | | | | | | | | | | | | | | | |
Portfolio turnover rate | | | 51 | % | | | 44 | % | | | 61 | % | | | 67 | % | | | 41 | % |
Net assets, end of period (000s omitted) | | | $359,971 | | | | $97,041 | | | | $26,685 | | | | $15,267 | | | | $8,277 | |
| 1 | Calculated based upon average shares outstanding |
| 2 | Total return calculations do not include any sales charges. |
The accompanying notes are an integral part of these financial statements.
| | | | |
| 18 | | Wells Fargo Large Cap Core Fund | | Financial highlights |
(For a share outstanding throughout each period)
| | | | | | | | | | | | | | | | | | | | |
| | | Year ended July 31 | |
| CLASS C | | 2016 | | | 2015 | | | 2014 | | | 2013 | | | 2012 | |
Net asset value, beginning of period | | | $15.61 | | | | $14.17 | | | | $12.05 | | | | $9.45 | | | | $8.71 | |
Net investment income (loss) | | | 0.00 | 1 | | | (0.06 | )1 | | | (0.01 | ) | | | (0.00 | )2 | | | (0.00 | )2 |
Net realized and unrealized gains (losses) on investments | | | (0.61 | ) | | | 1.50 | | | | 2.15 | | | | 2.62 | | | | 0.74 | |
| | | | | | | | | | | | | | | | | | | | |
Total from investment operations | | | (0.61 | ) | | | 1.44 | | | | 2.14 | | | | 2.62 | | | | 0.74 | |
Distributions to shareholders from | | | | | | | | | | | | | | | | | | | | |
Net investment income | | | 0.00 | | | | 0.00 | | | | (0.02 | ) | | | (0.02 | ) | | | 0.00 | |
Net realized gains | | | (0.13 | ) | | | 0.00 | | | | 0.00 | | | | 0.00 | | | | 0.00 | |
| | | | | | | | | | | | | | | | | | | | |
Total distributions to shareholders | | | (0.13 | ) | | | 0.00 | | | | (0.02 | ) | | | (0.02 | ) | | | 0.00 | |
Net asset value, end of period | | | $14.87 | | | | $15.61 | | | | $14.17 | | | | $12.05 | | | | $9.45 | |
Total return3 | | | (3.90 | )% | | | 10.16 | % | | | 17.73 | % | | | 27.82 | % | | | 8.50 | % |
Ratios to average net assets (annualized) | | | | | | | | | | | | | | | | | | | | |
Gross expenses | | | 1.95 | % | | | 2.01 | % | | | 2.04 | % | | | 2.08 | % | | | 2.12 | % |
Net expenses | | | 1.89 | % | | | 1.89 | % | | | 1.89 | % | | | 1.89 | % | | | 1.89 | % |
Net investment income (loss) | | | 0.02 | % | | | (0.38 | )% | | | (0.30 | )% | | | (0.01 | )% | | | (0.04 | )% |
Supplemental data | | | | | | | | | | | | | | | | | | | | |
Portfolio turnover rate | | | 51 | % | | | 44 | % | | | 61 | % | | | 67 | % | | | 41 | % |
Net assets, end of period (000s omitted) | | | $71,512 | | | | $53,076 | | | | $8,624 | | | | $3,786 | | | | $2,041 | |
| 1 | Calculated based upon average shares outstanding |
| 2 | Amount is less than $0.005. |
| 3 | Total return calculations do not include any sales charges. |
The accompanying notes are an integral part of these financial statements.
| | | | | | |
| Financial highlights | | Wells Fargo Large Cap Core Fund | | | 19 | |
(For a share outstanding throughout the period)
| | | | |
| CLASS R | | Year ended July 31 20161 | |
Net asset value, beginning of period | | | $14.66 | |
Net investment income | | | 0.06 | |
Net realized and unrealized gains (losses) on investments | | | 0.66 | |
| | | | |
Total from investment operations | | | 0.72 | |
Distributions to shareholders from | | | | |
Net investment income | | | (0.08 | ) |
Net realized gains | | | (0.13 | ) |
| | | | |
Total distributions to shareholders | | | (0.21 | ) |
Net asset value, end of period | | | $15.17 | |
Total return2 | | | 4.90 | % |
Ratios to average net assets (annualized) | | | | |
Gross expenses | | | 1.46 | % |
Net expenses | | | 1.39 | % |
Net investment income | | | 0.52 | % |
Supplemental data | | | | |
Portfolio turnover rate | | | 51 | % |
Net assets, end of period (000s omitted) | | | $26 | |
| 1 | For the period from September 30, 2015 (commencement of class operations) to July 31, 2016 |
| 2 | Returns for periods of less than one year are not annualized. |
The accompanying notes are an integral part of these financial statements.
| | | | |
| 20 | | Wells Fargo Large Cap Core Fund | | Financial highlights |
(For a share outstanding throughout the period)
| | | | |
| CLASS R6 | | Year ended July 31 20161 | |
Net asset value, beginning of period | | | $14.66 | |
Net investment income | | | 0.20 | |
Net realized and unrealized gains (losses) on investments | | | 0.62 | |
| | | | |
Total from investment operations | | | 0.82 | |
Distributions to shareholders from | | | | |
Net investment income | | | (0.11 | ) |
Net realized gains | | | (0.13 | ) |
| | | | |
Total distributions to shareholders | | | (0.24 | ) |
Net asset value, end of period | | | $15.24 | |
Total return2 | | | 5.57 | % |
Ratios to average net assets (annualized) | | | | |
Gross expenses | | | 0.77 | % |
Net expenses | | | 0.68 | % |
Net investment income | | | 1.31 | % |
Supplemental data | | | | |
Portfolio turnover rate | | | 51 | % |
Net assets, end of period (000s omitted) | | | $2,449 | |
| 1 | For the period from September 30, 2015 (commencement of class operations) to July 31, 2016 |
| 2 | Returns for periods of less than one year are not annualized. |
The accompanying notes are an integral part of these financial statements.
| | | | | | |
| Financial highlights | | Wells Fargo Large Cap Core Fund | | | 21 | |
(For a share outstanding throughout each period)
| | | | | | | | | | | | | | | | | | | | |
| | | Year ended July 31 | |
| ADMINISTRATOR CLASS | | 2016 | | | 2015 | | | 2014 | | | 2013 | | | 2012 | |
Net asset value, beginning of period | | | $15.87 | | | | $14.34 | | | | $12.16 | | | | $9.52 | | | | $8.77 | |
Net investment income | | | 0.15 | | | | 0.10 | | | | 0.09 | | | | 0.10 | | | | 0.09 | |
Net realized and unrealized gains (losses) on investments | | | (0.62 | ) | | | 1.50 | | | | 2.20 | | | | 2.64 | | | | 0.74 | |
| | | | | | | | | | | | | | | | | | | | |
Total from investment operations | | | (0.47 | ) | | | 1.60 | | | | 2.29 | | | | 2.74 | | | | 0.83 | |
Distributions to shareholders from | | | | | | | | | | | | | | | | | | | | |
Net investment income | | | (0.09 | ) | | | (0.07 | ) | | | (0.11 | ) | | | (0.10 | ) | | | (0.08 | ) |
Net realized gains | | | (0.13 | ) | | | 0.00 | | | | 0.00 | | | | 0.00 | | | | 0.00 | |
| | | | | | | | | | | | | | | | | | | | |
Total distributions to shareholders | | | (0.22 | ) | | | (0.07 | ) | | | (0.11 | ) | | | (0.10 | ) | | | (0.08 | ) |
Net asset value, end of period | | | $15.18 | | | | $15.87 | | | | $14.34 | | | | $12.16 | | | | $9.52 | |
Total return | | | (2.98 | )% | | | 11.28 | % | | | 18.83 | % | | | 29.12 | % | | | 9.61 | % |
Ratios to average net assets (annualized) | | | | | | | | | | | | | | | | | | | | |
Gross expenses | | | 1.12 | % | | | 1.11 | % | | | 1.11 | % | | | 1.14 | % | | | 1.16 | % |
Net expenses | | | 0.96 | % | | | 0.90 | % | | | 0.90 | % | | | 0.89 | % | | | 0.87 | % |
Net investment income | | | 0.95 | % | | | 0.61 | % | | | 0.63 | % | | | 1.00 | % | | | 0.97 | % |
Supplemental data | | | | | | | | | | | | | | | | | | | | |
Portfolio turnover rate | | | 51 | % | | | 44 | % | | | 61 | % | | | 67 | % | | | 41 | % |
Net assets, end of period (000s omitted) | | | $57,879 | | | | $83,692 | | | | $6,849 | | | | $1,192 | | | | $522 | |
The accompanying notes are an integral part of these financial statements.
| | | | |
| 22 | | Wells Fargo Large Cap Core Fund | | Financial highlights |
(For a share outstanding throughout each period)
| | | | | | | | | | | | | | | | | | | | |
| | | Year ended July 31 | |
| INSTITUTIONAL CLASS | | 2016 | | | 2015 | | | 2014 | | | 2013 | | | 2012 | |
Net asset value, beginning of period | | | $15.91 | | | | $14.35 | | | | $12.16 | | | | $9.52 | | | | $8.77 | |
Net investment income | | | 0.18 | 1 | | | 0.14 | 1 | | | 0.11 | 1 | | | 0.13 | 1 | | | 0.12 | |
Net realized and unrealized gains (losses) on investments | | | (0.62 | ) | | | 1.50 | | | | 2.21 | | | | 2.63 | | | | 0.73 | |
| | | | | | | | | | | | | | | | | | | | |
Total from investment operations | | | (0.44 | ) | | | 1.64 | | | | 2.32 | | | | 2.76 | | | | 0.85 | |
Distributions to shareholders from | | | | | | | | | | | | | | | | | | | | |
Net investment income | | | (0.11 | ) | | | (0.08 | ) | | | (0.13 | ) | | | (0.12 | ) | | | (0.10 | ) |
Net realized gains | | | (0.13 | ) | | | 0.00 | | | | 0.00 | | | | 0.00 | | | | 0.00 | |
| | | | | | | | | | | | | | | | | | | | |
Total distributions to shareholders | | | (0.24 | ) | | | (0.08 | ) | | | (0.13 | ) | | | (0.12 | ) | | | (0.10 | ) |
Net asset value, end of period | | | $15.23 | | | | $15.91 | | | | $14.35 | | | | $12.16 | | | | $9.52 | |
Total return | | | (2.75 | )% | | | 11.51 | % | | | 19.21 | % | | | 29.38 | % | | | 9.88 | % |
Ratios to average net assets (annualized) | | | | | | | | | | | | | | | | | | | | |
Gross expenses | | | 0.87 | % | | | 0.84 | % | | | 0.85 | % | | | 0.90 | % | | | 0.94 | % |
Net expenses | | | 0.70 | % | | | 0.66 | % | | | 0.66 | % | | | 0.66 | % | | | 0.66 | % |
Net investment income | | | 1.22 | % | | | 0.86 | % | | | 0.83 | % | | | 1.24 | % | | | 1.19 | % |
Supplemental data | | | | | | | | | | | | | | | | | | | | |
Portfolio turnover rate | | | 51 | % | | | 44 | % | | | 61 | % | | | 67 | % | | | 41 | % |
Net assets, end of period (000s omitted) | | | $412,678 | | | | $63,235 | | | | $5,775 | | | | $537 | | | | $480 | |
| 1 | Calculated based upon average shares outstanding |
The accompanying notes are an integral part of these financial statements.
| | | | | | |
| Notes to financial statements | | Wells Fargo Large Cap Core Fund | | | 23 | |
1. ORGANIZATION
Wells Fargo Funds Trust (the “Trust”), a Delaware statutory trust organized on March 10, 1999, is an open-end management investment company registered under the Investment Company Act of 1940, as amended (the “1940 Act”). As an investment company, the Trust follows the accounting and reporting guidance in Financial Accounting Standards Board (“FASB”) Accounting Standards Codification Topic 946, Financial Services – Investment Companies. These financial statements report on the Wells Fargo Large Cap Core Fund (the “Fund”) which is a diversified series of the Trust.
Effective at the close of business on October 23, 2015, Investor Class shares became Class A shares in a tax-free conversion. Shareholders of Investor Class received Class A shares at a value equal to the value of their Investor Class shares immediately prior to the conversion. Investor Class shares are no longer offered by the Fund.
2. SIGNIFICANT ACCOUNTING POLICIES
The following significant accounting policies, which are consistently followed in the preparation of the financial statements of the Fund, are in conformity with U.S. generally accepted accounting principles which require management to make estimates and assumptions that affect the reported amounts of assets and liabilities, disclosure of contingent assets and liabilities at the date of the financial statements, and the reported amounts of revenues and expenses during the reporting period. Actual results could differ from those estimates.
Securities valuation
All investments are valued each business day as of the close of regular trading on the New York Stock Exchange (generally 4 p.m. Eastern Time), although the Fund may deviate from this calculation time under unusual or unexpected circumstances.
Equity securities that are listed on a foreign or domestic exchange or market are valued at the official closing price or, if none, the last sales price. If no sale occurs on the principal exchange or market that day, the prior day’s price will be deemed “stale” and a fair value price will be determined in accordance with the Fund’s Valuation Procedures.
Investments in registered open-end investment companies are valued at net asset value. Interests in non-registered investment vehicles that are redeemable at net asset value are fair valued normally at net asset value.
Investments which are not valued using any of the methods discussed above are valued at their fair value, as determined in good faith by the Board of Trustees of the Fund. The Board of Trustees has established a Valuation Committee comprised of the Trustees and has delegated to it the authority to take any actions regarding the valuation of portfolio securities that the Valuation Committee deems necessary or appropriate, including determining the fair value of portfolio securities, unless the determination has been delegated to the Management Valuation Team of Wells Fargo Funds Management, LLC (“Funds Management”). The Board of Trustees retains the authority to make or ratify any valuation decisions or approve any changes to the Valuation Procedures as it deems appropriate. On a quarterly basis, the Board of Trustees receives reports on any valuation actions taken by the Valuation Committee or the Management Valuation Team which may include items for ratification.
Valuations of fair valued securities are compared to the next actual sales price when available, or other appropriate market values, to assess the continued appropriateness of the fair valuation methodologies used. These securities are fair valued on a day-to-day basis, taking into consideration changes to appropriate market information and any significant changes to the inputs considered in the valuation process until there is a readily available price provided on an exchange or by an independent pricing service. Valuations received from an independent pricing service or independent broker-dealer quotes are periodically validated by comparisons to most recent trades and valuations provided by other independent pricing services in addition to the review of prices by the manager and/or subadviser. Unobservable inputs used in determining fair valuations are identified based on the type of security, taking into consideration factors utilized by market participants in valuing the investment, knowledge about the issuer and the current market environment.
Security loans
The Fund may lend its securities from time to time in order to earn additional income in the form of fees or interest on securities received as collateral or the investment of any cash received as collateral. The Fund continues to receive interest or dividends on the securities loaned. The Fund receives collateral in the form of cash or securities with a value at least equal to the value of the securities on loan. The value of the loaned securities is determined at the close of each business day and any additional required collateral is delivered to the Fund on the next business day. In a securities lending transaction, the net asset value of the Fund will be affected by an increase or decrease in the value of the securities loaned and by an increase or decrease in the value of the instrument in which collateral is invested. The amount of securities lending activity undertaken by the Fund fluctuates from time to time. In the event of default or bankruptcy by the
| | | | |
| 24 | | Wells Fargo Large Cap Core Fund | | Notes to financial statements |
borrower, the Fund may be prevented from recovering the loaned securities or gaining access to the collateral or may experience delays or costs in doing so. In addition, the investment of any cash collateral received may lose all or part of its value. The Fund has the right under the lending agreement to recover the securities from the borrower on demand.
The Fund lends its securities through an unaffiliated securities lending agent. Cash collateral received in connection with its securities lending transactions is invested in Securities Lending Cash Investments, LLC (the “Securities Lending Fund”). The Securities Lending Fund is exempt from registration under Section 3(c)(7) of the 1940 Act and is managed by Funds Management and is subadvised by Wells Capital Management Incorporated (“WellsCap”), an affiliate of Funds Management and an indirect wholly owned subsidiary of Wells Fargo & Company (“Wells Fargo”). Funds Management receives an advisory fee starting at 0.05% and declining to 0.01% as the average daily net assets of the Securities Lending Fund increase. All of the fees received by Funds Management are paid to WellsCap for its services as subadviser. The Securities Lending Fund seeks to provide a positive return compared to the daily Fed Funds Open rate by investing in high-quality, U.S. dollar-denominated short-term money market instruments. Securities Lending Fund investments are fair valued based upon the amortized cost valuation technique. Income earned from investment in the Securities Lending Fund is included in securities lending income on the Statement of Operations.
Security transactions and income recognition
Securities transactions are recorded on a trade date basis. Realized gains or losses are recorded on the basis of identified cost.
Dividend income is recognized on the ex-dividend date. Dividend income is recorded net of foreign taxes withheld where recovery of such taxes is not assured.
Distributions to shareholders
Distributions to shareholders from net investment income and net realized gains, if any, are recorded on the ex-dividend date. Such distributions are determined in conformity with federal income tax regulations, which may differ in amount or character from net investment income and realized gains recognized for purposes of U.S. generally accepted accounting principles.
Federal and other taxes
The Fund intends to continue to qualify as a regulated investment company by distributing substantially all of its investment company taxable income and any net realized capital gains (after reduction for capital loss carryforwards) sufficient to relieve it from all, or substantially all, federal income taxes. Accordingly, no provision for federal income taxes was required.
The Fund’s income and federal excise tax returns and all financial records supporting those returns for the prior three fiscal years are subject to examination by the federal and Delaware revenue authorities. Management has analyzed the Fund’s tax positions taken on federal, state, and foreign tax returns for all open tax years and does not believe that there are any uncertain tax positions that require recognition of a tax liability.
Reclassifications are made to the Fund’s capital accounts for permanent tax differences to reflect income and gains available for distribution (or available capital loss carryforwards) under federal income tax regulations. U.S. generally accepted accounting principles require that certain components of net assets be adjusted to reflect permanent differences between financial and tax reporting. These reclassifications have no effect on net assets or net asset values per share. At July 31, 2016, as a result of permanent book-to-tax differences, the following reclassification adjustments were made on the Statement of Assets and Liabilities:
| | |
Undistributed net
investment income | | Accumulated net
realized losses
on investments |
| $70 | | $(70) |
Capital loss carryforwards that do not expire are required to be utilized prior to capital loss carryforwards that expire. As of July 31, 2016, capital loss carryforwards available to offset future net realized capital gains were as follows through the indicated expiration dates:
| | | | |
| | | No expiration |
| 2017 | | Short-term | | Long-term |
| $(309,497) | | $(27,516,712) | | $(20,816,155) |
| | | | | | |
| Notes to financial statements | | Wells Fargo Large Cap Core Fund | | | 25 | |
Class allocations
The separate classes of shares offered by the Fund differ principally in applicable sales charges, distribution, shareholder servicing, and administration fees. Class specific expenses are charged directly to that share class. Investment income, common expenses, and realized and unrealized gains (losses) on investments are allocated daily to each class of shares based on the relative proportion of net assets of each class.
3. FAIR VALUATION MEASUREMENTS
Fair value measurements of investments are determined within a framework that has established a fair value hierarchy based upon the various data inputs utilized in determining the value of the Fund’s investments. The three-level hierarchy gives the highest priority to unadjusted quoted prices in active markets for identical assets or liabilities (Level 1) and the lowest priority to significant unobservable inputs (Level 3). The Fund’s investments are classified within the fair value hierarchy based on the lowest level of input that is significant to the fair value measurement. The inputs are summarized into three broad levels as follows:
| n | | Level 1 – quoted prices in active markets for identical securities |
| n | | Level 2 – other significant observable inputs (including quoted prices for similar securities, interest rates, prepayment speeds, credit risk, use of amortized cost, etc.) |
| n | | Level 3 – significant unobservable inputs (including the Fund’s own assumptions in determining the fair value of investments) |
The inputs or methodologies used for valuing investments in securities are not necessarily an indication of the risk associated with investing in those securities.
The following is a summary of the inputs used in valuing the Fund’s assets and liabilities as of July 31, 2016:
| | | | | | | | | | | | | | | | |
| | | Quoted prices (Level 1) | | | Other significant observable inputs (Level 2) | | | Significant unobservable inputs (Level 3) | | | Total | |
Assets | | | | | | | | | | | | | | | | |
Investments in: | | | | | | | | | | | | | | | | |
| | | | |
Common stocks | | | | | | | | | | | | | | | | |
Consumer discretionary | | $ | 144,799,739 | | | $ | 0 | | | $ | 0 | | | $ | 144,799,739 | |
Consumer staples | | | 74,316,147 | | | | 0 | | | | 0 | | | | 74,316,147 | |
Energy | | | 44,818,647 | | | | 0 | | | | 0 | | | | 44,818,647 | |
Financials | | | 116,732,470 | | | | 0 | | | | 0 | | | | 116,732,470 | |
Health care | | | 162,183,137 | | | | 0 | | | | 0 | | | | 162,183,137 | |
Industrials | | | 82,765,359 | | | | 0 | | | | 0 | | | | 82,765,359 | |
Information technology | | | 199,106,185 | | | | 0 | | | | 0 | | | | 199,106,185 | |
Materials | | | 58,726,946 | | | | 0 | | | | 0 | | | | 58,726,946 | |
Telecommunication Services | | | 18,981,496 | | | | 0 | | | | 0 | | | | 18,981,496 | |
| | | | |
Short-term investments | | | | | | | | | | | | | | | | |
Investment companies | | | 4,155,161 | | | | 0 | | | | 0 | | | | 4,155,161 | |
Total assets | | $ | 906,585,287 | | | $ | 0 | | | $ | 0 | | | $ | 906,585,287 | |
The Fund recognizes transfers between levels within the fair value hierarchy at the end of the reporting period. At July 31, 2016, the Fund did not have any transfers into/out of Level 1, Level 2, or Level 3.
4. TRANSACTIONS WITH AFFILIATES
Management fee
Funds Management, an indirect wholly owned subsidiary of Wells Fargo, is the manager of the Fund and provides advisory and fund-level administrative services under an investment management agreement. Under the investment management agreement, Funds Management is responsible for, among other services, implementing the investment objectives and strategies of the Fund, supervising the subadviser, providing fund-level administrative services in connection with the Fund’s operations, and providing any other fund-level administrative services reasonably necessary for the operation of the Fund. As compensation for its services under the investment management agreement, Funds
| | | | |
| 26 | | Wells Fargo Large Cap Core Fund | | Notes to financial statements |
Management is entitled to receive an annual management fee starting at 0.70% and declining to 0.505% as the average daily net assets of the Fund increase. For the year ended July 31, 2016, the management fee was equivalent to an annual rate of 0.69% of the Fund’s average daily net assets.
Funds Management has retained the services of a subadviser to provide daily portfolio management to the Fund. The fee for subadvisory services is borne by Funds Management. Golden Capital Management, LLC, an affiliate of Funds Management, is the subadviser to the Fund and is entitled to receive a fee from Funds Management at an annual rate starting at 0.35% and declining to 0.30% as the average daily net assets of the Fund increase.
Administration fees
Under a class-level administration agreement, Funds Management provides class-level administrative services to the Fund, which includes paying fees and expenses for services provided by the transfer agent, sub-transfer agents, omnibus account servicers and record-keepers. As compensation for its services under the class-level administration agreement, Funds Management receives an annual fee which is calculated based on the average daily net assets of each class as follows:
| | | | |
| | | Class-level administration fee | |
Class A, Class C, Class R | | | 0.21 | % |
Class R6 | | | 0.03 | |
Administrator Class, Institutional Class | | | 0.13 | |
Investor Class | | | 0.32 | |
Funds Management has contractually waived and/or reimbursed management and administration fees to the extent necessary to maintain certain net operating expense ratios for the Fund. Waiver of fees and/or reimbursement of expenses by Funds Management were made first from fund level expenses on a proportionate basis and then from class specific expenses. Funds Management has committed through November 30, 2016 to waive fees and/or reimburse expenses to the extent necessary to cap the Fund’s expenses at 1.14% for Class A shares, 1.89% for Class C shares, 1.39% for Class R shares, 0.68% for Class R6 shares, 1.00% for Administrator Class shares, and 0.70% for Institutional Class shares. After this time, the cap may be increased or the commitment to maintain the cap may be terminated only with the approval of the Board of Trustees. Prior to December 1, 2015, the Fund’s expenses were capped at 0.90% for Administrator Class shares and 0.66% for Institutional Class shares.
Distribution fees
The Trust has adopted a distribution plan for Class C and Class R shares of the Fund pursuant to Rule 12b-1 under the 1940 Act. Distribution fees are charged to Class C and Class R shares and paid to Wells Fargo Funds Distributor, LLC (“Funds Distributor”), the principal underwriter, at an annual rate of 0.75% of the average daily net assets of Class C shares and 0.25% of the average daily net assets of Class R shares.
In addition, Funds Distributor is entitled to receive the front-end sales charge from the purchase of Class A shares and a contingent deferred sales charge on the redemption of certain Class A shares. Funds Distributor is also entitled to receive the contingent deferred sales charges from redemptions of Class C shares. For the year ended July 31, 2016, Funds Distributor received $67,985 from the sale of Class A shares and $466 and $855 in contingent deferred sales charges from redemptions of Class A and Class C shares, respectively
Shareholder servicing fees
The Trust has entered into contracts with one or more shareholder servicing agents, whereby Class A, Class C, Class R, Administrator Class, and Investor Class of the Fund are charged a fee at an annual rate of 0.25% of the average daily net assets of each respective class.
A portion of these total shareholder servicing fees were paid to affiliates of Wells Fargo.
5. INVESTMENT PORTFOLIO TRANSACTIONS
Purchases and sales of investments, excluding U.S. government obligations (if any) and short-term securities, for the year ended July 31, 2016 were $645,116,810 and $396,987,710, respectively.
The Fund may purchase or sell investment securities to other Wells Fargo funds under procedures adopted by the Board of Trustees. The procedures have been designed to ensure that these interfund transactions, which generally do not incur broker commissions, are effected at current market prices. Interfund trades are included within the respective purchases and sales amounts shown.
6. ACQUISITION
After the close of business on May 20, 2016, the Fund acquired the net assets of Golden Large Cap Core Fund. The purpose of the transaction was to combine two funds with similar investment objectives and strategies. Shareholders holding
| | | | | | |
| Notes to financial statements | | Wells Fargo Large Cap Core Fund | | | 27 | |
Institutional Class shares of Golden Large Cap Core Fund received Institutional Class shares of the Fund in the reorganization. The acquisition was accomplished by a tax-free exchange of all of the Institutional Class shares of Golden Large Cap Core Fund for 7,161,519 Institutional Class shares of the Fund valued at $103,887,609 at an exchange ratio of 0.90. The investment portfolio of Golden Large Cap Core Fund with a fair value of $101,587,245, identified cost of $91,037,630 and unrealized gains of $10,549,615 at May 20, 2016 were the principal assets acquired by the Fund. The aggregate net assets of Golden Large Cap Core Fund and the Fund immediately prior to the acquisition were $103,887,609 and $865,210,261, respectively. The aggregate net assets of the Fund immediately after the acquisition were $969,097,870. For financial reporting purposes, assets received and shares issued by the Fund were recorded at fair value; however, the cost basis of the investments received from Golden Large Cap Core Fund was carried forward to align ongoing reporting of the Fund’s realized and unrealized gains and losses with amounts distributable to shareholders for tax purposes.
Assuming the acquisition had been completed August 1, 2015, the beginning of the annual reporting period for the Fund, the pro forma results of operations for the year ended July 31, 2016 would have been:
| | | | |
Net investment income | | $ | 7,679,055 | |
Net realized and unrealized gains (losses) on investments | | $ | (9,371,087 | ) |
Net decrease in net assets resulting from operations | | $ | (1,692,032 | ) |
Because the combined investment portfolios have been managed as a single integrated portfolio since the acquisition was completed, it is not practicable to separate the amounts of revenue and earnings of Golden Large Cap Core Fund that have been included in the Fund’s Statement of Operations since May 21, 2016.
7. BANK BORROWINGS
The Trust (excluding the money market funds and certain other funds) and Wells Fargo Variable Trust are parties to a $200,000,000 revolving credit agreement whereby the Fund is permitted to use bank borrowings for temporary or emergency purposes, such as to fund shareholder redemption requests. Interest under the credit agreement is charged to the Fund based on a borrowing rate equal to the higher of the Federal Funds rate in effect on that day plus 1.25% or the overnight LIBOR rate in effect on that day plus 1.25%. In addition, an annual commitment fee equal to 0.20% of the unused balance is allocated to each participating fund. Prior to September 1, 2015, the revolving credit agreement amount was $150,000,000 and the annual commitment fee was equal to 0.10% of the unused balance which was allocated to each participating fund.
During the year ended July 31, 2016, the Fund had average borrowings outstanding of $196,205 at an average rate of 1.66% and paid interest in the amount of $3,257.
8. DISTRIBUTIONS TO SHAREHOLDERS
The tax character of distributions paid during the years ended July 31, 2016 and July 31, 2015 were as follows:
| | | | | | | | |
| | | Year ended July 31 | |
| | | 2016 | | | 2015 | |
Ordinary income | | $ | 2,630,814 | | | $ | 708,298 | |
Long-term capital gain | | | 5,925,465 | | | | 0 | |
As of July 31, 2016, the components of distributable earnings on a tax basis were as follows:
| | | | |
Undistributed ordinary income | | Unrealized gains | | Capital loss carryforward |
| $5,070,130 | | $110,994,901 | | $(48,642,364) |
9. INDEMNIFICATION
Under the Trust’s organizational documents, the officers and Trustees have been granted certain indemnification rights against certain liabilities that may arise out of performance of their duties to the Trust. Additionally, in the normal course of business, the Trust may enter into contracts with service providers that contain a variety of indemnification clauses. The Trust’s maximum exposure under these arrangements is dependent on future claims that may be made against the Fund and, therefore, cannot be estimated.
| | | | |
| 28 | | Wells Fargo Large Cap Core Fund | | Report of independent registered public accounting firm |
BOARD OF TRUSTEES AND SHAREHOLDERS OF WELLS FARGO FUNDS TRUST:
We have audited the accompanying statements of assets and liabilities, including the portfolio of investments, of the Wells Fargo Large Cap Core Fund (formerly known as Wells Fargo Advantage Large Cap Core Fund) (the “Fund”), one of the funds constituting the Wells Fargo Funds Trust, as of July 31, 2016, and the related statement of operations for the year then ended, the statements of changes in net assets for each of the years in the two-year period then ended, and the financial highlights for each of the years or periods in the five-year period then ended. These financial statements and financial highlights are the responsibility of the Fund’s management. Our responsibility is to express an opinion on these financial statements and financial highlights based on our audits.
We conducted our audits in accordance with the standards of the Public Company Accounting Oversight Board (United States). Those standards require that we plan and perform the audit to obtain reasonable assurance about whether the financial statements and financial highlights are free of material misstatement. An audit includes examining, on a test basis, evidence supporting the amounts and disclosures in the financial statements. Our procedures included confirmation of securities owned as of July 31, 2016, by correspondence with the custodian, or by other appropriate auditing procedures. An audit also includes assessing the accounting principles used and significant estimates made by management, as well as evaluating the overall financial statement presentation. We believe that our audits provide a reasonable basis for our opinion.
In our opinion, the financial statements and financial highlights referred to above present fairly, in all material respects, the financial position of the Wells Fargo Large Cap Core Fund as of July 31, 2016, the results of its operations for the year then ended, the changes in its net assets for each of the years in the two-year period then ended, and the financial highlights for each of the years or periods in the five-year period then ended, in conformity with U.S. generally accepted accounting principles.

Boston, Massachusetts
September 23, 2016
| | | | | | |
| Other information (unaudited) | | Wells Fargo Large Cap Core Fund | | | 29 | |
TAX INFORMATION
For corporate shareholders, pursuant to Section 854 of the Internal Revenue Code, 100% of ordinary income dividends qualify for the corporate dividends-received deduction for the fiscal year ended July 31, 2016.
Pursuant to Section 852 of the Internal Revenue Code, $5,925,465 was designated as a 20% rate gain distribution for the fiscal year ended July 31, 2016.
Pursuant to Section 854 of the Internal Revenue Code, $2,630,814 of income dividends paid during the fiscal year ended July 31, 2016 has been designated as qualified dividend income (QDI).
PROXY VOTING INFORMATION
A description of the policies and procedures that the Fund uses to determine how to vote proxies relating to portfolio securities is available, upon request, by calling 1-800-222-8222, visiting our website at wellsfargofunds.com, or visiting the SEC website at sec.gov. Information regarding how the Fund voted proxies relating to portfolio securities during the most recent 12-month period ended June 30 is available on the Fund’s website at wellsfargofunds.com or by visiting the SEC website at sec.gov.
PORTFOLIO HOLDINGS INFORMATION
The complete portfolio holdings for the Fund are publicly available monthly on the Fund’s website (wellsfargofunds.com), on a one-month delayed basis. In addition, top ten holdings information (excluding derivative positions) for the Fund is publicly available on the Fund’s website on a monthly, seven-day or more delayed basis. The Fund files its complete schedule of portfolio holdings with the SEC for the first and third quarters of each fiscal year on Form N-Q, which is available by visiting the SEC website at sec.gov. In addition, the Fund’s Form N-Q may be reviewed and copied at the SEC’s Public Reference Room in Washington, DC, and at regional offices in New York City, at 233 Broadway, and in Chicago, at 175 West Jackson Boulevard, Suite 900. Information about the Public Reference Room may be obtained by calling 1-800-SEC-0330.
| | | | |
| 30 | | Wells Fargo Large Cap Core Fund | | Other information (unaudited) |
BOARD OF TRUSTEES AND OFFICERS
Each of the Trustees and Officers1 listed in the table below acts in identical capacities for each fund in the Wells Fargo family of funds, which consists of 139 mutual funds comprising the Wells Fargo Funds Trust, Wells Fargo Variable Trust, Wells Fargo Master Trust and four closed-end funds (collectively the “Fund Complex”). This table should be read in conjunction with the Prospectus and the Statement of Additional Information2. The mailing address of each Trustee and Officer is 525 Market Street, 12th Floor, San Francisco, CA 94105. Each Trustee and Officer serves an indefinite term, however, each Trustee serves such term until reaching the mandatory retirement age established by the Trustees.
Independent Trustees
| | | | | | |
Name and year of birth | | Position held and length of service* | | Principal occupations during past five years or longer | | Current other public company or investment company directorships |
William R. Ebsworth
(Born 1957) | | Trustee, since 2015 | | Retired. From 1984 to 2013, equities analyst, portfolio manager, research director and chief financial officer at Fidelity Management and Research Company in Boston, Tokyo, and Hong Kong and retired in 2013 as Chief Investment Officer of Fidelity Strategic Advisers, Inc. where he lead a team of investment professionals managing client assets. Prior thereto, Board member of Hong Kong Securities Clearing Co., Hong Kong Options Clearing Corp., the Thailand International Fund, Ltd., Fidelity Investments Life Insurance Company, and Empire Fidelity Investments Life Insurance Company. Mr. Ebsworth is a CFA® charterholder and an Adjunct Lecturer, Finance, at Babson College. | | Asset Allocation Trust |
Jane A. Freeman
(Born 1953) | | Trustee, since 2015 | | Retired. From 2012 to 2014 and 1999 to 2008, Chief Financial Officer of Scientific Learning Corporation. From 2008 to 2012, Ms. Freeman provided consulting services related to strategic business projects. Prior to 1999, Portfolio Manager at Rockefeller & Co. and Scudder, Stevens & Clark. Board member of the Harding Loevner Funds from 1996 to 2014, serving as both Lead Independent Director and chair of the Audit Committee. Board member of the Russell Exchange Traded Funds Trust from 2011 to 2012 and the chair of the Audit Committee. Ms. Freeman is Chair of Taproot Foundation (non-profit organization), a Board Member of Ruth Bancroft Garden (non-profit organization) and an inactive chartered financial analyst. | | Asset Allocation Trust |
Peter G. Gordon
(Born 1942) | | Trustee, since 1998; Chairman, since 2005 | | Co-Founder, Retired Chairman, President and CEO of Crystal Geyser Water Company. Trustee Emeritus, Colby College. | | Asset Allocation Trust |
Isaiah Harris, Jr.
(Born 1952) | | Trustee, since 2009 | | Retired. Chairman of the Board of CIGNA Corporation since 2009, and Director since 2005. From 2003 to 2011, Director of Deluxe Corporation. Prior thereto, President and CEO of BellSouth Advertising and Publishing Corp. from 2005 to 2007, President and CEO of BellSouth Enterprises from 2004 to 2005 and President of BellSouth Consumer Services from 2000 to 2003. Emeritus member of the Iowa State University Foundation Board of Governors. Emeritus Member of the Advisory Board of Iowa State University School of Business. Advisory Board Member, Palm Harbor Academy (charter school). Advisory Board Member, Child Evangelism Fellowship (non-profit). Mr. Harris is a certified public accountant (inactive status). | | CIGNA Corporation; Asset Allocation Trust |
Judith M. Johnson
(Born 1949) | | Trustee, since 2008; Audit Committee Chairman, since 2008 | | Retired. Prior thereto, Chief Executive Officer and Chief Investment Officer of Minneapolis Employees Retirement Fund from 1996 to 2008. Ms. Johnson is an attorney, certified public accountant and a certified managerial accountant. | | Asset Allocation Trust |
David F. Larcker
(Born 1950) | | Trustee, since 2009 | | James Irvin Miller Professor of Accounting at the Graduate School of Business, Stanford University, Director of the Corporate Governance Research Initiative and Senior Faculty of The Rock Center for Corporate Governance since 2006. From 2005 to 2008, Professor of Accounting at the Graduate School of Business, Stanford University. Prior thereto, Ernst & Young Professor of Accounting at The Wharton School, University of Pennsylvania from 1985 to 2005. | | Asset Allocation Trust |
| | | | | | |
| Other information (unaudited) | | Wells Fargo Large Cap Core Fund | | | 31 | |
| | | | | | |
Name and year of birth | | Position held and length of service* | | Principal occupations during past five years or longer | | Current other public company or investment company directorships |
Olivia S. Mitchell
(Born 1953) | | Trustee, since 2006 | | International Foundation of Employee Benefit Plans Professor, Wharton School of the University of Pennsylvania since 1993. Director of Wharton’s Pension Research Council and Boettner Center on Pensions & Retirement Research, and Research Associate at the National Bureau of Economic Research. Previously, Cornell University Professor from 1978 to 1993. | | Asset Allocation Trust |
Timothy J. Penny
(Born 1951) | | Trustee, since 1996 | | President and Chief Executive Officer of Southern Minnesota Initiative Foundation, a non-profit organization, since 2007 and Senior Fellow at the Humphrey Institute Policy Forum at the University of Minnesota since 1995. Member of the Board of Trustees of NorthStar Education Finance, Inc., a non-profit organization, since 2007. | | Asset Allocation Trust |
Michael S. Scofield
(Born 1943) | | Trustee, since 2010 | | Served on the Investment Company Institute’s Board of Governors and Executive Committee from 2008-2011 as well the Governing Council of the Independent Directors Council from 2006-2011 and the Independent Directors Council Executive Committee from 2008-2011. Chairman of the IDC from 2008-2010. Institutional Investor (Fund Directions) Trustee of Year in 2007. Trustee of the Evergreen Funds complex (and its predecessors) from 1984 to 2010. Chairman of the Evergreen Funds from 2000-2010. Former Trustee of the Mentor Funds. Retired Attorney, Law Offices of Michael S. Scofield. | | Asset Allocation Trust |
| * | Length of service dates reflect the Trustee’s commencement of service with the Trust’s predecessor entities, where applicable. |
Officers
| | | | | | |
Name and year of birth | | Position held and length of service | | Principal occupations during past five years or longer | | |
Karla M. Rabusch
(Born 1959) | | President, since 2003 | | Executive Vice President of Wells Fargo Bank, N.A. and President of Wells Fargo Funds Management, LLC since 2003. | | |
Jeremy DePalma1
(Born 1974) | | Treasurer, since 2012 | | Senior Vice President of Wells Fargo Funds Management, LLC since 2009. Senior Vice President of Evergreen Investment Management Company, LLC from 2008 to 2010 and head of the Fund Reporting and Control Team within Fund Administration from 2005 to 2010. | | |
C. David Messman
(Born 1960) | | Secretary, since 2000; Chief Legal Officer, since 2003 | | Senior Vice President and Secretary of Wells Fargo Funds Management, LLC since 2001. Assistant General Counsel of Wells Fargo Bank, N.A. since 2013 and Vice President and Managing Counsel of Wells Fargo Bank, N.A. from 1996 to 2013. | | |
Michael Whitaker
(Born 1967) | | Chief Compliance Officer, since 2016* | | Executive Vice President of Wells Fargo Funds Management, LLC since 2016. Chief Compliance Officer of Fidelity’s Fixed Income Funds and Asset Allocation Funds from 2008 to 2016, Compliance Officer of FMR Co., Inc. from 2014 to 2016, Fidelity Investments Money Management, Inc. from 2014 to 2016, Fidelity Investments from 2007 to 2016. | | |
David Berardi
(Born 1975) | | Assistant Treasurer, since 2009 | | Vice President of Wells Fargo Funds Management, LLC since 2009. Vice President of Evergreen Investment Management Company, LLC from 2008 to 2010. Manager of Fund Reporting and Control for Evergreen Investment Management Company, LLC from 2004 to 2010. | | |
| 1 | Jeremy DePalma acts as Treasurer of 68 funds and Assistant Treasurer of 71 funds in the Fund Complex. |
| 2 | The Statement of Additional Information includes additional information about the Trustees and is available, without charge, upon request, by calling
1-800-222-8222 or by visiting the website at wellsfargofunds.com. |
| * | Michael Whitaker became Chief Compliance Officer effective May 16, 2016. |
| | | | |
| 32 | | Wells Fargo Large Cap Core Fund | | Other information (unaudited) |
BOARD CONSIDERATION OF INVESTMENT MANAGEMENT AND SUB-ADVISORY AGREEMENTS:
Under the Investment Company Act of 1940 (the “1940 Act”), the Board of Trustees (the “Board”) of Wells Fargo Funds Trust (the “Trust”) must determine annually whether to approve the continuation of the Trust’s investment management and sub-advisory agreements. In this regard, at an in-person meeting held on May 24-25, 2016 (the “Meeting”), the Board, all the members of which have no direct or indirect interest in the investment management and sub-advisory agreements and are not “interested persons” of the Trust, as defined in the 1940 Act (the “Independent Trustees”), reviewed and approved for Wells Fargo Large Cap Core Fund (the “Fund”): (i) an investment management agreement (the “Management Agreement”) with Wells Fargo Funds Management, LLC (“Funds Management”); and (ii) an investment sub-advisory agreement (the “Sub-Advisory Agreement”) with Golden Capital Management, LLC (the “Sub-Adviser”), an affiliate of Funds Management. The Management Agreement and the Sub-Advisory Agreement are collectively referred to as the “Advisory Agreements.”
At the Meeting, the Board considered the factors and reached the conclusions described below relating to the selection of Funds Management and the Sub-Adviser and the approval of the Advisory Agreements. Prior to the Meeting, including at an in-person meeting in April 2016, the Trustees conferred extensively among themselves and with representatives of Funds Management about these matters. Also, the Board has adopted a team-based approach, with each team consisting of a sub-set of Trustees, to assist the full Board in the discharge of its duties in reviewing performance and other matters throughout the year. The Independent Trustees were assisted in their evaluation of the Advisory Agreements by independent legal counsel, from whom they received separate legal advice and with whom they met separately.
In providing information to the Board, Funds Management and the Sub-Adviser were guided by a detailed set of requests for information submitted to them by independent legal counsel on behalf of the Independent Trustees at the start of the Board’s annual contract renewal process earlier in 2016. In considering and approving the Advisory Agreements, the Trustees considered the information they believed relevant, including but not limited to the information discussed below. The Board considered not only the specific information presented in connection with the Meeting, but also the knowledge gained over time through interaction with Funds Management and the Sub-Adviser about various topics. In this regard, the Board reviewed reports of Funds Management at each of its quarterly meetings, which included, among other things, portfolio reviews and performance reports. In addition, the Board and the teams mentioned above confer with portfolio managers at various times throughout the year. The Board did not identify any particular information or consideration that was all-important or controlling, and each individual Trustee may have attributed different weights to various factors.
After its deliberations, the Board unanimously approved the continuation of the Advisory Agreements for a one-year term and determined that the compensation payable to Funds Management and the Sub-Adviser under each of the Advisory Agreements was reasonable. The Board considered the approval of the Advisory Agreements for the Fund as part of its consideration of agreements for funds across the complex, but its approvals were made on a fund-by-fund basis. The following summarizes a number of important, but not necessarily all, factors considered by the Board in support of its approvals.
Nature, extent and quality of services
The Board received and considered various information regarding the nature, extent and quality of services provided to the Fund by Funds Management and the Sub-Adviser under the Advisory Agreements. This information included a description of the investment advisory services and Fund-level administrative services covered by the Management Agreement, as well as, among other things, a summary of the background and experience of senior management of Funds Management, and the qualifications, background, tenure and responsibilities of each of the portfolio managers primarily responsible for the day-to-day portfolio management of the Fund.
The Board evaluated the ability of Funds Management and the Sub-Adviser to attract and retain qualified investment professionals, including research, advisory and supervisory personnel. The Board further considered the compliance programs and compliance records of Funds Management and the Sub-Adviser. In addition, the Board took into account the full range of services provided to the Fund by Funds Management and its affiliates.
Fund performance and expenses
The Board considered the performance results for the Fund over various time periods ended December 31, 2015. The Board considered these results in comparison to the performance of funds in a universe that was determined by Broadridge Inc. (“Broadridge”) to be similar to the Fund (the “Universe”), and in comparison to the Fund’s benchmark index and to other comparative data. Broadridge is an independent provider of investment company data. The Board received a description of the methodology used by Broadridge to select the mutual funds in the performance Universe.
| | | | | | |
| Other information (unaudited) | | Wells Fargo Large Cap Core Fund | | | 33 | |
The Board noted that the performance of the Fund (Class A) was higher than the average performance of the Universe for all periods under review. The Board also noted that the performance of the Fund was higher than its benchmark, the S&P 500 Index, for all periods under review except the one-year period.
The Board also received and considered information regarding the Fund’s net operating expense ratios and their various components, including actual management fees, custodian and other non-management fees, and Rule 12b-1 and non-Rule 12b-1 shareholder service fees. The Board considered these ratios in comparison to the median ratios of funds in class-specific expense groups that were determined by Broadridge to be similar to the Fund (the “Groups”). The Board received a description of the methodology used by Broadridge to select the mutual funds in the expense Groups and an explanation of how funds comprising expense groups and their expense ratios may vary from year-to-year. Based on the Broadridge reports, the Board noted that the net operating expense ratios of the Fund were lower than the median net operating expense ratios of the expense Groups.
The Board took into account the Fund performance and expense information provided to it among the factors considered in deciding to re-approve the Advisory Agreements.
Investment management and sub-advisory fee rates
The Board reviewed and considered the contractual fee rates payable by the Fund to Funds Management under the Management Agreement, as well as the contractual fee rates payable by the Fund to Funds Management for class-level administrative services under a Class-Level Administration Agreement, which include class-level transfer agency and sub-transfer agency costs (collectively, the “Management Rates”). The Board also reviewed and considered the contractual investment sub-advisory fee rates that are payable by Funds Management to the Sub-Adviser for investment sub-advisory services.
Among other information reviewed by the Board was a comparison of the Fund’s Management Rates with the average contractual investment management fee rates of funds in the expense Groups at a common asset level as well as transfer agency costs of the funds in the expense Groups. The Board noted that the Management Rates of the Fund were lower than or in range of the sum of these average rates for the Fund’s expense Groups for all share classes.
The Board also received and considered information about the portion of the total management fee that was retained by Funds Management after payment of the fee to the Sub-Adviser for sub-advisory services. In assessing the reasonableness of this amount, the Board received and evaluated information about the nature and extent of responsibilities retained and risks assumed by Funds Management and not delegated to or assumed by the Sub-Adviser, and about Funds Management’s on-going oversight services. However, given the affiliation between Funds Management and the Sub-Adviser, the Board ascribed limited relevance to the allocation of fees between them.
The Board also received and considered information about the nature and extent of services offered and fee rates charged by Funds Management and the Sub-Adviser to other types of clients with investment strategies similar to those of the Fund. In this regard, the Board received information about the significantly greater scope of services, and compliance, reporting and other legal burdens and risks of managing mutual funds compared with those associated with managing assets of non-mutual fund clients such as collective funds or institutional separate accounts.
Based on its consideration of the factors and information it deemed relevant, including those described here, the Board determined that the compensation payable to Funds Management under the Management Agreement and to the Sub-Adviser under the Sub-Advisory Agreement was reasonable, in light of the services covered by the Advisory Agreements.
Profitability
The Board received and considered information concerning the profitability of Funds Management, as well as the profitability of Wells Fargo as a whole, from providing services to the Fund and the fund family as a whole. The Board also received and considered information concerning the profitability of the Sub-Adviser, if any, from providing services to the fund family as a whole, noting that the Sub-Adviser’s profitability information with respect to providing services to the Fund was subsumed in the Wells Fargo and Funds Management profitability analysis.
Funds Management reported on the methodologies and estimates used in calculating profitability. Among other things, the Board noted that the levels of profitability reported on a fund-by-fund basis varied widely, depending on factors such as the size and type of fund. Based on its review, the Board did not deem the profits reported by Funds Management or Wells Fargo from its services to the Fund to be at a level that would prevent it from approving the continuation of the Advisory Agreements.
| | | | |
| 34 | | Wells Fargo Large Cap Core Fund | | Other information (unaudited) |
Economies of scale
With respect to possible economies of scale, the Board noted the existence of breakpoints in the Fund’s management fee structure, which operate generally to reduce the Fund’s expense ratios as the Fund grows in size. It considered that, for a small fund or a fund that shrinks in size, breakpoints conversely can result in higher fee levels. The Board also considered that fee waiver and expense reimbursement arrangements and competitive fee rates at the outset are means of sharing potential economies of scale with shareholders of the Fund and the fund family as a whole. The Board considered Funds Management’s view that any analyses of potential economies of scale in managing a particular fund are inherently limited in light of the joint and common costs and investments that Funds Management incurs across the fund family as a whole.
The Board concluded that the Fund’s fee and expense arrangements, including contractual breakpoints, constituted a reasonable approach to sharing potential economies of scale with the Fund and its shareholders.
Other benefits to Funds Management and the Sub-Adviser
The Board received and considered information regarding potential “fall-out” or ancillary benefits received by Funds Management and its affiliates, including the Sub-Adviser, as a result of their relationships with the Fund. Ancillary benefits could include, among others, benefits directly attributable to other relationships with the Fund and benefits potentially derived from an increase in Funds Management’s and the Sub-Adviser’s business as a result of their relationships with the Fund. The Board noted that various affiliates of Funds Management may receive distribution-related fees, shareholder servicing payments and sub-transfer agency fees in respect of shares sold or held through them and services provided.
The Board also reviewed information about soft dollar credits earned and utilized by the Sub-Adviser, fees earned by Funds Management from managing a private investment vehicle for the fund family’s securities lending collateral and commissions earned by an affiliated broker from portfolio transactions.
Based on its consideration of the factors and information it deemed relevant, including those described here, the Board did not find that any ancillary benefits received by Funds Management and its affiliates, including the Sub-Adviser, were unreasonable.
Conclusion
At the Meeting, after considering the above-described factors and based on its deliberations and its evaluation of the information described above, the Board unanimously approved the continuation of the Advisory Agreements for a one-year term and determined that the compensation payable to Funds Management and the Sub-Adviser under each of the Advisory Agreements was reasonable.
| | | | | | |
| List of abbreviations | | Wells Fargo Large Cap Core Fund | | | 35 | |
The following is a list of common abbreviations for terms and entities that may have appeared in this report.
| ACA | — ACA Financial Guaranty Corporation |
| ADR | — American depositary receipt |
| ADS | — American depositary shares |
| AGC | — Assured Guaranty Corporation |
| AGM | — Assured Guaranty Municipal |
| Ambac | — Ambac Financial Group Incorporated |
| AMT | — Alternative minimum tax |
| BAN | — Bond anticipation notes |
| BHAC | — Berkshire Hathaway Assurance Corporation |
| CAB | — Capital appreciation bond |
| CCAB | — Convertible capital appreciation bond |
| CDA | — Community Development Authority |
| CDO | — Collateralized debt obligation |
| DRIVER | — Derivative inverse tax-exempt receipts |
| DW&P | — Department of Water & Power |
| DWR | — Department of Water Resources |
| ECFA | — Educational & Cultural Facilities Authority |
| EDA | — Economic Development Authority |
| EDFA | — Economic Development Finance Authority |
| ETF | — Exchange-traded fund |
| FDIC | — Federal Deposit Insurance Corporation |
| FFCB | — Federal Farm Credit Banks |
| FGIC | — Financial Guaranty Insurance Corporation |
| FHA | — Federal Housing Administration |
| FHLB | — Federal Home Loan Bank |
| FHLMC | — Federal Home Loan Mortgage Corporation |
| FICO | — The Financing Corporation |
| FNMA | — Federal National Mortgage Association |
| GDR | — Global depositary receipt |
| GNMA | — Government National Mortgage Association |
| HCFR | — Healthcare facilities revenue |
| HEFA | — Health & Educational Facilities Authority |
| HEFAR | — Higher education facilities authority revenue |
| HFA | — Housing Finance Authority |
| HFFA | — Health Facilities Financing Authority |
| HUD | — Department of Housing and Urban Development |
| IDA | — Industrial Development Authority |
| IDAG | — Industrial Development Agency |
| KRW | — Republic of Korea won |
| LIBOR | — London Interbank Offered Rate |
| LIFER | — Long Inverse Floating Exempt Receipts |
| LLC | — Limited liability company |
| LLLP | — Limited liability limited partnership |
| LLP | — Limited liability partnership |
| MBIA | — Municipal Bond Insurance Association |
| MFHR | — Multifamily housing revenue |
| MSTR | — Municipal securities trust receipts |
| MUD | — Municipal Utility District |
| National | — National Public Finance Guarantee Corporation |
| PCFA | — Pollution Control Financing Authority |
| PCL | — Public Company Limited |
| PCR | — Pollution control revenue |
| PFA | — Public Finance Authority |
| PFFA | — Public Facilities Financing Authority |
| PFOTER | — Puttable floating option tax-exempt receipts |
| plc | — Public limited company |
| PUTTER | — Puttable tax-exempt receipts |
| R&D | — Research & development |
| Radian | — Radian Asset Assurance |
| RAN | — Revenue anticipation notes |
| RDA | — Redevelopment Authority |
| RDFA | — Redevelopment Finance Authority |
| REIT | — Real estate investment trust |
| ROC | — Reset option certificates |
| SAVRS | — Select auction variable rate securities |
| SBA | — Small Business Authority |
| SDR | — Swedish depositary receipt |
| SFHR | — Single-family housing revenue |
| SFMR | — Single-family mortgage revenue |
| SPA | — Standby purchase agreement |
| SPDR | — Standard & Poor’s Depositary Receipts |
| SPEAR | — Short Puttable Exempt Adjustable Receipts |
| STRIPS | — Separate trading of registered interest and |
| TAN | — Tax anticipation notes |
| TIPS | — Treasury inflation-protected securities |
| TRAN | — Tax revenue anticipation notes |
| TTFA | — Transportation Trust Fund Authority |
| TVA | — Tennessee Valley Authority |
This page is intentionally left blank.

For more information
More information about Wells Fargo Funds is available free upon request. To obtain literature, please write, email, visit the Fund’s website, or call:
Wells Fargo Funds
P.O. Box 8266
Boston, MA 02266-8266
Email: fundservice@wellsfargo.com
Website: wellsfargofunds.com
Individual investors: 1-800-222-8222
Retail investment professionals: 1-888-877-9275
Institutional investment professionals: 1-866-765-0778
This report and the financial statements contained herein are submitted for the general information of the shareholders of the Fund. If this report is used for promotional purposes, distribution of the report must be accompanied or preceded by a current prospectus. Before investing, please consider the investment objectives, risks, charges, and expenses of the investment. For a current prospectus and, if available, a summary prospectus, containing this information, call
1-800-222-8222 or visit the Fund’s website at wellsfargofunds.com. Read the prospectus carefully before you invest or send money.
Wells Fargo Asset Management (WFAM) is a trade name used by the asset management businesses of Wells Fargo & Company. Wells Fargo Funds Management, LLC, a wholly owned subsidiary of Wells Fargo & Company, provides investment advisory and administrative services for Wells Fargo Funds. Other affiliates of Wells Fargo & Company provide subadvisory and other services for the funds. The funds are distributed by Wells Fargo Funds Distributor, LLC, Member FINRA, an affiliate of Wells Fargo & Company.
NOT FDIC INSURED ¡ NO BANK GUARANTEE ¡ MAY LOSE VALUE
© 2016 Wells Fargo Funds Management, LLC. All rights reserved.
| | |
 | | 245325 09-16 A208/AR208 07-16 |
Annual Report
July 31, 2016

Wells Fargo Large Cap Growth Fund


Reduce clutter. Save trees.
Sign up for electronic delivery of prospectuses and shareholder reports at wellsfargo.com/advantagedelivery
Contents
The views expressed and any forward-looking statements are as of July 31, 2016, unless otherwise noted, and are those of the Fund managers and/or Wells Fargo Funds Management, LLC. Discussions of individual securities, or the markets generally, or any Wells Fargo Fund are not intended as individual recommendations. Future events or results may vary significantly from those expressed in any forward-looking statements. The views expressed are subject to change at any time in response to changing circumstances in the market. Wells Fargo Funds Management, LLC and the Fund disclaim any obligation to publicly update or revise any views expressed or forward-looking statements.
NOT FDIC INSURED ¡ NO BANK GUARANTEE ¡ MAY LOSE VALUE
| | | | |
| 2 | | Wells Fargo Large Cap Growth Fund | | Letter to shareholders (unaudited) |

Karla M. Rabusch
President
Wells Fargo Funds
Despite significant market fluctuations over the course of the year, U.S. stocks delivered positive results overall for the 12-month reporting period
Dear Valued Shareholder:
We are pleased to offer you this annual report for the Wells Fargo Large Cap Growth Fund for the 12-month period that ended July 31, 2016. During this period, which began August 1, 2015, U.S. and international stock markets experienced heightened volatility, with intermittent rebounds interspersed with sell-offs. The U.S. economy displayed resilience throughout the period, although growth was somewhat sluggish amid ongoing pressures that included slowing growth in China, a strengthening U.S. dollar, and uncertainty regarding interest-rate increases by the U.S. Federal Reserve (Fed); international economies faced deeper ongoing challenges. During June 2016, global markets became especially volatile as the U.K.’s vote over whether to leave the European Union (E.U.) approached. However, markets began recovering shortly after the U.K. voted to leave and rallied through July. Despite significant market fluctuations over the course of the year, U.S. stocks delivered positive results overall for the 12-month reporting period, as measured by the Russell 1000® Index.1 International markets generally declined as measured by the Morgan Stanley Capital International (MSCI) Europe, Australasia, Far East (EAFE) Index.2
In the third quarter of 2015, China’s slowdown took a toll on economies and markets worldwide.
U.S. stocks sagged during the quarter, experiencing the most volatility since 2011. Economic data released during the quarter suggested the U.S. economy remained solid but had lost some steam, burdened by the drag of the U.S. dollar’s strength coupled with global economic turmoil. The fact that the Fed left the federal funds interest rate unchanged at its September 2015 meeting surprised investors and fueled increased uncertainty about the U.S. economy’s stamina to remain healthy while facing the challenges of slowing growth in China and troubles elsewhere in the world. Outside the U.S., markets were even more volatile and delivered generally weaker quarterly results, also largely due to investors’ increasing anxiety over China’s weakened economy.
Despite ongoing concerns, U.S. stocks generally rose in the fourth quarter of 2015; international markets lagged.
While the broad U.S. stock market bounced back in the quarter, stock markets outside the U.S. failed to keep pace as economic concerns, including China’s ongoing slowdown, continued to affect many countries. U.S. economic data released during the quarter indicated the economy remained solid, although the strong U.S. dollar and weakness in international economies remained headwinds. In December, the Fed, as expected, raised its target interest rate by 25 basis points (bps; 100 bps equals 1.00%) after keeping it near zero for seven years. The move reflected confidence in the U.S. economy’s ability to stay healthy with less central-bank support. The Fed also clarified that future interest-rate increases would be gradual.
| 1 | The Russell 1000® Index measures the performance of the 1,000 largest companies in the Russell 3000® Index, which represents approximately 92% of the total market capitalization of the Russell 3000® Index. You cannot invest directly in an index. |
| 2 | Morgan Stanley Capital International (MSCI) Europe, Australasia, Far East (EAFE) Index is a free-float-adjusted market-capitalization-weighted index that is designed to measure the equity market performance of developed markets, excluding the United States and Canada. The MSCI EAFE Index consists of the following 21 developed markets country indexes: Australia, Austria, Belgium, Denmark, Finland, France, Germany, Hong Kong, Ireland, Israel, Italy, Japan, the Netherlands, New Zealand, Norway, Portugal, Singapore, Spain, Sweden, Switzerland, and the United Kingdom. You cannot invest directly in an index. |
| | | | | | |
| Letter to shareholders (unaudited) | | Wells Fargo Large Cap Growth Fund | | | 3 | |
In the first quarter of 2016, market volatility increased globally amid ongoing concerns.
Stock markets worldwide fluctuated widely in the first quarter of 2016. Most sold off sharply in the first six weeks of the year on concerns such as weak global growth, falling commodity prices, and uncertainty over the timing and impact of the Fed’s interest-rate increases. As the quarter progressed, fears abated somewhat and global markets generally rallied back. The U.S. economy ended the quarter on a positive note as much of the quarter’s data reflected resiliency. With ongoing uncertainties about global growth and financial markets, however, the Fed held off from raising the target interest rate during the quarter. Outside the U.S., the eurozone fell into deflation in February; in response, the European Central Bank announced an expansion of its stimulus program. In China, the government in March set a growth rate of 6.5% to 7.0% for 2016, an acknowledgment of weakening growth. In emerging markets, although central-bank stimulus and improved prices for oil and other commodities led to stock-market rallies in the quarter, many of these countries’ economies face credit downgrades due to challenges such as the likelihood of a stronger U.S. dollar, which would make dollar-denominated debt more expensive.
Worries over interest rates and the U.K.’s vote largely drove the markets during the second quarter of 2016.
U.S. stocks began the quarter in positive territory but started to lose steam in early May on worries that a possible June interest-rate increase by the Fed could hurt the market. In mid-May, stocks briefly plunged following comments by Fed officials noting that a June interest-rate increase remained on the table. But once investors had processed this information, stocks again rallied, finishing up for the month. The first three weeks of June brought heightened volatility, spurred largely by a disappointing jobs report and uncertainty over whether the U.K. would remain in the E.U. The U.K.’s Brexit vote on June 23 shocked countries in Europe and much of the rest of the world. Stock markets plummeted as investors worried that the U.K.’s departure from the E.U. would slow global growth and prolong the low-interest-rate environment. Following the initial rout, however, U.S. stocks rallied as investors seemed to decide that any negative effects would be more localized and not create a serious risk for global growth. By quarter-end, the broad U.S. stock market had moved back into positive territory.
Stocks generally posted positive results for July 2016.
U.S. stocks displayed the most momentum during the first two weeks of the month, buoyed partly by an unexpectedly favorable June jobs report that helped strengthen confidence in the U.S. economy. Also, investors perhaps felt that global central banks could extend stimulus measures in the wake of the Brexit vote. Although U.S. market momentum slowed during the second half of July, stocks ended in positive territory for the month. International stocks delivered positive monthly results as well.
| | | | |
| 4 | | Wells Fargo Large Cap Growth Fund | | Letter to shareholders (unaudited) |
Don’t let short-term uncertainty derail long-term investment goals.
Periods of uncertainty can present challenges, but experience has taught us that maintaining long-term investment goals can be an effective way to plan for the future. To help you create a sound strategy based on your personal goals and risk tolerance, Wells Fargo Funds offers more than 100 mutual funds spanning a wide range of asset classes and investment styles. Although diversification cannot guarantee an investment profit or prevent losses, we believe it can be an effective way to manage investment risk and potentially smooth out overall portfolio performance. We encourage investors to know their investments and to understand that appropriate levels of risk-taking may unlock opportunities.
Thank you for choosing to invest in Wells Fargo Funds. We appreciate your confidence in us and remain committed to helping you meet your financial needs.
Sincerely,

Karla M. Rabusch
President
Wells Fargo Funds
Although diversification cannot guarantee an investment profit or prevent losses, we believe it can be an effective way to manage investment risk and potentially smooth out overall portfolio performance.
For further information about your Fund, contact your investment professional, visit our website at wellsfargofunds.com, or call us directly at 1-800-222-8222. We are available 24 hours a day, 7 days a week.
This page is intentionally left blank.
| | | | |
| 6 | | Wells Fargo Large Cap Growth Fund | | Performance highlights (unaudited) |
Investment objective
The Fund seeks long-term capital appreciation.
Manager
Wells Fargo Funds Management, LLC
Subadviser
Wells Capital Management Incorporated
Portfolio managers
Joseph Eberhardy, CFA®, CPA
Thomas Ognar, CFA®
Bruce Olson, CFA®
Average annual total returns (%) as of July 31, 20161
| | | | | | | | | | | | | | | | | | | | | | | | | | | | | | | | | | |
| | | | | Including sales charge | | | Excluding sales charge | | | Expense ratios2 (%) | |
| | | Inception date | | 1 year | | | 5 year | | | 10 year | | | 1 year | | | 5 year | | | 10 year | | | Gross | | | Net3 | |
| Class A (STAFX) | | 7-30-2010 | | | (7.47 | ) | | | 9.38 | | | | 7.90 | | | | (1.83 | ) | | | 10.69 | | | | 8.54 | | | | 1.15 | | | | 1.07 | |
| Class C (STOFX) | | 7-30-2010 | | | (3.56 | ) | | | 9.87 | | | | 7.76 | | | | (2.56 | ) | | | 9.87 | | | | 7.76 | | | | 1.90 | | | | 1.82 | |
| Class R (STMFX) | | 6-15-2012 | | | – | | | | – | | | | – | | | | (2.08 | ) | | | 10.43 | | | | 8.33 | | | | 1.40 | | | | 1.32 | |
| Class R4 (SLGRX) | | 11-30-2012 | | | – | | | | – | | | | – | | | | (1.54 | ) | | | 11.06 | | | | 8.76 | | | | 0.87 | | | | 0.80 | |
| Class R6 (STFFX) | | 11-30-2012 | | | – | | | | – | | | | – | | | | (1.39 | ) | | | 11.18 | | | | 8.81 | | | | 0.72 | | | | 0.65 | |
| Administrator Class (STDFX) | | 7-30-2010 | | | – | | | | – | | | | – | | | | (1.71 | ) | | | 10.84 | | | | 8.62 | | | | 1.07 | | | | 0.95 | |
| Institutional Class (STNFX) | | 7-30-2010 | | | – | | | | – | | | | – | | | | (1.49 | ) | | | 11.12 | | | | 8.79 | | | | 0.82 | | | | 0.75 | |
| Russell 1000® Growth Index4 | | – | | | – | | | | – | | | | – | | | | 4.35 | | | | 13.62 | | | | 9.50 | | | | – | | | | – | |
Figures quoted represent past performance, which is no guarantee of future results, and do not reflect taxes that a shareholder may pay on fund distributions or the redemption of fund shares. Investment return and principal value of an investment will fluctuate so that an investor’s shares, when redeemed, may be worth more or less than their original cost. Performance shown without sales charges would be lower if sales charges were reflected. Current performance may be lower or higher than the performance data quoted, which assumes the reinvestment of dividends and capital gains. Current month-end performance is available on the Fund’s website, wellsfargofunds.com.
Index returns do not include transaction costs associated with buying and selling securities, any mutual fund fees or expenses, or any taxes. It is not possible to invest directly in an index.
For Class A shares, the maximum front-end sales charge is 5.75%. For Class C shares, the maximum contingent deferred sales charge is 1.00%. Performance including a contingent deferred sales charge assumes the sales charge for the corresponding time period. Class R, Class R4, Class R6, Administrator Class, and Institutional Class shares are sold without a front-end sales charge or contingent deferred sales charge.
Stock values fluctuate in response to the activities of individual companies and general market and economic conditions. Certain investment strategies tend to increase the total risk of an investment (relative to the broader market). The Fund is exposed to foreign investment risk. Consult the Fund’s prospectus for additional information on these and other risks.
Please see footnotes on page 7.
| | | | | | |
| Performance highlights (unaudited) | | Wells Fargo Large Cap Growth Fund | | | 7 | |
|
| Growth of $10,000 investment as of July 31, 20165 |
|
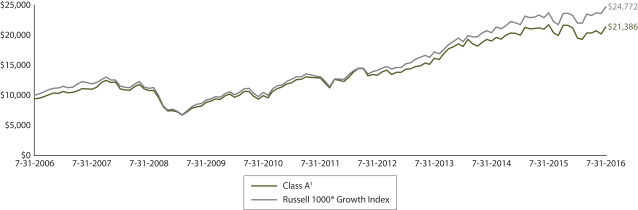 |
| 1 | Historical performance shown for Class A, Administrator Class, and Institutional Class shares prior to their inception reflects the performance of the former Investor Class shares, and includes the higher expenses applicable to the former Investor Class shares. If these expenses had not been included, returns would be higher. Historical performance shown for Class C shares prior to their inception reflects the performance of the former Investor Class shares, adjusted to reflect the higher expenses applicable to Class C shares. Historical performance shown for Class R shares prior to their inception reflects the performance of the former Investor Class shares, adjusted to reflect the higher expenses applicable to Class R shares. Historical performance shown for Class R4 shares prior to their inception reflects the performance of Institutional Class shares, adjusted to reflect the higher expenses applicable to Class R4 shares. Historical performance shown for Class R6 shares prior to their inception reflects the performance of Institutional Class shares, and includes the higher expenses applicable to Institutional Class shares. If these expenses had not been included, returns would be higher. |
| 2 | Reflects the expense ratios as stated in the most recent prospectuses. The expense ratios shown are subject to change and may differ from the annualized expense ratios shown in the financial highlights of this report. |
| 3 | The manager has contractually committed through November 30, 2016, to waive fees and/or reimburse expenses to the extent necessary to cap the Fund’s Total Annual Fund Operating Expenses After Fee Waiver at the amounts shown. After this time, the cap may be increased or the commitment to maintain the cap may be terminated only with the approval of the Board of Trustees. Brokerage commissions, stamp duty fees, interest, taxes, acquired fund fees and expenses, and extraordinary expenses are excluded from the expense cap. Without this cap, the Fund’s returns would have been lower. |
| 4 | The Russell 1000® Growth Index measures the performance of those Russell 1000 companies with higher price-to-book ratios and higher forecasted growth values. You cannot invest directly in an index. |
| 5 | The chart compares the performance of Class A shares for the most recent ten years with the Russell 1000® Growth Index. The chart assumes a hypothetical investment of $10,000 in Class A shares and reflects all operating expenses and assumes the maximum initial sales charge of 5.75%. |
| 6 | The ten largest holdings, excluding cash and cash equivalents, are calculated based on the value of the investments divided by total net assets of the Fund. Holdings are subject to change and may have changed since the date specified. |
| 7 | Amounts are calculated based on the total long-term investments of the Fund. These amounts are subject to change and may have changed since the date specified. |
| | | | |
| 8 | | Wells Fargo Large Cap Growth Fund | | Performance highlights (unaudited) |
MANAGER’S DISCUSSION
Fund highlights
| n | | The Fund underperformed its benchmark, the Russell 1000® Growth Index, for the 12-month period that ended July 31, 2016. |
| n | | Holdings within the health care and information technology (IT) sectors contributed to the Fund’s underperformance for the period. An underweight to slower-growing stocks in the consumer staples sector also detracted from results as investors sought higher-yielding stocks. |
| n | | The market environment often was influenced by investor sentiment rather than by fundamentals during the period, which presented a general challenge for our emphasis on adding value through bottom-up stock selection. |
The ongoing low-interest-rate environment drove investors’ demand for dividend yield, hindering Fund results.
Faced with the prospect of historically low interest rates and, in some countries, negative interest rates, investors continued to seek alternative sources of income via dividend-paying stocks. Stocks paying a dividend yield larger than 2% contributed disproportionately to the total return of the Russell 1000® Growth Index for the period. Due to its focus on faster-growing stocks, the Fund tends to be significantly underweight dividend-paying stocks compared with the index; this characteristic significantly contributed to the Fund’s underperformance for the period. While investors’ preference for dividend yield challenged our investment process at times during the period, it also led to historically attractive relative valuations for faster-growing stocks, which could bode well for future Fund performance.
| | | | |
| Ten largest holdings (%) as of July 31, 20166 | |
Facebook Incorporated Class A | | | 5.36 | |
Amazon.com Incorporated | | | 4.03 | |
Dollar Tree Incorporated | | | 3.61 | |
Microsoft Corporation | | | 3.58 | |
Alphabet Incorporated Class A | | | 3.56 | |
Alphabet Incorporated Class C | | | 2.72 | |
Costco Wholesale Corporation | | | 2.70 | |
Visa Incorporated Class A | | | 2.62 | |
MasterCard Incorporated Class A | | | 2.60 | |
O’Reilly Automotive Incorporated | | | 2.33 | |
Results from the Fund’s health care and IT holdings detracted from performance.
Within health care, biotechnology holdings detracted notably over the period. Although these companies tended to experience solid demand for existing medical solutions, their stocks suffered significant declines in the first half of 2016. Multiple factors drove the share-price weakness, including the negative effects of ongoing political rhetoric concerning potential drug-pricing controls and less-robust fundamental outlooks for several companies.
Within the IT sector, several holdings with significant market opportunities within faster-growing areas, such as cloud services, data analytics, and network security,
displayed weakness. Although these holdings generally delivered solid growth fundamentals, they experienced significant volatility as investors reacted to global economic uncertainties. At times during the period, investors preferred select mega-cap IT stocks, often at the expense of many small- and mid-cap IT companies that were actively reinvesting in their businesses to expand their market share.
Select holdings within the consumer discretionary and energy sectors contributed positively to performance.
Within the consumer discretionary sector, the Fund benefited from solid performance by holdings with strong secular growth. Several top performers effectively executed on self-help initiatives that boosted company profit margins and contributed to higher same-store sales. Retail companies focused on the lower-end consumer continued to perform well as their business models tend to be more resistant to the pressures of Amazon.com, Incorporated, and other online retailers. Specialty retailers focused on a specific market segment also delivered positive results in the Amazon-dominated retail field. Among the Fund’s energy holdings, exploration and production company Concho Resources Incorporated, which has fracking operations in the Permian Basin, delivered favorable results as oil prices rallied off their February 2016 lows.
Please see footnotes on page 7.
| | | | | | |
| Performance highlights (unaudited) | | Wells Fargo Large Cap Growth Fund | | | 9 | |
|
| Sector distribution as of July 31, 20167 |
|
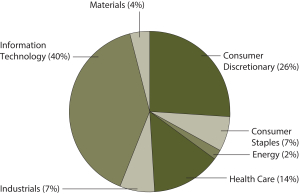 |
We continue to focus on consistently implementing our process.
Over the course of the 12-month period, we made modest adjustments to the Fund to potentially capitalize on opportunities and position for the future. Using our bottom-up research process, we added IT companies that met our criteria for robust, sustainable growth that appears underappreciated by the market. We funded these purchases primarily with the proceeds from sales of holdings in the consumer discretionary sector.
Given the abundant political and economic headlines dominating the media in the U.S. and worldwide, we expect to see continued market volatility heading into the summer of 2016 and likely through the U.S. general
election in November 2016. As this volatility occurs, we intend to take advantage of potential opportunities as the valuation gaps of the companies held within the Fund widen and contract. We maintain strong conviction for the rapidly growing companies within the portfolio; many holdings have been trading at or near multiyear-low valuations relative to the broad market. Our investment strategy—seeking robust growth companies with sustainable business models that are underappreciated by investors—should position us, going forward, to take advantage of opportunities within the market for the benefit of Fund shareholders.
Please see footnotes on page 7.
| | | | |
| 10 | | Wells Fargo Large Cap Growth Fund | | Fund expenses (unaudited) |
As a shareholder of the Fund, you incur two types of costs: (1) transaction costs, including sales charges (loads) on purchase payments and contingent deferred sales charges (if any) on redemptions and (2) ongoing costs, including management fees, distribution (12b-1) and/or shareholder servicing fees, and other Fund expenses. This example is intended to help you understand your ongoing costs (in dollars) of investing in the Fund and to compare these costs with the ongoing costs of investing in other mutual funds.
The example is based on an investment of $1,000 invested at the beginning of the six-month period and held for the entire period from February 1, 2016 to July 31, 2016.
Actual expenses
The “Actual” line of the table below provides information about actual account values and actual expenses. You may use the information in this line, together with the amount you invested, to estimate the expenses that you paid over the period. Simply divide your account value by $1,000 (for example, an $8,600 account value divided by $1,000 = 8.6), then multiply the result by the number in the “Actual” line under the heading entitled “Expenses paid during period” for your applicable class of shares to estimate the expenses you paid on your account during this period.
Hypothetical example for comparison purposes
The “Hypothetical” line of the table below provides information about hypothetical account values and hypothetical expenses based on the Fund’s actual expense ratio and an assumed rate of return of 5% per year before expenses, which is not the Fund’s actual return. The hypothetical account values and expenses may not be used to estimate the actual ending account balance or expenses you paid for the period. You may use this information to compare the ongoing costs of investing in the Fund and other funds. To do so, compare this 5% hypothetical example with the 5% hypothetical examples that appear in the shareholder reports of the other funds.
Please note that the expenses shown in the table are meant to highlight your ongoing costs only and do not reflect any transactional costs, such as sales charges (loads) and contingent deferred sales charges. Therefore, the “Hypothetical” line of the table is useful in comparing ongoing costs only and will not help you determine the relative total costs of owning different funds. In addition, if these transactional costs were included, your costs would have been higher.
| | | | | | | | | | | | | | | | |
| | | Beginning account value 2-1-2016 | | | Ending account value 7-31-2016 | | | Expenses paid during the period¹ | | | Annualized net expense ratio | |
Class A | | | | | | | | | | | | | | | | |
Actual | | $ | 1,000.00 | | | $ | 1,094.34 | | | $ | 5.57 | | | | 1.07 | % |
Hypothetical (5% return before expenses) | | $ | 1,000.00 | | | $ | 1,019.54 | | | $ | 5.37 | | | | 1.07 | % |
Class C | | | | | | | | | | | | | | | | |
Actual | | $ | 1,000.00 | | | $ | 1,090.19 | | | $ | 9.46 | | | | 1.82 | % |
Hypothetical (5% return before expenses) | | $ | 1,000.00 | | | $ | 1,015.81 | | | $ | 9.12 | | | | 1.82 | % |
Class R | | | | | | | | | | | | | | | | |
Actual | | $ | 1,000.00 | | | $ | 1,092.96 | | | $ | 6.87 | | | | 1.32 | % |
Hypothetical (5% return before expenses) | | $ | 1,000.00 | | | $ | 1,018.30 | | | $ | 6.62 | | | | 1.32 | % |
Class R4 | | | | | | | | | | | | | | | | |
Actual | | $ | 1,000.00 | | | $ | 1,096.01 | | | $ | 4.17 | | | | 0.80 | % |
Hypothetical (5% return before expenses) | | $ | 1,000.00 | | | $ | 1,020.89 | | | $ | 4.02 | | | | 0.80 | % |
Class R6 | | | | | | | | | | | | | | | | |
Actual | | $ | 1,000.00 | | | $ | 1,096.74 | | | $ | 3.39 | | | | 0.65 | % |
Hypothetical (5% return before expenses) | | $ | 1,000.00 | | | $ | 1,021.63 | | | $ | 3.27 | | | | 0.65 | % |
Administrator Class | | | | | | | | | | | | | | | | |
Actual | | $ | 1,000.00 | | | $ | 1,095.04 | | | $ | 4.95 | | | | 0.95 | % |
Hypothetical (5% return before expenses) | | $ | 1,000.00 | | | $ | 1,020.14 | | | $ | 4.77 | | | | 0.95 | % |
Institutional Class | | | | | | | | | | | | | | | | |
Actual | | $ | 1,000.00 | | | $ | 1,095.90 | | | $ | 3.91 | | | | 0.75 | % |
Hypothetical (5% return before expenses) | | $ | 1,000.00 | | | $ | 1,021.13 | | | $ | 3.77 | | | | 0.75 | % |
| 1 | Expenses paid is equal to the annualized net expense ratio of each class multiplied by the average account value over the period, multiplied by the number of days in the most recent fiscal half-year divided by the number of days in the fiscal year (to reflect the one-half-year period). |
| | | | | | |
| Portfolio of investments—July 31, 2016 | | Wells Fargo Large Cap Growth Fund | | | 11 | |
| | | | | | | | | | | | | | | | |
| Security name | | | | | | | | Shares | | | Value | |
| | | | |
Common Stocks: 98.67% | | | | | | | | | | | | | | | | |
| | | | |
Consumer Discretionary: 25.80% | | | | | | | | | | | | | | | | |
| | | | |
| Auto Components: 0.29% | | | | | | | | | | | | | | | | |
Delphi Automotive plc | | | | | | | | | | | 59,470 | | | $ | 4,033,255 | |
| | | | | | | | | | | | | | | | |
| | | | |
| Hotels, Restaurants & Leisure: 3.47% | | | | | | | | | | | | | | | | |
Hilton Worldwide Holdings Incorporated | | | | | | | | | | | 319,960 | | | | 7,419,872 | |
Marriott International Incorporated Class A « | | | | | | | | | | | 157,440 | | | | 11,288,448 | |
Starbucks Corporation | | | | | | | | | | | 509,300 | | | | 29,564,865 | |
| |
| | | | 48,273,185 | |
| | | | | | | | | | | | | | | | |
| | | | |
| Internet & Catalog Retail: 4.74% | | | | | | | | | | | | | | | | |
Amazon.com Incorporated † | | | | | | | | | | | 73,900 | | | | 56,076,059 | |
The Priceline Group Incorporated † | | | | | | | | | | | 7,340 | | | | 9,914,945 | |
| |
| | | | 65,991,004 | |
| | | | | | | | | | | | | | | | |
| | | | |
| Media: 1.50% | | | | | | | | | | | | | | | | |
The Walt Disney Company | | | | | | | | | | | 216,900 | | | | 20,811,555 | |
| | | | | | | | | | | | | | | | |
| | | | |
| Multiline Retail: 3.60% | | | | | | | | | | | | | | | | |
Dollar Tree Incorporated † | | | | | | | | | | | 521,090 | | | | 50,175,756 | |
| | | | | | | | | | | | | | | | |
| | | | |
| Specialty Retail: 7.58% | | | | | | | | | | | | | | | | |
CarMax Incorporated Ǡ | | | | | | | | | | | 120,360 | | | | 7,012,174 | |
O’Reilly Automotive Incorporated † | | | | | | | | | | | 111,800 | | | | 32,492,434 | |
The Home Depot Incorporated | | | | | | | | | | | 234,840 | | | | 32,464,282 | |
Tractor Supply Company | | | | | | | | | | | 270,010 | | | | 24,746,417 | |
ULTA Salon, Cosmetics and Fragrance Incorporated † | | | | | | | | | | | 33,380 | | | | 8,719,190 | |
| |
| | | | 105,434,497 | |
| | | | | | | | | | | | | | | | |
| | | | |
| Textiles, Apparel & Luxury Goods: 4.62% | | | | | | | | | | | | | | | | |
Nike Incorporated Class B | | | | | | | | | | | 523,740 | | | | 29,067,570 | |
Under Armour Incorporated Class A « | | | | | | | | | | | 270,970 | | | | 10,692,476 | |
VF Corporation | | | | | | | | | | | 394,130 | | | | 24,605,536 | |
| |
| | | | 64,365,582 | |
| | | | | | | | | | | | | | | | |
| | | | |
Consumer Staples: 6.64% | | | | | | | | | | | | | | | | |
| | | | |
| Food & Staples Retailing: 4.42% | | | | | | | | | | | | | | | | |
Costco Wholesale Corporation | | | | | | | | | | | 224,940 | | | | 37,614,467 | |
CVS Health Corporation | | | | | | | | | | | 257,660 | | | | 23,890,235 | |
| |
| | | | 61,504,702 | |
| | | | | | | | | | | | | | | | |
| | | | |
| Household Products: 0.68% | | | | | | | | | | | | | | | | |
Colgate-Palmolive Company | | | | | | | | | | | 126,360 | | | | 9,404,975 | |
| | | | | | | | | | | | | | | | |
| | | | |
| Personal Products: 1.54% | | | | | | | | | | | | | | | | |
The Estee Lauder Companies Incorporated Class A | | | | | | | | | | | 231,420 | | | | 21,498,918 | |
| | | | | | | | | | | | | | | | |
The accompanying notes are an integral part of these financial statements.
| | | | |
| 12 | | Wells Fargo Large Cap Growth Fund | | Portfolio of investments—July 31, 2016 |
| | | | | | | | | | | | | | | | |
| Security name | | | | | | | | Shares | | | Value | |
| | | | |
Energy: 2.01% | | | | | | | | | | | | | | | | |
| | | | |
| Energy Equipment & Services: 0.45% | | | | | | | | | | | | | | | | |
Schlumberger Limited | | | | | | | | | | | 77,480 | | | $ | 6,238,690 | |
| | | | | | | | | | | | | | | | |
| | | | |
| Oil, Gas & Consumable Fuels: 1.56% | | | | | | | | | | | | | | | | |
Concho Resources Incorporated † | | | | | | | | | | | 175,280 | | | | 21,769,776 | |
| | | | | | | | | | | | | | | | |
| | | | |
Financials: 0.20% | | | | | | | | | | | | | | | | |
| | | | |
| Capital Markets: 0.20% | | | | | | | | | | | | | | | | |
TD Ameritrade Holding Corporation | | | | | | | | | | | 91,120 | | | | 2,766,403 | |
| | | | | | | | | | | | | | | | |
| | | | |
Health Care: 14.14% | | | | | | | | | | | | | | | | |
| | | | |
| Biotechnology: 7.23% | | | | | | | | | | | | | | | | |
Alexion Pharmaceuticals Incorporated † | | | | | | | | | | | 215,070 | | | | 27,658,002 | |
Amgen Incorporated | | | | | | | | | | | 12,000 | | | | 2,064,360 | |
BioMarin Pharmaceutical Incorporated † | | | | | | | | | | | 153,180 | | | | 15,229,156 | |
Celgene Corporation † | | | | | | | | | | | 227,380 | | | | 25,509,762 | |
Incyte Corporation † | | | | | | | | | | | 53,460 | | | | 4,822,627 | |
Regeneron Pharmaceuticals Incorporated † | | | | | | | | | | | 38,850 | | | | 16,515,912 | |
Vertex Pharmaceuticals Incorporated † | | | | | | | | | | | 91,370 | | | | 8,862,890 | |
| |
| | | | 100,662,709 | |
| | | | | | | | | | | | | | | | |
| | | | |
| Health Care Equipment & Supplies: 2.85% | | | | | | | | | | | | | | | | |
Danaher Corporation | | | | | | | | | | | 149,930 | | | | 12,210,299 | |
Medtronic plc | | | | | | | | | | | 312,650 | | | | 27,397,520 | |
| |
| | | | 39,607,819 | |
| | | | | | | | | | | | | | | | |
| | | | |
| Health Care Technology: 1.45% | | | | | | | | | | | | | | | | |
Cerner Corporation † | | | | | | | | | | | 323,070 | | | | 20,156,337 | |
| | | | | | | | | | | | | | | | |
| | | | |
| Life Sciences Tools & Services: 0.37% | | | | | | | | | | | | | | | | |
Quintiles Transnational Holdings Incorporated † | | | | | | | | | | | 67,360 | | | | 5,229,830 | |
| | | | | | | | | | | | | | | | |
| | | | |
| Pharmaceuticals: 2.24% | | | | | | | | | | | | | | | | |
Bristol-Myers Squibb Company | | | | | | | | | | | 317,680 | | | | 23,765,641 | |
Zoetis Incorporated | | | | | | | | | | | 145,910 | | | | 7,364,078 | |
| |
| | | | 31,129,719 | |
| | | | | | | | | | | | | | | | |
| | | | |
Industrials: 7.26% | | | | | | | | | | | | | | | | |
| | | | |
| Aerospace & Defense: 0.77% | | | | | | | | | | | | | | | | |
The Boeing Company | | | | | | | | | | | 80,080 | | | | 10,703,493 | |
| | | | | | | | | | | | | | | | |
| | | | |
| Airlines: 0.99% | | | | | | | | | | | | | | | | |
Southwest Airlines Company | | | | | | | | | | | 372,313 | | | | 13,779,304 | |
| | | | | | | | | | | | | | | | |
| | | | |
| Electrical Equipment: 0.62% | | | | | | | | | | | | | | | | |
Rockwell Automation Incorporated | | | | | | | | | | | 75,000 | | | | 8,580,000 | |
| | | | | | | | | | | | | | | | |
| | | | |
| Industrial Conglomerates: 1.53% | | | | | | | | | | | | | | | | |
3M Company | | | | | | | | | | | 119,560 | | | | 21,324,722 | |
| | | | | | | | | | | | | | | | |
The accompanying notes are an integral part of these financial statements.
| | | | | | |
| Portfolio of investments—July 31, 2016 | | Wells Fargo Large Cap Growth Fund | | | 13 | |
| | | | | | | | | | | | | | | | |
| Security name | | | | | | | | Shares | | | Value | |
| | | | |
| Machinery: 0.26% | | | | | | | | | | | | | | | | |
Fortive Corporation † | | | | | | | | | | | 74,960 | | | $ | 3,613,822 | |
| | | | | | | | | | | | | | | | |
| | | | |
| Road & Rail: 3.09% | | | | | | | | | | | | | | | | |
Kansas City Southern | | | | | | | | | | | 153,160 | | | | 14,720,208 | |
Union Pacific Corporation | | | | | | | | | | | 304,440 | | | | 28,328,142 | |
| |
| | | | 43,048,350 | |
| | | | | | | | | | | | | | | | |
| | | | |
Information Technology: 39.15% | | | | | | | | | | | | | | | | |
| | | | |
| Communications Equipment: 1.17% | | | | | | | | | | | | | | | | |
Palo Alto Networks Incorporated † | | | | | | | | | | | 124,190 | | | | 16,255,229 | |
| | | | | | | | | | | | | | | | |
| | | | |
| Internet Software & Services: 11.63% | | | | | | | | | | | | | | | | |
Alphabet Incorporated Class A † | | | | | | | | | | | 62,530 | | | | 49,482,490 | |
Alphabet Incorporated Class C † | | | | | | | | | | | 49,270 | | | | 37,878,283 | |
Facebook Incorporated Class A † | | | | | | | | | | | 601,630 | | | | 74,566,022 | |
| |
| | | | 161,926,795 | |
| | | | | | | | | | | | | | | | |
| | | | |
| IT Services: 8.36% | | | | | | | | | | | | | | | | |
Accenture plc Class A | | | | | | | | | | | 177,410 | | | | 20,013,622 | |
Cognizant Technology Solutions Corporation Class A † | | | | | | | | | | | 155,640 | | | | 8,947,744 | |
MasterCard Incorporated Class A | | | | | | | | | | | 380,400 | | | | 36,229,296 | |
PayPal Holdings Incorporated † | | | | | | | | | | | 394,360 | | | | 14,685,966 | |
Visa Incorporated Class A | | | | | | | | | | | 467,480 | | | | 36,486,814 | |
| |
| | | | 116,363,442 | |
| | | | | | | | | | | | | | | | |
| | | | |
| Semiconductors & Semiconductor Equipment: 6.24% | | | | | | | | | | | | | | | | |
Broadcom Limited | | | | | | | | | | | 155,380 | | | | 25,168,451 | |
Microchip Technology Incorporated « | | | | | | | | | | | 520,040 | | | | 28,935,026 | |
QUALCOMM Incorporated | | | | | | | | | | | 68,450 | | | | 4,283,601 | |
Texas Instruments Incorporated | | | | | | | | | | | 407,260 | | | | 28,406,385 | |
| |
| | | | 86,793,463 | |
| | | | | | | | | | | | | | | | |
| | | | |
| Software: 10.24% | | | | | | | | | | | | | | | | |
Activision Blizzard Incorporated | | | | | | | | | | | 186,000 | | | | 7,469,760 | |
Adobe Systems Incorporated † | | | | | | | | | | | 218,700 | | | | 21,401,982 | |
Microsoft Corporation | | | | | | | | | | | 879,950 | | | | 49,875,566 | |
Mobileye NV † | | | | | | | | | | | 45,630 | | | | 2,186,133 | |
Red Hat Incorporated † | | | | | | | | | | | 170,280 | | | | 12,820,381 | |
Salesforce.com Incorporated † | | | | | | | | | | | 288,700 | | | | 23,615,660 | |
ServiceNow Incorporated † | | | | | | | | | | | 171,810 | | | | 12,872,005 | |
Splunk Incorporated † | | | | | | | | | | | 197,170 | | | | 12,331,012 | |
| |
| | | | 142,572,499 | |
| | | | | | | | | | | | | | | | |
| | | | |
| Technology Hardware, Storage & Peripherals: 1.51% | | | | | | | | | | | | | | | | |
Apple Incorporated | | | | | | | | | | | 201,200 | | | | 20,967,052 | |
| | | | | | | | | | | | | | | | |
The accompanying notes are an integral part of these financial statements.
| | | | |
| 14 | | Wells Fargo Large Cap Growth Fund | | Portfolio of investments—July 31, 2016 |
| | | | | | | | | | | | | | | | |
| Security name | | | | | | | | Shares | | | Value | |
| | | | |
Materials: 3.47% | | | | | | | | | | | | | | | | |
| | | | |
| Chemicals: 3.47% | | | | | | | | | | | | | | | | |
Ecolab Incorporated | | | | | | | | | | | 236,860 | | | $ | 28,039,487 | |
Praxair Incorporated | | | | | | | | | | | 173,320 | | | | 20,198,713 | |
| |
| | | | 48,238,200 | |
| | | | | | | | | | | | | | | | |
| |
Total Common Stocks (Cost $855,949,807) | | | | 1,373,221,083 | |
| | | | | | | | | | | | | | | | |
| | | | |
| | | Yield | | | | | | | | | | |
| Short-Term Investments: 4.03% | | | | | | | | | | | | | | | | |
| | | | |
| Investment Companies: 4.03% | | | | | | | | | | | | | | | | |
Securities Lending Cash Investments LLC (l)(r)(u) | | | 0.50 | % | | | | | | | 39,207,100 | | | | 39,207,100 | |
Wells Fargo Government Money Market Fund Select Class (l)(u) | | | 0.32 | | | | | | | | 16,831,628 | | | | 16,831,628 | |
| | | | |
Total Short-Term Investments (Cost $56,038,728) | | | | | | | | | | | | | | | 56,038,728 | |
| | | | | | | | | | | | | | | | |
| | | | | | | | |
| Total investments in securities (Cost $911,988,535) * | | | 102.70 | % | | | 1,429,259,811 | |
Other assets and liabilities, net | | | (2.70 | ) | | | (37,571,300 | ) |
| | | | | | | | |
| Total net assets | | | 100.00 | % | | $ | 1,391,688,511 | |
| | | | | | | | |
| « | All or a portion of this security is on loan. |
| † | Non-income-earning security |
| (l) | The issuer of the security is an affiliated person of the Fund as defined in the Investment Company Act of 1940. |
| (r) | The investment is a non-registered investment vehicle purchased with cash collateral received from securities on loan. |
| (u) | The rate represents the 7-day annualized yield at period end. |
| * | Cost for federal income tax purposes is $913,879,466 and unrealized gains (losses) consists of: |
| | | | |
Gross unrealized gains | | $ | 526,221,303 | |
Gross unrealized losses | | | (10,840,958 | ) |
| | | | |
Net unrealized gains | | $ | 515,380,345 | |
The accompanying notes are an integral part of these financial statements.
| | | | | | |
| Statement of assets and liabilities—July 31, 2016 | | Wells Fargo Large Cap Growth Fund | | | 15 | |
| | | | |
| | | | |
| |
Assets | | | | |
Investments | | | | |
In unaffiliated securities (including $38,112,159 of securities loaned), at value (cost $855,949,807) | | $ | 1,373,221,083 | |
In affiliated securities, at value (cost $56,038,728) | | | 56,038,728 | |
| | | | |
Total investments, at value (cost $911,988,535) | | | 1,429,259,811 | |
Receivable for investments sold | | | 6,786,832 | |
Receivable for Fund shares sold | | | 865,246 | |
Receivable for dividends | | | 543,396 | |
Receivable for securities lending income | | | 22,174 | |
Prepaid expenses and other assets | | | 60,675 | |
| | | | |
Total assets | | | 1,437,538,134 | |
| | | | |
| |
Liabilities | | | | |
Payable for investments purchased | | | 3,951,192 | |
Payable for Fund shares redeemed | | | 1,471,169 | |
Payable upon receipt of securities loaned | | | 39,207,100 | |
Management fee payable | | | 708,921 | |
Distribution fees payable | | | 13,664 | |
Administration fees payable | | | 180,160 | |
Accrued expenses and other liabilities | | | 317,417 | |
| | | | |
Total liabilities | | | 45,849,623 | |
| | | | |
Total net assets | | $ | 1,391,688,511 | |
| | | | |
| |
NET ASSETS CONSIST OF | | | | |
Paid-in capital | | $ | 841,664,040 | |
Overdistributed net investment income | | | (25,370 | ) |
Accumulated net realized gains on investments | | | 32,778,565 | |
Net unrealized gains on investments | | | 517,271,276 | |
| | | | |
Total net assets | | $ | 1,391,688,511 | |
| | | | |
| |
COMPUTATION OF NET ASSET VALUE AND OFFERING PRICE PER SHARE | | | | |
Net assets – Class A | | $ | 576,501,554 | |
Shares outstanding – Class A1 | | | 12,519,808 | |
Net asset value per share – Class A | | | $46.05 | |
Maximum offering price per share – Class A2 | | | $48.86 | |
Net assets – Class C | | $ | 18,876,866 | |
Shares outstanding – Class C1 | | | 430,183 | |
Net asset value per share – Class C | | | $43.88 | |
Net assets – Class R | | $ | 8,218,316 | |
Shares outstanding – Class R1 | | | 180,622 | |
Net asset value per share – Class R | | | $45.50 | |
Net assets – Class R4 | | $ | 8,399,688 | |
Share outstanding – Class R41 | | | 179,921 | |
Net asset value per share – Class R4 | | | $46.69 | |
Net assets – Class R6 | | $ | 225,805,288 | |
Shares outstanding – Class R61 | | | 4,823,047 | |
Net asset value per share – Class R6 | | | $46.82 | |
Net assets – Administrator Class | | $ | 237,576,677 | |
Shares outstanding – Administrator Class1 | | | 5,129,545 | |
Net asset value per share – Administrator Class | | | $46.32 | |
Net assets – Institutional Class | | $ | 316,310,122 | |
Shares outstanding – Institutional Class1 | | | 6,767,018 | |
Net asset value per share – Institutional Class | | | $46.74 | |
| 1 | The Fund has an unlimited number of authorized shares. |
| 2 | Maximum offering price is computed as 100/94.25 of net asset value. On investments of $50,000 or more, the offering price is reduced. |
The accompanying notes are an integral part of these financial statements.
| | | | |
| 16 | | Wells Fargo Large Cap Growth Fund | | Statement of operations—year ended July 31, 2016 |
| | | | |
| | | | |
| |
Investment income | | | | |
Dividends (net of foreign withholding taxes of $2,320) | | $ | 15,562,652 | |
Securities lending income, net | | | 212,487 | |
Income from affiliated securities | | | 48,348 | |
| | | | |
Total investment income | | | 15,823,487 | |
| | | | |
| |
Expenses | | | | |
Management fee | | | 9,978,513 | |
Administration fees | | | | |
Class A | | | 1,028,499 | |
Class C | | | 42,027 | |
Class R | | | 21,838 | |
Class R4 | | | 5,839 | |
Class R6 | | | 44,588 | |
Administrator Class | | | 306,498 | |
Institutional Class | | | 599,663 | |
Investor Class | | | 334,829 | 1 |
Shareholder servicing fees | | | | |
Class A | | | 1,224,403 | |
Class C | | | 50,033 | |
Class R | | | 25,997 | |
Class R4 | | | 7,299 | |
Administrator Class | | | 589,191 | |
Investor Class | | | 261,244 | 1 |
Distribution fees | | | | |
Class C | | | 150,098 | |
Class R | | | 25,997 | |
Custody and accounting fees | | | 80,195 | |
Professional fees | | | 43,149 | |
Registration fees | | | 113,138 | |
Shareholder report expenses | | | 112,567 | |
Trustees’ fees and expenses | | | 25,010 | |
Other fees and expenses | | | 31,453 | |
| | | | |
Total expenses | | | 15,102,068 | |
Less: Fee waivers and/or expense reimbursements | | | (1,642,326 | ) |
| | | | |
Net expenses | | | 13,459,742 | |
| | | | |
Net investment income | | | 2,363,745 | |
| | | | |
| |
REALIZED AND UNREALIZED GAINS (LOSSES) ON INVESTMENTS | | | | |
Net realized gains on investments | | | 44,634,435 | |
Net change in unrealized gains (losses) on investments | | | (80,144,617 | ) |
| | | | |
Net realized and unrealized gains (losses) on investments | | | (35,510,182 | ) |
| | | | |
Net decrease in net assets resulting from operations | | $ | (33,146,437 | ) |
| | | | |
| 1 | For the period from August 1, 2015 to October 23, 2015. Effective at the close of business on October 23, 2015, Investor Class shares were converted to Class A shares and are no longer offered by the Fund. |
The accompanying notes are an integral part of these financial statements.
| | | | | | |
| Statement of changes in net assets | | Wells Fargo Large Cap Growth Fund | | | 17 | |
| | | | | | | | | | | | | | | | |
| | | Year ended July 31, 2016 | | | Year ended July 31, 2015 | |
| | | |
Operations | | | | | | | | | | | | |
Net investment income | | | | | | $ | 2,363,745 | | | | | | | $ | 2,126,502 | |
Net realized gains on investments | | | | | | | 44,634,435 | | | | | | | | 86,753,919 | |
Net change in unrealized gains (losses) on investments | | | | | | | (80,144,617 | ) | | | | | | | 129,352,284 | |
| | | | |
Net increase (decrease) in net assets resulting from operations | | | | | | | (33,146,437 | ) | | | | | | | 218,232,705 | |
| | | | |
| | | |
Distributions to shareholders from | | | | | | | | | | | | |
Net investment income | | | | | | | | | | | | | | | | |
Class A | | | | | | | (8,533 | ) | | | | | | | 0 | |
Class R4 | | | | | | | (26,255 | ) | | | | | | | 0 | |
Class R6 | | | | | | | (542,444 | ) | | | | | | | (5,386 | ) |
Administrator Class | | | | | | | (399,214 | ) | | | | | | | 0 | |
Institutional Class | | | | | | | (2,359,767 | ) | | | | | | | (392,482 | ) |
Net realized gains | | | | | | | | | | | | | | | | |
Class A | | | | | | | (33,357,991 | ) | | | | | | | (9,083,839 | ) |
Class C | | | | | | | (1,130,136 | ) | | | | | | | (1,024,179 | ) |
Class R | | | | | | | (642,814 | ) | | | | | | | (537,456 | ) |
Class R4 | | | | | | | (366,120 | ) | | | | | | | (95,079 | ) |
Class R6 | | | | | | | (5,970,675 | ) | | | | | | | (286,515 | ) |
Administrator Class | | | | | | | (12,858,667 | ) | | | | | | | (10,809,644 | ) |
Institutional Class | | | | | | | (26,507,074 | ) | | | | | | | (26,749,730 | ) |
Investor Class | | | | | | | 0 | 1 | | | | | | | (21,002,277 | ) |
| | | | |
Total distributions to shareholders | | | | | | | (84,169,690 | ) | | | | | | | (69,986,587 | ) |
| | | | |
| | | | |
Capital share transactions | | | Shares | | | | | | | | Shares | | | | | |
Proceeds from shares sold | | | | | | | | | | | | | | | | |
Class A | | | 10,423,557 | | | | 507,133,935 | | | | 604,229 | | | | 28,340,904 | |
Class C | | | 94,075 | | | | 4,156,298 | | | | 91,683 | | | | 4,185,001 | |
Class R | | | 93,883 | | | | 4,246,909 | | | | 83,403 | | | | 3,934,240 | |
Class R4 | | | 47,194 | | | | 2,095,908 | | | | 109,342 | | | | 5,395,990 | |
Class R6 | | | 2,853,291 | | | | 127,876,221 | | | | 2,237,120 | | | | 108,798,050 | |
Administrator Class | | | 871,378 | | | | 39,477,413 | | | | 1,113,913 | | | | 52,906,429 | |
Institutional Class | | | 1,620,978 | | | | 73,346,308 | | | | 1,575,447 | | | | 75,088,702 | |
Investor Class | | | 88,699 | 1 | | | 4,159,389 | 1 | | | 770,891 | | | | 36,000,565 | |
| | | | |
| | | | | | | 762,492,381 | | | | | | | | 314,649,881 | |
| | | | |
Reinvestment of distributions | | | | | | | | | | | | | | | | |
Class A | | | 689,341 | | | | 31,248,057 | | | | 162,603 | | | | 7,413,043 | |
Class C | | | 21,233 | | | | 921,496 | | | | 17,563 | | | | 774,161 | |
Class R | | | 5,901 | | | | 264,733 | | | | 4,111 | | | | 186,032 | |
Class R4 | | | 8,508 | | | | 392,375 | | | | 2,062 | | | | 95,079 | |
Class R6 | | | 140,783 | | | | 6,513,119 | | | | 6,321 | | | | 291,901 | |
Administrator Class | | | 290,191 | | | | 13,252,210 | | | | 235,753 | | | | 10,802,180 | |
Institutional Class | | | 541,392 | | | | 25,023,933 | | | | 511,339 | | | | 23,607,785 | |
Investor Class | | | 0 | 1 | | | 0 | 1 | | | 448,656 | | | | 20,413,846 | |
| | | | |
| | | | | | | 77,615,923 | | | | | | | | 63,584,027 | |
| | | | |
Payment for shares redeemed | | | | | | | | | | | | | | | | |
Class A | | | (2,316,847 | ) | | | (103,461,789 | ) | | | (1,728,758 | ) | | | (81,675,715 | ) |
Class C | | | (164,112 | ) | | | (7,122,729 | ) | | | (147,803 | ) | | | (6,761,459 | ) |
Class R | | | (165,274 | ) | | | (7,268,281 | ) | | | (114,456 | ) | | | (5,361,082 | ) |
Class R4 | | | (19,211 | ) | | | (894,912 | ) | | | (14,494 | ) | | | (712,377 | ) |
Class R6 | | | (509,940 | ) | | | (23,062,787 | ) | | | (34,221 | ) | | | (1,666,642 | ) |
Administrator Class | | | (1,299,777 | ) | | | (59,103,069 | ) | | | (1,474,270 | ) | | | (70,446,514 | ) |
Institutional Class | | | (6,030,432 | ) | | | (274,102,744 | ) | | | (4,464,060 | ) | | | (215,627,720 | ) |
Investor Class | | | (9,823,525 | )1 | | | (479,180,351 | )1 | | | (1,815,052 | ) | | | (85,116,561 | ) |
| | | | |
| | | | | | | (954,196,662 | ) | | | | | | | (467,368,070 | ) |
| | | | |
Net decrease in net assets resulting from capital share transactions | | | | | | | (114,088,358 | ) | | | | | | | (89,134,162 | ) |
| | | | |
Total increase (decrease) in net assets | | | | | | | (231,404,485 | ) | | | | | | | 59,111,956 | |
| | | | |
| | |
Net assets | | | | | | | | |
Beginning of period | | | | | | | 1,623,092,996 | | | | | | | | 1,563,981,040 | |
| | | | |
End of period | | | | | | $ | 1,391,688,511 | | | | | | | $ | 1,623,092,996 | |
| | | | |
Undistributed (overdistributed) net investment income | | | | | | $ | (25,370 | ) | | | | | | $ | 1,032,532 | |
| | | | |
| 1 | For the period from August 1, 2015 to October 23, 2015. Effective at the close of business on October 23, 2015, Investor Class shares were converted to Class A shares and are no longer offered by the Fund. |
The accompanying notes are an integral part of these financial statements.
| | | | |
| 18 | | Wells Fargo Large Cap Growth Fund | | Financial highlights |
(For a share outstanding throughout each period)
| | | | | | | | | | | | | | | | | | | | |
| | | Year ended July 31 | |
| CLASS A | | 2016 | | | 2015 | | | 2014 | | | 2013 | | | 2012 | |
Net asset value, beginning of period | | | $49.55 | | | | $45.30 | | | | $39.73 | | | | $32.92 | | | | $31.62 | |
Net investment income (loss) | | | (0.03 | )1 | | | (0.01 | )1 | | | (0.06 | ) | | | 0.04 | | | | (0.12 | )1 |
Net realized and unrealized gains (losses) on investments | | | (0.92 | ) | | | 6.33 | | | | 7.01 | | | | 6.81 | | | | 1.42 | |
| | | | | | | | | | | | | | | | | | | | |
Total from investment operations | | | (0.95 | ) | | | 6.32 | | | | 6.95 | | | | 6.85 | | | | 1.30 | |
Distributions to shareholders from | | | | | | | | | | | | | | | | | | | | |
Net investment income | | | (0.00 | )2 | | | 0.00 | | | | 0.00 | | | | (0.04 | ) | | | 0.00 | |
Net realized gains | | | (2.55 | ) | | | (2.07 | ) | | | (1.38 | ) | | | 0.00 | | | | 0.00 | |
| | | | | | | | | | | | | | | | | | | | |
Total distributions to shareholders | | | (2.55 | ) | | | (2.07 | ) | | | (1.38 | ) | | | (0.04 | ) | | | 0.00 | |
Net asset value, end of period | | | $46.05 | | | | $49.55 | | | | $45.30 | | | | $39.73 | | | | $32.92 | |
Total return3 | | | (1.83 | )% | | | 14.35 | % | | | 17.69 | % | | | 20.84 | % | | | 4.08 | % |
Ratios to average net assets (annualized) | | | | | | | | | | | | | | | | | | | | |
Gross expenses | | | 1.16 | % | | | 1.20 | % | | | 1.22 | % | | | 1.23 | % | | | 1.24 | % |
Net expenses | | | 1.07 | % | | | 1.07 | % | | | 1.07 | % | | | 1.07 | % | | | 1.10 | % |
Net investment income (loss) | | | (0.06 | )% | | | (0.02 | )% | | | (0.17 | )% | | | 0.09 | % | | | (0.37 | )% |
Supplemental data | | | | | | | | | | | | | | | | | | | | |
Portfolio turnover rate | | | 31 | % | | | 26 | % | | | 35 | % | | | 57 | % | | | 46 | % |
Net assets, end of period (000s omitted) | | | $576,502 | | | | $184,504 | | | | $212,273 | | | | $131,616 | | | | $75,149 | |
| 1 | Calculated based upon average shares outstanding |
| 2 | Amount is less than $0.005. |
| 3 | Total return calculations do not include any sales charges. |
The accompanying notes are an integral part of these financial statements.
| | | | | | |
| Financial highlights | | Wells Fargo Large Cap Growth Fund | | | 19 | |
(For a share outstanding throughout each period)
| | | | | | | | | | | | | | | | | | | | |
| | | Year ended July 31 | |
| CLASS C | | 2016 | | | 2015 | | | 2014 | | | 2013 | | | 2012 | |
Net asset value, beginning of period | | | $47.68 | | | | $43.99 | | | | $38.90 | | | | $32.43 | | | | $31.38 | |
Net investment loss | | | (0.32 | )1 | | | (0.42 | ) | | | (0.33 | ) | | | (0.20 | ) | | | (0.37 | )1 |
Net realized and unrealized gains (losses) on investments | | | (0.93 | ) | | | 6.18 | | | | 6.80 | | | | 6.67 | | | | 1.42 | |
| | | | | | | | | | | | | | | | | | | | |
Total from investment operations | | | (1.25 | ) | | | 5.76 | | | | 6.47 | | | | 6.47 | | | | 1.05 | |
Distributions to shareholders from | | | | | | | | | | | | | | | | | | | | |
Net realized gains | | | (2.55 | ) | | | (2.07 | ) | | | (1.38 | ) | | | 0.00 | | | | 0.00 | |
Net asset value, end of period | | | $43.88 | | | | $47.68 | | | | $43.99 | | | | $38.90 | | | | $32.43 | |
Total return2 | | | (2.56 | )% | | | 13.47 | % | | | 16.81 | % | | | 19.95 | % | | | 3.31 | % |
Ratios to average net assets (annualized) | | | | | | | | | | | | | | | | | | | | |
Gross expenses | | | 1.91 | % | | | 1.95 | % | | | 1.97 | % | | | 1.98 | % | | | 1.99 | % |
Net expenses | | | 1.82 | % | | | 1.82 | % | | | 1.82 | % | | | 1.82 | % | | | 1.84 | % |
Net investment loss | | | (0.75 | )% | | | (0.77 | )% | | | (0.89 | )% | | | (0.65 | )% | | | (1.16 | )% |
Supplemental data | | | | | | | | | | | | | | | | | | | | |
Portfolio turnover rate | | | 31 | % | | | 26 | % | | | 35 | % | | | 57 | % | | | 46 | % |
Net assets, end of period (000s omitted) | | | $18,877 | | | | $22,839 | | | | $22,767 | | | | $17,748 | | | | $11,829 | |
| 1 | Calculated based upon average shares outstanding |
| 2 | Total return calculations do not include any sales charges. |
The accompanying notes are an integral part of these financial statements.
| | | | |
| 20 | | Wells Fargo Large Cap Growth Fund | | Financial highlights |
(For a share outstanding throughout each period)
| | | | | | | | | | | | | | | | | | | | |
| | | Year ended July 31 | |
| CLASS R | | 2016 | | | 2015 | | | 2014 | | | 2013 | | | 20121 | |
Net asset value, beginning of period | | | $49.11 | | | | $45.03 | | | | $39.59 | | | | $32.86 | | | | $32.91 | |
Net investment loss | | | (0.10 | )2 | | | (0.16 | ) | | | (0.15 | ) | | | (0.06 | )2 | | | (0.05 | )2 |
Net realized and unrealized gains (losses) on investments | | | (0.96 | ) | | | 6.31 | | | | 6.97 | | | | 6.80 | | | | 0.00 | 3 |
| | | | | | | | | | | | | | | | | | | | |
Total from investment operations | | | (1.06 | ) | | | 6.15 | | | | 6.82 | | | | 6.74 | | | | (0.05 | ) |
Distributions to shareholders from | | | | | | | | | | | | | | | | | | | | |
Net investment income | | | 0.00 | | | | 0.00 | | | | 0.00 | | | | (0.01 | ) | | | 0.00 | |
Net realized gains | | | (2.55 | ) | | | (2.07 | ) | | | (1.38 | ) | | | 0.00 | | | | 0.00 | |
| | | | | | | | | | | | | | | | | | | | |
Total distributions to shareholders | | | (2.55 | ) | | | (2.07 | ) | | | (1.38 | ) | | | (0.01 | ) | | | 0.00 | |
Net asset value, end of period | | | $45.50 | | | | $49.11 | | | | $45.03 | | | | $39.59 | | | | $32.86 | |
Total return4 | | | (2.08 | )% | | | 14.05 | % | | | 17.42 | % | | | 20.53 | % | | | (0.15 | )% |
Ratios to average net assets (annualized) | | | | | | | | | | | | | | | | | | | | |
Gross expenses | | | 1.41 | % | | | 1.45 | % | | | 1.47 | % | | | 1.47 | % | | | 1.47 | % |
Net expenses | | | 1.32 | % | | | 1.32 | % | | | 1.32 | % | | | 1.32 | % | | | 1.32 | % |
Net investment loss | | | (0.23 | )% | | | (0.28 | )% | | | (0.41 | )% | | | (0.16 | )% | | | (0.95 | )% |
Supplemental data | | | | | | | | | | | | | | | | | | | | |
Portfolio turnover rate | | | 31 | % | | | 26 | % | | | 35 | % | | | 57 | % | | | 46 | % |
Net assets, end of period (000s omitted) | | | $8,218 | | | | $12,086 | | | | $12,295 | | | | $8,149 | | | | $5,065 | |
| 1 | For the period from June 15, 2012 (commencement of class operations) to July 31, 2012 |
| 2 | Calculated based upon average shares outstanding |
| 3 | Amount is less than $0.005. |
| 4 | Returns for periods of less than one year are not annualized. |
The accompanying notes are an integral part of these financial statements.
| | | | | | |
| Financial highlights | | Wells Fargo Large Cap Growth Fund | | | 21 | |
(For a share outstanding throughout each period)
| | | | | | | | | | | | | | | | |
| | | Year ended July 31 | |
| CLASS R4 | | 2016 | | | 2015 | | | 2014 | | | 20131 | |
Net asset value, beginning of period | | | $50.23 | | | | $45.76 | | | | $40.05 | | | | $34.26 | |
Net investment income | | | 0.13 | | | | 0.07 | | | | 0.08 | | | | 0.09 | |
Net realized and unrealized gains (losses) on investments | | | (0.95 | ) | | | 6.47 | | | | 7.11 | | | | 5.81 | |
| | | | | | | | | | | | | | | | |
Total from investment operations | | | (0.82 | ) | | | 6.54 | | | | 7.19 | | | | 5.90 | |
Distributions to shareholders from | | | | | | | | | | | | | | | | |
Net investment income | | | (0.17 | ) | | | 0.00 | | | | (0.10 | ) | | | (0.11 | ) |
Net realized gains | | | (2.55 | ) | | | (2.07 | ) | | | (1.38 | ) | | | 0.00 | |
| | | | | | | | | | | | | | | | |
Total distributions to shareholders | | | (2.72 | ) | | | (2.07 | ) | | | (1.48 | ) | | | (0.11 | ) |
Net asset value, end of period | | | $46.69 | | | | $50.23 | | | | $45.76 | | | | $40.05 | |
Total return2 | | | (1.54 | )% | | | 14.69 | % | | | 18.07 | % | | | 17.37 | % |
Ratios to average net assets (annualized) | | | | | | | | | | | | | | | | |
Gross expenses | | | 0.88 | % | | | 0.87 | % | | | 0.89 | % | | | 0.87 | % |
Net expenses | | | 0.78 | % | | | 0.75 | % | | | 0.75 | % | | | 0.75 | % |
Net investment income | | | 0.27 | % | | | 0.17 | % | | | 0.17 | % | | | 0.39 | % |
Supplemental data | | | | | | | | | | | | | | | | |
Portfolio turnover rate | | | 31 | % | | | 26 | % | | | 35 | % | | | 57 | % |
Net assets, end of period (000s omitted) | | | $8,400 | | | | $7,205 | | | | $2,129 | | | | $12 | |
| 1 | For the period from November 30, 2012 (commencement of class operations) to July 31, 2013 |
| 2 | Returns for periods of less than one year are not annualized. |
The accompanying notes are an integral part of these financial statements.
| | | | |
| 22 | | Wells Fargo Large Cap Growth Fund | | Financial highlights |
(For a share outstanding throughout each period)
| | | | | | | | | | | | | | | | |
| | | Year ended July 31 | |
| CLASS R6 | | 2016 | | | 2015 | | | 2014 | | | 20131 | |
Net asset value, beginning of period | | | $50.34 | | | | $45.82 | | | | $40.11 | | | | $34.26 | |
Net investment income | | | 0.22 | | | | 0.07 | 2 | | | 0.12 | | | | 0.15 | |
Net realized and unrealized gains (losses) on investments | | | (0.97 | ) | | | 6.56 | | | | 7.11 | | | | 5.82 | |
| | | | | | | | | | | | | | | | |
Total from investment operations | | | (0.75 | ) | | | 6.63 | | | | 7.23 | | | | 5.97 | |
Distributions to shareholders from | | | | | | | | | | | | | | | | |
Net investment income | | | (0.22 | ) | | | (0.04 | ) | | | (0.14 | ) | | | (0.12 | ) |
Net realized gains | | | (2.55 | ) | | | (2.07 | ) | | | (1.38 | ) | | | 0.00 | |
| | | | | | | | | | | | | | | | |
Total distributions to shareholders | | | (2.77 | ) | | | (2.11 | ) | | | (1.52 | ) | | | (0.12 | ) |
Net asset value, end of period | | | $46.82 | | | | $50.34 | | | | $45.82 | | | | $40.11 | |
Total return3 | | | (1.39 | )% | | | 14.88 | % | | | 18.25 | % | | | 17.48 | % |
Ratios to average net assets (annualized) | | | | | | | | | | | | | | | | |
Gross expenses | | | 0.73 | % | | | 0.72 | % | | | 0.74 | % | | | 0.75 | % |
Net expenses | | | 0.64 | % | | | 0.60 | % | | | 0.60 | % | | | 0.60 | % |
Net investment income | | | 0.39 | % | | | 0.13 | % | | | 0.29 | % | | | 0.26 | % |
Supplemental data | | | | | | | | | | | | | | | | |
Portfolio turnover rate | | | 31 | % | | | 26 | % | | | 35 | % | | | 57 | % |
Net assets, end of period (000s omitted) | | | $225,805 | | | | $117,741 | | | | $5,942 | | | | $2,278 | |
| 1 | For the period from November 30, 2012 (commencement of class operations) to July 31, 2013 |
| 2 | Calculated based upon average shares outstanding |
| 3 | Returns for periods of less than one year are not annualized. |
The accompanying notes are an integral part of these financial statements.
| | | | | | |
| Financial highlights | | Wells Fargo Large Cap Growth Fund | | | 23 | |
(For a share outstanding throughout each period)
| | | | | | | | | | | | | | | | | | | | |
| | | Year ended July 31 | |
| ADMINISTRATOR CLASS | | 2016 | | | 2015 | | | 2014 | | | 2013 | | | 2012 | |
Net asset value, beginning of period | | | $49.84 | | | | $45.50 | | | | $39.86 | | | | $33.02 | | | | $31.67 | |
Net investment income (loss) | | | 0.05 | | | | 0.05 | | | | (0.01 | ) | | | 0.09 | 1 | | | (0.06 | )1 |
Net realized and unrealized gains (losses) on investments | | | (0.94 | ) | | | 6.36 | | | | 7.04 | | | | 6.83 | | | | 1.41 | |
| | | | | | | | | | | | | | | | | | | | |
Total from investment operations | | | (0.89 | ) | | | 6.41 | | | | 7.03 | | | | 6.92 | | | | 1.35 | |
Distributions to shareholders from | | | | | | | | | | | | | | | | | | | | |
Net investment income | | | (0.08 | ) | | | 0.00 | | | | (0.01 | ) | | | (0.08 | ) | | | 0.00 | |
Net realized gains | | | (2.55 | ) | | | (2.07 | ) | | | (1.38 | ) | | | 0.00 | | | | 0.00 | |
| | | | | | | | | | | | | | | | | | | | |
Total distributions to shareholders | | | (2.63 | ) | | | (2.07 | ) | | | (1.39 | ) | | | (0.08 | ) | | | 0.00 | |
Net asset value, end of period | | | $46.32 | | | | $49.84 | | | | $45.50 | | | | $39.86 | | | | $33.02 | |
Total return | | | (1.71 | )% | | | 14.48 | % | | | 17.84 | % | | | 21.00 | % | | | 4.26 | % |
Ratios to average net assets (annualized) | | | | | | | | | | | | | | | | | | | | |
Gross expenses | | | 1.08 | % | | | 1.05 | % | | | 1.06 | % | | | 1.07 | % | | | 1.08 | % |
Net expenses | | | 0.95 | % | | | 0.95 | % | | | 0.95 | % | | | 0.95 | % | | | 0.95 | % |
Net investment income (loss) | | | 0.12 | % | | | 0.10 | % | | | (0.02 | )% | | | 0.24 | % | | | (0.17 | )% |
Supplemental data | | | | | | | | | | | | | | | | | | | | |
Portfolio turnover rate | | | 31 | % | | | 26 | % | | | 35 | % | | | 57 | % | | | 46 | % |
Net assets, end of period (000s omitted) | | | $237,577 | | | | $262,535 | | | | $245,364 | | | | $208,053 | | | | $75,099 | |
| 1 | Calculated based upon average shares outstanding |
The accompanying notes are an integral part of these financial statements.
| | | | |
| 24 | | Wells Fargo Large Cap Growth Fund | | Financial highlights |
(For a share outstanding throughout each period)
| | | | | | | | | | | | | | | | | | | | |
| | | Year ended July 31 | |
| INSTITUTIONAL CLASS | | 2016 | | | 2015 | | | 2014 | | | 2013 | | | 2012 | |
Net asset value, beginning of period | | | $50.30 | | | | $45.80 | | | | $40.11 | | | | $33.16 | | | | $31.73 | |
Net investment income (loss) | | | 0.17 | 1 | | | 0.19 | 1 | | | 0.11 | | | | 0.20 | | | | (0.08 | )1 |
Net realized and unrealized gains (losses) on investments | | | (0.96 | ) | | | 6.41 | | | | 7.09 | | | | 6.86 | | | | 1.51 | |
| | | | | | | | | | | | | | | | | | | | |
Total from investment operations | | | (0.79 | ) | | | 6.60 | | | | 7.20 | | | | 7.06 | | | | 1.43 | |
Distributions to shareholders from | | | | | | | | | | | | | | | | | | | | |
Net investment income | | | (0.22 | ) | | | (0.03 | ) | | | (0.13 | ) | | | (0.11 | ) | | | 0.00 | |
Net realized gains | | | (2.55 | ) | | | (2.07 | ) | | | (1.38 | ) | | | 0.00 | | | | 0.00 | |
| | | | | | | | | | | | | | | | | | | | |
Total distributions to shareholders | | | (2.77 | ) | | | (2.10 | ) | | | (1.51 | ) | | | (0.11 | ) | | | 0.00 | |
Net asset value, end of period | | | $46.74 | | | | $50.30 | | | | $45.80 | | | | $40.11 | | | | $33.16 | |
Total return | | | (1.49 | )% | | | 14.82 | % | | | 18.16 | % | | | 21.34 | % | | | 4.47 | % |
Ratios to average net assets (annualized) | | | | | | | | | | | | | | | | | | | | |
Gross expenses | | | 0.83 | % | | | 0.78 | % | | | 0.79 | % | | | 0.79 | % | | | 0.80 | % |
Net expenses | | | 0.71 | % | | | 0.65 | % | | | 0.65 | % | | | 0.69 | % | | | 0.75 | % |
Net investment income (loss) | | | 0.37 | % | | | 0.40 | % | | | 0.28 | % | | | 0.53 | % | | | (0.25 | )% |
Supplemental data | | | | | | | | | | | | | | | | | | | | |
Portfolio turnover rate | | | 31 | % | | | 26 | % | | | 35 | % | | | 57 | % | | | 46 | % |
Net assets, end of period (000s omitted) | | | $316,310 | | | | $534,975 | | | | $596,006 | | | | $508,853 | | | | $601,684 | |
| 1 | Calculated based upon average shares outstanding |
The accompanying notes are an integral part of these financial statements.
| | | | | | |
| Notes to financial statements | | Wells Fargo Large Cap Growth Fund | | | 25 | |
1. ORGANIZATION
Wells Fargo Funds Trust (the “Trust”), a Delaware statutory trust organized on March 10, 1999, is an open-end management investment company registered under the Investment Company Act of 1940, as amended (the “1940 Act”). As an investment company, the Trust follows the accounting and reporting guidance in Financial Accounting Standards Board (“FASB”) Accounting Standards Codification Topic 946, Financial Services – Investment Companies. These financial statements report on the Wells Fargo Large Cap Growth Fund (the “Fund”) which is a diversified series of the Trust.
Effective at the close of business on October 23, 2015, Investor Class shares became Class A shares in a tax-free conversion. Shareholders of Investor Class received Class A shares at a value equal to the value of their Investor Class shares immediately prior to the conversion. Investor Class shares are no longer offered by the Fund.
2. SIGNIFICANT ACCOUNTING POLICIES
The following significant accounting policies, which are consistently followed in the preparation of the financial statements of the Fund, are in conformity with U.S. generally accepted accounting principles which require management to make estimates and assumptions that affect the reported amounts of assets and liabilities, disclosure of contingent assets and liabilities at the date of the financial statements, and the reported amounts of revenues and expenses during the reporting period. Actual results could differ from those estimates.
Securities valuation
All investments are valued each business day as of the close of regular trading on the New York Stock Exchange (generally 4 p.m. Eastern Time), although the Fund may deviate from this calculation time under unusual or unexpected circumstances.
Equity securities that are listed on a foreign or domestic exchange or market are valued at the official closing price or, if none, the last sales price. If no sale occurs on the principal exchange or market that day, the prior day’s price will be deemed “stale” and a fair value price will be determined in accordance with the Fund’s Valuation Procedures.
Investments in registered open-end investment companies are valued at net asset value. Interests in non-registered investment vehicles that are redeemable at net asset value are fair valued normally at net asset value.
Investments which are not valued using any of the methods discussed above are valued at their fair value, as determined in good faith by the Board of Trustees of the Fund. The Board of Trustees has established a Valuation Committee comprised of the Trustees and has delegated to it the authority to take any actions regarding the valuation of portfolio securities that the Valuation Committee deems necessary or appropriate, including determining the fair value of portfolio securities, unless the determination has been delegated to the Management Valuation Team of Wells Fargo Funds Management, LLC (“Funds Management”). The Board of Trustees retains the authority to make or ratify any valuation decisions or approve any changes to the Valuation Procedures as it deems appropriate. On a quarterly basis, the Board of Trustees receives reports on any valuation actions taken by the Valuation Committee or the Management Valuation Team which may include items for ratification.
Valuations of fair valued securities are compared to the next actual sales price when available, or other appropriate market values, to assess the continued appropriateness of the fair valuation methodologies used. These securities are fair valued on a day-to-day basis, taking into consideration changes to appropriate market information and any significant changes to the inputs considered in the valuation process until there is a readily available price provided on an exchange or by an independent pricing service. Valuations received from an independent pricing service or independent broker-dealer quotes are periodically validated by comparisons to most recent trades and valuations provided by other independent pricing services in addition to the review of prices by the manager and/or subadviser. Unobservable inputs used in determining fair valuations are identified based on the type of security, taking into consideration factors utilized by market participants in valuing the investment, knowledge about the issuer and the current market environment.
Security loans
The Fund may lend its securities from time to time in order to earn additional income in the form of fees or interest on securities received as collateral or the investment of any cash received as collateral. The Fund continues to receive interest or dividends on the securities loaned. The Fund receives collateral in the form of cash or securities with a value at least equal to the value of the securities on loan. The value of the loaned securities is determined at the close of each business day and any additional required collateral is delivered to the Fund on the next business day. In a securities lending transaction, the net asset value of the Fund will be affected by an increase or decrease in the value of the securities loaned and by an increase or decrease in the value of the instrument in which collateral is invested. The amount of securities lending activity undertaken by the Fund fluctuates from time to time. In the event of default or bankruptcy
| | | | |
| 26 | | Wells Fargo Large Cap Growth Fund | | Notes to financial statements |
by the borrower, the Fund may be prevented from recovering the loaned securities or gaining access to the collateral or may experience delays or costs in doing so. In addition, the investment of any cash collateral received may lose all or part of its value. The Fund has the right under the lending agreement to recover the securities from the borrower on demand.
The Fund lends its securities through an unaffiliated securities lending agent. Cash collateral received in connection with its securities lending transactions is invested in Securities Lending Cash Investments, LLC (the “Securities Lending Fund”). The Securities Lending Fund is exempt from registration under Section 3(c)(7) of the 1940 Act and is managed by Funds Management and is subadvised by Wells Capital Management Incorporated (“WellsCap”), an affiliate of Funds Management and an indirect wholly owned subsidiary of Wells Fargo & Company (“Wells Fargo”). Funds Management receives an advisory fee starting at 0.05% and declining to 0.01% as the average daily net assets of the Securities Lending Fund increase. All of the fees received by Funds Management are paid to WellsCap for its services as subadviser. The Securities Lending Fund seeks to provide a positive return compared to the daily Fed Funds Open rate by investing in high-quality, U.S. dollar-denominated short-term money market instruments. Securities Lending Fund investments are fair valued based upon the amortized cost valuation technique. Income earned from investment in the Securities Lending Fund is included in securities lending income on the Statement of Operations.
Security transactions and income recognition
Securities transactions are recorded on a trade date basis. Realized gains or losses are recorded on the basis of identified cost.
Dividend income is recognized on the ex-dividend date. Dividend income is recorded net of foreign taxes withheld where recovery of such taxes is not assured.
Distributions to shareholders
Distributions to shareholders from net investment income and net realized gains, if any, are recorded on the ex-dividend date. Such distributions are determined in conformity with federal income tax regulations, which may differ in amount or character from net investment income and realized gains recognized for purposes of U.S. generally accepted accounting principles.
Federal and other taxes
The Fund intends to continue to qualify as a regulated investment company by distributing substantially all of its investment company taxable income and any net realized capital gains (after reduction for capital loss carryforwards) sufficient to relieve it from all, or substantially all, federal income taxes. Accordingly, no provision for federal income taxes was required.
The Fund’s income and federal excise tax returns and all financial records supporting those returns for the prior three fiscal years are subject to examination by the federal and Delaware revenue authorities. Management has analyzed the Fund’s tax positions taken on federal, state, and foreign tax returns for all open tax years and does not believe that there are any uncertain tax positions that require recognition of a tax liability.
Reclassifications are made to the Fund’s capital accounts for permanent tax differences to reflect income and gains available for distribution (or available capital loss carryforwards) under federal income tax regulations. U.S. generally accepted accounting principles require that certain components of net assets be adjusted to reflect permanent differences between financial and tax reporting. These reclassifications have no effect on net assets or net asset values per share. At July 31, 2016, as a result of permanent book-to-tax differences, the following reclassification adjustments were made on the Statement of Assets and Liabilities:
| | |
Overdistributed net
investment income | | Accumulated net
realized gains
on investments |
| $(85,434) | | $85,434 |
Class allocations
The separate classes of shares offered by the Fund differ principally in applicable sales charges, distribution, shareholder servicing, and administration fees. Class specific expenses are charged directly to that share class. Investment income, common expenses, and realized and unrealized gains (losses) on investments are allocated daily to each class of shares based on the relative proportion of net assets of each class.
| | | | | | |
| Notes to financial statements | | Wells Fargo Large Cap Growth Fund | | | 27 | |
3. FAIR VALUATION MEASUREMENTS
Fair value measurements of investments are determined within a framework that has established a fair value hierarchy based upon the various data inputs utilized in determining the value of the Fund’s investments. The three-level hierarchy gives the highest priority to unadjusted quoted prices in active markets for identical assets or liabilities (Level 1) and the lowest priority to significant unobservable inputs (Level 3). The Fund’s investments are classified within the fair value hierarchy based on the lowest level of input that is significant to the fair value measurement. The inputs are summarized into three broad levels as follows:
| n | | Level 1 – quoted prices in active markets for identical securities |
| n | | Level 2 – other significant observable inputs (including quoted prices for similar securities, interest rates, prepayment speeds, credit risk, use of amortized cost, etc.) |
| n | | Level 3 – significant unobservable inputs (including the Fund’s own assumptions in determining the fair value of investments) |
The inputs or methodologies used for valuing investments in securities are not necessarily an indication of the risk associated with investing in those securities.
The following is a summary of the inputs used in valuing the Fund’s assets and liabilities as of July 31, 2016:
| | | | | | | | | | | | | | | | |
| | | Quoted prices
(Level 1) | | | Other significant
observable inputs
(Level 2) | | | Significant
unobservable inputs (Level 3) | | | Total | |
Assets | | | | | | | | | | | | | | | | |
Investments in: | | | | | | | | | | | | | | | | |
| | | | |
Common stocks | | | | | | | | | | | | | | | | |
Consumer discretionary | | $ | 359,084,834 | | | $ | 0 | | | $ | 0 | | | $ | 359,084,834 | |
Consumer staples | | | 92,408,595 | | | | 0 | | | | 0 | | | | 92,408,595 | |
Energy | | | 28,008,466 | | | | 0 | | | | 0 | | | | 28,008,466 | |
Financials | | | 2,766,403 | | | | 0 | | | | 0 | | | | 2,766,403 | |
Health care | | | 196,786,414 | | | | 0 | | | | 0 | | | | 196,786,414 | |
Industrials | | | 101,049,691 | | | | 0 | | | | 0 | | | | 101,049,691 | |
Information technology | | | 544,878,480 | | | | 0 | | | | 0 | | | | 544,878,480 | |
Materials | | | 48,238,200 | | | | 0 | | | | 0 | | | | 48,238,200 | |
| | | | |
Short-term investments | | | | | | | | | | | | | | | | |
Investment companies | | | 16,831,628 | | | | 0 | | | | 0 | | | | 16,831,628 | |
Investments measured at net asset value* | | | | | | | | | | | | | | | 39,207,100 | |
Total assets | | $ | 1,390,052,711 | | | $ | 0 | | | $ | 0 | | | $ | 1,429,259,811 | |
| * | Investments that are measured at fair value using the net asset value per share (or its equivalent) as a practical expedient have not been categorized in the fair value hierarchy. The fair value amount presented in the table is intended to permit reconciliation of the fair value hierarchy to the amounts presented in the Statement of Assets and Liabilities. The Fund’s investment in Securities Lending Cash Investments, LLC valued at $39,207,100 does not have a redemption period notice, can be redeemed daily and does not have any unfunded commitments. |
The Fund recognizes transfers between levels within the fair value hierarchy at the end of the reporting period. At July 31, 2016, the Fund did not have any transfers into/out of Level 1, Level 2, or Level 3.
4. TRANSACTIONS WITH AFFILIATES
Management fee
Funds Management, an indirect wholly owned subsidiary of Wells Fargo, is the manager of the Fund and provides advisory and fund-level administrative services under an investment management agreement. Under the investment management agreement, Funds Management is responsible for, among other services, implementing the investment objectives and strategies of the Fund, supervising the subadviser, providing fund-level administrative services in connection with the Fund’s operations, and providing any other fund-level administrative services reasonably necessary for the operation of the Fund. As compensation for its services under the investment management agreement, Funds Management is entitled to receive an annual management fee starting at 0.70% and declining to 0.505% as the average daily net assets of the Fund increase. For the year ended July 31, 2016, the management fee was equivalent to an annual rate of 0.68% of the Fund’s average daily net assets.
| | | | |
| 28 | | Wells Fargo Large Cap Growth Fund | | Notes to financial statements |
Funds Management has retained the services of a subadviser to provide daily portfolio management to the Fund. The fee for subadvisory services is borne by Funds Management. WellsCap is the subadviser to the Fund and is entitled to receive a fee from Funds Management at an annual rate starting at 0.30% and declining to 0.20% as the average daily net assets of the Fund increase.
Administration fees
Under a class-level administration agreement, Funds Management provides class-level administrative services to the Fund, which includes paying fees and expenses for services provided by the transfer agent, sub-transfer agents, omnibus account servicers and record-keepers. As compensation for its services under the class-level administration agreement, Funds Management receives an annual fee which is calculated based on the average daily net assets of each class as follows:
| | | | |
| | | Class-level
administration fee | |
Class A, Class C, Class R | | | 0.21 | % |
Class R4 | | | 0.08 | |
Class R6 | | | 0.03 | |
Administrator Class, Institutional Class | | | 0.13 | |
Investor Class | | | 0.32 | |
Funds Management has contractually waived and/or reimbursed management and administration fees to the extent necessary to maintain certain net operating expense ratios for the Fund. Waiver of fees and/or reimbursement of expenses by Funds Management were made first from fund level expenses on a proportionate basis and then from class specific expenses. Funds Management has committed through November 30, 2016 to waive fees and/or reimburse expenses to the extent necessary to cap the Fund’s expenses at 1.07% for Class A shares, 1.82% for Class C shares, 1.32% for Class R shares, 0.80% for Class R4 shares, 0.65% for Class R6 shares, 0.95% for Administrator Class shares, and 0.75% for Institutional Class shares. After this time, the cap may be increased or the commitment to maintain the cap may be terminated only with the approval of the Board of Trustees. Prior to December 1, 2015, the Fund’s expenses were capped at 0.75% for Class R4 shares, 0.60% for Class R6 shares, and 0.65% for Institutional Class shares.
Distribution fees
The Trust has adopted a distribution plan for Class C and Class R shares of the Fund pursuant to Rule 12b-1 under the 1940 Act. Distribution fees are charged to Class C and Class R shares and paid to Wells Fargo Funds Distributor, LLC (“Funds Distributor”), the principal underwriter, at an annual rate of 0.75% of the average daily net assets of Class C shares and 0.25% of the average daily net assets of Class R shares.
In addition, Funds Distributor is entitled to receive the front-end sales charge from the purchase of Class A shares and a contingent deferred sales charge on the redemption of certain Class A shares. Funds Distributor is also entitled to receive the contingent deferred sales charges from redemptions of Class C shares. For the year ended July 31, 2016, Funds Distributor received $13,126 from the sale of Class A shares.
Shareholder servicing fees
The Trust has entered into contracts with one or more shareholder servicing agents, whereby Class A, Class C, Class R, Administrator Class, and Investor Class of the Fund are charged a fee at an annual rate of 0.25% of the average daily net assets of each respective class. Class R4 is charged a fee at an annual rate of 0.10% of its average daily net assets.
A portion of these total shareholder servicing fees were paid to affiliates of Wells Fargo.
5. INVESTMENT PORTFOLIO TRANSACTIONS
Purchases and sales of investments, excluding U.S. government obligations (if any) and short-term securities, for the year ended July 31, 2016 were $451,530,718 and $654,534,625, respectively.
The Fund may purchase or sell investment securities to other Wells Fargo funds under procedures adopted by the Board of Trustees. The procedures have been designed to ensure that these interfund transactions, which generally do not incur broker commissions, are effected at current market prices. Interfund trades are included within the respective purchases and sales amounts shown.
| | | | | | |
| Notes to financial statements | | Wells Fargo Large Cap Growth Fund | | | 29 | |
6. BANK BORROWINGS
The Trust (excluding the money market funds and certain other funds) and Wells Fargo Variable Trust are parties to a $200,000,000 revolving credit agreement whereby the Fund is permitted to use bank borrowings for temporary or emergency purposes, such as to fund shareholder redemption requests. Interest under the credit agreement is charged to the Fund based on a borrowing rate equal to the higher of the Federal Funds rate in effect on that day plus 1.25% or the overnight LIBOR rate in effect on that day plus 1.25%. In addition, an annual commitment fee equal to 0.20% of the unused balance is allocated to each participating fund. Prior to September 1, 2015, the revolving credit agreement amount was $150,000,000 and the annual commitment fee was equal to 0.10% of the unused balance which was allocated to each participating fund.
For the year ended July 31, 2016, there were no borrowings by the Fund under the agreement.
7. DISTRIBUTIONS TO SHAREHOLDERS
The tax character of distributions paid during the years ended July 31, 2016 and July 31, 2015 were as follows:
| | | | | | | | |
| | | Year ended July 31 | |
| | | 2016 | | | 2015 | |
Ordinary income | | $ | 3,172,894 | | | $ | 6,459,928 | |
Long-term capital gain | | | 80,996,796 | | | | 63,526,659 | |
As of July 31, 2016, the components of distributable earnings on a tax basis were as follows:
| | |
Undistributed long-term gain | | Unrealized gains |
| $34,669,485 | | $515,380,345 |
8. CONCENTRATION RISK
Concentration risks result from exposure to a limited number of sectors. A fund that invests a substantial portion of their assets in any sector may be more affected by changes in that sector than would be a fund whose investments are not heavily weighted in any sector.
9. INDEMNIFICATION
Under the Trust’s organizational documents, the officers and Trustees have been granted certain indemnification rights against certain liabilities that may arise out of performance of their duties to the Trust. Additionally, in the normal course of business, the Trust may enter into contracts with service providers that contain a variety of indemnification clauses. The Trust’s maximum exposure under these arrangements is dependent on future claims that may be made against the Fund and, therefore, cannot be estimated.
| | | | |
| 30 | | Wells Fargo Large Cap Growth Fund | | Report of independent registered public accounting firm |
BOARD OF TRUSTEES AND SHAREHOLDERS OF WELLS FARGO FUNDS TRUST:
We have audited the accompanying statements of assets and liabilities, including the portfolio of investments, of the Wells Fargo Large Cap Growth Fund (formerly known as Wells Fargo Advantage Large Cap Growth Fund) (the “Fund”), one of the funds constituting the Wells Fargo Funds Trust, as of July 31, 2016, and the related statement of operations for the year then ended, the statements of changes in net assets for each of the years in the two-year period then ended, and the financial highlights for each of the years or periods in the five-year period then ended. These financial statements and financial highlights are the responsibility of the Fund’s management. Our responsibility is to express an opinion on these financial statements and financial highlights based on our audits.
We conducted our audits in accordance with the standards of the Public Company Accounting Oversight Board (United States). Those standards require that we plan and perform the audit to obtain reasonable assurance about whether the financial statements and financial highlights are free of material misstatement. An audit includes examining, on a test basis, evidence supporting the amounts and disclosures in the financial statements. Our procedures included confirmation of securities owned as of July 31, 2016, by correspondence with the custodian and brokers, or by other appropriate auditing procedures. An audit also includes assessing the accounting principles used and significant estimates made by management, as well as evaluating the overall financial statement presentation. We believe that our audits provide a reasonable basis for our opinion.
In our opinion, the financial statements and financial highlights referred to above present fairly, in all material respects, the financial position of the Wells Fargo Large Cap Growth Fund as of July 31, 2016, the results of its operations for the year then ended, the changes in its net assets for each of the years in the two-year period then ended, and the financial highlights for each of the years or periods in the five-year period then ended, in conformity with U.S. generally accepted accounting principles.

Boston, Massachusetts
September 23, 2016
| | | | | | |
| Other information (unaudited) | | Wells Fargo Large Cap Growth Fund | | | 31 | |
TAX INFORMATION
For corporate shareholders, pursuant to Section 854 of the Internal Revenue Code, 100% of ordinary income dividends qualify for the corporate dividends-received deduction for the fiscal year ended July 31, 2016.
Pursuant to Section 852 of the Internal Revenue Code, $80,996,796 was designated as a 20% rate gain distribution for the fiscal year ended July 31, 2016.
Pursuant to Section 854 of the Internal Revenue Code, $3,172,894 of income dividends paid during the fiscal year ended July 31, 2016 has been designated as qualified dividend income (QDI).
PROXY VOTING INFORMATION
A description of the policies and procedures that the Fund uses to determine how to vote proxies relating to portfolio securities is available, upon request, by calling 1-800-222-8222, visiting our website at wellsfargofunds.com, or visiting the SEC website at sec.gov. Information regarding how the Fund voted proxies relating to portfolio securities during the most recent 12-month period ended June 30 is available on the Fund’s website at wellsfargofunds.com or by visiting the SEC website at sec.gov.
PORTFOLIO HOLDINGS INFORMATION
The complete portfolio holdings for the Fund are publicly available monthly on the Fund’s website (wellsfargofunds.com), on a one-month delayed basis. In addition, top ten holdings information (excluding derivative positions) for the Fund is publicly available on the Fund’s website on a monthly, seven-day or more delayed basis. The Fund files its complete schedule of portfolio holdings with the SEC for the first and third quarters of each fiscal year on Form N-Q, which is available by visiting the SEC website at sec.gov. In addition, the Fund’s Form N-Q may be reviewed and copied at the SEC’s Public Reference Room in Washington, DC, and at regional offices in New York City, at 233 Broadway, and in Chicago, at 175 West Jackson Boulevard, Suite 900. Information about the Public Reference Room may be obtained by calling 1-800-SEC-0330.
| | | | |
| 32 | | Wells Fargo Large Cap Growth Fund | | Other information (unaudited) |
BOARD OF TRUSTEES AND OFFICERS
Each of the Trustees and Officers1 listed in the table below acts in identical capacities for each fund in the Wells Fargo family of funds, which consists of 139 mutual funds comprising the Wells Fargo Funds Trust, Wells Fargo Variable Trust, Wells Fargo Master Trust and four closed-end funds (collectively the “Fund Complex”). This table should be read in conjunction with the Prospectus and the Statement of Additional Information2. The mailing address of each Trustee and Officer is 525 Market Street, 12th Floor, San Francisco, CA 94105. Each Trustee and Officer serves an indefinite term, however, each Trustee serves such term until reaching the mandatory retirement age established by the Trustees.
Independent Trustees
| | | | | | |
Name and year of birth | | Position held and length of service* | | Principal occupations during past five years or longer | | Current other
public company or
investment company
directorships |
William R. Ebsworth
(Born 1957) | | Trustee, since 2015 | | Retired. From 1984 to 2013, equities analyst, portfolio manager, research director and chief financial officer at Fidelity Management and Research Company in Boston, Tokyo, and Hong Kong and retired in 2013 as Chief Investment Officer of Fidelity Strategic Advisers, Inc. where he lead a team of investment professionals managing client assets. Prior thereto, Board member of Hong Kong Securities Clearing Co., Hong Kong Options Clearing Corp., the Thailand International Fund, Ltd., Fidelity Investments Life Insurance Company, and Empire Fidelity Investments Life Insurance Company. Mr. Ebsworth is a CFA® charterholder and an Adjunct Lecturer, Finance, at Babson College. | | Asset Allocation Trust |
Jane A. Freeman
(Born 1953) | | Trustee, since 2015 | | Retired. From 2012 to 2014 and 1999 to 2008, Chief Financial Officer of Scientific Learning Corporation. From 2008 to 2012, Ms. Freeman provided consulting services related to strategic business projects. Prior to 1999, Portfolio Manager at Rockefeller & Co. and Scudder, Stevens & Clark. Board member of the Harding Loevner Funds from 1996 to 2014, serving as both Lead Independent Director and chair of the Audit Committee. Board member of the Russell Exchange Traded Funds Trust from 2011 to 2012 and the chair of the Audit Committee. Ms. Freeman is Chair of Taproot Foundation (non-profit organization), a Board Member of Ruth Bancroft Garden (non-profit organization) and an inactive chartered financial analyst. | | Asset Allocation Trust |
Peter G. Gordon
(Born 1942) | | Trustee, since 1998; Chairman, since 2005 | | Co-Founder, Retired Chairman, President and CEO of Crystal Geyser Water Company. Trustee Emeritus, Colby College. | | Asset Allocation Trust |
Isaiah Harris, Jr.
(Born 1952) | | Trustee, since 2009 | | Retired. Chairman of the Board of CIGNA Corporation since 2009, and Director since 2005. From 2003 to 2011, Director of Deluxe Corporation. Prior thereto, President and CEO of BellSouth Advertising and Publishing Corp. from 2005 to 2007, President and CEO of BellSouth Enterprises from 2004 to 2005 and President of BellSouth Consumer Services from 2000 to 2003. Emeritus member of the Iowa State University Foundation Board of Governors. Emeritus Member of the Advisory Board of Iowa State University School of Business. Advisory Board Member, Palm Harbor Academy (charter school). Advisory Board Member, Child Evangelism Fellowship (non-profit). Mr. Harris is a certified public accountant (inactive status). | | CIGNA Corporation; Asset Allocation Trust |
Judith M. Johnson
(Born 1949) | | Trustee, since 2008; Audit Committee Chairman, since 2008 | | Retired. Prior thereto, Chief Executive Officer and Chief Investment Officer of Minneapolis Employees Retirement Fund from 1996 to 2008. Ms. Johnson is an attorney, certified public accountant and a certified managerial accountant. | | Asset Allocation Trust |
David F. Larcker
(Born 1950) | | Trustee, since 2009 | | James Irvin Miller Professor of Accounting at the Graduate School of Business, Stanford University, Director of the Corporate Governance Research Initiative and Senior Faculty of The Rock Center for Corporate Governance since 2006. From 2005 to 2008, Professor of Accounting at the Graduate School of Business, Stanford University. Prior thereto, Ernst & Young Professor of Accounting at The Wharton School, University of Pennsylvania from 1985 to 2005. | | Asset Allocation Trust |
| | | | | | |
| Other information (unaudited) | | Wells Fargo Large Cap Growth Fund | | | 33 | |
| | | | | | |
Name and year of birth | | Position held and length of service* | | Principal occupations during past five years or longer | | Current other
public company or
investment company
directorships |
Olivia S. Mitchell
(Born 1953) | | Trustee, since 2006 | | International Foundation of Employee Benefit Plans Professor, Wharton School of the University of Pennsylvania since 1993. Director of Wharton’s Pension Research Council and Boettner Center on Pensions & Retirement Research, and Research Associate at the National Bureau of Economic Research. Previously, Cornell University Professor from 1978 to 1993. | | Asset Allocation Trust |
Timothy J. Penny
(Born 1951) | | Trustee, since 1996 | | President and Chief Executive Officer of Southern Minnesota Initiative Foundation, a non-profit organization, since 2007 and Senior Fellow at the Humphrey Institute Policy Forum at the University of Minnesota since 1995. Member of the Board of Trustees of NorthStar Education Finance, Inc., a non-profit organization, since 2007. | | Asset Allocation Trust |
Michael S. Scofield
(Born 1943) | | Trustee, since 2010 | | Served on the Investment Company Institute’s Board of Governors and Executive Committee from 2008-2011 as well the Governing Council of the Independent Directors Council from 2006-2011 and the Independent Directors Council Executive Committee from 2008-2011. Chairman of the IDC from 2008-2010. Institutional Investor (Fund Directions) Trustee of Year in 2007. Trustee of the Evergreen Funds complex (and its predecessors) from 1984 to 2010. Chairman of the Evergreen Funds from 2000-2010. Former Trustee of the Mentor Funds. Retired Attorney, Law Offices of Michael S. Scofield. | | Asset Allocation Trust |
| * | Length of service dates reflect the Trustee’s commencement of service with the Trust’s predecessor entities, where applicable. |
Officers
| | | | | | |
Name and year of birth | | Position held and
length of service | | Principal occupations during past five years or longer | | |
| Karla M. Rabusch (Born 1959) | | President, since 2003 | | Executive Vice President of Wells Fargo Bank, N.A. and President of Wells Fargo Funds Management, LLC since 2003. | | |
| Jeremy DePalma1 (Born 1974) | | Treasurer, since 2012 | | Senior Vice President of Wells Fargo Funds Management, LLC since 2009. Senior Vice President of Evergreen Investment Management Company, LLC from 2008 to 2010 and head of the Fund Reporting and Control Team within Fund Administration from 2005 to 2010. | | |
| C. David Messman (Born 1960) | | Secretary, since 2000; Chief Legal Officer, since 2003 | | Senior Vice President and Secretary of Wells Fargo Funds Management, LLC since 2001. Assistant General Counsel of Wells Fargo Bank, N.A. since 2013 and Vice President and Managing Counsel of Wells Fargo Bank, N.A. from 1996 to 2013. | | |
| Michael Whitaker (Born 1967) | | Chief Compliance Officer, since 2016* | | Executive Vice President of Wells Fargo Funds Management, LLC since 2016. Chief Compliance Officer of Fidelity’s Fixed Income Funds and Asset Allocation Funds from 2008 to 2016, Compliance Officer of FMR Co., Inc. from 2014 to 2016, Fidelity Investments Money Management, Inc. from 2014 to 2016, Fidelity Investments from 2007 to 2016. | | |
David Berardi (Born 1975) | | Assistant Treasurer, since 2009 | | Vice President of Wells Fargo Funds Management, LLC since 2009. Vice President of Evergreen Investment Management Company, LLC from 2008 to 2010. Manager of Fund Reporting and Control for Evergreen Investment Management Company, LLC from 2004 to 2010. | | |
| 1 | Jeremy DePalma acts as Treasurer of 68 funds and Assistant Treasurer of 71 funds in the Fund Complex. |
| 2 | The Statement of Additional Information includes additional information about the Trustees and is available, without charge, upon request, by calling 1-800-222-8222 or by visiting the website at wellsfargofunds.com. |
| * | Michael Whitaker became Chief Compliance Officer effective May 16, 2016. |
| | | | |
| 34 | | Wells Fargo Large Cap Growth Fund | | Other information (unaudited) |
BOARD CONSIDERATION OF INVESTMENT MANAGEMENT AND SUB-ADVISORY AGREEMENTS:
Under the Investment Company Act of 1940 (the “1940 Act”), the Board of Trustees (the “Board”) of Wells Fargo Funds Trust (the “Trust”) must determine annually whether to approve the continuation of the Trust’s investment management and sub-advisory agreements. In this regard, at an in-person meeting held on May 24-25, 2016 (the “Meeting”), the Board, all the members of which have no direct or indirect interest in the investment management and sub-advisory agreements and are not “interested persons” of the Trust, as defined in the 1940 Act (the “Independent Trustees”), reviewed and approved for Wells Fargo Large Cap Growth Fund (the “Fund”): (i) an investment management agreement (the “Management Agreement”) with Wells Fargo Funds Management, LLC (“Funds Management”); and (ii) an investment sub-advisory agreement (the “Sub-Advisory Agreement”) with Wells Capital Management Incorporated (the “Sub-Adviser”), an affiliate of Funds Management. The Management Agreement and the Sub-Advisory Agreement are collectively referred to as the “Advisory Agreements.”
At the Meeting, the Board considered the factors and reached the conclusions described below relating to the selection of Funds Management and the Sub-Adviser and the approval of the Advisory Agreements. Prior to the Meeting, including at an in-person meeting in April 2016, the Trustees conferred extensively among themselves and with representatives of Funds Management about these matters. Also, the Board has adopted a team-based approach, with each team consisting of a sub-set of Trustees, to assist the full Board in the discharge of its duties in reviewing performance and other matters throughout the year. The Independent Trustees were assisted in their evaluation of the Advisory Agreements by independent legal counsel, from whom they received separate legal advice and with whom they met separately.
In providing information to the Board, Funds Management and the Sub-Adviser were guided by a detailed set of requests for information submitted to them by independent legal counsel on behalf of the Independent Trustees at the start of the Board’s annual contract renewal process earlier in 2016. In considering and approving the Advisory Agreements, the Trustees considered the information they believed relevant, including but not limited to the information discussed below. The Board considered not only the specific information presented in connection with the Meeting, but also the knowledge gained over time through interaction with Funds Management and the Sub-Adviser about various topics. In this regard, the Board reviewed reports of Funds Management at each of its quarterly meetings, which included, among other things, portfolio reviews and performance reports. In addition, the Board and the teams mentioned above confer with portfolio managers at various times throughout the year. The Board did not identify any particular information or consideration that was all-important or controlling, and each individual Trustee may have attributed different weights to various factors.
After its deliberations, the Board unanimously approved the continuation of the Advisory Agreements for a one-year term and determined that the compensation payable to Funds Management and the Sub-Adviser under each of the Advisory Agreements was reasonable. The Board considered the approval of the Advisory Agreements for the Fund as part of its consideration of agreements for funds across the complex, but its approvals were made on a fund-by-fund basis. The following summarizes a number of important, but not necessarily all, factors considered by the Board in support of its approvals.
Nature, extent and quality of services
The Board received and considered various information regarding the nature, extent and quality of services provided to the Fund by Funds Management and the Sub-Adviser under the Advisory Agreements. This information included a description of the investment advisory services and Fund-level administrative services covered by the Management Agreement, as well as, among other things, a summary of the background and experience of senior management of Funds Management, and the qualifications, background, tenure and responsibilities of each of the portfolio managers primarily responsible for the day-to-day portfolio management of the Fund.
The Board evaluated the ability of Funds Management and the Sub-Adviser to attract and retain qualified investment professionals, including research, advisory and supervisory personnel. The Board further considered the compliance programs and compliance records of Funds Management and the Sub-Adviser. In addition, the Board took into account the full range of services provided to the Fund by Funds Management and its affiliates.
Fund performance and expenses
The Board considered the performance results for the Fund over various time periods ended December 31, 2015. The Board considered these results in comparison to the performance of funds in a universe that was determined by Broadridge Inc. (“Broadridge”) to be similar to the Fund (the “Universe”), and in comparison to the Fund’s benchmark index and to other comparative data. Broadridge is an independent provider of investment company data. The Board received a description of the methodology used by Broadridge to select the mutual funds in the performance Universe.
| | | | | | |
| Other information (unaudited) | | Wells Fargo Large Cap Growth Fund | | | 35 | |
The Board noted that the performance of the Fund (Class A) was lower than the average performance of the Universe for all periods under review except the five and ten-year periods under review. The Board also noted that the performance of the Fund was lower than its benchmark, the Russell 1000® Growth Index, for all periods under review.
The Board received information concerning, and discussed factors contributing to, the underperformance of the Fund relative to the Universe and benchmark for the periods noted above. The Board took note of the explanations for the relative underperformance in these periods, including with respect to market factors and investment decisions that affected the Fund’s performance and of recent outperformance relative to the Universe.
The Board also received and considered information regarding the Fund’s net operating expense ratios and their various components, including actual management fees, custodian and other non-management fees, and Rule 12b-1 and non-Rule 12b-1 shareholder service fees. The Board considered these ratios in comparison to the median ratios of funds in class-specific expense groups that were determined by Broadridge to be similar to the Fund (the “Groups”). The Board received a description of the methodology used by Broadridge to select the mutual funds in the expense Groups and an explanation of how funds comprising expense groups and their expense ratios may vary from year-to-year. Based on the Broadridge reports, the Board noted that the net operating expense ratios of the Fund were lower than the median net operating expense ratios of the expense Groups.
The Board took into account the Fund performance and expense information provided to it among the factors considered in deciding to re-approve the Advisory Agreements.
Investment management and sub-advisory fee rates
The Board reviewed and considered the contractual fee rates payable by the Fund to Funds Management under the Management Agreement, as well as the contractual fee rates payable by the Fund to Funds Management for class-level administrative services under a Class-Level Administration Agreement, which include class-level transfer agency and sub-transfer agency costs (collectively, the “Management Rates”). The Board also reviewed and considered the contractual investment sub-advisory fee rates that are payable by Funds Management to the Sub-Adviser for investment sub-advisory services.
Among other information reviewed by the Board was a comparison of the Fund’s Management Rates with the average contractual investment management fee rates of funds in the expense Groups at a common asset level as well as transfer agency costs of the funds in the expense Groups. The Board noted that the Management Rates of the Fund were lower than or equal to the sum of these average rates for the Fund’s expense Groups for all share classes.
The Board also received and considered information about the portion of the total management fee that was retained by Funds Management after payment of the fee to the Sub-Adviser for sub-advisory services. In assessing the reasonableness of this amount, the Board received and evaluated information about the nature and extent of responsibilities retained and risks assumed by Funds Management and not delegated to or assumed by the Sub-Adviser, and about Funds Management’s on-going oversight services. However, given the affiliation between Funds Management and the Sub-Adviser, the Board ascribed limited relevance to the allocation of fees between them.
The Board also received and considered information about the nature and extent of services offered and fee rates charged by Funds Management and the Sub-Adviser to other types of clients with investment strategies similar to those of the Fund. In this regard, the Board received information about the significantly greater scope of services, and compliance, reporting and other legal burdens and risks of managing mutual funds compared with those associated with managing assets of non-mutual fund clients such as collective funds or institutional separate accounts.
Based on its consideration of the factors and information it deemed relevant, including those described here, the Board determined that the compensation payable to Funds Management under the Management Agreement and to the Sub-Adviser under the Sub-Advisory Agreement was reasonable, in light of the services covered by the Advisory Agreements.
Profitability
The Board received and considered information concerning the profitability of Funds Management, as well as the profitability of Wells Fargo as a whole, from providing services to the Fund and the fund family as a whole. The Board also received and considered information concerning the profitability of the Sub-Adviser from providing services to the fund family as a whole, noting that the Sub-Adviser’s profitability information with respect to providing services to the Fund was subsumed in the Wells Fargo and Funds Management profitability analysis.
Funds Management reported on the methodologies and estimates used in calculating profitability. Among other things, the Board noted that the levels of profitability reported on a fund-by-fund basis varied widely, depending on factors such
| | | | |
| 36 | | Wells Fargo Large Cap Growth Fund | | Other information (unaudited) |
as the size and type of fund. Based on its review, the Board did not deem the profits reported by Funds Management or Wells Fargo from its services to the Fund to be at a level that would prevent it from approving the continuation of the Advisory Agreements.
Economies of scale
With respect to possible economies of scale, the Board noted the existence of breakpoints in the Fund’s management fee structure, which operate generally to reduce the Fund’s expense ratios as the Fund grows in size. It considered that, for a small fund or a fund that shrinks in size, breakpoints conversely can result in higher fee levels. The Board also considered that fee waiver and expense reimbursement arrangements and competitive fee rates at the outset are means of sharing potential economies of scale with shareholders of the Fund and the fund family as a whole. The Board considered Funds Management’s view that any analyses of potential economies of scale in managing a particular fund are inherently limited in light of the joint and common costs and investments that Funds Management incurs across the fund family as a whole.
The Board concluded that the Fund’s fee and expense arrangements, including contractual breakpoints, constituted a reasonable approach to sharing potential economies of scale with the Fund and its shareholders.
Other benefits to Funds Management and the Sub-Adviser
The Board received and considered information regarding potential “fall-out” or ancillary benefits received by Funds Management and its affiliates, including the Sub-Adviser, as a result of their relationships with the Fund. Ancillary benefits could include, among others, benefits directly attributable to other relationships with the Fund and benefits potentially derived from an increase in Funds Management’s and the Sub-Adviser’s business as a result of their relationships with the Fund. The Board noted that various affiliates of Funds Management may receive distribution-related fees, shareholder servicing payments and sub-transfer agency fees in respect of shares sold or held through them and services provided.
The Board also reviewed information about soft dollar credits earned and utilized by the Sub-Adviser, fees earned by Funds Management and the Sub-Adviser from managing a private investment vehicle for the fund family’s securities lending collateral and commissions earned by an affiliated broker from portfolio transactions.
Based on its consideration of the factors and information it deemed relevant, including those described here, the Board did not find that any ancillary benefits received by Funds Management and its affiliates, including the Sub-Adviser, were unreasonable.
Conclusion
At the Meeting, after considering the above-described factors and based on its deliberations and its evaluation of the information described above, the Board unanimously approved the continuation of the Advisory Agreements for a one-year term and determined that the compensation payable to Funds Management and the Sub-Adviser under each of the Advisory Agreements was reasonable.
| | | | | | |
| List of abbreviations | | Wells Fargo Large Cap Growth Fund | | | 37 | |
The following is a list of common abbreviations for terms and entities that may have appeared in this report.
| ACA | — ACA Financial Guaranty Corporation |
| ADR | — American depositary receipt |
| ADS | — American depositary shares |
| AGC | — Assured Guaranty Corporation |
| AGM | — Assured Guaranty Municipal |
| Ambac | — Ambac Financial Group Incorporated |
| AMT | — Alternative minimum tax |
| BAN | — Bond anticipation notes |
| BHAC | — Berkshire Hathaway Assurance Corporation |
| CAB | — Capital appreciation bond |
| CCAB | — Convertible capital appreciation bond |
| CDA | — Community Development Authority |
| CDO | — Collateralized debt obligation |
| DRIVER | — Derivative inverse tax-exempt receipts |
| DW&P | — Department of Water & Power |
| DWR | — Department of Water Resources |
| ECFA | — Educational & Cultural Facilities Authority |
| EDA | — Economic Development Authority |
| EDFA | — Economic Development Finance Authority |
| ETF | — Exchange-traded fund |
| FDIC | — Federal Deposit Insurance Corporation |
| FFCB | — Federal Farm Credit Banks |
| FGIC | — Financial Guaranty Insurance Corporation |
| FHA | — Federal Housing Administration |
| FHLB | — Federal Home Loan Bank |
| FHLMC | — Federal Home Loan Mortgage Corporation |
| FICO | — The Financing Corporation |
| FNMA | — Federal National Mortgage Association |
| GDR | — Global depositary receipt |
| GNMA | — Government National Mortgage Association |
| HCFR | — Healthcare facilities revenue |
| HEFA | — Health & Educational Facilities Authority |
| HEFAR | — Higher education facilities authority revenue |
| HFA | — Housing Finance Authority |
| HFFA | — Health Facilities Financing Authority |
| HUD | — Department of Housing and Urban Development |
| IDA | — Industrial Development Authority |
| IDAG | — Industrial Development Agency |
| KRW | — Republic of Korea won |
| LIBOR | — London Interbank Offered Rate |
| LIFER | — Long Inverse Floating Exempt Receipts |
| LLC | — Limited liability company |
| LLLP | — Limited liability limited partnership |
| LLP | — Limited liability partnership |
| MBIA | — Municipal Bond Insurance Association |
| MFHR | — Multifamily housing revenue |
| MSTR | — Municipal securities trust receipts |
| MUD | — Municipal Utility District |
| National | — National Public Finance Guarantee Corporation |
| PCFA | — Pollution Control Financing Authority |
| PCL | — Public Company Limited |
| PCR | — Pollution control revenue |
| PFA | — Public Finance Authority |
| PFFA | — Public Facilities Financing Authority |
| PFOTER | — Puttable floating option tax-exempt receipts |
| plc | — Public limited company |
| PUTTER | — Puttable tax-exempt receipts |
| R&D | — Research & development |
| Radian | — Radian Asset Assurance |
| RAN | — Revenue anticipation notes |
| RDA | — Redevelopment Authority |
| RDFA | — Redevelopment Finance Authority |
| REIT | — Real estate investment trust |
| ROC | — Reset option certificates |
| SAVRS | — Select auction variable rate securities |
| SBA | — Small Business Authority |
| SDR | — Swedish depositary receipt |
| SFHR | — Single-family housing revenue |
| SFMR | — Single-family mortgage revenue |
| SPA | — Standby purchase agreement |
| SPDR | — Standard & Poor’s Depositary Receipts |
| SPEAR | — Short Puttable Exempt Adjustable Receipts |
| STRIPS | — Separate trading of registered interest and |
| TAN | — Tax anticipation notes |
| TIPS | — Treasury inflation-protected securities |
| TRAN | — Tax revenue anticipation notes |
| TTFA | — Transportation Trust Fund Authority |
| TVA | — Tennessee Valley Authority |
This page is intentionally left blank.
This page is intentionally left blank.
This page is intentionally left blank.

For more information
More information about Wells Fargo Funds is available free upon request. To obtain literature, please write, email, visit the Fund’s website, or call:
Wells Fargo Funds
P.O. Box 8266
Boston, MA 02266-8266
Email: fundservice@wellsfargo.com
Website: wellsfargofunds.com
Individual investors: 1-800-222-8222
Retail investment professionals: 1-888-877-9275
Institutional investment professionals: 1-866-765-0778
This report and the financial statements contained herein are submitted for the general information of the shareholders of the Fund. If this report is used for promotional purposes, distribution of the report must be accompanied or preceded by a current prospectus. Before investing, please consider the investment objectives, risks, charges, and expenses of the investment. For a current prospectus and, if available, a summary prospectus, containing this information, call 1-800-222-8222 or visit the Fund’s website at wellsfargofunds.com. Read the prospectus carefully before you invest or send money.
Wells Fargo Asset Management (WFAM) is a trade name used by the asset management businesses of Wells Fargo & Company. Wells Fargo Funds Management, LLC, a wholly owned subsidiary of Wells Fargo & Company, provides investment advisory and administrative services for Wells Fargo Funds. Other affiliates of Wells Fargo & Company provide subadvisory and other services for the funds. The funds are distributed by Wells Fargo Funds Distributor, LLC, Member FINRA, an affiliate of Wells Fargo & Company.
NOT FDIC INSURED ¡ NO BANK GUARANTEE ¡ MAY LOSE VALUE
© 2016 Wells Fargo Funds Management, LLC. All rights reserved.
| | |
 | | 245326 09-16 A209/AR209 07-16 |
Annual Report
July 31, 2016

Wells Fargo Large Company Value Fund


Reduce clutter. Save trees.
Sign up for electronic delivery of prospectuses and shareholder reports at wellsfargo.com/advantagedelivery
Contents
The views expressed and any forward-looking statements are as of July 31, 2016, unless otherwise noted, and are those of the Fund managers and/or Wells Fargo Funds Management, LLC. Discussions of individual securities, or the markets generally, or any Wells Fargo Fund are not intended as individual recommendations. Future events or results may vary significantly from those expressed in any forward-looking statements. The views expressed are subject to change at any time in response to changing circumstances in the market. Wells Fargo Funds Management, LLC and the Fund disclaim any obligation to publicly update or revise any views expressed or forward-looking statements.
NOT FDIC INSURED ¡ NO BANK GUARANTEE ¡ MAY LOSE VALUE
| | | | |
| 2 | | Wells Fargo Large Company Value Fund | | Letter to shareholders (unaudited) |

Karla M. Rabusch
President
Wells Fargo Funds
Despite significant market fluctuations over the course of the year, U.S. stocks delivered positive results overall for the 12-month reporting period
Dear Valued Shareholder:
We are pleased to offer you this annual report for the Wells Fargo Large Company Value Fund for the 12-month period that ended July 31, 2016. During this period, which began August 1, 2015, U.S. and international stock markets experienced heightened volatility, with intermittent rebounds interspersed with sell-offs. The U.S. economy displayed resilience throughout the period, although growth was somewhat sluggish amid ongoing pressures that included slowing growth in China, a strengthening U.S. dollar, and uncertainty regarding interest-rate increases by the U.S. Federal Reserve (Fed); international economies faced deeper ongoing challenges. During June 2016, global markets became especially volatile as the U.K.’s vote over whether to leave the European Union (E.U.) approached. However, markets began recovering shortly after the U.K. voted to leave and rallied through July. Despite significant market fluctuations over the course of the year, U.S. stocks delivered positive results overall for the 12-month reporting period, as measured by the Russell 1000® Index.1 International markets generally declined as measured by the Morgan Stanley Capital International (MSCI) Europe, Australasia, Far East (EAFE) Index.2
In the third quarter of 2015, China’s slowdown took a toll on economies and markets worldwide.
U.S. stocks sagged during the quarter, experiencing the most volatility since 2011. Economic data released during the quarter suggested the U.S. economy remained solid but had lost some steam, burdened by the drag of the U.S. dollar’s strength coupled with global economic turmoil. The fact that the Fed left the federal funds interest rate unchanged at its September 2015 meeting surprised investors and fueled increased uncertainty about the U.S. economy’s stamina to remain healthy while facing the challenges of slowing growth in China and troubles elsewhere in the world. Outside the U.S., markets were even more volatile and delivered generally weaker quarterly results, also largely due to investors’ increasing anxiety over China’s weakened economy.
Despite ongoing concerns, U.S. stocks generally rose in the fourth quarter of 2015; international markets lagged.
While the broad U.S. stock market bounced back in the quarter, stock markets outside the U.S. failed to keep pace as economic concerns, including China’s ongoing slowdown, continued to affect many countries. U.S. economic data released during the quarter indicated the economy remained solid, although the strong U.S. dollar and weakness in international economies remained headwinds. In December, the Fed, as expected, raised its target interest rate by 25 basis points (bps; 100 bps equals 1.00%) after keeping it near zero for seven years. The move reflected confidence in the U.S. economy’s ability to stay healthy with less central-bank support. The Fed also clarified that future interest-rate increases would be gradual.
| 1 | The Russell 1000® Index measures the performance of the 1,000 largest companies in the Russell 3000® Index, which represents approximately 92% of the total market capitalization of the Russell 3000® Index. You cannot invest directly in an index. |
| 2 | Morgan Stanley Capital International (MSCI) Europe, Australasia, Far East (EAFE) Index is a free-float-adjusted market-capitalization-weighted index that is designed to measure the equity market performance of developed markets, excluding the United States and Canada. The MSCI EAFE Index consists of the following 21 developed markets country indexes: Australia, Austria, Belgium, Denmark, Finland, France, Germany, Hong Kong, Ireland, Israel, Italy, Japan, the Netherlands, New Zealand, Norway, Portugal, Singapore, Spain, Sweden, Switzerland, and the United Kingdom. You cannot invest directly in an index. |
| | | | | | |
| Letter to shareholders (unaudited) | | Wells Fargo Large Company Value Fund | | | 3 | |
In the first quarter of 2016, market volatility increased globally amid ongoing concerns.
Stock markets worldwide fluctuated widely in the first quarter of 2016. Most sold off sharply in the first six weeks of the year on concerns such as weak global growth, falling commodity prices, and uncertainty over the timing and impact of the Fed’s interest-rate increases. As the quarter progressed, fears abated somewhat and global markets generally rallied back. The U.S. economy ended the quarter on a positive note as much of the quarter’s data reflected resiliency. With ongoing uncertainties about global growth and financial markets, however, the Fed held off from raising the target interest rate during the quarter. Outside the U.S., the eurozone fell into deflation in February; in response, the European Central Bank announced an expansion of its stimulus program. In China, the government in March set a growth rate of 6.5% to 7.0% for 2016, an acknowledgment of weakening growth. In emerging markets, although central-bank stimulus and improved prices for oil and other commodities led to stock-market rallies in the quarter, many of these countries’ economies face credit downgrades due to challenges such as the likelihood of a stronger U.S. dollar, which would make dollar-denominated debt more expensive.
Worries over interest rates and the U.K.’s vote largely drove the markets during the second quarter of 2016.
U.S. stocks began the quarter in positive territory but started to lose steam in early May on worries that a possible June interest-rate increase by the Fed could hurt the market. In mid-May, stocks briefly plunged following comments by Fed officials noting that a June interest-rate increase remained on the table. But once investors had processed this information, stocks again rallied, finishing up for the month. The first three weeks of June brought heightened volatility, spurred largely by a disappointing jobs report and uncertainty over whether the U.K. would remain in the E.U. The U.K.’s Brexit vote on June 23 shocked countries in Europe and much of the rest of the world. Stock markets plummeted as investors worried that the U.K.’s departure from the E.U. would slow global growth and prolong the low-interest-rate environment. Following the initial rout, however, U.S. stocks rallied as investors seemed to decide that any negative effects would be more localized and not create a serious risk for global growth. By quarter-end, the broad U.S. stock market had moved back into positive territory.
Stocks generally posted positive results for July 2016.
U.S. stocks displayed the most momentum during the first two weeks of the month, buoyed partly by an unexpectedly favorable June jobs report that helped strengthen confidence in the U.S. economy. Also, investors perhaps felt that global central banks could extend stimulus measures in the wake of the Brexit vote. Although U.S. market momentum slowed during the second half of July, stocks ended in positive territory for the month. International stocks delivered positive monthly results as well.
| | | | |
| 4 | | Wells Fargo Large Company Value Fund | | Letter to shareholders (unaudited) |
Don’t let short-term uncertainty derail long-term investment goals.
Periods of uncertainty can present challenges, but experience has taught us that maintaining long-term investment goals can be an effective way to plan for the future. To help you create a sound strategy based on your personal goals and risk tolerance, Wells Fargo Funds offers more than 100 mutual funds spanning a wide range of asset classes and investment styles. Although diversification cannot guarantee an investment profit or prevent losses, we believe it can be an effective way to manage investment risk and potentially smooth out overall portfolio performance. We encourage investors to know their investments and to understand that appropriate levels of risk-taking may unlock opportunities.
Thank you for choosing to invest in Wells Fargo Funds. We appreciate your confidence in us and remain committed to helping you meet your financial needs.
Sincerely,

Karla M. Rabusch
President
Wells Fargo Funds
Although diversification cannot guarantee an investment profit or prevent losses, we believe it can be an effective way to manage investment risk and potentially smooth out overall portfolio performance.
For further information about your Fund, contact your investment professional, visit our website at wellsfargofunds.com, or call us directly at 1-800-222-8222. We are available 24 hours a day, 7 days a week.
This page is intentionally left blank.
| | | | |
| 6 | | Wells Fargo Large Company Value Fund | | Performance highlights (unaudited) |
Investment objective
The Fund seeks long-term capital appreciation.
Manager
Wells Fargo Funds Management, LLC
Subadviser
Phocas Financial Corporation
Portfolio managers
Stephen L. Block, CFA®
William F.K. Schaff, CFA®
Average annual total returns (%) as of July 31, 20161
| | | | | | | | | | | | | | | | | | | | | | | | | | | | | | | | | | |
| | | | | Including sales charge | | | Excluding sales charge | | | Expense ratios2 (%) | |
| | | Inception date | | 1 year | | | 5 year | | | 10 year | | | 1 year | | | 5 year | | | 10 year | | | Gross | | | Net3 | |
| Class A (WLCAX) | | 3-31-2008 | | | (6.66 | ) | | | 8.42 | | | | 4.57 | | | | (0.98 | ) | | | 9.71 | | | | 5.20 | | | | 1.23 | | | | 1.10 | |
| Class C (WFLVX) | | 3-31-2008 | | | (2.68 | ) | | | 8.90 | | | | 4.45 | | | | (1.68 | ) | | | 8.90 | | | | 4.45 | | | | 1.98 | | | | 1.85 | |
| Administrator Class (WWIDX) | | 12-31-2001 | | | – | | | | – | | | | – | | | | (0.79 | ) | | | 9.97 | | | | 5.50 | | | | 1.15 | | | | 0.98 | |
| Institutional Class (WLCIX) | | 3-31-2008 | | | – | | | | – | | | | – | | | | (0.54 | ) | | | 10.22 | | | | 5.68 | | | | 0.90 | | | | 0.75 | |
| Russell 1000® Value Index4 | | – | | | – | | | | – | | | | – | | | | 5.38 | | | | 12.75 | | | | 6.18 | | | | – | | | | – | |
Figures quoted represent past performance, which is no guarantee of future results, and do not reflect taxes that a shareholder may pay on fund distributions or the redemption of fund shares. Investment return and principal value of an investment will fluctuate so that an investor’s shares, when redeemed, may be worth more or less than their original cost. Performance shown without sales charges would be lower if sales charges were reflected. Current performance may be lower or higher than the performance data quoted, which assumes the reinvestment of dividends and capital gains. Current month-end performance is available on the Fund’s website, wellsfargofunds.com.
Index returns do not include transaction costs associated with buying and selling securities, any mutual fund fees or expenses, or any taxes. It is not possible to invest directly in an index.
For Class A shares, the maximum front-end sales charge is 5.75%. For Class C shares, the maximum contingent deferred sales charge is 1.00%. Performance including a contingent deferred sales charge assumes the sales charge for the corresponding time period. Administrator Class and Institutional Class shares are sold without a front-end sales charge or contingent deferred sales charge.
Stock values fluctuate in response to the activities of individual companies and general market and economic conditions. Certain investment strategies tend to increase the total risk of an investment (relative to the broader market). The Fund is exposed to foreign investment risk and focused portfolio risk. Consult the Fund’s prospectus for additional information on these and other risks.
Please see footnotes on page 7.
| | | | | | |
| Performance highlights (unaudited) | | Wells Fargo Large Company Value Fund | | | 7 | |
|
| Growth of $10,000 investment as of July 31, 20165 |
|
 |
| 1 | Historical performance shown for Class A shares prior to their inception reflects the performance of the former Investor Class shares, and includes the higher expenses applicable to the former Investor Class shares (except during those periods in which the expenses of Class A shares would have been higher than those of the former Investor Class shares). If these expenses had not been included, returns would be higher. Historical performance shown for Class C shares prior to their inception reflects the performance of the former Investor Class shares, adjusted to reflect the higher expenses applicable to Class C shares. Historical performance shown for Institutional Class shares prior to their inception reflects the performance of the former Investor Class shares and includes the higher expenses applicable to the former Investor Class shares. If these expenses had not been included, returns would be higher. Historical performance shown for all classes of the Fund prior to March 21, 2008 does not reflect the Fund’s current investment objective and strategies. |
| 2 | Reflects the expense ratios as stated in the most recent prospectuses. The expense ratios shown are subject to change and may differ from the annualized expense ratios shown in the financial highlights of this report. |
| 3 | The manager has contractually committed through November 30, 2016, to waive fees and/or reimburse expenses to the extent necessary to cap the Fund’s Total Annual Fund Operating Expenses After Fee Waiver at the amounts shown. After this time, the cap may be increased or the commitment to maintain the cap may be terminated only with the approval of the Board of Trustees. Brokerage commissions, stamp duty fees, interest, taxes, acquired fund fees and expenses, and extraordinary expenses are excluded from the expense cap. Without this cap, the Fund’s returns would have been lower. |
| 4 | The Russell 1000® Value Index measures the performance of those Russell 1000 companies with lower price-to-book ratios and lower forecasted growth values. You cannot invest directly in an index. |
| 5 | The chart compares the performance of Class A shares for the most recent ten years with the Russell 1000® Value Index. The chart assumes a hypothetical investment of $10,000 in Class A shares and reflects all operating expenses and assumes the maximum initial sales charge of 5.75%. |
| 6 | The ten largest holdings, excluding cash and cash equivalents, are calculated based on the value of the investments divided by total net assets of the Fund. Holdings are subject to change and may have changed since the date specified. |
| 7 | Amounts are calculated based on the total long-term investments of the Fund. These amounts are subject to change and may have changed since the date specified. |
| | | | |
| 8 | | Wells Fargo Large Company Value Fund | | Performance highlights (unaudited) |
MANAGER’S DISCUSSION
Fund highlights
| n | | The Fund underperformed its benchmark, the Russell 1000® Value Index, for the 12-month period that ended July 31, 2016. |
| n | | The Fund’s underperformance was primarily due to weak relative performance in the energy, health care, and information technology (IT) sectors. The energy sector was weighed down by weak performance from companies that are highly exposed to the price of oil and gas. Allergan, Incorporated; HCA Holdings, Incorporated; and Cigna Corporation were underperformers in the health care sector while fears of a slowdown from Apple Incorporated and the auto sector weighed on performance from Skyworks Solutions, Incorporated, and NXP Semiconductors N.V. in the IT sector. |
| n | | Holdings in the financials sector aided relative results. The Fund especially benefited from its holdings of real estate investment trusts (REITs), which found favor from yield-seeking investors. |
Unfavorable stock selection was primarily responsible for the Fund’s underperformance.
In our opinion, attempting to pick the best-performing sectors is an inconsistent and unrewarding approach to investing. We therefore do not attempt to overweight or underweight economic sectors relative to the benchmark. Instead, we focus on owning securities across all sectors that we believe are fundamentally undervalued. The Fund’s performance is generally driven by stock selection rather than sector allocation, and this reporting period was no exception.
In the health care sector, Allergan plc was a notably weak performer. This pharmaceutical company did quite well specializing in eye care, the central nervous system, and dermatology, and it was in the process of selling its generic drug business. Unfortunately, investors likened it to another quite troubled specialty pharmaceutical company—unfairly, in our view—and Allergan’s stock suffered. In the consumer discretionary sector, Norwegian Cruise Line Holdings Limited continued to post record company results. However, investors weren’t in the mood to buy a stock with exposure to such travel-related fears as the Zika virus and terrorism in Europe, as well as to such headwinds as rising fuel prices and a strong U.S. dollar. Our research indicates that none of these issues significantly affected Norwegian Cruise Line’s business, but in the short-term perception can trump reality.
Among contributors, the Fund benefited from holding several REITs in the financials sector. Historically, REITs have been higher-yielding stocks and benefited from investor interest in dividend-paying stocks against a backdrop of low interest rates. Alexandra Real Estate Equities, Incorporated, was a notable REIT contributor. Alexandra Real Estate’s business of providing medical office space to the biotechnology industry showed rapid growth and solid profitability. In the health care sector, Baxalta Incorporated was a strong performer during the one-year period. It was spun out of Baxter International Incorporated in June 2015 only to be acquired by Shire plc in May 2016.
By design, the Fund’s exposure to the various economic sectors were mostly in line with the benchmark. The Fund had a lower allocation to utilities due to the lofty valuations in that sector, while the Fund’s allocation to consumer discretionary was somewhat larger than the benchmark.
| | | | |
| Ten largest holdings (%) as of July 31, 20166 | |
Exxon Mobil Corporation | | | 3.13 | |
Alexandria Real Estate Equities Incorporated | | | 2.59 | |
JPMorgan Chase & Company | | | 2.51 | |
CVS Health Corporation | | | 2.49 | |
NCR Corporation | | | 1.98 | |
Pfizer Incorporated | | | 1.95 | |
American International Group Incorporated | | | 1.92 | |
Great Plains Energy Incorporated | | | 1.85 | |
Bank of America Corporation | | | 1.74 | |
Stanley Black & Decker Incorporated | | | 1.73 | |
We continued to find attractive opportunities throughout the reporting period.
The Fund’s fiscal year started off with a bang as fears of a slowing Chinese economy and of higher interest rates spooked investors, starting off a precipitous decline for the equity markets in August 2015. Such situations have been occurring more frequently and often suit our investment strategy well—we buy companies with solid business prospects that trade at significant discounts to their peers. The sell-off afforded us the opportunity to buy companies like waste hauler Progressive Waste Solutions Limited (which was subsequently acquired by Waste Connections, Incorporated), industrial tools and security provider Stanley Black & Decker, Incorporated; industrial equipment
maker Curtiss-Wright Corporation; and construction and industrial products provider HD Supply Holdings, Incorporated. We also had the opportunity to increase our exposure to certain financials stocks like Bank of America Corporation, Citigroup Incorporated, and CIT Group Incorporated. We believe these companies should benefit significantly from restructuring actions, and there is also the potential for higher interest rates to boost their profit margins.
Please see footnotes on page 7.
| | | | | | |
| Performance highlights (unaudited) | | Wells Fargo Large Company Value Fund | | | 9 | |
|
| Sector distribution as of July 31, 20167 |
|
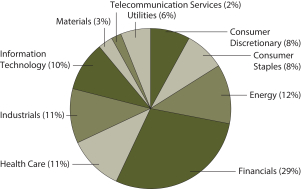
|
We remain committed to our investment strategy and process.
Over the next 6 to 12 months, we expect more slow growth around the globe. Britain’s decision to leave the European Union may have repercussions by the end of the Fund’s fiscal year, but this is expected to play out slowly and the effects are still unknown. Offsetting this factor is a recovering Europe, possibly foreshadowing better profits for multinationals with significant exposure to the region. China’s economy isn’t worsening but isn’t improving either, and the outlook for the country remains murky. The last few months of the fiscal year saw strong outperformance from traditionally defensive sectors, as well as from defensive and high-dividend-paying stocks.
Because the valuations on these stocks have gotten quite stretched, we don’t believe they will continue to outperform in the near future. Instead, we believe companies that offer good future business prospects but whose stocks are trading at steep discounts will begin to entice investors once again.
Please see footnotes on page 7.
| | | | |
| 10 | | Wells Fargo Large Company Value Fund | | Fund expenses (unaudited) |
As a shareholder of the Fund, you incur two types of costs: (1) transaction costs, including sales charges (loads) on purchase payments and contingent deferred sales charges (if any) on redemptions and (2) ongoing costs, including management fees, distribution (12b-1) and/or shareholder servicing fees, and other Fund expenses. This example is intended to help you understand your ongoing costs (in dollars) of investing in the Fund and to compare these costs with the ongoing costs of investing in other mutual funds.
The example is based on an investment of $1,000 invested at the beginning of the six-month period and held for the entire period from February 1, 2016 to July 31, 2016.
Actual expenses
The “Actual” line of the table below provides information about actual account values and actual expenses. You may use the information in this line, together with the amount you invested, to estimate the expenses that you paid over the period. Simply divide your account value by $1,000 (for example, an $8,600 account value divided by $1,000 = 8.6), then multiply the result by the number in the “Actual” line under the heading entitled “Expenses paid during period” for your applicable class of shares to estimate the expenses you paid on your account during this period.
Hypothetical example for comparison purposes
The “Hypothetical” line of the table below provides information about hypothetical account values and hypothetical expenses based on the Fund’s actual expense ratio and an assumed rate of return of 5% per year before expenses, which is not the Fund’s actual return. The hypothetical account values and expenses may not be used to estimate the actual ending account balance or expenses you paid for the period. You may use this information to compare the ongoing costs of investing in the Fund and other funds. To do so, compare this 5% hypothetical example with the 5% hypothetical examples that appear in the shareholder reports of the other funds.
Please note that the expenses shown in the table are meant to highlight your ongoing costs only and do not reflect any transactional costs, such as sales charges (loads) and contingent deferred sales charges. Therefore, the “Hypothetical” line of the table is useful in comparing ongoing costs only and will not help you determine the relative total costs of owning different funds. In addition, if these transactional costs were included, your costs would have been higher.
| | | | | | | | | | | | | | | | |
| | | Beginning
account value
2-1-2016 | | | Ending
account value
7-31-2016 | | | Expenses
paid during
the period¹ | | | Annualized net
expense ratio | |
Class A | | | | | | | | | | | | | | | | |
Actual | | $ | 1,000.00 | | | $ | 1,126.12 | | | $ | 5.81 | | | | 1.10 | % |
Hypothetical (5% return before expenses) | | $ | 1,000.00 | | | $ | 1,019.39 | | | $ | 5.52 | | | | 1.10 | % |
Class C | | | | | | | | | | | | | | | | |
Actual | | $ | 1,000.00 | | | $ | 1,121.66 | | | $ | 9.76 | | | | 1.85 | % |
Hypothetical (5% return before expenses) | | $ | 1,000.00 | | | $ | 1,015.66 | | | $ | 9.27 | | | | 1.85 | % |
Administrator Class | | | | | | | | | | | | | | | | |
Actual | | $ | 1,000.00 | | | $ | 1,126.22 | | | $ | 5.18 | | | | 0.98 | % |
Hypothetical (5% return before expenses) | | $ | 1,000.00 | | | $ | 1,019.99 | | | $ | 4.92 | | | | 0.98 | % |
Institutional Class | | | | | | | | | | | | | | | | |
Actual | | $ | 1,000.00 | | | $ | 1,127.98 | | | $ | 3.97 | | | | 0.75 | % |
Hypothetical (5% return before expenses) | | $ | 1,000.00 | | | $ | 1,021.13 | | | $ | 3.77 | | | | 0.75 | % |
| 1 | Expenses paid is equal to the annualized net expense ratio of each class multiplied by the average account value over the period, multiplied by the number of days in the most recent fiscal half-year divided by the number of days in the fiscal year (to reflect the one-half-year period). |
| | | | | | |
| Portfolio of investments—July 31, 2016 | | Wells Fargo Large Company Value Fund | | | 11 | |
| | | | | | | | | | | | | | | | |
| Security name | | | | | | | | Shares | | | Value | |
| | | | | | | | | | | | | | | | |
| | | |
Common Stocks: 97.22% | | | | | | | | | | | | | |
| | | | |
Consumer Discretionary: 7.53% | | | | | | | | | | | | | | | | |
| | | |
| Hotels, Restaurants & Leisure: 1.30% | | | | | | | | | | | | | |
Norwegian Cruise Line Holdings Limited † | | | | | | | | | | | 78,429 | | | $ | 3,341,075 | |
| | | | | | | | | | | | | | | | |
| | | | |
| Household Durables: 1.18% | | | | | | | | | | | | | | | | |
Harman International Industries Incorporated | | | | | | | | | | | 36,627 | | | | 3,026,855 | |
| | | | | | | | | | | | | | | | |
| | | | |
| Leisure Products: 1.28% | | | | | | | | | | | | | | | | |
Mattel Incorporated | | | | | | | | | | | 98,217 | | | | 3,278,483 | |
| | | | | | | | | | | | | | | | |
| | | | |
| Media: 1.20% | | | | | | | | | | | | | | | | |
Scripps Networks Interactive Incorporated Class A | | | | | | | | | | | 46,387 | | | | 3,064,325 | |
| | | | | | | | | | | | | | | | |
| | | | |
| Specialty Retail: 1.61% | | | | | | | | | | | | | | | | |
Signet Jewelers Limited | | | | | | | | | | | 25,839 | | | | 2,271,506 | |
Williams-Sonoma Incorporated | | | | | | | | | | | 34,189 | | | | 1,848,941 | |
| |
| | | | 4,120,447 | |
| | | | | | | | | | | | | | | | |
| | | | |
| Textiles, Apparel & Luxury Goods: 0.96% | | | | | | | | | | | | | | | | |
Skechers U.S.A. Incorporated Class A † | | | | | | | | | | | 102,072 | | | | 2,451,769 | |
| | | | | | | | | | | | | | | | |
| | | | |
Consumer Staples: 7.90% | | | | | | | | | | | | | | | | |
| | | | |
| Beverages: 0.91% | | | | | | | | | | | | | | | | |
Coca-Cola European Partners plc | | | | | | | | | | | 62,588 | | | | 2,336,410 | |
| | | | | | | | | | | | | | | | |
| | | | |
| Food & Staples Retailing: 2.49% | | | | | | | | | | | | | | | | |
CVS Health Corporation | | | | | | | | | | | 68,885 | | | | 6,387,017 | |
| | | | | | | | | | | | | | | | |
| | | | |
| Food Products: 2.20% | | | | | | | | | | | | | | | | |
ConAgra Foods Incorporated | | | | | | | | | | | 54,538 | | | | 2,550,197 | |
TreeHouse Foods Incorporated † | | | | | | | | | | | 29,847 | | | | 3,079,912 | |
| |
| | | | 5,630,109 | |
| | | | | | | | | | | | | | | | |
| | | | |
| Household Products: 1.29% | | | | | | | | | | | | | | | | |
The Procter & Gamble Company | | | | | | | | | | | 38,469 | | | | 3,292,562 | |
| | | | | | | | | | | | | | | | |
| | | | |
| Personal Products: 1.01% | | | | | | | | | | | | | | | | |
Herbalife Limited Ǡ | | | | | | | | | | | 38,079 | | | | 2,589,753 | |
| | | | | | | | | | | | | | | | |
| | | | |
Energy: 11.60% | | | | | | | | | | | | | | | | |
| | | | |
| Energy Equipment & Services: 1.24% | | | | | | | | | | | | | | | | |
Baker Hughes Incorporated | | | | | | | | | | | 42,092 | | | | 2,013,260 | |
Noble Corporation plc « | | | | | | | | | | | 157,667 | | | | 1,163,582 | |
| |
| | | | 3,176,842 | |
| | | | | | | | | | | | | | | | |
The accompanying notes are an integral part of these financial statements.
| | | | |
| 12 | | Wells Fargo Large Company Value Fund | | Portfolio of investments—July 31, 2016 |
| | | | | | | | | | | | | | | | |
| Security name | | | | | | | | Shares | | | Value | |
| | | | | | | | | | | | | | | | |
| | | | |
| Oil, Gas & Consumable Fuels: 10.36% | | | | | | | | | | | | | | | | |
Chevron Corporation | | | | | | | | | | | 35,502 | | | $ | 3,638,245 | |
ConocoPhillips | | | | | | | | | | | 88,758 | | | | 3,623,102 | |
Exxon Mobil Corporation | | | | | | | | | | | 90,002 | | | | 8,005,678 | |
Kinder Morgan Incorporated | | | | | | | | | | | 211,292 | | | | 4,295,566 | |
Noble Energy Incorporated | | | | | | | | | | | 110,426 | | | | 3,944,417 | |
Valero Energy Corporation | | | | | | | | | | | 57,930 | | | | 3,028,580 | |
| |
| | | | 26,535,588 | |
| | | | | | | | | | | | | | | | |
| | | | |
Financials: 26.39% | | | | | | | | | | | | | | | | |
| | | | |
| Banks: 10.32% | | | | | | | | | | | | | | | | |
Bank of America Corporation | | | | | | | | | | | 307,122 | | | | 4,450,198 | |
BOK Financial Corporation « | | | | | | | | | | | 61,918 | | | | 4,038,911 | |
CIT Group Incorporated | | | | | | | | | | | 59,130 | | | | 2,043,533 | |
Citigroup Incorporated | | | | | | | | | | | 97,377 | | | | 4,266,086 | |
First Republic Bank | | | | | | | | | | | 37,062 | | | | 2,656,234 | |
FNB Corporation PA | | | | | | | | | | | 213,213 | | | | 2,547,895 | |
JPMorgan Chase & Company | | | | | | | | | | | 100,385 | | | | 6,421,628 | |
| | | | |
| | | | | | | | | | | | | | | 26,424,485 | |
| | | | | | | | | | | | | | | | |
| | | | |
| Capital Markets: 3.20% | | | | | | | | | | | | | | | | |
Affiliated Managers Group Incorporated † | | | | | | | | | | | 16,312 | | | | 2,394,275 | |
Ameriprise Financial Incorporated | | | | | | | | | | | 26,790 | | | | 2,567,554 | |
Goldman Sachs Group Incorporated | | | | | | | | | | | 20,387 | | | | 3,237,659 | |
| | | | |
| | | | | | | | | | | | | | | 8,199,488 | |
| | | | | | | | | | | | | | | | |
| | | | |
| Insurance: 6.91% | | | | | | | | | | | | | | | | |
American International Group Incorporated | | | | | | | | | | | 90,286 | | | | 4,915,170 | |
Arthur J. Gallagher & Company | | | | | | | | | | | 66,402 | | | | 3,266,314 | |
Chubb Limited | | | | | | | | | | | 22,279 | | | | 2,790,668 | |
Endurance Specialty Holdings Limited | | | | | | | | | | | 35,710 | | | | 2,415,067 | |
MetLife Incorporated | | | | | | | | | | | 100,814 | | | | 4,308,790 | |
| | | | |
| | | | | | | | | | | | | | | 17,696,009 | |
| | | | | | | | | | | | | | | | |
| | | | |
| REITs: 5.96% | | | | | | | | | | | | | | | | |
Alexandria Real Estate Equities Incorporated | | | | | | | | | | | 59,003 | | | | 6,626,037 | |
Prologis Incorporated | | | | | | | | | | | 57,028 | | | | 3,107,456 | |
VEREIT Incorporated | | | | | | | | | | | 308,932 | | | | 3,416,788 | |
Vornado Realty Trust | | | | | | | | | | | 19,720 | | | | 2,117,928 | |
| | | | |
| | | | | | | | | | | | | | | 15,268,209 | |
| | | | | | | | | | | | | | | | |
| | | | |
Health Care: 10.76% | | | | | | | | | | | | | | | | |
| | | | |
| Biotechnology: 0.85% | | | | | | | | | | | | | | | | |
AbbVie Incorporated | | | | | | | | | | | 32,851 | | | | 2,175,722 | |
| | | | | | | | | | | | | | | | |
| | | | |
| Health Care Providers & Services: 1.75% | | | | | | | | | | | | | | | | |
Cigna Corporation | | | | | | | | | | | 17,476 | | | | 2,253,705 | |
HCA Holdings Incorporated † | | | | | | | | | | | 28,786 | | | | 2,220,264 | |
| | | | |
| | | | | | | | | | | | | | | 4,473,969 | |
| | | | | | | | | | | | | | | | |
The accompanying notes are an integral part of these financial statements.
| | | | | | |
| Portfolio of investments—July 31, 2016 | | Wells Fargo Large Company Value Fund | | | 13 | |
| | | | | | | | | | | | | | | | |
| Security name | | | | | | | | Shares | | | Value | |
| | | | | | | | | | | | | | | | |
| | | | |
| Pharmaceuticals: 8.16% | | | | | | | | | | | | | | | | |
Allergan plc † | | | | | | | | | | | 13,794 | | | $ | 3,489,192 | |
Johnson & Johnson | | | | | | | | | | | 24,005 | | | | 3,006,146 | |
Mallinckrodt plc † | | | | | | | | | | | 49,385 | | | | 3,325,586 | |
Merck & Company Incorporated | | | | | | | | | | | 52,041 | | | | 3,052,725 | |
Pfizer Incorporated | | | | | | | | | | | 135,575 | | | | 5,001,362 | |
Shire plc ADR | | | | | | | | | | | 15,585 | | | | 3,025,360 | |
| | | | |
| | | | | | | | | | | | | | | 20,900,371 | |
| | | | | | | | | | | | | | | | |
| | | | |
Industrials: 10.83% | | | | | | | | | | | | | | | | |
| | | | |
| Aerospace & Defense: 2.25% | | | | | | | | | | | | | | | | |
Curtiss-Wright Corporation | | | | | | | | | | | 36,617 | | | | 3,258,547 | |
Raytheon Company | | | | | | | | | | | 17,973 | | | | 2,507,773 | |
| |
| | | | 5,766,320 | |
| | | | | | | | | | | | | | | | |
| | | | |
| Airlines: 0.57% | | | | | | | | | | | | | | | | |
United Continental Holdings Incorporated † | | | | | | | | | | | 30,974 | | | | 1,452,371 | |
| | | | | | | | | | | | | | | | |
| | | | |
| Electrical Equipment: 0.92% | | | | | | | | | | | | | | | | |
Eaton Corporation plc | | | | | | | | | | | 37,299 | | | | 2,365,130 | |
| | | | | | | | | | | | | | | | |
| | | | |
| Industrial Conglomerates: 1.65% | | | | | | | | | | | | | | | | |
General Electric Company | | | | | | | | | | | 135,741 | | | | 4,226,975 | |
| | | | | | | | | | | | | | | | |
| | | | |
| Machinery: 1.73% | | | | | | | | | | | | | | | | |
Stanley Black & Decker Incorporated | | | | | | | | | | | 36,477 | | | | 4,439,251 | |
| | | | | | | | | | | | | | | | |
| | | | |
| Professional Services: 0.86% | | | | | | | | | | | | | | | | |
Robert Half International Incorporated | | | | | | | | | | | 59,978 | | | | 2,191,596 | |
| | | | | | | | | | | | | | | | |
| | | | |
| Road & Rail: 1.67% | | | | | | | | | | | | | | | | |
Hertz Global Holdings Incorporated † | | | | | | | | | | | 32,480 | | | | 1,581,126 | |
Norfolk Southern Corporation | | | | | | | | | | | 30,051 | | | | 2,697,979 | |
| |
| | | | 4,279,105 | |
| | | | | | | | | | | | | | | | |
| | | | |
| Trading Companies & Distributors: 1.18% | | | | | | | | | | | | | | | | |
HD Supply Holdings Incorporated † | | | | | | | | | | | 72,973 | | | | 2,640,893 | |
Herc Holdings Incorporated | | | | | | | | | | | 10,826 | | | | 382,699 | |
| |
| | | | 3,023,592 | |
| | | | | | | | | | | | | | | | |
| | | | |
Information Technology: 10.15% | | | | | | | | | | | | | | | | |
| | | | |
| Electronic Equipment, Instruments & Components: 1.88% | | | | | | | | | | | | | | | | |
Synnex Corporation | | | | | | | | | | | 25,414 | | | | 2,554,869 | |
TE Connectivity Limited | | | | | | | | | | | 37,335 | | | | 2,250,554 | |
| |
| | | | 4,805,423 | |
| | | | | | | | | | | | | | | | |
| | | | |
| Internet Software & Services: 1.42% | | | | | | | | | | | | | | | | |
Alphabet Incorporated Class C † | | | | | | | | | | | 4,727 | | | | 3,634,070 | |
| | | | | | | | | | | | | | | | |
The accompanying notes are an integral part of these financial statements.
| | | | |
| 14 | | Wells Fargo Large Company Value Fund | | Portfolio of investments—July 31, 2016 |
| | | | | | | | | | | | | | | | |
| Security name | | | | | | | | Shares | | | Value | |
| | | | | | | | | | | | | | | | |
| | | | |
| IT Services: 1.03% | | | | | | | | | | | | | | | | |
Alliance Data Systems Corporation † | | | | | | | | | | | 11,423 | | | $ | 2,645,795 | |
| | | | | | | | | | | | | | | | |
| | | | |
| Semiconductors & Semiconductor Equipment: 2.35% | | | | | | | | | | | | | | | | |
NXP Semiconductors NV † | | | | | | | | | | | 45,771 | | | | 3,848,883 | |
Skyworks Solutions Incorporated | | | | | | | | | | | 32,975 | | | | 2,177,010 | |
| |
| | | | 6,025,893 | |
| | | | | | | | | | | | | | | | |
| | | | |
| Software: 0.59% | | | | | | | | | | | | | | | | |
Citrix Systems Incorporated † | | | | | | | | | | | 16,785 | | | | 1,496,047 | |
| | | | | | | | | | | | | | | | |
| | | | |
| Technology Hardware, Storage & Peripherals: 2.88% | | | | | | | | | | | | | | | | |
Apple Incorporated | | | | | | | | | | | 22,163 | | | | 2,309,606 | |
NCR Corporation † | | | | | | | | | | | 153,872 | | | | 5,073,160 | |
| |
| | | | 7,382,766 | |
| | | | | | | | | | | | | | | | |
| | | | |
Materials: 3.35% | | | | | | | | | | | | | | | | |
| | | | |
| Chemicals: 1.86% | | | | | | | | | | | | | | | | |
Cabot Corporation | | | | | | | | | | | 37,503 | | | | 1,826,021 | |
FMC Corporation | | | | | | | | | | | 61,891 | | | | 2,942,298 | |
| | | | |
| | | | | | | | | | | | | | | 4,768,319 | |
| | | | | | | | | | | | | | | | |
| | | | |
| Containers & Packaging: 1.49% | | | | | | | | | | | | | | | | |
Crown Holdings Incorporated † | | | | | | | | | | | 53,806 | | | | 2,850,104 | |
WestRock Company | | | | | | | | | | | 22,407 | | | | 961,484 | |
| | | | |
| | | | | | | | | | | | | | | 3,811,588 | |
| | | | | | | | | | | | | | | | |
| | | | |
Telecommunication Services: 2.41% | | | | | | | | | | | | | | | | |
| | | | |
| Diversified Telecommunication Services: 2.41% | | | | | | | | | | | | | | | | |
AT&T Incorporated | | | | | | | | | | | 71,214 | | | | 3,082,854 | |
Verizon Communications Incorporated | | | | | | | | | | | 55,538 | | | | 3,077,361 | |
| | | | |
| | | | | | | | | | | | | | | 6,160,215 | |
| | | | | | | | | | | | | | | | |
| | | | |
Utilities: 6.30% | | | | | | | | | | | | | | | | |
| | | | |
| Electric Utilities: 5.14% | | | | | | | | | | | | | | | | |
Duke Energy Corporation | | | | | | | | | | | 47,730 | | | | 4,085,211 | |
Great Plains Energy Incorporated | | | | | | | | | | | 158,712 | | | | 4,726,443 | |
The Southern Company | | | | | | | | | | | 81,273 | | | | 4,348,106 | |
| | | | |
| | | | | | | | | | | | | | | 13,159,760 | |
| | | | | | | | | | | | | | | | |
| | | | |
| Gas Utilities: 1.16% | | | | | | | | | | | | | | | | |
Atmos Energy Corporation | | | | | | | | | | | 37,368 | | | | 2,981,593 | |
| | | | | | | | | | | | | | | | |
| | | | |
Total Common Stocks (Cost $200,998,030) | | | | | | | | | | | | | | | 248,985,297 | |
| | | | | | | | | | | | | | | | |
The accompanying notes are an integral part of these financial statements.
| | | | | | |
| Portfolio of investments—July 31, 2016 | | Wells Fargo Large Company Value Fund | | | 15 | |
| | | | | | | | | | | | | | | | |
| Security name | | Yield | | | | | | Shares | | | Value | |
| | | | | | | | | | | | | | | | |
| | | | |
Short-Term Investments: 4.47% | | | | | | | | | | | | | | | | |
| | | | |
| Investment Companies: 4.47% | | | | | | | | | | | | | | | | |
Securities Lending Cash Investments, LLC (l)(r)(u) | | | 0.50 | % | | | | | | | 6,621,300 | | | $ | 6,621,300 | |
Wells Fargo Government Money Market Fund Select Class (l)(u) | | | 0.32 | | | | | | | | 4,823,016 | | | | 4,823,016 | |
| | | | |
Total Short-Term Investments (Cost $11,444,316) | | | | | | | | | | | | | | | 11,444,316 | |
| | | | | | | | | | | | | | | | |
| | | | | | | | |
| Total investments in securities (Cost $212,442,346) * | | | 101.69 | % | | | 260,429,613 | |
Other assets and liabilities, net | | | (1.69 | ) | | | (4,325,611 | ) |
| | | | | | | | |
| Total net assets | | | 100.00 | % | | $ | 256,104,002 | |
| | | | | | | | |
| † | Non-income-earning security |
| « | All or a portion of this security is on loan. |
| (l) | The issuer of the security is an affiliated person of the Fund as defined in the Investment Company Act of 1940. |
| (r) | The investment is a non-registered investment vehicle purchased with cash collateral received from securities on loan. |
| (u) | The rate represents the 7-day annualized yield at period end. |
| * | Cost for federal income tax purposes is $216,401,943 and unrealized gains (losses) consists of: |
| | | | |
Gross unrealized gains | | $ | 53,301,012 | |
Gross unrealized losses | | | (9,273,342 | ) |
| | | | |
Net unrealized gains | | $ | 44,027,670 | |
The accompanying notes are an integral part of these financial statements.
| | | | |
| 16 | | Wells Fargo Large Company Value Fund | | Statement of assets and liabilities—July 31, 2016 |
| | | | |
| | | | |
| |
Assets | | | | |
Investments | | | | |
In unaffiliated securities (including $6,429,729 of securities loaned), at value (cost $200,998,030) | | $ | 248,985,297 | |
In affiliated securities, at value (cost $11,444,316) | | | 11,444,316 | |
| | | | |
Total investments, at value (cost $212,442,346) | | | 260,429,613 | |
Receivable for investments sold | | | 6,162,497 | |
Receivable for Fund shares sold | | | 9,024 | |
Receivable for dividends | | | 344,137 | |
Receivable for securities lending income | | | 1,845 | |
Prepaid expenses and other assets | | | 49,026 | |
| | | | |
Total assets | | | 266,996,142 | |
| | | | |
| |
Liabilities | | | | |
Payable for investments purchased | | | 3,845,974 | |
Payable for Fund shares redeemed | | | 140,210 | |
Payable upon receipt of securities loaned | | | 6,621,300 | |
Management fee payable | | | 118,772 | |
Distribution fee payable | | | 2,380 | |
Administration fees payable | | | 42,954 | |
Accrued expenses and other liabilities | | | 120,550 | |
| | | | |
Total liabilities | | | 10,892,140 | |
| | | | |
Total net assets | | $ | 256,104,002 | |
| | | | |
| |
NET ASSETS CONSIST OF | | | | |
Paid-in capital | | $ | 215,526,392 | |
Overdistributed net investment income | | | (11,855 | ) |
Accumulated net realized losses on investments | | | (7,397,802 | ) |
Net unrealized gains on investments | | | 47,987,267 | |
| | | | |
Total net assets | | $ | 256,104,002 | |
| | | | |
| |
COMPUTATION OF NET ASSET VALUE AND OFFERING PRICE PER SHARE | | | | |
Net assets – Class A | | $ | 218,922,210 | |
Shares outstanding – Class A1 | | | 15,017,498 | |
Net asset value per share – Class A | | | $14.58 | |
Maximum offering price per share – Class A2 | | | $15.47 | |
Net assets – Class C | | $ | 3,674,172 | |
Shares outstanding – Class C1 | | | 246,667 | |
Net asset value per share – Class C | | | $14.90 | |
Net assets – Administrator Class | | $ | 24,164,288 | |
Shares outstanding – Administrator Class1 | | | 1,646,555 | |
Net asset value per share – Administrator Class | | | $14.68 | |
Net assets – Institutional Class | | $ | 9,343,332 | |
Shares outstanding – Institutional Class1 | | | 637,399 | |
Net asset value per share – Institutional Class | | | $14.66 | |
| 1 | The Fund has an unlimited number of authorized shares. |
| 2 | Maximum offering price is computed as 100/94.25 of net asset value. On investments of $50,000 or more, the offering price is reduced. |
The accompanying notes are an integral part of these financial statements.
| | | | | | |
| Statement of operations—year ended July 31, 2016 | | Wells Fargo Large Company Value Fund | | | 17 | |
| | | | |
| | | | |
| |
Investment income | | | | |
Dividends (net of foreign withholding taxes of $2,998) | | $ | 5,673,508 | |
Securities lending income, net | | | 117,985 | |
Income from affiliated securities | | | 15,781 | |
| | | | |
Total investment income | | | 5,807,274 | |
| | | | |
| |
Expenses | | | | |
Management fee | | | 1,779,099 | |
Administration fees | | | | |
Class A | | | 395,497 | |
Class C | | | 8,008 | |
Administrator Class | | | 32,922 | |
Institutional Class | | | 7,981 | |
Investor Class | | | 97,752 | 1 |
Shareholder servicing fees | | | | |
Class A | | | 470,284 | |
Class C | | | 9,533 | |
Administrator Class | | | 63,312 | |
Investor Class | | | 76,122 | 1 |
Distribution fee | | | | |
Class C | | | 28,600 | |
Custody and accounting fees | | | 21,561 | |
Professional fees | | | 40,298 | |
Registration fees | | | 65,564 | |
Shareholder report expenses | | | 49,173 | |
Trustees’ fees and expenses | | | 24,075 | |
Other fees and expenses | | | 11,502 | |
| | | | |
Total expenses | | | 3,181,283 | |
Less: Fee waivers and/or expense reimbursements | | | (403,003 | ) |
| | | | |
Net expenses | | | 2,778,280 | |
| | | | |
Net investment income | | | 3,028,994 | |
| | | | |
| |
REALIZED AND UNREALIZED GAINS (LOSSES) ON INVESTMENTS | | | | |
Net realized losses on investments | | | (969,698 | ) |
Net change in unrealized gains (losses) on investments | | | (5,958,734 | ) |
| | | | |
Net realized and unrealized gains (losses) on investments | | | (6,928,432 | ) |
| | | | |
Net decrease in net assets resulting from operations | | $ | (3,899,438 | ) |
| | | | |
| 1 | For the period from August 1, 2015 to October 23, 2015. Effective at the close of business on October 23, 2015, Investor Class shares were converted to Class A shares and are no longer offered by the Fund. |
The accompanying notes are an integral part of these financial statements.
| | | | |
| 18 | | Wells Fargo Large Company Value Fund | | Statement of changes in net assets |
| | | | | | | | | | | | | | | | |
| | | Year ended July 31, 2016 | | | Year ended July 31, 2015 | |
| | | | |
Operations | | | | | | | | | | | | | | | | |
Net investment income | | | | | | $ | 3,028,994 | | | | | | | $ | 2,249,903 | |
Net realized gains (losses) on investments | | | | | | | (969,698 | ) | | | | | | | 31,510,363 | |
Net change in unrealized gains (losses) on investments | | | | | | | (5,958,734 | ) | | | | | | | (16,922,395 | ) |
| | | | |
Net increase (decrease) in net assets resulting from operations | | | | | | | (3,899,438 | ) | | | | | | | 16,837,871 | |
| | | | |
| | | | |
Distributions to shareholders from | | | | | | | | | | | | | | | | |
Net investment income | | | | | | | | | | | | | | | | |
Class A | | | | | | | (2,264,793 | ) | | | | | | | (879,902 | ) |
Class C | | | | | | | (13,093 | ) | | | | | | | (2,940 | ) |
Administrator Class | | | | | | | (337,098 | ) | | | | | | | (376,690 | ) |
Institutional Class | | | | | | | (111,852 | ) | | | | | | | (21,092 | ) |
Investor Class | | | | | | | (248,226 | )1 | | | | | | | (1,017,744 | ) |
Net realized gains | | | | | | | | | | | | | | | | |
Class A | | | | | | | (16,632,476 | ) | | | | | | | (9,704,404 | ) |
Class C | | | | | | | (275,850 | ) | | | | | | | (389,854 | ) |
Administrator Class | | | | | | | (1,889,643 | ) | | | | | | | (3,048,826 | ) |
Institutional Class | | | | | | | (642,971 | ) | | | | | | | (160,301 | ) |
Investor Class | | | | | | | 0 | 1 | | | | | | | (12,477,097 | ) |
| | | | |
Total distributions to shareholders | | | | | | | (22,416,002 | ) | | | | | | | (28,078,850 | ) |
| | | | |
| | | | |
Capital share transactions | | | Shares | | | | | | | | Shares | | | | | |
Proceeds from shares sold | | | | | | | | | | | | | | | | |
Class A | | | 8,907,108 | | | | 138,160,256 | | | | 123,205 | | | | 2,013,071 | |
Class C | | | 31,550 | | | | 457,515 | | | | 38,787 | | | | 642,242 | |
Administrator Class | | | 71,607 | | | | 1,041,380 | | | | 119,049 | | | | 1,984,735 | |
Institutional Class | | | 547,916 | | | | 8,310,962 | | | | 70,995 | | | | 1,223,711 | |
Investor Class | | | 32,361 | 1 | | | 501,302 | 1 | | | 320,863 | | | | 5,443,693 | |
| | | | |
| | | | | | | 148,471,415 | | | | | | | | 11,307,452 | |
| | | | |
Reinvestment of distributions | | | | | | | | | | | | | | | | |
Class A | | | 1,321,571 | | | | 18,357,171 | | | | 651,156 | | | | 10,256,986 | |
Class C | | | 18,165 | | | | 257,417 | | | | 21,352 | | | | 341,919 | |
Administrator Class | | | 143,421 | | | | 2,009,265 | | | | 197,644 | | | | 3,137,103 | |
Institutional Class | | | 50,313 | | | | 702,990 | | | | 6,036 | | | | 95,717 | |
Investor Class | | | 15,819 | 1 | | | 239,184 | 1 | | | 800,321 | | | | 12,965,138 | |
| | | | |
| | | | | | | 21,566,027 | | | | | | | | 26,796,863 | |
| | | | |
Payment for shares redeemed | | | | | | | | | | | | | | | | |
Class A | | | (1,699,975 | ) | | | (24,158,609 | ) | | | (1,205,076 | ) | | | (20,028,888 | ) |
Class C | | | (76,521 | ) | | | (1,132,943 | ) | | | (58,702 | ) | | | (985,449 | ) |
Administrator Class | | | (431,324 | ) | | | (6,314,039 | ) | | | (580,514 | ) | | | (9,574,977 | ) |
Institutional Class | | | (52,523 | ) | | | (756,449 | ) | | | (36,394 | ) | | | (597,478 | ) |
Investor Class | | | (8,624,994 | )1 | | | (137,936,039 | )1 | | | (1,044,020 | ) | | | (17,642,122 | ) |
| | | | |
| | | | | | | (170,298,079 | ) | | | | | | | (48,828,914 | ) |
| | | | |
Net decrease in net assets resulting from capital share transactions | | | | | | | (260,637 | ) | | | | | | | (10,724,599 | ) |
| | | | |
Total decrease in net assets | | | | | | | (26,576,077 | ) | | | | | | | (21,965,578 | ) |
| | | | |
| | | | |
Net assets | | | | | | | | | | | | | | | | |
Beginning of period | | | | | | | 282,680,079 | | | | | | | | 304,645,657 | |
| | | | |
End of period | | | | | | $ | 256,104,002 | | | | | | | $ | 282,680,079 | |
| | | | |
Undistributed (overdistributed) net investment income | | | | | | $ | (11,855 | ) | | | | | | $ | 101,225 | |
| | | | |
| 1 | For the period from August 1, 2015 to October 23, 2015. Effective at the close of business on October 23, 2015, Investor Class shares were converted to Class A shares and are no longer offered by the Fund. |
The accompanying notes are an integral part of these financial statements.
| | | | | | |
| Financial highlights | | Wells Fargo Large Company Value Fund | | | 19 | |
(For a share outstanding throughout each period)
| | | | | | | | | | | | | | | | | | | | |
| | | Year ended July 31 | |
| CLASS A | | 2016 | | | 2015 | | | 2014 | | | 2013 | | | 2012 | |
Net asset value, beginning of period | | | $16.10 | | | | $16.82 | | | | $16.39 | | | | $12.96 | | | | $12.61 | |
Net investment income | | | 0.17 | | | | 0.13 | 1 | | | 0.10 | | | | 0.14 | | | | 0.17 | |
Net realized and unrealized gains (losses) on investments | | | (0.41 | ) | | | 0.78 | | | | 2.04 | | | | 3.48 | | | | 0.35 | |
| | | | | | | | | | | | | | | | | | | | |
Total from investment operations | | | (0.24 | ) | | | 0.91 | | | | 2.14 | | | | 3.62 | | | | 0.52 | |
Distributions to shareholders from | | | | | | | | | | | | | | | | | | | | |
Net investment income | | | (0.16 | ) | | | (0.13 | ) | | | (0.09 | ) | | | (0.19 | ) | | | (0.17 | ) |
Net realized gains | | | (1.12 | ) | | | (1.50 | ) | | | (1.62 | ) | | | 0.00 | | | | 0.00 | |
| | | | | | | | | | | | | | | | | | | | |
Total distributions to shareholders | | | (1.28 | ) | | | (1.63 | ) | | | (1.71 | ) | | | (0.19 | ) | | | (0.17 | ) |
Net asset value, end of period | | | $14.58 | | | | $16.10 | | | | $16.82 | | | | $16.39 | | | | $12.96 | |
Total return2 | | | (0.98 | )% | | | 5.72 | % | | | 13.68 | % | | | 28.16 | % | | | 4.21 | % |
Ratios to average net assets (annualized) | | | | | | | | | | | | | | | | | | | | |
Gross expenses | | | 1.24 | % | | | 1.27 | % | | | 1.28 | % | | | 1.28 | % | | | 1.27 | % |
Net expenses | | | 1.10 | % | | | 1.10 | % | | | 1.10 | % | | | 1.10 | % | | | 1.10 | % |
Net investment income | | | 1.19 | % | | | 0.76 | % | | | 0.61 | % | | | 1.00 | % | | | 1.29 | % |
Supplemental data | | | | | | | | | | | | | | | | | | | | |
Portfolio turnover rate | | | 50 | % | | | 71 | % | | | 59 | % | | | 78 | % | | | 37 | % |
Net assets, end of period (000s omitted) | | | $218,922 | | | | $104,453 | | | | $116,398 | | | | $115,895 | | | | $103,195 | |
| 1 | Calculated based upon average shares outstanding |
| 2 | Total return calculations do not include any sales charges. |
The accompanying notes are an integral part of these financial statements.
| | | | |
| 20 | | Wells Fargo Large Company Value Fund | | Financial highlights |
(For a share outstanding throughout each period)
| | | | | | | | | | | | | | | | | | | | |
| | | Year ended July 31 | |
| CLASS C | | 2016 | | | 2015 | | | 2014 | | | 2013 | | | 2012 | |
Net asset value, beginning of period | | | $16.41 | | | | $17.12 | | | | $16.70 | | | | $13.21 | | | | $12.81 | |
Net investment income (loss) | | | 0.06 | | | | 0.00 | 1 | | | (0.02 | ) | | | 0.04 | | | | 0.09 | |
Net realized and unrealized gains (losses) on investments | | | (0.40 | ) | | | 0.80 | | | | 2.07 | | | | 3.54 | | | | 0.36 | |
| | | | | | | | | | | | | | | | | | | | |
Total from investment operations | | | (0.34 | ) | | | 0.80 | | | | 2.05 | | | | 3.58 | | | | 0.45 | |
Distributions to shareholders from | | | | | | | | | | | | | | | | | | | | |
Net investment income | | | (0.05 | ) | | | (0.01 | ) | | | (0.01 | ) | | | (0.09 | ) | | | (0.05 | ) |
Net realized gains | | | (1.12 | ) | | | (1.50 | ) | | | (1.62 | ) | | | 0.00 | | | | 0.00 | |
| | | | | | | | | | | | | | | | | | | | |
Total distributions to shareholders | | | (1.17 | ) | | | (1.51 | ) | | | (1.63 | ) | | | (0.09 | ) | | | (0.05 | ) |
Net asset value, end of period | | | $14.90 | | | | $16.41 | | | | $17.12 | | | | $16.70 | | | | $13.21 | |
Total return2 | | | (1.68 | )% | | | 4.92 | % | | | 12.83 | % | | | 27.17 | % | | | 3.49 | % |
Ratios to average net assets (annualized) | | | | | | | | | | | | | | | | | | | | |
Gross expenses | | | 1.99 | % | | | 2.02 | % | | | 2.03 | % | | | 2.03 | % | | | 2.02 | % |
Net expenses | | | 1.85 | % | | | 1.85 | % | | | 1.85 | % | | | 1.85 | % | | | 1.85 | % |
Net investment income (loss) | | | 0.44 | % | | | 0.01 | % | | | (0.14 | )% | | | 0.25 | % | | | 0.54 | % |
Supplemental data | | | | | | | | | | | | | | | | | | | | |
Portfolio turnover rate | | | 50 | % | | | 71 | % | | | 59 | % | | | 78 | % | | | 37 | % |
Net assets, end of period (000s omitted) | | | $3,674 | | | | $4,488 | | | | $4,659 | | | | $4,543 | | | | $4,022 | |
| 1 | Amount is less than $0.005. |
| 2 | Total return calculations do not include any sales charges. |
The accompanying notes are an integral part of these financial statements.
| | | | | | |
| Financial highlights | | Wells Fargo Large Company Value Fund | | | 21 | |
(For a share outstanding throughout each period)
| | | | | | | | | | | | | | | | | | | | |
| | | Year ended July 31 | |
| ADMINISTRATOR CLASS | | 2016 | | | 2015 | | | 2014 | | | 2013 | | | 2012 | |
Net asset value, beginning of period | | | $16.20 | | | | $16.93 | | | | $16.47 | | | | $13.02 | | | | $12.68 | |
Net investment income | | | 0.20 | | | | 0.17 | | | | 0.15 | | | | 0.21 | | | | 0.19 | 1 |
Net realized and unrealized gains (losses) on investments | | | (0.41 | ) | | | 0.78 | | | | 2.05 | | | | 3.46 | | | | 0.36 | |
| | | | | | | | | | | | | | | | | | | | |
Total from investment operations | | | (0.21 | ) | | | 0.95 | | | | 2.20 | | | | 3.67 | | | | 0.55 | |
Distributions to shareholders from | | | | | | | | | | | | | | | | | | | | |
Net investment income | | | (0.19 | ) | | | (0.18 | ) | | | (0.12 | ) | | | (0.22 | ) | | | (0.21 | ) |
Net realized gains | | | (1.12 | ) | | | (1.50 | ) | | | (1.62 | ) | | | 0.00 | | | | 0.00 | |
| | | | | | | | | | | | | | | | | | | | |
Total distributions to shareholders | | | (1.31 | ) | | | (1.68 | ) | | | (1.74 | ) | | | (0.22 | ) | | | (0.21 | ) |
Net asset value, end of period | | | $14.68 | | | | $16.20 | | | | $16.93 | | | | $16.47 | | | | $13.02 | |
Total return | | | (0.79 | )% | | | 5.95 | % | | | 13.94 | % | | | 28.52 | % | | | 4.47 | % |
Ratios to average net assets (annualized) | | | | | | | | | | | | | | | | | | | | |
Gross expenses | | | 1.16 | % | | | 1.12 | % | | | 1.12 | % | | | 1.10 | % | | | 1.11 | % |
Net expenses | | | 0.93 | % | | | 0.85 | % | | | 0.85 | % | | | 0.85 | % | | | 0.85 | % |
Net investment income | | | 1.35 | % | | | 1.01 | % | | | 0.86 | % | | | 1.28 | % | | | 1.54 | % |
Supplemental data | | | | | | | | | | | | | | | | | | | | |
Portfolio turnover rate | | | 50 | % | | | 71 | % | | | 59 | % | | | 78 | % | | | 37 | % |
Net assets, end of period (000s omitted) | | | $24,164 | | | | $30,177 | | | | $36,002 | | | | $38,798 | | | | $176,623 | |
| 1 | Calculated based upon average shares outstanding |
The accompanying notes are an integral part of these financial statements.
| | | | |
| 22 | | Wells Fargo Large Company Value Fund | | Financial highlights |
(For a share outstanding throughout each period)
| | | | | | | | | | | | | | | | | | | | |
| | | Year ended July 31 | |
| INSTITUTIONAL CLASS | | 2016 | | | 2015 | | | 2014 | | | 2013 | | | 2012 | |
Net asset value, beginning of period | | | $16.17 | | | | $16.91 | | | | $16.44 | | | | $13.00 | | | | $12.68 | |
Net investment income | | | 0.21 | 1 | | | 0.20 | 1 | | | 0.18 | 1 | | | 0.26 | 1 | | | 0.22 | |
Net realized and unrealized gains (losses) on investments | | | (0.38 | ) | | | 0.78 | | | | 2.05 | | | | 3.45 | | | | 0.35 | |
| | | | | | | | | | | | | | | | | | | | |
Total from investment operations | | | (0.17 | ) | | | 0.98 | | | | 2.23 | | | | 3.71 | | | | 0.57 | |
Distributions to shareholders from | | | | | | | | | | | | | | | | | | | | |
Net investment income | | | (0.22 | ) | | | (0.22 | ) | | | (0.14 | ) | | | (0.27 | ) | | | (0.25 | ) |
Net realized gains | | | (1.12 | ) | | | (1.50 | ) | | | (1.62 | ) | | | 0.00 | | | | 0.00 | |
| | | | | | | | | | | | | | | | | | | | |
Total distributions to shareholders | | | (1.34 | ) | | | (1.72 | ) | | | (1.76 | ) | | | (0.27 | ) | | | (0.25 | ) |
Net asset value, end of period | | | $14.66 | | | | $16.17 | | | | $16.91 | | | | $16.44 | | | | $13.00 | |
Total return | | | (0.54 | )% | | | 6.14 | % | | | 14.16 | % | | | 28.93 | % | | | 4.67 | % |
Ratios to average net assets (annualized) | | | | | | | | | | | | | | | | | | | | |
Gross expenses | | | 0.91 | % | | | 0.85 | % | | | 0.85 | % | | | 0.84 | % | | | 0.85 | % |
Net expenses | | | 0.74 | % | | | 0.65 | % | | | 0.65 | % | | | 0.65 | % | | | 0.66 | % |
Net investment income | | | 1.52 | % | | | 1.23 | % | | | 1.10 | % | | | 1.83 | % | | | 1.80 | % |
Supplemental data | | | | | | | | | | | | | | | | | | | | |
Portfolio turnover rate | | | 50 | % | | | 71 | % | | | 59 | % | | | 78 | % | | | 37 | % |
Net assets, end of period (000s omitted) | | | $9,343 | | | | $1,483 | | | | $863 | | | | $3,299 | | | | $15,924 | |
| 1 | Calculated based upon average shares outstanding |
The accompanying notes are an integral part of these financial statements.
| | | | | | |
| Notes to financial statements | | Wells Fargo Large Company Value Fund | | | 23 | |
1. ORGANIZATION
Wells Fargo Funds Trust (the “Trust”), a Delaware statutory trust organized on March 10, 1999, is an open-end management investment company registered under the Investment Company Act of 1940, as amended (the “1940 Act”). As an investment company, the Trust follows the accounting and reporting guidance in Financial Accounting Standards Board (“FASB”) Accounting Standards Codification Topic 946, Financial Services – Investment Companies. These financial statements report on the Wells Fargo Large Company Value Fund (the “Fund”) which is a diversified series of the Trust.
2. SIGNIFICANT ACCOUNTING POLICIES
The following significant accounting policies, which are consistently followed in the preparation of the financial statements of the Fund, are in conformity with U.S. generally accepted accounting principles which require management to make estimates and assumptions that affect the reported amounts of assets and liabilities, disclosure of contingent assets and liabilities at the date of the financial statements, and the reported amounts of revenues and expenses during the reporting period. Actual results could differ from those estimates.
Securities valuation
All investments are valued each business day as of the close of regular trading on the New York Stock Exchange (generally 4 p.m. Eastern Time), although the Fund may deviate from this calculation time under unusual or unexpected circumstances.
Equity securities that are listed on a foreign or domestic exchange or market are valued at the official closing price or, if none, the last sales price. If no sale occurs on the principal exchange or market that day, the prior day’s price will be deemed “stale” and a fair value price will be determined in accordance with the Fund’s Valuation Procedures.
Investments in registered open-end investment companies are valued at net asset value. Interests in non-registered investment vehicles that are redeemable at net asset value are fair valued normally at net asset value.
Investments which are not valued using any of the methods discussed above are valued at their fair value, as determined in good faith by the Board of Trustees of the Fund. The Board of Trustees has established a Valuation Committee comprised of the Trustees and has delegated to it the authority to take any actions regarding the valuation of portfolio securities that the Valuation Committee deems necessary or appropriate, including determining the fair value of portfolio securities, unless the determination has been delegated to the Management Valuation Team of Wells Fargo Funds Management, LLC (“Funds Management”). The Board of Trustees retains the authority to make or ratify any valuation decisions or approve any changes to the Valuation Procedures as it deems appropriate. On a quarterly basis, the Board of Trustees receives reports on any valuation actions taken by the Valuation Committee or the Management Valuation Team which may include items for ratification.
Valuations of fair valued securities are compared to the next actual sales price when available, or other appropriate market values, to assess the continued appropriateness of the fair valuation methodologies used. These securities are fair valued on a day-to-day basis, taking into consideration changes to appropriate market information and any significant changes to the inputs considered in the valuation process until there is a readily available price provided on an exchange or by an independent pricing service. Valuations received from an independent pricing service or independent broker-dealer quotes are periodically validated by comparisons to most recent trades and valuations provided by other independent pricing services in addition to the review of prices by the manager and/or subadviser. Unobservable inputs used in determining fair valuations are identified based on the type of security, taking into consideration factors utilized by market participants in valuing the investment, knowledge about the issuer and the current market environment.
Security loans
The Fund may lend its securities from time to time in order to earn additional income in the form of fees or interest on securities received as collateral or the investment of any cash received as collateral. The Fund continues to receive interest or dividends on the securities loaned. The Fund receives collateral in the form of cash or securities with a value at least equal to the value of the securities on loan. The value of the loaned securities is determined at the close of each business day and any additional required collateral is delivered to the Fund on the next business day. In a securities lending transaction, the net asset value of the Fund will be affected by an increase or decrease in the value of the securities loaned and by an increase or decrease in the value of the instrument in which collateral is invested. The amount of securities lending activity undertaken by the Fund fluctuates from time to time. In the event of default or bankruptcy by the borrower, the Fund may be prevented from recovering the loaned securities or gaining access to the collateral or may experience delays or costs in doing so. In addition, the investment of any cash collateral received may lose all or part of its value. The Fund has the right under the lending agreement to recover the securities from the borrower on demand.
| | | | |
| 24 | | Wells Fargo Large Company Value Fund | | Notes to financial statements |
The Fund lends its securities through an unaffiliated securities lending agent. Cash collateral received in connection with its securities lending transactions is invested in Securities Lending Cash Investments, LLC (the “Securities Lending Fund”). The Securities Lending Fund is exempt from registration under Section 3(c)(7) of the 1940 Act and is managed by Funds Management and is subadvised by Wells Capital Management Incorporated (“WellsCap”), an affiliate of Funds Management and an indirect wholly owned subsidiary of Wells Fargo & Company (“Wells Fargo”). Funds Management receives an advisory fee starting at 0.05% and declining to 0.01% as the average daily net assets of the Securities Lending Fund increase. All of the fees received by Funds Management are paid to WellsCap for its services as subadviser. The Securities Lending Fund seeks to provide a positive return compared to the daily Fed Funds Open rate by investing in high-quality, U.S. dollar-denominated short-term money market instruments. Securities Lending Fund investments are fair valued based upon the amortized cost valuation technique. Income earned from investment in the Securities Lending Fund is included in securities lending income on the Statement of Operations.
Security transactions and income recognition
Securities transactions are recorded on a trade date basis. Realized gains or losses are recorded on the basis of identified cost.
Dividend income is recognized on the ex-dividend date. Dividend income is recorded net of foreign taxes withheld where recovery of such taxes is not assured.
Distributions to shareholders
Distributions to shareholders from net investment income and net realized gains, if any, are recorded on the ex-dividend date. Such distributions are determined in conformity with federal income tax regulations, which may differ in amount or character from net investment income and realized gains recognized for purposes of U.S. generally accepted accounting principles.
Federal and other taxes
The Fund intends to continue to qualify as a regulated investment company by distributing substantially all of its investment company taxable income and any net realized capital gains (after reduction for capital loss carryforwards) sufficient to relieve it from all, or substantially all, federal income taxes. Accordingly, no provision for federal income taxes was required.
The Fund’s income and federal excise tax returns and all financial records supporting those returns for the prior three fiscal years are subject to examination by the federal and Delaware revenue authorities. Management has analyzed the Fund’s tax positions taken on federal, state, and foreign tax returns for all open tax years and does not believe that there are any uncertain tax positions that require recognition of a tax liability.
Reclassifications are made to the Fund’s capital accounts for permanent tax differences to reflect income and gains available for distribution (or available capital loss carryforwards) under federal income tax regulations. U.S. generally accepted accounting principles require that certain components of net assets be adjusted to reflect permanent differences between financial and tax reporting. These reclassifications have no effect on net assets or net asset values per share. The primary permanent differences causing such reclassifications are due to certain distributions paid, dividends from certain securities, and expiration of capital loss carryforwards. At July 31, 2016, as a result of permanent book-to-tax differences, the following reclassification adjustments were made on the Statement of Assets and Liabilities:
| | | | |
| Paid-in capital | | Overdistributed net
investment income | | Accumulated net realized losses on investments |
| $(1,040,715) | | $(167,012) | | $1,207,727 |
As of July 31, 2016, the Fund had current year deferred post-October capital losses and a qualified late-year ordinary loss which will both be recognized on the first day of the following fiscal year in the following amounts:
| | | | |
Deferred post-October capital losses | | Late-year ordinary losses deferred |
| Short-term | | Long-term | |
| $(2,154,994) | | $(1,283,211) | | $(361) |
| | | | | | |
| Notes to financial statements | | Wells Fargo Large Company Value Fund | | | 25 | |
Class allocations
The separate classes of shares offered by the Fund differ principally in applicable sales charges, distribution, shareholder servicing, and administration fees. Class specific expenses are charged directly to that share class. Investment income, common expenses, and realized and unrealized gains (losses) on investments are allocated daily to each class of shares based on the relative proportion of net assets of each class.
3. FAIR VALUATION MEASUREMENTS
Fair value measurements of investments are determined within a framework that has established a fair value hierarchy based upon the various data inputs utilized in determining the value of the Fund’s investments. The three-level hierarchy gives the highest priority to unadjusted quoted prices in active markets for identical assets or liabilities (Level 1) and the lowest priority to significant unobservable inputs (Level 3). The Fund’s investments are classified within the fair value hierarchy based on the lowest level of input that is significant to the fair value measurement. The inputs are summarized into three broad levels as follows:
| n | | Level 1 – quoted prices in active markets for identical securities |
| n | | Level 2 – other significant observable inputs (including quoted prices for similar securities, interest rates, prepayment speeds, credit risk, use of amortized cost, etc.) |
| n | | Level 3 – significant unobservable inputs (including the Fund’s own assumptions in determining the fair value of investments) |
The inputs or methodologies used for valuing investments in securities are not necessarily an indication of the risk associated with investing in those securities.
The following is a summary of the inputs used in valuing the Fund’s assets and liabilities as of July 31, 2016:
| | | | | | | | | | | | | | | | |
| | | Quoted prices (Level 1) | | | Other significant observable inputs
(Level 2) | | | Significant
unobservable inputs (Level 3) | | | Total | |
Assets | | | | | | | | | | | | | | | | |
Investments in: | | | | | | | | | | | | | | | | |
| | | | |
Common stocks | | | | | | | | | | | | | | | | |
Consumer discretionary | | $ | 19,282,954 | | | $ | 0 | | | $ | 0 | | | $ | 19,282,954 | |
Consumer staples | | | 20,235,851 | | | | 0 | | | | 0 | | | | 20,235,851 | |
Energy | | | 29,712,430 | | | | 0 | | | | 0 | | | | 29,712,430 | |
Financials | | | 67,588,191 | | | | 0 | | | | 0 | | | | 67,588,191 | |
Health care | | | 27,550,062 | | | | 0 | | | | 0 | | | | 27,550,062 | |
Industrials | | | 27,744,340 | | | | 0 | | | | 0 | | | | 27,744,340 | |
Information technology | | | 25,989,994 | | | | 0 | | | | 0 | | | | 25,989,994 | |
Materials | | | 8,579,907 | | | | 0 | | | | 0 | | | | 8,579,907 | |
Telecommunication services | | | 6,160,215 | | | | 0 | | | | 0 | | | | 6,160,215 | |
Utilities | | | 16,141,353 | | | | 0 | | | | 0 | | | | 16,141,353 | |
| | | | |
Short-term investments | | | | | | | | | | | | | | | | |
Investment companies | | | 4,823,016 | | | | 0 | | | | 0 | | | | 4,823,016 | |
Investments measured at net asset value* | | | | | | | | | | | | | | | 6,621,300 | |
Total assets | | $ | 253,808,313 | | | $ | 0 | | | $ | 0 | | | $ | 260,429,613 | |
| * | Investments that are measured at fair value using the net asset value per share (or its equivalent) as a practical expedient have not been categorized in the fair value hierarchy. The fair value amount presented in the table is intended to permit reconciliation of the fair value hierarchy to the amounts presented in the Statement of Assets and Liabilities. The Fund’s investment in Securities Lending Cash Investments, LLC valued at $6,621,300 does not have a redemption period notice, can be redeemed daily and does not have any unfunded commitments. |
The Fund recognizes transfers between levels within the fair value hierarchy at the end of the reporting period. At July 31, 2016, the Fund did not have any transfers into/out of Level 1, Level 2, or Level 3.
| | | | |
| 26 | | Wells Fargo Large Company Value Fund | | Notes to financial statements |
4. TRANSACTIONS WITH AFFILIATES AND OTHER EXPENSES
Management fee
Funds Management, an indirect wholly owned subsidiary of Wells Fargo, is the manager of the Fund and provides advisory and fund-level administrative services under an investment management agreement. Under the investment management agreement, Funds Management is responsible for, among other services, implementing the investment objectives and strategies of the Fund, supervising the subadviser, providing fund-level administrative services in connection with the Fund’s operations, and providing any other fund-level administrative services reasonably necessary for the operation of the Fund. As compensation for its services under the investment management agreement, Funds Management is entitled to receive an annual management fee starting at 0.70% and declining to 0.505% as the average daily net assets of the Fund increase. For the year ended July 31, 2016, the management fee was equivalent to an annual rate of 0.70% of the Fund’s average daily net assets.
Funds Management has retained the services of a subadviser to provide daily portfolio management to the Fund. The fee for subadvisory services is borne by Funds Management. Phocas Financial Corporation is the subadviser to the Fund and is entitled to receive a fee from Funds Management at an annual rate starting at 0.29% and declining to 0.20% as the average daily net assets of the Fund increase.
Administration fees
Under a class-level administration agreement, Funds Management provides class-level administrative services to the Fund, which includes paying fees and expenses for services provided by the transfer agent, sub-transfer agents, omnibus account servicers and record-keepers. As compensation for its services under the class-level administration agreement, Funds Management receives an annual fee which is calculated based on the average daily net assets of each class as follows:
| | | | |
| | | Class-level
administration fee | |
Class A, Class C | | | 0.21 | % |
Administrator Class, Institutional Class | | | 0.13 | |
Investor Class | | | 0.32 | |
Funds Management has contractually waived and/or reimbursed management and administration fees to the extent necessary to maintain certain net operating expense ratios for the Fund. Waiver of fees and/or reimbursement of expenses by Funds Management were made first from fund level expenses on a proportionate basis and then from class specific expenses. Funds Management has committed through November 30, 2016 to waive fees and/or reimburse expenses to the extent necessary to cap the Fund’s expenses at 1.10% for Class A shares, 1.85% for Class C shares, 0.98% for Administrator Class shares, and 0.75% for Institutional Class shares. After this time, the cap may be increased or the commitment to maintain the cap may be terminated only with the approval of the Board of Trustees. Prior to October 23, 2015, the Fund’s expenses were capped at 0.85% for Administrator Class shares and 0.65% for Institutional Class shares.
Distribution fee
The Trust has adopted a distribution plan for Class C shares of the Fund pursuant to Rule 12b-1 under the 1940 Act. A distribution fee is charged to Class C shares and paid to Wells Fargo Funds Distributor, LLC (“Funds Distributor”), the principal underwriter, at an annual rate of 0.75% of the average daily net assets of Class C shares.
In addition, Funds Distributor is entitled to receive the front-end sales charge from the purchase of Class A shares and a contingent deferred sales charge on the redemption of certain Class A shares. Funds Distributor is also entitled to receive the contingent deferred sales charges from redemptions of Class C shares. For the year ended July 31, 2016, Funds Distributor received $1,491 from the sale of Class A shares and $24 in contingent deferred sales charges from redemptions of Class A shares.
Shareholder servicing fees
The Trust has entered into contracts with one or more shareholder servicing agents, whereby Class A, Class C, Administrator Class, and Investor Class of the Fund are charged a fee at an annual rate of 0.25% of the average daily net assets of each respective class.
A portion of these total shareholder servicing fees were paid to affiliates of Wells Fargo.
| | | | | | |
| Notes to financial statements | | Wells Fargo Large Company Value Fund | | | 27 | |
5. INVESTMENT PORTFOLIO TRANSACTIONS
Purchases and sales of investments, excluding U.S. government obligations (if any) and short-term securities, for the year ended July 31, 2016 were $126,376,586 and $142,755,540, respectively.
The Fund may purchase or sell investment securities to other Wells Fargo funds under procedures adopted by the Board of Trustees. The procedures have been designed to ensure that these interfund transactions, which generally do not incur broker commissions, are effected at current market prices. Interfund trades are included within the respective purchases and sales amounts shown.
6. BANK BORROWINGS
The Trust (excluding the money market funds and certain other funds) and Wells Fargo Variable Trust are parties to a $200,000,000 revolving credit agreement whereby the Fund is permitted to use bank borrowings for temporary or emergency purposes, such as to fund shareholder redemption requests. Interest under the credit agreement is charged to the Fund based on a borrowing rate equal to the higher of the Federal Funds rate in effect on that day plus 1.25% or the overnight LIBOR rate in effect on that day plus 1.25%. In addition, an annual commitment fee equal to 0.20% of the unused balance is allocated to each participating fund. Prior to September 1, 2015, the revolving credit agreement amount was $150,000,000 and the annual commitment fee was equal to 0.10% of the unused balance which was allocated to each participating fund.
For the year ended July 31, 2016, there were no borrowings by the Fund under the agreement.
7. DISTRIBUTIONS TO SHAREHOLDERS
The tax character of distributions paid during the years ended July 31, 2016 and July 31, 2015 were as follows:
| | | | | | | | |
| | | Year ended July 31 | |
| | | 2016 | | | 2015 | |
Ordinary income | | $ | 2,975,062 | | | $ | 2,298,368 | |
Long-term capital gain | | | 19,440,940 | | | | 25,780,482 | |
As of July 31, 2016, the components of distributable earnings on a tax basis were as follows:
| | | | |
Unrealized gains | | Late-year ordinary losses deferred | | Post-October capital losses deferred |
| $44,027,670 | | $(361) | | $(3,438,205) |
8. CONCENTRATION RISK
Concentration risks result from exposure to a limited number of sectors. A fund that invests a substantial portion of its assets in any sector may be more affected by changes in that sector than would be a fund whose investments are not heavily weighted in any sector.
9. INDEMNIFICATION
Under the Trust’s organizational documents, the officers and Trustees have been granted certain indemnification rights against certain liabilities that may arise out of performance of their duties to the Trust. Additionally, in the normal course of business, the Trust may enter into contracts with service providers that contain a variety of indemnification clauses. The Trust’s maximum exposure under these arrangements is dependent on future claims that may be made against the Fund and, therefore, cannot be estimated.
| | | | |
| 28 | | Wells Fargo Large Company Value Fund | | Report of independent registered public accounting firm |
BOARD OF TRUSTEES AND SHAREHOLDERS OF WELLS FARGO FUNDS TRUST:
We have audited the accompanying statements of assets and liabilities, including the portfolio of investments, of the Wells Fargo Large Company Value Fund (formerly known as Wells Fargo Advantage Large Company Value Fund) (the “Fund”), one of the funds constituting the Wells Fargo Funds Trust, as of July 31, 2016, and the related statement of operations for the year then ended, the statements of changes in net assets for each of the years in the two-year period then ended, and the financial highlights for each of the years in the five-year period then ended. These financial statements and financial highlights are the responsibility of the Fund’s management. Our responsibility is to express an opinion on these financial statements and financial highlights based on our audits.
We conducted our audits in accordance with the standards of the Public Company Accounting Oversight Board (United States). Those standards require that we plan and perform the audit to obtain reasonable assurance about whether the financial statements and financial highlights are free of material misstatement. An audit includes examining, on a test basis, evidence supporting the amounts and disclosures in the financial statements. Our procedures included confirmation of securities owned as of July 31, 2016, by correspondence with the custodian and brokers, or by other appropriate auditing procedures. An audit also includes assessing the accounting principles used and significant estimates made by management, as well as evaluating the overall financial statement presentation. We believe that our audits provide a reasonable basis for our opinion.
In our opinion, the financial statements and financial highlights referred to above present fairly, in all material respects, the financial position of the Wells Fargo Large Company Value Fund as of July 31, 2016, the results of its operations for the year then ended, the changes in its net assets for each of the years in the two-year period then ended, and the financial highlights for each of the years in the five-year period then ended, in conformity with U.S. generally accepted accounting principles.

Boston, Massachusetts
September 23, 2016
| | | | | | |
| Other information (unaudited) | | Wells Fargo Large Company Value Fund | | | 29 | |
TAX INFORMATION
For corporate shareholders, pursuant to Section 854 of the Internal Revenue Code, 100% of ordinary income dividends qualify for the corporate dividends-received deduction for the fiscal year ended July 31, 2016.
Pursuant to Section 852 of the Internal Revenue Code, $19,440,940 was designated as a 20% rate gain distribution for the fiscal year ended July 31, 2016.
Pursuant to Section 854 of the Internal Revenue Code, $2,975,062 of income dividends paid during the fiscal year ended July 31, 2016 has been designated as qualified dividend income (QDI).
PROXY VOTING INFORMATION
A description of the policies and procedures that the Fund uses to determine how to vote proxies relating to portfolio securities is available, upon request, by calling 1-800-222-8222, visiting our website at wellsfargofunds.com, or visiting the SEC website at sec.gov. Information regarding how the Fund voted proxies relating to portfolio securities during the most recent 12-month period ended June 30 is available on the Fund’s website at wellsfargofunds.com or by visiting the SEC website at sec.gov.
PORTFOLIO HOLDINGS INFORMATION
The complete portfolio holdings for the Fund are publicly available monthly on the Fund’s website (wellsfargofunds.com), on a one-month delayed basis. In addition, top ten holdings information (excluding derivative positions) for the Fund is publicly available on the Fund’s website on a monthly, seven-day or more delayed basis. The Fund files its complete schedule of portfolio holdings with the SEC for the first and third quarters of each fiscal year on Form N-Q, which is available by visiting the SEC website at sec.gov. In addition, the Fund’s Form N-Q may be reviewed and copied at the SEC’s Public Reference Room in Washington, DC, and at regional offices in New York City, at 233 Broadway, and in Chicago, at 175 West Jackson Boulevard, Suite 900. Information about the Public Reference Room may be obtained by calling 1-800-SEC-0330.
| | | | |
| 30 | | Wells Fargo Large Company Value Fund | | Other information (unaudited) |
BOARD OF TRUSTEES AND OFFICERS
Each of the Trustees and Officers1 listed in the table below acts in identical capacities for each fund in the Wells Fargo family of funds, which consists of 139 mutual funds comprising the Wells Fargo Funds Trust, Wells Fargo Variable Trust, Wells Fargo Master Trust and four closed-end funds (collectively the “Fund Complex”). This table should be read in conjunction with the Prospectus and the Statement of Additional Information2. The mailing address of each Trustee and Officer is 525 Market Street, 12th Floor, San Francisco, CA 94105. Each Trustee and Officer serves an indefinite term, however, each Trustee serves such term until reaching the mandatory retirement age established by the Trustees.
Independent Trustees
| | | | | | |
Name and year of birth | | Position held and length of service* | | Principal occupations during past five years or longer | | Current other public
company or
investment company directorships |
William R. Ebsworth (Born 1957) | | Trustee, since 2015 | | Retired. From 1984 to 2013, equities analyst, portfolio manager, research director and chief financial officer at Fidelity Management and Research Company in Boston, Tokyo, and Hong Kong and retired in 2013 as Chief Investment Officer of Fidelity Strategic Advisers, Inc. where he lead a team of investment professionals managing client assets. Prior thereto, Board member of Hong Kong Securities Clearing Co., Hong Kong Options Clearing Corp., the Thailand International Fund, Ltd., Fidelity Investments Life Insurance Company, and Empire Fidelity Investments Life Insurance Company. Mr. Ebsworth is a CFA® charterholder and an Adjunct Lecturer, Finance, at Babson College. | | Asset Allocation Trust |
Jane A. Freeman (Born 1953) | | Trustee, since 2015 | | Retired. From 2012 to 2014 and 1999 to 2008, Chief Financial Officer of Scientific Learning Corporation. From 2008 to 2012, Ms. Freeman provided consulting services related to strategic business projects. Prior to 1999, Portfolio Manager at Rockefeller & Co. and Scudder, Stevens & Clark. Board member of the Harding Loevner Funds from 1996 to 2014, serving as both Lead Independent Director and chair of the Audit Committee. Board member of the Russell Exchange Traded Funds Trust from 2011 to 2012 and the chair of the Audit Committee. Ms. Freeman is Chair of Taproot Foundation (non-profit organization), a Board Member of Ruth Bancroft Garden (non-profit organization) and an inactive chartered financial analyst. | | Asset Allocation Trust |
Peter G. Gordon (Born 1942) | | Trustee, since 1998; Chairman, since 2005 | | Co-Founder, Retired Chairman, President and CEO of Crystal Geyser Water Company. Trustee Emeritus, Colby College. | | Asset Allocation Trust |
Isaiah Harris, Jr. (Born 1952) | | Trustee, since 2009 | | Retired. Chairman of the Board of CIGNA Corporation since 2009, and Director since 2005. From 2003 to 2011, Director of Deluxe Corporation. Prior thereto, President and CEO of BellSouth Advertising and Publishing Corp. from 2005 to 2007, President and CEO of BellSouth Enterprises from 2004 to 2005 and President of BellSouth Consumer Services from 2000 to 2003. Emeritus member of the Iowa State University Foundation Board of Governors. Emeritus Member of the Advisory Board of Iowa State University School of Business. Advisory Board Member, Palm Harbor Academy (charter school). Advisory Board Member, Child Evangelism Fellowship (non-profit). Mr. Harris is a certified public accountant (inactive status). | | CIGNA Corporation; Asset Allocation Trust |
Judith M. Johnson (Born 1949) | | Trustee, since 2008; Audit Committee Chairman, since 2008 | | Retired. Prior thereto, Chief Executive Officer and Chief Investment Officer of Minneapolis Employees Retirement Fund from 1996 to 2008. Ms. Johnson is an attorney, certified public accountant and a certified managerial accountant. | | Asset Allocation Trust |
David F. Larcker (Born 1950) | | Trustee, since 2009 | | James Irvin Miller Professor of Accounting at the Graduate School of Business, Stanford University, Director of the Corporate Governance Research Initiative and Senior Faculty of The Rock Center for Corporate Governance since 2006. From 2005 to 2008, Professor of Accounting at the Graduate School of Business, Stanford University. Prior thereto, Ernst & Young Professor of Accounting at The Wharton School, University of Pennsylvania from 1985 to 2005. | | Asset Allocation Trust |
| | | | | | |
| Other information (unaudited) | | Wells Fargo Large Company Value Fund | | | 31 | |
| | | | | | |
Name and year of birth | | Position held and length of service* | | Principal occupations during past five years or longer | | Current other public
company or
investment company directorships |
Olivia S. Mitchell (Born 1953) | | Trustee, since 2006 | | International Foundation of Employee Benefit Plans Professor, Wharton School of the University of Pennsylvania since 1993. Director of Wharton’s Pension Research Council and Boettner Center on Pensions & Retirement Research, and Research Associate at the National Bureau of Economic Research. Previously, Cornell University Professor from 1978 to 1993. | | Asset Allocation Trust |
Timothy J. Penny (Born 1951) | | Trustee, since 1996 | | President and Chief Executive Officer of Southern Minnesota Initiative Foundation, a non-profit organization, since 2007 and Senior Fellow at the Humphrey Institute Policy Forum at the University of Minnesota since 1995. Member of the Board of Trustees of NorthStar Education Finance, Inc., a non-profit organization, since 2007. | | Asset Allocation Trust |
Michael S. Scofield (Born 1943) | | Trustee, since 2010 | | Served on the Investment Company Institute’s Board of Governors and Executive Committee from 2008-2011 as well the Governing Council of the Independent Directors Council from 2006-2011 and the Independent Directors Council Executive Committee from 2008-2011. Chairman of the IDC from 2008-2010. Institutional Investor (Fund Directions) Trustee of Year in 2007. Trustee of the Evergreen Funds complex (and its predecessors) from 1984 to 2010. Chairman of the Evergreen Funds from 2000-2010. Former Trustee of the Mentor Funds. Retired Attorney, Law Offices of Michael S. Scofield. | | Asset Allocation Trust |
| * | Length of service dates reflect the Trustee’s commencement of service with the Trust’s predecessor entities, where applicable. |
Officers
| | | | | | |
Name and year of birth | | Position held and length of service | | Principal occupations during past five years or longer | | |
Karla M. Rabusch (Born 1959) | | President, since 2003 | | Executive Vice President of Wells Fargo Bank, N.A. and President of Wells Fargo Funds Management, LLC since 2003. | | |
Jeremy DePalma1 (Born 1974) | | Treasurer, since 2012 | | Senior Vice President of Wells Fargo Funds Management, LLC since 2009. Senior Vice President of Evergreen Investment Management Company, LLC from 2008 to 2010 and head of the Fund Reporting and Control Team within Fund Administration from 2005 to 2010. | | |
C. David Messman (Born 1960) | | Secretary, since 2000; Chief Legal Officer, since 2003 | | Senior Vice President and Secretary of Wells Fargo Funds Management, LLC since 2001. Assistant General Counsel of Wells Fargo Bank, N.A. since 2013 and Vice President and Managing Counsel of Wells Fargo Bank, N.A. from 1996 to 2013. | | |
Michael Whitaker (Born 1967) | | Chief Compliance Officer, since 2016* | | Executive Vice President of Wells Fargo Funds Management, LLC since 2016. Chief Compliance Officer of Fidelity’s Fixed Income Funds and Asset Allocation Funds from 2008 to 2016, Compliance Officer of FMR Co., Inc. from 2014 to 2016, Fidelity Investments Money Management, Inc. from 2014 to 2016, Fidelity Investments from 2007 to 2016. | | |
David Berardi (Born 1975) | | Assistant Treasurer, since 2009 | | Vice President of Wells Fargo Funds Management, LLC since 2009. Vice President of Evergreen Investment Management Company, LLC from 2008 to 2010. Manager of Fund Reporting and Control for Evergreen Investment Management Company, LLC from 2004 to 2010. | | |
| 1 | Jeremy DePalma acts as Treasurer of 68 funds and Assistant Treasurer of 71 funds in the Fund Complex. |
| 2 | The Statement of Additional Information includes additional information about the Trustees and is available, without charge, upon request, by calling
1-800-222-8222 or by visiting the website at wellsfargofunds.com. |
| * | Michael Whitaker became Chief Compliance Officer effective May 16, 2016. |
| | | | |
| 32 | | Wells Fargo Large Company Value Fund | | Other information (unaudited) |
BOARD CONSIDERATION OF INVESTMENT MANAGEMENT AND SUB-ADVISORY AGREEMENTS:
Under the Investment Company Act of 1940 (the “1940 Act”), the Board of Trustees (the “Board”) of Wells Fargo Funds Trust (the “Trust”) must determine annually whether to approve the continuation of the Trust’s investment management and sub-advisory agreements. In this regard, at an in-person meeting held on May 24-25, 2016 (the “Meeting”), the Board, all the members of which have no direct or indirect interest in the investment management and sub-advisory agreements and are not “interested persons” of the Trust, as defined in the 1940 Act (the “Independent Trustees”), reviewed and approved for Wells Fargo Large Company Value Fund (the “Fund”): (i) an investment management agreement (the “Management Agreement”) with Wells Fargo Funds Management, LLC (“Funds Management”); and (ii) an investment sub-advisory agreement (the “Sub-Advisory Agreement”) with Phocas Financial Corporation, L.P. (the “Sub-Adviser”). The Management Agreement and the Sub-Advisory Agreement are collectively referred to as the “Advisory Agreements.”
At the Meeting, the Board considered the factors and reached the conclusions described below relating to the selection of Funds Management and the Sub-Adviser and the approval of the Advisory Agreements. Prior to the Meeting, including at an in-person meeting in April 2016, the Trustees conferred extensively among themselves and with representatives of Funds Management about these matters. Also, the Board has adopted a team-based approach, with each team consisting of a sub-set of Trustees, to assist the full Board in the discharge of its duties in reviewing performance and other matters throughout the year. The Independent Trustees were assisted in their evaluation of the Advisory Agreements by independent legal counsel, from whom they received separate legal advice and with whom they met separately.
In providing information to the Board, Funds Management and the Sub-Adviser were guided by a detailed set of requests for information submitted to them by independent legal counsel on behalf of the Independent Trustees at the start of the Board’s annual contract renewal process earlier in 2016. In considering and approving the Advisory Agreements, the Trustees considered the information they believed relevant, including but not limited to the information discussed below. The Board considered not only the specific information presented in connection with the Meeting, but also the knowledge gained over time through interaction with Funds Management and the Sub-Adviser about various topics. In this regard, the Board reviewed reports of Funds Management at each of its quarterly meetings, which included, among other things, portfolio reviews and performance reports. In addition, the Board and the teams mentioned above confer with portfolio managers at various times throughout the year. The Board did not identify any particular information or consideration that was all-important or controlling, and each individual Trustee may have attributed different weights to various factors.
After its deliberations, the Board unanimously approved the continuation of the Advisory Agreements for a one-year term and determined that the compensation payable to Funds Management and the Sub-Adviser under each of the Advisory Agreements was reasonable. The Board considered the approval of the Advisory Agreements for the Fund as part of its consideration of agreements for funds across the complex, but its approvals were made on a fund-by-fund basis. The following summarizes a number of important, but not necessarily all, factors considered by the Board in support of its approvals.
Nature, extent and quality of services
The Board received and considered various information regarding the nature, extent and quality of services provided to the Fund by Funds Management and the Sub-Adviser under the Advisory Agreements. This information included a description of the investment advisory services and Fund-level administrative services covered by the Management Agreement, as well as, among other things, a summary of the background and experience of senior management of Funds Management, and the qualifications, background, tenure and responsibilities of each of the portfolio managers primarily responsible for the day-to-day portfolio management of the Fund.
The Board evaluated the ability of Funds Management and the Sub-Adviser to attract and retain qualified investment professionals, including research, advisory and supervisory personnel. The Board further considered the compliance programs and compliance records of Funds Management and the Sub-Adviser. In addition, the Board took into account the full range of services provided to the Fund by Funds Management and its affiliates.
Fund performance and expenses
The Board considered the performance results for the Fund over various time periods ended December 31, 2015. The Board considered these results in comparison to the performance of funds in a universe that was determined by Broadridge Inc. (“Broadridge”) to be similar to the Fund (the “Universe”), and in comparison to the Fund’s benchmark index and to other comparative data. Broadridge is an independent provider of investment company data. The Board received a description of the methodology used by Broadridge to select the mutual funds in the performance Universe.
| | | | | | |
| Other information (unaudited) | | Wells Fargo Large Company Value Fund | | | 33 | |
The Board noted that the performance of the Fund (Administrator Class) was higher than, equal to, or in range of of the average performance of the Universe for all periods under review. The Board also noted that the performance of the Fund was lower than its benchmark, the Russell 1000® Value Index, for all periods under review except the one-year period.
The Board received information concerning, and discussed factors contributing to, the underperformance of the Fund relative to the benchmark for the periods noted above. The Board took note of the explanations for the relative underperformance in these periods, including with respect to market factors and investment decisions that affected the Fund’s performance and of recent outperformance.
The Board also received and considered information regarding the Fund’s net operating expense ratios and their various components, including actual management fees, custodian and other non-management fees, and Rule 12b-1 and non-Rule 12b-1 shareholder service fees. The Board considered these ratios in comparison to the median ratios of funds in class-specific expense groups that were determined by Broadridge to be similar to the Fund (the “Groups”). The Board received a description of the methodology used by Broadridge to select the mutual funds in the expense Groups and an explanation of how funds comprising expense groups and their expense ratios may vary from year-to-year. Based on the Broadridge reports, the Board noted that the net operating expense ratios of the Fund were lower than the median net operating expense ratios of the expense Groups.
The Board took into account the Fund performance and expense information provided to it among the factors considered in deciding to re-approve the Advisory Agreements.
Investment management and sub-advisory fee rates
The Board reviewed and considered the contractual fee rates payable by the Fund to Funds Management under the Management Agreement, as well as the contractual fee rates payable by the Fund to Funds Management for class-level administrative services under a Class-Level Administration Agreement, which include class-level transfer agency and sub-transfer agency costs (collectively, the “Management Rates”). The Board also reviewed and considered the contractual investment sub-advisory fee rates that are payable by Funds Management to the Sub-Adviser for investment sub-advisory services.
Among other information reviewed by the Board was a comparison of the Fund’s Management Rates with the average contractual investment management fee rates of funds in the expense Groups at a common asset level as well as transfer agency costs of the funds in the expense Groups. The Board noted that the Management Rates of the Fund were in range of the sum of these average rates for the Fund’s expense Groups for all share classes.
The Board also received and considered information about the portion of the total management fee that was retained by Funds Management after payment of the fee to the Sub-Adviser for sub-advisory services. The Board considered this amount in comparison to the median amount retained by advisers to funds in a sub-advised expense universe that was determined by Broadridge to be similar to the Fund. In assessing the reasonableness of this amount, the Board received and evaluated information about the nature and extent of responsibilities retained and risks assumed by Funds Management and not delegated to or assumed by the Sub-Adviser, and about Funds Management’s on-going oversight services. The Board also considered that the sub-advisory fees paid to the Sub-Adviser had been negotiated by Funds Management on an arm’s length basis.
The Board also received and considered information about the nature and extent of services offered and fee rates charged by Funds Management and the Sub-Adviser to other types of clients with investment strategies similar to those of the Fund. In this regard, the Board received information about the significantly greater scope of services, and compliance, reporting and other legal burdens and risks of managing mutual funds compared with those associated with managing assets of non-mutual fund clients such as collective funds or institutional separate accounts.
Based on its consideration of the factors and information it deemed relevant, including those described here, the Board determined that the compensation payable to Funds Management under the Management Agreement and to the Sub-Adviser under the Sub-Advisory Agreement was reasonable, in light of the services covered by the Advisory Agreements.
Profitability
The Board received and considered information concerning the profitability of Funds Management, as well as the profitability of Wells Fargo as a whole, from providing services to the Fund and the fund family as a whole. Funds Management reported on the methodologies and estimates used in calculating profitability. Among other things, the Board noted that the levels of profitability reported on a fund-by-fund basis varied widely, depending on factors such as the size and type of fund. The Board did not consider profitability with respect to the Sub-Adviser, as the sub-advisory fees paid to the Sub-Adviser had been negotiated by Funds Management on an arm’s-length basis.
| | | | |
| 34 | | Wells Fargo Large Company Value Fund | | Other information (unaudited) |
Based on its review, the Board did not deem the profits reported by Funds Management to be at a level that would prevent it from approving the continuation of the Advisory Agreements.
Economies of scale
With respect to possible economies of scale, the Board noted the existence of breakpoints in the Fund’s management fee structure, which operate generally to reduce the Fund’s expense ratios as the Fund grows in size. It considered that, for a small fund or a fund that shrinks in size, breakpoints conversely can result in higher fee levels. The Board also considered that fee waiver and expense reimbursement arrangements and competitive fee rates at the outset are means of sharing potential economies of scale with shareholders of the Fund and the fund family as a whole. The Board considered Funds Management’s view that any analyses of potential economies of scale in managing a particular fund are inherently limited in light of the joint and common costs and investments that Funds Management incurs across the fund family as a whole.
The Board concluded that the Fund’s fee and expense arrangements, including contractual breakpoints, constituted a reasonable approach to sharing potential economies of scale with the Fund and its shareholders.
Other benefits to Funds Management and the Sub-Adviser
The Board received and considered information regarding potential “fall-out” or ancillary benefits received by Funds Management, the Sub-Adviser, and their affiliates as a result of their relationships with the Fund. Ancillary benefits could include, among others, benefits directly attributable to other relationships with the Fund and benefits potentially derived from an increase in Funds Management’s and the Sub-Adviser’s business as a result of their relationships with the Fund. The Board noted that various affiliates of Funds Management may receive distribution-related fees, shareholder servicing payments and sub-transfer agency fees in respect of shares sold or held through them and services provided.
The Board also reviewed information about soft dollar credits earned and utilized by the Sub-Adviser, fees earned by Funds Management and its affiliate from managing a private investment vehicle for the fund family’s securities lending collateral and commissions earned by an affiliated broker from portfolio transactions.
Based on its consideration of the factors and information it deemed relevant, including those described here, the Board did not find that any ancillary benefits received by Funds Management, the Sub-Adviser, and their affiliates were unreasonable.
Conclusion
At the Meeting, after considering the above-described factors and based on its deliberations and its evaluation of the information described above, the Board unanimously approved the continuation of the Advisory Agreements for a one-year term and determined that the compensation payable to Funds Management and the Sub-Adviser under each of the Advisory Agreements was reasonable.
| | | | | | |
| List of abbreviations | | Wells Fargo Large Company Value Fund | | | 35 | |
The following is a list of common abbreviations for terms and entities that may have appeared in this report.
| ACA | — ACA Financial Guaranty Corporation |
| ADR | — American depositary receipt |
| ADS | — American depositary shares |
| AGC | — Assured Guaranty Corporation |
| AGM | — Assured Guaranty Municipal |
| Ambac | — Ambac Financial Group Incorporated |
| AMT | — Alternative minimum tax |
| BAN | — Bond anticipation notes |
| BHAC | — Berkshire Hathaway Assurance Corporation |
| CAB | — Capital appreciation bond |
| CCAB | — Convertible capital appreciation bond |
| CDA | — Community Development Authority |
| CDO | — Collateralized debt obligation |
| DRIVER | — Derivative inverse tax-exempt receipts |
| DW&P | — Department of Water & Power |
| DWR | — Department of Water Resources |
| ECFA | — Educational & Cultural Facilities Authority |
| EDA | — Economic Development Authority |
| EDFA | — Economic Development Finance Authority |
| ETF | — Exchange-traded fund |
| FDIC | — Federal Deposit Insurance Corporation |
| FFCB | — Federal Farm Credit Banks |
| FGIC | — Financial Guaranty Insurance Corporation |
| FHA | — Federal Housing Administration |
| FHLB | — Federal Home Loan Bank |
| FHLMC | — Federal Home Loan Mortgage Corporation |
| FICO | — The Financing Corporation |
| FNMA | — Federal National Mortgage Association |
| GDR | — Global depositary receipt |
| GNMA | — Government National Mortgage Association |
| HCFR | — Healthcare facilities revenue |
| HEFA | — Health & Educational Facilities Authority |
| HEFAR | — Higher education facilities authority revenue |
| HFA | — Housing Finance Authority |
| HFFA | — Health Facilities Financing Authority |
| HUD | — Department of Housing and Urban Development |
| IDA | — Industrial Development Authority |
| IDAG | — Industrial Development Agency |
| KRW | — Republic of Korea won |
| LIBOR | — London Interbank Offered Rate |
| LIFER | — Long Inverse Floating Exempt Receipts |
| LLC | — Limited liability company |
| LLLP | — Limited liability limited partnership |
| LLP | — Limited liability partnership |
| MBIA | — Municipal Bond Insurance Association |
| MFHR | — Multifamily housing revenue |
| MSTR | — Municipal securities trust receipts |
| MUD | — Municipal Utility District |
| National | — National Public Finance Guarantee Corporation |
| PCFA | — Pollution Control Financing Authority |
| PCL | — Public Company Limited |
| PCR | — Pollution control revenue |
| PFA | — Public Finance Authority |
| PFFA | — Public Facilities Financing Authority |
| PFOTER | — Puttable floating option tax-exempt receipts |
| plc | — Public limited company |
| PUTTER | — Puttable tax-exempt receipts |
| R&D | — Research & development |
| Radian | — Radian Asset Assurance |
| RAN | — Revenue anticipation notes |
| RDA | — Redevelopment Authority |
| RDFA | — Redevelopment Finance Authority |
| REIT | — Real estate investment trust |
| ROC | — Reset option certificates |
| SAVRS | — Select auction variable rate securities |
| SBA | — Small Business Authority |
| SDR | — Swedish depositary receipt |
| SFHR | — Single-family housing revenue |
| SFMR | — Single-family mortgage revenue |
| SPA | — Standby purchase agreement |
| SPDR | — Standard & Poor’s Depositary Receipts |
| SPEAR | — Short Puttable Exempt Adjustable Receipts |
| STRIPS | — Separate trading of registered interest and |
| TAN | — Tax anticipation notes |
| TIPS | — Treasury inflation-protected securities |
| TRAN | — Tax revenue anticipation notes |
| TTFA | — Transportation Trust Fund Authority |
| TVA | — Tennessee Valley Authority |
This page is intentionally left blank.

For more information
More information about Wells Fargo Funds is available free upon request. To obtain literature, please write, email, visit the Fund’s website, or call:
Wells Fargo Funds
P.O. Box 8266
Boston, MA 02266-8266
Email: fundservice@wellsfargo.com
Website: wellsfargofunds.com
Individual investors: 1-800-222-8222
Retail investment professionals: 1-888-877-9275
Institutional investment professionals: 1-866-765-0778
This report and the financial statements contained herein are submitted for the general information of the shareholders of the Fund. If this report is used for promotional purposes, distribution of the report must be accompanied or preceded by a current prospectus. Before investing, please consider the investment objectives, risks, charges, and expenses of the investment. For a current prospectus and, if available, a summary prospectus, containing this information, call 1-800-222-8222 or visit the Fund’s website at wellsfargofunds.com. Read the prospectus carefully before you invest or send money.
Wells Fargo Asset Management (WFAM) is a trade name used by the asset management businesses of Wells Fargo & Company. Wells Fargo Funds Management, LLC, a wholly owned subsidiary of Wells Fargo & Company, provides investment advisory and administrative services for Wells Fargo Funds. Other affiliates of Wells Fargo & Company provide subadvisory and other services for the funds. The funds are distributed by Wells Fargo Funds Distributor, LLC, Member FINRA, an affiliate of Wells Fargo & Company.
NOT FDIC INSURED ¡ NO BANK GUARANTEE ¡ MAY LOSE VALUE
© 2016 Wells Fargo Funds Management, LLC. All rights reserved.
| | |
 | | 245327 09-16 A210/AR210 07-16 |
Annual Report
July 31, 2016

Wells Fargo Omega Growth Fund


Reduce clutter. Save trees.
Sign up for electronic delivery of prospectuses and shareholder reports at wellsfargo.com/advantagedelivery
Contents
The views expressed and any forward-looking statements are as of July 31, 2016, unless otherwise noted, and are those of the Fund managers and/or Wells Fargo Funds Management, LLC. Discussions of individual securities, or the markets generally, or any Wells Fargo Fund are not intended as individual recommendations. Future events or results may vary significantly from those expressed in any forward-looking statements. The views expressed are subject to change at any time in response to changing circumstances in the market. Wells Fargo Funds Management, LLC and the Fund disclaim any obligation to publicly update or revise any views expressed or forward-looking statements.
NOT FDIC INSURED ¡ NO BANK GUARANTEE ¡ MAY LOSE VALUE
| | | | |
| 2 | | Wells Fargo Omega Growth Fund | | Letter to shareholders (unaudited) |

Karla M. Rabusch
President
Wells Fargo Funds
Despite significant market fluctuations over the course of the year, U.S. stocks delivered positive results overall for the 12-month reporting period
Dear Valued Shareholder:
We are pleased to offer you this annual report for the Wells Fargo Omega Growth Fund for the 12-month period that ended July 31, 2016. During this period, which began August 1, 2015, U.S. and international stock markets experienced heightened volatility, with intermittent rebounds interspersed with sell-offs. The U.S. economy displayed resilience throughout the period, although growth was somewhat sluggish amid ongoing pressures that included slowing growth in China, a strengthening U.S. dollar, and uncertainty regarding interest-rate increases by the U.S. Federal Reserve (Fed); international economies faced deeper ongoing challenges. During June 2016, global markets became especially volatile as the U.K.’s vote over whether to leave the European Union (E.U.) approached. However, markets began recovering shortly after the U.K. voted to leave and rallied through July. Despite significant market fluctuations over the course of the year, U.S. stocks delivered positive results overall for the 12-month reporting period, as measured by the Russell 1000® Index.1 International markets generally declined as measured by the Morgan Stanley Capital International (MSCI) Europe, Australasia, Far East (EAFE) Index.2
In the third quarter of 2015, China’s slowdown took a toll on economies and markets worldwide.
U.S. stocks sagged during the quarter, experiencing the most volatility since 2011. Economic data released during the quarter suggested the U.S. economy remained solid but had lost some steam, burdened by the drag of the U.S. dollar’s strength coupled with global economic turmoil. The fact that the Fed left the federal funds interest rate unchanged at its September 2015 meeting surprised investors and fueled increased uncertainty about the U.S. economy’s stamina to remain healthy while facing the challenges of slowing growth in China and troubles elsewhere in the world. Outside the U.S., markets were even more volatile and delivered generally weaker quarterly results, also largely due to investors’ increasing anxiety over China’s weakened economy.
Despite ongoing concerns, U.S. stocks generally rose in the fourth quarter of 2015; international markets lagged.
While the broad U.S. stock market bounced back in the quarter, stock markets outside the U.S. failed to keep pace as economic concerns, including China’s ongoing slowdown, continued to affect many countries. U.S. economic data released during the quarter indicated the economy remained solid, although the strong U.S. dollar and weakness in international economies remained headwinds. In December, the Fed, as expected, raised its target interest rate by 25 basis points (bps; 100 bps equals 1.00%) after keeping it near zero for seven years. The move reflected confidence in the U.S. economy’s ability to stay healthy with less central-bank support. The Fed also clarified that future interest-rate increases would be gradual.
| 1 | The Russell 1000® Index measures the performance of the 1,000 largest companies in the Russell 3000® Index, which represents approximately 92% of the total market capitalization of the Russell 3000® Index. You cannot invest directly in an index. |
| 2 | Morgan Stanley Capital International (MSCI) Europe, Australasia, Far East (EAFE) Index is a free-float-adjusted market-capitalization-weighted index that is designed to measure the equity market performance of developed markets, excluding the United States and Canada. The MSCI EAFE Index consists of the following 21 developed markets country indexes: Australia, Austria, Belgium, Denmark, Finland, France, Germany, Hong Kong, Ireland, Israel, Italy, Japan, the Netherlands, New Zealand, Norway, Portugal, Singapore, Spain, Sweden, Switzerland, and the United Kingdom. You cannot invest directly in an index. |
| | | | | | |
| Letter to shareholders (unaudited) | | Wells Fargo Omega Growth Fund | | | 3 | |
In the first quarter of 2016, market volatility increased globally amid ongoing concerns.
Stock markets worldwide fluctuated widely in the first quarter of 2016. Most sold off sharply in the first six weeks of the year on concerns such as weak global growth, falling commodity prices, and uncertainty over the timing and impact of the Fed’s interest-rate increases. As the quarter progressed, fears abated somewhat and global markets generally rallied back. The U.S. economy ended the quarter on a positive note as much of the quarter’s data reflected resiliency. With ongoing uncertainties about global growth and financial markets, however, the Fed held off from raising the target interest rate during the quarter. Outside the U.S., the eurozone fell into deflation in February; in response, the European Central Bank announced an expansion of its stimulus program. In China, the government in March set a growth rate of 6.5% to 7.0% for 2016, an acknowledgment of weakening growth. In emerging markets, although central-bank stimulus and improved prices for oil and other commodities led to stock-market rallies in the quarter, many of these countries’ economies face credit downgrades due to challenges such as the likelihood of a stronger U.S. dollar, which would make dollar-denominated debt more expensive.
Worries over interest rates and the U.K.’s vote largely drove the markets during the second quarter of 2016.
U.S. stocks began the quarter in positive territory but started to lose steam in early May on worries that a possible June interest-rate increase by the Fed could hurt the market. In mid-May, stocks briefly plunged following comments by Fed officials noting that a June interest-rate increase remained on the table. But once investors had processed this information, stocks again rallied, finishing up for the month. The first three weeks of June brought heightened volatility, spurred largely by a disappointing jobs report and uncertainty over whether the U.K. would remain in the E.U. The U.K.’s Brexit vote on June 23 shocked countries in Europe and much of the rest of the world. Stock markets plummeted as investors worried that the U.K.’s departure from the E.U. would slow global growth and prolong the low-interest-rate environment. Following the initial rout, however, U.S. stocks rallied as investors seemed to decide that any negative effects would be more localized and not create a serious risk for global growth. By quarter-end, the broad U.S. stock market had moved back into positive territory.
Stocks generally posted positive results for July 2016.
U.S. stocks displayed the most momentum during the first two weeks of the month, buoyed partly by an unexpectedly favorable June jobs report that helped strengthen confidence in the U.S. economy. Also, investors perhaps felt that global central banks could extend stimulus measures in the wake of the Brexit vote. Although U.S. market momentum slowed during the second half of July, stocks ended in positive territory for the month. International stocks delivered positive monthly results as well.
| | | | |
| 4 | | Wells Fargo Omega Growth Fund | | Letter to shareholders (unaudited) |
Don’t let short-term uncertainty derail long-term investment goals.
Periods of uncertainty can present challenges, but experience has taught us that maintaining long-term investment goals can be an effective way to plan for the future. To help you create a sound strategy based on your personal goals and risk tolerance, Wells Fargo Funds offers more than 100 mutual funds spanning a wide range of asset classes and investment styles. Although diversification cannot guarantee an investment profit or prevent losses, we believe it can be an effective way to manage investment risk and potentially smooth out overall portfolio performance. We encourage investors to know their investments and to understand that appropriate levels of risk-taking may unlock opportunities.
Thank you for choosing to invest in Wells Fargo Funds. We appreciate your confidence in us and remain committed to helping you meet your financial needs.
Sincerely,

Karla M. Rabusch
President
Wells Fargo Funds
Although diversification cannot guarantee an investment profit or prevent losses, we believe it can be an effective way to manage investment risk and potentially smooth out overall portfolio performance.
For further information about your Fund, contact your investment professional, visit our website at wellsfargofunds.com, or call us directly at 1-800-222-8222. We are available 24 hours a day, 7 days a week.
This page is intentionally left blank.
| | | | |
| 6 | | Wells Fargo Omega Growth Fund | | Performance highlights (unaudited) |
Investment objective
The Fund seeks long-term capital appreciation.
Manager
Wells Fargo Funds Management, LLC
Subadviser
Wells Capital Management Incorporated
Portfolio managers
Michael T. Smith, CFA®
Chris Warner, CFA®
Average annual total returns (%) as of July 31, 20161
| | | | | | | | | | | | | | | | | | | | | | | | | | | | | | | | | | |
| | | | | Including sales charge | | | Excluding sales charge | | | Expense ratios2 (%) | |
| | | Inception date | | 1 year | | | 5 year | | | 10 year | | | 1 year | | | 5 year | | | 10 year | | | Gross | | | Net3 | |
| Class A (EKOAX) | | 4-29-1968 | | | (8.64 | ) | | | 8.86 | | | | 9.46 | | | | (3.07 | ) | | | 10.16 | | | | 10.11 | | | | 1.27 | | | | 1.27 | |
| Class B (EKOBX)* | | 8-2-1993 | | | (8.04 | ) | | | 9.06 | | | | 9.54 | | | | (3.77 | ) | | | 9.34 | | | | 9.54 | | | | 2.02 | | | | 2.02 | |
| Class C (EKOCX) | | 8-2-1993 | | | (4.75 | ) | | | 9.34 | | | | 9.30 | | | | (3.75 | ) | | | 9.34 | | | | 9.30 | | | | 2.02 | | | | 2.02 | |
| Class R (EKORX) | | 10-10-2003 | | | – | | | | – | | | | – | | | | (3.30 | ) | | | 9.88 | | | | 9.85 | | | | 1.52 | | | | 1.52 | |
| Administrator Class (EOMYX) | | 1-13-1997 | | | – | | | | – | | | | – | | | | (2.84 | ) | | | 10.42 | | | | 10.39 | | | | 1.19 | | | | 1.10 | |
| Institutional Class (EKONX) | | 7-30-2010 | | | – | | | | – | | | | – | | | | (2.61 | ) | | | 10.70 | | | | 10.55 | | | | 0.94 | | | | 0.85 | |
| Russell 3000® Growth Index4 | | – | | | – | | | | – | | | | – | | | | 3.57 | | | | 13.39 | | | | 9.41 | | | | – | | | | – | |
| * | | Class B shares are closed to investment, except in connections with reinvestment of any distributions and permitted exchanges. |
Figures quoted represent past performance, which is no guarantee of future results, and do not reflect taxes that a shareholder may pay on fund distributions or the redemption of fund shares. Investment return and principal value of an investment will fluctuate so that an investor’s shares, when redeemed, may be worth more or less than their original cost. Performance shown without sales charges would be lower if sales charges were reflected. Current performance may be lower or higher than the performance data quoted, which assumes the reinvestment of dividends and capital gains. Current month-end performance is available on the Fund’s website, wellsfargofunds.com.
Index returns do not include transaction costs associated with buying and selling securities, any mutual fund fees or expenses, or any taxes. It is not possible to invest directly in an index.
For Class A shares, the maximum front-end sales charge is 5.75%. For Class B shares, the maximum contingent deferred sales charge is 5.00%. For Class C shares, the maximum contingent deferred sales charge is 1.00%. Performance including a contingent deferred sales charge assumes the sales charge for the corresponding time period. Class R, Administrator Class, and Institutional Class shares are sold without a front-end sales charge or contingent deferred sales charge.
Stock values fluctuate in response to the activities of individual companies and general market and economic conditions. Certain investment strategies tend to increase the total risk of an investment (relative to the broader market). The Fund is exposed to foreign investment risk and smaller-company securities risk. Consult the Fund’s prospectus for additional information on these and other risks.
Please see footnotes on page 7.
| | | | | | |
| Performance highlights (unaudited) | | Wells Fargo Omega Growth Fund | | | 7 | |
|
| Growth of $10,000 investment as of July 31, 20165 |
|
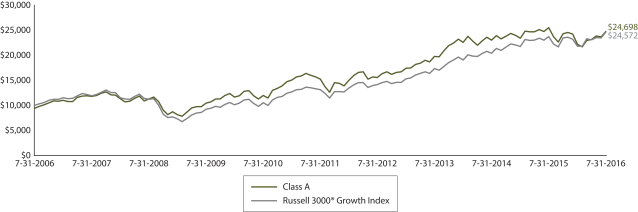 |
| 1 | Historical performance shown for Institutional Class shares prior to their inception reflects the performance of Administrator Class shares, and includes the higher expenses applicable to Administrator Class shares. If these expenses had not been included, returns would be higher. Historical performance shown for all classes of the Fund prior to July 19, 2010, is based on the performance of the Fund’s predecessor, Evergreen Omega Fund. |
| 2 | Reflects the expense ratios as stated in the most recent prospectuses. The expense ratios shown are subject to change and may differ from the annualized expense ratios shown in the financial highlights of this report. |
| 3 | The manager has contractually committed through November 30, 2016, to waive fees and/or reimburse expenses to the extent necessary to cap the Fund’s Total Annual Fund Operating Expenses After Fee Waiver at 1.30% for Class A, 2.05% for Class B, 2.05% for Class C, 1.55% for Class R, 1.10% for Administrator Class, and 0.85% for Institutional Class. After this time, the cap may be increased or the commitment to maintain the cap may be terminated only with the approval of the Board of Trustees. Brokerage commissions, stamp duty fees, interest, taxes, acquired fund fees and expenses, and extraordinary expenses are excluded from the expense cap. Without this cap, the Fund’s returns would have been lower. |
| 4 | The Russell 3000® Growth Index measures the performance of those Russell 3000 companies with higher price-to-book ratios and higher forecasted growth values. The stocks in this index are also members of either the Russell 1000® Growth Index or the Russell 2000® Growth Index. You cannot invest directly in an index. |
| 5 | The chart compares the performance of Class A shares for the most recent ten years with the Russell 3000® Growth Index. The chart assumes a hypothetical investment of $10,000 in Class A shares and reflects all operating expenses and assumes the maximum initial sales charge of 5.75%. |
| 6 | The ten largest holdings, excluding cash and cash equivalents, are calculated based on the value of the investments divided by total net assets of the Fund. Holdings are subject to change and may have changed since the date specified. |
| 7 | Amounts are calculated based on the total long-term investments of the Fund. These amounts are subject to change and may have changed since the date specified. |
| | | | |
| 8 | | Wells Fargo Omega Growth Fund | | Performance highlights (unaudited) |
MANAGER’S DISCUSSION
Fund highlights
| n | | The Fund underperformed its benchmark, the Russell 3000® Growth Index, for the 12-month period that ended July 31, 2016. |
| n | | Stock selection in the information technology (IT) and industrials sectors detracted from performance. |
| n | | Stock selection within the consumer discretionary and health care sectors benefited performance. |
Over the 12-month period, an elevated level of uncertainty was visible in the U.S. stock market as global economic data and geopolitical events led many investors to reexamine their tolerance for risk; as a result, U.S. stocks at times traded more on emotion and fear than on company-specific fundamentals. In this environment, investors generally tended to prefer yield and defensive stocks, often referred to as bond proxies. These market dynamics were more pronounced in international markets, where economic activity generally was more tepid and geopolitical events caused greater uncertainty.
| | | | |
| Ten largest holdings (%) as of July 31, 20166 | |
Amazon.com Incorporated | | | 4.39 | |
Facebook Incorporated Class A | | | 3.78 | |
Alphabet Incorporated Class A | | | 3.31 | |
Visa Incorporated Class A | | | 3.18 | |
The Home Depot Incorporated | | | 3.16 | |
Bristol-Myers Squibb Company | | | 2.78 | |
UnitedHealth Group Incorporated | | | 2.55 | |
Apple Incorporated | | | 2.48 | |
Alphabet Incorporated Class C | | | 2.46 | |
KAR Auction Services Incorporated | | | 2.07 | |
The Fund’s IT and industrials holdings weighed on performance relative to the Russell 3000® Growth Index.
Within the IT sector, stock selection within the semiconductor and semiconductor-equipment industry detracted from returns. Also, a combination of company-specific issues and concerns over corporate IT spending pressured Fund holdings in the software industry. Tableau Software, Incorporated, which develops data-visualization software, reported disappointing results driven by an unexpected decline in licensing revenue. As a result, Tableau’s shares declined sharply. After reevaluating our investment thesis, we exited the position in favor of other opportunities in which we had higher conviction.
Among the Fund’s industrials holdings, Old Dominion Freight Line, Incorporated, detracted from performance. Old Dominion, which operates as a less-than-truckload (LTL) transportation network in North America, provides regional and national LTL services, including ground and air-expedited transportation as well as consumer-household pickup and delivery. Our thesis for adding Old Dominion to the Fund’s portfolio was centered on the company’s better ability to grow market share as compared with a fragmented network of competitors. We believed Old Dominion could experience superior growth through its investments in expanding its network, both organically and via acquisition, and in improving its IT capabilities. While the company succeeded in this strategy, outpacing the overall industry’s tonnage growth in the past few years, Old Dominion’s growth rate recently decelerated as the benefits from these initiatives began to plateau. With limited visibility into whether growth would reaccelerate in the future, we sold the position from the Fund.
|
| Sector distribution as of July 31, 20167 |
|
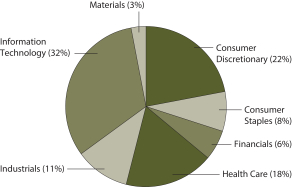 |
Stock selection in the consumer discretionary and health care sectors aided Fund performance.
Within consumer discretionary, Vail Resorts, Incorporated, contributed to Fund performance. Vail—an operator of world-class resorts and ski areas globally, with prominent properties in the Western U.S.—has been enjoying the benefits of an expanding portfolio of properties and a sophisticated marketing system/loyalty program to encourage repeat visits. The company posted impressive results driven by increased attendance at its properties coupled with increasing pricing metrics per customer visit. Vail also showed healthy progress on its acquisition of the Park City Mountain Resort in Utah. We believe that under Vail’s management, Park City could drive significant future growth.
Please see footnotes on page 7.
| | | | | | |
| Performance highlights (unaudited) | | Wells Fargo Omega Growth Fund | | | 9 | |
Within the health care sector, positioning in the innovative medical-equipment industry drove strong results. DexCom, Incorporated, a leader in continuous glucose monitoring, added to returns as the company continued to address a large, unmet medical need. DexCom helps certain diabetes patients manage their blood glucose levels and minimize hypoglycemic events, and demand for the company’s products has been heavy. DexCom also is seeking to gain FDA approval of a new product that could meaningfully increase its potential customer base. These factors combined to help send shares up sharply over the reporting period.
Recent market dynamics support our confidence in the Fund’s positioning.
The world presently faces a range of complex and substantial issues. As a result, investors often become preoccupied with worries about the global economic and geopolitical outlooks. Because we share many of these concerns, we have taken a cautious approach within the Fund. We have intentionally shifted toward higher-quality companies with stable cash flows; this positioning reflects the impact that macro factors could have on individual holdings. We acknowledge the importance of risk management in an era of uncertainty.
That being said, however, our process will remain focused on the micro. While valuations of the Fund’s holdings can fluctuate, the fundamentals of these companies, in our view, are underpinned by innovation and strong managements as well as by potentially profitable business models and durable growth. We believe these businesses may be relatively immune to economic uncertainty and therefore could be able to command a scarcity premium. These companies also tend to have visible, durable earnings growth, which indicates their stock prices ultimately could follow the same trajectory. We have been encouraged by recent market activity, which has shown signs of this condition playing out.
Scarcity is a key dimension in our view of the investing landscape. We believe the root cause of many of the world’s problems is a lack of healthy economic growth; however, the scarcity premium for secular earnings growth has yet to meaningfully unfold. We believe this time lag creates an attractive opportunity, as many of the Fund’s positions have underperformed relative to their actual earnings-growth rates; if investors are like thirsty desert travelers, the Fund’s fundamentally strong holdings could be viewed as an oasis on the horizon.
We believe the U.S. economy is on stable footing with attractive growth relative to much of the world. However, we remain mindful of the duration of economic cycles and the ongoing challenge for the U.S. economy to find a higher altitude. Therefore, we maintain a healthy allocation to high-quality core holdings and remain underweight stocks with high economic sensitivity. While consumer spending has not been overly robust, strength has continued in areas such as value retailing, ecommerce, leisure, and housing. These consumer themes, along with innovation in high-growth IT and health care, are well represented in the Fund.
Government spending appears poised to expand in areas such as infrastructure and defense. Although corporations remain cautious on capital spending, the severe headwinds of a strong U.S. dollar and low oil prices appear to be easing and could provide for better-than-expected earnings growth. Overall, we believe the U.S. stock market likely will be supported by a slowly improving economy, giving growth stocks a potential opportunity to stand out from the crowd.
Please see footnotes on page 7.
| | | | |
| 10 | | Wells Fargo Omega Growth Fund | | Fund expenses (unaudited) |
As a shareholder of the Fund, you incur two types of costs: (1) transaction costs, including sales charges (loads) on purchase payments and contingent deferred sales charges (if any) on redemptions and (2) ongoing costs, including management fees, distribution (12b-1) and/or shareholder servicing fees, and other Fund expenses. This example is intended to help you understand your ongoing costs (in dollars) of investing in the Fund and to compare these costs with the ongoing costs of investing in other mutual funds.
The example is based on an investment of $1,000 invested at the beginning of the six-month period and held for the entire period from February 1, 2016 to July 31, 2016.
Actual expenses
The “Actual” line of the table below provides information about actual account values and actual expenses. You may use the information in this line, together with the amount you invested, to estimate the expenses that you paid over the period. Simply divide your account value by $1,000 (for example, an $8,600 account value divided by $1,000 = 8.6), then multiply the result by the number in the “Actual” line under the heading entitled “Expenses paid during period” for your applicable class of shares to estimate the expenses you paid on your account during this period.
Hypothetical example for comparison purposes
The “Hypothetical” line of the table below provides information about hypothetical account values and hypothetical expenses based on the Fund’s actual expense ratio and an assumed rate of return of 5% per year before expenses, which is not the Fund’s actual return. The hypothetical account values and expenses may not be used to estimate the actual ending account balance or expenses you paid for the period. You may use this information to compare the ongoing costs of investing in the Fund and other funds. To do so, compare this 5% hypothetical example with the 5% hypothetical examples that appear in the shareholder reports of the other funds.
Please note that the expenses shown in the table are meant to highlight your ongoing costs only and do not reflect any transactional costs, such as sales charges (loads) and contingent deferred sales charges. Therefore, the “Hypothetical” line of the table is useful in comparing ongoing costs only and will not help you determine the relative total costs of owning different funds. In addition, if these transactional costs were included, your costs would have been higher.
| | | | | | | | | | | | | | | | |
| | | Beginning account value 2-1-2016 | | | Ending account value 7-31-2016 | | | Expenses paid during the period¹ | | | Annualized net expense ratio | |
Class A | | | | | | | | | | | | | | | | |
Actual | | $ | 1,000.00 | | | $ | 1,113.05 | | | $ | 6.78 | | | | 1.29 | % |
Hypothetical (5% return before expenses) | | $ | 1,000.00 | | | $ | 1,018.45 | | | $ | 6.47 | | | | 1.29 | % |
Class B | | | | | | | | | | | | | | | | |
Actual | | $ | 1,000.00 | | | $ | 1,108.95 | | | $ | 10.69 | | | | 2.04 | % |
Hypothetical (5% return before expenses) | | $ | 1,000.00 | | | $ | 1,014.73 | | | $ | 10.21 | | | | 2.04 | % |
Class C | | | | | | | | | | | | | | | | |
Actual | | $ | 1,000.00 | | | $ | 1,108.92 | | | $ | 10.69 | | | | 2.04 | % |
Hypothetical (5% return before expenses) | | $ | 1,000.00 | | | $ | 1,014.72 | | | $ | 10.22 | | | | 2.04 | % |
Class R | | | | | | | | | | | | | | | | |
Actual | | $ | 1,000.00 | | | $ | 1,111.59 | | | $ | 8.06 | | | | 1.54 | % |
Hypothetical (5% return before expenses) | | $ | 1,000.00 | | | $ | 1,017.23 | | | $ | 7.70 | | | | 1.54 | % |
Administrator Class | | | | | | | | | | | | | | | | |
Actual | | $ | 1,000.00 | | | $ | 1,114.23 | | | $ | 5.78 | | | | 1.10 | % |
Hypothetical (5% return before expenses) | | $ | 1,000.00 | | | $ | 1,019.39 | | | $ | 5.52 | | | | 1.10 | % |
Institutional Class | | | | | | | | | | | | | | | | |
Actual | | $ | 1,000.00 | | | $ | 1,115.50 | | | $ | 4.47 | | | | 0.85 | % |
Hypothetical (5% return before expenses) | | $ | 1,000.00 | | | $ | 1,020.64 | | | $ | 4.27 | | | | 0.85 | % |
| 1 | Expenses paid is equal to the annualized net expense ratio of each class multiplied by the average account value over the period, multiplied by the number of days in the most recent fiscal half-year divided by the number of days in the fiscal year (to reflect the one-half-year period). |
| | | | | | |
| Portfolio of investments—July 31, 2016 | | Wells Fargo Omega Growth Fund | | | 11 | |
| | | | | | | | | | | | | | | | |
| Security name | | | | | | | | Shares | | | Value | |
| | | | |
Common Stocks: 100.16% | | | | | | | | | | | | | | | | |
| | | | |
Consumer Discretionary: 21.90% | | | | | | | | | | | | | | | | |
| | | | |
| Diversified Consumer Services: 1.17% | | | | | | | | | | | | | | | | |
ServiceMaster Global Holdings Incorporated † | | | | | | | | | | | 240,612 | | | $ | 9,102,352 | |
| | | | | | | | | | | | | | | | |
| | | | |
| Hotels, Restaurants & Leisure: 6.66% | | | | | | | | | | | | | | | | |
Six Flags Entertainment Corporation | | | | | | | | | | | 170,200 | | | | 9,597,578 | |
Starbucks Corporation | | | | | | | | | | | 264,300 | | | | 15,342,615 | |
Vail Resorts Incorporated | | | | | | | | | | | 87,102 | | | | 12,461,683 | |
Yum! Brands Incorporated | | | | | | | | | | | 159,600 | | | | 14,271,432 | |
| | | | |
| | | | | | | | | | | | | | | 51,673,308 | |
| | | | | | | | | | | | | | | | |
| | | | |
| Internet & Catalog Retail: 4.39% | | | | | | | | | | | | | | | | |
Amazon.com Incorporated † | | | | | | | | | | | 44,900 | | | | 34,070,569 | |
| | | | | | | | | | | | | | | | |
| | | | |
| Media: 2.69% | | | | | | | | | | | | | | | | |
Charter Communications Incorporated Class A † | | | | | | | | | | | 46,300 | | | | 10,874,481 | |
Cinemark Holdings Incorporated | | | | | | | | | | | 265,495 | | | | 9,982,612 | |
| | | | |
| | | | | | | | | | | | | | | 20,857,093 | |
| | | | | | | | | | | | | | | | |
| | | | |
| Multiline Retail: 1.51% | | | | | | | | | | | | | | | | |
Dollar General Corporation | | | | | | | | | | | 123,740 | | | | 11,723,128 | |
| | | | | | | | | | | | | | | | |
| | | | |
| Specialty Retail: 4.46% | | | | | | | | | | | | | | | | |
O’Reilly Automotive Incorporated † | | | | | | | | | | | 34,700 | | | | 10,084,861 | |
The Home Depot Incorporated | | | | | | | | | | | 177,500 | | | | 24,537,600 | |
| | | | |
| | | | | | | | | | | | | | | 34,622,461 | |
| | | | | | | | | | | | | | | | |
| | | | |
| Textiles, Apparel & Luxury Goods: 1.02% | | | | | | | | | | | | | | | | |
Coach Incorporated | | | | | | | | | | | 184,500 | | | | 7,953,795 | |
| | | | | | | | | | | | | | | | |
| | | | |
Consumer Staples: 8.06% | | | | | | | | | | | | | | | | |
| | | | |
| Beverages: 6.08% | | | | | | | | | | | | | | | | |
Constellation Brands Incorporated Class A | | | | | | | | | | | 96,900 | | | | 15,952,647 | |
Dr Pepper Snapple Group Incorporated | | | | | | | | | | | 158,400 | | | | 15,603,984 | |
Monster Beverage Corporation † | | | | | | | | | | | 97,300 | | | | 15,629,299 | |
| | | | |
| | | | | | | | | | | | | | | 47,185,930 | |
| | | | | | | | | | | | | | | | |
| | | | |
| Tobacco: 1.98% | | | | | | | | | | | | | | | | |
Reynolds American Incorporated | | | | | | | | | | | 307,500 | | | | 15,393,450 | |
| | | | | | | | | | | | | | | | |
| | | | |
Financials: 6.13% | | | | | | | | | | | | | | | | |
| | | | |
| Capital Markets: 2.01% | | | | | | | | | | | | | | | | |
Raymond James Financial Incorporated | | | | | | | | | | | 151,502 | | | | 8,317,460 | |
SEI Investments Company | | | | | | | | | | | 161,200 | | | | 7,254,000 | |
| | | | |
| | | | | | | | | | | | | | | 15,571,460 | |
| | | | | | | | | | | | | | | | |
| | | | |
| Diversified Financial Services: 3.04% | | | | | | | | | | | | | | | | |
Intercontinental Exchange Incorporated | | | | | | | | | | | 46,400 | | | | 12,258,880 | |
The accompanying notes are an integral part of these financial statements.
| | | | |
| 12 | | Wells Fargo Omega Growth Fund | | Portfolio of investments—July 31, 2016 |
| | | | | | | | | | | | | | | | |
| Security name | | | | | | | | Shares | | | Value | |
| | | | |
| Diversified Financial Services (continued) | | | | | | | | | | | | | | | | |
S&P Global Incorporated | | | | | | | | | | | 92,800 | | | $ | 11,340,160 | |
| | | | |
| | | | | | | | | | | | | | | 23,599,040 | |
| | | | | | | | | | | | | | | | |
| | | | |
| Real Estate Management & Development: 1.08% | | | | | | | | | | | | | | | | |
CBRE Group Incorporated Class A † | | | | | | | | | | | 294,000 | | | | 8,364,300 | |
| | | | | | | | | | | | | | | | |
| | | | |
Health Care: 18.12% | | | | | | | | | | | | | | | | |
| | | | |
| Biotechnology: 2.52% | | | | | | | | | | | | | | | | |
Alexion Pharmaceuticals Incorporated † | | | | | | | | | | | 43,300 | | | | 5,568,380 | |
Biogen Incorporated † | | | | | | | | | | | 28,600 | | | | 8,291,998 | |
Celgene Corporation † | | | | | | | | | | | 50,575 | | | | 5,674,009 | |
| | | | |
| | | | | | | | | | | | | | | 19,534,387 | |
| | | | | | | | | | | | | | | | |
| | | | |
| Health Care Equipment & Supplies: 5.39% | | | | | | | | | | | | | | | | |
Baxter International Incorporated | | | | | | | | | | | 187,700 | | | | 9,013,354 | |
Boston Scientific Corporation † | | | | | | | | | | | 411,300 | | | | 9,986,364 | |
DexCom Incorporated † | | | | | | | | | | | 122,100 | | | | 11,261,283 | |
Intuitive Surgical Incorporated † | | | | | | | | | | | 16,600 | | | | 11,549,616 | |
| | | | |
| | | | | | | | | | | | | | | 41,810,617 | |
| | | | | | | | | | | | | | | | |
| | | | |
| Health Care Providers & Services: 4.40% | | | | | | | | | | | | | | | | |
Amedisys Incorporated † | | | | | | | | | | | 148,600 | | | | 7,957,530 | |
Surgical Care Affiliates Incorporated † | | | | | | | | | | | 122,940 | | | | 6,394,109 | |
UnitedHealth Group Incorporated | | | | | | | | | | | 138,400 | | | | 19,818,880 | |
| | | | |
| | | | | | | | | | | | | | | 34,170,519 | |
| | | | | | | | | | | | | | | | |
| | | | |
| Health Care Technology: 1.03% | | | | | | | | | | | | | | | | |
Veeva Systems Incorporated Class A † | | | | | | | | | | | 210,411 | | | | 7,993,514 | |
| | | | | | | | | | | | | | | | |
| | | | |
| Pharmaceuticals: 4.78% | | | | | | | | | | | | | | | | |
Bristol-Myers Squibb Company | | | | | | | | | | | 288,300 | | | | 21,567,723 | |
Eli Lilly & Company | | | | | | | | | | | 66,200 | | | | 5,487,318 | |
Novo Nordisk A/S ADR | | | | | | | | | | | 177,100 | | | | 10,089,387 | |
| | | | |
| | | | | | | | | | | | | | | 37,144,428 | |
| | | | | | | | | | | | | | | | |
| | | | |
Industrials: 11.09% | | | | | | | | | | | | | | | | |
| | | | |
| Aerospace & Defense: 1.18% | | | | | | | | | | | | | | | | |
Orbital ATK Incorporated | | | | | | | | | | | 105,000 | | | | 9,147,600 | |
| | | | | | | | | | | | | | | | |
| | | | |
| Airlines: 0.71% | | | | | | | | | | | | | | | | |
Delta Air Lines Incorporated | | | | | | | | | | | 142,700 | | | | 5,529,625 | |
| | | | | | | | | | | | | | | | |
| | | | |
| Commercial Services & Supplies: 2.07% | | | | | | | | | | | | | | | | |
KAR Auction Services Incorporated | | | | | | | | | | | 376,348 | | | | 16,096,404 | |
| | | | | | | | | | | | | | | | |
| | | | |
| Electrical Equipment: 1.05% | | | | | | | | | | | | | | | | |
Acuity Brands Incorporated | | | | | | | | | | | 31,000 | | | | 8,135,330 | |
| | | | | | | | | | | | | | | | |
| | | | |
| Industrial Conglomerates: 1.19% | | | | | | | | | | | | | | | | |
Carlisle Companies Incorporated | | | | | | | | | | | 89,200 | | | | 9,213,468 | |
| | | | | | | | | | | | | | | | |
The accompanying notes are an integral part of these financial statements.
| | | | | | |
| Portfolio of investments—July 31, 2016 | | Wells Fargo Omega Growth Fund | | | 13 | |
| | | | | | | | | | | | | | | | |
| Security name | | | | | | | | Shares | | | Value | |
| | | | |
| Machinery: 0.24% | | | | | | | | | | | | | | | | |
Proto Labs Incorporated †« | | | | | | | | | | | 34,102 | | | $ | 1,876,974 | |
| | | | | | | | | | | | | | | | |
| | | | |
| Professional Services: 1.07% | | | | | | | | | | | | | | | | |
Verisk Analytics Incorporated † | | | | | | | | | | | 97,000 | | | | 8,272,160 | |
| | | | | | | | | | | | | | | | |
| | | | |
| Road & Rail: 2.51% | | | | | | | | | | | | | | | | |
J.B. Hunt Transport Services Incorporated | | | | | | | | | | | 96,900 | | | | 8,055,297 | |
Kansas City Southern | | | | | | | | | | | 118,900 | | | | 11,427,479 | |
| | | | |
| | | | | | | | | | | | | | | 19,482,776 | |
| | | | | | | | | | | | | | | | |
| | | | |
| Trading Companies & Distributors: 1.07% | | | | | | | | | | | | | | | | |
HD Supply Holdings Incorporated † | | | | | | | | | | | 230,477 | | | | 8,340,963 | |
| | | | | | | | | | | | | | | | |
| | | | |
Information Technology: 31.91% | | | | | | | | | | | | | | | | |
| | | | |
| Communications Equipment: 1.36% | | | | | | | | | | | | | | | | |
Harris Corporation | | | | | | | | | | | 122,100 | | | | 10,576,302 | |
| | | | | | | | | | | | | | | | |
| | | | |
| Internet Software & Services: 12.04% | | | | | | | | | | | | | | | | |
Alphabet Incorporated Class A † | | | | | | | | | | | 32,500 | | | | 25,718,550 | |
Alphabet Incorporated Class C † | | | | | | | | | | | 24,885 | | | | 19,131,339 | |
CoStar Group Incorporated † | | | | | | | | | | | 36,200 | | | | 7,525,980 | |
Facebook Incorporated Class A † | | | | | | | | | | | 237,000 | | | | 29,373,780 | |
Tencent Holdings Limited ADR | | | | | | | | | | | 482,200 | | | | 11,669,240 | |
| | | | |
| | | | | | | | | | | | | | | 93,418,889 | |
| | | | | | | | | | | | | | | | |
| | | | |
| IT Services: 9.23% | | | | | | | | | | | | | | | | |
Acxiom Corporation † | | | | | | | | | | | 95,126 | | | | 2,183,142 | |
Alliance Data Systems Corporation † | | | | | | | | | | | 20,300 | | | | 4,701,886 | |
Broadridge Financial Solutions Incorporated | | | | | | | | | | | 150,169 | | | | 10,163,438 | |
EPAM Systems Incorporated † | | | | | | | | | | | 158,741 | | | | 11,149,968 | |
PayPal Holdings Incorporated † | | | | | | | | | | | 323,800 | | | | 12,058,312 | |
Visa Incorporated Class A | | | | | | | | | | | 315,804 | | | | 24,648,502 | |
WEX Incorporated † | | | | | | | | | | | 72,160 | | | | 6,759,949 | |
| | | | |
| | | | | | | | | | | | | | | 71,665,197 | |
| | | | | | | | | | | | | | | | |
| | | | |
| Software: 6.80% | | | | | | | | | | | | | | | | |
Adobe Systems Incorporated † | | | | | | | | | | | 106,300 | | | | 10,402,518 | |
Salesforce.com Incorporated † | | | | | | | | | | | 133,500 | | | | 10,920,300 | |
ServiceNow Incorporated † | | | | | | | | | | | 152,300 | | | | 11,410,316 | |
Take-Two Interactive Software Incorporated † | | | | | | | | | | | 308,300 | | | | 12,387,494 | |
Tyler Technologies Incorporated † | | | | | | | | | | | 47,000 | | | | 7,661,940 | |
| | | | |
| | | | | | | | | | | | | | | 52,782,568 | |
| | | | | | | | | | | | | | | | |
| | | | |
| Technology Hardware, Storage & Peripherals: 2.48% | | | | | | | | | | | | | | | | |
Apple Incorporated | | | | | | | | | | | 184,900 | | | | 19,268,429 | |
| | | | | | | | | | | | | | | | |
| | | | |
Materials: 2.95% | | | | | | | | | | | | | | | | |
| | | | |
| Chemicals: 1.64% | | | | | | | | | | | | | | | | |
The Sherwin-Williams Company | | | | | | | | | | | 42,300 | | | | 12,678,579 | |
| | | | | | | | | | | | | | | | |
The accompanying notes are an integral part of these financial statements.
| | | | |
| 14 | | Wells Fargo Omega Growth Fund | | Portfolio of investments—July 31, 2016 |
| | | | | | | | | | | | | | | | |
| Security name | | | | | | | | Shares | | | Value | |
| | | | |
| Construction Materials: 1.31% | | | | | | | | | | | | | | | | |
Vulcan Materials Company | | | | | | | | | | | 82,200 | | | $ | 10,191,155 | |
| | | | | | | | | | | | | | | | |
| | | | |
Total Common Stocks (Cost $592,538,616) | | | | | | | | | | | | | | | 777,446,770 | |
| | | | | | | | | | | | | | | | |
| | | | |
| | | Yield | | | | | | | | | | |
| Short-Term Investments: 1.02% | | | | | | | | | | | | | | | | |
| | | | |
| Investment Companies: 1.02% | | | | | | | | | | | | | | | | |
Securities Lending Cash Investments LLC (l)(r)(u) | | | 0.50 | % | | | | | | | 421,875 | | | | 421,875 | |
Wells Fargo Government Money Market Fund Select Class (l)(u) | | | 0.32 | | | | | | | | 7,513,053 | | | | 7,513,053 | |
| | | | |
Total Short-Term Investments (Cost $7,934,928) | | | | | | | | | | | | | | | 7,934,928 | |
| | | | | | | | | | | | | | | | |
| | | | | | | | |
| Total investments in securities (Cost $600,473,544) * | | | 101.18 | % | | | 785,381,698 | |
Other assets and liabilities, net | | | (1.18 | ) | | | (9,122,255 | ) |
| | | | | | | | |
| Total net assets | | | 100.00 | % | | $ | 776,259,443 | |
| | | | | | | | |
| † | Non-income-earning security |
| « | All or a portion of this security is on loan. |
| (l) | The issuer of the security is an affiliated person of the Fund as defined in the Investment Company Act of 1940. |
| (r) | The investment is a non-registered investment vehicle purchased with cash collateral received from securities on loan. |
| (u) | The rate represents the 7-day annualized yield at period end. |
| * | Cost for federal income tax purposes is $601,770,245 and unrealized gains (losses) consists of: |
| | | | |
Gross unrealized gains | | $ | 192,198,541 | |
Gross unrealized losses | | | (8,587,088 | ) |
| | | | |
Net unrealized gains | | $ | 183,611,453 | |
The accompanying notes are an integral part of these financial statements.
| | | | | | |
| Statement of assets and liabilities—July 31, 2016 | | Wells Fargo Omega Growth Fund | | | 15 | |
| | | | |
| | | | |
| |
Assets | | | | |
Investments | | | | |
In unaffiliated securities (including $412,800 of securities loaned), at value (cost $592,538,616) | | $ | 777,446,770 | |
In affiliated securities, at value (cost $7,934,928) | | | 7,934,928 | |
| | | | |
Total investments, at value (cost $600,473,544) | | | 785,381,698 | |
Receivable for investments sold | | | 12,652,981 | |
Receivable for Fund shares sold | | | 140,518 | |
Receivable for dividends | | | 190,633 | |
Receivable for securities lending income | | | 866 | |
Prepaid expenses and other assets | | | 48,199 | |
| | | | |
Total assets | | | 798,414,895 | |
| | | | |
| |
Liabilities | | | | |
Payable for investments purchased | | | 19,647,807 | |
Payable for Fund shares redeemed | | | 1,079,265 | |
Payable upon receipt of securities loaned | | | 421,875 | |
Management fee payable | | | 498,210 | |
Distribution fees payable | | | 51,051 | |
Administration fees payable | | | 128,751 | |
Accrued expenses and other liabilities | | | 328,493 | |
| | | | |
Total liabilities | | | 22,155,452 | |
| | | | |
Total net assets | | $ | 776,259,443 | |
| | | | |
| |
NET ASSETS CONSIST OF | | | | |
Paid-in capital | | $ | 604,167,271 | |
Accumulated net investment loss | | | (6,504,204 | ) |
Accumulated net realized losses on investments | | | (6,311,778 | ) |
Net unrealized gains on investments | | | 184,908,154 | |
| | | | |
Total net assets | | $ | 776,259,443 | |
| | | | |
| |
COMPUTATION OF NET ASSET VALUE AND OFFERING PRICE PER SHARE | | | | |
Net assets – Class A | | $ | 573,303,983 | |
Shares outstanding – Class A1 | | | 13,415,946 | |
Net asset value per share – Class A | | | $42.73 | |
Maximum offering price per share – Class A2 | | | $45.34 | |
Net assets – Class B | | $ | 3,477,144 | |
Shares outstanding – Class B1 | | | 108,808 | |
Net asset value per share – Class B | | | $31.96 | |
Net assets – Class C | | $ | 74,336,869 | |
Shares outstanding – Class C1 | | | 2,318,112 | |
Net asset value per share – Class C | | | $32.07 | |
Net assets – Class R | | $ | 10,121,769 | |
Shares outstanding – Class R1 | | | 246,639 | |
Net asset value per share – Class R | | | $41.04 | |
Net assets – Administrator Class | | $ | 38,039,410 | |
Shares outstanding – Administrator Class1 | | | 833,336 | |
Net asset value per share – Administrator Class | | | $45.65 | |
Net assets – Institutional Class | | $ | 76,980,268 | |
Shares outstanding – Institutional Class1 | | | 1,653,614 | |
Net asset value per share – Institutional Class | | | $46.55 | |
| 1 | The Fund has an unlimited number of authorized shares. |
| 2 | Maximum offering price is computed as 100/94.25 of net asset value. On investments of $50,000 or more, the offering price is reduced. |
The accompanying notes are an integral part of these financial statements.
| | | | |
| 16 | | Wells Fargo Omega Growth Fund | | Statement of operations—year ended July 31, 2016 |
| | | | |
| | | | |
| |
Investment income | | | | |
Dividends | | $ | 6,493,476 | |
Securities lending income, net | | | 129,604 | |
Income from affiliated securities | | | 26,794 | |
| | | | |
Total investment income | | | 6,649,874 | |
| | | | |
| |
Expenses | | | | |
Management fee | | | 6,348,545 | |
Administration fees | | | | |
Class A | | | 1,228,591 | |
Class B | | | 10,690 | |
Class C | | | 169,120 | |
Class R | | | 25,813 | |
Administrator Class | | | 74,194 | |
Institutional Class | | | 95,277 | |
Shareholder servicing fees | | | | |
Class A | | | 1,462,608 | |
Class B | | | 12,726 | |
Class C | | | 201,333 | |
Class R | | | 30,524 | |
Administrator Class | | | 136,667 | |
Distribution fees | | | | |
Class B | | | 38,178 | |
Class C | | | 603,999 | |
Class R | | | 30,729 | |
Custody and accounting fees | | | 59,667 | |
Professional fees | | | 48,336 | |
Registration fees | | | 84,990 | |
Shareholder report expenses | | | 119,756 | |
Trustees’ fees and expenses | | | 24,905 | |
Other fees and expenses | | | 20,182 | |
| | | | |
Total expenses | | | 10,826,830 | |
Less: Fee waivers and/or expense reimbursements | | | (155,367 | ) |
| | | | |
Net expenses | | | 10,671,463 | |
| | | | |
Net investment loss | | | (4,021,589 | ) |
| | | | |
| |
REALIZED AND UNREALIZED GAINS (LOSSES) ON INVESTMENTS | | | | |
Net realized losses on investments | | | (4,017,597 | ) |
Net change in unrealized gains (losses) on investments | | | (30,592,986 | ) |
| | | | |
Net realized and unrealized gains (losses) on investments | | | (34,610,583 | ) |
| | | | |
Net decrease in net assets resulting from operations | | $ | (38,632,172 | ) |
| | | | |
The accompanying notes are an integral part of these financial statements.
| | | | | | |
| Statement of changes in net assets | | Wells Fargo Omega Growth Fund | | | 17 | |
| | | | | | | | | | | | | | | | |
| | | Year ended
July 31, 2016 | | | Year ended
July 31, 2015 | |
| | | | |
Operations | | | | | | | | | | | | | | | | |
Net investment loss | | | | | | $ | (4,021,589 | ) | | | | | | $ | (6,158,068 | ) |
Net realized gains (losses) on investments | | | | | | | (4,017,597 | ) | | | | | | | 83,493,222 | |
Net change in unrealized gains (losses) on investments | | | | | | | (30,592,986 | ) | | | | | | | 22,205,824 | |
| | | | |
Net increase (decrease) in net assets resulting from operations | | | | | | | (38,632,172 | ) | | | | | | | 99,540,978 | |
| | | | |
| | | | |
Distributions to shareholders from | | | | | | | | | | | | | | | | |
Net realized gains | | | | | | | | | | | | | | | | |
Class A | | | | | | | (53,442,331 | ) | | | | | | | (88,485,249 | ) |
Class B | | | | | | | (648,915 | ) | | | | | | | (1,659,485 | ) |
Class C | | | | | | | (9,667,016 | ) | | | | | | | (16,860,203 | ) |
Class R | | | | | | | (1,155,110 | ) | | | | | | | (2,357,246 | ) |
Administrator Class | | | | | | | (4,963,941 | ) | | | | | | | (11,565,611 | ) |
Institutional Class | | | | | | | (5,527,216 | ) | | | | | | | (8,555,196 | ) |
| | | | |
Total distributions to shareholders | | | | | | | (75,404,529 | ) | | | | | | | (129,482,990 | ) |
| | | | |
| | | | |
Capital share transactions | | | Shares | | | | | | | | Shares | | | | | |
Proceeds from shares sold | | | | | | | | | | | | | | | | |
Class A | | | 636,040 | | | | 26,983,625 | | | | 1,073,382 | | | | 51,726,380 | |
Class B | | | 592 | | | | 18,253 | | | | 3,036 | | | | 118,881 | |
Class C | | | 129,265 | | | | 4,127,591 | | | | 278,343 | | | | 10,475,969 | |
Class R | | | 78,841 | | | | 3,191,728 | | | | 114,110 | | | | 5,204,171 | |
Administrator Class | | | 117,203 | | | | 5,396,775 | | | | 459,293 | | | | 23,327,789 | |
Institutional Class | | | 421,170 | | | | 18,380,976 | | | | 1,015,747 | | | | 53,541,695 | |
| | | | |
| | | | | | | 58,098,948 | | | | | | | | 144,394,885 | |
| | | | |
Reinvestment of distributions | | | | | | | | | | | | | | | | |
Class A | | | 1,213,454 | | | | 49,860,826 | | | | 1,824,272 | | | | 82,165,203 | |
Class B | | | 20,867 | | | | 644,380 | | | | 46,774 | | | | 1,640,836 | |
Class C | | | 278,845 | | | | 8,638,611 | | | | 404,364 | | | | 14,229,572 | |
Class R | | | 11,870 | | | | 469,234 | | | | 21,691 | | | | 945,291 | |
Administrator Class | | | 110,013 | | | | 4,822,974 | | | | 205,792 | | | | 9,812,172 | |
Institutional Class | | | 110,554 | | | | 4,935,146 | | | | 136,046 | | | | 6,577,836 | |
| | | | |
| | | | | | | 69,371,171 | | | | | | | | 115,370,910 | |
| | | | |
Payment for shares redeemed | | | | | | | | | | | | | | | | |
Class A | | | (2,617,353 | ) | | | (109,288,473 | ) | | | (3,198,159 | ) | | | (154,561,009 | ) |
Class B | | | (121,453 | ) | | | (3,865,675 | ) | | | (150,668 | ) | | | (5,747,142 | ) |
Class C | | | (728,858 | ) | | | (22,930,898 | ) | | | (708,562 | ) | | | (26,619,160 | ) |
Class R | | | (212,709 | ) | | | (8,667,886 | ) | | | (180,460 | ) | | | (8,460,276 | ) |
Administrator Class | | | (1,088,227 | ) | | | (49,198,465 | ) | | | (1,166,619 | ) | | | (60,110,360 | ) |
Institutional Class | | | (552,473 | ) | | | (26,185,870 | ) | | | (418,232 | ) | | | (21,368,714 | ) |
| | | | |
| | | | | | | (220,137,267 | ) | | | | | | | (276,866,661 | ) |
| | | | |
Net decrease in net assets resulting from capital share transactions | | | | | | | (92,667,148 | ) | | | | | | | (17,100,866 | ) |
| | | | |
Total decrease in net assets | | | | | | | (206,703,849 | ) | | | | | | | (47,042,878 | ) |
| | | | |
| | | | |
Net assets | | | | | | | | | | | | | | | | |
Beginning of period | | | | | | | 982,963,292 | | | | | | | | 1,030,006,170 | |
| | | | |
End of period | | | | | | $ | 776,259,443 | | | | | | | $ | 982,963,292 | |
| | | | |
Accumulated net investment loss | | | | | | $ | (6,504,204 | ) | | | | | | $ | (4,452,286 | ) |
| | | | |
The accompanying notes are an integral part of these financial statements.
| | | | |
| 18 | | Wells Fargo Omega Growth Fund | | Financial highlights |
(For a share outstanding throughout each period)
| | | | | | | | | | | | | | | | | | | | |
| | | Year ended July 31 | |
| CLASS A | | 2016 | | | 2015 | | | 2014 | | | 2013 | | | 2012 | |
Net asset value, beginning of period | | | $48.29 | | | | $49.99 | | | | $47.97 | | | | $39.09 | | | | $38.29 | |
Net investment loss | | | (0.19 | )1 | | | (0.28 | )1 | | | (0.49 | ) | | | (0.02 | ) | | | (0.28 | )1 |
Net realized and unrealized gains (losses) on investments | | | (1.44 | ) | | | 5.12 | | | | 8.28 | | | | 10.31 | | | | 1.08 | |
| | | | | | | | | | | | | | | | | | | | |
Total from investment operations | | | (1.63 | ) | | | 4.84 | | | | 7.79 | | | | 10.29 | | | | 0.80 | |
Distributions to shareholders from | | | | | | | | | | | | | | | | | | | | |
Net realized gains | | | (3.93 | ) | | | (6.54 | ) | | | (5.77 | ) | | | (1.41 | ) | | | 0.00 | |
Net asset value, end of period | | | $42.73 | | | | $48.29 | | | | $49.99 | | | | $47.97 | | | | $39.09 | |
Total return2 | | | (3.07 | )% | | | 10.65 | % | | | 16.58 | % | | | 27.07 | % | | | 2.09 | % |
Ratios to average net assets (annualized) | | | | | | | | | | | | | | | | | | | | |
Gross expenses | | | 1.28 | % | | | 1.32 | % | | | 1.32 | % | | | 1.34 | % | | | 1.35 | % |
Net expenses | | | 1.28 | % | | | 1.30 | % | | | 1.30 | % | | | 1.30 | % | | | 1.30 | % |
Net investment loss | | | (0.47 | )% | | | (0.58 | )% | | | (0.84 | )% | | | (0.08 | )% | | | (0.75 | )% |
Supplemental data | | | | | | | | | | | | | | | | | | | | |
Portfolio turnover rate | | | 84 | % | | | 94 | % | | | 101 | % | | | 88 | % | | | 101 | % |
Net assets, end of period (000s omitted) | | | $573,304 | | | | $685,005 | | | | $724,071 | | | | $668,992 | | | | $550,758 | |
| 1 | Calculated based upon average shares outstanding |
| 2 | Total return calculations do not include any sales charges. |
The accompanying notes are an integral part of these financial statements.
| | | | | | |
| Financial highlights | | Wells Fargo Omega Growth Fund | | | 19 | |
(For a share outstanding throughout each period)
| | | | | | | | | | | | | | | | | | | | |
| | | Year ended July 31 | |
| CLASS B | | 2016 | | | 2015 | | | 2014 | | | 2013 | | | 2012 | |
Net asset value, beginning of period | | | $37.44 | | | | $40.45 | | | | $40.07 | | | | $33.12 | | | | $32.68 | |
Net investment loss | | | (0.39 | )1 | | | (0.51 | )1 | | | (0.65 | )1 | | | (0.28 | )1 | | | (0.47 | )1 |
Net realized and unrealized gains (losses) on investments | | | (1.16 | ) | | | 4.04 | | | | 6.80 | | | | 8.64 | | | | 0.91 | |
| | | | | | | | | | | | | | | | | | | | |
Total from investment operations | | | (1.55 | ) | | | 3.53 | | | | 6.15 | | | | 8.36 | | | | 0.44 | |
Distributions to shareholders from | | | | | | | | | | | | | | | | | | | | |
Net realized gains | | | (3.93 | ) | | | (6.54 | ) | | | (5.77 | ) | | | (1.41 | ) | | | 0.00 | |
Net asset value, end of period | | | $31.96 | | | | $37.44 | | | | $40.45 | | | | $40.07 | | | | $33.12 | |
Total return2 | | | (3.77 | )% | | | 9.82 | % | | | 15.71 | % | | | 26.11 | % | | | 1.32 | % |
Ratios to average net assets (annualized) | | | | | | | | | | | | | | | | | | | | |
Gross expenses | | | 2.03 | % | | | 2.07 | % | | | 2.07 | % | | | 2.09 | % | | | 2.10 | % |
Net expenses | | | 2.03 | % | | | 2.05 | % | | | 2.05 | % | | | 2.05 | % | | | 2.05 | % |
Net investment loss | | | (1.22 | )% | | | (1.32 | )% | | | (1.58 | )% | | | (0.78 | )% | | | (1.51 | )% |
Supplemental data | | | | | | | | | | | | | | | | | | | | |
Portfolio turnover rate | | | 84 | % | | | 94 | % | | | 101 | % | | | 88 | % | | | 101 | % |
Net assets, end of period (000s omitted) | | | $3,477 | | | | $7,817 | | | | $12,526 | | | | $17,476 | | | | $22,271 | |
| 1 | Calculated based upon average shares outstanding |
| 2 | Total return calculations do not include any sales charges. |
The accompanying notes are an integral part of these financial statements.
| | | | |
| 20 | | Wells Fargo Omega Growth Fund | | Financial highlights |
(For a share outstanding throughout each period)
| | | | | | | | | | | | | | | | | | | | |
| | | Year ended July 31 | |
| CLASS C | | 2016 | | | 2015 | | | 2014 | | | 2013 | | | 2012 | |
Net asset value, beginning of period | | | $37.55 | | | | $40.56 | | | | $40.15 | | | | $33.18 | | | | $32.75 | |
Net investment loss | | | (0.39 | )1 | | | (0.51 | )1 | | | (0.65 | )1 | | | (0.31 | )1 | | | (0.47 | )1 |
Net realized and unrealized gains (losses) on investments | | | (1.16 | ) | | | 4.04 | | | | 6.83 | | | | 8.69 | | | | 0.90 | |
| | | | | | | | | | | | | | | | | | | | |
Total from investment operations | | | (1.55 | ) | | | 3.53 | | | | 6.18 | | | | 8.38 | | | | 0.43 | |
Distributions to shareholders from | | | | | | | | | | | | | | | | | | | | |
Net realized gains | | | (3.93 | ) | | | (6.54 | ) | | | (5.77 | ) | | | (1.41 | ) | | | 0.00 | |
Net asset value, end of period | | | $32.07 | | | | $37.55 | | | | $40.56 | | | | $40.15 | | | | $33.18 | |
Total return2 | | | (3.75 | )% | | | 9.79 | % | | | 15.73 | % | | | 26.11 | % | | | 1.31 | % |
Ratios to average net assets (annualized) | | | | | | | | | | | | | | | | | | | | |
Gross expenses | | | 2.03 | % | | | 2.07 | % | | | 2.07 | % | | | 2.09 | % | | | 2.10 | % |
Net expenses | | | 2.03 | % | | | 2.05 | % | | | 2.05 | % | | | 2.05 | % | | | 2.05 | % |
Net investment loss | | | (1.22 | )% | | | (1.33 | )% | | | (1.59 | )% | | | (0.85 | )% | | | (1.49 | )% |
Supplemental data | | | | | | | | | | | | | | | | | | | | |
Portfolio turnover rate | | | 84 | % | | | 94 | % | | | 101 | % | | | 88 | % | | | 101 | % |
Net assets, end of period (000s omitted) | | | $74,337 | | | | $99,100 | | | | $108,073 | | | | $83,206 | | | | $59,481 | |
| 1 | Calculated based upon average shares outstanding |
| 2 | Total return calculations do not include any sales charges. |
The accompanying notes are an integral part of these financial statements.
| | | | | | |
| Financial highlights | | Wells Fargo Omega Growth Fund | | | 21 | |
(For a share outstanding throughout each period)
| | | | | | | | | | | | | | | | | | | | |
| | | Year ended July 31 | |
| CLASS R | | 2016 | | | 2015 | | | 2014 | | | 2013 | | | 2012 | |
Net asset value, beginning of period | | | $46.66 | | | | $48.62 | | | | $46.90 | | | | $38.35 | | | | $37.66 | |
Net investment loss | | | (0.29 | )1 | | | (0.39 | )1 | | | (0.53 | )1 | | | (0.09 | ) | | | (0.36 | )1 |
Net realized and unrealized gains (losses) on investments | | | (1.40 | ) | | | 4.97 | | | | 8.02 | | | | 10.05 | | | | 1.05 | |
| | | | | | | | | | | | | | | | | | | | |
Total from investment operations | | | (1.69 | ) | | | 4.58 | | | | 7.49 | | | | 9.96 | | | | 0.69 | |
Distributions to shareholders from | | | | | | | | | | | | | | | | | | | | |
Net realized gains | | | (3.93 | ) | | | (6.54 | ) | | | (5.77 | ) | | | (1.41 | ) | | | 0.00 | |
Net asset value, end of period | | | $41.04 | | | | $46.66 | | | | $48.62 | | | | $46.90 | | | | $38.35 | |
Total return | | | (3.30 | )% | | | 10.38 | % | | | 16.30 | % | | | 26.73 | % | | | 1.83 | % |
Ratios to average net assets (annualized) | | | | | | | | | | | | | | | | | | | | |
Gross expenses | | | 1.53 | % | | | 1.57 | % | | | 1.57 | % | | | 1.59 | % | | | 1.60 | % |
Net expenses | | | 1.53 | % | | | 1.55 | % | | | 1.55 | % | | | 1.55 | % | | | 1.55 | % |
Net investment loss | | | (0.71 | )% | | | (0.83 | )% | | | (1.09 | )% | | | (0.38 | )% | | | (0.99 | )% |
Supplemental data | | | | | | | | | | | | | | | | | | | | |
Portfolio turnover rate | | | 84 | % | | | 94 | % | | | 101 | % | | | 88 | % | | | 101 | % |
Net assets, end of period (000s omitted) | | | $10,122 | | | | $17,199 | | | | $20,095 | | | | $23,745 | | | | $15,408 | |
| 1 | Calculated based upon average shares outstanding |
The accompanying notes are an integral part of these financial statements.
| | | | |
| 22 | | Wells Fargo Omega Growth Fund | | Financial highlights |
(For a share outstanding throughout each period)
| | | | | | | | | | | | | | | | | | | | |
| | | Year ended July 31 | |
| ADMINISTRATOR CLASS | | 2016 | | | 2015 | | | 2014 | | | 2013 | | | 2012 | |
Net asset value, beginning of period | | | $51.20 | | | | $52.50 | | | | $50.00 | | | | $40.60 | | | | $39.67 | |
Net investment income (loss) | | | (0.12 | )1 | | | (0.17 | )1 | | | (0.31 | )1 | | | 0.07 | 1 | | | (0.19 | )1 |
Net realized and unrealized gains (losses) on investments | | | (1.50 | ) | | | 5.41 | | | | 8.58 | | | | 10.74 | | | | 1.12 | |
| | | | | | | | | | | | | | | | | | | | |
Total from investment operations | | | (1.62 | ) | | | 5.24 | | | | 8.27 | | | | 10.81 | | | | 0.93 | |
Distributions to shareholders from | | | | | | | | | | | | | | | | | | | | |
Net realized gains | | | (3.93 | ) | | | (6.54 | ) | | | (5.77 | ) | | | (1.41 | ) | | | 0.00 | |
Net asset value, end of period | | | $45.65 | | | | $51.20 | | | | $52.50 | | | | $50.00 | | | | $40.60 | |
Total return | | | (2.84 | )% | | | 10.91 | % | | | 16.89 | % | | | 27.35 | % | | | 2.34 | % |
Ratios to average net assets (annualized) | | | | | | | | | | | | | | | | | | | | |
Gross expenses | | | 1.19 | % | | | 1.15 | % | | | 1.15 | % | | | 1.17 | % | | | 1.17 | % |
Net expenses | | | 1.08 | % | | | 1.05 | % | | | 1.05 | % | | | 1.05 | % | | | 1.05 | % |
Net investment income (loss) | | | (0.27 | )% | | | (0.33 | )% | | | (0.59 | )% | | | 0.16 | % | | | (0.49 | )% |
Supplemental data | | | | | | | | | | | | | | | | | | | | |
Portfolio turnover rate | | | 84 | % | | | 94 | % | | | 101 | % | | | 88 | % | | | 101 | % |
Net assets, end of period (000s omitted) | | | $38,039 | | | | $86,756 | | | | $115,281 | | | | $69,264 | | | | $51,560 | |
| 1 | Calculated based upon average shares outstanding |
The accompanying notes are an integral part of these financial statements.
| | | | | | |
| Financial highlights | | Wells Fargo Omega Growth Fund | | | 23 | |
(For a share outstanding throughout each period)
| | | | | | | | | | | | | | | | | | | | |
| | | Year ended July 31 | |
| INSTITUTIONAL CLASS | | 2016 | | | 2015 | | | 2014 | | | 2013 | | | 2012 | |
Net asset value, beginning of period | | | $52.01 | | | | $53.10 | | | | $50.40 | | | | $40.81 | | | | $39.77 | |
Net investment income (loss) | | | (0.00 | )1 | | | (0.04 | )2 | | | (0.24 | ) | | | 0.11 | 2 | | | (0.10 | ) |
Net realized and unrealized gains (losses) on investments | | | (1.53 | ) | | | 5.49 | | | | 8.71 | | | | 10.89 | | | | 1.14 | |
| | | | | | | | | | | | | | | | | | | | |
Total from investment operations | | | (1.53 | ) | | | 5.45 | | | | 8.47 | | | | 11.00 | | | | 1.04 | |
Distributions to shareholders from | | | | | | | | | | | | | | | | | | | | |
Net realized gains | | | (3.93 | ) | | | (6.54 | ) | | | (5.77 | ) | | | (1.41 | ) | | | 0.00 | |
Net asset value, end of period | | | $46.55 | | | | $52.01 | | | | $53.10 | | | | $50.40 | | | | $40.81 | |
Total return | | | (2.61 | )% | | | 11.20 | % | | | 17.17 | % | | | 27.68 | % | | | 2.62 | % |
Ratios to average net assets (annualized) | | | | | | | | | | | | | | | | | | | | |
Gross expenses | | | 0.95 | % | | | 0.90 | % | | | 0.89 | % | | | 0.91 | % | | | 0.92 | % |
Net expenses | | | 0.83 | % | | | 0.80 | % | | | 0.80 | % | | | 0.80 | % | | | 0.80 | % |
Net investment income (loss) | | | (0.01 | )% | | | (0.09 | )% | | | (0.36 | )% | | | 0.24 | % | | | (0.24 | )% |
Supplemental data | | | | | | | | | | | | | | | | | | | | |
Portfolio turnover rate | | | 84 | % | | | 94 | % | | | 101 | % | | | 88 | % | | | 101 | % |
Net assets, end of period (000s omitted) | | | $76,980 | | | | $87,085 | | | | $49,960 | | | | $3,507 | | | | $779 | |
| 1 | Amount is less than $0.005. |
| 2 | Calculated based upon average shares outstanding |
The accompanying notes are an integral part of these financial statements.
| | | | |
| 24 | | Wells Fargo Omega Growth Fund | | Notes to financial statements |
1. ORGANIZATION
Wells Fargo Funds Trust (the “Trust”), a Delaware statutory trust organized on March 10, 1999, is an open-end management investment company registered under the Investment Company Act of 1940, as amended (the “1940 Act”). As an investment company, the Trust follows the accounting and reporting guidance in Financial Accounting Standards Board (“FASB”) Accounting Standards Codification Topic 946, Financial Services – Investment Companies. These financial statements report on the Wells Fargo Omega Growth Fund (the “Fund”) which is a diversified series of the Trust.
2. SIGNIFICANT ACCOUNTING POLICIES
The following significant accounting policies, which are consistently followed in the preparation of the financial statements of the Fund, are in conformity with U.S. generally accepted accounting principles which require management to make estimates and assumptions that affect the reported amounts of assets and liabilities, disclosure of contingent assets and liabilities at the date of the financial statements, and the reported amounts of revenues and expenses during the reporting period. Actual results could differ from those estimates.
Securities valuation
All investments are valued each business day as of the close of regular trading on the New York Stock Exchange (generally 4 p.m. Eastern Time), although the Fund may deviate from this calculation time under unusual or unexpected circumstances.
Equity securities that are listed on a foreign or domestic exchange or market are valued at the official closing price or, if none, the last sales price. If no sale occurs on the principal exchange or market that day, the prior day’s price will be deemed “stale” and a fair value price will be determined in accordance with the Fund’s Valuation Procedures.
Investments in registered open-end investment companies are valued at net asset value. Interests in non-registered investment vehicles that are redeemable at net asset value are fair valued normally at net asset value.
Investments which are not valued using any of the methods discussed above are valued at their fair value, as determined in good faith by the Board of Trustees of the Fund. The Board of Trustees has established a Valuation Committee comprised of the Trustees and has delegated to it the authority to take any actions regarding the valuation of portfolio securities that the Valuation Committee deems necessary or appropriate, including determining the fair value of portfolio securities, unless the determination has been delegated to the Management Valuation Team of Wells Fargo Funds Management, LLC (“Funds Management”). The Board of Trustees retains the authority to make or ratify any valuation decisions or approve any changes to the Valuation Procedures as it deems appropriate. On a quarterly basis, the Board of Trustees receives reports on any valuation actions taken by the Valuation Committee or the Management Valuation Team which may include items for ratification.
Valuations of fair valued securities are compared to the next actual sales price when available, or other appropriate market values, to assess the continued appropriateness of the fair valuation methodologies used. These securities are fair valued on a day-to-day basis, taking into consideration changes to appropriate market information and any significant changes to the inputs considered in the valuation process until there is a readily available price provided on an exchange or by an independent pricing service. Valuations received from an independent pricing service or independent broker-dealer quotes are periodically validated by comparisons to most recent trades and valuations provided by other independent pricing services in addition to the review of prices by the manager and/or subadviser. Unobservable inputs used in determining fair valuations are identified based on the type of security, taking into consideration factors utilized by market participants in valuing the investment, knowledge about the issuer and the current market environment.
Security loans
The Fund may lend its securities from time to time in order to earn additional income in the form of fees or interest on securities received as collateral or the investment of any cash received as collateral. The Fund continues to receive interest or dividends on the securities loaned. The Fund receives collateral in the form of cash or securities with a value at least equal to the value of the securities on loan. The value of the loaned securities is determined at the close of each business day and any additional required collateral is delivered to the Fund on the next business day. In a securities lending transaction, the net asset value of the Fund will be affected by an increase or decrease in the value of the securities loaned and by an increase or decrease in the value of the instrument in which collateral is invested. The amount of securities lending activity undertaken by the Fund fluctuates from time to time. In the event of default or bankruptcy by the borrower, the Fund may be prevented from recovering the loaned securities or gaining access to the collateral or may experience delays or costs in doing so. In addition, the investment of any cash collateral received may lose all or part of its value. The Fund has the right under the lending agreement to recover the securities from the borrower on demand.
| | | | | | |
| Notes to financial statements | | Wells Fargo Omega Growth Fund | | | 25 | |
The Fund lends its securities through an unaffiliated securities lending agent. Cash collateral received in connection with its securities lending transactions is invested in Securities Lending Cash Investments, LLC (the “Securities Lending Fund”). The Securities Lending Fund is exempt from registration under Section 3(c)(7) of the 1940 Act and is managed by Funds Management and is subadvised by Wells Capital Management Incorporated (“WellsCap”), an affiliate of Funds Management and an indirect wholly owned subsidiary of Wells Fargo & Company (“Wells Fargo”). Funds Management receives an advisory fee starting at 0.05% and declining to 0.01% as the average daily net assets of the Securities Lending Fund increase. All of the fees received by Funds Management are paid to WellsCap for its services as subadviser. The Securities Lending Fund seeks to provide a positive return compared to the daily Fed Funds Open rate by investing in high-quality, U.S. dollar-denominated short-term money market instruments. Securities Lending Fund investments are fair valued based upon the amortized cost valuation technique. Income earned from investment in the Securities Lending Fund is included in securities lending income on the Statement of Operations.
Security transactions and income recognition
Securities transactions are recorded on a trade date basis. Realized gains or losses are recorded on the basis of identified cost.
Dividend income is recognized on the ex-dividend date.
Distributions to shareholders
Distributions to shareholders from net investment income and net realized gains, if any, are recorded on the ex-dividend date. Such distributions are determined in conformity with federal income tax regulations, which may differ in amount or character from net investment income and realized gains recognized for purposes of U.S. generally accepted accounting principles.
Federal and other taxes
The Fund intends to continue to qualify as a regulated investment company by distributing substantially all of its investment company taxable income and any net realized capital gains (after reduction for capital loss carryforwards) sufficient to relieve it from all, or substantially all, federal income taxes. Accordingly, no provision for federal income taxes was required.
The Fund’s income and federal excise tax returns and all financial records supporting those returns for the prior three fiscal years are subject to examination by the federal and Delaware revenue authorities. Management has analyzed the Fund’s tax positions taken on federal, state, and foreign tax returns for all open tax years and does not believe that there are any uncertain tax positions that require recognition of a tax liability.
Reclassifications are made to the Fund’s capital accounts for permanent tax differences to reflect income and gains available for distribution (or available capital loss carryforwards) under federal income tax regulations. U.S. generally accepted accounting principles require that certain components of net assets be adjusted to reflect permanent differences between financial and tax reporting. These reclassifications have no effect on net assets or net asset values per share. The primary permanent differences causing such reclassifications are due to certain distributions paid and net operating losses. At July 31, 2016, as a result of permanent book-to-tax differences, the following reclassification adjustments were made on the Statement of Assets and Liabilities:
| | | | |
| Paid-in capital | | Accumulated net
investment loss | | Accumulated net
realized losses
on investments |
| $(5,082,539) | | $1,969,671 | | $3,112,868 |
As of July 31, 2016, the Fund had current year deferred post-October capital losses and a qualified late-year ordinary loss which will both be recognized on the first day of the following fiscal year in the following amounts:
| | |
Deferred post-October capital losses | | Late-year ordinary losses deferred |
$(5,015,077) | | $(6,480,064) |
Class allocations
The separate classes of shares offered by the Fund differ principally in applicable sales charges, distribution, shareholder servicing, and administration fees. Class specific expenses are charged directly to that share class. Investment income, common expenses, and realized and unrealized gains (losses) on investments are allocated daily to each class of shares based on the relative proportion of net assets of each class.
| | | | |
| 26 | | Wells Fargo Omega Growth Fund | | Notes to financial statements |
3. FAIR VALUATION MEASUREMENTS
Fair value measurements of investments are determined within a framework that has established a fair value hierarchy based upon the various data inputs utilized in determining the value of the Fund’s investments. The three-level hierarchy gives the highest priority to unadjusted quoted prices in active markets for identical assets or liabilities (Level 1) and the lowest priority to significant unobservable inputs (Level 3). The Fund’s investments are classified within the fair value hierarchy based on the lowest level of input that is significant to the fair value measurement. The inputs are summarized into three broad levels as follows:
| n | | Level 1 – quoted prices in active markets for identical securities |
| n | | Level 2 – other significant observable inputs (including quoted prices for similar securities, interest rates, prepayment speeds, credit risk, use of amortized cost, etc.) |
| n | | Level 3 – significant unobservable inputs (including the Fund’s own assumptions in determining the fair value of investments) |
The inputs or methodologies used for valuing investments in securities are not necessarily an indication of the risk associated with investing in those securities.
The following is a summary of the inputs used in valuing the Fund’s assets and liabilities as of July 31, 2016:
| | | | | | | | | | | | | | | | |
| | | Quoted prices (Level 1) | | | Other significant observable inputs (Level 2) | | | Significant unobservable inputs (Level 3) | | | Total | |
Assets | | | | | | | | | | | | | | | | |
Investments in: | | | | | | | | | | | | | | | | |
| | | | |
Common stocks | | | | | | | | | | | | | | | | |
Consumer discretionary | | $ | 170,002,706 | | | $ | 0 | | | $ | 0 | | | $ | 170,002,706 | |
Consumer staples | | | 62,579,380 | | | | 0 | | | | 0 | | | | 62,579,380 | |
Financials | | | 47,534,800 | | | | 0 | | | | 0 | | | | 47,534,800 | |
Health care | | | 140,653,465 | | | | 0 | | | | 0 | | | | 140,653,465 | |
Industrials | | | 86,095,300 | | | | 0 | | | | 0 | | | | 86,095,300 | |
Information technology | | | 247,711,385 | | | | 0 | | | | 0 | | | | 247,711,385 | |
Materials | | | 22,869,734 | | | | 0 | | | | 0 | | | | 22,869,734 | |
| | | | |
Short-term investments | | | | | | | | | | | | | | | | |
Investment companies | | | 7,513,053 | | | | 0 | | | | 0 | | | | 7,513,053 | |
Investments measured at net asset value* | | | | | | | | | | | | | | | 421,875 | |
Total assets | | $ | 784,959,823 | | | $ | 0 | | | $ | 0 | | | $ | 785,381,698 | |
| * | Investments that are measured at fair value using the net asset value per share (or its equivalent) as a practical expedient have not been categorized in the fair value hierarchy. The fair value amount presented in the table is intended to permit reconciliation of the fair value hierarchy to the amounts presented in the Statement of Assets and Liabilities. The Fund’s investment in Securities Lending Cash Investments LLC valued at $421,875 does not have a redemption period notice, can be redeemed daily and does not have any unfunded commitments. |
The Fund recognizes transfers between levels within the fair value hierarchy at the end of the reporting period. At July 31, 2016, the Fund did not have any transfers into/out of Level 1, Level 2, or Level 3.
4. TRANSACTIONS WITH AFFILIATES
Management fee
Funds Management, an indirect wholly owned subsidiary of Wells Fargo, is the manager of the Fund and provides advisory and fund-level administrative services under an investment management agreement. Under the investment management agreement, Funds Management is responsible for, among other services, implementing the investment objectives and strategies of the Fund, supervising the subadviser, providing fund-level administrative services in connection with the Fund’s operations, and providing any other fund-level administrative services reasonably necessary for the operation of the Fund. As compensation for its services under the investment management agreement, Funds Management is entitled to receive an annual management fee starting at 0.80% and declining to 0.555% as the average daily net assets of the Fund increase. For the year ended July 31, 2016, the management fee was equivalent to an annual rate of 0.78% of the Fund’s average daily net assets.
| | | | | | |
| Notes to financial statements | | Wells Fargo Omega Growth Fund | | | 27 | |
Funds Management has retained the services of a subadviser to provide daily portfolio management to the Fund. The fee for subadvisory services is borne by Funds Management. WellsCap is the subadviser to the Fund and is entitled to receive a fee from Funds Management at an annual rate starting at 0.45% and declining to 0.30% as the average daily net assets of the Fund increase.
Administration fees
Under a class-level administration agreement, Funds Management provides class-level administrative services to the Fund, which includes paying fees and expenses for services provided by the transfer agent, sub-transfer agents, omnibus account servicers and record-keepers. As compensation for its services under the class-level administration agreement, Funds Management receives an annual fee which is calculated based on the average daily net assets of each class as follows:
| | | | |
| | | Class-level administration fee | |
Class A, Class B, Class C, Class R | | | 0.21 | % |
Administrator Class, Institutional Class | | | 0.13 | |
Funds Management has contractually waived and/or reimbursed management and administration fees to the extent necessary to maintain certain net operating expense ratios for the Fund. Waiver of fees and/or reimbursement of expenses by Funds Management were made first from fund level expenses on a proportionate basis and then from class specific expenses. Funds Management has committed through November 30, 2016 to waive fees and/or reimburse expenses to the extent necessary to cap the Fund’s expenses at 1.30% for Class A shares, 2.05% for Class B shares, 2.05% for Class C shares, 1.55% for Class R shares, 1.10% for Administrator Class shares, and 0.85% for Institutional Class shares. After this time, the cap may be increased or the commitment to maintain the cap may be terminated only with the approval of the Board of Trustees. Prior to December 1, 2015, the Fund’s expenses were capped at 1.05% for Administrator Class and 0.80% for Institutional Class shares.
Distribution fees
The Trust has adopted a distribution plan for Class B, Class C, and Class R shares of the Fund pursuant to Rule 12b-1 under the 1940 Act. Distribution fees are charged to Class B, Class C, and Class R shares and paid to Wells Fargo Funds Distributor, LLC (“Funds Distributor”), the principal underwriter, at an annual rate of 0.75% of the average daily net assets of Class B and Class C shares and 0.25% of the average daily net assets of Class R shares.
In addition, Funds Distributor is entitled to receive the front-end sales charge from the purchase of Class A shares and a contingent deferred sales charge on the redemption of certain Class A shares. Funds Distributor is also entitled to receive the contingent deferred sales charges from redemptions of Class B and Class C shares. For the year ended July 31, 2016, Funds Distributor received $18,593 from the sale of Class A shares and $164 and $429 in contingent deferred sales charges from redemptions of Class B and Class C shares, respectively.
Shareholder servicing fees
The Trust has entered into contracts with one or more shareholder servicing agents, whereby Class A, Class B, Class C, Class R, and Administrator Class of the Fund are charged a fee at an annual rate of 0.25% of the average daily net assets of each respective class.
A portion of these total shareholder servicing fees were paid to affiliates of Wells Fargo.
5. INVESTMENT PORTFOLIO TRANSACTIONS
Purchases and sales of investments, excluding U.S. government obligations (if any) and short-term securities, for the year ended July 31, 2016 were $692,876,059 and $854,088,789, respectively.
The Fund may purchase or sell investment securities to other Wells Fargo funds under procedures adopted by the Board of Trustees. The procedures have been designed to ensure that these interfund transactions, which generally do not incur broker commissions, are effected at current market prices. Interfund trades are included within the respective purchases and sales amounts shown.
6. BANK BORROWINGS
The Trust (excluding the money market funds and certain other funds) and Wells Fargo Variable Trust are parties to a $200,000,000 revolving credit agreement whereby the Fund is permitted to use bank borrowings for temporary or emergency purposes, such as to fund shareholder redemption requests. Interest under the credit agreement is charged
| | | | |
| 28 | | Wells Fargo Omega Growth Fund | | Notes to financial statements |
to the Fund based on a borrowing rate equal to the higher of the Federal Funds rate in effect on that day plus 1.25% or the overnight LIBOR rate in effect on that day plus 1.25%. In addition, an annual commitment fee equal to 0.20% of the unused balance is allocated to each participating fund. Prior to September 1, 2015, the revolving credit agreement amount was $150,000,000 and the annual commitment fee was equal to 0.10% of the unused balance which was allocated to each participating fund.
For the year ended July 31, 2016, there were no borrowings by the Fund under the agreement.
7. DISTRIBUTIONS TO SHAREHOLDERS
The tax character of distributions paid during the years ended July 31, 2016 and July 31, 2015 were as follows:
| | | | | | | | |
| | | Year ended July 31 | |
| | | 2016 | | | 2015 | |
Ordinary income | | $ | 0 | | | $ | 25,132,357 | |
Long-term capital gain | | | 75,404,529 | | | | 104,350,633 | |
As of July 31, 2016, the components of distributable earnings on a tax basis were as follows:
| | | | |
Unrealized gains | | Late-year ordinary losses deferred | | Post-October capital losses deferred |
| $183,611,453 | | $(6,480,064) | | $(5,015,077) |
8. CONCENTRATION RISK
Concentration risks result from exposure to a limited number of sectors. A fund that invests a substantial portion of its assets in any sector may be more affected by changes in that sector than would be a fund whose investments are not heavily weighted in any sector.
9. INDEMNIFICATION
Under the Trust’s organizational documents, the officers and Trustees have been granted certain indemnification rights against certain liabilities that may arise out of performance of their duties to the Trust. Additionally, in the normal course of business, the Trust may enter into contracts with service providers that contain a variety of indemnification clauses. The Trust’s maximum exposure under these arrangements is dependent on future claims that may be made against the Fund and, therefore, cannot be estimated.
| | | | | | |
| Report of independent registered public accounting firm | | Wells Fargo Omega Growth Fund | | | 29 | |
BOARD OF TRUSTEES AND SHAREHOLDERS OF WELLS FARGO FUNDS TRUST:
We have audited the accompanying statements of assets and liabilities, including the portfolio of investments, of the Wells Fargo Omega Growth Fund (formerly known as Wells Fargo Advantage Omega Growth Fund) (the “Fund”), one of the funds constituting the Wells Fargo Funds Trust, as of July 31, 2016, and the related statement of operations for the year then ended, the statements of changes in net assets for each of the years in the two-year period then ended, and the financial highlights for each of the years in the five-year period then ended. These financial statements and financial highlights are the responsibility of the Fund’s management. Our responsibility is to express an opinion on these financial statements and financial highlights based on our audits.
We conducted our audits in accordance with the standards of the Public Company Accounting Oversight Board (United States). Those standards require that we plan and perform the audit to obtain reasonable assurance about whether the financial statements and financial highlights are free of material misstatement. An audit includes examining, on a test basis, evidence supporting the amounts and disclosures in the financial statements. Our procedures included confirmation of securities owned as of July 31, 2016, by correspondence with the custodian and brokers, or by other appropriate auditing procedures. An audit also includes assessing the accounting principles used and significant estimates made by management, as well as evaluating the overall financial statement presentation. We believe that our audits provide a reasonable basis for our opinion.
In our opinion, the financial statements and financial highlights referred to above present fairly, in all material respects, the financial position of the Wells Fargo Omega Growth Fund as of July 31, 2016, the results of its operations for the year then ended, the changes in its net assets for each of the years in the two-year period then ended, and the financial highlights for each of the years in the five-year period then ended, in conformity with U.S. generally accepted accounting principles.

Boston, Massachusetts
September 23, 2016
| | | | |
| 30 | | Wells Fargo Omega Growth Fund | | Other information (unaudited) |
TAX INFORMATION
Pursuant to Section 852 of the Internal Revenue Code, $75,404,529 was designated as a 20% rate gain distribution for the fiscal year ended July 31, 2016.
PROXY VOTING INFORMATION
A description of the policies and procedures that the Fund uses to determine how to vote proxies relating to portfolio securities is available, upon request, by calling 1-800-222-8222, visiting our website at wellsfargofunds.com, or visiting the SEC website at sec.gov. Information regarding how the Fund voted proxies relating to portfolio securities during the most recent 12-month period ended June 30 is available on the Fund’s website at wellsfargofunds.com or by visiting the SEC website at sec.gov.
PORTFOLIO HOLDINGS INFORMATION
The complete portfolio holdings for the Fund are publicly available monthly on the Fund’s website (wellsfargofunds.com), on a one-month delayed basis. In addition, top ten holdings information (excluding derivative positions) for the Fund is publicly available on the Fund’s website on a monthly, seven-day or more delayed basis. The Fund files its complete schedule of portfolio holdings with the SEC for the first and third quarters of each fiscal year on Form N-Q, which is available by visiting the SEC website at sec.gov. In addition, the Fund’s Form N-Q may be reviewed and copied at the SEC’s Public Reference Room in Washington, DC, and at regional offices in New York City, at 233 Broadway, and in Chicago, at 175 West Jackson Boulevard, Suite 900. Information about the Public Reference Room may be obtained by calling 1-800-SEC-0330.
| | | | | | |
| Other information (unaudited) | | Wells Fargo Omega Growth Fund | | | 31 | |
BOARD OF TRUSTEES AND OFFICERS
Each of the Trustees and Officers1 listed in the table below acts in identical capacities for each fund in the Wells Fargo family of funds, which consists of 139 mutual funds comprising the Wells Fargo Funds Trust, Wells Fargo Variable Trust, Wells Fargo Master Trust and four closed-end funds (collectively the “Fund Complex”). This table should be read in conjunction with the Prospectus and the Statement of Additional Information2. The mailing address of each Trustee and Officer is 525 Market Street, 12th Floor, San Francisco, CA 94105. Each Trustee and Officer serves an indefinite term, however, each Trustee serves such term until reaching the mandatory retirement age established by the Trustees.
Independent Trustees
| | | | | | |
Name and year of birth | | Position held and length of service* | | Principal occupations during past five years or longer | | Current other public company or investment company directorships |
William R. Ebsworth (Born 1957) | | Trustee, since 2015 | | Retired. From 1984 to 2013, equities analyst, portfolio manager, research director and chief financial officer at Fidelity Management and Research Company in Boston, Tokyo, and Hong Kong and retired in 2013 as Chief Investment Officer of Fidelity Strategic Advisers, Inc. where he lead a team of investment professionals managing client assets. Prior thereto, Board member of Hong Kong Securities Clearing Co., Hong Kong Options Clearing Corp., the Thailand International Fund, Ltd., Fidelity Investments Life Insurance Company, and Empire Fidelity Investments Life Insurance Company. Mr. Ebsworth is a CFA® charterholder and an Adjunct Lecturer, Finance, at Babson College. | | Asset Allocation Trust |
Jane A. Freeman (Born 1953) | | Trustee, since 2015 | | Retired. From 2012 to 2014 and 1999 to 2008, Chief Financial Officer of Scientific Learning Corporation. From 2008 to 2012, Ms. Freeman provided consulting services related to strategic business projects. Prior to 1999, Portfolio Manager at Rockefeller & Co. and Scudder, Stevens & Clark. Board member of the Harding Loevner Funds from 1996 to 2014, serving as both Lead Independent Director and chair of the Audit Committee. Board member of the Russell Exchange Traded Funds Trust from 2011 to 2012 and the chair of the Audit Committee. Ms. Freeman is Chair of Taproot Foundation (non-profit organization), a Board Member of Ruth Bancroft Garden (non-profit organization) and an inactive chartered financial analyst. | | Asset Allocation Trust |
Peter G. Gordon (Born 1942) | | Trustee, since 1998; Chairman, since 2005 | | Co-Founder, Retired Chairman, President and CEO of Crystal Geyser Water Company. Trustee Emeritus, Colby College. | | Asset Allocation Trust |
Isaiah Harris, Jr. (Born 1952) | | Trustee, since 2009 | | Retired. Chairman of the Board of CIGNA Corporation since 2009, and Director since 2005. From 2003 to 2011, Director of Deluxe Corporation. Prior thereto, President and CEO of BellSouth Advertising and Publishing Corp. from 2005 to 2007, President and CEO of BellSouth Enterprises from 2004 to 2005 and President of BellSouth Consumer Services from 2000 to 2003. Emeritus member of the Iowa State University Foundation Board of Governors. Emeritus Member of the Advisory Board of Iowa State University School of Business. Advisory Board Member, Palm Harbor Academy (charter school). Advisory Board Member, Child Evangelism Fellowship (non-profit). Mr. Harris is a certified public accountant (inactive status). | | CIGNA Corporation; Asset Allocation Trust |
Judith M. Johnson (Born 1949) | | Trustee, since 2008; Audit Committee Chairman, since 2008 | | Retired. Prior thereto, Chief Executive Officer and Chief Investment Officer of Minneapolis Employees Retirement Fund from 1996 to 2008. Ms. Johnson is an attorney, certified public accountant and a certified managerial accountant. | | Asset Allocation Trust |
David F. Larcker (Born 1950) | | Trustee, since 2009 | | James Irvin Miller Professor of Accounting at the Graduate School of Business, Stanford University, Director of the Corporate Governance Research Initiative and Senior Faculty of The Rock Center for Corporate Governance since 2006. From 2005 to 2008, Professor of Accounting at the Graduate School of Business, Stanford University. Prior thereto, Ernst & Young Professor of Accounting at The Wharton School, University of Pennsylvania from 1985 to 2005. | | Asset Allocation Trust |
| | | | |
| 32 | | Wells Fargo Omega Growth Fund | | Other information (unaudited) |
| | | | | | |
Name and year of birth | | Position held and length of service* | | Principal occupations during past five years or longer | | Current other public company or investment company directorships |
Olivia S. Mitchell (Born 1953) | | Trustee, since 2006 | | International Foundation of Employee Benefit Plans Professor, Wharton School of the University of Pennsylvania since 1993. Director of Wharton’s Pension Research Council and Boettner Center on Pensions & Retirement Research, and Research Associate at the National Bureau of Economic Research. Previously, Cornell University Professor from 1978 to 1993. | | Asset Allocation Trust |
Timothy J. Penny (Born 1951) | | Trustee, since 1996 | | President and Chief Executive Officer of Southern Minnesota Initiative Foundation, a non-profit organization, since 2007 and Senior Fellow at the Humphrey Institute Policy Forum at the University of Minnesota since 1995. Member of the Board of Trustees of NorthStar Education Finance, Inc., a non-profit organization, since 2007. | | Asset Allocation Trust |
Michael S. Scofield (Born 1943) | | Trustee, since 2010 | | Served on the Investment Company Institute’s Board of Governors and Executive Committee from 2008-2011 as well the Governing Council of the Independent Directors Council from 2006-2011 and the Independent Directors Council Executive Committee from 2008-2011. Chairman of the IDC from 2008-2010. Institutional Investor (Fund Directions) Trustee of Year in 2007. Trustee of the Evergreen Funds complex (and its predecessors) from 1984 to 2010. Chairman of the Evergreen Funds from 2000-2010. Former Trustee of the Mentor Funds. Retired Attorney, Law Offices of Michael S. Scofield. | | Asset Allocation Trust |
| * | Length of service dates reflect the Trustee’s commencement of service with the Trust’s predecessor entities, where applicable. |
Officers
| | | | | | |
Name and year of birth | | Position held and length of service | | Principal occupations during past five years or longer | | |
Karla M. Rabusch (Born 1959) | | President, since 2003 | | Executive Vice President of Wells Fargo Bank, N.A. and President of Wells Fargo Funds Management, LLC since 2003. | | |
Jeremy DePalma1 (Born 1974) | | Treasurer, since 2012 | | Senior Vice President of Wells Fargo Funds Management, LLC since 2009. Senior Vice President of Evergreen Investment Management Company, LLC from 2008 to 2010 and head of the Fund Reporting and Control Team within Fund Administration from 2005 to 2010. | | |
C. David Messman (Born 1960) | | Secretary, since 2000; Chief Legal Officer, since 2003 | | Senior Vice President and Secretary of Wells Fargo Funds Management, LLC since 2001. Assistant General Counsel of Wells Fargo Bank, N.A. since 2013 and Vice President and Managing Counsel of Wells Fargo Bank, N.A. from 1996 to 2013. | | |
Michael Whitaker (Born 1967) | | Chief Compliance Officer, since 2016* | | Executive Vice President of Wells Fargo Funds Management, LLC since 2016. Chief Compliance Officer of Fidelity’s Fixed Income Funds and Asset Allocation Funds from 2008 to 2016, Compliance Officer of FMR Co., Inc. from 2014 to 2016, Fidelity Investments Money Management, Inc. from 2014 to 2016, Fidelity Investments from 2007 to 2016. | | |
David Berardi
(Born 1975) | | Assistant Treasurer, since 2009 | | Vice President of Wells Fargo Funds Management, LLC since 2009. Vice President of Evergreen Investment Management Company, LLC from 2008 to 2010. Manager of Fund Reporting and Control for Evergreen Investment Management Company, LLC from 2004 to 2010. | | |
| 1 | Jeremy DePalma acts as Treasurer of 68 funds and Assistant Treasurer of 71 funds in the Fund Complex. |
| 2 | The Statement of Additional Information includes additional information about the Trustees and is available, without charge, upon request, by calling 1-800-222-8222 or by visiting the website at wellsfargofunds.com. |
| * | Michael Whitaker became Chief Compliance Officer effective May 16, 2016. |
| | | | | | |
| Other information (unaudited) | | Wells Fargo Omega Growth Fund | | | 33 | |
BOARD CONSIDERATION OF INVESTMENT MANAGEMENT AND SUB-ADVISORY AGREEMENTS:
Under the Investment Company Act of 1940 (the “1940 Act”), the Board of Trustees (the “Board”) of Wells Fargo Funds Trust (the “Trust”) must determine annually whether to approve the continuation of the Trust’s investment management and sub-advisory agreements. In this regard, at an in-person meeting held on May 24-25, 2016 (the “Meeting”), the Board, all the members of which have no direct or indirect interest in the investment management and sub-advisory agreements and are not “interested persons” of the Trust, as defined in the 1940 Act (the “Independent Trustees”), reviewed and approved for Wells Fargo Omega Growth Fund (the “Fund”): (i) an investment management agreement (the “Management Agreement”) with Wells Fargo Funds Management, LLC (“Funds Management”); and (ii) an investment sub-advisory agreement (the “Sub-Advisory Agreement”) with Wells Capital Management Incorporated (the “Sub-Adviser”), an affiliate of Funds Management. The Management Agreement and the Sub-Advisory Agreement are collectively referred to as the “Advisory Agreements.”
At the Meeting, the Board considered the factors and reached the conclusions described below relating to the selection of Funds Management and the Sub-Adviser and the approval of the Advisory Agreements. Prior to the Meeting, including at an in-person meeting in April 2016, the Trustees conferred extensively among themselves and with representatives of Funds Management about these matters. Also, the Board has adopted a team-based approach, with each team consisting of a sub-set of Trustees, to assist the full Board in the discharge of its duties in reviewing performance and other matters throughout the year. The Independent Trustees were assisted in their evaluation of the Advisory Agreements by independent legal counsel, from whom they received separate legal advice and with whom they met separately.
In providing information to the Board, Funds Management and the Sub-Adviser were guided by a detailed set of requests for information submitted to them by independent legal counsel on behalf of the Independent Trustees at the start of the Board’s annual contract renewal process earlier in 2016. In considering and approving the Advisory Agreements, the Trustees considered the information they believed relevant, including but not limited to the information discussed below. The Board considered not only the specific information presented in connection with the Meeting, but also the knowledge gained over time through interaction with Funds Management and the Sub-Adviser about various topics. In this regard, the Board reviewed reports of Funds Management at each of its quarterly meetings, which included, among other things, portfolio reviews and performance reports. In addition, the Board and the teams mentioned above confer with portfolio managers at various times throughout the year. The Board did not identify any particular information or consideration that was all-important or controlling, and each individual Trustee may have attributed different weights to various factors.
After its deliberations, the Board unanimously approved the continuation of the Advisory Agreements for a one-year term and determined that the compensation payable to Funds Management and the Sub-Adviser under each of the Advisory Agreements was reasonable. The Board considered the approval of the Advisory Agreements for the Fund as part of its consideration of agreements for funds across the complex, but its approvals were made on a fund-by-fund basis. The following summarizes a number of important, but not necessarily all, factors considered by the Board in support of its approvals.
Nature, extent and quality of services
The Board received and considered various information regarding the nature, extent and quality of services provided to the Fund by Funds Management and the Sub-Adviser under the Advisory Agreements. This information included a description of the investment advisory services and Fund-level administrative services covered by the Management Agreement, as well as, among other things, a summary of the background and experience of senior management of Funds Management, and the qualifications, background, tenure and responsibilities of each of the portfolio managers primarily responsible for the day-to-day portfolio management of the Fund.
The Board evaluated the ability of Funds Management and the Sub-Adviser to attract and retain qualified investment professionals, including research, advisory and supervisory personnel. The Board further considered the compliance programs and compliance records of Funds Management and the Sub-Adviser. In addition, the Board took into account the full range of services provided to the Fund by Funds Management and its affiliates.
Fund performance and expenses
The Board considered the performance results for the Fund over various time periods ended December 31, 2015. The Board considered these results in comparison to the performance of funds in a universe that was determined by Broadridge Inc. (“Broadridge”) to be similar to the Fund (the “Universe”), and in comparison to the Fund’s benchmark index and to other comparative data. Broadridge is an independent provider of investment company data. The Board received a description of the methodology used by Broadridge to select the mutual funds in the performance
| | | | |
| 34 | | Wells Fargo Omega Growth Fund | | Other information (unaudited) |
Universe. The Board noted that the performance of the Fund (Administrator Class) was lower than the average performance of the Universe for all periods under review except the five- and ten-year periods under review. The Board also noted that the performance of the Fund was lower than its benchmark, the Russell 3000® Growth Index, for all periods under review except the ten-year period.
The Board received information concerning, and discussed factors contributing to, the underperformance of the Fund relative to the Universe and benchmark for the periods noted above. The Board took note of the explanations for the relative underperformance in these periods, including with respect to market factors and investment decisions that affected the Fund’s performance and of longer term outperformance.
The Board also received and considered information regarding the Fund’s net operating expense ratios and their various components, including actual management fees, custodian and other non-management fees, and Rule 12b-1 and non-Rule 12b-1 shareholder service fees. The Board considered these ratios in comparison to the median ratios of funds in class-specific expense groups that were determined by Broadridge to be similar to the Fund (the “Groups”). The Board received a description of the methodology used by Broadridge to select the mutual funds in the expense Groups and an explanation of how funds comprising expense groups and their expense ratios may vary from year-to-year. Based on the Broadridge reports, the Board noted that the net operating expense ratios of the Fund were lower than or in range of the median net operating expense ratios of the expense Groups.
The Board took into account the Fund performance and expense information provided to it among the factors considered in deciding to re-approve the Advisory Agreements.
Investment management and sub-advisory fee rates
The Board reviewed and considered the contractual fee rates payable by the Fund to Funds Management under the Management Agreement, as well as the contractual fee rates payable by the Fund to Funds Management for class-level administrative services under a Class-Level Administration Agreement, which include class-level transfer agency and sub-transfer agency costs (collectively, the “Management Rates”). The Board also reviewed and considered the contractual investment sub-advisory fee rates that are payable by Funds Management to the Sub-Adviser for investment sub-advisory services.
Among other information reviewed by the Board was a comparison of the Fund’s Management Rates with the average contractual investment management fee rates of funds in the expense Groups at a common asset level as well as transfer agency costs of the funds in the expense Groups. The Board noted that the Management Rates of the Fund were in range of the sum of these average rates for the Fund’s expense Groups for all share classes.
The Board also received and considered information about the portion of the total management fee that was retained by Funds Management after payment of the fee to the Sub-Adviser for sub-advisory services. In assessing the reasonableness of this amount, the Board received and evaluated information about the nature and extent of responsibilities retained and risks assumed by Funds Management and not delegated to or assumed by the Sub-Adviser, and about Funds Management’s on-going oversight services. However, given the affiliation between Funds Management and the Sub-Adviser, the Board ascribed limited relevance to the allocation of fees between them.
The Board also received and considered information about the nature and extent of services offered and fee rates charged by Funds Management and the Sub-Adviser to other types of clients with investment strategies similar to those of the Fund. In this regard, the Board received information about the significantly greater scope of services, and compliance, reporting and other legal burdens and risks of managing mutual funds compared with those associated with managing assets of non-mutual fund clients such as collective funds or institutional separate accounts.
Based on its consideration of the factors and information it deemed relevant, including those described here, the Board determined that the compensation payable to Funds Management under the Management Agreement and to the Sub-Adviser under the Sub-Advisory Agreement was reasonable, in light of the services covered by the Advisory Agreements.
Profitability
The Board received and considered information concerning the profitability of Funds Management, as well as the profitability of Wells Fargo as a whole, from providing services to the Fund and the fund family as a whole. The Board also received and considered information concerning the profitability of the Sub-Adviser from providing services to the fund family as a whole, noting that the Sub-Adviser’s profitability information with respect to providing services to the Fund was subsumed in the Wells Fargo and Funds Management profitability analysis.
Funds Management reported on the methodologies and estimates used in calculating profitability. Among other things, the Board noted that the levels of profitability reported on a fund-by-fund basis varied widely, depending on factors such
| | | | | | |
| Other information (unaudited) | | Wells Fargo Omega Growth Fund | | | 35 | |
as the size and type of fund. Based on its review, the Board did not deem the profits reported by Funds Management or Wells Fargo from its services to the Fund to be at a level that would prevent it from approving the continuation of the Advisory Agreements.
Economies of scale
With respect to possible economies of scale, the Board noted the existence of breakpoints in the Fund’s management fee structure, which operate generally to reduce the Fund’s expense ratios as the Fund grows in size. It considered that, for a small fund or a fund that shrinks in size, breakpoints conversely can result in higher fee levels. The Board also considered that fee waiver and expense reimbursement arrangements and competitive fee rates at the outset are means of sharing potential economies of scale with shareholders of the Fund and the fund family as a whole. The Board considered Funds Management’s view that any analyses of potential economies of scale in managing a particular fund are inherently limited in light of the joint and common costs and investments that Funds Management incurs across the fund family as a whole.
The Board concluded that the Fund’s fee and expense arrangements, including contractual breakpoints, constituted a reasonable approach to sharing potential economies of scale with the Fund and its shareholders.
Other benefits to Funds Management and the Sub-Adviser
The Board received and considered information regarding potential “fall-out” or ancillary benefits received by Funds Management and its affiliates, including the Sub-Adviser, as a result of their relationships with the Fund. Ancillary benefits could include, among others, benefits directly attributable to other relationships with the Fund and benefits potentially derived from an increase in Funds Management’s and the Sub-Adviser’s business as a result of their relationships with the Fund. The Board noted that various affiliates of Funds Management may receive distribution-related fees, shareholder servicing payments and sub-transfer agency fees in respect of shares sold or held through them and services provided.
The Board also reviewed information about soft dollar credits earned and utilized by the Sub-Adviser, fees earned by Funds Management and the Sub-Adviser from managing a private investment vehicle for the fund family’s securities lending collateral and commissions earned by an affiliated broker from portfolio transactions.
Based on its consideration of the factors and information it deemed relevant, including those described here, the Board did not find that any ancillary benefits received by Funds Management and its affiliates, including the Sub-Adviser, were unreasonable.
Conclusion
At the Meeting, after considering the above-described factors and based on its deliberations and its evaluation of the information described above, the Board unanimously approved the continuation of the Advisory Agreements for a one-year term and determined that the compensation payable to Funds Management and the Sub-Adviser under each of the Advisory Agreements was reasonable.
| | | | |
| 36 | | Wells Fargo Omega Growth Fund | | List of abbreviations |
The following is a list of common abbreviations for terms and entities that may have appeared in this report.
| ACA | — ACA Financial Guaranty Corporation |
| ADR | — American depositary receipt |
| ADS | — American depositary shares |
| AGC | — Assured Guaranty Corporation |
| AGM | — Assured Guaranty Municipal |
| Ambac | — Ambac Financial Group Incorporated |
| AMT | — Alternative minimum tax |
| BAN | — Bond anticipation notes |
| BHAC | — Berkshire Hathaway Assurance Corporation |
| CAB | — Capital appreciation bond |
| CCAB | — Convertible capital appreciation bond |
| CDA | — Community Development Authority |
| CDO | — Collateralized debt obligation |
| DRIVER | — Derivative inverse tax-exempt receipts |
| DW&P | — Department of Water & Power |
| DWR | — Department of Water Resources |
| ECFA | — Educational & Cultural Facilities Authority |
| EDA | — Economic Development Authority |
| EDFA | — Economic Development Finance Authority |
| ETF | — Exchange-traded fund |
| FDIC | — Federal Deposit Insurance Corporation |
| FFCB | — Federal Farm Credit Banks |
| FGIC | — Financial Guaranty Insurance Corporation |
| FHA | — Federal Housing Administration |
| FHLB | — Federal Home Loan Bank |
| FHLMC | — Federal Home Loan Mortgage Corporation |
| FICO | — The Financing Corporation |
| FNMA | — Federal National Mortgage Association |
| GDR | — Global depositary receipt |
| GNMA | — Government National Mortgage Association |
| HCFR | — Healthcare facilities revenue |
| HEFA | — Health & Educational Facilities Authority |
| HEFAR | — Higher education facilities authority revenue |
| HFA | — Housing Finance Authority |
| HFFA | — Health Facilities Financing Authority |
| HUD | — Department of Housing and Urban Development |
| IDA | — Industrial Development Authority |
| IDAG | — Industrial Development Agency |
| KRW | — Republic of Korea won |
| LIBOR | — London Interbank Offered Rate |
| LIFER | — Long Inverse Floating Exempt Receipts |
| LLC | — Limited liability company |
| LLLP | — Limited liability limited partnership |
| LLP | — Limited liability partnership |
| MBIA | — Municipal Bond Insurance Association |
| MFHR | — Multifamily housing revenue |
| MSTR | — Municipal securities trust receipts |
| MUD | — Municipal Utility District |
| National | — National Public Finance Guarantee Corporation |
| PCFA | — Pollution Control Financing Authority |
| PCL | — Public Company Limited |
| PCR | — Pollution control revenue |
| PFA | — Public Finance Authority |
| PFFA | — Public Facilities Financing Authority |
| PFOTER | — Puttable floating option tax-exempt receipts |
| plc | — Public limited company |
| PUTTER | — Puttable tax-exempt receipts |
| R&D | — Research & development |
| Radian | — Radian Asset Assurance |
| RAN | — Revenue anticipation notes |
| RDA | — Redevelopment Authority |
| RDFA | — Redevelopment Finance Authority |
| REIT | — Real estate investment trust |
| ROC | — Reset option certificates |
| SAVRS | — Select auction variable rate securities |
| SBA | — Small Business Authority |
| SDR | — Swedish depositary receipt |
| SFHR | — Single-family housing revenue |
| SFMR | — Single-family mortgage revenue |
| SPA | — Standby purchase agreement |
| SPDR | — Standard & Poor’s Depositary Receipts |
| SPEAR | — Short Puttable Exempt Adjustable Receipts |
| STRIPS | — Separate trading of registered interest and |
| TAN | — Tax anticipation notes |
| TIPS | — Treasury inflation-protected securities |
| TRAN | — Tax revenue anticipation notes |
| TTFA | — Transportation Trust Fund Authority |
| TVA | — Tennessee Valley Authority |

For more information
More information about Wells Fargo Funds is available free upon request. To obtain literature, please write, email, visit the Fund’s website, or call:
Wells Fargo Funds
P.O. Box 8266
Boston, MA 02266-8266
Email: fundservice@wellsfargo.com
Website: wellsfargofunds.com
Individual investors: 1-800-222-8222
Retail investment professionals: 1-888-877-9275
Institutional investment professionals: 1-866-765-0778
This report and the financial statements contained herein are submitted for the general information of the shareholders of the Fund. If this report is used for promotional purposes, distribution of the report must be accompanied or preceded by a current prospectus. Before investing, please consider the investment objectives, risks, charges, and expenses of the investment. For a current prospectus and, if available, a summary prospectus, containing this information, call 1-800-222-8222 or visit the Fund’s website at wellsfargofunds.com. Read the prospectus carefully before you invest or send money.
Wells Fargo Asset Management (WFAM) is a trade name used by the asset management businesses of Wells Fargo & Company. Wells Fargo Funds Management, LLC, a wholly owned subsidiary of Wells Fargo & Company, provides investment advisory and administrative services for Wells Fargo Funds. Other affiliates of Wells Fargo & Company provide subadvisory and other services for the funds. The funds are distributed by Wells Fargo Funds Distributor, LLC, Member FINRA, an affiliate of Wells Fargo & Company.
NOT FDIC INSURED ¡ NO BANK GUARANTEE ¡ MAY LOSE VALUE
© 2016 Wells Fargo Funds Management, LLC. All rights reserved.
| | |
 | | 245328 09-16 A211/AR211 07-16 |
Annual Report
July 31, 2016

Wells Fargo
Premier Large Company Growth Fund


Reduce clutter. Save trees.
Sign up for electronic delivery of prospectuses and shareholder reports at wellsfargo.com/advantagedelivery
Contents
The views expressed and any forward-looking statements are as of July 31, 2016, unless otherwise noted, and are those of the Fund managers and/or Wells Fargo Funds Management, LLC. Discussions of individual securities, or the markets generally, or any Wells Fargo Fund are not intended as individual recommendations. Future events or results may vary significantly from those expressed in any forward-looking statements. The views expressed are subject to change at any time in response to changing circumstances in the market. Wells Fargo Funds Management, LLC and the Fund disclaim any obligation to publicly update or revise any views expressed or forward-looking statements.
NOT FDIC INSURED ¡ NO BANK GUARANTEE ¡ MAY LOSE VALUE
| | | | |
| 2 | | Wells Fargo Premier Large Company Growth Fund | | Letter to shareholders (unaudited) |

Karla M. Rabusch
President
Wells Fargo Funds
Despite significant market fluctuations over the course of the year, U.S. stocks delivered positive results overall for the 12-month reporting period
Dear Valued Shareholder:
We are pleased to offer you this annual report for the Wells Fargo Premier Large Company Growth Fund for the 12-month period that ended July 31, 2016. During this period, which began August 1, 2015, U.S. and international stock markets experienced heightened volatility, with intermittent rebounds interspersed with sell-offs. The U.S. economy displayed resilience throughout the period, although growth was somewhat sluggish amid ongoing pressures that included slowing growth in China, a strengthening U.S. dollar, and uncertainty regarding interest-rate increases by the U.S. Federal Reserve (Fed); international economies faced deeper ongoing challenges. During June 2016, global markets became especially volatile as the U.K.’s vote over whether to leave the European Union (E.U.) approached. However, markets began recovering shortly after the U.K. voted to leave and rallied through July. Despite significant market fluctuations over the course of the year, U.S. stocks delivered positive results overall for the 12-month reporting period, as measured by the Russell 1000® Index.1 International markets generally declined as measured by the Morgan Stanley Capital International (MSCI) Europe, Australasia, Far East (EAFE) Index.2
In the third quarter of 2015, China’s slowdown took a toll on economies and markets worldwide.
U.S. stocks sagged during the quarter, experiencing the most volatility since 2011. Economic data released during the quarter suggested the U.S. economy remained solid but had lost some steam, burdened by the drag of the U.S. dollar’s strength coupled with global economic turmoil. The fact that the Fed left the federal funds interest rate unchanged at its September 2015 meeting surprised investors and fueled increased uncertainty about the U.S. economy’s stamina to remain healthy while facing the challenges of slowing in growth China and troubles elsewhere in the world. Outside the U.S., markets were even more volatile and delivered generally weaker quarterly results, also largely due to investors’ increasing anxiety over China’s weakened economy.
Despite ongoing concerns, U.S. stocks generally rose in the fourth quarter of 2015; international markets lagged.
While the broad U.S. stock market bounced back in the quarter, stock markets outside the U.S. failed to keep pace as economic concerns, including China’s ongoing slowdown, continued to affect many countries. U.S. economic data released during the quarter indicated the economy remained solid, although the strong U.S. dollar and weakness in international economies remained headwinds. In December, the Fed, as expected, raised its target interest rate by 25 basis points (bps; 100 bps equals 1.00%) after keeping it near zero for seven years. The move reflected confidence in the U.S. economy’s ability to stay healthy with less central-bank support. The Fed also clarified that future interest-rate increases would be gradual.
| 1 | The Russell 1000® Index measures the performance of the 1,000 largest companies in the Russell 3000® Index, which represents approximately 92% of the total market capitalization of the Russell 3000® Index. You cannot invest directly in an index. |
| 2 | Morgan Stanley Capital International (MSCI) Europe, Australasia, Far East (EAFE) Index is a free-float-adjusted market-capitalization-weighted index that is designed to measure the equity market performance of developed markets, excluding the United States and Canada. The MSCI EAFE Index consists of the following 21 developed markets country indexes: Australia, Austria, Belgium, Denmark, Finland, France, Germany, Hong Kong, Ireland, Israel, Italy, Japan, the Netherlands, New Zealand, Norway, Portugal, Singapore, Spain, Sweden, Switzerland, and the United Kingdom. You cannot invest directly in an index. |
| | | | | | |
| Letter to shareholders (unaudited) | | Wells Fargo Premier Large Company Growth Fund | | | 3 | |
In the first quarter of 2016, market volatility increased globally amid ongoing concerns.
Stock markets worldwide fluctuated widely in the first quarter of 2016. Most sold off sharply in the first six weeks of the year on concerns such as weak global growth, falling commodity prices, and uncertainty over the timing and impact of the Fed’s interest-rate increases. As the quarter progressed, fears abated somewhat and global markets generally rallied back. The U.S. economy ended the quarter on a positive note as much of the quarter’s data reflected resiliency. With ongoing uncertainties about global growth and financial markets, however, the Fed held off from raising the target interest rate during the quarter. Outside the U.S., the eurozone fell into deflation in February; in response, the European Central Bank announced an expansion of its stimulus program. In China, the government in March set a growth rate of 6.5% to 7.0% for 2016, an acknowledgment of weakening growth. In emerging markets, although central-bank stimulus and improved prices for oil and other commodities led to stock-market rallies in the quarter, many of these countries’ economies face credit downgrades due to challenges such as the likelihood of a stronger U.S. dollar, which would make dollar-denominated debt more expensive.
Worries over interest rates and the U.K.’s vote largely drove the markets during the second quarter of 2016.
U.S. stocks began the quarter in positive territory but started to lose steam in early May on worries that a possible June interest-rate increase by the Fed could hurt the market. In mid-May, stocks briefly plunged following comments by Fed officials noting that a June interest-rate increase remained on the table. But once investors had processed this information, stocks again rallied, finishing up for the month. The first three weeks of June brought heightened volatility, spurred largely by a disappointing jobs report and uncertainty over whether the U.K. would remain in the E.U. The U.K.’s Brexit vote on June 23 shocked countries in Europe and much of the rest of the world. Stock markets plummeted as investors worried that the U.K.’s departure from the E.U. would slow global growth and prolong the low-interest-rate environment. Following the initial rout, however, U.S. stocks rallied as investors seemed to decide that any negative effects would be more localized and not create a serious risk for global growth. By quarter-end, the broad U.S. stock market had moved back into positive territory.
Stocks generally posted positive results for July 2016.
U.S. stocks displayed the most momentum during the first two weeks of the month, buoyed partly by an unexpectedly favorable June jobs report that helped strengthen confidence in the U.S. economy. Also, investors perhaps felt that global central banks could extend stimulus measures in the wake of the Brexit vote. Although U.S. market momentum slowed during the second half of July, stocks ended in positive territory for the month. International stocks delivered positive monthly results as well.
| | | | |
| 4 | | Wells Fargo Premier Large Company Growth Fund | | Letter to shareholders (unaudited) |
Don’t let short-term uncertainty derail long-term investment goals.
Periods of uncertainty can present challenges, but experience has taught us that maintaining long-term investment goals can be an effective way to plan for the future. To help you create a sound strategy based on your personal goals and risk tolerance, Wells Fargo Funds offers more than 100 mutual funds spanning a wide range of asset classes and investment styles. Although diversification cannot guarantee an investment profit or prevent losses, we believe it can be an effective way to manage investment risk and potentially smooth out overall portfolio performance. We encourage investors to know their investments and to understand that appropriate levels of risk-taking may unlock opportunities.
Thank you for choosing to invest in Wells Fargo Funds. We appreciate your confidence in us and remain committed to helping you meet your financial needs.
Sincerely,

Karla M. Rabusch
President
Wells Fargo Funds
Although diversification cannot guarantee an investment profit or prevent losses, we believe it can be an effective way to manage investment risk and potentially smooth out overall portfolio performance.
For further information about your Fund, contact your investment professional, visit our website at wellsfargofunds.com, or call us directly at 1-800-222-8222. We are available 24 hours a day, 7 days a week.
This page is intentionally left blank.
| | | | |
| 6 | | Wells Fargo Premier Large Company Growth Fund | | Performance highlights (unaudited) |
Investment objective
The Fund seeks long-term capital appreciation.
Manager
Wells Fargo Funds Management, LLC
Subadviser
Wells Capital Management Incorporated
Portfolio managers
Joseph M. Eberhardy, CFA®, CPA
Thomas C. Ognar, CFA®
Bruce C. Olson, CFA®
Average annual total returns (%) as of July 31, 20161
| | | | | | | | | | | | | | | | | | | | | | | | | | | | | | | | | | |
| | | | | Including sales charge | | | Excluding sales charge | | | Expense ratios2 (%) | |
| | | Inception date | | 1 year | | | 5 year | | | 10 year | | | 1 year | | | 5 year | | | 10 year | | | Gross | | | Net3 | |
| Class A (EKJAX) | | 1-20-1998 | | | (8.77 | ) | | | 9.37 | | | | 9.21 | | | | (3.22 | ) | | | 10.67 | | | | 9.87 | | | | 1.11 | | | | 1.11 | |
| Class B (EKJBX)* | | 9-11-1935 | | | (8.35 | ) | | | 9.56 | | | | 9.30 | | | | (3.92 | ) | | | 9.83 | | | | 9.30 | | | | 1.86 | | | | 1.86 | |
| Class C (EKJCX) | | 1-22-1998 | | | (4.92 | ) | | | 9.84 | | | | 9.05 | | | | (3.92 | ) | | | 9.84 | | | | 9.05 | | | | 1.86 | | | | 1.86 | |
| Class R4 (EKJRX) | | 11-30-2012 | | | – | | | | – | | | | – | | | | (2.91 | ) | | | 11.03 | | | | 10.20 | | | | 0.83 | | | | 0.80 | |
| Class R6 (EKJFX) | | 11-30-2012 | | | – | | | | – | | | | – | | | | (2.78 | ) | | | 11.15 | | | | 10.27 | | | | 0.68 | | | | 0.65 | |
| Administrator Class (WFPDX) | | 7-16-2010 | | | – | | | | – | | | | – | | | | (3.13 | ) | | | 10.84 | | | | 10.00 | | | | 1.03 | | | | 1.00 | |
| Institutional Class (EKJYX) | | 6-30-1999 | | | – | | | | – | | | | – | | | | (2.85 | ) | | | 11.12 | | | | 10.25 | | | | 0.78 | | | | 0.70 | |
| Russell 1000® Growth Index4 | | – | | | – | | | | – | | | | – | | | | 4.35 | | | | 13.62 | | | | 9.50 | | | | – | | | | – | |
| * | | Class B shares are closed to investment, except in connection with the reinvestment of any distributions and permitted exchanges. |
Figures quoted represent past performance, which is no guarantee of future results, and do not reflect taxes that a shareholder may pay on fund distributions or the redemption of fund shares. Investment return and principal value of an investment will fluctuate so that an investor’s shares, when redeemed, may be worth more or less than their original cost. Performance shown without sales charges would be lower if sales charges were reflected. Current performance may be lower or higher than the performance data quoted, which assumes the reinvestment of dividends and capital gains. Current month-end performance is available on the Fund’s website, wellsfargofunds.com.
Index returns do not include transaction costs associated with buying and selling securities, any mutual fund fees or expenses, or any taxes. It is not possible to invest directly in an index.
For Class A shares, the maximum front-end sales charge is 5.75%. For Class B shares, the maximum contingent deferred sales charge is 5.00%. For Class C shares, the maximum contingent deferred sales charge is 1.00%. Performance including a contingent deferred sales charge assumes the sales charge for the corresponding time period. Class R4, Class R6, Administrator Class, and Institutional Class shares are sold without a front-end sales charge or contingent deferred sales charge.
Stock values fluctuate in response to the activities of individual companies and general market and economic conditions. Certain investment strategies tend to increase the total risk of an investment (relative to the broader market). The Fund is exposed to foreign investment risk. Consult the Fund’s prospectus for additional information on these and other risks.
Please see footnotes on page 7.
| | | | | | |
| Performance highlights (unaudited) | | Wells Fargo Premier Large Company Growth Fund | | | 7 | |
|
| Growth of $10,000 investment as of July 31, 20165 |
|
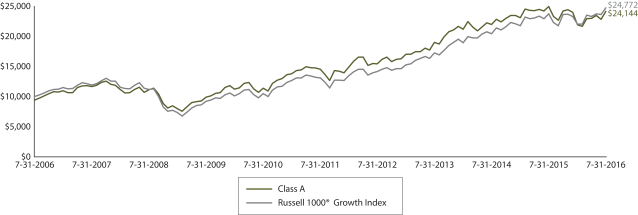 |
| 1 | Historical performance shown for Class R4 shares prior to their inception reflects the performance of Institutional Class shares, adjusted to reflect the higher expenses applicable to Class R4 shares. Historical performance shown for Class R6 shares prior to their inception reflects the performance of Institutional Class shares, and includes the higher expenses applicable to Institutional Class shares. If these expenses had not been included, returns would be higher. Historical performance shown for Administrator Class shares prior to their inception reflects the performance of Institutional Class shares, adjusted to reflect the higher expenses applicable to Administrator Class shares. Historical performance shown for all classes of the Fund prior to July 19, 2010, is based on the performance of the Fund’s predecessor, Evergreen Large Company Growth Fund. |
| 2 | Reflects the expense ratios as stated in the most recent prospectuses. The expense ratios shown are subject to change and may differ from the annualized expense ratios shown in the financial highlights of this report. |
| 3 | The manager has contractually committed through November 30, 2016, to waive fees and/or reimburse expenses to the extent necessary to cap the Fund’s Total Annual Fund Operating Expenses After Fee Waiver at the amounts shown. After this time, the cap may be increased or the commitment to maintain the cap may be terminated only with the approval of the Board of Trustees. Brokerage commissions, stamp duty fees, interest, taxes, acquired fund fees and expenses, and extraordinary expenses are excluded from the expense cap. Without this cap, the Fund’s returns would have been lower. |
| 4 | The Russell 1000® Growth Index measures the performance of those Russell 1000 companies with higher price-to-book ratios and higher forecasted growth values. You cannot invest directly in an index. |
| 5 | The chart compares the performance of Class A shares for the most recent ten years with the Russell 1000® Growth Index. The chart assumes a hypothetical investment of $10,000 in Class A shares and reflects all operating expenses and assumes the maximum initial sales charge of 5.75%. |
| 6 | The ten largest holdings, excluding cash and cash equivalents, are calculated based on the value of the investments divided by total net assets of the Fund. Holdings are subject to change and may have changed since the date specified. |
| 7 | Amounts are calculated based on the total long-term investments of the Fund. These amounts are subject to change and may have changed since the date specified. |
| | | | |
| 8 | | Wells Fargo Premier Large Company Growth Fund | | Performance highlights (unaudited) |
MANAGER’S DISCUSSION
Fund highlights
| n | | The Fund underperformed its benchmark, the Russell 1000® Growth Index, for the 12-month period that ended July 31, 2016. |
| n | | Holdings within the health care and information technology (IT) sectors contributed to the Fund’s underperformance for the period. An underweight to slower-growing stocks in the consumer staples sector also detracted from results as investors sought higher-yielding stocks. |
| n | | The market environment often was influenced by investor sentiment rather than by fundamentals during the period, which presented a general challenge for our emphasis on adding value through bottom-up stock selection. |
The ongoing low-interest-rate environment drove investors’ demand for dividend yield, hindering Fund results.
Faced with the prospect of historically low interest rates and, in some countries, negative interest rates, investors continued to seek alternative sources of income via dividend-paying stocks. Stocks paying a dividend yield larger than 2% contributed disproportionately to the total return of the Russell 1000® Growth Index for the period. Due to its focus on faster-growing stocks, the Fund tends to be significantly underweight dividend-paying stocks compared with the index; this characteristic significantly contributed to the Fund’s underperformance for the period. While investors’ preference for dividend yield challenged our investment process at times during the period, it also led to historically attractive relative valuations for faster-growing stocks, which could bode well for future Fund performance.
| | | | |
| Ten largest holdings (%) as of July 31, 20166 | |
Facebook Incorporated Class A | | | 5.50 | |
Alphabet Incorporated Class A | | | 4.60 | |
Amazon.com Incorporated | | | 4.41 | |
Visa Incorporated Class A | | | 2.87 | |
Microchip Technology Incorporated | | | 2.76 | |
Microsoft Corporation | | | 2.42 | |
Dollar Tree Incorporated | | | 2.33 | |
MasterCard Incorporated Class A | | | 2.14 | |
Union Pacific Corporation | | | 2.09 | |
Ecolab Incorporated | | | 1.99 | |
Results from the Fund’s health care and IT holdings detracted from performance.
Within health care, biotechnology holdings detracted notably over the period. Although these companies tended to experience solid demand for existing medical solutions, their stocks suffered significant declines in the first half of 2016. Multiple factors drove the share-price weakness, including the negative effects of ongoing political rhetoric concerning potential drug-pricing controls and less-robust fundamental outlooks for several companies.
Within the IT sector, several holdings with significant market opportunities within faster-growing areas, such as cloud services, data analytics, and network security,
displayed weakness. Although these holdings generally delivered solid growth fundamentals, they experienced significant volatility as investors reacted to global economic uncertainties. At times during the period, investors preferred select mega-cap IT stocks, often at the expense of many small- and mid-cap IT companies that were actively reinvesting in their businesses to expand their market share.
Holdings within the consumer discretionary, energy, and materials sectors contributed positively to performance.
Within the consumer discretionary sector, the Fund benefited from solid performance by holdings with strong secular growth. Retail companies focused on the lower-end consumer continued to perform well as their business models tend to be more resistant to the pressures of Amazon.com, Incorporated, and other online retailers. Among the Fund’s energy holdings, exploration and production company Concho Resources Incorporated, which has fracking operations in the Permian Basin, delivered favorable results as oil prices rallied off their February 2016 lows. Within the materials sector, Airgas, Incorporated, performed well as investors rewarded companies with proven business models that offered consistent results.
Please see footnotes on page 7.
| | | | | | |
| Performance highlights (unaudited) | | Wells Fargo Premier Large Company Growth Fund | | | 9 | |
|
| Sector distribution as of July 31, 20167 |
|
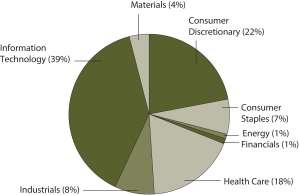 |
We continue to focus on consistently implementing our process.
Over the course of the 12-month period, we made modest adjustments to the Fund to potentially capitalize on opportunities and position for the future. Using our bottom-up research process, we added IT companies that met our criteria for robust, sustainable growth that appears underappreciated by the market. We funded these purchases primarily with the proceeds from sales of holdings in the health care and consumer discretionary sectors.
Given the abundant political and economic headlines dominating the media in the U.S. and worldwide, we expect to see continued market volatility heading into
the summer of 2016 and likely through the U.S. general election in November 2016. As this volatility occurs, we intend to take advantage of potential opportunities as the valuation gaps of the companies held within the Fund widen and contract. We maintain strong conviction for the rapidly growing companies within the portfolio; many holdings have been trading at or near multiyear-low valuations relative to the broad market. Our investment strategy—seeking robust growth companies with sustainable business models that are underappreciated by investors—should position us, going forward, to take advantage of opportunities within the market for the benefit of Fund shareholders.
Please see footnotes on page 7.
| | | | |
| 10 | | Wells Fargo Premier Large Company Growth Fund | | Fund expenses (unaudited) |
As a shareholder of the Fund, you incur two types of costs: (1) transaction costs, including sales charges (loads) on purchase payments and contingent deferred sales charges (if any) on redemptions and (2) ongoing costs, including management fees, distribution (12b-1) and/or shareholder servicing fees, and other Fund expenses. This example is intended to help you understand your ongoing costs (in dollars) of investing in the Fund and to compare these costs with the ongoing costs of investing in other mutual funds.
The example is based on an investment of $1,000 invested at the beginning of the six-month period and held for the entire period from February 1, 2016 to July 31, 2016.
Actual expenses
The “Actual” line of the table below provides information about actual account values and actual expenses. You may use the information in this line, together with the amount you invested, to estimate the expenses that you paid over the period. Simply divide your account value by $1,000 (for example, an $8,600 account value divided by $1,000 = 8.6), then multiply the result by the number in the “Actual” line under the heading entitled “Expenses paid during period” for your applicable class of shares to estimate the expenses you paid on your account during this period.
Hypothetical example for comparison purposes
The “Hypothetical” line of the table below provides information about hypothetical account values and hypothetical expenses based on the Fund’s actual expense ratio and an assumed rate of return of 5% per year before expenses, which is not the Fund’s actual return. The hypothetical account values and expenses may not be used to estimate the actual ending account balance or expenses you paid for the period. You may use this information to compare the ongoing costs of investing in the Fund and other funds. To do so, compare this 5% hypothetical example with the 5% hypothetical examples that appear in the shareholder reports of the other funds.
Please note that the expenses shown in the table are meant to highlight your ongoing costs only and do not reflect any transactional costs, such as sales charges (loads) and contingent deferred sales charges. Therefore, the “Hypothetical” line of the table is useful in comparing ongoing costs only and will not help you determine the relative total costs of owning different funds. In addition, if these transactional costs were included, your costs would have been higher.
| | | | | | | | | | | | | | | | |
| | | Beginning
account value
2-1-2016 | | | Ending
account value
7-31-2016 | | | Expenses
paid during
the period¹ | | | Annualized net
expense ratio | |
Class A | | | | | | | | | | | | | | | | |
Actual | | $ | 1,000.00 | | | $ | 1,101.28 | | | $ | 5.80 | | | | 1.11 | % |
Hypothetical (5% return before expenses) | | $ | 1,000.00 | | | $ | 1,019.34 | | | $ | 5.57 | | | | 1.11 | % |
Class B | | | | | | | | | | | | | | | | |
Actual | | $ | 1,000.00 | | | $ | 1,096.97 | | | $ | 9.69 | | | | 1.86 | % |
Hypothetical (5% return before expenses) | | $ | 1,000.00 | | | $ | 1,015.62 | | | $ | 9.32 | | | | 1.86 | % |
Class C | | | | | | | | | | | | | | | | |
Actual | | $ | 1,000.00 | | | $ | 1,097.22 | | | $ | 9.70 | | | | 1.86 | % |
Hypothetical (5% return before expenses) | | $ | 1,000.00 | | | $ | 1,015.61 | | | $ | 9.32 | | | | 1.86 | % |
Class R4 | | | | | | | | | | | | | | | | |
Actual | | $ | 1,000.00 | | | $ | 1,102.94 | | | $ | 4.18 | | | | 0.80 | % |
Hypothetical (5% return before expenses) | | $ | 1,000.00 | | | $ | 1,020.89 | | | $ | 4.02 | | | | 0.80 | % |
Class R6 | | | | | | | | | | | | | | | | |
Actual | | $ | 1,000.00 | | | $ | 1,103.95 | | | $ | 3.40 | | | | 0.65 | % |
Hypothetical (5% return before expenses) | | $ | 1,000.00 | | | $ | 1,021.63 | | | $ | 3.27 | | | | 0.65 | % |
Administrator Class | | | | | | | | | | | | | | | | |
Actual | | $ | 1,000.00 | | | $ | 1,101.86 | | | $ | 5.23 | | | | 1.00 | % |
Hypothetical (5% return before expenses) | | $ | 1,000.00 | | | $ | 1,019.89 | | | $ | 5.02 | | | | 1.00 | % |
Institutional Class | | | | | | | | | | | | | | | | |
Actual | | $ | 1,000.00 | | | $ | 1,103.30 | | | $ | 3.66 | | | | 0.70 | % |
Hypothetical (5% return before expenses) | | $ | 1,000.00 | | | $ | 1,021.38 | | | $ | 3.52 | | | | 0.70 | % |
| 1 | Expenses paid is equal to the annualized net expense ratio of each class multiplied by the average account value over the period, multiplied by the number of days in the most recent fiscal half-year divided by the number of days in the fiscal year (to reflect the one-half-year period). |
| | | | | | |
| Portfolio of investments—July 31, 2016 | | Wells Fargo Premier Large Company Growth Fund | | | 11 | |
| | | | | | | | | | | | | | | | |
| Security name | | | | | | | | Shares | | | Value | |
| | | | |
Common Stocks: 95.78% | | | | | | | | | | | | | | | | |
| | | | |
Consumer Discretionary: 21.19% | | | | | | | | | | | | | | | | |
| | | | |
| Auto Components: 0.28% | | | | | | | | | | | | | | | | |
Delphi Automotive plc | | | | | | | | | | | 147,660 | | | $ | 10,014,301 | |
| | | | | | | | | | | | | | | | |
| | | | |
| Distributors: 1.52% | | | | | | | | | | | | | | | | |
LKQ Corporation † | | | | | | | | | | | 1,577,210 | | | | 54,240,252 | |
| | | | | | | | | | | | | | | | |
| | | | |
| Hotels, Restaurants & Leisure: 1.87% | | | | | | | | | | | | | | | | |
Starbucks Corporation | | | | | | | | | | | 1,150,170 | | | | 66,767,369 | |
| | | | | | | | | | | | | | | | |
| | | | |
| Internet & Catalog Retail: 4.41% | | | | | | | | | | | | | | | | |
Amazon.com Incorporated † | | | | | | | | | | | 207,580 | | | | 157,513,780 | |
| | | | | | | | | | | | | | | | |
| | | | |
| Media: 1.01% | | | | | | | | | | | | | | | | |
The Walt Disney Company | | | | | | | | | | | 374,080 | | | | 35,892,976 | |
| | | | | | | | | | | | | | | | |
| | | | |
| Multiline Retail: 3.77% | | | | | | | | | | | | | | | | |
Dollar General Corporation | | | | | | | | | | | 541,900 | | | | 51,339,606 | |
Dollar Tree Incorporated † | | | | | | | | | | | 865,130 | | | | 83,303,368 | |
| | | | |
| | | | | | | | | | | | | | | 134,642,974 | |
| | | | | | | | | | | | | | | | |
| | | | |
| Specialty Retail: 6.37% | | | | | | | | | | | | | | | | |
CarMax Incorporated †« | | | | | | | | | | | 80,230 | | | | 4,674,200 | |
O’Reilly Automotive Incorporated † | | | | | | | | | | | 121,680 | | | | 35,363,858 | |
The Home Depot Incorporated | | | | | | | | | | | 486,840 | | | | 67,300,762 | |
The TJX Companies Incorporated | | | | | | | | | | | 629,470 | | | | 51,440,288 | |
Tractor Supply Company | | | | | | | | | | | 749,950 | | | | 68,732,918 | |
| | | | |
| | | | | | | | | | | | | | | 227,512,026 | |
| | | | | | | | | | | | | | | | |
| | | | |
| Textiles, Apparel & Luxury Goods: 1.96% | | | | | | | | | | | | | | | | |
Nike Incorporated Class B | | | | | | | | | | | 501,190 | | | | 27,816,045 | |
Under Armour Incorporated Class A †« | | | | | | | | | | | 424,190 | | | | 16,738,537 | |
Under Armour Incorporated Class C † | | | | | | | | | | | 441,980 | | | | 15,778,686 | |
VF Corporation | | | | | | | | | | | 151,260 | | | | 9,443,162 | |
| | | | |
| | | | | | | | | | | | | | | 69,776,430 | |
| | | | | | | | | | | | | | | | |
| | | | |
Consumer Staples: 6.35% | | | | | | | | | | | | | | | | |
| | | | |
| Beverages: 2.01% | | | | | | | | | | | | | | | | |
Constellation Brands Incorporated Class A | | | | | | | | | | | 172,730 | | | | 28,436,540 | |
The Coca-Cola Company | | | | | | | | | | | 997,400 | | | | 43,516,562 | |
| | | | |
| | | | | | | | | | | | | | | 71,953,102 | |
| | | | | | | | | | | | | | | | |
| | | | |
| Food & Staples Retailing: 2.96% | | | | | | | | | | | | | | | | |
Costco Wholesale Corporation | | | | | | | | | | | 311,490 | | | | 52,087,358 | |
CVS Health Corporation | | | | | | | | | | | 349,430 | | | | 32,399,150 | |
Sprouts Farmers Market Incorporated † | | | | | | | | | | | 915,222 | | | | 21,169,085 | |
| | | | |
| | | | | | | | | | | | | | | 105,655,593 | |
| | | | | | | | | | | | | | | | |
The accompanying notes are an integral part of these financial statements.
| | | | |
| 12 | | Wells Fargo Premier Large Company Growth Fund | | Portfolio of investments—July 31, 2016 |
| | | | | | | | | | | | | | | | |
| Security name | | | | | | | | Shares | | | Value | |
| | | | |
| Household Products: 0.54% | | | | | | | | | | | | | | | | |
Colgate-Palmolive Company | | | | | | | | | | | 257,520 | | | $ | 19,167,214 | |
| | | | | | | | | | | | | | | | |
| | | | |
| Personal Products: 0.84% | | | | | | | | | | | | | | | | |
The Estee Lauder Companies Incorporated Class A | | | | | | | | | | | 322,110 | | | | 29,924,019 | |
| | | | | | | | | | | | | | | | |
| | | | |
Energy: 1.47% | | | | | | | | | | | | | | | | |
| | | | |
| Energy Equipment & Services: 0.45% | | | | | | | | | | | | | | | | |
Schlumberger Limited | | | | | | | | | | | 197,910 | | | | 15,935,713 | |
| | | | | | | | | | | | | | | | |
| | | | |
| Oil, Gas & Consumable Fuels: 1.02% | | | | | | | | | | | | | | | | |
Concho Resources Incorporated † | | | | | | | | | | | 292,770 | | | | 36,362,034 | |
| | | | | | | | | | | | | | | | |
| | | | |
Financials: 1.20% | | | | | | | | | | | | | | | | |
| | | | |
| Capital Markets: 0.33% | | | | | | | | | | | | | | | | |
SEI Investments Company | | | | | | | | | | | 80 | | | | 3,600 | |
TD Ameritrade Holding Corporation | | | | | | | | | | | 394,560 | | | | 11,978,842 | |
| | | | |
| | | | | | | | | | | | | | | 11,982,442 | |
| | | | | | | | | | | | | | | | |
| | | | |
| REITs: 0.87% | | | | | | | | | | | | | | | | |
American Tower Corporation | | | | | | | | | | | 267,550 | | | | 30,974,264 | |
| | | | | | | | | | | | | | | | |
| | | | |
Health Care: 17.12% | | | | | | | | | | | | | | | | |
| | | | |
| Biotechnology: 7.69% | | | | | | | | | | | | | | | | |
Alexion Pharmaceuticals Incorporated † | | | | | | | | | | | 550,604 | | | | 70,807,674 | |
BioMarin Pharmaceutical Incorporated † | | | | | | | | | | | 597,130 | | | | 59,366,665 | |
Celgene Corporation † | | | | | | | | | | | 515,868 | | | | 57,875,231 | |
Incyte Corporation † | | | | | | | | | | | 85,490 | | | | 7,712,053 | |
Regeneron Pharmaceuticals Incorporated † | | | | | | | | | | | 136,940 | | | | 58,215,933 | |
Vertex Pharmaceuticals Incorporated † | | | | | | | | | | | 213,140 | | | | 20,674,580 | |
| | | | |
| | | | | | | | | | | | | | | 274,652,136 | |
| | | | | | | | | | | | | | | | |
| | | | |
| Health Care Equipment & Supplies: 2.94% | | | | | | | | | | | | | | | | |
Danaher Corporation | | | | | | | | | | | 284,420 | | | | 23,163,165 | |
Intuitive Surgical Incorporated † | | | | | | | | | | | 26,780 | | | | 18,632,453 | |
Medtronic plc | | | | | | | | | | | 721,762 | | | | 63,248,004 | |
| | | | |
| | | | | | | | | | | | | | | 105,043,622 | |
| | | | | | | | | | | | | | | | |
| | | | |
| Health Care Providers & Services: 0.61% | | | | | | | | | | | | | | | | |
Laboratory Corporation of America Holdings † | | | | | | | | | | | 154,920 | | | | 21,620,635 | |
| | | | | | | | | | | | | | | | |
| | | | |
| Health Care Technology: 1.50% | | | | | | | | | | | | | | | | |
Cerner Corporation † | | | | | | | | | | | 855,880 | | | | 53,398,353 | |
| | | | | | | | | | | | | | | | |
| | | | |
| Life Sciences Tools & Services: 0.85% | | | | | | | | | | | | | | | | |
Patheon NV † | | | | | | | | | | | 109,433 | | | | 2,829,937 | |
Quintiles Transnational Holdings Incorporated † | | | | | | | | | | | 351,767 | | | | 27,311,190 | |
| | | | |
| | | | | | | | | | | | | | | 30,141,127 | |
| | | | | | | | | | | | | | | | |
The accompanying notes are an integral part of these financial statements.
| | | | | | |
| Portfolio of investments—July 31, 2016 | | Wells Fargo Premier Large Company Growth Fund | | | 13 | |
| | | | | | | | | | | | | | | | |
| Security name | | | | | | | | Shares | | | Value | |
| | | | |
| Pharmaceuticals: 3.53% | | | | | | | | | | | | | | | | |
Allergan plc † | | | | | | | | | | | 98,750 | | | $ | 24,978,813 | |
Bristol-Myers Squibb Company | | | | | | | | | | | 772,910 | | | | 57,821,397 | |
Zoetis Incorporated | | | | | | | | | | | 857,288 | | | | 43,267,325 | |
| | | | |
| | | | | | | | | | | | | | | 126,067,535 | |
| | | | | | | | | | | | | | | | |
| | | | |
Industrials: 7.92% | | | | | | | | | | | | | | | | |
| | | | |
| Aerospace & Defense: 1.64% | | | | | | | | | | | | | | | | |
Honeywell International Incorporated | | | | | | | | | | | 293,170 | | | | 34,104,466 | |
The Boeing Company | | | | | | | | | | | 183,870 | | | | 24,576,064 | |
| | | | |
| | | | | | | | | | | | | | | 58,680,530 | |
| | | | | | | | | | | | | | | | |
| | | | |
| Air Freight & Logistics: 0.95% | | | | | | | | | | | | | | | | |
United Parcel Service Incorporated Class B | | | | | | | | | | | 313,820 | | | | 33,923,942 | |
| | | | | | | | | | | | | | | | |
| | | | |
| Airlines: 0.71% | | | | | | | | | | | | | | | | |
Southwest Airlines Company | | | | | | | | | | | 687,500 | | | | 25,444,375 | |
| | | | | | | | | | | | | | | | |
| | | | |
| Electrical Equipment: 0.68% | | | | | | | | | | | | | | | | |
Acuity Brands Incorporated | | | | | | | | | | | 91,920 | | | | 24,122,566 | |
| | | | | | | | | | | | | | | | |
| | | | |
| Machinery: 0.39% | | | | | | | | | | | | | | | | |
Fortive Corporation † | | | | | | | | | | | 286,705 | | | | 13,822,048 | |
| | | | | | | | | | | | | | | | |
| | | | |
| Road & Rail: 3.55% | | | | | | | | | | | | | | | | |
Canadian Pacific Railway Limited | | | | | | | | | | | 5,660 | | | | 847,755 | |
Kansas City Southern | | | | | | | | | | | 532,440 | | | | 51,172,808 | |
Union Pacific Corporation | | | | | | | | | | | 803,040 | | | | 74,722,872 | |
| | | | |
| | | | | | | | | | | | | | | 126,743,435 | |
| | | | | | | | | | | | | | | | |
| | | | |
Information Technology: 37.13% | | | | | | | | | | | | | | | | |
| | | | |
| Communications Equipment: 0.66% | | | | | | | | | | | | | | | | |
Palo Alto Networks Incorporated † | | | | | | | | | | | 179,290 | | | | 23,467,268 | |
| | | | | | | | | | | | | | | | |
| | | | |
| Internet Software & Services: 11.15% | | | | | | | | | | | | | | | | |
Alphabet Incorporated Class A † | | | | | | | | | | | 207,410 | | | | 164,131,829 | |
Alphabet Incorporated Class C † | | | | | | | | | | | 48,918 | | | | 37,607,669 | |
Facebook Incorporated Class A † | | | | | | | | | | | 1,584,450 | | | | 196,376,733 | |
| | | | |
| | | | | | | | | | | | | | | 398,116,231 | |
| | | | | | | | | | | | | | | | |
| | | | |
| IT Services: 7.39% | | | | | | | | | | | | | | | | |
Accenture plc Class A | | | | | | | | | | | 247,580 | | | | 27,929,500 | |
Cognizant Technology Solutions Corporation Class A † | | | | | | | | | | | 382,370 | | | | 21,982,451 | |
MasterCard Incorporated Class A | | | | | | | | | | | 800,510 | | | | 76,240,572 | |
PayPal Holdings Incorporated † | | | | | | | | | | | 946,190 | | | | 35,236,116 | |
Visa Incorporated Class A | | | | | | | | | | | 1,311,550 | | | | 102,366,478 | |
| | | | |
| | | | | | | | | | | | | | | 263,755,117 | |
| | | | | | | | | | | | | | | | |
The accompanying notes are an integral part of these financial statements.
| | | | |
| 14 | | Wells Fargo Premier Large Company Growth Fund | | Portfolio of investments—July 31, 2016 |
| | | | | | | | | | | | | | | | |
| Security name | | | | | | | | Shares | | | Value | |
| | | | |
| Semiconductors & Semiconductor Equipment: 6.80% | | | | | | | | | | | | | | | | |
Broadcom Limited | | | | | | | | | | | 437,893 | | | $ | 70,929,908 | |
Microchip Technology Incorporated | | | | | | | | | | | 1,769,870 | | | | 98,475,567 | |
NXP Semiconductors NV † | | | | | | | | | | | 158,420 | | | | 13,321,538 | |
Texas Instruments Incorporated | | | | | | | | | | | 860,110 | | | | 59,992,673 | |
| | | | |
| | | | | | | | | | | | | | | 242,719,686 | |
| | | | | | | | | | | | | | | | |
| | | | |
| Software: 9.43% | | | | | | | | | | | | | | | | |
Activision Blizzard Incorporated | | | | | | | | | | | 848,060 | | | | 34,058,090 | |
Adobe Systems Incorporated † | | | | | | | | | | | 455,080 | | | | 44,534,129 | |
Fortinet Incorporated † | | | | | | | | | | | 935,780 | | | | 32,462,208 | |
Microsoft Corporation | | | | | | | | | | | 1,525,530 | | | | 86,467,040 | |
Red Hat Incorporated † | | | | | | | | | | | 521,960 | | | | 39,298,368 | |
Salesforce.com Incorporated † | | | | | | | | | | | 363,950 | | | | 29,771,110 | |
ServiceNow Incorporated † | | | | | | | | | | | 239,620 | | | | 17,952,330 | |
Splunk Incorporated † | | | | | | | | | | | 602,620 | | | | 37,687,855 | |
Tableau Software Incorporated Class A † | | | | | | | | | | | 26,164 | | | | 1,478,528 | |
Ultimate Software Group Incorporated † | | | | | | | | | | | 62,612 | | | | 13,092,169 | |
| | | | |
| | | | | | | | | | | | | | | 336,801,827 | |
| | | | | | | | | | | | | | | | |
| | | | |
| Technology Hardware, Storage & Peripherals: 1.70% | | | | | | | | | | | | | | | | |
Apple Incorporated | | | | | | | | | | | 581,580 | | | | 60,606,452 | |
| | | | | | | | | | | | | | | | |
| | | | |
Materials: 3.40% | | | | | | | | | | | | | | | | |
| | | | |
| Chemicals: 3.40% | | | | | | | | | | | | | | | | |
Ecolab Incorporated | | | | | | | | | | | 600,680 | | | | 71,108,498 | |
Praxair Incorporated | | | | | | | | | | | 432,420 | | | | 50,394,224 | |
| | | | |
| | | | | | | | | | | | | | | 121,502,722 | |
| | | | | | | | | | | | | | | | |
| | | | |
Total Common Stocks (Cost $2,218,539,602) | | | | | | | | | | | | | | | 3,418,944,096 | |
| | | | | | | | | | | | | | | | |
| | | | |
| | | Yield | | | | | | | | | | |
| Short-Term Investments: 3.31% | | | | | | | | | | | | | | | | |
| | | | |
| Investment Companies: 3.31% | | | | | | | | | | | | | | | | |
Securities Lending Cash Investments LLC (l)(r)(u) | | | 0.50 | % | | | | | | | 20,898,750 | | | | 20,898,750 | |
Wells Fargo Government Money Market Fund Select Class (l)(u) | | | 0.32 | | | | | | | | 97,272,258 | | | | 97,272,258 | |
| | | | |
Total Short-Term Investments (Cost $118,171,008) | | | | | | | | | | | | | | | 118,171,008 | |
| | | | | | | | | | | | | | | | |
| | | | | | | | |
| Total investments in securities (Cost $2,336,710,610) * | | | 99.09 | % | | | 3,537,115,104 | |
Other assets and liabilities, net | | | 0.91 | | | | 32,458,790 | |
| | | | | | | | |
| Total net assets | | | 100.00 | % | | $ | 3,569,573,894 | |
| | | | | | | | |
| † | Non-income-earning security |
| « | All or a portion of this security is on loan. |
| (l) | The issuer of the security is an affiliated person of the Fund as defined in the Investment Company Act of 1940. |
| (r) | The investment is a non-registered investment vehicle purchased with cash collateral received from securities on loan. |
| (u) | The rate represents the 7-day annualized yield at period end. |
| * | Cost for federal income tax purposes is $2,354,267,055 and unrealized gains (losses) consists of: |
| | | | |
Gross unrealized gains | | $ | 1,215,099,766 | |
Gross unrealized losses | | | (32,251,717 | ) |
| | | | |
Net unrealized gains | | $ | 1,182,848,049 | |
The accompanying notes are an integral part of these financial statements.
| | | | | | |
| Statement of assets and liabilities—July 31, 2016 | | Wells Fargo Premier Large Company Growth Fund | | | 15 | |
| | | | |
| | | | |
| |
Assets | | | | |
Investments | | | | |
In unaffiliated securities (including $20,365,468 of securities loaned), at value (cost $2,218,539,602) | | $ | 3,418,944,096 | |
In affiliated securities, at value (cost $118,171,008) | | | 118,171,008 | |
| | | | |
Total investments, at value (cost $2,336,710,610) | | | 3,537,115,104 | |
Receivable for investments sold | | | 32,631,226 | |
Receivable for Fund shares sold | | | 91,003,564 | |
Receivable for dividends | | | 1,149,039 | |
Receivable for securities lending income | | | 14,262 | |
Prepaid expenses and other assets | | | 106,868 | |
| | | | |
Total assets | | | 3,662,020,063 | |
| | | | |
| |
Liabilities | | | | |
Payable for investments purchased | | | 57,942,609 | |
Payable for Fund shares redeemed | | | 10,449,311 | |
Payable upon receipt of securities loaned | | | 20,898,750 | |
Management fee payable | | | 1,716,229 | |
Distribution fees payable | | | 187,956 | |
Administration fees payable | | | 487,884 | |
Accrued expenses and other liabilities | | | 763,430 | |
| | | | |
Total liabilities | | | 92,446,169 | |
| | | | |
Total net assets | | $ | 3,569,573,894 | |
| | | | |
| |
NET ASSETS CONSIST OF | | | | |
Paid-in capital | | $ | 2,185,774,894 | |
Accumulated net investment loss | | | (2,674,776 | ) |
Accumulated net realized gains on investments | | | 186,069,282 | |
Net unrealized gains on investments | | | 1,200,404,494 | |
| | | | |
Total net assets | | $ | 3,569,573,894 | |
| | | | |
| |
COMPUTATION OF NET ASSET VALUE AND OFFERING PRICE PER SHARE | | | | |
Net assets – Class A | | $ | 1,697,745,583 | |
Shares outstanding – Class A1 | | | 115,623,546 | |
Net asset value per share – Class A | | | $14.68 | |
Maximum offering price per share – Class A2 | | | $15.58 | |
Net assets – Class B | | $ | 869,902 | |
Shares outstanding – Class B1 | | | 68,644 | |
Net asset value per share – Class B | | | $12.67 | |
Net assets – Class C | | $ | 296,895,783 | |
Shares outstanding – Class C1 | | | 23,490,086 | |
Net asset value per share – Class C | | | $12.64 | |
Net assets – Class R4 | | $ | 3,988,364 | |
Share outstanding – Class R41 | | | 265,886 | |
Net asset value per share – Class R4 | | | $15.00 | |
Net assets – Class R6 | | $ | 179,198,135 | |
Shares outstanding – Class R61 | | | 11,883,082 | |
Net asset value per share – Class R6 | | | $15.08 | |
Net assets – Administrator Class | | $ | 292,900,411 | |
Shares outstanding – Administrator Class1 | | | 19,761,119 | |
Net asset value per share – Administrator Class | | | $14.82 | |
Net assets – Institutional Class | | $ | 1,097,975,716 | |
Shares outstanding – Institutional Class1 | | | 72,896,530 | |
Net asset value per share – Institutional Class | | | $15.06 | |
| 1 | The Fund has an unlimited number of authorized shares. |
| 2 | Maximum offering price is computed as 100/94.25 of net asset value. On investments of $50,000 or more, the offering price is reduced. |
The accompanying notes are an integral part of these financial statements.
| | | | |
| 16 | | Wells Fargo Premier Large Company Growth Fund | | Statement of operations—year ended July 31, 2016 |
| | | | |
| | | | |
| |
Investment income | | | | |
Dividends (net of foreign withholding taxes of $13,000) | | $ | 40,113,419 | |
Securities lending income, net | | | 515,970 | |
Income from affiliated securities | | | 106,015 | |
| | | | |
Total investment income | | | 40,735,404 | |
| | | | |
| |
Expenses | | | | |
Management fee | | | 27,761,080 | |
Administration fees | | | | |
Class A | | | 4,052,405 | |
Class B | | | 2,777 | |
Class C | | | 694,972 | |
Class R4 | | | 1,972 | |
Class R6 | | | 52,893 | |
Administrator Class | | | 795,384 | |
Institutional Class | | | 1,598,145 | |
Investor Class | | | 132,962 | 1 |
Shareholder servicing fees | | | | |
Class A | | | 4,823,730 | |
Class B | | | 3,306 | |
Class C | | | 827,347 | |
Class R4 | | | 2,464 | |
Administrator Class | | | 1,516,286 | |
Investor Class | | | 103,446 | 1 |
Distribution fees | | | | |
Class B | | | 9,916 | |
Class C | | | 2,482,043 | |
Custody and accounting fees | | | 226,704 | |
Professional fees | | | 54,345 | |
Registration fees | | | 162,479 | |
Shareholder report expenses | | | 429,971 | |
Trustees’ fees and expenses | | | 24,636 | |
Other fees and expenses | | | 98,196 | |
| | | | |
Total expenses | | | 45,857,459 | |
Less: Fee waivers and/or expense reimbursements | | | (2,029,726 | ) |
| | | | |
Net expenses | | | 43,827,733 | |
| | | | |
Net investment loss | | | (3,092,329 | ) |
| | | | |
| |
REALIZED AND UNREALIZED GAINS (LOSSES) ON INVESTMENTS | | | | |
Net realized gains on investments | | | 354,287,986 | |
Net change in unrealized gains (losses) on investments | | | (628,644,827 | ) |
| | | | |
Net realized and unrealized gains (losses) on investments | | | (274,356,841 | ) |
| | | | |
Net decrease in net assets resulting from operations | | $ | (277,449,170 | ) |
| | | | |
| 1 | For the period from August 1, 2015 to October 23, 2015. Effective at the close of business on October 23, 2015, Investor Class shares were converted to Class A shares and are no longer offered by the Fund. |
The accompanying notes are an integral part of these financial statements.
| | | | | | |
| Statement of changes in net assets | | Wells Fargo Premier Large Company Growth Fund | | | 17 | |
| | | | | | | | | | | | | | | | |
| | | Year ended
July 31, 2016 | | | Year ended
July 31, 2015 | |
| | | | |
Operations | | | | | | | | | | | | | | | | |
Net investment loss | | | | | | $ | (3,092,329 | ) | | | | | | $ | (4,932,440 | ) |
Net realized gains on investments | | | | | | | 354,287,986 | | | | | | | | 217,385,650 | |
Net change in unrealized gains (losses) on investments | | | | | | | (628,644,827 | ) | | | | | | | 456,933,003 | |
| | | | |
Net increase (decrease) in net assets resulting from operations | | | | | | | (277,449,170 | ) | | | | | | | 669,386,213 | |
| | | | |
| | | | |
Distributions to shareholders from | | | | | | | | | | | | | | | | |
Net realized gains | | | | | | | | | | | | | | | | |
Class A | | | | | | | (154,141,985 | ) | | | | | | | (25,289,106 | ) |
Class B | | | | | | | (115,925 | ) | | | | | | | (52,310 | ) |
Class C | | | | | | | (27,659,123 | ) | | | | | | | (6,075,432 | ) |
Class R4 | | | | | | | (138,255 | ) | | | | | | | (26,355 | ) |
Class R6 | | | | | | | (12,437,527 | ) | | | | | | | (2,294,051 | ) |
Administrator Class | | | | | | | (51,332,185 | ) | | | | | | | (17,637,288 | ) |
Institutional Class | | | | | | | (90,311,280 | ) | | | | | | | (16,043,030 | ) |
Investor Class | | | | | | | 0 | 1 | | | | | | | (2,767,968 | ) |
| | | | |
Total distributions to shareholders | | | | | | | (336,136,280 | ) | | | | | | | (70,185,540 | ) |
| | | | |
| | | | |
Capital share transactions | | | Shares | | | | | | | | Shares | | | | | |
Proceeds from shares sold | | | | | | | | | | | | | | | | |
Class A | | | 33,396,591 | | | | 499,630,054 | | | | 44,287,833 | | | | 683,559,842 | |
Class B | | | 6,032 | | | | 75,914 | | | | 4,474 | | | | 61,128 | |
Class C | | | 2,643,388 | | | | 33,651,473 | | | | 4,631,916 | | | | 62,766,733 | |
Class R4 | | | 147,562 | | | | 2,106,423 | | | | 89,416 | | | | 1,331,780 | |
Class R6 | | | 3,017,767 | | | | 46,660,260 | | | | 1,160,674 | | | | 18,210,412 | |
Administrator Class | | | 3,919,148 | | | | 57,602,147 | | | | 11,745,864 | | | | 181,283,260 | |
Institutional Class | | | 27,347,396 | | | | 409,718,053 | | | | 26,787,602 | | | | 422,028,125 | |
Investor Class | | | 204,065 | 1 | | | 3,092,911 | 1 | | | 1,217,432 | | | | 18,676,165 | |
| | | | |
| | | | | | | 1,052,537,235 | | | | | | | | 1,387,917,445 | |
| | | | |
Reinvestment of distributions | | | | | | | | | | | | | | | | |
Class A | | | 10,119,274 | | | | 145,413,973 | | | | 1,553,406 | | | | 23,409,833 | |
Class B | | | 7,422 | | | | 92,480 | | | | 3,219 | | | | 42,848 | |
Class C | | | 1,715,487 | | | | 21,323,504 | | | | 333,914 | | | | 4,431,032 | |
Class R4 | | | 9,437 | | | | 138,255 | | | | 1,723 | | | | 26,355 | |
Class R6 | | | 813,689 | | | | 11,977,506 | | | | 141,900 | | | | 2,176,746 | |
Administrator Class | | | 3,513,370 | | | | 50,943,861 | | | | 1,033,233 | | | | 15,674,143 | |
Institutional Class | | | 4,638,850 | | | | 68,237,489 | | | | 854,382 | | | | 13,097,671 | |
Investor Class | | | 0 | 1 | | | 0 | 1 | | | 181,619 | | | | 2,727,921 | |
| | | | |
| | | | | | | 298,127,068 | | | | | | | | 61,586,549 | |
| | | | |
Payment for shares redeemed | | | | | | | | | | | | | | | | |
Class A | | | (67,943,982 | ) | | | (948,979,782 | ) | | | (36,977,346 | ) | | | (568,178,692 | ) |
Class B | | | (96,549 | ) | | | (1,234,246 | ) | | | (166,018 | ) | | | (2,261,194 | ) |
Class C | | | (8,078,699 | ) | | | (100,085,119 | ) | | | (6,821,898 | ) | | | (93,243,358 | ) |
Class R4 | | | (19,668 | ) | | | (274,630 | ) | | | (14,450 | ) | | | (227,033 | ) |
Class R6 | | | (1,984,285 | ) | | | (28,819,972 | ) | | | (2,357,872 | ) | | | (37,477,435 | ) |
Administrator Class | | | (56,550,448 | ) | | | (817,362,391 | ) | | | (34,510,354 | ) | | | (539,756,076 | ) |
Institutional Class | | | (38,166,413 | ) | | | (557,212,931 | ) | | | (18,413,561 | ) | | | (290,307,468 | ) |
Investor Class | | | (12,187,103 | )1 | | | (190,582,272 | )1 | | | (3,060,955 | ) | | | (47,139,147 | ) |
| | | | |
| | | | | | | (2,644,551,343 | ) | | | | | | | (1,578,590,403 | ) |
| | | | |
Net decrease in net assets resulting from capital share transactions | | | | | | | (1,293,887,040 | ) | | | | | | | (129,086,409 | ) |
| | | | |
Total increase (decrease) in net assets | | | | | | | (1,907,472,490 | ) | | | | | | | 470,114,264 | |
| | | | |
| | | | |
Net assets | | | | | | | | | | | | | | | | |
Beginning of period | | | | | | | 5,477,046,384 | | | | | | | | 5,006,932,120 | |
| | | | |
End of period | | | | | | $ | 3,569,573,894 | | | | | | | $ | 5,477,046,384 | |
| | | | |
Accumulated net investment loss | | | | | | $ | (2,674,776 | ) | | | | | | $ | (2,789,149 | ) |
| | | | |
| 1 | For the period from August 1, 2015 to October 23, 2015. Effective at the close of business on October 23, 2015, Investor Class shares were converted to Class A shares and are no longer offered by the Fund. |
The accompanying notes are an integral part of these financial statements.
| | | | |
| 18 | | Wells Fargo Premier Large Company Growth Fund | | Financial highlights |
(For a share outstanding throughout each period)
| | | | | | | | | | | | | | | | | | | | |
| | | Year ended July 31 | |
| CLASS A | | 2016 | | | 2015 | | | 2014 | | | 2013 | | | 2012 | |
Net asset value, beginning of period | | | $16.28 | | | | $14.55 | | | | $12.57 | | | | $10.21 | | | | $9.89 | |
Net investment loss | | | (0.03 | ) | | | (0.03 | ) | | | (0.05 | ) | | | (0.02 | ) | | | (0.03 | )1 |
Net realized and unrealized gains (losses) on investments | | | (0.52 | ) | | | 1.97 | | | | 2.03 | | | | 2.38 | | | | 0.60 | |
| | | | | | | | | | | | | | | | | | | | |
Total from investment operations | | | (0.55 | ) | | | 1.94 | | | | 1.98 | | | | 2.36 | | | | 0.57 | |
Distributions to shareholders from | | | | | | | | | | | | | | | | | | | | |
Net realized gains | | | (1.05 | ) | | | (0.21 | ) | | | 0.00 | | | | 0.00 | | | | (0.25 | ) |
Net asset value, end of period | | | $14.68 | | | | $16.28 | | | | $14.55 | | | | $12.57 | | | | $10.21 | |
Total return2 | | | (3.22 | )% | | | 13.46 | % | | | 15.75 | % | | | 23.11 | % | | | 6.08 | % |
Ratios to average net assets (annualized) | | | | | | | | | | | | | | | | | | | | |
Gross expenses | | | 1.13 | % | | | 1.16 | % | | | 1.17 | % | | | 1.19 | % | | | 1.23 | % |
Net expenses | | | 1.11 | % | | | 1.12 | % | | | 1.12 | % | | | 1.12 | % | | | 1.12 | % |
Net investment loss | | | (0.17 | )% | | | (0.18 | )% | | | (0.36 | )% | | | (0.15 | )% | | | (0.30 | )% |
Supplemental data | | | | | | | | | | | | | | | | | | | | |
Portfolio turnover rate | | | 47 | % | | | 44 | % | | | 37 | % | | | 32 | % | | | 51 | % |
Net assets, end of period (000s omitted) | | | $1,697,746 | | | | $2,280,107 | | | | $1,908,455 | | | | $1,515,862 | | | | $932,106 | |
| 1 | Calculated based upon average shares outstanding |
| 2 | Total return calculations do not include any sales charges. |
The accompanying notes are an integral part of these financial statements.
| | | | | | |
| Financial highlights | | Wells Fargo Premier Large Company Growth Fund | | | 19 | |
(For a share outstanding throughout each period)
| | | | | | | | | | | | | | | | | | | | |
| | | Year ended July 31 | |
| CLASS B | | 2016 | | | 2015 | | | 2014 | | | 2013 | | | 2012 | |
Net asset value, beginning of period | | | $14.30 | | | | $12.90 | | | | $11.23 | | | | $9.19 | | | | $8.99 | |
Net investment loss | | | (0.11 | )1 | | | (0.13 | )1 | | | (0.13 | )1 | | | (0.09 | )1 | | | (0.09 | )1 |
Net realized and unrealized gains (losses) on investments | | | (0.47 | ) | | | 1.74 | | | | 1.80 | | | | 2.13 | | | | 0.54 | |
| | | | | | | | | | | | | | | | | | | | |
Total from investment operations | | | (0.58 | ) | | | 1.61 | | | | 1.67 | | | | 2.04 | | | | 0.45 | |
Distributions to shareholders from | | | | | | | | | | | | | | | | | | | | |
Net realized gains | | | (1.05 | ) | | | (0.21 | ) | | | 0.00 | | | | 0.00 | | | | (0.25 | ) |
Net asset value, end of period | | | $12.67 | | | | $14.30 | | | | $12.90 | | | | $11.23 | | | | $9.19 | |
Total return2 | | | (3.92 | )% | | | 12.61 | % | | | 14.87 | % | | | 22.20 | % | | | 5.22 | % |
Ratios to average net assets (annualized) | | | | | | | | | | | | | | | | | | | | |
Gross expenses | | | 1.87 | % | | | 1.91 | % | | | 1.91 | % | | | 1.94 | % | | | 1.97 | % |
Net expenses | | | 1.86 | % | | | 1.87 | % | | | 1.87 | % | | | 1.87 | % | | | 1.87 | % |
Net investment loss | | | (0.91 | )% | | | (0.92 | )% | | | (1.09 | )% | | | (0.87 | )% | | | (1.04 | )% |
Supplemental data | | | | | | | | | | | | | | | | | | | | |
Portfolio turnover rate | | | 47 | % | | | 44 | % | | | 37 | % | | | 32 | % | | | 51 | % |
Net assets, end of period (000s omitted) | | | $870 | | | | $2,170 | | | | $4,001 | | | | $5,637 | | | | $6,962 | |
| 1 | Calculated based upon average shares outstanding |
| 2 | Total return calculations do not include any sales charges. |
The accompanying notes are an integral part of these financial statements.
| | | | |
| 20 | | Wells Fargo Premier Large Company Growth Fund | | Financial highlights |
(For a share outstanding throughout each period)
| | | | | | | | | | | | | | | | | | | | |
| | | Year ended July 31 | |
| CLASS C | | 2016 | | | 2015 | | | 2014 | | | 2013 | | | 2012 | |
Net asset value, beginning of period | | | $14.27 | | | | $12.87 | | | | $11.20 | | | | $9.17 | | | | $8.97 | |
Net investment loss | | | (0.12 | )1 | | | (0.13 | )1 | | | (0.14 | )1 | | | (0.09 | )1 | | | (0.10 | )1 |
Net realized and unrealized gains (losses) on investments | | | (0.46 | ) | | | 1.74 | | | | 1.81 | | | | 2.12 | | | | 0.55 | |
| | | | | | | | | | | | | | | | | | | | |
Total from investment operations | | | (0.58 | ) | | | 1.61 | | | | 1.67 | | | | 2.03 | | | | 0.45 | |
Distributions to shareholders from | | | | | | | | | | | | | | | | | | | | |
Net realized gains | | | (1.05 | ) | | | (0.21 | ) | | | 0.00 | | | | 0.00 | | | | (0.25 | ) |
Net asset value, end of period | | | $12.64 | | | | $14.27 | | | | $12.87 | | | | $11.20 | | | | $9.17 | |
Total return2 | | | (3.92 | )% | | | 12.65 | % | | | 14.91 | % | | | 22.14 | % | | | 5.24 | % |
Ratios to average net assets (annualized) | | | | | | | | | | | | | | | | | | | | |
Gross expenses | | | 1.88 | % | | | 1.91 | % | | | 1.92 | % | | | 1.94 | % | | | 1.98 | % |
Net expenses | | | 1.86 | % | | | 1.87 | % | | | 1.87 | % | | | 1.87 | % | | | 1.87 | % |
Net investment loss | | | (0.92 | )% | | | (0.93 | )% | | | (1.11 | )% | | | (0.91 | )% | | | (1.07 | )% |
Supplemental data | | | | | | | | | | | | | | | | | | | | |
Portfolio turnover rate | | | 47 | % | | | 44 | % | | | 37 | % | | | 32 | % | | | 51 | % |
Net assets, end of period (000s omitted) | | | $296,896 | | | | $388,290 | | | | $374,136 | | | | $279,203 | | | | $129,980 | |
| 1 | Calculated based upon average shares outstanding |
| 2 | Total return calculations do not include any sales charges. |
The accompanying notes are an integral part of these financial statements.
| | | | | | |
| Financial highlights | | Wells Fargo Premier Large Company Growth Fund | | | 21 | |
(For a share outstanding throughout each period)
| | | | | | | | | | | | | | | | |
| | | Year ended July 31 | |
| CLASS R4 | | 2016 | | | 2015 | | | 2014 | | | 20131 | |
Net asset value, beginning of period | | | $16.56 | | | | $14.75 | | | | $12.70 | | | | $10.81 | |
Net investment income (loss) | | | 0.02 | 3 | | | 0.02 | | | | (0.01 | ) | | | 0.00 | 2 |
Net realized and unrealized gains (losses) on investments | | | (0.53 | ) | | | 2.00 | | | | 2.06 | | | | 1.89 | |
| | | | | | | | | | | | | | | | |
Total from investment operations | | | (0.51 | ) | | | 2.02 | | | | 2.05 | | | | 1.89 | |
Distributions to shareholders from | | | | | | | | | | | | | | | | |
Net realized gains | | | (1.05 | ) | | | (0.21 | ) | | | 0.00 | | | | 0.00 | |
Net asset value, end of period | | | $15.00 | | | | $16.56 | | | | $14.75 | | | | $12.70 | |
Total return4 | | | (2.91 | )% | | | 13.82 | % | | | 16.14 | % | | | 17.48 | % |
Ratios to average net assets (annualized) | | | | | | | | | | | | | | | | |
Gross expenses | | | 0.85 | % | | | 0.83 | % | | | 0.84 | % | | | 0.85 | % |
Net expenses | | | 0.80 | % | | | 0.80 | % | | | 0.80 | % | | | 0.80 | % |
Net investment income (loss) | | | 0.13 | % | | | 0.13 | % | | | (0.11 | )% | | | 0.06 | % |
Supplemental data | | | | | | | | | | | | | | | | |
Portfolio turnover rate | | | 47 | % | | | 44 | % | | | 37 | % | | | 32 | % |
Net assets, end of period (000s omitted) | | | $3,988 | | | | $2,129 | | | | $765 | | | | $131 | |
| 1 | For the period from November 30, 2012 (commencement of class operations) to July 31, 2013 |
| 2 | Amount is less than $0.005 per share. |
| 3 | Calculated based upon average shares outstanding |
| 4 | Returns for periods of less than one year are not annualized. |
The accompanying notes are an integral part of these financial statements.
| | | | |
| 22 | | Wells Fargo Premier Large Company Growth Fund | | Financial highlights |
(For a share outstanding throughout each period)
| | | | | | | | | | | | | | | | |
| | | Year ended July 31 | |
| CLASS R6 | | 2016 | | | 2015 | | | 2014 | | | 20131 | |
Net asset value, beginning of period | | | $16.62 | | | | $14.77 | | | | $12.71 | | | | $10.81 | |
Net investment income | | | 0.04 | 3 | | | 0.05 | | | | 0.01 | | | | 0.00 | 2 |
Net realized and unrealized gains (losses) on investments | | | (0.53 | ) | | | 2.01 | | | | 2.05 | | | | 1.90 | |
| | | | | | | | | | | | | | | | |
Total from investment operations | | | (0.49 | ) | | | 2.06 | | | | 2.06 | | | | 1.90 | |
Distributions to shareholders from | | | | | | | | | | | | | | | | |
Net realized gains | | | (1.05 | ) | | | (0.21 | ) | | | 0.00 | | | | 0.00 | |
Net asset value, end of period | | | $15.08 | | | | $16.62 | | | | $14.77 | | | | $12.71 | |
Total return4 | | | (2.78 | )% | | | 14.00 | % | | | 16.29 | % | | | 17.58 | % |
Ratios to average net assets (annualized) | | | | | | | | | | | | | | | | |
Gross expenses | | | 0.70 | % | | | 0.68 | % | | | 0.69 | % | | | 0.71 | % |
Net expenses | | | 0.65 | % | | | 0.65 | % | | | 0.65 | % | | | 0.65 | % |
Net investment income | | | 0.28 | % | | | 0.29 | % | | | 0.09 | % | | | 0.05 | % |
Supplemental data | | | | | | | | | | | | | | | | |
Portfolio turnover rate | | | 47 | % | | | 44 | % | | | 37 | % | | | 32 | % |
Net assets, end of period (000s omitted) | | | $179,198 | | | | $166,768 | | | | $163,871 | | | | $4,629 | |
| 1 | For the period from November 30, 2012 (commencement of class operations) to July 31, 2013 |
| 2 | Amount is less than $0.005 per share. |
| 3 | Calculated based upon average shares outstanding |
| 4 | Returns for periods of less than one year are not annualized. |
The accompanying notes are an integral part of these financial statements.
| | | | | | |
| Financial highlights | | Wells Fargo Premier Large Company Growth Fund | | | 23 | |
(For a share outstanding throughout each period)
| | | | | | | | | | | | | | | | | | | | |
| | | Year ended July 31 | |
| ADMINISTRATOR CLASS | | 2016 | | | 2015 | | | 2014 | | | 2013 | | | 2012 | |
Net asset value, beginning of period | | | $16.41 | | | | $14.63 | | | | $12.62 | | | | $10.24 | | | | $9.90 | |
Net investment loss | | | (0.00 | )1,2 | | | (0.00 | )1 | | | (0.02 | ) | | | (0.00 | )1 | | | (0.02 | ) |
Net realized and unrealized gains (losses) on investments | | | (0.54 | ) | | | 1.99 | | | | 2.03 | | | | 2.38 | | | | 0.61 | |
| | | | | | | | | | | | | | | | | | | | |
Total from investment operations | | | (0.54 | ) | | | 1.99 | | | | 2.01 | | | | 2.38 | | | | 0.59 | |
Distributions to shareholders from | | | | | | | | | | | | | | | | | | | | |
Net realized gains | | | (1.05 | ) | | | (0.21 | ) | | | 0.00 | | | | 0.00 | | | | (0.25 | ) |
Net asset value, end of period | | | $14.82 | | | | $16.41 | | | | $14.63 | | | | $12.62 | | | | $10.24 | |
Total return | | | (3.13 | )% | | | 13.73 | % | | | 15.93 | % | | | 23.24 | % | | | 6.28 | % |
Ratios to average net assets (annualized) | | | | | | | | | | | | | | | | | | | | |
Gross expenses | | | 1.04 | % | | | 1.00 | % | | | 1.00 | % | | | 1.04 | % | | | 1.07 | % |
Net expenses | | | 0.98 | % | | | 0.95 | % | | | 0.95 | % | | | 0.95 | % | | | 0.95 | % |
Net investment loss | | | (0.02 | )% | | | (0.01 | )% | | | (0.19 | )% | | | (0.01 | )% | | | (0.16 | )% |
Supplemental data | | | | | | | | | | | | | | | | | | | | |
Portfolio turnover rate | | | 47 | % | | | 44 | % | | | 37 | % | | | 32 | % | | | 51 | % |
Net assets, end of period (000s omitted) | | | $292,900 | | | | $1,129,970 | | | | $1,325,864 | | | | $640,494 | | | | $251,759 | |
| 1 | Amount is less than $0.005. |
| 2 | Calculated based upon average shares outstanding |
The accompanying notes are an integral part of these financial statements.
| | | | |
| 24 | | Wells Fargo Premier Large Company Growth Fund | | Financial highlights |
(For a share outstanding throughout each period)
| | | | | | | | | | | | | | | | | | | | |
| | | Year ended July 31 | |
| INSTITUTIONAL CLASS | | 2016 | | | 2015 | | | 2014 | | | 2013 | | | 2012 | |
Net asset value, beginning of period | | | $16.61 | | | | $14.77 | | | | $12.71 | | | | $10.28 | | | | $9.91 | |
Net investment income | | | 0.03 | 2 | | | 0.03 | | | | 0.01 | 2 | | | 0.00 | 1 | | | 0.00 | 1,2 |
Net realized and unrealized gains (losses) on investments | | | (0.53 | ) | | | 2.02 | | | | 2.05 | | | | 2.43 | | | | 0.62 | |
| | | | | | | | | | | | | | | | | | | | |
Total from investment operations | | | (0.50 | ) | | | 2.05 | | | | 2.06 | | | | 2.43 | | | | 0.62 | |
Distributions to shareholders from | | | | | | | | | | | | | | | | | | | | |
Net realized gains | | | (1.05 | ) | | | (0.21 | ) | | | 0.00 | | | | 0.00 | | | | (0.25 | ) |
Net asset value, end of period | | | $15.06 | | | | $16.61 | | | | $14.77 | | | | $12.71 | | | | $10.28 | |
Total return | | | (2.85 | )% | | | 14.01 | % | | | 16.21 | % | | | 23.64 | % | | | 6.48 | % |
Ratios to average net assets (annualized) | | | | | | | | | | | | | | | | | | | | |
Gross expenses | | | 0.80 | % | | | 0.74 | % | | | 0.74 | % | | | 0.76 | % | | | 0.79 | % |
Net expenses | | | 0.70 | % | | | 0.70 | % | | | 0.70 | % | | | 0.71 | % | | | 0.75 | % |
Net investment income | | | 0.23 | % | | | 0.23 | % | | | 0.07 | % | | | 0.16 | % | | | 0.04 | % |
Supplemental data | | | | | | | | | | | | | | | | | | | | |
Portfolio turnover rate | | | 47 | % | | | 44 | % | | | 37 | % | | | 32 | % | | | 51 | % |
Net assets, end of period (000s omitted) | | | $1,097,976 | | | | $1,313,281 | | | | $1,031,979 | | | | $1,328,994 | | | | $223,616 | |
| 1 | Amount is less than $0.005. |
| 2 | Calculated based upon average shares outstanding |
The accompanying notes are an integral part of these financial statements.
| | | | | | |
| Notes to financial statements | | Wells Fargo Premier Large Company Growth Fund | | | 25 | |
1. ORGANIZATION
Wells Fargo Funds Trust (the “Trust”), a Delaware statutory trust organized on March 10, 1999, is an open-end management investment company registered under the Investment Company Act of 1940, as amended (the “1940 Act”). As an investment company, the Trust follows the accounting and reporting guidance in Financial Accounting Standards Board (“FASB”) Accounting Standards Codification Topic 946, Financial Services – Investment Companies. These financial statements report on the Wells Fargo Premier Large Company Growth Fund (the “Fund”) which is a diversified series of the Trust.
Effective at the close of business on October 23, 2015, Investor Class shares became Class A shares in a tax-free conversion. Shareholders of Investor Class received Class A shares at a value equal to the value of their Investor Class shares immediately prior to the conversion. Investor Class shares are no longer offered by the Fund.
2. SIGNIFICANT ACCOUNTING POLICIES
The following significant accounting policies, which are consistently followed in the preparation of the financial statements of the Fund, are in conformity with U.S. generally accepted accounting principles which require management to make estimates and assumptions that affect the reported amounts of assets and liabilities, disclosure of contingent assets and liabilities at the date of the financial statements, and the reported amounts of revenues and expenses during the reporting period. Actual results could differ from those estimates.
Securities valuation
All investments are valued each business day as of the close of regular trading on the New York Stock Exchange (generally 4 p.m. Eastern Time), although the Fund may deviate from this calculation time under unusual or unexpected circumstances.
Equity securities that are listed on a foreign or domestic exchange or market are valued at the official closing price or, if none, the last sales price. If no sale occurs on the principal exchange or market that day, the prior day’s price will be deemed “stale” and a fair value price will be determined in accordance with the Fund’s Valuation Procedures.
Investments in registered open-end investment companies are valued at net asset value. Interests in non-registered investment vehicles that are redeemable at net asset value are fair valued normally at net asset value.
Investments which are not valued using any of the methods discussed above are valued at their fair value, as determined in good faith by the Board of Trustees of the Fund. The Board of Trustees has established a Valuation Committee comprised of the Trustees and has delegated to it the authority to take any actions regarding the valuation of portfolio securities that the Valuation Committee deems necessary or appropriate, including determining the fair value of portfolio securities, unless the determination has been delegated to the Management Valuation Team of Wells Fargo Funds Management, LLC (“Funds Management”). The Board of Trustees retains the authority to make or ratify any valuation decisions or approve any changes to the Valuation Procedures as it deems appropriate. On a quarterly basis, the Board of Trustees receives reports on any valuation actions taken by the Valuation Committee or the Management Valuation Team which may include items for ratification.
Valuations of fair valued securities are compared to the next actual sales price when available, or other appropriate market values, to assess the continued appropriateness of the fair valuation methodologies used. These securities are fair valued on a day-to-day basis, taking into consideration changes to appropriate market information and any significant changes to the inputs considered in the valuation process until there is a readily available price provided on an exchange or by an independent pricing service. Valuations received from an independent pricing service or independent broker-dealer quotes are periodically validated by comparisons to most recent trades and valuations provided by other independent pricing services in addition to the review of prices by the manager and/or subadviser. Unobservable inputs used in determining fair valuations are identified based on the type of security, taking into consideration factors utilized by market participants in valuing the investment, knowledge about the issuer and the current market environment.
Security loans
The Fund may lend its securities from time to time in order to earn additional income in the form of fees or interest on securities received as collateral or the investment of any cash received as collateral. The Fund continues to receive interest or dividends on the securities loaned. The Fund receives collateral in the form of cash or securities with a value at least equal to the value of the securities on loan. The value of the loaned securities is determined at the close of each business day and any additional required collateral is delivered to the Fund on the next business day. In a securities lending transaction, the net asset value of the Fund will be affected by an increase or decrease in the value of the securities loaned and by an increase or decrease in the value of the instrument in which collateral is invested. The amount
| | | | |
| 26 | | Wells Fargo Premier Large Company Growth Fund | | Notes to financial statements |
of securities lending activity undertaken by the Fund fluctuates from time to time. In the event of default or bankruptcy by the borrower, the Fund may be prevented from recovering the loaned securities or gaining access to the collateral or may experience delays or costs in doing so. In addition, the investment of any cash collateral received may lose all or part of its value. The Fund has the right under the lending agreement to recover the securities from the borrower on demand.
The Fund lends its securities through an unaffiliated securities lending agent. Cash collateral received in connection with its securities lending transactions is invested in Securities Lending Cash Investments, LLC (the “Securities Lending Fund”). The Securities Lending Fund is exempt from registration under Section 3(c)(7) of the 1940 Act and is managed by Funds Management and is subadvised by Wells Capital Management Incorporated (“WellsCap”), an affiliate of Funds Management and an indirect wholly owned subsidiary of Wells Fargo & Company (“Wells Fargo”). Funds Management receives an advisory fee starting at 0.05% and declining to 0.01% as the average daily net assets of the Securities Lending Fund increase. All of the fees received by Funds Management are paid to WellsCap for its services as subadviser. The Securities Lending Fund seeks to provide a positive return compared to the daily Fed Funds Open rate by investing in high-quality, U.S. dollar-denominated short-term money market instruments. Securities Lending Fund investments are fair valued based upon the amortized cost valuation technique. Income earned from investment in the Securities Lending Fund is included in securities lending income on the Statement of Operations.
Security transactions and income recognition
Securities transactions are recorded on a trade date basis. Realized gains or losses are recorded on the basis of identified cost.
Dividend income is recognized on the ex-dividend date. Dividend income is recorded net of foreign taxes withheld where recovery of such taxes is not assured.
Distributions to shareholders
Distributions to shareholders from net investment income and net realized gains, if any, are recorded on the ex-dividend date. Such distributions are determined in conformity with federal income tax regulations, which may differ in amount or character from net investment income and realized gains recognized for purposes of U.S. generally accepted accounting principles.
Federal and other taxes
The Fund intends to continue to qualify as a regulated investment company by distributing substantially all of its investment company taxable income and any net realized capital gains (after reduction for capital loss carryforwards) sufficient to relieve it from all, or substantially all, federal income taxes. Accordingly, no provision for federal income taxes was required.
The Fund’s income and federal excise tax returns and all financial records supporting those returns for the prior three fiscal years are subject to examination by the federal and Delaware revenue authorities. Management has analyzed the Fund’s tax positions taken on federal, state, and foreign tax returns for all open tax years and does not believe that there are any uncertain tax positions that require recognition of a tax liability.
Reclassifications are made to the Fund’s capital accounts for permanent tax differences to reflect income and gains available for distribution (or available capital loss carryforwards) under federal income tax regulations. U.S. generally accepted accounting principles require that certain components of net assets be adjusted to reflect permanent differences between financial and tax reporting. These reclassifications have no effect on net assets or net asset values per share. The primary permanent differences causing such reclassifications are due to dividends from certain securities and net operating losses. At July 31, 2016, as a result of permanent book-to-tax differences, the following reclassification adjustments were made on the Statement of Assets and Liabilities:
| | | | |
| Paid-in capital | | Accumulated net
investment loss | | Accumulated net
realized gains
on investments |
| $(4,385,179) | | $3,206,702 | | $1,178,477 |
As of July 31, 2016, the Fund had capital loss carryforwards available to offset future net realized capital gains in the amount of $12,303,738 expiring in 2017.
As of July 31, 2016, the Fund had a qualified late-year ordinary loss of $2,656,167 which will be recognized on the first day of the following fiscal year.
| | | | | | |
| Notes to financial statements | | Wells Fargo Premier Large Company Growth Fund | | | 27 | |
Class allocations
The separate classes of shares offered by the Fund differ principally in applicable sales charges, distribution, shareholder servicing, and administration fees. Class specific expenses are charged directly to that share class. Investment income, common expenses, and realized and unrealized gains (losses) on investments are allocated daily to each class of shares based on the relative proportion of net assets of each class.
3. FAIR VALUATION MEASUREMENTS
Fair value measurements of investments are determined within a framework that has established a fair value hierarchy based upon the various data inputs utilized in determining the value of the Fund’s investments. The three-level hierarchy gives the highest priority to unadjusted quoted prices in active markets for identical assets or liabilities (Level 1) and the lowest priority to significant unobservable inputs (Level 3). The Fund’s investments are classified within the fair value hierarchy based on the lowest level of input that is significant to the fair value measurement. The inputs are summarized into three broad levels as follows:
| n | | Level 1 – quoted prices in active markets for identical securities |
| n | | Level 2 – other significant observable inputs (including quoted prices for similar securities, interest rates, prepayment speeds, credit risk, use of amortized cost, etc.) |
| n | | Level 3 – significant unobservable inputs (including the Fund’s own assumptions in determining the fair value of investments) |
The inputs or methodologies used for valuing investments in securities are not necessarily an indication of the risk associated with investing in those securities.
The following is a summary of the inputs used in valuing the Fund’s assets and liabilities as of July 31, 2016:
| | | | | | | | | | | | | | | | |
| | | Quoted prices
(Level 1) | | | Other significant
observable inputs
(Level 2) | | | Significant
unobservable inputs (Level 3) | | | Total | |
Assets | | | | | | | | | | | | | | | | |
Investments in: | | | | | | | | | | | | | | | | |
| | | | |
Common stocks | | | | | | | | | | | | | | | | |
Consumer discretionary | | $ | 756,360,108 | | | $ | 0 | | | $ | 0 | | | $ | 756,360,108 | |
Consumer staples | | | 226,699,928 | | | | 0 | | | | 0 | | | | 226,699,928 | |
Energy | | | 52,297,747 | | | | 0 | | | | 0 | | | | 52,297,747 | |
Financials | | | 42,956,706 | | | | 0 | | | | 0 | | | | 42,956,706 | |
Health care | | | 610,923,408 | | | | 0 | | | | 0 | | | | 610,923,408 | |
Industrials | | | 282,736,896 | | | | 0 | | | | 0 | | | | 282,736,896 | |
Information technology | | | 1,325,466,581 | | | | 0 | | | | 0 | | | | 1,325,466,581 | |
Materials | | | 121,502,722 | | | | 0 | | | | 0 | | | | 121,502,722 | |
| | | | |
Short-term investments | | | | | | | | | | | | | | | | |
Investment companies | | | 97,272,258 | | | | 0 | | | | 0 | | | | 97,272,258 | |
Investments measured at net asset value* | | | | | | | | | | | | | | | 20,898,750 | |
Total assets | | $ | 3,516,216,354 | | | $ | 0 | | | $ | 0 | | | $ | 3,537,115,104 | |
| * | Investments that are measured at fair value using the net asset value per share (or its equivalent) as a practical expedient have not been categorized in the fair value hierarchy. The fair value amount presented in the table is intended to permit reconciliation of the fair value hierarchy to the amounts presented in the Statement of Assets and Liabilities. The Fund’s investment in Securities Lending Cash Investments, LLC valued at $20,898,750 does not have a redemption period notice, can be redeemed daily and does not have any unfunded commitments. |
The Fund recognizes transfers between levels within the fair value hierarchy at the end of the reporting period. At July 31, 2016, the Fund did not have any transfers into/out of Level 1, Level 2, or Level 3.
4. TRANSACTIONS WITH AFFILIATES
Management fee
Funds Management, an indirect wholly owned subsidiary of Wells Fargo, is the manager of the Fund and provides advisory and fund-level administrative services under an investment management agreement. Under the investment
| | | | |
| 28 | | Wells Fargo Premier Large Company Growth Fund | | Notes to financial statements |
management agreement, Funds Management is responsible for, among other services, implementing the investment objectives and strategies of the Fund, supervising the subadviser, providing fund-level administrative services in connection with the Fund’s operations, and providing any other fund-level administrative services reasonably necessary for the operation of the Fund. As compensation for its services under the investment management agreement, Funds Management is entitled to receive an annual management fee starting at 0.70% and declining to 0.505% as the average daily net assets of the Fund increase. For the year ended July 31, 2016, the management fee was equivalent to an annual rate of 0.64% of the Fund’s average daily net assets.
Funds Management has retained the services of a subadviser to provide daily portfolio management to the Fund. The fee for subadvisory services is borne by Funds Management. WellsCap is the subadviser to the Fund and is entitled to receive a fee from Funds Management at an annual rate starting at 0.35% and declining to 0.275% as the average daily net assets of the Fund increase.
Administration fees
Under a class-level administration agreement, Funds Management provides class-level administrative services to the Fund, which includes paying fees and expenses for services provided by the transfer agent, sub-transfer agents, omnibus account servicers and record-keepers. As compensation for its services under the class-level administration agreement, Funds Management receives an annual fee which is calculated based on the average daily net assets of each class as follows:
| | | | |
| | | Class-level
administration fee | |
Class A, Class B, Class C | | | 0.21 | % |
Class R4 | | | 0.08 | |
Class R6 | | | 0.03 | |
Administrator Class, Institutional Class | | | 0.13 | |
Investor Class | | | 0.32 | |
Funds Management has contractually waived and/or reimbursed management and administration fees to the extent necessary to maintain certain net operating expense ratios for the Fund. Waiver of fees and/or reimbursement of expenses by Funds Management were made first from fund level expenses on a proportionate basis and then from class specific expenses. Funds Management has committed through November 30, 2016 to waive fees and/or reimburse expenses to the extent necessary to cap the Fund’s expenses at 1.11% for Class A shares, 1.86 for Class B shares, 1.86% for Class C shares, 0.80% for Class R4 shares, 0.65% for Class R6 shares, 1.00% for Administrator Class shares, and 0.70% for Institutional Class shares. After this time, the cap may be increased or the commitment to maintain the cap may be terminated only with the approval of the Board of Trustees. Prior to December 1, 2015, the Fund’s expenses were capped at 0.95% for Administration Class shares.
Distribution fees
The Trust has adopted a distribution plan for Class B and Class C shares of the Fund pursuant to Rule 12b-1 under the 1940 Act. Distribution fees are charged to Class B and Class C shares and paid to Wells Fargo Funds Distributor, LLC (“Funds Distributor”), the principal underwriter, at an annual rate of 0.75% of the average daily net assets of Class B and Class C shares.
In addition, Funds Distributor is entitled to receive the front-end sales charge from the purchase of Class A shares and a contingent deferred sales charge on the redemption of certain Class A shares. Funds Distributor is also entitled to receive the contingent deferred sales charges from redemptions of Class B and Class C shares. For the year ended July 31, 2016, Funds Distributor received $63,210 from the sale of Class A shares and $466 and $2,487 in contingent deferred sales charges from redemptions of Class A and Class C shares, respectively.
Shareholder servicing fees
The Trust has entered into contracts with one or more shareholder servicing agents, whereby Class A, Class B, Class C, Administrator Class, and Investor Class of the Fund are charged a fee at an annual rate of 0.25% of the average daily net assets of each respective class. Class R4 is charged a fee at an annual rate of 0.10% of its average daily net assets.
A portion of these total shareholder servicing fees were paid to affiliates of Wells Fargo.
| | | | | | |
| Notes to financial statements | | Wells Fargo Premier Large Company Growth Fund | | | 29 | |
5. INVESTMENT PORTFOLIO TRANSACTIONS
Purchases and sales of investments, excluding U.S. government obligations (if any) and short-term securities, for the year ended July 31, 2016 were $2,040,630,462 and $3,721,706,318, respectively.
The Fund may purchase or sell investment securities to other Wells Fargo funds under procedures adopted by the Board of Trustees. The procedures have been designed to ensure that these interfund transactions, which generally do not incur broker commissions, are effected at current market prices. Interfund trades are included within the respective purchases and sales amounts shown.
6. BANK BORROWINGS
The Trust (excluding the money market funds and certain other funds) and Wells Fargo Variable Trust are parties to a $200,000,000 revolving credit agreement whereby the Fund is permitted to use bank borrowings for temporary or emergency purposes, such as to fund shareholder redemption requests. Interest under the credit agreement is charged to the Fund based on a borrowing rate equal to the higher of the Federal Funds rate in effect on that day plus 1.25% or the overnight LIBOR rate in effect on that day plus 1.25%. In addition, an annual commitment fee equal to 0.20% of the unused balance is allocated to each participating fund. Prior to September 1, 2015, the revolving credit agreement amount was $150,000,000 and the annual commitment fee was equal to 0.10% of the unused balance which was allocated to each participating fund.
For the year ended July 31, 2016, there were no borrowings by the Fund under the agreement.
7. DISTRIBUTIONS TO SHAREHOLDERS
The tax character of distributions paid was $336,136,280 and $70,185,540 of long-term capital gain for the years ended July 31, 2016 and July 31, 2015, respectively.
As of July 31, 2016, the components of distributable earnings on a tax basis were as follows:
| | | | | | |
Undistributed long-term gain | | Unrealized gains | | Late-year ordinary losses deferred | | Capital loss carryforward |
| $215,929,465 | | $1,182,848,049 | | $(2,656,167) | | $(12,303,738) |
8. CONCENTRATION RISK
Concentration risks result from exposure to a limited number of sectors. A fund that invests a substantial portion of its assets in any sector may be more affected by changes in that sector than would be a fund whose investments are not heavily weighted in any sector.
9. INDEMNIFICATION
Under the Trust’s organizational documents, the officers and Trustees have been granted certain indemnification rights against certain liabilities that may arise out of performance of their duties to the Trust. Additionally, in the normal course of business, the Trust may enter into contracts with service providers that contain a variety of indemnification clauses. The Trust’s maximum exposure under these arrangements is dependent on future claims that may be made against the Fund and, therefore, cannot be estimated.
| | | | |
| 30 | | Wells Fargo Premier Large Company Growth Fund | | Report of independent registered public accounting firm |
BOARD OF TRUSTEES AND SHAREHOLDERS OF WELLS FARGO FUNDS TRUST:
We have audited the accompanying statements of assets and liabilities, including the portfolio of investments, of the Wells Fargo Premier Large Company Growth Fund (formerly known as Wells Fargo Advantage Premier Large Company Growth Fund) (the “Fund”), one of the funds constituting the Wells Fargo Funds Trust, as of July 31, 2016, and the related statement of operations for the year then ended, the statements of changes in net assets for each of the years in the two-year period then ended, and the financial highlights for each of the years or periods in the five-year period then ended. These financial statements and financial highlights are the responsibility of the Fund’s management. Our responsibility is to express an opinion on these financial statements and financial highlights based on our audits.
We conducted our audits in accordance with the standards of the Public Company Accounting Oversight Board (United States). Those standards require that we plan and perform the audit to obtain reasonable assurance about whether the financial statements and financial highlights are free of material misstatement. An audit includes examining, on a test basis, evidence supporting the amounts and disclosures in the financial statements. Our procedures included confirmation of securities owned as of July 31, 2016, by correspondence with the custodian and brokers, or by other appropriate auditing procedures. An audit also includes assessing the accounting principles used and significant estimates made by management, as well as evaluating the overall financial statement presentation. We believe that our audits provide a reasonable basis for our opinion.
In our opinion, the financial statements and financial highlights referred to above present fairly, in all material respects, the financial position of the Wells Fargo Premier Large Company Growth Fund as of July 31, 2016, the results of its operations for the year then ended, the changes in its net assets for each of the years in the two-year period then ended, and the financial highlights for each of the years or periods in the five-year period then ended, in conformity with U.S. generally accepted accounting principles.

Boston, Massachusetts
September 23, 2016
| | | | | | |
| Other information (unaudited) | | Wells Fargo Premier Large Company Growth Fund | | | 31 | |
TAX INFORMATION
Pursuant to Section 852 of the Internal Revenue Code, $336,136,280 was designated as a 20% rate gain distribution for the fiscal year ended July 31, 2016.
PROXY VOTING INFORMATION
A description of the policies and procedures that the Fund uses to determine how to vote proxies relating to portfolio securities is available, upon request, by calling 1-800-222-8222, visiting our website at wellsfargofunds.com, or visiting the SEC website at sec.gov. Information regarding how the Fund voted proxies relating to portfolio securities during the most recent 12-month period ended June 30 is available on the Fund’s website at wellsfargofunds.com or by visiting the SEC website at sec.gov.
PORTFOLIO HOLDINGS INFORMATION
The complete portfolio holdings for the Fund are publicly available monthly on the Fund’s website (wellsfargofunds.com), on a one-month delayed basis. In addition, top ten holdings information (excluding derivative positions) for the Fund is publicly available on the Fund’s website on a monthly, seven-day or more delayed basis. The Fund files its complete schedule of portfolio holdings with the SEC for the first and third quarters of each fiscal year on Form N-Q, which is available by visiting the SEC website at sec.gov. In addition, the Fund’s Form N-Q may be reviewed and copied at the SEC’s Public Reference Room in Washington, DC, and at regional offices in New York City, at 233 Broadway, and in Chicago, at 175 West Jackson Boulevard, Suite 900. Information about the Public Reference Room may be obtained by calling 1-800-SEC-0330.
| | | | |
| 32 | | Wells Fargo Premier Large Company Growth Fund | | Other information (unaudited) |
BOARD OF TRUSTEES AND OFFICERS
Each of the Trustees and Officers1 listed in the table below acts in identical capacities for each fund in the Wells Fargo family of funds, which consists of 139 mutual funds comprising the Wells Fargo Funds Trust, Wells Fargo Variable Trust, Wells Fargo Master Trust and four closed-end funds (collectively the “Fund Complex”). This table should be read in conjunction with the Prospectus and the Statement of Additional Information2. The mailing address of each Trustee and Officer is 525 Market Street, 12th Floor, San Francisco, CA 94105. Each Trustee and Officer serves an indefinite term, however, each Trustee serves such term until reaching the mandatory retirement age established by the Trustees.
Independent Trustees
| | | | | | |
Name and year of birth | | Position held and length of service* | | Principal occupations during past five years or longer | | Current other public
company or
investment company
directorships |
William R. Ebsworth (Born 1957) | | Trustee, since 2015 | | Retired. From 1984 to 2013, equities analyst, portfolio manager, research director and chief financial officer at Fidelity Management and Research Company in Boston, Tokyo, and Hong Kong and retired in 2013 as Chief Investment Officer of Fidelity Strategic Advisers, Inc. where he lead a team of investment professionals managing client assets. Prior thereto, Board member of Hong Kong Securities Clearing Co., Hong Kong Options Clearing Corp., the Thailand International Fund, Ltd., Fidelity Investments Life Insurance Company, and Empire Fidelity Investments Life Insurance Company. Mr. Ebsworth is a CFA® charterholder and an Adjunct Lecturer, Finance, at Babson College. | | Asset Allocation Trust |
Jane A. Freeman (Born 1953) | | Trustee, since 2015 | | Retired. From 2012 to 2014 and 1999 to 2008, Chief Financial Officer of Scientific Learning Corporation. From 2008 to 2012, Ms. Freeman provided consulting services related to strategic business projects. Prior to 1999, Portfolio Manager at Rockefeller & Co. and Scudder, Stevens & Clark. Board member of the Harding Loevner Funds from 1996 to 2014, serving as both Lead Independent Director and chair of the Audit Committee. Board member of the Russell Exchange Traded Funds Trust from 2011 to 2012 and the chair of the Audit Committee. Ms. Freeman is Chair of Taproot Foundation (non-profit organization), a Board Member of Ruth Bancroft Garden (non-profit organization) and an inactive chartered financial analyst. | | Asset Allocation Trust |
Peter G. Gordon (Born 1942) | | Trustee, since 1998; Chairman, since 2005 | | Co-Founder, Retired Chairman, President and CEO of Crystal Geyser Water Company. Trustee Emeritus, Colby College. | | Asset Allocation Trust |
Isaiah Harris, Jr. (Born 1952) | | Trustee, since 2009 | | Retired. Chairman of the Board of CIGNA Corporation since 2009, and Director since 2005. From 2003 to 2011, Director of Deluxe Corporation. Prior thereto, President and CEO of BellSouth Advertising and Publishing Corp. from 2005 to 2007, President and CEO of BellSouth Enterprises from 2004 to 2005 and President of BellSouth Consumer Services from 2000 to 2003. Emeritus member of the Iowa State University Foundation Board of Governors. Emeritus Member of the Advisory Board of Iowa State University School of Business. Advisory Board Member, Palm Harbor Academy (charter school). Advisory Board Member, Child Evangelism Fellowship (non-profit). Mr. Harris is a certified public accountant (inactive status). | | CIGNA Corporation; Asset Allocation Trust |
| Judith M. Johnson (Born 1949) | | Trustee, since 2008;
Audit Committee Chairman, since 2008 | | Retired. Prior thereto, Chief Executive Officer and Chief Investment Officer of Minneapolis Employees Retirement Fund from 1996 to 2008. Ms. Johnson is an attorney, certified public accountant and a certified managerial accountant. | | Asset Allocation Trust |
David F. Larcker (Born 1950) | | Trustee, since 2009 | | James Irvin Miller Professor of Accounting at the Graduate School of Business, Stanford University, Director of the Corporate Governance Research Initiative and Senior Faculty of The Rock Center for Corporate Governance since 2006. From 2005 to 2008, Professor of Accounting at the Graduate School of Business, Stanford University. Prior thereto, Ernst & Young Professor of Accounting at The Wharton School, University of Pennsylvania from 1985 to 2005. | | Asset Allocation Trust |
| | | | | | |
| Other information (unaudited) | | Wells Fargo Premier Large Company Growth Fund | | | 33 | |
| | | | | | |
Name and year of birth | | Position held and length of service* | | Principal occupations during past five years or longer | | Current other public
company or
investment company
directorships |
Olivia S. Mitchell (Born 1953) | | Trustee, since 2006 | | International Foundation of Employee Benefit Plans Professor, Wharton School of the University of Pennsylvania since 1993. Director of Wharton’s Pension Research Council and Boettner Center on Pensions & Retirement Research, and Research Associate at the National Bureau of Economic Research. Previously, Cornell University Professor from 1978 to 1993. | | Asset Allocation Trust |
Timothy J. Penny (Born 1951) | | Trustee, since 1996 | | President and Chief Executive Officer of Southern Minnesota Initiative Foundation, a non-profit organization, since 2007 and Senior Fellow at the Humphrey Institute Policy Forum at the University of Minnesota since 1995. Member of the Board of Trustees of NorthStar Education Finance, Inc., a non-profit organization, since 2007. | | Asset Allocation Trust |
Michael S. Scofield (Born 1943) | | Trustee, since 2010 | | Served on the Investment Company Institute’s Board of Governors and Executive Committee from 2008-2011 as well the Governing Council of the Independent Directors Council from 2006-2011 and the Independent Directors Council Executive Committee from 2008-2011. Chairman of the IDC from 2008-2010. Institutional Investor (Fund Directions) Trustee of Year in 2007. Trustee of the Evergreen Funds complex (and its predecessors) from 1984 to 2010. Chairman of the Evergreen Funds from 2000-2010. Former Trustee of the Mentor Funds. Retired Attorney, Law Offices of Michael S. Scofield. | | Asset Allocation Trust |
| * | Length of service dates reflect the Trustee’s commencement of service with the Trust’s predecessor entities, where applicable. |
Officers
| | | | | | |
Name and year of birth | | Position held and length of service | | Principal occupations during past five years or longer | | |
Karla M. Rabusch (Born 1959) | | President, since 2003 | | Executive Vice President of Wells Fargo Bank, N.A. and President of Wells Fargo Funds Management, LLC since 2003. | | |
Jeremy DePalma1 (Born 1974) | | Treasurer, since 2012 | | Senior Vice President of Wells Fargo Funds Management, LLC since 2009. Senior Vice President of Evergreen Investment Management Company, LLC from 2008 to 2010 and head of the Fund Reporting and Control Team within Fund Administration from 2005 to 2010. | | |
C. David Messman (Born 1960) | | Secretary, since 2000; Chief Legal Officer, since 2003 | | Senior Vice President and Secretary of Wells Fargo Funds Management, LLC since 2001. Assistant General Counsel of Wells Fargo Bank, N.A. since 2013 and Vice President and Managing Counsel of Wells Fargo Bank, N.A. from 1996 to 2013. | | |
Michael Whitaker (Born 1967) | | Chief Compliance Officer, since 2016* | | Executive Vice President of Wells Fargo Funds Management, LLC since 2016. Chief Compliance Officer of Fidelity’s Fixed Income Funds and Asset Allocation Funds from 2008 to 2016, Compliance Officer of FMR Co., Inc. from 2014 to 2016, Fidelity Investments Money Management, Inc. from 2014 to 2016, Fidelity Investments from 2007 to 2016. | | |
David Berardi (Born 1975) | | Assistant Treasurer, since 2009 | | Vice President of Wells Fargo Funds Management, LLC since 2009. Vice President of Evergreen Investment Management Company, LLC from 2008 to 2010. Manager of Fund Reporting and Control for Evergreen Investment Management Company, LLC from 2004 to 2010. | | |
| 1 | Jeremy DePalma acts as Treasurer of 68 funds and Assistant Treasurer of 71 funds in the Fund Complex. |
| 2 | The Statement of Additional Information includes additional information about the Trustees and is available without charge, upon request, by calling 1-800-222-8222 or by visiting the website at wellsfargofunds.com. |
| * | Michael Whitaker became Chief Compliance Officer effective May 16, 2016. |
| | | | |
| 34 | | Wells Fargo Premier Large Company Growth Fund | | Other information (unaudited) |
BOARD CONSIDERATION OF INVESTMENT MANAGEMENT AND SUB-ADVISORY AGREEMENTS:
Under the Investment Company Act of 1940 (the “1940 Act”), the Board of Trustees (the “Board”) of Wells Fargo Funds Trust (the “Trust”) must determine annually whether to approve the continuation of the Trust’s investment management and sub-advisory agreements. In this regard, at an in-person meeting held on May 24-25, 2016 (the “Meeting”), the Board, all the members of which have no direct or indirect interest in the investment management and sub-advisory agreements and are not “interested persons” of the Trust, as defined in the 1940 Act (the “Independent Trustees”), reviewed and approved for Wells Fargo Premier Large Company Growth Fund (the “Fund”): (i) an investment management agreement (the “Management Agreement”) with Wells Fargo Funds Management, LLC (“Funds Management”); and (ii) an investment sub-advisory agreement (the “Sub-Advisory Agreement”) with Wells Capital Management Incorporated (the “Sub-Adviser”), an affiliate of Funds Management. The Management Agreement and the Sub-Advisory Agreement are collectively referred to as the “Advisory Agreements.”
At the Meeting, the Board considered the factors and reached the conclusions described below relating to the selection of Funds Management and the Sub-Adviser and the approval of the Advisory Agreements. Prior to the Meeting, including at an in-person meeting in April 2016, the Trustees conferred extensively among themselves and with representatives of Funds Management about these matters. Also, the Board has adopted a team-based approach, with each team consisting of a sub-set of Trustees, to assist the full Board in the discharge of its duties in reviewing performance and other matters throughout the year. The Independent Trustees were assisted in their evaluation of the Advisory Agreements by independent legal counsel, from whom they received separate legal advice and with whom they met separately.
In providing information to the Board, Funds Management and the Sub-Adviser were guided by a detailed set of requests for information submitted to them by independent legal counsel on behalf of the Independent Trustees at the start of the Board’s annual contract renewal process earlier in 2016. In considering and approving the Advisory Agreements, the Trustees considered the information they believed relevant, including but not limited to the information discussed below. The Board considered not only the specific information presented in connection with the Meeting, but also the knowledge gained over time through interaction with Funds Management and the Sub-Adviser about various topics. In this regard, the Board reviewed reports of Funds Management at each of its quarterly meetings, which included, among other things, portfolio reviews and performance reports. In addition, the Board and the teams mentioned above confer with portfolio managers at various times throughout the year. The Board did not identify any particular information or consideration that was all-important or controlling, and each individual Trustee may have attributed different weights to various factors.
After its deliberations, the Board unanimously approved the continuation of the Advisory Agreements for a one-year term and determined that the compensation payable to Funds Management and the Sub-Adviser under each of the Advisory Agreements was reasonable. The Board considered the approval of the Advisory Agreements for the Fund as part of its consideration of agreements for funds across the complex, but its approvals were made on a fund-by-fund basis. The following summarizes a number of important, but not necessarily all, factors considered by the Board in support of its approvals.
Nature, extent and quality of services
The Board received and considered various information regarding the nature, extent and quality of services provided to the Fund by Funds Management and the Sub-Adviser under the Advisory Agreements. This information included a description of the investment advisory services and Fund-level administrative services covered by the Management Agreement, as well as, among other things, a summary of the background and experience of senior management of Funds Management, and the qualifications, background, tenure and responsibilities of each of the portfolio managers primarily responsible for the day-to-day portfolio management of the Fund.
The Board evaluated the ability of Funds Management and the Sub-Adviser to attract and retain qualified investment professionals, including research, advisory and supervisory personnel. The Board further considered the compliance programs and compliance records of Funds Management and the Sub-Adviser. In addition, the Board took into account the full range of services provided to the Fund by Funds Management and its affiliates.
Fund performance and expenses
The Board considered the performance results for the Fund over various time periods ended December 31, 2015. The Board considered these results in comparison to the performance of funds in a universe that was determined by Broadridge Inc. (“Broadridge”) to be similar to the Fund (the “Universe”), and in comparison to the Fund’s benchmark index and to other comparative data. Broadridge is an independent provider of investment company data. The Board received a description of the methodology used by Broadridge to select the mutual funds in the performance
| | | | | | |
| Other information (unaudited) | | Wells Fargo Premier Large Company Growth Fund | | | 35 | |
Universe. The Board noted that the performance of the Fund (Class A) was higher than or in range of the average performance of the Universe for all periods under review except the three-year period under review. The Board also noted that the performance of the Fund was lower than its benchmark, the Russell 1000® Growth Index, for all periods under review except the ten-year period.
The Board received information concerning, and discussed factors contributing to, the underperformance of the Fund relative to the Universe and benchmark for the periods noted above. The Board took note of the explanations for the relative underperformance in these periods, including with respect to market factors and investment decisions that affected the Fund’s performance.
The Board also received and considered information regarding the Fund’s net operating expense ratios and their various components, including actual management fees, custodian and other non-management fees, and Rule 12b-1 and non-Rule 12b-1 shareholder service fees. The Board considered these ratios in comparison to the median ratios of funds in class-specific expense groups that were determined by Broadridge to be similar to the Fund (the “Groups”). The Board received a description of the methodology used by Broadridge to select the mutual funds in the expense Groups and an explanation of how funds comprising expense groups and their expense ratios may vary from year-to-year. Based on the Broadridge reports, the Board noted that the net operating expense ratios of the Fund were lower than the median net operating expense ratios of the expense Groups.
The Board took into account the Fund performance and expense information provided to it among the factors considered in deciding to re-approve the Advisory Agreements.
Investment management and sub-advisory fee rates
The Board reviewed and considered the contractual fee rates payable by the Fund to Funds Management under the Management Agreement, as well as the contractual fee rates payable by the Fund to Funds Management for class-level administrative services under a Class-Level Administration Agreement, which include class-level transfer agency and sub-transfer agency costs (collectively, the “Management Rates”). The Board also reviewed and considered the contractual investment sub-advisory fee rates that are payable by Funds Management to the Sub-Adviser for investment sub-advisory services.
Among other information reviewed by the Board was a comparison of the Fund’s Management Rates with the average contractual investment management fee rates of funds in the expense Groups at a common asset level as well as transfer agency costs of the funds in the expense Groups. The Board noted that the Management Rates of the Fund were lower than or equal to the sum of these average rates for the Fund’s expense Groups for all share classes.
The Board also received and considered information about the portion of the total management fee that was retained by Funds Management after payment of the fee to the Sub-Adviser for sub-advisory services. In assessing the reasonableness of this amount, the Board received and evaluated information about the nature and extent of responsibilities retained and risks assumed by Funds Management and not delegated to or assumed by the Sub-Adviser, and about Funds Management’s on-going oversight services. However, given the affiliation between Funds Management and the Sub-Adviser, the Board ascribed limited relevance to the allocation of fees between them.
The Board also received and considered information about the nature and extent of services offered and fee rates charged by Funds Management and the Sub-Adviser to other types of clients with investment strategies similar to those of the Fund. In this regard, the Board received information about the significantly greater scope of services, and compliance, reporting and other legal burdens and risks of managing mutual funds compared with those associated with managing assets of non-mutual fund clients such as collective funds or institutional separate accounts.
Based on its consideration of the factors and information it deemed relevant, including those described here, the Board determined that the compensation payable to Funds Management under the Management Agreement and to the Sub-Adviser under the Sub-Advisory Agreement was reasonable, in light of the services covered by the Advisory Agreements.
Profitability
The Board received and considered information concerning the profitability of Funds Management, as well as the profitability of Wells Fargo as a whole, from providing services to the Fund and the fund family as a whole. The Board also received and considered information concerning the profitability of the Sub-Adviser from providing services to the fund family as a whole, noting that the Sub-Adviser’s profitability information with respect to providing services to the Fund was subsumed in the Wells Fargo and Funds Management profitability analysis.
Funds Management reported on the methodologies and estimates used in calculating profitability. Among other things, the Board noted that the levels of profitability reported on a fund-by-fund basis varied widely, depending on factors such
| | | | |
| 36 | | Wells Fargo Premier Large Company Growth Fund | | Other information (unaudited) |
as the size and type of fund. Based on its review, the Board did not deem the profits reported by Funds Management or Wells Fargo from its services to the Fund to be at a level that would prevent it from approving the continuation of the Advisory Agreements.
Economies of scale
With respect to possible economies of scale, the Board noted the existence of breakpoints in the Fund’s management fee structure, which operate generally to reduce the Fund’s expense ratios as the Fund grows in size. It considered that, for a small fund or a fund that shrinks in size, breakpoints conversely can result in higher fee levels. The Board also considered that fee waiver and expense reimbursement arrangements and competitive fee rates at the outset are means of sharing potential economies of scale with shareholders of the Fund and the fund family as a whole. The Board considered Funds Management’s view that any analyses of potential economies of scale in managing a particular fund are inherently limited in light of the joint and common costs and investments that Funds Management incurs across the fund family as a whole.
The Board concluded that the Fund’s fee and expense arrangements, including contractual breakpoints, constituted a reasonable approach to sharing potential economies of scale with the Fund and its shareholders.
Other benefits to Funds Management and the Sub-Adviser
The Board received and considered information regarding potential “fall-out” or ancillary benefits received by Funds Management and its affiliates, including the Sub-Adviser, as a result of their relationships with the Fund. Ancillary benefits could include, among others, benefits directly attributable to other relationships with the Fund and benefits potentially derived from an increase in Funds Management’s and the Sub-Adviser’s business as a result of their relationships with the Fund. The Board noted that various affiliates of Funds Management may receive distribution-related fees, shareholder servicing payments and sub-transfer agency fees in respect of shares sold or held through them and services provided.
The Board also reviewed information about soft dollar credits earned and utilized by the Sub-Adviser, fees earned by Funds Management and the Sub-Adviser from managing a private investment vehicle for the fund family’s securities lending collateral and commissions earned by an affiliated broker from portfolio transactions.
Based on its consideration of the factors and information it deemed relevant, including those described here, the Board did not find that any ancillary benefits received by Funds Management and its affiliates, including the Sub-Adviser, were unreasonable.
Conclusion
At the Meeting, after considering the above-described factors and based on its deliberations and its evaluation of the information described above, the Board unanimously approved the continuation of the Advisory Agreements for a one-year term and determined that the compensation payable to Funds Management and the Sub-Adviser under each of the Advisory Agreements was reasonable.
| | | | | | |
| List of abbreviations | | Wells Fargo Premier Large Company Growth Fund | | | 37 | |
The following is a list of common abbreviations for terms and entities that may have appeared in this report.
| ACA | — ACA Financial Guaranty Corporation |
| ADR | — American depositary receipt |
| ADS | — American depositary shares |
| AGC | — Assured Guaranty Corporation |
| AGM | — Assured Guaranty Municipal |
| Ambac | — Ambac Financial Group Incorporated |
| AMT | — Alternative minimum tax |
| BAN | — Bond anticipation notes |
| BHAC | — Berkshire Hathaway Assurance Corporation |
| CAB | — Capital appreciation bond |
| CCAB | — Convertible capital appreciation bond |
| CDA | — Community Development Authority |
| CDO | — Collateralized debt obligation |
| DRIVER | — Derivative inverse tax-exempt receipts |
| DW&P | — Department of Water & Power |
| DWR | — Department of Water Resources |
| ECFA | — Educational & Cultural Facilities Authority |
| EDA | — Economic Development Authority |
| EDFA | — Economic Development Finance Authority |
| ETF | — Exchange-traded fund |
| FDIC | — Federal Deposit Insurance Corporation |
| FFCB | — Federal Farm Credit Banks |
| FGIC | — Financial Guaranty Insurance Corporation |
| FHA | — Federal Housing Administration |
| FHLB | — Federal Home Loan Bank |
| FHLMC | — Federal Home Loan Mortgage Corporation |
| FICO | — The Financing Corporation |
| FNMA | — Federal National Mortgage Association |
| GDR | — Global depositary receipt |
| GNMA | — Government National Mortgage Association |
| HCFR | — Healthcare facilities revenue |
| HEFA | — Health & Educational Facilities Authority |
| HEFAR | — Higher education facilities authority revenue |
| HFA | — Housing Finance Authority |
| HFFA | — Health Facilities Financing Authority |
| HUD | — Department of Housing and Urban Development |
| IDA | — Industrial Development Authority |
| IDAG | — Industrial Development Agency |
| KRW | — Republic of Korea won |
| LIBOR | — London Interbank Offered Rate |
| LIFER | — Long Inverse Floating Exempt Receipts |
| LLC | — Limited liability company |
| LLLP | — Limited liability limited partnership |
| LLP | — Limited liability partnership |
| MBIA | — Municipal Bond Insurance Association |
| MFHR | — Multifamily housing revenue |
| MSTR | — Municipal securities trust receipts |
| MUD | — Municipal Utility District |
| National | — National Public Finance Guarantee Corporation |
| PCFA | — Pollution Control Financing Authority |
| PCL | — Public Company Limited |
| PCR | — Pollution control revenue |
| PFA | — Public Finance Authority |
| PFFA | — Public Facilities Financing Authority |
| PFOTER | — Puttable floating option tax-exempt receipts |
| plc | — Public limited company |
| PUTTER | — Puttable tax-exempt receipts |
| R&D | — Research & development |
| Radian | — Radian Asset Assurance |
| RAN | — Revenue anticipation notes |
| RDA | — Redevelopment Authority |
| RDFA | — Redevelopment Finance Authority |
| REIT | — Real estate investment trust |
| ROC | — Reset option certificates |
| SAVRS | — Select auction variable rate securities |
| SBA | — Small Business Authority |
| SDR | — Swedish depositary receipt |
| SFHR | — Single-family housing revenue |
| SFMR | — Single-family mortgage revenue |
| SPA | — Standby purchase agreement |
| SPDR | — Standard & Poor’s Depositary Receipts |
| SPEAR | — Short Puttable Exempt Adjustable Receipts |
| STRIPS | — Separate trading of registered interest and |
| TAN | — Tax anticipation notes |
| TIPS | — Treasury inflation-protected securities |
| TRAN | — Tax revenue anticipation notes |
| TTFA | — Transportation Trust Fund Authority |
| TVA | — Tennessee Valley Authority |
This page is intentionally left blank.
This page is intentionally left blank.
This page is intentionally left blank.

For more information
More information about Wells Fargo Funds is available free upon request. To obtain literature, please write, email, visit the Fund’s website, or call:
Wells Fargo Funds
P.O. Box 8266
Boston, MA 02266-8266
Email: fundservice@wellsfargo.com
Website: wellsfargofunds.com
Individual investors: 1-800-222-8222
Retail investment professionals: 1-888-877-9275
Institutional investment professionals: 1-866-765-0778
This report and the financial statements contained herein are submitted for the general information of the shareholders of the Fund. If this report is used for promotional purposes, distribution of the report must be accompanied or preceded by a current prospectus. Before investing, please consider the investment objectives, risks, charges, and expenses of the investment. For a current prospectus and, if available, a summary prospectus, containing this information, call 1-800-222-8222 or visit the Fund’s website at wellsfargofunds.com. Read the prospectus carefully before you invest or send money.
Wells Fargo Asset Management (WFAM) is a trade name used by the asset management businesses of Wells Fargo & Company. Wells Fargo Funds Management, LLC, a wholly owned subsidiary of Wells Fargo & Company, provides investment advisory and administrative services for Wells Fargo Funds. Other affiliates of Wells Fargo & Company provide subadvisory and other services for the funds. The funds are distributed by Wells Fargo Funds Distributor, LLC, Member FINRA, an affiliate of Wells Fargo & Company.
NOT FDIC INSURED ¡ NO BANK GUARANTEE ¡ MAY LOSE VALUE
© 2016 Wells Fargo Funds Management, LLC. All rights reserved.
| | |
 | | 245329 09-16 A212/AR212 07-16 |
ITEM 2. CODE OF ETHICS
(a) As of the end of the period covered by the report, Wells Fargo Funds Trust has adopted a code of ethics that applies to its President and Treasurer. A copy of the code of ethics is filed as an exhibit to this Form N-CSR.
(c) During the period covered by this report, there were no amendments to the provisions of the code of ethics adopted in Item 2(a) above.
(d) During the period covered by this report, there were no implicit or explicit waivers to the provisions of the code of ethics adopted in Item 2(a) above.
ITEM 3. AUDIT COMMITTEE FINANCIAL EXPERT
The Board of Trustees of Wells Fargo Funds Trust has determined that Judith Johnson is an audit committee financial expert, as defined in Item 3 of Form N-CSR. Mrs. Johnson is independent for purposes of Item 3 of Form N-CSR.
ITEM 4. PRINCIPAL ACCOUNTANT FEES AND SERVICES
(a), (b), (c), (d) The following table presents aggregate fees billed in each of the last two fiscal years for services rendered
to the Registrant by the Registrant’s principal accountant. These fees were billed to the registrant and were approved by
the Registrant’s audit committee.
| | | | | | | | |
| | | Fiscal | | | Fiscal | |
| | | year ended | | | year ended | |
| | | July 31, 2016 | | | July 31, 2015 | |
Audit fees | | $ | 302,656 | | | $ | 296,590 | |
Audit-related fees | | | — | | | | — | |
Tax fees (1) | | | 39,450 | | | | 40,200 | |
All other fees | | | — | | | | — | |
| | | | | | | | |
| | $ | 342,106 | | | $ | 336,790 | |
| | | | | | | | |
| (1) | Tax fees consist of fees for tax compliance, tax advice, tax planning and excise tax. |
(e) The Chairman of the Audit Committees is authorized to pre-approve: (1) audit services for the mutual funds of Wells Fargo Funds Trust; (2) non-audit tax or compliance consulting or training services provided to the Funds by the independent auditors (“Auditors”) if the fees for any particular engagement are not anticipated to exceed $50,000; and (3) non-audit tax or compliance consulting or training services provided by the Auditors to a Fund’s investment adviser and its controlling entities (where pre-approval is required because the engagement relates directly to the operations and financial reporting of the Fund) if the fee to the Auditors for any particular engagement is not anticipated to exceed $50,000. For any such pre-approval sought from the Chairman, Management shall prepare a brief description of the proposed services. If the Chairman approves of such service, he or she shall sign the statement prepared by Management. Such written statement shall be presented to the full Committees at their next regularly scheduled meetings.
(f) Not applicable
(g) Not applicable
(h) Not applicable
ITEM 5. AUDIT COMMITTEE OF LISTED REGISTRANTS
Not applicable.
ITEM 6. INVESTMENTS
A Portfolio of Investments for each series of Wells Fargo Funds Trust is included as part of the report to shareholders filed under Item 1 of this Form.
ITEM 7. DISCLOSURE OF PROXY VOTING POLICIES AND PROCEDURES FOR CLOSED-END MANAGEMENT INVESTMENT COMPANIES
Not applicable.
ITEM 8. PORTFOLIO MANAGERS OF CLOSED-END MANAGEMENT INVESTMENT COMPANIES
Not applicable.
ITEM 9. PURCHASES OF EQUITY SECURITIES BY CLOSED-END MANAGEMENT INVESTMENT COMPANY AND AFFILIATED PURCHASERS
Not applicable.
ITEM 10. SUBMISSION OF MATTERS TO A VOTE OF SECURITY HOLDERS
There have been no material changes to the procedures by which shareholders may recommend nominees to the registrant’s Board of Trustees that have been implemented since the registrant’s last provided disclosure in response to the requirements of this Item.
ITEM 11. CONTROLS AND PROCEDURES
(a) The President and Treasurer have concluded that the Wells Fargo Funds Trust (the “Trust”) disclosure controls and procedures (as defined in Rule 30a-3(c) under the Investment Company Act of 1940) provide reasonable assurances that material information relating to the Trust is made known to them by the appropriate persons based on their evaluation of these controls and procedures as of a date within 90 days of the filing of this report.
(b) There were no significant changes in the Trust’s internal controls over financial reporting (as defined in Rule 30a-3(d) under the Investment Company Act of 1940) that occurred during the second fiscal quarter of the period covered by this report that materially affected, or is reasonably likely to materially affect, the registrant’s internal control over financial reporting.
ITEM 12. EXHIBITS
(a)(1) Code of Ethics pursuant to Item 2 of Form N-CSR is filed and attached hereto as Exhibit COE.
(a)(2) Certification pursuant to Rule 30a-2(a) under the Investment Company Act of 1940 (17 CFR 270.30a-2(a)) is filed and attached hereto as Exhibit 99.CERT.
(a)(3) Not applicable.
(b) Certification pursuant to Rule 30a-2(b) under the Investment Company Act of 1940 (17 CFR 270.30a-2(b)) is filed and attached hereto as Exhibit 99.906CERT.
SIGNATURES
Pursuant to the requirements of the Securities Exchange Act of 1934 and the Investment Company Act of 1940, the registrant has duly caused this report to be signed on its behalf by the undersigned, thereunto duly authorized.
| | |
| Wells Fargo Funds Trust |
| |
| By: | | /s/ Karla M. Rabusch |
| |
| | Karla M. Rabusch |
| | President |
| |
| Date: | | September 23, 2016 |
Pursuant to the requirements of the Securities Exchange Act of 1934 and the Investment Company Act of 1940, this report has been signed below by the following persons on behalf of the registrant and in the capacities and on the date indicated.
| | |
Wells Fargo Funds Trust |
| |
By: | | /s/ Karla M. Rabusch |
| |
| | Karla M. Rabusch |
| | President |
| |
Date: | | September 23, 2016 |
| |
By: | | /s/ Jeremy DePalma |
| |
| | Jeremy DePalma |
| | Treasurer |
| |
Date: | | September 23, 2016 |