
UNITED STATES
SECURITIES AND EXCHANGE COMMISSION
Washington, D.C. 20549
FORM N-CSR
CERTIFIED SHAREHOLDER REPORT OF REGISTERED
MANAGEMENT INVESTMENT COMPANIES
Investment Company Act file number: 811-09253
Wells Fargo Funds Trust
(Exact name of registrant as specified in charter)
525 Market St., San Francisco, CA 94105
(Address of principal executive offices) (Zip code)
C. David Messman
Wells Fargo Funds Management, LLC
525 Market St., San Francisco, CA 94105
(Name and address of agent for service)
Registrant’s telephone number, including area code: 800-222-8222
Date of fiscal year end: December 31
Registrant is making a filing for: Wells Fargo CoreBuilder Shares-Series M
Date of reporting period: December 31, 2016
| ITEM 1. | REPORT TO STOCKHOLDERS |
Annual Report
December 31, 2016

Wells Fargo Managed Account

| ∎ | | Wells Fargo Managed Account CoreBuilder® Shares – Series M |

Reduce clutter. Save trees.
Sign up for electronic delivery of prospectuses and shareholder reports at wellsfargo.com/advantagedelivery
Contents
The views expressed and any forward-looking statements are as of December 31, 2016, unless otherwise noted, and are those of the Fund managers and/or Wells Fargo Funds Management, LLC. Discussions of individual securities, or the markets generally, or any Wells Fargo Fund are not intended as individual recommendations. Future events or results may vary significantly from those expressed in any forward-looking statements. The views expressed are subject to change at any time in response to changing circumstances in the market. Wells Fargo Funds Management, LLC and the Fund disclaim any obligation to publicly update or revise any views expressed or forward-looking statements.
NOT FDIC INSURED ◾ NO BANK GUARANTEE ◾ MAY LOSE VALUE
| | | | |
| 2 | | Wells Fargo Managed Account CoreBuilder Shares – Series M | | Performance highlights (unaudited) |
Investment objective
The Fund seeks total return, consisting of current income and capital appreciation.
Manager
Wells Fargo Funds Management, LLC
Subadviser
Wells Capital Management Incorporated
Portfolio managers
Lyle J. Fitterer, CFA®, CPA
Robert J. Miller
Average annual total returns (%) as of December 31, 2016
| | | | | | | | | | | | | | |
| | | Inception date | | 1 year | | | 5 year | | | Since inception | |
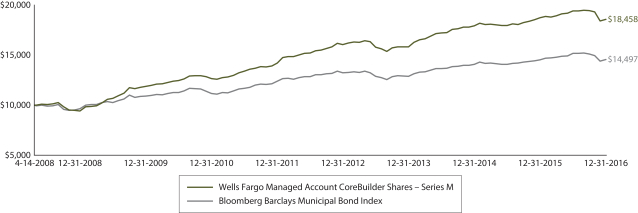
| Wells Fargo Managed Account CoreBuilder Shares – Series M | | 4-14-2008 | | | (0.75 | ) | | | 5.48 | | | | 7.29 | |
| Bloomberg Barclays Municipal Bond Index1 | | – | | | 0.25 | | | | 3.28 | | | | 4.35 | |
Figures quoted represent past performance, which is no guarantee of future results, and do not reflect taxes that a shareholder may pay on fund distributions or the redemption of fund shares. Investment return and principal value of an investment will fluctuate so that an investor’s shares, when redeemed, may be worth more or less than their original cost. Current performance may be lower or higher than the performance data quoted, which assumes the reinvestment of dividends and capital gains. Current month-end performance is available by calling 1-888-877-9275.
Index returns do not include transaction costs associated with buying and selling securities, any mutual fund fees or expenses, or any taxes. It is not possible to invest directly in an index.
Bond values fluctuate in response to the financial condition of individual issuers, general market and economic conditions, and changes in interest rates. Changes in market conditions and government policies may lead to periods of heightened volatility in the bond market and reduced liquidity for certain bonds held by the Fund. In general, when interest rates rise, bond values fall and investors may lose principal value. Interest-rate changes and their impact on the Fund and its share price can be sudden and unpredictable. The use of derivatives may reduce returns and/or increase volatility. Certain investment strategies tend to increase the total risk of an investment (relative to the broader market). The Fund is exposed to high-yield securities risk and municipal securities risk. Consult the Fund’s prospectus for additional information on these and other risks. A portion of the Fund’s income may be subject to federal, state, and/or local income taxes or the Alternative Minimum Tax (AMT). Any capital gains distributions may be taxable.
CoreBuilder Shares are a series of investment options within the separately managed accounts advised or subadvised by Wells Fargo Funds Management, LLC. The shares are fee-waived mutual funds that enable certain separately managed account investors to achieve greater diversification than smaller managed accounts might otherwise achieve.
Please remember that shares of the Fund may be purchased only by or on behalf of separately managed account clients where Wells Fargo Funds Management, LLC has an agreement to serve as investment adviser or subadviser to the account with the separately managed account sponsor (typically a registered investment adviser or broker/dealer) or directly with the client.
Please see footnotes on page 3.
| | | | | | |
| Performance highlights (unaudited) | | Wells Fargo Managed Account CoreBuilder Shares – Series M | | | 3 | |
|
| Growth of $10,000 investment as of December 31, 20162 |
|
|
| 1 | The Bloomberg Barclays Municipal Bond Index (formerly known as Barclays Municipal Bond Index) is an unmanaged index composed of long-term tax-exempt bonds with a minimum credit rating of Baa. You cannot invest directly in an index. |
| 2 | The chart compares the performance of the Fund since inception with the Bloomberg Barclays Municipal Bond Index. The chart assumes a hypothetical $10,000 investment and reflects all operating expenses of the Fund. |
| 3 | The S&P 500 Index consists of 500 stocks chosen for market size, liquidity, and industry group representation. It is a market-value-weighted index with each stock’s weight in the index proportionate to its market value. You cannot invest directly in an index. |
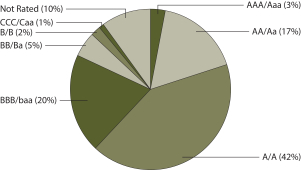
| 4 | The credit quality distribution of portfolio holdings reflected in the chart is based on ratings from Standard & Poor’s, Moody’s Investors Service, and/or Fitch Ratings Ltd. Credit quality ratings apply to the underlying holdings of the Fund and not to the Fund itself. The percentages of the Fund’s portfolio with the ratings depicted in the chart are calculated based on the total market value of fixed income securities held by the Fund. If a security was rated by all three rating agencies, the middle rating was utilized. If rated by two of three rating agencies, the lower rating was utilized, and if rated by one of the rating agencies, that rating was utilized. Standard & Poor’s rates the creditworthiness of bonds, ranging from AAA (highest) to D (lowest). Ratings from A to CCC may be modified by the addition of a plus (+) or minus (-) sign to show relative standing within the rating categories. Standard & Poor’s rates the creditworthiness of short-term notes from SP-1 (highest) to SP-3 (lowest). Moody’s rates the creditworthiness of bonds, ranging from Aaa (highest) to C (lowest). Ratings Aa to B may be modified by the addition of a number 1 (highest) to 3 (lowest) to show relative standing within the ratings categories. Moody’s rates the creditworthiness of short-term U.S. tax-exempt municipal securities from MIG 1/VMIG 1 (highest) to SG (lowest). Fitch rates the creditworthiness of bonds, ranging from AAA (highest) to D (lowest). Credit quality distribution is subject to change and may have changed since the date specified. |
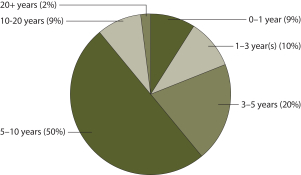
| 5 | Amounts are calculated based on the total investments of the Fund. These amounts are subject to change and may have changed since the date specified. |
| | | | |
| 4 | | Wells Fargo Managed Account CoreBuilder Shares – Series M | | Performance highlights (unaudited) |
MANAGER’S DISCUSSION
Fund highlights
| ∎ | | The Fund underperformed its benchmark, the Bloomberg Barclays Municipal Bond Index, for the 12-month period that ended December 31, 2016. |
| ∎ | | Duration and yield curve positioning were positive contributors to performance but were insufficient to offset individual security selection, a detractor to performance. |
| ∎ | | Use of the basis trade (that is, tactical short positions of U.S. Treasury futures) overall detracted from performance. |
Municipal bond returns were modestly positive and underperformed other fixed income asset classes and equities in 2016.
Municipal bonds, as measured by the Bloomberg Barclays Municipal Bond Index, returned 0.25% during 2016, underperforming fixed-income asset classes such as corporates; Treasuries; mortgages; and stock indexes, such as the S&P 500 Index.3 Municipals did well in the first half of the year, bolstered by rallies in credit and the intermediate and longer-end of the yield curve. Supply and demand technical factors, which had been supportive of the market, turned sharply negative in the third quarter. In the fourth quarter, municipal mutual fund flows turned negative (reversing a trend of 54 weeks of positive flows) and municipal bond supply increased. Deteriorating technicals, along with the expectation of an expansionary fiscal policy and lower tax rates under the new administration, drove market volatility; credit spreads widened and the yield curve steepened as municipal yields rose.
Credit and security selection were the key to Fund’s underperformance.
The Fund’s credit allocation to overweight lower-rated investment-grade bonds, which outperformed high-grade paper, was initially positive. However, the Fund’s BB-rated and nonrated categories underperformed in the second half of the year which more than offset the earlier positive position.
Security selection, often the largest contributor of performance, negatively affected performance in 2016. Rigorous credit analysis by our research team sought to identify credits that could benefit the Fund by recognizing opportunities and avoiding pitfalls. Relative-value trading also sought to enhance performance as we optimized buys and sells in certain issuers. Exposure to First Energy, Virgin Islands Public Finance Authority, Metropolitan Pier & Exposition Authority, and the Chicago Board of Education hurt performance. Our basis trade, used to hedge some longer-dated bonds and manage duration, was a net detractor from performance. The largest single contributor to performance was a trade executed in the first half of the year which exploited the disconnect between corporate high-yield and municipal high-yield bonds. Also contributing to performance were the following bonds: New York MTA; Wyandotte County, Kansas; Cleveland County, Oklahoma Education Facilities Authority; and Metropolitan Pier 0’s of 2030.
The Fund’s duration position aided performance. As the rally continued and credit spreads contracted in the first two quarters, we sold into strength and moved duration shorter than the benchmark. Treasury futures were used as a duration management tool to meet our duration target without foregoing the income associated with being more fully invested. During the market sell-off in the second half of the year, we were net buyers; this brought duration slightly long to the benchmark in anticipation of possible strong market technicals in early 2017. Meanwhile, the Fund’s yield-curve positioning was suboptimal in the first half of the year since it was underweight the long-end of the yield-curve, but this underweight aided performance later in the year.
We believe municipal market performance could be modest in 2017.
We believe municipal returns to be in the low single-digit area with income driving performance as interest rates rise. Tax reform and an expansionary fiscal policy may result in increased economic growth and higher inflation, though longer-term growth may be potentially muted by a more protectionist stance. We believe the Federal Reserve may raise the federal funds rate two or three times in 2017, and there is a low probability of any change to the tax preference of municipal bonds. Changes to individual tax rates are likely, but we do not anticipate any notable impact on municipal yields given historical precedent: municipal bond supply and general direction of interest rates are the key drivers of yields. Corporate tax reform may have some impact on our market since approximately 25% of all municipal bonds are held by banks and insurance companies. If corporate tax rates are lowered, there may be less appetite among companies to add exposure since the tax-adjusted yields would decrease.
Please see footnotes on page 3.
| | | | | | |
| Performance highlights (unaudited) | | Wells Fargo Managed Account CoreBuilder Shares – Series M | | | 5 | |
While improvements in the economy have been supportive of lower-rated municipal debt, we see fewer opportunities going forward. We continue to favor BBB-rated and A-rated credits, but rich valuations will temper the selection process. We expect that a higher degree of security selection will be necessary in the coming year, as compared to 2016.
In our view, opportunities in municipals remain solid. We will continue to manage interest-rate and credit risk, and position the Fund along the yield curve in a barbell manner that includes bonds with maturities in steeper parts of the yield curve, and tap our experienced research team to uncover municipal bonds with strong relative values from among the many municipal bond issuers.
|
| Credit quality as of December 31, 20164 |
|
 |
|
| Effective maturity distribution as of December 31, 20165 |
|
 |
Please see footnotes on page 3.
| | | | |
| 6 | | Wells Fargo Managed Account CoreBuilder Shares – Series M | | Fund expenses (unaudited) |
As a shareholder of the Fund, you incur ongoing costs and other Fund expenses. This example is intended to help you understand your ongoing costs (in dollars) of investing in the Fund and to compare these costs with the ongoing costs of investing in other mutual funds.
The example is based on an investment of $1,000 invested at the beginning of the six-month period and held for the entire period from July 1, 2016 to December 31, 2016.
Actual expenses
The “Actual” line of the table below provides information about actual account values and actual expenses. You may use the information in this line, together with the amount you invested, to estimate the expenses that you paid over the period. Simply divide your account value by $1,000 (for example, an $8,600 account value divided by $1,000 = 8.6), then multiply the result by the number in the “Actual” line under the heading entitled “Expenses paid during period” for your applicable class of shares to estimate the expenses you paid on your account during this period.
Hypothetical example for comparison purposes
The “Hypothetical” line of the table below provides information about hypothetical account values and hypothetical expenses based on the Fund’s actual expense ratio and an assumed rate of return of 5% per year before expenses, which is not the Fund’s actual return. The hypothetical account values and expenses may not be used to estimate the actual ending account balance or expenses you paid for the period. You may use this information to compare the ongoing costs of investing in the Fund and other funds. To do so, compare this 5% hypothetical example with the 5% hypothetical examples that appear in the shareholder reports of the other funds.
Please note that the expenses shown in the table are meant to highlight your ongoing costs. Therefore, the “Hypothetical” line of the table is useful in comparing ongoing costs only and will not help you determine the relative total costs of owning different funds.
| | | | | | | | | | | | | | | | |
| | | Beginning
account value
7-1-2016 | | | Ending
account value
12-31-2016 | | | Expenses
paid during
the period¹ | | | Annualized net
expense ratio | |
Actual | | $ | 1,000.00 | | | $ | 957.99 | | | $ | 0.00 | * | | | 0.00 | %* |
Hypothetical (5% return before expenses) | | $ | 1,000.00 | | | $ | 1,025.14 | | | $ | 0.00 | * | | | 0.00 | %* |
| 1 | Expenses paid is equal to the annualized net expense ratio multiplied by the average account value over the period, multiplied by the number of days in the most recent fiscal half-year divided by the number of days in the fiscal year (to reflect the one-half-year period). |
| * | Generally, no ordinary operating fees or expenses are charged to the Fund. Wells Fargo Funds Management, LLC has contractually committed to irrevocably absorb and pay or reimburse all ordinary operating expenses of the Fund, except portfolio transactions or other investment-related costs (e.g., commissions), fees payable for services provided by the Fund’s securities lending agent, interest, taxes, leverage expenses and other expenses not incurred in the ordinary course of the Fund’s business. This commitment has an indefinite term. |
| | | | | | |
| Portfolio of investments—December 31, 2016 | | Wells Fargo Managed Account CoreBuilder Shares – Series M | | | 7 | |
| | | | | | | | | | | | | | | | |
| Security name | | Interest rate | | | Maturity date | | | Principal | | | Value | |
| | | | |
Municipal Obligations: 99.51% | | | | | | | | | | | | | | | | |
| | | | |
| Alabama: 1.26% | | | | | | | | | | | | | | | | |
Alabama Federal Aid Highway Finance Authority Series A (Tax Revenue) | | | 5.00 | % | | | 9-1-2035 | | | $ | 3,250,000 | | | $ | 3,768,245 | |
Alabama State University General Tuition and Fee (Education Revenue, Syncora Guarantee Incorporated Insured) | | | 5.25 | | | | 8-1-2032 | | | | 1,500,000 | | | | 1,429,335 | |
Jefferson County AL CAB Series B (Water & Sewer Revenue, AGM Insured) ¤ | | | 0.00 | | | | 10-1-2026 | | | | 1,350,000 | | | | 915,786 | |
Jefferson County AL Series A (GO Revenue) | | | 4.90 | | | | 4-1-2021 | | | | 670,000 | | | | 697,798 | |
| |
| | | | 6,811,164 | |
| | | | | | | | | | | | | | | | |
| | | | |
| Alaska: 0.41% | | | | | | | | | | | | | | | | |
Alaska International Airport Series B (Airport Revenue) | | | 5.00 | | | | 10-1-2035 | | | | 2,000,000 | | | | 2,211,680 | |
| | | | | | | | | | | | | | | | |
| | | | |
| Arizona: 3.37% | | | | | | | | | | | | | | | | |
City of San Luis AZ Pledged Excise Tax Series A (Tax Revenue, Build America Mutual Assurance Company Insured) | | | 5.00 | | | | 7-1-2038 | | | | 1,200,000 | | | | 1,329,552 | |
Florence AZ IDA Legacy Traditional School Project Queen Creek & Casa Grande Campuses (Education Revenue) | | | 5.00 | | | | 7-1-2023 | | | | 650,000 | | | | 674,453 | |
Maricopa County AZ IDA Horizon Community Learning Center Project (Education Revenue) | | | 5.00 | | | | 7-1-2035 | | | | 3,000,000 | | | | 3,072,960 | |
Maricopa County AZ IDA Senior Living Facility Series 2016 (Health Revenue) 144A | | | 6.00 | | | | 1-1-2048 | | | | 2,000,000 | | | | 1,829,500 | |
Phoenix AZ IDA Education Great Hearts Academies-Veritas Project (Education Revenue) | | | 6.00 | | | | 7-1-2032 | | | | 500,000 | | | | 535,305 | |
Phoenix AZ IDA Education Great Hearts Academies-Veritas Project (Education Revenue) | | | 6.25 | | | | 7-1-2032 | | | | 315,000 | | | | 339,104 | |
Pima County AZ IDA Educational Facility Charter School Project Series R (Education Revenue) | | | 2.88 | | | | 7-1-2021 | | | | 1,000,000 | | | | 979,270 | |
Pima County AZ IDA Educational Facility Desert Heights Charter School (Education Revenue) | | | 7.00 | | | | 5-1-2034 | | | | 1,000,000 | | | | 1,072,620 | |
Pima County AZ IDA New Plan Learning Project Series A (Education Revenue) | | | 7.75 | | | | 7-1-2035 | | | | 1,000,000 | | | | 1,004,870 | |
Pima County AZ IDA Noah Webster Schools Project Series A (Education Revenue) | | | 6.75 | | | | 12-15-2033 | | | | 1,120,000 | | | | 1,218,885 | |
Pima County AZ IDA Paideia Academies Project (Education Revenue) 144A | | | 5.00 | | | | 7-1-2025 | | | | 830,000 | | | | 830,000 | |
Pima County AZ IDA Paideia Academies Project (Education Revenue) 144A | | | 6.00 | | | | 7-1-2035 | | | | 1,025,000 | | | | 1,031,099 | |
Pima County AZ IDA Paideia Academies Project (Education Revenue) 144A | | | 6.13 | | | | 7-1-2045 | | | | 1,000,000 | | | | 1,000,980 | |
Salt Verde Financial Corporation (Utilities Revenue, Citibank NA Guaranty Agreement) | | | 5.00 | | | | 12-1-2032 | | | | 2,055,000 | | | | 2,315,923 | |
Verrado AZ Community Facilities District #1 (GO Revenue) 144A | | | 5.00 | | | | 7-15-2022 | | | | 500,000 | | | | 522,625 | |
Yavapai County AZ IDA Business & Equine Center Project (Education Revenue) | | | 4.63 | | | | 3-1-2022 | | | | 390,000 | | | | 400,620 | |
| |
| | | | 18,157,766 | |
| | | | | | | | | | | | | | | | |
| | | | |
| California: 3.82% | | | | | | | | | | | | | | | | |
Anaheim CA PFA Convention Center Expansion Project Series A (Miscellaneous Revenue) | | | 5.00 | | | | 5-1-2046 | | | | 1,000,000 | | | | 1,094,230 | |
California Municipal Finance Authority Charter School Albert Einstein Academies Project Series A (Miscellaneous Revenue) | | | 7.13 | | | | 8-1-2043 | | | | 1,000,000 | | | | 1,096,800 | |
California PCFA Water Furnishing Poseidon Resources LP Desalination Project (Water & Sewer Revenue) 144A | | | 5.00 | | | | 7-1-2027 | | | | 1,000,000 | | | | 1,004,970 | |
California PFOTER Series DCL-011 (GO Revenue, Dexia Credit Local LOC, AGM Insured) 144Aø | | | 0.90 | | | | 8-1-2027 | | | | 5,965,000 | | | | 5,965,000 | |
California Public Works Board Department of General Services Buildings 8 & 9A (Miscellaneous Revenue) | | | 6.25 | | | | 4-1-2034 | | | | 250,000 | | | | 277,058 | |
California School Finance Authority View Park Elementary & Middle Schools Series A (Education Revenue) | | | 4.75 | | | | 10-1-2024 | | | | 425,000 | | | | 436,624 | |
California School Finance Authority View Park Elementary & Middle Schools Series A (Education Revenue) | | | 5.63 | | | | 10-1-2034 | | | | 575,000 | | | | 595,574 | |
California Statewide CDA Sutter Health Series A (Health Revenue) | | | 6.00 | | | | 8-15-2042 | | | | 100,000 | | | | 114,445 | |
The accompanying notes are an integral part of these financial statements.
| | | | |
| 8 | | Wells Fargo Managed Account CoreBuilder Shares – Series M | | Portfolio of investments—December 31, 2016 |
| | | | | | | | | | | | | | | | |
| Security name | | Interest rate | | | Maturity date | | | Principal | | | Value | |
|
| California (continued) | |
California Various Purposes (GO Revenue) | | | 6.00 | % | | | 4-1-2038 | | | $ | 200,000 | | | $ | 218,296 | |
Campbell CA Union High School District (Miscellaneous Revenue) | | | 5.00 | | | | 8-1-2022 | | | | 500,000 | | | | 510,950 | |
Campbell CA Union High School District (Miscellaneous Revenue) | | | 5.00 | | | | 8-1-2023 | | | | 500,000 | | | | 510,895 | |
Compton CA Community College District Election of 2002 CAB Series C (GO Revenue) ¤ | | | 0.00 | | | | 8-1-2029 | | | | 500,000 | | | | 298,255 | |
Gilroy CA Unified School District Prerefunded CAB Election of 2008 Series A (GO Revenue, AGC Insured) ¤ | | | 0.00 | | | | 8-1-2032 | | | | 130,000 | | | | 82,995 | |
Gilroy CA Unified School District Unrefunded CAB Election of 2008 Series A (GO Revenue, AGC Insured) ¤ | | | 0.00 | | | | 8-1-2032 | | | | 70,000 | | | | 37,758 | |
Golden State Tobacco Securitization California Tobacco Settlement CAB Series A (Tobacco Revenue, Ambac Insured) ¤ | | | 0.00 | | | | 6-1-2024 | | | | 4,985,000 | | | | 3,920,204 | |
Hawthorne CA School District CAB Series C (GO Revenue, National Insured) ¤ | | | 0.00 | | | | 11-1-2025 | | | | 100,000 | | | | 74,075 | |
Los Angeles CA DW&P Series A (Water & Sewer Revenue) | | | 5.00 | | | | 7-1-2039 | | | | 500,000 | | | | 564,230 | |
Palo Alto CA Improvement Bond Act of 1915 (Miscellaneous Revenue) | | | 4.00 | | | | 9-2-2020 | | | | 240,000 | | | | 253,030 | |
Peralta CA Community College District Alameda County (GO Revenue) | | | 5.00 | | | | 8-1-2024 | | | | 450,000 | | | | 517,820 | |
San Buenaventura CA Community Mental Health System (Health Revenue) | | | 6.25 | | | | 12-1-2020 | | | | 150,000 | | | | 167,993 | |
San Diego CA Public Financing Authority Capital Improvement Project Series B (Miscellaneous Revenue) | | | 5.00 | | | | 10-15-2029 | | | | 500,000 | | | | 576,780 | |
University of California Regents Medical Center Series J (Health Revenue) | | | 5.25 | | | | 5-15-2038 | | | | 1,000,000 | | | | 1,145,870 | |
University of California Series AI (Education Revenue) | | | 5.00 | | | | 5-15-2038 | | | | 1,000,000 | | | | 1,125,730 | |
| |
| | | | 20,589,582 | |
| | | | | | | | | | | | | | | | |
| | | | |
| Colorado: 2.19% | | | | | | | | | | | | | | | | |
Colorado ECFA Charter School American Academy Project (Education Revenue) | | | 7.13 | | | | 12-1-2033 | | | | 200,000 | | | | 225,548 | |
Colorado ECFA Charter School American Academy Project (Education Revenue) | | | 7.25 | | | | 12-1-2028 | | | | 250,000 | | | | 282,525 | |
Colorado ECFA Charter School American Academy Project (Education Revenue) | | | 7.63 | | | | 12-1-2040 | | | | 260,000 | | | | 295,667 | |
Colorado ECFA Charter School Banning Lewis Ranch Academy Project Series A (Education Revenue) | | | 6.00 | | | | 12-15-2037 | | | | 1,500,000 | | | | 1,366,920 | |
Colorado ECFA Charter School Community Leadership Academy Second Campus Project (Education Revenue) | | | 7.00 | | | | 8-1-2033 | | | | 500,000 | | | | 565,675 | |
Colorado ECFA Charter School Rocky Mountain Classical Academy Project Series A (Education Revenue) | | | 8.13 | | | | 9-1-2048 | | | | 1,000,000 | | | | 1,113,640 | |
Colorado Health Facilities Authority Catholic Health Initiative Series 2009A (Health Revenue) | | | 5.00 | | | | 7-1-2039 | | | | 4,000,000 | | | | 4,100,120 | |
Denver CO Convention Center Hotel Authority Senior Revenue Refunding Bonds Series 2016 (Industrial Development Revenue) | | | 5.00 | | | | 12-1-2033 | | | | 2,500,000 | | | | 2,705,100 | |
Regents of the University of Colorado Certificate of Participation Series 2013A (Education Revenue) | | | 5.00 | | | | 11-1-2028 | | | | 1,000,000 | | | | 1,139,410 | |
| |
| | | | 11,794,605 | |
| | | | | | | | | | | | | | | | |
| | | | |
| Connecticut: 0.15% | | | | | | | | | | | | | | | | |
Hamden CT (GO Revenue, Build America Mutual Assurance Company Insured) | | | 5.00 | | | | 8-15-2024 | | | | 450,000 | | | | 519,134 | |
Hamden CT (GO Revenue, Build America Mutual Assurance Company Insured) | | | 5.00 | | | | 8-15-2025 | | | | 275,000 | | | | 314,402 | |
| |
| | | | 833,536 | |
| | | | | | | | | | | | | | | | |
| | | | |
| Delaware: 0.28% | | | | | | | | | | | | | | | | |
Delaware EDA Odyssey Charter School Incorporated Project Series A (Education Revenue) 144A | | | 7.00 | | | | 9-1-2045 | | | | 1,500,000 | | | | 1,496,115 | |
| | | | | | | | | | | | | | | | |
The accompanying notes are an integral part of these financial statements.
| | | | | | |
| Portfolio of investments—December 31, 2016 | | Wells Fargo Managed Account CoreBuilder Shares – Series M | | | 9 | |
| | | | | | | | | | | | | | | | |
| Security name | | Interest rate | | | Maturity date | | | Principal | | | Value | |
| | | | |
| District of Columbia: 0.62% | | | | | | | | | | | | | | | | |
District of Columbia Association of American Medical Colleges Series A (Miscellaneous Revenue) | | | 5.00 | % | | | 10-1-2024 | | | $ | 270,000 | | | $ | 311,464 | |
District of Columbia Cesar Chavez Public Charter School (Education Revenue) | | | 6.50 | | | | 11-15-2021 | | | | 50,000 | | | | 53,517 | |
District of Columbia University Bonds Series 2009C (Education Revenue, Bank of Tokyo-Mitsubishi LOC) ø | | | 0.73 | | | | 4-1-2042 | | | | 3,000,000 | | | | 3,000,000 | |
| |
| | | | 3,364,981 | |
| | | | | | | | | | | | | | | | |
| | | | |
| Florida: 2.05% | | | | | | | | | | | | | | | | |
CityPlace Florida Community Development District (Miscellaneous Revenue) | | | 5.00 | | | | 5-1-2022 | | | | 500,000 | | | | 544,925 | |
Florida Development Finance Corporation Educational Facilities Renaissance Charter School Project Series A (Education Revenue) | | | 8.50 | | | | 6-15-2044 | | | | 1,000,000 | | | | 1,144,840 | |
Holmes County FL Hospital Corporation Doctors Memorial Hospital Project (Health Revenue) | | | 6.00 | | | | 11-1-2038 | | | | 250,000 | | | | 247,575 | |
Miami-Dade County FL IDA Aspira Florida Project Series 2016A (Education Revenue) 144A | | | 5.75 | | | | 11-1-2036 | | | | 2,000,000 | | | | 1,960,440 | |
Miami-Dade County FL IDA Youth Co-Op Charter School Project Series 2015A (Education Revenue) 144A | | | 5.75 | | | | 9-15-2035 | | | | 1,500,000 | | | | 1,479,570 | |
Miami-Dade County FL School Board Certificate of Participation Series A (Miscellaneous Revenue) ± | | | 5.00 | | | | 5-1-2031 | | | | 3,000,000 | | | | 3,453,480 | |
Miami-Dade County FL Seaport AMT Series B (Airport Revenue) | | | 6.00 | | | | 10-1-2033 | | | | 1,000,000 | | | | 1,180,760 | |
Seminole Tribe of Florida Special Obligation Series A (Miscellaneous Revenue) 144A | | | 5.50 | | | | 10-1-2024 | | | | 1,000,000 | | | | 1,022,340 | |
| |
| | | | 11,033,930 | |
| | | | | | | | | | | | | | | | |
| | | | |
| Georgia: 0.15% | | | | | | | | | | | | | | | | |
Atlanta GA Development Authority Tuff Yamacraw LLC Project Series A (Industrial Development Revenue, Ambac Insured) | | | 5.00 | | | | 1-1-2027 | | | | 50,000 | | | | 54,046 | |
Washington & Wilkes Counties GA Payroll Development Authority Sub Series C (Health Revenue) ¤ | | | 0.00 | | | | 12-1-2021 | | | | 815,000 | | | | 732,652 | |
| |
| | | | 786,698 | |
| | | | | | | | | | | | | | | | |
| | | | |
| Guam: 1.07% | | | | | | | | | | | | | | | | |
Guam Government Business Privilege Tax Series A (Tax Revenue) | | | 5.00 | | | | 1-1-2031 | | | | 365,000 | | | | 387,860 | |
Guam Government Limited Obligation Section 30 Series A (Miscellaneous Revenue) | | | 5.38 | | | | 12-1-2024 | | | | 1,000,000 | | | | 1,105,420 | |
Guam Government Obligation Revenue Series A (Tax Revenue) | | | 5.00 | | | | 12-1-2020 | | | | 2,250,000 | | | | 2,461,793 | |
Guam Government Waterworks Authority Water & Wastewater System Project Series 2010 (Water & Sewer Revenue) | | | 5.00 | | | | 7-1-2019 | | | | 75,000 | | | | 80,333 | |
Guam Government Waterworks Authority Water & Wastewater System Project Series 2013 (Water & Sewer Revenue) | | | 5.25 | | | | 7-1-2021 | | | | 550,000 | | | | 607,613 | |
Guam Government Waterworks Authority Water & Wastewater System Project Series 2013 (Water & Sewer Revenue) | | | 5.25 | | | | 7-1-2022 | | | | 500,000 | | | | 558,160 | |
Guam Power Authority Series A (Utilities Revenue, AGM Insured) | | | 5.00 | | | | 10-1-2020 | | | | 500,000 | | | | 546,645 | |
| |
| | | | 5,747,824 | |
| | | | | | | | | | | | | | | | |
| | | | |
| Idaho: 0.35% | | | | | | | | | | | | | | | | |
Boise-Kuna ID Irrigation District Arrowrock Hydroelectric Project (Utilities Revenue) | | | 7.38 | | | | 6-1-2040 | | | | 100,000 | | | | 108,646 | |
Idaho Housing & Finance Association Idaho Arts Charter School Series A (Education Revenue) 144A | | | 5.00 | | | | 12-1-2036 | | | | 1,000,000 | | | | 1,034,140 | |
Idaho Housing & Finance Association Legacy Public Charter School Incorporated Project Series A (Education Revenue) | | | 5.85 | | | | 5-1-2033 | | | | 500,000 | | | | 510,660 | |
Idaho Housing & Finance Association Liberty Charter School Series A (Education Revenue) | | | 6.00 | | | | 6-1-2038 | | | | 250,000 | | | | 255,573 | |
| |
| | | | 1,909,019 | |
| | | | | | | | | | | | | | | | |
The accompanying notes are an integral part of these financial statements.
| | | | |
| 10 | | Wells Fargo Managed Account CoreBuilder Shares – Series M | | Portfolio of investments—December 31, 2016 |
| | | | | | | | | | | | | | | | |
| Security name | | Interest rate | | | Maturity date | | | Principal | | | Value | |
| | | | |
| Illinois: 20.31% | | | | | | | | | | | | | | | | |
Bureau County IL Township High School District #502 Series A (GO Revenue, Build America Mutual Assurance Company Insured) | | | 6.25 | % | | | 12-1-2033 | | | $ | 750,000 | | | $ | 914,355 | |
Chicago IL Board of Education CAB School Reform Series B-1 (GO Revenue, National Insured) ¤ | | | 0.00 | | | | 12-1-2021 | | | | 4,380,000 | | | | 3,579,161 | |
Chicago IL Board of Education CAB School Reform Series B-1 (GO Revenue, National Insured) ¤ | | | 0.00 | | | | 12-1-2022 | | | | 3,250,000 | | | | 2,524,860 | |
Chicago IL Board of Education Lease Certificates Refunding Bond Series A (Miscellaneous Revenue, National Insured) | | | 6.00 | | | | 1-1-2020 | | | | 195,000 | | | | 205,826 | |
Chicago IL Board of Education Series A (GO Revenue) | | | 5.00 | | | | 1-1-2020 | | | | 1,000,000 | | | | 998,400 | |
Chicago IL Board of Education Series A (GO Revenue, National Insured) | | | 5.25 | | | | 12-1-2017 | | | | 250,000 | | | | 255,058 | |
Chicago IL Board of Education Series A (GO Revenue, National Insured) | | | 5.25 | | | | 12-1-2021 | | | | 2,555,000 | | | | 2,738,679 | |
Chicago IL Board of Education Series C (GO Revenue) | | | 5.25 | | | | 12-1-2025 | | | | 1,000,000 | | | | 820,260 | |
Chicago IL Board of Education Series D (GO Revenue, AGM Insured) | | | 5.00 | | | | 12-1-2022 | | | | 375,000 | | | | 382,290 | |
Chicago IL CAB Series A (GO Revenue, National Insured) | | | 5.59 | | | | 1-1-2023 | | | | 950,000 | | | | 953,040 | |
Chicago IL City Colleges Capital Improvement Project CAB (GO Revenue, National Insured) ¤ | | | 0.00 | | | | 1-1-2031 | | | | 800,000 | | | | 397,920 | |
Chicago IL Emergency Telephone System Project (GO Revenue, National Insured) | | | 5.50 | | | | 1-1-2023 | | | | 555,000 | | | | 594,361 | |
Chicago IL Library Project Series D (GO Revenue) | | | 5.00 | | | | 1-1-2021 | | | | 440,000 | | | | 438,926 | |
Chicago IL Modern Schools Across Chicago Program Series A (GO Revenue) | | | 4.00 | | | | 12-1-2018 | | | | 445,000 | | | | 443,696 | |
Chicago IL Motor Fuel Tax (Tax Revenue) | | | 5.00 | | | | 1-1-2019 | | | | 250,000 | | | | 258,958 | |
Chicago IL O’Hare International Airport (Airport Revenue) | | | 5.00 | | | | 1-1-2035 | | | | 2,350,000 | | | | 2,478,475 | |
Chicago IL O’Hare International Airport AMT Senior Lien Series C (Airport Revenue) | | | 5.50 | | | | 1-1-2044 | | | | 1,000,000 | | | | 1,101,180 | |
Chicago IL O’Hare International Airport Customer Facility Charge Senior Lien Series D (Airport Revenue) | | | 5.75 | | | | 1-1-2043 | | | | 1,500,000 | | | | 1,686,480 | |
Chicago IL O’Hare International Airport Senior Lien (Airport Revenue) | | | 5.25 | | | | 1-1-2032 | | | | 1,000,000 | | | | 1,107,700 | |
Chicago IL Park District Limited Tax Park Bonds Series 2016A (GO Revenue) | | | 5.00 | | | | 1-1-2030 | | | | 1,000,000 | | | | 1,103,600 | |
Chicago IL Park District Limited Tax Park Bonds Series 2016A (GO Revenue) | | | 5.00 | | | | 1-1-2031 | | | | 1,000,000 | | | | 1,099,570 | |
Chicago IL Park District Limited Tax Park Bonds Series 2016A (GO Revenue) | | | 5.00 | | | | 1-1-2032 | | | | 1,225,000 | | | | 1,341,081 | |
Chicago IL Park District Limited Tax Park Bonds Series 2016A (GO Revenue) | | | 5.00 | | | | 1-1-2035 | | | | 1,000,000 | | | | 1,079,690 | |
Chicago IL Park District Unlimited Tax Refunding Bonds Series 2016A (GO Revenue) | | | 5.00 | | | | 11-15-2028 | | | | 1,655,000 | | | | 1,855,934 | |
Chicago IL Park District Unlimited Tax Refunding Bonds Series 2016E (GO Revenue) | | | 5.00 | | | | 11-15-2029 | | | | 1,735,000 | | | | 1,936,260 | |
Chicago IL Sales Tax (Tax Revenue) | | | 5.00 | | | | 1-1-2031 | | | | 4,525,000 | | | | 4,743,784 | |
Chicago IL Sales Tax (Tax Revenue) | | | 5.00 | | | | 1-1-2032 | | | | 850,000 | | | | 888,174 | |
Chicago IL Sales Tax (Tax Revenue) | | | 5.00 | | | | 1-1-2033 | | | | 2,785,000 | | | | 2,898,600 | |
Chicago IL Sales Tax Refunding Bond (Tax Revenue) | | | 5.00 | | | | 1-1-2025 | | | | 1,775,000 | | | | 1,830,327 | |
Chicago IL Sales Tax Refunding Bond (Tax Revenue) | | | 5.00 | | | | 1-1-2030 | | | | 2,250,000 | | | | 2,371,275 | |
Chicago IL Series A (GO Revenue) | | | 4.00 | | | | 1-1-2020 | | | | 590,000 | | | | 576,943 | |
Chicago IL Series A (GO Revenue) | | | 5.25 | | | | 1-1-2021 | | | | 845,000 | | | | 842,955 | |
Chicago IL Series A (GO Revenue) | | | 5.25 | | | | 1-1-2026 | | | | 550,000 | | | | 547,272 | |
Chicago IL Series B (GO Revenue, AGM Insured) | | | 5.00 | | | | 1-1-2018 | | | | 735,000 | | | | 744,893 | |
Chicago IL Series B (GO Revenue) | | | 5.50 | | | | 1-1-2032 | | | | 1,300,000 | | | | 1,247,077 | |
Chicago IL Series C (GO Revenue) ¤ | | | 0.00 | | | | 1-1-2021 | | | | 610,000 | | | | 487,109 | |
Chicago IL Series C (GO Revenue) | | | 4.00 | | | | 1-1-2021 | | | | 750,000 | | | | 723,098 | |
Chicago IL Series C (GO Revenue, National Insured) | | | 5.00 | | | | 1-1-2029 | | | | 1,000,000 | | | | 1,027,920 | |
Chicago IL Wastewater Second Lien Transmission Revenue Project Bonds Series 2012 (Water & Sewer Revenue) | | | 5.00 | | | | 1-1-2027 | | | | 1,000,000 | | | | 1,078,760 | |
Chicago IL Wastewater Second Lien Transmission Revenue Project Bonds Series 2014 (Water & Sewer Revenue) | | | 5.00 | | | | 1-1-2025 | | | | 400,000 | | | | 444,056 | |
Chicago IL Waterworks Second Lien Revenue Bonds Series 2004 (Water & Sewer Revenue) | | | 5.00 | | | | 11-1-2027 | | | | 2,250,000 | | | | 2,516,760 | |
Chicago IL Waterworks Second Lien Revenue Bonds Series 2012 (Water & Sewer Revenue) | | | 4.00 | | | | 11-1-2020 | | | | 625,000 | | | | 654,931 | |
The accompanying notes are an integral part of these financial statements.
| | | | | | |
| Portfolio of investments—December 31, 2016 | | Wells Fargo Managed Account CoreBuilder Shares – Series M | | | 11 | |
| | | | | | | | | | | | | | | | |
| Security name | | Interest rate | | | Maturity date | | | Principal | | | Value | |
| | | | |
| Illinois (continued) | | | | | | | | | | | | | | | | |
Chicago IL Waterworks Second Lien Revenue Bonds Series 2012 (Water & Sewer Revenue) | | | 5.00 | % | | | 11-1-2030 | | | $ | 1,000,000 | | | $ | 1,080,160 | |
Cook County IL School District #144 Prairie Hills CAB Refunding Bond Series C (GO Revenue, AGM Insured) ¤ | | | 0.00 | | | | 12-1-2025 | | | | 675,000 | | | | 455,645 | |
Cook County IL School District #159 CAB (GO Revenue, AGM Insured) ¤ | | | 0.00 | | | | 12-1-2023 | | | | 615,000 | | | | 457,726 | |
Cook County IL Series A (GO Revenue) | | | 5.00 | | | | 11-15-2020 | | | | 600,000 | | | | 654,480 | |
Cook County IL Series A (GO Revenue) | | | 5.25 | | | | 11-15-2022 | | | | 2,940,000 | | | | 3,214,126 | |
Illinois (GO Revenue) | | | 5.00 | | | | 2-1-2021 | | | | 3,000,000 | | | | 3,128,550 | |
Illinois (GO Revenue, AGM Insured) | | | 5.00 | | | | 1-1-2023 | | | | 300,000 | | | | 311,940 | |
Illinois (GO Revenue) | | | 5.00 | | | | 5-1-2025 | | | | 870,000 | | | | 891,794 | |
Illinois (GO Revenue, AGM Insured) | | | 5.00 | | | | 4-1-2026 | | | | 1,130,000 | | | | 1,203,405 | |
Illinois (Miscellaneous Revenue) | | | 5.50 | | | | 7-1-2025 | | | | 1,250,000 | | | | 1,311,913 | |
Illinois (Miscellaneous Revenue) | | | 5.50 | | | | 7-1-2038 | | | | 1,000,000 | | | | 1,018,580 | |
Illinois Finance Authority Charter Schools Series A (Education Revenue) | | | 7.13 | | | | 10-1-2041 | | | | 200,000 | | | | 218,644 | |
Illinois Finance Authority Medical District Commission Project A (Health Revenue, AGC Insured) | | | 4.13 | | | | 9-1-2018 | | | | 25,000 | | | | 25,048 | |
Illinois Finance Authority Rogers Park Montessori School (Miscellaneous Revenue) | | | 5.00 | | | | 2-1-2024 | | | | 505,000 | | | | 514,019 | |
Illinois Finance Authority The Art Institute of Chicago Series A (Miscellaneous Revenue) | | | 5.00 | | | | 3-1-2034 | | | | 500,000 | | | | 546,535 | |
Illinois Finance Authority The Art Institute of Chicago Series A (Miscellaneous Revenue) | | | 6.00 | | | | 3-1-2038 | | | | 400,000 | | | | 439,636 | |
Illinois Finance Authority Wesleyan University (Education Revenue) | | | 5.00 | | | | 9-1-2046 | | | | 1,000,000 | | | | 1,069,550 | |
Illinois Series A (GO Revenue) | | | 4.00 | | | | 9-1-2019 | | | | 600,000 | | | | 604,854 | |
Illinois Series A (Tax Revenue) | | | 4.00 | | | | 1-1-2029 | | | | 1,000,000 | | | | 903,830 | |
Illinois Series A (Tax Revenue) | | | 5.00 | | | | 6-1-2019 | | | | 465,000 | | | | 482,089 | |
Illinois Series A (GO Revenue, AGM Insured) | | | 5.00 | | | | 4-1-2024 | | | | 1,905,000 | | | | 2,035,988 | |
Illinois Series A (Tax Revenue) | | | 5.00 | | | | 1-1-2027 | | | | 2,000,000 | | | | 2,009,660 | |
Illinois Sports Facilities Authority State Tax Supported CAB (Tax Revenue, Ambac Insured) ¤ | | | 0.00 | | | | 6-15-2023 | | | | 1,285,000 | | | | 999,936 | |
Illinois Sports Facilities Authority State Tax Supported CAB (Tax Revenue, AGM Insured) | | | 5.25 | | | | 6-15-2031 | | | | 2,500,000 | | | | 2,753,925 | |
Illinois Sports Facilities Authority State Tax Supported Refunding Bonds (Tax Revenue, AGM Insured) | | | 5.00 | | | | 6-15-2028 | | | | 1,500,000 | | | | 1,643,175 | |
Illinois Toll Highway Authority Series B (Transportation Revenue) | | | 5.00 | | | | 1-1-2039 | | | | 1,000,000 | | | | 1,098,960 | |
Kane, Cook & DuPage Counties IL Series A (GO Revenue) | | | 5.00 | | | | 1-1-2034 | | | | 1,000,000 | | | | 1,077,640 | |
Kane, Cook & DuPage Counties IL Series D (GO Revenue) | | | 5.00 | | | | 1-1-2034 | | | | 1,700,000 | | | | 1,831,988 | |
Lake County IL School District #38 Big Hollow CAB (GO Revenue, Ambac Insured) ¤ | | | 0.00 | | | | 2-1-2019 | | | | 75,000 | | | | 70,555 | |
Metropolitan Pier & Exposition Authority Illinois CAB McCormick Place Expansion Project Series A (Tax Revenue, National Insured) ¤ | | | 0.00 | | | | 12-15-2019 | | | | 1,135,000 | | | | 1,033,179 | |
Metropolitan Pier & Exposition Authority IIlinois CAB McCormick Place Expansion Project Series A (Tax Revenue, National Insured) ¤ | | | 0.00 | | | | 12-15-2030 | | | | 960,000 | | | | 505,373 | |
Metropolitan Pier & Exposition Authority Illinois CAB McCormick Place Expansion Project Series A (Tax Revenue, National Insured) ¤ | | | 0.00 | | | | 6-15-2033 | | | | 3,440,000 | | | | 1,588,592 | |
Metropolitan Pier & Exposition Authority Illinois CAB McCormick Place Expansion Project Series A (Tax Revenue, National Insured) ¤ | | | 0.00 | | | | 12-15-2033 | | | | 14,000,000 | | | | 6,315,101 | |
Metropolitan Pier & Exposition Authority IIlinois CAB McCormick Place Expansion Project Series A (Tax Revenue, National Insured) ¤ | | | 0.00 | | | | 12-15-2034 | | | | 2,200,000 | | | | 935,308 | |
Metropolitan Pier & Exposition Authority Illinois CAB McCormick Place Expansion Project Series B-1 (Tax Revenue, AGM Insured) ¤ | | | 0.00 | | | | 6-15-2027 | | | | 5,150,000 | | | | 3,284,516 | |
Southern Illinois State University (Education Revenue) | | | 4.00 | | | | 4-1-2017 | | | | 160,000 | | | | 160,309 | |
Springfield Sangamon County IL (GO Revenue) | | | 5.00 | | | | 12-1-2031 | | | | 850,000 | | | | 925,854 | |
Village Bolingbrook IL (GO Revenue, AGM Insured) | | | 5.00 | | | | 1-1-2031 | | | | 500,000 | | | | 552,320 | |
Will County IL Community High School District #210 Lincoln-Way Series 2009 (GO Revenue) | | | 4.00 | | | | 1-1-2017 | | | | 1,005,000 | | | | 1,005,010 | |
The accompanying notes are an integral part of these financial statements.
| | | | |
| 12 | | Wells Fargo Managed Account CoreBuilder Shares – Series M | | Portfolio of investments—December 31, 2016 |
| | | | | | | | | | | | | | | | |
| Security name | | Interest rate | | | Maturity date | | | Principal | | | Value | |
| | | | |
| Illinois (continued) | | | | | | | | | | | | | | | | |
Will County IL Lincoln-Way Community High School District #210 Series A (GO Revenue, AGM Insured) | | | 5.00 | % | | | 1-1-2027 | | | $ | 4,000,000 | | | $ | 4,331,320 | |
Will County IL Lincoln-Way Community High School District #210 Series A (GO Revenue) | | | 5.00 | | | | 1-1-2030 | | | | 1,000,000 | | | | 959,370 | |
Will County IL Lincoln-Way Community High School District #210 Series B (GO Revenue) ¤ | | | 0.00 | | | | 1-1-2033 | | | | 1,590,000 | | | | 623,137 | |
Will County IL School District #14 Prerefunded CAB School Series (GO Revenue, National Insured) ¤ | | | 0.00 | | | | 12-1-2017 | | | | 145,000 | | | | 143,285 | |
Will County IL School District #14 Prerefunded CAB School Series (GO Revenue, National Insured) ¤ | | | 0.00 | | | | 12-1-2017 | | | | 110,000 | | | | 108,350 | |
Winnebago County IL Series A (GO Revenue, AGM Insured) | | | 4.00 | | | | 12-30-2025 | | | | 1,000,000 | | | | 1,053,350 | |
| |
| | | | 109,498,419 | |
| | | | | | | | | | | | | | | | |
| | | | |
| Indiana: 4.09% | | | | | | | | | | | | | | | | |
Indiana Finance Authority AMT-I-69 Development Partners LLC (Miscellaneous Revenue) | | | 5.25 | | | | 9-1-2034 | | | | 1,000,000 | | | | 997,760 | |
Indiana Finance Authority Environmental Facilities Series 2016A (Industrial Development Revenue) | | | 3.13 | | | | 12-1-2024 | | | | 3,125,000 | | | | 3,082,250 | |
Indiana Finance Authority Ohio River Bridges East End Crossing Project Series A (Industrial Development Revenue) | | | 5.00 | | | | 7-1-2035 | | | | 1,000,000 | | | | 1,023,950 | |
Indiana Finance Authority Series M (Miscellaneous Revenue) | | | 5.00 | | | | 7-1-2029 | | | | 605,000 | | | | 682,646 | |
Indiana Finance Authority Wastewater Utility Project Series A (Water & Sewer Revenue) | | | 5.25 | | | | 10-1-2031 | | | | 1,310,000 | | | | 1,473,095 | |
Indiana Health & Educational Facility Financing Authority Series 2006B (Health Revenue) ± | | | 1.75 | | | | 11-15-2031 | | | | 7,000,000 | | | | 6,791,890 | |
Indianapolis IN Local Public Improvement Series 2015E (Miscellaneous Revenue) | | | 5.00 | | | | 1-1-2035 | | | | 2,675,000 | | | | 3,044,578 | |
Whiting IN BP Products North America Incorporated Project (Resource Recovery Revenue) | | | 1.48 | | | | 12-1-2044 | | | | 5,000,000 | | | | 4,948,550 | |
| |
| | | | 22,044,719 | |
| | | | | | | | | | | | | | | | |
| | | | |
| Iowa: 0.19% | | | | | | | | | | | | | | | | |
Coralville IA Certificate of Participation (Miscellaneous Revenue) | | | 4.00 | | | | 6-1-2020 | | | | 500,000 | | | | 522,555 | |
Coralville IA Certificate of Participation (Miscellaneous Revenue) | | | 4.00 | | | | 6-1-2021 | | | | 500,000 | | | | 523,565 | |
| |
| | | | 1,046,120 | |
| | | | | | | | | | | | | | | | |
| | | | |
| Kansas: 1.15% | | | | | | | | | | | | | | | | |
Wyandotte County & Kansas City KS Sales Tax Special Obligation Vacation Village Project Area 4 - Major Multi-Sport Athletic Complex Project CAB Series 2015 (Tax Revenue) 144A¤ | | | 0.00 | | | | 9-1-2034 | | | | 19,680,000 | | | | 6,205,301 | |
| | | | | | | | | | | | | | | | |
| | | | |
| Kentucky: 0.76% | | | | | | | | | | | | | | | | |
Kentucky EDFA Senior Revenue Bonds Next Generation Kentucky Information Highway Project Series A (Miscellaneous Revenue) | | | 5.00 | | | | 7-1-2037 | | | | 1,000,000 | | | | 1,043,090 | |
Kentucky Public Transportation Infrastructure Authority Downtown Crossing Project CAB Series B (Transportation Revenue) ¤ | | | 0.00 | | | | 7-1-2029 | | | | 1,400,000 | | | | 789,404 | |
Paducah KY Electric Plan (Utilities Revenue, AGM Insured) | | | 5.00 | | | | 10-1-2033 | | | | 2,000,000 | | | | 2,253,020 | |
| |
| | | | 4,085,514 | |
| | | | | | | | | | | | | | | | |
| | | | |
| Louisiana: 1.30% | | | | | | | | | | | | | | | | |
Louisiana Series A (GO Revenue) | | | 5.00 | | | | 8-1-2026 | | | | 1,000,000 | | | | 1,161,340 | |
New Orleans LA Aviation Board Gulf Opportunity Zone Consolidated Rental Car Series A (Airport Revenue) | | | 6.50 | | | | 1-1-2040 | | | | 500,000 | | | | 539,035 | |
Shreveport LA Water & Sewer Series A (Water & Sewer Revenue, Build America Mutual Assurance Company Insured) | | | 4.00 | | | | 12-1-2018 | | | | 3,000,000 | | | | 3,132,510 | |
The accompanying notes are an integral part of these financial statements.
| | | | | | |
| Portfolio of investments—December 31, 2016 | | Wells Fargo Managed Account CoreBuilder Shares – Series M | | | 13 | |
| | | | | | | | | | | | | | | | |
| Security name | | Interest rate | | | Maturity date | | | Principal | | | Value | |
| | | | |
| Louisiana (continued) | | | | | | | | | | | | | | | | |
Shreveport LA Water & Sewer Series A (Water & Sewer Revenue, Build America Mutual Assurance Company Insured) | | | 5.00 | % | | | 12-1-2019 | | | $ | 2,000,000 | | | $ | 2,173,440 | |
| |
| | | | 7,006,325 | |
| | | | | | | | | | | | | | | | |
| | | | |
| Maine: 0.07% | | | | | | | | | | | | | | | | |
Portland ME General Airport (Airport Revenue) | | | 5.00 | | | | 7-1-2022 | | | | 150,000 | | | | 169,953 | |
Portland ME General Airport (Airport Revenue) | | | 5.00 | | | | 7-1-2023 | | | | 175,000 | | | | 200,828 | |
| |
| | | | 370,781 | |
| | | | | | | | | | | | | | | | |
| | | | |
| Maryland: 0.49% | | | | | | | | | | | | | | | | |
Maryland Health & Higher Education Washington County Hospital Project (Health Revenue) | | | 5.00 | | | | 1-1-2019 | | | | 125,000 | | | | 129,771 | |
Prince George’s County MD Chesapeake Lighthouse Charter School Project Series 2016A (Education Revenue) | | | 5.75 | | | | 8-1-2033 | | | | 1,000,000 | | | | 1,012,760 | |
Prince George’s County MD Chesapeake Lighthouse Charter School Project Series 2016A (Education Revenue) | | | 7.00 | | | | 8-1-2046 | | | | 1,500,000 | | | | 1,518,045 | |
| |
| | | | 2,660,576 | |
| | | | | | | | | | | | | | | | |
| | | | |
| Massachusetts: 0.34% | | | | | | | | | | | | | | | | |
Massachusetts Development Finance Agency Sabis International Charter Series A (Education Revenue) | | | 8.00 | | | | 4-15-2039 | | | | 100,000 | | | | 117,658 | |
Massachusetts School Building Authority Series A (Tax Revenue) | | | 5.00 | | | | 11-15-2034 | | | | 1,470,000 | | | | 1,702,510 | |
| |
| | | | 1,820,168 | |
| | | | | | | | | | | | | | | | |
| | | | |
| Michigan: 5.28% | | | | | | | | | | | | | | | | |
Detroit MI Distributable State Aid Project (GO Revenue) | | | 4.25 | | | | 11-1-2021 | | | | 770,000 | | | | 797,243 | |
Detroit MI Water Supply System Second Lien Series B (Water & Sewer Revenue, AGM Insured) | | | 7.00 | | | | 7-1-2036 | | | | 715,000 | | | | 808,601 | |
Great Lakes Michigan Water Authority Sewage Disposal System Series 2016C (Water & Sewer Revenue) | | | 5.00 | | | | 7-1-2036 | | | | 3,560,000 | | | | 3,874,384 | |
Great Lakes Michigan Water Authority Water Supply System Series 2016D (Water & Sewer Revenue) | | | 4.00 | | | | 7-1-2032 | | | | 4,000,000 | | | | 4,025,200 | |
Great Lakes Michigan Water Authority Water Supply System Series 2016D (Water & Sewer Revenue, AGM Insured) | | | 4.00 | | | | 7-1-2033 | | | | 4,000,000 | | | | 4,031,520 | |
Michigan Finance Authority Local Government Loan Program Series D (Water & Sewer Revenue) | | | 5.00 | | | | 7-1-2030 | | | | 4,000,000 | | | | 4,437,440 | |
Michigan Finance Authority Local Government Loan Program Series D4 (Water & Sewer Revenue) | | | 5.00 | | | | 7-1-2029 | | | | 1,000,000 | | | | 1,114,640 | |
Michigan Public Educational Facilities Authority Bradford Academy Project (Education Revenue) (s) | | | 8.00 | | | | 9-1-2021 | | | | 115,000 | | | | 91,984 | |
Michigan Public Educational Facilities Authority Landmark Academy Project Series 2010 (Education Revenue) | | | 6.00 | | | | 6-1-2020 | | | | 390,000 | | | | 391,888 | |
Michigan Strategic Fund Limited Obligation Events Center Project Series A (Tax Revenue) ± | | | 4.13 | | | | 7-1-2045 | | | | 3,500,000 | | | | 3,543,750 | |
Oakland County MI Economic Development Corporation The Academy of The Sacred Heart Project Series A (Education Revenue) | | | 6.50 | | | | 12-15-2036 | | | | 500,000 | | | | 470,250 | |
Taylor MI Tax Increment Refunding Bond Series B (Tax Revenue, AGM Insured) | | | 4.00 | | | | 5-1-2020 | | | | 785,000 | | | | 786,507 | |
Taylor MI Tax Increment Refunding Bond Series B (Tax Revenue, AGM Insured) | | | 4.00 | | | | 5-1-2021 | | | | 870,000 | | | | 871,531 | |
Wayne County MI Airport Series A (Airport Revenue, AGM Insured) | | | 4.00 | | | | 12-1-2020 | | | | 1,715,000 | | | | 1,809,342 | |
Wayne County MI Building Improvement Series A (GO Revenue) | | | 6.75 | | | | 11-1-2039 | | | | 900,000 | | | | 930,177 | |
Western Michigan University (Education Revenue) | | | 5.25 | | | | 11-15-2031 | | | | 400,000 | | | | 455,524 | |
| |
| | | | 28,439,981 | |
| | | | | | | | | | | | | | | | |
The accompanying notes are an integral part of these financial statements.
| | | | |
| 14 | | Wells Fargo Managed Account CoreBuilder Shares – Series M | | Portfolio of investments—December 31, 2016 |
| | | | | | | | | | | | | | | | |
| Security name | | Interest rate | | | Maturity date | | | Principal | | | Value | |
| | | | |
| Minnesota: 0.09% | | | | | | | | | | | | | | | | |
Independence MN Charter School Lease Series A (Education Revenue) | | | 4.25 | % | | | 7-1-2026 | | | $ | 500,000 | | | $ | 472,270 | |
| | | | | | | | | | | | | | | | |
| | | | |
| Mississippi: 0.86% | | | | | | | | | | | | | | | | |
Mississippi Development Bank Special Obligation Convention Center Refunding Project Series A (Miscellaneous Revenue, Municipal Government Guaranty Insured) | | | 5.00 | | | | 3-1-2026 | | | | 3,050,000 | | | | 3,525,617 | |
Mississippi Development Bank Special Obligation Jackson Water & Sewer System Project Series A (Water & Sewer Revenue, AGM Insured) | | | 5.00 | | | | 9-1-2030 | | | | 1,000,000 | | | | 1,119,000 | |
| |
| | | | 4,644,617 | |
| | | | | | | | | | | | | | | | |
|
| Missouri: 0.47% | |
Missouri HEFA (Health Revenue) | | | 1.50 | | | | 2-1-2018 | | | | 450,000 | | | | 449,609 | |
Missouri HEFA (Health Revenue) | | | 5.00 | | | | 2-1-2021 | | | | 800,000 | | | | 878,072 | |
Missouri HEFA (Health Revenue) | | | 5.00 | | | | 2-1-2022 | | | | 220,000 | | | | 244,119 | |
Raymore MO Tax Increment Refunding & Improvement Raymore Galleria Project Series A (Tax Revenue) | | | 3.00 | | | | 5-1-2017 | | | | 190,000 | | | | 189,962 | |
Raymore MO Tax Increment Refunding & Improvement Raymore Galleria Project Series A (Tax Revenue) | | | 4.00 | | | | 5-1-2020 | | | | 750,000 | | | | 756,038 | |
| |
| | | | 2,517,800 | |
| | | | | | | | | | | | | | | | |
|
| New Hampshire: 0.83% | |
New Hampshire Business Authority Water Facility Pennichuck Water Works Incorporated Project Series A (Water & Sewer Revenue) | | | 5.00 | | | | 1-1-2026 | | | | 1,000,000 | | | | 1,129,210 | |
New Hampshire Business Authority Water Facility Pennichuck Water Works Incorporated Project Series A (Water & Sewer Revenue) | | | 5.00 | | | | 1-1-2027 | | | | 845,000 | | | | 937,333 | |
New Hampshire Business Authority Water Facility Pennichuck Water Works Incorporated Project Series A (Water & Sewer Revenue) | | | 5.00 | | | | 1-1-2028 | | | | 2,170,000 | | | | 2,418,696 | |
| |
| | | | 4,485,239 | |
| | | | | | | | | | | | | | | | |
|
| New Jersey: 7.44% | |
City of Bayonne NJ School District (GO Revenue, AGM Insured) | | | 5.00 | | | | 7-15-2021 | | | | 1,300,000 | | | | 1,443,065 | |
Essex County NJ Improvement Authority Lease Newark Project Series A (Miscellaneous Revenue) | | | 6.25 | | | | 11-1-2030 | | | | 1,490,000 | | | | 1,549,049 | |
New Jersey EDA Educational Facilities Series AB (Education Revenue) | | | 5.00 | | | | 6-1-2022 | | | | 1,875,000 | | | | 1,975,781 | |
New Jersey EDA Motor Vehicle Surcharges Series A (Miscellaneous Revenue, National Insured) | | | 5.25 | | | | 7-1-2026 | | | | 250,000 | | | | 281,238 | |
New Jersey EDA Police Barracks Project (Miscellaneous Revenue) | | | 5.00 | | | | 6-15-2020 | | | | 285,000 | | | | 300,880 | |
New Jersey EDA School Facilities Construction Project Series NN (Miscellaneous Revenue) | | | 5.00 | | | | 3-1-2027 | | | | 3,150,000 | | | | 3,223,395 | |
New Jersey EDA School Facilities Construction Project Series NN (Miscellaneous Revenue) | | | 5.00 | | | | 3-1-2028 | | | | 5,000,000 | | | | 5,096,200 | |
New Jersey EDA School Facilities Construction Project Series PP (Miscellaneous Revenue) | | | 5.00 | | | | 6-15-2019 | | | | 1,800,000 | | | | 1,883,430 | |
New Jersey EDA School Facilities Drew University Series C (Education Revenue, National Insured) | | | 5.25 | | | | 7-1-2020 | | | | 2,060,000 | | | | 2,256,833 | |
New Jersey EDA Student Loan Series 1 (Education Revenue) | | | 5.50 | | | | 12-1-2021 | | | | 2,900,000 | | | | 3,208,676 | |
New Jersey Educational Facilities Authority Series 2014 (Education Revenue) | | | 5.00 | | | | 6-15-2025 | | | | 1,000,000 | | | | 1,045,380 | |
New Jersey TTFA CAB Series A (Transportation Revenue) ¤ | | | 0.00 | | | | 12-15-2031 | | | | 2,500,000 | | | | 1,192,575 | |
New Jersey TTFA Series A (Miscellaneous Revenue) | | | 5.00 | | | | 6-15-2020 | | | | 1,600,000 | | | | 1,687,984 | |
New Jersey TTFA Series A (Transportation Revenue) | | | 5.00 | | | | 6-15-2029 | | | | 2,000,000 | | | | 2,140,220 | |
New Jersey TTFA Series A (Miscellaneous Revenue) | | | 5.25 | | | | 12-15-2022 | | | | 600,000 | | | | 642,528 | |
New Jersey TTFA Series AA (Miscellaneous Revenue) | | | 5.00 | | | | 6-15-2045 | | | | 1,500,000 | | | | 1,490,940 | |
New Jersey TTFA Series B (Miscellaneous Revenue, National Insured) | | | 5.50 | | | | 12-15-2021 | | | | 7,115,000 | | | | 7,896,583 | |
New Jersey TTFA Series B (Miscellaneous Revenue) | | | 5.50 | | | | 6-15-2031 | | | | 250,000 | | | | 262,058 | |
The accompanying notes are an integral part of these financial statements.
| | | | | | |
| Portfolio of investments—December 31, 2016 | | Wells Fargo Managed Account CoreBuilder Shares – Series M | | | 15 | |
| | | | | | | | | | | | | | | | |
| Security name | | Interest rate | | | Maturity date | | | Principal | | | Value | |
|
| New Jersey (continued) | |
Newark NJ Qualified General Improvement Series A (GO Revenue) | | | 5.00 | % | | | 7-15-2025 | | | $ | 2,355,000 | | | $ | 2,523,312 | |
| |
| | | | 40,100,127 | |
| | | | | | | | | | | | | | | | |
|
| New Mexico: 0.48% | |
New Mexico Municipal Energy Acquisition Authority Gas Supply Sub Series B (Utilities Revenue, Royal Bank of Canada SPA) ± | | | 1.16 | | | | 11-1-2039 | | | | 2,600,000 | | | | 2,584,088 | |
| | | | | | | | | | | | | | | | |
|
| New York: 7.51% | |
Glen Cove NY Local Economic Assistance Corporation CCAB Series B (Industrial Development Revenue) ¤ | | | 0.00 | | | | 1-1-2045 | | | | 3,250,000 | | | | 586,333 | |
Glen Cove NY Local Economic Assistance Corporation CCAB Series C (Industrial Development Revenue) ¤ | | | 0.00 | | | | 1-1-2055 | | | | 1,000,000 | | | | 683,580 | |
Hempstead Town NY Local Development Corporation The Academy Charter School Project Series A (Education Revenue) | | | 7.65 | | | | 2-1-2044 | | | | 500,000 | | | | 548,255 | |
Metropolitan Transportation Authority New York Series C (Transportation Revenue) | | | 5.25 | | | | 11-15-2031 | | | | 5,000,000 | | | | 5,849,450 | |
Monroe County NY IDAG Refunding Bond Monroe Community College Association (Education Revenue, AGM Insured) | | | 5.00 | | | | 1-15-2038 | | | | 500,000 | | | | 549,060 | |
Nassau County NY Series F (GO Revenue) | | | 5.00 | | | | 10-1-2020 | | | | 150,000 | | | | 162,494 | |
New York Dormitory Authority State University Educational Facilities Series A (Miscellaneous Revenue) | | | 5.50 | | | | 5-15-2019 | | | | 500,000 | | | | 534,565 | |
New York Local Government Assistance Corporation Series A-11V (Tax Revenue, AGM Insured) ±(m)(n) | | | 0.99 | | | | 4-1-2017 | | | | 25,000 | | | | 25,000 | |
New York NY Series F-1 (GO Revenue) | | | 5.00 | | | | 3-1-2032 | | | | 1,000,000 | | | | 1,136,560 | |
New York NY Sub Series H-5 (GO Revenue, Dexia Credit Local LOC) ø | | | 0.93 | | | | 3-1-2034 | | | | 6,500,000 | | | | 6,500,000 | |
New York Transportation Development Corporation American Airlines Incorporated John F. Kennedy International Airport Project Series 2016 (Airport Revenue) | | | 5.00 | | | | 8-1-2026 | | | | 3,000,000 | | | | 3,093,900 | |
New York Urban Development Corporation Certificate of Participation James A Farley Post Office Project (Miscellaneous Revenue) 144A | | | 4.20 | | | | 2-1-2017 | | | | 3,485,000 | | | | 3,483,606 | |
New York Urban Development Corporation Personal Income Tax Series A (Tax Revenue) | | | 5.00 | | | | 3-15-2020 | | | | 10,000,000 | | | | 11,059,500 | |
Onondaga NY Civic Development Corporation St. Joseph’s Hospital Health Center Project Series A (Health Revenue) | | | 4.63 | | | | 7-1-2022 | | | | 1,500,000 | | | | 1,617,795 | |
Onondaga NY Civic Development Corporation St. Joseph’s Hospital Health Center Project Series A (Health Revenue) | | | 5.00 | | | | 7-1-2019 | | | | 750,000 | | | | 798,953 | |
Oyster Bay NY BAN Series C (GO Revenue) | | | 4.00 | | | | 6-1-2018 | | | | 1,000,000 | | | | 1,003,370 | |
Oyster Bay NY Public Improvement (GO Revenue) | | | 3.00 | | | | 8-15-2019 | | | | 875,000 | | | | 856,581 | |
Suffolk NY Tobacco Asset Securitization Corporation (Tobacco Revenue) | | | 5.00 | | | | 6-1-2024 | | | | 500,000 | | | | 550,780 | |
Westchester County NY Local Development Pace University Series A (Education Revenue) | | | 5.00 | | | | 5-1-2034 | | | | 1,000,000 | | | | 1,017,130 | |
Western Nassau County NY Water Authority Series B (Water & Sewer Revenue) | | | 5.00 | | | | 4-1-2025 | | | | 340,000 | | | | 400,044 | |
| |
| | | | 40,456,956 | |
| | | | | | | | | | | | | | | | |
|
| North Carolina: 0.37% | |
Charlotte-Mecklenburg NC Hospital Authority Series B (Health Revenue, JPMorgan Chase & Company SPA) ø | | | 0.69 | | | | 1-15-2038 | | | | 1,980,000 | | | | 1,980,000 | |
| | | | | | | | | | | | | | | | |
|
| Ohio: 2.71% | |
Lancaster OH Port Authority (Utilities Revenue, Royal Bank of Canada SPA) ± | | | 1.13 | | | | 5-1-2038 | | | | 3,000,000 | | | | 2,973,720 | |
Maple Heights OH City School District Certificate of Participation (Miscellaneous Revenue) | | | 6.00 | | | | 11-1-2028 | | | | 620,000 | | | | 649,853 | |
Medina County OH Manor Apartments Project (Housing Revenue) ± | | | 1.00 | | | | 12-1-2017 | | | | 2,000,000 | | | | 1,998,340 | |
Ohio Air Quality Development Authority FirstEnergy Generation Series 2009-A (Utilities Revenue) | | | 5.70 | | | | 8-1-2020 | | | | 1,500,000 | | | | 626,985 | |
The accompanying notes are an integral part of these financial statements.
| | | | |
| 16 | | Wells Fargo Managed Account CoreBuilder Shares – Series M | | Portfolio of investments—December 31, 2016 |
| | | | | | | | | | | | | | | | |
| Security name | | Interest rate | | | Maturity date | | | Principal | | | Value | |
|
| Ohio (continued) | |
Ohio Air Quality Development Authority Series A (Utilities Revenue) ± | | | 3.75 | % | | | 12-1-2023 | | | $ | 3,000,000 | | | $ | 1,255,410 | |
Ohio Private Activity Bond AMT Portsmouth Bypass Project (Miscellaneous Revenue, AGM Insured) | | | 5.00 | | | | 12-31-2035 | | | | 2,000,000 | | | | 2,175,980 | |
Ohio Private Activity Bond Series A (Industrial Development Revenue, AGM Insured) | | | 5.00 | | | | 12-31-2029 | | | | 2,070,000 | | | | 2,303,020 | |
Ohio Water Development Authority Pollution Control Series A (Industrial Development Revenue) ± | | | 3.75 | | | | 7-1-2033 | | | | 6,000,000 | | | | 2,508,180 | |
Toledo OH Enterprise Bond Series 2-A (Industrial Development Revenue) | | | 5.50 | | | | 12-1-2019 | | | | 110,000 | | | | 114,520 | |
| |
| | | | 14,606,008 | |
| | | | | | | | | | | | | | | | |
|
| Oklahoma: 0.41% | |
Garfield County OK Educational Facilities Authority Enid Public Schools Project (Miscellaneous Revenue) | | | 5.00 | | | | 9-1-2027 | | | | 1,895,000 | | | | 2,197,177 | |
| | | | | | | | | | | | | | | | |
|
| Oregon: 0.14% | |
Deschutes County OR Hospital Facilities Authority Cascade Healthcare Community Incorporated Project (Health Revenue) | | | 8.25 | | | | 1-1-2038 | | | | 500,000 | | | | 565,600 | |
Oregon Facilities Authority Southern Oregon University Project (Education Revenue, AGM Insured) | | | 4.00 | | | | 7-1-2023 | | | | 185,000 | | | | 196,348 | |
| |
| | | | 761,948 | |
| | | | | | | | | | | | | | | | |
|
| Pennsylvania: 9.34% | |
Allegheny County PA IDA Propel Charter School Sunrise Project (Education Revenue) | | | 5.25 | | | | 7-15-2023 | | | | 540,000 | | | | 555,325 | |
Allegheny County PA Series C-72 (GO Revenue) | | | 5.25 | | | | 12-1-2032 | | | | 1,000,000 | | | | 1,152,440 | |
Beaver County PA IDA Pollution Control First Nuclear General Project Series A (Utilities Revenue) ± | | | 2.70 | | | | 4-1-2035 | | | | 1,500,000 | | | | 628,590 | |
Berks County PA Municipal Authority Reading Hospital & Medical Center Project Series B (Health Revenue) | | | 2.23 | | | | 11-1-2039 | | | | 2,000,000 | | | | 2,015,500 | |
Chester County PA IDA Avon Grove Charter School Project Series A (Education Revenue) | | | 6.25 | | | | 12-15-2027 | | | | 325,000 | | | | 333,778 | |
Commonwealth Financing Authority Pennsylvania Series B-1 (Miscellaneous Revenue, AGM Insured) | | | 5.00 | | | | 6-1-2025 | | | | 500,000 | | | | 578,275 | |
Delaware County PA IDA Resource Recovery Facility Series A (Resource Recovery Revenue) | | | 6.20 | | | | 7-1-2019 | | | | 35,000 | | | | 35,113 | |
Delaware Valley PA Regional Finance Authority Local Government Series A (Miscellaneous Revenue, Ambac Insured) | | | 5.50 | | | | 8-1-2028 | | | | 1,400,000 | | | | 1,661,100 | |
East Hempfield Township PA IDA Student Services Incorporated Student Housing Project Millersville University (Education Revenue) | | | 5.00 | | | | 7-1-2021 | | | | 660,000 | | | | 713,480 | |
East Hempfield Township PA IDA Student Services Incorporated Student Housing Project Millersville University (Education Revenue) | | | 5.00 | | | | 7-1-2023 | | | | 760,000 | | | | 829,016 | |
Pennsylvania EDFA Bridges Finco LP (Industrial Development Revenue) | | | 5.00 | | | | 12-31-2034 | | | | 5,000,000 | | | | 5,290,600 | |
Pennsylvania Turnpike Commission CCAB Sub Series E (Transportation Revenue) ± | | | 0.00 | | | | 12-1-2038 | | | | 1,000,000 | | | | 1,172,660 | |
Philadelphia PA Airport Bonds AMT Series A (Airport Revenue, AGM Insured) | | | 5.00 | | | | 6-15-2037 | | | | 2,000,000 | | | | 2,023,580 | |
Philadelphia PA IDA 1st Philadelphia Preparatory Charter School Project Series A (Education Revenue) | | | 7.00 | | | | 6-15-2033 | | | | 1,000,000 | | | | 1,129,180 | |
Philadelphia PA IDA Architecture & Design Charter School Project (Education Revenue) | | | 5.25 | | | | 3-15-2023 | | | | 265,000 | | | | 272,462 | |
Philadelphia PA IDA Cultural & Commercial Corridors Program Series A (Miscellaneous Revenue) | | | 5.00 | | | | 12-1-2025 | | | | 1,995,000 | | | | 2,281,382 | |
Philadelphia PA IDA Discovery Charter School Project (Education Revenue) | | | 4.00 | | | | 4-1-2017 | | | | 85,000 | | | | 84,992 | |
Philadelphia PA IDA Discovery Charter School Project (Education Revenue) | | | 5.00 | | | | 4-1-2022 | | | | 450,000 | | | | 450,995 | |
Philadelphia PA IDA Mariana Bracetti Academy Project (Education Revenue) | | | 6.25 | | | | 12-15-2021 | | | | 190,000 | | | | 200,908 | |
Philadelphia PA IDA National Board of Medical Examiners Project (Health Revenue) | | | 5.00 | | | | 5-1-2026 | | | | 1,420,000 | | | | 1,684,063 | |
Philadelphia PA IDA New Foundations Charter School Project (Education Revenue) | | | 6.00 | | | | 12-15-2027 | | | | 280,000 | | | | 301,731 | |
Philadelphia PA Refunding Bond Series A (GO Revenue) | | | 5.25 | | | | 7-15-2033 | | | | 1,000,000 | | | | 1,131,010 | |
The accompanying notes are an integral part of these financial statements.
| | | | | | |
| Portfolio of investments—December 31, 2016 | | Wells Fargo Managed Account CoreBuilder Shares – Series M | | | 17 | |
| | | | | | | | | | | | | | | | |
| Security name | | Interest rate | | | Maturity date | | | Principal | | | Value | |
|
| Pennsylvania (continued) | |
Philadelphia PA School District Series C (GO Revenue) | | | 5.00 | % | | | 9-1-2020 | | | $ | 250,000 | | | $ | 270,520 | |
Philadelphia PA School District Series E (GO Revenue) | | | 5.25 | | | | 9-1-2022 | | | | 1,350,000 | | | | 1,443,582 | |
Philadelphia Pa School District Series F (GO Revenue) | | | 5.00 | | | | 9-1-2030 | | | | 1,000,000 | | | | 1,091,220 | |
Philadelphia PA School District Series F (GO Revenue) | | | 5.00 | | | | 9-1-2036 | | | | 3,000,000 | | | | 3,188,940 | |
Philadelphia PA School District Series F (GO Revenue) | | | 5.00 | | | | 9-1-2037 | | | | 1,000,000 | | | | 1,058,900 | |
Philadelphia PA Series A (GO Revenue) | | | 5.00 | | | | 8-1-2025 | | | | 1,905,000 | | | | 2,210,505 | |
Philadelphia PA Water & Sewer Series B (Water & Sewer Revenue) | | | 5.00 | | | | 7-1-2032 | | | | 1,145,000 | | | | 1,293,724 | |
Reading PA Water Authority Series 2011 (Water & Sewer Revenue) | | | 5.25 | | | | 12-1-2036 | | | | 1,250,000 | | | | 1,400,013 | |
State Public School Building Authority Harrisburg School District Project Series A (Miscellaneous Revenue, AGM Insured) | | | 5.00 | | | | 12-1-2023 | | | | 1,710,000 | | | | 1,957,830 | |
State Public School Building Authority Series 2016A (Miscellaneous Revenue) | | | 5.00 | | | | 6-1-2036 | | | | 4,715,000 | | | | 4,998,654 | |
York County PA IDA Philadelphia Electric Company Project Series A (Industrial Development Revenue) ± | | | 2.55 | | | | 6-1-2036 | | | | 7,000,000 | | | | 6,926,360 | |
| |
| | | | 50,366,428 | |
| | | | | | | | | | | | | | | | |
|
| South Carolina: 0.84% | |
South Carolina Jobs EDA York Preparatory Academy Project Series A (Education Revenue) | | | 7.00 | | | | 11-1-2033 | | | | 1,000,000 | | | | 1,066,830 | |
South Carolina Public Service Authority Series C (Miscellaneous Revenue) | | | 5.00 | | | | 12-1-2030 | | | | 3,010,000 | | | | 3,437,059 | |
| |
| | | | 4,503,889 | |
| | | | | | | | | | | | | | | | |
|
| Tennessee: 1.21% | |
Bristol TN Industrial Development Board Sales Tax Pinnacle Project Series A (Tax Revenue) 144A | | | 5.13 | | | | 12-1-2042 | | | | 2,500,000 | | | | 2,231,175 | |
Bristol TN Industrial Development Board Sales Tax Series B CAB (Tax Revenue) 144A¤ | | | 0.00 | | | | 12-1-2031 | | | | 3,000,000 | | | | 1,195,980 | |
Metropolitan Government of Nashville & Davidson County TN Health & Educational Facilities Board Series 2001B-1 (Health Revenue) ± | | | 1.55 | | | | 11-15-2030 | | | | 3,000,000 | | | | 2,935,680 | |
Tennessee Energy Acquisition Corporation Series A (Utilities Revenue) | | | 5.25 | | | | 9-1-2018 | | | | 150,000 | | | | 158,367 | |
| |
| | | | 6,521,202 | |
| | | | | | | | | | | | | | | | |
|
| Texas: 8.12% | |
Arlington TX Higher Education Finance Corporation Universal Academy Project Series A (Education Revenue) | | | 7.13 | | | | 3-1-2044 | | | | 1,250,000 | | | | 1,261,813 | |
Arlington TX Permanent Import (GO Revenue) | | | 5.00 | | | | 8-15-2023 | | | | 2,940,000 | | | | 3,459,527 | |
Austin TX Airport System AMT (Airport Revenue) | | | 5.00 | | | | 11-15-2044 | | | | 2,500,000 | | | | 2,693,600 | |
Clifton TX Higher Educational Finance Corporation International Leadership Series A (Education Revenue) | | | 5.50 | | | | 8-15-2035 | | | | 2,000,000 | | | | 1,997,540 | |
Clifton TX Higher Educational Finance Corporation International Leadership Series A (Education Revenue) | | | 5.75 | | | | 8-15-2038 | | | | 1,000,000 | | | | 1,011,440 | |
Clifton TX Higher Educational Finance Corporation Uplift Education Project Series A (Education Revenue) | | | 3.10 | | | | 12-1-2022 | | | | 1,825,000 | | | | 1,771,966 | |
Houston TX Higher Education Finance Corporation Series A (Education Revenue) | | | 4.00 | | | | 2-15-2022 | | | | 175,000 | | | | 175,557 | |
La Vernia TX Higher Education Finance Corporation Series A (Education Revenue) | | | 6.25 | | | | 2-15-2017 | | | | 55,000 | | | | 55,366 | |
New Hope Cultural Educational Facilities Finance Corporation Series A (Education Revenue) 144A | | | 5.00 | | | | 8-15-2026 | | | | 500,000 | | | | 506,765 | |
North Texas Tollway Authority System Series A (Transportation Revenue) | | | 5.00 | | | | 1-1-2023 | | | | 3,500,000 | | | | 4,027,030 | |
North Texas Tollway Authority System Series B (Transportation Revenue) | | | 5.00 | | | | 1-1-2026 | | | | 350,000 | | | | 383,691 | |
Northside TX Independent School District Building Project (GO Revenue) ± | | | 2.00 | | | | 8-1-2044 | | | | 2,000,000 | | | | 2,017,020 | |
Port Houston TX Authority Series D-1 (GO Revenue) | | | 5.00 | | | | 10-1-2035 | | | | 2,190,000 | | | | 2,413,599 | |
San Antonio TX Independent School District (GO Revenue) ± | | | 2.00 | | | | 8-1-2044 | | | | 965,000 | | | | 969,005 | |
Tarrant County TX Cultural Education Facilities Finance Corporation Series 2974 (Health Revenue, Credit Suisse LIQ) 144Aø | | | 0.92 | | | | 11-15-2029 | | | | 5,605,000 | | | | 5,605,000 | |
The accompanying notes are an integral part of these financial statements.
| | | | |
| 18 | | Wells Fargo Managed Account CoreBuilder Shares – Series M | | Portfolio of investments—December 31, 2016 |
| | | | | | | | | | | | | | | | |
| Security name | | Interest rate | | | Maturity date | | | Principal | | | Value | |
|
| Texas (continued) | |
Tender Option Bond Trust Receipts/Certificates Floaters Series 2015 (Transportation Revenue, Barclays Bank plc LIQ) 144Aø | | | 1.01 | % | | | 7-1-2021 | | | $ | 4,215,000 | | | $ | 4,215,000 | |
Texas Municipal Gas Acquisition & Supply Corporation Subordinated Lien Series C (Utilities Revenue) ± | | | 2.02 | | | | 12-15-2026 | | | | 5,000,000 | | | | 4,514,400 | |
Texas Private Activity Bond Surface Transportation Corporation LBJ Infrastructure Project (Transportation Revenue) | | | 7.50 | | | | 6-30-2033 | | | | 250,000 | | | | 290,858 | |
Texas Private Activity Bond Surface Transportation Corporation Project NTE Mobility Partners Segments LLC (Transportation Revenue) ## | | | 7.00 | | | | 12-31-2038 | | | | 1,300,000 | | | | 1,477,658 | |
Texas SA Energy Acquisition Public Facility Corporation Gas Supply (Utilities Revenue) | | | 5.50 | | | | 8-1-2019 | | | | 330,000 | | | | 357,918 | |
Texas Transportation Commission Highway (Miscellaneous Revenue) | | | 5.00 | | | | 4-1-2028 | | | | 2,605,000 | | | | 3,116,726 | |
Upper Trinity TX Regional Water District (Water & Sewer Revenue, Build America Mutual Assurance Company Insured) | | | 5.00 | | | | 8-1-2028 | | | | 750,000 | | | | 863,408 | |
Upper Trinity TX Regional Water District (Water & Sewer Revenue, Build America Mutual Assurance Company Insured) | | | 5.00 | | | | 8-1-2029 | | | | 500,000 | | | | 573,045 | |
| |
| | | | 43,757,932 | |
| | | | | | | | | | | | | | | | |
|
| Vermont: 0.77% | |
Burlington VT Airport (Airport Revenue, AGM Insured) | | | 5.00 | | | | 7-1-2018 | | | | 280,000 | | | | 293,353 | |
Burlington VT Airport (Airport Revenue, AGM Insured) | | | 5.00 | | | | 7-1-2019 | | | | 100,000 | | | | 107,212 | |
Vermont Student Assistance Corporation Series B Class A-2 (Education Revenue) ± | | | 3.94 | | | | 12-3-2035 | | | | 500,000 | | | | 526,930 | |
Vermont Student Assistance Corporation Series B Class B (Education Revenue) ± | | | 1.62 | | | | 6-2-2042 | | | | 3,266,204 | | | | 3,251,179 | |
| |
| | | | 4,178,674 | |
| | | | | | | | | | | | | | | | |
|
| Virgin Islands: 1.28% | |
Virgin Islands PFA Matching Fund Loan Note Senior Lien Series A (Tobacco Revenue) | | | 5.00 | | | | 10-1-2025 | | | | 2,500,000 | | | | 2,123,900 | |
Virgin Islands PFA Series A (Tax Revenue) 144A | | | 5.00 | | | | 10-1-2032 | | | | 5,750,000 | | | | 4,772,788 | |
| |
| | | | 6,896,688 | |
| | | | | | | | | | | | | | | | |
|
| Washington: 4.61% | |
King County WA Public Hospital District #1 Valley Medical Center Refunding Bond (GO Revenue) %% | | | 5.00 | | | | 12-1-2035 | | | | 5,500,000 | | | | 6,020,740 | |
King County WA Public Hospital District Series 2016 (GO Revenue) %% | | | 5.00 | | | | 12-1-2036 | | | | 1,475,000 | | | | 1,609,579 | |
Tacoma WA Solid Waste Series B (Resource Recovery Revenue) | | | 5.00 | | | | 12-1-2026 | | | | 1,135,000 | | | | 1,351,581 | |
Washington HCFR Catholic Health Initiatives Series A (Health Revenue) | | | 5.00 | | | | 1-1-2029 | | | | 1,300,000 | | | | 1,472,991 | |
Washington HCFR Catholic Health Initiatives Series B (Health Revenue) ± | | | 1.73 | | | | 1-1-2035 | | | | 5,000,000 | | | | 4,979,150 | |
Washington HCFR Catholic Health Initiatives Series B (Health Revenue) ± | | | 2.12 | | | | 1-1-2035 | | | | 3,000,000 | | | | 2,999,460 | |
Washington State Series D (GO Revenue) | | | 5.00 | | | | 2-1-2037 | | | | 5,620,000 | | | | 6,411,970 | |
| |
| | | | 24,845,471 | |
| | | | | | | | | | | | | | | | |
|
| Wisconsin: 2.33% | |
Wisconsin PFA Airport Facilities Series C (Airport Revenue) | | | 5.00 | | | | 7-1-2042 | | | | 2,585,000 | | | | 2,677,698 | |
Wisconsin PFA Carolina International School Series A (Education Revenue) 144A | | | 7.20 | | | | 8-1-2048 | | | | 1,000,000 | | | | 1,099,510 | |
Wisconsin PFA Lease Development KU Campus Development Project (Education Revenue) | | | 5.00 | | | | 3-1-2046 | | | | 4,500,000 | | | | 4,958,505 | |
Wisconsin PFA Pine Lake Preparatory (Education Revenue) 144A | | | 4.95 | | | | 3-1-2030 | | | | 1,270,000 | | | | 1,287,805 | |
Wisconsin PFA Research Triangle High School Project Series 2015-A (Education Revenue) 144A | | | 5.63 | | | | 7-1-2045 | | | | 1,115,000 | | | | 1,069,965 | |
Wisconsin PFA Research Triangle High School Project Series A (Education Revenue) 144A | | | 4.38 | | | | 7-1-2025 | | | | 535,000 | | | | 526,055 | |
The accompanying notes are an integral part of these financial statements.
| | | | | | |
| Portfolio of investments—December 31, 2016 | | Wells Fargo Managed Account CoreBuilder Shares – Series M | | | 19 | |
| | | | | | | | | | | | | | | | |
| Security name | | Interest rate | | | Maturity date | | | Principal | | | Value | |
|
| Wisconsin (continued) | |
Wisconsin PFA Research Triangle High School Project Series A (Education Revenue) 144A | | | 5.38 | % | | | 7-1-2035 | | | $ | 1,000,000 | | | $ | 965,910 | |
| |
| | | | 12,585,448 | |
| | | | | | | | | | | | | | | | |
| |
Total Municipal Obligations (Cost $546,857,390) | | | | 536,376,766 | |
| | | | | | | | | | | | | | | | |
| | | | |
| | | Yield | | | | | | Shares | | | | |
| Short-Term Investments: 1.47% | | | | | | | | | | | | | | | | |
| | | | |
| Investment Companies: 1.22% | | | | | | | | | | | | | | | | |
Wells Fargo Municipal Cash Management Fund Institutional Class ##(l)(u) | | | 0.67 | | | | | | | | 6,601,672 | | | | 6,605,633 | |
| | | | | | | | | | | | | | | | |
| | | | |
| | | | | | Maturity date | | | Principal | | | | |
| U.S. Treasury Securities: 0.25% | | | | | | | | | | | | | | | | |
U.S. Treasury Bill (z) | | | 0.15 | | | | 3-16-2017 | | | $ | 1,325,000 | | | | 1,323,675 | |
| | | | | | | | | | | | | | | | |
| | | | |
Total Short-Term Investments (Cost $7,928,688) | | | | | | | | | | | | | | | 7,929,308 | |
| | | | | | | | | | | | | | | | |
| | | | | | | | |
| Total investments in securities (Cost $554,786,078) * | | | 100.98 | % | | | 544,306,074 | |
Other assets and liabilities, net | | | (0.98 | ) | | | (5,258,895 | ) |
| | | | | | | | |
| Total net assets | | | 100.00 | % | | $ | 539,047,179 | |
| | | | | | | | |
| ¤ | The security is issued in zero coupon form with no periodic interest payments. |
| 144A | The security may be resold in transactions exempt from registration, normally to qualified institutional buyers, pursuant to Rule 144A under the Securities Act of 1933. |
| ø | Variable rate demand notes are subject to a demand feature which reduces the effective maturity. The maturity date shown represents the final maturity date of the security. The interest rate is determined and reset by the issuer daily, weekly, or monthly depending upon the terms of the security. The rate shown is the rate in effect at period end. |
| ± | Variable rate investment. The rate shown is the rate in effect at period end. |
| (s) | The security is currently in default with regards to scheduled interest and/or principal payments. |
| (m) | The security is an auction-rate security which has an interest rate that resets at predetermined short-term intervals through a Dutch auction. The rate shown is the rate in effect at period end. |
| (n) | The auction to set the interest rate on the security failed at period end due to insufficient investor interest. A failed auction does not itself cause a default. |
| ## | All or a portion of this security is segregated for when-issued securities. |
| %% | The security is issued on a when-issued basis. |
| (l) | The issuer of the security is an affiliated person of the Fund as defined in the Investment Company Act of 1940. |
| (u) | The rate represents the 7-day annualized yield at period end. |
| (z) | Zero coupon security. The rate represents the current yield to maturity. |
| * | Cost for federal income tax purposes is $554,786,077 and unrealized gains (losses) consists of: |
| | | | |
Gross unrealized gains | | $ | 6,708,404 | |
Gross unrealized losses | | | (17,188,407 | ) |
| | | | |
Net unrealized losses | | $ | (10,480,003 | ) |
The accompanying notes are an integral part of these financial statements.
| | | | |
| 20 | | Wells Fargo Managed Account CoreBuilder Shares – Series M | | Statement of assets and liabilities—December 31, 2016 |
| | | | |
| | | | |
| |
Assets | | | | |
Investments | | | | |
In unaffiliated securities, at value (cost $548,181,009) | | $ | 537,700,441 | |
In affiliated securities, at value (cost $6,605,069) | | | 6,605,633 | |
| | | | |
Total investments, at value (cost $554,786,078) | | | 544,306,074 | |
Receivable for investments sold | | | 1,079,980 | |
Receivable for Fund shares sold | | | 2,471,753 | |
Receivable for interest | | | 6,170,046 | |
| | | | |
Total assets | | | 554,027,853 | |
| | | | |
| |
Liabilities | | | | |
Dividends payable | | | 1,637,306 | |
Payable for investments purchased | | | 10,033,271 | |
Payable for Fund shares redeemed | | | 3,310,097 | |
| | | | |
Total liabilities | | | 14,980,674 | |
| | | | |
Total net assets | | $ | 539,047,179 | |
| | | | |
| |
NET ASSETS CONSIST OF | | | | |
Paid-in capital | | $ | 550,558,588 | |
Overdistributed net investment income | | | (74 | ) |
Accumulated net realized losses on investments | | | (1,031,331 | ) |
Net unrealized losses on investments | | | (10,480,004 | ) |
| | | | |
Total net assets | | $ | 539,047,179 | |
| | | | |
| |
COMPUTATION OF NET ASSET VALUE | | | | |
Net assets | | $ | 539,047,179 | |
Shares outstanding1 | | | 46,846,633 | |
Net asset value per share | | | $11.51 | |
| 1 | The Fund has an unlimited number of authorized shares. |
The accompanying notes are an integral part of these financial statements.
| | | | | | |
| Statement of operations—year ended December 31, 2016 | | Wells Fargo Managed Account CoreBuilder Shares – Series M | | | 21 | |
| | | | |
| | | | |
| |
Investment income | | | | |
Interest | | $ | 14,551,625 | |
Dividends | | | 79,798 | |
Income from affiliated securities | | | 18,825 | |
| | | | |
Total investment income | | | 14,650,248 | |
| | | | |
| |
Expenses | | | | |
Custody and accounting fees | | | 30,716 | |
Professional fees | | | 47,229 | |
Registration fees | | | 69,228 | |
Shareholder report expenses | | | 18,961 | |
Trustees’ fees and expenses | | | 19,515 | |
Other fees and expenses | | | 10,291 | |
| | | | |
Total expenses | | | 195,940 | |
Less: Fee waivers and/or expense reimbursements | | | (195,940 | ) |
| | | | |
Net expenses | | | 0 | |
| | | | |
Net investment income | | | 14,650,248 | |
| | | | |
| |
REALIZED AND UNREALIZED GAINS (LOSSES) ON INVESTMENTS | | | | |
| |
Net realized gains (losses) on: | | | | |
Unaffiliated securities | | | 1,792,356 | |
Affiliated securities | | | 2,066 | |
Futures transactions | | | (2,509,856 | ) |
| | | | |
Net realized losses on investments | | | (715,434 | ) |
| | | | |
| |
Net change in unrealized gains (losses) on: | | | | |
Unaffiliated securities | | | (22,117,481 | ) |
Affiliated securities | | | 564 | |
Futures transactions | | | (264,701 | ) |
| | | | |
Net change in unrealized gains (losses) on investments | | | (22,381,618 | ) |
| | | | |
Net realized and unrealized gains (losses) on investments | | | (23,097,052 | ) |
| | | | |
Net decrease in net assets resulting from operations | | $ | (8,446,804 | ) |
| | | | |
The accompanying notes are an integral part of these financial statements.
| | | | |
| 22 | | Wells Fargo Managed Account CoreBuilder Shares – Series M | | Statement of changes in net assets |
| | | | | | | | | | | | | | | | |
| | | Year ended December 31, 2016 | | | Year ended December 31, 2015 | |
| | | |
Operations | | | | | | | | | | | | |
Net investment income | | | | | | $ | 14,650,248 | | | | | | | $ | 10,164,627 | |
Net realized losses on investments | | | | | | | (715,434 | ) | | | | | | | (340,359 | ) |
Net change in unrealized gains (losses) on investments | | | | | | | (22,381,618 | ) | | | | | | | 3,876,087 | |
| | | | |
Net increase (decrease) in net assets resulting from operations | | | | | | | (8,446,804 | ) | | | | | | | 13,700,355 | |
| | | | |
Distributions to shareholders from net investment income | | | | | | | (14,649,787 | ) | | | | | | | (10,162,044 | ) |
| | | | |
| | | | |
Capital share transactions | | | Shares | | | | | | | | Shares | | | | | |
Proceeds from shares sold | | | 25,355,522 | | | | 304,732,701 | | | | 16,297,884 | | | | 192,388,203 | |
Payment for shares redeemed | | | (8,725,514 | ) | | | (103,998,208 | ) | | | (4,853,267 | ) | | | (57,133,399 | ) |
| | | | |
Net increase in net assets resulting from capital share transactions | | | | | | | 200,734,493 | | | | | | | | 135,254,804 | |
| | | | |
Total increase in net assets | | | | | | | 177,637,902 | | | | | | | | 138,793,115 | |
| | | | |
| | |
Net assets | | | | | | | | |
Beginning of period | | | | | | | 361,409,277 | | | | | | | | 222,616,162 | |
| | | | |
End of period | | | | | | $ | 539,047,179 | | | | | | | $ | 361,409,277 | |
| | | | |
Overdistributed net investment income | | | | | | $ | (74 | ) | | | | | | $ | (535 | ) |
| | | | |
The accompanying notes are an integral part of these financial statements.
| | | | | | |
| Financial highlights | | Wells Fargo Managed Account CoreBuilder Shares – Series M | | | 23 | |
(For a share outstanding throughout each period)
| | | | | | | | | | | | | | | | | | | | |
| | | Year ended December 31 | |
| | | 2016 | | | 2015 | | | 2014 | | | 2013 | | | 2012 | |
Net asset value, beginning of period | | | $11.96 | | | | $11.86 | | | | $10.99 | | | | $11.61 | | | | $10.93 | |
Net investment income | | | 0.37 | | | | 0.41 | | | | 0.44 | | | | 0.44 | | | | 0.44 | |
Net realized and unrealized gains (losses) on investments | | | (0.45 | ) | | | 0.10 | | | | 1.00 | | | | (0.60 | ) | | | 0.93 | |
| | | | | | | | | | | | | | | | | | | | |
Total from investment operations | | | (0.08 | ) | | | 0.51 | | | | 1.44 | | | | (0.16 | ) | | | 1.37 | |
Distributions to shareholders from | | | | | | | | | | | | | | | | | | | | |
Net investment income | | | (0.37 | ) | | | (0.41 | ) | | | (0.44 | ) | | | (0.43 | ) | | | (0.44 | ) |
Net realized gains | | | 0.00 | | | | 0.00 | | | | (0.13 | ) | | | (0.03 | ) | | | (0.25 | ) |
| | | | | | | | | | | | | | | | | | | | |
Total distributions to shareholders | | | (0.37 | ) | | | (0.41 | ) | | | (0.57 | ) | | | (0.46 | ) | | | (0.69 | ) |
Net asset value, end of period | | | $11.51 | | | | $11.96 | | | | $11.86 | | | | $10.99 | | | | $11.61 | |
Total return | | | (0.75 | )% | | | 4.38 | % | | | 13.27 | % | | | (1.37 | )% | | | 12.81 | % |
Ratios to average net assets (annualized) | | | | | | | | | | | | | | | | | | | | |
Gross expenses | | | 0.04 | % | | | 0.07 | % | | | 0.10 | % | | | 0.08 | % | | | 0.24 | % |
Net expenses | | | 0.00 | %1 | | | 0.00 | %1 | | | 0.00 | %1 | | | 0.00 | %1 | | | 0.00 | %1 |
Net investment income | | | 3.05 | % | | | 3.45 | % | | | 3.66 | % | | | 3.94 | % | | | 3.76 | % |
Supplemental data | | | | | | | | | | | | | | | | | | | | |
Portfolio turnover rate | | | 15 | % | | | 21 | % | | | 37 | % | | | 56 | % | | | 57 | % |
Net assets, end of period (000s omitted) | | | $539,047 | | | | $361,409 | | | | $222,616 | | | | $104,914 | | | | $49,911 | |
| 1 | The manager has contractually committed to irrevocably absorb and pay or reimburse all ordinary operating expenses of the Fund, except portfolio transactions or other investment-related costs (e.g., commissions), fees payable for services provided by the Fund’s securities lending agent, interest, taxes, leverage expenses, and other expenses not incurred in the ordinary course of the Fund’s business. This commitment has an indefinite term. |
The accompanying notes are an integral part of these financial statements.
| | | | |
| 24 | | Wells Fargo Managed Account CoreBuilder Shares – Series M | | Notes to financial statements |
1. ORGANIZATION
Wells Fargo Funds Trust (the “Trust”), a Delaware statutory trust organized on March 10, 1999, is an open-end management investment company registered under the Investment Company Act of 1940, as amended (the “1940 Act”). As an investment company, the Trust follows the accounting and reporting guidance in Financial Accounting Standards Board (“FASB”) Accounting Standards Codification Topic 946, Financial Services – Investment Companies. These financial statements report on the Wells Fargo Managed Account CoreBuilder Shares – Series M (the “Fund”) which is a diversified series of the Trust.
The Fund is a special purpose municipal bond fund that is used in combination with selected individual securities to effectively model institutional-level investment strategies. As an investment option within the separately managed accounts advised or subadvised by Wells Fargo Funds Management, LLC (“Funds Management”), the Fund enables certain separately managed account investors to achieve greater diversification than small managed accounts might otherwise achieve.
2. SIGNIFICANT ACCOUNTING POLICIES
The following significant accounting policies, which are consistently followed in the preparation of the financial statements of the Fund, are in conformity with U.S. generally accepted accounting principles which require management to make estimates and assumptions that affect the reported amounts of assets and liabilities, disclosure of contingent assets and liabilities at the date of the financial statements, and the reported amounts of revenues and expenses during the reporting period. Actual results could differ from those estimates.
Securities valuation
All investments are valued each business day as of the close of regular trading on the New York Stock Exchange (generally 4 p.m. Eastern Time), although the Fund may deviate from this calculation time under unusual or unexpected circumstances.
Debt securities are valued at the evaluated bid price provided by an independent pricing service or, if a reliable price is not available, the quoted bid price from an independent broker-dealer.
Equity securities and futures that are listed on a foreign or domestic exchange or market are valued at the official closing price or, if none, the last sales price. If no sale occurs on the principal exchange or market that day, the prior day’s price will be deemed “stale” and a fair value price will be determined in accordance with the Fund’s Valuation Procedures.
Investments in registered open-end investment companies are valued at net asset value.
Investments which are not valued using any of the methods discussed above are valued at their fair value, as determined in good faith by the Board of Trustees of the Fund. The Board of Trustees has established a Valuation Committee comprised of the Trustees and has delegated to it the authority to take any actions regarding the valuation of portfolio securities that the Valuation Committee deems necessary or appropriate, including determining the fair value of portfolio securities, unless the determination has been delegated to the Management Valuation Team. The Board of Trustees retains the authority to make or ratify any valuation decisions or approve any changes to the Valuation Procedures as it deems appropriate. On a quarterly basis, the Board of Trustees receives reports on any valuation actions taken by the Valuation Committee or the Management Valuation Team which may include items for ratification.
Valuations of fair valued securities are compared to the next actual sales price when available, or other appropriate market values, to assess the continued appropriateness of the fair valuation methodologies used. These securities are fair valued on a day-to-day basis, taking into consideration changes to appropriate market information and any significant changes to the inputs considered in the valuation process until there is a readily available price provided on an exchange or by an independent pricing service. Valuations received from an independent pricing service or independent broker-dealer quotes are periodically validated by comparisons to most recent trades and valuations provided by other independent pricing services in addition to the review of prices by the manager and/or subadviser. Unobservable inputs used in determining fair valuations are identified based on the type of security, taking into consideration factors utilized by market participants in valuing the investment, knowledge about the issuer and the current market environment.
When-issued transactions
The Fund may purchase securities on a forward commitment or when-issued basis. The Fund records a when-issued transaction on the trade date and will segregate assets in an amount at least equal in value to the Fund’s commitment to purchase when-issued securities. Securities purchased on a when-issued basis are marked-to-market daily and the Fund begins earning interest on the settlement date. Losses may arise due to changes in the market value of the underlying securities or if the counterparty does not perform under the contract.
| | | | | | |
| Notes to financial statements | | Wells Fargo Managed Account CoreBuilder Shares – Series M | | | 25 | |
Futures contracts
The Fund is subject to interest rate risk in the normal course of pursuing its investment objectives. The Fund may buy and sell futures contracts in order to gain exposure to, or protect against, changes in security values and interest rates. The primary risks associated with the use of futures contracts are the imperfect correlation between changes in market values of securities held by the Fund and the prices of futures contracts, and the possibility of an illiquid market.
The aggregate principal amounts of the contracts are not recorded in the financial statements. Fluctuations in the value of the contracts are recorded in the Statement of Assets and Liabilities as an asset or liability and in the Statement of Operations as unrealized gains or losses until the contracts are closed, at which point they are recorded as net realized gains or losses on futures contracts. With futures contracts, there is minimal counterparty risk to the Fund since futures are exchange traded and the exchange’s clearinghouse, as counterparty to all exchange traded futures, guarantees the futures against default.
Security transactions and income recognition
Securities transactions are recorded on a trade date basis. Realized gains or losses are recorded on the basis of identified cost.
Interest income is accrued daily and bond discounts are accreted and premiums are amortized daily based on the effective interest method. To the extent debt obligations are placed on non-accrual status, any related interest income may be reduced by writing off interest receivables when the collection of all or a portion of interest has become doubtful based on consistently applied procedures. If the issuer subsequently resumes interest payments or when the collectability of interest is reasonably assured, the debt obligation is removed from non-accrual status.
Dividend income is recognized on the ex-dividend date.
Distributions to shareholders
Distributions to shareholders from net investment income are accrued daily and paid monthly. Distributions from net realized gains, if any, are recorded on the ex-dividend date. Such distributions are determined in conformity with federal income tax regulations, which may differ in amount or character from net investment income and realized gains recognized for purposes of U.S. generally accepted accounting principles.
Federal and other taxes
The Fund intends to continue to qualify as a regulated investment company by distributing substantially all of its investment company taxable and tax-exempt income and any net realized capital gains (after reduction for capital loss carryforwards) sufficient to relieve it from all, or substantially all, federal income taxes. Accordingly, no provision for federal income taxes was required.
The Fund’s income and federal excise tax returns and all financial records supporting those returns for the prior three fiscal years are subject to examination by the federal and Delaware revenue authorities. Management has analyzed the Fund’s tax positions taken on federal, state, and foreign tax returns for all open tax years and does not believe that there are any uncertain tax positions that require recognition of a tax liability.
As of December 31, 2016, the Fund had capital loss carryforwards which consist of $845,380 in long-term capital losses.
As of December 31, 2016, the Fund had current year net deferred post-October capital losses consisting of $185,952 in short-term losses which will be recognized on the first day of the following fiscal year.
3. FAIR VALUATION MEASUREMENTS
Fair value measurements of investments are determined within a framework that has established a fair value hierarchy based upon the various data inputs utilized in determining the value of the Fund’s investments. The three-level hierarchy gives the highest priority to unadjusted quoted prices in active markets for identical assets or liabilities (Level 1) and the lowest priority to significant unobservable inputs (Level 3). The Fund’s investments are classified within the fair value hierarchy based on the lowest level of input that is significant to the fair value measurement. The inputs are summarized into three broad levels as follows:
| ∎ | | Level 1 – quoted prices in active markets for identical securities |
| ∎ | | Level 2 – other significant observable inputs (including quoted prices for similar securities, interest rates, prepayment speeds, credit risk, use of amortized cost, etc.) |
| ∎ | | Level 3 – significant unobservable inputs (including the Fund’s own assumptions in determining the fair value of investments) |
| | | | |
| 26 | | Wells Fargo Managed Account CoreBuilder Shares – Series M | | Notes to financial statements |
The inputs or methodologies used for valuing investments in securities are not necessarily an indication of the risk associated with investing in those securities.
The following is a summary of the inputs used in valuing the Fund’s assets and liabilities as of December 31, 2016:
| | | | | | | | | | | | | | | | |
| | | Quoted prices
(Level 1) | | | Other significant
observable inputs
(Level 2) | | | Significant
unobservable inputs (Level 3) | | | Total | |
Assets | | | | | | | | | | | | | | | | |
Investments in: | | | | | | | | | | | | | | | | |
| | | | |
Municipal obligations | | $ | 0 | | | $ | 536,376,766 | | | $ | 0 | | | $ | 536,376,766 | |
| | | | |
Short-term investments | | | | | | | | | | | | | | | | |
Investment companies | | | 6,605,633 | | | | 0 | | | | 0 | | | | 6,605,633 | |
U.S. Treasury securities | | | 1,323,675 | | | | 0 | | | | 0 | | | | 1,323,675 | |
Total assets | | $ | 7,929,308 | | | $ | 536,376,766 | | | $ | 0 | | | $ | 544,306,074 | |
The Fund recognizes transfers between levels within the fair value hierarchy at the end of the reporting period. At December 31, 2016, the Fund did not have any transfers into/out of Level 1, Level 2, or Level 3.
4. TRANSACTIONS WITH AFFILIATES AND OTHER EXPENSES
The Trust has entered into an advisory contract with Funds Management, an indirect wholly owned subsidiary of Wells Fargo & Company (“Wells Fargo”). The adviser is responsible for implementing investment policies and guidelines and for supervising the subadviser, who is responsible for day-to-day portfolio management of the Fund. For providing these services, Funds Management does not receive a fee from the Fund but is entitled to receive fees from the sponsors of the wrap-fee programs. Out of these fees, Funds Management pays Wells Capital Management Incorporated, an affiliate of Funds Management and an indirect wholly owned subsidiary of Wells Fargo, for its services as the subadviser to the Fund.
Generally, no ordinary operating fees or expenses are charged to the Fund. Funds Management has contractually committed to irrevocably absorb and pay or reimburse all ordinary operating expenses of the Fund, except portfolio transactions or other investment-related costs (e.g., commissions), fees payable for services provided by the Fund’s securities lending agent, interest, taxes, leverage expenses, and other expenses not incurred in the ordinary course of the Fund’s business. This commitment has an indefinite term.
During the year ended December 31, 2016, State Street Bank and Trust Company, the Fund’s custodian, reimbursed the Fund $3,047 for certain out-of-pocket expenses that were billed to the Fund in error from 1998-2015. This amount is included in interest income on the Statement of Operations.
5. INVESTMENT PORTFOLIO TRANSACTIONS
Purchases and sales of investments, excluding U.S. government obligations (if any) and short-term securities, for the year ended December 31, 2016 were $299,861,408 and $63,584,531, respectively.
The Fund may purchase or sell investment securities to other Wells Fargo funds under procedures adopted by the Board of Trustees. The procedures have been designed to ensure that these interfund transactions, which generally do not incur broker commissions, are effected at current market prices. Interfund trades are included within the respective purchases and sales amounts shown.
6. DERIVATIVE TRANSACTIONS
During the year ended December 31, 2016, the Fund entered into futures contracts to take advantage of the differences between municipal and treasury yields and to help manage the duration of the Fund.
As of December 31, 2016, the Fund did not have any open futures contracts. The Fund had an average notional amount of $35,706,462 in short futures contracts during the year ended December 31, 2016.
The realized losses and change in unrealized gains (losses) on futures contracts are reflected in the Statement of Operations.
| | | | | | |
| Notes to financial statements | | Wells Fargo Managed Account CoreBuilder Shares – Series M | | | 27 | |
7. BANK BORROWINGS
The Trust (excluding the money market funds and certain other funds) and Wells Fargo Variable Trust are parties to a $250,000,000 revolving credit agreement whereby the Fund is permitted to use bank borrowings for temporary or emergency purposes, such as to fund shareholder redemption requests. Interest under the credit agreement is charged to the Fund based on a borrowing rate equal to the higher of the Federal Funds rate in effect on that day plus 1.25% or the overnight LIBOR rate in effect on that day plus 1.25%. In addition, an annual commitment fee equal to 0.25% of the unused balance is allocated to each participating fund. Prior to August 30, 2016, the revolving credit agreement amount was $200,000,000 and the annual commitment fee was equal to 0.20% of the unused balance which was allocated to each participating fund.
For the year ended December 31, 2016, there were no borrowings by the Fund under the agreement.
8. DISTRIBUTIONS TO SHAREHOLDERS
The tax character of distributions paid during the year ended December 31, 2016 and December 31, 2015 were as follows:
| | | | | | | | |
| | | Year ended December 31 | |
| | | 2016 | | | 2015 | |
Ordinary income | | $ | 234,568 | | | $ | 0 | |
Tax-exempt income | | | 14,415,219 | | | | 10,162,044 | |
As of December 31, 2016, the components of distributable earnings on a tax basis were as follows:
| | | | | | |
Undistributed
tax-exempt
income | | Unrealized
losses | | Post-October
capital losses
deferred | | Capital loss
carryforward |
| $1,637,232 | | $(10,480,003) | | $(185,952) | | $(845,380) |
9. CONCENTRATION OF OWNERSHIP
From time to time, the Fund may have a concentration of one or more of its shareholders that hold a significant percentage of the Fund’s shares outstanding. Investment and/or voting activities of these shareholders with respect to their holdings in the Fund shares could have a material impact on the Fund.
At December 31, 2016, the following shareholders held 91.63% of the outstanding shares of the Fund:
| | | | |
| | | % of ownership | |
Charles Schwab & Company Incorporated | | | 5.30 | |
Morgan Stanley Smith Barney LLC | | | 23.61 | |
Pershing LLC | | | 9.29 | |
UBS Financial Services Incorporated | | | 53.43 | |
10. INDEMNIFICATION
Under the Trust’s organizational documents, the officers and Trustees have been granted certain indemnification rights against certain liabilities that may arise out of performance of their duties to the Trust. Additionally, in the normal course of business, the Trust may enter into contracts with service providers that contain a variety of indemnification clauses. The Trust’s maximum exposure under these arrangements is dependent on future claims that may be made against the Fund and, therefore, cannot be estimated.
11. REGULATORY CHANGES
In October 2016, the Securities and Exchange Commission (“SEC”) adopted new rules and forms and amended existing rules and forms (together, “final rules”) intended to modernize and enhance the reporting and disclosure of information by registered investment companies and to enhance liquidity risk management by open-end mutual funds and exchange-traded funds. The final rules will enhance the quality of information available to investors and will allow the SEC to more effectively collect and use data reported by funds. In part, the final rules amend Regulation S-X and require standardized, enhanced disclosure about derivatives in the Fund’s financial statements, as well as other amendments. The compliance date for the amendments to Regulation S-X is August 1, 2017 while the compliance date for the new form types is June 1, 2018 and the compliance date for the liquidity risk management program requirements is December 1, 2018. Management is currently assessing the potential impact of these enhancements and their impact on the financial statement disclosures and reporting requirements.
| | | | |
| 28 | | Wells Fargo Managed Account CoreBuilder Shares – Series M | | Report of independent registered public accounting firm |
BOARD OF TRUSTEES AND SHAREHOLDERS OF WELLS FARGO FUNDS TRUST:
We have audited the accompanying statement of assets and liabilities, including the portfolio of investments, of the Wells Fargo Managed Account CoreBuilder Shares – Series M (the “Fund”), one of the funds constituting the Wells Fargo Funds Trust, as of December 31, 2016, and the related statement of operations for the year then ended, the statements of changes in net assets for each of the years in the two-year period then ended, and the financial highlights for each of the years in the five-year period then ended. These financial statements and financial highlights are the responsibility of the Fund’s management. Our responsibility is to express an opinion on these financial statements and financial highlights based on our audits.
We conducted our audits in accordance with the standards of the Public Company Accounting Oversight Board (United States). Those standards require that we plan and perform the audit to obtain reasonable assurance about whether the financial statements and financial highlights are free of material misstatement. An audit includes examining, on a test basis, evidence supporting the amounts and disclosures in the financial statements. Our procedures included confirmation of securities owned as of December 31, 2016, by correspondence with the custodian and brokers, or by other appropriate auditing procedures. An audit also includes assessing the accounting principles used and significant estimates made by management, as well as evaluating the overall financial statement presentation. We believe that our audits provide a reasonable basis for our opinion.
In our opinion, the financial statements and financial highlights referred to above present fairly, in all material respects, the financial position of the Wells Fargo Managed Account CoreBuilder Shares – Series M as of December 31, 2016, the results of its operations for the year then ended, the changes in its net assets for each of the years in the two-year period then ended, and the financial highlights for each of the years in the five-year period then ended, in conformity with U.S. generally accepted accounting principles.

Boston, Massachusetts
February 23, 2017
| | | | | | |
| Other information (unaudited) | | Wells Fargo Managed Account CoreBuilder Shares – Series M | | | 29 | |
TAX INFORMATION
Pursuant to Section 852 of the Internal Revenue Code, 98.40% of distributions paid from net investment income is designated as exempt-interest dividends for the fiscal year ended December 31, 2016.
PROXY VOTING INFORMATION
A description of the policies and procedures that the Fund uses to determine how to vote proxies relating to portfolio securities is available, upon request, by calling 1-888-877-9275, visiting our website at wellsfargofunds.com, or visiting the SEC website at sec.gov. Information regarding how the Fund voted proxies relating to portfolio securities during the most recent 12-month period ended June 30 is available on the Fund’s website at wellsfargofunds.com or by visiting the SEC website at sec.gov.
PORTFOLIO HOLDINGS INFORMATION
The complete portfolio holdings for the Fund are publicly available monthly on the Fund’s website (wellsfargofunds.com), on a one-month delayed basis. In addition, top ten holdings information (excluding derivative positions) for the Fund is publicly available on the Fund’s website on a monthly, seven-day or more delayed basis. The Fund files its complete schedule of portfolio holdings with the SEC for the first and third quarters of each fiscal year on Form N-Q, which is available by visiting the SEC website at sec.gov. In addition, the Fund’s Form N-Q may be reviewed and copied at the SEC’s Public Reference Room in Washington, DC, and at regional offices in New York City, at 233 Broadway, and in Chicago, at 175 West Jackson Boulevard, Suite 900. Information about the Public Reference Room may be obtained by calling 1-800-SEC-0330.
| | | | |
| 30 | | Wells Fargo Managed Account CoreBuilder Shares – Series M | | Other information (unaudited) |
BOARD OF TRUSTEES AND OFFICERS
Each of the Trustees and Officers1 listed in the table below acts in identical capacities for each fund in the Wells Fargo family of funds, which consists of 139 mutual funds comprising the Wells Fargo Funds Trust, Wells Fargo Variable Trust, Wells Fargo Master Trust and four closed-end funds (collectively the “Fund Complex”). This table should be read in conjunction with the Prospectus and the Statement of Additional Information2. The mailing address of each Trustee and Officer is 525 Market Street, 12th Floor, San Francisco, CA 94105. Each Trustee and Officer serves an indefinite term, however, each Trustee serves such term until reaching the mandatory retirement age established by the Trustees.
Independent Trustees
| | | | | | |
Name and
year of birth | | Position held and
length of service* | | Principal occupations during past five years or longer | | Current other
public company or
investment company directorships |
| William R. Ebsworth (Born 1957) | | Trustee, since 2015 | | Retired. From 1984 to 2013, equities analyst, portfolio manager, research director and chief financial officer at Fidelity Management and Research Company in Boston, Tokyo, and Hong Kong and retired in 2013 as Chief Investment Officer of Fidelity Strategic Advisers, Inc. where he lead a team of investment professionals managing client assets. Prior thereto, Board member of Hong Kong Securities Clearing Co., Hong Kong Options Clearing Corp., the Thailand International Fund, Ltd., Fidelity Investments Life Insurance Company, and Empire Fidelity Investments Life Insurance Company. Board member of the Fonté Foundation (non-profit organization) and the Vincent Memorial Hospital Endowment (non-profit organization), where he serves on the Investment Committee and as a Chair of the Audit Committee. Mr. Ebsworth is a CFA® charterholder and an Adjunct Lecturer, Finance, at Babson College. | | Asset Allocation Trust |
| Jane A. Freeman (Born 1953) | | Trustee, since 2015 | | Retired. From 2012 to 2014 and 1999 to 2008, Chief Financial Officer of Scientific Learning Corporation. From 2008 to 2012, Ms. Freeman provided consulting services related to strategic business projects. Prior to 1999, Portfolio Manager at Rockefeller & Co. and Scudder, Stevens & Clark. Board member of the Harding Loevner Funds from 1996 to 2014, serving as both Lead Independent Director and chair of the Audit Committee. Board member of the Russell Exchange Traded Funds Trust from 2011 to 2012 and the chair of the Audit Committee. Ms. Freeman is a Board Member of Ruth Bancroft Garden (non-profit organization) and an inactive chartered financial analyst. | | Asset Allocation Trust |
| Peter G. Gordon** (Born 1942) | | Trustee, since 1998; Chairman, since 2005 | | Co-Founder, Retired Chairman, President and CEO of Crystal Geyser Water Company. Trustee Emeritus, Colby College. | | Asset Allocation Trust |
Isaiah Harris, Jr. (Born 1952) | | Trustee, since 2009 | | Retired. Chairman of the Board of CIGNA Corporation since 2009, and Director since 2005. From 2003 to 2011, Director of Deluxe Corporation. Prior thereto, President and CEO of BellSouth Advertising and Publishing Corp. from 2005 to 2007, President and CEO of BellSouth Enterprises from 2004 to 2005 and President of BellSouth Consumer Services from 2000 to 2003. Emeritus member of the Iowa State University Foundation Board of Governors. Emeritus Member of the Advisory Board of Iowa State University School of Business. Advisory Board Member, Palm Harbor Academy (charter school). Advisory Board Member, Child Evangelism Fellowship (non-profit). Mr. Harris is a certified public accountant (inactive status). | | CIGNA Corporation; Asset Allocation Trust |
| Judith M. Johnson (Born 1949) | | Trustee, since 2008;
Audit Committee Chairman, since 2008 | | Retired. Prior thereto, Chief Executive Officer and Chief Investment Officer of Minneapolis Employees Retirement Fund from 1996 to 2008. Ms. Johnson is an attorney, certified public accountant and a certified managerial accountant. | | Asset Allocation Trust |
| David F. Larcker (Born 1950) | | Trustee, since 2009 | | James Irvin Miller Professor of Accounting at the Graduate School of Business, Stanford University, Director of the Corporate Governance Research Initiative and Senior Faculty of The Rock Center for Corporate Governance since 2006. From 2005 to 2008, Professor of Accounting at the Graduate School of Business, Stanford University. Prior thereto, Ernst & Young Professor of Accounting at The Wharton School, University of Pennsylvania from 1985 to 2005. | | Asset Allocation Trust |
| | | | | | |
| Other information (unaudited) | | Wells Fargo Managed Account CoreBuilder Shares – Series M | | | 31 | |
| | | | | | |
Name and
year of birth | | Position held and
length of service* | | Principal occupations during past five years or longer | | Current other
public company or
investment company directorships |
| Olivia S. Mitchell (Born 1953) | | Trustee, since 2006 | | International Foundation of Employee Benefit Plans Professor, Wharton School of the University of Pennsylvania since 1993. Director of Wharton’s Pension Research Council and Boettner Center on Pensions & Retirement Research, and Research Associate at the National Bureau of Economic Research. Previously, Cornell University Professor from 1978 to 1993. | | Asset Allocation Trust |
| Timothy J. Penny (Born 1951) | | Trustee, since 1996 | | President and Chief Executive Officer of Southern Minnesota Initiative Foundation, a non-profit organization, since 2007 and Senior Fellow at the Humphrey Institute Policy Forum at the University of Minnesota since 1995. Member of the Board of Trustees of NorthStar Education Finance, Inc., a non-profit organization, since 2007. | | Asset Allocation Trust |
| Michael S. Scofield (Born 1943) | | Trustee, since 2010 | | Served on the Investment Company Institute’s Board of Governors and Executive Committee from 2008-2011 as well the Governing Council of the Independent Directors Council from 2006-2011 and the Independent Directors Council Executive Committee from 2008-2011. Chairman of the IDC from 2008-2010. Institutional Investor (Fund Directions) Trustee of Year in 2007. Trustee of the Evergreen Funds complex (and its predecessors) from 1984 to 2010. Chairman of the Evergreen Funds from 2000-2010. Former Trustee of the Mentor Funds. Retired Attorney, Law Offices of Michael S. Scofield. | | Asset Allocation Trust |
| * | Length of service dates reflect the Trustee’s commencement of service with the Trust’s predecessor entities, where applicable. |
| ** | Peter Gordon is expected to retire on December 31, 2017. |
Officers
| | | | | | |
Name and
year of birth | | Position held and
length of service | | Principal occupations during past five years or longer | | |
| Andrew Owen3 (Born 1960) | | President, since 2017 | | Executive Vice President of Wells Fargo Bank, N.A. and President of Wells Fargo & Company and Head of Affiliated Managaers, Wells Fargo Asset Management, since 2014. Executive Vice President responsible for marketing, investments and product development for Wells Fargo Funds Management, LLC, from 2009 to 2014. | | |
| Nancy Wiser1 (Born 1967) | | Treasurer, since 2012 | | Executive Vice President of Wells Fargo Funds Management, LLC since 2011. Chief Operating Officer and Chief Compliance Officer at LightBox Capital Management LLC, from 2008 to 2011. | | |
| C. David Messman (Born 1960) | | Secretary, since 2000; Chief Legal Officer, since 2003 | | Senior Vice President and Secretary of Wells Fargo Funds Management, LLC since 2001. Assistant General Counsel of Wells Fargo Bank, N.A. since 2013 and Vice President and Managing Counsel of Wells Fargo Bank, N.A. from 1996 to 2013. | | |
| Michael Whitaker (Born 1967) | | Chief Compliance Officer, since 2016 | | Executive Vice President of Wells Fargo Funds Management, LLC since 2016. Chief Compliance Officer of Fidelity’s Fixed Income Funds and Asset Allocation Funds from 2008 to 2016, Compliance Officer of FMR Co., Inc. from 2014 to 2016, Fidelity Investments Money Management, Inc. from 2014 to 2016, Fidelity Investments from 2007 to 2016. | | |
| David Berardi (Born 1975) | | Assistant Treasurer, since 2009 | | Vice President of Wells Fargo Funds Management, LLC since 2009. Vice President of Evergreen Investment Management Company, LLC from 2008 to 2010. Manager of Fund Reporting and Control for Evergreen Investment Management Company, LLC from 2004 to 2010. | | |
| Jeremy DePalma1 (Born 1974) | | Assistant Treasurer, since 2009 | | Senior Vice President of Wells Fargo Funds Management, LLC since 2009. Senior Vice President of Evergreen Investment Management Company, LLC from 2008 to 2010 and head of the Fund Reporting and Control Team within Fund Administration from 2005 to 2010. | | |
| 1 | Nancy Wiser acts as Treasurer of 70 funds in the Fund Complex. Jeremy DePalma acts as Treasurer of 69 funds and Assistant Treasurer of 70 funds in the Fund Complex. |
| 2 | The Statement of Additional Information includes additional information about the Trustees and is available, without charge, upon request, by calling 1-888-877-9275 or by visiting the website at wellsfargofunds.com. |
| 3 | Andrew Owen became President on January 1, 2017. |
| | | | |
| 32 | | Wells Fargo Managed Account CoreBuilder Shares – Series M | | List of abbreviations |
The following is a list of common abbreviations for terms and entities that may have appeared in this report.
| ACA | — ACA Financial Guaranty Corporation |
| ADR | — American depositary receipt |
| ADS | — American depositary shares |
| AGC | — Assured Guaranty Corporation |
| AGM | — Assured Guaranty Municipal |
| Ambac | — Ambac Financial Group Incorporated |
| AMT | — Alternative minimum tax |
| BAN | — Bond anticipation notes |
| BHAC | — Berkshire Hathaway Assurance Corporation |
| CAB | — Capital appreciation bond |
| CCAB | — Convertible capital appreciation bond |
| CDA | — Community Development Authority |
| CDO | — Collateralized debt obligation |
| DRIVER | — Derivative inverse tax-exempt receipts |
| DW&P | — Department of Water & Power |
| DWR | — Department of Water Resources |
| ECFA | — Educational & Cultural Facilities Authority |
| EDA | — Economic Development Authority |
| EDFA | — Economic Development Finance Authority |
| ETF | — Exchange-traded fund |
| FDIC | — Federal Deposit Insurance Corporation |
| FFCB | — Federal Farm Credit Banks |
| FGIC | — Financial Guaranty Insurance Corporation |
| FHA | — Federal Housing Administration |
| FHLB | — Federal Home Loan Bank |
| FHLMC | — Federal Home Loan Mortgage Corporation |
| FICO | — The Financing Corporation |
| FNMA | — Federal National Mortgage Association |
| GDR | — Global depositary receipt |
| GNMA | — Government National Mortgage Association |
| HCFR | — Healthcare facilities revenue |
| HEFA | — Health & Educational Facilities Authority |
| HEFAR | — Higher education facilities authority revenue |
| HFA | — Housing Finance Authority |
| HFFA | — Health Facilities Financing Authority |
| HUD | — Department of Housing and Urban Development |
| IDA | — Industrial Development Authority |
| IDAG | — Industrial Development Agency |
| KRW | — Republic of Korea won |
| LIBOR | — London Interbank Offered Rate |
| LIFER | — Long Inverse Floating Exempt Receipts |
| LLC | — Limited liability company |
| LLLP | — Limited liability limited partnership |
| LLP | — Limited liability partnership |
| MBIA | — Municipal Bond Insurance Association |
| MFHR | — Multifamily housing revenue |
| MSTR | — Municipal securities trust receipts |
| MUD | — Municipal Utility District |
| National | — National Public Finance Guarantee Corporation |
| PCFA | — Pollution Control Financing Authority |
| PCL | — Public Company Limited |
| PCR | — Pollution control revenue |
| PFA | — Public Finance Authority |
| PFFA | — Public Facilities Financing Authority |
| PFOTER | — Puttable floating option tax-exempt receipts |
| plc | — Public limited company |
| PUTTER | — Puttable tax-exempt receipts |
| R&D | — Research & development |
| Radian | — Radian Asset Assurance |
| RAN | — Revenue anticipation notes |
| RDA | — Redevelopment Authority |
| RDFA | — Redevelopment Finance Authority |
| REIT | — Real estate investment trust |
| ROC | — Reset option certificates |
| SAVRS | — Select auction variable rate securities |
| SBA | — Small Business Authority |
| SDR | — Swedish depositary receipt |
| SFHR | — Single-family housing revenue |
| SFMR | — Single-family mortgage revenue |
| SPA | — Standby purchase agreement |
| SPDR | — Standard & Poor’s Depositary Receipts |
| SPEAR | — Short Puttable Exempt Adjustable Receipts |
| STRIPS | — Separate trading of registered interest and |
| TAN | — Tax anticipation notes |
| TIPS | — Treasury inflation-protected securities |
| TRAN | — Tax revenue anticipation notes |
| TTFA | — Transportation Trust Fund Authority |
| TVA | — Tennessee Valley Authority |

For more information
More information about Wells Fargo Funds is available free upon request. To obtain literature, please write, email, visit the Fund’s website, or call:
Wells Fargo Funds
Attn: Managed Account Services
P.O. Box 1450
Milwaukee, WI 53201
Email: MAS@wellsfargo.com
Website: wellsfargofunds.com
Managed Account Services: 1-800-368-0627
Sales Support Inquiries: 1-800-368-1683
This report and the financial statements contained herein are submitted for the general information of the shareholders of the Fund. If this report is used for promotional purposes, distribution of the report must be accompanied or preceded by a current prospectus. Before investing, please consider the investment objectives, risks, charges, and expenses of the investment. For a current prospectus and, if available, a summary prospectus, containing this information, call 1-888-877-9275. Read the prospectus carefully before you invest or send money.
Wells Fargo Funds Management, LLC, a wholly owned subsidiary of Wells Fargo & Company, provides investment advisory and administrative services for the Fund. Other affiliates of Wells Fargo & Company provide subadvisory and other services for the Fund. The Fund is distributed by Wells Fargo Funds Distributor, LLC, Member FINRA, an affiliate of Wells Fargo & Company. Neither Wells Fargo Funds Management nor Wells Fargo Funds Distributor has Fund customer accounts/assets, and neither provides investment advice/recommendations or acts as an investment advice fiduciary to any investor.
NOT FDIC INSURED ◾ NO BANK GUARANTEE ◾ MAY LOSE VALUE
© 2016 Wells Fargo Funds Management, LLC. All rights reserved.
| | |
 | | 300467 02-17 ACBM/AR130 12-16 |
(a) As of the end of the period covered by the report, Wells Fargo Funds Trust has adopted a code of ethics that applies to its President and Treasurer. A copy of the code of ethics is filed as an exhibit to this Form N-CSR.
(c) During the period covered by this report, there were no amendments to the provisions of the code of ethics adopted in Item 2(a) above.
(d) During the period covered by this report, there were no implicit or explicit waivers to the provisions of the code of ethics adopted in Item 2(a) above.
| ITEM 3. | AUDIT COMMITTEE FINANCIAL EXPERT |
The Board of Trustees of Wells Fargo Funds Trust has determined that Judith Johnson is an audit committee financial expert, as defined in Item 3 of Form N-CSR. Mrs. Johnson is independent for purposes of Item 3 of Form N-CSR.
| ITEM 4. | PRINCIPAL ACCOUNTANT FEES AND SERVICES |
(a), (b), (c), (d) The following table presents aggregate fees billed in each of the last two fiscal years for services rendered to the Registrant by the Registrant’s principal accountant. These fees were billed to the registrant and were approved by the Registrant’s audit committee.
| | | | | | | | |
| | | Fiscal
year ended
December 31, 2016 | | | Fiscal
year ended
December 31, 2015 | |
Audit fees | | $ | 32,000 | | | $ | 31,340 | |
Audit-related fees | | | — | | | | — | |
Tax fees (1) | | | 2,235 | | | | 2,250 | |
All other fees | | | — | | | | — | |
| | | | | | | | |
| | $ | 34,325 | | | $ | 33,590 | |
| | | | | | | | |
| (1) | Tax fees consist of fees for tax compliance, tax advice, tax planning and excise tax. |
(e) The Chairman of the Audit Committees is authorized to pre-approve: (1) audit services for the mutual funds of Wells Fargo Funds Trust; (2) non-audit tax or compliance consulting or training services provided to the Funds by the independent auditors (“Auditors”) if the fees for any particular engagement are not anticipated to exceed $50,000; and (3) non-audit tax or compliance consulting or training services provided by the Auditors to a Fund’s investment adviser and its controlling entities (where pre-approval is required because the engagement relates directly to the operations and financial reporting of the Fund) if the fee to the Auditors for any particular engagement is not anticipated to exceed $50,000. For any such pre-approval sought from the Chairman, Management shall prepare a brief description of the proposed services. If the Chairman approves of such service, he or she shall sign the statement prepared by Management. Such written statement shall be presented to the full Committees at their next regularly scheduled meetings.
(f) Not applicable
(g) Not applicable
(h) Not applicable
| ITEM 5. | AUDIT COMMITTEE OF LISTED REGISTRANTS |
Not applicable.
A Portfolio of Investments for each series of Wells Fargo Funds Trust is included as part of the report to shareholders filed under Item 1 of this Form.
| ITEM 7. | DISCLOSURE OF PROXY VOTING POLICIES AND PROCEDURES FOR CLOSED-END MANAGEMENT INVESTMENT COMPANIES |
Not applicable.
| ITEM 8. | PORTFOLIO MANAGERS OF CLOSED-END MANAGEMENT INVESTMENT COMPANIES |
Not applicable.
| ITEM 9. | PURCHASES OF EQUITY SECURITIES BY CLOSED-END MANAGEMENT INVESTMENT COMPANY AND AFFILIATED PURCHASERS |
Not applicable.
| ITEM 10. | SUBMISSION OF MATTERS TO A VOTE OF SECURITY HOLDERS |
There have been no material changes to the procedures by which shareholders may recommend nominees to the registrant’s Board of Trustees that have been implemented since the registrant’s last provided disclosure in response to the requirements of this Item.
| ITEM 11. | CONTROLS AND PROCEDURES |
(a) The President and Treasurer have concluded that the Wells Fargo Funds Trust (the “Trust”) disclosure controls and procedures (as defined in Rule 30a-3(c) under the Investment Company Act of 1940) provide reasonable assurances that material information relating to the Trust is made known to them by the appropriate persons based on their evaluation of these controls and procedures as of a date within 90 days of the filing of this report.
(b) There were no significant changes in the Trust’s internal controls over financial reporting (as defined in Rule 30a-3(d) under the Investment Company Act of 1940) that occurred during the second fiscal quarter of the period covered by this report that materially affected, or is reasonably likely to materially affect, the registrant’s internal control over financial reporting.
(a)(1) Code of Ethics pursuant to Item 2 of Form N-CSR is filed and attached hereto as Exhibit COE.
(a)(2) Certification pursuant to Rule 30a-2(a) under the Investment Company Act of 1940 (17 CFR 270.30a-2(a)) is filed and attached hereto as Exhibit 99.CERT.
(a)(3) Not applicable.
(b) Certification pursuant to Rule 30a-2(b) under the Investment Company Act of 1940 (17 CFR 270.30a-2(b)) is filed and attached hereto as Exhibit 99.906CERT.
SIGNATURES
Pursuant to the requirements of the Securities Exchange Act of 1934 and the Investment Company Act of 1940, the registrant has duly caused this report to be signed on its behalf by the undersigned, thereunto duly authorized.
| | |
| Wells Fargo Funds Trust |
| |
By: | | |
| | /s/ Andrew Owen |
| |
| | Andrew Owen |
| | President |
| |
Date: | | February 23, 2017 |
Pursuant to the requirements of the Securities Exchange Act of 1934 and the Investment Company Act of 1940, this report has been signed below by the following persons on behalf of the registrant and in the capacities and on the date indicated.
| | |
| Wells Fargo Funds Trust |
| |
By: | | |
| | /s/ Andrew Owen |
| |
| | Andrew Owen |
| | President |
| |
Date: | | February 23, 2017 |
| |
By: | | |
| | /s/ Nancy Wiser |
| |
| | Nancy Wiser |
| | Treasurer |
| |
Date: | | February 23, 2017 |