
UNITED STATES
SECURITIES AND EXCHANGE COMMISSION
Washington, D.C. 20549
FORMN-CSRS
CERTIFIED SHAREHOLDER REPORT OF REGISTERED
MANAGEMENT INVESTMENT COMPANIES
Investment Company Act file number:811-09253
Wells Fargo Funds Trust
(Exact name of registrant as specified in charter)
525 Market St., San Francisco, CA 94105
(Address of principal executive offices) (Zip code)
Alexander Kymn
Wells Fargo Funds Management, LLC
525 Market St., San Francisco, CA 94105
(Name and address of agent for service)
Registrant’s telephone number, including area code:800-222-8222
Date of fiscal year end: July 31
Registrant is making a filing for 11 of its series:
Wells Fargo Capital Growth Fund, Wells Fargo Disciplined U.S. Core Fund, Wells Fargo Endeavor Select Fund, Wells Fargo Growth Fund, Wells Fargo Intrinsic Value Fund, Wells Fargo Large Cap Core Fund, Wells Fargo Large Cap Growth Fund, Wells Fargo Large Company Value Fund, Wells Fargo Low Volatility U.S. Equity Fund, Wells Fargo Omega Growth Fund, and Wells Fargo Premier Large Company Growth Fund.
Date of reporting period: January 31, 2019
| ITEM 1. | REPORT TO STOCKHOLDERS |
Semi-Annual Report
January 31, 2019

Wells Fargo Capital Growth Fund

Beginning on January 1, 2021, as permitted by new regulations adopted by the Securities and Exchange Commission, paper copies of the Wells Fargo Funds’ annual and semi-annual shareholder reports issued after this date will no longer be sent by mail, unless you specifically request paper copies of the reports. Instead, the reports will be made available on the Funds’ website, and you will be notified by mail each time a report is posted and provided with a website address to access the report.
If you already elected to receive shareholder reports electronically, you will not be affected by this change and you need not take any action. You may elect to receive shareholder reports and other communications from the Fund electronically at any time by contacting your financial intermediary (such as a broker-dealer or bank) or, if you are a direct investor, by calling 1-800-222-8222 or by enrolling at wellsfargo.com/advantagedelivery.
You may elect to receive all future reports in paper free of charge. If you invest through a financial intermediary, you can contact your financial intermediary to request that you continue to receive paper copies of your shareholder reports; if you invest directly with the Fund, you can call 1-800-222-8222. Your election to receive reports in paper will apply to all Wells Fargo Funds held in your account with your financial intermediary or, if you are a direct investor, to all Wells Fargo Funds that you hold.

Reduce clutter. Save trees.
Sign up for electronic delivery of prospectuses and shareholder reports atwellsfargo.com/advantagedelivery
Contents
The views expressed and any forward-looking statements are as of January 31, 2019, unless otherwise noted, and are those of the Fund managers and/or Wells Fargo Funds Management, LLC. Discussions of individual securities, or the markets generally, or any Wells Fargo Fund are not intended as individual recommendations. Future events or results may vary significantly from those expressed in any forward-looking statements. The views expressed are subject to change at any time in response to changing circumstances in the market. Wells Fargo Funds Management, LLC and the Fund disclaim any obligation to publicly update or revise any views expressed or forward-looking statements.
INVESTMENT PRODUCTS: NOT FDIC INSURED ◾ NO BANK GUARANTEE ◾ MAY LOSE VALUE
| | | | |
| 2 | | Wells Fargo Capital Growth Fund | | Letter to shareholders (unaudited) |

Andrew Owen
President
Wells Fargo Funds
Favorable third-quarter economic indicators and corporate earnings reports encouraged domestic stock investors.
Dear Shareholder:
We are pleased to offer you this semi-annual report for the Wells Fargo Capital Growth Fund for the six-month period that ended January 31, 2019. Highershort-term interest rates, inflation concerns, trade tensions, slowing economic growth outside the U.S., and geopolitical events contributed to investment market volatility throughout the period.
For the period, U.S. stocks, as measured by the S&P 500 Index,1 fell 3.00% and international stocks, as measured by the MSCI ACWI ex USA Index (Net),2 declined 6.34%. Based on the MSCI EM Index (Net),3 emerging market stocks lost 2.60%. For bond investors, the Bloomberg Barclays U.S. Aggregate Bond Index4 added 2.71% while the Bloomberg Barclays Global Aggregate ex-USD Index5 gained 1.37%. The Bloomberg Barclays Municipal Bond Index6 added 2.05%, and the ICE BofAML U.S. High Yield Index7 gained 1.02%.
Investors appeared to shake off lingering concerns during the third quarter.
Favorable third-quarter economic indicators and corporate earnings reports encouraged domestic stock investors. U.S. trade negotiations with Mexico and Canada made progress. The Conference Board Consumer Confidence Index®8 reached its highest level in 18 years during September. Several U.S. equity market indices reached records during August. The U.S. Federal Reserve (Fed) raised the federal funds rate by 25 basis points (bps; 100 bps equal 1.00%) to a target range of between 2.00% and 2.25% in September 2018. For the quarter that ended September 30, the S&P 500 Index added 7.71%.
Investors in international markets were not as reassured. Tensions between the U.S. and China increased when the U.S. imposed an additional $200 billion in tariffs on Chinese goods. China responded with $60 billion in tariffs on U.S. products. In addition, economic growth in China drew renewed concerns. The Bank of England, having raised its monetary policy rate to 0.50% in November 2017, increased the rate again in August 2018 to 0.75%. During the three-month period that ended September 30, 2018, the MSCI ACWI ex USA Index (Net) gained 0.71% while the MSCI EM Index (Net) declined 1.09%.
| 1 | The S&P 500 Index consists of 500 stocks chosen for market size, liquidity, and industry group representation. It is a market-value-weighted index with each stock’s weight in the index proportionate to its market value. You cannot invest directly in an index. |
| 2 | The Morgan Stanley Capital International (MSCI) All Country World Index (ACWI) ex USA Index (Net) is a free-float-adjusted market-capitalization-weighted index that is designed to measure the equity market performance of developed markets, excluding the United States and Canada. Source: MSCI. MSCI makes no express or implied warranties or representations and shall have no liability whatsoever with respect to any MSCI data contained herein. The MSCI data may not be further redistributed or used as a basis for other indices or any securities or financial products. This report is not approved, reviewed, or produced by MSCI. You cannot invest directly in an index. |
| 3 | The MSCI Emerging Markets (EM) Index (Net) is a free-float-adjusted market-capitalization-weighted index that is designed to measure large- and mid-cap equity market performance of emerging markets. The MSCI EM Index (Net) consists of the following 24 emerging market country indices: Brazil, Chile, China, Colombia, Czech Republic, Egypt, Greece, Hungary, India, Indonesia, Korea, Malaysia, Mexico, Pakistan, Peru, the Philippines, Poland, Qatar, Russia, South Africa, Taiwan, Thailand, Turkey, and the United Arab Emirates. You cannot invest directly in an index. |
| 4 | The Bloomberg Barclays U.S. Aggregate Bond Index is a broad-based benchmark that measures the investment-grade, U.S. dollar-denominated, fixed-rate taxable bond market, including Treasuries, government-related and corporate securities, mortgage-backed securities (agency fixed-rate and hybrid adjustable-rate mortgage pass-throughs), asset-backed securities, and commercial mortgage-backed securities. You cannot invest directly in an index. |
| 5 | The Bloomberg Barclays Global Aggregate ex-USD Index is an unmanaged index that provides a broad-based measure of the global investment-grade fixed-income markets excluding the U.S. dollar-denominated debt market. You cannot invest directly in an index. |
| 6 | The Bloomberg Barclays Municipal Bond Index is an unmanaged index composed of long-term tax-exempt bonds with a minimum credit rating of Baa. You cannot invest directly in an index. |
| 7 | The ICE BofAML U.S. High Yield Index is a market-capitalization-weighted index of domestic and Yankee high-yield bonds. The index tracks the performance of high-yield securities traded in the U.S. bond market. You cannot invest directly in an index. Copyright 2019. ICE Data Indices, LLC. All rights reserved. |
| 8 | The Conference Board Consumer Confidence Index® measures the degree of optimism on the state of the U.S. economy that consumers are expressing through their activities of savings and spending. You cannot invest directly in an index. |
| | | | | | |
| Letter to shareholders (unaudited) | | Wells Fargo Capital Growth Fund | | | 3 | |
In bond markets, U.S. bonds, as measured by the Bloomberg Barclays U.S. Aggregate Bond Index, were flat. The Bloomberg Barclays Global Aggregateex-USD Index fell 1.74% during the quarter that ended September 30, 2018.
Conflicting data unsettled markets during the fourth quarter.
Negative stock market performance during October and December bracketed a mildly positive November for the S&P 500 Index and the MSCI ACWI ex USA Index (Net). As interest rates and bond yields gained during October, stock markets struggled. December’s S&P 500 Index performance was the worst since 1931. Globally, fixed-income investments fared better than stocks during the last two months of the year.
November’s U.S. midterm elections shifted control of the House of Representatives from Republicans to Democrats, presaging potential partisan disputes. The Bureau of Economic Analysis reported that third-quarter U.S. gross domestic product (GDP) grew at an annualized 3.4% rate, lower than second-quarter GDP growth. Brexit efforts stalled in the U.K. ahead of the March 2019 deadline. The People’s Bank of China cut reserve requirement ratios and accelerated infrastructure spending and tax cuts, and the value of the yuan declined to low levels last seen in 2008. Oil prices fell.
After the Fed increased the federal funds rate by 25 bps to a target range of between 2.25% and 2.50% in December 2018—the ninth such increase since the Fed began raising rates three years ago from near zero—it softened its outlook for further interest rate increases in 2019.
The market climbs a wall of worry.
Investors entered 2019 with reasons to be concerned. A partial U.S. government shutdown driven by partisan disputes over spending and immigration policies extended into January. Globally, economic signals were uneven. Investors expected high levels of stock market volatility to continue, as measured by the VIX9.
January’s returns tended to support the investing adage that the market climbs a wall of worry. The S&P 500 Index gained 8.01% for the month that ended January 31, 2019, its best monthly performance in 30 years. Returns for the MSCI ACWI ex USA Index (Net), the Bloomberg Barclays U.S. Aggregate Bond Index, and the Bloomberg Barclays Global Aggregate ex-USD Index also were positive.
Don’t let short-term uncertainty derail long-term investment goals.
Periods of investment uncertainty can present challenges, but experience has taught us that maintaining long-term investment goals can be an effective way to plan for the future. To help you create a sound strategy based on your personal goals and risk tolerance, Wells Fargo Funds offers more than 100 mutual funds spanning a wide range of asset classes and investment styles. Although diversification cannot guarantee an investment profit or prevent losses, we believe it can be an effective way to manage investment risk and potentially smooth out overall portfolio performance. We encourage investors to know their investments and to understand that appropriate levels of risk-taking may unlock opportunities.
January’s returns tended to support the investing adage that the market climbs a wall of worry.
| 9 | The Chicago Board Options Exchange Market Volatility Index (VIX) is a popular measure of the implied volatility of S&P 500 Index options. It represents one measure of the market’s expectation of stock market volatility over the next 30-day period. You cannot invest directly in an index. |
| | | | |
| 4 | | Wells Fargo Capital Growth Fund | | Letter to shareholders (unaudited) |
Thank you for choosing to invest with Wells Fargo Funds. We appreciate your confidence in us and remain committed to helping you meet your financial needs.
Sincerely,

Andrew Owen
President
Wells Fargo Funds
For further information about your Fund, contact your investment professional, visit our website atwellsfargofunds.com, or call us directly at1-800-222-8222.
This page is intentionally left blank.
| | | | |
| 6 | | Wells Fargo Capital Growth Fund | | Performance highlights (unaudited) |
Investment objective
The Fund seeks long-term capital appreciation.
Manager
Wells Fargo Funds Management, LLC
Subadviser
Wells Capital Management Incorporated
Portfolio managers
Michael T. Smith, CFA®‡
Christopher J. Warner, CFA®‡
Average annual total returns (%) as of January 31, 2019
| | | | | | | | | | | | | | | | | | | | | | | | | | | | | | | | | | |
| | | | | Including sales charge | | | Excluding sales charge | | | Expense ratios1 (%) | |
| | | Inception date | | 1 year | | | 5 year | | | 10 year | | | 1 year | | | 5 year | | | 10 year | | | Gross | | | Net2 | |
| | | | | | | | | |
| Class A (WFCGX) | | 7-31-2007 | | | -3.24 | | | | 10.05 | | | | 14.45 | | | | 2.64 | | | | 11.36 | | | | 15.13 | | | | 1.27 | | | | 1.12 | |
| | | | | | | | | |
| Class C (WFCCX) | | 7-31-2007 | | | 0.97 | | | | 10.54 | | | | 14.28 | | | | 1.97 | | | | 10.54 | | | | 14.28 | | | | 2.02 | | | | 1.87 | |
| | | | | | | | | |
| Class R6 (WFCRX)3 | | 11-30-2012 | �� | | – | | | | – | | | | – | | | | 2.91 | | | | 11.84 | | | | 15.67 | | | | 0.84 | | | | 0.61 | |
| | | | | | | | | |
| Administrator Class (WFCDX) | | 6-30-2003 | | | – | | | | – | | | | – | | | | 2.80 | | | | 11.53 | | | | 15.37 | | | | 1.19 | | | | 0.95 | |
| | | | | | | | | |
| Institutional Class (WWCIX) | | 4-8-2005 | | | – | | | | – | | | | – | | | | 3.04 | | | | 11.82 | | | | 15.65 | | | | 0.94 | | | | 0.71 | |
| | | | | | | | | |
| Russell 1000® Growth Index4 | | – | | | – | | | | – | | | | – | | | | 0.24 | | | | 12.97 | | | | 16.86 | | | | – | | | | – | |
Figures quoted represent past performance, which is no guarantee of future results, and do not reflect taxes that a shareholder may pay on fund distributions or the redemption of fund shares. Investment return and principal value of an investment will fluctuate so that an investor’s shares, when redeemed, may be worth more or less than their original cost. Performance shown without sales charges would be lower if sales charges were reflected. Current performance may be lower or higher than the performance data quoted, which assumes the reinvestment of dividends and capital gains. Current month-end performance is available on the Fund’s website,wellsfargofunds.com.
Index returns do not include transaction costs associated with buying and selling securities, any mutual fund fees or expenses, or any taxes. It is not possible to invest directly in an index.
For Class A shares, the maximum front-end sales charge is 5.75%. For Class C shares, the maximum contingent deferred sales charge is 1.00%. Performance including a contingent deferred sales charge assumes the sales charge for the corresponding time period. Class R6, Administrator Class, and Institutional Class shares are sold without a front-end sales charge or contingent deferred sales charge.
Stock values fluctuate in response to the activities of individual companies and general market and economic conditions. Certain investment strategies tend to increase the total risk of an investment (relative to the broader market). The Fund is exposed to foreign investment risk. Consult the Fund’s prospectus for additional information on these and other risks.
Please see footnotes on page 7.
| | | | | | |
| Performance highlights (unaudited) | | Wells Fargo Capital Growth Fund | | | 7 | |
| | | | |
| Ten largest holdings (%) as of January 31, 20195 | |
| |
Amazon.com Incorporated | | | 7.87 | |
| |
Microsoft Corporation | | | 7.09 | |
| |
Alphabet Incorporated Class A | | | 6.02 | |
| |
UnitedHealth Group Incorporated | | | 5.26 | |
| |
Visa Incorporated Class A | | | 4.69 | |
| |
Waste Connections Incorporated | | | 3.55 | |
| |
Union Pacific Corporation | | | 3.03 | |
| |
The Home Depot Incorporated | | | 2.90 | |
| |
First Data Corporation Class A | | | 2.51 | |
| |
Salesforce.com Incorporated | | | 2.39 | |
|
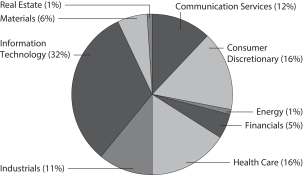
| Sector distribution as of January 31, 20196 |
|
|
| ‡ | CFA® and Chartered Financial Analyst® are trademarks owned by CFA Institute. |
| 1 | Reflects the expense ratios as stated in the most recent prospectus, which include the impact of 0.01% in acquired fund fees and expenses. The expense ratios shown are subject to change and may differ from the annualized expense ratios shown in the financial highlights of this report. |
| 2 | The manager has contractually committed through November 30, 2019, to waive fees and/or reimburse expenses to the extent necessary to cap the expenses of each class after fee waivers at 1.11% for Class A, 1.86% for Class C, 0.60% for Class R6, 0.94% for Administrator Class, and 0.70% for Institutional Class. Brokerage commissions, stamp duty fees, interest, taxes, acquired fund fees and expenses (if any), and extraordinary expenses are excluded from the expense cap. Prior to or after the commitment expiration date, the cap may be increased or the commitment to maintain the cap may be terminated only with the approval of the Board of Trustees. Without this cap, the Fund’s returns would have been lower. The expense ratio paid by an investor is the net expense ratio (the total annual fund operating expenses after fee waivers) as stated in the prospectuses. |
| 3 | Historical performance shown for Class R6 shares prior to their inception reflects the performance of Institutional Class shares, and includes the higher expenses applicable to Institutional Class shares. If these expenses had not been included, returns for Class R6 shares would be higher. |
| 4 | The Russell 1000® Growth Index measures the performance of those Russell 1000 companies with higher price/book ratios and higher forecasted growth values. You cannot invest directly in an index. |
| 5 | The ten largest holdings, excluding cash, cash equivalents and any money market funds, are calculated based on the value of the investments divided by total net assets of the Fund. Holdings are subject to change and may have changed since the date specified. |
| 6 | Amounts are calculated based on the total long-term investments of the Fund. These amounts are subject to change and may have changed since the date specified. |
| | | | |
| 8 | | Wells Fargo Capital Growth Fund | | Fund expenses (unaudited) |
As a shareholder of the Fund, you incur two types of costs: (1) transaction costs, including sales charges (loads) on purchase payments and contingent deferred sales charges (if any) on redemptions and (2) ongoing costs, including management fees, distribution (12b-1) and/or shareholder servicing fees, and other Fund expenses. This example is intended to help you understand your ongoing costs (in dollars) of investing in the Fund and to compare these costs with the ongoing costs of investing in other mutual funds.
The example is based on an investment of $1,000 invested at the beginning of the six-month period and held for the entire period from August 1, 2018 to January 31, 2019.
Actual expenses
The “Actual” line of the table below provides information about actual account values and actual expenses. You may use the information in this line, together with the amount you invested, to estimate the expenses that you paid over the period. Simply divide your account value by $1,000 (for example, an $8,600 account value divided by $1,000 = 8.6), then multiply the result by the number in the “Actual” line under the heading entitled “Expenses paid during period” for your applicable class of shares to estimate the expenses you paid on your account during this period.
Hypothetical example for comparison purposes
The “Hypothetical” line of the table below provides information about hypothetical account values and hypothetical expenses based on the Fund’s actual expense ratio and an assumed rate of return of 5% per year before expenses, which is not the Fund’s actual return. The hypothetical account values and expenses may not be used to estimate the actual ending account balance or expenses you paid for the period. You may use this information to compare the ongoing costs of investing in the Fund and other funds. To do so, compare this 5% hypothetical example with the 5% hypothetical examples that appear in the shareholder reports of the other funds.
Please note that the expenses shown in the table are meant to highlight your ongoing costs only and do not reflect any transactional costs, such as sales charges (loads) and contingent deferred sales charges. Therefore, the “Hypothetical” line of the table is useful in comparing ongoing costs only and will not help you determine the relative total costs of owning different funds. In addition, if these transactional costs were included, your costs would have been higher.
| | | | | | | | | | | | | | | | |
| | | Beginning
account value
8-1-2018 | | | Ending
account value
1-31-2019 | | | Expenses
paid during
the period¹ | | | Annualized net
expense ratio | |
Class A | | | | | | | | | | | | | | | | |
| | | | |
Actual | | $ | 1,000.00 | | | $ | 976.75 | | | $ | 5.28 | | | | 1.06 | % |
| | | | |
Hypothetical (5% return before expenses) | | $ | 1,000.00 | | | $ | 1,019.86 | | | $ | 5.40 | | | | 1.06 | % |
Class C | | | | | | | | | | | | | | | | |
| | | | |
Actual | | $ | 1,000.00 | | | $ | 973.67 | | | $ | 9.00 | | | | 1.81 | % |
| | | | |
Hypothetical (5% return before expenses) | | $ | 1,000.00 | | | $ | 1,016.08 | | | $ | 9.20 | | | | 1.81 | % |
Class R6 | | | | | | | | | | | | | | | | |
| | | | |
Actual | | $ | 1,000.00 | | | $ | 978.95 | | | $ | 2.99 | | | | 0.60 | % |
| | | | |
Hypothetical (5% return before expenses) | | $ | 1,000.00 | | | $ | 1,022.18 | | | $ | 3.06 | | | | 0.60 | % |
Administrator Class | | | | | | | | | | | | | | | | |
| | | | |
Actual | | $ | 1,000.00 | | | $ | 977.35 | | | $ | 4.68 | | | | 0.94 | % |
| | | | |
Hypothetical (5% return before expenses) | | $ | 1,000.00 | | | $ | 1,020.47 | | | $ | 4.79 | | | | 0.94 | % |
Institutional Class | | | | | | | | | | | | | | | | |
| | | | |
Actual | | $ | 1,000.00 | | | $ | 979.03 | | | $ | 3.49 | | | | 0.70 | % |
| | | | |
Hypothetical (5% return before expenses) | | $ | 1,000.00 | | | $ | 1,021.68 | | | $ | 3.57 | | | | 0.70 | % |
| 1 | Expenses paid is equal to the annualized net expense ratio of each class multiplied by the average account value over the period, multiplied by the number of days in the most recent fiscal half-year divided by the number of days in the fiscal year (to reflect the one-half-year period). |
| | | | | | |
| Portfolio of investments—January 31, 2019 (unaudited) | | Wells Fargo Capital Growth Fund | | | 9 | |
| | | | | | | | | | | | | | | | |
| Security name | | | | | | | | Shares | | | Value | |
| | | | |
Common Stocks: 98.42% | | | | | | | | | | | | | | | | |
| | | | |
Communication Services: 11.39% | | | | | | | | | | | | | | | | |
| | | | |
| Entertainment: 3.85% | | | | | | | | | | | | | | | | |
| | | | |
Activision Blizzard Incorporated | | | | | | | | | | | 21,300 | | | $ | 1,006,212 | |
| | | | |
Netflix Incorporated † | | | | | | | | | | | 4,400 | | | | 1,493,800 | |
| | | | |
Nintendo Company Limited ADR | | | | | | | | | | | 33,500 | | | | 1,247,540 | |
| | | | |
| | | | | | | | | | | | | | | 3,747,552 | |
| | | | | | | | | | | | | | | | |
| | | | |
| Interactive Media & Services: 7.54% | | | | | | | | | | | | | | | | |
| | | | |
Alphabet Incorporated Class A † | | | | | | | | | | | 5,208 | | | | 5,863,635 | |
| | | | |
Tencent Holdings Limited ADR | | | | | | | | | | | 33,050 | | | | 1,474,361 | |
| | | | |
| | | | | | | | | | | | | | | 7,337,996 | |
| | | | | | | | | | | | | | | | |
| | | | |
Consumer Discretionary: 16.07% | | | | | | | | | | | | | | | | |
| | | | |
| Auto Components: 1.56% | | | | | | | | | | | | | | | | |
| | | | |
Aptiv plc | | | | | | | | | | | 19,200 | | | | 1,519,296 | |
| | | | | | | | | | | | | | | | |
| | | | |
| Automobiles: 1.18% | | | | | | | | | | | | | | | | |
| | | | |
Ferrari NV | | | | | | | | | | | 9,100 | | | | 1,149,330 | |
| | | | | | | | | | | | | | | | |
| | | | |
| Internet & Direct Marketing Retail: 10.43% | | | | | | | | | | | | | | | | |
| | | | |
Alibaba Group Holding Limited ADR † | | | | | | | | | | | 6,050 | | | | 1,019,365 | |
| | | | |
Amazon.com Incorporated † | | | | | | | | | | | 4,455 | | | | 7,656,938 | |
| | | | |
MercadoLibre Incorporated † | | | | | | | | | | | 4,050 | | | | 1,474,200 | |
| | | | |
| | | | | | | | | | | | | | | 10,150,503 | |
| | | | | | | | | | | | | | | | |
| | | | |
| Specialty Retail: 2.90% | | | | | | | | | | | | | | | | |
| | | | |
The Home Depot Incorporated | | | | | | | | | | | 15,383 | | | | 2,823,242 | |
| | | | | | | | | | | | | | | | |
| | | | |
Energy: 0.77% | | | | | | | | | | | | | | | | |
| | | | |
| Oil, Gas & Consumable Fuels: 0.77% | | | | | | | | | | | | | | | | |
| | | | |
Pioneer Natural Resources Company | | | | | | | | | | | 5,250 | | | | 747,180 | |
| | | | | | | | | | | | | | | | |
| | | | |
Financials: 5.28% | | | | | | | | | | | | | | | | |
| | | | |
| Capital Markets: 5.28% | | | | | | | | | | | | | | | | |
| | | | |
Intercontinental Exchange Incorporated | | | | | | | | | | | 28,075 | | | | 2,155,037 | |
| | | | |
Raymond James Financial Incorporated | | | | | | | | | | | 21,000 | | | | 1,690,500 | |
| | | | |
S&P Global Incorporated | | | | | | | | | | | 6,763 | | | | 1,296,129 | |
| | | | |
| | | | | | | | | | | | | | | 5,141,666 | |
| | | | | | | | | | | | | | | | |
| | | | |
Health Care: 16.21% | | | | | | | | | | | | | | | | |
| | | | |
| Biotechnology: 2.69% | | | | | | | | | | | | | | | | |
| | | | |
Celgene Corporation † | | | | | | | | | | | 19,350 | | | | 1,711,701 | |
| | | | |
Exact Sciences Corporation † | | | | | | | | | | | 10,050 | | | | 905,304 | |
| | | | |
| | | | | | | | | | | | | | | 2,617,005 | |
| | | | | | | | | | | | | | | | |
The accompanying notes are an integral part of these financial statements.
| | | | |
| 10 | | Wells Fargo Capital Growth Fund | | Portfolio of investments—January 31, 2019 (unaudited) |
| | | | | | | | | | | | | | | | |
| Security name | | | | | | | | Shares | | | Value | |
| | | | |
| Health Care Equipment & Supplies: 7.05% | | | | | | | | | | | | | | | | |
| | | | |
Align Technology Incorporated † | | | | | | | | | | | 4,600 | | | $ | 1,145,170 | |
| | | | |
Boston Scientific Corporation † | | | | | | | | | | | 53,200 | | | | 2,029,580 | |
| | | | |
Edwards Lifesciences Corporation † | | | | | | | | | | | 8,850 | | | | 1,508,217 | |
| | | | |
Intuitive Surgical Incorporated † | | | | | | | | | | | 1,400 | | | | 733,096 | |
| | | | |
Medtronic plc | | | | | | | | | | | 16,400 | | | | 1,449,596 | |
| | | | |
| | | | | | | | | | | | | | | 6,865,659 | |
| | | | | | | | | | | | | | | | |
| | | | |
| Health Care Providers & Services: 5.26% | | | | | | | | | | | | | | | | |
| | | | |
UnitedHealth Group Incorporated | | | | | | | | | | | 18,947 | | | | 5,119,479 | |
| | | | | | | | | | | | | | | | |
| | | | |
| Life Sciences Tools & Services: 1.21% | | | | | | | | | | | | | | | | |
| | | | |
Illumina Incorporated † | | | | | | | | | | | 4,200 | | | | 1,175,118 | |
| | | | | | | | | | | | | | | | |
| | | | |
Industrials: 10.78% | | | | | | | | | | | | | | | | |
| | | | |
| Aerospace & Defense: 0.99% | | | | | | | | | | | | | | | | |
| | | | |
Teledyne Technologies Incorporated † | | | | | | | | | | | 4,300 | | | | 964,146 | |
| | | | | | | | | | | | | | | | |
| | | | |
| Commercial Services & Supplies: 5.50% | | | | | | | | | | | | | | | | |
| | | | |
Cintas Corporation | | | | | | | | | | | 10,100 | | | | 1,893,851 | |
| | | | |
Waste Connections Incorporated | | | | | | | | | | | 41,330 | | | | 3,453,535 | |
| | | | |
| | | | | | | | | | | | | | | 5,347,386 | |
| | | | | | | | | | | | | | | | |
| | | | |
| Electrical Equipment: 1.26% | | | | | | | | | | | | | | | | |
| | | | |
Rockwell Automation Incorporated | | | | | | | | | | | 7,250 | | | | 1,229,020 | |
| | | | | | | | | | | | | | | | |
| | | | |
| Road & Rail: 3.03% | | | | | | | | | | | | | | | | |
| | | | |
Union Pacific Corporation | | | | | | | | | | | 18,550 | | | | 2,950,749 | |
| | | | | | | | | | | | | | | | |
| | | | |
Information Technology: 31.20% | | | | | | | | | | | | | | | | |
| | | | |
| Communications Equipment: 1.80% | | | | | | | | | | | | | | | | |
| | | | |
Motorola Solutions Incorporated | | | | | | | | | | | 14,950 | | | | 1,747,805 | |
| | | | | | | | | | | | | | | | |
| | | | |
| IT Services: 16.40% | | | | | | | | | | | | | | | | |
| | | | |
Black Knight Incorporated † | | | | | | | | | | | 27,950 | | | | 1,374,861 | |
| | | | |
Fidelity National Information Services Incorporated | | | | | | | | | | | 18,850 | | | | 1,970,391 | |
| | | | |
First Data Corporation Class A † | | | | | | | | | | | 99,050 | | | | 2,441,583 | |
| | | | |
FleetCor Technologies Incorporated † | | | | | | | | | | | 6,800 | | | | 1,372,308 | |
| | | | |
PayPal Holdings Incorporated † | | | | | | | | | | | 23,150 | | | | 2,054,794 | |
| | | | |
Shopify Incorporated Class A † | | | | | | | | | | | 4,800 | | | | 808,656 | |
| | | | |
Total System Services Incorporated | | | | | | | | | | | 15,350 | | | | 1,375,514 | |
| | | | |
Visa Incorporated Class A | | | | | | | | | | | 33,820 | | | | 4,566,038 | |
| | | | |
| | | | | | | | | | | | | | | 15,964,145 | |
| | | | | | | | | | | | | | | | |
| | | | |
| Semiconductors & Semiconductor Equipment: 0.79% | | | | | | | | | | | | | | | | |
| | | | |
Infineon Technologies AG ADR | | | | | | | | | | | 34,750 | | | | 773,535 | |
| | | | | | | | | | | | | | | | |
| | | | |
| Software: 12.21% | | | | | | | | | | | | | | | | |
| | | | |
Autodesk Incorporated † | | | | | | | | | | | 8,100 | | | | 1,192,320 | |
| | | | |
Microsoft Corporation | | | | | | | | | | | 66,081 | | | | 6,900,839 | |
The accompanying notes are an integral part of these financial statements.
| | | | | | |
| Portfolio of investments—January 31, 2019 (unaudited) | | Wells Fargo Capital Growth Fund | | | 11 | |
| | | | | | | | | | | | | | | | |
| Security name | | | | | | | | Shares | | | Value | |
| | | | |
| Software(continued) | | | | | | | | | | | | | | | | |
| | | | |
Salesforce.com Incorporated † | | | | | | | | | | | 15,330 | | | $ | 2,329,700 | |
| | | | |
ServiceNow Incorporated † | | | | | | | | | | | 6,630 | | | | 1,458,733 | |
| | | | |
| | | | | | | | | | | | | | | 11,881,592 | |
| | | | | | | | | | | | | | | | |
| | | | |
Materials: 5.78% | | | | | | | | | | | | | | | | |
| | | | |
| Chemicals: 4.51% | | | | | | | | | | | | | | | | |
| | | | |
Air Products & Chemicals Incorporated | | | | | | | | | | | 13,000 | | | | 2,137,070 | |
| | | | |
The Sherwin-Williams Company | | | | | | | | | | | 5,350 | | | | 2,255,132 | |
| | | | |
| | | | | | | | | | | | | | | 4,392,202 | |
| | | | | | | | | | | | | | | | |
| | | | |
| Construction Materials: 1.27% | | | | | | | | | | | | | | | | |
| | | | |
Vulcan Materials Company | | | | | | | | | | | 12,100 | | | | 1,229,965 | |
| | | | | | | | | | | | | | | | |
| | | | |
Real Estate: 0.94% | | | | | | | | | | | | | | | | |
| | | | |
| Equity REITs: 0.94% | | | | | | | | | | | | | | | | |
| | | | |
SBA Communications Corporation † | | | | | | | | | | | 5,000 | | | | 912,650 | |
| | | | | | | | | | | | | | | | |
| | | | |
Total Common Stocks (Cost $57,662,769) | | | | | | | | | | | | | | | 95,787,221 | |
| | | | | | | | | | | | | | | | |
| | | | |
| | | Yield | | | | | | | | | | |
| Short-Term Investments: 2.34% | | | | | | | | | | | | | | | | |
| | | | |
| Investment Companies: 2.34% | | | | | | | | | | | | | | | | |
| | | | |
Wells Fargo Government Money Market Fund Select Class (l)(u) | | | 2.33 | % | | | | | | | 2,277,652 | | | | 2,277,652 | |
| | | | | | | | | | | | | | | | |
| | | | |
Total Short-Term Investments (Cost $2,277,652) | | | | | | | | | | | | | | | 2,277,652 | |
| | | | | | | | | | | | | | | | |
| | | | | | | | |
| Total investments in securities (Cost $59,940,421) | | | 100.76 | % | | | 98,064,873 | |
| | |
Other assets and liabilities, net | | | (0.76 | ) | | | (737,200 | ) |
| | | | | | | | |
| Total net assets | | | 100.00 | % | | $ | 97,327,673 | |
| | | | | | | | |
| † | Non-income-earning security |
| (l) | The issuer of the security is an affiliated person of the Fund as defined in the Investment Company Act of 1940. |
| (u) | The rate represents the 7-day annualized yield at period end. |
Abbreviations:
| ADR | American depositary receipt |
| REIT | Real estate investment trust |
The accompanying notes are an integral part of these financial statements.
| | | | |
| 12 | | Wells Fargo Capital Growth Fund | | Portfolio of investments—January 31, 2019 (unaudited) |
Investments in Affiliates
An affiliated investment is an investment in which the Fund owns at least 5% of the outstanding voting shares of the issuer or as a result of other relationships, such as the Fund and the issuer having the same investment manager. Transactions with issuers that were either affiliated persons of the Fund at the beginning of the period or the end of the period were as follows:
| | | | | | | | | | | | | | | | | | | | | | | | | | | | | | | | | | | | |
| | | Shares,
beginning of
period | | | Shares
purchased | | | Shares
sold | | | Shares,
end of
period | | | Net
realized
gains
(losses) | | | Net
change in
unrealized
gains
(losses) | | | Income
from
affiliated
securities | | | Value,
end
of period | | | % of
net
assets | |
Short-Term Investments | | | | | | | | | | | | | | | | | | | | | | | | | | | | | | | | | | | | |
Investment Companies | | | | | | | | | | | | | | | | | | | | | | | | | | | | | | | | | | | | |
Securities Lending Cash Investments LLC * | | | 1,332,367 | | | | 11,684,172 | | | | 13,016,539 | | | | 0 | | | $ | (1,160 | ) | | $ | 0 | | | $ | 7,140 | | | $ | 0 | | | | | |
Wells Fargo Government Money Market Fund Select Class | | | 922,555 | | | | 20,633,116 | | | | 19,278,019 | | | | 2,277,652 | | | | 0 | | | | 0 | | | | 12,482 | | | | 2,277,652 | | | | | |
| | | | | | | | | | | | | | | | | | | | | | | | | | | | | | | | | | | | |
| | | | | | | | | |
| | | | | | | | | | | | | | | | | | $ | (1,160 | ) | | $ | 0 | | | $ | 19,622 | | | $ | 2,277,652 | | | | 2.34 | % |
| | | | | | | | | | | | | | | | | | | | | | | | | | | | | | | | | | | | |
| | * | No longer held at the end of the period. |
The accompanying notes are an integral part of these financial statements.
| | | | | | |
| Statement of assets and liabilities—January 31, 2019 (unaudited) | | Wells Fargo Capital Growth Fund | | | 13 | |
| | | | |
| | | | |
| |
Assets | | | | |
Investments in unaffiliated securities, at value (cost $57,662,769) | | $ | 95,787,221 | |
Investments in affiliated securities, at value (cost $2,277,652) | | | 2,277,652 | |
Receivable for Fund shares sold | | | 12,171 | |
Receivable for dividends | | | 20,974 | |
Prepaid expenses and other assets | | | 58,401 | |
| | | | |
Total assets | | | 98,156,419 | |
| | | | |
| |
Liabilities | | | | |
Payable for investments purchased | | | 654,674 | |
Payable for Fund shares redeemed | | | 73,560 | |
Management fee payable | | | 25,701 | |
Administration fees payable | | | 15,274 | |
Trustees’ fees and expenses payable | | | 2,799 | |
Distribution fee payable | | | 1,809 | |
Due to custodian bank | | | 631 | |
Accrued expenses and other liabilities | | | 54,298 | |
| | | | |
Total liabilities | | | 828,746 | |
| | | | |
Total net assets | | $ | 97,327,673 | |
| | | | |
| |
NET ASSETS CONSIST OF | | | | |
Paid-in capital | | $ | 52,504,319 | |
Total distributable earnings | | | 44,823,354 | |
| | | | |
Total net assets | | $ | 97,327,673 | |
| | | | |
| |
COMPUTATION OF NET ASSET VALUE AND OFFERING PRICE PER SHARE | | | | |
Net assets – Class A | | $ | 75,246,122 | |
Shares outstanding – Class A1 | | | 9,322,846 | |
Net asset value per share – Class A | | | $8.07 | |
Maximum offering price per share – Class A2 | | | $8.56 | |
Net assets – Class C | | $ | 2,963,659 | |
Shares outstanding – Class C1 | | | 542,047 | |
Net asset value per share – Class C | | | $5.47 | |
Net assets – Class R6 | | $ | 2,069,858 | |
Shares outstanding – Class R61 | | | 195,791 | |
Net asset value per share – Class R6 | | | $10.57 | |
Net assets – Administrator Class | | $ | 4,706,093 | |
Shares outstanding – Administrator Class1 | | | 484,099 | |
Net asset value per share – Administrator Class | | | $9.72 | |
Net assets – Institutional Class | | $ | 12,341,941 | |
Shares outstanding – Institutional Class1 | | | 1,176,710 | |
Net asset value per share – Institutional Class | | | $10.49 | |
| 1 | The Fund has an unlimited number of authorized shares. |
| 2 | Maximum offering price is computed as 100/94.25 of net asset value. On investments of $50,000 or more, the offering price is reduced. |
The accompanying notes are an integral part of these financial statements.
| | | | |
| 14 | | Wells Fargo Capital Growth Fund | | Statement of operations—six months ended January 31, 2019 (unaudited) |
| | | | |
| | | | |
| |
Investment income | | | | |
Dividends (net of foreign withholding taxes of $2,615) | | $ | 408,256 | |
Income from affiliated securities | | | 13,609 | |
| | | | |
Total investment income | | | 421,865 | |
| | | | |
| |
Expenses | | | | |
Management fee | | | 390,574 | |
Administration fees | | | | |
Class A | | | 83,810 | |
Class C | | | 3,131 | |
Class R6 | | | 1,048 | |
Administrator Class | | | 3,567 | |
Institutional Class | | | 10,604 | |
Shareholder servicing fees | | | | |
Class A | | | 99,774 | |
Class C | | | 3,728 | |
Administrator Class | | | 6,860 | |
Distribution fee | | | | |
Class C | | | 11,183 | |
Custody and accounting fees | | | 12,098 | |
Professional fees | | | 25,493 | |
Registration fees | | | 55,200 | |
Shareholder report expenses | | | 16,083 | |
Trustees’ fees and expenses | | | 12,611 | |
Other fees and expenses | | | 6,450 | |
| | | | |
Total expenses | | | 742,214 | |
Less: Fee waivers and/or expense reimbursements | | | (188,324 | ) |
| | | | |
Net expenses | | | 553,890 | |
| | | | |
Net investment loss | | | (132,025 | ) |
| | | | |
| |
REALIZED AND UNREALIZED GAINS (LOSSES) ON INVESTMENTS | | | | |
| |
Net realized gains (losses) on: | | | | |
Unaffiliated securities | | | 10,551,534 | |
Affiliated securities | | | (1,160 | ) |
| | | | |
Net realized gains on investments | | | 10,550,374 | |
Net change in unrealized gains (losses) on investments | | | (14,448,191 | ) |
| | | | |
Net realized and unrealized gains (losses) on investments | | | (3,897,817 | ) |
| | | | |
Net decrease in net assets resulting from operations | | $ | (4,029,842 | ) |
| | | | |
The accompanying notes are an integral part of these financial statements.
| | | | | | |
| Statement of changes in net assets | | Wells Fargo Capital Growth Fund | | | 15 | |
| | | | | | | | | | | | | | | | |
| | | Six months ended
January 31, 2019 (unaudited) | | | Year ended
July 31, 20181 | |
| | | | |
Operations | | | | | | | | | | | | | | | | |
Net investment loss | | | | | | $ | (132,025 | ) | | | | | | $ | (105,891 | ) |
Net realized gains on investments | | | | | | | 10,550,374 | | | | | | | | 84,278,242 | |
Net change in unrealized gains (losses) on investments | | | | | | | (14,448,191 | ) | | | | | | | (34,428,399 | ) |
| | | | |
Net increase (decrease) in net assets resulting from operations | | | | | | | (4,029,842 | ) | | | | | | | 49,743,952 | |
| | | | |
| | | | |
Distributions to shareholders from net investment income and net realized gains | | | | | | | | | | | | | | | | |
Class A | | | | | | | (45,016,507 | ) | | | | | | | (10,659,612 | ) |
Class C | | | | | | | (1,770,673 | ) | | | | | | | (475,651 | ) |
Class R4 | | | | | | | N/A | | | | | | | | (1,544 | )2 |
Class R6 | | | | | | | (4,194,378 | ) | | | | | | | (16,512,790 | ) |
Administrator Class | | | | | | | (2,839,109 | ) | | | | | | | (2,322,996 | ) |
Institutional Class | | | | | | | (7,429,013 | ) | | | | | | | (2,869,464 | ) |
| | | | |
Total distributions to shareholders | | | | | | | (61,249,680 | ) | | | | | | | (32,842,057 | ) |
| | | | |
| | | | |
Capital share transactions | | | Shares | | | | | | | | Shares | | | | | |
Proceeds from shares sold | | | | | | | | | | | | | | | | |
Class A | | | 261,725 | | | | 2,772,894 | | | | 324,772 | | | | 5,663,591 | |
Class C | | | 136,150 | | | | 797,139 | | | | 51,472 | | | | 773,137 | |
Class R6 | | | 21,407 | | | | 286,048 | | | | 429,937 | | | | 8,300,687 | |
Administrator Class | | | 18,359 | | | | 223,173 | | | | 98,501 | | | | 1,847,357 | |
Institutional Class | | | 65,637 | | | | 793,641 | | | | 180,220 | | | | 3,556,665 | |
| | | | |
| | | | |
| | | | | | | 4,872,895 | | | | | | | | 20,141,437 | |
| | | | |
Reinvestment of distributions | | | | | | | | | | | | | | | | |
Class A | | | 5,508,288 | | | | 44,139,774 | | | | 642,270 | | | | 10,449,869 | |
Class C | | | 301,972 | | | | 1,666,667 | | | | 30,860 | | | | 437,693 | |
Class R4 | | | N/A | | | | N/A | | | | 0 | 2 | | | 0 | 2 |
Class R6 | | | 89,812 | | | | 934,429 | | | | 905,002 | | | | 16,500,487 | |
Administrator Class | | | 291,982 | | | | 2,801,545 | | | | 131,868 | | | | 2,308,838 | |
Institutional Class | | | 716,926 | | | | 7,403,250 | | | | 155,432 | | | | 2,828,945 | |
| | | | |
| | | | |
| | | | | | | 56,945,665 | | | | | | | | 32,525,832 | |
| | | | |
Payment for shares redeemed | | | | | | | | | | | | | | | | |
Class A | | | (981,678 | ) | | | (10,631,637 | ) | | | (560,818 | ) | | | (9,909,912 | ) |
Class C | | | (101,146 | ) | | | (1,016,596 | ) | | | (62,592 | ) | | | (954,216 | ) |
Class R4 | | | N/A | | | | N/A | | | | (974 | )2 | | | (18,521 | )2 |
Class R6 | | | (396,164 | ) | | | (4,594,611 | ) | | | (8,922,240 | ) | | | (178,495,590 | ) |
Administrator Class | | | (113,534 | ) | | | (1,258,403 | ) | | | (1,169,379 | ) | | | (22,013,800 | ) |
Institutional Class | | | (547,905 | ) | | | (7,899,700 | ) | | | (661,462 | ) | | | (12,665,267 | ) |
| | | | |
| | | | |
| | | | | | | (25,400,947 | ) | | | | | | | (224,057,306 | ) |
| | | | |
Net increase (decrease) in net assets resulting from capital share transactions | | | | | | | 36,417,613 | | | | | | | | (171,390,037 | ) |
| | | | |
Total decrease in net assets | | | | | | | (28,861,909 | ) | | | | | | | (154,488,142 | ) |
| | | | |
| | |
Net assets | | | | | | | | |
Beginning of period | | | | | | | 126,189,582 | | | | | | | | 280,677,724 | |
| | | | |
End of period | | | | | | $ | 97,327,673 | | | | | | | $ | 126,189,582 | |
| | | | |
| 1 | Effective for all filings after November 4, 2018, the SEC prospectively eliminated the requirement to parenthetically disclose undistributed net investment income at the end of the period and permitted the aggregation of distributions, with the exception of tax basis returns of capital. Undistributed net investment income at July 31, 2018 was $0. The disaggregated distributions information for the year ended July 31, 2018 is included in Note 7,Distributions to Shareholders, in the notes to the financial statements. |
| 2 | For the period from August 1, 2017 to November 13, 2017. Effective at the close of business on November 13, 2017, Class R4 shares were liquidated and the class was subsequently closed. Class R4 shares are no longer offered by the Fund. |
The accompanying notes are an integral part of these financial statements.
| | | | |
| 16 | | Wells Fargo Capital Growth Fund | | Financial highlights |
(For a share outstanding throughout each period)
| | | | | | | | | | | | | | | | | | | | | | | | |
| | | Six months ended
January 31, 2019 (unaudited) | | | Year ended July 31 | |
| CLASS A | | 2018 | | | 2017 | | | 2016 | | | 2015 | | | 2014 | |
Net asset value, beginning of period | | | $19.03 | | | | $17.56 | | | | $15.12 | | | | $17.38 | | | | $21.31 | | | | $19.87 | |
Net investment loss | | | (0.02 | )1 | | | (0.06 | )1 | | | (0.03 | )1 | | | (0.03 | )1 | | | (0.07 | )1 | | | (0.10 | )1 |
Net realized and unrealized gains (losses) on investments | | | (0.85 | ) | | | 4.06 | | | | 2.90 | | | | 0.04 | | | | 2.09 | | | | 3.79 | |
| | | | | | | | | | | | | | | | | | | | | | | | |
Total from investment operations | | | (0.87 | ) | | | 4.00 | | | | 2.87 | | | | 0.01 | | | | 2.02 | | | | 3.69 | |
Distributions to shareholders from | | | | | | | | | | | | | | | | | | | | | | | | |
Net investment income | | | 0.00 | | | | 0.00 | | | | (0.02 | ) | | | 0.00 | | | | 0.00 | | | | (0.02 | ) |
Net realized gains | | | (10.09 | ) | | | (2.53 | ) | | | (0.41 | ) | | | (2.27 | ) | | | (5.95 | ) | | | (2.23 | ) |
| | | | | | | | | | | | | | | | | | | | | | | | |
Total distributions to shareholders | | | (10.09 | ) | | | (2.53 | ) | | | (0.43 | ) | | | (2.27 | ) | | | (5.95 | ) | | | (2.25 | ) |
Net asset value, end of period | | | $8.07 | | | | $19.03 | | | | $17.56 | | | | $15.12 | | | | $17.38 | | | | $21.31 | |
Total return2 | | | (2.32 | )% | | | 25.83 | % | | | 19.52 | % | | | 0.75 | % | | | 11.00 | % | | | 19.09 | % |
Ratios to average net assets (annualized) | | | | | | | | | | | | | | | | | | | | | | | | |
Gross expenses | | | 1.39 | % | | | 1.26 | % | | | 1.24 | % | | | 1.24 | % | | | 1.27 | % | | | 1.26 | % |
Net expenses | | | 1.06 | % | | | 1.06 | % | | | 1.06 | % | | | 1.06 | % | | | 1.11 | % | | | 1.11 | % |
Net investment loss | | | (0.30 | )% | | | (0.32 | )% | | | (0.21 | )% | | | (0.18 | )% | | | (0.39 | )% | | | (0.46 | )% |
Supplemental data | | | | | | | | | | | | | | | | | | | | | | | | |
Portfolio turnover rate | | | 12 | % | | | 40 | % | | | 59 | % | | | 85 | % | | | 114 | % | | | 94 | % |
Net assets, end of period (000s omitted) | | | $75,246 | | | | $86,285 | | | | $72,511 | | | | $77,648 | | | | $17,126 | | | | $18,561 | |
| 1 | Calculated based upon average shares outstanding |
| 2 | Total return calculations do not include any sales charges. Returns for periods of less than one year are not annualized. |
The accompanying notes are an integral part of these financial statements.
| | | | | | |
| Financial highlights | | Wells Fargo Capital Growth Fund | | | 17 | |
(For a share outstanding throughout each period)
| | | | | | | | | | | | | | | | | | | | | | | | |
| | | Six months ended
January 31, 2019 (unaudited) | | | Year ended July 31 | |
| CLASS C | | 2018 | | | 2017 | | | 2016 | | | 2015 | | | 2014 | |
Net asset value, beginning of period | | | $16.41 | | | | $15.58 | | | | $13.54 | | | | $15.92 | | | | $20.12 | | | | $18.98 | |
Net investment loss | | | (0.05 | )1 | | | (0.16 | )1 | | | (0.13 | )1 | | | (0.13 | )1 | | | (0.20 | )1 | | | (0.24 | )1 |
Net realized and unrealized gains (losses) on investments | | | (0.80 | ) | | | 3.52 | | | | 2.58 | | | | 0.02 | | | | 1.95 | | | | 3.61 | |
| | | | | | | | | | | | | | | | | | | | | | | | |
Total from investment operations | | | (0.85 | ) | | | 3.36 | | | | 2.45 | | | | (0.11 | ) | | | 1.75 | | | | 3.37 | |
Distributions to shareholders from | | | | | | | | | | | | | | | | | | | | | | | | |
Net realized gains | | | (10.09 | ) | | | (2.53 | ) | | | (0.41 | ) | | | (2.27 | ) | | | (5.95 | ) | | | (2.23 | ) |
Net asset value, end of period | | | $5.47 | | | | $16.41 | | | | $15.58 | | | | $13.54 | | | | $15.92 | | | | $20.12 | |
Total return2 | | | (2.63 | )% | | | 24.89 | % | | | 18.65 | % | | | 0.00 | % | | | 10.15 | % | | | 18.21 | % |
Ratios to average net assets (annualized) | | | | | | | | | | | | | | | | | | | | | | | | |
Gross expenses | | | 2.14 | % | | | 2.01 | % | | | 1.99 | % | | | 1.99 | % | | | 2.02 | % | | | 2.01 | % |
Net expenses | | | 1.81 | % | | | 1.81 | % | | | 1.81 | % | | | 1.81 | % | | | 1.86 | % | | | 1.86 | % |
Net investment loss | | | (1.07 | )% | | | (1.07 | )% | | | (0.95 | )% | | | (0.98 | )% | | | (1.14 | )% | | | (1.20 | )% |
Supplemental data | | | | | | | | | | | | | | | | | | | | | | | | |
Portfolio turnover rate | | | 12 | % | | | 40 | % | | | 59 | % | | | 85 | % | | | 114 | % | | | 94 | % |
Net assets, end of period (000s omitted) | | | $2,964 | | | | $3,365 | | | | $2,888 | | | | $3,415 | | | | $4,212 | | | | $4,628 | |
| 1 | Calculated based upon average shares outstanding |
| 2 | Total return calculations do not include any sales charges. Returns for periods of less than one year are not annualized. |
The accompanying notes are an integral part of these financial statements.
| | | | |
| 18 | | Wells Fargo Capital Growth Fund | | Financial highlights |
(For a share outstanding throughout each period)
| | | | | | | | | | | | | | | | | | | | | | | | |
| | | Six months ended
January 31, 2019 (unaudited) | | | Year ended July 31 | |
| CLASS R6 | | 2018 | | | 2017 | | | 2016 | | | 2015 | | | 2014 | |
Net asset value, beginning of period | | | $21.55 | | | | $19.52 | | | | $16.70 | | | | $18.87 | | | | $22.56 | | | | $20.85 | |
Net investment income | | | 0.02 | 1 | | | 0.04 | 1 | | | 0.04 | | | | 0.04 | 1 | | | 0.02 | | | | 0.00 | 1,2 |
Net realized and unrealized gains (losses) on investments | | | (0.91 | ) | | | 4.52 | | | | 3.24 | | | | 0.06 | | | | 2.24 | | | | 4.00 | |
| | | | | | | | | | | | | | | | | | | | | | | | |
Total from investment operations | | | (0.89 | ) | | | 4.56 | | | | 3.28 | | | | 0.10 | | | | 2.26 | | | | 4.00 | |
Distributions to shareholders from | | | | | | | | | | | | | | | | | | | | | | | | |
Net investment income | | | 0.00 | | | | 0.00 | | | | (0.05 | ) | | | 0.00 | | | | 0.00 | | | | (0.06 | ) |
Net realized gains | | | (10.09 | ) | | | (2.53 | ) | | | (0.41 | ) | | | (2.27 | ) | | | (5.95 | ) | | | (2.23 | ) |
| | | | | | | | | | | | | | | | | | | | | | | | |
Total distributions to shareholders | | | (10.09 | ) | | | (2.53 | ) | | | (0.46 | ) | | | (2.27 | ) | | | (5.95 | ) | | | (2.29 | ) |
Net asset value, end of period | | | $10.57 | | | | $21.55 | | | | $19.52 | | | | $16.70 | | | | $18.87 | | | | $22.56 | |
Total return3 | | | (2.11 | )% | | | 26.13 | % | | | 20.18 | % | | | 1.20 | % | | | 11.54 | % | | | 19.71 | % |
Ratios to average net assets (annualized) | | | | | | | | | | | | | | | | | | | | | | | | |
Gross expenses | | | 0.95 | % | | | 0.82 | % | | | 0.81 | % | | | 0.81 | % | | | 0.79 | % | | | 0.78 | % |
Net expenses | | | 0.60 | % | | | 0.60 | % | | | 0.60 | % | | | 0.60 | % | | | 0.60 | % | | | 0.60 | % |
Net investment income | | | 0.18 | % | | | 0.19 | % | | | 0.23 | % | | | 0.23 | % | | | 0.11 | % | | | 0.01 | % |
Supplemental data | | | | | | | | | | | | | | | | | | | | | | | | |
Portfolio turnover rate | | | 12 | % | | | 40 | % | | | 59 | % | | | 85 | % | | | 114 | % | | | 94 | % |
Net assets, end of period (000s omitted) | | | $2,070 | | | | $10,360 | | | | $157,462 | | | | $140,581 | | | | $153,009 | | | | $142,754 | |
| 1 | Calculated based upon average shares outstanding |
| 2 | Amount is less than $0.005. |
| 3 | Returns for periods of less than one year are not annualized. |
The accompanying notes are an integral part of these financial statements.
| | | | | | |
| Financial highlights | | Wells Fargo Capital Growth Fund | | | 19 | |
(For a share outstanding throughout each period)
| | | | | | | | | | | | | | | | | | | | | | | | |
| | | Six months ended
January 31, 2019 (unaudited) | | | Year ended July 31 | |
| ADMINISTRATOR CLASS | | 2018 | | | 2017 | | | 2016 | | | 2015 | | | 2014 | |
Net asset value, beginning of period | | | $20.71 | | | | $18.87 | | | | $16.20 | | | | $18.43 | | | | $22.22 | | | | $20.61 | |
Net investment loss | | | (0.01 | )1 | | | (0.03 | )1 | | | (0.01 | )1 | | | (0.01 | )1 | | | (0.03 | )1 | | | (0.05 | )1 |
Net realized and unrealized gains (losses) on investments | | | (0.89 | ) | | | 4.40 | | | | 3.12 | | | | 0.05 | | | | 2.19 | | | | 3.93 | |
| | | | | | | | | | | | | | | | | | | | | | | | |
Total from investment operations | | | (0.90 | ) | | | 4.37 | | | | 3.11 | | | | 0.04 | | | | 2.16 | | | | 3.88 | |
Distributions to shareholders from | | | | | | | | | | | | | | | | | | | | | | | | |
Net investment income | | | 0.00 | | | | 0.00 | | | | (0.03 | ) | | | 0.00 | | | | 0.00 | | | | (0.04 | ) |
Net realized gains | | | (10.09 | ) | | | (2.53 | ) | | | (0.41 | ) | | | (2.27 | ) | | | (5.95 | ) | | | (2.23 | ) |
| | | | | | | | | | | | | | | | | | | | | | | | |
Total distributions to shareholders | | | (10.09 | ) | | | (2.53 | ) | | | (0.44 | ) | | | (2.27 | ) | | | (5.95 | ) | | | (2.27 | ) |
Net asset value, end of period | | | $9.72 | | | | $20.71 | | | | $18.87 | | | | $16.20 | | | | $18.43 | | | | $22.22 | |
Total return2 | | | (2.27 | )% | | | 26.01 | % | | | 19.68 | % | | | 0.88 | % | | | 11.22 | % | | | 19.35 | % |
Ratios to average net assets (annualized) | | | | | | | | | | | | | | | | | | | | | | | | |
Gross expenses | | | 1.31 | % | | | 1.17 | % | | | 1.16 | % | | | 1.16 | % | | | 1.11 | % | | | 1.09 | % |
Net expenses | | | 0.94 | % | | | 0.94 | % | | | 0.94 | % | | | 0.93 | % | | | 0.90 | % | | | 0.90 | % |
Net investment loss | | | (0.18 | )% | | | (0.18 | )% | | | (0.04 | )% | | | (0.09 | )% | | | (0.16 | )% | | | (0.24 | )% |
Supplemental data | | | | | | | | | | | | | | | | | | | | | | | | |
Portfolio turnover rate | | | 12 | % | | | 40 | % | | | 59 | % | | | 85 | % | | | 114 | % | | | 94 | % |
Net assets, end of period (000s omitted) | | | $4,706 | | | | $5,950 | | | | $23,144 | | | | $31,064 | | | | $34,886 | | | | $67,830 | |
| 1 | Calculated based upon average shares outstanding |
| 2 | Returns for periods of less than one year are not annualized. |
The accompanying notes are an integral part of these financial statements.
| | | | |
| 20 | | Wells Fargo Capital Growth Fund | | Financial highlights |
(For a share outstanding throughout each period)
| | | | | | | | | | | | | | | | | | | | | | | | |
| | | Six months ended
January 31, 2019 (unaudited) | | | Year ended July 31 | |
| INSTITUTIONAL CLASS | | 2018 | | | 2017 | | | 2016 | | | 2015 | | | 2014 | |
Net asset value, beginning of period | | | $21.47 | | | | $19.44 | | | | $16.65 | | | | $18.84 | | | | $22.54 | | | | $20.84 | |
Net investment income | | | 0.00 | 1,2 | | | 0.01 | 1 | | | 0.02 | 1 | | | 0.03 | 1 | | | 0.02 | 1 | | | 0.01 | 1 |
Net realized and unrealized gains (losses) on investments | | | (0.89 | ) | | | 4.55 | | | | 3.22 | | | | 0.05 | | | | 2.23 | | | | 4.00 | |
| | | | | | | | | | | | | | | | | | | | | | | | |
Total from investment operations | | | (0.89 | ) | | | 4.56 | | | | 3.24 | | | | 0.08 | | | | 2.25 | | | | 4.01 | |
Distributions to shareholders from | | | | | | | | | | | | | | | | | | | | | | | | |
Net investment income | | | 0.00 | | | | 0.00 | | | | (0.04 | ) | | | 0.00 | | | | 0.00 | | | | (0.08 | ) |
Net realized gains | | | (10.09 | ) | | | (2.53 | ) | | | (0.41 | ) | | | (2.27 | ) | | | (5.95 | ) | | | (2.23 | ) |
| | | | | | | | | | | | | | | | | | | | | | | | |
Total distributions to shareholders | | | (10.09 | ) | | | (2.53 | ) | | | (0.45 | ) | | | (2.27 | ) | | | (5.95 | ) | | | (2.31 | ) |
Net asset value, end of period | | | $10.49 | | | | $21.47 | | | | $19.44 | | | | $16.65 | | | | $18.84 | | | | $22.54 | |
Total return3 | | | (2.10 | )% | | | 26.25 | % | | | 20.00 | % | | | 1.09 | % | | | 11.50 | % | | | 19.76 | % |
Ratios to average net assets (annualized) | | | | | | | | | | | | | | | | | | | | | | | | |
Gross expenses | | | 1.05 | % | | | 0.93 | % | | | 0.91 | % | | | 0.91 | % | | | 0.84 | % | | | 0.82 | % |
Net expenses | | | 0.70 | % | | | 0.70 | % | | | 0.70 | % | | | 0.68 | % | | | 0.65 | % | | | 0.65 | % |
Net investment income | | | 0.05 | % | | | 0.05 | % | | | 0.13 | % | | | 0.16 | % | | | 0.09 | % | | | 0.05 | % |
Supplemental data | | | | | | | | | | | | | | | | | | | | | | | | |
Portfolio turnover rate | | | 12 | % | | | 40 | % | | | 59 | % | | | 85 | % | | | 114 | % | | | 94 | % |
Net assets, end of period (000s omitted) | | | $12,342 | | | | $20,229 | | | | $24,653 | | | | $23,670 | | | | $22,578 | | | | $49,816 | |
| 1 | Calculated based upon average shares outstanding |
| 2 | Amount is less than $0.005. |
| 3 | Returns for periods of less than one year are not annualized. |
The accompanying notes are an integral part of these financial statements.
| | | | | | |
| Notes to financial statements (unaudited) | | Wells Fargo Capital Growth Fund | | | 21 | |
1. ORGANIZATION
Wells Fargo Funds Trust (the “Trust”), a Delaware statutory trust organized on March 10, 1999, is an open-end management investment company registered under the Investment Company Act of 1940, as amended (the “1940 Act”). As an investment company, the Trust follows the accounting and reporting guidance in Financial Accounting Standards Board (“FASB”) Accounting Standards Codification Topic 946, Financial Services – Investment Companies. These financial statements report on the Wells Fargo Capital Growth Fund (the “Fund”) which is a diversified series of the Trust.
Effective at the close of business on November 13, 2017, Class R4 shares were liquidated and the class was subsequently closed. Class R4 shares are no longer offered by the Fund. Information for Class R4 shares reflected in the financial statements represents activity through November 13, 2017.
2. SIGNIFICANT ACCOUNTING POLICIES
The following significant accounting policies, which are consistently followed in the preparation of the financial statements of the Fund, are in conformity with U.S. generally accepted accounting principles which require management to make estimates and assumptions that affect the reported amounts of assets and liabilities, disclosure of contingent assets and liabilities at the date of the financial statements, and the reported amounts of revenues and expenses during the reporting period. Actual results could differ from those estimates.
Securities valuation
All investments are valued each business day as of the close of regular trading on the New York Stock Exchange (generally 4 p.m. Eastern Time), although the Fund may deviate from this calculation time under unusual or unexpected circumstances.
Equity securities that are listed on a foreign or domestic exchange or market are valued at the official closing price or, if none, the last sales price. If no sale occurs on the principal exchange or market that day, a fair value price will be determined in accordance with the Fund’s Valuation Procedures.
Investments in registered open-end investment companies are valued at net asset value. Interests in non-registered investment companies that are redeemable at net asset value are fair valued normally at net asset value.
Investments which are not valued using any of the methods discussed above are valued at their fair value, as determined in good faith by the Board of Trustees of the Fund. The Board of Trustees has established a Valuation Committee comprised of the Trustees and has delegated to it the authority to take any actions regarding the valuation of portfolio securities that the Valuation Committee deems necessary or appropriate, including determining the fair value of portfolio securities, unless the determination has been delegated to the Wells Fargo Asset Management Pricing Committee at Wells Fargo Funds Management, LLC (“Funds Management”). The Board of Trustees retains the authority to make or ratify any valuation decisions or approve any changes to the Valuation Procedures as it deems appropriate. On a quarterly basis, the Board of Trustees receives reports on any valuation actions taken by the Valuation Committee or the Wells Fargo Asset Management Pricing Committee which may include items for ratification.
Foreign currency translation
The accounting records of the Fund are maintained in U.S. dollars. The values of other assets and liabilities denominated in foreign currencies are translated into U.S. dollars at rates provided by an independent foreign currency pricing source at a time each business day specified by the Wells Fargo Asset Management Pricing Committee. Purchases and sales of securities, and income and expenses are converted at the rate of exchange on the respective dates of such transactions. Net realized foreign exchange gains or losses arise from sales of foreign currencies, currency gains or losses realized between the trade and settlement dates on securities transactions, and the difference between the amounts of dividends, interest and foreign withholding taxes recorded and the U.S. dollar equivalent of the amounts actually paid or received. Net unrealized foreign exchange gains and losses arise from changes in the fair value of assets and liabilities other than investments in securities resulting from changes in exchange rates. The changes in net assets arising from changes in exchange rates of securities and the changes in net assets resulting from changes in market prices of securities are not separately presented. Such changes are included in net realized and unrealized gains or losses from investments.
Securities lending
The Fund may lend its securities from time to time in order to earn additional income in the form of fees or interest on securities received as collateral or the investment of any cash received as collateral. The Fund continues to receive interest or dividends on the securities loaned. The Fund receives collateral in the form of cash or securities with a value at least equal to the value of the securities on loan. The value of the loaned securities is determined at the close of each
| | | | |
| 22 | | Wells Fargo Capital Growth Fund | | Notes to financial statements (unaudited) |
business day and any additional required collateral is delivered to the Fund on the next business day. In a securities lending transaction, the net asset value of the Fund will be affected by an increase or decrease in the value of the securities loaned and by an increase or decrease in the value of the instrument in which collateral is invested. The amount of securities lending activity undertaken by the Fund fluctuates from time to time. In the event of default or bankruptcy by the borrower, the Fund may be prevented from recovering the loaned securities or gaining access to the collateral or may experience delays or costs in doing so. In addition, the investment of any cash collateral received may lose all or part of its value. The Fund has the right under the lending agreement to recover the securities from the borrower on demand.
The Fund lends its securities through an unaffiliated securities lending agent. Cash collateral received in connection with its securities lending transactions is invested in Securities Lending Cash Investments, LLC (the “Securities Lending Fund”). The Securities Lending Fund is exempt from registration under Section 3(c)(7) of the 1940 Act and is managed by Funds Management and is subadvised by Wells Capital Management Incorporated (“WellsCap”), an affiliate of Funds Management and an indirect wholly owned subsidiary of Wells Fargo & Company (“Wells Fargo”). Funds Management receives an advisory fee starting at 0.05% and declining to 0.01% as the average daily net assets of the Securities Lending Fund increase. All of the fees received by Funds Management are paid to WellsCap for its services as subadviser. The Securities Lending Fund seeks to provide a positive return compared to the daily Fed Funds Open Rate by investing in high-quality, U.S. dollar-denominated short-term money market instruments. Securities Lending Fund investments are valued at the evaluated bid price provided by an independent pricing service. Income earned from investment in the Securities Lending Fund (net of fees and rebates), if any, is included in income from affiliated securities on the Statement of Operations.
Security transactions and income recognition
Securities transactions are recorded on a trade date basis. Realized gains or losses are recorded on the basis of identified cost.
Dividend income is recognized on the ex-dividend date. Dividend income is recorded net of foreign taxes withheld where recovery of such taxes is not assured.
Distributions to shareholders
Distributions to shareholders from net investment income and any net realized gains are recorded on the ex-dividend date and paid at least annually. Such distributions are determined in accordance with income tax regulations and may differ from U.S. generally accepted accounting principles. Dividend sources are estimated at the time of declaration. The tax character of distributions is determined as of the Fund’s fiscal year end. Therefore, a portion of the Fund’s distributions made prior to the Fund’s fiscal year end may be categorized as a tax return of capital at year end.
Federal and other taxes
The Fund intends to continue to qualify as a regulated investment company by distributing substantially all of its investment company taxable income and any net realized capital gains (after reduction for capital loss carryforwards) sufficient to relieve it from all, or substantially all, federal income taxes. Accordingly, no provision for federal income taxes was required.
The Fund’s income and federal excise tax returns and all financial records supporting those returns for the prior three fiscal years are subject to examination by the federal and Delaware revenue authorities. Management has analyzed the Fund’s tax positions taken on federal, state, and foreign tax returns for all open tax years and does not believe that there are any uncertain tax positions that require recognition of a tax liability.
As of January 31, 2019, the aggregate cost of all investments for federal income tax purposes was $60,019,299 and the unrealized gains (losses) consisted of:
| | | | |
| |
Gross unrealized gains | | $ | 39,105,883 | |
| |
Gross unrealized losses | | | (1,060,309 | ) |
| |
Net unrealized gains | | $ | 38,045,574 | |
Class allocations
The separate classes of shares offered by the Fund differ principally in applicable sales charges, distribution, shareholder servicing, and administration fees. Class specific expenses are charged directly to that share class. Investment income, common expenses, and realized and unrealized gains (losses) on investments are allocated daily to each class of shares based on the relative proportion of net assets of each class.
| | | | | | |
| Notes to financial statements (unaudited) | | Wells Fargo Capital Growth Fund | | | 23 | |
3. FAIR VALUATION MEASUREMENTS
Fair value measurements of investments are determined within a framework that has established a fair value hierarchy based upon the various data inputs utilized in determining the value of the Fund’s investments. The three-level hierarchy gives the highest priority to unadjusted quoted prices in active markets for identical assets or liabilities (Level 1) and the lowest priority to unobservable inputs (Level 3). The Fund’s investments are classified within the fair value hierarchy based on the lowest level of input that is significant to the fair value measurement. The inputs are summarized into three broad levels as follows:
| ∎ | | Level 1 – quoted prices in active markets for identical securities |
| ∎ | | Level 2 – other significant observable inputs (including quoted prices for similar securities, interest rates, prepayment speeds, credit risk, etc.) |
| ∎ | | Level 3 – significant unobservable inputs (including the Fund’s own assumptions in determining the fair value of investments) |
The inputs or methodologies used for valuing investments in securities are not necessarily an indication of the risk associated with investing in those securities.
The following is a summary of the inputs used in valuing the Fund’s assets and liabilities as of January 31, 2019:
| | | | | | | | | | | | | | | | |
| | | | |
| | | Quoted prices
(Level 1) | | | Other significant
observable inputs
(Level 2) | | | Significant
unobservable inputs (Level 3) | | | Total | |
| | | | |
Assets | | | | | | | | | | | | | | | | |
Investments in: | | | | | | | | | | | | | | | | |
| | | | |
Common stocks | | | | | | | | | | | | | | | | |
| | | | |
Communication services | | $ | 11,085,548 | | | $ | 0 | | | $ | 0 | | | $ | 11,085,548 | |
| | | | |
Consumer discretionary | | | 15,642,371 | | | | 0 | | | | 0 | | | | 15,642,371 | |
| | | | |
Energy | | | 747,180 | | | | 0 | | | | 0 | | | | 747,180 | |
| | | | |
Financials | | | 5,141,666 | | | | 0 | | | | 0 | | | | 5,141,666 | |
| | | | |
Health care | | | 15,777,261 | | | | 0 | | | | 0 | | | | 15,777,261 | |
| | | | |
Industrials | | | 10,491,301 | | | | 0 | | | | 0 | | | | 10,491,301 | |
| | | | |
Information technology | | | 30,367,077 | | | | 0 | | | | 0 | | | | 30,367,077 | |
| | | | |
Materials | | | 5,622,167 | | | | 0 | | | | 0 | | | | 5,622,167 | |
| | | | |
Real estate | | | 912,650 | | | | 0 | | | | 0 | | | | 912,650 | |
| | | | |
Short-term investments | | | | | | | | | | | | | | | | |
| | | | |
Investment companies | | | 2,277,652 | | | | 0 | | | | 0 | | | | 2,277,652 | |
| | | | |
Total assets | | $ | 98,064,873 | | | $ | 0 | | | $ | 0 | | | $ | 98,064,873 | |
Additional sector, industry or geographic detail is included in the Portfolio of Investments.
At January 31, 2019, the Fund did not have any transfers into/out of Level 3.
4. TRANSACTIONS WITH AFFILIATES
Management fee
Funds Management, an indirect wholly owned subsidiary of Wells Fargo, is the manager of the Fund and provides advisory and fund-level administrative services under an investment management agreement. Under the investment management agreement, Funds Management is responsible for, among other services, implementing the investment objectives and strategies of the Fund, supervising the subadviser and providing fund-level administrative services in connection with the Fund’s operations. As compensation for its services under the investment management agreement, Funds Management is entitled to receive an annual management fee starting at 0.70% and declining to 0.505% as the average daily net assets of the Fund increase. For the six months ended January 31, 2019, the management fee was equivalent to an annual rate of 0.70% of the Fund’s average daily net assets.
Funds Management has retained the services of a subadviser to provide daily portfolio management to the Fund. The fee for subadvisory services is borne by Funds Management. WellsCap is the subadviser to the Fund and is entitled to receive a fee from Funds Management at an annual rate starting at 0.30% and declining to 0.20% as the average daily net assets of the Fund increase.
| | | | |
| 24 | | Wells Fargo Capital Growth Fund | | Notes to financial statements (unaudited) |
Administration fees
Under a class-level administration agreement, Funds Management provides class-level administrative services to the Fund, which includes paying fees and expenses for services provided by the transfer agent, sub-transfer agents, omnibus account servicers and record-keepers. As compensation for its services under the class-level administration agreement, Funds Management receives an annual fee which is calculated based on the average daily net assets of each class as follows:
| | | | |
| | | Class-level
administration fee | |
| |
Class A, Class C | | | 0.21 | % |
| |
Class R6 | | | 0.03 | |
| |
Administrator Class, Institutional Class | | | 0.13 | |
Funds Management has contractually waived and/or reimbursed management and administration fees to the extent necessary to maintain certain net operating expense ratios for the Fund. When each class of the Fund has exceeded its expense cap, Funds Management has waived fees and/or reimbursed expenses from fund level expenses on a proportionate basis and then from class specific expenses; otherwise, waivers and/or reimbursements are applied against class specific expenses before fund level expenses. Funds Management has committed through November 30 2019 to waive fees and/or reimburse expenses to the extent necessary to cap the Fund’s expenses at 1.11% for Class A shares, 1.86% for Class C shares, 0.60% for Class R6 shares, 0.94% for Administrator Class shares, and 0.70% for Institutional Class shares. Prior to or after the commitment expiration date, the cap may be increased or the commitment to maintain the cap may be terminated only with the approval of the Board of Trustees.
Distribution fee
The Trust has adopted a distribution plan for Class C shares of the Fund pursuant to Rule 12b-1 under the 1940 Act. A distribution fee is charged to Class C shares and paid to Wells Fargo Funds Distributor, LLC (“Funds Distributor”), the principal underwriter, at an annual rate of 0.75% of the average daily net assets of Class C shares.
In addition, Funds Distributor is entitled to receive the front-end sales charge from the purchase of Class A shares and a contingent deferred sales charge on the redemption of certain Class A shares. Funds Distributor is also entitled to receive the contingent deferred sales charges from redemptions of Class C shares. For the six months ended January 31, 2019, Funds Distributor received $1,797 from the sale of Class A shares. No contingent deferred sales charges were incurred by Class A and Class C shares for the six months ended January 31, 2019.
Shareholder servicing fees
The Trust has entered into contracts with one or more shareholder servicing agents, whereby Class A, Class C, and Administrator Class of the Fund are charged a fee at an annual rate of 0.25% of the average daily net assets of each respective class.
A portion of these total shareholder servicing fees were paid to affiliates of Wells Fargo.
Interfund transactions
The Fund may purchase or sell portfolio investment securities to certain other Wells Fargo affiliates pursuant toRule 17a-7 under the 1940 Act and under procedures adopted by the Board of Trustees. The procedures have been designed to ensure that these interfund transactions, which do not incur broker commissions, are effected at current market prices.
5. INVESTMENT PORTFOLIO TRANSACTIONS
Purchases and sales of investments, excluding U.S. government obligations (if any) and short-term securities, for the six months ended January 31, 2019 were $13,618,307 and $39,847,687, respectively.
6. BANK BORROWINGS
The Trust (excluding the money market funds), Wells Fargo Master Trust and Wells Fargo Variable Trust are parties to a $280,000,000 revolving credit agreement whereby the Fund is permitted to use bank borrowings for temporary or emergency purposes, such as to fund shareholder redemption requests. Interest under the credit agreement is charged to the Fund based on a borrowing rate equal to the higher of the Federal Funds rate in effect on that day plus 1.25% or the overnight LIBOR rate in effect on that day plus 1.25%. In addition, an annual commitment fee equal to 0.25% of the unused balance is allocated to each participating fund.
For the six months ended January 31, 2019, there were no borrowings by the Fund under the agreement.
| | | | | | |
| Notes to financial statements (unaudited) | | Wells Fargo Capital Growth Fund | | | 25 | |
7. DISTRIBUTIONS TO SHAREHOLDERS
Effective for all filings after November 4, 2018, the Securities and Exchange Commission eliminated the requirement to separately state the components of distributions to shareholders under U.S. generally accepted accounting principles. The amounts of distributions to shareholders for the year ended July 31, 2018 were as follows:
| | | | |
| | | Net realized
gains | |
| |
Class A | | | $10,659,612 | |
| |
Class C | | | 475,651 | |
| |
Class R4 | | | 1,544 | * |
| |
Class R6 | | | 16,512,790 | |
| |
Administrator Class | | | 2,322,996 | |
| |
Institutional Class | | | 2,869,464 | |
| * | For the period from August 1, 2017 to November 13, 2017. |
8. CONCENTRATION RISK
Concentration risks result from exposure to a limited number of sectors. A fund that invests a substantial portion of its assets in any sector may be more affected by changes in that sector than would be a fund whose investments are not heavily weighted in any sector.
9. INDEMNIFICATION
Under the Trust’s organizational documents, the officers and Trustees have been granted certain indemnification rights against certain liabilities that may arise out of performance of their duties to the Trust. Additionally, in the normal course of business, the Trust may enter into contracts with service providers that contain a variety of indemnification clauses. The Trust’s maximum exposure under these arrangements is dependent on future claims that may be made against the Fund and, therefore, cannot be estimated.
10. NEW ACCOUNTING PRONOUNCEMENT
In August 2018, FASB issued Accounting Standards Update (“ASU”) No. 2018-13, Fair Value Measurement (Topic 820)Disclosure Framework—Changes to the Disclosure Requirements for Fair Value Measurement. ASU 2018-13 updates the disclosure requirements for fair value measurements by modifying or removing certain disclosures and adding certain new disclosures. The amendments are effective for fiscal years, and interim periods within those fiscal years, beginning after December 15, 2019. Early adoption is permitted. Management has adopted the removal and modification of disclosures early, as permitted, and will adopt the additional new disclosures at the effective date.
| | | | |
| 26 | | Wells Fargo Capital Growth Fund | | Other information (unaudited) |
PROXY VOTING INFORMATION
A description of the policies and procedures used to determine how to vote proxies relating to portfolio securities is available, upon request, by calling1-800-222-8222, visiting our website atwellsfargofunds.com, or visiting the SEC website at sec.gov. Information regarding how the Fund voted proxies relating to portfolio securities during the most recent 12-month period ended June 30 is available on the Fund’s website atwellsfargofunds.comor by visiting the SEC website at sec.gov.
PORTFOLIO HOLDINGS INFORMATION
The complete portfolio holdings for the Fund are publicly available monthly on the Fund’s website (wellsfargofunds.com), on a one-month delayed basis. In addition, top ten holdings information (excluding derivative positions) for the Fund is publicly available on the Fund’s website on a monthly, seven-day or more delayed basis. The Fund files its complete schedule of portfolio holdings with the SEC for the first and third quarters of each fiscal year on Form N-Q, which is available by visiting the SEC website at sec.gov. In addition, the Fund’s Form N-Q may be reviewed and copied at the SEC’s Public Reference Room in Washington, DC, and at regional offices in New York City, at 233 Broadway, and in Chicago, at 175 West Jackson Boulevard, Suite 900. Information about the Public Reference Room may be obtained by calling 1-800-SEC-0330.
| | | | | | |
| Other information (unaudited) | | Wells Fargo Capital Growth Fund | | | 27 | |
BOARD OF TRUSTEES AND OFFICERS
Each of the Trustees and Officers1 listed in the table below acts in identical capacities for each fund in the Wells Fargo family of funds, which consists of 152 mutual funds comprising the Wells Fargo Funds Trust, Wells Fargo Variable Trust, Wells Fargo Master Trust and four closed-end funds (collectively the “Fund Complex”). This table should be read in conjunction with the Prospectus and the Statement of Additional Information2. The mailing address of each Trustee and Officer is 525 Market Street, 12th Floor, San Francisco, CA 94105. Each Trustee and Officer serves an indefinite term, however, each Trustee serves such term until reaching the mandatory retirement age established by the Trustees.
Independent Trustees
| | | | | | |
Name and year of birth | | Position held and length of service* | | Principal occupations during past five years or longer | | Current other public company or
investment company
directorships |
| | | |
William R. Ebsworth (Born 1957) | | Trustee, since 2015 | | Retired. From 1984 to 2013, equities analyst, portfolio manager, research director and chief investment officer at Fidelity Management and Research Company in Boston, Tokyo, and Hong Kong, and retired in 2013 as Chief Investment Officer of Fidelity Strategic Advisers, Inc. where he led a team of investment professionals managing client assets. Prior thereto, Board member of Hong Kong Securities Clearing Co., Hong Kong Options Clearing Corp., the Thailand International Fund, Ltd., Fidelity Investments Life Insurance Company, and Empire Fidelity Investments Life Insurance Company. Audit Committee Chair and Investment Committee Chair of the Vincent Memorial Hospital Endowment (non-profit organization). Mr. Ebsworth is a CFA® charterholder. | | N/A |
| | | |
Jane A. Freeman (Born 1953) | | Trustee, since 2015; Chair Liaison, since 2018 | | Retired. From 2012 to 2014 and 1999 to 2008, Chief Financial Officer of Scientific Learning Corporation. From 2008 to 2012, Ms. Freeman provided consulting services related to strategic business projects. Prior to 1999, Portfolio Manager at Rockefeller & Co. and Scudder, Stevens & Clark. Board member of the Harding Loevner Funds from 1996 to 2014, serving as both Lead Independent Director and chair of the Audit Committee. Board member of the Russell Exchange Traded Funds Trust from 2011 to 2012 and the chair of the Audit Committee. Ms. Freeman is a Board Member of The Ruth Bancroft Garden (non-profit organization). She is also an inactive Chartered Financial Analyst. | | N/A |
| | | |
Isaiah Harris, Jr.3 (Born 1952) | | Trustee, since 2009; Audit Committee Chairman, since 2019 | | Retired. Chairman of the Board of CIGNA Corporation since 2009, and Director since 2005. From 2003 to 2011, Director of Deluxe Corporation. Prior thereto, President and CEO of BellSouth Advertising and Publishing Corp. from 2005 to 2007, President and CEO of BellSouth Enterprises from 2004 to 2005 and President of BellSouth Consumer Services from 2000 to 2003. Emeritus member of the Iowa State University Foundation Board of Governors. Emeritus Member of the Advisory Board of Iowa State University School of Business. Advisory Board Member, Palm Harbor Academy (private school). Advisory Board Member, Child Evangelism Fellowship (non-profit). Mr. Harris is a certified public accountant (inactive status). | | CIGNA Corporation |
| | | |
Judith M. Johnson3 (Born 1949) | | Trustee, since 2008; Audit Committee Chairman, from 2009 to 2018 | | Retired. Prior thereto, Chief Executive Officer and Chief Investment Officer of Minneapolis Employees Retirement Fund from 1996 to 2008. Ms. Johnson is an attorney, certified public accountant and a certified managerial accountant. | | N/A |
| | | |
David F. Larcker (Born 1950) | | Trustee, since 2009 | | James Irvin Miller Professor of Accounting at the Graduate School of Business, Stanford University, Director of the Corporate Governance Research Initiative and Senior Faculty of The Rock Center for Corporate Governance since 2006. From 2005 to 2008, Professor of Accounting at the Graduate School of Business, Stanford University. Prior thereto, Ernst & Young Professor of Accounting at The Wharton School, University of Pennsylvania from 1985 to 2005. | | N/A |
| | | | |
| 28 | | Wells Fargo Capital Growth Fund | | Other information (unaudited) |
| | | | | | |
Name and year of birth | | Position held and length of service* | | Principal occupations during past five years or longer | | Current other public company or
investment company
directorships |
| | | |
Olivia S. Mitchell (Born 1953) | | Trustee, since 2006; Nominating and Governance Committee Chairman, since 2018 | | International Foundation of Employee Benefit Plans Professor, Wharton School of the University of Pennsylvania since 1993. Director of Wharton’s Pension Research Council and Boettner Center on Pensions & Retirement Research, and Research Associate at the National Bureau of Economic Research. Previously, Cornell University Professor from 1978 to 1993. | | N/A |
| | | |
Timothy J. Penny (Born 1951) | | Trustee, since 1996; Chairman, since 2018; Vice Chairman, from 2017 to 2018 | | President and Chief Executive Officer of Southern Minnesota Initiative Foundation, a non-profit organization, since 2007. Member of the Board of Trustees of NorthStar Education Finance, Inc., a non-profit organization, since 2007. | | N/A |
| | | |
James G. Polisson (Born 1959) | | Trustee, since 2018; Advisory Board Member, from 2017 to 2018 | | Retired. Chief Marketing Officer, Source (ETF) UK Services, Ltd, from 2015 to 2017. From 2012 to 2015, Principal of The Polisson Group, LLC, a management consulting, corporate advisory and principal investing company. Chief Executive Officer and Managing Director at Russell Investments, Global Exchange Traded Funds from 2010 to 2012. Managing Director of Barclays Global Investors from 1998 to 2010 and Global Chief Marketing Officer for iShares and Barclays Global Investors from 2000 to 2010. Trustee of the San Francisco Mechanics’ Institute, a non-profit organization, from 2013 to 2015. Board member of the Russell Exchange Traded Fund Trust from 2011 to 2012. Director of Barclays Global Investors Holdings Deutschland GmbH from 2006 to 2009. Mr. Polisson is an attorney and has a retired status with the Massachusetts and District of Columbia Bar Associations. | | N/A |
| | | |
Pamela Wheelock (Born 1959) | | Trustee, since 2018; Advisory Board Member, from 2017 to 2018 | | Board member of the Destination Medical Center Economic Development Agency, Rochester, Minnesota since 2019. Chief Operating Officer, Twin Cities Habitat for Humanity from 2017 to 2019. Vice President of University Services, University of Minnesota from 2012 to 2016. Prior thereto, on the Board of Directors, Governance Committee and Finance Committee for the Minnesota Philanthropy Partners (Saint Paul Foundation) from 2012 to 2018, Interim Chief Executive Officer of Blue Cross Blue Shield of Minnesota from 2011 to 2012, Chairman of the Board from 2009 to 2012 and Board Director from 2003 to 2015. Vice President, Leadership and Community Engagement, Bush Foundation, Saint Paul, Minnesota (a private foundation) from 2009 to 2011. Executive Vice President and Chief Financial Officer, Minnesota Sports and Entertainment from 2004 to 2009 and Senior Vice President from 2002 to 2004. Executive Vice President of the Minnesota Wild Foundation from 2004 to 2008. Commissioner of Finance, State of Minnesota, from 1999 to 2002. Currently Board Chair of the Minnesota Wild Foundation since 2010. | | N/A |
| * | Length of service dates reflect the Trustee’s commencement of service with the Trust’s predecessor entities, where applicable. |
| | | | | | |
| Other information (unaudited) | | Wells Fargo Capital Growth Fund | | | 29 | |
Officers
| | | | | | |
Name and year of birth | | Position held and
length of service | | Principal occupations during past five years or longer | | |
| | | |
Andrew Owen (Born 1960) | | President, since 2017 | | Executive Vice President of Wells Fargo & Company and Head of Affiliated Managers, Wells Fargo Asset Management, since 2014. In addition, Mr. Owen is currently President, Chief Executive Officer and Director of Wells Fargo Funds Management, LLC since 2017. Prior thereto, Executive Vice President responsible for marketing, investments and product development for Wells Fargo Funds Management, LLC, from 2009 to 2014. | | |
| | | |
Jeremy DePalma1 (Born 1974) | | Treasurer, since 2012 | | Senior Vice President of Wells Fargo Funds Management, LLC since 2009. Senior Vice President of Evergreen Investment Management Company, LLC from 2008 to 2010 and head of the Fund Reporting and Control Team within Fund Administration from 2005 to 2010. | | |
| | | |
Alexander Kymn (Born 1973) | | Secretary, since 2018; Chief Legal Officer, since 2018 | | Senior Company Counsel of Wells Fargo Bank, N.A. since 2018 (previously Senior Counsel from 2007 to 2018). Vice President of Wells Fargo Funds Management, LLC from 2008 to 2014. | | |
| | | |
Michael H. Whitaker (Born 1967) | | Chief Compliance Officer, since 2016 | | Senior Vice President and Chief Compliance Officer since 2016. Senior Vice President and Chief Compliance Officer for Fidelity Investments from 2007 to 2016. | | |
| | | |
David Berardi (Born 1975) | | Assistant Treasurer, since 2009 | | Vice President of Wells Fargo Funds Management, LLC since 2009. Vice President of Evergreen Investment Management Company, LLC from 2008 to 2010. Manager of Fund Reporting and Control for Evergreen Investment Management Company, LLC from 2004 to 2010. | | |
| 1 | Jeremy DePalma acts as Treasurer of 76 funds and Assistant Treasurer of 76 funds in the Fund Complex. |
| 2 | The Statement of Additional Information includes additional information about the Trustees and is available, without charge, upon request, by calling 1-800-260-5969 or by visiting the website atwellsfargofunds.com. |
| 3 | Mr. Harris became Chairman of the Audit Committee effective January 1, 2019. |
| | | | |
| 30 | | Wells Fargo Capital Growth Fund | | Appendix A (unaudited) |
SALES CHARGE REDUCTIONS AND WAIVERS FOR CERTAIN INTERMEDIARIES
Raymond James & Associates, Inc., Raymond James Financial Services & Raymond James affiliates (“Raymond James”)
Effective on or about March 1, 2019, shareholders purchasing Fund shares through a Raymond James platform or account will be eligible only for the following load waivers (front-end sales charge waivers and contingent deferred, or back-end, sales charge waivers) and discounts, which may differ from those disclosed elsewhere in the Fund’s Prospectus or SAI.
Front-end Sales Load Waivers on Class A shares Available at Raymond James
| | • | | Shares purchased in an investment advisory program. |
| | • | | Shares purchased through reinvestment of capital gains distributions and dividend reinvestment when purchasing shares of the same fund (but not any other fund within the fund family). |
| | • | | Employees and registered representatives of Raymond James or its affiliates and their family members as designated by Raymond James. |
| | • | | Shares purchased from the proceeds of redemptions within the same fund family, provided (1) the repurchase occurs within 90 days following the redemption, (2) the redemption and purchase occur in the same account, and (3) redeemed shares were subject to a front-end or deferred sales load (known as Rights of Reinstatement). |
| | • | | A shareholder in the fund’s Class C shares will have their shares automatically exchanged at net asset value to Class A shares (or the appropriate share class) of the fund if the shares are no longer subject to a CDSC and the exchange is in line with the policies and procedures of Raymond James. |
CDSC Waivers on Class A and C Shares Available at Raymond James
| | • | | Death or disability of the shareholder. |
| | • | | Shares sold as part of a systematic withdrawal plan as described in the Fund’s Prospectus. |
| | • | | Return of excess contributions from an IRA Account. |
| | • | | Shares sold as part of a required minimum distribution for IRA and retirement accounts due to the shareholder reaching age 70½ as described in the Fund’s prospectus. |
| | • | | Shares sold to pay Raymond James fees but only if the transaction is initiated by Raymond James. |
| | • | | Shares acquired through a right of reinstatement. |
Front-end Load Discounts Available at Raymond James: Breakpoints, and/or Rights of Accumulation
| | • | | Breakpoints as described in the Fund’s Prospectus. |
| | • | | Rights of accumulation which entitle shareholders to breakpoint discounts will be automatically calculated based on the aggregated holding of fund family assets held by accounts within the purchaser’s household at Raymond James. Eligible fund family assets not held at Raymond James may be included in the rights of accumulation calculation only if the shareholder notifies his or her financial advisor about such assets. |
This page is intentionally left blank.
This page is intentionally left blank.

For more information
More information about Wells Fargo Funds is available free upon request. To obtain literature, please write, visit the Fund’s website, or call:
Wells Fargo Funds
P.O. Box 219967
Kansas City, MO 64121-9967
Website: wellsfargofunds.com
Individual investors: 1-800-222-8222
Retail investment professionals: 1-888-877-9275
Institutional investment professionals:1-866-765-0778
This report and the financial statements contained herein are submitted for the general information of the shareholders of the Fund. If this report is used for promotional purposes, distribution of the report must be accompanied or preceded by a current prospectus. Before investing, please consider the investment objectives, risks, charges, and expenses of the investment. For a current prospectus and, if available, a summary prospectus, containing this information, call1-800-222-8222 or visit the Fund’s website atwellsfargofunds.com. Read the prospectus carefully before you invest or send money.
Wells Fargo Asset Management (WFAM) is the trade name for certain investment advisory/management firms owned by Wells Fargo & Company. These firms include but are not limited to Wells Capital Management Incorporated and Wells Fargo Funds Management, LLC. Certain products managed by WFAM entities are distributed by Wells Fargo Funds Distributor, LLC (a broker/dealer and Member FINRA).
This material is for general informational and educational purposes only and is NOT intended to provide investment advice or a recommendation of any kind—including a recommendation for any specific investment, strategy, or plan.
INVESTMENT PRODUCTS: NOT FDIC INSURED ◾ NO BANK GUARANTEE ◾ MAY LOSE VALUE
© 2019 Wells Fargo Funds Management, LLC. All rights reserved.
| | |
 | | 320768 03-19 SA200/SAR200 01-19 |
Semi-Annual Report
January 31, 2019

Wells Fargo Disciplined U.S. Core Fund

Beginning on January 1, 2021, as permitted by new regulations adopted by the Securities and Exchange Commission, paper copies of the Wells Fargo Funds’ annual and semi-annual shareholder reports issued after this date will no longer be sent by mail, unless you specifically request paper copies of the reports. Instead, the reports will be made available on the Funds’ website, and you will be notified by mail each time a report is posted and provided with a website address to access the report.
If you already elected to receive shareholder reports electronically, you will not be affected by this change and you need not take any action. You may elect to receive shareholder reports and other communications from the Fund electronically at any time by contacting your financial intermediary (such as a broker-dealer or bank) or, if you are a direct investor, by calling 1-800-222-8222 or by enrolling at wellsfargo.com/advantagedelivery.
You may elect to receive all future reports in paper free of charge. If you invest through a financial intermediary, you can contact your financial intermediary to request that you continue to receive paper copies of your shareholder reports; if you invest directly with the Fund, you can call 1-800-222-8222. Your election to receive reports in paper will apply to all Wells Fargo Funds held in your account with your financial intermediary or, if you are a direct investor, to all Wells Fargo Funds that you hold.

Reduce clutter. Save trees.
Sign up for electronic delivery of prospectuses and shareholder reports atwellsfargo.com/advantagedelivery
Contents
The views expressed and any forward-looking statements are as of January 31, 2019, unless otherwise noted, and are those of the Fund managers and/or Wells Fargo Funds Management, LLC. Discussions of individual securities, or the markets generally, or any Wells Fargo Fund are not intended as individual recommendations. Future events or results may vary significantly from those expressed in any forward-looking statements. The views expressed are subject to change at any time in response to changing circumstances in the market. Wells Fargo Funds Management, LLC and the Fund disclaim any obligation to publicly update or revise any views expressed or forward-looking statements.
INVESTMENT PRODUCTS: NOT FDIC INSURED ◾ NO BANK GUARANTEE ◾ MAY LOSE VALUE
| | | | |
| 2 | | Wells Fargo Disciplined U.S. Core Fund | | Letter to shareholders (unaudited) |

Andrew Owen
President
Wells Fargo Funds
Favorable third-quarter economic indicators and corporate earnings reports encouraged domestic stock investors.
Dear Shareholder:
We are pleased to offer you this semi-annual report for the Wells Fargo Disciplined U.S. Core Fund for thesix-month period that ended January 31, 2019. Higher short-term interest rates, inflation concerns, trade tensions, slowing economic growth outside the U.S., and geopolitical events contributed to investment market volatility throughout the period.
For the period, U.S. stocks, as measured by the S&P 500 Index,1 fell 3.00% and international stocks, as measured by the MSCI ACWI ex USA Index (Net),2 declined 6.34%. Based on the MSCI EM Index (Net),3 emerging market stocks lost 2.60%. For bond investors, the Bloomberg Barclays U.S. Aggregate Bond Index4 added 2.71% while the Bloomberg Barclays Global Aggregateex-USD Index5 gained 1.37%. The Bloomberg Barclays Municipal Bond Index6 added 2.05%, and the ICE BofAML U.S. High Yield Index7 gained 1.02%.
Investors appeared to shake off lingering concerns during the third quarter.
Favorable third-quarter economic indicators and corporate earnings reports encouraged domestic stock investors. U.S. trade negotiations with Mexico and Canada made progress. The Conference Board Consumer Confidence Index®8 reached its highest level in 18 years during September. Several U.S. equity market indices reached records during August. The U.S. Federal Reserve (Fed) raised the federal funds rate by 25 basis points (bps; 100 bps equal 1.00%) to a target range of between 2.00% and 2.25% in September 2018. For the quarter that ended September 30, the S&P 500 Index added 7.71%.
Investors in international markets were not as reassured. Tensions between the U.S. and China increased when the U.S. imposed an additional $200 billion in tariffs on Chinese goods. China responded with $60 billion in tariffs on U.S. products. In addition, economic growth in China drew renewed concerns. The Bank of England, having raised its monetary policy rate to 0.50% in November 2017, increased the rate again in August 2018 to 0.75%. During the three-month period that ended September 30, 2018, the MSCI ACWI ex USA Index (Net) gained 0.71% while the MSCI EM Index (Net) declined 1.09%.
| 1 | The S&P 500 Index consists of 500 stocks chosen for market size, liquidity, and industry group representation. It is a market-value-weighted index with each stock’s weight in the index proportionate to its market value. You cannot invest directly in an index. |
| 2 | The Morgan Stanley Capital International (MSCI) All Country World Index (ACWI) ex USA Index (Net) is a free-float-adjusted market-capitalization-weighted index that is designed to measure the equity market performance of developed markets, excluding the United States and Canada. Source: MSCI. MSCI makes no express or implied warranties or representations and shall have no liability whatsoever with respect to any MSCI data contained herein. The MSCI data may not be further redistributed or used as a basis for other indices or any securities or financial products. This report is not approved, reviewed, or produced by MSCI. You cannot invest directly in an index. |
| 3 | The MSCI Emerging Markets (EM) Index (Net) is a free-float-adjusted market-capitalization-weighted index that is designed to measure large- andmid-cap equity market performance of emerging markets. The MSCI EM Index (Net) consists of the following 24 emerging market country indices: Brazil, Chile, China, Colombia, Czech Republic, Egypt, Greece, Hungary, India, Indonesia, Korea, Malaysia, Mexico, Pakistan, Peru, the Philippines, Poland, Qatar, Russia, South Africa, Taiwan, Thailand, Turkey, and the United Arab Emirates. You cannot invest directly in an index. |
| 4 | The Bloomberg Barclays U.S. Aggregate Bond Index is a broad-based benchmark that measures the investment-grade, U.S. dollar-denominated, fixed-rate taxable bond market, including Treasuries, government-related and corporate securities, mortgage-backed securities (agency fixed-rate and hybrid adjustable-rate mortgage pass-throughs), asset-backed securities, and commercial mortgage-backed securities. You cannot invest directly in an index. |
| 5 | The Bloomberg Barclays Global Aggregateex-USD Index is an unmanaged index that provides a broad-based measure of the global investment-grade fixed-income markets excluding the U.S. dollar-denominated debt market. You cannot invest directly in an index. |
| 6 | The Bloomberg Barclays Municipal Bond Index is an unmanaged index composed of long-termtax-exempt bonds with a minimum credit rating of Baa. You cannot invest directly in an index. |
| 7 | The ICE BofAML U.S. High Yield Index is a market-capitalization-weighted index of domestic and Yankee high-yield bonds. The index tracks the performance of high-yield securities traded in the U.S. bond market. You cannot invest directly in an index. Copyright 2019. ICE Data Indices, LLC. All rights reserved. |
| 8 | The Conference Board Consumer Confidence Index® measures the degree of optimism on the state of the U.S. economy that consumers are expressing through their activities of savings and spending. You cannot invest directly in an index. |
| | | | | | |
| Letter to shareholders (unaudited) | | Wells Fargo Disciplined U.S. Core Fund | | | 3 | |
In bond markets, U.S. bonds, as measured by the Bloomberg Barclays U.S. Aggregate Bond Index, were flat. The Bloomberg Barclays Global Aggregateex-USD Index fell 1.74% during the quarter that ended September 30, 2018.
Conflicting data unsettled markets during the fourth quarter.
Negative stock market performance during October and December bracketed a mildly positive November for the S&P 500 Index and the MSCI ACWI ex USA Index (Net). As interest rates and bond yields gained during October, stock markets struggled. December’s S&P 500 Index performance was the worst since 1931. Globally, fixed-income investments fared better than stocks during the last two months of the year.
November’s U.S. midterm elections shifted control of the House of Representatives from Republicans to Democrats, presaging potential partisan disputes. The Bureau of Economic Analysis reported that third-quarter U.S. gross domestic product (GDP) grew at an annualized 3.4% rate, lower than second-quarter GDP growth. Brexit efforts stalled in the U.K. ahead of the March 2019 deadline. The People’s Bank of China cut reserve requirement ratios and accelerated infrastructure spending and tax cuts, and the value of the yuan declined to low levels last seen in 2008. Oil prices fell.
After the Fed increased the federal funds rate by 25 bps to a target range of between 2.25% and 2.50% in December 2018—the ninth such increase since the Fed began raising rates three years ago from near zero—it softened its outlook for further interest rate increases in 2019.
The market climbs a wall of worry.
Investors entered 2019 with reasons to be concerned. A partial U.S. government shutdown driven by partisan disputes over spending and immigration policies extended into January. Globally, economic signals were uneven. Investors expected high levels of stock market volatility to continue, as measured by the VIX9.
January’s returns tended to support the investing adage that the market climbs a wall of worry. The S&P 500 Index gained 8.01% for the month that ended January 31, 2019, its best monthly performance in 30 years. Returns for the MSCI ACWI ex USA Index (Net), the Bloomberg Barclays U.S. Aggregate Bond Index, and the Bloomberg Barclays Global Aggregateex-USD Index also were positive.
Don’t let short-term uncertainty derail long-term investment goals.
Periods of investment uncertainty can present challenges, but experience has taught us that maintaining long-term investment goals can be an effective way to plan for the future. To help you create a sound strategy based on your personal goals and risk tolerance, Wells Fargo Funds offers more than 100 mutual funds spanning a wide range of asset classes and investment styles. Although diversification cannot guarantee an investment profit or prevent losses, we believe it can be an effective way to manage investment risk and potentially smooth out overall portfolio performance. We encourage investors to know their investments and to understand that appropriate levels of risk-taking may unlock opportunities.
January’s returns tended to support the investing adage that the market climbs a wall of worry.
| 9 | The Chicago Board Options Exchange Market Volatility Index (VIX) is a popular measure of the implied volatility of S&P 500 Index options. It represents one measure of the market’s expectation of stock market volatility over the next30-day period. You cannot invest directly in an index. |
| | | | |
| 4 | | Wells Fargo Disciplined U.S. Core Fund | | Letter to shareholders (unaudited) |
Thank you for choosing to invest with Wells Fargo Funds. We appreciate your confidence in us and remain committed to helping you meet your financial needs.
Sincerely,

Andrew Owen
President
Wells Fargo Funds
For further information about your Fund, contact your investment professional, visit our website atwellsfargofunds.com, or call us directly at1-800-222-8222.
This page is intentionally left blank.
| | | | |
| 6 | | Wells Fargo Disciplined U.S. Core Fund | | Performance highlights (unaudited) |
Investment objective
The Fund seeks long-term capital appreciation.
Manager
Wells Fargo Funds Management, LLC
Subadviser
Wells Capital Management Incorporated
Portfolio managers
Justin Carr, CFA®‡
Greg W. Golden, CFA®‡
Average annual total returns (%) as of January 31, 2019*
| | | | | | | | | | | | | | | | | | | | | | | | | | | | | | | | | | |
| | | | | Including sales charge | | | Excluding sales charge | | | Expense ratios1 (%) | |
| | | Inception date | | 1 year | | | 5 year | | | 10 year | | | 1 year | | | 5 year | | | 10 year | | | Gross | | | Net2 | |
| | | | | | | | | |
| Class A (EVSAX) | | 2-28-1990 | | | -11.53 | | | | 8.82 | | | | 13.40 | | | | -6.12 | | | | 10.12 | | | | 14.07 | | | | 0.83 | | | | 0.83 | |
| | | | | | | | | |
| Class C (EVSTX) | | 6-30-1999 | | | -7.87 | | | | 9.28 | | | | 13.22 | | | | -6.87 | | | | 9.28 | | | | 13.22 | | | | 1.58 | | | | 1.58 | |
| | | | | | | | | |
| Class R (EVSHX)3 | | 9-30-2015 | | | – | | | | – | | | | – | | | | -6.40 | | | | 9.83 | | | | 13.77 | | | | 1.08 | | | | 1.08 | |
| | | | | | | | | |
| Class R6 (EVSRX)4 | | 9-30-2015 | | | – | | | | – | | | | – | | | | -5.74 | | | | 10.58 | | | | 14.54 | | | | 0.40 | | | | 0.40 | |
| | | | | | | | | |
| Administrator Class (EVSYX) | | 2-21-1995 | | | – | | | | – | | | | – | | | | -6.01 | | | | 10.25 | | | | 14.26 | | | | 0.75 | | | | 0.74 | |
| | | | | | | | | |
| Institutional Class (EVSIX)5 | | 7-30-2010 | | | – | | | | – | | | | – | | | | -5.81 | | | | 10.53 | | | | 14.51 | | | | 0.50 | | | | 0.48 | |
| | | | | | | | | |
| S&P 500 Index6 | | – | | | – | | | | – | | | | – | | | | -2.31 | | | | 10.96 | | | | 15.00 | | | | – | | | | – | |
Figures quoted represent past performance, which is no guarantee of future results, and do not reflect taxes that a shareholder may pay on fund distributions or the redemption of fund shares. Investment return and principal value of an investment will fluctuate so that an investor’s shares, when redeemed, may be worth more or less than their original cost. Performance shown without sales charges would be lower if sales charges were reflected. Current performance may be lower or higher than the performance data quoted, which assumes the reinvestment of dividends and capital gains. Currentmonth-end performance is available on the Fund’s website,wellsfargofunds.com.
Index returns do not include transaction costs associated with buying and selling securities, any mutual fund fees or expenses, or any taxes. It is not possible to invest directly in an index.
For Class A shares, the maximumfront-end sales charge is 5.75%. For Class C shares, the maximum contingent deferred sales charge is 1.00%. Performance including a contingent deferred sales charge assumes the sales charge for the corresponding time period. Class R, Class R6, Administrator Class, and Institutional Class shares are sold without afront-end sales charge or contingent deferred sales charge.
Stock values fluctuate in response to the activities of individual companies and general market and economic conditions. The use of derivatives may reduce returns and/or increase volatility. Consult the Fund’s prospectus for additional information on these and other risks.
Please see footnotes on page 7.
| | | | | | |
| Performance highlights (unaudited) | | Wells Fargo Disciplined U.S. Core Fund | | | 7 | |
| | | | |
| Ten largest holdings (%) as of January 31, 20197 | |
| |
Microsoft Corporation | | | 3.99 | |
| |
Apple Incorporated | | | 3.81 | |
| |
Amazon.com Incorporated | | | 3.15 | |
| |
Berkshire Hathaway Incorporated Class B | | | 2.35 | |
| |
Alphabet Incorporated Class C | | | 1.91 | |
| |
Johnson & Johnson | | | 1.89 | |
| |
Alphabet Incorporated Class A | | | 1.84 | |
| |
Exxon Mobil Corporation | | | 1.83 | |
| |
JPMorgan Chase & Company | | | 1.76 | |
| |
Facebook Incorporated Class A | | | 1.68 | |
| | |
| Sector distribution as of January 31, 20198 |
|
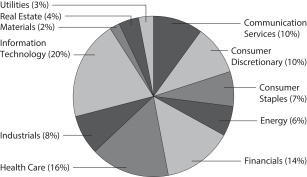 |
| ‡ | CFA® and Chartered Financial Analyst®are trademarks owned by CFA Institute. |
| * | Historical performance shown for all classes of the Fund prior to July 19, 2010, is based on the performance of the Fund’s predecessor, Evergreen Enhanced S&P 500 Fund. |
| 1 | Reflects the expense ratios as stated in the most recent prospectuses. The expense ratios shown are subject to change and may differ from the annualized expense ratios shown in the financial highlights of this report. |
| 2 | The manager has contractually committed through November 30, 2019, to waive fees and/or reimburse expenses to the extent necessary to cap the expenses of each class after fee waivers at 0.87% for Class A, 1.62% for Class C, 1.12% for Class R, 0.43% for Class R6, 0.74% for Administrator Class, and 0.48% for Institutional Class. Brokerage commissions, stamp duty fees, interest, taxes, acquired fund fees and expenses (if any), and extraordinary expenses are excluded from the expense cap. Prior to or after the commitment expiration date, the cap may be increased or the commitment to maintain the cap may be terminated only with the approval of the Board of Trustees. Without this cap, the Fund’s returns would have been lower. The expense ratio paid by an investor is the net expense ratio (the total annual fund operating expenses after fee waivers) as stated in the prospectuses. |
| 3 | Historical performance shown for Class R shares prior to their inception reflects the performance of Administrator Class shares, adjusted to reflect higher expenses applicable to Class R shares. |
| 4 | Historical performance shown for Class R6 shares prior to their inception reflects the performance of Institutional Class shares, and includes the higher expenses applicable to Institutional Class shares. If these expenses had not been included, returns for Class R6 shares would be higher. |
| 5 | Historical performance shown for Institutional Class shares prior to their inception reflects the performance of Administrator Class shares, and includes the higher expenses applicable to Administrator Class shares. If these expenses had not been included, returns for Institutional Class shares would be higher. |
| 6 | The S&P 500 Index consists of 500 stocks chosen for market size, liquidity, and industry group representation. It is a market-value-weighted index with each stock’s weight in the index proportionate to its market value. You cannot invest directly in an index. |
| 7 | The ten largest holdings, excluding cash, cash equivalents and any money market funds, are calculated based on the value of the investments divided by total net assets of the Fund. Holdings are subject to change and may have changed since the date specified. |
| 8 | Amounts are calculated based on the total long-term investments of the Fund. These amounts are subject to change and may have changed since the date specified. |
| | | | |
| 8 | | Wells Fargo Disciplined U.S. Core Fund | | Fund expenses (unaudited) |
As a shareholder of the Fund, you incur two types of costs: (1) transaction costs, including sales charges (loads) on purchase payments and contingent deferred sales charges (if any) on redemptions and (2) ongoing costs, including management fees, distribution(12b-1) and/or shareholder servicing fees, and other Fund expenses. This example is intended to help you understand your ongoing costs (in dollars) of investing in the Fund and to compare these costs with the ongoing costs of investing in other mutual funds.
The example is based on an investment of $1,000 invested at the beginning of thesix-month period and held for the entire period from August 1, 2018 to January 31, 2019.
Actual expenses
The “Actual” line of the table below provides information about actual account values and actual expenses. You may use the information in this line, together with the amount you invested, to estimate the expenses that you paid over the period. Simply divide your account value by $1,000 (for example, an $8,600 account value divided by $1,000 = 8.6), then multiply the result by the number in the “Actual” line under the heading entitled “Expenses paid during period” for your applicable class of shares to estimate the expenses you paid on your account during this period.
Hypothetical example for comparison purposes
The “Hypothetical” line of the table below provides information about hypothetical account values and hypothetical expenses based on the Fund’s actual expense ratio and an assumed rate of return of 5% per year before expenses, which is not the Fund’s actual return. The hypothetical account values and expenses may not be used to estimate the actual ending account balance or expenses you paid for the period. You may use this information to compare the ongoing costs of investing in the Fund and other funds. To do so, compare this 5% hypothetical example with the 5% hypothetical examples that appear in the shareholder reports of the other funds.
Please note that the expenses shown in the table are meant to highlight your ongoing costs only and do not reflect any transactional costs, such as sales charges (loads) and contingent deferred sales charges. Therefore, the “Hypothetical” line of the table is useful in comparing ongoing costs only and will not help you determine the relative total costs of owning different funds. In addition, if these transactional costs were included, your costs would have been higher.
| | | | | | | | | | | | | | | | |
| | | Beginning
account value
8-1-2018 | | | Ending
account value
1-31-2019 | | | Expenses
paid during
the period¹ | | | Annualized net
expense ratio | |
Class A | | | | | | | | | | | | | | | | |
| | | | |
Actual | | $ | 1,000.00 | | | $ | 952.63 | | | $ | 4.13 | | | | 0.84 | % |
| | | | |
Hypothetical (5% return before expenses) | | $ | 1,000.00 | | | $ | 1,020.97 | | | $ | 4.28 | | | | 0.84 | % |
Class C | | | | | | | | | | | | | | | | |
| | | | |
Actual | | $ | 1,000.00 | | | $ | 949.02 | | | $ | 7.81 | | | | 1.59 | % |
| | | | |
Hypothetical (5% return before expenses) | | $ | 1,000.00 | | | $ | 1,017.19 | | | $ | 8.08 | | | | 1.59 | % |
Class R | | | | | | | | | | | | | | | | |
| | | | |
Actual | | $ | 1,000.00 | | | $ | 951.23 | | | $ | 5.36 | | | | 1.09 | % |
| | | | |
Hypothetical (5% return before expenses) | | $ | 1,000.00 | | | $ | 1,019.71 | | | $ | 5.55 | | | | 1.09 | % |
Class R6 | | | | | | | | | | | | | | | | |
| | | | |
Actual | | $ | 1,000.00 | | | $ | 954.50 | | | $ | 2.02 | | | | 0.41 | % |
| | | | |
Hypothetical (5% return before expenses) | | $ | 1,000.00 | | | $ | 1,023.14 | | | $ | 2.09 | | | | 0.41 | % |
Administrator Class | | | | | | | | | | | | | | | | |
| | | | |
Actual | | $ | 1,000.00 | | | $ | 953.36 | | | $ | 3.64 | | | | 0.74 | % |
| | | | |
Hypothetical (5% return before expenses) | | $ | 1,000.00 | | | $ | 1,021.48 | | | $ | 3.77 | | | | 0.74 | % |
Institutional Class | | | | | | | | | | | | | | | | |
| | | | |
Actual | | $ | 1,000.00 | | | $ | 953.97 | | | $ | 2.36 | | | | 0.48 | % |
| | | | |
Hypothetical (5% return before expenses) | | $ | 1,000.00 | | | $ | 1,022.79 | | | $ | 2.45 | | | | 0.48 | % |
| 1 | Expenses paid is equal to the annualized net expense ratio of each class multiplied by the average account value over the period, multiplied by the number of days in the most recent fiscal half-year divided by the number of days in the fiscal year (to reflect theone-half-year period). |
| | | | | | |
| Portfolio of investments—January 31, 2019 (unaudited) | | Wells Fargo Disciplined U.S. Core Fund | | | 9 | |
| | | | | | | | | | | | | | | | |
| Security name | | | | | | | | Shares | | | Value | |
| | | |
Common Stocks: 99.26% | | | | | | | | | | | | | |
| | | | |
Communication Services: 9.59% | | | | | | | | | | | | | | | | |
| | | |
| Diversified Telecommunication Services: 2.88% | | | | | | | | | | | | | |
| | | | |
AT&T Incorporated | | | | | | | | | | | 583,623 | | | $ | 17,543,707 | |
| | | | |
Verizon Communications Incorporated | | | | | | | | | | | 339,450 | | | | 18,690,117 | |
| | | | |
| | | | | | | | | | | | | | | 36,233,824 | |
| | | | | | | | | | | | | | | | |
|
| Entertainment: 0.90% | |
| | | | |
The Walt Disney Company | | | | | | | | | | | 37,728 | | | | 4,207,427 | |
| | | | |
Twenty-First Century Fox Incorporated Class A | | | | | | | | | | | 143,304 | | | | 7,066,320 | |
| | | | |
| | | | | | | | | | | | | | | 11,273,747 | |
| | | | | | | | | | | | | | | | |
|
| Interactive Media & Services: 5.44% | |
| | | | |
Alphabet Incorporated Class A † | | | | | | | | | | | 20,582 | | | | 23,173,068 | |
| | | | |
Alphabet Incorporated Class C † | | | | | | | | | | | 21,538 | | | | 24,044,377 | |
| | | | |
Facebook Incorporated Class A † | | | | | | | | | | | 126,399 | | | | 21,069,449 | |
| | | | |
| | | | | | | | | | | | | | | 68,286,894 | |
| | | | | | | | | | | | | | | | |
|
| Media: 0.37% | |
| | | | |
Comcast Corporation Class A | | | | | | | | | | | 128,087 | | | | 4,684,142 | |
| | | | | | | | | | | | | | | | |
|
Consumer Discretionary: 9.81% | |
|
| Automobiles: 0.84% | |
| | | | |
Ford Motor Company | | | | | | | | | | | 898,784 | | | | 7,909,299 | |
| | | | |
General Motors Company | | | | | | | | | | | 69,005 | | | | 2,692,575 | |
| | | | |
| | | | | | | | | | | | | | | 10,601,874 | |
| | | | | | | | | | | | | | | | |
|
| Hotels, Restaurants & Leisure: 0.62% | |
| | | | |
Chipotle Mexican Grill Incorporated † | | | | | | | | | | | 5,266 | | | | 2,788,926 | |
| | | | |
Starbucks Corporation | | | | | | | | | | | 73,626 | | | | 5,016,876 | |
| | | | |
| | | | | | | | | | | | | | | 7,805,802 | |
| | | | | | | | | | | | | | | | |
|
| Household Durables: 0.61% | |
| | | | |
Garmin Limited | | | | | | | | | | | 52,828 | | | | 3,654,641 | |
| | | | |
Pulte Group Incorporated | | | | | | | | | | | 144,091 | | | | 4,007,171 | |
| | | | |
| | | | | | | | | | | | | | | 7,661,812 | |
| | | | | | | | | | | | | | | | |
|
| Internet & Direct Marketing Retail: 3.16% | |
| | | | |
Amazon.com Incorporated † | | | | | | | | | | | 23,056 | | | | 39,627,039 | |
| | | | | | | | | | | | | | | | |
|
| Multiline Retail: 1.05% | |
| | | | |
Kohl’s Corporation | | | | | | | | | | | 60,120 | | | | 4,129,643 | |
| | | | |
Macy’s Incorporated | | | | | | | | | | | 195,257 | | | | 5,135,259 | |
| | | | |
Target Corporation | | | | | | | | | | | 52,909 | | | | 3,862,357 | |
| | | | |
| | | | | | | | | | | | | | | 13,127,259 | |
| | | | | | | | | | | | | | | | |
|
| Specialty Retail: 2.46% | |
| | | | |
Best Buy Company Incorporated | | | | | | | | | | | 127,725 | | | | 7,566,429 | |
| | | | |
Lowe’s Companies Incorporated | | | | | | | | | | | 33,191 | | | | 3,191,647 | |
The accompanying notes are an integral part of these financial statements.
| | | | |
| 10 | | Wells Fargo Disciplined U.S. Core Fund | | Portfolio of investments—January 31, 2019 (unaudited) |
| | | | | | | | | | | | | | | | |
| Security name | | | | | | | | Shares | | | Value | |
|
| Specialty Retail (continued) | |
| | | | |
The Home Depot Incorporated | | | | | | | | | | | 87,770 | | | $ | 16,108,428 | |
| | | | |
The TJX Companies Incorporated | | | | | | | | | | | 81,782 | | | | 4,067,019 | |
| | | | |
| | | | | | | | | | | | | | | 30,933,523 | |
| | | | | | | | | | | | | | | | |
|
| Textiles, Apparel & Luxury Goods: 1.07% | |
| | | | |
Nike Incorporated Class B | | | | | | | | | | | 164,355 | | | | 13,457,387 | |
| | | | | | | | | | | | | | | | |
|
Consumer Staples: 6.55% | |
|
| Beverages: 0.87% | |
| | | | |
Molson Coors Brewing Company Class B | | | | | | | | | | | 127,624 | | | | 8,501,035 | |
| | | | |
PepsiCo Incorporated | | | | | | | | | | | 21,722 | | | | 2,447,418 | |
| | | | |
| | | | | | | | | | | | | | | 10,948,453 | |
| | | | | | | | | | | | | | | | |
|
| Food & Staples Retailing: 2.43% | |
| | | | |
The Kroger Company | | | | | | | | | | | 282,745 | | | | 8,010,166 | |
| | | | |
Wal-Mart Stores Incorporated | | | | | | | | | | | 142,561 | | | | 13,661,621 | |
| | | | |
Walgreens Boots Alliance Incorporated | | | | | | | | | | | 122,846 | | | | 8,876,852 | |
| | | | |
| | | | | | | | | | | | | | | 30,548,639 | |
| | | | | | | | | | | | | | | | |
|
| Food Products: 1.45% | |
| | | | |
Cal-Maine Foods Incorporated | | | | | | | | | | | 138,144 | | | | 5,826,914 | |
| | | | |
Kellogg Company | | | | | | | | | | | 34,026 | | | | 2,007,874 | |
| | | | |
Lamb Weston Holdings Incorporated | | | | | | | | | | | 49,119 | | | | 3,551,304 | |
| | | | |
Tyson Foods Incorporated Class A | | | | | | | | | | | 110,607 | | | | 6,848,785 | |
| | | | |
| | | | | | | | | | | | | | | 18,234,877 | |
| | | | | | | | | | | | | | | | |
|
| Household Products: 1.17% | |
| | | | |
Kimberly-Clark Corporation | | | | | | | | | | | 75,228 | | | | 8,378,895 | |
| | | | |
The Procter & Gamble Company | | | | | | | | | | | 66,092 | | | | 6,375,895 | |
| | | | |
| | | | | | | | | | | | | | | 14,754,790 | |
| | | | | | | | | | | | | | | | |
|
| Tobacco: 0.63% | |
| | | | |
Altria Group Incorporated | | | | | | | | | | | 90,331 | | | | 4,457,835 | |
| | | | |
Philip Morris International Incorporated | | | | | | | | | | | 44,239 | | | | 3,394,016 | |
| | | | |
| | | | | | | | | | | | | | | 7,851,851 | |
| | | | | | | | | | | | | | | | |
|
Energy: 6.37% | |
|
| Energy Equipment & Services: 1.25% | |
| | | | |
Helmerich & Payne Incorporated | | | | | | | | | | | 148,364 | | | | 8,306,900 | |
| | | | |
Schlumberger Limited | | | | | | | | | | | 168,394 | | | | 7,444,699 | |
| | | | |
| | | | | | | | | | | | | | | 15,751,599 | |
| | | | | | | | | | | | | | | | |
|
| Oil, Gas & Consumable Fuels: 5.12% | |
| | | | |
Chevron Corporation | | | | | | | | | | | 164,408 | | | | 18,849,377 | |
| | | | |
Exxon Mobil Corporation | | | | | | | | | | | 313,429 | | | | 22,968,077 | |
| | | | |
Kinder Morgan Incorporated | | | | | | | | | | | 523,921 | | | | 9,482,970 | |
| | | | |
Marathon Petroleum Corporation | | | | | | | | | | | 78,869 | | | | 5,225,860 | |
The accompanying notes are an integral part of these financial statements.
| | | | | | |
| Portfolio of investments—January 31, 2019 (unaudited) | | Wells Fargo Disciplined U.S. Core Fund | | | 11 | |
| | | | | | | | | | | | | | | | |
| Security name | | | | | | | | Shares | | | Value | |
|
| Oil, Gas & Consumable Fuels(continued) | |
| | | | |
ONEOK Incorporated | | | | | | | | | | | 120,369 | | | $ | 7,728,893 | |
| | | | |
| | | | | | | | | | | | | | | 64,255,177 | |
| | | | | | | | | | | | | | | | |
|
Financials: 13.59% | |
|
| Banks: 5.06% | |
| | | | |
Bank of America Corporation | | | | | | | | | | | 607,345 | | | | 17,291,112 | |
| | | | |
Citigroup Incorporated | | | | | | | | | | | 242,547 | | | | 15,634,580 | |
| | | | |
Citizens Financial Group Incorporated | | | | | | | | | | | 84,887 | | | | 2,879,367 | |
| | | | |
JPMorgan Chase & Company | | | | | | | | | | | 213,767 | | | | 22,124,885 | |
| | | | |
Popular Incorporated | | | | | | | | | | | 104,200 | | | | 5,690,362 | |
| | | | |
| | | | | | | | | | | | | | | 63,620,306 | |
| | | | | | | | | | | | | | | | |
|
| Capital Markets: 1.52% | |
| | | | |
Evercore Partners Incorporated Class A | | | | | | | | | | | 71,610 | | | | 6,405,515 | |
| | | | |
State Street Corporation | | | | | | | | | | | 100,619 | | | | 7,133,887 | |
| | | | |
Waddell & Reed Financial Incorporated Class A | | | | | | | | | | | 325,520 | | | | 5,572,902 | |
| | | | |
| | | | | | | | | | | | | | | 19,112,304 | |
| | | | | | | | | | | | | | | | |
|
| Consumer Finance: 0.96% | |
| | | | |
Capital One Financial Corporation | | | | | | | | | | | 88,354 | | | | 7,120,449 | |
| | | | |
Synchrony Financial | | | | | | | | | | | 161,988 | | | | 4,866,120 | |
| | | | |
| | | | | | | | | | | | | | | 11,986,569 | |
| | | | | | | | | | | | | | | | |
|
| Diversified Financial Services: 2.35% | |
| | | | |
Berkshire Hathaway Incorporated Class B † | | | | | | | | | | | 143,774 | | | | 29,551,308 | |
| | | | | | | | | | | | | | | | |
|
| Insurance: 3.40% | |
| | | | |
AFLAC Incorporated | | | | | | | | | | | 174,985 | | | | 8,346,785 | |
| | | | |
Everest Reinsurance Group Limited | | | | | | | | | | | 32,130 | | | | 7,038,077 | |
| | | | |
MetLife Incorporated | | | | | | | | | | | 216,226 | | | | 9,875,041 | |
| | | | |
Prudential Financial Incorporated | | | | | | | | | | | 98,330 | | | | 9,060,126 | |
| | | | |
The Progressive Corporation | | | | | | | | | | | 124,594 | | | | 8,383,930 | |
| | | | |
| | | | | | | | | | | | | | | 42,703,959 | |
| | | | | | | | | | | | | | | | |
|
| Thrifts & Mortgage Finance: 0.30% | |
| | | | |
MGIC Investment Corporation † | | | | | | | | | | | 299,981 | | | | 3,743,763 | |
| | | | | | | | | | | | | | | | |
|
Health Care: 15.74% | |
|
| Biotechnology: 2.87% | |
| | | | |
AbbVie Incorporated | | | | | | | | | | | 155,734 | | | | 12,503,883 | |
| | | | |
Amgen Incorporated | | | | | | | | | | | 65,210 | | | | 12,201,443 | |
| | | | |
Gilead Sciences Incorporated | | | | | | | | | | | 162,278 | | | | 11,361,083 | |
| | | | |
| | | | | | | | | | | | | | | 36,066,409 | |
| | | | | | | | | | | | | | | | |
|
| Health Care Equipment & Supplies: 2.38% | |
| | | | |
Abbott Laboratories | | | | | | | | | | | 165,296 | | | | 12,063,302 | |
| | | | |
Baxter International Incorporated | | | | | | | | | | | 118,074 | | | | 8,559,184 | |
| | | | |
Medtronic plc | | | | | | | | | | | 104,148 | | | | 9,205,642 | |
| | | | |
| | | | | | | | | | | | | | | 29,828,128 | |
| | | | | | | | | | | | | | | | |
The accompanying notes are an integral part of these financial statements.
| | | | |
| 12 | | Wells Fargo Disciplined U.S. Core Fund | | Portfolio of investments—January 31, 2019 (unaudited) |
| | | | | | | | | | | | | | | | |
| Security name | | | | | | | | Shares | | | Value | |
|
| Health Care Providers & Services: 4.33% | |
| | | | |
AmerisourceBergen Corporation | | | | | | | | | | | 31,995 | | | $ | 2,667,423 | |
| | | | |
Anthem Incorporated | | | | | | | | | | | 42,369 | | | | 12,837,807 | |
| | | | |
CVS Health Corporation | | | | | | | | | | | 140,206 | | | | 9,190,503 | |
| | | | |
Humana Incorporated | | | | | | | | | | | 13,137 | | | | 4,059,202 | |
| | | | |
McKesson Corporation | | | | | | | | | | | 47,957 | | | | 6,150,485 | |
| | | | |
UnitedHealth Group Incorporated | | | | | | | | | | | 72,075 | | | | 19,474,665 | |
| | | | |
| | | | | | | | | | | | | | | 54,380,085 | |
| | | | | | | | | | | | | | | | |
|
| Life Sciences Tools & Services: 0.26% | |
| | | | |
Illumina Incorporated † | | | | | | | | | | | 11,857 | | | | 3,317,470 | |
| | | | | | | | | | | | | | | | |
|
| Pharmaceuticals: 5.90% | |
| | | | |
Allergan plc | | | | | | | | | | | 28,871 | | | | 4,156,847 | |
| | | | |
Bristol-Myers Squibb Company | | | | | | | | | | | 157,669 | | | | 7,784,119 | |
| | | | |
Eli Lilly & Company | | | | | | | | | | | 99,046 | | | | 11,871,654 | |
| | | | |
Johnson & Johnson | | | | | | | | | | | 178,363 | | | | 23,736,548 | |
| | | | |
Merck & Company Incorporated | | | | | | | | | | | 233,917 | | | | 17,410,442 | |
| | | | |
Pfizer Incorporated | | | | | | | | | | | 215,970 | | | | 9,167,927 | |
| | | | |
| | | | | | | | | | | | | | | 74,127,537 | |
| | | | | | | | | | | | | | | | |
|
Industrials: 8.46% | |
|
| Aerospace & Defense: 1.60% | |
| | | | |
Lockheed Martin Corporation | | | | | | | | | | | 12,511 | | | | 3,624,312 | |
| | | | |
Raytheon Company | | | | | | | | | | | 49,862 | | | | 8,215,263 | |
| | | | |
The Boeing Company | | | | | | | | | | | 7,055 | | | | 2,720,549 | |
| | | | |
United Technologies Corporation | | | | | | | | | | | 46,468 | | | | 5,486,477 | |
| | | | |
| | | | | | | | | | | | | | | 20,046,601 | |
| | | | | | | | | | | | | | | | |
|
| Air Freight & Logistics: 0.55% | |
| | | | |
C.H. Robinson Worldwide Incorporated | | | | | | | | | | | 80,236 | | | | 6,962,078 | |
| | | | | | | | | | | | | | | | |
|
| Airlines: 0.41% | |
| | | | |
United Continental Holdings Incorporated † | | | | | | | | | | | 59,775 | | | | 5,216,564 | |
| | | | | | | | | | | | | | | | |
|
| Commercial Services & Supplies: 0.74% | |
| | | | |
Waste Management Incorporated | | | | | | | | | | | 97,145 | | | | 9,293,862 | |
| | | | | | | | | | | | | | | | |
|
| Construction & Engineering: 1.04% | |
| | | | |
Fluor Corporation | | | | | | | | | | | 176,626 | | | | 6,459,213 | |
| | | | |
KBR Incorporated | | | | | | | | | | | 196,720 | | | | 3,383,584 | |
| | | | |
Quanta Services Incorporated | | | | | | | | | | | 90,707 | | | | 3,205,585 | |
| | | | |
| | | | | | | | | | | | | | | 13,048,382 | |
| | | | | | | | | | | | | | | | |
|
| Electrical Equipment: 0.31% | |
| | | | |
Eaton Corporation plc | | | | | | | | | | | 51,036 | | | | 3,891,495 | |
| | | | | | | | | | | | | | | | |
|
| Industrial Conglomerates: 0.62% | |
| | | | |
Honeywell International Incorporated | | | | | | | | | | | 54,226 | | | | 7,788,480 | |
| | | | | | | | | | | | | | | | |
The accompanying notes are an integral part of these financial statements.
| | | | | | |
| Portfolio of investments—January 31, 2019 (unaudited) | | Wells Fargo Disciplined U.S. Core Fund | | | 13 | |
| | | | | | | | | | | | | | | | |
| Security name | | | | | | | | Shares | | | Value | |
|
| Machinery: 1.28% | |
| | | | |
Caterpillar Incorporated | | | | | | | | | | | 68,226 | | | $ | 9,084,974 | |
| | | | |
Cummins Incorporated | | | | | | | | | | | 20,775 | | | | 3,056,210 | |
| | | | |
Paccar Incorporated | | | | | | | | | | | 59,346 | | | | 3,888,350 | |
| | | | |
| | | | | | | | | | | | | | | 16,029,534 | |
| | | | | | | | | | | | | | | | |
|
| Professional Services: 0.78% | |
| | | | |
Manpower Incorporated | | | | | | | | | | | 72,624 | | | | 5,739,475 | |
| | | | |
Robert Half International Incorporated | | | | | | | | | | | 62,838 | | | | 4,048,652 | |
| | | | |
| | | | | | | | | | | | | | | 9,788,127 | |
| | | | | | | | | | | | | | | | |
|
| Road & Rail: 0.49% | |
| | | | |
CSX Corporation | | | | | | | | | | | 45,501 | | | | 2,989,416 | |
| | | | |
Norfolk Southern Corporation | | | | | | | | | | | 19,034 | | | | 3,192,763 | |
| | | | |
| | | | | | | | | | | | | | | 6,182,179 | |
| | | | | | | | | | | | | | | | |
|
| Trading Companies & Distributors: 0.64% | |
| | | | |
W.W. Grainger Incorporated | | | | | | | | | | | 27,266 | | | | 8,054,104 | |
| | | | | | | | | | | | | | | | |
|
Information Technology: 20.24% | |
|
| Communications Equipment: 1.46% | |
| | | | |
Cisco Systems Incorporated | | | | | | | | | | | 388,766 | | | | 18,384,744 | |
| | | | | | | | | | | | | | | | |
|
| Electronic Equipment, Instruments & Components: 0.30% | |
| | | | |
Amphenol Corporation Class A | | | | | | | | | | | 42,123 | | | | 3,703,454 | |
| | | | | | | | | | | | | | | | |
|
| IT Services: 3.91% | |
| | | | |
Accenture plc Class A | | | | | | | | | | | 76,685 | | | | 11,774,982 | |
| | | | |
Cognizant Technology Solutions Corporation Class A | | | | | | | | | | | 37,346 | | | | 2,602,269 | |
| | | | |
MasterCard Incorporated Class A | | | | | | | | | | | 37,478 | | | | 7,912,730 | |
| | | | |
Total System Services Incorporated | | | | | | | | | | | 84,888 | | | | 7,606,814 | |
| | | | |
Visa Incorporated Class A | | | | | | | | | | | 142,762 | | | | 19,274,298 | |
| | | | |
| | | | | | | | | | | | | | | 49,171,093 | |
| | | | | | | | | | | | | | | | |
|
| Semiconductors & Semiconductor Equipment: 4.12% | |
| | | | |
Advanced Micro Devices Incorporated † | | | | | | | | | | | 122,902 | | | | 3,000,038 | |
| | | | |
Broadcom Incorporated | | | | | | | | | | | 26,456 | | | | 7,096,822 | |
| | | | |
Cypress Semiconductor Corporation | | | | | | | | | | | 366,242 | | | | 5,079,777 | |
| | | | |
Intel Corporation | | | | | | | | | | | 394,979 | | | | 18,611,410 | |
| | | | |
Micron Technology Incorporated † | | | | | | | | | | | 245,677 | | | | 9,389,775 | |
| | | | |
Texas Instruments Incorporated | | | | | | | | | | | 54,951 | | | | 5,532,467 | |
| | | | |
Xilinx Incorporated | | | | | | | | | | | 27,282 | | | | 3,053,947 | |
| | | | |
| | | | | | | | | | | | | | | 51,764,236 | |
| | | | | | | | | | | | | | | | |
|
| Software: 5.76% | |
| | | | |
Adobe Systems Incorporated † | | | | | | | | | | | 17,948 | | | | 4,447,873 | |
| | | | |
Fortinet Incorporated † | | | | | | | | | | | 34,586 | | | | 2,648,250 | |
| | | | |
Intuit Incorporated | | | | | | | | | | | 30,147 | | | | 6,506,326 | |
| | | | |
Microsoft Corporation | | | | | | | | | | | 480,181 | | | | 50,145,302 | |
| | | | |
Oracle Corporation | | | | | | | | | | | 110,371 | | | | 5,543,935 | |
The accompanying notes are an integral part of these financial statements.
| | | | |
| 14 | | Wells Fargo Disciplined U.S. Core Fund | | Portfolio of investments—January 31, 2019 (unaudited) |
| | | | | | | | | | | | | | | | |
| Security name | | | | | | | | Shares | | | Value | |
|
| Software(continued) | |
| | | | |
Salesforce.com Incorporated † | | | | | | | | | | | 20,605 | | | $ | 3,131,342 | |
| | | | |
| | | | | | | | | | | | | | | 72,423,028 | |
| | | | | | | | | | | | | | | | |
|
| Technology Hardware, Storage & Peripherals: 4.69% | |
| | | | |
Apple Incorporated | | | | | | | | | | | 287,613 | | | | 47,870,308 | |
| | | | |
HP Incorporated | | | | | | | | | | | 351,081 | | | | 7,734,314 | |
| | | | |
NetApp Incorporated | | | | | | | | | | | 51,239 | | | | 3,267,511 | |
| | | | |
| | | | | | | | | | | | | | | 58,872,133 | |
| | | | | | | | | | | | | | | | |
|
Materials: 2.13% | |
|
| Chemicals: 0.77% | |
| | | | |
CF Industries Holdings Incorporated | | | | | | | | | | | 60,859 | | | | 2,656,495 | |
| | | | |
LyondellBasell Industries NV Class A | | | | | | | | | | | 81,325 | | | | 7,072,835 | |
| | | | |
| | | | | | | | | | | | | | | 9,729,330 | |
| | | | | | | | | | | | | | | | |
|
| Containers & Packaging: 0.29% | |
| | | | |
Avery Dennison Corporation | | | | | | | | | | | 35,110 | | | | 3,667,240 | |
| | | | | | | | | | | | | | | | |
|
| Metals & Mining: 0.61% | |
| | | | |
Freeport-McMoRan Incorporated | | | | | | | | | | | 654,137 | | | | 7,614,155 | |
| | | | | | | | | | | | | | | | |
|
| Paper & Forest Products: 0.46% | |
| | |
Louisiana-Pacific Corporation | | | | 237,150 | | | | 5,781,717 | |
| | | | | | | | | | | | | | | | |
|
Real Estate: 4.06% | |
|
| Equity REITs: 3.43% | |
| | |
American Tower Corporation | | | | 64,119 | | | | 11,082,328 | |
| | |
Crown Castle International Corporation | | | | 79,293 | | | | 9,282,039 | |
| | |
Kimco Realty Corporation | | | | 222,262 | | | | 3,780,677 | |
| | |
Prologis Incorporated | | | | 141,994 | | | | 9,820,305 | |
| | |
Weyerhaeuser Company | | | | 345,768 | | | | 9,072,952 | |
| | | | |
| | | | | | | | | | | | | | | 43,038,301 | |
| | | | | | | | | | | | | | | | |
|
| Real Estate Management & Development: 0.63% | |
| | |
CBRE Group Incorporated Class A † | | | | 174,399 | | | | 7,978,754 | |
| | | | | | | | | | | | | | | | |
|
Utilities: 2.72% | |
|
| Electric Utilities: 1.25% | |
| | |
Exelon Corporation | | | | 187,078 | | | | 8,934,845 | |
| | |
Otter Tail Corporation | | | | 61,399 | | | | 2,974,782 | |
| | |
The Southern Company | | | | 78,533 | | | | 3,816,704 | |
| | | | |
| | | | | | | | | | | | | | | 15,726,331 | |
| | | | | | | | | | | | | | | | |
|
| Gas Utilities: 0.48% | |
| | |
UGI Corporation | | | | 106,106 | | | | 6,051,225 | |
| | | | | | | | | | | | | | | | |
|
| Multi-Utilities: 0.99% | |
| | |
CenterPoint Energy Incorporated | | | | 237,423 | | | | 7,341,115 | |
The accompanying notes are an integral part of these financial statements.
| | | | | | |
| Portfolio of investments—January 31, 2019 (unaudited) | | Wells Fargo Disciplined U.S. Core Fund | | | 15 | |
| | | | | | | | | | | | | | | | |
| Security name | | | | | | | | Shares | | | Value | |
|
| Multi-Utilities(continued) | |
| | |
DTE Energy Company | | | | 43,440 | | | $ | 5,115,060 | |
| | | | |
| | | | | | | | | | | | | | | 12,456,175 | |
| | | | | | | | | | | | | | | | |
| | | |
Total Common Stocks (Cost $986,868,646) | | | | | | | | | | | | 1,247,139,849 | |
| | | | | | | | | | | | | | | | |
| | | | |
| | | Yield | | | | | | | | | | |
| Short-Term Investments: 0.36% | | | | | | | | | | | | | |
|
| Investment Companies: 0.36% | |
| | | | |
Wells Fargo Government Money Market Fund Select Class (l)(u) | | | 2.33 | % | | | | | | | 4,483,539 | | | | 4,483,539 | |
| | | | | | | | | | | | | | | | |
| | | |
Total Short-Term Investments (Cost $4,483,539) | | | | | | | | | | | | 4,483,539 | |
| | | | | | | | | | | | | | | | |
| | | | | | | | |
| Total investments in securities (Cost $991,352,185) | | | 99.62 | % | | | 1,251,623,388 | |
| | |
Other assets and liabilities, net | | | 0.38 | | | | 4,778,622 | |
| | | | | | | | |
| Total net assets | | | 100.00 | % | | $ | 1,256,402,010 | |
| | | | | | | | |
| † | Non-income-earning security |
| (l) | The issuer of the security is an affiliated person of the Fund as defined in the Investment Company Act of 1940. |
| (u) | The rate represents the7-day annualized yield at period end. |
Abbreviations:
| REIT | Real estate investment trust |
Investments in Affiliates
An affiliated investment is an investment in which the Fund owns at least 5% of the outstanding voting shares of the issuer or as a result of other relationships, such as the Fund and the issuer having the same investment manager. Transactions with issuers that were either affiliated persons of the Fund at the beginning of the period or the end of the period were as follows:
| | | | | | | | | | | | | | | | | | | | | | | | | | | | | | | | | | | | |
| | | Shares,
beginning of
period | | | Shares
purchased | | | Shares
sold | | | Shares,
end of
period | | | Net
realized
gains
(losses) | | | Net change in
unrealized
gains (losses) | | | Income
from
affiliated
securities | | | Value,
end
of period | | | % of
net
assets | |
Short-Term Investments | | | | | | | | | | | | | | | | | | | | | | | | | | | | | | | | | | | | |
Investment Companies | | | | | | | | | | | | | | | | | | | | | | | | | | | | | | | | | | | | |
Wells Fargo Government Money Market Fund Select Class | | | 9,015,872 | | | | 152,691,959 | | | | 157,224,292 | | | | 4,483,539 | | | $ | 0 | | | $ | 0 | | | $ | 61,586 | | | $ | 4,483,539 | | | | 0.36 | % |
The accompanying notes are an integral part of these financial statements.
| | | | |
| 16 | | Wells Fargo Disciplined U.S. Core Fund | | Statement of assets and liabilities—January 31, 2019 (unaudited) |
| | | | |
| | | | |
| |
Assets | | | | |
Investments in unaffiliated securities, at value (cost $986,868,646) | | $ | 1,247,139,849 | |
Investments in affiliated securities, at value (cost $4,483,539) | | | 4,483,539 | |
Receivable for investments sold | | | 4,271,930 | |
Receivable for Fund shares sold | | | 1,762,559 | |
Receivable for dividends | | | 1,645,279 | |
Prepaid expenses and other assets | | | 222,783 | |
| | | | |
Total assets | | | 1,259,525,939 | |
| | | | |
| |
Liabilities | | | | |
Payable for Fund shares redeemed | | | 2,519,434 | |
Management fee payable | | | 347,975 | |
Administration fees payable | | | 134,341 | |
Distribution fees payable | | | 27,880 | |
Trustees’ fees and expenses payable | | | 2,567 | |
Due to custodian bank | | | 515 | |
Accrued expenses and other liabilities | | | 91,217 | |
| | | | |
Total liabilities | | | 3,123,929 | |
| | | | |
Total net assets | | $ | 1,256,402,010 | |
| | | | |
| |
NET ASSETS CONSIST OF | | | | |
Paid-in capital | | $ | 1,006,728,072 | |
Total distributable earnings | | | 249,673,938 | |
| | | | |
Total net assets | | $ | 1,256,402,010 | |
| | | | |
| |
COMPUTATION OF NET ASSET VALUE AND OFFERING PRICE PER SHARE | | | | |
Net assets – Class A | | $ | 430,062,714 | |
Shares outstanding – Class A1 | | | 27,238,689 | |
Net asset value per share – Class A | | | $15.79 | |
Maximum offering price per share – Class A2 | | | $16.75 | |
Net assets – Class C | | $ | 46,823,663 | |
Shares outstanding – Class C1 | | | 3,223,821 | |
Net asset value per share – Class C | | | $14.52 | |
Net assets – Class R | | $ | 3,011,418 | |
Shares outstanding – Class R1 | | | 188,895 | |
Net asset value per share – Class R | | | $15.94 | |
Net assets – Class R6 | | $ | 382,619,094 | |
Shares outstanding – Class R61 | | | 23,645,392 | |
Net asset value per share – Class R6 | | | $16.18 | |
Net assets – Administrator Class | | $ | 58,743,789 | |
Shares outstanding – Administrator Class1 | | | 3,615,704 | |
Net asset value per share – Administrator Class | | | $16.25 | |
Net assets – Institutional Class | | $ | 335,141,332 | |
Shares outstanding – Institutional Class1 | | | 20,927,158 | |
Net asset value per share – Institutional Class | | | $16.01 | |
| 1 | The Fund has an unlimited number of authorized shares. |
| 2 | Maximum offering price is computed as 100/94.25 of net asset value. On investments of $50,000 or more, the offering price is reduced. |
The accompanying notes are an integral part of these financial statements.
| | | | | | |
| Statement of operations—six months ended January 31, 2019 (unaudited) | | Wells Fargo Disciplined U.S. Core Fund | | | 17 | |
| | | | |
| | | | |
| |
Investment income | | | | |
Dividends (net of foreign withholding taxes of $5,575) | | $ | 15,649,285 | |
Income from affiliated securities | | | 61,586 | |
| | | | |
Total investment income | | | 15,710,871 | |
| | | | |
| |
Expenses | | | | |
Management fee | | | 2,372,321 | |
Administration fees | | | | |
Class A | | | 478,227 | |
Class C | | | 52,048 | |
Class R | | | 3,440 | |
Class R6 | | | 61,393 | |
Administrator Class | | | 50,679 | |
Institutional Class | | | 251,407 | |
Shareholder servicing fees | | | | |
Class A | | | 569,318 | |
Class C | | | 61,962 | |
Class R | | | 4,095 | |
Administrator Class | | | 96,859 | |
Distribution fees | | | | |
Class C | | | 185,886 | |
Class R | | | 4,095 | |
Custody and accounting fees | | | 30,246 | |
Professional fees | | | 26,921 | |
Registration fees | | | 55,200 | |
Shareholder report expenses | | | 59,715 | |
Trustees’ fees and expenses | | | 11,090 | |
Other fees and expenses | | | 40,376 | |
| | | | |
Total expenses | | | 4,415,278 | |
Less: Fee waivers and/or expense reimbursements | | | (54,204 | ) |
| | | | |
Net expenses | | | 4,361,074 | |
| | | | |
Net investment income | | | 11,349,797 | |
| | | | |
| |
REALIZED AND UNREALIZED GAINS (LOSSES) ON INVESTMENTS | | | | |
Net realized losses on investments | | | (10,849,257 | ) |
Net change in unrealized gains (losses) on investments | | | (68,537,957 | ) |
| | | | |
Net realized and unrealized gains (losses) on investments | | | (79,387,214 | ) |
| | | | |
Net decrease in net assets resulting from operations | | $ | (68,037,417 | ) |
| | | | |
The accompanying notes are an integral part of these financial statements.
| | | | |
| 18 | | Wells Fargo Disciplined U.S. Core Fund | | Statement of changes in net assets |
| | | | | | | | | | | | | | | | |
| | | Six months ended
January 31, 2019
(unaudited) | | | Year ended
July 31, 20181 | |
| |
Operations | | | | | |
Net investment income | | | | | | $ | 11,349,797 | | | | | | | $ | 18,267,289 | |
Net realized gains (losses) on investments | | | | | | | (10,849,257 | ) | | | | | | | 58,671,899 | |
Net change in unrealized gains (losses) on investments | | | | | | | (68,537,957 | ) | | | | | | | 83,409,567 | |
| | | | |
Net increase (decrease) in net assets resulting from operations | | | | | | | (68,037,417 | ) | | | | | | | 160,348,755 | |
| | | | |
| | | |
Distributions to shareholders from net investment income and net realized gains | | | | | | | | | | | | |
Class A | | | | | | | (27,282,105 | ) | | | | | | | (20,704,762 | ) |
Class C | | | | | | | (2,771,228 | ) | | | | | | | (2,046,966 | ) |
Class R | | | | | | | (201,547 | ) | | | | | | | (86,235 | ) |
Class R6 | | | | | | | (25,476,362 | ) | | | | | | | (10,400,864 | ) |
Administrator Class | | | | | | | (3,946,556 | ) | | | | | | | (4,178,646 | ) |
Institutional Class | | | | | | | (24,186,334 | ) | | | | | | | (18,508,153 | ) |
| | | | |
Total distributions to shareholders | | | | | | | (83,864,132 | ) | | | | | | | (55,926,626 | ) |
| | | | |
| | | | |
Capital share transactions | | | Shares | | | | | | | | Shares | | | | | |
Proceeds from shares sold | |
Class A | | | 1,133,921 | | | | 18,565,288 | | | | 3,025,519 | | | | 51,764,763 | |
Class C | | | 423,926 | | | | 6,135,011 | | | | 374,010 | | | | 5,918,031 | |
Class R | | | 13,300 | | | | 228,771 | | | | 106,436 | | | | 1,833,037 | |
Class R6 | | | 2,744,398 | | | | 43,118,288 | | | | 31,753,862 | | | | 558,773,061 | |
Administrator Class | | | 239,895 | | | | 4,099,451 | | | | 801,468 | | | | 14,055,574 | |
Institutional Class | | | 3,245,754 | | | | 55,710,559 | | | | 9,147,678 | | | | 158,493,564 | |
| | | | |
| | | | |
| | | | | | | 127,857,368 | | | | | | | | 790,838,030 | |
| | | | |
| | |
Reinvestment of distributions | | | | | | | | |
Class A | | | 1,648,190 | | | | 25,532,516 | | | | 1,131,935 | | | | 19,445,471 | |
Class C | | | 177,775 | | | | 2,524,825 | | | | 117,892 | | | | 1,860,460 | |
Class R | | | 12,744 | | | | 199,335 | | | | 4,876 | | | | 84,764 | |
Class R6 | | | 1,506,629 | | | | 23,955,923 | | | | 589,809 | | | | 10,399,263 | |
Administrator Class | | | 235,868 | | | | 3,758,071 | | | | 230,133 | | | | 4,058,515 | |
Institutional Class | | | 1,264,383 | | | | 19,892,703 | | | | 851,853 | | | | 14,861,788 | |
| | | | |
| | | | |
| | | | | | | 75,863,373 | | | | | | | | 50,710,261 | |
| | | | |
| | |
Payment for shares redeemed | | | | | | | | |
Class A | | | (2,697,692 | ) | | | (44,905,060 | ) | | | (5,686,039 | ) | | | (97,150,526 | ) |
Class C | | | (610,781 | ) | | | (9,023,660 | ) | | | (852,666 | ) | | | (13,443,380 | ) |
Class R | | | (21,620 | ) | | | (332,190 | ) | | | (48,086 | ) | | | (836,247 | ) |
Class R6 | | | (5,136,299 | ) | | | (86,368,650 | ) | | | (10,312,522 | ) | | | (185,383,377 | ) |
Administrator Class | | | (2,036,223 | ) | | | (35,432,152 | ) | | | (1,497,144 | ) | | | (26,145,921 | ) |
Institutional Class | | | (6,497,757 | ) | | | (107,626,453 | ) | | | (8,454,555 | ) | | | (147,923,158 | ) |
| | | | |
| | | | |
| | | | | | | (283,688,165 | ) | | | | | | | (470,882,609 | ) |
| | | | |
Net increase (decrease) in net assets resulting from capital share transactions | | | | | | | (79,967,424 | ) | | | | | | | 370,665,682 | |
| | | | |
Total increase (decrease) in net assets | | | | | | | (231,868,973 | ) | | | | | | | 475,088,811 | |
| | | | |
| | |
Net assets | | | | | | | | |
Beginning of period | | | | | | | 1,488,270,983 | | | | | | | | 1,013,182,172 | |
| | | | |
End of period | | | | | | $ | 1,256,402,010 | | | | | | | $ | 1,488,270,983 | |
| | | | |
| 1 | Effective for all filings after November 4, 2018, the SEC prospectively eliminated the requirement to parenthetically disclose undistributed net investment income at the end of the period and permitted the aggregation of distributions, with the exception of tax basis returns of capital. Undistributed net investment income at July 31, 2018 was $18,219,041. The disaggregated distributions information for the year ended July 31, 2018 is included in Note 7,Distributions to Shareholders, in the notes to the financial statements. |
The accompanying notes are an integral part of these financial statements.
| | | | | | |
| Financial highlights | | Wells Fargo Disciplined U.S. Core Fund | | | 19 | |
(For a share outstanding throughout each period)
| | | | | | | | | | | | | | | | | | | | | | | | |
| | | Six months ended January 31, 2019 (unaudited) | | | Year ended July 31 | |
| CLASS A | | 2018 | | | 2017 | | | 2016 | | | 2015 | | | 2014 | |
Net asset value, beginning of period | | | $17.70 | | | | $16.30 | | | | $14.50 | | | | $15.45 | | | | $16.29 | | | | $16.27 | |
Net investment income | | | 0.12 | | | | 0.24 | | | | 0.22 | | | | 0.21 | | | | 0.21 | | | | 0.19 | |
Net realized and unrealized gains (losses) on investments | | | (0.99 | ) | | | 1.90 | | | | 1.94 | | | | 0.47 | | | | 1.60 | | | | 2.35 | |
| | | | | | | | | | | | | | | | | | | | | | | | |
Total from investment operations | | | (0.87 | ) | | | 2.14 | | | | 2.16 | | | | 0.68 | | | | 1.81 | | | | 2.54 | |
Distributions to shareholders from | | | | | | | | | | | | | | | | | | | | | | | | |
Net investment income | | | (0.19 | ) | | | (0.15 | ) | | | (0.15 | ) | | | (0.19 | ) | | | (0.16 | ) | | | (0.24 | ) |
Net realized gains | | | (0.85 | ) | | | (0.59 | ) | | | (0.21 | ) | | | (1.44 | ) | | | (2.49 | ) | | | (2.28 | ) |
| | | | | | | | | | | | | | | | | | | | | | | | |
Total distributions to shareholders | | | (1.04 | ) | | | (0.74 | ) | | | (0.36 | ) | | | (1.63 | ) | | | (2.65 | ) | | | (2.52 | ) |
Net asset value, end of period | | | $15.79 | | | | $17.70 | | | | $16.30 | | | | $14.50 | | | | $15.45 | | | | $16.29 | |
Total return1 | | | (4.74 | )% | | | 13.28 | % | | | 15.12 | % | | | 5.22 | % | | | 12.01 | % | | | 17.00 | % |
Ratios to average net assets (annualized) | | | | | | | | | | | | | | | | | | | | | | | | |
Gross expenses | | | 0.84 | % | | | 0.83 | % | | | 0.85 | % | | | 0.87 | % | | | 0.89 | % | | | 0.93 | % |
Net expenses | | | 0.84 | % | | | 0.83 | % | | | 0.85 | % | | | 0.87 | % | | | 0.89 | % | | | 0.92 | % |
Net investment income | | | 1.44 | % | | | 1.33 | % | | | 1.45 | % | | | 1.60 | % | | | 1.43 | % | | | 1.27 | % |
Supplemental data | | | | | | | | | | | | | | | | | | | | | | | | |
Portfolio turnover rate | | | 30 | % | | | 73 | % | | | 60 | % | | | 52 | % | | | 53 | % | | | 71 | % |
Net assets, end of period (000s omitted) | | | $430,063 | | | | $480,602 | | | | $467,491 | | | | $412,629 | | | | $331,123 | | | | $305,577 | |
| 1 | Total return calculations do not include any sales charges. Returns for periods of less than one year are not annualized. |
The accompanying notes are an integral part of these financial statements.
| | | | |
| 20 | | Wells Fargo Disciplined U.S. Core Fund | | Financial highlights |
(For a share outstanding throughout each period)
| | | | | | | | | | | | | | | | | | | | | | | | |
| | | Six months ended January 31, 2019 (unaudited) | | | Year ended July 31 | |
| CLASS C | | 2018 | | | 2017 | | | 2016 | | | 2015 | | | 2014 | |
Net asset value, beginning of period | | | $16.28 | | | | $15.04 | | | | $13.45 | | | | $14.50 | | | | $15.47 | | | | $15.58 | |
Net investment income | | | 0.05 | | | | 0.09 | | | | 0.10 | | | | 0.14 | | | | 0.13 | | | | 0.08 | |
Net realized and unrealized gains (losses) on investments | | | (0.91 | ) | | | 1.76 | | | | 1.79 | | | | 0.38 | | | | 1.48 | | | | 2.23 | |
| | | | | | | | | | | | | | | | | | | | | | | | |
Total from investment operations | | | (0.86 | ) | | | 1.85 | | | | 1.89 | | | | 0.52 | | | | 1.61 | | | | 2.31 | |
Distributions to shareholders from | | | | | | | | | | | | | | | | | | | | | | | | |
Net investment income | | | (0.05 | ) | | | (0.02 | ) | | | (0.09 | ) | | | (0.13 | ) | | | (0.09 | ) | | | (0.14 | ) |
Net realized gains | | | (0.85 | ) | | | (0.59 | ) | | | (0.21 | ) | | | (1.44 | ) | | | (2.49 | ) | | | (2.28 | ) |
| | | | | | | | | | | | | | | | | | | | | | | | |
Total distributions to shareholders | | | (0.90 | ) | | | (0.61 | ) | | | (0.30 | ) | | | (1.57 | ) | | | (2.58 | ) | | | (2.42 | ) |
Net asset value, end of period | | | $14.52 | | | | $16.28 | | | | $15.04 | | | | $13.45 | | | | $14.50 | | | | $15.47 | |
Total return1 | | | (5.10 | )% | | | 12.41 | % | | | 14.27 | % | | | 4.43 | % | | | 11.18 | % | | | 16.10 | % |
Ratios to average net assets (annualized) | | | | | | | | | | | | | | | | | | | | | | | | |
Gross expenses | | | 1.59 | % | | | 1.58 | % | | | 1.60 | % | | | 1.62 | % | | | 1.64 | % | | | 1.68 | % |
Net expenses | | | 1.59 | % | | | 1.58 | % | | | 1.60 | % | | | 1.62 | % | | | 1.64 | % | | | 1.67 | % |
Net investment income | | | 0.69 | % | | | 0.58 | % | | | 0.69 | % | | | 0.82 | % | | | 0.66 | % | | | 0.51 | % |
Supplemental data | | | | | | | | | | | | | | | | | | | | | | | | |
Portfolio turnover rate | | | 30 | % | | | 73 | % | | | 60 | % | | | 52 | % | | | 53 | % | | | 71 | % |
Net assets, end of period (000s omitted) | | | $46,824 | | | | $52,647 | | | | $54,054 | | | | $46,801 | | | | $20,680 | | | | $10,913 | |
| 1 | Total return calculations do not include any sales charges. Returns for periods of less than one year are not annualized. |
The accompanying notes are an integral part of these financial statements.
| | | | | | |
| Financial highlights | | Wells Fargo Disciplined U.S. Core Fund | | | 21 | |
(For a share outstanding throughout each period)
| | | | | | | | | | | | | | | | |
| | | Six months ended
January 31, 2019
(unaudited) | | | Year ended July 31 | |
| CLASS R | | 2018 | | | 2017 | | | 20161 | |
Net asset value, beginning of period | | | $17.88 | | | | $16.51 | | | | $14.77 | | | | $14.62 | |
Net investment income | | | 0.10 | 2 | | | 0.18 | 2 | | | 0.17 | 2 | | | 0.13 | 2 |
Net realized and unrealized gains (losses) on investments | | | (1.00 | ) | | | 1.94 | | | | 1.99 | | | | 1.72 | |
| | | | | | | | | | | | | | | | |
Total from investment operations | | | (0.90 | ) | | | 2.12 | | | | 2.16 | | | | 1.85 | |
Distributions to shareholders from | | | | | | | | | | | | | | | | |
Net investment income | | | (0.19 | ) | | | (0.16 | ) | | | (0.21 | ) | | | (0.26 | ) |
Net realized gains | | | (0.85 | ) | | | (0.59 | ) | | | (0.21 | ) | | | (1.44 | ) |
| | | | | | | | | | | | | | | | |
Total distributions to shareholders | | | (1.04 | ) | | | (0.75 | ) | | | (0.42 | ) | | | (1.70 | ) |
Net asset value, end of period | | | $15.94 | | | | $17.88 | | | | $16.51 | | | | $14.77 | |
Total return3 | | | (4.88 | )% | | | 12.97 | % | | | 14.86 | % | | | 13.56 | % |
Ratios to average net assets (annualized) | | | | | | | | | | | | | | | | |
Gross expenses | | | 1.09 | % | | | 1.08 | % | | | 1.10 | % | | | 1.12 | % |
Net expenses | | | 1.09 | % | | | 1.08 | % | | | 1.10 | % | | | 1.12 | % |
Net investment income | | | 1.19 | % | | | 1.04 | % | | | 1.10 | % | | | 1.12 | % |
Supplemental data | | | | | | | | | | | | | | | | |
Portfolio turnover rate | | | 30 | % | | | 73 | % | | | 60 | % | | | 52 | % |
Net assets, end of period (000s omitted) | | | $3,011 | | | | $3,298 | | | | $2,001 | | | | $201 | |
| 1 | For the period from September 30, 2015 (commencement of class operations) to July 31, 2016 |
| 2 | Calculated based upon average shares outstanding |
| 3 | Returns for periods of less than one year are not annualized. |
The accompanying notes are an integral part of these financial statements.
| | | | |
| 22 | | Wells Fargo Disciplined U.S. Core Fund | | Financial highlights |
(For a share outstanding throughout each period)
| | | | | | | | | | | | | | | | |
| | | Six months ended
January 31, 2019
(unaudited) | | | Year ended July 31 | |
| CLASS R6 | | 2018 | | | 2017 | | | 20161 | |
Net asset value, beginning of period | | | $18.17 | | | | $16.71 | | | | $14.86 | | | | $14.62 | |
Net investment income | | | 0.19 | | | | 0.30 | 2 | | | 0.28 | 2 | | | 0.22 | 2 |
Net realized and unrealized gains (losses) on investments | | | (1.05 | ) | | | 1.97 | | | | 1.99 | | | | 1.72 | |
| | | | | | | | | | | | | | | | |
Total from investment operations | | | (0.86 | ) | | | 2.27 | | | | 2.27 | | | | 1.94 | |
Distributions to shareholders from | | | | | | | | | | | | | | | | |
Net investment income | | | (0.28 | ) | | | (0.22 | ) | | | (0.21 | ) | | | (0.26 | ) |
Net realized gains | | | (0.85 | ) | | | (0.59 | ) | | | (0.21 | ) | | | (1.44 | ) |
| | | | | | | | | | | | | | | | |
Total distributions to shareholders | | | (1.13 | ) | | | (0.81 | ) | | | (0.42 | ) | | | (1.70 | ) |
Net asset value, end of period | | | $16.18 | | | | $18.17 | | | | $16.71 | | | | $14.86 | |
Total return3 | | | (4.55 | )% | | | 13.78 | % | | | 15.56 | % | | | 14.24 | % |
Ratios to average net assets (annualized) | | | | | | | | | | | | | | | | |
Gross expenses | | | 0.41 | % | | | 0.40 | % | | | 0.42 | % | | | 0.44 | % |
Net expenses | | | 0.41 | % | | | 0.40 | % | | | 0.42 | % | | | 0.43 | % |
Net investment income | | | 1.87 | % | | | 1.71 | % | | | 1.77 | % | | | 1.88 | % |
Supplemental data | | | | | | | | | | | | | | | | |
Portfolio turnover rate | | | 30 | % | | | 73 | % | | | 60 | % | | | 52 | % |
Net assets, end of period (000s omitted) | | | $382,619 | | | | $445,678 | | | | $41,770 | | | | $4,024 | |
| 1 | For the period from September 30, 2015 (commencement of class operations) to July 31, 2016 |
| 2 | Calculated based upon average shares outstanding |
| 3 | Returns for periods of less than one year are not annualized. |
The accompanying notes are an integral part of these financial statements.
| | | | | | |
| Financial highlights | | Wells Fargo Disciplined U.S. Core Fund | | | 23 | |
(For a share outstanding throughout each period)
| | | | | | | | | | | | | | | | | | | | | | | | |
| | | Six months ended January 31, 2019 (unaudited) | | | Year ended July 31 | |
| ADMINISTRATOR CLASS | | 2018 | | | 2017 | | | 2016 | | | 2015 | | | 2014 | |
Net asset value, beginning of period | | | $18.17 | | | | $16.71 | | | | $14.85 | | | | $15.80 | | | | $16.60 | | | | $16.47 | |
Net investment income | | | 0.14 | 1 | | | 0.25 | 1 | | | 0.25 | 1 | | | 0.24 | 1 | | | 0.25 | 1 | | | 0.25 | 1 |
Net realized and unrealized gains (losses) on investments | | | (1.02 | ) | | | 1.97 | | | | 1.98 | | | | 0.48 | | | | 1.63 | | | | 2.35 | |
| | | | | | | | | | | | | | | | | | | | | | | | |
Total from investment operations | | | (0.88 | ) | | | 2.22 | | | | 2.23 | | | | 0.72 | | | | 1.88 | | | | 2.60 | |
Distributions to shareholders from | | | | | | | | | | | | | | | | | | | | | | | | |
Net investment income | | | (0.19 | ) | | | (0.17 | ) | | | (0.16 | ) | | | (0.23 | ) | | | (0.19 | ) | | | (0.19 | ) |
Net realized gains | | | (0.85 | ) | | | (0.59 | ) | | | (0.21 | ) | | | (1.44 | ) | | | (2.49 | ) | | | (2.28 | ) |
| | | | | | | | | | | | | | | | | | | | | | | | |
Total distributions to shareholders | | | (1.04 | ) | | | (0.76 | ) | | | (0.37 | ) | | | (1.67 | ) | | | (2.68 | ) | | | (2.47 | ) |
Net asset value, end of period | | | $16.25 | | | | $18.17 | | | | $16.71 | | | | $14.85 | | | | $15.80 | | | | $16.60 | |
Total return2 | | | (4.66 | )% | | | 13.40 | % | | | 15.24 | % | | | 5.36 | % | | | 12.20 | % | | | 17.12 | % |
Ratios to average net assets (annualized) | | | | | | | | | | | | | | | | | | | | | | | | |
Gross expenses | | | 0.75 | % | | | 0.75 | % | | | 0.77 | % | | | 0.78 | % | | | 0.74 | % | | | 0.76 | % |
Net expenses | | | 0.74 | % | | | 0.74 | % | | | 0.74 | % | | | 0.74 | % | | | 0.73 | % | | | 0.74 | % |
Net investment income | | | 1.53 | % | | | 1.42 | % | | | 1.60 | % | | | 1.71 | % | | | 1.58 | % | | | 1.56 | % |
Supplemental data | | | | | | | | | | | | | | | | | | | | | | | | |
Portfolio turnover rate | | | 30 | % | | | 73 | % | | | 60 | % | | | 52 | % | | | 53 | % | | | 71 | % |
Net assets, end of period (000s omitted) | | | $58,744 | | | | $94,058 | | | | $94,294 | | | | $116,807 | | | | $63,544 | | | | $50,498 | |
| 1 | Calculated based upon average shares outstanding |
| 2 | Returns for periods of less than one year are not annualized. |
The accompanying notes are an integral part of these financial statements.
| | | | |
| 24 | | Wells Fargo Disciplined U.S. Core Fund | | Financial highlights |
(For a share outstanding throughout each period)
| | | | | | | | | | | | | | | | | | | | | | | | |
| | | Six months ended
January 31, 2019 (unaudited) | | | Year ended July 31 | |
| INSTITUTIONAL CLASS | | 2018 | | | 2017 | | | 2016 | | | 2015 | | | 2014 | |
Net asset value, beginning of period | | | $17.98 | | | | $16.55 | | | | $14.72 | | | | $15.66 | | | | $16.47 | | | | $16.43 | |
Net investment income | | | 0.16 | | | | 0.28 | | | | 0.27 | 1 | | | 0.28 | 1 | | | 0.30 | | | | 0.26 | 1 |
Net realized and unrealized gains (losses) on investments | | | (1.02 | ) | | | 1.95 | | | | 1.98 | | | | 0.47 | | | | 1.61 | | | | 2.37 | |
| | | | | | | | | | | | | | | | | | | | | | | | |
Total from investment operations | | | (0.86 | ) | | | 2.23 | | | | 2.25 | | | | 0.75 | | | | 1.91 | | | | 2.63 | |
Distributions to shareholders from | | | | | | | | | | | | | | | | | | | | | | | | |
Net investment income | | | (0.26 | ) | | | (0.21 | ) | | | (0.21 | ) | | | (0.25 | ) | | | (0.23 | ) | | | (0.31 | ) |
Net realized gains | | | (0.85 | ) | | | (0.59 | ) | | | (0.21 | ) | | | (1.44 | ) | | | (2.49 | ) | | | (2.28 | ) |
| | | | | | | | | | | | | | | | | | | | | | | | |
Total distributions to shareholders | | | (1.11 | ) | | | (0.80 | ) | | | (0.42 | ) | | | (1.69 | ) | | | (2.72 | ) | | | (2.59 | ) |
Net asset value, end of period | | | $16.01 | | | | $17.98 | | | | $16.55 | | | | $14.72 | | | | $15.66 | | | | $16.47 | |
Total return2 | | | (4.60 | )% | | | 13.65 | % | | | 15.51 | % | | | 5.64 | % | | | 12.55 | % | | | 17.48 | % |
Ratios to average net assets (annualized) | | | | | | | | | | | | | | | | | | | | | | | | |
Gross expenses | | | 0.51 | % | | | 0.50 | % | | | 0.52 | % | | | 0.54 | % | | | 0.47 | % | | | 0.50 | % |
Net expenses | | | 0.48 | % | | | 0.48 | % | | | 0.48 | % | | | 0.48 | % | | | 0.47 | % | | | 0.48 | % |
Net investment income | | | 1.80 | % | | | 1.67 | % | | | 1.76 | % | | | 1.96 | % | | | 1.86 | % | | | 1.63 | % |
Supplemental data | | | | | | | | | | | | | | | | | | | | | | | | |
Portfolio turnover rate | | | 30 | % | | | 73 | % | | | 60 | % | | | 52 | % | | | 53 | % | | | 71 | % |
Net assets, end of period (000s omitted) | | | $335,141 | | | | $411,988 | | | | $353,573 | | | | $163,674 | | | | $109,901 | | | | $91,144 | |
| 1 | Calculated based upon average shares outstanding |
| 2 | Returns for periods of less than one year are not annualized. |
The accompanying notes are an integral part of these financial statements.
| | | | | | |
| Notes to financial statements (unaudited) | | Wells Fargo Disciplined U.S. Core Fund | | | 25 | |
1. ORGANIZATION
Wells Fargo Funds Trust (the “Trust”), a Delaware statutory trust organized on March 10, 1999, is anopen-end management investment company registered under the Investment Company Act of 1940, as amended (the “1940 Act”). As an investment company, the Trust follows the accounting and reporting guidance in Financial Accounting Standards Board (“FASB”)Accounting Standards Codification Topic 946, Financial Services – Investment Companies. These financial statements report on the Wells Fargo Disciplined U.S. Core Fund (the “Fund”) which is a diversified series of the Trust.
2. SIGNIFICANT ACCOUNTING POLICIES
The following significant accounting policies, which are consistently followed in the preparation of the financial statements of the Fund, are in conformity with U.S. generally accepted accounting principles which require management to make estimates and assumptions that affect the reported amounts of assets and liabilities, disclosure of contingent assets and liabilities at the date of the financial statements, and the reported amounts of revenues and expenses during the reporting period. Actual results could differ from those estimates.
Securities valuation
All investments are valued each business day as of the close of regular trading on the New York Stock Exchange (generally 4 p.m. Eastern Time), although the Fund may deviate from this calculation time under unusual or unexpected circumstances.
Equity securities that are listed on a foreign or domestic exchange or market are valued at the official closing price or, if none, the last sales price. If no sale occurs on the principal exchange or market that day, a fair value price will be determined in accordance with the Fund’s Valuation Procedures.
Investments in registeredopen-end investment companies are valued at net asset value. Interests innon-registered investment companies that are redeemable at net asset value are fair valued normally at net asset value.
Investments which are not valued using any of the methods discussed above are valued at their fair value, as determined in good faith by the Board of Trustees of the Fund. The Board of Trustees has established a Valuation Committee comprised of the Trustees and has delegated to it the authority to take any actions regarding the valuation of portfolio securities that the Valuation Committee deems necessary or appropriate, including determining the fair value of portfolio securities, unless the determination has been delegated to the Wells Fargo Asset Management Pricing Committee at Wells Fargo Funds Management, LLC (“Funds Management”). The Board of Trustees retains the authority to make or ratify any valuation decisions or approve any changes to the Valuation Procedures as it deems appropriate. On a quarterly basis, the Board of Trustees receives reports on any valuation actions taken by the Valuation Committee or the Wells Fargo Asset Management Pricing Committee which may include items for ratification.
Securities lending
The Fund may lend its securities from time to time in order to earn additional income in the form of fees or interest on securities received as collateral or the investment of any cash received as collateral. The Fund continues to receive interest or dividends on the securities loaned. The Fund receives collateral in the form of cash or securities with a value at least equal to the value of the securities on loan. The value of the loaned securities is determined at the close of each business day and any additional required collateral is delivered to the Fund on the next business day. In a securities lending transaction, the net asset value of the Fund will be affected by an increase or decrease in the value of the securities loaned and by an increase or decrease in the value of the instrument in which collateral is invested. The amount of securities lending activity undertaken by the Fund fluctuates from time to time. In the event of default or bankruptcy by the borrower, the Fund may be prevented from recovering the loaned securities or gaining access to the collateral or may experience delays or costs in doing so. In addition, the investment of any cash collateral received may lose all or part of its value. The Fund has the right under the lending agreement to recover the securities from the borrower on demand.
The Fund lends its securities through an unaffiliated securities lending agent. Cash collateral received in connection with its securities lending transactions is invested in Securities Lending Cash Investments, LLC (the “Securities Lending Fund”). The Securities Lending Fund is exempt from registration under Section 3(c)(7) of the 1940 Act and is managed by Funds Management and is subadvised by Wells Capital Management Incorporated (“WellsCap”), an affiliate of Funds Management and an indirect wholly owned subsidiary of Wells Fargo & Company (“Wells Fargo”). Funds Management receives an advisory fee starting at 0.05% and declining to 0.01% as the average daily net assets of the Securities Lending Fund increase. All of the fees received by Funds Management are paid to WellsCap for its services as subadviser. The Securities Lending Fund seeks to provide a positive return compared to the daily Fed Funds Open Rate by investing in high-quality, U.S. dollar-denominated short-term money market instruments. Securities Lending Fund investments are
| | | | |
| 26 | | Wells Fargo Disciplined U.S. Core Fund | | Notes to financial statements (unaudited) |
valued at the evaluated bid price provided by an independent pricing service. Income earned from investment in the Securities Lending Fund (net of fees and rebates), if any, is included in income from affiliated securities on the Statement of Operations
Security transactions and income recognition
Securities transactions are recorded on a trade date basis. Realized gains or losses are recorded on the basis of identified cost.
Dividend income is recognized on theex-dividend date. Dividend income is recorded net of foreign taxes withheld where recovery of such taxes is not assured.
Distributions to shareholders
Distributions to shareholders from net investment income and any net realized gains are recorded on theex-dividend date and paid at least annually. Such distributions are determined in accordance with income tax regulations and may differ from U.S. generally accepted accounting principles. Dividend sources are estimated at the time of declaration. The tax character of distributions is determined as of the Fund’s fiscal year end. Therefore, a portion of the Fund’s distributions made prior to the Fund’s fiscal year end may be categorized as a tax return of capital at year end.
Federal and other taxes
The Fund intends to continue to qualify as a regulated investment company by distributing substantially all of its investment company taxable income and any net realized capital gains (after reduction for capital loss carryforwards) sufficient to relieve it from all, or substantially all, federal income taxes. Accordingly, no provision for federal income taxes was required.
The Fund’s income and federal excise tax returns and all financial records supporting those returns for the prior three fiscal years are subject to examination by the federal and Delaware revenue authorities. Management has analyzed the Fund’s tax positions taken on federal, state, and foreign tax returns for all open tax years and does not believe that there are any uncertain tax positions that require recognition of a tax liability.
As of January 31, 2019, the aggregate cost of all investments for federal income tax purposes was $990,492,785 and the unrealized gains (losses) consisted of:
| | | | |
| |
Gross unrealized gains | | $ | 287,923,883 | |
| |
Gross unrealized losses | | | (26,793,280 | ) |
| |
Net unrealized gains | | $ | 261,130,603 | |
Class allocations
The separate classes of shares offered by the Fund differ principally in applicable sales charges, distribution, shareholder servicing, and administration fees. Class specific expenses are charged directly to that share class. Investment income, common expenses, and realized and unrealized gains (losses) on investments are allocated daily to each class of shares based on the relative proportion of net assets of each class.
3. FAIR VALUATION MEASUREMENTS
Fair value measurements of investments are determined within a framework that has established a fair value hierarchy based upon the various data inputs utilized in determining the value of the Fund’s investments. The three-level hierarchy gives the highest priority to unadjusted quoted prices in active markets for identical assets or liabilities (Level 1) and the lowest priority to unobservable inputs (Level 3). The Fund’s investments are classified within the fair value hierarchy based on the lowest level of input that is significant to the fair value measurement. The inputs are summarized into three broad levels as follows:
| ∎ | | Level 1 – quoted prices in active markets for identical securities |
| ∎ | | Level 2 – other significant observable inputs (including quoted prices for similar securities, interest rates, prepayment speeds, credit risk, etc.) |
| ∎ | | Level 3 – significant unobservable inputs (including the Fund’s own assumptions in determining the fair value of investments) |
The inputs or methodologies used for valuing investments in securities are not necessarily an indication of the risk associated with investing in those securities.
| | | | | | |
| Notes to financial statements (unaudited) | | Wells Fargo Disciplined U.S. Core Fund | | | 27 | |
The following is a summary of the inputs used in valuing the Fund’s assets and liabilities as of January 31, 2019:
| | | | | | | | | | | | | | | | |
| | | | |
| | | Quoted prices
(Level 1) | | | Other significant
observable inputs
(Level 2) | | | Significant
unobservable inputs
(Level 3) | | | Total | |
| | | | |
Assets | | | | | | | | | | | | | | | | |
Investments in: | | | | | | | | | | | | | | | | |
| | | | |
Common stocks | | | | | | | | | | | | | | | | |
| | | | |
Communication services | | $ | 120,478,607 | | | $ | 0 | | | $ | 0 | | | $ | 120,478,607 | |
| | | | |
Consumer discretionary | | | 123,214,696 | | | | 0 | | | | 0 | | | | 123,214,696 | |
| | | | |
Consumer staples | | | 82,338,610 | | | | 0 | | | | 0 | | | | 82,338,610 | |
| | | | |
Energy | | | 80,006,776 | | | | 0 | | | | 0 | | | | 80,006,776 | |
| | | | |
Financials | | | 170,718,209 | | | | 0 | | | | 0 | | | | 170,718,209 | |
| | | | |
Health care | | | 197,719,629 | | | | 0 | | | | 0 | | | | 197,719,629 | |
| | | | |
Industrials | | | 106,301,406 | | | | 0 | | | | 0 | | | | 106,301,406 | |
| | | | |
Information technology | | | 254,318,688 | | | | 0 | | | | 0 | | | | 254,318,688 | |
| | | | |
Materials | | | 26,792,442 | | | | 0 | | | | 0 | | | | 26,792,442 | |
| | | | |
Real estate | | | 51,017,055 | | | | 0 | | | | 0 | | | | 51,017,055 | |
| | | | |
Utilities | | | 34,233,731 | | | | 0 | | | | 0 | | | | 34,233,731 | |
| | | | |
Short-term investments | | | | | | | | | | | | | | | | |
| | | | |
Investment companies | | | 4,483,539 | | | | 0 | | | | 0 | | | | 4,483,539 | |
| | | | |
Total assets | | $ | 1,251,623,388 | | | $ | 0 | | | $ | 0 | | | $ | 1,251,623,388 | |
Additional sector, industry or geographic detail is included in the Portfolio of Investments.
At January 31, 2019, the Fund did not have any transfers into/out of Level 3.
4. TRANSACTIONS WITH AFFILIATES
Management fee
Funds Management, an indirect wholly owned subsidiary of Wells Fargo, is the manager of the Fund and provides advisory and fund-level administrative services under an investment management agreement. Under the investment management agreement, Funds Management is responsible for, among other services, implementing the investment objectives and strategies of the Fund, supervising the subadviser and providing fund-level administrative services in connection with the Fund’s operations. As compensation for its services under the investment management agreement, Funds Management is entitled to receive an annual management fee starting at 0.35% and declining to 0.28% as the average daily net assets of the Fund increase. For the six months ended January 31, 2019, the management fee was equivalent to an annual rate of 0.34% of the Fund’s average daily net assets.
Funds Management has retained the services of a subadviser to provide daily portfolio management to the Fund. The fee for subadvisory services is borne by Funds Management. WellsCap is the subadviser to the Fund and is entitled to receive a fee from Funds Management at an annual rate starting at 0.25% and declining to 0.15% as the average daily net assets of the Fund increase.
Administration fees
Under a class-level administration agreement, Funds Management provides class-level administrative services to the Fund, which includes paying fees and expenses for services provided by the transfer agent,sub-transfer agents, omnibus account servicers and record-keepers. As compensation for its services under the class-level administration agreement, Funds Management receives an annual fee which is calculated based on the average daily net assets of each class as follows:
| | | | |
| | | Class-level
administration fee | |
| |
Class A, Class C, Class R | | | 0.21 | % |
| |
Class R6 | | | 0.03 | |
| |
Administrator Class, Institutional Class | | | 0.13 | |
| | | | |
| 28 | | Wells Fargo Disciplined U.S. Core Fund | | Notes to financial statements (unaudited) |
Funds Management has contractually waived and/or reimbursed management and administration fees to the extent necessary to maintain certain net operating expense ratios for the Fund. When each class of the Fund has exceeded its expense cap, Funds Management has waived fees and/or reimbursed expenses from fund level expenses on a proportionate basis and then from class specific expenses; otherwise, waivers and/or reimbursements are applied against class specific expenses before fund level expenses. Funds Management has committed through November 30, 2019 to waive fees and/or reimburse expenses to the extent necessary to cap the Fund’s expenses at 0.87% for Class A shares, 1.62% for Class C shares, 1.12% for Class R shares, 0.43% for Class R6 shares, 0.74% for Administrator Class, and 0.48% for Institutional Class shares. Prior to or after the commitment expiration date, the cap may be increased or the commitment to maintain the cap may be terminated only with the approval of the Board of Trustees.
Distribution fees
The Trust has adopted a distribution plan for Class C and Class R shares of the Fund pursuant to Rule12b-1 under the 1940 Act. Distribution fees are charged to Class C and Class R shares and paid to Wells Fargo Funds Distributor, LLC (“Funds Distributor”), the principal underwriter, at an annual rate of 0.75% of the average daily net assets of Class C shares and 0.25% of the average daily net assets of Class R shares.
In addition, Funds Distributor is entitled to receive thefront-end sales charge from the purchase of Class A shares and a contingent deferred sales charge on the redemption of certain Class A shares. Funds Distributor is also entitled to receive the contingent deferred sales charges from redemptions of Class C shares. For the six months ended January 31, 2019, Funds Distributor received $6,136 from the sale of Class A shares and $31 in contingent deferred sales charges from redemptions of Class C shares. No contingent deferred sales charges were incurred by Class A shares for the six months ended January 31, 2019.
Shareholder servicing fees
The Trust has entered into contracts with one or more shareholder servicing agents, whereby Class A, Class C, Class R, and Administrator Class of the Fund are charged a fee at an annual rate of 0.25% of the average daily net assets of each respective class. A portion of these total shareholder servicing fees were paid to affiliates of Wells Fargo.
A portion of these total shareholder servicing fees were paid to affiliates of Wells Fargo.
Interfund transactions
The Fund may purchase or sell portfolio investment securities to certain other Wells Fargo affiliates pursuant to Rule17a-7 under the 1940 Act and under procedures adopted by the Board of Trustees. The procedures have been designed to ensure that these interfund transactions, which do not incur broker commissions, are effected at current market prices.
5. INVESTMENT PORTFOLIO TRANSACTIONS
Purchases and sales of investments, excluding U.S. government obligations (if any) and short-term securities, for the six months ended January 31, 2019 were $411,337,078 and $565,246,170, respectively.
6. BANK BORROWINGS
The Trust (excluding the money market funds), Wells Fargo Master Trust and Wells Fargo Variable Trust are parties to a $280,000,000 revolving credit agreement whereby the Fund is permitted to use bank borrowings for temporary or emergency purposes, such as to fund shareholder redemption requests. Interest under the credit agreement is charged to the Fund based on a borrowing rate equal to the higher of the Federal Funds rate in effect on that day plus 1.25% or the overnight LIBOR rate in effect on that day plus 1.25%. In addition, an annual commitment fee equal to 0.25% of the unused balance is allocated to each participating fund.
For the six months ended January 31, 2019, there were no borrowings by the Fund under the agreement.
| | | | | | |
| Notes to financial statements (unaudited) | | Wells Fargo Disciplined U.S. Core Fund | | | 29 | |
7. DISTRIBUTIONS TO SHAREHOLDERS
Effective for all filings after November 4, 2018, the Securities and Exchange Commission eliminated the requirement to separately state the components of distributions to shareholders under U.S. generally accepted accounting principles. The amounts of distributions to shareholders for the year ended July 31, 2018 were as follows:
| | | | | | | | |
| | | Net investment
income | | | Net realized
gains | |
| | |
Class A | | $ | 4,337,310 | | | $ | 16,367,452 | |
| | |
Class C | | | 71,920 | | | | 1,975,046 | |
| | |
Class R | | | 19,170 | | | | 67,065 | |
| | |
Class R6 | | | 2,941,311 | | | | 7,459,553 | |
| | |
Administrator Class | | | 938,093 | | | | 3,240,553 | |
| | |
Institutional Class | | | 5,006,239 | | | | 13,501,914 | |
8. INDEMNIFICATION
Under the Trust’s organizational documents, the officers and Trustees have been granted certain indemnification rights against certain liabilities that may arise out of performance of their duties to the Trust. Additionally, in the normal course of business, the Trust may enter into contracts with service providers that contain a variety of indemnification clauses. The Trust’s maximum exposure under these arrangements is dependent on future claims that may be made against the Fund and, therefore, cannot be estimated.
9. NEW ACCOUNTING PRONOUNCEMENT
In August 2018, FASB issued Accounting Standards Update (“ASU”)No. 2018-13, Fair Value Measurement (Topic 820)Disclosure Framework—Changes to the Disclosure Requirements for Fair Value Measurement. ASU2018-13 updates the disclosure requirements for fair value measurements by modifying or removing certain disclosures and adding certain new disclosures. The amendments are effective for fiscal years, and interim periods within those fiscal years, beginning after December 15, 2019. Early adoption is permitted. Management has early adopted the removal and modification disclosures, as permitted, and will adopt the additional new disclosures at the effective date.
| | | | |
| 30 | | Wells Fargo Disciplined U.S. Core Fund | | Other information (unaudited) |
PROXY VOTING INFORMATION
A description of the policies and procedures used to determine how to vote proxies relating to portfolio securities is available, upon request, by calling1-800-222-8222, visiting our website atwellsfargofunds.com, or visiting the SEC website at sec.gov. Information regarding how the Fund voted proxies relating to portfolio securities during the most recent12-month period ended June 30 is available on the Fund’s website atwellsfargofunds.comor by visiting the SEC website at sec.gov.
PORTFOLIO HOLDINGS INFORMATION
The complete portfolio holdings for the Fund are publicly available monthly on the Fund’s website (wellsfargofunds.com), on aone-month delayed basis. In addition, top ten holdings information (excluding derivative positions) for the Fund is publicly available on the Fund’s website on a monthly,seven-day or more delayed basis. The Fund files its complete schedule of portfolio holdings with the SEC for the first and third quarters of each fiscal year on FormN-Q, which is available by visiting the SEC website at sec.gov. In addition, the Fund’s FormN-Q may be reviewed and copied at the SEC’s Public Reference Room in Washington, DC, and at regional offices in New York City, at 233 Broadway, and in Chicago, at 175 West Jackson Boulevard, Suite 900. Information about the Public Reference Room may be obtained by calling1-800-SEC-0330.
| | | | | | |
| Other information (unaudited) | | Wells Fargo Disciplined U.S. Core Fund | | | 31 | |
BOARD OF TRUSTEES AND OFFICERS
Each of the Trustees and Officers1 listed in the table below acts in identical capacities for each fund in the Wells Fargo family of funds, which consists of 152 mutual funds comprising the Wells Fargo Funds Trust, Wells Fargo Variable Trust, Wells Fargo Master Trust and fourclosed-end funds (collectively the “Fund Complex”). This table should be read in conjunction with the Prospectus and the Statement of Additional Information2. The mailing address of each Trustee and Officer is 525 Market Street, 12th Floor, San Francisco, CA 94105. Each Trustee and Officer serves an indefinite term, however, each Trustee serves such term until reaching the mandatory retirement age established by the Trustees.
Independent Trustees
| | | | | | |
Name and year of birth | | Position held and
length of service* | | Principal occupations during past five years or longer | | Current other public company or
investment company
directorships |
| | | |
| William R. Ebsworth (Born 1957) | | Trustee, since 2015 | | Retired. From 1984 to 2013, equities analyst, portfolio manager, research director and chief investment officer at Fidelity Management and Research Company in Boston, Tokyo, and Hong Kong, and retired in 2013 as Chief Investment Officer of Fidelity Strategic Advisers, Inc. where he led a team of investment professionals managing client assets. Prior thereto, Board member of Hong Kong Securities Clearing Co., Hong Kong Options Clearing Corp., the Thailand International Fund, Ltd., Fidelity Investments Life Insurance Company, and Empire Fidelity Investments Life Insurance Company. Audit Committee Chair and Investment Committee Chair of the Vincent Memorial Hospital Endowment(non-profit organization). Mr. Ebsworth is a CFA® charterholder. | | N/A |
| | | |
| Jane A. Freeman (Born 1953) | | Trustee, since 2015; Chair Liaison, since 2018 | | Retired. From 2012 to 2014 and 1999 to 2008, Chief Financial Officer of Scientific Learning Corporation. From 2008 to 2012, Ms. Freeman provided consulting services related to strategic business projects. Prior to 1999, Portfolio Manager at Rockefeller & Co. and Scudder, Stevens & Clark. Board member of the Harding Loevner Funds from 1996 to 2014, serving as both Lead Independent Director and chair of the Audit Committee. Board member of the Russell Exchange Traded Funds Trust from 2011 to 2012 and the chair of the Audit Committee. Ms. Freeman is a Board Member of The Ruth Bancroft Garden(non-profit organization). She is also an inactive Chartered Financial Analyst. | | N/A |
| | | |
| Isaiah Harris, Jr.3 (Born 1952) | | Trustee, since 2009; Audit Committee Chairman, since 2019 | | Retired. Chairman of the Board of CIGNA Corporation since 2009, and Director since 2005. From 2003 to 2011, Director of Deluxe Corporation. Prior thereto, President and CEO of BellSouth Advertising and Publishing Corp. from 2005 to 2007, President and CEO of BellSouth Enterprises from 2004 to 2005 and President of BellSouth Consumer Services from 2000 to 2003. Emeritus member of the Iowa State University Foundation Board of Governors. Emeritus Member of the Advisory Board of Iowa State University School of Business. Advisory Board Member, Palm Harbor Academy (private school). Advisory Board Member, Child Evangelism Fellowship(non-profit). Mr. Harris is a certified public accountant (inactive status). | | CIGNA Corporation |
| | | |
| Judith M. Johnson3 (Born 1949) | | Trustee, since 2008; Audit Committee Chairman, from 2009 to 2018 | | Retired. Prior thereto, Chief Executive Officer and Chief Investment Officer of Minneapolis Employees Retirement Fund from 1996 to 2008. Ms. Johnson is an attorney, certified public accountant and a certified managerial accountant. | | N/A |
| | | |
| David F. Larcker (Born 1950) | | Trustee, since 2009 | | James Irvin Miller Professor of Accounting at the Graduate School of Business, Stanford University, Director of the Corporate Governance Research Initiative and Senior Faculty of The Rock Center for Corporate Governance since 2006. From 2005 to 2008, Professor of Accounting at the Graduate School of Business, Stanford University. Prior thereto, Ernst & Young Professor of Accounting at The Wharton School, University of Pennsylvania from 1985 to 2005. | | N/A |
| | | | |
| 32 | | Wells Fargo Disciplined U.S. Core Fund | | Other information (unaudited) |
| | | | | | |
Name and year of birth | | Position held and
length of service* | | Principal occupations during past five years or longer | | Current other public company or
investment company
directorships |
| | | |
| Olivia S. Mitchell (Born 1953) | | Trustee, since 2006; Nominating and Governance Committee Chairman, since 2018 | | International Foundation of Employee Benefit Plans Professor, Wharton School of the University of Pennsylvania since 1993. Director of Wharton’s Pension Research Council and Boettner Center on Pensions & Retirement Research, and Research Associate at the National Bureau of Economic Research. Previously, Cornell University Professor from 1978 to 1993. | | N/A |
| | | |
| Timothy J. Penny (Born 1951) | | Trustee, since 1996; Chairman, since 2018; Vice Chairman, from 2017 to 2018 | | President and Chief Executive Officer of Southern Minnesota Initiative Foundation, anon-profit organization, since 2007. Member of the Board of Trustees of NorthStar Education Finance, Inc., anon-profit organization, since 2007. | | N/A |
| | | |
| James G. Polisson (Born 1959) | | Trustee, since 2018; Advisory Board Member, from 2017 to 2018 | | Retired. Chief Marketing Officer, Source (ETF) UK Services, Ltd, from 2015 to 2017. From 2012 to 2015, Principal of The Polisson Group, LLC, a management consulting, corporate advisory and principal investing company. Chief Executive Officer and Managing Director at Russell Investments, Global Exchange Traded Funds from 2010 to 2012. Managing Director of Barclays Global Investors from 1998 to 2010 and Global Chief Marketing Officer for iShares and Barclays Global Investors from 2000 to 2010. Trustee of the San Francisco Mechanics’ Institute, anon-profit organization, from 2013 to 2015. Board member of the Russell Exchange Traded Fund Trust from 2011 to 2012. Director of Barclays Global Investors Holdings Deutschland GmbH from 2006 to 2009. Mr. Polisson is an attorney and has a retired status with the Massachusetts and District of Columbia Bar Associations. | | N/A |
| | | |
| Pamela Wheelock (Born 1959) | | Trustee, since 2018; Advisory Board Member, from 2017 to 2018 | | Board member of the Destination Medical Center Economic Development Agency, Rochester, Minnesota since 2019. Chief Operating Officer, Twin Cities Habitat for Humanity from 2017 to 2019. Vice President of University Services, University of Minnesota from 2012 to 2016. Prior thereto, on the Board of Directors, Governance Committee and Finance Committee for the Minnesota Philanthropy Partners (Saint Paul Foundation) from 2012 to 2018, Interim Chief Executive Officer of Blue Cross Blue Shield of Minnesota from 2011 to 2012, Chairman of the Board from 2009 to 2012 and Board Director from 2003 to 2015. Vice President, Leadership and Community Engagement, Bush Foundation, Saint Paul, Minnesota (a private foundation) from 2009 to 2011. Executive Vice President and Chief Financial Officer, Minnesota Sports and Entertainment from 2004 to 2009 and Senior Vice President from 2002 to 2004. Executive Vice President of the Minnesota Wild Foundation from 2004 to 2008. Commissioner of Finance, State of Minnesota, from 1999 to 2002. Currently Board Chair of the Minnesota Wild Foundation since 2010. | | N/A |
| * | Length of service dates reflect the Trustee’s commencement of service with the Trust’s predecessor entities, where applicable. |
| | | | | | |
| Other information (unaudited) | | Wells Fargo Disciplined U.S. Core Fund | | | 33 | |
Officers
| | | | | | |
Name and
year of birth | | Position held and
length of service | | Principal occupations during past five years or longer | | |
| | | |
Andrew Owen (Born 1960) | | President, since 2017 | | Executive Vice President of Wells Fargo & Company and Head of Affiliated Managers, Wells Fargo Asset Management, since 2014. In addition, Mr. Owen is currently President, Chief Executive Officer and Director of Wells Fargo Funds Management, LLC since 2017. Prior thereto, Executive Vice President responsible for marketing, investments and product development for Wells Fargo Funds Management, LLC, from 2009 to 2014. | | |
| | | |
| Jeremy DePalma1 (Born 1974) | | Treasurer, since 2012 | | Senior Vice President of Wells Fargo Funds Management, LLC since 2009. Senior Vice President of Evergreen Investment Management Company, LLC from 2008 to 2010 and head of the Fund Reporting and Control Team within Fund Administration from 2005 to 2010. | | |
| | | |
| Alexander Kymn (Born 1973) | | Secretary, since 2018; Chief Legal Officer, since 2018 | | Senior Company Counsel of Wells Fargo Bank, N.A. since 2018 (previously Senior Counsel from 2007 to 2018). Vice President of Wells Fargo Funds Management, LLC from 2008 to 2014. | | |
| | | |
| Michael H. Whitaker(Born 1967) | | Chief Compliance Officer, since 2016 | | Senior Vice President and Chief Compliance Officer since 2016. Senior Vice President and Chief Compliance Officer for Fidelity Investments from 2007 to 2016. | | |
| | | |
David Berardi (Born 1975) | | Assistant Treasurer, since 2009 | | Vice President of Wells Fargo Funds Management, LLC since 2009. Vice President of Evergreen Investment Management Company, LLC from 2008 to 2010. Manager of Fund Reporting and Control for Evergreen Investment Management Company, LLC from 2004 to 2010. | | |
| 1 | Jeremy DePalma acts as Treasurer of 76 funds and Assistant Treasurer of 76 funds in the Fund Complex. |
| 2 | The Statement of Additional Information includes additional information about the Trustees and is available, without charge, upon request, by calling1-800-260-5969 or by visiting the website atwellsfargofunds.com. |
| 3 | Mr. Harris became Chairman of the Audit Committee effective January 1, 2019. |
| | | | |
| 34 | | Wells Fargo Disciplined U.S. Core Fund | | Appendix A (unaudited) |
SALES CHARGE REDUCTIONS AND WAIVERS FOR CERTAIN INTERMEDIARIES
Raymond James & Associates, Inc., Raymond James Financial Services & Raymond James affiliates (“Raymond James”)
Effective on or about March 1, 2019, shareholders purchasing Fund shares through a Raymond James platform or account will be eligible only for the following load waivers(front-end sales charge waivers and contingent deferred, orback-end, sales charge waivers) and discounts, which may differ from those disclosed elsewhere in the Fund’s Prospectus or SAI.
Front-end Sales Load Waivers on Class A shares Available at Raymond James
| | • | | Shares purchased in an investment advisory program. |
| | • | | Shares purchased through reinvestment of capital gains distributions and dividend reinvestment when purchasing shares of the same fund (but not any other fund within the fund family). |
| | • | | Employees and registered representatives of Raymond James or its affiliates and their family members as designated by Raymond James. |
| | • | | Shares purchased from the proceeds of redemptions within the same fund family, provided (1) the repurchase occurs within 90 days following the redemption, (2) the redemption and purchase occur in the same account, and (3) redeemed shares were subject to afront-end or deferred sales load (known as Rights of Reinstatement). |
| | • | | A shareholder in the fund’s Class C shares will have their shares automatically exchanged at net asset value to Class A shares (or the appropriate share class) of the fund if the shares are no longer subject to a CDSC and the exchange is in line with the policies and procedures of Raymond James. |
CDSC Waivers on Class A and C Shares Available at Raymond James
| | • | | Death or disability of the shareholder. |
| | • | | Shares sold as part of a systematic withdrawal plan as described in the Fund’s Prospectus. |
| | • | | Return of excess contributions from an IRA Account. |
| | • | | Shares sold as part of a required minimum distribution for IRA and retirement accounts due to the shareholder reaching age 70½ as described in the Fund’s prospectus. |
| | • | | Shares sold to pay Raymond James fees but only if the transaction is initiated by Raymond James. |
| | • | | Shares acquired through a right of reinstatement. |
Front-end Load Discounts Available at Raymond James: Breakpoints, and/or Rights of Accumulation
| | • | | Breakpoints as described in the Fund’s Prospectus. |
| | • | | Rights of accumulation which entitle shareholders to breakpoint discounts will be automatically calculated based on the aggregated holding of fund family assets held by accounts within the purchaser’s household at Raymond James. Eligible fund family assets not held at Raymond James may be included in the rights of accumulation calculation only if the shareholder notifies his or her financial advisor about such assets. |
This page is intentionally left blank.
This page is intentionally left blank.

For more information
More information about Wells Fargo Funds is available free upon request. To obtain literature, please write, visit the Fund’s website, or call:
Wells Fargo Funds
P.O. Box 219967
Kansas City, MO 64121-9967
Website: wellsfargofunds.com
Individual investors: 1-800-222-8222
Retail investment professionals: 1-888-877-9275
Institutional investment professionals: 1-866-765-0778
This report and the financial statements contained herein are submitted for the general information of the shareholders of the Fund. If this report is used for promotional purposes, distribution of the report must be accompanied or preceded by a current prospectus. Before investing, please consider the investment objectives, risks, charges, and expenses of the investment. For a current prospectus and, if available, a summary prospectus, containing this information, call1-800-222-8222 or visit the Fund’s website atwellsfargofunds.com. Read the prospectus carefully before you invest or send money.
Wells Fargo Asset Management (WFAM) is the trade name for certain investment advisory/management firms owned by Wells Fargo & Company. These firms include but are not limited to Wells Capital Management Incorporated and Wells Fargo Funds Management, LLC. Certain products managed by WFAM entities are distributed by Wells Fargo Funds Distributor, LLC (a broker/dealer and Member FINRA).
This material is for general informational and educational purposes only and is NOT intended to provide investment advice or a recommendation of any kind—including a recommendation for any specific investment, strategy, or plan.
INVESTMENT PRODUCTS: NOT FDIC INSURED ◾ NO BANK GUARANTEE ◾ MAY LOSE VALUE
© 2019 Wells Fargo Funds Management, LLC. All rights reserved.
| | |
 | | 320769 03-19 SA203/SAR203 01-19 |
Semi-Annual Report
January 31, 2019

Wells Fargo Endeavor Select Fund

Beginning on January 1, 2021, as permitted by new regulations adopted by the Securities and Exchange Commission, paper copies of the Wells Fargo Funds’ annual and semi-annual shareholder reports issued after this date will no longer be sent by mail, unless you specifically request paper copies of the reports. Instead, the reports will be made available on the Funds’ website, and you will be notified by mail each time a report is posted and provided with a website address to access the report.
If you already elected to receive shareholder reports electronically, you will not be affected by this change and you need not take any action. You may elect to receive shareholder reports and other communications from the Fund electronically at any time by contacting your financial intermediary (such as a broker-dealer or bank) or, if you are a direct investor, by calling 1-800-222-8222 or by enrolling at wellsfargo.com/advantagedelivery.
You may elect to receive all future reports in paper free of charge. If you invest through a financial intermediary, you can contact your financial intermediary to request that you continue to receive paper copies of your shareholder reports; if you invest directly with the Fund, you can call 1-800-222-8222. Your election to receive reports in paper will apply to all Wells Fargo Funds held in your account with your financial intermediary or, if you are a direct investor, to all Wells Fargo Funds that you hold.

Reduce clutter. Save trees.
Sign up for electronic delivery of prospectuses and shareholder reports atwellsfargo.com/advantagedelivery
Contents
The views expressed and any forward-looking statements are as of January 31, 2019, unless otherwise noted, and are those of the Fund managers and/or Wells Fargo Funds Management, LLC. Discussions of individual securities, or the markets generally, or any Wells Fargo Fund are not intended as individual recommendations. Future events or results may vary significantly from those expressed in any forward-looking statements. The views expressed are subject to change at any time in response to changing circumstances in the market. Wells Fargo Funds Management, LLC and the Fund disclaim any obligation to publicly update or revise any views expressed or forward-looking statements.
INVESTMENT PRODUCTS: NOT FDIC INSURED ◾ NO BANK GUARANTEE ◾ MAY LOSE VALUE
| | | | |
| 2 | | Wells Fargo Endeavor Select Fund | | Letter to shareholders (unaudited) |

Andrew Owen
President
Wells Fargo Funds
Favorable third-quarter economic indicators and corporate earnings reports encouraged domestic stock investors.
Dear Shareholder:
We are pleased to offer you this semi-annual report for the Wells Fargo Endeavor Select Fund for the six-month period that ended January 31, 2019. Higher short-term interest rates, inflation concerns, trade tensions, slowing economic growth outside the U.S., and geopolitical events contributed to investment market volatility throughout the period.
For the period, U.S. stocks, as measured by the S&P 500 Index,1 fell 3.00% and international stocks, as measured by the MSCI ACWI ex USA Index (Net),2 declined 6.34%. Based on the MSCI EM Index (Net),3 emerging market stocks lost 2.60%. For bond investors, the Bloomberg Barclays U.S. Aggregate Bond Index4 added 2.71% while the Bloomberg Barclays Global Aggregate ex-USD Index5 gained 1.37%. The Bloomberg Barclays Municipal Bond Index6 added 2.05%, and the ICE BofAML U.S. High Yield Index7 gained 1.02%.
Investors appeared to shake off lingering concerns during the third quarter.
Favorable third-quarter economic indicators and corporate earnings reports encouraged domestic stock investors. U.S. trade negotiations with Mexico and Canada made progress. The Conference Board Consumer Confidence Index®8 reached its highest level in 18 years during September. Several U.S. equity market indices reached records during August. The U.S. Federal Reserve (Fed) raised the federal funds rate by 25 basis points (bps; 100 bps equal 1.00%) to a target range of between 2.00% and 2.25% in September 2018. For the quarter that ended September 30, the S&P 500 Index added 7.71%.
Investors in international markets were not as reassured. Tensions between the U.S. and China increased when the U.S. imposed an additional $200 billion in tariffs on Chinese goods. China responded with $60 billion in tariffs on U.S. products. In addition, economic growth in China drew renewed concerns. The Bank of England, having raised its monetary policy rate to 0.50% in November 2017, increased the rate again in August 2018 to 0.75%. During the three-month period that ended September 30, 2018, the MSCI ACWI ex USA Index (Net) gained 0.71% while the MSCI EM Index (Net) declined 1.09%.
| 1 | The S&P 500 Index consists of 500 stocks chosen for market size, liquidity, and industry group representation. It is a market-value-weighted index with each stock’s weight in the index proportionate to its market value. You cannot invest directly in an index. |
| 2 | The Morgan Stanley Capital International (MSCI) All Country World Index (ACWI) ex USA Index (Net) is a free-float-adjusted market-capitalization-weighted index that is designed to measure the equity market performance of developed markets, excluding the United States and Canada. Source: MSCI. MSCI makes no express or implied warranties or representations and shall have no liability whatsoever with respect to any MSCI data contained herein. The MSCI data may not be further redistributed or used as a basis for other indices or any securities or financial products. This report is not approved, reviewed, or produced by MSCI. You cannot invest directly in an index. |
| 3 | The MSCI Emerging Markets (EM) Index (Net) is a free-float-adjusted market-capitalization-weighted index that is designed to measure large- and mid-cap equity market performance of emerging markets. The MSCI EM Index (Net) consists of the following 24 emerging market country indices: Brazil, Chile, China, Colombia, Czech Republic, Egypt, Greece, Hungary, India, Indonesia, Korea, Malaysia, Mexico, Pakistan, Peru, the Philippines, Poland, Qatar, Russia, South Africa, Taiwan, Thailand, Turkey, and the United Arab Emirates. You cannot invest directly in an index. |
| 4 | The Bloomberg Barclays U.S. Aggregate Bond Index is a broad-based benchmark that measures the investment-grade, U.S. dollar-denominated, fixed-rate taxable bond market, including Treasuries, government-related and corporate securities, mortgage-backed securities (agency fixed-rate and hybrid adjustable-rate mortgage pass-throughs), asset-backed securities, and commercial mortgage-backed securities. You cannot invest directly in an index. |
| 5 | The Bloomberg Barclays Global Aggregate ex-USD Index is an unmanaged index that provides a broad-based measure of the global investment-grade fixed-income markets excluding the U.S. dollar-denominated debt market. You cannot invest directly in an index. |
| 6 | The Bloomberg Barclays Municipal Bond Index is an unmanaged index composed of long-term tax-exempt bonds with a minimum credit rating of Baa. You cannot invest directly in an index. |
| 7 | The ICE BofAML U.S. High Yield Index is a market-capitalization-weighted index of domestic and Yankee high-yield bonds. The index tracks the performance of high-yield securities traded in the U.S. bond market. You cannot invest directly in an index. Copyright 2019. ICE Data Indices, LLC. All rights reserved. |
| 8 | The Conference Board Consumer Confidence Index® measures the degree of optimism on the state of the U.S. economy that consumers are expressing through their activities of savings and spending. You cannot invest directly in an index. |
| | | | | | |
| Letter to shareholders (unaudited) | | Wells Fargo Endeavor Select Fund | | | 3 | |
In bond markets, U.S. bonds, as measured by the Bloomberg Barclays U.S. Aggregate Bond Index, were flat. The Bloomberg Barclays Global Aggregateex-USD Index fell 1.74% during the quarter that ended September 30, 2018.
Conflicting data unsettled markets during the fourth quarter.
Negative stock market performance during October and December bracketed a mildly positive November for the S&P 500 Index and the MSCI ACWI ex USA Index (Net). As interest rates and bond yields gained during October, stock markets struggled. December’s S&P 500 Index performance was the worst since 1931. Globally, fixed-income investments fared better than stocks during the last two months of the year.
November’s U.S. midterm elections shifted control of the House of Representatives from Republicans to Democrats, presaging potential partisan disputes. The Bureau of Economic Analysis reported that third-quarter U.S. gross domestic product (GDP) grew at an annualized 3.4% rate, lower than second-quarter GDP growth. Brexit efforts stalled in the U.K. ahead of the March 2019 deadline. The People’s Bank of China cut reserve requirement ratios and accelerated infrastructure spending and tax cuts, and the value of the yuan declined to low levels last seen in 2008. Oil prices fell.
After the Fed increased the federal funds rate by 25 bps to a target range of between 2.25% and 2.50% in December 2018—the ninth such increase since the Fed began raising rates three years ago from near zero—it softened its outlook for further interest rate increases in 2019.
The market climbs a wall of worry.
Investors entered 2019 with reasons to be concerned. A partial U.S. government shutdown driven by partisan disputes over spending and immigration policies extended into January. Globally, economic signals were uneven. Investors expected high levels of stock market volatility to continue, as measured by the VIX9.
January’s returns tended to support the investing adage that the market climbs a wall of worry. The S&P 500 Index gained 8.01% for the month that ended January 31, 2019, its best monthly performance in 30 years. Returns for the MSCI ACWI ex USA Index (Net), the Bloomberg Barclays U.S. Aggregate Bond Index, and the Bloomberg Barclays Global Aggregate ex-USD Index also were positive.
Don’t let short-term uncertainty derail long-term investment goals.
Periods of investment uncertainty can present challenges, but experience has taught us that maintaining long-term investment goals can be an effective way to plan for the future. To help you create a sound strategy based on your personal goals and risk tolerance, Wells Fargo Funds offers more than 100 mutual funds spanning a wide range of asset classes and investment styles. Although diversification cannot guarantee an investment profit or prevent losses, we believe it can be an effective way to manage investment risk and potentially smooth out overall portfolio performance. We encourage investors to know their investments and to understand that appropriate levels of risk-taking may unlock opportunities.
January’s returns tended to support the investing adage that the market climbs a wall of worry.
| 9 | The Chicago Board Options Exchange Market Volatility Index (VIX) is a popular measure of the implied volatility of S&P 500 Index options. It represents one measure of the market’s expectation of stock market volatility over the next 30-day period. You cannot invest directly in an index. |
| | | | |
| 4 | | Wells Fargo Endeavor Select Fund | | Letter to shareholders (unaudited) |
Thank you for choosing to invest with Wells Fargo Funds. We appreciate your confidence in us and remain committed to helping you meet your financial needs.
Sincerely,

Andrew Owen
President
Wells Fargo Funds
For further information about your Fund, contact your investment professional, visit our website atwellsfargofunds.com, or call us directly at1-800-222-8222.
This page is intentionally left blank.
| | | | |
| 6 | | Wells Fargo Endeavor Select Fund | | Performance highlights (unaudited) |
Investment objective
The Fund seeks long-term capital appreciation.
Manager
Wells Fargo Funds Management, LLC
Subadviser
Wells Capital Management Incorporated
Portfolio managers
Michael T. Smith, CFA®‡
Christopher J. Warner, CFA®‡
Average annual total returns (%) as of January 31, 2019
| | | | | | | | | | | | | | | | | | | | | | | | | | | | | | | | | | |
| | | | | Including sales charge | | | Excluding sales charge | | | Expense ratios1 (%) | |
| | | Inception date | | 1 year | | | 5 year | | | 10 year | | | 1 year | | | 5 year | | | 10 year | | | Gross | | | Net2 | |
| | | | | | | | | |
| Class A (STAEX) | | 12-29-2000 | | | -3.08 | | | | 10.18 | | | | 14.44 | | | | 2.88 | | | | 11.48 | | | | 15.12 | | | | 1.26 | | | | 1.21 | |
| | | | | | | | | |
| Class C (WECCX) | | 12-29-2000 | | | 1.21 | | | | 10.66 | | | | 14.28 | | | | 2.21 | | | | 10.66 | | | | 14.28 | | | | 2.01 | | | | 1.96 | |
| | | | | | | | | |
| Administrator Class (WECDX) | | 4-8-2005 | | | – | | | | – | | | | – | | | | 3.21 | | | | 11.75 | | | | 15.41 | | | | 1.18 | | | | 1.01 | |
| | | | | | | | | |
| Institutional Class (WFCIX) | | 4-8-2005 | | | – | | | | – | | | | – | | | | 3.40 | | | | 11.95 | | | | 15.63 | | | | 0.93 | | | | 0.81 | |
| | | | | | | | | |
| Russell 1000® Growth Index3 | | – | | | – | | | | – | | | | – | | | | 0.24 | | | | 12.97 | | | | 16.86 | | | | – | | | | – | |
Figures quoted represent past performance, which is no guarantee of future results, and do not reflect taxes that a shareholder may pay on fund distributions or the redemption of fund shares. Investment return and principal value of an investment will fluctuate so that an investor’s shares, when redeemed, may be worth more or less than their original cost. Performance shown without sales charges would be lower if sales charges were reflected. Current performance may be lower or higher than the performance data quoted, which assumes the reinvestment of dividends and capital gains. Current month-end performance is available on the Fund’s website,wellsfargofunds.com.
Index returns do not include transaction costs associated with buying and selling securities, any mutual fund fees or expenses, or any taxes. It is not possible to invest directly in an index.
For Class A shares, the maximum front-end sales charge is 5.75%. For Class C shares, the maximum contingent deferred sales charge is 1.00%. Performance including a contingent deferred sales charge assumes the sales charge for the corresponding time period. Administrator Class and Institutional Class shares are sold without a front-end sales charge or contingent deferred sales charge.
Stock values fluctuate in response to the activities of individual companies and general market and economic conditions. Certain investment strategies tend to increase the total risk of an investment (relative to the broader market). The Fund is exposed to foreign investment risk, focused portfolio risk, and smaller-company securities risk. Consult the Fund’s prospectus for additional information on these and other risks.
Please see footnotes on page 7.
| | | | | | |
| Performance highlights (unaudited) | | Wells Fargo Endeavor Select Fund | | | 7 | |
| | | | |
| Ten largest holdings (%) as of January 31, 20194 | |
| |
Amazon.com Incorporated | | | 8.43 | |
| |
Microsoft Corporation | | | 7.78 | |
| |
Alphabet Incorporated Class A | | | 5.56 | |
| |
UnitedHealth Group Incorporated | | | 5.49 | |
| |
Visa Incorporated Class A | | | 5.44 | |
| |
Waste Connections Incorporated | | | 3.95 | |
| |
Union Pacific Corporation | | | 3.41 | |
| |
The Home Depot Incorporated | | | 3.23 | |
| |
Salesforce.com Incorporated | | | 3.08 | |
| |
The Sherwin-Williams Company | | | 2.89 | |
|
| Sector distribution as of January 31, 20195 |
|
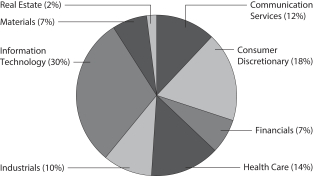 |
| ‡ | CFA® and Chartered Financial Analyst® are trademarks owned by CFA Institute. |
| 1 | Reflects the expense ratios as stated in the most recent prospectuses, which include the impact of 0.01% in acquired fund fees and expenses. The expense ratios shown are subject to change and may differ from the annualized expense ratios shown in the financial highlights of this report. |
| 2 | The manager has contractually committed through November 30, 2019, to waive fees and/or reimburse expenses to the extent necessary to cap the expenses of each class after fee waivers at 1.20% for Class A, 1.95% for Class C, 1.00% for Administrator Class, and 0.80% for Institutional Class. Brokerage commissions, stamp duty fees, interest, taxes, acquired fund fees and expenses (if any), and extraordinary expenses are excluded from the expense cap. Prior to or after the commitment expiration date, the cap may be increased or the commitment to maintain the cap may be terminated only with the approval of the Board of Trustees. Without this cap, the Fund’s returns would have been lower. The expense ratio paid by an investor is the net expense ratio (the total annual fund operating expenses after fee waivers) as stated in the prospectuses. |
| 3 | The Russell 1000® Growth Index measures the performance of those Russell 1000 companies with higher price/book ratios and higher forecasted growth values. You cannot invest directly in an index. |
| 4 | The ten largest holdings, excluding cash, cash equivalents and any money market funds, are calculated based on the value of the investments divided by total net assets of the Fund. Holdings are subject to change and may have changed since the date specified. |
| 5 | Amounts are calculated based on the total long-term investments of the Fund. These amounts are subject to change and may have changed since the date specified. |
| | | | |
| 8 | | Wells Fargo Endeavor Select Fund | | Fund expenses (unaudited) |
As a shareholder of the Fund, you incur two types of costs: (1) transaction costs, including sales charges (loads) on purchase payments and contingent deferred sales charges (if any) on redemptions and (2) ongoing costs, including management fees, distribution (12b-1) and/or shareholder servicing fees, and other Fund expenses. This example is intended to help you understand your ongoing costs (in dollars) of investing in the Fund and to compare these costs with the ongoing costs of investing in other mutual funds.
The example is based on an investment of $1,000 invested at the beginning of the six-month period and held for the entire period from August 1, 2018 to January 31, 2019.
Actual expenses
The “Actual” line of the table below provides information about actual account values and actual expenses. You may use the information in this line, together with the amount you invested, to estimate the expenses that you paid over the period. Simply divide your account value by $1,000 (for example, an $8,600 account value divided by $1,000 = 8.6), then multiply the result by the number in the “Actual” line under the heading entitled “Expenses paid during period” for your applicable class of shares to estimate the expenses you paid on your account during this period.
Hypothetical example for comparison purposes
The “Hypothetical” line of the table below provides information about hypothetical account values and hypothetical expenses based on the Fund’s actual expense ratio and an assumed rate of return of 5% per year before expenses, which is not the Fund’s actual return. The hypothetical account values and expenses may not be used to estimate the actual ending account balance or expenses you paid for the period. You may use this information to compare the ongoing costs of investing in the Fund and other funds. To do so, compare this 5% hypothetical example with the 5% hypothetical examples that appear in the shareholder reports of the other funds.
Please note that the expenses shown in the table are meant to highlight your ongoing costs only and do not reflect any transactional costs, such as sales charges (loads) and contingent deferred sales charges. Therefore, the “Hypothetical” line of the table is useful in comparing ongoing costs only and will not help you determine the relative total costs of owning different funds. In addition, if these transactional costs were included, your costs would have been higher.
| | | | | | | | | | | | | | | | |
| | | Beginning
account value
8-1-2018 | | | Ending
account value
1-31-2019 | | | Expenses
paid during
the period¹ | | | Annualized net
expense ratio | |
Class A | | | | | | | | | | | | | | | | |
| | | | |
Actual | | $ | 1,000.00 | | | $ | 976.40 | | | $ | 5.98 | | | | 1.20 | % |
| | | | |
Hypothetical (5% return before expenses) | | $ | 1,000.00 | | | $ | 1,019.16 | | | $ | 6.11 | | | | 1.20 | % |
Class C | | | | | | | | | | | | | | | | |
| | | | |
Actual | | $ | 1,000.00 | | | $ | 973.07 | | | $ | 9.70 | | | | 1.95 | % |
| | | | |
Hypothetical (5% return before expenses) | | $ | 1,000.00 | | | $ | 1,015.38 | | | $ | 9.91 | | | | 1.95 | % |
Administrator Class | | | | | | | | | | | | | | | | |
| | | | |
Actual | | $ | 1,000.00 | | | $ | 978.09 | | | $ | 4.99 | | | | 1.00 | % |
| | | | |
Hypothetical (5% return before expenses) | | $ | 1,000.00 | | | $ | 1,020.16 | | | $ | 5.09 | | | | 1.00 | % |
Institutional Class | | | | | | | | | | | | | | | | |
| | | | |
Actual | | $ | 1,000.00 | | | $ | 978.24 | | | $ | 3.99 | | | | 0.80 | % |
| | | | |
Hypothetical (5% return before expenses) | | $ | 1,000.00 | | | $ | 1,021.17 | | | $ | 4.08 | | | | 0.80 | % |
| 1 | Expenses paid is equal to the annualized net expense ratio of each class multiplied by the average account value over the period, multiplied by the number of days in the most recent fiscal half-year divided by the number of days in the fiscal year (to reflect the one-half-year period). |
| | | | | | |
| Portfolio of investments—January 31, 2019 (unaudited) | | Wells Fargo Endeavor Select Fund | | | 9 | |
| | | | | | | | | | | | | | | | |
| Security name | | | | | | | | Shares | | | Value | |
| | | | |
Common Stocks: 99.98% | | | | | | | | | | | | | | | | |
| | | | |
Communication Services: 12.36% | | | | | | | | | | | | | | | | |
| | | | |
| Entertainment: 4.20% | | | | | | | | | | | | | | | | |
| | | | |
Activision Blizzard Incorporated | | | | | | | | | | | 33,400 | | | $ | 1,577,816 | |
| | | | |
Netflix Incorporated † | | | | | | | | | | | 5,900 | | | | 2,003,050 | |
| | | | |
Nintendo Company Limited ADR | | | | | | | | | | | 45,200 | | | | 1,683,248 | |
| | | | |
| | | | | | | | | | | | | | | 5,264,114 | |
| | | | | | | | | | | | | | | | |
| | | | |
| Interactive Media & Services: 8.16% | | | | | | | | | | | | | | | | |
| | | | |
Alphabet Incorporated Class A † | | | | | | | | | | | 6,199 | | | | 6,979,392 | |
| | | | |
Alphabet Incorporated Class C † | | | | | | | | | | | 1,150 | | | | 1,283,826 | |
| | | | |
Tencent Holdings Limited ADR | | | | | | | | | | | 44,300 | | | | 1,976,223 | |
| | | | |
| | | | | | | | | | | | | | | 10,239,441 | |
| | | | | | | | | | | | | | | | |
| | | | |
Consumer Discretionary: 17.61% | | | | | | | | | | | | | | | | |
| | | | |
| Auto Components: 1.68% | | | | | | | | | | | | | | | | |
| | | | |
Aptiv plc | | | | | | | | | | | 26,600 | | | | 2,104,858 | |
| | | | | | | | | | | | | | | | |
| | | | |
| Automobiles: 1.43% | | | | | | | | | | | | | | | | |
| | | | |
Ferrari NV | | | | | | | | | | | 14,200 | | | | 1,793,460 | |
| | | | | | | | | | | | | | | | |
| | | | |
| Internet & Direct Marketing Retail: 11.27% | | | | | | | | | | | | | | | | |
| | | | |
Alibaba Group Holding Limited ADR † | | | | | | | | | | | 7,800 | | | | 1,314,222 | |
| | | | |
Amazon.com Incorporated † | | | | | | | | | | | 6,153 | | | | 10,575,345 | |
| | | | |
MercadoLibre Incorporated † | | | | | | | | | | | 6,200 | | | | 2,256,800 | |
| | | | |
| | | | | | | | | | | | | | | 14,146,367 | |
| | | | | | | | | | | | | | | | |
| | | | |
| Specialty Retail: 3.23% | | | | | | | | | | | | | | | | |
| | | | |
The Home Depot Incorporated | | | | | | | | | | | 22,083 | | | | 4,052,893 | |
| | | | | | | | | | | | | | | | |
| | | | |
Financials: 7.14% | | | | | | | | | | | | | | | | |
| | | | |
| Capital Markets: 7.14% | | | | | | | | | | | | | | | | |
| | | | |
Intercontinental Exchange Incorporated | | | | | | | | | | | 43,315 | | | | 3,324,859 | |
| | | | |
Raymond James Financial Incorporated | | | | | | | | | | | 36,300 | | | | 2,922,150 | |
| | | | |
S&P Global Incorporated | | | | | | | | | | | 14,178 | | | | 2,717,214 | |
| | | | |
| | | | | | | | | | | | | | | 8,964,223 | |
| | | | | | | | | | | | | | | | |
| | | | |
Health Care: 13.63% | | | | | | | | | | | | | | | | |
| | | | |
| Biotechnology: 1.82% | | | | | | | | | | | | | | | | |
| | | | |
Celgene Corporation † | | | | | | | | | | | 25,779 | | | | 2,280,410 | |
| | | | | | | | | | | | | | | | |
| | | | |
| Health Care Equipment & Supplies: 6.32% | | | | | | | | | | | | | | | | |
| | | | |
Boston Scientific Corporation † | | | | | | | | | | | 88,800 | | | | 3,387,720 | |
| | | | |
Edwards Lifesciences Corporation † | | | | | | | | | | | 13,400 | | | | 2,283,628 | |
| | | | |
Medtronic plc | | | | | | | | | | | 25,500 | | | | 2,253,945 | |
| | | | |
| | | | | | | | | | | | | | | 7,925,293 | |
| | | | | | | | | | | | | | | | |
The accompanying notes are an integral part of these financial statements.
| | | | |
| 10 | | Wells Fargo Endeavor Select Fund | | Portfolio of investments—January 31, 2019 (unaudited) |
| | | | | | | | | | | | | | | | |
| Security name | | | | | | | | Shares | | | Value | |
| | | | |
| Health Care Providers & Services: 5.49% | | | | | | | | | | | | | | | | |
| | | | |
UnitedHealth Group Incorporated | | | | | | | | | | | 25,500 | | | $ | 6,890,100 | |
| | | | | | | | | | | | | | | | |
| | | | |
Industrials: 9.89% | | | | | | | | | | | | | | | | |
| | | | |
| Commercial Services & Supplies: 6.48% | | | | | | | | | | | | | | | | |
| | | | |
Cintas Corporation | | | | | | | | | | | 16,900 | | | | 3,168,919 | |
| | | | |
Waste Connections Incorporated | | | | | | | | | | | 59,360 | | | | 4,960,122 | |
| | | | |
| | | | | | | | | | | | | | | 8,129,041 | |
| | | | | | | | | | | | | | | | |
| | | | |
| Road & Rail: 3.41% | | | | | | | | | | | | | | | | |
| | | | |
Union Pacific Corporation | | | | | | | | | | | 26,900 | | | | 4,278,983 | |
| | | | | | | | | | | | | | | | |
| | | | |
Information Technology: 30.78% | | | | | | | | | | | | | | | | |
| | | | |
| Communications Equipment: 2.00% | | | | | | | | | | | | | | | | |
| | | | |
Motorola Solutions Incorporated | | | | | | | | | | | 21,500 | | | | 2,513,565 | |
| | | | | | | | | | | | | | | | |
| | | | |
| IT Services: 16.08% | | | | | | | | | | | | | | | | |
| | | | |
Fidelity National Information Services Incorporated | | | | | | | | | | | 25,100 | | | | 2,623,703 | |
| | | | |
First Data Corporation Class A † | | | | | | | | | | | 145,800 | | | | 3,593,970 | |
| | | | |
FleetCor Technologies Incorporated † | | | | | | | | | | | 10,400 | | | | 2,098,824 | |
| | | | |
PayPal Holdings Incorporated † | | | | | | | | | | | 33,200 | | | | 2,946,832 | |
| | | | |
Total System Services Incorporated | | | | | | | | | | | 23,200 | | | | 2,078,952 | |
| | | | |
Visa Incorporated Class A | | | | | | | | | | | 50,558 | | | | 6,825,836 | |
| | | | |
| | | | | | | | | | | | | | | 20,168,117 | |
| | | | | | | | | | | | | | | | |
| | | | |
| Software: 12.70% | | | | | | | | | | | | | | | | |
| | | | |
Microsoft Corporation | | | | | | | | | | | 93,500 | | | | 9,764,205 | |
| | | | |
Salesforce.com Incorporated † | | | | | | | | | | | 25,400 | | | | 3,860,038 | |
| | | | |
ServiceNow Incorporated † | | | | | | | | | | | 10,500 | | | | 2,310,210 | |
| | | | |
| | | | | | | | | | | | | | | 15,934,453 | |
| | | | | | | | | | | | | | | | |
| | | | |
Materials: 6.77% | | | | | | | | | | | | | | | | |
| | | | |
| Chemicals: 5.33% | | | | | | | | | | | | | | | | |
| | | | |
Air Products & Chemicals Incorporated | | | | | | | | | | | 18,600 | | | | 3,057,654 | |
| | | | |
The Sherwin-Williams Company | | | | | | | | | | | 8,600 | | | | 3,625,072 | |
| | | | |
| | | | | | | | | | | | | | | 6,682,726 | |
| | | | | | | | | | | | | | | | |
| | | | |
| Construction Materials: 1.44% | | | | | | | | | | | | | | | | |
| | | | |
Vulcan Materials Company | | | | | | | | | | | 17,800 | | | | 1,809,370 | |
| | | | | | | | | | | | | | | | |
| | | | |
Real Estate: 1.80% | | | | | | | | | | | | | | | | |
| | | | |
| Equity REITs: 1.80% | | | | | | | | | | | | | | | | |
| | | | |
SBA Communications Corporation † | | | | | | | | | | | 12,400 | | | | 2,263,372 | |
| | | | | | | | | | | | | | | | |
| | | | |
Total Common Stocks (Cost $77,098,829) | | | | | | | | | | | | | | | 125,440,786 | |
| | | | | | | | | | | | | | | | |
The accompanying notes are an integral part of these financial statements.
| | | | | | |
| Portfolio of investments—January 31, 2019 (unaudited) | | Wells Fargo Endeavor Select Fund | | | 11 | |
| | | | | | | | | | | | | | | | |
| Security name | | Yield | | | | | | Shares | | | Value | |
| | | | |
Short-Term Investments: 1.98% | | | | | | | | | | | | | | | | |
| | | | |
| Investment Companies: 1.98% | | | | | | | | | | | | | | | | |
| | | | |
Wells Fargo Government Money Market Fund Select Class (l)(u) | | | 2.33 | % | | | | | | | 2,487,948 | | | $ | 2,487,948 | |
| | | | | | | | | | | | | | | | |
| | | | |
Total Short-Term Investments (Cost $2,487,948) | | | | | | | | | | | | | | | 2,487,948 | |
| | | | | | | | | | | | | | | | |
| | | | | | | | |
| Total investments in securities (Cost $79,586,777) | | | 101.96 | % | | | 127,928,734 | |
| | |
Other assets and liabilities, net | | | (1.96 | ) | | | (2,459,231 | ) |
| | | | | | | | |
| Total net assets | | | 100.00 | % | | $ | 125,469,503 | |
| | | | | | | | |
| † | Non-income-earning security |
| (l) | The issuer of the security is an affiliated person of the Fund as defined in the Investment Company Act of 1940. |
| (u) | The rate represents the 7-day annualized yield at period end. |
Abbreviations:
| ADR | American depositary receipt |
| REIT | Real estate investment trust |
Investments in Affiliates
An affiliated investment is an investment in which the Fund owns at least 5% of the outstanding voting shares of the issuer or as a result of other relationships, such as the Fund and the issuer having the same investment manager. Transactions with issuers that were either affiliated persons of the Fund at the beginning of the period or the end of the period were as follows:
| | | | | | | | | | | | | | | | | | | | | | | | | | | | | | | | | | | | |
| | | Shares,
beginning of
period | | | Shares
purchased | | | Shares sold | | | Shares, end of period | | | Net realized gains (losses) | | | Net
change in unrealized gains (losses) | | | Income
from
affiliated
securities | | | Value, end of period | | | % of net
assets | |
Short-Term Investments | | | | | | | | | | | | | | | | | | | | | | | | | | | | | | | | | | | | |
Investment Companies | | | | | | | | | | | | | | | | | | | | | | | | | | | | | | | | | | | | |
Securities Lending Cash Investments LLC * | | | 2,171,758 | | | | 21,676,529 | | | | 23,848,287 | | | | 0 | | | $ | (1,003 | ) | | $ | 0 | | | $ | 18,851 | | | $ | 0 | | | | | |
Wells Fargo Government Money Market Fund Select Class | | | 2,588,003 | | | | 25,951,309 | | | | 26,051,364 | | | | 2,487,948 | | | | 0 | | | | 0 | | | | 28,050 | | | | 2,487,948 | | | | | |
| | | | | | | | | | | | | | | | | | | | | | | | | | | | | | | | | | | | |
| | | | | | | | | |
| | | | | | | | | | | | | | | | | | $ | (1,003 | ) | | $ | 0 | | | $ | 46,901 | | | $ | 2,487,948 | | | | 1.98 | % |
| | | | | | | | | | | | | | | | | | | | | | | | | | | | | | | | | | | | |
| | * | No longer held at the end of the period. |
The accompanying notes are an integral part of these financial statements.
| | | | |
| 12 | | Wells Fargo Endeavor Select Fund | | Statement of assets and liabilities—January 31, 2019 (unaudited) |
| | | | |
| | | | |
| |
Assets | | | | |
Investments in unaffiliated securities, at value (cost $77,098,829) | | $ | 125,440,786 | |
Investments in affiliated securities, at value (cost $2,487,948) | | | 2,487,948 | |
Receivable for Fund shares sold | | | 183,596 | |
Receivable for dividends | | | 28,975 | |
Receivable for securities lending income | | | 288 | |
Prepaid expenses and other assets | | | 139,307 | |
| | | | |
Total assets | | | 128,280,900 | |
| | | | |
| |
Liabilities | | | | |
Payable for investments purchased | | | 2,526,856 | |
Payable for Fund shares redeemed | | | 154,993 | |
Management fee payable | | | 54,492 | |
Administration fees payable | | | 14,701 | |
Distribution fee payable | | | 2,229 | |
Trustees’ fees and expenses payable | | | 2,209 | |
Due to custodian bank | | | 546 | |
Accrued expenses and other liabilities | | | 55,371 | |
| | | | |
Total liabilities | | | 2,811,397 | |
| | | | |
Total net assets | | $ | 125,469,503 | |
| | | | |
| |
NET ASSETS CONSIST OF | | | | |
Paid-in capital | | $ | 73,272,412 | |
Total distributable earnings | | | 52,197,091 | |
| | | | |
Total net assets | | $ | 125,469,503 | |
| | | | |
| |
COMPUTATION OF NET ASSET VALUE AND OFFERING PRICE PER SHARE | | | | |
Net assets – Class A | | $ | 14,238,564 | |
Shares outstanding – Class A1 | | | 2,018,426 | |
Net asset value per share – Class A | | | $7.05 | |
Maximum offering price per share – Class A2 | | | $7.48 | |
Net assets – Class C | | $ | 3,722,892 | |
Shares outstanding – Class C1 | | | 901,389 | |
Net asset value per share – Class C | | | $4.13 | |
Net assets – Administrator Class | | $ | 2,674,782 | |
Shares outstanding – Administrator Class1 | | | 345,632 | |
Net asset value per share – Administrator Class | | | $7.74 | |
Net assets – Institutional Class | | $ | 104,833,265 | |
Shares outstanding – Institutional Class1 | | | 12,815,064 | |
Net asset value per share – Institutional Class | | | $8.18 | |
| 1 | The Fund has an unlimited number of authorized shares. |
| 2 | Maximum offering price is computed as 100/94.25 of net asset value. On investments of $50,000 or more, the offering price is reduced. |
The accompanying notes are an integral part of these financial statements.
| | | | | | |
| Statement of operations—six months ended January 31, 2019 (unaudited) | | Wells Fargo Endeavor Select Fund | | | 13 | |
| | | | |
| | | | |
| |
Investment income | | | | |
Dividends (net of foreign withholding taxes of $3,807) | | $ | 539,995 | |
Income from affiliated securities | | | 32,359 | |
| | | | |
Total investment income | | | 572,354 | |
| | | | |
| |
Expenses | | | | |
Management fee | | | 493,007 | |
Administration fees | | | | |
Class A | | | 16,207 | |
Class C | | | 3,850 | |
Administrator Class | | | 1,802 | |
Institutional Class | | | 77,340 | |
Shareholder servicing fees | | | | |
Class A | | | 19,294 | |
Class C | | | 4,583 | |
Administrator Class | | | 3,465 | |
Distribution fee | | | | |
Class C | | | 13,750 | |
Custody and accounting fees | | | 7,009 | |
Professional fees | | | 22,893 | |
Registration fees | | | 30,246 | |
Shareholder report expenses | | | 17,644 | |
Trustees’ fees and expenses | | | 11,741 | |
Other fees and expenses | | | 6,248 | |
| | | | |
Total expenses | | | 729,079 | |
Less: Fee waivers and/or expense reimbursements | | | (110,917 | ) |
| | | | |
Net expenses | | | 618,162 | |
| | | | |
Net investment loss | | | (45,808 | ) |
| | | | |
| |
REALIZED AND UNREALIZED GAINS (LOSSES) ON INVESTMENTS | | | | |
| |
Net realized gains (losses) on: | | | | |
Unaffiliated securities | | | 9,549,243 | |
Affiliated securities | | | (1,003 | ) |
| | | | |
Net realized gains on investments | | | 9,548,240 | |
Net change in unrealized gains (losses) on investments | | | (13,170,545 | ) |
| | | | |
Net realized and unrealized gains (losses) on investments | | | (3,622,305 | ) |
| | | | |
Net decrease in net assets resulting from operations | | $ | (3,668,113 | ) |
| | | | |
The accompanying notes are an integral part of these financial statements.
| | | | |
| 14 | | Wells Fargo Endeavor Select Fund | | Statement of changes in net assets |
| | | | | | | | | | | | | | | | |
| | | Six months ended
January 31, 2019 (unaudited) | | | Year ended
July 31, 20181 | |
| | | | |
Operations | | | | | | | | | | | | | | | | |
Net investment loss | | | | | | $ | (45,808 | ) | | | | | | $ | (234,390 | ) |
Net realized gains on investments | | | | | | | 9,548,240 | | | | | | | | 29,720,347 | |
Net change in unrealized gains (losses) on investments | | | | | | | (13,170,545 | ) | | | | | | | 10,190,328 | |
| | | | |
Net increase (decrease) in net assets resulting from operations | | | | | | | (3,668,113 | ) | | | | | | | 39,676,285 | |
| | | | |
| | | | |
Distributions to shareholders from net investment income and net realized gains | | | | | | | | | | | | | | | | |
Class A | | | | | | | (3,430,850 | ) | | | | | | | (2,526,049 | ) |
Class C | | | | | | | (1,168,306 | ) | | | | | | | (946,756 | ) |
Administrator Class | | | | | | | (567,258 | ) | | | | | | | (597,659 | ) |
Institutional Class | | | | | | | (23,115,769 | ) | | | | | | | (24,176,044 | ) |
| | | | |
Total distributions to shareholders | | | | | | | (28,282,183 | ) | | | | | | | (28,246,508 | ) |
| | | | |
| | | | |
Capital share transactions | | | Shares | | | | | | | | Shares | | | | | |
Proceeds from shares sold | | | | | | | | | | | | | | | | |
Class A | | | 272,920 | | | | 2,232,943 | | | | 742,375 | | | | 6,708,296 | |
Class C | | | 114,398 | | | | 476,747 | | | | 68,071 | | | | 431,126 | |
Administrator Class | | | 15,813 | | | | 118,981 | | | | 8,610 | | | | 83,829 | |
Institutional Class | | | 547,899 | | | | 4,817,729 | | | | 829,379 | | | | 8,252,736 | |
| | | | |
| | | | |
| | | | | | | 7,646,400 | | | | | | | | 15,475,987 | |
| | | | |
Reinvestment of distributions | | | | | | | | | | | | | | | | |
Class A | | | 460,780 | | | | 3,073,403 | | | | 267,712 | | | | 2,179,176 | |
Class C | | | 298,728 | | | | 1,168,031 | | | | 168,269 | | | | 942,309 | |
Administrator Class | | | 77,421 | | | | 566,717 | | | | 65,748 | | | | 573,324 | |
Institutional Class | | | 2,976,015 | | | | 23,004,591 | | | | 2,647,483 | | | | 24,092,788 | |
| | | | |
| | | | |
| | | | | | | 27,812,742 | | | | | | | | 27,787,597 | |
| | | | |
Payment for shares redeemed | | | | | | | | | | | | | | | | |
Class A | | | (443,475 | ) | | | (3,444,550 | ) | | | (706,902 | ) | | | (6,353,582 | ) |
Class C | | | (98,663 | ) | | | (443,905 | ) | | | (189,968 | ) | | | (1,213,972 | ) |
Administrator Class | | | (50,698 | ) | | | (436,832 | ) | | | (155,500 | ) | | | (1,499,494 | ) |
Institutional Class | | | (3,170,028 | ) | | | (28,529,442 | ) | | | (5,501,471 | ) | | | (55,332,910 | ) |
| | | | |
| | | | |
| | | | | | | (32,854,729 | ) | | | | | | | (64,399,958 | ) |
| | | | |
Net increase (decrease) in net assets resulting from capital share transactions | | | | | | | 2,604,413 | | | | | | | | (21,136,374 | ) |
| | | | |
Total decrease in net assets | | | | | | | (29,345,883 | ) | | | | | | | (9,706,597 | ) |
| | | | |
| | | | |
Net assets | | | | | | | | | | | | | | | | |
Beginning of period | | | | | | | 154,815,386 | | | | | | | | 164,521,983 | |
| | | | |
End of period | | | | | | $ | 125,469,503 | | | | | | | $ | 154,815,386 | |
| | | | |
| 1 | Effective for all filings after November 4, 2018, the SEC prospectively eliminated the requirement to parenthetically disclose undistributed net investment income at the end of the period and permitted the aggregation of distributions, with the exception of tax basis returns of capital. Undistributed net investment income at July 31, 2018 was $0. The disaggregated distributions information for the year ended July 31, 2018 is included in Note 7,Distributions to Shareholders, in the notes to the financial statements. |
The accompanying notes are an integral part of these financial statements.
| | | | | | |
| Financial highlights | | Wells Fargo Endeavor Select Fund | | | 15 | |
(For a share outstanding throughout each period)
| | | | | | | | | | | | | | | | | | | | | | | | |
| | | Six months ended January 31, 2019 (unaudited) | | | Year ended July 31 | |
| CLASS A | | 2018 | | | 2017 | | | 2016 | | | 2015 | | | 2014 | |
Net asset value, beginning of period | | | $9.43 | | | | $9.09 | | | | $8.96 | | | | $13.74 | | | | $14.13 | | | | $12.52 | |
Net investment loss | | | (0.02 | )1 | | | (0.04 | )1 | | | (0.03 | )1 | | | (0.04 | )1 | | | (0.08 | )1 | | | (0.09 | )1 |
Net realized and unrealized gains (losses) on investments | | | (0.32 | ) | | | 2.23 | | | | 1.49 | | | | (0.14 | ) | | | 1.65 | | | | 2.37 | |
| | | | | | | | | | | | | | | | | | | | | | | | |
Total from investment operations | | | (0.34 | ) | | | 2.19 | | | | 1.46 | | | | (0.18 | ) | | | 1.57 | | | | 2.28 | |
Distributions to shareholders from | | | | | | | | | | | | | | | | | | | | | | | | |
Net realized gains | | | (2.04 | ) | | | (1.85 | ) | | | (1.33 | ) | | | (4.60 | ) | | | (1.96 | ) | | | (0.67 | ) |
Net asset value, end of period | | | $7.05 | | | | $9.43 | | | | $9.09 | | | | $8.96 | | | | $13.74 | | | | $14.13 | |
Total return2 | | | (2.36 | )% | | | 27.35 | % | | | 19.39 | % | | | (0.07 | )% | | | 12.14 | % | | | 18.40 | % |
Ratios to average net assets (annualized) | | | | | | | | | | | | | | | | | | | | | | | | |
Gross expenses | | | 1.30 | % | | | 1.25 | % | | | 1.22 | % | | | 1.28 | % | | | 1.24 | % | | | 1.25 | % |
Net expenses | | | 1.20 | % | | | 1.20 | % | | | 1.20 | % | | | 1.20 | % | | | 1.23 | % | | | 1.24 | % |
Net investment loss | | | (0.39 | )% | | | (0.49 | )% | | | (0.33 | )% | | | (0.36 | )% | | | (0.55 | )% | | | (0.66 | )% |
Supplemental data | | | | | | | | | | | | | | | | | | | | | | | | |
Portfolio turnover rate | | | 10 | % | | | 36 | % | | | 59 | % | | | 79 | % | | | 126 | % | | | 100 | % |
Net assets, end of period (000s omitted) | | | $14,239 | | | | $16,301 | | | | $12,953 | | | | $18,498 | | | | $26,197 | | | | $41,708 | |
| 1 | Calculated based upon average shares outstanding |
| 2 | Total return calculations do not include any sales charges. Returns for periods of less than one year are not annualized. |
The accompanying notes are an integral part of these financial statements.
| | | | |
| 16 | | Wells Fargo Endeavor Select Fund | | Financial highlights |
(For a share outstanding throughout each period)
| | | | | | | | | | | | | | | | | | | | | | | | |
| | | Six months ended January 31, 2019 (unaudited) | | | Year ended July 31 | |
| CLASS C | | 2018 | | | 2017 | | | 2016 | | | 2015 | | | 2014 | |
Net asset value, beginning of period | | | $6.46 | | | | $6.80 | | | | $7.09 | | | | $11.93 | | | | $12.61 | | | | $11.32 | |
Net investment loss | | | (0.03 | )1 | | | (0.08 | )1 | | | (0.07 | )1 | | | (0.09 | )1 | | | (0.16 | )1 | | | (0.17 | )1 |
Net realized and unrealized gains (losses) on investments | | | (0.26 | ) | | | 1.59 | | | | 1.11 | | | | (0.15 | ) | | | 1.44 | | | | 2.13 | |
| | | | | | | | | | | | | | | | | | | | | | | | |
Total from investment operations | | | (0.29 | ) | | | 1.51 | | | | 1.04 | | | | (0.24 | ) | | | 1.28 | | | | 1.96 | |
Distributions to shareholders from | | | | | | | | | | | | | | | | | | | | | | | | |
Net realized gains | | | (2.04 | ) | | | (1.85 | ) | | | (1.33 | ) | | | (4.60 | ) | | | (1.96 | ) | | | (0.67 | ) |
Net asset value, end of period | | | $4.13 | | | | $6.46 | | | | $6.80 | | | | $7.09 | | | | $11.93 | | | | $12.61 | |
Total return2 | | | (2.69 | )% | | | 26.43 | % | | | 18.46 | % | | | (0.76 | )% | | | 11.21 | % | | | 17.60 | % |
Ratios to average net assets (annualized) | | | | | | | | | | | | | | | | | | | | | | | | |
Gross expenses | | | 2.05 | % | | | 2.00 | % | | | 1.97 | % | | | 2.03 | % | | | 1.99 | % | | | 2.00 | % |
Net expenses | | | 1.95 | % | | | 1.95 | % | | | 1.95 | % | | | 1.95 | % | | | 1.99 | % | | | 1.99 | % |
Net investment loss | | | (1.15 | )% | | | (1.22 | )% | | | (1.08 | )% | | | (1.11 | )% | | | (1.32 | )% | | | (1.41 | )% |
Supplemental data | | | | | | | | | | | | | | | | | | | | | | | | |
Portfolio turnover rate | | | 10 | % | | | 36 | % | | | 59 | % | | | 79 | % | | | 126 | % | | | 100 | % |
Net assets, end of period (000s omitted) | | | $3,723 | | | | $3,792 | | | | $3,676 | | | | $4,845 | | | | $6,914 | | | | $6,747 | |
| 1 | Calculated based upon average shares outstanding |
| 2 | Total return calculations do not include any sales charges. Returns for periods of less than one year are not annualized. |
The accompanying notes are an integral part of these financial statements.
| | | | | | |
| Financial highlights | | Wells Fargo Endeavor Select Fund | | | 17 | |
(For a share outstanding throughout each period)
| | | | | | | | | | | | | | | | | | | | | | | | |
| | | Six months ended January 31, 2019 (unaudited) | | | Year ended July 31 | |
| ADMINISTRATOR CLASS | | 2018 | | | 2017 | | | 2016 | | | 2015 | | | 2014 | |
Net asset value, beginning of period | | | $10.12 | | | | $9.62 | | | | $9.38 | | | | $14.13 | | | | $14.45 | | | | $12.78 | |
Net investment income (loss) | | | (0.01 | )1 | | | (0.03 | )1 | | | (0.01 | )1 | | | 0.01 | 1 | | | (0.05 | )1 | | | (0.06 | )1 |
Net realized and unrealized gains (losses) on investments | | | (0.33 | ) | | | 2.38 | | | | 1.58 | | | | (0.16 | ) | | | 1.69 | | | | 2.42 | |
| | | | | | | | | | | | | | | | | | | | | | | | |
Total from investment operations | | | (0.34 | ) | | | 2.35 | | | | 1.57 | | | | (0.15 | ) | | | 1.64 | | | | 2.36 | |
Distributions to shareholders from | | | | | | | | | | | | | | | | | | | | | | | | |
Net investment income | | | 0.00 | | | | 0.00 | | | | 0.00 | | | | 0.00 | | | | 0.00 | | | | (0.02 | ) |
Net realized gains | | | (2.04 | ) | | | (1.85 | ) | | | (1.33 | ) | | | (4.60 | ) | | | (1.96 | ) | | | (0.67 | ) |
| | | | | | | | | | | | | | | | | | | | | | | | |
Total distributions to shareholders | | | (2.04 | ) | | | (1.85 | ) | | | (1.33 | ) | | | (4.60 | ) | | | (1.96 | ) | | | (0.69 | ) |
Net asset value, end of period | | | $7.74 | | | | $10.12 | | | | $9.62 | | | | $9.38 | | | | $14.13 | | | | $14.45 | |
Total return2 | | | (2.19 | )% | | | 27.55 | % | | | 19.71 | % | | | 0.16 | % | | | 12.38 | % | | | 18.77 | % |
Ratios to average net assets (annualized) | | | | | | | | | | | | | | | | | | | | | | | | |
Gross expenses | | | 1.22 | % | | | 1.16 | % | | | 1.14 | % | | | 1.14 | % | | | 1.05 | % | | | 1.06 | % |
Net expenses | | | 1.00 | % | | | 1.00 | % | | | 1.00 | % | | | 1.00 | % | | | 0.99 | % | | | 1.00 | % |
Net investment income (loss) | | | (0.19 | )% | | | (0.28 | )% | | | (0.12 | )% | | | 0.06 | % | | | (0.32 | )% | | | (0.42 | )% |
Supplemental data | | | | | | | | | | | | | | | | | | | | | | | | |
Portfolio turnover rate | | | 10 | % | | | 36 | % | | | 59 | % | | | 79 | % | | | 126 | % | | | 100 | % |
Net assets, end of period (000s omitted) | | | $2,675 | | | | $3,068 | | | | $3,695 | | | | $5,254 | | | | $42,776 | | | | $48,560 | |
| 1 | Calculated based upon average shares outstanding |
| 2 | Returns for periods of less than one year are not annualized. |
The accompanying notes are an integral part of these financial statements.
| | | | |
| 18 | | Wells Fargo Endeavor Select Fund | | Financial highlights |
(For a share outstanding throughout each period)
| | | | | | | | | | | | | | | | | | | | | | | | |
| | | Six months ended January 31, 2019 (unaudited) | | | Year ended July 31 | |
| INSTITUTIONAL CLASS | | 2018 | | | 2017 | | | 2016 | | | 2015 | | | 2014 | |
Net asset value, beginning of period | | | $10.57 | | | | $9.95 | | | | $9.65 | | | | $14.39 | | | | $14.65 | | | | $12.95 | |
Net investment income (loss) | | | 0.00 | 1,2 | | | (0.01 | )1 | | | 0.00 | 1,2 | | | 0.00 | 1,2 | | | (0.01 | )1 | | | (0.03 | )1 |
Net realized and unrealized gains (losses) on investments | | | (0.35 | ) | | | 2.49 | | | | 1.64 | | | | (0.14 | ) | | | 1.71 | | | | 2.45 | |
| | | | | | | | | | | | | | | | | | | | | | | | |
Total from investment operations | | | (0.35 | ) | | | 2.48 | | | | 1.64 | | | | (0.14 | ) | | | 1.70 | | | | 2.42 | |
Distributions to shareholders from | | | | | | | | | | | | | | | | | | | | | | | | |
Net investment income | | | 0.00 | | | | (0.01 | ) | | | (0.01 | ) | | | 0.00 | | | | 0.00 | | | | (0.05 | ) |
Net realized gains | | | (2.04 | ) | | | (1.85 | ) | | | (1.33 | ) | | | (4.60 | ) | | | (1.96 | ) | | | (0.67 | ) |
| | | | | | | | | | | | | | | | | | | | | | | | |
Total distributions to shareholders | | | (2.04 | ) | | | (1.86 | ) | | | (1.34 | ) | | | (4.60 | ) | | | (1.96 | ) | | | (0.72 | ) |
Net asset value, end of period | | | $8.18 | | | | $10.57 | | | | $9.95 | | | | $9.65 | | | | $14.39 | | | | $14.65 | |
Total return3 | | | (2.18 | )% | | | 28.01 | % | | | 19.87 | % | | | 0.27 | % | | | 12.63 | % | | | 18.98 | % |
Ratios to average net assets (annualized) | | | | | | | | | | | | | | | | | | | | | | | | |
Gross expenses | | | 0.97 | % | | | 0.92 | % | | | 0.89 | % | | | 0.95 | % | | | 0.81 | % | | | 0.82 | % |
Net expenses | | | 0.80 | % | | | 0.80 | % | | | 0.80 | % | | | 0.80 | % | | | 0.80 | % | | | 0.80 | % |
Net investment income (loss) | | | 0.01 | % | | | (0.08 | )% | | | 0.05 | % | | | 0.04 | % | | | (0.09 | )% | | | (0.22 | )% |
Supplemental data | | | | | | | | | | | | | | | | | | | | | | | | |
Portfolio turnover rate | | | 10 | % | | | 36 | % | | | 59 | % | | | 79 | % | | | 126 | % | | | 100 | % |
Net assets, end of period (000s omitted) | | | $104,833 | | | | $131,655 | | | | $144,199 | | | | $162,935 | | | | $221,801 | | | | $618,502 | |
| 1 | Calculated based upon average shares outstanding |
| 2 | Amount is less than $0.005. |
| 3 | Returns for periods of less than one year are not annualized. |
The accompanying notes are an integral part of these financial statements.
| | | | | | |
| Notes to financial statements (unaudited) | | Wells Fargo Endeavor Select Fund | | | 19 | |
1. ORGANIZATION
Wells Fargo Funds Trust (the “Trust”), a Delaware statutory trust organized on March 10, 1999, is an open-end management investment company registered under the Investment Company Act of 1940, as amended (the “1940 Act”). As an investment company, the Trust follows the accounting and reporting guidance in Financial Accounting Standards Board (“FASB”) Accounting Standards Codification Topic 946, Financial Services – Investment Companies. These financial statements report on the Wells Fargo Endeavor Select Fund (the “Fund”) which is a diversified series of the Trust.
2. SIGNIFICANT ACCOUNTING POLICIES
The following significant accounting policies, which are consistently followed in the preparation of the financial statements of the Fund, are in conformity with U.S. generally accepted accounting principles which require management to make estimates and assumptions that affect the reported amounts of assets and liabilities, disclosure of contingent assets and liabilities at the date of the financial statements, and the reported amounts of revenues and expenses during the reporting period. Actual results could differ from those estimates.
Securities valuation
All investments are valued each business day as of the close of regular trading on the New York Stock Exchange (generally 4 p.m. Eastern Time), although the Fund may deviate from this calculation time under unusual or unexpected circumstances.
Equity securities that are listed on a foreign or domestic exchange or market are valued at the official closing price or, if none, the last sales price. If no sale occurs on the principal exchange or market that day, a fair value price will be determined in accordance with the Fund’s Valuation Procedures.
Investments in registered open-end investment companies are valued at net asset value. Interests in non-registered investment companies that are redeemable at net asset value are fair valued normally at net asset value.
Investments which are not valued using any of the methods discussed above are valued at their fair value, as determined in good faith by the Board of Trustees of the Fund. The Board of Trustees has established a Valuation Committee comprised of the Trustees and has delegated to it the authority to take any actions regarding the valuation of portfolio securities that the Valuation Committee deems necessary or appropriate, including determining the fair value of portfolio securities, unless the determination has been delegated to the Wells Fargo Asset Management Pricing Committee at Wells Fargo Funds Management, LLC (“Funds Management”). The Board of Trustees retains the authority to make or ratify any valuation decisions or approve any changes to the Valuation Procedures as it deems appropriate. On a quarterly basis, the Board of Trustees receives reports on any valuation actions taken by the Valuation Committee or the Wells Fargo Asset Management Pricing Committee which may include items for ratification.
Foreign currency translation
The accounting records of the Fund are maintained in U.S. dollars. The values of other assets and liabilities denominated in foreign currencies are translated into U.S. dollars at rates provided by an independent foreign currency pricing source at a time each business day specified by the Wells Fargo Asset Management Pricing Committee. Purchases and sales of securities, and income and expenses are converted at the rate of exchange on the respective dates of such transactions. Net realized foreign exchange gains or losses arise from sales of foreign currencies, currency gains or losses realized between the trade and settlement dates on securities transactions, and the difference between the amounts of dividends, interest and foreign withholding taxes recorded and the U.S. dollar equivalent of the amounts actually paid or received. Net unrealized foreign exchange gains and losses arise from changes in the fair value of assets and liabilities other than investments in securities resulting from changes in exchange rates. The changes in net assets arising from changes in exchange rates of securities and the changes in net assets resulting from changes in market prices of securities are not separately presented. Such changes are included in net realized and unrealized gains or losses from investments.
Securities lending
The Fund may lend its securities from time to time in order to earn additional income in the form of fees or interest on securities received as collateral or the investment of any cash received as collateral. The Fund continues to receive interest or dividends on the securities loaned. The Fund receives collateral in the form of cash or securities with a value at least equal to the value of the securities on loan. The value of the loaned securities is determined at the close of each business day and any additional required collateral is delivered to the Fund on the next business day. In a securities lending transaction, the net asset value of the Fund will be affected by an increase or decrease in the value of the securities loaned and by an increase or decrease in the value of the instrument in which collateral is invested. The amount of securities lending activity undertaken
| | | | |
| 20 | | Wells Fargo Endeavor Select Fund | | Notes to financial statements (unaudited) |
by the Fund fluctuates from time to time. In the event of default or bankruptcy by the borrower, the Fund may be prevented from recovering the loaned securities or gaining access to the collateral or may experience delays or costs in doing so. In addition, the investment of any cash collateral received may lose all or part of its value. The Fund has the right under the lending agreement to recover the securities from the borrower on demand.
The Fund lends its securities through an unaffiliated securities lending agent. Cash collateral received in connection with its securities lending transactions is invested in Securities Lending Cash Investments, LLC (the “Securities Lending Fund”). The Securities Lending Fund is exempt from registration under Section 3(c)(7) of the 1940 Act and is managed by Funds Management and is subadvised by Wells Capital Management Incorporated (“WellsCap”), an affiliate of Funds Management and an indirect wholly owned subsidiary of Wells Fargo & Company (“Wells Fargo”). Funds Management receives an advisory fee starting at 0.05% and declining to 0.01% as the average daily net assets of the Securities Lending Fund increase. All of the fees received by Funds Management are paid to WellsCap for its services as subadviser. The Securities Lending Fund seeks to provide a positive return compared to the daily Fed Funds Open Rate by investing in high-quality, U.S. dollar-denominated short-term money market instruments. Securities Lending Fund investments are valued at the evaluated bid price provided by an independent pricing service. Income earned from investment in the Securities Lending Fund (net of fees and rebates), if any, is included in income from affiliated securities on the Statement of Operations.
Security transactions and income recognition
Securities transactions are recorded on a trade date basis. Realized gains or losses are recorded on the basis of identified cost.
Dividend income is recognized on the ex-dividend date. Dividend income is recorded net of foreign taxes withheld where recovery of such taxes is not assured.
Distributions to shareholders
Distributions to shareholders from net investment income and any net realized gains are recorded on the ex-dividend date and paid at least annually. Such distributions are determined in accordance with income tax regulations and may differ from U.S. generally accepted accounting principles. Dividend sources are estimated at the time of declaration. The tax character of distributions is determined as of the Fund’s fiscal year end. Therefore, a portion of the Fund’s distributions made prior to the Fund’s fiscal year end may be categorized as a tax return of capital at year end.
Federal and other taxes
The Fund intends to continue to qualify as a regulated investment company by distributing substantially all of its investment company taxable income and any net realized capital gains (after reduction for capital loss carryforwards) sufficient to relieve it from all, or substantially all, federal income taxes. Accordingly, no provision for federal income taxes was required.
The Fund’s income and federal excise tax returns and all financial records supporting those returns for the prior three fiscal years are subject to examination by the federal and Delaware revenue authorities. Management has analyzed the Fund’s tax positions taken on federal, state, and foreign tax returns for all open tax years and does not believe that there are any uncertain tax positions that require recognition of a tax liability.
As of January 31, 2019, the aggregate cost of all investments for federal income tax purposes was $79,509,623 and the unrealized gains (losses) consisted of:
| | | | |
| |
Gross unrealized gains | | $ | 49,564,004 | |
| |
Gross unrealized losses | | | (1,144,893 | ) |
| |
Net unrealized gains | | $ | 48,419,111 | |
Class allocations
The separate classes of shares offered by the Fund differ principally in applicable sales charges, distribution, shareholder servicing, and administration fees. Class specific expenses are charged directly to that share class. Investment income, common expenses, and realized and unrealized gains (losses) on investments are allocated daily to each class of shares based on the relative proportion of net assets of each class.
| | | | | | |
| Notes to financial statements (unaudited) | | Wells Fargo Endeavor Select Fund | | | 21 | |
3. FAIR VALUATION MEASUREMENTS
Fair value measurements of investments are determined within a framework that has established a fair value hierarchy based upon the various data inputs utilized in determining the value of the Fund’s investments. The three-level hierarchy gives the highest priority to unadjusted quoted prices in active markets for identical assets or liabilities (Level 1) and the lowest priority to unobservable inputs (Level 3). The Fund’s investments are classified within the fair value hierarchy based on the lowest level of input that is significant to the fair value measurement. The inputs are summarized into three broad levels as follows:
| ∎ | | Level 1 – quoted prices in active markets for identical securities |
| ∎ | | Level 2 – other significant observable inputs (including quoted prices for similar securities, interest rates, prepayment speeds, credit risk, etc.) |
| ∎ | | Level 3 – significant unobservable inputs (including the Fund’s own assumptions in determining the fair value of investments) |
The inputs or methodologies used for valuing investments in securities are not necessarily an indication of the risk associated with investing in those securities.
The following is a summary of the inputs used in valuing the Fund’s assets and liabilities as of January 31, 2019:
| | | | | | | | | | | | | | | | |
| | | | |
| | | Quoted prices (Level 1) | | | Other significant
observable inputs
(Level 2) | | | Significant
unobservable inputs (Level 3) | | | Total | |
| | | | |
Assets | | | | | | | | | | | | | | | | |
Investments in: | | | | | | | | | | | | | | | | |
| | | | |
Common stocks | | | | | | | | | | | | | | | | |
| | | | |
Communication services | | $ | 15,503,555 | | | $ | 0 | | | $ | 0 | | | $ | 15,503,555 | |
| | | | |
Consumer discretionary | | | 22,097,578 | | | | 0 | | | | 0 | | | | 22,097,578 | |
| | | | |
Financials | | | 8,964,223 | | | | 0 | | | | 0 | | | | 8,964,223 | |
| | | | |
Health care | | | 17,095,803 | | | | 0 | | | | 0 | | | | 17,095,803 | |
| | | | |
Industrials | | | 12,408,024 | | | | 0 | | | | 0 | | | | 12,408,024 | |
| | | | |
Information technology | | | 38,616,135 | | | | 0 | | | | 0 | | | | 38,616,135 | |
| | | | |
Materials | | | 8,492,096 | | | | 0 | | | | 0 | | | | 8,492,096 | |
| | | | |
Real estate | | | 2,263,372 | | | | 0 | | | | 0 | | | | 2,263,372 | |
| | | | |
Short-term investments | | | | | | | | | | | | | | | | |
| | | | |
Investment companies | | | 2,487,948 | | | | 0 | | | | 0 | | | | 2,487,948 | |
| | | | |
Total assets | | $ | 127,928,734 | | | $ | 0 | | | $ | 0 | | | $ | 127,928,734 | |
Additional sector, industry or geographic detail is included in the Portfolio of Investments.
At January 31, 2019, the Fund did not have any transfers into/out of Level 3.
4. TRANSACTIONS WITH AFFILIATES
Management fee
Funds Management, an indirect wholly owned subsidiary of Wells Fargo, is the manager of the Fund and provides advisory and fund-level administrative services under an investment management agreement. Under the investment management agreement, Funds Management is responsible for, among other services, implementing the investment objectives and strategies of the Fund, supervising the subadviser and providing fund-level administrative services in connection with the Fund’s operations. As compensation for its services under the investment management agreement, Funds Management is entitled to receive an annual management fee starting at 0.70% and declining to 0.505% as the average daily net assets of the Fund increase. For the six months ended January 31, 2019, the management fee was equivalent to an annual rate of 0.70% of the Fund’s average daily net assets.
Funds Management has retained the services of a subadviser to provide daily portfolio management to the Fund. The fee for subadvisory services is borne by Funds Management. WellsCap is the subadviser to the Fund and is entitled to receive a fee from Funds Management at an annual rate starting at 0.30% and declining to 0.20% as the average daily net assets of the Fund increase.
| | | | |
| 22 | | Wells Fargo Endeavor Select Fund | | Notes to financial statements (unaudited) |
Administration fees
Under a class-level administration agreement, Funds Management provides class-level administrative services to the Fund, which includes paying fees and expenses for services provided by the transfer agent, sub-transfer agents, omnibus account servicers and record-keepers. As compensation for its services under the class-level administration agreement, Funds Management receives an annual fee which is calculated based on the average daily net assets of each class as follows:
| | | | |
| | | Class-level
administration fee | |
| |
Class A, Class C | | | 0.21 | % |
| |
Administrator Class, Institutional Class | | | 0.13 | |
Funds Management has contractually waived and/or reimbursed management and administration fees to the extent necessary to maintain certain net operating expense ratios for the Fund. When each class of the Fund has exceeded its expense cap, Funds Management has waived fees and/or reimbursed expenses from fund level expenses on a proportionate basis and then from class specific expenses; otherwise, waivers and/or reimbursements are applied against class specific expenses before fund level expenses. Funds Management has committed through November 30, 2019 to waive fees and/or reimburse expenses to the extent necessary to cap the Fund’s expenses at 1.20% for Class A shares, 1.95% for Class C shares, 1.00% for Administrator Class shares, and 0.80% for Institutional Class shares. Prior to or after the commitment expiration date, the cap may be increased or the commitment to maintain the cap may be terminated only with the approval of the Board of Trustees.
Distribution fee
The Trust has adopted a distribution plan for Class C shares of the Fund pursuant to Rule 12b-1 under the 1940 Act. A distribution fee is charged to Class C shares and paid to Wells Fargo Funds Distributor, LLC (“Funds Distributor”), the principal underwriter, at an annual rate of 0.75% of the average daily net assets of Class C shares.
In addition, Funds Distributor is entitled to receive the front-end sales charge from the purchase of Class A shares and a contingent deferred sales charge on the redemption of certain Class A shares. Funds Distributor is also entitled to receive the contingent deferred sales charges from redemptions of Class C shares. For the six months ended January 31, 2019, Funds Distributor received $2,309 from the sale of Class A shares. No contingent deferred sales charges were incurred by Class A and Class C shares for the six months ended January 31, 2019.
Shareholder servicing fees
The Trust has entered into contracts with one or more shareholder servicing agents, whereby Class A, Class C, and Administrator Class of the Fund are charged a fee at an annual rate of 0.25% of the average daily net assets of each respective class.
A portion of these total shareholder servicing fees were paid to affiliates of Wells Fargo.
Interfund transactions
The Fund may purchase or sell portfolio investment securities to certain other Wells Fargo affiliates pursuant to Rule 17a-7 under the 1940 Act and under procedures adopted by the Board of Trustees. The procedures have been designed to ensure that these interfund transactions, which do not incur broker commissions, are effected at current market prices.
5. INVESTMENT PORTFOLIO TRANSACTIONS
Purchases and sales of investments, excluding U.S. government obligations (if any) and short-term securities, for the six months ended January 31, 2019 were $13,780,664 and $36,751,657, respectively.
6. BANK BORROWINGS
The Trust (excluding the money market funds), Wells Fargo Master Trust and Wells Fargo Variable Trust are parties to a $280,000,000 revolving credit agreement whereby the Fund is permitted to use bank borrowings for temporary or emergency purposes, such as to fund shareholder redemption requests. Interest under the credit agreement is charged to the Fund based on a borrowing rate equal to the higher of the Federal Funds rate in effect on that day plus 1.25% or the overnight LIBOR rate in effect on that day plus 1.25%. In addition, an annual commitment fee equal to 0.25% of the unused balance is allocated to each participating fund.
For the six months ended January 31, 2019, there were no borrowings by the Fund under the agreement.
| | | | | | |
| Notes to financial statements (unaudited) | | Wells Fargo Endeavor Select Fund | | | 23 | |
7. DISTRIBUTIONS TO SHAREHOLDERS
Effective for all filings after November 4, 2018, the Securities and Exchange Commission eliminated the requirement to separately state the components of distributions to shareholders under U.S. generally accepted accounting principles. The amounts of distributions to shareholders for the year ended July 31, 2018 were as follows:
| | | | | | | | |
| | | Net investment
income | | | Net realized
gains | |
| | |
Class A | | | $ 0 | | | | $ 2,526,049 | |
| | |
Class C | | | 0 | | | | 946,756 | |
| | |
Administrator Class | | | 0 | | | | 597,659 | |
| | |
Institutional Class | | | 159,467 | | | | 24,016,577 | |
8. CONCENTRATION RISK
Concentration risks result from exposure to a limited number of sectors. A fund that invests a substantial portion of its assets in any sector may be more affected by changes in that sector than would be a fund whose investments are not heavily weighted in any sector.
9. INDEMNIFICATION
Under the Trust’s organizational documents, the officers and Trustees have been granted certain indemnification rights against certain liabilities that may arise out of performance of their duties to the Trust. Additionally, in the normal course of business, the Trust may enter into contracts with service providers that contain a variety of indemnification clauses. The Trust’s maximum exposure under these arrangements is dependent on future claims that may be made against the Fund and, therefore, cannot be estimated.
10. NEW ACCOUNTING PRONOUNCEMENT
In August 2018, FASB issued Accounting Standards Update (“ASU”) No. 2018-13, Fair Value Measurement (Topic 820)Disclosure Framework—Changes to the Disclosure Requirements for Fair Value Measurement. ASU 2018-13 updates the disclosure requirements for fair value measurements by modifying or removing certain disclosures and adding certain new disclosures. The amendments are effective for fiscal years, and interim periods within those fiscal years, beginning after December 15, 2019. Early adoption is permitted. Management has early adopted the removal and modification disclosures, as permitted, and will adopt the additional new disclosures at the effective date.
| | | | |
| 24 | | Wells Fargo Endeavor Select Fund | | Other information (unaudited) |
PROXY VOTING INFORMATION
A description of the policies and procedures used to determine how to vote proxies relating to portfolio securities is available, upon request, by calling1-800-222-8222, visiting our website atwellsfargofunds.com, or visiting the SEC website at sec.gov. Information regarding how the Fund voted proxies relating to portfolio securities during the most recent 12-month period ended June 30 is available on the Fund’s website atwellsfargofunds.comor by visiting the SEC website at sec.gov.
PORTFOLIO HOLDINGS INFORMATION
The complete portfolio holdings for the Fund are publicly available monthly on the Fund’s website (wellsfargofunds.com), on a one-month delayed basis. In addition, top ten holdings information (excluding derivative positions) for the Fund is publicly available on the Fund’s website on a monthly, seven-day or more delayed basis. The Fund files its complete schedule of portfolio holdings with the SEC for the first and third quarters of each fiscal year on Form N-Q, which is available by visiting the SEC website at sec.gov. In addition, the Fund’s Form N-Q may be reviewed and copied at the SEC’s Public Reference Room in Washington, DC, and at regional offices in New York City, at 233 Broadway, and in Chicago, at 175 West Jackson Boulevard, Suite 900. Information about the Public Reference Room may be obtained by calling 1-800-SEC-0330.
| | | | | | |
| Other information (unaudited) | | Wells Fargo Endeavor Select Fund | | | 25 | |
BOARD OF TRUSTEES AND OFFICERS
Each of the Trustees and Officers1 listed in the table below acts in identical capacities for each fund in the Wells Fargo family of funds, which consists of 152 mutual funds comprising the Wells Fargo Funds Trust, Wells Fargo Variable Trust, Wells Fargo Master Trust and four closed-end funds (collectively the “Fund Complex”). This table should be read in conjunction with the Prospectus and the Statement of Additional Information2. The mailing address of each Trustee and Officer is 525 Market Street, 12th Floor, San Francisco, CA 94105. Each Trustee and Officer serves an indefinite term, however, each Trustee serves such term until reaching the mandatory retirement age established by the Trustees.
Independent Trustees
| | | | | | |
Name and year of birth | | Position held and length of service* | | Principal occupations during past five years or longer | | Current other public company or
investment company
directorships |
| | | |
William R. Ebsworth (Born 1957) | | Trustee, since 2015 | | Retired. From 1984 to 2013, equities analyst, portfolio manager, research director and chief investment officer at Fidelity Management and Research Company in Boston, Tokyo, and Hong Kong, and retired in 2013 as Chief Investment Officer of Fidelity Strategic Advisers, Inc. where he led a team of investment professionals managing client assets. Prior thereto, Board member of Hong Kong Securities Clearing Co., Hong Kong Options Clearing Corp., the Thailand International Fund, Ltd., Fidelity Investments Life Insurance Company, and Empire Fidelity Investments Life Insurance Company. Audit Committee Chair and Investment Committee Chair of the Vincent Memorial Hospital Endowment (non-profit organization). Mr. Ebsworth is a CFA® charterholder. | | N/A |
| | | |
Jane A. Freeman (Born 1953) | | Trustee, since 2015; Chair Liaison, since 2018 | | Retired. From 2012 to 2014 and 1999 to 2008, Chief Financial Officer of Scientific Learning Corporation. From 2008 to 2012, Ms. Freeman provided consulting services related to strategic business projects. Prior to 1999, Portfolio Manager at Rockefeller & Co. and Scudder, Stevens & Clark. Board member of the Harding Loevner Funds from 1996 to 2014, serving as both Lead Independent Director and chair of the Audit Committee. Board member of the Russell Exchange Traded Funds Trust from 2011 to 2012 and the chair of the Audit Committee. Ms. Freeman is a Board Member of The Ruth Bancroft Garden (non-profit organization). She is also an inactive Chartered Financial Analyst. | | N/A |
| | | |
Isaiah Harris, Jr.3 (Born 1952) | | Trustee, since 2009; Audit Committee Chairman, since 2019 | | Retired. Chairman of the Board of CIGNA Corporation since 2009, and Director since 2005. From 2003 to 2011, Director of Deluxe Corporation. Prior thereto, President and CEO of BellSouth Advertising and Publishing Corp. from 2005 to 2007, President and CEO of BellSouth Enterprises from 2004 to 2005 and President of BellSouth Consumer Services from 2000 to 2003. Emeritus member of the Iowa State University Foundation Board of Governors. Emeritus Member of the Advisory Board of Iowa State University School of Business. Advisory Board Member, Palm Harbor Academy (private school). Advisory Board Member, Child Evangelism Fellowship (non-profit). Mr. Harris is a certified public accountant (inactive status). | | CIGNA Corporation |
| | | |
Judith M. Johnson3 (Born 1949) | | Trustee, since 2008; Audit Committee Chairman, from 2009 to 2018 | | Retired. Prior thereto, Chief Executive Officer and Chief Investment Officer of Minneapolis Employees Retirement Fund from 1996 to 2008. Ms. Johnson is an attorney, certified public accountant and a certified managerial accountant. | | N/A |
| | | |
David F. Larcker (Born 1950) | | Trustee, since 2009 | | James Irvin Miller Professor of Accounting at the Graduate School of Business, Stanford University, Director of the Corporate Governance Research Initiative and Senior Faculty of The Rock Center for Corporate Governance since 2006. From 2005 to 2008, Professor of Accounting at the Graduate School of Business, Stanford University. Prior thereto, Ernst & Young Professor of Accounting at The Wharton School, University of Pennsylvania from 1985 to 2005. | | N/A |
| | | | |
| 26 | | Wells Fargo Endeavor Select Fund | | Other information (unaudited) |
| | | | | | |
Name and year of birth | | Position held and length of service* | | Principal occupations during past five years or longer | | Current other public company or
investment company
directorships |
| | | |
Olivia S. Mitchell (Born 1953) | | Trustee, since 2006; Nominating and Governance Committee Chairman, since 2018 | | International Foundation of Employee Benefit Plans Professor, Wharton School of the University of Pennsylvania since 1993. Director of Wharton’s Pension Research Council and Boettner Center on Pensions & Retirement Research, and Research Associate at the National Bureau of Economic Research. Previously, Cornell University Professor from 1978 to 1993. | | N/A |
| | | |
Timothy J. Penny (Born 1951) | | Trustee, since 1996; Chairman, since 2018; Vice Chairman, from 2017 to 2018 | | President and Chief Executive Officer of Southern Minnesota Initiative Foundation, a non-profit organization, since 2007. Member of the Board of Trustees of NorthStar Education Finance, Inc., a non-profit organization, since 2007. | | N/A |
| | | |
James G. Polisson (Born 1959) | | Trustee, since 2018; Advisory Board Member, from 2017 to 2018 | | Retired. Chief Marketing Officer, Source (ETF) UK Services, Ltd, from 2015 to 2017. From 2012 to 2015, Principal of The Polisson Group, LLC, a management consulting, corporate advisory and principal investing company. Chief Executive Officer and Managing Director at Russell Investments, Global Exchange Traded Funds from 2010 to 2012. Managing Director of Barclays Global Investors from 1998 to 2010 and Global Chief Marketing Officer for iShares and Barclays Global Investors from 2000 to 2010. Trustee of the San Francisco Mechanics’ Institute, a non-profit organization, from 2013 to 2015. Board member of the Russell Exchange Traded Fund Trust from 2011 to 2012. Director of Barclays Global Investors Holdings Deutschland GmbH from 2006 to 2009. Mr. Polisson is an attorney and has a retired status with the Massachusetts and District of Columbia Bar Associations. | | N/A |
| | | |
Pamela Wheelock (Born 1959) | | Trustee, since 2018; Advisory Board Member, from 2017 to 2018 | | Board member of the Destination Medical Center Economic Development Agency, Rochester, Minnesota since 2019. Chief Operating Officer, Twin Cities Habitat for Humanity from 2017 to 2019. Vice President of University Services, University of Minnesota from 2012 to 2016. Prior thereto, on the Board of Directors, Governance Committee and Finance Committee for the Minnesota Philanthropy Partners (Saint Paul Foundation) from 2012 to 2018, Interim Chief Executive Officer of Blue Cross Blue Shield of Minnesota from 2011 to 2012, Chairman of the Board from 2009 to 2012 and Board Director from 2003 to 2015. Vice President, Leadership and Community Engagement, Bush Foundation, Saint Paul, Minnesota (a private foundation) from 2009 to 2011. Executive Vice President and Chief Financial Officer, Minnesota Sports and Entertainment from 2004 to 2009 and Senior Vice President from 2002 to 2004. Executive Vice President of the Minnesota Wild Foundation from 2004 to 2008. Commissioner of Finance, State of Minnesota, from 1999 to 2002. Currently Board Chair of the Minnesota Wild Foundation since 2010. | | N/A |
| * | Length of service dates reflect the Trustee’s commencement of service with the Trust’s predecessor entities, where applicable. |
| | | | | | |
| Other information (unaudited) | | Wells Fargo Endeavor Select Fund | | | 27 | |
Officers
| | | | | | |
Name and year of birth | | Position held and
length of service | | Principal occupations during past five years or longer | | |
| | | |
Andrew Owen (Born 1960) | | President, since 2017 | | Executive Vice President of Wells Fargo & Company and Head of Affiliated Managers, Wells Fargo Asset Management, since 2014. In addition, Mr. Owen is currently President, Chief Executive Officer and Director of Wells Fargo Funds Management, LLC since 2017. Prior thereto, Executive Vice President responsible for marketing, investments and product development for Wells Fargo Funds Management, LLC, from 2009 to 2014. | | |
| | | |
Jeremy DePalma1 (Born 1974) | | Treasurer, since 2012 | | Senior Vice President of Wells Fargo Funds Management, LLC since 2009. Senior Vice President of Evergreen Investment Management Company, LLC from 2008 to 2010 and head of the Fund Reporting and Control Team within Fund Administration from 2005 to 2010. | | |
| | | |
Alexander Kymn (Born 1973) | | Secretary, since 2018; Chief Legal Officer, since 2018 | | Senior Company Counsel of Wells Fargo Bank, N.A. since 2018 (previously Senior Counsel from 2007 to 2018). Vice President of Wells Fargo Funds Management, LLC from 2008 to 2014. | | |
| | | |
Michael H. Whitaker (Born 1967) | | Chief Compliance Officer, since 2016 | | Senior Vice President and Chief Compliance Officer since 2016. Senior Vice President and Chief Compliance Officer for Fidelity Investments from 2007 to 2016. | | |
| | | |
David Berardi (Born 1975) | | Assistant Treasurer, since 2009 | | Vice President of Wells Fargo Funds Management, LLC since 2009. Vice President of Evergreen Investment Management Company, LLC from 2008 to 2010. Manager of Fund Reporting and Control for Evergreen Investment Management Company, LLC from 2004 to 2010. | | |
| 1 | Jeremy DePalma acts as Treasurer of 76 funds and Assistant Treasurer of 76 funds in the Fund Complex. |
| 2 | The Statement of Additional Information includes additional information about the Trustees and is available, without charge, upon request, by calling1-800-260-5969 or by visiting the website atwellsfargofunds.com. |
| 3 | Mr. Harris became Chairman of the Audit Committee effective January 1, 2019. |
| | | | |
| 28 | | Wells Fargo Endeavor Select Fund | | Appendix A (unaudited) |
SALES CHARGE REDUCTIONS AND WAIVERS FOR CERTAIN INTERMEDIARIES
Raymond James & Associates, Inc., Raymond James Financial Services & Raymond James affiliates (“Raymond James”)
Effective on or about March 1, 2019, shareholders purchasing Fund shares through a Raymond James platform or account will be eligible only for the following load waivers (front-end sales charge waivers and contingent deferred, or back-end, sales charge waivers) and discounts, which may differ from those disclosed elsewhere in the Fund’s Prospectus or SAI.
Front-end Sales Load Waivers on Class A shares Available at Raymond James
| | • | | Shares purchased in an investment advisory program. |
| | • | | Shares purchased through reinvestment of capital gains distributions and dividend reinvestment when purchasing shares of the same fund (but not any other fund within the fund family). |
| | • | | Employees and registered representatives of Raymond James or its affiliates and their family members as designated by Raymond James. |
| | • | | Shares purchased from the proceeds of redemptions within the same fund family, provided (1) the repurchase occurs within 90 days following the redemption, (2) the redemption and purchase occur in the same account, and (3) redeemed shares were subject to a front-end or deferred sales load (known as Rights of Reinstatement). |
| | • | | A shareholder in the fund’s Class C shares will have their shares automatically exchanged at net asset value to Class A shares (or the appropriate share class) of the fund if the shares are no longer subject to a CDSC and the exchange is in line with the policies and procedures of Raymond James. |
CDSC Waivers on Class A and C Shares Available at Raymond James
| | • | | Death or disability of the shareholder. |
| | • | | Shares sold as part of a systematic withdrawal plan as described in the Fund’s Prospectus. |
| | • | | Return of excess contributions from an IRA Account. |
| | • | | Shares sold as part of a required minimum distribution for IRA and retirement accounts due to the shareholder reaching age 70½ as described in the Fund’s prospectus. |
| | • | | Shares sold to pay Raymond James fees but only if the transaction is initiated by Raymond James. |
| | • | | Shares acquired through a right of reinstatement. |
Front-end Load Discounts Available at Raymond James: Breakpoints, and/or Rights of Accumulation
| | • | | Breakpoints as described in the Fund’s Prospectus. |
| | • | | Rights of accumulation which entitle shareholders to breakpoint discounts will be automatically calculated based on the aggregated holding of fund family assets held by accounts within the purchaser’s household at Raymond James. Eligible fund family assets not held at Raymond James may be included in the rights of accumulation calculation only if the shareholder notifies his or her financial advisor about such assets. |

For more information
More information about Wells Fargo Funds is available free upon request. To obtain literature, please write, visit the Fund’s website, or call:
Wells Fargo Funds
P.O. Box 219967
Kansas City, MO 64121-9967
Website: wellsfargofunds.com
Individual investors: 1-800-222-8222
Retail investment professionals: 1-888-877-9275
Institutional investment professionals:1-866-765-0778
This report and the financial statements contained herein are submitted for the general information of the shareholders of the Fund. If this report is used for promotional purposes, distribution of the report must be accompanied or preceded by a current prospectus. Before investing, please consider the investment objectives, risks, charges, and expenses of the investment. For a current prospectus and, if available, a summary prospectus, containing this information, call1-800-222-8222 or visit the Fund’s website atwellsfargofunds.com. Read the prospectus carefully before you invest or send money.
Wells Fargo Asset Management (WFAM) is the trade name for certain investment advisory/management firms owned by Wells Fargo & Company. These firms include but are not limited to Wells Capital Management Incorporated and Wells Fargo Funds Management, LLC. Certain products managed by WFAM entities are distributed by Wells Fargo Funds Distributor, LLC (a broker/dealer and Member FINRA).
This material is for general informational and educational purposes only and is NOT intended to provide investment advice or a recommendation of any kind—including a recommendation for any specific investment, strategy, or plan.
INVESTMENT PRODUCTS: NOT FDIC INSURED ◾ NO BANK GUARANTEE ◾ MAY LOSE VALUE
© 2019 Wells Fargo Funds Management, LLC. All rights reserved.
| | |
 | | 320770 03-19 SA205/SAR205 1-19 |
Semi-Annual Report
January 31, 2019

Wells Fargo Growth Fund

Beginning on January 1, 2021, as permitted by new regulations adopted by the Securities and Exchange Commission, paper copies of the Wells Fargo Funds’ annual and semi-annual shareholder reports issued after this date will no longer be sent by mail, unless you specifically request paper copies of the reports. Instead, the reports will be made available on the Funds’ website, and you will be notified by mail each time a report is posted and provided with a website address to access the report.
If you already elected to receive shareholder reports electronically, you will not be affected by this change and you need not take any action. You may elect to receive shareholder reports and other communications from the Fund electronically at any time by contacting your financial intermediary (such as a broker-dealer or bank) or, if you are a direct investor, by calling 1-800-222-8222 or by enrolling at wellsfargo.com/advantagedelivery.
You may elect to receive all future reports in paper free of charge. If you invest through a financial intermediary, you can contact your financial intermediary to request that you continue to receive paper copies of your shareholder reports; if you invest directly with the Fund, you can call 1-800-222-8222. Your election to receive reports in paper will apply to all Wells Fargo Funds held in your account with your financial intermediary or, if you are a direct investor, to all Wells Fargo Funds that you hold.

Reduce clutter. Save trees.
Sign up for electronic delivery of prospectuses and shareholder reports atwellsfargo.com/advantagedelivery
Contents
The views expressed and any forward-looking statements are as of January 31, 2019, unless otherwise noted, and are those of the Fund managers and/or Wells Fargo Funds Management, LLC. Discussions of individual securities, or the markets generally, or any Wells Fargo Fund are not intended as individual recommendations. Future events or results may vary significantly from those expressed in any forward-looking statements. The views expressed are subject to change at any time in response to changing circumstances in the market. Wells Fargo Funds Management, LLC and the Fund disclaim any obligation to publicly update or revise any views expressed or forward-looking statements.
INVESTMENT PRODUCTS: NOT FDIC INSURED ◾ NO BANK GUARANTEE ◾ MAY LOSE VALUE
| | | | |
| 2 | | Wells Fargo Growth Fund | | Letter to shareholders (unaudited) |

Andrew Owen
President
Wells Fargo Funds
Favorable third-quarter economic indicators and corporate earnings reports encouraged domestic stock investors.
Dear Shareholder:
We are pleased to offer you this semi-annual report for the Wells Fargo Growth Fund for the six-month period that ended January 31, 2019. Higher short-term interest rates, inflation concerns, trade tensions, slowing economic growth outside the U.S., and geopolitical events contributed to investment market volatility throughout the period.
For the period, U.S. stocks, as measured by the S&P 500 Index,1 fell 3.00% and international stocks, as measured by the MSCI ACWI ex USA Index (Net),2 declined 6.34%. Based on the MSCI EM Index (Net),3 emerging market stocks lost 2.60%. For bond investors, the Bloomberg Barclays U.S. Aggregate Bond Index4 added 2.71% while the Bloomberg Barclays Global Aggregate ex-USD Index5 gained 1.37%. The Bloomberg Barclays Municipal Bond Index6 added 2.05%, and the ICE BofAML U.S. High Yield Index7 gained 1.02%.
Investors appeared to shake off lingering concerns during the third quarter.
Favorable third-quarter economic indicators and corporate earnings reports encouraged domestic stock investors. U.S. trade negotiations with Mexico and Canada made progress. The Conference Board Consumer Confidence Index®8 reached its highest level in 18 years during September. Several U.S. equity market indices reached records during August. The U.S. Federal Reserve (Fed) raised the federal funds rate by 25 basis points (bps; 100 bps equal 1.00%) to a target range of between 2.00% and 2.25% in September 2018. For the quarter that ended September 30, the S&P 500 Index added 7.71%.
Investors in international markets were not as reassured. Tensions between the U.S. and China increased when the U.S. imposed an additional $200 billion in tariffs on Chinese goods. China responded with $60 billion in tariffs on U.S. products. In addition, economic growth in China drew renewed concerns. The Bank of England, having raised its monetary policy rate to 0.50% in November 2017, increased the rate again in August 2018 to 0.75%. During the three-month period that ended September 30, 2018, the MSCI ACWI ex USA Index (Net) gained 0.71% while the MSCI EM Index (Net) declined 1.09%.
| 1 | The S&P 500 Index consists of 500 stocks chosen for market size, liquidity, and industry group representation. It is a market-value-weighted index with each stock’s weight in the index proportionate to its market value. You cannot invest directly in an index. |
| 2 | The Morgan Stanley Capital International (MSCI) All Country World Index (ACWI) ex USA Index (Net) is a free-float-adjusted market-capitalization-weighted index that is designed to measure the equity market performance of developed markets, excluding the United States and Canada. Source: MSCI. MSCI makes no express or implied warranties or representations and shall have no liability whatsoever with respect to any MSCI data contained herein. The MSCI data may not be further redistributed or used as a basis for other indices or any securities or financial products. This report is not approved, reviewed, or produced by MSCI. You cannot invest directly in an index. |
| 3 | The MSCI Emerging Markets (EM) Index (Net) is a free-float-adjusted market-capitalization-weighted index that is designed to measure large- and mid-cap equity market performance of emerging markets. The MSCI EM Index (Net) consists of the following 24 emerging market country indices: Brazil, Chile, China, Colombia, Czech Republic, Egypt, Greece, Hungary, India, Indonesia, Korea, Malaysia, Mexico, Pakistan, Peru, the Philippines, Poland, Qatar, Russia, South Africa, Taiwan, Thailand, Turkey, and the United Arab Emirates. You cannot invest directly in an index. |
| 4 | The Bloomberg Barclays U.S. Aggregate Bond Index is a broad-based benchmark that measures the investment-grade, U.S. dollar-denominated, fixed-rate taxable bond market, including Treasuries, government-related and corporate securities, mortgage-backed securities (agency fixed-rate and hybrid adjustable-rate mortgage pass-throughs), asset-backed securities, and commercial mortgage-backed securities. You cannot invest directly in an index. |
| 5 | The Bloomberg Barclays Global Aggregate ex-USD Index is an unmanaged index that provides a broad-based measure of the global investment-grade fixed-income markets excluding the U.S. dollar-denominated debt market. You cannot invest directly in an index. |
| 6 | The Bloomberg Barclays Municipal Bond Index is an unmanaged index composed of long-term tax-exempt bonds with a minimum credit rating of Baa. You cannot invest directly in an index. |
| 7 | The ICE BofAML U.S. High Yield Index is a market-capitalization-weighted index of domestic and Yankee high-yield bonds. The index tracks the performance of high-yield securities traded in the U.S. bond market. You cannot invest directly in an index. Copyright 2019. ICE Data Indices, LLC. All rights reserved. |
| 8 | The Conference Board Consumer Confidence Index® measures the degree of optimism on the state of the U.S. economy that consumers are expressing through their activities of savings and spending. You cannot invest directly in an index. |
| | | | | | |
| Letter to shareholders (unaudited) | | Wells Fargo Growth Fund | | | 3 | |
In bond markets, U.S. bonds, as measured by the Bloomberg Barclays U.S. Aggregate Bond Index, were flat. The Bloomberg Barclays Global Aggregateex-USD Index fell 1.74% during the quarter that ended September 30, 2018.
Conflicting data unsettled markets during the fourth quarter.
Negative stock market performance during October and December bracketed a mildly positive November for the S&P 500 Index and the MSCI ACWI ex USA Index (Net). As interest rates and bond yields gained during October, stock markets struggled. December’s S&P 500 Index performance was the worst since 1931. Globally, fixed-income investments fared better than stocks during the last two months of the year.
November’s U.S. midterm elections shifted control of the House of Representatives from Republicans to Democrats, presaging potential partisan disputes. The Bureau of Economic Analysis reported that third-quarter U.S. gross domestic product (GDP) grew at an annualized 3.4% rate, lower than second-quarter GDP growth. Brexit efforts stalled in the U.K. ahead of the March 2019 deadline. The People’s Bank of China cut reserve requirement ratios and accelerated infrastructure spending and tax cuts, and the value of the yuan declined to low levels last seen in 2008. Oil prices fell.
After the Fed increased the federal funds rate by 25 bps to a target range of between 2.25% and 2.50% in December 2018—the ninth such increase since the Fed began raising rates three years ago from near zero—it softened its outlook for further interest rate increases in 2019.
The market climbs a wall of worry.
Investors entered 2019 with reasons to be concerned. A partial U.S. government shutdown driven by partisan disputes over spending and immigration policies extended into January. Globally, economic signals were uneven. Investors expected high levels of stock market volatility to continue, as measured by the VIX9.
January’s returns tended to support the investing adage that the market climbs a wall of worry. The S&P 500 Index gained 8.01% for the month that ended January 31, 2019, its best monthly performance in 30 years. Returns for the MSCI ACWI ex USA Index (Net), the Bloomberg Barclays U.S. Aggregate Bond Index, and the Bloomberg Barclays Global Aggregate ex-USD Index also were positive.
Don’t let short-term uncertainty derail long-term investment goals.
Periods of investment uncertainty can present challenges, but experience has taught us that maintaining long-term investment goals can be an effective way to plan for the future. To help you create a sound strategy based on your personal goals and risk tolerance, Wells Fargo Funds offers more than 100 mutual funds spanning a wide range of asset classes and investment styles. Although diversification cannot guarantee an investment profit or prevent losses, we believe it can be an effective way to manage investment risk and potentially smooth out overall portfolio performance. We encourage investors to know their investments and to understand that appropriate levels of risk-taking may unlock opportunities.
January’s returns tended to support the investing adage that the market climbs a wall of worry.
| 9 | The Chicago Board Options Exchange Market Volatility Index (VIX) is a popular measure of the implied volatility of S&P 500 Index options. It represents one measure of the market’s expectation of stock market volatility over the next 30-day period. You cannot invest directly in an index. |
| | | | |
| 4 | | Wells Fargo Growth Fund | | Letter to shareholders (unaudited) |
Thank you for choosing to invest with Wells Fargo Funds. We appreciate your confidence in us and remain committed to helping you meet your financial needs.
Sincerely,

Andrew Owen
President
Wells Fargo Funds
For further information about your Fund, contact your investment professional, visit our website atwellsfargofunds.com, or call us directly at1-800-222-8222.
This page is intentionally left blank.
| | | | |
| 6 | | Wells Fargo Growth Fund | | Performance highlights (unaudited) |
Investment objective
The Fund seeks long-term capital appreciation.
Manager
Wells Fargo Funds Management, LLC
Subadviser
Wells Capital Management Incorporated
Portfolio managers
Joseph M. Eberhardy, CFA®‡, CPA
Thomas C. Ognar, CFA®‡
Average annual total returns (%) as of January 31, 2019
| | | | | | | | | | | | | | | | | | | | | | | | | | | | | | | | | | |
| | | | | Including sales charge | | | Excluding sales charge | | | Expense ratios1 (%) | |
| | | Inception date | | 1 year | | | 5 year | | | 10 year | | | 1 year | | | 5 year | | | 10 year | | | Gross | | | Net2 | |
| | | | | | | | | |
| Class A (SGRAX) | | 2-24-2000 | | | -3.30 | | | | 8.78 | | | | 16.96 | | | | 2.59 | | | | 10.08 | | | | 17.66 | | | | 1.18 | | | | 1.16 | |
| | | | | | | | | |
| Class C (WGFCX) | | 12-26-2002 | | | 0.84 | | | | 9.25 | | | | 16.78 | | | | 1.84 | | | | 9.25 | | | | 16.78 | | | | 1.93 | | | | 1.91 | |
| | | | | | | | | |
| Class R6 (SGRHX)3 | | 9-30-2015 | | | – | | | | – | | | | – | | | | 3.04 | | | | 10.57 | | | | 18.19 | | | | 0.75 | | | | 0.70 | |
| | | | | | | | | |
| Administrator Class (SGRKX) | | 8-30-2002 | | | – | | | | – | | | | – | | | | 2.80 | | | | 10.30 | | | | 17.94 | | | | 1.10 | | | | 0.96 | |
| | | | | | | | | |
| Institutional Class (SGRNX) | | 2-24-2000 | | | – | | | | – | | | | – | | | | 3.00 | | | | 10.53 | | | | 18.17 | | | | 0.85 | | | | 0.75 | |
| | | | | | | | | |
| Russell 3000® Growth Index4 | | – | | | – | | | | – | | | | – | | | | 0.03 | | | | 12.57 | | | | 16.77 | | | | – | | | | – | |
Figures quoted represent past performance, which is no guarantee of future results, and do not reflect taxes that a shareholder may pay on fund distributions or the redemption of fund shares. Investment return and principal value of an investment will fluctuate so that an investor’s shares, when redeemed, may be worth more or less than their original cost. Performance shown without sales charges would be lower if sales charges were reflected. Current performance may be lower or higher than the performance data quoted, which assumes the reinvestment of dividends and capital gains. Current month-end performance is available on the Fund’s website,wellsfargofunds.com.
Index returns do not include transaction costs associated with buying and selling securities, any mutual fund fees or expenses, or any taxes. It is not possible to invest directly in an index.
For Class A shares, the maximum front-end sales charge is 5.75%. For Class C shares, the maximum contingent deferred sales charge is 1.00%. Performance including a contingent deferred sales charge assumes the sales charge for the corresponding time period. Class R6, Administrator Class, and Institutional Class shares are sold without a front-end sales charge or contingent deferred sales charge.
Stock values fluctuate in response to the activities of individual companies and general market and economic conditions. Certain investment strategies tend to increase the total risk of an investment (relative to the broader market). The Fund is exposed to foreign investment risk and smaller-company securities risk. Consult the Fund’s prospectus for additional information on these and other risks.
Please see footnotes on page 7.
| | | | | | |
| Performance highlights (unaudited) | | Wells Fargo Growth Fund | | | 7 | |
| | | | |
| Ten largest holdings (%) as of January 31, 20195 | |
| |
Amazon.com Incorporated | | | 8.00 | |
| |
Alphabet Incorporated Class A | | | 6.36 | |
| |
Microsoft Corporation | | | 3.99 | |
| |
Microchip Technology Incorporated | | | 3.64 | |
| |
MasterCard Incorporated Class A | | | 3.31 | |
| |
Visa Incorporated Class A | | | 3.19 | |
| |
MarketAxess Holdings Incorporated | | | 2.39 | |
| |
Burlington Stores Incorporated | | | 2.31 | |
| |
Monolithic Power Systems Incorporated | | | 2.14 | |
| |
Apple Incorporated | | | 1.99 | |
|
| Sector distribution as of January 31, 20196 |
|
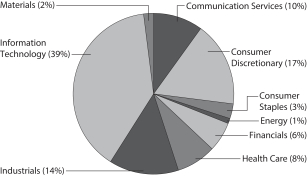 |
| ‡ | CFA® and Chartered Financial Analyst® are trademarks owned by CFA Institute. |
| 1 | Reflects the expense ratios as stated in the most recent prospectuses. The expense ratios shown are subject to change and may differ from the annualized expense ratios shown in the financial highlights of this report. |
| 2 | The manager has contractually committed through November 30, 2019, to waive fees and/or reimburse expenses to the extent necessary to cap the expenses of each class after fee waivers at the amounts shown. Brokerage commissions, stamp duty fees, interest, taxes, acquired fund fees and expenses (if any), and extraordinary expenses are excluded from the expense cap. Prior to or after the commitment expiration date, the cap may be increased or the commitment to maintain the cap may be terminated only with the approval of the Board of Trustees. Without this cap, the Fund’s returns would have been lower. The expense ratio paid by an investor is the net expense ratio (the total annual fund operating expenses after fee waivers) as stated in the prospectuses. |
| 3 | Historical performance shown for Class R6 shares prior to their inception reflects the performance of Institutional Class shares, and includes the higher expenses applicable to Institutional Class shares. If these expenses had not been included, returns for Class R6 shares would be higher. |
| 4 | The Russell 3000® Growth Index measures the performance of those Russell 3000® Index companies with higher price/book ratios and higher forecasted growth values. You cannot invest directly in an index. |
| 5 | The ten largest holdings, excluding cash, cash equivalents and any money market funds, are calculated based on the value of the investments divided by total net assets of the Fund. Holdings are subject to change and may have changed since the date specified. |
| 6 | Amounts are calculated based on the total long-term investments of the Fund. These amounts are subject to change and may have changed since the date specified. |
| | | | |
| 8 | | Wells Fargo Growth Fund | | Fund expenses (unaudited) |
As a shareholder of the Fund, you incur two types of costs: (1) transaction costs, including sales charges (loads) on purchase payments and contingent deferred sales charges (if any) on redemptions and (2) ongoing costs, including management fees, distribution (12b-1) and/or shareholder servicing fees, and other Fund expenses. This example is intended to help you understand your ongoing costs (in dollars) of investing in the Fund and to compare these costs with the ongoing costs of investing in other mutual funds.
The example is based on an investment of $1,000 invested at the beginning of the six-month period and held for the entire period from August 1, 2018 to January 31, 2019.
Actual expenses
The “Actual” line of the table below provides information about actual account values and actual expenses. You may use the information in this line, together with the amount you invested, to estimate the expenses that you paid over the period. Simply divide your account value by $1,000 (for example, an $8,600 account value divided by $1,000 = 8.6), then multiply the result by the number in the “Actual” line under the heading entitled “Expenses paid during period” for your applicable class of shares to estimate the expenses you paid on your account during this period.
Hypothetical example for comparison purposes
The “Hypothetical” line of the table below provides information about hypothetical account values and hypothetical expenses based on the Fund’s actual expense ratio and an assumed rate of return of 5% per year before expenses, which is not the Fund’s actual return. The hypothetical account values and expenses may not be used to estimate the actual ending account balance or expenses you paid for the period. You may use this information to compare the ongoing costs of investing in the Fund and other funds. To do so, compare this 5% hypothetical example with the 5% hypothetical examples that appear in the shareholder reports of the other funds.
Please note that the expenses shown in the table are meant to highlight your ongoing costs only and do not reflect any transactional costs, such as sales charges (loads) and contingent deferred sales charges. Therefore, the “Hypothetical” line of the table is useful in comparing ongoing costs only and will not help you determine the relative total costs of owning different funds. In addition, if these transactional costs were included, your costs would have been higher.
| | | | | | | | | | | | | | | | |
| | | Beginning
account value
8-1-2018 | | | Ending
account value
1-31-2019 | | | Expenses
paid during
the period¹ | | | Annualized net
expense ratio | |
Class A | | | | | | | | | | | | | | | | |
| | | | |
Actual | | $ | 1,000.00 | | | $ | 966.24 | | | $ | 5.75 | | | | 1.16 | % |
| | | | |
Hypothetical (5% return before expenses) | | $ | 1,000.00 | | | $ | 1,019.36 | | | $ | 5.90 | | | | 1.16 | % |
Class C | | | | | | | | | | | | | | | | |
| | | | |
Actual | | $ | 1,000.00 | | | $ | 962.62 | | | $ | 9.45 | | | | 1.91 | % |
| | | | |
Hypothetical (5% return before expenses) | | $ | 1,000.00 | | | $ | 1,015.58 | | | $ | 9.70 | | | | 1.91 | % |
Class R6 | | | | | | | | | | | | | | | | |
| | | | |
Actual | | $ | 1,000.00 | | | $ | 968.39 | | | $ | 3.47 | | | | 0.70 | % |
| | | | |
Hypothetical (5% return before expenses) | | $ | 1,000.00 | | | $ | 1,021.68 | | | $ | 3.57 | | | | 0.70 | % |
Administrator Class | | | | | | | | | | | | | | | | |
| | | | |
Actual | | $ | 1,000.00 | | | $ | 967.32 | | | $ | 4.76 | | | | 0.96 | % |
| | | | |
Hypothetical (5% return before expenses) | | $ | 1,000.00 | | | $ | 1,020.37 | | | $ | 4.89 | | | | 0.96 | % |
Institutional Class | | | | | | | | | | | | | | | | |
| | | | |
Actual | | $ | 1,000.00 | | | $ | 968.14 | | | $ | 3.72 | | | | 0.75 | % |
| | | | |
Hypothetical (5% return before expenses) | | $ | 1,000.00 | | | $ | 1,021.42 | | | $ | 3.82 | | | | 0.75 | % |
| 1 | Expenses paid is equal to the annualized net expense ratio of each class multiplied by the average account value over the period, multiplied by the number of days in the most recent fiscal half-year divided by the number of days in the fiscal year (to reflect the one-half-year period). |
| | | | | | |
| Portfolio of investments—January 31, 2019 (unaudited) | | Wells Fargo Growth Fund | | | 9 | |
| | | | | | | | | | | | | | | | |
| Security name | | | | | | | | Shares | | | Value | |
| | | | |
Common Stocks: 99.02% | | | | | | | | | | | | | | | | |
| | | | |
Communication Services: 9.93% | | | | | | | | | | | | | | | | |
| | | | |
| Entertainment: 1.11% | | | | | | | | | | | | | | | | |
| | | | |
Activision Blizzard Incorporated | | | | | | | | | | | 87,480 | | | $ | 4,132,555 | |
| | | | |
Electronic Arts Incorporated † | | | | | | | | | | | 89,770 | | | | 8,280,385 | |
| | | | |
Netflix Incorporated † | | | | | | | | | | | 94,340 | | | | 32,028,430 | |
| | | | |
Take-Two Interactive Software Incorporated † | | | | | | | | | | | 18,900 | | | | 1,994,895 | |
| | | | |
| | | | | | | | | | | | | | | 46,436,265 | |
| | | | | | | | | | | | | | | | |
| | | | |
| Interactive Media & Services: 8.82% | | | | | | | | | | | | | | | | |
| | | | |
Alphabet Incorporated Class A † | | | | | | | | | | | 235,835 | | | | 265,524,268 | |
| | | | |
Alphabet Incorporated Class C † | | | | | | | | | | | 22,090 | | | | 24,660,613 | |
| | | | |
Eventbrite Incorporated Class A †« | | | | | | | | | | | 362,677 | | | | 10,883,937 | |
| | | | |
Facebook Incorporated Class A † | | | | | | | | | | | 404,800 | | | | 67,476,112 | |
| | | | |
| | | | | | | | | | | | | | | 368,544,930 | |
| | | | | | | | | | | | | | | | |
| | | | |
Consumer Discretionary: 16.45% | | | | | | | | | | | | | | | | |
| | | | |
| Diversified Consumer Services: 0.66% | | | | | | | | | | | | | | | | |
| | | | |
Bright Horizons Family Solutions Incorporated † | | | | | | | | | | | 130,530 | | | | 15,114,069 | |
| | | | |
Grand Canyon Education Incorporated † | | | | | | | | | | | 133,950 | | | | 12,449,313 | |
| | | | |
| | | | | | | | | | | | | | | 27,563,382 | |
| | | | | | | | | | | | | | | | |
| | | | |
| Hotels, Restaurants & Leisure: 1.59% | | | | | | | | | | | | | | | | |
| | | | |
Carnival Corporation | | | | | | | | | | | 417,050 | | | | 24,013,739 | |
| | | | |
Norwegian Cruise Line Holdings Limited † | | | | | | | | | | | 477,000 | | | | 24,532,110 | |
| | | | |
Royal Caribbean Cruises Limited | | | | | | | | | | | 148,500 | | | | 17,827,425 | |
| | | | |
| | | | | | | | | | | | | | | 66,373,274 | |
| | | | | | | | | | | | | | | | |
| | | | |
| Household Durables: 1.08% | | | | | | | | | | | | | | | | |
| | | | |
Roku Incorporated †« | | | | | | | | | | | 999,200 | | | | 44,914,040 | |
| | | | | | | | | | | | | | | | |
| | | | |
| Internet & Direct Marketing Retail: 8.00% | | | | | | | | | | | | | | | | |
| | | | |
Amazon.com Incorporated † | | | | | | | | | | | 194,470 | | | | 334,241,423 | |
| | | | | | | | | | | | | | | | |
| | | | |
| Leisure Products: 0.01% | | | | | | | | | | | | | | | | |
| | | | |
Yeti Holdings Incorporated †« | | | | | | | | | | | 28,780 | | | | 489,548 | |
| | | | | | | | | | | | | | | | |
| | | | |
| Multiline Retail: 0.48% | | | | | | | | | | | | | | | | |
| | | | |
Ollie’s Bargain Outlet Holdings Incorporated † | | | | | | | | | | | 258,400 | | | | 20,199,128 | |
| | | | | | | | | | | | | | | | |
| | | | |
| Specialty Retail: 4.63% | | | | | | | | | | | | | | | | |
| | | | |
Burlington Stores Incorporated † | | | | | | | | | | | 562,150 | | | | 96,526,777 | |
| | | | |
Five Below Incorporated † | | | | | | | | | | | 271,175 | | | | 33,552,483 | |
| | | | |
The Home Depot Incorporated | | | | | | | | | | | 159,710 | | | | 29,311,576 | |
| | | | |
ULTA Beauty Incorporated † | | | | | | | | | | | 116,800 | | | | 34,096,256 | |
| | | | |
| | | | | | | | | | | | | | | 193,487,092 | |
| | | | | | | | | | | | | | | | |
The accompanying notes are an integral part of these financial statements.
| | | | |
| 10 | | Wells Fargo Growth Fund | | Portfolio of investments—January 31, 2019 (unaudited) |
| | | | | | | | | | | | | | | | |
| Security name | | | | | | | | Shares | | | Value | |
| | | | |
Consumer Staples: 2.88% | | | | | | | | | | | | | | | | |
| | | | |
| Beverages: 1.97% | | | | | | | | | | | | | | | | |
| | | | |
Constellation Brands Incorporated Class A | | | | | | | | | | | 132,910 | | | $ | 23,081,151 | |
| | | | |
The Coca-Cola Company | | | | | | | | | | | 1,232,800 | | | | 59,334,664 | |
| | | | |
| | | | | | | | | | | | | | | 82,415,815 | |
| | | | | | | | | | | | | | | | |
| | | | |
| Food & Staples Retailing: 0.12% | | | | | | | | | | | | | | | | |
| | | | |
Costco Wholesale Corporation | | | | | | | | | | | 23,770 | | | | 5,101,755 | |
| | | | | | | | | | | | | | | | |
| | | | |
| Personal Products: 0.79% | | | | | | | | | | | | | | | | |
| | | | |
The Estee Lauder Companies Incorporated Class A | | | | | | | | | | | 239,960 | | | | 32,735,343 | |
| | | | | | | | | | | | | | | | |
| | | | |
Energy: 0.95% | | | | | | | | | | | | | | | | |
| | | | |
| Oil, Gas & Consumable Fuels: 0.95% | | | | | | | | | | | | | | | | |
| | | | |
Concho Resources Incorporated † | | | | | | | | | | | 330,150 | | | | 39,565,176 | |
| | | | | | | | | | | | | | | | |
| | | | |
Financials: 6.21% | | | | | | | | | | | | | | | | |
| | | | |
| Capital Markets: 5.61% | | | | | | | | | | | | | | | | |
| | | | |
BlackRock Incorporated | | | | | | | | | | | 25,800 | | | | 10,709,064 | |
| | | | |
CME Group Incorporated | | | | | | | | | | | 43,610 | | | | 7,949,231 | |
| | | | |
MarketAxess Holdings Incorporated | | | | | | | | | | | 465,521 | | | | 99,979,945 | |
| | | | |
Raymond James Financial Incorporated | | | | | | | | | | | 831,340 | | | | 66,922,870 | |
| | | | |
The Charles Schwab Corporation | | | | | | | | | | | 1,039,250 | | | | 48,605,723 | |
| | | | |
| | | | | | | | | | | | | | | 234,166,833 | |
| | | | | | | | | | | | | | | | |
| | | | |
| Thrifts & Mortgage Finance: 0.60% | | | | | | | | | | | | | | | | |
| | | | |
LendingTree Incorporated †« | | | | | | | | | | | 85,260 | | | | 25,265,948 | |
| | | | | | | | | | | | | | | | |
| | | | |
Health Care: 8.33% | | | | | | | | | | | | | | | | |
| | | | |
| Biotechnology: 3.32% | | | | | | | | | | | | | | | | |
| | | | |
Alexion Pharmaceuticals Incorporated † | | | | | | | | | | | 224,400 | | | | 27,592,224 | |
| | | | |
Ligand Pharmaceuticals Incorporated † | | | | | | | | | | | 24,600 | | | | 2,905,260 | |
| | | | |
Neurocrine Biosciences Incorporated † | | | | | | | | | | | 161,040 | | | | 14,206,949 | |
| | | | |
Regeneron Pharmaceuticals Incorporated † | | | | | | | | | | | 30,100 | | | | 12,921,027 | |
| | | | |
Sage Therapeutics Incorporated † | | | | | | | | | | | 82,300 | | | | 11,735,157 | |
| | | | |
Sarepta Therapeutics Incorporated † | | | | | | | | | | | 62,600 | | | | 8,745,846 | |
| | | | |
Vertex Pharmaceuticals Incorporated † | | | | | | | | | | | 316,600 | | | | 60,442,106 | |
| | | | |
| | | | | | | | | | | | | | | 138,548,569 | |
| | | | | | | | | | | | | | | | |
| | | | |
| Health Care Equipment & Supplies: 2.38% | | | | | | | | | | | | | | | | |
| | | | |
Boston Scientific Corporation † | | | | | | | | | | | 1,577,020 | | | | 60,163,313 | |
| | | | |
Novocure Limited † | | | | | | | | | | | 617,900 | | | | 30,277,100 | |
| | | | |
Stryker Corporation | | | | | | | | | | | 51,000 | | | | 9,056,070 | |
| | | | |
| | | | | | | | | | | | | | | 99,496,483 | |
| | | | | | | | | | | | | | | | |
| | | | |
| Health Care Technology: 1.48% | | | | | | | | | | | | | | | | |
| | | | |
Veeva Systems Incorporated Class A † | | | | | | | | | | | 567,550 | | | | 61,897,003 | |
| | | | | | | | | | | | | | | | |
The accompanying notes are an integral part of these financial statements.
| | | | | | |
| Portfolio of investments—January 31, 2019 (unaudited) | | Wells Fargo Growth Fund | | | 11 | |
| | | | | | | | | | | | | | | | |
| Security name | | | | | | | | Shares | | | Value | |
| | | | |
| Life Sciences Tools & Services: 0.18% | | | | | | | | | | | | | | | | |
| | | | |
PRA Health Sciences Incorporated † | | | | | | | | | | | 69,750 | | | $ | 7,391,408 | |
| | | | | | | | | | | | | | | | |
| | | | |
| Pharmaceuticals: 0.97% | | | | | | | | | | | | | | | | |
| | | | |
Elanco Animal Health Incorporated †« | | | | | | | | | | | 386,005 | | | | 11,263,626 | |
| | | | |
Zoetis Incorporated | | | | | | | | | | | 340,970 | | | | 29,377,975 | |
| | | | |
| | | | | | | | | | | | | | | 40,641,601 | |
| | | | | | | | | | | | | | | | |
| | | | |
Industrials: 13.65% | | | | | | | | | | | | | | | | |
| | | | |
| Aerospace & Defense: 1.66% | | | | | | | | | | | | | | | | |
| | | | |
The Boeing Company | | | | | | | | | | | 179,980 | | | | 69,403,888 | |
| | | | | | | | | | | | | | | | |
| | | | |
| Commercial Services & Supplies: 3.99% | | | | | | | | | | | | | | | | |
| | | | |
Casella Waste Systems Incorporated Class A † | | | | | | | | | | | 666,980 | | | | 20,089,438 | |
| | | | |
Copart Incorporated † | | | | | | | | | | | 699,770 | | | | 35,429,355 | |
| | | | |
KAR Auction Services Incorporated | | | | | | | | | | | 686,290 | | | | 35,693,943 | |
| | | | |
Waste Connections Incorporated | | | | | | | | | | | 901,505 | | | | 75,329,758 | |
| | | | |
| | | | | | | | | | | | | | | 166,542,494 | |
| | | | | | | | | | | | | | | | |
| | | | |
| Industrial Conglomerates: 0.53% | | | | | | | | | | | | | | | | |
| | | | |
Roper Industries Incorporated | | | | | | | | | | | 78,690 | | | | 22,289,729 | |
| | | | | | | | | | | | | | | | |
| | | | |
| Machinery: 1.57% | | | | | | | | | | | | | | | | |
| | | | |
Fortive Corporation | | | | | | | | | | | 121,960 | | | | 9,145,780 | |
| | | | |
Milacron Holdings Corporation †(l) | | | | | | | | | | | 4,080,535 | | | | 56,556,215 | |
| | | | |
| | | | | | | | | | | | | | | 65,701,995 | |
| | | | | | | | | | | | | | | | |
| | | | |
| Professional Services: 1.02% | | | | | | | | | | | | | | | | |
| | | | |
ASGN Incorporated † | | | | | | | | | | | 300,300 | | | | 18,915,897 | |
| | | | |
CoStar Group Incorporated † | | | | | | | | | | | 60,300 | | | | 23,561,622 | |
| | | | |
| | | | | | | | | | | | | | | 42,477,519 | |
| | | | | | | | | | | | | | | | |
| | | | |
| Road & Rail: 4.52% | | | | | | | | | | | | | | | | |
| | | | |
CSX Corporation | | | | | | | | | | | 1,092,480 | | | | 71,775,936 | |
| | | | |
Norfolk Southern Corporation | | | | | | | | | | | 361,490 | | | | 60,636,333 | |
| | | | |
Union Pacific Corporation | | | | | | | | | | | 354,360 | | | | 56,368,045 | |
| | | | |
| | | | | | | | | | | | | | | 188,780,314 | |
| | | | | | | | | | | | | | | | |
| | | | |
| Trading Companies & Distributors: 0.36% | | | | | | | | | | | | | | | | |
| | | | |
SiteOne Landscape Supply Incorporated † | | | | | | | | | | | 279,900 | | | | 14,918,670 | |
| | | | | | | | | | | | | | | | |
| | | | |
Information Technology: 38.14% | | | | | | | | | | | | | | | | |
| | | | |
| IT Services: 13.02% | | | | | | | | | | | | | | | | |
| | | | |
Euronet Worldwide Incorporated † | | | | | | | | | | | 259,800 | | | | 29,879,598 | |
| | | | |
Global Payments Incorporated | | | | | | | | | | | 561,970 | | | | 63,097,992 | |
| | | | |
MasterCard Incorporated Class A | | | | | | | | | | | 655,770 | | | | 138,452,720 | |
| | | | |
MongoDB Incorporated †« | | | | | | | | | | | 288,620 | | | | 26,656,943 | |
| | | | |
PayPal Holdings Incorporated † | | | | | | | | | | | 893,590 | | | | 79,315,048 | |
| | | | |
Shopify Incorporated Class A † | | | | | | | | | | | 185,110 | | | | 31,185,482 | |
The accompanying notes are an integral part of these financial statements.
| | | | |
| 12 | | Wells Fargo Growth Fund | | Portfolio of investments—January 31, 2019 (unaudited) |
| | | | | | | | | | | | | | | | |
| Security name | | | | | | | | Shares | | | Value | |
| | | | |
| IT Services(continued) | | | | | | | | | | | | | | | | |
| | | | |
Square Incorporated Class A † | | | | | | | | | | | 245,900 | | | $ | 17,544,965 | |
| | | | |
Twilio Incorporated Class A †« | | | | | | | | | | | 169,630 | | | | 18,883,212 | |
| | | | |
Visa Incorporated Class A | | | | | | | | | | | 988,410 | | | | 133,445,234 | |
| | | | |
WEX Incorporated † | | | | | | | | | | | 33,300 | | | | 5,372,289 | |
| | | | |
| | | | | | | | | | | | | | | 543,833,483 | |
| | | | | | | | | | | | | | | | |
| | | | |
| Semiconductors & Semiconductor Equipment: 7.92% | | | | | | | | | | | | | | | | |
| | | | |
Microchip Technology Incorporated « | | | | | | | | | | | 1,893,690 | | | | 152,195,865 | |
| | | | |
Monolithic Power Systems Incorporated | | | | | | | | | | | 707,270 | | | | 89,512,091 | |
| | | | |
NVIDIA Corporation | | | | | | | | | | | 50,700 | | | | 7,288,125 | |
| | | | |
Texas Instruments Incorporated | | | | | | | | | | | 812,180 | | | | 81,770,282 | |
| | | | |
| | | | | | | | | | | | | | | 330,766,363 | |
| | | | | | | | | | | | | | | | |
| | | | |
| Software: 15.21% | | | | | | | | | | | | | | | | |
| | | | |
Adobe Systems Incorporated † | | | | | | | | | | | 74,520 | | | | 18,467,546 | |
| | | | |
Anaplan Incorporated † | | | | | | | | | | | 233,839 | | | | 7,340,206 | |
| | | | |
BlackLine Incorporated † | | | | | | | | | | | 298,330 | | | | 14,194,541 | |
| | | | |
Dropbox Incorporated Class A †« | | | | | | | | | | | 1,375,000 | | | | 33,976,250 | |
| | | | |
Envestnet Incorporated † | | | | | | | | | | | 1,477,370 | | | | 80,147,323 | |
| | | | |
Microsoft Corporation | | | | | | | | | | | 1,597,650 | | | | 166,842,590 | |
| | | | |
Mimecast Limited † | | | | | | | | | | | 812,600 | | | | 30,529,382 | |
| | | | |
New Relic Incorporated † | | | | | | | | | | | 191,260 | | | | 19,441,579 | |
| | | | |
Pivotal Software Incorporated Class A † | | | | | | | | | | | 1,900,464 | | | | 35,139,579 | |
| | | | |
Proofpoint Incorporated † | | | | | | | | | | | 446,690 | | | | 45,504,310 | |
| | | | |
RealPage Incorporated † | | | | | | | | | | | 301,200 | | | | 16,797,924 | |
| | | | |
SailPoint Technologies Holdings Incorporated † | | | | | | | | | | | 793,871 | | | | 22,665,017 | |
| | | | |
Salesforce.com Incorporated † | | | | | | | | | | | 146,780 | | | | 22,306,157 | |
| | | | |
SendGrid Incorporated † | | | | | | | | | | | 439,400 | | | | 23,762,752 | |
| | | | |
ServiceNow Incorporated † | | | | | | | | | | | 81,190 | | | | 17,863,424 | |
| | | | |
Splunk Incorporated † | | | | | | | | | | | 176,400 | | | | 22,021,776 | |
| | | | |
Tableau Software Incorporated Class A † | | | | | | | | | | | 75,900 | | | | 9,703,056 | |
| | | | |
Talend SA ADR † | | | | | | | | | | | 448,800 | | | | 16,695,360 | |
| | | | |
The Ultimate Software Group Incorporated † | | | | | | | | | | | 117,820 | | | | 32,173,107 | |
| | | | |
| | | | | | | | | | | | | | | 635,571,879 | |
| | | | | | | | | | | | | | | | |
| | | | |
| Technology Hardware, Storage & Peripherals: 1.99% | | | | | | | | | | | | | | | | |
| | | | |
Apple Incorporated | | | | | | | | | | | 500,140 | | | | 83,243,302 | |
| | | | | | | | | | | | | | | | |
| | | | |
Materials: 2.48% | | | | | | | | | | | | | | | | |
| | | | |
| Chemicals: 2.48% | | | | | | | | | | | | | | | | |
| | | | |
Linde plc | | | | | | | | | | | 287,360 | | | | 46,842,554 | |
| | | | |
PolyOne Corporation | | | | | | | | | | | 1,751,663 | | | | 56,701,330 | |
| | | | |
| | | | | | | | | | | | | | | 103,543,884 | |
| | | | | | | | | | | | | | | | |
| | | | |
Total Common Stocks (Cost $2,146,894,196) | | | | | | | | | | | | | | | 4,136,548,536 | |
| | | | | | | | | | | | | | | | |
The accompanying notes are an integral part of these financial statements.
| | | | | | |
| Portfolio of investments—January 31, 2019 (unaudited) | | Wells Fargo Growth Fund | | | 13 | |
| | | | | | | | | | | | | | | | |
| Security name | | Yield | | | | | | Shares | | | Value | |
| | | | |
Short-Term Investments: 7.31% | | | | | | | | | | | | | | | | |
| | | | |
| Investment Companies: 7.31% | | | | | | | | | | | | | | | | |
| | | | |
Securities Lending Cash Investments LLC (l)(r)(u) | | | 2.57 | % | | | | | | | 253,225,707 | | | $ | 253,251,030 | |
| | | | |
Wells Fargo Government Money Market Fund Select Class (l)(u) | | | 2.33 | | | | | | | | 51,925,610 | | | | 51,925,610 | |
| | | | |
Total Short-Term Investments (Cost $305,172,300) | | | | | | | | | | | | | | | 305,176,640 | |
| | | | | | | | | | | | | | | | |
| | | | | | | | |
| Total investments in securities (Cost $2,452,066,496) | | | 106.33 | % | | | 4,441,725,176 | |
| | |
Other assets and liabilities, net | | | (6.33 | ) | | | (264,380,362 | ) |
| | | | | | | | |
| Total net assets | | | 100.00 | % | | $ | 4,177,344,814 | |
| | | | | | | | |
| † | Non-income-earning security |
| « | All or a portion of this security is on loan. |
| (l) | The issuer of the security is an affiliated person of the Fund as defined in the Investment Company Act of 1940. |
| (r) | The investment is a non-registered investment company purchased with cash collateral received from securities on loan. |
| (u) | The rate represents the 7-day annualized yield at period end. |
Abbreviations:
| ADR | American depositary receipt |
Investments in Affiliates
An affiliated investment is an investment in which the Fund owns at least 5% of the outstanding voting shares of the issuer or as a result of other relationships, such as the Fund and the issuer having the same investment manager. Transactions with issuers that were either affiliated persons of the Fund at the beginning of the period or the end of the period were as follows:
| | | | | | | | | | | | | | | | | | | | | | | | | | | | | | | | | | | | |
| | | Shares,
beginning of
period | | | Shares
purchased | | | Shares
sold | | | Shares,
end of
period | | | Net
realized
gains
(losses) | | | Net
change in
unrealized
gains
(losses) | | | Income
from
affiliated
securities | | | Value,
end
of period | | | % of
net
assets | |
Common Stocks | | | | | | | | | | | | | | | | | | | | | | | | | | | | | | | | | | | | |
Industrials | | | | | | | | | | | | | | | | | | | | | | | | | | | | | | | | | | | | |
Machinery | | | | | | | | | | | | | | | | | | | | | | | | | | | | | | | | | | | | |
Milacron Holdings Corporation † | | | 3,945,835 | | | | 134,700 | | | | 0 | | | | 4,080,535 | | | $ | 0 | | | $ | (27,975,984 | ) | | $ | 0 | | | $ | 56,556,215 | | | | 1.35 | % |
| | | | | | | | | |
Short-Term Investments | | | | | | | | | | | | | | | | | | | | | | | | | | | | | | | | | | | | |
Investment Companies | | | | | | | | | | | | | | | | | | | | | | | | | | | | | | | | | | | | |
Securities Lending Cash Investments LLC | | | 149,251,008 | | | | 644,399,009 | | | | 540,424,310 | | | | 253,225,707 | | | | (2,709 | ) | | | 0 | | | | 2,710,420 | | | | 253,251,030 | | | | | |
Wells Fargo Government Money Market Fund Select Class | | | 17,742,561 | | | | 410,497,979 | | | | 376,314,930 | | | | 51,925,610 | | | | 0 | | | | 0 | | | | 310,326 | | | | 51,925,610 | | | | | |
| | | | | | | | | |
| | | | | | | | | | | | | | | | | | | | | | | | | | | | | | | 305,176,640 | | | | 7.31 | % |
| | | | | | | | | | | | | | | | | | | | | | | | | | | | | | | | | | | | |
| | | | | | | | | |
| | | | | | | | | | | | | | | | | | $ | (2,709 | ) | | $ | (27,975,984 | ) | | $ | 3,020,746 | | | $ | 361,732,855 | | | | 8.66 | % |
| | | | | | | | | | | | | | | | | | | | | | | | | | | | | | | | | | | | |
| | † | Non-income-earning security |
The accompanying notes are an integral part of these financial statements.
| | | | |
| 14 | | Wells Fargo Growth Fund | | Statement of assets and liabilities—January 31, 2019 (unaudited) |
| | | | |
| | | | |
| |
Assets | | | | |
Investments in unaffiliated securities (including $247,729,020 of securities loaned), at value (cost $2,076,955,986) | | $ | 4,079,992,321 | |
Investments in affiliated securities, at value (cost $375,110,510) | | | 361,732,855 | |
Receivable for investments sold | | | 5,320,942 | |
Receivable for Fund shares sold | | | 2,539,377 | |
Receivable for dividends | | | 968,475 | |
Receivable for securities lending income | | | 68,279 | |
| | | | |
Total assets | | | 4,450,622,249 | |
| | | | |
| |
Liabilities | | | | |
Payable upon receipt of securities loaned | | | 253,242,554 | |
Payable for investments purchased | | | 12,601,530 | |
Payable for Fund shares redeemed | | | 3,456,901 | |
Management fee payable | | | 2,163,369 | |
Administration fees payable | | | 550,550 | |
Distribution fee payable | | | 92,917 | |
Trustees’ fees and expenses payable | | | 2,793 | |
Due to custodian bank | | | 1,377 | |
Accrued expenses and other liabilities | | | 1,165,444 | |
| | | | |
Total liabilities | | | 273,277,435 | |
| | | | |
Total net assets | | $ | 4,177,344,814 | |
| | | | |
| |
NET ASSETS CONSIST OF | | | | |
Paid-in capital | | $ | 2,079,505,104 | |
Total distributable earnings | | | 2,097,839,710 | |
| | | | |
Total net assets | | $ | 4,177,344,814 | |
| | | | |
| |
COMPUTATION OF NET ASSET VALUE AND OFFERING PRICE PER SHARE | | | | |
Net assets – Class A | | $ | 1,906,910,643 | |
Shares outstanding – Class A1 | | | 63,016,332 | |
Net asset value per share – Class A | | | $30.26 | |
Maximum offering price per share – Class A2 | | | $32.11 | |
Net assets – Class C | | $ | 152,775,990 | |
Shares outstanding – Class C1 | | | 6,914,224 | |
Net asset value per share – Class C | | | $22.10 | |
Net assets – Class R6 | | $ | 269,903,109 | |
Shares outstanding – Class R61 | | | 6,934,189 | |
Net asset value per share – Class R6 | | | $38.92 | |
Net assets – Administrator Class | | $ | 473,642,216 | |
Shares outstanding – Administrator Class1 | | | 13,399,333 | |
Net asset value per share – Administrator Class | | | $35.35 | |
Net assets – Institutional Class | | $ | 1,374,112,856 | |
Shares outstanding – Institutional Class1 | | | 35,407,349 | |
Net asset value per share – Institutional Class | | | $38.81 | |
| 1 | The Fund has an unlimited number of authorized shares. |
| 2 | Maximum offering price is computed as 100/94.25 of net asset value. On investments of $50,000 or more, the offering price is reduced. |
The accompanying notes are an integral part of these financial statements.
| | | | | | |
| Statement of operations—six months ended January 31, 2019 (unaudited) | | Wells Fargo Growth Fund | | | 15 | |
| | | | |
| | | | |
| |
Investment income | | | | |
Dividends (net of foreign withholding taxes of $43,908) | | $ | 15,958,004 | |
Income from affiliated securities | | | 719,482 | |
| | | | |
Total investment income | | | 16,677,486 | |
| | | | |
| |
Expenses | | | | |
Management fee | | | 15,595,558 | |
Administration fees | | | | |
Class A | | | 2,121,678 | |
Class C | | | 178,481 | |
Class R6 | | | 38,512 | |
Administrator Class | | | 331,674 | |
Institutional Class | | | 970,548 | |
Shareholder servicing fees | | | | |
Class A | | | 2,525,807 | |
Class C | | | 212,477 | |
Administrator Class | | | 636,764 | |
Distribution fee | | | | |
Class C | | | 637,431 | |
Custody and accounting fees | | | 79,293 | |
Professional fees | | | 25,686 | |
Registration fees | | | 60,494 | |
Shareholder report expenses | | | 126,027 | |
Trustees’ fees and expenses | | | 12,610 | |
Other fees and expenses | | | 43,107 | |
| | | | |
Total expenses | | | 23,596,147 | |
Less: Fee waivers and/or expense reimbursements | | | (1,305,858 | ) |
| | | | |
Net expenses | | | 22,290,289 | |
| | | | |
Net investment loss | | | (5,612,803 | ) |
| | | | |
| |
REALIZED AND UNREALIZED GAINS (LOSSES) ON INVESTMENTS | | | | |
| |
Net realized gains (losses) on: | | | | |
Unaffiliated securities | | | 342,732,800 | |
Affiliated securities | | | (2,079 | ) |
| | | | |
Net realized gains on investments | | | 342,730,721 | |
| | | | |
| |
Net change in unrealized gains (losses) on: | | | | |
Unaffiliated securities | | | (472,479,827 | ) |
Affiliated securities | | | (27,975,984 | ) |
| | | | |
Net change in unrealized gains (losses) on investments | | | (500,455,811 | ) |
| | | | |
Net realized and unrealized gains (losses) on investments | | | (157,725,090 | ) |
| | | | |
Net decrease in net assets resulting from operations | | $ | (163,337,893 | ) |
| | | | |
The accompanying notes are an integral part of these financial statements.
| | | | |
| 16 | | Wells Fargo Growth Fund | | Statement of changes in net assets |
| | | | | | | | | | | | | | | | |
| | | Six months ended
January 31, 2019
(unaudited) | | | Year ended
July 31, 20181 | |
| | | |
Operations | | | | | | | | | | | | |
Net investment loss | | | | | | $ | (5,612,803 | ) | | | | | | $ | (13,576,427 | ) |
Net realized gains on investments | | | | | | | 342,730,721 | | | | | | | | 745,731,324 | |
Net change in unrealized gains (losses) on investments | | | | | | | (500,455,811 | ) | | | | | | | 402,450,351 | |
| | | | |
Net increase (decrease) in net assets resulting from operations | | | | | | | (163,337,893 | ) | | | | | | | 1,134,605,248 | |
| | | | |
| | | |
Distributions to shareholders from net investment income and net realized gains | | | | | | | | | | | | |
Class A | | | | | | | (355,696,811 | ) | | | | | | | (505,431,285 | ) |
Class C | | | | | | | (37,666,442 | ) | | | | | | | (57,934,182 | ) |
Class R6 | | | | | | | (36,585,868 | ) | | | | | | | (16,966,960 | ) |
Administrator Class | | | | | | | (78,768,918 | ) | | | | | | | (138,040,210 | ) |
Institutional Class | | | | | | | (211,847,451 | ) | | | | | | | (379,819,630 | ) |
| | | | |
Total distributions to shareholders | | | | | | | (720,565,490 | ) | | | | | | | (1,098,192,267 | ) |
| | | | |
| | | | |
Capital share transactions | | | Shares | | | | | | | | Shares | | | | | |
Proceeds from shares sold | | | | | | | | | | | | | | | | |
Class A | | | 1,325,180 | | | | 44,346,842 | | | | 2,597,711 | | | | 97,664,924 | |
Class C | | | 585,986 | | | | 13,182,812 | | | | 567,969 | | | | 15,881,145 | |
Class R6 | | | 1,600,879 | | | | 66,442,536 | | | | 4,402,138 | | | | 197,214,825 | |
Administrator Class | | | 915,634 | | | | 36,427,313 | | | | 2,015,636 | | | | 86,044,136 | |
Institutional Class | | | 2,764,677 | | | | 117,978,723 | | | | 8,063,218 | | | | 384,247,586 | |
| | | | |
| | | | |
| | | | | | | 278,378,226 | | | | | | | | 781,052,616 | |
| | | | |
Reinvestment of distributions | | | | | | | | | | | | | | | | |
Class A | | | 12,007,591 | | | | 343,056,893 | | | | 14,511,944 | | | | 482,812,377 | |
Class C | | | 1,566,352 | | | | 32,721,099 | | | | 1,880,250 | | | | 49,281,340 | |
Class R6 | | | 995,813 | | | | 36,576,208 | | | | 415,977 | | | | 16,959,366 | |
Administrator Class | | | 2,333,920 | | | | 77,882,902 | | | | 3,626,546 | | | | 136,757,066 | |
Institutional Class | | | 5,586,200 | | | | 204,566,633 | | | | 9,008,188 | | | | 366,543,153 | |
| | | | |
| | | | |
| | | | | | | 694,803,735 | | | | | | | | 1,052,353,302 | |
| | | | |
Payment for shares redeemed | | | | | | | | | | | | | | | | |
Class A | | | (5,726,612 | ) | | | (191,146,573 | ) | | | (10,001,358 | ) | | | (381,655,936 | ) |
Class C | | | (1,349,749 | ) | | | (33,163,610 | ) | | | (2,374,317 | ) | | | (73,235,128 | ) |
Class R6 | | | (771,520 | ) | | | (33,830,844 | ) | | | (758,315 | ) | | | (34,584,223 | ) |
Administrator Class | | | (2,708,061 | ) | | | (107,183,368 | ) | | | (7,153,909 | ) | | | (302,587,215 | ) |
Institutional Class | | | (6,988,141 | ) | | | (296,613,297 | ) | | | (18,199,975 | ) | | | (827,075,266 | ) |
| | | | |
| | | | |
| | | | | | | (661,937,692 | ) | | | | | | | (1,619,137,768 | ) |
| | | | |
Net increase in net assets resulting from capital share transactions | | | | | | | 311,244,269 | | | | | | | | 214,268,150 | |
| | | | |
Total increase (decrease) in net assets | | | | | | | (572,659,114 | ) | | | | | | | 250,681,131 | |
| | | | |
| | |
Net assets | | | | | | | | |
Beginning of period | | | | | | | 4,750,003,928 | | | | | | | | 4,499,322,797 | |
| | | | |
End of period | | | | | | $ | 4,177,344,814 | | | | | | | $ | 4,750,003,928 | |
| | | | |
| 1 | Effective for all filings after November 4, 2018, the SEC prospectively eliminated the requirement to parenthetically disclose undistributed net investment income at the end of the period and permitted the aggregation of distributions, with the exception of tax basis returns of capital. Undistributed net investment income at July 31, 2018 was $0. The disaggregated distributions information for the year ended July 31, 2018 is included in Note 7,Distributions to Shareholders, in the notes to the financial statements. |
The accompanying notes are an integral part of these financial statements.
| | | | | | |
| Financial highlights | | Wells Fargo Growth Fund | | | 17 | |
(For a share outstanding throughout each period)
| | | | | | | | | | | | | | | | | | | | | | | | |
| | | Six months ended
January 31, 2019
(unaudited) | | | Year ended July 31 | |
| CLASS A | | 2018 | | | 2017 | | | 2016 | | | 2015 | | | 2014 | |
Net asset value, beginning of period | | | $38.67 | | | | $40.38 | | | | $42.28 | | | | $49.50 | | | | $49.99 | | | | $46.74 | |
Net investment loss | | | (0.07 | )1 | | | (0.12 | ) | | | (0.19 | )1 | | | (0.20 | )1 | | | (0.29 | )1 | | | (0.32 | )1 |
Net realized and unrealized gains (losses) on investments | | | (1.63 | ) | | | 9.49 | | | | 5.61 | | | | (0.99 | ) | | | 7.03 | | | | 5.34 | |
| | | | | | | | | | | | | | | | | | | | | | | | |
Total from investment operations | | | (1.70 | ) | | | 9.37 | | | | 5.42 | | | | (1.19 | ) | | | 6.74 | | | | 5.02 | |
Distributions to shareholders from | | | | | | | | | | | | | | | | | | | | | | | | |
Net realized gains | | | (6.71 | ) | | | (11.08 | ) | | | (7.32 | ) | | | (6.03 | ) | | | (7.23 | ) | | | (1.77 | ) |
Net asset value, end of period | | | $30.26 | | | | $38.67 | | | | $40.38 | | | | $42.28 | | | | $49.50 | | | | $49.99 | |
Total return2 | | | (3.38 | )% | | | 27.66 | % | | | 15.95 | % | | | (1.69 | )% | | | 15.01 | % | | | 10.77 | % |
Ratios to average net assets (annualized) | | | | | | | | | | | | | | | | | | | | | | | | |
Gross expenses | | | 1.18 | % | | | 1.18 | % | | | 1.17 | % | | | 1.15 | % | | | 1.18 | % | | | 1.18 | % |
Net expenses | | | 1.16 | % | | | 1.16 | % | | | 1.16 | % | | | 1.14 | % | | | 1.18 | % | | | 1.18 | % |
Net investment loss | | | (0.41 | )% | | | (0.45 | )% | | | (0.49 | )% | | | (0.49 | )% | | | (0.59 | )% | | | (0.64 | )% |
Supplemental data | | | | | | | | | | | | | | | | | | | | | | | | |
Portfolio turnover rate | | | 24 | % | | | 37 | % | | | 42 | % | | | 38 | % | | | 35 | % | | | 42 | % |
Net assets, end of period (000s omitted) | | | $1,906,911 | | | | $2,142,855 | | | | $1,950,551 | | | | $2,582,955 | | | | $1,465,643 | | | | $2,047,410 | |
| 1 | Calculated based upon average shares outstanding |
| 2 | Total return calculations do not include any sales charges. Returns for periods of less than one year are not annualized. |
The accompanying notes are an integral part of these financial statements.
| | | | |
| 18 | | Wells Fargo Growth Fund | | Financial highlights |
(For a share outstanding throughout each period)
| | | | | | | | | | | | | | | | | | | | | | | | |
| | | Six months ended
January 31, 2019
(unaudited) | | | Year ended July 31 | |
| CLASS C | | 2018 | | | 2017 | | | 2016 | | | 2015 | | | 2014 | |
Net asset value, beginning of period | | | $30.33 | | | | $34.05 | | | | $37.07 | | | | $44.51 | | | | $45.95 | | | | $43.41 | |
Net investment loss | | | (0.16 | )1 | | | (0.33 | ) | | | (0.41 | )1 | | | (0.46 | )1 | | | (0.60 | )1 | | | (0.64 | )1 |
Net realized and unrealized gains (losses) on investments | | | (1.36 | ) | | | 7.69 | | | | 4.71 | | | | (0.95 | ) | | | 6.39 | | | | 4.95 | |
| | | | | | | | | | | | | | | | | | | | | | | | |
Total from investment operations | | | (1.52 | ) | | | 7.36 | | | | 4.30 | | | | (1.41 | ) | | | 5.79 | | | | 4.31 | |
Distributions to shareholders from | | | | | | | | | | | | | | | | | | | | | | | | |
Net realized gains | | | (6.71 | ) | | | (11.08 | ) | | | (7.32 | ) | | | (6.03 | ) | | | (7.23 | ) | | | (1.77 | ) |
Net asset value, end of period | | | $22.10 | | | | $30.33 | | | | $34.05 | | | | $37.07 | | | | $44.51 | | | | $45.95 | |
Total return2 | | | (3.74 | )% | | | 26.73 | % | | | 15.05 | % | | | (2.44 | )% | | | 14.16 | % | | | 9.96 | % |
Ratios to average net assets (annualized) | | | | | | | | | | | | | | | | | | | | | | | | |
Gross expenses | | | 1.93 | % | | | 1.93 | % | | | 1.92 | % | | | 1.90 | % | | | 1.93 | % | | | 1.93 | % |
Net expenses | | | 1.91 | % | | | 1.91 | % | | | 1.91 | % | | | 1.89 | % | | | 1.93 | % | | | 1.93 | % |
Net investment loss | | | (1.16 | )% | | | (1.19 | )% | | | (1.23 | )% | | | (1.24 | )% | | | (1.34 | )% | | | (1.39 | )% |
Supplemental data | | | | | | | | | | | | | | | | | | | | | | | | |
Portfolio turnover rate | | | 24 | % | | | 37 | % | | | 42 | % | | | 38 | % | | | 35 | % | | | 42 | % |
Net assets, end of period (000s omitted) | | | $152,776 | | | | $185,346 | | | | $205,607 | | | | $321,032 | | | | $465,833 | | | | $560,481 | |
| 1 | Calculated based upon average shares outstanding |
| 2 | Total return calculations do not include any sales charges. Returns for periods of less than one year are not annualized. |
The accompanying notes are an integral part of these financial statements.
| | | | | | |
| Financial highlights | | Wells Fargo Growth Fund | | | 19 | |
(For a share outstanding throughout each period)
| | | | | | | | | | | | | | | | |
| | | Six months ended
January 31, 2019 (unaudited) | | | Year ended July 31 | |
| CLASS R6 | | 2018 | | | 2017 | | | 20161 | |
Net asset value, beginning of period | | | $47.53 | | | | $47.13 | | | | $47.90 | | | | $48.97 | |
Net investment income (loss) | | | 0.01 | 2 | | | (0.01 | )2 | | | (0.02 | )2 | | | (0.02 | ) |
Net realized and unrealized gains (losses) on investments | | | (1.91 | ) | | | 11.49 | | | | 6.57 | | | | 4.98 | |
| | | | | | | | | | | | | | | | |
Total from investment operations | | | (1.90 | ) | | | 11.48 | | | | 6.55 | | | | 4.96 | |
Distributions to shareholders from | | | | | | | | | | | | | | | | |
Net realized gains | | | (6.71 | ) | | | (11.08 | ) | | | (7.32 | ) | | | (6.03 | ) |
Net asset value, end of period | | | $38.92 | | | | $47.53 | | | | $47.13 | | | | $47.90 | |
Total return3 | | | (3.16 | )% | | | 28.26 | % | | | 16.49 | % | | | 10.89 | % |
Ratios to average net assets (annualized) | | | | | | | | | | | | | | | | |
Gross expenses | | | 0.75 | % | | | 0.75 | % | | | 0.74 | % | | | 0.74 | % |
Net expenses | | | 0.70 | % | | | 0.70 | % | | | 0.70 | % | | | 0.70 | % |
Net investment income (loss) | | | 0.04 | % | | | (0.02 | )% | | | (0.05 | )% | | | (0.23 | )% |
Supplemental data | | | | | | | | | | | | | | | | |
Portfolio turnover rate | | | 24 | % | | | 37 | % | | | 42 | % | | | 38 | % |
Net assets, end of period (000s omitted) | | | $269,903 | | | | $242,838 | | | | $49,454 | | | | $30,906 | |
| 1 | For the period from September 30, 2015 (commencement of class operations) to July 31, 2016 |
| 2 | Calculated based upon average shares outstanding |
| 3 | Returns for periods of less than one year are not annualized. |
The accompanying notes are an integral part of these financial statements.
| | | | |
| 20 | | Wells Fargo Growth Fund | | Financial highlights |
(For a share outstanding throughout each period)
| | | | | | | | | | | | | | | | | | | | | | | | |
| | | Six months ended
January 31, 2019 (unaudited) | | | Year ended July 31 | |
| ADMINISTRATOR CLASS | | 2018 | | | 2017 | | | 2016 | | | 2015 | | | 2014 | |
Net asset value, beginning of period | | | $43.89 | | | | $44.40 | | | | $45.66 | | | | $52.86 | | | | $52.80 | | | | $49.16 | |
Net investment loss | | | (0.04 | )1 | | | (0.11 | )1 | | | (0.11 | )1 | | | (0.14 | )1 | | | (0.20 | )1 | | | (0.23 | ) |
Net realized and unrealized gains (losses) on investments | | | (1.79 | ) | | | 10.68 | | | | 6.17 | | | | (1.03 | ) | | | 7.49 | | | | 5.64 | |
| | | | | | | | | | | | | | | | | | | | | | | | |
Total from investment operations | | | (1.83 | ) | | | 10.57 | | | | 6.06 | | | | (1.17 | ) | | | 7.29 | | | | 5.41 | |
Distributions to shareholders from | | | | | | | | | | | | | | | | | | | | | | | | |
Net realized gains | | | (6.71 | ) | | | (11.08 | ) | | | (7.32 | ) | | | (6.03 | ) | | | (7.23 | ) | | | (1.77 | ) |
Net asset value, end of period | | | $35.35 | | | | $43.89 | | | | $44.40 | | | | $45.66 | | | | $52.86 | | | | $52.80 | |
Total return2 | | | (3.27 | )% | | | 27.90 | % | | | 16.20 | % | | | (1.53 | )% | | | 15.28 | % | | | 11.04 | % |
Ratios to average net assets (annualized) | | | | | | | | | | | | | | | | | | | | | | | | |
Gross expenses | | | 1.10 | % | | | 1.10 | % | | | 1.09 | % | | | 1.07 | % | | | 1.02 | % | | | 1.02 | % |
Net expenses | | | 0.96 | % | | | 0.96 | % | | | 0.96 | % | | | 0.96 | % | | | 0.96 | % | | | 0.96 | % |
Net investment loss | | | (0.21 | )% | | | (0.24 | )% | | | (0.27 | )% | | | (0.31 | )% | | | (0.37 | )% | | | (0.42 | )% |
Supplemental data | | | | | | | | | | | | | | | | | | | | | | | | |
Portfolio turnover rate | | | 24 | % | | | 37 | % | | | 42 | % | | | 38 | % | | | 35 | % | | | 42 | % |
Net assets, end of period (000s omitted) | | | $473,642 | | | | $564,391 | | | | $637,987 | | | | $1,528,288 | | | | $2,349,359 | | | | $3,359,480 | |
| 1 | Calculated based upon average shares outstanding |
| 2 | Returns for periods of less than one year are not annualized. |
The accompanying notes are an integral part of these financial statements.
| | | | | | |
| Financial highlights | | Wells Fargo Growth Fund | | | 21 | |
(For a share outstanding throughout each period)
| | | | | | | | | | | | | | | | | | | | | | | | |
| | | Six months ended
January 31, 2019 (unaudited) | | | Year ended July 31 | |
| INSTITUTIONAL CLASS | | 2018 | | | 2017 | | | 2016 | | | 2015 | | | 2014 | |
Net asset value, beginning of period | | | $47.43 | | | | $47.07 | | | | $47.87 | | | | $54.99 | | | | $54.54 | | | | $50.63 | |
Net investment income (loss) | | | 0.00 | 1,2 | | | (0.02 | )1 | | | (0.04 | )1 | | | (0.05 | )1 | | | (0.09 | )1 | | | (0.13 | ) |
Net realized and unrealized gains (losses) on investments | | | (1.91 | ) | | | 11.46 | | | | 6.56 | | | | (1.04 | ) | | | 7.77 | | | | 5.81 | |
| | | | | | | | | | | | | | | | | | | | | | | | |
Total from investment operations | | | (1.91 | ) | | | 11.44 | | | | 6.52 | | | | (1.09 | ) | | | 7.68 | | | | 5.68 | |
Distributions to shareholders from | | | | | | | | | | | | | | | | | | | | | | | | |
Net realized gains | | | (6.71 | ) | | | (11.08 | ) | | | (7.32 | ) | | | (6.03 | ) | | | (7.23 | ) | | | (1.77 | ) |
Net asset value, end of period | | | $38.81 | | | | $47.43 | | | | $47.07 | | | | $47.87 | | | | $54.99 | | | | $54.54 | |
Total return3 | | | (3.19 | )% | | | 28.21 | % | | | 16.44 | % | | | (1.31 | )% | | | 15.53 | % | | | 11.26 | % |
Ratios to average net assets (annualized) | | | | | | | | | | | | | | | | | | | | | | | | |
Gross expenses | | | 0.85 | % | | | 0.85 | % | | | 0.84 | % | | | 0.82 | % | | | 0.76 | % | | | 0.75 | % |
Net expenses | | | 0.75 | % | | | 0.75 | % | | | 0.75 | % | | | 0.75 | % | | | 0.75 | % | | | 0.75 | % |
Net investment income (loss) | | | 0.00 | % | | | (0.03 | )% | | | (0.08 | )% | | | (0.10 | )% | | | (0.17 | )% | | | (0.21 | )% |
Supplemental data | | | | | | | | | | | | | | | | | | | | | | | | |
Portfolio turnover rate | | | 24 | % | | | 37 | % | | | 42 | % | | | 38 | % | | | 35 | % | | | 42 | % |
Net assets, end of period (000s omitted) | | | $1,374,113 | | | | $1,614,575 | | | | $1,655,724 | | | | $2,398,134 | | | | $3,863,196 | | | | $2,975,721 | |
| 1 | Calculated based upon average shares outstanding |
| 2 | Amount is less than $0.005. |
| 3 | Returns for periods of less than one year are not annualized. |
The accompanying notes are an integral part of these financial statements.
| | | | |
| 22 | | Wells Fargo Growth Fund | | Notes to financial statements (unaudited) |
1. ORGANIZATION
Wells Fargo Fund Trust (the “Trust”), a Delaware statutory trust organized on March 10, 1999, is an open-end management investment company registered under the Investment Company Act of 1940, as amended (the “1940 Act”). As an investment company, the Trust follows the accounting and reporting guidance in Financial Accounting Standards Board (“FASB”) Accounting Standards Codification Topic 946, Financial Services – Investment Companies. These financial statements report on the Wells Fargo Growth Fund (the “Fund”) which is a diversified series of the Trust.
2. SIGNIFICANT ACCOUNTING POLICIES
The following significant accounting policies, which are consistently followed in the preparation of the financial statements of the Fund, are in conformity with U.S. generally accepted accounting principles which require management to make estimates and assumptions that affect the reported amounts of assets and liabilities, disclosure of contingent assets and liabilities at the date of the financial statements, and the reported amounts of revenues and expenses during the reporting period. Actual results could differ from those estimates.
Securities valuation
All investments are valued each business day as of the close of regular trading on the New York Stock Exchange (generally 4 p.m. Eastern Time), although the Fund may deviate from this calculation time under unusual or unexpected circumstances.
Equity securities that are listed on a foreign or domestic exchange or market are valued at the official closing price or, if none, the last sales price. If no sale occurs on the principal exchange or market that day, a fair value price will be determined in accordance with the Fund’s Valuation Procedures.
Investments in registered open-end investment companies are valued at net asset value. Interests in non-registered investment companies that are redeemable at net asset value are fair valued normally at net asset value.
Investments which are not valued using any of the methods discussed above are valued at their fair value, as determined in good faith by the Board of Trustees of the Fund. The Board of Trustees has established a Valuation Committee comprised of the Trustees and has delegated to it the authority to take any actions regarding the valuation of portfolio securities that the Valuation Committee deems necessary or appropriate, including determining the fair value of portfolio securities, unless the determination has been delegated to the Wells Fargo Asset Management Pricing Committee at Wells Fargo Funds Management, LLC (“Funds Management”). The Board of Trustees retains the authority to make or ratify any valuation decisions or approve any changes to the Valuation Procedures as it deems appropriate. On a quarterly basis, the Board of Trustees receives reports on any valuation actions taken by the Valuation Committee or the Wells Fargo Asset Management Pricing Committee which may include items for ratification.
Foreign currency translation
The accounting records of the Fund are maintained in U.S. dollars. The values of other assets and liabilities denominated in foreign currencies are translated into U.S. dollars at rates provided by an independent foreign currency pricing source at a time each business day specified by the Wells Fargo Asset Management Pricing Committee. Purchases and sales of securities, and income and expenses are converted at the rate of exchange on the respective dates of such transactions. Net realized foreign exchange gains or losses arise from sales of foreign currencies, currency gains or losses realized between the trade and settlement dates on securities transactions, and the difference between the amounts of dividends, interest and foreign withholding taxes recorded and the U.S. dollar equivalent of the amounts actually paid or received. Net unrealized foreign exchange gains and losses arise from changes in the fair value of assets and liabilities other than investments in securities resulting from changes in exchange rates. The changes in net assets arising from changes in exchange rates of securities and the changes in net assets resulting from changes in market prices of securities are not separately presented. Such changes are included in net realized and unrealized gains or losses from investments.
Securities lending
The Fund may lend its securities from time to time in order to earn additional income in the form of fees or interest on securities received as collateral or the investment of any cash received as collateral. The Fund continues to receive interest or dividends on the securities loaned. The Fund receives collateral in the form of cash or securities with a value at least equal to the value of the securities on loan. The value of the loaned securities is determined at the close of each business day and any additional required collateral is delivered to the Fund on the next business day. In a securities lending transaction, the net asset value of the Fund will be affected by an increase or decrease in the value of the securities loaned and by an increase or decrease in the value of the instrument in which collateral is invested. The amount
| | | | | | |
| Notes to financial statements (unaudited) | | Wells Fargo Growth Fund | | | 23 | |
of securities lending activity undertaken by the Fund fluctuates from time to time. In the event of default or bankruptcy by the borrower, the Fund may be prevented from recovering the loaned securities or gaining access to the collateral or may experience delays or costs in doing so. In addition, the investment of any cash collateral received may lose all or part of its value. The Fund has the right under the lending agreement to recover the securities from the borrower on demand.
The Fund lends its securities through an unaffiliated securities lending agent. Cash collateral received in connection with its securities lending transactions is invested in Securities Lending Cash Investments, LLC (the “Securities Lending Fund”). The Securities Lending Fund is exempt from registration under Section 3(c)(7) of the 1940 Act and is managed by Funds Management and is subadvised by Wells Capital Management Incorporated (“WellsCap”), an affiliate of Funds Management and an indirect wholly owned subsidiary of Wells Fargo & Company (“Wells Fargo”). Funds Management receives an advisory fee starting at 0.05% and declining to 0.01% as the average daily net assets of the Securities Lending Fund increase. All of the fees received by Funds Management are paid to WellsCap for its services as subadviser. The Securities Lending Fund seeks to provide a positive return compared to the daily Fed Funds Open Rate by investing in high-quality, U.S. dollar-denominated short-term money market instruments. Securities Lending Fund investments are valued at the evaluated bid price provided by an independent pricing service. Income earned from investment in the Securities Lending Fund (net of fees and rebates), if any, is included in income from affiliated securities on the Statement of Operations.
Security transactions and income recognition
Securities transactions are recorded on a trade date basis. Realized gains or losses are recorded on the basis of identified cost.
Dividend income is recognized on the ex-dividend date. Dividend income is recorded net of foreign taxes withheld where recovery of such taxes is not assured.
Distributions to shareholders
Distributions to shareholders from net investment income and any net realized gains are recorded on the ex-dividend date and paid at least annually. Such distributions are determined in accordance with income tax regulations and may differ from U.S. generally accepted accounting principles. Dividend sources are estimated at the time of declaration. The tax character of distributions is determined as of the Fund’s fiscal year end. Therefore, a portion of the Fund’s distributions made prior to the Fund’s fiscal year end may be categorized as a tax return of capital at year end.
Federal and other taxes
The Fund intends to continue to qualify as a regulated investment company by distributing substantially all of its investment company taxable income and any net realized capital gains (after reduction for capital loss carryforwards) sufficient to relieve it from all, or substantially all, federal income taxes. Accordingly, no provision for federal income taxes was required.
The Fund’s income and federal excise tax returns and all financial records supporting those returns for the prior three fiscal years are subject to examination by the federal and Delaware revenue authorities. Management has analyzed the Fund’s tax positions taken on federal, state, and foreign tax returns for all open tax years and does not believe that there are any uncertain tax positions that require recognition of a tax liability.
As of January 31, 2019, the aggregate cost of all investments for federal income tax purposes was $2,452,304,077 and the unrealized gains (losses) consisted of:
| | | | |
| |
Gross unrealized gains | | $ | 2,020,048,182 | |
| |
Gross unrealized losses | | | (30,627,083 | ) |
| |
Net unrealized gains | | $ | 1,989,421,099 | |
Class allocations
The separate classes of shares offered by the Fund differ principally in applicable sales charges, distribution, shareholder servicing, and administration fees. Class specific expenses are charged directly to that share class. Investment income, common expenses, and realized and unrealized gains (losses) on investments are allocated daily to each class of shares based on the relative proportion of net assets of each class.
| | | | |
| 24 | | Wells Fargo Growth Fund | | Notes to financial statements (unaudited) |
3. FAIR VALUATION MEASUREMENTS
Fair value measurements of investments are determined within a framework that has established a fair value hierarchy based upon the various data inputs utilized in determining the value of the Fund’s investments. The three-level hierarchy gives the highest priority to unadjusted quoted prices in active markets for identical assets or liabilities (Level 1) and the lowest priority to unobservable inputs (Level 3). The Fund’s investments are classified within the fair value hierarchy based on the lowest level of input that is significant to the fair value measurement. The inputs are summarized into three broad levels as follows:
| ∎ | | Level 1 – quoted prices in active markets for identical securities |
| ∎ | | Level 2 – other significant observable inputs (including quoted prices for similar securities, interest rates, prepayment speeds, credit risk, etc.) |
| ∎ | | Level 3 – significant unobservable inputs (including the Fund’s own assumptions in determining the fair value of investments) |
The inputs or methodologies used for valuing investments in securities are not necessarily an indication of the risk associated with investing in those securities.
The following is a summary of the inputs used in valuing the Fund’s assets and liabilities as of January 31, 2019:
| | | | | | | | | | | | | | | | |
| | | | |
| | | Quoted prices
(Level 1) | | | Other significant
observable inputs
(Level 2) | | | Significant
unobservable inputs (Level 3) | | | Total | |
| | | | |
Assets | | | | | | | | | | | | | | | | |
Investments in: | | | | | | | | | | | | | | | | |
| | | | |
Common stocks | | | | | | | | | | | | | | | | |
| | | | |
Communication services | | $ | 414,981,195 | | | $ | 0 | | | $ | 0 | | | $ | 414,981,195 | |
| | | | |
Consumer discretionary | | | 687,267,887 | | | | 0 | | | | 0 | | | | 687,267,887 | |
| | | | |
Consumer staples | | | 120,252,913 | | | | 0 | | | | 0 | | | | 120,252,913 | |
| | | | |
Energy | | | 39,565,176 | | | | 0 | | | | 0 | | | | 39,565,176 | |
| | | | |
Financials | | | 259,432,781 | | | | 0 | | | | 0 | | | | 259,432,781 | |
| | | | |
Health care | | | 347,975,064 | | | | 0 | | | | 0 | | | | 347,975,064 | |
| | | | |
Industrials | | | 570,114,609 | | | | 0 | | | | 0 | | | | 570,114,609 | |
| | | | |
Information technology | | | 1,593,415,027 | | | | 0 | | | | 0 | | | | 1,593,415,027 | |
| | | | |
Materials | | | 103,543,884 | | | | 0 | | | | 0 | | | | 103,543,884 | |
| | | | |
Short-term investments | | | | | | | | | | | | | | | | |
| | | | |
Investment companies | | | 51,925,610 | | | | 253,251,030 | | | | 0 | | | | 305,176,640 | |
| | | | |
Total assets | | $ | 4,188,474,146 | | | $ | 253,251,030 | | | $ | 0 | | | $ | 4,441,725,176 | |
Additional sector, industry or geographic detail is included in the Portfolio of Investments.
At January 31, 2019, the Fund did not have any transfers into/out of Level 3.
4. TRANSACTIONS WITH AFFILIATES
Management fee
Funds Management, an indirect wholly owned subsidiary of Wells Fargo, is the manager of the Fund and provides advisory and fund-level administrative services under an investment management agreement. Under the investment management agreement, Funds Management is responsible for, among other services, implementing the investment objectives and strategies of the Fund, supervising the subadviser and providing fund-level administrative services in connection with the Fund’s operations. As compensation for its services under the investment management agreement, Funds Management is entitled to receive an annual management fee starting at 0.80% and declining to 0.555% as the average daily net assets of the Fund increase. For the six months ended January 31, 2019, the management fee was equivalent to an annual rate of 0.70% of the Fund’s average daily net assets.
Funds Management has retained the services of a subadviser to provide daily portfolio management to the Fund. The fee for subadvisory services is borne by Funds Management. WellsCap is the subadviser to the Fund and is entitled to receive a fee from Funds Management at an annual rate starting at 0.45% and declining to 0.30% as the average daily net assets of the Fund increase.
| | | | | | |
| Notes to financial statements (unaudited) | | Wells Fargo Growth Fund | | | 25 | |
Administration fees
Under a class-level administration agreement, Funds Management provides class-level administrative services to the Fund, which includes paying fees and expenses for services provided by the transfer agent, sub-transfer agents, omnibus account servicers and record-keepers. As compensation for its services under the class-level administration agreement, Funds Management receives an annual fee which is calculated based on the average daily net assets of each class as follows:
| | | | |
| | | Class-level
administration fee | |
| |
Class A, Class C | | | 0.21 | % |
| |
Class R6 | | | 0.03 | |
| |
Administrator Class, Institutional Class | | | 0.13 | |
Funds Management has contractually waived and/or reimbursed management and administration fees to the extent necessary to maintain certain net operating expense ratios for the Fund. When each class of the Fund has exceeded its expense cap, Funds Management has waived fees and/or reimbursed expenses from fund level expenses on a proportionate basis and then from class specific expenses; otherwise, waivers and/or reimbursements are applied against class specific expenses before fund level expenses. Funds Management has committed through November 30, 2019 to waive fees and/or reimburse expenses to the extent necessary to cap the Fund’s expenses at 1.16% for Class A shares, 1.91% for Class C shares, 0.70% for Class R6 shares, 0.96% for Administrator Class shares, and 0.75% for Institutional Class shares. Prior to or after the commitment expiration date, the cap may be increased or the commitment to maintain the cap may be terminated only with the approval of the Board of Trustees.
Distribution fee
The Trust has adopted a distribution plan for Class C shares of the Fund pursuant to Rule 12b-1 under the 1940 Act. A distribution fee is charged to Class C shares and paid to Wells Fargo Funds Distributor, LLC (“Funds Distributor”), the principal underwriter, at an annual rate of 0.75% of the average daily net assets of Class C shares.
In addition, Funds Distributor is entitled to receive the front-end sales charge from the purchase of Class A shares and a contingent deferred sales charge on the redemption of certain Class A shares. Funds Distributor is also entitled to receive the contingent deferred sales charges from redemptions of Class C shares. For the six months ended January 31, 2019, Funds Distributor received $13,879 from the sale of Class A shares and $88 in contingent deferred sales charges from redemptions of Class C shares. No contingent deferred sales charges were incurred by Class A for the six months ended January 31, 2019.
Shareholder servicing fees
The Trust has entered into contracts with one or more shareholder servicing agents, whereby Class A, Class C, and Administrator Class of the Fund are charged a fee at an annual rate of 0.25% of the average daily net assets of each respective class.
A portion of these total shareholder servicing fees were paid to affiliates of Wells Fargo.
Interfund transactions
The Fund may purchase or sell portfolio investment securities to certain other Wells Fargo affiliates pursuant toRule 17a-7 under the 1940 Act and under procedures adopted by the Board of Trustees. The procedures have been designed to ensure that these interfund transactions, which do not incur broker commissions, are effected at current market prices.
5. INVESTMENT PORTFOLIO TRANSACTIONS
Purchases and sales of investments, excluding U.S. government obligations (if any) and short-term securities, for the six months ended January 31, 2019 were $1,051,180,277 and $1,503,277,903, respectively.
6. BANK BORROWINGS
The Trust (excluding the money market funds), Wells Fargo Master Trust and Wells Fargo Variable Trust are parties to a $280,000,000 revolving credit agreement whereby the Fund is permitted to use bank borrowings for temporary or emergency purposes, such as to fund shareholder redemption requests. Interest under the credit agreement is charged to the Fund based on a borrowing rate equal to the higher of the Federal Funds rate in effect on that day plus 1.25% or the overnight LIBOR rate in effect on that day plus 1.25%. In addition, an annual commitment fee equal to 0.25% of the unused balance is allocated to each participating fund.
For the six months ended January 31, 2019, there were no borrowings by the Fund under the agreement.
| | | | |
| 26 | | Wells Fargo Growth Fund | | Notes to financial statements (unaudited) |
7. DISTRIBUTIONS TO SHAREHOLDERS
Effective for all filings after November 4, 2018, the Securities and Exchange Commission eliminated the requirement to separately state the components of distributions to shareholders under U.S. generally accepted accounting principles. The amounts of distributions to shareholders for the year ended July 31, 2018 were as follows:
| | | | |
| | | Net realized
gains | |
| |
Class A | | | $505,431,285 | |
| |
Class C | | | 57,934,182 | |
| |
Class R6 | | | 16,966,960 | |
| |
Administrator Class | | | 138,040,210 | |
| |
Institutional Class | | | 379,819,630 | |
8. CONCENTRATION RISK
Concentration risk result from exposure to a limited number of sectors. A fund that invests a substantial portion of its assets in any sector may be more affected by changes in that sector than would be a fund whose investments are not heavily weighted in any sector.
9. INDEMNIFICATION
Under the Trust’s organizational documents, the officers and Trustees have been granted certain indemnification rights against certain liabilities that may arise out of performance of their duties to the Trust. Additionally, in the normal course of business, the Trust may enter into contracts with service providers that contain a variety of indemnification clauses. The Trust’s maximum exposure under these arrangements is dependent on future claims that may be made against the Fund and, therefore, cannot be estimated.
10. REDEMPTION IN-KIND
After the close of business on July 12, 2018, the Fund redeemed assets through an in-kind redemption. In the redemption transaction, the Fund issued securities with a value of $75,847,965 and cash in the amount of $271,155. The redemption in-kind by a shareholder of the Institutional Class represented 1.54% of the Fund and is reflected on the Statement of Changes in Net Assets.
11. NEW ACCOUNTING PRONOUNCEMENT
In August 2018, FASB issued Accounting Standards Update (“ASU”) No. 2018-13, Fair Value Measurement (Topic 820)Disclosure Framework—Changes to the Disclosure Requirements for Fair Value Measurement. ASU 2018-13 updates the disclosure requirements for fair value measurements by modifying or removing certain disclosures and adding certain new disclosures. The amendments are effective for fiscal years, and interim periods within those fiscal years, beginning after December 15, 2019. Early adoption is permitted. Management has adopted the removal and modification of disclosures early, as permitted, and will adopt the additional new disclosures at the effective date.
| | | | | | |
| Other information (unaudited) | | Wells Fargo Growth Fund | | | 27 | |
PROXY VOTING INFORMATION
A description of the policies and procedures used to determine how to vote proxies relating to portfolio securities is available, upon request, by calling1-800-222-8222, visiting our website at wellsfargofunds.com, or visiting the SEC website at sec.gov. Information regarding how the Fund voted proxies relating to portfolio securities during the most recent 12-month period ended June 30 is available on the Fund’s website atwellsfargofunds.comor by visiting the SEC website at sec.gov.
PORTFOLIO HOLDINGS INFORMATION
The complete portfolio holdings for the Fund are publicly available monthly on the Fund’s website (wellsfargofunds.com), on a one-month delayed basis. In addition, top ten holdings information (excluding derivative positions) for the Fund is publicly available on the Fund’s website on a monthly, seven-day or more delayed basis. The Fund files its complete schedule of portfolio holdings with the SEC for the first and third quarters of each fiscal year on Form N-Q, which is available by visiting the SEC website at sec.gov. In addition, the Fund’s Form N-Q may be reviewed and copied at the SEC’s Public Reference Room in Washington, DC, and at regional offices in New York City, at 233 Broadway, and in Chicago, at 175 West Jackson Boulevard, Suite 900. Information about the Public Reference Room may be obtained by calling 1-800-SEC-0330.
| | | | |
| 28 | | Wells Fargo Growth Fund | | Other information (unaudited) |
BOARD OF TRUSTEES AND OFFICERS
Each of the Trustees and Officers1 listed in the table below acts in identical capacities for each fund in the Wells Fargo family of funds, which consists of 152 mutual funds comprising the Wells Fargo Funds Trust, Wells Fargo Variable Trust, Wells Fargo Master Trust and four closed-end funds (collectively the “Fund Complex”). This table should be read in conjunction with the Prospectus and the Statement of Additional Information2. The mailing address of each Trustee and Officer is 525 Market Street, 12th Floor, San Francisco, CA 94105. Each Trustee and Officer serves an indefinite term, however, each Trustee serves such term until reaching the mandatory retirement age established by the Trustees.
Independent Trustees
| | | | | | |
Name and
year of birth | | Position held and
length of service* | | Principal occupations during past five years or longer | | Current other
public company or
investment company
directorships |
| | | |
William R. Ebsworth
(Born 1957) | | Trustee, since 2015 | | Retired. From 1984 to 2013, equities analyst, portfolio manager, research director and chief investment officer at Fidelity Management and Research Company in Boston, Tokyo, and Hong Kong, and retired in 2013 as Chief Investment Officer of Fidelity Strategic Advisers, Inc. where he led a team of investment professionals managing client assets. Prior thereto, Board member of Hong Kong Securities Clearing Co., Hong Kong Options Clearing Corp., the Thailand International Fund, Ltd., Fidelity Investments Life Insurance Company, and Empire Fidelity Investments Life Insurance Company. Audit Committee Chair and Investment Committee Chair of the Vincent Memorial Hospital Endowment (non-profit organization). Mr. Ebsworth is a CFA® charterholder. | | N/A |
| | | |
Jane A. Freeman
(Born 1953) | | Trustee, since 2015; Chair Liaison, since 2018 | | Retired. From 2012 to 2014 and 1999 to 2008, Chief Financial Officer of Scientific Learning Corporation. From 2008 to 2012, Ms. Freeman provided consulting services related to strategic business projects. Prior to 1999, Portfolio Manager at Rockefeller & Co. and Scudder, Stevens & Clark. Board member of the Harding Loevner Funds from 1996 to 2014, serving as both Lead Independent Director and chair of the Audit Committee. Board member of the Russell Exchange Traded Funds Trust from 2011 to 2012 and the chair of the Audit Committee. Ms. Freeman is a Board Member of The Ruth Bancroft Garden (non-profit organization). She is also an inactive Chartered Financial Analyst. | | N/A |
| | | |
Isaiah Harris, Jr.3
(Born 1952) | | Trustee, since 2009; Audit Committee Chairman, since 2019 | | Retired. Chairman of the Board of CIGNA Corporation since 2009, and Director since 2005. From 2003 to 2011, Director of Deluxe Corporation. Prior thereto, President and CEO of BellSouth Advertising and Publishing Corp. from 2005 to 2007, President and CEO of BellSouth Enterprises from 2004 to 2005 and President of BellSouth Consumer Services from 2000 to 2003. Emeritus member of the Iowa State University Foundation Board of Governors. Emeritus Member of the Advisory Board of Iowa State University School of Business. Advisory Board Member, Palm Harbor Academy (private school). Advisory Board Member, Child Evangelism Fellowship (non-profit). Mr. Harris is a certified public accountant (inactive status). | | CIGNA Corporation |
| | | |
Judith M. Johnson3
(Born 1949) | | Trustee, since 2008; Audit Committee Chairman, from 2009 to 2018 | | Retired. Prior thereto, Chief Executive Officer and Chief Investment Officer of Minneapolis Employees Retirement Fund from 1996 to 2008. Ms. Johnson is an attorney, certified public accountant and a certified managerial accountant. | | N/A |
| | | |
David F. Larcker
(Born 1950) | | Trustee, since 2009 | | James Irvin Miller Professor of Accounting at the Graduate School of Business, Stanford University, Director of the Corporate Governance Research Initiative and Senior Faculty of The Rock Center for Corporate Governance since 2006. From 2005 to 2008, Professor of Accounting at the Graduate School of Business, Stanford University. Prior thereto, Ernst & Young Professor of Accounting at The Wharton School, University of Pennsylvania from 1985 to 2005. | | N/A |
| | | | | | |
| Other information (unaudited) | | Wells Fargo Growth Fund | | | 29 | |
| | | | | | |
Name and
year of birth | | Position held and
length of service* | | Principal occupations during past five years or longer | | Current other
public company or
investment company
directorships |
| | | |
Olivia S. Mitchell
(Born 1953) | | Trustee, since 2006; Nominating and Governance Committee Chairman, since 2018 | | International Foundation of Employee Benefit Plans Professor, Wharton School of the University of Pennsylvania since 1993. Director of Wharton’s Pension Research Council and Boettner Center on Pensions & Retirement Research, and Research Associate at the National Bureau of Economic Research. Previously, Cornell University Professor from 1978 to 1993. | | N/A |
| | | |
Timothy J. Penny
(Born 1951) | | Trustee, since 1996; Chairman, since 2018; Vice Chairman, from 2017 to 2018 | | President and Chief Executive Officer of Southern Minnesota Initiative Foundation, a non-profit organization, since 2007. Member of the Board of Trustees of NorthStar Education Finance, Inc., a non-profit organization, since 2007. | | N/A |
| | | |
James G. Polisson
(Born 1959) | | Trustee, since 2018; Advisory Board Member, from 2017 to 2018 | | Retired. Chief Marketing Officer, Source (ETF) UK Services, Ltd, from 2015 to 2017. From 2012 to 2015, Principal of The Polisson Group, LLC, a management consulting, corporate advisory and principal investing company. Chief Executive Officer and Managing Director at Russell Investments, Global Exchange Traded Funds from 2010 to 2012. Managing Director of Barclays Global Investors from 1998 to 2010 and Global Chief Marketing Officer for iShares and Barclays Global Investors from 2000 to 2010. Trustee of the San Francisco Mechanics’ Institute, a non-profit organization, from 2013 to 2015. Board member of the Russell Exchange Traded Fund Trust from 2011 to 2012. Director of Barclays Global Investors Holdings Deutschland GmbH from 2006 to 2009. Mr. Polisson is an attorney and has a retired status with the Massachusetts and District of Columbia Bar Associations. | | N/A |
| | | |
Pamela Wheelock
(Born 1959) | | Trustee, since 2018; Advisory Board Member, from 2017 to 2018 | | Board member of the Destination Medical Center Economic Development Agency, Rochester, Minnesota since 2019. Chief Operating Officer, Twin Cities Habitat for Humanity from 2017 to 2019. Vice President of University Services, University of Minnesota from 2012 to 2016. Prior thereto, on the Board of Directors, Governance Committee and Finance Committee for the Minnesota Philanthropy Partners (Saint Paul Foundation) from 2012 to 2018, Interim Chief Executive Officer of Blue Cross Blue Shield of Minnesota from 2011 to 2012, Chairman of the Board from 2009 to 2012 and Board Director from 2003 to 2015. Vice President, Leadership and Community Engagement, Bush Foundation, Saint Paul, Minnesota (a private foundation) from 2009 to 2011. Executive Vice President and Chief Financial Officer, Minnesota Sports and Entertainment from 2004 to 2009 and Senior Vice President from 2002 to 2004. Executive Vice President of the Minnesota Wild Foundation from 2004 to 2008. Commissioner of Finance, State of Minnesota, from 1999 to 2002. Currently Board Chair of the Minnesota Wild Foundation since 2010. | | N/A |
| * | Length of service dates reflect the Trustee’s commencement of service with the Trust’s predecessor entities, where applicable. |
| | | | |
| 30 | | Wells Fargo Growth Fund | | Other information (unaudited) |
Officers
| | | | | | |
Name and
year of birth | | Position held and
length of service | | Principal occupations during past five years or longer | | |
| | | |
Andrew Owen
(Born 1960) | | President, since 2017 | | Executive Vice President of Wells Fargo & Company and Head of Affiliated Managers, Wells Fargo Asset Management, since 2014. In addition, Mr. Owen is currently President, Chief Executive Officer and Director of Wells Fargo Funds Management, LLC since 2017. Prior thereto, Executive Vice President responsible for marketing, investments and product development for Wells Fargo Funds Management, LLC, from 2009 to 2014. | | |
| | | |
Jeremy DePalma1
(Born 1974) | | Treasurer, since 2012 | | Senior Vice President of Wells Fargo Funds Management, LLC since 2009. Senior Vice President of Evergreen Investment Management Company, LLC from 2008 to 2010 and head of the Fund Reporting and Control Team within Fund Administration from 2005 to 2010. | | |
| | | |
Alexander Kymn
(Born 1973) | | Secretary, since 2018; Chief Legal Officer, since 2018 | | Senior Company Counsel of Wells Fargo Bank, N.A. since 2018 (previously Senior Counsel from 2007 to 2018). Vice President of Wells Fargo Funds Management, LLC from 2008 to 2014. | | |
| | | |
Michael H. Whitaker
(Born 1967) | | Chief Compliance Officer, since 2016 | | Senior Vice President and Chief Compliance Officer since 2016. Senior Vice President and Chief Compliance Officer for Fidelity Investments from 2007 to 2016. | | |
| | | |
David Berardi
(Born 1975) | | Assistant Treasurer, since 2009 | | Vice President of Wells Fargo Funds Management, LLC since 2009. Vice President of Evergreen Investment Management Company, LLC from 2008 to 2010. Manager of Fund Reporting and Control for Evergreen Investment Management Company, LLC from 2004 to 2010. | | |
| 1 | Jeremy DePalma acts as Treasurer of 76 funds and Assistant Treasurer of 76 funds in the Fund Complex. |
| 2 | The Statement of Additional Information includes additional information about the Trustees and is available, without charge, upon request, by calling1-800-260-5969 or by visiting the website atwellsfargofunds.com. |
| 3 | Mr. Harris became Chairman of the Audit Committee effective January 1, 2019. |
| | | | | | |
| Appendix A (unaudited) | | Wells Fargo Growth Fund | | | 31 | |
SALES CHARGE REDUCTIONS AND WAIVERS FOR CERTAIN INTERMEDIARIES
Raymond James & Associates, Inc., Raymond James Financial Services & Raymond James affiliates (“Raymond James”)
Effective on or about March 1, 2019, shareholders purchasing Fund shares through a Raymond James platform or account will be eligible only for the following load waivers (front-end sales charge waivers and contingent deferred, or back-end, sales charge waivers) and discounts, which may differ from those disclosed elsewhere in the Fund’s Prospectus or SAI.
Front-end Sales Load Waivers on Class A shares Available at Raymond James
| | • | | Shares purchased in an investment advisory program. |
| | • | | Shares purchased through reinvestment of capital gains distributions and dividend reinvestment when purchasing shares of the same fund (but not any other fund within the fund family). |
| | • | | Employees and registered representatives of Raymond James or its affiliates and their family members as designated by Raymond James. |
| | • | | Shares purchased from the proceeds of redemptions within the same fund family, provided (1) the repurchase occurs within 90 days following the redemption, (2) the redemption and purchase occur in the same account, and (3) redeemed shares were subject to a front-end or deferred sales load (known as Rights of Reinstatement). |
| | • | | A shareholder in the fund’s Class C shares will have their shares automatically exchanged at net asset value to Class A shares (or the appropriate share class) of the fund if the shares are no longer subject to a CDSC and the exchange is in line with the policies and procedures of Raymond James. |
CDSC Waivers on Class A and C Shares Available at Raymond James
| | • | | Death or disability of the shareholder. |
| | • | | Shares sold as part of a systematic withdrawal plan as described in the Fund’s Prospectus. |
| | • | | Return of excess contributions from an IRA Account. |
| | • | | Shares sold as part of a required minimum distribution for IRA and retirement accounts due to the shareholder reaching age 70½ as described in the Fund’s prospectus. |
| | • | | Shares sold to pay Raymond James fees but only if the transaction is initiated by Raymond James. |
| | • | | Shares acquired through a right of reinstatement. |
Front-end Load Discounts Available at Raymond James: Breakpoints, and/or Rights of Accumulation
| | • | | Breakpoints as described in the Fund’s Prospectus. |
| | • | | Rights of accumulation which entitle shareholders to breakpoint discounts will be automatically calculated based on the aggregated holding of fund family assets held by accounts within the purchaser’s household at Raymond James. Eligible fund family assets not held at Raymond James may be included in the rights of accumulation calculation only if the shareholder notifies his or her financial advisor about such assets. |
This page is intentionally left blank.

For more information
More information about Wells Fargo Funds is available free upon request. To obtain literature, please write, visit the Fund’s website, or call:
Wells Fargo Funds
P.O. Box 219967
Kansas City, MO 64121-9967
Website: wellsfargofunds.com
Individual investors: 1-800-222-8222
Retail investment professionals: 1-888-877-9275
Institutional investment professionals:1-866-765-0778
This report and the financial statements contained herein are submitted for the general information of the shareholders of the Fund. If this report is used for promotional purposes, distribution of the report must be accompanied or preceded by a current prospectus. Before investing, please consider the investment objectives, risks, charges, and expenses of the investment. For a current prospectus and, if available, a summary prospectus, containing this information, call1-800-222-8222 or visit the Fund’s website atwellsfargofunds.com. Read the prospectus carefully before you invest or send money.
Wells Fargo Asset Management (WFAM) is the trade name for certain investment advisory/management firms owned by Wells Fargo & Company. These firms include but are not limited to Wells Capital Management Incorporated and Wells Fargo Funds Management, LLC. Certain products managed by WFAM entities are distributed by Wells Fargo Funds Distributor, LLC (a broker/dealer and Member FINRA).
This material is for general informational and educational purposes only and is NOT intended to provide investment advice or a recommendation of any kind—including a recommendation for any specific investment, strategy, or plan.
INVESTMENT PRODUCTS: NOT FDIC INSURED ◾ NO BANK GUARANTEE ◾ MAY LOSE VALUE
© 2019 Wells Fargo Funds Management, LLC. All rights reserved.
| | |
 | | 320771 03-19 SA206/SAR206 01-19 |
Semi-Annual Report
January 31, 2019

Wells Fargo Intrinsic Value Fund

Beginning on January 1, 2021, as permitted by new regulations adopted by the Securities and Exchange Commission, paper copies of the Wells Fargo Funds’ annual and semi-annual shareholder reports issued after this date will no longer be sent by mail, unless you specifically request paper copies of the reports. Instead, the reports will be made available on the Funds’ website, and you will be notified by mail each time a report is posted and provided with a website address to access the report.
If you already elected to receive shareholder reports electronically, you will not be affected by this change and you need not take any action. You may elect to receive shareholder reports and other communications from the Fund electronically at any time by contacting your financial intermediary (such as a broker-dealer or bank) or, if you are a direct investor, by calling 1-800-222-8222 or by enrolling at wellsfargo.com/advantagedelivery.
You may elect to receive all future reports in paper free of charge. If you invest through a financial intermediary, you can contact your financial intermediary to request that you continue to receive paper copies of your shareholder reports; if you invest directly with the Fund, you can call 1-800-222-8222. Your election to receive reports in paper will apply to all Wells Fargo Funds held in your account with your financial intermediary or, if you are a direct investor, to all Wells Fargo Funds that you hold.

Reduce clutter. Save trees.
Sign up for electronic delivery of prospectuses and shareholder reports atwellsfargo.com/advantagedelivery
Contents
The views expressed and any forward-looking statements are as of January 31, 2019, unless otherwise noted, and are those of the Fund managers and/or Wells Fargo Funds Management, LLC. Discussions of individual securities, or the markets generally, or any Wells Fargo Fund are not intended as individual recommendations. Future events or results may vary significantly from those expressed in any forward-looking statements. The views expressed are subject to change at any time in response to changing circumstances in the market. Wells Fargo Funds Management, LLC and the Fund disclaim any obligation to publicly update or revise any views expressed or forward-looking statements.
INVESTMENT PRODUCTS: NOT FDIC INSURED ◾ NO BANK GUARANTEE ◾ MAY LOSE VALUE
| | | | |
| 2 | | Wells Fargo Intrinsic Value Fund | | Letter to shareholders (unaudited) |

Andrew Owen
President
Wells Fargo Funds
Favorable third-quarter economic indicators and corporate earnings reports encouraged domestic stock investors.
Dear Shareholder:
We are pleased to offer you this semi-annual report for the Wells Fargo Intrinsic Value Fund for thesix-month period that ended January 31, 2019. Higher short-term interest rates, inflation concerns, trade tensions, slowing economic growth outside the U.S., and geopolitical events contributed to investment market volatility throughout the period.
For the period, U.S. stocks, as measured by the S&P 500 Index,1 fell 3.00% and international stocks, as measured by the MSCI ACWI ex USA Index (Net),2 declined 6.34%. Based on the MSCI EM Index (Net),3 emerging market stocks lost 2.60%. For bond investors, the Bloomberg Barclays U.S. Aggregate Bond Index4 added 2.71% while the Bloomberg Barclays Global Aggregateex-USD Index5 gained 1.37%. The Bloomberg Barclays Municipal Bond Index6 added 2.05%, and the ICE BofAML U.S. High Yield Index7 gained 1.02%.
Investors appeared to shake off lingering concerns during the third quarter.
Favorable third-quarter economic indicators and corporate earnings reports encouraged domestic stock investors. U.S. trade negotiations with Mexico and Canada made progress. The Conference Board Consumer Confidence Index®8 reached its highest level in 18 years during September. Several U.S. equity market indices reached records during August. The U.S. Federal Reserve (Fed) raised the federal funds rate by 25 basis points (bps; 100 bps equal 1.00%) to a target range of between 2.00% and 2.25% in September 2018. For the quarter that ended September 30, the S&P 500 Index added 7.71%.
Investors in international markets were not as reassured. Tensions between the U.S. and China increased when the U.S. imposed an additional $200 billion in tariffs on Chinese goods. China responded with $60 billion in tariffs on U.S. products. In addition, economic growth in China drew renewed concerns. The Bank of England, having raised its monetary policy rate to 0.50% in November 2017, increased the rate again in August 2018 to 0.75%. During the three-month period that ended September 30, 2018, the MSCI ACWI ex USA Index (Net) gained 0.71% while the MSCI EM Index (Net) declined 1.09%.
| 1 | The S&P 500 Index consists of 500 stocks chosen for market size, liquidity, and industry group representation. It is a market-value-weighted index with each stock’s weight in the index proportionate to its market value. You cannot invest directly in an index. |
| 2 | The Morgan Stanley Capital International (MSCI) All Country World Index (ACWI) ex USA Index (Net) is a free-float-adjusted market-capitalization-weighted index that is designed to measure the equity market performance of developed markets, excluding the United States and Canada. Source: MSCI. MSCI makes no express or implied warranties or representations and shall have no liability whatsoever with respect to any MSCI data contained herein. The MSCI data may not be further redistributed or used as a basis for other indices or any securities or financial products. This report is not approved, reviewed, or produced by MSCI. You cannot invest directly in an index. |
| 3 | The MSCI Emerging Markets (EM) Index (Net) is a free-float-adjusted market-capitalization-weighted index that is designed to measure large- andmid-cap equity market performance of emerging markets. The MSCI EM Index (Net) consists of the following 24 emerging market country indices: Brazil, Chile, China, Colombia, Czech Republic, Egypt, Greece, Hungary, India, Indonesia, Korea, Malaysia, Mexico, Pakistan, Peru, the Philippines, Poland, Qatar, Russia, South Africa, Taiwan, Thailand, Turkey, and the United Arab Emirates. You cannot invest directly in an index. |
| 4 | The Bloomberg Barclays U.S. Aggregate Bond Index is a broad-based benchmark that measures the investment-grade, U.S. dollar-denominated, fixed-rate taxable bond market, including Treasuries, government-related and corporate securities, mortgage-backed securities (agency fixed-rate and hybrid adjustable-rate mortgage pass-throughs), asset-backed securities, and commercial mortgage-backed securities. You cannot invest directly in an index. |
| 5 | The Bloomberg Barclays Global Aggregateex-USD Index is an unmanaged index that provides a broad-based measure of the global investment-grade fixed-income markets excluding the U.S. dollar-denominated debt market. You cannot invest directly in an index. |
| 6 | The Bloomberg Barclays Municipal Bond Index is an unmanaged index composed of long-termtax-exempt bonds with a minimum credit rating of Baa. You cannot invest directly in an index. |
| 7 | The ICE BofAML U.S. High Yield Index is a market-capitalization-weighted index of domestic and Yankee high-yield bonds. The index tracks the performance of high-yield securities traded in the U.S. bond market. You cannot invest directly in an index. Copyright 2019. ICE Data Indices, LLC. All rights reserved. |
| 8 | The Conference Board Consumer Confidence Index® measures the degree of optimism on the state of the U.S. economy that consumers are expressing through their activities of savings and spending. You cannot invest directly in an index. |
| | | | | | |
| Letter to shareholders (unaudited) | | Wells Fargo Intrinsic Value Fund | | | 3 | |
In bond markets, U.S. bonds, as measured by the Bloomberg Barclays U.S. Aggregate Bond Index, were flat. The Bloomberg Barclays Global Aggregateex-USD Index fell 1.74% during the quarter that ended September 30, 2018.
Conflicting data unsettled markets during the fourth quarter.
Negative stock market performance during October and December bracketed a mildly positive November for the S&P 500 Index and the MSCI ACWI ex USA Index (Net). As interest rates and bond yields gained during October, stock markets struggled. December’s S&P 500 Index performance was the worst since 1931. Globally, fixed-income investments fared better than stocks during the last two months of the year.
November’s U.S. midterm elections shifted control of the House of Representatives from Republicans to Democrats, presaging potential partisan disputes. The Bureau of Economic Analysis reported that third-quarter U.S. gross domestic product (GDP) grew at an annualized 3.4% rate, lower than second-quarter GDP growth. Brexit efforts stalled in the U.K. ahead of the March 2019 deadline. The People’s Bank of China cut reserve requirement ratios and accelerated infrastructure spending and tax cuts, and the value of the yuan declined to low levels last seen in 2008. Oil prices fell.
After the Fed increased the federal funds rate by 25 bps to a target range of between 2.25% and 2.50% in December 2018—the ninth such increase since the Fed began raising rates three years ago from near zero—it softened its outlook for further interest rate increases in 2019.
The market climbs a wall of worry.
Investors entered 2019 with reasons to be concerned. A partial U.S. government shutdown driven by partisan disputes over spending and immigration policies extended into January. Globally, economic signals were uneven. Investors expected high levels of stock market volatility to continue, as measured by the VIX9.
January’s returns tended to support the investing adage that the market climbs a wall of worry. The S&P 500 Index gained 8.01% for the month that ended January 31, 2019, its best monthly performance in 30 years. Returns for the MSCI ACWI ex USA Index (Net), the Bloomberg Barclays U.S. Aggregate Bond Index, and the Bloomberg Barclays Global Aggregateex-USD Index also were positive.
Don’t let short-term uncertainty derail long-term investment goals.
Periods of investment uncertainty can present challenges, but experience has taught us that maintaining long-term investment goals can be an effective way to plan for the future. To help you create a sound strategy based on your personal goals and risk tolerance, Wells Fargo Funds offers more than 100 mutual funds spanning a wide range of asset classes and investment styles. Although diversification cannot guarantee an investment profit or prevent losses, we believe it can be an effective way to manage investment risk and potentially smooth out overall portfolio performance. We encourage investors to know their investments and to understand that appropriate levels of risk-taking may unlock opportunities.
January’s returns tended to support the investing adage that the market climbs a wall of worry.
| 9 | The Chicago Board Options Exchange Market Volatility Index (VIX) is a popular measure of the implied volatility of S&P 500 Index options. It represents one measure of the market’s expectation of stock market volatility over the next30-day period. You cannot invest directly in an index. |
| | | | |
| 4 | | Wells Fargo Intrinsic Value Fund | | Letter to shareholders (unaudited) |
Thank you for choosing to invest with Wells Fargo Funds. We appreciate your confidence in us and remain committed to helping you meet your financial needs.
Sincerely,

Andrew Owen
President
Wells Fargo Funds
For further information about your Fund, contact your investment professional, visit our website atwellsfargofunds.com, or call us directly at1-800-222-8222.
This page is intentionally left blank.
| | | | |
| 6 | | Wells Fargo Intrinsic Value Fund | | Performance highlights (unaudited) |
Investment objective
The Fund seeks long-term capital appreciation.
Manager
Wells Fargo Funds Management, LLC
Subadviser
Wells Capital Management Incorporated
Portfolio managers
Miguel E. Giaconi, CFA®‡
Jean-Baptiste Nadal, CFA®‡
Average annual total returns (%) as of January 31, 2019*
| | | | | | | | | | | | | | | | | | | | | | | | | | | | | | | | | | |
| | | | | Including sales charge | | | Excluding sales charge | | | Expense ratios1 (%) | |
| | | Inception date | | 1 year | | | 5 year | | | 10 year | | | 1 year | | | 5 year | | | 10 year | | | Gross | | | Net2 | |
| | | | | | | | | |
| Class A (EIVAX) | | 8-1-2006 | | | -8.97 | | | | 6.23 | | | | 12.64 | | | | -3.42 | | | | 7.49 | | | | 13.31 | | | | 1.18 | | | | 1.11 | |
| | | | | | | | | |
| Class C (EIVCX) | | 8-1-2006 | | | -5.10 | | | | 6.69 | �� | | | 12.46 | | | | -4.10 | | | | 6.69 | | | | 12.46 | | | | 1.93 | | | | 1.86 | |
| | | | | | | | | |
| Class R (EIVTX)3 | | 3-1-2013 | | | – | | | | – | | | | – | | | | -3.55 | | | | 7.24 | | | | 13.04 | | | | 1.43 | | | | 1.36 | |
| | | | | | | | | |
| Class R6 (EIVFX)4 | | 11-30-2012 | | | – | | | | – | | | | – | | | | -2.20 | | | | 8.07 | | | | 13.80 | | | | 0.75 | | | | 0.65 | |
| | | | | | | | | |
| Administrator Class (EIVDX)5 | | 7-30-2010 | | | – | | | | – | | | | – | | | | -3.21 | | | | 7.69 | | | | 13.52 | | | | 1.10 | | | | 0.95 | |
| | | | | | | | | |
| Institutional Class (EIVIX) | | 8-1-2006 | | | – | | | | – | | | | – | | | | -2.99 | | | | 7.97 | | | | 13.74 | | | | 0.85 | | | | 0.70 | |
| | | | | | | | | |
| Russell 1000® Value Index6 | | – | | | – | | | | – | | | | – | | | | -4.81 | | | | 8.33 | | | | 13.39 | | | | – | | | | – | |
Figures quoted represent past performance, which is no guarantee of future results, and do not reflect taxes that a shareholder may pay on fund distributions or the redemption of fund shares. Investment return and principal value of an investment will fluctuate so that an investor’s shares, when redeemed, may be worth more or less than their original cost. Performance shown without sales charges would be lower if sales charges were reflected. Current performance may be lower or higher than the performance data quoted, which assumes the reinvestment of dividends and capital gains. Currentmonth-end performance is available on the Fund’s website, wellsfargofunds.com.
Index returns do not include transaction costs associated with buying and selling securities, any mutual fund fees or expenses, or any taxes. It is not possible to invest directly in an index.
For Class A shares, the maximumfront-end sales charge is 5.75%. For Class C shares, the maximum contingent deferred sales charge is 1.00%. Performance including a contingent deferred sales charge assumes the sales charge for the corresponding time period. Class R, Class R6, Administrator Class, and Institutional Class shares are sold without afront-end sales charge or contingent deferred sales charge.
Stock values fluctuate in response to the activities of individual companies and general market and economic conditions. Certain investment strategies tend to increase the total risk of an investment (relative to the broader market). The Fund is exposed to foreign investment risk and focused portfolio risk. Consult the Fund’s prospectus for additional information on these and other risks.
Please see footnotes on page 7.
| | | | | | |
| Performance highlights (unaudited) | | Wells Fargo Intrinsic Value Fund | | | 7 | |
| | | | |
| Ten largest holdings (%) as of January 31, 20197 | |
| |
Cisco Systems Incorporated | | | 3.61 | |
| |
Alphabet Incorporated Class C | | | 3.57 | |
| |
Comcast Corporation Class A | | | 3.03 | |
| |
Mondelez International Incorporated Class A | | | 3.02 | |
| |
Dollar Tree Incorporated | | | 2.97 | |
| |
Merck & Company Incorporated | | | 2.90 | |
| |
Microsoft Corporation | | | 2.85 | |
| |
Motorola Solutions Incorporated | | | 2.79 | |
| |
AerCap Holdings NV | | | 2.70 | |
| |
US Bancorp | | | 2.70 | |
|
| Sector distribution as of January 31, 20198 |
|
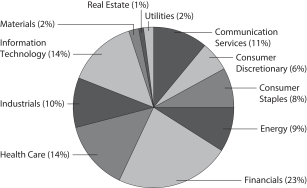
|
| ‡ | CFA® and Chartered Financial Analyst® are trademarks owned by CFA Institute. |
| * | Historical performance shown for all classes of the Fund prior to July 19, 2010, is based on the performance of the Fund’s predecessor, Evergreen Intrinsic Value Fund. |
| 1 | Reflects the expense ratios as stated in the most recent prospectuses. The expense ratios shown are subject to change and may differ from the annualized expense ratios shown in the financial highlights of this report. |
| 2 | The manager has contractually committed through November 30, 2019, to waive fees and/or reimburse expenses to the extent necessary to cap the expenses of each class after fee waivers at the amounts shown. Brokerage commissions, stamp duty fees, interest, taxes, acquired fund fees and expenses (if any), and extraordinary expenses are excluded from the expense cap. Prior to or after the commitment expiration date, the cap may be increased or the commitment to maintain the cap may be terminated only with the approval of the Board of Trustees. Without this cap, the Fund’s returns would have been lower. The expense ratio paid by an investor is the net expense ratio (the total annual fund operating expenses after fee waivers) as stated in the prospectuses. |
| 3 | Historical performance shown for Class R shares prior to their inception reflects the performance of Institutional Class shares, adjusted to reflect the higher expenses applicable to Class R shares. |
| 4 | Historical performance shown for Class R6 shares prior to their inception reflects the performance of Institutional Class shares and includes the higher expenses applicable to Institutional Class shares. If these expenses had not been included, returns for Class R6 shares would be higher. |
| 5 | Historical performance shown for Administrator Class shares prior to their inception reflects the performance of Institutional Class shares, adjusted to reflect the higher expenses applicable to Administrator Class shares. |
| 6 | The Russell 1000® Value Index measures the performance of those Russell 1000 companies with lower price/book ratios and lower forecasted growth values. You cannot invest directly in an index. |
| 7 | The ten largest holdings, excluding cash, cash equivalents and any money market funds, are calculated based on the value of the investments divided by total net assets of the Fund. Holdings are subject to change and may have changed since the date specified. |
| 8 | Amounts are calculated based on the total long-term investments of the Fund. These amounts are subject to change and may have changed since the date specified. |
| | | | |
| 8 | | Wells Fargo Intrinsic Value Fund | | Fund expenses (unaudited) |
As a shareholder of the Fund, you incur two types of costs: (1) transaction costs, including sales charges (loads) on purchase payments and contingent deferred sales charges (if any) on redemptions and (2) ongoing costs, including management fees, distribution(12b-1) and/or shareholder servicing fees, and other Fund expenses. This example is intended to help you understand your ongoing costs (in dollars) of investing in the Fund and to compare these costs with the ongoing costs of investing in other mutual funds.
The example is based on an investment of $1,000 invested at the beginning of thesix-month period and held for the entire period from August 1, 2018 to January 31, 2019.
Actual expenses
The “Actual” line of the table below provides information about actual account values and actual expenses. You may use the information in this line, together with the amount you invested, to estimate the expenses that you paid over the period. Simply divide your account value by $1,000 (for example, an $8,600 account value divided by $1,000 = 8.6), then multiply the result by the number in the “Actual” line under the heading entitled “Expenses paid during period” for your applicable class of shares to estimate the expenses you paid on your account during this period.
Hypothetical example for comparison purposes
The “Hypothetical” line of the table below provides information about hypothetical account values and hypothetical expenses based on the Fund’s actual expense ratio and an assumed rate of return of 5% per year before expenses, which is not the Fund’s actual return. The hypothetical account values and expenses may not be used to estimate the actual ending account balance or expenses you paid for the period. You may use this information to compare the ongoing costs of investing in the Fund and other funds. To do so, compare this 5% hypothetical example with the 5% hypothetical examples that appear in the shareholder reports of the other funds.
Please note that the expenses shown in the table are meant to highlight your ongoing costs only and do not reflect any transactional costs, such as sales charges (loads) and contingent deferred sales charges. Therefore, the “Hypothetical” line of the table is useful in comparing ongoing costs only and will not help you determine the relative total costs of owning different funds. In addition, if these transactional costs were included, your costs would have been higher.
| | | | | | | | | | | | | | | | |
| | | Beginning
account value
8-1-2018 | | | Ending
account value
1-31-2019 | | | Expenses
paid during
the period¹ | | | Annualized net
expense ratio | |
Class A | | | | | | | | | | | | | | | | |
| | | | |
Actual | | $ | 1,000.00 | | | $ | 966.55 | | | $ | 5.45 | | | | 1.10 | % |
| | | | |
Hypothetical (5% return before expenses) | | $ | 1,000.00 | | | $ | 1,019.66 | | | $ | 5.60 | | | | 1.10 | % |
Class C | | | | | | | | | | | | | | | | |
| | | | |
Actual | | $ | 1,000.00 | | | $ | 962.83 | | | $ | 9.20 | | | | 1.86 | % |
| | | | |
Hypothetical (5% return before expenses) | | $ | 1,000.00 | | | $ | 1,015.83 | | | $ | 9.45 | | | | 1.86 | % |
Class R | | | | | | | | | | | | | | | | |
| | | | |
Actual | | $ | 1,000.00 | | | $ | 965.28 | | | $ | 6.74 | | | | 1.36 | % |
| | | | |
Hypothetical (5% return before expenses) | | $ | 1,000.00 | | | $ | 1,018.35 | | | $ | 6.92 | | | | 1.36 | % |
Class R6 | | | | | | | | | | | | | | | | |
| | | | |
Actual | | $ | 1,000.00 | | | $ | 975.73 | | | $ | 3.24 | | | | 0.65 | % |
| | | | |
Hypothetical (5% return before expenses) | | $ | 1,000.00 | | | $ | 1,021.93 | | | $ | 3.31 | | | | 0.65 | % |
Administrator Class | | | | | | | | | | | | | | | | |
| | | | |
Actual | | $ | 1,000.00 | | | $ | 967.94 | | | $ | 4.71 | | | | 0.95 | % |
| | | | |
Hypothetical (5% return before expenses) | | $ | 1,000.00 | | | $ | 1,020.42 | | | $ | 4.84 | | | | 0.95 | % |
Institutional Class | | | | | | | | | | | | | | | | |
| | | | |
Actual | | $ | 1,000.00 | | | $ | 968.59 | | | $ | 3.47 | | | | 0.70 | % |
| | | | |
Hypothetical (5% return before expenses) | | $ | 1,000.00 | | | $ | 1,021.68 | | | $ | 3.57 | | | | 0.70 | % |
| 1 | Expenses paid is equal to the annualized net expense ratio of each class multiplied by the average account value over the period, multiplied by the number of days in the most recent fiscal half-year divided by the number of days in the fiscal year (to reflect the one-half-year period). |
| | | | | | |
| Portfolio of investments—January 31, 2019 (unaudited) | | Wells Fargo Intrinsic Value Fund | | | 9 | |
| | | | | | | | | | | | | | | | |
| Security name | | | | | | | | Shares | | | Value | |
| | | | |
Common Stocks: 98.67% | | | | | | | | | | | | | | | | |
| | | | |
Communication Services: 11.04% | | | | | | | | | | | | | | | | |
| | | | |
| Diversified Telecommunication Services: 2.45% | | | | | | | | | | | | | | | | |
| | | | |
Verizon Communications Incorporated | | | | | | | | | | | 362,400 | | | $ | 19,953,744 | |
| | | | | | | | | | | | | | | | |
| | | | |
| Entertainment: 1.99% | | | | | | | | | | | | | | | | |
| | | | |
The Walt Disney Company | | | | | | | | | | | 145,800 | | | | 16,259,616 | |
| | | | | | | | | | | | | | | | |
| | | | |
| Interactive Media & Services: 3.57% | | | | | | | | | | | | | | | | |
| | | | |
Alphabet Incorporated Class C † | | | | | | | | | | | 26,100 | | | | 29,137,257 | |
| | | | | | | | | | | | | | | | |
| | | | |
| Media: 3.03% | | | | | | | | | | | | | | | | |
| | | | |
Comcast Corporation Class A | | | | | | | | | | | 676,800 | | | | 24,750,576 | |
| | | | | | | | | | | | | | | | |
| | | | |
Consumer Discretionary: 5.62% | | | | | | | | | | | | | | | | |
| | | | |
| Multiline Retail: 2.97% | | | | | | | | | | | | | | | | |
| | | | |
Dollar Tree Incorporated † | | | | | | | | | | | 250,500 | | | | 24,255,915 | |
| | | | | | | | | | | | | | | | |
| | | | |
| Specialty Retail: 2.65% | | | | | | | | | | | | | | | | |
| | | | |
Advance Auto Parts Incorporated | | | | | | | | | | | 135,500 | | | | 21,571,600 | |
| | | | | | | | | | | | | | | | |
| | | | |
Consumer Staples: 8.12% | | | | | | | | | | | | | | | | |
| | | | |
| Beverages: 2.25% | | | | | | | | | | | | | | | | |
| | | | |
Anheuser-Busch InBev NV ADR « | | | | | | | | | | | 240,100 | | | | 18,353,244 | |
| | | | | | | | | | | | | | | | |
| | | | |
| Food Products: 5.87% | | | | | | | | | | | | | | | | |
| | | | |
ConAgra Foods Incorporated | | | | | | | | | | | 324,200 | | | | 7,015,688 | |
| | | | |
Mondelez International Incorporated Class A | | | | | | | | | | | 532,700 | | | | 24,642,702 | |
| | | | |
Nestle SA ADR | | | | | | | | | | | 186,000 | | | | 16,226,640 | |
| | | | |
| | | | | | | | | | | | | | | 47,885,030 | |
| | | | | | | | | | | | | | | | |
| | | | |
Energy: 8.73% | | | | | | | | | | | | | | | | |
| | | | |
| Energy Equipment & Services: 2.41% | | | | | | | | | | | | | | | | |
| | | | |
Schlumberger Limited | | | | | | | | | | | 266,900 | | | | 11,799,649 | |
| | | | |
TechnipFMC plc | | | | | | | | | | | 344,300 | | | | 7,905,128 | |
| | | | |
| | | | | | | | | | | | | | | 19,704,777 | |
| | | | | | | | | | | | | | | | |
| | | | |
| Oil, Gas & Consumable Fuels: 6.32% | | | | | | | | | | | | | | | | |
| | | | |
Chevron Corporation | | | | | | | | | | | 170,800 | | | | 19,582,220 | |
| | | | |
Concho Resources Incorporated † | | | | | | | | | | | 112,400 | | | | 13,470,016 | |
| | | | |
EOG Resources Incorporated | | | | | | | | | | | 186,200 | | | | 18,471,040 | |
| | | | |
| | | | | | | | | | | | | | | 51,523,276 | |
| | | | | | | | | | | | | | | | |
| | | | |
Financials: 22.64% | | | | | | | | | | | | | | | | |
| | | | |
| Banks: 10.30% | | | | | | | | | | | | | | | | |
| | | | |
Bank of America Corporation | | | | | | | | | | | 724,100 | | | | 20,615,127 | |
| | | | |
BB&T Corporation | | | | | | | | | | | 435,800 | | | | 21,267,040 | |
| | | | |
CIT Group Incorporated | | | | | | | | | | | 435,200 | | | | 20,101,888 | |
| | | | |
US Bancorp | | | | | | | | | | | 430,200 | | | | 22,009,032 | |
| | | | |
| | | | | | | | | | | | | | | 83,993,087 | |
| | | | | | | | | | | | | | | | �� |
The accompanying notes are an integral part of these financial statements.
| | | | |
| 10 | | Wells Fargo Intrinsic Value Fund | | Portfolio of investments—January 31, 2019 (unaudited) |
| | | | | | | | | | | | | | | | |
| Security name | | | | | | | | Shares | | | Value | |
| | | | |
| Capital Markets: 3.64% | | | | | | | | | | | | | | | | |
| | | | |
Intercontinental Exchange Incorporated | | | | | | | | | | | 216,900 | | | $ | 16,649,245 | |
| | | | |
UBS Group AG « | | | | | | | | | | | 1,006,900 | | | | 13,049,424 | |
| | | | |
| | | | | | | | | | | | | | | 29,698,669 | |
| | | | | | | | | | | | | | | | |
| | | |
| Consumer Finance: 1.96% | | | | | | | | | | | | | |
| | | | |
Synchrony Financial | | | | | | | | | | | 533,600 | | | | 16,029,344 | |
| | | | | | | | | | | | | | | | |
| | | |
| Insurance: 6.74% | | | | | | | | | | | | | |
| | | | |
American International Group Incorporated | | | | | | | | | | | 383,300 | | | | 16,570,059 | |
| | | | |
Aon plc | | | | | | | | | | | 135,300 | | | | 21,137,919 | |
| | | | |
The Allstate Corporation | | | | | | | | | | | 196,300 | | | | 17,248,881 | |
| | | | |
| | | | | | | | | | | | | | | 54,956,859 | |
| | | | | | | | | | | | | | | | |
| | | | |
Health Care: 13.81% | | | | | | | | | | | | | | | | |
| | | |
| Biotechnology: 2.52% | | | | | | | | | | | | | |
| | | | |
Gilead Sciences Incorporated | | | | | | | | | | | 292,800 | | | | 20,498,927 | |
| | | | | | | | | | | | | | | | |
| | | |
| Health Care Equipment & Supplies: 3.49% | | | | | | | | | | | | | |
| | | | |
Abbott Laboratories | | | | | | | | | | | 224,500 | | | | 16,384,010 | |
| | | | |
Medtronic plc | | | | | | | | | | | 136,800 | | | | 12,091,752 | |
| | | | |
| | | | | | | | | | | | | | | 28,475,762 | |
| | | | | | | | | | | | | | | | |
| | | |
| Health Care Providers & Services: 2.48% | | | | | | | | | | | | | |
| | | | |
Cigna Corporation | | | | | | | | | | | 101,300 | | | | 20,240,753 | |
| | | | | | | | | | | | | | | | |
| | | |
| Pharmaceuticals: 5.32% | | | | | | | | | | | | | |
| | | | |
Eli Lilly & Company | | | | | | | | | | | 164,700 | | | | 19,740,942 | |
| | | | |
Merck & Company Incorporated | | | | | | | | | | | 318,000 | | | | 23,668,740 | |
| | | | |
| | | | | | | | | | | | | | | 43,409,682 | |
| | | | | | | | | | | | | | | | |
| | | | |
Industrials: 10.23% | | | | | | | | | | | | | | | | |
| | | |
| Aerospace & Defense: 2.20% | | | | | | | | | | | | | |
| | | | |
General Dynamics Corporation | | | | | | | | | | | 104,700 | | | | 17,921,499 | |
| | | | | | | | | | | | | | | | |
| | | |
| Air Freight & Logistics: 1.75% | | | | | | | | | | | | | |
| | | | |
United Parcel Service Incorporated Class B | | | | | | | | | | | 135,100 | | | | 14,239,540 | |
| | | | | | | | | | | | | | | | |
| | | |
| Electrical Equipment: 0.91% | | | | | | | | | | | | | |
| | | | |
Sensata Technologies Holding plc † | | | | | | | | | | | 156,100 | | | | 7,414,750 | |
| | | | | | | | | | | | | | | | |
| | | |
| Industrial Conglomerates: 2.67% | | | | | | | | | | | | | |
| | | | |
Honeywell International Incorporated | | | | | | | | | | | 151,700 | | | | 21,788,671 | |
| | | | | | | | | | | | | | | | |
| | | |
| Trading Companies & Distributors: 2.70% | | | | | | | | | | | | | |
| | | | |
AerCap Holdings NV † | | | | | | | | | | | 466,600 | | | | 22,051,516 | |
| | | | | | | | | | | | | | | | |
| | | | |
Information Technology: 13.58% | | | | | | | | | | | | | | | | |
| | | |
| Communications Equipment: 6.39% | | | | | | | | | | | | | |
| | | | |
Cisco Systems Incorporated | | | | | | | | | | | 622,400 | | | | 29,433,296 | |
| | | | |
Motorola Solutions Incorporated | | | | | | | | | | | 194,400 | | | | 22,727,304 | |
| | | | |
| | | | | | | | | | | | | | | 52,160,600 | |
| | | | | | | | | | | | | | | | |
The accompanying notes are an integral part of these financial statements.
| | | | | | |
| Portfolio of investments—January 31, 2019 (unaudited) | | Wells Fargo Intrinsic Value Fund | | | 11 | |
| | | | | | | | | | | | | | | | |
| Security name | | | | | | | | Shares | | | Value | |
| | | |
| IT Services: 2.04% | | | | | | | | | | | | | |
| | | | |
Accenture plc Class A | | | | | | | | | | | 108,300 | | | $ | 16,629,465 | |
| | | | | | | | | | | | | | | | |
| | | | |
| Semiconductors & Semiconductor Equipment: 1.38% | | | | | | | | | | | | | | | | |
| | | | |
NXP Semiconductors NV | | | | | | | | | | | 128,900 | | | | 11,218,167 | |
| | | | | | | | | | | | | | | | |
| | | | |
| Software: 2.85% | | | | | | | | | | | | | | | | |
| | | | |
Microsoft Corporation | | | | | | | | | | | 222,700 | | | | 23,256,561 | |
| | | | | | | | | | | | | | | | |
| | | | |
| Technology Hardware, Storage & Peripherals: 0.92% | | | | | | | | | | | | | | | | |
| | | | |
Apple Incorporated | | | | | | | | | | | 45,300 | | | | 7,539,732 | |
| | | | | | | | | | | | | | | | |
| | | | |
Materials: 2.30% | | | | | | | | | | | | | | | | |
| | | | |
| Construction Materials: 2.30% | | | | | | | | | | | | | | | | |
| | | | |
Vulcan Materials Company | | | | | | | | | | | 184,800 | | | | 18,784,920 | |
| | | | | | | | | | | | | | | | |
| | | | |
Real Estate: 0.51% | | | | | | | | | | | | | | | | |
| | | | |
| Equity REITs: 0.51% | | | | | | | | | | | | | | | | |
| | | | |
Crown Castle International Corporation | | | | | | | | | | | 35,500 | | | | 4,155,630 | |
| | | | | | | | | | | | | | | | |
| | | | |
Utilities: 2.09% | | | | | | | | | | | | | | | | |
| | | | |
| Electric Utilities: 2.09% | | | | | | | | | | | | | | | | |
| | | | |
NextEra Energy Incorporated | | | | | | | | | | | 95,200 | | | | 17,038,896 | |
| | | | | | | | | | | | | | | | |
| | | | |
Total Common Stocks (Cost $656,245,572) | | | | | | | | | | | | | | | 804,898,065 | |
| | | | | | | | | | | | | | | | |
| | | | |
| | | Yield | | | | | | | | | | |
| Short-Term Investments: 4.72% | | | | | | | | | | | | | | | | |
| | | | |
| Investment Companies: 4.72% | | | | | | | | | | | | | | | | |
| | | | |
Securities Lending Cash Investments LLC (l)(r)(u) | | | 2.57 | % | | | | | | | 30,355,880 | | | | 30,358,915 | |
| | | | |
Wells Fargo Government Money Market Fund Select Class (l)(u) | | | 2.33 | | | | | | | | 8,181,622 | | | | 8,181,622 | |
| | | | |
Total Short-Term Investments (Cost $38,540,537) | | | | | | | | | | | | | | | 38,540,537 | |
| | | | | | | | | | | | | | | | |
| | | | | | | | |
| Total investments in securities (Cost $694,786,109) | | | 103.39 | % | | | 843,438,602 | |
| | |
Other assets and liabilities, net | | | (3.39 | ) | | | (27,690,577 | ) |
| | | | | | | | |
| Total net assets | | | 100.00 | % | | $ | 815,748,025 | |
| | | | | | | | |
| † | Non-income-earning security |
| « | All or a portion of this security is on loan. |
| (l) | The issuer of the security is an affiliated person of the Fund as defined in the Investment Company Act of 1940. |
| (r) | The investment is anon-registered investment company purchased with cash collateral received from securities on loan. |
| (u) | The rate represents the7-day annualized yield at period end. |
Abbreviations:
| ADR | American depositary receipt |
| REIT | Real estate investment trust |
The accompanying notes are an integral part of these financial statements.
| | | | |
| 12 | | Wells Fargo Intrinsic Value Fund | | Portfolio of investments—January 31, 2019 (unaudited) |
Investments in Affiliates
An affiliated investment is an investment in which the Fund owns at least 5% of the outstanding voting shares of the issuer or as a result of other relationships, such as the Fund and the issuer having the same investment manager. Transactions with issuers that were either affiliated persons of the Fund at the beginning of the period or the end of the period were as follows:
| | | | | | | | | | | | | | | | | | | | | | | | | | | | | | | | | | | | |
| | | Shares,
beginning of
period | | | Shares
purchased | | | Shares
sold | | | Shares,
end of
period | | | Net
realized
gains
(losses) | | | Net
change in
unrealized
gains
(losses) | | | Income
from
affiliated
securities | | | Value,
end
of period | | | % of
net
assets | |
Short-Term Investments | | | | | | | | | | | | | | | | | | | | | | | | | | | | | | | | | | | | |
Investment Companies | | | | | | | | | | | | | | | | | | | | | | | | | | | | | | | | | | | | |
Securities Lending Cash Investments LLC | | | 22,455,104 | | | | 88,601,006 | | | | 80,700,230 | | | | 30,355,880 | | | $ | 1,459 | | | $ | 0 | | | $ | 261,575 | | | $ | 30,358,915 | | | | | |
Wells Fargo Government Money Market Fund Select Class | | | 9,615,845 | | | | 86,651,353 | | | | 88,085,576 | | | | 8,181,622 | | | | 0 | | | | 0 | | | | 91,914 | | | | 8,181,622 | | | | | |
| | | | | | | | | | | | | | | | | | | | | | | | | | | | | | | | | | �� | | |
| | | | | | | | | |
| | | | | | | | | | | | | | | | | | $ | 1,459 | | | $ | 0 | | | $ | 353,489 | | | $ | 38,540,537 | | | | 4.72 | % |
| | | | | | | | | | | | | | | | | | | | | | | | | | | | | | | | | | | | |
The accompanying notes are an integral part of these financial statements.
| | | | | | |
| Statement of assets and liabilities—January 31, 2019 (unaudited) | | Wells Fargo Intrinsic Value Fund | | | 13 | |
| | | | |
| | | | |
| |
Assets | | | | |
Investments in unaffiliated securities (including $29,715,148 of securities on loan), at value (cost $656,245,572) | | $ | 804,898,065 | |
Investments in affiliated securities, at value (cost $38,540,537) | | | 38,540,537 | |
Receivable for investments sold | | | 3,443,464 | |
Receivable for Fund shares sold | | | 41,493 | |
Receivable for dividends | | | 667,941 | |
Receivable for securities lending income | | | 8,970 | |
| | | | |
Total assets | | | 847,600,470 | |
| | | | |
| |
Liabilities | | | | |
Payable upon receipt of securities loaned | | | 30,356,135 | |
Payable for Fund shares redeemed | | | 756,031 | |
Management fee payable | | | 372,672 | |
Administration fees payable | | | 105,490 | |
Distribution fees payable | | | 10,790 | |
Trustees’ fees and expenses payable | | | 2,714 | |
Due to custodian bank | | | 1,563 | |
Accrued expenses and other liabilities | | | 247,050 | |
| | | | |
Total liabilities | | | 31,852,445 | |
| | | | |
Total net assets | | $ | 815,748,025 | |
| | | | |
| |
NET ASSETS CONSIST OF | | | | |
Paid-in capital | | $ | 648,207,489 | |
Total distributable earnings | | | 167,540,536 | |
| | | | |
Total net assets | | $ | 815,748,025 | |
| | | | |
| |
COMPUTATION OF NET ASSET VALUE AND OFFERING PRICE PER SHARE | | | | |
Net assets – Class A | | $ | 263,588,830 | |
Shares outstanding – Class A1 | | | 22,639,409 | |
Net asset value per share – Class A | | | $11.64 | |
Maximum offering price per share – Class A2 | | | $12.35 | |
Net assets – Class C | | $ | 17,293,064 | |
Shares outstanding – Class C1 | | | 1,523,440 | |
Net asset value per share – Class C | | | $11.35 | |
Net assets – Class R | | $ | 73,857 | |
Shares outstanding – Class R1 | | | 6,293 | |
Net asset value per share – Class R | | | $11.74 | |
Net assets – Class R6 | | $ | 104,648 | |
Shares outstanding – Class R61 | | | 9,154 | |
Net asset value per share – Class R6 | | | $11.43 | |
Net assets – Administrator Class | | $ | 431,033,356 | |
Shares outstanding – Administrator Class1 | | | 35,227,591 | |
Net asset value per share – Administrator Class | | | $12.24 | |
Net assets – Institutional Class | | $ | 103,654,270 | |
Shares outstanding – Institutional Class1 | | | 8,859,879 | |
Net asset value per share – Institutional Class | | | $11.70 | |
| 1 | The Fund has an unlimited number of authorized shares. |
| 2 | Maximum offering price is computed as 100/94.25 of net asset value. On investments of $50,000 or more, the offering price is reduced. |
The accompanying notes are an integral part of these financial statements.
| | | | |
| 14 | | Wells Fargo Intrinsic Value Fund | | Statement of operations—six months ended January 31, 2019 (unaudited) |
| | | | |
| | | | |
| |
Investment income | | | | |
Dividends (net of foreign withholding taxes of $154,486) | | $ | 7,960,840 | |
Income from affiliated securities | | | 186,285 | |
| | | | |
Total investment income | | | 8,147,125 | |
| | | | |
| |
Expenses | | | | |
Management fee | | | 3,013,661 | |
Administration fees | | | | |
Class A | | | 291,456 | |
Class C | | | 19,773 | |
Class R | | | 78 | |
Class R6 | | | 119 | |
Administrator Class | | | 293,377 | |
Institutional Class | | | 81,667 | |
Shareholder servicing fees | | | | |
Class A | | | 334,600 | |
Class C | | | 23,539 | |
Class R | | | 93 | |
Administrator Class | | | 561,703 | |
Distribution fees | | | | |
Class C | | | 70,618 | |
Class R | | | 93 | |
Custody and accounting fees | | | 17,721 | |
Professional fees | | | 22,573 | |
Registration fees | | | 50,425 | |
Shareholder report expenses | | | 45,369 | |
Trustees’ fees and expenses | | | 11,090 | |
Other fees and expenses | | | 14,719 | |
| | | | |
Total expenses | | | 4,852,674 | |
Less: Fee waivers and/or expense reimbursements | | | (564,134 | ) |
| | | | |
Net expenses | | | 4,288,540 | |
| | | | |
Net investment income | | | 3,858,585 | |
| | | | |
| |
REALIZED AND UNREALIZED GAINS (LOSSES) ON INVESTMENTS | | | | |
| |
Net realized gains on: | | | | |
Unaffiliated securities | | | 26,113,695 | |
Affiliated securities | | | 1,459 | |
| | | | |
Net realized gains on investments | | | 26,115,154 | |
Net change in unrealized gains (losses) on investments | | | (61,182,428 | ) |
| | | | |
Net realized and unrealized gains (losses) on investments | | | (35,067,274 | ) |
| | | | |
Net decrease in net assets resulting from operations | | $ | (31,208,689 | ) |
| | | | |
The accompanying notes are an integral part of these financial statements.
| | | | | | |
| Statement of changes in net assets | | Wells Fargo Intrinsic Value Fund | | | 15 | |
| | | | | | | | | | | | | | | | |
| | | Six months ended
January 31, 2019
(unaudited) | | | Year ended
July 31, 20181 | |
| | | | |
Operations | | | | | | | | | | | | | | | | |
Net investment income | | | | | | $ | 3,858,585 | | | | | | | $ | 8,762,212 | |
Net realized gains on investments | | | | | | | 26,115,154 | | | | | | | | 72,505,918 | |
Net change in unrealized gains (losses) on investments | | | | | | | (61,182,428 | ) | | | | | | | 27,765,454 | |
| | | | |
Net increase (decrease) in net assets resulting from operations | | | | | | | (31,208,689 | ) | | | | | | | 109,033,584 | |
| | | | |
| | | | |
Distributions to shareholders from net investment income and net realized gains | | | | | | | | | | | | | | | | |
Class A | | | | | | | (20,592,244 | ) | | | | | | | (23,575,879 | ) |
Class C | | | | | | | (1,289,606 | ) | | | | | | | (1,660,929 | ) |
Class R | | | | | | | (5,465 | ) | | | | | | | (4,009 | ) |
Class R6 | | | | | | | (8,549 | ) | | | | | | | (208,873 | ) |
Administrator Class | | | | | | | (32,970,858 | ) | | | | | | | (36,749,268 | ) |
Institutional Class | | | | | | | (9,914,802 | ) | | | | | | | (12,727,579 | ) |
| | | | |
Total distributions to shareholders | | | | | | | (64,781,524 | ) | | | | | | | (74,926,537 | ) |
| | | | |
| | | | |
Capital share transactions | | | Shares | | | | | | | | Shares | | | | | |
Proceeds from shares sold | | | | | | | | | | | | | | | | |
Class A | | | 186,753 | | | | 2,281,228 | | | | 331,519 | | | | 4,190,768 | |
Class C | | | 36,664 | | | | 443,053 | | | | 19,728 | | | | 240,572 | |
Class R | | | 279 | | | | 3,439 | | | | 1,671 | | | | 20,842 | |
Class R6 | | | 2,270 | | | | 26,150 | | | | 12,234 | | | | 151,356 | |
Administrator Class | | | 117,883 | | | | 1,523,154 | | | | 128,470 | | | | 1,686,875 | |
Institutional Class | | | 148,724 | | | | 1,885,853 | | | | 594,996 | | | | 7,543,156 | |
| | | | |
| | | | |
| | | | | | | 6,162,877 | | | | | | | | 13,833,569 | |
| | | | |
Reinvestment of distributions | | | | | | | | | | | | | | | | |
Class A | | | 1,707,185 | | | | 19,644,349 | | | | 1,816,483 | | | | 22,389,992 | |
Class C | | | 110,426 | | | | 1,234,002 | | | | 131,832 | | | | 1,579,351 | |
Class R | | | 372 | | | | 4,310 | | | | 220 | | | | 2,728 | |
Class R6 | | | 65 | | | | 713 | | | | 16,488 | | | | 201,277 | |
Administrator Class | | | 2,569,095 | | | | 31,093,192 | | | | 2,684,570 | | | | 34,693,107 | |
Institutional Class | | | 740,566 | | | | 8,584,300 | | | | 901,012 | | | | 11,188,786 | |
| | | | |
| | | | |
| | | | | | | 60,560,866 | | | | | | | | 70,055,241 | |
| | | | |
Payment for shares redeemed | | | | | | | | | | | | | | | | |
Class A | | | (1,446,992 | ) | | | (17,725,467 | ) | | | (3,243,108 | ) | | | (40,904,939 | ) |
Class C | | | (189,620 | ) | | | (2,204,789 | ) | | | (349,959 | ) | | | (4,293,957 | ) |
Class R | | | 0 | | | | 0 | | | | (33 | ) | | | (423 | ) |
Class R4 | | | N/A | | | | N/A | | | | (1,342 | )2 | | | (17,226 | )2 |
Class R6 | | | (192,709 | ) | | | (2,574,138 | ) | | | (21,179 | ) | | | (269,458 | ) |
Administrator Class | | | (1,766,644 | ) | | | (22,783,528 | ) | | | (3,402,317 | ) | | | (44,953,219 | ) |
Institutional Class | | | (2,475,636 | ) | | | (28,633,076 | ) | | | (3,859,490 | ) | | | (48,539,311 | ) |
| | | | |
| | | | |
| | | | | | | (73,920,998 | ) | | | | | | | (138,978,533 | ) |
| | | | |
Net decrease in net assets resulting from capital share transactions | | | | | | | (7,197,255 | ) | | | | | | | (55,089,723 | ) |
| | | | |
Total decrease in net assets | | | | | | | (103,187,468 | ) | | | | | | | (20,982,676 | ) |
| | | | |
| | | | |
Net assets | | | | | | | | | | | | | | | | |
Beginning of period | | | | | | | 918,935,493 | | | | | | | | 939,918,169 | |
| | | | |
End of period | | | | | | $ | 815,748,025 | | | | | | | $ | 918,935,493 | |
| | | | |
| 1 | Effective for all filings after November 4, 2018, the SEC prospectively eliminated the requirement to parenthetically disclose undistributed net investment income at the end of the period and permitted the aggregation of distributions, with the exception of tax basis returns of capital. Undistributed net investment income at July 31, 2018 was $7,412,219. The disaggregated distributions information for the year ended July 31, 2018 is included in Note 7,Distributions to Shareholders, in the notes to the financial statements. |
| 2 | For the period from August 1, 2017 to November 13, 2017. Effective at the close of business on November 13, 2017, Class R4 shares were liquidated and the class was subsequently closed. Class R4 shares are no longer offered by the Fund. |
The accompanying notes are an integral part of these financial statements.
| | | | |
| 16 | | Wells Fargo Intrinsic Value Fund | | Financial highlights |
(For a share outstanding throughout each period)
| | | | | | | | | | | | | | | | | | | | | | | | |
| | | Six months ended
January 31, 2019
(unaudited) | | | Year ended July 31 | |
| CLASS A | | 2018 | | | 2017 | | | 2016 | | | 2015 | | | 2014 | |
Net asset value, beginning of period | | | $13.05 | | | | $12.61 | | | | $12.01 | | | | $13.73 | | | | $13.60 | | | | $12.52 | |
Net investment income | | | 0.04 | | | | 0.11 | | | | 0.12 | 1 | | | 0.13 | | | | 0.10 | | | | 0.07 | |
Net realized and unrealized gains (losses) on investments | | | (0.49 | ) | | | 1.39 | | | | 1.43 | | | | (0.42 | ) | | | 1.09 | | | | 1.53 | |
| | | | | | | | | | | | | | | | | | | | | | | | |
Total from investment operations | | | (0.45 | ) | | | 1.50 | | | | 1.55 | | | | (0.29 | ) | | | 1.19 | | | | 1.60 | |
Distributions to shareholders from | | | | | | | | | | | | | | | | | | | | | | | | |
Net investment income | | | (0.12 | ) | | | (0.06 | ) | | | (0.14 | ) | | | (0.11 | ) | | | (0.07 | ) | | | (0.06 | ) |
Net realized gains | | | (0.84 | ) | | | (1.00 | ) | | | (0.81 | ) | | | (1.32 | ) | | | (0.99 | ) | | | (0.46 | ) |
| | | | | | | | | | | | | | | | | | | | | | | | |
Total distributions to shareholders | | | (0.96 | ) | | | (1.06 | ) | | | (0.95 | ) | | | (1.43 | ) | | | (1.06 | ) | | | (1.52 | ) |
Net asset value, end of period | | | $11.64 | | | | $13.05 | | | | $12.61 | | | | $12.01 | | | | $13.73 | | | | $13.60 | |
Total return2 | | | (3.34 | )% | | | 12.43 | % | | | 13.50 | % | | | (1.73 | )% | | | 9.19 | % | | | 13.09 | % |
Ratios to average net assets (annualized) | | | | | | | | | | | | | | | | | | | | | | | | |
Gross expenses | | | 1.18 | % | | | 1.18 | % | | | 1.17 | % | | | 1.17 | % | | | 1.20 | % | | | 1.21 | % |
Net expenses | | | 1.10 | % | | | 1.10 | % | | | 1.10 | % | | | 1.10 | % | | | 1.16 | % | | | 1.16 | % |
Net investment income | | | 0.76 | % | | | 0.83 | % | | | 0.95 | % | | | 1.12 | % | | | 0.75 | % | | | 0.53 | % |
Supplemental data | | | | | | | | | | | | | | | | | | | | | | | | |
Portfolio turnover rate | | | 8 | % | | | 21 | % | | | 27 | % | | | 34 | % | | | 29 | % | | | 23 | % |
Net assets, end of period (000s omitted) | | | $263,589 | | | | $289,683 | | | | $293,599 | | | | $318,543 | | | | $372,443 | | | | $391,028 | |
| 1 | Calculated based upon average shares outstanding |
| 2 | Total return calculations do not include any sales charges. Returns for periods of less than one year are not annualized. |
The accompanying notes are an integral part of these financial statements.
| | | | | | |
| Financial highlights | | Wells Fargo Intrinsic Value Fund | | | 17 | |
(For a share outstanding throughout each period)
| | | | | | | | | | | | | | | | | | | | | | | | |
| | | Six months ended
January 31, 2019
(unaudited) | | | Year ended July 31 | |
| CLASS C | | 2018 | | | 2017 | | | 2016 | | | 2015 | | | 2014 | |
Net asset value, beginning of period | | | $12.69 | | | | $12.31 | | | | $11.74 | | | | $13.45 | | | | $13.36 | | | | $12.35 | |
Net investment income (loss) | | | (0.01 | ) | | | 0.01 | 1 | | | 0.02 | 1 | | | 0.03 | | | | 0.00 | 2 | | | (0.03 | ) |
Net realized and unrealized gains (losses) on investments | | | (0.47 | ) | | | 1.37 | | | | 1.40 | | | | (0.41 | ) | | | 1.08 | | | | 1.50 | |
| | | | | | | | | | | | | | | | | | | | | | | | |
Total from investment operations | | | (0.48 | ) | | | 1.38 | | | | 1.42 | | | | (0.38 | ) | | | 1.08 | | | | 1.47 | |
Distributions to shareholders from | | | | | | | | | | | | | | | | | | | | | | | | |
Net investment income | | | (0.02 | ) | | | 0.00 | | | | (0.04 | ) | | | (0.01 | ) | | | 0.00 | | | | (0.00 | ) |
Net realized gains | | | (0.84 | ) | | | (1.00 | ) | | | (0.81 | ) | | | (1.32 | ) | | | (0.99 | ) | | | (0.46 | ) |
| | | | | | | | | | | | | | | | | | | | | | | | |
Total distributions to shareholders | | | (0.86 | ) | | | (1.00 | ) | | | (0.85 | ) | | | (1.33 | ) | | | (0.99 | ) | | | (0.46 | ) |
Net asset value, end of period | | | $11.35 | | | | $12.69 | | | | $12.31 | | | | $11.74 | | | | $13.45 | | | | $13.36 | |
Total return3 | | | (3.72 | )% | | | 11.65 | % | | | 12.58 | % | | | (2.47 | )% | | | 8.42 | % | | | 12.24 | % |
Ratios to average net assets (annualized) | | | | | | | | | | | | | | | | | | | | | | | | |
Gross expenses | | | 1.94 | % | | | 1.93 | % | | | 1.93 | % | | | 1.93 | % | | | 1.96 | % | | | 1.97 | % |
Net expenses | | | 1.86 | % | | | 1.86 | % | | | 1.86 | % | | | 1.86 | % | | | 1.91 | % | | | 1.91 | % |
Net investment income (loss) | | | (0.00 | )% | | | 0.08 | % | | | 0.20 | % | | | 0.37 | % | | | 0.00 | % | | | (0.22 | )% |
Supplemental data | | | | | | | | | | | | | | | | | | | | | | | | |
Portfolio turnover rate | | | 8 | % | | | 21 | % | | | 27 | % | | | 34 | % | | | 29 | % | | | 23 | % |
Net assets, end of period (000s omitted) | | | $17,293 | | | | $19,874 | | | | $21,727 | | | | $28,756 | | | | $36,098 | | | | $36,654 | |
| 1 | Calculated based upon average shares outstanding |
| 2 | Amount is less than $0.005. |
| 3 | Total return calculations do not include any sales charges. Returns for periods of less than one year are not annualized. |
The accompanying notes are an integral part of these financial statements.
| | | | |
| 18 | | Wells Fargo Intrinsic Value Fund | | Financial highlights |
(For a share outstanding throughout each period)
| | | | | | | | | | | | | | | | | | | | | | | | |
| | | Six months ended
January 31, 2019 (unaudited) | | | Year ended July 31 | |
| CLASS R | | 2018 | | | 2017 | | | 2016 | | | 2015 | | | 2014 | |
Net asset value, beginning of period | | | $13.15 | | | | $12.70 | | | | $12.09 | | | | $13.81 | | | | $13.66 | | | | $12.55 | |
Net investment income | | | 0.03 | | | | 0.05 | | | | 0.08 | 1 | | | 0.10 | | | | 0.05 | | | | 0.03 | |
Net realized and unrealized gains (losses) on investments | | | (0.50 | ) | | | 1.44 | | | | 1.45 | | | | (0.43 | ) | | | 1.12 | | | | 1.54 | |
| | | | | | | | | | | | | | | | | | | | | | | | |
Total from investment operations | | | (0.47 | ) | | | 1.49 | | | | 1.53 | | | | (0.33 | ) | | | 1.17 | | | | 1.57 | |
Distributions to shareholders from | | | | | | | | | | | | | | | | | | | | | | | | |
Net investment income | | | (0.10 | ) | | | (0.04 | ) | | | (0.11 | ) | | | (0.07 | ) | | | (0.03 | ) | | | 0.00 | |
Net realized gains | | | (0.84 | ) | | | (1.00 | ) | | | (0.81 | ) | | | (1.32 | ) | | | (0.99 | ) | | | (0.46 | ) |
| | | | | | | | | | | | | | | | | | | | | | | | |
Total distributions to shareholders | | | (0.94 | ) | | | (1.04 | ) | | | (0.92 | ) | | | (1.39 | ) | | | (1.02 | ) | | | (0.46 | ) |
Net asset value, end of period | | | $11.74 | | | | $13.15 | | | | $12.70 | | | | $12.09 | | | | $13.81 | | | | $13.66 | |
Total return2 | | | (3.47 | )% | | | 12.21 | % | | | 13.22 | % | | | (1.99 | )% | | | 8.96 | % | | | 12.77 | % |
Ratios to average net assets (annualized) | | | | | | | | | | | | | | | | | | | | | | | | |
Gross expenses | | | 1.44 | % | | | 1.44 | % | | | 1.44 | % | | | 1.44 | % | | | 1.47 | % | | | 1.49 | % |
Net expenses | | | 1.36 | % | | | 1.36 | % | | | 1.36 | % | | | 1.36 | % | | | 1.40 | % | | | 1.41 | % |
Net investment income | | | 0.50 | % | | | 0.56 | % | | | 0.69 | % | | | 0.86 | % | | | 0.50 | % | | | 0.26 | % |
Supplemental data | | | | | | | | | | | | | | | | | | | | | | | | |
Portfolio turnover rate | | | 8 | % | | | 21 | % | | | 27 | % | | | 34 | % | | | 29 | % | | | 23 | % |
Net assets, end of period (000s omitted) | | | $74 | | | | $74 | | | | $48 | | | | $43 | | | | $41 | | | | $28 | |
| 1 | Calculated based upon average shares outstanding. |
| 2 | Returns for periods of less than one year are not annualized. |
The accompanying notes are an integral part of these financial statements.
| | | | | | |
| Financial highlights | | Wells Fargo Intrinsic Value Fund | | | 19 | |
(For a share outstanding throughout each period)
| | | | | | | | | | | | | | | | | | | | | | | | |
| | | Six months ended
January 31, 2019 (unaudited) | | | Year ended July 31 | |
| CLASS R6 | | 2018 | | | 2017 | | | 2016 | | | 2015 | | | 2014 | |
Net asset value, beginning of period | | | $12.92 | | | | $12.49 | | | | $11.90 | | | | $13.62 | | | | $13.60 | | | | $12.56 | |
Net investment income | | | 0.09 | 1 | | | 0.16 | | | | 0.17 | 1 | | | 0.17 | | | | 0.17 | 1 | | | 0.14 | 1 |
Net realized and unrealized gains (losses) on investments | | | (0.43 | ) | | | 1.39 | | | | 1.42 | | | | (0.40 | ) | | | 1.08 | | | | 1.47 | |
| | | | | | | | | | | | | | | | | | | | | | | | |
Total from investment operations | | | (0.34 | ) | | | 1.55 | | | | 1.59 | | | | (0.23 | ) | | | 1.25 | | | | 1.61 | |
Distributions to shareholders from | | | | | | | | | | | | | | | | | | | | | | | | |
Net investment income | | | (0.31 | ) | | | (0.12 | ) | | | (0.19 | ) | | | (0.17 | ) | | | (0.24 | ) | | | (0.11 | ) |
Net realized gains | | | (0.84 | ) | | | (1.00 | ) | | | (0.81 | ) | | | (1.32 | ) | | | (0.99 | ) | | | (0.46 | ) |
| | | | | | | | | | | | | | | | | | | | | | | | |
Total distributions to shareholders | | | (1.15 | ) | | | (1.12 | ) | | | (1.00 | ) | | | (1.49 | ) | | | (1.23 | ) | | | (0.57 | ) |
Net asset value, end of period | | | $11.43 | | | | $12.92 | | | | $12.49 | | | | $11.90 | | | | $13.62 | | | | $13.60 | |
Total return2 | | | (2.43 | )% | | | 12.96 | % | | | 14.03 | % | | | (1.30 | )% | | | 9.74 | % | | | 13.19 | % |
Ratios to average net assets (annualized) | | | | | | | | | | | | | | | | | | | | | | | | |
Gross expenses | | | 0.75 | % | | | 0.75 | % | | | 0.75 | % | | | 0.75 | % | | | 0.74 | % | | | 0.74 | % |
Net expenses | | | 0.65 | % | | | 0.65 | % | | | 0.65 | % | | | 0.65 | % | | | 0.65 | % | | | 0.65 | % |
Net investment income | | | 1.41 | % | | | 1.31 | % | | | 1.40 | % | | | 1.47 | % | | | 1.25 | % | | | 1.10 | % |
Supplemental data | | | | | | | | | | | | | | | | | | | | | | | | |
Portfolio turnover rate | | | 8 | % | | | 21 | % | | | 27 | % | | | 34 | % | | | 29 | % | | | 23 | % |
Net assets, end of period (000s omitted) | | | $105 | | | | $2,578 | | | | $2,397 | | | | $2,842 | | | | $169 | | | | $150 | |
| 1 | Calculated based upon average shares outstanding |
| 2 | Returns for periods of less than one year are not annualized. |
The accompanying notes are an integral part of these financial statements.
| | | | |
| 20 | | Wells Fargo Intrinsic Value Fund | | Financial highlights |
(For a share outstanding throughout each period)
| | | | | | | | | | | | | | | | | | | | | | | | |
| | | Six months ended
January 31, 2019 (unaudited) | | | Year ended July 31 | |
| ADMINISTRATOR CLASS | | 2018 | | | 2017 | | | 2016 | | | 2015 | | | 2014 | |
Net asset value, beginning of period | | | $13.68 | | | | $13.17 | | | | $12.51 | | | | $14.25 | | | | $14.08 | | | | $12.95 | |
Net investment income | | | 0.06 | | | | 0.13 | | | | 0.14 | 1 | | | 0.15 | | | | 0.13 | | | | 0.10 | |
Net realized and unrealized gains (losses) on investments | | | (0.51 | ) | | | 1.47 | | | | 1.49 | | | | (0.43 | ) | | | 1.14 | | | | 1.58 | |
| | | | | | | | | | | | | | | | | | | | | | | | |
Total from investment operations | | | (0.45 | ) | | | 1.60 | | | | 1.63 | | | | (0.28 | ) | | | 1.27 | | | | 1.68 | |
Distributions to shareholders from | | | | | | | | | | | | | | | | | | | | | | | | |
Net investment income | | | (0.15 | ) | | | (0.09 | ) | | | (0.16 | ) | | | (0.14 | ) | | | (0.11 | ) | | | (0.09 | ) |
Net realized gains | | | (0.84 | ) | | | (1.00 | ) | | | (0.81 | ) | | | (1.32 | ) | | | (0.99 | ) | | | (0.46 | ) |
| | | | | | | | | | | | | | | | | | | | | | | | |
Total distributions to shareholders | | | (0.99 | ) | | | (1.09 | ) | | | (0.97 | ) | | | (1.46 | ) | | | (1.10 | ) | | | (0.55 | ) |
Net asset value, end of period | | | $12.24 | | | | $13.68 | | | | $13.17 | | | | $12.51 | | | | $14.25 | | | | $14.08 | |
Total return2 | | | (3.21 | )% | | | 12.63 | % | | | 13.66 | % | | | (1.58 | )% | | | 9.42 | % | | | 13.36 | % |
Ratios to average net assets (annualized) | | | | | | | | | | | | | | | | | | | | | | | | |
Gross expenses | | | 1.11 | % | | | 1.10 | % | | | 1.10 | % | | | 1.10 | % | | | 1.06 | % | | | 1.06 | % |
Net expenses | | | 0.95 | % | | | 0.95 | % | | | 0.95 | % | | | 0.95 | % | | | 0.95 | % | | | 0.95 | % |
Net investment income | | | 0.91 | % | | | 0.98 | % | | | 1.10 | % | | | 1.27 | % | | | 0.95 | % | | | 0.74 | % |
Supplemental data | | | | | | | | | | | | | | | | | | | | | | | | |
Portfolio turnover rate | | | 8 | % | | | 21 | % | | | 27 | % | | | 34 | % | | | 29 | % | | | 23 | % |
Net assets, end of period (000s omitted) | | | $431,033 | | | | $469,464 | | | | $459,650 | | | | $470,152 | | | | $529,293 | | | | $534,641 | |
| 1 | Calculated based upon average shares outstanding |
| 2 | Returns for periods of less than one year are not annualized. |
The accompanying notes are an integral part of these financial statements.
| | | | | | |
| Financial highlights | | Wells Fargo Intrinsic Value Fund | | | 21 | |
(For a share outstanding throughout each period)
| | | | | | | | | | | | | | | | | | | | | | | | |
| | | Six months ended
January 31, 2019 (unaudited) | | | Year ended July 31 | |
| INSTITUTIONAL CLASS | | 2018 | | | 2017 | | | 2016 | | | 2015 | | | 2014 | |
Net asset value, beginning of period | | | $13.14 | | | | $12.68 | | | | $12.08 | | | | $13.80 | | | | $13.67 | | | | $12.58 | |
Net investment income | | | 0.07 | 1 | | | 0.22 | | | | 0.17 | 1 | | | 0.18 | | | | 0.15 | | | | 0.13 | |
Net realized and unrealized gains (losses) on investments | | | (0.50 | ) | | | 1.35 | | | | 1.43 | | | | (0.41 | ) | | | 1.11 | | | | 1.53 | |
| | | | | | | | | | | | | | | | | | | | | | | | |
Total from investment operations | | | (0.43 | ) | | | 1.57 | | | | 1.60 | | | | (0.23 | ) | | | 1.26 | | | | 1.66 | |
Distributions to shareholders from | | | | | | | | | | | | | | | | | | | | | | | | |
Net investment income | | | (0.17 | ) | | | (0.11 | ) | | | (0.19 | ) | | | (0.17 | ) | | | (0.14 | ) | | | (0.11 | ) |
Net realized gains | | | (0.84 | ) | | | (1.00 | ) | | | (0.81 | ) | | | (1.32 | ) | | | (0.99 | ) | | | (0.46 | ) |
| | | | | | | | | | | | | | | | | | | | | | | | |
Total distributions to shareholders | | | (1.01 | ) | | | (1.11 | ) | | | (1.00 | ) | | | (1.49 | ) | | | (1.13 | ) | | | (0.57 | ) |
Net asset value, end of period | | | $11.70 | | | | $13.14 | | | | $12.68 | | | | $12.08 | | | | $13.80 | | | | $13.67 | |
Total return2 | | | (3.14 | )% | | | 12.96 | % | | | 13.88 | % | | | (1.27 | )% | | | 9.66 | % | | | 13.64 | % |
Ratios to average net assets (annualized) | | | | | | | | | | | | | | | | | | | | | | | | |
Gross expenses | | | 0.86 | % | | | 0.85 | % | | | 0.85 | % | | | 0.85 | % | | | 0.79 | % | | | 0.79 | % |
Net expenses | | | 0.70 | % | | | 0.70 | % | | | 0.70 | % | | | 0.70 | % | | | 0.70 | % | | | 0.70 | % |
Net investment income | | | 1.17 | % | | | 1.24 | % | | | 1.36 | % | | | 1.52 | % | | | 1.20 | % | | | 0.99 | % |
Supplemental data | | | | | | | | | | | | | | | | | | | | | | | | |
Portfolio turnover rate | | | 8 | % | | | 21 | % | | | 27 | % | | | 34 | % | | | 29 | % | | | 23 | % |
Net assets, end of period (000s omitted) | | | $103,654 | | | | $137,263 | | | | $162,480 | | | | $215,175 | | | | $255,565 | | | | $244,378 | |
| 1 | Calculated based upon average shares outstanding. |
| 2 | Returns for periods of less than one year are not annualized. |
The accompanying notes are an integral part of these financial statements.
| | | | |
| 22 | | Wells Fargo Intrinsic Value Fund | | Notes to financial statements (unaudited) |
1. ORGANIZATION
Wells Fargo Funds Trust (the “Trust”), a Delaware statutory trust organized on March 10, 1999, is anopen-end management investment company registered under the Investment Company Act of 1940, as amended (the “1940 Act”). As an investment company, the Trust follows the accounting and reporting guidance in Financial Accounting Standards BoardAccounting Standards (“FASB”) Codification Topic 946, Financial Services – Investment Companies. These financial statements report on the Wells Fargo Intrinsic Value Fund (the “Fund”) which is a diversified series of the Trust.
Effective at the close of business on November 13, 2017, Class R4 shares were liquidated and the class was closed. Class R4 shares are no longer offered by the Fund. Information for Class R4 shares reflected in the financial statements represents activity through November 13, 2017.
2. SIGNIFICANT ACCOUNTING POLICIES
The following significant accounting policies, which are consistently followed in the preparation of the financial statements of the Fund, are in conformity with U.S. generally accepted accounting principles which require management to make estimates and assumptions that affect the reported amounts of assets and liabilities, disclosure of contingent assets and liabilities at the date of the financial statements, and the reported amounts of revenues and expenses during the reporting period. Actual results could differ from those estimates.
Securities valuation
All investments are valued each business day as of the close of regular trading on the New York Stock Exchange (generally 4 p.m. Eastern Time), although the Fund may deviate from this calculation time under unusual or unexpected circumstances.
Equity securities that are listed on a foreign or domestic exchange or market are valued at the official closing price or, if none, the last sales price. If no sale occurs on the principal exchange or market that day, a fair value price will be determined in accordance with the Fund’s Valuation Procedures.
Investments in registeredopen-end investment companies are valued at net asset value. Interests innon-registered investment companies that are redeemable at net asset value are fair valued normally at net asset value.
Investments which are not valued using any of the methods discussed above are valued at their fair value, as determined in good faith by the Board of Trustees of the Fund. The Board of Trustees has established a Valuation Committee comprised of the Trustees and has delegated to it the authority to take any actions regarding the valuation of portfolio securities that the Valuation Committee deems necessary or appropriate, including determining the fair value of portfolio securities, unless the determination has been delegated to the Wells Fargo Asset Management Pricing Committee at Wells Fargo Funds Management, LLC (“Funds Management”). The Board of Trustees retains the authority to make or ratify any valuation decisions or approve any changes to the Valuation Procedures as it deems appropriate. On a quarterly basis, the Board of Trustees receives reports on any valuation actions taken by the Valuation Committee or the Wells Fargo Asset Management Pricing Committee which may include items for ratification.
Securities lending
The Fund may lend its securities from time to time in order to earn additional income in the form of fees or interest on securities received as collateral or the investment of any cash received as collateral. The Fund continues to receive interest or dividends on the securities loaned. The Fund receives collateral in the form of cash or securities with a value at least equal to the value of the securities on loan. The value of the loaned securities is determined at the close of each business day and any additional required collateral is delivered to the Fund on the next business day. In a securities lending transaction, the net asset value of the Fund will be affected by an increase or decrease in the value of the securities loaned and by an increase or decrease in the value of the instrument in which collateral is invested. The amount of securities lending activity undertaken by the Fund fluctuates from time to time. In the event of default or bankruptcy by the borrower, the Fund may be prevented from recovering the loaned securities or gaining access to the collateral or may experience delays or costs in doing so. In addition, the investment of any cash collateral received may lose all or part of its value. The Fund has the right under the lending agreement to recover the securities from the borrower on demand.
The Fund lends its securities through an unaffiliated securities lending agent. Cash collateral received in connection with its securities lending transactions is invested in Securities Lending Cash Investments, LLC (the “Securities Lending Fund”). The Securities Lending Fund is exempt from registration under Section 3(c)(7) of the 1940 Act and is managed by Funds Management and is subadvised by Wells Capital Management Incorporated (“WellsCap”), an affiliate of Funds Management and an indirect wholly owned subsidiary of Wells Fargo & Company (“Wells Fargo”). Funds Management receives an advisory fee starting at 0.05% and declining to 0.01% as the average daily net assets of the Securities Lending Fund increase. All of the
| | | | | | |
| Notes to financial statements (unaudited) | | Wells Fargo Intrinsic Value Fund | | | 23 | |
fees received by Funds Management are paid to WellsCap for its services as subadviser. The Securities Lending Fund seeks to provide a positive return compared to the daily Fed Funds Open Rate by investing in high-quality, U.S. dollar-denominated short-term money market instruments. Securities Lending Fund investments are valued at the evaluated bid price provided by an independent pricing service. Income earned from investment in the Securities Lending Fund (net of fees and rebates), if any, is included in income from affiliated securities on the Statement of Operations.
Security transactions and income recognition
Securities transactions are recorded on a trade date basis. Realized gains or losses are recorded on the basis of identified cost.
Dividend income is recognized on theex-dividend date. Dividend income is recorded net of foreign taxes withheld where recovery of such taxes is not assured.
Distributions to shareholders
Distributions to shareholders from net investment income and any net realized gains are recorded on theex-dividend date and paid at least annually. Such distributions are determined in accordance with income tax regulations and may differ from U.S. generally accepted accounting principles. Dividend sources are estimated at the time of declaration. The tax character of distributions is determined as of the Fund’s fiscal year end. Therefore, a portion of the Fund’s distributions made prior to the Fund’s fiscal year end may be categorized as a tax return of capital at year end.
Federal and other taxes
The Fund intends to continue to qualify as a regulated investment company by distributing substantially all of its investment company taxable income and any net realized capital gains (after reduction for capital loss carryforwards) sufficient to relieve it from all, or substantially all, federal income taxes. Accordingly, no provision for federal income taxes was required.
The Fund’s income and federal excise tax returns and all financial records supporting those returns for the prior three fiscal years are subject to examination by the federal and Delaware revenue authorities. Management has analyzed the Fund’s tax positions taken on federal, state, and foreign tax returns for all open tax years and does not believe that there are any uncertain tax positions that require recognition of a tax liability.
As of January 31, 2019, the aggregate cost of all investments for federal income tax purposes was $694,606,172 and the unrealized gains (losses) consisted of:
| | | | |
| |
Gross unrealized gains | | $ | 186,477,457 | |
| |
Gross unrealized losses | | | (37,645,027 | ) |
| |
Net unrealized gains | | $ | 148,832,430 | |
Class allocations
The separate classes of shares offered by the Fund differ principally in applicable sales charges, distribution, shareholder servicing, and administration fees. Class specific expenses are charged directly to that share class. Investment income, common expenses, and realized and unrealized gains (losses) on investments are allocated daily to each class of shares based on the relative proportion of net assets of each class.
3. FAIR VALUATION MEASUREMENTS
Fair value measurements of investments are determined within a framework that has established a fair value hierarchy based upon the various data inputs utilized in determining the value of the Fund’s investments. The three-level hierarchy gives the highest priority to unadjusted quoted prices in active markets for identical assets or liabilities (Level 1) and the lowest priority to unobservable inputs (Level 3). The Fund’s investments are classified within the fair value hierarchy based on the lowest level of input that is significant to the fair value measurement. The inputs are summarized into three broad levels as follows:
| ∎ | | Level 1 – quoted prices in active markets for identical securities |
| ∎ | | Level 2 – other significant observable inputs (including quoted prices for similar securities, interest rates, prepayment speeds, credit risk, etc.) |
| ∎ | | Level 3 – significant unobservable inputs (including the Fund’s own assumptions in determining the fair value of investments) |
| | | | |
| 24 | | Wells Fargo Intrinsic Value Fund | | Notes to financial statements (unaudited) |
The inputs or methodologies used for valuing investments in securities are not necessarily an indication of the risk associated with investing in those securities.
The following is a summary of the inputs used in valuing the Fund’s assets and liabilities as of January 31, 2019:
| | | | | | | | | | | | | | | | |
| | | | |
| | | Quoted prices
(Level 1) | | | Other significant
observable inputs
(Level 2) | | | Significant
unobservable inputs (Level 3) | | | Total | |
| | | | |
Assets | | | | | | | | | | | | | | | | |
| | | | |
Common stocks | | | | | | | | | | | | | | | | |
| | | | |
Communication services | | $ | 90,101,193 | | | $ | 0 | | | $ | 0 | | | $ | 90,101,193 | |
| | | | |
Consumer discretionary | | | 45,827,515 | | | | 0 | | | | 0 | | | | 45,827,515 | |
| | | | |
Consumer staples | | | 66,238,274 | | | | 0 | | | | 0 | | | | 66,238,274 | |
| | | | |
Energy | | | 71,228,053 | | | | 0 | | | | 0 | | | | 71,228,053 | |
| | | | |
Financials | | | 184,677,959 | | | | 0 | | | | 0 | | | | 184,677,959 | |
| | | | |
Health care | | | 112,625,124 | | | | 0 | | | | 0 | | | | 112,625,124 | |
| | | | |
Industrials | | | 83,415,976 | | | | 0 | | | | 0 | | | | 83,415,976 | |
| | | | |
Information technology | | | 110,804,525 | | | | 0 | | | | 0 | | | | 110,804,525 | |
| | | | |
Materials | | | 18,784,920 | | | | 0 | | | | 0 | | | | 18,784,920 | |
| | | | |
Real estate | | | 4,155,630 | | | | 0 | | | | 0 | | | | 4,155,630 | |
| | | | |
Utilities | | | 17,038,896 | | | | 0 | | | | 0 | | | | 17,038,896 | |
| | | | |
Short-term investments | | | | | | | | | | | | | | | | |
| | | | |
Investment companies | | | 8,181,622 | | | | 30,358,915 | | | | 0 | | | | 38,540,537 | |
| | | | |
Total assets | | $ | 813,079,687 | | | $ | 30,358,915 | | | $ | 0 | | | $ | 843,438,602 | |
Additional sector, industry or geographic detail is included in the Portfolio of Investments.
At January 31, 2019, the Fund did not have any transfers into/out of Level 3.
4. TRANSACTIONS WITH AFFILIATES
Management fee
Funds Management, an indirect wholly owned subsidiary of Wells Fargo, is the manager of the Fund and provides advisory and fund-level administrative services under an investment management agreement. Under the investment management agreement, Funds Management is responsible for, among other services, implementing the investment objectives and strategies of the Fund, supervising the subadviser and providing fund-level administrative services in connection with the Fund’s operations. As compensation for its services under the investment management agreement, Funds Management is entitled to receive an annual management fee starting at 0.70% and declining to 0.505% as the average daily net assets of the Fund increase. For the six months ended January 31, 2019, the management fee was equivalent to an annual rate of 0.69% of the Fund’s average daily net assets.
Funds Management has retained the services of a subadviser to provide daily portfolio management to the Fund. The fee for subadvisory services is borne by Funds Management. WellsCap is the subadviser to the Fund and is entitled to receive a fee from Funds Management at an annual rate starting at 0.35% and declining to 0.25% as the average daily net assets of the Fund increase.
Administration fees
Under a class-level administration agreement, Funds Management provides class-level administrative services to the Fund, which includes paying fees and expenses for services provided by the transfer agent,sub-transfer agents, omnibus account servicers and record-keepers. As compensation for its services under the class-level administration agreement, Funds Management receives an annual fee which is calculated based on the average daily net assets of each class as follows:
| | | | |
| | | Class-level
administration fee | |
| |
Class A, Class C, Class R | | | 0.21 | % |
| |
Class R6 | | | 0.03 | |
| |
Administrator Class, Institutional Class | | | 0.13 | |
| | | | | | |
| Notes to financial statements (unaudited) | | Wells Fargo Intrinsic Value Fund | | | 25 | |
Funds Management has contractually waived and/or reimbursed management and administration fees to the extent necessary to maintain certain net operating expense ratios for the Fund. When each class of the Fund has exceeded its expense cap, Funds Management has waived fees and/or reimbursed expenses from fund level expenses on a proportionate basis and then from class specific expenses; otherwise, waivers and/or reimbursements are applied against class specific expenses before fund level expenses. Funds Management has committed through November 30, 2019 to waive fees and/or reimburse expenses to the extent necessary to cap the Fund’s expenses at 1.11% for Class A shares, 1.86% for Class C shares, 1.36% for Class R shares, 0.65% for Class R6 chares, 0.95% for Administrator Class shares and 0.70% for Institutional Class shares. Prior to or after the commitment expiration date, the cap may be increased or the commitment to maintain the cap may be terminated only with the approval of the Board of Trustees.
Distribution fees
The Trust has adopted a distribution plan for Class C and Class R shares of the Fund pursuant to Rule12b-1 under the 1940 Act. Distribution fees are charged to Class C and Class R shares and paid to Wells Fargo Funds Distributor, LLC (“Funds Distributor”), the principal underwriter, at an annual rate of 0.75% of the average daily net assets of Class C shares and 0.25% of the average daily net assets of Class R shares.
In addition, Funds Distributor is entitled to receive thefront-end sales charge from the purchase of Class A shares and a contingent deferred sales charge on the redemption of certain Class A shares. Funds Distributor is also entitled to receive the contingent deferred sales charges from redemptions of Class C shares. For the six months ended January 31, 2019, Funds Distributor received $1,763 from the sale of Class A shares. No contingent deferred sales charges were incurred by Class A and Class C shares for the six months ended January 31, 2019.
Shareholder servicing fees
The Trust has entered into contracts with one or more shareholder servicing agents, whereby Class A, Class C, Class R and Administrator Class of the Fund are charged a fee at an annual rate of 0.25% of the average daily net assets of each respective class.
A portion of these total shareholder servicing fees were paid to affiliates of Wells Fargo.
Interfund transactions
The Fund may purchase or sell portfolio investment securities to certain other Wells Fargo affiliates pursuant toRule 17a-7 under the 1940 Act and under procedures adopted by the Board of Trustees. The procedures have been designed to ensure that these interfund transactions, which do not incur broker commissions, are effected at current market prices.
5. INVESTMENT PORTFOLIO TRANSACTIONS
Purchases and sales of investments, excluding U.S. government obligations (if any) and short-term securities, for the six months ended January 31, 2019 were $69,951,720 and $138,873,684, respectively.
6. BANK BORROWINGS
The Trust (excluding the money market funds), Wells Fargo Master Trust and Wells Fargo Variable Trust are parties to a $280,000,000 revolving credit agreement whereby the Fund is permitted to use bank borrowings for temporary or emergency purposes, such as to fund shareholder redemption requests. Interest under the credit agreement is charged to the Fund based on a borrowing rate equal to the higher of the Federal Funds rate in effect on that day plus 1.25% or the overnight LIBOR rate in effect on that day plus 1.25%. In addition, an annual commitment fee equal to 0.25% of the unused balance is allocated to each participating fund.
For the six months ended January 31, 2019, there were no borrowings by the Fund under the agreement.
| | | | |
| 26 | | Wells Fargo Intrinsic Value Fund | | Notes to financial statements (unaudited) |
7. DISTRIBUTIONS TO SHAREHOLDERS
Effective for all filings after November 4, 2018, the Securities and Exchange Commission eliminated the requirement to separately state the components of distributions to shareholders under U.S. generally accepted accounting principles. The amounts of distributions to shareholders for the year ended July 31, 2018 were as follows:
| | | | | | | | |
| | | Net investment
income | | | Net realized
gains | |
| | |
Class A | | | $1,516,748 | | | | $22,059,131 | |
| | |
Class C | | | 0 | | | | 1,660,929 | |
| | |
Class R | | | 163 | | | | 3,846 | |
| | |
Class R6 | | | 23,745 | | | | 185,128 | |
| | |
Administrator Class | | | 3,138,315 | | | | 33,610,953 | |
| | |
Institutional Class | | | 1,366,652 | | | | 11,360,927 | |
8. INDEMNIFICATION
Under the Trust’s organizational documents, the officers and Trustees have been granted certain indemnification rights against certain liabilities that may arise out of performance of their duties to the Trust. Additionally, in the normal course of business, the Trust may enter into contracts with service providers that contain a variety of indemnification clauses. The Trust’s maximum exposure under these arrangements is dependent on future claims that may be made against the Fund and, therefore, cannot be estimated.
9. NEW ACCOUNTING PRONOUNCEMENT
In August 2018, FASB issued Accounting Standards Update (“ASU”)No. 2018-13, Fair Value Measurement (Topic 820)Disclosure Framework—Changes to the Disclosure Requirements for Fair Value Measurement.ASU2018-13 updates the disclosure requirements for fair value measurements by modifying or removing certain disclosures and adding certain new disclosures. The amendments are effective for fiscal years, and interim periods within those fiscal years, beginning after December 15, 2019. Early adoption is permitted. Management has adopted the removal and modification of disclosures early, as permitted, and will adopt the additional new disclosures at the effective date.
| | | | | | |
| Other information (unaudited) | | Wells Fargo Intrinsic Value Fund | | | 27 | |
PROXY VOTING INFORMATION
A description of the policies and procedures used to determine how to vote proxies relating to portfolio securities is available, upon request, by calling1-800-222-8222, visiting our website atwellsfargofunds.com, or visiting the SEC website at sec.gov. Information regarding how the Fund voted proxies relating to portfolio securities during the most recent12-month period ended June 30 is available on the Fund’s website atwellsfargofunds.comor by visiting the SEC website at sec.gov.
PORTFOLIO HOLDINGS INFORMATION
The complete portfolio holdings for the Fund are publicly available monthly on the Fund’s website (wellsfargofunds.com), on aone-month delayed basis. In addition, top ten holdings information (excluding derivative positions) for the Fund is publicly available on the Fund’s website on a monthly,seven-day or more delayed basis. The Fund files its complete schedule of portfolio holdings with the SEC for the first and third quarters of each fiscal year on FormN-Q, which is available by visiting the SEC website at sec.gov. In addition, the Fund’s FormN-Q may be reviewed and copied at the SEC’s Public Reference Room in Washington, DC, and at regional offices in New York City, at 233 Broadway, and in Chicago, at 175 West Jackson Boulevard, Suite 900. Information about the Public Reference Room may be obtained by calling1-800-SEC-0330.
| | | | |
| 28 | | Wells Fargo Intrinsic Value Fund | | Other information (unaudited) |
BOARD OF TRUSTEES AND OFFICERS
Each of the Trustees and Officers1 listed in the table below acts in identical capacities for each fund in the Wells Fargo family of funds, which consists of 152 mutual funds comprising the Wells Fargo Funds Trust, Wells Fargo Variable Trust, Wells Fargo Master Trust and fourclosed-end funds (collectively the “Fund Complex”). This table should be read in conjunction with the Prospectus and the Statement of Additional Information2. The mailing address of each Trustee and Officer is 525 Market Street, 12th Floor, San Francisco, CA 94105. Each Trustee and Officer serves an indefinite term, however, each Trustee serves such term until reaching the mandatory retirement age established by the Trustees.
Independent Trustees
| | | | | | |
Name and year of birth | | Position held and length of service* | | Principal occupations during past five years or longer | | Current other public company or investment company directorships |
| | | |
William R. Ebsworth (Born 1957) | | Trustee, since 2015 | | Retired. From 1984 to 2013, equities analyst, portfolio manager, research director and chief investment officer at Fidelity Management and Research Company in Boston, Tokyo, and Hong Kong, and retired in 2013 as Chief Investment Officer of Fidelity Strategic Advisers, Inc. where he led a team of investment professionals managing client assets. Prior thereto, Board member of Hong Kong Securities Clearing Co., Hong Kong Options Clearing Corp., the Thailand International Fund, Ltd., Fidelity Investments Life Insurance Company, and Empire Fidelity Investments Life Insurance Company. Audit Committee Chair and Investment Committee Chair of the Vincent Memorial Hospital Endowment(non-profit organization). Mr. Ebsworth is a CFA® charterholder. | | N/A |
| | | |
Jane A. Freeman (Born 1953) | | Trustee, since 2015; Chair Liaison, since 2018 | | Retired. From 2012 to 2014 and 1999 to 2008, Chief Financial Officer of Scientific Learning Corporation. From 2008 to 2012, Ms. Freeman provided consulting services related to strategic business projects. Prior to 1999, Portfolio Manager at Rockefeller & Co. and Scudder, Stevens & Clark. Board member of the Harding Loevner Funds from 1996 to 2014, serving as both Lead Independent Director and chair of the Audit Committee. Board member of the Russell Exchange Traded Funds Trust from 2011 to 2012 and the chair of the Audit Committee. Ms. Freeman is a Board Member of The Ruth Bancroft Garden(non-profit organization). She is also an inactive Chartered Financial Analyst. | | N/A |
| | | |
| Isaiah Harris, Jr.3 (Born 1952) | | Trustee, since 2009; Audit Committee Chairman, since 2019 | | Retired. Chairman of the Board of CIGNA Corporation since 2009, and Director since 2005. From 2003 to 2011, Director of Deluxe Corporation. Prior thereto, President and CEO of BellSouth Advertising and Publishing Corp. from 2005 to 2007, President and CEO of BellSouth Enterprises from 2004 to 2005 and President of BellSouth Consumer Services from 2000 to 2003. Emeritus member of the Iowa State University Foundation Board of Governors. Emeritus Member of the Advisory Board of Iowa State University School of Business. Advisory Board Member, Palm Harbor Academy (private school). Advisory Board Member, Child Evangelism Fellowship(non-profit). Mr. Harris is a certified public accountant (inactive status). | | CIGNA Corporation |
| | | |
Judith M. Johnson3 (Born 1949) | | Trustee, since 2008; Audit Committee Chairman, from 2009 to 2018 | | Retired. Prior thereto, Chief Executive Officer and Chief Investment Officer of Minneapolis Employees Retirement Fund from 1996 to 2008. Ms. Johnson is an attorney, certified public accountant and a certified managerial accountant. | | N/A |
| | | |
| David F. Larcker (Born 1950) | | Trustee, since 2009 | | James Irvin Miller Professor of Accounting at the Graduate School of Business, Stanford University, Director of the Corporate Governance Research Initiative and Senior Faculty of The Rock Center for Corporate Governance since 2006. From 2005 to 2008, Professor of Accounting at the Graduate School of Business, Stanford University. Prior thereto, Ernst & Young Professor of Accounting at The Wharton School, University of Pennsylvania from 1985 to 2005. | | N/A |
| | | | | | |
| Other information (unaudited) | | Wells Fargo Intrinsic Value Fund | | | 29 | |
| | | | | | |
Name and year of birth | | Position held and length of service* | | Principal occupations during past five years or longer | | Current other public company or investment company directorships |
| | | |
| Olivia S. Mitchell (Born 1953) | | Trustee, since 2006; Nominating and Governance Committee Chairman, since 2018 | | International Foundation of Employee Benefit Plans Professor, Wharton School of the University of Pennsylvania since 1993. Director of Wharton’s Pension Research Council and Boettner Center on Pensions & Retirement Research, and Research Associate at the National Bureau of Economic Research. Previously, Cornell University Professor from 1978 to 1993. | | N/A |
| | | |
| Timothy J. Penny (Born 1951) | | Trustee, since 1996; Chairman, since 2018; Vice Chairman, from 2017 to 2018 | | President and Chief Executive Officer of Southern Minnesota Initiative Foundation, anon-profit organization, since 2007. Member of the Board of Trustees of NorthStar Education Finance, Inc., anon-profit organization, since 2007. | | N/A |
| | | |
| James G. Polisson (Born 1959) | | Trustee, since 2018; Advisory Board Member, from 2017 to 2018 | | Retired. Chief Marketing Officer, Source (ETF) UK Services, Ltd, from 2015 to 2017. From 2012 to 2015, Principal of The Polisson Group, LLC, a management consulting, corporate advisory and principal investing company. Chief Executive Officer and Managing Director at Russell Investments, Global Exchange Traded Funds from 2010 to 2012. Managing Director of Barclays Global Investors from 1998 to 2010 and Global Chief Marketing Officer for iShares and Barclays Global Investors from 2000 to 2010. Trustee of the San Francisco Mechanics’ Institute, anon-profit organization, from 2013 to 2015. Board member of the Russell Exchange Traded Fund Trust from 2011 to 2012. Director of Barclays Global Investors Holdings Deutschland GmbH from 2006 to 2009. Mr. Polisson is an attorney and has a retired status with the Massachusetts and District of Columbia Bar Associations. | | N/A |
| | | |
| Pamela Wheelock (Born 1959) | | Trustee, since 2018; Advisory Board Member, from 2017 to 2018 | | Board member of the Destination Medical Center Economic Development Agency, Rochester, Minnesota since 2019. Chief Operating Officer, Twin Cities Habitat for Humanity from 2017 to 2019. Vice President of University Services, University of Minnesota from 2012 to 2016. Prior thereto, on the Board of Directors, Governance Committee and Finance Committee for the Minnesota Philanthropy Partners (Saint Paul Foundation) from 2012 to 2018, Interim Chief Executive Officer of Blue Cross Blue Shield of Minnesota from 2011 to 2012, Chairman of the Board from 2009 to 2012 and Board Director from 2003 to 2015. Vice President, Leadership and Community Engagement, Bush Foundation, Saint Paul, Minnesota (a private foundation) from 2009 to 2011. Executive Vice President and Chief Financial Officer, Minnesota Sports and Entertainment from 2004 to 2009 and Senior Vice President from 2002 to 2004. Executive Vice President of the Minnesota Wild Foundation from 2004 to 2008. Commissioner of Finance, State of Minnesota, from 1999 to 2002. Currently Board Chair of the Minnesota Wild Foundation since 2010. | | N/A |
| * | Length of service dates reflect the Trustee’s commencement of service with the Trust’s predecessor entities, where applicable. |
| | | | |
| 30 | | Wells Fargo Intrinsic Value Fund | | Other information (unaudited) |
Officers
| | | | | | |
Name and
year of birth | | Position held and length of service | | Principal occupations during past five years or longer | | |
| | | |
| Andrew Owen (Born 1960) | | President, since 2017 | | Executive Vice President of Wells Fargo & Company and Head of Affiliated Managers, Wells Fargo Asset Management, since 2014. In addition, Mr. Owen is currently President, Chief Executive Officer and Director of Wells Fargo Funds Management, LLC since 2017. Prior thereto, Executive Vice President responsible for marketing, investments and product development for Wells Fargo Funds Management, LLC, from 2009 to 2014. | | |
| | | |
| Jeremy DePalma1 (Born 1974) | | Treasurer, since 2012 | | Senior Vice President of Wells Fargo Funds Management, LLC since 2009. Senior Vice President of Evergreen Investment Management Company, LLC from 2008 to 2010 and head of the Fund Reporting and Control Team within Fund Administration from 2005 to 2010. | | |
| | | |
| Alexander Kymn (Born 1973) | | Secretary, since 2018; Chief Legal Officer, since 2018 | | Senior Company Counsel of Wells Fargo Bank, N.A. since 2018 (previously Senior Counsel from 2007 to 2018). Vice President of Wells Fargo Funds Management, LLC from 2008 to 2014. | | |
| | | |
Michael H. Whitaker (Born 1967) | | Chief Compliance Officer, since 2016 | | Senior Vice President and Chief Compliance Officer since 2016. Senior Vice President and Chief Compliance Officer for Fidelity Investments from 2007 to 2016. | | |
| | | |
David Berardi (Born 1975) | | Assistant Treasurer, since 2009 | | Vice President of Wells Fargo Funds Management, LLC since 2009. Vice President of Evergreen Investment Management Company, LLC from 2008 to 2010. Manager of Fund Reporting and Control for Evergreen Investment Management Company, LLC from 2004 to 2010. | | |
| 1 | Jeremy DePalma acts as Treasurer of 76 funds and Assistant Treasurer of 76 funds in the Fund Complex. |
| 2 | The Statement of Additional Information includes additional information about the Trustees and is available, without charge, upon request, by calling1-800-260-5969 or by visiting the website atwellsfargofunds.com. |
| 3 | Mr. Harris became Chairman of the Audit Committee effective January 1, 2019. |
| | | | | | |
| Appendix A (unaudited) | | Wells Fargo Intrinsic Value Fund | | | 31 | |
SALES CHARGE REDUCTIONS AND WAIVERS FOR CERTAIN INTERMEDIARIES
Raymond James & Associates, Inc., Raymond James Financial Services & Raymond James affiliates (“Raymond James”)
Effective on or about March 1, 2019, shareholders purchasing Fund shares through a Raymond James platform or account will be eligible only for the following load waivers(front-end sales charge waivers and contingent deferred, orback-end, sales charge waivers) and discounts, which may differ from those disclosed elsewhere in the Fund’s Prospectus or SAI.
Front-end Sales Load Waivers on Class A shares Available at Raymond James
| | • | | Shares purchased in an investment advisory program. |
| | • | | Shares purchased through reinvestment of capital gains distributions and dividend reinvestment when purchasing shares of the same fund (but not any other fund within the fund family). |
| | • | | Employees and registered representatives of Raymond James or its affiliates and their family members as designated by Raymond James. |
| | • | | Shares purchased from the proceeds of redemptions within the same fund family, provided (1) the repurchase occurs within 90 days following the redemption, (2) the redemption and purchase occur in the same account, and (3) redeemed shares were subject to afront-end or deferred sales load (known as Rights of Reinstatement). |
| | • | | A shareholder in the fund’s Class C shares will have their shares automatically exchanged at net asset value to Class A shares (or the appropriate share class) of the fund if the shares are no longer subject to a CDSC and the exchange is in line with the policies and procedures of Raymond James. |
CDSC Waivers on Class A and C Shares Available at Raymond James
| | • | | Death or disability of the shareholder. |
| | • | | Shares sold as part of a systematic withdrawal plan as described in the Fund’s Prospectus. |
| | • | | Return of excess contributions from an IRA Account. |
| | • | | Shares sold as part of a required minimum distribution for IRA and retirement accounts due to the shareholder reaching age 70½ as described in the Fund’s prospectus. |
| | • | | Shares sold to pay Raymond James fees but only if the transaction is initiated by Raymond James. |
| | • | | Shares acquired through a right of reinstatement. |
Front-end Load Discounts Available at Raymond James: Breakpoints, and/or Rights of Accumulation
| | • | | Breakpoints as described in the Fund’s Prospectus. |
| | • | | Rights of accumulation which entitle shareholders to breakpoint discounts will be automatically calculated based on the aggregated holding of fund family assets held by accounts within the purchaser’s household at Raymond James. Eligible fund family assets not held at Raymond James may be included in the rights of accumulation calculation only if the shareholder notifies his or her financial advisor about such assets. |
This page is intentionally left blank.

For more information
More information about Wells Fargo Funds is available free upon request. To obtain literature, please write, visit the Fund’s website, or call:
Wells Fargo Funds
P.O. Box 219967
Kansas City, MO 64121-9967
Website: wellsfargofunds.com
Individual investors: 1-800-222-8222
Retail investment professionals: 1-888-877-9275
Institutional investment professionals: 1-866-765-0778
This report and the financial statements contained herein are submitted for the general information of the shareholders of the Fund. If this report is used for promotional purposes, distribution of the report must be accompanied or preceded by a current prospectus. Before investing, please consider the investment objectives, risks, charges, and expenses of the investment. For a current prospectus and, if available, a summary prospectus, containing this information, call1-800-222-8222 or visit the Fund’s website atwellsfargofunds.com. Read the prospectus carefully before you invest or send money.
Wells Fargo Asset Management (WFAM) is the trade name for certain investment advisory/management firms owned by Wells Fargo & Company. These firms include but are not limited to Wells Capital Management Incorporated and Wells Fargo Funds Management, LLC. Certain products managed by WFAM entities are distributed by Wells Fargo Funds Distributor, LLC (a broker/dealer and Member FINRA).
This material is for general informational and educational purposes only and is NOT intended to provide investment advice or a recommendation of any kind—including a recommendation for any specific investment, strategy, or plan.
INVESTMENT PRODUCTS: NOT FDIC INSURED ◾ NO BANK GUARANTEE ◾ MAY LOSE VALUE
© 2019 Wells Fargo Funds Management, LLC. All rights reserved.
| | |
 | | 320772 03-19 SA207/SAR207 01-19 |
Semi-Annual Report
January 31, 2019

Wells Fargo Large Cap Core Fund

Beginning on January 1, 2021, as permitted by new regulations adopted by the Securities and Exchange Commission, paper copies of the Wells Fargo Funds’ annual and semi-annual shareholder reports issued after this date will no longer be sent by mail, unless you specifically request paper copies of the reports. Instead, the reports will be made available on the Funds’ website, and you will be notified by mail each time a report is posted and provided with a website address to access the report.
If you already elected to receive shareholder reports electronically, you will not be affected by this change and you need not take any action. You may elect to receive shareholder reports and other communications from the Fund electronically at any time by contacting your financial intermediary (such as a broker-dealer or bank) or, if you are a direct investor, by calling 1-800-222-8222 or by enrolling at wellsfargo.com/advantagedelivery.
You may elect to receive all future reports in paper free of charge. If you invest through a financial intermediary, you can contact your financial intermediary to request that you continue to receive paper copies of your shareholder reports; if you invest directly with the Fund, you can call 1-800-222-8222. Your election to receive reports in paper will apply to all Wells Fargo Funds held in your account with your financial intermediary or, if you are a direct investor, to all Wells Fargo Funds that you hold.

Reduce clutter. Save trees.
Sign up for electronic delivery of prospectuses and shareholder reports atwellsfargo.com/advantagedelivery
Contents
The views expressed and any forward-looking statements are as of January 31, 2019, unless otherwise noted, and are those of the Fund managers and/or Wells Fargo Funds Management, LLC. Discussions of individual securities, or the markets generally, or any Wells Fargo Fund are not intended as individual recommendations. Future events or results may vary significantly from those expressed in any forward-looking statements. The views expressed are subject to change at any time in response to changing circumstances in the market. Wells Fargo Funds Management, LLC and the Fund disclaim any obligation to publicly update or revise any views expressed or forward-looking statements.
INVESTMENT PRODUCTS: NOT FDIC INSURED ◾ NO BANK GUARANTEE ◾ MAY LOSE VALUE
| | | | |
| 2 | | Wells Fargo Large Cap Core Fund | | Letter to shareholders (unaudited) |

Andrew Owen
President
Wells Fargo Funds
Favorable third-quarter economic indicators and corporate earnings reports encouraged domestic stock investors.
Dear Shareholder:
We are pleased to offer you this semi-annual report for the Wells Fargo Large Cap Core Fund for the six-month period that ended January 31, 2019. Higher short-term interest rates, inflation concerns, trade tensions, slowing economic growth outside the U.S., and geopolitical events contributed to investment market volatility throughout the period.
For the period, U.S. stocks, as measured by the S&P 500 Index,1 fell 3.00% and international stocks, as measured by the MSCI ACWI ex USA Index (Net),2 declined 6.34%. Based on the MSCI EM Index (Net),3 emerging market stocks lost 2.60%. For bond investors, the Bloomberg Barclays U.S. Aggregate Bond Index4 added 2.71% while the Bloomberg Barclays Global Aggregate ex-USD Index5 gained 1.37%. The Bloomberg Barclays Municipal Bond Index6 added 2.05%, and the ICE BofAML U.S. High Yield Index7 gained 1.02%.
Investors appeared to shake off lingering concerns during the third quarter.
Favorable third-quarter economic indicators and corporate earnings reports encouraged domestic stock investors. U.S. trade negotiations with Mexico and Canada made progress. The Conference Board Consumer Confidence Index®8 reached its highest level in 18 years during September. Several U.S. equity market indices reached records during August. The U.S. Federal Reserve (Fed) raised the federal funds rate by 25 basis points (bps; 100 bps equal 1.00%) to a target range of between 2.00% and 2.25% in September 2018. For the quarter that ended September 30, the S&P 500 Index added 7.71%.
Investors in international markets were not as reassured. Tensions between the U.S. and China increased when the U.S. imposed an additional $200 billion in tariffs on Chinese goods. China responded with $60 billion in tariffs on U.S. products. In addition, economic growth in China drew renewed concerns. The Bank of England, having raised its monetary policy rate to 0.50% in November 2017, increased the rate again in August 2018 to 0.75%. During the three-month period that ended September 30, 2018, the MSCI ACWI ex USA Index (Net) gained 0.71% while the MSCI EM Index (Net) declined 1.09%.
| 1 | The S&P 500 Index consists of 500 stocks chosen for market size, liquidity, and industry group representation. It is a market-value-weighted index with each stock’s weight in the index proportionate to its market value. You cannot invest directly in an index. |
| 2 | The Morgan Stanley Capital International (MSCI) All Country World Index (ACWI) ex USA Index (Net) is a free-float-adjusted market-capitalization-weighted index that is designed to measure the equity market performance of developed markets, excluding the United States and Canada. Source: MSCI. MSCI makes no express or implied warranties or representations and shall have no liability whatsoever with respect to any MSCI data contained herein. The MSCI data may not be further redistributed or used as a basis for other indices or any securities or financial products. This report is not approved, reviewed, or produced by MSCI. You cannot invest directly in an index. |
| 3 | The MSCI Emerging Markets (EM) Index (Net) is a free-float-adjusted market-capitalization-weighted index that is designed to measure large- and mid-cap equity market performance of emerging markets. The MSCI EM Index (Net) consists of the following 24 emerging market country indices: Brazil, Chile, China, Colombia, Czech Republic, Egypt, Greece, Hungary, India, Indonesia, Korea, Malaysia, Mexico, Pakistan, Peru, the Philippines, Poland, Qatar, Russia, South Africa, Taiwan, Thailand, Turkey, and the United Arab Emirates. You cannot invest directly in an index. |
| 4 | The Bloomberg Barclays U.S. Aggregate Bond Index is a broad-based benchmark that measures the investment-grade, U.S. dollar-denominated, fixed-rate taxable bond market, including Treasuries, government-related and corporate securities, mortgage-backed securities (agency fixed-rate and hybrid adjustable-rate mortgage pass-throughs), asset-backed securities, and commercial mortgage-backed securities. You cannot invest directly in an index. |
| 5 | The Bloomberg Barclays Global Aggregate ex-USD Index is an unmanaged index that provides a broad-based measure of the global investment-grade fixed-income markets excluding the U.S. dollar-denominated debt market. You cannot invest directly in an index. |
| 6 | The Bloomberg Barclays Municipal Bond Index is an unmanaged index composed of long-term tax-exempt bonds with a minimum credit rating of Baa. You cannot invest directly in an index. |
| 7 | The ICE BofAML U.S. High Yield Index is a market-capitalization-weighted index of domestic and Yankee high-yield bonds. The index tracks the performance of high-yield securities traded in the U.S. bond market. You cannot invest directly in an index. Copyright 2019. ICE Data Indices, LLC. All rights reserved. |
| 8 | The Conference Board Consumer Confidence Index® measures the degree of optimism on the state of the U.S. economy that consumers are expressing through their activities of savings and spending. You cannot invest directly in an index. |
| | | | | | |
| Letter to shareholders (unaudited) | | Wells Fargo Large Cap Core Fund | | | 3 | |
In bond markets, U.S. bonds, as measured by the Bloomberg Barclays U.S. Aggregate Bond Index, were flat. The Bloomberg Barclays Global Aggregateex-USD Index fell 1.74% during the quarter that ended September 30, 2018.
Conflicting data unsettled markets during the fourth quarter.
Negative stock market performance during October and December bracketed a mildly positive November for the S&P 500 Index and the MSCI ACWI ex USA Index (Net). As interest rates and bond yields gained during October, stock markets struggled. December’s S&P 500 Index performance was the worst since 1931. Globally, fixed-income investments fared better than stocks during the last two months of the year.
November’s U.S. midterm elections shifted control of the House of Representatives from Republicans to Democrats, presaging potential partisan disputes. The Bureau of Economic Analysis reported that third-quarter U.S. gross domestic product (GDP) grew at an annualized 3.4% rate, lower than second-quarter GDP growth. Brexit efforts stalled in the U.K. ahead of the March 2019 deadline. The People’s Bank of China cut reserve requirement ratios and accelerated infrastructure spending and tax cuts, and the value of the yuan declined to low levels last seen in 2008. Oil prices fell.
After the Fed increased the federal funds rate by 25 bps to a target range of between 2.25% and 2.50% in December 2018—the ninth such increase since the Fed began raising rates three years ago from near zero—it softened its outlook for further interest rate increases in 2019.
The market climbs a wall of worry.
Investors entered 2019 with reasons to be concerned. A partial U.S. government shutdown driven by partisan disputes over spending and immigration policies extended into January. Globally, economic signals were uneven. Investors expected high levels of stock market volatility to continue, as measured by the VIX9.
January’s returns tended to support the investing adage that the market climbs a wall of worry. The S&P 500 Index gained 8.01% for the month that ended January 31, 2019, its best monthly performance in 30 years. Returns for the MSCI ACWI ex USA Index (Net), the Bloomberg Barclays U.S. Aggregate Bond Index, and the Bloomberg Barclays Global Aggregate ex-USD Index also were positive.
Don’t let short-term uncertainty derail long-term investment goals.
Periods of investment uncertainty can present challenges, but experience has taught us that maintaining long-term investment goals can be an effective way to plan for the future. To help you create a sound strategy based on your personal goals and risk tolerance, Wells Fargo Funds offers more than 100 mutual funds spanning a wide range of asset classes and investment styles. Although diversification cannot guarantee an investment profit or prevent losses, we believe it can be an effective way to manage investment risk and potentially smooth out overall portfolio performance. We encourage investors to know their investments and to understand that appropriate levels of risk-taking may unlock opportunities.
January’s returns tended to support the investing adage that the market climbs a wall of worry.
| 9 | The Chicago Board Options Exchange Market Volatility Index (VIX) is a popular measure of the implied volatility of S&P 500 Index options. It represents one measure of the market’s expectation of stock market volatility over the next 30-day period. You cannot invest directly in an index. |
| | | | |
| 4 | | Wells Fargo Large Cap Core Fund | | Letter to shareholders (unaudited) |
Thank you for choosing to invest with Wells Fargo Funds. We appreciate your confidence in us and remain committed to helping you meet your financial needs.
Sincerely,

Andrew Owen
President
Wells Fargo Funds
For further information about your Fund, contact your investment professional, visit our website atwellsfargofunds.com, or call us directly at1-800-222-8222.
This page is intentionally left blank.
| | | | |
| 6 | | Wells Fargo Large Cap Core Fund | | Performance highlights (unaudited) |
Investment objective
The Fund seeks long-term capital appreciation.
Manager
Wells Fargo Funds Management, LLC
Subadviser
Wells Capital Management Incorporated
Portfolio managers
John R. Campbell, CFA®‡
Jeff C. Moser, CFA®‡
Average annual total returns (%) as of January 31, 2019
| | | | | | | | | | | | | | | | | | | | | | | | | | | | | | | | | | |
| | | | | Including sales charge | | | Excluding sales charge | | | Expense ratios1 (%) | |
| | | Inception date | | 1 year | | | 5 year | | | 10 year | | | 1 year | | | 5 year | | | 10 year | | | Gross | | | Net2 | |
| | | | | | | | | |
| Class A (EGOAX) | | 12-17-2007 | | | -12.48 | | | | 7.84 | | | | 12.61 | | | | -7.13 | | | | 9.12 | | | | 13.28 | | | | 1.18 | | | | 1.08 | |
| | | | | | | | | |
| Class C (EGOCX) | | 12-17-2007 | | | -8.86 | | | | 8.31 | | | | 12.43 | | | | -7.86 | | | | 8.31 | | | | 12.43 | | | | 1.93 | | | | 1.83 | |
| | | | | | | | | |
| Class R (EGOHX)3 | | 9-30-2015 | | | – | | | | – | | | | – | | | | -7.37 | | | | 8.86 | | | | 13.01 | | | | 1.43 | | | | 1.33 | |
| | | | | | | | | |
| Class R6 (EGORX)4 | | 9-30-2015 | | | – | | | | – | | | | – | | | | -6.77 | | | | 10.26 | | | | 14.10 | | | | 0.75 | | | | 0.65 | |
| | | | | | | | | |
| Administrator Class (WFLLX)5 | | 7-16-2010 | | | – | | | | – | | | | – | | | | -7.05 | | | | 9.30 | | | | 13.49 | | | | 1.10 | | | | 0.97 | |
| | | | | | | | | |
| Institutional Class (EGOIX) | | 12-17-2007 | | | – | | | | – | | | | – | | | | -6.75 | | | | 9.63 | | | | 13.78 | | | | 0.85 | | | | 0.67 | |
| | | | | | | | | |
| S&P 500 Index6 | | – | | | – | | | | – | | | | – | | | | -2.31 | | | | 10.96 | | | | 15.00 | | | | – | | | | – | |
Figures quoted represent past performance, which is no guarantee of future results, and do not reflect taxes that a shareholder may pay on fund distributions or the redemption of fund shares. Investment return and principal value of an investment will fluctuate so that an investor’s shares, when redeemed, may be worth more or less than their original cost. Performance shown without sales charges would be lower if sales charges were reflected. Current performance may be lower or higher than the performance data quoted, which assumes the reinvestment of dividends and capital gains. Current month-end performance is available on the Fund’s website,wellsfargofunds.com.
Index returns do not include transaction costs associated with buying and selling securities, any mutual fund fees or expenses, or any taxes. It is not possible to invest directly in an index.
For Class A shares, the maximum front-end sales charge is 5.75%. For Class C shares, the maximum contingent deferred sales charge is 1.00%. Performance including a contingent deferred sales charge assumes the sales charge for the corresponding time period. Class R, Class R6, Administrator Class, and Institutional Class shares are sold without a front-end sales charge or contingent deferred sales charge.
Stock values fluctuate in response to the activities of individual companies and general market and economic conditions. Certain investment strategies tend to increase the total risk of an investment (relative to the broader market). The Fund is exposed to foreign investment risk and focused portfolio risk. Consult the Fund’s prospectus for additional information on these and other risks.
Please see footnotes on page 7.
| | | | | | |
| Performance highlights (unaudited) | | Wells Fargo Large Cap Core Fund | | | 7 | |
| | | | |
| Ten largest holdings (%) as of January 31, 20197 | |
| |
Zebra Technologies Corporation Class A | | | 2.61 | |
| |
Apple Incorporated | | | 2.58 | |
| |
VMware Incorporated Class A | | | 2.56 | |
| |
Microsoft Corporation | | | 2.51 | |
| |
JPMorgan Chase & Company | | | 2.40 | |
| |
The Home Depot Incorporated | | | 2.37 | |
| |
UnitedHealth Group Incorporated | | | 2.36 | |
| |
NetApp Incorporated | | | 2.35 | |
| |
Costco Wholesale Corporation | | | 2.33 | |
| |
The Progressive Corporation | | | 2.33 | |
|
| Sector distribution as of January 31, 20198 |
|
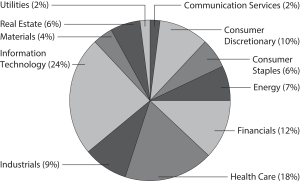
|
| ‡ | CFA® and Chartered Financial Analyst® are trademarks owned by CFA Institute. |
| 1 | Reflects the expense ratios as stated in the most recent prospectuses. The expense ratios shown are subject to change and may differ from the annualized expense ratios shown in the financial highlights of this report. |
| 2 | The manager has contractually committed through November 30, 2019, to waive fees and/or reimburse expenses to the extent necessary to cap the expenses of each class after fee waivers at the amounts shown. Brokerage commissions, stamp duty fees, interest, taxes, acquired fund fees and expenses (if any), and extraordinary expenses are excluded from the expense cap. Prior to or after the commitment expiration date, the cap may be increased or the commitment to maintain the cap may be terminated only with the approval of the Board of Trustees. Without this cap, the Fund’s returns would have been lower. The expense ratio paid by an investor is the net expense ratio (the total annual fund operating expenses after fee waivers) as stated in the prospectuses. |
| 3 | Historical performance shown for Class R shares prior to their inception reflects the performance of Administrator Class shares, adjusted to reflect higher expenses applicable to Class R shares. |
| 4 | Historical performance shown for Class R6 shares prior to their inception reflects the performance of Institutional Class shares, adjusted to reflect higher expenses applicable to Class R6 shares. |
| 5 | Historical performance shown for Administrator Class shares prior to their inception reflects the performance of Institutional Class shares, adjusted to reflect higher expenses applicable to Administrator Class shares. |
| 6 | The S&P 500 Index consists of 500 stocks chosen for market size, liquidity, and industry group representation. It is a market-value-weighted index with each stock’s weight in the index proportionate to its market value. You cannot invest directly in an index. |
| 7 | The ten largest holdings, excluding cash and cash equivalents and any money market funds, are calculated based on the value of the investments divided by total net assets of the Fund. Holdings are subject to change and may have changed since the date specified. |
| 8 | Amounts are calculated based on the total long-term investments of the Fund. These amounts are subject to change and may have changed since the date specified. |
| | | | |
| 8 | | Wells Fargo Large Cap Core Fund | | Fund expenses (unaudited) |
As a shareholder of the Fund, you incur two types of costs: (1) transaction costs, including sales charges (loads) on purchase payments and contingent deferred sales charges (if any) on redemptions and (2) ongoing costs, including management fees, distribution (12b-1) and/or shareholder servicing fees, and other Fund expenses. This example is intended to help you understand your ongoing costs (in dollars) of investing in the Fund and to compare these costs with the ongoing costs of investing in other mutual funds.
The example is based on an investment of $1,000 invested at the beginning of the six-month period and held for the entire period from August 1, 2018 to January 31, 2019.
Actual expenses
The “Actual” line of the table below provides information about actual account values and actual expenses. You may use the information in this line, together with the amount you invested, to estimate the expenses that you paid over the period. Simply divide your account value by $1,000 (for example, an $8,600 account value divided by $1,000 = 8.6), then multiply the result by the number in the “Actual” line under the heading entitled “Expenses paid during period” for your applicable class of shares to estimate the expenses you paid on your account during this period.
Hypothetical example for comparison purposes
The “Hypothetical” line of the table below provides information about hypothetical account values and hypothetical expenses based on the Fund’s actual expense ratio and an assumed rate of return of 5% per year before expenses, which is not the Fund’s actual return. The hypothetical account values and expenses may not be used to estimate the actual ending account balance or expenses you paid for the period. You may use this information to compare the ongoing costs of investing in the Fund and other funds. To do so, compare this 5% hypothetical example with the 5% hypothetical examples that appear in the shareholder reports of the other funds.
Please note that the expenses shown in the table are meant to highlight your ongoing costs only and do not reflect any transactional costs, such as sales charges (loads) and contingent deferred sales charges. Therefore, the “Hypothetical” line of the table is useful in comparing ongoing costs only and will not help you determine the relative total costs of owning different funds. In addition, if these transactional costs were included, your costs would have been higher.
| | | | | | | | | | | | | | | | |
| | | Beginning
account value
8-1-2018 | | | Ending
account value
1-31-2019 | | | Expenses
paid during
the period¹ | | | Annualized net
expense ratio | |
Class A | | | | | | | | | | | | | | | | |
| | | | |
Actual | | $ | 1,000.00 | | | $ | 935.36 | | | $ | 5.27 | | | | 1.08 | % |
| | | | |
Hypothetical (5% return before expenses) | | $ | 1,000.00 | | | $ | 1,019.76 | | | $ | 5.50 | | | | 1.08 | % |
Class C | | | | | | | | | | | | | | | | |
| | | | |
Actual | | $ | 1,000.00 | | | $ | 931.30 | | | $ | 8.91 | | | | 1.83 | % |
| | | | |
Hypothetical (5% return before expenses) | | $ | 1,000.00 | | | $ | 1,015.98 | | | $ | 9.30 | | | | 1.83 | % |
Class R | | | | | | | | | | | | | | | | |
| | | | |
Actual | | $ | 1,000.00 | | | $ | 934.33 | | | $ | 6.48 | | | | 1.33 | % |
| | | | |
Hypothetical (5% return before expenses) | | $ | 1,000.00 | | | $ | 1,018.50 | | | $ | 6.77 | | | | 1.33 | % |
Class R6 | | | | | | | | | | | | | | | | |
| | | | |
Actual | | $ | 1,000.00 | | | $ | 937.17 | | | $ | 3.17 | | | | 0.65 | % |
| | | | |
Hypothetical (5% return before expenses) | | $ | 1,000.00 | | | $ | 1,021.93 | | | $ | 3.31 | | | | 0.65 | % |
Administrator Class | | | | | | | | | | | | | | | | |
| | | | |
Actual | | $ | 1,000.00 | | | $ | 935.66 | | | $ | 4.73 | | | | 0.97 | % |
| | | | |
Hypothetical (5% return before expenses) | | $ | 1,000.00 | | | $ | 1,020.32 | | | $ | 4.94 | | | | 0.97 | % |
Institutional Class | | | | | | | | | | | | | | | | |
| | | | |
Actual | | $ | 1,000.00 | | | $ | 937.42 | | | $ | 3.27 | | | | 0.67 | % |
| | | | |
Hypothetical (5% return before expenses) | | $ | 1,000.00 | | | $ | 1,021.83 | | | $ | 3.41 | | | | 0.67 | % |
| 1 | Expenses paid is equal to the annualized net expense ratio of each class multiplied by the average account value over the period, multiplied by the number of days in the most recent fiscal half-year divided by the number of days in the fiscal year (to reflect the one-half-year period). |
| | | | | | |
| Portfolio of investments—January 31, 2019 (unaudited) | | Wells Fargo Large Cap Core Fund | | | 9 | |
| | | | | | | | | | | | | | | | |
| Security name | | | | | | | | Shares | | | Value | |
|
Common Stocks: 98.92% | |
| | | | |
Communication Services: 2.09% | | | | | | | | | | | | | | | | |
| | | | |
| Interactive Media & Services: 2.09% | | | | | | | | | | | | | | | | |
| | | | |
Alphabet Incorporated Class C † | | | | | | | | | | | 19,096 | | | $ | 21,318,202 | |
| | | | | | | | | | | | | | | | |
| | | | |
Consumer Discretionary: 10.06% | | | | | | | | | | | | | | | | |
| | | | |
| Auto Components: 1.86% | | | | | | | | | | | | | | | | |
| | | | |
Lear Corporation | | | | | | | | | | | 123,312 | | | | 18,981,416 | |
| | | | | | | | | | | | | | | | |
| | | | |
| Multiline Retail: 3.90% | | | | | | | | | | | | | | | | |
| | | | |
Macy’s Incorporated | | | | | | | | | | | 635,913 | | | | 16,724,512 | |
| | | | |
Target Corporation | | | | | | | | | | | 316,534 | | | | 23,106,982 | |
| |
| | | | 39,831,494 | |
| | | | | | | | | | | | | | | | |
| | | | |
| Specialty Retail: 4.30% | | | | | | | | | | | | | | | | |
| | | | |
The Home Depot Incorporated | | | | | | | | | | | 131,480 | | | | 24,130,524 | |
| | | | |
The TJX Companies Incorporated | | | | | | | | | | | 396,611 | | | | 19,723,465 | |
| |
| | | | 43,853,989 | |
| | | | | | | | | | | | | | | | |
| | | | |
Consumer Staples: 6.19% | | | | | | | | | | | | | | | | |
| | | | |
| Food & Staples Retailing: 6.19% | | | | | | | | | | | | | | | | |
| | | | |
Casey’s General Stores Incorporated | | | | | | | | | | | 144,961 | | | | 18,653,581 | |
| | | | |
Costco Wholesale Corporation | | | | | | | | | | | 110,915 | | | | 23,805,686 | |
| | | | |
Wal-Mart Stores Incorporated | | | | | | | | | | | 215,409 | | | | 20,642,644 | |
| |
| | | | 63,101,911 | |
| | | | | | | | | | | | | | | | |
| | | | |
Energy: 7.02% | | | | | | | | | | | | | | | | |
| | | | |
| Oil, Gas & Consumable Fuels: 7.02% | | | | | | | | | | | | | | | | |
| | | | |
Chevron Corporation | | | | | | | | | | | 142,937 | | | | 16,387,727 | |
| | | | |
Exxon Mobil Corporation | | | | | | | | | | | 268,415 | | | | 19,669,451 | |
| | | | |
Marathon Petroleum Corporation | | | | | | | | | | | 255,938 | | | | 16,958,452 | |
| | | | |
Valero Energy Corporation | | | | | | | | | | | 211,360 | | | | 18,561,635 | |
| |
| | | | 71,577,265 | |
| | | | | | | | | | | | | | | | |
| | | | |
Financials: 11.69% | | | | | | | | | | | | | | | | |
| | | | |
| Banks: 5.95% | | | | | | | | | | | | | | | | |
| | | | |
Bank of America Corporation | | | | | | | | | | | 726,507 | | | | 20,683,654 | |
| | | | |
Citizens Financial Group Incorporated | | | | | | | | | | | 459,158 | | | | 15,574,639 | |
| | | | |
JPMorgan Chase & Company | | | | | | | | | | | 236,328 | | | | 24,459,948 | |
| |
| | | | 60,718,241 | |
| | | | | | | | | | | | | | | | |
| | | | |
| Capital Markets: 1.87% | | | | | | | | | | | | | | | | |
| | | | |
Evercore Partners Incorporated Class A | | | | | | | | | | | 213,521 | | | | 19,099,453 | |
| | | | | | | | | | | | | | | | |
| | | | |
| Insurance: 3.87% | | | | | | | | | | | | | | | | |
| | | | |
Prudential Financial Incorporated | | | | | | | | | | | 170,615 | | | | 15,720,466 | |
| | | | |
The Progressive Corporation | | | | | | | | | | | 352,728 | | | | 23,735,067 | |
| |
| | | | 39,455,533 | |
| | | | | | | | | | | | | | | | |
The accompanying notes are an integral part of these financial statements.
| | | | |
| 10 | | Wells Fargo Large Cap Core Fund | | Portfolio of investments—January 31, 2019 (unaudited) |
| | | | | | | | | | | | | | | | |
| Security name | | | | | | | | Shares | | | Value | |
|
Health Care: 17.55% | |
| | | | |
| Biotechnology: 5.15% | | | | | | | | | | | | | | | | |
| | | | |
AbbVie Incorporated | | | | | | | | | | | 179,032 | | | $ | 14,374,479 | |
| | | | |
Amgen Incorporated | | | | | | | | | | | 93,951 | | | | 17,579,172 | |
| | | | |
Exelixis Incorporated † | | | | | | | | | | | 874,158 | | | | 20,603,904 | |
| |
| | | | 52,557,555 | |
| | | | | | | | | | | | | | | | |
| | | | |
| Health Care Equipment & Supplies: 2.20% | | | | | | | | | | | | | | | | |
| | | | |
Baxter International Incorporated | | | | | | | | | | | 310,337 | | | | 22,496,329 | |
| | | | | | | | | | | | | | | | |
| | | | |
| Health Care Providers & Services: 6.33% | | | | | | | | | | | | | | | | |
| | | | |
Centene Corporation † | | | | | | | | | | | 166,578 | | | | 21,750,089 | |
| | | | |
Encompass Health Corporation | | | | | | | | | | | 279,880 | | | | 18,707,182 | |
| | | | |
UnitedHealth Group Incorporated | | | | | | | | | | | 89,113 | | | | 24,078,333 | |
| |
| | | | 64,535,604 | |
| | | | | | | | | | | | | | | | |
| | | | |
| Life Sciences Tools & Services: 2.07% | | | | | | | | | | | | | | | | |
| | | | |
Agilent Technologies Incorporated | | | | | | | | | | | 277,050 | | | | 21,069,653 | |
| | | | | | | | | | | | | | | | |
| | | | |
| Pharmaceuticals: 1.80% | | | | | | | | | | | | | | | | |
| | | | |
Johnson & Johnson | | | | | | | | | | | 138,368 | | | | 18,414,013 | |
| | | | | | | | | | | | | | | | |
| | | | |
Industrials: 9.00% | | | | | | | | | | | | | | | | |
| | | | |
| Aerospace & Defense: 1.67% | | | | | | | | | | | | | | | | |
| | | | |
Northrop Grumman Corporation | | | | | | | | | | | 61,921 | | | | 17,062,332 | |
| | | | | | | | | | | | | | | | |
| | | | |
| Construction & Engineering: 1.93% | | | | | | | | | | | | | | | | |
| | | | |
EMCOR Group Incorporated | | | | | | | | | | | 301,957 | | | | 19,696,655 | |
| | | | | | | | | | | | | | | | |
| | | | |
| Machinery: 3.70% | | | | | | | | | | | | | | | | |
| | | | |
Allison Transmission Holdings Incorporated | | | | | | | | | | | 429,289 | | | | 20,893,496 | |
| | | | |
Cummins Incorporated | | | | | | | | | | | 114,750 | | | | 16,880,873 | |
| |
| | | | 37,774,369 | |
| | | | | | | | | | | | | | | | |
| | | | |
| Trading Companies & Distributors: 1.70% | | | | | | | | | | | | | | | | |
| | | | |
Applied Industrial Technologies Incorporated | | | | | | | | | | | 292,829 | | | | 17,279,839 | |
| | | | | | | | | | | | | | | | |
| | | | |
Information Technology: 23.53% | | | | | | | | | | | | | | | | |
| | | | |
| Communications Equipment: 2.10% | | | | | | | | | | | | | | | | |
| | | | |
Cisco Systems Incorporated | | | | | | | | | | | 453,920 | | | | 21,465,877 | |
| | | | | | | | | | | | | | | | |
| | | | |
| Electronic Equipment, Instruments & Components: 4.26% | | | | | | | | | | | | | | | | |
| | | | |
Jabil Circuit Incorporated | | | | | | | | | | | 629,175 | | | | 16,767,514 | |
| | | | |
Zebra Technologies Corporation Class A † | | | | | | | | | | | 153,464 | | | | 26,641,350 | |
| |
| | | | 43,408,864 | |
| | | | | | | | | | | | | | | | |
| | | | |
| Semiconductors & Semiconductor Equipment: 5.19% | | | | | | | | | | | | | | | | |
| | | | |
Intel Corporation | | | | | | | | | | | 410,287 | | | | 19,332,723 | |
| | | | |
NVIDIA Corporation | | | | | | | | | | | 107,539 | | | | 15,458,731 | |
| | | | |
ON Semiconductor Corporation † | | | | | | | | | | | 907,348 | | | | 18,183,254 | |
| |
| | | | 52,974,708 | |
| | | | | | | | | | | | | | | | |
The accompanying notes are an integral part of these financial statements.
| | | | | | |
| Portfolio of investments—January 31, 2019 (unaudited) | | Wells Fargo Large Cap Core Fund | | | 11 | |
| | | | | | | | | | | | | | | | |
| Security name | | | | | | | | Shares | | | Value | |
| | | | |
| Software: 5.07% | | | | | | | | | | | | | | | | |
| | | | |
Microsoft Corporation | | | | | | | | | | | 245,484 | | | $ | 25,635,894 | |
| | | | |
VMware Incorporated Class A | | | | | | | | | | | 172,670 | | | | 26,085,257 | |
| |
| | | | 51,721,151 | |
| | | | | | | | | | | | | | | | |
| | | | |
| Technology Hardware, Storage & Peripherals: 6.91% | | | | | | | | | | | | | | | | |
| | | | |
Apple Incorporated | | | | | | | | | | | 158,330 | | | | 26,352,445 | |
| | | | |
HP Incorporated | | | | | | | | | | | 918,023 | | | | 20,224,047 | |
| | | | |
NetApp Incorporated | | | | | | | | | | | 375,122 | | | | 23,921,530 | |
| |
| | | | 70,498,022 | |
| | | | | | | | | | | | | | | | |
| | | | |
Materials: 3.83% | | | | | | | | | | | | | | | | |
| | | | |
| Chemicals: 1.64% | | | | | | | | | | | | | | | | |
| | | | |
Huntsman Corporation | | | | | | | | | | | 762,464 | | | | 16,751,334 | |
| | | | | | | | | | | | | | | | |
| | | | |
| Containers & Packaging: 2.19% | | | | | | | | | | | | | | | | |
| | | | |
Avery Dennison Corporation | | | | | | | | | | | 213,314 | | | | 22,280,647 | |
| | | | | | | | | | | | | | | | |
| | | | |
Real Estate: 6.11% | | | | | | | | | | | | | | | | |
| | | | |
| Equity REITs: 4.11% | | | | | | | | | | | | | | | | |
| | | | |
American Tower Corporation | | | | | | | | | | | 134,653 | | | | 23,273,425 | |
| | | | |
Prologis Incorporated | | | | | | | | | | | 269,251 | | | | 18,621,399 | |
| |
| | | | 41,894,824 | |
| | | | | | | | | | | | | | | | |
| | | | |
| Real Estate Management & Development: 2.00% | | | | | | | | | | | | | | | | |
| | | | |
CBRE Group Incorporated Class A † | | | | | | | | | | | 447,083 | | | | 20,454,047 | |
| | | | | | | | | | | | | | | | |
| | | | |
Utilities: 1.85% | | | | | | | | | | | | | | | | |
| | | | |
| Multi-Utilities: 1.85% | | | | | | | | | | | | | | | | |
| | | | |
CenterPoint Energy Incorporated | | | | | | | | | | | 611,210 | | | | 18,898,613 | |
| | | | | | | | | | | | | | | | |
| |
Total Common Stocks (Cost $819,056,606) | | | | 1,009,171,940 | |
| | | | | | | | | | | | | | | | |
| | | | |
| | | Yield | | | | | | | | | | |
| Short-Term Investments: 1.03% | | | | | | | | | | | | | | | | |
| | | | |
| Investment Companies: 1.03% | | | | | | | | | | | | | | | | |
| | | | |
Wells Fargo Government Money Market Fund Select Class (l)(u) | | | 2.33 | % | | | | | | | 10,550,830 | | | | 10,550,830 | |
| | | | | | | | | | | | | | | | |
| | | | |
Total Short-Term Investments (Cost $10,550,830) | | | | | | | | | | | | | | | 10,550,830 | |
| | | | | | | | | | | | | | | | |
| | | | | | | | |
| Total investments in securities (Cost $829,607,436) | | | 99.95 | % | | | 1,019,722,770 | |
| | |
Other assets and liabilities, net | | | 0.05 | | | | 462,296 | |
| | | | | | | | |
| Total net assets | | | 100.00 | % | | $ | 1,020,185,066 | |
| | | | | | | | |
| † | Non-income-earning security |
| (l) | The issuer of the security is an affiliated person of the Fund as defined in the Investment Company Act of 1940. |
| (u) | The rate represents the 7-day annualized yield at period end. |
Abbreviations:
| REIT | Real estate investment trust |
The accompanying notes are an integral part of these financial statements.
| | | | |
| 12 | | Wells Fargo Large Cap Core Fund | | Portfolio of investments—January 31, 2019 (unaudited) |
Investments in Affiliates
An affiliated investment is an investment in which the Fund owns at least 5% of the outstanding voting shares of the issuer or as a result of other relationships, such as the Fund and the issuer having the same investment manager. Transactions with issuers that were either affiliated persons of the Fund at the beginning of the period or the end of the period were as follows:
| | | | | | | | | | | | | | | | | | | | | | | | | | | | | | | | | | | | |
| | | Shares,
beginning of
period | | | Shares
purchased | | | Shares
sold | | | Shares,
end of
period | | | Net
realized
gains
(losses) | | | Net
change in
unrealized
gains
(losses) | | | Income
from
affiliated
securities | | | Value,
end
of period | | | % of
net
assets | |
Short-Term Investments | | | | | | | | | | | | | | | | | | | | | | | | | | | | | | | | | | | | |
Investment Companies | | | | | | | | | | | | | | | | | | | | | | | | | | | | | | | | | | | | |
Securities Lending Cash Investments LLC * | | | 0 | | | | 47,671,858 | | | | 47,671,858 | | | | 0 | | | $ | 0 | | | $ | 0 | | | $ | 45,138 | | | $ | 0 | | | | | |
Wells Fargo Government Money Market Fund Select Class | | | 10,016,109 | | | | 78,197,811 | | | | 77,663,090 | | | | 10,550,830 | | | | 0 | | | | 0 | | | | 119,476 | | | | 10,550,830 | | | | | |
| | | | | | | | | | | | | | | | | | | | | | | | | | | | | | | | | | | | |
| | | | | | | | | |
| | | | | | | | | | | | | | | | | | $ | 0 | | | $ | 0 | | | $ | 164,614 | | | $ | 10,550,830 | | | | 1.03 | % |
| | | | | | | | | | | | | | | | | | | | | | | | | | | | | | | | | | | | |
| | * | No longer held at the end of the period. |
The accompanying notes are an integral part of these financial statements.
| | | | | | |
| Statement of assets and liabilities—January 31, 2019 (unaudited) | | Wells Fargo Large Cap Core Fund | | | 13 | |
| | | | |
| | | | |
| |
Assets | | | | |
Investments in unaffiliated securities, at value (cost $819,056,606) | | $ | 1,009,171,940 | |
Investments in affiliated securities, at value (cost $10,550,830) | | | 10,550,830 | |
Receivable for Fund shares sold | | | 1,696,014 | |
Receivable for dividends | | | 525,182 | |
Receivable for securities lending income | | | 679 | |
Prepaid expenses and other assets | | | 49,846 | |
| | | | |
Total assets | | | 1,021,994,491 | |
| | | | |
| |
Liabilities | | | | |
Payable for Fund shares redeemed | | | 1,202,880 | |
Management fee payable | | | 439,657 | |
Administration fees payable | | | 131,807 | |
Distribution fees payable | | | 32,329 | |
Trustees’ fees and expenses payable | | | 2,752 | |
| | | | |
Total liabilities | | | 1,809,425 | |
| | | | |
Total net assets | | $ | 1,020,185,066 | |
| | | | |
| |
NET ASSETS CONSIST OF | | | | |
Paid-in capital | | $ | 812,219,703 | |
Total distributable earnings | | | 207,965,363 | |
| | | | |
Total net assets | | $ | 1,020,185,066 | |
| | | | |
| |
COMPUTATION OF NET ASSET VALUE AND OFFERING PRICE PER SHARE | | | | |
Net assets – Class A | | $ | 321,912,196 | |
Shares outstanding – Class A1 | | | 18,742,913 | |
Net asset value per share – Class A | | | $17.18 | |
Maximum offering price per share – Class A2 | | | $18.23 | |
Net assets – Class C | | $ | 52,058,412 | |
Shares outstanding – Class C1 | | | 3,078,068 | |
Net asset value per share – Class C | | | $16.91 | |
Net assets – Class R | | $ | 1,977,196 | |
Shares outstanding – Class R1 | | | 114,973 | |
Net asset value per share – Class R | | | $17.20 | |
Net assets – Class R6 | | $ | 12,278,088 | |
Shares outstanding – Class R61 | | | 712,458 | |
Net asset value per share – Class R6 | | | $17.23 | |
Net assets – Administrator Class | | $ | 19,148,795 | |
Shares outstanding – Administrator Class1 | | | 1,101,174 | |
Net asset value per share – Administrator Class | | | $17.39 | |
Net assets – Institutional Class | | $ | 612,810,379 | |
Shares outstanding – Institutional Class1 | | | 35,512,607 | |
Net asset value per share – Institutional Class | | | $17.26 | |
| 1 | The Fund has an unlimited number of authorized shares. |
| 2 | Maximum offering price is computed as 100/94.25 of net asset value. On investments of $50,000 or more, the offering price is reduced. |
The accompanying notes are an integral part of these financial statements.
| | | | |
| 14 | | Wells Fargo Large Cap Core Fund | | Statement of operations—six months ended January 31, 2019 (unaudited) |
| | | | |
| | | | |
| |
Investment income | | | | |
Dividends | | $ | 13,477,095 | |
Income from affiliated securities | | | 125,139 | |
| | | | |
Total investment income | | | 13,602,234 | |
| | | | |
| |
Expenses | | | | |
Management fee | | | 3,736,915 | |
Administration fees | | | | |
Class A | | | 359,122 | |
Class C | | | 59,887 | |
Class R | | | 2,098 | |
Class R6 | | | 2,105 | |
Administrator Class | | | 14,390 | |
Institutional Class | | | 425,621 | |
Shareholder servicing fees | | | | |
Class A | | | 427,527 | |
Class C | | | 71,294 | |
Class R | | | 2,498 | |
Administrator Class | | | 27,423 | |
Distribution fees | | | | |
Class C | | | 213,883 | |
Class R | | | 2,498 | |
Custody and accounting fees | | | 29,238 | |
Professional fees | | | 23,489 | |
Registration fees | | | 60,492 | |
Shareholder report expenses | | | 75,615 | |
Trustees’ fees and expenses | | | 11,745 | |
Interest expense | | | 588 | |
Other fees and expenses | | | 13,990 | |
| | | | |
Total expenses | | | 5,560,418 | |
Less: Fee waivers and/or expense reimbursements | | | (831,181 | ) |
| | | | |
Net expenses | | | 4,729,237 | |
| | | | |
Net investment income | | | 8,872,997 | |
| | | | |
| |
REALIZED AND UNREALIZED GAINS (LOSSES) ON INVESTMENTS | | | | |
Net realized gains on investments | | | 43,356,371 | |
Net change in unrealized gains (losses) on investments | | | (125,896,735 | ) |
| | | | |
Net realized and unrealized gains (losses) on investments | | | (82,540,364 | ) |
| | | | |
Net decrease in net assets resulting from operations | | $ | (73,667,367 | ) |
| | | | |
The accompanying notes are an integral part of these financial statements.
| | | | | | |
| Statement of changes in net assets | | Wells Fargo Large Cap Core Fund | | | 15 | |
| | | | | | | | | | | | | | | | |
| | | Six months ended
January 31, 2019
(unaudited) | | | Year ended
July 31, 20181 | |
| | | |
Operations | | | | | | | | | | | | |
Net investment income | | | | | | $ | 8,872,997 | | | | | | | $ | 10,468,177 | |
Net realized gains on investments | | | | | | | 43,356,371 | | | | | | | | 93,764,997 | |
Net change in unrealized gains (losses) on investments | | | | | | | (125,896,735 | ) | | | | | | | 76,367,116 | |
| | | | |
Net increase (decrease) in net assets resulting from operations | | | | | | | (73,667,367 | ) | | | | | | | 180,600,290 | |
| | | | |
| | | | |
Distributions to shareholders from net investment income and net realized gains | | | | | | | | | | | | | | | | |
Class A | | | | | | | (37,574,345 | ) | | | | | | | (6,205,749 | ) |
Class C | | | | | | | (5,864,767 | ) | | | | | | | (697,513 | ) |
Class R | | | | | | | (218,389 | ) | | | | | | | (24,344 | ) |
Class R6 | | | | | | | (1,664,230 | ) | | | | | | | (13,463 | ) |
Administrator Class | | | | | | | (2,269,291 | ) | | | | | | | (646,297 | ) |
Institutional Class | | | | | | | (74,264,283 | ) | | | | | | | (14,330,177 | ) |
| | | | |
Total distributions to shareholders | | | | | | | (121,855,305 | ) | | | | | | | (21,917,543 | ) |
| | | | |
| | | | |
Capital share transactions | | | Shares | | | | | | | | Shares | | | | | |
Proceeds from shares sold | | | | | | | | | | | | | | | | |
Class A | | | 948,467 | | | | 17,871,076 | | | | 1,110,773 | | | | 22,158,115 | |
Class C | | | 292,683 | | | | 5,232,031 | | | | 379,357 | | | | 7,444,081 | |
Class R | | | 6,558 | | | | 120,789 | | | | 64,450 | | | | 1,271,370 | |
Class R6 | | | 104,741 | | | | 2,028,627 | | | | 768,314 | | | | 15,462,838 | |
Administrator Class | | | 28,526 | | | | 541,281 | | | | 183,497 | | | | 3,604,364 | |
Institutional Class | | | 5,677,817 | | | | 103,069,924 | | | | 7,081,551 | | | | 141,445,213 | |
| | | | |
| | | | |
| | | | | | | 128,863,728 | | | | | | | | 191,385,981 | |
| | | | |
Reinvestment of distributions | | | | | | | | | | | | | | | | |
Class A | | | 2,156,895 | | | | 36,026,156 | | | | 301,834 | | | | 5,924,919 | |
Class C | | | 305,503 | | | | 4,991,915 | | | | 30,164 | | | | 580,958 | |
Class R | | | 12,855 | | | | 214,625 | | | | 1,208 | | | | 23,747 | |
Class R6 | | | 23,922 | | | | 403,097 | | | | 644 | | | | 12,693 | |
Administrator Class | | | 133,494 | | | | 2,258,572 | | | | 31,853 | | | | 632,062 | |
Institutional Class | | | 4,092,477 | | | | 68,868,016 | | | | 658,543 | | | | 12,996,677 | |
| | | | |
| | | | |
| | | | | | | 112,762,381 | | | | | | | | 20,171,056 | |
| | | | |
Payment for shares redeemed | | | | | | | | | | | | | | | | |
Class A | | | (1,699,502 | ) | | | (32,065,018 | ) | | | (2,398,895 | ) | | | (47,209,115 | ) |
Class C | | | (530,867 | ) | | | (9,551,188 | ) | | | (828,652 | ) | | | (16,059,336 | ) |
Class R | | | (2,564 | ) | | | (46,682 | ) | | | (43,438 | ) | | | (851,162 | ) |
Class R6 | | | (143,866 | ) | | | (2,709,382 | ) | | | (48,034 | ) | | | (992,474 | ) |
Administrator Class | | | (269,644 | ) | | | (5,361,478 | ) | | | (768,837 | ) | | | (15,531,475 | ) |
Institutional Class | | | (7,229,912 | ) | | | (132,216,132 | ) | | | (9,084,266 | ) | | | (179,681,555 | ) |
| | | | |
| | | | |
| | | | | | | (181,949,880 | ) | | | | | | | (260,325,117 | ) |
| | | | |
Net increase (decrease) in net assets resulting from capital share transactions | | | | | | | 59,676,229 | | | | | | | | (48,768,080 | ) |
| | | | |
Total increase (decrease) in net assets | | | | | | | (135,846,443 | ) | | | | | | | 109,914,667 | |
| | | | |
| | |
Net assets | | | | | | | | |
Beginning of period | | | | | | | 1,156,031,509 | | | | | | | | 1,046,116,842 | |
| | | | |
End of period | | | | | | $ | 1,020,185,066 | | | | | | | $ | 1,156,031,509 | |
| | | | |
| 1 | Effective for all filings after November 4, 2018, the SEC prospectively eliminated the requirement to parenthetically disclose undistributed net investment income at the end of the period and permitted the aggregation of distributions, with the exception of tax basis returns of capital. Undistributed net investment income at July 31, 2018 was $5,856,737. The disaggregated distributions information for the year ended July 31, 2018 is included in Note 7,Distributions to Shareholders,in the notes to the financial statements. |
The accompanying notes are an integral part of these financial statements.
| | | | |
| 16 | | Wells Fargo Large Cap Core Fund | | Financial highlights |
(For a share outstanding throughout each period)
| | | | | | | | | | | | | | | | | | | | | | | | |
| | | Six months ended
January 31, 2019 (unaudited) | | | Year ended July 31 | |
| CLASS A | | 2018 | | | 2017 | | | 2016 | | | 2015 | | | 2014 | |
Net asset value, beginning of period | | | $20.82 | | | | $18.01 | | | | $15.13 | | | | $15.81 | | | | $14.30 | | | | $12.13 | |
Net investment income | | | 0.12 | | | | 0.15 | | | | 0.15 | | | | 0.10 | | | | 0.06 | | | | 0.06 | 1 |
Net realized and unrealized gains (losses) on investments | | | (1.55 | ) | | | 3.01 | | | | 2.85 | | | | (0.60 | ) | | | 1.50 | | | | 2.20 | |
| | | | | | | | | | | | | | | | | | | | | | | | |
Total from investment operations | | | (1.43 | ) | | | 3.16 | | | | 3.00 | | | | (0.50 | ) | | | 1.56 | | | | 2.26 | |
Distributions to shareholders from | | | | | | | | | | | | | | | | | | | | | | | | |
Net investment income | | | (0.16 | ) | | | (0.13 | ) | | | (0.12 | ) | | | (0.05 | ) | | | (0.05 | ) | | | (0.09 | ) |
Net realized gains | | | (2.05 | ) | | | (0.22 | ) | | | 0.00 | | | | (0.13 | ) | | | 0.00 | | | | 0.00 | |
| | | | | | | | | | | | | | | | | | | | | | | | |
Total distributions to shareholders | | | (2.21 | ) | | | (0.35 | ) | | | (0.12 | ) | | | (0.18 | ) | | | (0.05 | ) | | | (0.09 | ) |
Net asset value, end of period | | | $17.18 | | | | $20.82 | | | | $18.01 | | | | $15.13 | | | | $15.81 | | | | $14.30 | |
Total return2 | | | (6.46 | )% | | | 17.66 | % | | | 19.94 | % | | | (3.18 | )% | | | 10.99 | % | | | 18.58 | % |
Ratios to average net assets (annualized) | | | | | | | | | | | | | | | | | | | | | | | | |
Gross expenses | | | 1.18 | % | | | 1.18 | % | | | 1.19 | % | | | 1.20 | % | | | 1.26 | % | | | 1.29 | % |
Net expenses | | | 1.08 | % | | | 1.10 | % | | | 1.14 | % | | | 1.14 | % | | | 1.14 | % | | | 1.14 | % |
Net investment income | | | 1.42 | % | | | 0.73 | % | | | 0.82 | % | | | 0.80 | % | | | 0.35 | % | | | 0.47 | % |
Supplemental data | | | | | | | | | | | | | | | | | | | | | | | | |
Portfolio turnover rate | | | 20 | % | | | 33 | % | | | 50 | % | | | 51 | % | | | 44 | % | | | 61 | % |
Net assets, end of period (000s omitted) | | | $321,912 | | | | $360,937 | | | | $329,974 | | | | $359,971 | | | | $97,041 | | | | $26,685 | |
| 1 | Calculated based upon average shares outstanding |
| 2 | Total return calculations do not include any sales charges. Returns for periods of less than one year are not annualized. |
The accompanying notes are an integral part of these financial statements.
| | | | | | |
| Financial highlights | | Wells Fargo Large Cap Core Fund | | | 17 | |
(For a share outstanding throughout each period)
| | | | | | | | | | | | | | | | | | | | | | | | |
| | | Six months ended
January 31, 2019 (unaudited) | | | Year ended July 31 | |
| CLASS C | | 2018 | | | 2017 | | | 2016 | | | 2015 | | | 2014 | |
Net asset value, beginning of period | | | $20.44 | | | | $17.70 | | | | $14.87 | | | | $15.61 | | | | $14.17 | | | | $12.05 | |
Net investment income (loss) | | | 0.06 | | | | (0.00 | )1 | | | 0.00 | 2 | | | 0.00 | 2,3 | | | (0.06 | )3 | | | (0.01 | ) |
Net realized and unrealized gains (losses) on investments | | | (1.54 | ) | | | 2.96 | | | | 2.83 | | | | (0.61 | ) | | | 1.50 | | | | 2.15 | |
| | | | | | | | | | | | | | | | | | | | | | | | |
Total from investment operations | | | (1.48 | ) | | | 2.96 | | | | 2.83 | | | | (0.61 | ) | | | 1.44 | | | | 2.14 | |
Distributions to shareholders from | | | | | | | | | | | | | | | | | | | | | | | | |
Net investment income | | | 0.00 | | | | 0.00 | | | | 0.00 | | | | 0.00 | | | | 0.00 | | | | (0.02 | ) |
Net realized gains | | | (2.05 | ) | | | (0.22 | ) | | | 0.00 | | | | (0.13 | ) | | | 0.00 | | | | 0.00 | |
| | | | | | | | | | | | | | | | | | | | | | | | |
Total distributions to shareholders | | | (2.05 | ) | | | (0.22 | ) | | | 0.00 | | | | (0.13 | ) | | | 0.00 | | | | (0.02 | ) |
Net asset value, end of period | | | $16.91 | | | | $20.44 | | | | $17.70 | | | | $14.87 | | | | $15.61 | | | | $14.17 | |
Total return4 | | | (6.87 | )% | | | 16.78 | % | | | 19.03 | % | | | (3.90 | )% | | | 10.16 | % | | | 17.73 | % |
Ratios to average net assets (annualized) | | | | | | | | | | | | | | | | | | | | | | | | |
Gross expenses | | | 1.93 | % | | | 1.93 | % | | | 1.94 | % | | | 1.95 | % | | | 2.01 | % | | | 2.04 | % |
Net expenses | | | 1.83 | % | | | 1.85 | % | | | 1.89 | % | | | 1.89 | % | | | 1.89 | % | | | 1.89 | % |
Net investment income (loss) | | | 0.66 | % | | | (0.02 | )% | | | 0.07 | % | | | 0.02 | % | | | (0.38 | )% | | | (0.30 | )% |
Supplemental data | | | | | | | | | | | | | | | | | | | | | | | | |
Portfolio turnover rate | | | 20 | % | | | 33 | % | | | 50 | % | | | 51 | % | | | 44 | % | | | 61 | % |
Net assets, end of period (000s omitted) | | | $52,058 | | | | $61,529 | | | | $60,697 | | | | $71,512 | | | | $53,076 | | | | $8,624 | |
| 1 | Amount is more than $(0.005). |
| 2 | Amount is less than $0.005. |
| 3 | Calculated based upon average shares outstanding |
| 4 | Total return calculations do not include any sales charges. Returns for periods of less than one year are not annualized. |
The accompanying notes are an integral part of these financial statements.
| | | | |
| 18 | | Wells Fargo Large Cap Core Fund | | Financial highlights |
(For a share outstanding throughout each period)
| | | | | | | | | | | | | | | | |
| | | Six months ended
January 31, 2019 (unaudited) | | | Year ended July 31 | |
| CLASS R | | 2018 | | | 2017 | | | 20161 | |
Net asset value, beginning of period | | | $20.81 | | | | $18.04 | | | | $15.17 | | | | $14.66 | |
Net investment income | | | 0.10 | | | | 0.12 | | | | 0.13 | | | | 0.06 | |
Net realized and unrealized gains (losses) on investments | | | (1.55 | ) | | | 2.99 | | | | 2.84 | | | | 0.66 | |
| | | | | | | | | | | | | | | | |
Total from investment operations | | | (1.45 | ) | | | 3.11 | | | | 2.97 | | | | 0.72 | |
Distributions to shareholders from | | | | | | | | | | | | | | | | |
Net investment income | | | (0.11 | ) | | | (0.12 | ) | | | (0.10 | ) | | | (0.08 | ) |
Net realized gains | | | (2.05 | ) | | | (0.22 | ) | | | 0.00 | | | | (0.13 | ) |
| | | | | | | | | | | | | | | | |
Total distributions to shareholders | | | (2.16 | ) | | | (0.34 | ) | | | (0.10 | ) | | | (0.21 | ) |
Net asset value, end of period | | | $17.20 | | | | $20.81 | | | | $18.04 | | | | $15.17 | |
Total return2 | | | (6.57 | )% | | | 17.37 | % | | | 19.64 | % | | | 4.90 | % |
Ratios to average net assets (annualized) | | | | | | | | | | | | | | | | |
Gross expenses | | | 1.43 | % | | | 1.43 | % | | | 1.44 | % | | | 1.46 | % |
Net expenses | | | 1.33 | % | | | 1.34 | % | | | 1.39 | % | | | 1.39 | % |
Net investment income | | | 1.18 | % | | | 0.48 | % | | | 0.51 | % | | | 0.52 | % |
Supplemental data | | | | | | | | | | | | | | | | |
Portfolio turnover rate | | | 20 | % | | | 33 | % | | | 50 | % | | | 51 | % |
Net assets, end of period (000s omitted) | | | $1,977 | | | | $2,042 | | | | $1,369 | | | | $26 | |
| 1 | For the period from September 30, 2015 (commencement of class operations) to July 31, 2016 |
| 2 | Returns for periods of less than one year are not annualized. |
The accompanying notes are an integral part of these financial statements.
| | | | | | |
| Financial highlights | | Wells Fargo Large Cap Core Fund | | | 19 | |
(For a share outstanding throughout each period)
| | | | | | | | | | | | | | | | |
| | | Six months ended
January 31, 2019 (unaudited) | | | Year ended July 31 | |
| CLASS R6 | | 2018 | | | 2017 | | | 20161 | |
Net asset value, beginning of period | | | $20.92 | | | | $18.09 | | | | $15.24 | | | | $14.66 | |
Net investment income | | | 0.18 | | | | 0.22 | 2 | | | 0.25 | 2 | | | 0.20 | |
Net realized and unrealized gains (losses) on investments | | | (1.59 | ) | | | 3.04 | | | | 3.33 | | | | 0.62 | |
| | | | | | | | | | | | | | | | |
Total from investment operations | | | (1.41 | ) | | | 3.26 | | | | 3.58 | | | | 0.82 | |
Distributions to shareholders from | | | | | | | | | | | | | | | | |
Net investment income | | | (0.23 | ) | | | (0.21 | ) | | | (0.73 | ) | | | (0.11 | ) |
Net realized gains | | | (2.05 | ) | | | (0.22 | ) | | | 0.00 | | | | (0.13 | ) |
| | | | | | | | | | | | | | | | |
Total distributions to shareholders | | | (2.28 | ) | | | (0.43 | ) | | | (0.73 | ) | | | (0.24 | ) |
Net asset value, end of period | | | $17.23 | | | | $20.92 | | | | $18.09 | | | | $15.24 | |
Total return3 | | | (6.28 | )% | | | 18.16 | % | | | 24.01 | % | | | 5.57 | % |
Ratios to average net assets (annualized) | | | | | | | | | | | | | | | | |
Gross expenses | | | 0.75 | % | | | 0.75 | % | | | 0.76 | % | | | 0.77 | % |
Net expenses | | | 0.65 | % | | | 0.65 | % | | | 0.68 | % | | | 0.68 | % |
Net investment income | | | 1.82 | % | | | 1.08 | % | | | 1.62 | % | | | 1.31 | % |
Supplemental data | | | | | | | | | | | | | | | | |
Portfolio turnover rate | | | 20 | % | | | 33 | % | | | 50 | % | | | 51 | % |
Net assets, end of period (000s omitted) | | | $12,278 | | | | $15,225 | | | | $122 | | | | $2,449 | |
| 1 | For the period from September 30, 2015 (commencement of class operations) to July 31, 2016 |
| 2 | Calculated based upon average shares outstanding |
| 3 | Returns for periods of less than one year are not annualized. |
The accompanying notes are an integral part of these financial statements.
| | | | |
| 20 | | Wells Fargo Large Cap Core Fund | | Financial highlights |
(For a share outstanding throughout each period)
| | | | | | | | | | | | | | | | | | | | | | | | |
| | | Six months ended
January 31, 2019 (unaudited) | | | Year ended July 31 | |
| ADMINISTRATOR CLASS | | 2018 | | | 2017 | | | 2016 | | | 2015 | | | 2014 | |
Net asset value, beginning of period | | | $21.05 | | | | $18.21 | | | | $15.18 | | | | $15.87 | | | | $14.34 | | | | $12.16 | |
Net investment income | | | 0.15 | 1 | | | 0.17 | 1 | | | 0.16 | 1 | | | 0.15 | | | | 0.10 | | | | 0.09 | |
Net realized and unrealized gains (losses) on investments | | | (1.59 | ) | | | 3.05 | | | | 2.87 | | | | (0.62 | ) | | | 1.50 | | | | 2.20 | |
| | | | | | | | | | | | | | | | | | | | | | | | |
Total from investment operations | | | (1.44 | ) | | | 3.22 | | | | 3.03 | | | | (0.47 | ) | | | 1.60 | | | | 2.29 | |
Distributions to shareholders from | | | | | | | | | | | | | | | | | | | | | | | | |
Net investment income | | | (0.17 | ) | | | (0.16 | ) | | | (0.00 | )2 | | | (0.09 | ) | | | (0.07 | ) | | | (0.11 | ) |
Net realized gains | | | (2.05 | ) | | | (0.22 | ) | | | 0.00 | | | | (0.13 | ) | | | 0.00 | | | | 0.00 | |
| | | | | | | | | | | | | | | | | | | | | | | | |
Total distributions to shareholders | | | (2.22 | ) | | | (0.38 | ) | | | (0.00 | )2 | | | (0.22 | ) | | | (0.07 | ) | | | (0.11 | ) |
Net asset value, end of period | | | $17.39 | | | | $21.05 | | | | $18.21 | | | | $15.18 | | | | $15.87 | | | | $14.34 | |
Total return3 | | | (6.43 | )% | | | 17.81 | % | | | 19.99 | % | | | (2.98 | )% | | | 11.28 | % | | | 18.83 | % |
Ratios to average net assets (annualized) | | | | | | | | | | | | | | | | | | | | | | | | |
Gross expenses | | | 1.10 | % | | | 1.10 | % | | | 1.10 | % | | | 1.12 | % | | | 1.11 | % | | | 1.11 | % |
Net expenses | | | 0.97 | % | | | 0.98 | % | | | 1.00 | % | | | 0.96 | % | | | 0.90 | % | | | 0.90 | % |
Net investment income | | | 1.50 | % | | | 0.86 | % | | | 1.00 | % | | | 0.95 | % | | | 0.61 | % | | | 0.63 | % |
Supplemental data | | | | | | | | | | | | | | | | | | | | | | | | |
Portfolio turnover rate | | | 20 | % | | | 33 | % | | | 50 | % | | | 51 | % | | | 44 | % | | | 61 | % |
Net assets, end of period (000s omitted) | | | $19,149 | | | | $25,444 | | | | $32,091 | | | | $57,879 | | | | $83,692 | | | | $6,849 | |
| 1 | Calculated based upon average shares outstanding |
| 2 | Amount is less than $0.005. |
| 3 | Returns for periods of less than one year are not annualized. |
The accompanying notes are an integral part of these financial statements.
| | | | | | |
| Financial highlights | | Wells Fargo Large Cap Core Fund | | | 21 | |
(For a share outstanding throughout each period)
| | | | | | | | | | | | | | | | | | | | | | | | |
| | | Six months ended
January 31, 2019 (unaudited) | | | Year ended July 31 | |
| INSTITUTIONAL CLASS | | 2018 | | | 2017 | | | 2016 | | | 2015 | | | 2014 | |
Net asset value, beginning of period | | | $20.95 | | | | $18.12 | | | | $15.23 | | | | $15.91 | | | | $14.35 | | | | $12.16 | |
Net investment income | | | 0.17 | | | | 0.23 | | | | 0.18 | | | | 0.18 | 1 | | | 0.14 | 1 | | | 0.11 | 1 |
Net realized and unrealized gains (losses) on investments | | | (1.57 | ) | | | 3.03 | | | | 2.91 | | | | (0.62 | ) | | | 1.50 | | | | 2.21 | |
| | | | | | | | | | | | | | | | | | | | | | | | |
Total from investment operations | | | (1.40 | ) | | | 3.26 | | | | 3.09 | | | | (0.44 | ) | | | 1.64 | | | | 2.32 | |
Distributions to shareholders from | | | | | | | | | | | | | | | | | | | | | | | | |
Net investment income | | | (0.24 | ) | | | (0.21 | ) | | | (0.20 | ) | | | (0.11 | ) | | | (0.08 | ) | | | (0.13 | ) |
Net realized gains | | | (2.05 | ) | | | (0.22 | ) | | | 0.00 | | | | (0.13 | ) | | | 0.00 | | | | 0.00 | |
| | | | | | | | | | | | | | | | | | | | | | | | |
Total distributions to shareholders | | | (2.29 | ) | | | (0.43 | ) | | | (0.20 | ) | | | (0.24 | ) | | | (0.08 | ) | | | (0.13 | ) |
Net asset value, end of period | | | $17.26 | | | | $20.95 | | | | $18.12 | | | | $15.23 | | | | $15.91 | | | | $14.35 | |
Total return2 | | | (6.26 | )% | | | 18.16 | % | | | 20.43 | % | | | (2.75 | )% | | | 11.51 | % | | | 19.21 | % |
Ratios to average net assets (annualized) | | | | | | | | | | | | | | | | | | | | | | | | |
Gross expenses | | | 0.85 | % | | | 0.85 | % | | | 0.86 | % | | | 0.87 | % | | | 0.84 | % | | | 0.85 | % |
Net expenses | | | 0.67 | % | | | 0.68 | % | | | 0.70 | % | | | 0.70 | % | | | 0.66 | % | | | 0.66 | % |
Net investment income | | | 1.82 | % | | | 1.15 | % | | | 1.23 | % | | | 1.22 | % | | | 0.86 | % | | | 0.83 | % |
Supplemental data | | | | | | | | | | | | | | | | | | | | | | | | |
Portfolio turnover rate | | | 20 | % | | | 33 | % | | | 50 | % | | | 51 | % | | | 44 | % | | | 61 | % |
Net assets, end of period (000s omitted) | | | $612,810 | | | | $690,855 | | | | $621,864 | | | | $412,678 | | | | $63,235 | | | | $5,775 | |
| 1 | Calculated based upon average shares outstanding |
| 2 | Returns for periods of less than one year are not annualized. |
The accompanying notes are an integral part of these financial statements.
| | | | |
| 22 | | Wells Fargo Large Cap Core Fund | | Notes to financial statements (unaudited) |
1. ORGANIZATION
Wells Fargo Funds Trust (the “Trust”), a Delaware statutory trust organized on March 10, 1999, is an open-end management investment company registered under the Investment Company Act of 1940, as amended (the “1940 Act”). As an investment company, the Trust follows the accounting and reporting guidance in Financial Accounting Standards Board (“FASB”) Accounting Standards Codification Topic 946, Financial Services – Investment Companies. These financial statements report on the Wells Fargo Large Cap Core Fund (the “Fund”) which is a diversified series of the Trust.
2. SIGNIFICANT ACCOUNTING POLICIES
The following significant accounting policies, which are consistently followed in the preparation of the financial statements of the Fund, are in conformity with U.S. generally accepted accounting principles which require management to make estimates and assumptions that affect the reported amounts of assets and liabilities, disclosure of contingent assets and liabilities at the date of the financial statements, and the reported amounts of revenues and expenses during the reporting period. Actual results could differ from those estimates.
Securities valuation
All investments are valued each business day as of the close of regular trading on the New York Stock Exchange (generally 4 p.m. Eastern Time), although the Fund may deviate from this calculation time under unusual or unexpected circumstances.
Equity securities that are listed on a foreign or domestic exchange or market are valued at the official closing price or, if none, the last sales price. If no sale occurs on the principal exchange or market that day, a fair value price will be determined in accordance with the Fund’s Valuation Procedures.
Investments in registered open-end investment companies are valued at net asset value. Interests in non-registered investment companies that are redeemable at net asset value are fair valued normally at net asset value.
Investments which are not valued using any of the methods discussed above are valued at their fair value, as determined in good faith by the Board of Trustees of the Fund. The Board of Trustees has established a Valuation Committee comprised of the Trustees and has delegated to it the authority to take any actions regarding the valuation of portfolio securities that the Valuation Committee deems necessary or appropriate, including determining the fair value of portfolio securities, unless the determination has been delegated to the Wells Fargo Asset Management Pricing Committee at Wells Fargo Funds Management, LLC (“Funds Management”). The Board of Trustees retains the authority to make or ratify any valuation decisions or approve any changes to the Valuation Procedures as it deems appropriate. On a quarterly basis, the Board of Trustees receives reports on any valuation actions taken by the Valuation Committee or the Wells Fargo Asset Management Pricing Committee which may include items for ratification.
Securities lending
The Fund may lend its securities from time to time in order to earn additional income in the form of fees or interest on securities received as collateral or the investment of any cash received as collateral. The Fund continues to receive interest or dividends on the securities loaned. The Fund receives collateral in the form of cash or securities with a value at least equal to the value of the securities on loan. The value of the loaned securities is determined at the close of each business day and any additional required collateral is delivered to the Fund on the next business day. In a securities lending transaction, the net asset value of the Fund will be affected by an increase or decrease in the value of the securities loaned and by an increase or decrease in the value of the instrument in which collateral is invested. The amount of securities lending activity undertaken by the Fund fluctuates from time to time. In the event of default or bankruptcy by the borrower, the Fund may be prevented from recovering the loaned securities or gaining access to the collateral or may experience delays or costs in doing so. In addition, the investment of any cash collateral received may lose all or part of its value. The Fund has the right under the lending agreement to recover the securities from the borrower on demand.
The Fund lends its securities through an unaffiliated securities lending agent. Cash collateral received in connection with its securities lending transactions is invested in Securities Lending Cash Investments, LLC (the “Securities Lending Fund”). The Securities Lending Fund is exempt from registration under Section 3(c)(7) of the 1940 Act and is managed by Funds Management and is subadvised by Wells Capital Management Incorporated (“WellsCap”), an affiliate of Funds Management and an indirect wholly owned subsidiary of Wells Fargo & Company (“Wells Fargo”). Funds Management receives an advisory fee starting at 0.05% and declining to 0.01% as the average daily net assets of the Securities Lending Fund increase. All of the fees received by Funds Management are paid to WellsCap for its services as subadviser. The Securities Lending Fund seeks to provide a positive return compared to the daily Fed Funds Open Rate by investing in high-quality, U.S. dollar-denominated short-term money market instruments. Securities Lending Fund investments are valued at the evaluated bid price provided by an independent pricing service. Income earned from investment in the Securities Lending Fund (net of fees and rebates), if any, is included in income from affiliated securities on the Statement of Operations.
| | | | | | |
| Notes to financial statements (unaudited) | | Wells Fargo Large Cap Core Fund | | | 23 | |
Security transactions and income recognition
Securities transactions are recorded on a trade date basis. Realized gains or losses are recorded on the basis of identified cost.
Dividend income is recognized on the ex-dividend date.
Distributions to shareholders
Distributions to shareholders from net investment income and any net realized gains are recorded on the ex-dividend date and paid at least annually. Such distributions are determined in accordance with income tax regulations and may differ from U.S. generally accepted accounting principles. Dividend sources are estimated at the time of declaration. The tax character of distributions is determined as of the Fund’s fiscal year end. Therefore, a portion of the Fund’s distributions made prior to the Fund’s fiscal year end may be categorized as a tax return of capital at year end.
Federal and other taxes
The Fund intends to continue to qualify as a regulated investment company by distributing substantially all of its investment company taxable income and any net realized capital gains (after reduction for capital loss carryforwards) sufficient to relieve it from all, or substantially all, federal income taxes. Accordingly, no provision for federal income taxes was required.
The Fund’s income and federal excise tax returns and all financial records supporting those returns for the prior three fiscal years are subject to examination by the federal and Delaware revenue authorities. Management has analyzed the Fund’s tax positions taken on federal, state, and foreign tax returns for all open tax years and does not believe that there are any uncertain tax positions that require recognition of a tax liability.
As of January 31, 2019, the aggregate cost of all investments for federal income tax purposes was $829,766,698 and the unrealized gains (losses) consisted of:
| | | | |
| |
Gross unrealized gains | | $ | 226,930,430 | |
| |
Gross unrealized losses | | | (36,974,358 | ) |
| |
Net unrealized gains | | $ | 189,956,072 | |
Class allocations
The separate classes of shares offered by the Fund differ principally in applicable sales charges, distribution, shareholder servicing, and administration fees. Class specific expenses are charged directly to that share class. Investment income, common expenses, and realized and unrealized gains (losses) on investments are allocated daily to each class of shares based on the relative proportion of net assets of each class.
3. FAIR VALUATION MEASUREMENTS
Fair value measurements of investments are determined within a framework that has established a fair value hierarchy based upon the various data inputs utilized in determining the value of the Fund’s investments. The three-level hierarchy gives the highest priority to unadjusted quoted prices in active markets for identical assets or liabilities (Level 1) and the lowest priority to unobservable inputs (Level 3). The Fund’s investments are classified within the fair value hierarchy based on the lowest level of input that is significant to the fair value measurement. The inputs are summarized into three broad levels as follows:
| ∎ | | Level 1 – quoted prices in active markets for identical securities |
| ∎ | | Level 2 – other significant observable inputs (including quoted prices for similar securities, interest rates, prepayment speeds, credit risk, etc.) |
| ∎ | | Level 3 – significant unobservable inputs (including the Fund’s own assumptions in determining the fair value of investments) |
The inputs or methodologies used for valuing investments in securities are not necessarily an indication of the risk associated with investing in those securities.
| | | | |
| 24 | | Wells Fargo Large Cap Core Fund | | Notes to financial statements (unaudited) |
The following is a summary of the inputs used in valuing the Fund’s assets and liabilities as of January 31, 2019:
| | | | | | | | | | | | | | | | |
| | | | |
| | | Quoted prices
(Level 1) | | | Other significant
observable inputs
(Level 2) | | | Significant
unobservable inputs (Level 3) | | | Total | |
| | | | |
Assets | | | | | | | | | | | | | | | | |
Investments in: | | | | | | | | | | | | | | | | |
| | | | |
Common stocks | | | | | | | | | | | | | | | | |
| | | | |
Communication services | | $ | 21,318,202 | | | $ | 0 | | | $ | 0 | | | $ | 21,318,202 | |
| | | | |
Consumer discretionary | | | 102,666,899 | | | | 0 | | | | 0 | | | | 102,666,899 | |
| | | | |
Consumer staples | | | 63,101,911 | | | | 0 | | | | 0 | | | | 63,101,911 | |
| | | | |
Energy | | | 71,577,265 | | | | 0 | | | | 0 | | | | 71,577,265 | |
| | | | |
Financials | | | 119,273,227 | | | | 0 | | | | 0 | | | | 119,273,227 | |
| | | | |
Health care | | | 179,073,154 | | | | 0 | | | | 0 | | | | 179,073,154 | |
| | | | |
Industrials | | | 91,813,195 | | | | 0 | | | | 0 | | | | 91,813,195 | |
| | | | |
Information technology | | | 240,068,622 | | | | 0 | | | | 0 | | | | 240,068,622 | |
| | | | |
Materials | | | 39,031,981 | | | | 0 | | | | 0 | | | | 39,031,981 | |
| | | | |
Real estate | | | 62,348,871 | | | | 0 | | | | 0 | | | | 62,348,871 | |
| | | | |
Utilities | | | 18,898,613 | | | | 0 | | | | 0 | | | | 18,898,613 | |
| | | | |
Short-term investments | | | | | | | | | | | | | | | | |
| | | | |
Investment companies | | | 10,550,830 | | | | 0 | | | | 0 | | | | 10,550,830 | |
| | | | |
Total assets | | $ | 1,019,722,770 | | | $ | 0 | | | $ | 0 | | | $ | 1,019,722,770 | |
Additional sector, industry or geographic detail is included in the Portfolio of Investments.
At January 31, 2019, the Fund did not have any transfers into/out of Level 3.
4. TRANSACTIONS WITH AFFILIATES
Management fee
Funds Management, an indirect wholly owned subsidiary of Wells Fargo, is the manager of the Fund and provides advisory and fund-level administrative services under an investment management agreement. Under the investment management agreement, Funds Management is responsible for, among other services, implementing the investment objectives and strategies of the Fund, supervising the subadviser and providing fund-level administrative services in connection with the Fund’s operations. As compensation for its services under the investment management agreement, Funds Management is entitled to receive an annual management fee starting at 0.70% and declining to 0.505% as the average daily net assets of the Fund increase. For the six months ended January 31, 2019, the management fee was equivalent to an annual rate of 0.68% of the Fund’s average daily net assets.
Funds Management has retained the services of a subadviser to provide daily portfolio management to the Fund. The fee for subadvisory services is borne by Funds Management. WellsCap is the subadviser to the Fund and is entitled to receive a fee from Funds Management at an annual rate starting at 0.35% and declining to 0.30% as the average daily net assets of the Fund increase.
Administration fees
Under a class-level administration agreement, Funds Management provides class-level administrative services to the Fund, which includes paying fees and expenses for services provided by the transfer agent, sub-transfer agents, omnibus account servicers and record-keepers. As compensation for its services under the class-level administration agreement, Funds Management receives an annual fee which is calculated based on the average daily net assets of each class as follows:
| | | | |
| |
| | | Class-level
administration fee | |
| |
Class A, Class C, Class R | | | 0.21 | % |
| |
Class R6 | | | 0.03 | |
| |
Administrator Class, Institutional Class | | | 0.13 | |
| | | | | | |
| Notes to financial statements (unaudited) | | Wells Fargo Large Cap Core Fund | | | 25 | |
Funds Management has contractually waived and/or reimbursed management and administration fees to the extent necessary to maintain certain net operating expense ratios for the Fund. When each class of the Fund has exceeded its expense cap, Funds Management has waived fees and/or reimbursed expenses from fund level expenses on a proportionate basis and then from class specific expenses; otherwise, waivers and/or reimbursements are applied against class specific expenses before fund level expenses. Funds Management has committed through November 30, 2019 to waive fees and/or reimburse expenses to the extent necessary to cap the Fund’s expenses at 1.08% for Class A shares, 1.83% for Class C shares, 1.33% for Class R shares, 0.65% for Class R6 shares, 0.97% for Administrator Class shares, and 0.67% for Institutional Class shares. Prior to or after the commitment expiration date, the cap may be increased or the commitment to maintain the cap may be terminated only with the approval of the Board of Trustees.
Distribution fees
The Trust has adopted a distribution plan for Class C and Class R shares of the Fund pursuant to Rule 12b-1 under the 1940 Act. Distribution fees are charged to Class C and Class R shares and paid to Wells Fargo Funds Distributor, LLC (“Funds Distributor”), the principal underwriter, at an annual rate of 0.75% of the average daily net assets of Class C shares and 0.25% of the average daily net assets of Class R shares.
In addition, Funds Distributor is entitled to receive the front-end sales charge from the purchase of Class A shares and a contingent deferred sales charge on the redemption of certain Class A shares. Funds Distributor is also entitled to receive the contingent deferred sales charges from redemptions of Class C shares. For the six months ended January 31, 2019, Funds Distributor received $6,900 from the sale of Class A shares. No contingent deferred sales charges were incurred by Class A and Class C shares for the six months ended January 31, 2019.
Shareholder servicing fees
The Trust has entered into contracts with one or more shareholder servicing agents, whereby Class A, Class C, Class R, and Administrator Class of the Fund are charged a fee at an annual rate of 0.25% of the average daily net assets of each respective class.
A portion of these total shareholder servicing fees were paid to affiliates of Wells Fargo.
Interfund transactions
The Fund may purchase or sell portfolio investment securities to certain other Wells Fargo affiliates pursuant to Rule 17a-7 under the 1940 Act and under procedures adopted by the Board of Trustees. The procedures have been designed to ensure that these interfund transactions, which do not incur broker commissions, are effected at current market prices.
5. INVESTMENT PORTFOLIO TRANSACTIONS
Purchases and sales of investments, excluding U.S. government obligations (if any) and short-term securities, for the six months ended January 31, 2019 were $212,010,530 and $263,522,576, respectively.
6. BANK BORROWINGS
The Trust (excluding the money market funds), Wells Fargo Master Trust and Wells Fargo Variable Trust are parties to a $280,000,000 revolving credit agreement whereby the Fund is permitted to use bank borrowings for temporary or emergency purposes, such as to fund shareholder redemption requests. Interest under the credit agreement is charged to the Fund based on a borrowing rate equal to the higher of the Federal Funds rate in effect on that day plus 1.25% or the overnight LIBOR rate in effect on that day plus 1.25%. In addition, an annual commitment fee equal to 0.25% of the unused balance is allocated to each participating fund.
During the six months ended January 31, 2019, the Fund had average borrowings outstanding of $16,897 (on an annualized basis) at an average rate of 3.48% and paid interest in the amount of $588.
| | | | |
| 26 | | Wells Fargo Large Cap Core Fund | | Notes to financial statements (unaudited) |
7. DISTRIBUTIONS TO SHAREHOLDERS
Effective for all filings after November 4, 2018, the Securities and Exchange Commission eliminated the requirement to separately state the components of distributions to shareholders under U.S. generally accepted accounting principles. The amounts of distributions to shareholders for the year ended July 31, 2018 were as follows:
| | | | | | | | |
| | |
| | | Net investment
income | | | Net realized
gains | |
| | |
Class A | | $ | 2,344,339 | | | $ | 3,861,410 | |
| | |
Class C | | | 0 | | | | 697,513 | |
| | |
Class R | | | 8,939 | | | | 15,405 | |
| | |
Class R6 | | | 6,623 | | | | 6,840 | |
| | |
Administrator Class | | | 275,902 | | | | 370,395 | |
| | |
Institutional Class | | | 7,110,676 | | | | 7,219,501 | |
8. INDEMNIFICATION
Under the Trust’s organizational documents, the officers and Trustees have been granted certain indemnification rights against certain liabilities that may arise out of performance of their duties to the Trust. Additionally, in the normal course of business, the Trust may enter into contracts with service providers that contain a variety of indemnification clauses. The Trust’s maximum exposure under these arrangements is dependent on future claims that may be made against the Fund and, therefore, cannot be estimated.
9. NEW ACCOUNTING PRONOUNCEMENT
In August 2018, FASB issued Accounting Standards Update (“ASU”) No. 2018-13, Fair Value Measurement (Topic 820)Disclosure Framework—Changes to the Disclosure Requirements for Fair Value Measurement. ASU 2018-13 updates the disclosure requirements for fair value measurements by modifying or removing certain disclosures and adding certain new disclosures. The amendments are effective for fiscal years, and interim periods within those fiscal years, beginning after December 15, 2019. Early adoption is permitted. Management has adopted the removal and modification of disclosures early, as permitted, and will adopt the additional new disclosures at the effective date.
| | | | | | |
| Other information (unaudited) | | Wells Fargo Large Cap Core Fund | | | 27 | |
PROXY VOTING INFORMATION
A description of the policies and procedures used to determine how to vote proxies relating to portfolio securities is available, upon request, by calling1-800-222-8222, visiting our website atwellsfargofunds.com, or visiting the SEC website at sec.gov. Information regarding how the Fund voted proxies relating to portfolio securities during the most recent 12-month period ended June 30 is available on the Fund’s website atwellsfargofunds.comor by visiting the SEC website at sec.gov.
PORTFOLIO HOLDINGS INFORMATION
The complete portfolio holdings for the Fund are publicly available monthly on the Fund’s website (wellsfargofunds.com), on a one-month delayed basis. In addition, top ten holdings information (excluding derivative positions) for the Fund is publicly available on the Fund’s website on a monthly, seven-day or more delayed basis. The Fund files its complete schedule of portfolio holdings with the SEC for the first and third quarters of each fiscal year on Form N-Q, which is available by visiting the SEC website at sec.gov. In addition, the Fund’s Form N-Q may be reviewed and copied at the SEC’s Public Reference Room in Washington, DC, and at regional offices in New York City, at 233 Broadway, and in Chicago, at 175 West Jackson Boulevard, Suite 900. Information about the Public Reference Room may be obtained by calling 1-800-SEC-0330.
| | | | |
| 28 | | Wells Fargo Large Cap Core Fund | | Other information (unaudited) |
BOARD OF TRUSTEES AND OFFICERS
Each of the Trustees and Officers1 listed in the table below acts in identical capacities for each fund in the Wells Fargo family of funds, which consists of 152 mutual funds comprising the Wells Fargo Funds Trust, Wells Fargo Variable Trust, Wells Fargo Master Trust and four closed-end funds (collectively the “Fund Complex”). This table should be read in conjunction with the Prospectus and the Statement of Additional Information2. The mailing address of each Trustee and Officer is 525 Market Street, 12th Floor, San Francisco, CA 94105. Each Trustee and Officer serves an indefinite term, however, each Trustee serves such term until reaching the mandatory retirement age established by the Trustees.
Independent Trustees
| | | | | | |
Name and
year of birth | | Position held and
length of service* | | Principal occupations during past five years or longer | | Current other
public company or
investment company
directorships |
| | | |
William R. Ebsworth (Born 1957) | | Trustee, since 2015 | | Retired. From 1984 to 2013, equities analyst, portfolio manager, research director and chief investment officer at Fidelity Management and Research Company in Boston, Tokyo, and Hong Kong, and retired in 2013 as Chief Investment Officer of Fidelity Strategic Advisers, Inc. where he led a team of investment professionals managing client assets. Prior thereto, Board member of Hong Kong Securities Clearing Co., Hong Kong Options Clearing Corp., the Thailand International Fund, Ltd., Fidelity Investments Life Insurance Company, and Empire Fidelity Investments Life Insurance Company. Audit Committee Chair and Investment Committee Chair of the Vincent Memorial Hospital Endowment (non-profit organization). Mr. Ebsworth is a CFA® charterholder. | | N/A |
| | | |
Jane A. Freeman (Born 1953) | | Trustee, since 2015; Chair Liaison, since 2018 | | Retired. From 2012 to 2014 and 1999 to 2008, Chief Financial Officer of Scientific Learning Corporation. From 2008 to 2012, Ms. Freeman provided consulting services related to strategic business projects. Prior to 1999, Portfolio Manager at Rockefeller & Co. and Scudder, Stevens & Clark. Board member of the Harding Loevner Funds from 1996 to 2014, serving as both Lead Independent Director and chair of the Audit Committee. Board member of the Russell Exchange Traded Funds Trust from 2011 to 2012 and the chair of the Audit Committee. Ms. Freeman is a Board Member of The Ruth Bancroft Garden (non-profit organization). She is also an inactive Chartered Financial Analyst. | | N/A |
| | | |
Isaiah Harris, Jr.3 (Born 1952) | | Trustee, since 2009; Audit Committee Chairman, since 2019 | | Retired. Chairman of the Board of CIGNA Corporation since 2009, and Director since 2005. From 2003 to 2011, Director of Deluxe Corporation. Prior thereto, President and CEO of BellSouth Advertising and Publishing Corp. from 2005 to 2007, President and CEO of BellSouth Enterprises from 2004 to 2005 and President of BellSouth Consumer Services from 2000 to 2003. Emeritus member of the Iowa State University Foundation Board of Governors. Emeritus Member of the Advisory Board of Iowa State University School of Business. Advisory Board Member, Palm Harbor Academy (private school). Advisory Board Member, Child Evangelism Fellowship (non-profit). Mr. Harris is a certified public accountant (inactive status). | | CIGNA Corporation |
| | | |
Judith M. Johnson3 (Born 1949) | | Trustee, since 2008; Audit Committee Chairman, from 2009 to 2018 | | Retired. Prior thereto, Chief Executive Officer and Chief Investment Officer of Minneapolis Employees Retirement Fund from 1996 to 2008. Ms. Johnson is an attorney, certified public accountant and a certified managerial accountant. | | N/A |
| | | |
David F. Larcker (Born 1950) | | Trustee, since 2009 | | James Irvin Miller Professor of Accounting at the Graduate School of Business, Stanford University, Director of the Corporate Governance Research Initiative and Senior Faculty of The Rock Center for Corporate Governance since 2006. From 2005 to 2008, Professor of Accounting at the Graduate School of Business, Stanford University. Prior thereto, Ernst & Young Professor of Accounting at The Wharton School, University of Pennsylvania from 1985 to 2005. | | N/A |
| | | | | | |
| Other information (unaudited) | | Wells Fargo Large Cap Core Fund | | | 29 | |
| | | | | | |
Name and
year of birth | | Position held and
length of service* | | Principal occupations during past five years or longer | | Current other
public company or
investment company
directorships |
| | | |
Olivia S. Mitchell (Born 1953) | | Trustee, since 2006; Nominating and Governance Committee Chairman, since 2018 | | International Foundation of Employee Benefit Plans Professor, Wharton School of the University of Pennsylvania since 1993. Director of Wharton’s Pension Research Council and Boettner Center on Pensions & Retirement Research, and Research Associate at the National Bureau of Economic Research. Previously, Cornell University Professor from 1978 to 1993. | | N/A |
| | | |
Timothy J. Penny (Born 1951) | | Trustee, since 1996; Chairman, since 2018; Vice Chairman, from 2017 to 2018 | | President and Chief Executive Officer of Southern Minnesota Initiative Foundation, a non-profit organization, since 2007. Member of the Board of Trustees of NorthStar Education Finance, Inc., a non-profit organization, since 2007. | | N/A |
| | | |
James G. Polisson (Born 1959) | | Trustee, since 2018; Advisory Board Member, from 2017 to 2018 | | Retired. Chief Marketing Officer, Source (ETF) UK Services, Ltd, from 2015 to 2017. From 2012 to 2015, Principal of The Polisson Group, LLC, a management consulting, corporate advisory and principal investing company. Chief Executive Officer and Managing Director at Russell Investments, Global Exchange Traded Funds from 2010 to 2012. Managing Director of Barclays Global Investors from 1998 to 2010 and Global Chief Marketing Officer for iShares and Barclays Global Investors from 2000 to 2010. Trustee of the San Francisco Mechanics’ Institute, a non-profit organization, from 2013 to 2015. Board member of the Russell Exchange Traded Fund Trust from 2011 to 2012. Director of Barclays Global Investors Holdings Deutschland GmbH from 2006 to 2009. Mr. Polisson is an attorney and has a retired status with the Massachusetts and District of Columbia Bar Associations. | | N/A |
| | | |
Pamela Wheelock (Born 1959) | | Trustee, since 2018; Advisory Board Member, from 2017 to 2018 | | Board member of the Destination Medical Center Economic Development Agency, Rochester, Minnesota since 2019. Chief Operating Officer, Twin Cities Habitat for Humanity from 2017 to 2019. Vice President of University Services, University of Minnesota from 2012 to 2016. Prior thereto, on the Board of Directors, Governance Committee and Finance Committee for the Minnesota Philanthropy Partners (Saint Paul Foundation) from 2012 to 2018, Interim Chief Executive Officer of Blue Cross Blue Shield of Minnesota from 2011 to 2012, Chairman of the Board from 2009 to 2012 and Board Director from 2003 to 2015. Vice President, Leadership and Community Engagement, Bush Foundation, Saint Paul, Minnesota (a private foundation) from 2009 to 2011. Executive Vice President and Chief Financial Officer, Minnesota Sports and Entertainment from 2004 to 2009 and Senior Vice President from 2002 to 2004. Executive Vice President of the Minnesota Wild Foundation from 2004 to 2008. Commissioner of Finance, State of Minnesota, from 1999 to 2002. Currently Board Chair of the Minnesota Wild Foundation since 2010. | | N/A |
| * | Length of service dates reflect the Trustee’s commencement of service with the Trust’s predecessor entities, where applicable. |
| | | | |
| 30 | | Wells Fargo Large Cap Core Fund | | Other information (unaudited) |
Officers
| | | | | | |
Name and
year of birth | | Position held and
length of service | | Principal occupations during past five years or longer | | |
| | | |
Andrew Owen (Born 1960) | | President, since 2017 | | Executive Vice President of Wells Fargo & Company and Head of Affiliated Managers, Wells Fargo Asset Management, since 2014. In addition, Mr. Owen is currently President, Chief Executive Officer and Director of Wells Fargo Funds Management, LLC since 2017. Prior thereto, Executive Vice President responsible for marketing, investments and product development for Wells Fargo Funds Management, LLC, from 2009 to 2014. | | |
| | | |
Jeremy DePalma1 (Born 1974) | | Treasurer, since 2012 | | Senior Vice President of Wells Fargo Funds Management, LLC since 2009. Senior Vice President of Evergreen Investment Management Company, LLC from 2008 to 2010 and head of the Fund Reporting and Control Team within Fund Administration from 2005 to 2010. | | |
| | | |
Alexander Kymn (Born 1973) | | Secretary, since 2018; Chief Legal Officer, since 2018 | | Senior Company Counsel of Wells Fargo Bank, N.A. since 2018 (previously Senior Counsel from 2007 to 2018). Vice President of Wells Fargo Funds Management, LLC from 2008 to 2014. | | |
| | | |
Michael H. Whitaker (Born 1967) | | Chief Compliance Officer, since 2016 | | Senior Vice President and Chief Compliance Officer since 2016. Senior Vice President and Chief Compliance Officer for Fidelity Investments from 2007 to 2016. | | |
| | | |
David Berardi (Born 1975) | | Assistant Treasurer, since 2009 | | Vice President of Wells Fargo Funds Management, LLC since 2009. Vice President of Evergreen Investment Management Company, LLC from 2008 to 2010. Manager of Fund Reporting and Control for Evergreen Investment Management Company, LLC from 2004 to 2010. | | |
| 1 | Jeremy DePalma acts as Treasurer of 76 funds and Assistant Treasurer of 76 funds in the Fund Complex. |
| 2 | The Statement of Additional Information includes additional information about the Trustees and is available, without charge, upon request, by calling1-800-260-5969 or by visiting the website atwellsfargofunds.com. |
| 3 | Mr. Harris became Chairman of the Audit Committee effective January 1, 2019. |
| | | | | | |
| Appendix A (unaudited) | | Wells Fargo Large Cap Core Fund | | | 31 | |
SALES CHARGE REDUCTIONS AND WAIVERS FOR CERTAIN INTERMEDIARIES
Raymond James & Associates, Inc., Raymond James Financial Services & Raymond James affiliates (“Raymond James”)
Effective on or about March 1, 2019, shareholders purchasing Fund shares through a Raymond James platform or account will be eligible only for the following load waivers (front-end sales charge waivers and contingent deferred, or back-end, sales charge waivers) and discounts, which may differ from those disclosed elsewhere in the Fund’s Prospectus or SAI.
Front-end Sales Load Waivers on Class A shares Available at Raymond James
| | • | | Shares purchased in an investment advisory program. |
| | • | | Shares purchased through reinvestment of capital gains distributions and dividend reinvestment when purchasing shares of the same fund (but not any other fund within the fund family). |
| | • | | Employees and registered representatives of Raymond James or its affiliates and their family members as designated by Raymond James. |
| | • | | Shares purchased from the proceeds of redemptions within the same fund family, provided (1) the repurchase occurs within 90 days following the redemption, (2) the redemption and purchase occur in the same account, and (3) redeemed shares were subject to a front-end or deferred sales load (known as Rights of Reinstatement). |
| | • | | A shareholder in the fund’s Class C shares will have their shares automatically exchanged at net asset value to Class A shares (or the appropriate share class) of the fund if the shares are no longer subject to a CDSC and the exchange is in line with the policies and procedures of Raymond James. |
CDSC Waivers on Class A and C Shares Available at Raymond James
| | • | | Death or disability of the shareholder. |
| | • | | Shares sold as part of a systematic withdrawal plan as described in the Fund’s Prospectus. |
| | • | | Return of excess contributions from an IRA Account. |
| | • | | Shares sold as part of a required minimum distribution for IRA and retirement accounts due to the shareholder reaching age 70½ as described in the Fund’s prospectus. |
| | • | | Shares sold to pay Raymond James fees but only if the transaction is initiated by Raymond James. |
| | • | | Shares acquired through a right of reinstatement. |
Front-end Load Discounts Available at Raymond James: Breakpoints, and/or Rights of Accumulation
| | • | | Breakpoints as described in the Fund’s Prospectus. |
| | • | | Rights of accumulation which entitle shareholders to breakpoint discounts will be automatically calculated based on the aggregated holding of fund family assets held by accounts within the purchaser’s household at Raymond James. Eligible fund family assets not held at Raymond James may be included in the rights of accumulation calculation only if the shareholder notifies his or her financial advisor about such assets. |
This page is intentionally left blank.

For more information
More information about Wells Fargo Funds is available free upon request. To obtain literature, please write, visit the Fund’s website, or call:
Wells Fargo Funds
P.O. Box 219967
Kansas City, MO 64121-9967
Website: wellsfargofunds.com
Individual investors: 1-800-222-8222
Retail investment professionals: 1-888-877-9275
Institutional investment professionals:1-866-765-0778
This report and the financial statements contained herein are submitted for the general information of the shareholders of the Fund. If this report is used for promotional purposes, distribution of the report must be accompanied or preceded by a current prospectus. Before investing, please consider the investment objectives, risks, charges, and expenses of the investment. For a current prospectus and, if available, a summary prospectus, containing this information, call1-800-222-8222 or visit the Fund’s website atwellsfargofunds.com. Read the prospectus carefully before you invest or send money.
Wells Fargo Asset Management (WFAM) is the trade name for certain investment advisory/management firms owned by Wells Fargo & Company. These firms include but are not limited to Wells Capital Management Incorporated and Wells Fargo Funds Management, LLC. Certain products managed by WFAM entities are distributed by Wells Fargo Funds Distributor, LLC (a broker/dealer and Member FINRA).
This material is for general informational and educational purposes only and is NOT intended to provide investment advice or a recommendation of any kind—including a recommendation for any specific investment, strategy, or plan.
INVESTMENT PRODUCTS: NOT FDIC INSURED ◾ NO BANK GUARANTEE ◾ MAY LOSE VALUE
© 2019 Wells Fargo Funds Management, LLC. All rights reserved.
| | |
 | | 320773 03-19 SA208/SAR208 01-19 |
Semi-Annual Report
January 31, 2019

Wells Fargo Large Cap Growth Fund

Beginning on January 1, 2021, as permitted by new regulations adopted by the Securities and Exchange Commission, paper copies of the Wells Fargo Funds’ annual and semi-annual shareholder reports issued after this date will no longer be sent by mail, unless you specifically request paper copies of the reports. Instead, the reports will be made available on the Funds’ website, and you will be notified by mail each time a report is posted and provided with a website address to access the report.
If you already elected to receive shareholder reports electronically, you will not be affected by this change and you need not take any action. You may elect to receive shareholder reports and other communications from the Fund electronically at any time by contacting your financial intermediary (such as a broker-dealer or bank) or, if you are a direct investor, by calling 1-800-222-8222 or by enrolling at wellsfargo.com/advantagedelivery.
You may elect to receive all future reports in paper free of charge. If you invest through a financial intermediary, you can contact your financial intermediary to request that you continue to receive paper copies of your shareholder reports; if you invest directly with the Fund, you can call 1-800-222-8222. Your election to receive reports in paper will apply to all Wells Fargo Funds held in your account with your financial intermediary or, if you are a direct investor, to all Wells Fargo Funds that you hold.

Reduce clutter. Save trees.
Sign up for electronic delivery of prospectuses and shareholder reports atwellsfargo.com/advantagedelivery
Contents
The views expressed and any forward-looking statements are as of January 31, 2019, unless otherwise noted, and are those of the Fund managers and/or Wells Fargo Funds Management, LLC. Discussions of individual securities, or the markets generally, or any Wells Fargo Fund are not intended as individual recommendations. Future events or results may vary significantly from those expressed in any forward-looking statements. The views expressed are subject to change at any time in response to changing circumstances in the market. Wells Fargo Funds Management, LLC and the Fund disclaim any obligation to publicly update or revise any views expressed or forward-looking statements.
INVESTMENT PRODUCTS: NOT FDIC INSURED ◾ NO BANK GUARANTEE ◾ MAY LOSE VALUE
| | | | |
| 2 | | Wells Fargo Large Cap Growth Fund | | Letter to shareholders (unaudited) |

Andrew Owen
President
Wells Fargo Funds
Favorable third-quarter economic indicators and corporate earnings reports encouraged domestic stock investors.
Dear Shareholder:
We are pleased to offer you this semi-annual report for the Wells Fargo Large Cap Growth Fund for thesix-month period that ended January 31, 2019. Highershort-term interest rates, inflation concerns, trade tensions, slowing economic growth outside the U.S., and geopolitical events contributed to investment market volatility throughout the period.
For the period, U.S. stocks, as measured by the S&P 500 Index,1 fell 3.00% and international stocks, as measured by the MSCI ACWI ex USA Index (Net),2 declined 6.34%. Based on the MSCI EM Index (Net),3 emerging market stocks lost 2.60%. For bond investors, the Bloomberg Barclays U.S. Aggregate Bond Index4 added 2.71% while the Bloomberg Barclays Global Aggregateex-USD Index5 gained 1.37%. The Bloomberg Barclays Municipal Bond Index6 added 2.05%, and the ICE BofAML U.S. High Yield Index7 gained 1.02%.
Investors appeared to shake off lingering concerns during the third quarter.
Favorable third-quarter economic indicators and corporate earnings reports encouraged domestic stock investors. U.S. trade negotiations with Mexico and Canada made progress. The Conference Board Consumer Confidence Index®8 reached its highest level in 18 years during September. Several U.S. equity market indices reached records during August. The U.S. Federal Reserve (Fed) raised the federal funds rate by 25 basis points (bps; 100 bps equal 1.00%) to a target range of between 2.00% and 2.25% in September 2018. For the quarter that ended September 30, the S&P 500 Index added 7.71%.
Investors in international markets were not as reassured. Tensions between the U.S. and China increased when the U.S. imposed an additional $200 billion in tariffs on Chinese goods. China responded with $60 billion in tariffs on U.S. products. In addition, economic growth in China drew renewed concerns. The Bank of England, having raised its monetary policy rate to 0.50% in November 2017, increased the rate again in August 2018 to 0.75%. During the three-month period that ended September 30, 2018, the MSCI ACWI ex USA Index (Net) gained 0.71% while the MSCI EM Index (Net) declined 1.09%.
| 1 | The S&P 500 Index consists of 500 stocks chosen for market size, liquidity, and industry group representation. It is a market-value-weighted index with each stock’s weight in the index proportionate to its market value. You cannot invest directly in an index. |
| 2 | The Morgan Stanley Capital International (MSCI) All Country World Index (ACWI) ex USA Index (Net) is a free-float-adjusted market-capitalization-weighted index that is designed to measure the equity market performance of developed markets, excluding the United States and Canada. Source: MSCI. MSCI makes no express or implied warranties or representations and shall have no liability whatsoever with respect to any MSCI data contained herein. The MSCI data may not be further redistributed or used as a basis for other indices or any securities or financial products. This report is not approved, reviewed, or produced by MSCI. You cannot invest directly in an index. |
| 3 | The MSCI Emerging Markets (EM) Index (Net) is a free-float-adjusted market-capitalization-weighted index that is designed to measure large- andmid-cap equity market performance of emerging markets. The MSCI EM Index (Net) consists of the following 24 emerging market country indices: Brazil, Chile, China, Colombia, Czech Republic, Egypt, Greece, Hungary, India, Indonesia, Korea, Malaysia, Mexico, Pakistan, Peru, the Philippines, Poland, Qatar, Russia, South Africa, Taiwan, Thailand, Turkey, and the United Arab Emirates. You cannot invest directly in an index. |
| 4 | The Bloomberg Barclays U.S. Aggregate Bond Index is a broad-based benchmark that measures the investment-grade, U.S. dollar-denominated, fixed-rate taxable bond market, including Treasuries, government-related and corporate securities, mortgage-backed securities (agency fixed-rate and hybrid adjustable-rate mortgage pass-throughs), asset-backed securities, and commercial mortgage-backed securities. You cannot invest directly in an index. |
| 5 | The Bloomberg Barclays Global Aggregateex-USD Index is an unmanaged index that provides a broad-based measure of the global investment-grade fixed-income markets excluding the U.S. dollar-denominated debt market. You cannot invest directly in an index. |
| 6 | The Bloomberg Barclays Municipal Bond Index is an unmanaged index composed of long-termtax-exempt bonds with a minimum credit rating of Baa. You cannot invest directly in an index. |
| 7 | The ICE BofAML U.S. High Yield Index is a market-capitalization-weighted index of domestic and Yankee high-yield bonds. The index tracks the performance of high-yield securities traded in the U.S. bond market. You cannot invest directly in an index. Copyright 2019. ICE Data Indices, LLC. All rights reserved. |
| 8 | The Conference Board Consumer Confidence Index® measures the degree of optimism on the state of the U.S. economy that consumers are expressing through their activities of savings and spending. You cannot invest directly in an index. |
| | | | | | |
| Letter to shareholders (unaudited) | | Wells Fargo Large Cap Growth Fund | | | 3 | |
In bond markets, U.S. bonds, as measured by the Bloomberg Barclays U.S. Aggregate Bond Index, were flat. The Bloomberg Barclays Global Aggregateex-USD Index fell 1.74% during the quarter that ended September 30, 2018.
Conflicting data unsettled markets during the fourth quarter.
Negative stock market performance during October and December bracketed a mildly positive November for the S&P 500 Index and the MSCI ACWI ex USA Index (Net). As interest rates and bond yields gained during October, stock markets struggled. December’s S&P 500 Index performance was the worst since 1931. Globally, fixed-income investments fared better than stocks during the last two months of the year.
November’s U.S. midterm elections shifted control of the House of Representatives from Republicans to Democrats, presaging potential partisan disputes. The Bureau of Economic Analysis reported that third-quarter U.S. gross domestic product (GDP) grew at an annualized 3.4% rate, lower than second-quarter GDP growth. Brexit efforts stalled in the U.K. ahead of the March 2019 deadline. The People’s Bank of China cut reserve requirement ratios and accelerated infrastructure spending and tax cuts, and the value of the yuan declined to low levels last seen in 2008. Oil prices fell.
After the Fed increased the federal funds rate by 25 bps to a target range of between 2.25% and 2.50% in December 2018—the ninth such increase since the Fed began raising rates three years ago from near zero—it softened its outlook for further interest rate increases in 2019.
The market climbs a wall of worry.
Investors entered 2019 with reasons to be concerned. A partial U.S. government shutdown driven by partisan disputes over spending and immigration policies extended into January. Globally, economic signals were uneven. Investors expected high levels of stock market volatility to continue, as measured by the VIX9.
January’s returns tended to support the investing adage that the market climbs a wall of worry. The S&P 500 Index gained 8.01% for the month that ended January 31, 2019, its best monthly performance in 30 years. Returns for the MSCI ACWI ex USA Index (Net), the Bloomberg Barclays U.S. Aggregate Bond Index, and the Bloomberg Barclays Global Aggregateex-USD Index also were positive.
Don’t let short-term uncertainty derail long-term investment goals.
Periods of investment uncertainty can present challenges, but experience has taught us that maintaining long-term investment goals can be an effective way to plan for the future. To help you create a sound strategy based on your personal goals and risk tolerance, Wells Fargo Funds offers more than 100 mutual funds spanning a wide range of asset classes and investment styles. Although diversification cannot guarantee an investment profit or prevent losses, we believe it can be an effective way to manage investment risk and potentially smooth out overall portfolio performance. We encourage investors to know their investments and to understand that appropriate levels of risk-taking may unlock opportunities.
January’s returns tended to support the investing adage that the market climbs a wall of worry.
| 9 | The Chicago Board Options Exchange Market Volatility Index (VIX) is a popular measure of the implied volatility of S&P 500 Index options. It represents one measure of the market’s expectation of stock market volatility over the next30-day period. You cannot invest directly in an index. |
| | | | |
| 4 | | Wells Fargo Large Cap Growth Fund | | Letter to shareholders (unaudited) |
Thank you for choosing to invest with Wells Fargo Funds. We appreciate your confidence in us and remain committed to helping you meet your financial needs.
Sincerely,

Andrew Owen
President
Wells Fargo Funds
For further information about your Fund, contact your investment professional, visit our website atwellsfargofunds.com, or call us directly at1-800-222-8222.
This page is intentionally left blank.
| | | | |
| 6 | | Wells Fargo Large Cap Growth Fund | | Performance highlights (unaudited) |
Investment objective
The Fund seeks long-term capital appreciation.
Manager
Wells Fargo Funds Management, LLC
Subadviser
Wells Capital Management Incorporated
Portfolio managers
Joseph M. Eberhardy, CFA®‡, CPA
Bob Gruendyke, CFA®‡
Thomas C. Ognar, CFA®‡
Average annual total returns (%) as of January 31, 2019
| | | | | | | | | | | | | | | | | | | | | | | | | | | | | | | | | | |
| | | | | Including sales charge | | | Excluding sales charge | | | Expense ratios1 (%) | |
| | | Inception date | | 1 year | | | 5 year | | | 10 year | | | 1 year | | | 5 year | | | 10 year | | | Gross | | | Net2 | |
| | | | | | | | | |
| Class A (STAFX)3 | | 7-30-2010 | | | -4.69 | | | | 9.54 | | | | 14.72 | | | | 1.12 | | | | 10.85 | | | | 15.40 | | | | 1.17 | | | | 1.07 | |
| | | | | | | | | |
| Class C (STOFX)4 | | 7-30-2010 | | | -0.63 | | | | 10.01 | | | | 14.55 | | | | 0.37 | | | | 10.01 | | | | 14.55 | | | | 1.92 | | | | 1.82 | |
| | | | | | | | | |
| Class R (STMFX)5 | | 6-15-2012 | | | – | | | | – | | | | – | | | | 0.85 | | | | 10.56 | | | | 15.14 | | | | 1.42 | | | | 1.32 | |
| | | | | | | | | |
| Class R4 (SLGRX)6 | | 11-30-2012 | | | – | | | | – | | | | – | | | | 1.38 | | | | 11.17 | | | | 15.71 | | | | 0.89 | | | | 0.80 | |
| | | | | | | | | |
| Class R6 (STFFX)7 | | 11-30-2012 | | | – | | | | – | | | | – | | | | 1.54 | | | | 11.33 | | | | 15.82 | | | | 0.74 | | | | 0.65 | |
| | | | | | | | | |
| Administrator Class (STDFX)8 | | 7-30-2010 | | | – | | | | – | | | | – | | | | 1.24 | | | | 10.98 | | | | 15.53 | | | | 1.09 | | | | 0.95 | |
| | | | | | | | | |
| Institutional Class (STNFX)9 | | 7-30-2010 | | | – | | | | – | | | | – | | | | 1.44 | | | | 11.24 | | | | 15.76 | | | | 0.84 | | | | 0.75 | |
| | | | | | | | | |
| Russell 1000® Growth Index10 | | – | | | – | | | | – | | | | – | | | | 0.24 | | | | 12.97 | | | | 16.86 | | | | – | | | | – | |
Figures quoted represent past performance, which is no guarantee of future results, and do not reflect taxes that a shareholder may pay on fund distributions or the redemption of fund shares. Investment return and principal value of an investment will fluctuate so that an investor’s shares, when redeemed, may be worth more or less than their original cost. Performance shown without sales charges would be lower if sales charges were reflected. Current performance may be lower or higher than the performance data quoted, which assumes the reinvestment of dividends and capital gains. Currentmonth-end performance is available on the Fund’s website, wellsfargofunds.com.
Index returns do not include transaction costs associated with buying and selling securities, any mutual fund fees or expenses, or any taxes. It is not possible to invest directly in an index.
For Class A shares, the maximumfront-end sales charge is 5.75%. For Class C shares, the maximum contingent deferred sales charge is 1.00%. Performance including a contingent deferred sales charge assumes the sales charge for the corresponding time period. Class R, Class R4, Class R6, Administrator Class, and Institutional Class shares are sold without afront-end sales charge or contingent deferred sales charge.
Stock values fluctuate in response to the activities of individual companies and general market and economic conditions. Certain investment strategies tend to increase the total risk of an investment (relative to the broader market). The Fund is exposed to foreign investment risk. Consult the Fund’s prospectus for additional information on these and other risks.
Please see footnotes on page 7.
| | | | | | |
| Performance highlights (unaudited) | | Wells Fargo Large Cap Growth Fund | | | 7 | |
| | | | |
| Ten largest holdings (%) as of January 31, 201911 | |
| |
Amazon.com Incorporated | | | 8.57 | |
| |
Microsoft Corporation | | | 6.99 | |
| |
Alphabet Incorporated Class A | | | 5.04 | |
| |
MasterCard Incorporated Class A | | | 3.87 | |
| |
Visa Incorporated Class A | | | 3.64 | |
| |
Texas Instruments Incorporated | | | 3.48 | |
| |
Microchip Technology Incorporated | | | 3.44 | |
| |
Alphabet Incorporated Class C | | | 3.32 | |
| |
PayPal Holdings Incorporated | | | 2.66 | |
| |
The Charles Schwab Corporation | | | 2.60 | |
| | |
| Sector distribution as of January 31, 201912 |
|
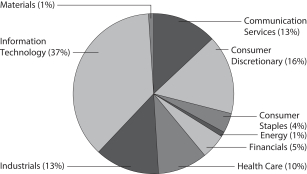
|
| ‡ | CFA® and Chartered Financial Analyst®are trademarks owned by CFA Institute. |
| 1 | Reflects the expense ratios as stated in the most recent prospectuses. The expense ratios shown are subject to change and may differ from the annualized expense ratios shown in the financial highlights of this report. |
| 2 | The manager has contractually committed through November 30, 2019, to waive fees and/or reimburse expenses to the extent necessary to cap the expenses of each class after fee waivers at the amounts shown. Brokerage commissions, stamp duty fees, interest, taxes, acquired fund fees and expenses (if any), and extraordinary expenses are excluded from the expense cap. Prior to or after the commitment expiration date, the cap may be increased or the commitment to maintain the cap may be terminated only with the approval of the Board of Trustees. Without this cap, the Fund’s returns would have been lower. The expense ratio paid by an investor is the net expense ratio (the total annual fund operating expenses after fee waivers) as stated in the prospectuses. |
| 3 | Historical performance shown for Class A shares prior to their inception reflects the performance of the former Investor Class shares and includes the higher expenses applicable to the former Investor Class shares. If these expenses had not been included, returns for Class A shares would be higher. |
| 4 | Historical performance shown for Class C shares prior to their inception reflects the performance of the former Investor Class shares, adjusted to reflect the higher expenses applicable to Class C shares. |
| 5 | Historical performance shown for Class R shares prior to their inception reflects the performance of the former Investor Class shares, adjusted to reflect the higher expenses applicable to Class R shares. |
| 6 | Historical performance shown for Class R4 shares prior to their inception reflects the performance of Institutional Class shares, adjusted to reflect the higher expenses applicable to Class R4 shares. |
| 7 | Historical performance shown for Class R6 shares prior to their inception reflects the performance of Institutional Class shares, and includes the higher expenses applicable to Institutional Class shares. If these expenses had not been included, returns for Class R6 shares would be higher. |
| 8 | Historical performance shown for Administrator Class shares prior to their inception reflects the performance of the former Investor Class shares, and includes the higher expenses applicable to the former Investor Class shares. If these expenses had not been included, returns for Administrator Class shares would be higher. |
| 9 | Historical performance shown for Institutional Class shares prior to their inception reflects the performance of the former Investor Class shares, and includes the higher expenses applicable to the former Investor Class shares. If these expenses had not been included, returns for Institutional Class shares would be higher. |
| 10 | The Russell 1000® Growth Index measures the performance of those Russell 1000 companies with higher price/book ratios and higher forecasted growth values. You cannot invest directly in an index. |
| 11 | The ten largest holdings, excluding cash, cash equivalents and any money market funds, are calculated based on the value of the investments divided by total net assets of the Fund. Holdings are subject to change and may have changed since the date specified. |
| 12 | Amounts are calculated based on the total long-term investments of the Fund. These amounts are subject to change and may have changed since the date specified. |
| | | | |
| 8 | | Wells Fargo Large Cap Growth Fund | | Fund expenses (unaudited) |
As a shareholder of the Fund, you incur two types of costs: (1) transaction costs, including sales charges (loads) on purchase payments and contingent deferred sales charges (if any) on redemptions and (2) ongoing costs, including management fees, distribution(12b-1) and/or shareholder servicing fees, and other Fund expenses. This example is intended to help you understand your ongoing costs (in dollars) of investing in the Fund and to compare these costs with the ongoing costs of investing in other mutual funds.
The example is based on an investment of $1,000 invested at the beginning of thesix-month period and held for the entire period from August 1, 2018 to January 31, 2019.
Actual expenses
The “Actual” line of the table below provides information about actual account values and actual expenses. You may use the information in this line, together with the amount you invested, to estimate the expenses that you paid over the period. Simply divide your account value by $1,000 (for example, an $8,600 account value divided by $1,000 = 8.6), then multiply the result by the number in the “Actual” line under the heading entitled “Expenses paid during period” for your applicable class of shares to estimate the expenses you paid on your account during this period.
Hypothetical example for comparison purposes
The “Hypothetical” line of the table below provides information about hypothetical account values and hypothetical expenses based on the Fund’s actual expense ratio and an assumed rate of return of 5% per year before expenses, which is not the Fund’s actual return. The hypothetical account values and expenses may not be used to estimate the actual ending account balance or expenses you paid for the period. You may use this information to compare the ongoing costs of investing in the Fund and other funds. To do so, compare this 5% hypothetical example with the 5% hypothetical examples that appear in the shareholder reports of the other funds.
Please note that the expenses shown in the table are meant to highlight your ongoing costs only and do not reflect any transactional costs, such as sales charges (loads) and contingent deferred sales charges. Therefore, the “Hypothetical” line of the table is useful in comparing ongoing costs only and will not help you determine the relative total costs of owning different funds. In addition, if these transactional costs were included, your costs would have been higher.
| | | | | | | | | | | | | | | | |
| | | Beginning
account value
8-1-2018 | | | Ending
account value
1-31-2019 | | | Expenses
paid during
the period¹ | | | Annualized net
expense ratio | |
Class A | | | | | | | | | | | | | | | | |
| | | | |
Actual | | $ | 1,000.00 | | | $ | 969.25 | | | $ | 5.31 | | | | 1.07 | % |
| | | | |
Hypothetical (5% return before expenses) | | $ | 1,000.00 | | | $ | 1,019.81 | | | $ | 5.45 | | | | 1.07 | % |
Class C | | | | | | | | | | | | | | | | |
| | | | |
Actual | | $ | 1,000.00 | | | $ | 965.58 | | | $ | 9.02 | | | | 1.82 | % |
| | | | |
Hypothetical (5% return before expenses) | | $ | 1,000.00 | | | $ | 1,016.03 | | | $ | 9.25 | | | | 1.82 | % |
Class R | | | | | | | | | | | | | | | | |
| | | | |
Actual | | $ | 1,000.00 | | | $ | 967.89 | | | $ | 6.55 | | | | 1.32 | % |
| | | | |
Hypothetical (5% return before expenses) | | $ | 1,000.00 | | | $ | 1,018.55 | | | $ | 6.72 | | | | 1.32 | % |
Class R4 | | | | | | | | | | | | | | | | |
| | | | |
Actual | | $ | 1,000.00 | | | $ | 970.57 | | | $ | 3.97 | | | | 0.80 | % |
| | | | |
Hypothetical (5% return before expenses) | | $ | 1,000.00 | | | $ | 1,021.17 | | | $ | 4.08 | | | | 0.80 | % |
Class R6 | | | | | | | | | | | | | | | | |
| | | | |
Actual | | $ | 1,000.00 | | | $ | 971.36 | | | $ | 3.23 | | | | 0.65 | % |
| | | | |
Hypothetical (5% return before expenses) | | $ | 1,000.00 | | | $ | 1,021.93 | | | $ | 3.31 | | | | 0.65 | % |
Administrator Class | | | | | | | | | | | | | | | | |
| | | | |
Actual | | $ | 1,000.00 | | | $ | 969.77 | | | $ | 4.72 | | | | 0.95 | % |
| | | | |
Hypothetical (5% return before expenses) | | $ | 1,000.00 | | | $ | 1,020.42 | | | $ | 4.84 | | | | 0.95 | % |
Institutional Class | | | | | | | | | | | | | | | | |
| | | | |
Actual | | $ | 1,000.00 | | | $ | 970.83 | | | $ | 3.73 | | | | 0.75 | % |
| | | | |
Hypothetical (5% return before expenses) | | $ | 1,000.00 | | | $ | 1,021.42 | | | $ | 3.82 | | | | 0.75 | % |
| 1 | Expenses paid is equal to the annualized net expense ratio of each class multiplied by the average account value over the period, multiplied by the number of days in the most recent fiscal half-year divided by the number of days in the fiscal year (to reflect theone-half-year period). |
| | | | | | |
| Portfolio of investments—January 31, 2019 (unaudited) | | Wells Fargo Large Cap Growth Fund | | | 9 | |
| | | | | | | | | | | | | | | | |
| Security name | | | | | | | | Shares | | | Value | |
|
Common Stocks: 99.09% | |
|
Communication Services: 12.50% | |
|
| Entertainment: 2.06% | |
| | | | |
Activision Blizzard Incorporated | | | | | | | | | | | 97,880 | | | $ | 4,623,851 | |
| | | | |
Electronic Arts Incorporated † | | | | | | | | | | | 43,700 | | | | 4,030,888 | |
| | | | |
Netflix Incorporated † | | | | | | | | | | | 31,220 | | | | 10,599,190 | |
| | | | |
| | | | | | | | | | | | | | | 19,253,929 | |
| | | | | | | | | | | | | | | | |
|
| Interactive Media & Services: 10.44% | |
| | | | |
Alphabet Incorporated Class A † | | | | | | | | | | | 41,930 | | | | 47,208,568 | |
| | | | |
Alphabet Incorporated Class C † | | | | | | | | | | | 27,870 | | | | 31,113,232 | |
| | | | |
Facebook Incorporated Class A † | | | | | | | | | | | 96,170 | | | | 16,030,577 | |
| | | | |
Match Group Incorporated « | | | | | | | | | | | 28,400 | | | | 1,519,116 | |
| | | | |
Twitter Incorporated † | | | | | | | | | | | 57,800 | | | | 1,939,768 | |
| | | | |
| | | | | | | | | | | | | | | 97,811,261 | |
| | | | | | | | | | | | | | | | |
|
Consumer Discretionary: 15.51% | |
|
| Hotels, Restaurants & Leisure: 2.73% | |
| | | | |
Carnival Corporation | | | | | | | | | | | 197,040 | | | | 11,345,563 | |
| | | | |
Marriott International Incorporated Class A | | | | | | | | | | | 60,200 | | | | 6,894,706 | |
| | | | |
Norwegian Cruise Line Holdings Limited † | | | | | | | | | | | 77,500 | | | | 3,985,825 | |
| | | | |
Royal Caribbean Cruises Limited | | | | | | | | | | | 27,700 | | | | 3,325,385 | |
| | | | |
| | | | | | | | | | | | | | | 25,551,479 | |
| | | | | | | | | | | | | | | | |
|
| Internet & Direct Marketing Retail: 8.56% | |
| | | | |
Amazon.com Incorporated † | | | | | | | | | | | 46,680 | | | | 80,230,316 | |
| | | | | | | | | | | | | | | | |
|
| Specialty Retail: 4.22% | |
| | | | |
Burlington Stores Incorporated † | | | | | | | | | | | 89,700 | | | | 15,402,387 | |
| | | | |
O’Reilly Automotive Incorporated † | | | | | | | | | | | 3,200 | | | | 1,102,912 | |
| | | | |
The Home Depot Incorporated | | | | | | | | | | | 85,960 | | | | 15,776,239 | |
| | | | |
ULTA Beauty Incorporated † | | | | | | | | | | | 24,800 | | | | 7,239,616 | |
| | | | |
| | | | | | | | | | | | | | | 39,521,154 | |
| | | | | | | | | | | | | | | | |
|
Consumer Staples: 3.83% | |
|
| Beverages: 2.18% | |
| | | | |
Constellation Brands Incorporated Class A | | | | | | | | | | | 15,790 | | | | 2,742,091 | |
| | | | |
The Coca-Cola Company | | | | | | | | | | | 366,480 | | | | 17,638,682 | |
| | | | |
| | | | | | | | | | | | | | | 20,380,773 | |
| | | | | | | | | | | | | | | | |
|
| Food & Staples Retailing: 0.29% | |
| | | | |
Costco Wholesale Corporation | | | | | | | | | | | 12,810 | | | | 2,749,410 | |
| | | | | | | | | | | | | | | | |
|
| Personal Products: 1.36% | |
| | | | |
The Estee Lauder Companies Incorporated Class A | | | | | | | | | | | 93,640 | | | | 12,774,369 | |
| | | | | | | | | | | | | | | | |
The accompanying notes are an integral part of these financial statements.
| | | | |
| 10 | | Wells Fargo Large Cap Growth Fund | | Portfolio of investments—January 31, 2019 (unaudited) |
| | | | | | | | | | | | | | | | |
| Security name | | | | | | | | Shares | | | Value | |
|
Energy: 0.98% | |
|
| Oil, Gas & Consumable Fuels: 0.98% | |
| | | | |
Concho Resources Incorporated † | | | | | | | | | | | 76,740 | | | $ | 9,196,522 | |
| | | | | | | | | | | | | | | | |
|
Financials: 5.22% | |
|
| Capital Markets: 4.47% | |
| | | | |
BlackRock Incorporated | | | | | | | | | | | 12,200 | | | | 5,063,976 | |
| | | | |
CME Group Incorporated | | | | | | | | | | | 25,030 | | | | 4,562,468 | |
| | | | |
Raymond James Financial Incorporated | | | | | | | | | | | 98,000 | | | | 7,889,000 | |
| | | | |
The Charles Schwab Corporation | | | | | | | | | | | 521,490 | | | | 24,390,087 | |
| | | | |
| | | | | | | | | | | | | | | 41,905,531 | |
| | | | | | | | | | | | | | | | |
|
| Insurance: 0.75% | |
| | | | |
The Progressive Corporation | | | | | | | | | | | 104,070 | | | | 7,002,870 | |
| | | | | | | | | | | | | | | | |
|
Health Care: 10.15% | |
|
| Biotechnology: 2.81% | |
| | | | |
Alexion Pharmaceuticals Incorporated † | | | | | | | | | | | 46,400 | | | | 5,705,344 | |
| | | | |
BioMarin Pharmaceutical Incorporated † | | | | | | | | | | | 38,200 | | | | 3,750,094 | |
| | | | |
Regeneron Pharmaceuticals Incorporated † | | | | | | | | | | | 9,500 | | | | 4,078,065 | |
| | | | |
Vertex Pharmaceuticals Incorporated † | | | | | | | | | | | 66,990 | | | | 12,789,061 | |
| | | | |
| | | | | | | | | | | | | | | 26,322,564 | |
| | | | | | | | | | | | | | | | |
|
| Health Care Equipment & Supplies: 4.46% | |
| | | | |
Abbott Laboratories | | | | | | | | | | | 117,490 | | | | 8,574,420 | |
| | | | |
Baxter International Incorporated | | | | | | | | | | | 112,490 | | | | 8,154,400 | |
| | | | |
Boston Scientific Corporation † | | | | | | | | | | | 418,340 | | | | 15,959,671 | |
| | | | |
Stryker Corporation | | | | | | | | | | | 51,300 | | | | 9,109,341 | |
| | | | |
| | | | | | | | | | | | | | | 41,797,832 | |
| | | | | | | | | | | | | | | | |
|
| Health Care Providers & Services: 0.23% | |
| | | | |
Humana Incorporated | | | | | | | | | | | 7,000 | | | | 2,162,930 | |
| | | | | | | | | | | | | | | | |
|
| Life Sciences Tools & Services: 1.04% | |
| | | | |
Agilent Technologies Incorporated | | | | | | | | | | | 127,870 | | | | 9,724,514 | |
| | | | | | | | | | | | | | | | |
|
| Pharmaceuticals: 1.61% | |
| | | | |
Zoetis Incorporated | | | | | | | | | | | 174,390 | | | | 15,025,442 | |
| | | | | | | | | | | | | | | | |
|
Industrials: 12.71% | |
|
| Aerospace & Defense: 2.05% | |
| | | | |
The Boeing Company | | | | | | | | | | | 49,840 | | | | 19,219,301 | �� |
| | | | | | | | | | | | | | | | |
|
| Air Freight & Logistics: 0.37% | |
| | | | |
C.H. Robinson Worldwide Incorporated | | | | | | | | | | | 40,200 | | | | 3,488,154 | |
| | | | | | | | | | | | | | | | |
|
| Commercial Services & Supplies: 2.68% | |
| | | | |
KAR Auction Services Incorporated | | | | | | | | | | | 144,950 | | | | 7,538,850 | |
| | | | |
Waste Connections Incorporated | | | | | | | | | | | 209,980 | | | | 17,545,929 | |
| | | | |
| | | | | | | | | | | | | | | 25,084,779 | |
| | | | | | | | | | | | | | | | |
The accompanying notes are an integral part of these financial statements.
| | | | | | |
| Portfolio of investments—January 31, 2019 (unaudited) | | Wells Fargo Large Cap Growth Fund | | | 11 | |
| | | | | | | | | | | | | | | | |
| Security name | | | | | | | | Shares | | | Value | |
| | | | |
| Industrial Conglomerates: 1.27% | | | | | | | | | | | | | | | | |
| | | | |
3M Company | | | | | | | | | | | 12,260 | | | $ | 2,455,678 | |
| | | | |
Roper Industries Incorporated | | | | | | | | | | | 33,430 | | | | 9,469,382 | |
| | | | |
| | | | | | | | | | | | | | | 11,925,060 | |
| | | | | | | | | | | | | | | | |
|
| Machinery: 0.94% | |
| | | | |
Fortive Corporation | | | | | | | | | | | 117,460 | | | | 8,808,325 | |
| | | | | | | | | | | | | | | | |
|
| Road & Rail: 5.40% | |
| | | |
CSX Corporation | | | | | | | | 292,800 | | | | 19,236,960 | |
| | | |
Norfolk Southern Corporation | | | | | | | | 101,270 | | | | 16,987,030 | |
| | | |
Union Pacific Corporation | | | | | | | | 89,950 | | | | 14,308,347 | |
| | | | |
| | | | | | | | | | | | | | | 50,532,337 | |
| | | | | | | | | | | | | | | | |
|
Information Technology: 36.47% | |
|
| IT Services: 13.88% | |
| | | |
Global Payments Incorporated | | | | | | | | 24,600 | | | | 2,762,088 | |
| | | |
MasterCard Incorporated Class A | | | | | | | | 171,480 | | | | 36,204,572 | |
| | | |
PayPal Holdings Incorporated † | | | | | | | | 281,180 | | | | 24,957,537 | |
| | | |
Shopify Incorporated Class A †« | | | | | | | | 43,130 | | | | 7,266,111 | |
| | | |
Square Incorporated Class A † | | | | | | | | 114,370 | | | | 8,160,300 | |
| | | |
Visa Incorporated Class A | | | | | | | | 252,330 | | | | 34,067,073 | |
| | | |
Worldpay Incorporated Class A † | | | | | | | | 197,880 | | | | 16,519,022 | |
| | | | |
| | | | | | | | | | | | | | | 129,936,703 | |
| | | | | | | | | | | | | | | | |
|
| Semiconductors & Semiconductor Equipment: 7.29% | |
| | | |
Microchip Technology Incorporated « | | | | | | | | 401,420 | | | | 32,262,125 | |
| | | |
NVIDIA Corporation | | | | | | | | 23,800 | | | | 3,421,250 | |
| | | |
Texas Instruments Incorporated | | | | | | | | 323,920 | | | | 32,612,266 | |
| | | | |
| | | | | | | | | | | | | | | 68,295,641 | |
| | | | | | | | | | | | | | | | |
|
| Software: 13.22% | |
| | | |
Adobe Systems Incorporated † | | | | | | | | 47,940 | | | | 11,880,491 | |
| | | |
Microsoft Corporation | | | | | | | | 627,100 | | | | 65,488,053 | |
| | | |
Salesforce.com Incorporated † | | | | | | | | 83,680 | | | | 12,716,850 | |
| | | |
ServiceNow Incorporated † | | | | | | | | 49,920 | | | | 10,983,398 | |
| | | |
Splunk Incorporated † | | | | | | | | 66,180 | | | | 8,261,911 | |
| | | |
The Ultimate Software Group Incorporated † | | | | | | | | 38,570 | | | | 10,532,310 | |
| | | |
VMware Incorporated Class A | | | | | | | | 26,310 | | | | 3,974,652 | |
| | | | |
| | | | | | | | | | | | | | | 123,837,665 | |
| | | | | | | | | | | | | | | | |
|
| Technology Hardware, Storage & Peripherals: 2.08% | |
| | | |
Apple Incorporated | | | | | | | | 117,140 | | | | 19,496,782 | |
| | | | | | | | | | | | | | | | |
|
Materials: 1.37% | |
|
| Chemicals: 1.37% | |
| | | |
Air Products & Chemicals Incorporated | | | | | | | | 12,020 | | | | 1,975,968 | |
| | | |
Linde plc | | | | | | | | 66,540 | | | | 10,846,685 | |
| | | | |
| | | | | | | | | | | | | | | 12,822,653 | |
| | | | | | | | | | | | | | | | |
The accompanying notes are an integral part of these financial statements.
| | | | |
| 12 | | Wells Fargo Large Cap Growth Fund | | Portfolio of investments—January 31, 2019 (unaudited) |
| | | | | | | | | | | | | | | | |
| Security name | | | | | | | | Shares | | | Value | |
|
Real Estate: 0.35% | |
|
| Real Estate Management & Development: 0.35% | |
| | | |
CBRE Group Incorporated Class A † | | | | | | | | 71,100 | | | $ | 3,252,825 | |
| | | | | | | | | | | | | | | | |
| |
Total Common Stocks (Cost $483,543,856) | | | | 928,111,121 | |
| | | | | | | | | | | | | | | | |
| | | | |
| | | Yield | | | | | | | | | | |
| Short-Term Investments: 4.04% | |
|
| Investment Companies: 4.04% | |
| | | | |
Securities Lending Cash Investments LLC (l)(r)(u) | | | 2.57 | % | | | | | | | 25,842,507 | | | | 25,845,091 | |
| | | | |
Wells Fargo Government Money Market Fund Select Class (l)(u) | | | 2.33 | | | | | | | | 11,987,303 | | | | 11,987,303 | |
| |
Total Short-Term Investments (Cost $37,832,394) | | | | 37,832,394 | |
| | | | | | | | | | | | | | | | |
| | | | | | | | |
| Total investments in securities (Cost $521,376,250) | | | 103.13 | % | | | 965,943,515 | |
| | |
Other assets and liabilities, net | | | (3.13 | ) | | | (29,345,193 | ) |
| | | | | | | | |
| Total net assets | | | 100.00 | % | | $ | 936,598,322 | |
| | | | | | | | |
| † | Non-income-earning security |
| « | All or a portion of this security is on loan. |
| (l) | The issuer of the security is an affiliated person of the Fund as defined in the Investment Company Act of 1940. |
| (r) | The investment is anon-registered investment company purchased with cash collateral received from securities on loan. |
| (u) | The rate represents the7-day annualized yield at period end. |
Investments in Affiliates
An affiliated investment is an investment in which the Fund owns at least 5% of the outstanding voting shares of the issuer or as a result of other relationships, such as the Fund and the issuer having the same investment manager. Transactions with issuers that were either affiliated persons of the Fund at the beginning of the period or the end of the period were as follows:
| | | | | | | | | | | | | | | | | | | | | | | | | | | | | | | | | | | | |
| | | Shares,
beginning of
period | | | Shares
purchased | | | Shares
sold | | | Shares,
end of
period | | | Net
realized
gains
(losses) | | | Net
change in
unrealized
gains
(losses) | | | Income
from
affiliated
securities | | | Value,
end
of period | | | % of
net
assets | |
Short-Term Investments | | | | | | | | | | | | | | | | | | | | | | | | | | | | | | | | | | | | |
Investment Companies | | | | | | | | | | | | | | | | | | | | | | | | | | | | | | | | | | | | |
Securities Lending Cash Investments LLC | | | 38,751,625 | | | | 109,649,791 | | | | 122,558,909 | | | | 25,842,507 | | | $ | (794 | ) | | $ | 0 | | | $ | 368,794 | | | $ | 25,845,091 | | | | | |
Wells Fargo Government Money Market Fund Select Class | | | 10,229,653 | | | | 96,225,914 | | | | 94,468,264 | | | | 11,987,303 | | | | 0 | | | | 0 | | | | 79,159 | | | | 11,987,303 | | | | | |
| | | | | | | | | | | | | | | | | | | | | | | | | | | | | | | | | | | | |
| | | | | | | | | |
| | | | | | | | | | | | | | | | | | $ | (794 | ) | | $ | 0 | | | $ | 447,953 | | | $ | 37,832,394 | | | | 4.04 | % |
| | | | | | | | | | | | | | | | | | | | | | | | | | | | | | | | | | | | |
The accompanying notes are an integral part of these financial statements.
| | | | | | |
| Statement of assets and liabilities—January 31, 2019 (unaudited) | | Wells Fargo Large Cap Growth Fund | | | 13 | |
| | | | |
| | | | |
| |
Assets | | | | |
Investments in unaffiliated securities (including $25,319,903 of securities loaned), at value (cost $483,543,856) | | $ | 928,111,121 | |
Investments in affiliated securities, at value (cost $37,832,394) | | | 37,832,394 | |
Receivable for Fund shares sold | | | 418,132 | |
Receivable for dividends | | | 401,055 | |
Receivable for securities lending income | | | 7,709 | |
Prepaid expenses and other assets | | | 46,880 | |
| | | | |
Total assets | | | 966,817,291 | |
| | | | |
| |
Liabilities | | | | |
Payable upon receipt of securities loaned | | | 25,844,438 | |
Payable for investments purchased | | | 3,346,443 | |
Management fee payable | | | 437,023 | |
Payable for Fund shares redeemed | | | 308,914 | |
Administration fees payable | | | 107,398 | |
Distribution fees payable | | | 9,113 | |
Trustees’ fees and expenses payable | | | 2,436 | |
Due to custodian bank | | | 470 | |
Accrued expenses and other liabilities | | | 162,734 | |
| | | | |
Total liabilities | | | 30,218,969 | |
| | | | |
Total net assets | | $ | 936,598,322 | |
| | | | |
| |
NET ASSETS CONSIST OF | | | | |
Paid-in capital | | $ | 470,631,797 | |
Total distributable earnings | | | 465,966,525 | |
| | | | |
Total net assets | | $ | 936,598,322 | |
| | | | |
| |
COMPUTATION OF NET ASSET VALUE AND OFFERING PRICE PER SHARE | | | | |
Net assets – Class A | | $ | 484,438,966 | |
Shares outstanding – Class A1 | | | 12,544,926 | |
Net asset value per share – Class A | | | $38.62 | |
Maximum offering price per share – Class A2 | | | $40.98 | |
Net assets – Class C | | $ | 13,296,248 | |
Shares outstanding – Class C1 | | | 384,991 | |
Net asset value per share – Class C | | | $34.54 | |
Net assets – Class R | | $ | 5,151,004 | |
Shares outstanding – Class R1 | | | 137,463 | |
Net asset value per share – Class R | | | $37.47 | |
Net assets – Class R4 | | $ | 2,094,114 | |
Share outstanding – Class R41 | | | 52,519 | |
Net asset value per share – Class R4 | | | $39.87 | |
Net assets – Class R6 | | $ | 296,321,255 | |
Shares outstanding – Class R61 | | | 7,383,052 | |
Net asset value per share – Class R6 | | | $40.14 | |
Net assets – Administrator Class | | $ | 60,514,173 | |
Shares outstanding – Administrator Class1 | | | 1,545,345 | |
Net asset value per share – Administrator Class | | | $39.16 | |
Net assets – Institutional Class | | $ | 74,782,562 | |
Shares outstanding – Institutional Class1 | | | 1,871,558 | |
Net asset value per share – Institutional Class | | | $39.96 | |
| 1 | The Fund has an unlimited number of authorized shares. |
| 2 | Maximum offering price is computed as 100/94.25 of net asset value. On investments of $50,000 or more, the offering price is reduced. |
The accompanying notes are an integral part of these financial statements.
| | | | |
| 14 | | Wells Fargo Large Cap Growth Fund | | Statement of operations—six months ended January 31, 2019 (unaudited) |
| | | | |
| | | | |
| |
Investment income | | | | |
Dividends (net of foreign withholding taxes of $9,592) | | $ | 5,140,069 | |
Income from affiliated securities | | | 129,075 | |
| | | | |
Total investment income | | | 5,269,144 | |
| | | | |
| |
Expenses | | | | |
Management fee | | | 3,425,678 | |
Administration fees | |
Class A | | | 536,537 | |
Class C | | | 15,226 | |
Class R | | | 5,876 | |
Class R4 | | | 830 | |
Class R6 | | | 46,715 | |
Administrator Class | | | 44,472 | |
Institutional Class | | | 54,934 | |
Shareholder servicing fees | |
Class A | | | 638,734 | |
Class C | | | 18,126 | |
Class R | | | 6,768 | |
Class R4 | | | 1,037 | |
Administrator Class | | | 84,337 | |
Distribution fees | |
Class C | | | 54,378 | |
Class R | | | 6,995 | |
Custody and accounting fees | | | 21,946 | |
Professional fees | | | 21,556 | |
Registration fees | | | 58,499 | |
Shareholder report expenses | | | 39,439 | |
Trustees’ fees and expenses | | | 11,090 | |
Other fees and expenses | | | 14,494 | |
| | | | |
Total expenses | | | 5,107,667 | |
Less: Fee waivers and/or expense reimbursements | | | (542,629 | ) |
| | | | |
Net expenses | | | 4,565,038 | |
| | | | |
Net investment income | | | 704,106 | |
| | | | |
| |
REALIZED AND UNREALIZED GAINS (LOSSES) ON INVESTMENTS | | | | |
|
Net realized gains (losses) on: | |
Unaffiliated securities | | | 72,040,055 | |
Affiliated securities | | | (794 | ) |
| | | | |
Net realized gains on investments | | | 72,039,261 | |
Net change in unrealized gains (losses) on investments | | | (106,459,160 | ) |
| | | | |
Net realized and unrealized gains (losses) on investments | | | (34,419,899 | ) |
| | | | |
Net decrease in net assets resulting from operations | | $ | (33,715,793 | ) |
| | | | |
The accompanying notes are an integral part of these financial statements.
| | | | | | |
| Statement of changes in net assets | | Wells Fargo Large Cap Growth Fund | | | 15 | |
| | | | | | | | | | | | | | | | |
| | | Six months ended
January 31, 2019
(unaudited) | | | Year ended
July 31, 20181 | |
| | | | |
Operations | | | | | | | | | | | | | | | | |
Net investment income | | | | | | $ | 704,106 | | | | | | | $ | 137,464 | |
Net realized gains on investments | | | | | | | 72,039,261 | | | | | | | | 234,857,518 | |
Net change in unrealized gains (losses) on investments | | | | | | | (106,459,160 | ) | | | | | | | 33,368,008 | |
| | | | |
Net increase (decrease) in net assets resulting from operations | | | | | | | (33,715,793 | ) | | | | | | | 268,362,990 | |
| | | | |
|
Distributions to shareholders from net investment income and net realized gains | |
Class A | | | | | | | (111,706,240 | ) | | | | | | | (94,299,274 | ) |
Class C | | | | | | | (3,431,246 | ) | | | | | | | (2,995,367 | ) |
Class R | | | | | | | (1,280,121 | ) | | | | | | | (1,226,176 | ) |
Class R4 | | | | | | | (455,047 | ) | | | | | | | (86,325 | ) |
Class R6 | | | | | | | (66,047,400 | ) | | | | | | | (60,894,090 | ) |
Administrator Class | | | | | | | (14,492,251 | ) | | | | | | | (12,791,477 | ) |
Institutional Class | | | | | | | (18,149,003 | ) | | | | | | | (29,593,244 | ) |
| | | | |
Total distributions to shareholders | | | | | | | (215,561,308 | ) | | | | | | | (201,885,953 | ) |
| | | | |
| | |
Capital share transactions | | | Shares | | | | Shares | |
Proceeds from shares sold | | | | | | | | | | | | | | | | |
Class A | | | 224,486 | | | | 10,132,532 | | | | 350,829 | | | | 17,319,919 | |
Class C | | | 51,192 | | | | 1,804,809 | | | | 45,353 | | | | 2,068,446 | |
Class R | | | 41,872 | | | | 1,682,545 | | | | 59,909 | | | | 2,827,726 | |
Class R4 | | | 6,953 | | | | 340,459 | | | | 35,016 | | | | 1,707,466 | |
Class R6 | | | 362,237 | | | | 17,021,547 | | | | 1,558,098 | | | | 79,758,923 | |
Administrator Class | | | 80,235 | | | | 3,807,722 | | | | 200,283 | | | | 10,104,338 | |
Institutional Class | | | 161,465 | | | | 7,427,190 | | | | 238,407 | | | | 12,259,125 | |
| | | | |
| | | | | | | 42,216,804 | | | | | | | | 126,045,943 | |
| | | | |
Reinvestment of distributions | |
Class A | | | 2,918,252 | | | | 107,245,772 | | | | 1,969,729 | | | | 89,405,992 | |
Class C | | | 92,097 | | | | 3,029,996 | | | | 60,978 | | | | 2,564,729 | |
Class R | | | 9,145 | | | | 326,200 | | | | 3,414 | | | | 151,866 | |
Class R4 | | | 11,893 | | | | 451,084 | | | | 1,781 | | | | 82,592 | |
Class R6 | | | 1,625,721 | | | | 62,084,213 | | | | 1,305,992 | | | | 60,875,276 | |
Administrator Class | | | 388,367 | | | | 14,470,567 | | | | 278,848 | | | | 12,776,830 | |
Institutional Class | | | 407,144 | | | | 15,475,547 | | | | 442,110 | | | | 20,540,888 | |
| | | | |
| | | | | | | 203,083,379 | | | | | | | | 186,398,173 | |
| | | | |
Payment for shares redeemed | |
Class A | | | (878,863 | ) | | | (38,604,383 | ) | | | (2,346,522 | ) | | | (122,033,744 | ) |
Class C | | | (83,221 | ) | | | (3,097,480 | ) | | | (91,221 | ) | | | (4,306,948 | ) |
Class R | | | (24,794 | ) | | | (993,647 | ) | | | (81,531 | ) | | | (3,970,677 | ) |
Class R4 | | | (5,578 | ) | | | (260,695 | ) | | | (4,157 | ) | | | (212,862 | ) |
Class R6 | | | (735,877 | ) | | | (34,913,734 | ) | | | (2,739,730 | ) | | | (142,658,457 | ) |
Administrator Class | | | (429,862 | ) | | | (19,788,850 | ) | | | (576,443 | ) | | | (29,889,749 | ) |
Institutional Class | | | (494,230 | ) | | | (22,701,424 | ) | | | (2,213,468 | ) | | | (110,506,781 | ) |
| | | | |
| | | | | | | (120,360,213 | ) | | | | | | | (413,579,218 | ) |
| | | | |
Net increase (decrease) in net assets resulting from capital share transactions | | | | | | | 124,939,970 | | | | | | | | (101,135,102 | ) |
| | | | |
Total decrease in net assets | | | | | | | (124,337,131 | ) | | | | | | | (34,658,065 | ) |
| | | | |
| | |
Net assets | | | | | | | | |
Beginning of period | | | | | | | 1,060,935,453 | | | | | | | | 1,095,593,518 | |
| | | | |
End of period | | | | | | $ | 936,598,322 | | | | | | | $ | 1,060,935,453 | |
| | | | |
| 1 | Effective for all filings after November 4, 2018, the SEC prospectively eliminated the requirement to parenthetically disclose undistributed net investment income at the end of the period and permitted the aggregation of distributions, with the exception of tax basis returns of capital. Undistributed net investment income at July 31, 2018 was $112,534. The disaggregated distributions information for the year ended July 31, 2018 is included in Note 7,Distributions to Shareholders, in the notes to the financial statements. |
The accompanying notes are an integral part of these financial statements.
| | | | |
| 16 | | Wells Fargo Large Cap Growth Fund | | Financial highlights |
(For a share outstanding throughout each period)
| | | | | | | | | | | | | | | | | | | | | | | | |
| | | Six months ended January 31, 2019 (unaudited) | | | Year ended July 31 | |
| CLASS A | | 2018 | | | 2017 | | | 2016 | | | 2015 | | | 2014 | |
Net asset value, beginning of period | | | $52.01 | | | | $50.10 | | | | $46.05 | | | | $49.55 | | | | $45.30 | | | | $39.73 | |
Net investment loss | | | (0.00 | )1,2 | | | (0.08 | ) | | | (0.03 | )1 | | | (0.03 | )1 | | | (0.01 | )1 | | | (0.06 | ) |
Net realized and unrealized gains (losses) on investments | | | (2.17 | ) | | | 12.56 | | | | 6.39 | | | | (0.92 | ) | | | 6.33 | | | | 7.01 | |
| | | | | | | | | | | | | | | | | | | | | | | | |
Total from investment operations | | | (2.17 | ) | | | 12.48 | | | | 6.36 | | | | (0.95 | ) | | | 6.32 | | | | 6.95 | |
Distributions to shareholders from | | | | | | | | | | | | | | | | | | | | | | | | |
Net investment income | | | 0.00 | | | | 0.00 | | | | 0.00 | | | | (0.00 | )3 | | | 0.00 | | | | 0.00 | |
Net realized gains | | | (11.22 | ) | | | (10.57 | ) | | | (2.31 | ) | | | (2.55 | ) | | | (2.07 | ) | | | (1.38 | ) |
| | | | | | | | | | | | | | | | | | | | | | | | |
Total distributions to shareholders | | | (11.22 | ) | | | (10.57 | ) | | | (2.31 | ) | | | (2.55 | ) | | | (2.07 | ) | | | (1.38 | ) |
Net asset value, end of period | | | $38.62 | | | | $52.01 | | | | $50.10 | | | | $46.05 | | | | $49.55 | | | | $45.30 | |
Total return4 | | | (3.08 | )% | | | 27.98 | % | | | 14.60 | % | | | (1.83 | )% | | | 14.35 | % | | | 17.69 | % |
Ratios to average net assets (annualized) | | | | | | | | | | | | | | | | | | | | | | | | |
Gross expenses | | | 1.18 | % | | | 1.17 | % | | | 1.17 | % | | | 1.16 | % | | | 1.20 | % | | | 1.22 | % |
Net expenses | | | 1.07 | % | | | 1.07 | % | | | 1.07 | % | | | 1.07 | % | | | 1.07 | % | | | 1.07 | % |
Net investment loss | | | (0.01 | )% | | | (0.16 | )% | | | (0.06 | )% | | | (0.06 | )% | | | (0.02 | )% | | | (0.17 | )% |
Supplemental data | | | | | | | | | | | | | | | | | | | | | | | | |
Portfolio turnover rate | | | 27 | % | | | 34 | % | | | 40 | % | | | 31 | % | | | 26 | % | | | 35 | % |
Net assets, end of period (000s omitted) | | | $484,439 | | | | $534,694 | | | | $516,410 | | | | $576,502 | | | | $184,504 | | | | $212,273 | |
| 1 | Calculated based upon average shares outstanding |
| 2 | Amount is more than $(0.005). |
| 3 | Amount is less than $0.005. |
| 4 | Total return calculations do not include any sales charges. Returns for periods of less than one year are not annualized. |
The accompanying notes are an integral part of these financial statements.
| | | | | | |
| Financial highlights | | Wells Fargo Large Cap Growth Fund | | | 17 | |
(For a share outstanding throughout each period)
| | | | | | | | | | | | | | | | | | | | | | | | |
| | | Six months ended
January 31, 2019 (unaudited) | | | Year ended July 31 | |
| CLASS C | | 2018 | | | 2017 | | | 2016 | | | 2015 | | | 2014 | |
Net asset value, beginning of period | | | $47.97 | | | | $47.25 | | | | $43.88 | | | | $47.68 | | | | $43.99 | | | | $38.90 | |
Net investment loss | | | (0.16 | )1 | | | (0.31 | ) | | | (0.35 | )1 | | | (0.32 | )1 | | | (0.42 | ) | | | (0.33 | ) |
Net realized and unrealized gains (losses) on investments | | | (2.05 | ) | | | 11.60 | | | | 6.03 | | | | (0.93 | ) | | | 6.18 | | | | 6.80 | |
| | | | | | | | | | | | | | | | | | | | | | | | |
Total from investment operations | | | (2.21 | ) | | | 11.29 | | | | 5.68 | | | | (1.25 | ) | | | 5.76 | | | | 6.47 | |
Distributions to shareholders from | | | | | | | | | | | | | | | | | | | | | | | | |
Net realized gains | | | (11.22 | ) | | | (10.57 | ) | | | (2.31 | ) | | | (2.55 | ) | | | (2.07 | ) | | | (1.38 | ) |
Net asset value, end of period | | | $34.54 | | | | $47.97 | | | | $47.25 | | | | $43.88 | | | | $47.68 | | | | $43.99 | |
Total return2 | | | (3.44 | )% | | | 27.03 | % | | | 13.74 | % | | | (2.56 | )% | | | 13.47 | % | | | 16.81 | % |
Ratios to average net assets (annualized) | | | | | | | | | | | | | | | | | | | | | | | | |
Gross expenses | | | 1.93 | % | | | 1.92 | % | | | 1.91 | % | | | 1.91 | % | | | 1.95 | % | | | 1.97 | % |
Net expenses | | | 1.82 | % | | | 1.82 | % | | | 1.82 | % | | | 1.82 | % | | | 1.82 | % | | | 1.82 | % |
Net investment loss | | | (0.76 | )% | | | (0.90 | )% | | | (0.81 | )% | | | (0.75 | )% | | | (0.77 | )% | | | (0.89 | )% |
Supplemental data | | | | | | | | | | | | | | | | | | | | | | | | |
Portfolio turnover rate | | | 27 | % | | | 34 | % | | | 40 | % | | | 31 | % | | | 26 | % | | | 35 | % |
Net assets, end of period (000s omitted) | | | $13,296 | | | | $15,586 | | | | $14,640 | | | | $18,877 | | | | $22,839 | | | | $22,767 | |
| 1 | Calculated based upon average shares outstanding |
| 2 | Total return calculations do not include any sales charges. Returns for periods of less than one year are not annualized. |
The accompanying notes are an integral part of these financial statements.
| | | | |
| 18 | | Wells Fargo Large Cap Growth Fund | | Financial highlights |
(For a share outstanding throughout each period)
| | | | | | | | | | | | | | | | | | | | | | | | |
| | | Six months ended January 31, 2019 (unaudited) | | | Year ended July 31 | |
| CLASS R | | 2018 | | | 2017 | | | 2016 | | | 2015 | | | 2014 | |
Net asset value, beginning of period | | | $50.89 | | | | $49.34 | | | | $45.50 | | | | $49.11 | | | | $45.03 | | | | $39.59 | |
Net investment loss | | | (0.06 | )1 | | | (0.20 | )1 | | | (0.14 | )1 | | | (0.10 | )1 | | | (0.16 | )1 | | | (0.15 | ) |
Net realized and unrealized gains (losses) on investments | | | (2.14 | ) | | | 12.32 | | | | 6.29 | | | | (0.96 | ) | | | 6.31 | | | | 6.97 | |
| | | | | | | | | | | | | | | | | | | | | | | | |
Total from investment operations | | | (2.20 | ) | | | 12.12 | | | | 6.15 | | | | (1.06 | ) | | | 6.15 | | | | 6.82 | |
Distributions to shareholders from | | | | | | | | | | | | | | | | | | | | | | | | |
Net realized gains | | | (11.22 | ) | | | (10.57 | ) | | | (2.31 | ) | | | (2.55 | ) | | | (2.07 | ) | | | (1.38 | ) |
Net asset value, end of period | | | $37.47 | | | | $50.89 | | | | $49.34 | | | | $45.50 | | | | $49.11 | | | | $45.03 | |
Total return2 | | | (3.21 | )% | | | 27.65 | % | | | 14.30 | % | | | (2.08 | )% | | | 14.05 | % | | | 17.42 | % |
Ratios to average net assets (annualized) | | | | | | | | | | | | | | | | | | | | | | | | |
Gross expenses | | | 1.42 | % | | | 1.42 | % | | | 1.41 | % | | | 1.41 | % | | | 1.45 | % | | | 1.47 | % |
Net expenses | | | 1.32 | % | | | 1.32 | % | | | 1.32 | % | | | 1.32 | % | | | 1.32 | % | | | 1.32 | % |
Net investment loss | | | (0.26 | )% | | | (0.40 | )% | | | (0.31 | )% | | | (0.23 | )% | | | (0.28 | )% | | | (0.41 | )% |
Supplemental data | | | | | | | | | | | | | | | | | | | | | | | | |
Portfolio turnover rate | | | 27 | % | | | 34 | % | | | 40 | % | | | 31 | % | | | 26 | % | | | 35 | % |
Net assets, end of period (000s omitted) | | | $5,151 | | | | $5,661 | | | | $6,387 | | | | $8,218 | | | | $12,086 | | | | $12,295 | |
| 1 | Calculated based upon average shares outstanding |
| 2 | Returns for periods of less than one year are not annualized. |
The accompanying notes are an integral part of these financial statements.
| | | | | | |
| Financial highlights | | Wells Fargo Large Cap Growth Fund | | | 19 | |
(For a share outstanding throughout each period)
| | | | | | | | | | | | | | | | | | | | | | | | |
| | | Six months ended January 31, 2019 (unaudited) | | | Year ended July 31 | |
| CLASS R4 | | 2018 | | | 2017 | | | 2016 | | | 2015 | | | 2014 | |
Net asset value, beginning of period | | | $53.23 | | | | $50.94 | | | | $46.69 | | | | $50.23 | | | | $45.76 | | | | $40.05 | |
Net investment income | | | 0.06 | 1 | | | 0.05 | 1 | | | 0.11 | 1 | | | 0.13 | | | | 0.07 | | | | 0.08 | |
Net realized and unrealized gains (losses) on investments | | | (2.20 | ) | | | 12.81 | | | | 6.50 | | | | (0.95 | ) | | | 6.47 | | | | 7.11 | |
| | | | | | | | | | | | | | | | | | | | | | | | |
Total from investment operations | | | (2.14 | ) | | | 12.86 | | | | 6.61 | | | | (0.82 | ) | | | 6.54 | | | | 7.19 | |
Distributions to shareholders from | | | | | | | | | | | | | | | | | | | | | | | | |
Net investment income | | | 0.00 | | | | 0.00 | | | | (0.05 | ) | | | (0.17 | ) | | | 0.00 | | | | (0.10 | ) |
Net realized gains | | | (11.22 | ) | | | (10.57 | ) | | | (2.31 | ) | | | (2.55 | ) | | | (2.07 | ) | | | (1.38 | ) |
| | | | | | | | | | | | | | | | | | | | | | | | |
Total distributions to shareholders | | | (11.22 | ) | | | (10.57 | ) | | | (2.36 | ) | | | (2.72 | ) | | | (2.07 | ) | | | (1.48 | ) |
Net asset value, end of period | | | $39.87 | | | | $53.23 | | | | $50.94 | | | | $46.69 | | | | $50.23 | | | | $45.76 | |
Total return2 | | | (2.94 | )% | | | 28.31 | % | | | 14.96 | % | | | (1.54 | )% | | | 14.69 | % | | | 18.07 | % |
Ratios to average net assets (annualized) | | | | | | | | | | | | | | | | | | | | | | | | |
Gross expenses | | | 0.90 | % | | | 0.90 | % | | | 0.88 | % | | | 0.88 | % | | | 0.87 | % | | | 0.89 | % |
Net expenses | | | 0.80 | % | | | 0.80 | % | | | 0.80 | % | | | 0.78 | % | | | 0.75 | % | | | 0.75 | % |
Net investment income | | | 0.25 | % | | | 0.10 | % | | | 0.25 | % | | | 0.27 | % | | | 0.17 | % | | | 0.17 | % |
Supplemental data | | | | | | | | | | | | | | | | | | | | | | | | |
Portfolio turnover rate | | | 27 | % | | | 34 | % | | | 40 | % | | | 31 | % | | | 26 | % | | | 35 | % |
Net assets, end of period (000s omitted) | | | $2,094 | | | | $2,089 | | | | $337 | | | | $8,400 | | | | $7,205 | | | | $2,129 | |
| 1 | Calculated based upon average shares outstanding |
| 2 | Returns for periods of less than one year are not annualized. |
The accompanying notes are an integral part of these financial statements.
| | | | |
| 20 | | Wells Fargo Large Cap Growth Fund | | Financial highlights |
(For a share outstanding throughout each period)
| | | | | | | | | | | | | | | | | | | | | | | | |
| | | Six months ended January 31, 2019 (unaudited) | | | Year ended July 31 | |
| CLASS R6 | | 2018 | | | 2017 | | | 2016 | | | 2015 | | | 2014 | |
Net asset value, beginning of period | | | $53.49 | | | | $51.12 | | | | $46.82 | | | | $50.34 | | | | $45.82 | | | | $40.11 | |
Net investment income | | | 0.10 | 1 | | | 0.14 | | | | 0.17 | | | | 0.22 | | | | 0.07 | 1 | | | 0.12 | |
Net realized and unrealized gains (losses) on investments | | | (2.21 | ) | | | 12.85 | | | | 6.52 | | | | (0.97 | ) | | | 6.56 | | | | 7.11 | |
| | | | | | | | | | | | | | | | | | | | | | | | |
Total from investment operations | | | (2.11 | ) | | | 12.99 | | | | 6.69 | | | | (0.75 | ) | | | 6.63 | | | | 7.23 | |
Distributions to shareholders from | | | | | | | | | | | | | | | | | | | | | | | | |
Net investment income | | | (0.02 | ) | | | (0.05 | ) | | | (0.08 | ) | | | (0.22 | ) | | | (0.04 | ) | | | (0.14 | ) |
Net realized gains | | | (11.22 | ) | | | (10.57 | ) | | | (2.31 | ) | | | (2.55 | ) | | | (2.07 | ) | | | (1.38 | ) |
| | | | | | | | | | | | | | | | | | | | | | | | |
Total distributions to shareholders | | | (11.24 | ) | | | (10.62 | ) | | | (2.39 | ) | | | (2.77 | ) | | | (2.11 | ) | | | (1.52 | ) |
Net asset value, end of period | | | $40.14 | | | | $53.49 | | | | $51.12 | | | | $46.82 | | | | $50.34 | | | | $45.82 | |
Total return2 | | | (2.86 | )% | | | 28.51 | % | | | 15.09 | % | | | (1.39 | )% | | | 14.88 | % | | | 18.25 | % |
Ratios to average net assets (annualized) | | | | | | | | | | | | | | | | | | | | | | | | |
Gross expenses | | | 0.75 | % | | | 0.75 | % | | | 0.74 | % | | | 0.73 | % | | | 0.72 | % | | | 0.74 | % |
Net expenses | | | 0.65 | % | | | 0.65 | % | | | 0.65 | % | | | 0.64 | % | | | 0.60 | % | | | 0.60 | % |
Net investment income | | | 0.40 | % | | | 0.27 | % | | | 0.36 | % | | | 0.39 | % | | | 0.13 | % | | | 0.29 | % |
Supplemental data | | | | | | | | | | | | | | | | | | | | | | | | |
Portfolio turnover rate | | | 27 | % | | | 34 | % | | | 40 | % | | | 31 | % | | | 26 | % | | | 35 | % |
Net assets, end of period (000s omitted) | | | $296,321 | | | | $327,943 | | | | $307,048 | | | | $225,805 | | | | $117,741 | | | | $5,942 | |
| 1 | Calculated based upon average shares outstanding |
| 2 | Returns for periods of less than one year are not annualized. |
The accompanying notes are an integral part of these financial statements.
| | | | | | |
| Financial highlights | | Wells Fargo Large Cap Growth Fund | | | 21 | |
(For a share outstanding throughout each period)
| | | | | | | | | | | | | | | | | | | | | | | | |
| | | Six months ended
January 31, 2019 (unaudited) | | | Year ended July 31 | |
| ADMINISTRATOR CLASS | | 2018 | | | 2017 | | | 2016 | | | 2015 | | | 2014 | |
Net asset value, beginning of period | | | $52.54 | | | | $50.46 | | | | $46.32 | | | | $49.84 | | | | $45.50 | | | | $39.86 | |
Net investment income (loss) | | | 0.02 | | | | (0.01 | ) | | | 0.05 | | | | 0.05 | | | | 0.05 | | | | (0.01 | ) |
Net realized and unrealized gains (losses) on investments | | | (2.18 | ) | | | 12.66 | | | | 6.41 | | | | (0.94 | ) | | | 6.36 | | | | 7.04 | |
| | | | | | | | | | | | | | | | | | | | | | | | |
Total from investment operations | | | (2.16 | ) | | | 12.65 | | | | 6.46 | | | | (0.89 | ) | | | 6.41 | | | | 7.03 | |
Distributions to shareholders from | | | | | | | | | | | | | | | | | | | | | | | | |
Net investment income | | | 0.00 | | | | 0.00 | | | | (0.01 | ) | | | (0.08 | ) | | | 0.00 | | | | (0.01 | ) |
Net realized gains | | | (11.22 | ) | | | (10.57 | ) | | | (2.31 | ) | | | (2.55 | ) | | | (2.07 | ) | | | (1.38 | ) |
| | | | | | | | | | | | | | | | | | | | | | | | |
Total distributions to shareholders | | | (11.22 | ) | | | (10.57 | ) | | | (2.32 | ) | | | (2.63 | ) | | | (2.07 | ) | | | (1.39 | ) |
Net asset value, end of period | | | $39.16 | | | | $52.54 | | | | $50.46 | | | | $46.32 | | | | $49.84 | | | | $45.50 | |
Total return1 | | | (3.02 | )% | | | 28.14 | % | | | 14.75 | % | | | (1.71 | )% | | | 14.48 | % | | | 17.84 | % |
Ratios to average net assets (annualized) | | | | | | | | | | | | | | | | | | | | | | | | |
Gross expenses | | | 1.10 | % | | | 1.09 | % | | | 1.08 | % | | | 1.08 | % | | | 1.05 | % | | | 1.06 | % |
Net expenses | | | 0.95 | % | | | 0.95 | % | | | 0.95 | % | | | 0.95 | % | | | 0.95 | % | | | 0.95 | % |
Net investment income (loss) | | | 0.10 | % | | | (0.03 | )% | | | 0.06 | % | | | 0.12 | % | | | 0.10 | % | | | (0.02 | )% |
Supplemental data | | | | | | | | | | | | | | | | | | | | | | | | |
Portfolio turnover rate | | | 27 | % | | | 34 | % | | | 40 | % | | | 31 | % | | | 26 | % | | | 35 | % |
Net assets, end of period (000s omitted) | | | $60,514 | | | | $79,154 | | | | $80,937 | | | | $237,577 | | | | $262,535 | | | | $245,364 | |
| 1 | Returns for periods of less than one year are not annualized. |
The accompanying notes are an integral part of these financial statements.
| | | | |
| 22 | | Wells Fargo Large Cap Growth Fund | | Financial highlights |
(For a share outstanding throughout each period)
| | | | | | | | | | | | | | | | | | | | | | | | |
| | | Six months ended
January 31, 2019 (unaudited) | | | Year ended July 31 | |
| INSTITUTIONAL CLASS | | 2018 | | | 2017 | | | 2016 | | | 2015 | | | 2014 | |
Net asset value, beginning of period | | | $53.31 | | | | $51.00 | | | | $46.74 | | | | $50.30 | | | | $45.80 | | | | $40.11 | |
Net investment income | | | 0.08 | 1 | | | 0.10 | 1 | | | 0.12 | 1 | | | 0.17 | 1 | | | 0.19 | 1 | | | 0.11 | |
Net realized and unrealized gains (losses) on investments | | | (2.21 | ) | | | 12.80 | | | | 6.51 | | | | (0.96 | ) | | | 6.41 | | | | 7.09 | |
| | | | | | | | | | | | | | | | | | | | | | | | |
Total from investment operations | | | (2.13 | ) | | | 12.90 | | | | 6.63 | | | | (0.79 | ) | | | 6.60 | | | | 7.20 | |
Distributions to shareholders from | | | | | | | | | | | | | | | | | | | | | | | | |
Net investment income | | | 0.00 | | | | (0.02 | ) | | | (0.06 | ) | | | (0.22 | ) | | | (0.03 | ) | | | (0.13 | ) |
Net realized gains | | | (11.22 | ) | | | (10.57 | ) | | | (2.31 | ) | | | (2.55 | ) | | | (2.07 | ) | | | (1.38 | ) |
| | | | | | | | | | | | | | | | | | | | | | | | |
Total distributions to shareholders | | | (11.22 | ) | | | (10.59 | ) | | | (2.37 | ) | | | (2.77 | ) | | | (2.10 | ) | | | (1.51 | ) |
Net asset value, end of period | | | $39.96 | | | | $53.31 | | | | $51.00 | | | | $46.74 | | | | $50.30 | | | | $45.80 | |
Total return2 | | | (2.92 | )% | | | 28.37 | % | | | 14.98 | % | | | (1.49 | )% | | | 14.82 | % | | | 18.16 | % |
Ratios to average net assets (annualized) | | | | | | | | | | | | | | | | | | | | | | | | |
Gross expenses | | | 0.85 | % | | | 0.84 | % | | | 0.83 | % | | | 0.83 | % | | | 0.78 | % | | | 0.79 | % |
Net expenses | | | 0.75 | % | | | 0.75 | % | | | 0.75 | % | | | 0.71 | % | | | 0.65 | % | | | 0.65 | % |
Net investment income | | | 0.31 | % | | | 0.18 | % | | | 0.27 | % | | | 0.37 | % | | | 0.40 | % | | | 0.28 | % |
Supplemental data | | | | | | | | | | | | | | | | | | | | | | | | |
Portfolio turnover rate | | | 27 | % | | | 34 | % | | | 40 | % | | | 31 | % | | | 26 | % | | | 35 | % |
Net assets, end of period (000s omitted) | | | $74,783 | | | | $95,809 | | | | $169,836 | | | | $316,310 | | | | $534,975 | | | | $596,006 | |
| 1 | Calculated based upon average shares outstanding |
| 2 | Returns for periods of less than one year are not annualized. |
The accompanying notes are an integral part of these financial statements.
| | | | | | |
| Notes to financial statements (unaudited) | | Wells Fargo Large Cap Growth Fund | | | 23 | |
1. ORGANIZATION
Wells Fargo Funds Trust (the “Trust”), a Delaware statutory trust organized on March 10, 1999, is anopen-end management investment company registered under the Investment Company Act of 1940, as amended (the “1940 Act”). As an investment company, the Trust follows the accounting and reporting guidance in Financial Accounting Standards Board (“FASB”)Accounting Standards Codification Topic 946, Financial Services – Investment Companies. These financial statements report on the Wells Fargo Large Cap Growth Fund (the “Fund”) which is a diversified series of the Trust.
2. SIGNIFICANT ACCOUNTING POLICIES
The following significant accounting policies, which are consistently followed in the preparation of the financial statements of the Fund, are in conformity with U.S. generally accepted accounting principles which require management to make estimates and assumptions that affect the reported amounts of assets and liabilities, disclosure of contingent assets and liabilities at the date of the financial statements, and the reported amounts of revenues and expenses during the reporting period. Actual results could differ from those estimates.
Securities valuation
All investments are valued each business day as of the close of regular trading on the New York Stock Exchange (generally 4 p.m. Eastern Time), although the Fund may deviate from this calculation time under unusual or unexpected circumstances.
Equity securities that are listed on a foreign or domestic exchange or market are valued at the official closing price or, if none, the last sales price. If no sale occurs on the principal exchange or market that day, a fair value price will be determined in accordance with the Fund’s Valuation Procedures.
Investments in registeredopen-end investment companies are valued at net asset value. Interests innon-registered investment companies that are redeemable at net asset value are fair valued normally at net asset value.
Investments which are not valued using any of the methods discussed above are valued at their fair value, as determined in good faith by the Board of Trustees of the Fund. The Board of Trustees has established a Valuation Committee comprised of the Trustees and has delegated to it the authority to take any actions regarding the valuation of portfolio securities that the Valuation Committee deems necessary or appropriate, including determining the fair value of portfolio securities, unless the determination has been delegated to the Wells Fargo Asset Management Pricing Committee at Wells Fargo Funds Management, LLC (“Funds Management”). The Board of Trustees retains the authority to make or ratify any valuation decisions or approve any changes to the Valuation Procedures as it deems appropriate. On a quarterly basis, the Board of Trustees receives reports on any valuation actions taken by the Valuation Committee or the Wells Fargo Asset Management Pricing Committee which may include items for ratification.
Foreign currency translation
The accounting records of the Fund are maintained in U.S. dollars. The values of other assets and liabilities denominated in foreign currencies are translated into U.S. dollars at rates provided by an independent foreign currency pricing source at a time each business day specified by the Wells Fargo Asset Management Pricing Committee. Purchases and sales of securities, and income and expenses are converted at the rate of exchange on the respective dates of such transactions. Net realized foreign exchange gains or losses arise from sales of foreign currencies, currency gains or losses realized between the trade and settlement dates on securities transactions, and the difference between the amounts of dividends, interest and foreign withholding taxes recorded and the U.S. dollar equivalent of the amounts actually paid or received. Net unrealized foreign exchange gains and losses arise from changes in the fair value of assets and liabilities other than investments in securities resulting from changes in exchange rates. The changes in net assets arising from changes in exchange rates of securities and the changes in net assets resulting from changes in market prices of securities are not separately presented. Such changes are included in net realized and unrealized gains or losses from investments.
Securities lending
The Fund may lend its securities from time to time in order to earn additional income in the form of fees or interest on securities received as collateral or the investment of any cash received as collateral. The Fund continues to receive interest or dividends on the securities loaned. The Fund receives collateral in the form of cash or securities with a value at least equal to the value of the securities on loan. The value of the loaned securities is determined at the close of each business day and any additional required collateral is delivered to the Fund on the next business day. In a securities lending transaction, the net asset value of the Fund will be affected by an increase or decrease in the value of the securities loaned and by an increase or decrease in the value of the instrument in which collateral is invested. The amount
| | | | |
| 24 | | Wells Fargo Large Cap Growth Fund | | Notes to financial statements (unaudited) |
of securities lending activity undertaken by the Fund fluctuates from time to time. In the event of default or bankruptcy by the borrower, the Fund may be prevented from recovering the loaned securities or gaining access to the collateral or may experience delays or costs in doing so. In addition, the investment of any cash collateral received may lose all or part of its value. The Fund has the right under the lending agreement to recover the securities from the borrower on demand.
The Fund lends its securities through an unaffiliated securities lending agent. Cash collateral received in connection with its securities lending transactions is invested in Securities Lending Cash Investments, LLC (the “Securities Lending Fund”). The Securities Lending Fund is exempt from registration under Section 3(c)(7) of the 1940 Act and is managed by Funds Management and is subadvised by Wells Capital Management Incorporated (“WellsCap”), an affiliate of Funds Management and an indirect wholly owned subsidiary of Wells Fargo & Company (“Wells Fargo”). Funds Management receives an advisory fee starting at 0.05% and declining to 0.01% as the average daily net assets of the Securities Lending Fund increase. All of the fees received by Funds Management are paid to WellsCap for its services as subadviser. The Securities Lending Fund seeks to provide a positive return compared to the daily Fed Funds Open Rate by investing in high-quality, U.S. dollar-denominated short-term money market instruments. Securities Lending Fund investments are valued at the evaluated bid price provided by an independent pricing service. Income earned from investment in the Securities Lending Fund (net of fees and rebates), if any, is included in income from affiliated securities on the Statement of Operations.
Security transactions and income recognition
Securities transactions are recorded on a trade date basis. Realized gains or losses are recorded on the basis of identified cost.
Dividend income is recognized on theex-dividend date. Dividend income is recorded net of foreign taxes withheld where recovery of such taxes is not assured.
Distributions to shareholders
Distributions to shareholders from net investment income and any net realized gains are recorded on theex-dividend date and paid at least annually. Such distributions are determined in accordance with income tax regulations and may differ from U.S. generally accepted accounting principles. Dividend sources are estimated at the time of declaration. The tax character of distributions is determined as of the Fund’s fiscal year end. Therefore, a portion of the Fund’s distributions made prior to the Fund’s fiscal year end may be categorized as a tax return of capital at year end.
Federal and other taxes
The Fund intends to continue to qualify as a regulated investment company by distributing substantially all of its investment company taxable income and any net realized capital gains (after reduction for capital loss carryforwards) sufficient to relieve it from all, or substantially all, federal income taxes. Accordingly, no provision for federal income taxes was required.
The Fund’s income and federal excise tax returns and all financial records supporting those returns for the prior three fiscal years are subject to examination by the federal and Delaware revenue authorities. Management has analyzed the Fund’s tax positions taken on federal, state, and foreign tax returns for all open tax years and does not believe that there are any uncertain tax positions that require recognition of a tax liability.
As of January 31, 2019, the aggregate cost of all investments for federal income tax purposes was $521,422,865 and the unrealized gains (losses) consisted of:
| | | | |
| |
Gross unrealized gains | | $ | 444,796,642 | |
| |
Gross unrealized losses | | | (275,992 | ) |
| |
Net unrealized gains | | $ | 444,520,650 | |
Class allocations
The separate classes of shares offered by the Fund differ principally in applicable sales charges, distribution, shareholder servicing, and administration fees. Class specific expenses are charged directly to that share class. Investment income, common expenses, and realized and unrealized gains (losses) on investments are allocated daily to each class of shares based on the relative proportion of net assets of each class.
| | | | | | |
| Notes to financial statements (unaudited) | | Wells Fargo Large Cap Growth Fund | | | 25 | |
3. FAIR VALUATION MEASUREMENTS
Fair value measurements of investments are determined within a framework that has established a fair value hierarchy based upon the various data inputs utilized in determining the value of the Fund’s investments. The three-level hierarchy gives the highest priority to unadjusted quoted prices in active markets for identical assets or liabilities (Level 1) and the lowest priority to unobservable inputs (Level 3). The Fund’s investments are classified within the fair value hierarchy based on the lowest level of input that is significant to the fair value measurement. The inputs are summarized into three broad levels as follows:
| ∎ | | Level 1 – quoted prices in active markets for identical securities |
| ∎ | | Level 2 – other significant observable inputs (including quoted prices for similar securities, interest rates, prepayment speeds, credit risk, etc.) |
| ∎ | | Level 3 – significant unobservable inputs (including the Fund’s own assumptions in determining the fair value of investments) |
The inputs or methodologies used for valuing investments in securities are not necessarily an indication of the risk associated with investing in those securities.
The following is a summary of the inputs used in valuing the Fund’s assets and liabilities as of January 31, 2019:
| | | | | | | | | | | | | | | | |
| | | | |
| | | Quoted prices
(Level 1) | | | Other significant
observable inputs
(Level 2) | | | Significant
unobservable inputs (Level 3) | | | Total | |
| | | | |
Assets | | | | | | | | | | | | | | | | |
Investments in: | | | | | | | | | | | | | | | | |
| | | | |
Common stocks | | | | | | | | | | | | | | | | |
| | | | |
Communication services | | $ | 117,065,190 | | | $ | 0 | | | $ | 0 | | | $ | 117,065,190 | |
| | | | |
Consumer discretionary | | | 145,302,949 | | | | 0 | | | | 0 | | | | 145,302,949 | |
| | | | |
Consumer staples | | | 35,904,552 | | | | 0 | | | | 0 | | | | 35,904,552 | |
| | | | |
Energy | | | 9,196,522 | | | | 0 | | | | 0 | | | | 9,196,522 | |
| | | | |
Financials | | | 48,908,401 | | | | 0 | | | | 0 | | | | 48,908,401 | |
| | | | |
Health care | | | 95,033,282 | | | | 0 | | | | 0 | | | | 95,033,282 | |
| | | | |
Industrials | | | 119,057,956 | | | | 0 | | | | 0 | | | | 119,057,956 | |
| | | | |
Information technology | | | 341,566,791 | | | | 0 | | | | 0 | | | | 341,566,791 | |
| | | | |
Materials | | | 12,822,653 | | | | 0 | | | | 0 | | | | 12,822,653 | |
| | | | |
Real estate | | | 3,252,825 | | | | 0 | | | | 0 | | | | 3,252,825 | |
| | | | |
Short-term investments | | | | | | | | | | | | | | | | |
| | | | |
Investment companies | | | 11,987,303 | | | | 25,845,091 | | | | 0 | | | | 37,832,394 | |
| | | | |
Total assets | | $ | 940,098,424 | | | $ | 25,845,091 | | | $ | 0 | | | $ | 965,943,515 | |
Additional sector, industry or geographic detail is included in the Portfolio of Investments.
At January 31, 2019, the Fund did not have any transfers into/out of Level 3.
4. TRANSACTIONS WITH AFFILIATES
Management fee
Funds Management, an indirect wholly owned subsidiary of Wells Fargo, is the manager of the Fund and provides advisory and fund-level administrative services under an investment management agreement. Under the investment management agreement, Funds Management is responsible for, among other services, implementing the investment objectives and strategies of the Fund, supervising the subadviser and providing fund-level administrative services in connection with the Fund’s operations. As compensation for its services under the investment management agreement, Funds Management is entitled to receive an annual management fee starting at 0.70% and declining to 0.505% as the average daily net assets of the Fund increase. For the six months ended January 31, 2019, the management fee was equivalent to an annual rate of 0.69% of the Fund’s average daily net assets.
| | | | |
| 26 | | Wells Fargo Large Cap Growth Fund | | Notes to financial statements (unaudited) |
Funds Management has retained the services of a subadviser to provide daily portfolio management to the Fund. The fee for subadvisory services is borne by Funds Management. WellsCap is the subadviser to the Fund and is entitled to receive a fee from Funds Management at an annual rate starting at 0.30% and declining to 0.20% as the average daily net assets of the Fund increase.
Administration fees
Under a class-level administration agreement, Funds Management provides class-level administrative services to the Fund, which includes paying fees and expenses for services provided by the transfer agent,sub-transfer agents, omnibus account servicers and record-keepers. As compensation for its services under the class-level administration agreement, Funds Management receives an annual fee which is calculated based on the average daily net assets of each class as follows:
| | | | |
| | | Class-level
administration fee | |
| |
Class A, Class C, Class R | | | 0.21 | % |
| |
Class R4 | | | 0.08 | |
| |
Class R6 | | | 0.03 | |
| |
Administrator Class, Institutional Class | | | 0.13 | |
Funds Management has contractually waived and/or reimbursed management and administration fees to the extent necessary to maintain certain net operating expense ratios for the Fund. When each class of the Fund has exceeded its expense cap, Funds Management has waived fees and/or reimbursed expenses from fund level expenses on a proportionate basis and then from class specific expenses; otherwise, waivers and/or reimbursements are applied against class specific expenses before fund level expenses. Funds Management has committed through November 30, 2019 to waive fees and/or reimburse expenses to the extent necessary to cap the Fund’s expenses at 1.07% for Class A shares, 1.82% for Class C shares, 1.32% for Class R shares, 0.80% for Class R4 shares, 0.65% for Class R6 shares, 0.95% for Administrator Class shares, and 0.75% for Institutional Class shares. Prior to or after the commitment expiration date, the cap may be increased or the commitment to maintain the cap may be terminated only with the approval of the Board of Trustees.
Distribution fees
The Trust has adopted a distribution plan for Class C and Class R shares of the Fund pursuant to Rule12b-1 under the 1940 Act. Distribution fees are charged to Class C and Class R shares and paid to Wells Fargo Funds Distributor, LLC (“Fund Distributor”), the principal underwriter, at an annual rate of 0.75% of the average daily net assets of Class C shares and 0.25% of the average daily net assets of Class R shares.
In addition, Funds Distributor is entitled to receive thefront-end sales charge from the purchase of Class A shares and a contingent deferred sales charge on the redemption of certain Class A shares. Funds Distributor is also entitled to receive the contingent deferred sales charges from redemptions of Class C shares. For the six months ended January 31, 2019, Funds Distributor received $1,488 from the sale of Class A shares. No contingent deferred sales charges were incurred by Class A and Class C shares for the six months ended January 31, 2019.
Shareholder servicing fees
The Trust has entered into contracts with one or more shareholder servicing agents, whereby Class A, Class C, Class R, and Administrator Class of the Fund are charged a fee at an annual rate of 0.25% of the average daily net assets of each respective class. Class R4 is charged a fee at an annual rate of 0.10% of its average daily net assets.
A portion of these total shareholder servicing fees were paid to affiliates of Wells Fargo.
Interfund transactions
The Fund may purchase or sell portfolio investment securities to certain other Wells Fargo affiliates pursuant to Rule17a-7 under the 1940 Act and under procedures adopted by the Board of Trustees. The procedures have been designed to ensure that these interfund transactions, which do not incur broker commissions, are effected at current market prices.
5. INVESTMENT PORTFOLIO TRANSACTIONS
Purchases and sales of investments, excluding U.S. government obligations (if any) and short-term securities, for the six months ended January 31, 2019 were $265,709,463 and $352,784,072, respectively.
| | | | | | |
| Notes to financial statements (unaudited) | | Wells Fargo Large Cap Growth Fund | | | 27 | |
6. BANK BORROWINGS
The Trust (excluding the money market funds), Wells Fargo Master Trust and Wells Fargo Variable Trust are parties to a $280,000,000 revolving credit agreement whereby the Fund is permitted to use bank borrowings for temporary or emergency purposes, such as to fund shareholder redemption requests. Interest under the credit agreement is charged to the Fund based on a borrowing rate equal to the higher of the Federal Funds rate in effect on that day plus 1.25% or the overnight LIBOR rate in effect on that day plus 1.25%. In addition, an annual commitment fee equal to 0.25% of the unused balance is allocated to each participating fund.
For the six months ended January 31, 2019, there were no borrowings by the Fund under the agreement.
7. DISTRIBUTIONS TO SHAREHOLDERS
Effective for all filings after November 4, 2018, the Securities and Exchange Commission eliminated the requirement to separately state the components of distributions to shareholders under U.S. generally accepted accounting principles. The amounts of distributions to shareholders for the year ended July 31, 2018 were as follows:
| | | | | | | | |
| | | Net investment
income | | | Net realized
gains | |
| | |
Class A | | $ | 0 | | | $ | 94,299,274 | |
| | |
Class C | | | 0 | | | | 2,995,367 | |
| | |
Class R | | | 0 | | | | 1,226,176 | |
| | |
Class R4 | | | 0 | | | | 86,325 | |
| | |
Class R6 | | | 368,832 | | | | 60,525,258 | |
| | |
Administrator Class | | | 0 | | | | 12,791,477 | |
| | |
Institutional Class | | | 76,634 | | | | 29,516,610 | |
8. CONCENTRATION RISK
Concentration risks result from exposure to a limited number of sectors. A fund that invests a substantial portion of its assets in any sector may be more affected by changes in that sector than would be a fund whose investments are not heavily weighted in any sector.
9. INDEMNIFICATION
Under the Trust’s organizational documents, the officers and Trustees have been granted certain indemnification rights against certain liabilities that may arise out of performance of their duties to the Trust. Additionally, in the normal course of business, the Trust may enter into contracts with service providers that contain a variety of indemnification clauses. The Trust’s maximum exposure under these arrangements is dependent on future claims that may be made against the Fund and, therefore, cannot be estimated.
10. NEW ACCOUNTING PRONOUNCEMENT
In August 2018, FASB issued Accounting Standards Update (“ASU”)No. 2018-13, Fair Value Measurement (Topic 820)Disclosure Framework—Changes to the Disclosure Requirements for Fair Value Measurement. ASU2018-13 updates the disclosure requirements for fair value measurements by modifying or removing certain disclosures and adding certain new disclosures. The amendments are effective for fiscal years, and interim periods within those fiscal years, beginning after December 15, 2019. Early adoption is permitted. Management has adopted the removal and modification of disclosures early, as permitted, and will adopt the additional new disclosures at the effective date.
| | | | |
| 28 | | Wells Fargo Large Cap Growth Fund | | Other information (unaudited) |
PROXY VOTING INFORMATION
A description of the policies and procedures used to determine how to vote proxies relating to portfolio securities is available, upon request, by calling1-800-222-8222, visiting our website atwellsfargofunds.com, or visiting the SEC website at sec.gov. Information regarding how the Fund voted proxies relating to portfolio securities during the most recent12-month period ended June 30 is available on the Fund’s website atwellsfargofunds.comor by visiting the SEC website at sec.gov.
PORTFOLIO HOLDINGS INFORMATION
The complete portfolio holdings for the Fund are publicly available monthly on the Fund’s website (wellsfargofunds.com), on aone-month delayed basis. In addition, top ten holdings information (excluding derivative positions) for the Fund is publicly available on the Fund’s website on a monthly,seven-day or more delayed basis. The Fund files its complete schedule of portfolio holdings with the SEC for the first and third quarters of each fiscal year on FormN-Q, which is available by visiting the SEC website at sec.gov. In addition, the Fund’s FormN-Q may be reviewed and copied at the SEC’s Public Reference Room in Washington, DC, and at regional offices in New York City, at 233 Broadway, and in Chicago, at 175 West Jackson Boulevard, Suite 900. Information about the Public Reference Room may be obtained by calling1-800-SEC-0330.
| | | | | | |
| Other information (unaudited) | | Wells Fargo Large Cap Growth Fund | | | 29 | |
BOARD OF TRUSTEES AND OFFICERS
Each of the Trustees and Officers1 listed in the table below acts in identical capacities for each fund in the Wells Fargo family of funds, which consists of 152 mutual funds comprising the Wells Fargo Funds Trust, Wells Fargo Variable Trust, Wells Fargo Master Trust and fourclosed-end funds (collectively the “Fund Complex”). This table should be read in conjunction with the Prospectus and the Statement of Additional Information2. The mailing address of each Trustee and Officer is 525 Market Street, 12th Floor, San Francisco, CA 94105. Each Trustee and Officer serves an indefinite term, however, each Trustee serves such term until reaching the mandatory retirement age established by the Trustees.
Independent Trustees
| | | | | | |
Name and
year of birth | | Position held and
length of service* | | Principal occupations during past five years or longer | | Current other
public company or
investment company
directorships |
| | | |
| William R. Ebsworth (Born 1957) | | Trustee, since 2015 | | Retired. From 1984 to 2013, equities analyst, portfolio manager, research director and chief investment officer at Fidelity Management and Research Company in Boston, Tokyo, and Hong Kong, and retired in 2013 as Chief Investment Officer of Fidelity Strategic Advisers, Inc. where he led a team of investment professionals managing client assets. Prior thereto, Board member of Hong Kong Securities Clearing Co., Hong Kong Options Clearing Corp., the Thailand International Fund, Ltd., Fidelity Investments Life Insurance Company, and Empire Fidelity Investments Life Insurance Company. Audit Committee Chair and Investment Committee Chair of the Vincent Memorial Hospital Endowment(non-profit organization). Mr. Ebsworth is a CFA® charterholder. | | N/A |
| | | |
| Jane A. Freeman (Born 1953) | | Trustee, since 2015; Chair Liaison, since 2018 | | Retired. From 2012 to 2014 and 1999 to 2008, Chief Financial Officer of Scientific Learning Corporation. From 2008 to 2012, Ms. Freeman provided consulting services related to strategic business projects. Prior to 1999, Portfolio Manager at Rockefeller & Co. and Scudder, Stevens & Clark. Board member of the Harding Loevner Funds from 1996 to 2014, serving as both Lead Independent Director and chair of the Audit Committee. Board member of the Russell Exchange Traded Funds Trust from 2011 to 2012 and the chair of the Audit Committee. Ms. Freeman is a Board Member of The Ruth Bancroft Garden(non-profit organization). She is also an inactive Chartered Financial Analyst. | | N/A |
| | | |
| Isaiah Harris, Jr.3(Born 1952) | | Trustee, since 2009; Audit Committee Chairman, since 2019 | | Retired. Chairman of the Board of CIGNA Corporation since 2009, and Director since 2005. From 2003 to 2011, Director of Deluxe Corporation. Prior thereto, President and CEO of BellSouth Advertising and Publishing Corp. from 2005 to 2007, President and CEO of BellSouth Enterprises from 2004 to 2005 and President of BellSouth Consumer Services from 2000 to 2003. Emeritus member of the Iowa State University Foundation Board of Governors. Emeritus Member of the Advisory Board of Iowa State University School of Business. Advisory Board Member, Palm Harbor Academy (private school). Advisory Board Member, Child Evangelism Fellowship(non-profit). Mr. Harris is a certified public accountant (inactive status). | | CIGNA Corporation |
| | | |
| Judith M. Johnson3(Born 1949) | | Trustee, since 2008; Audit Committee Chairman, from 2009 to 2018 | | Retired. Prior thereto, Chief Executive Officer and Chief Investment Officer of Minneapolis Employees Retirement Fund from 1996 to 2008. Ms. Johnson is an attorney, certified public accountant and a certified managerial accountant. | | N/A |
| | | |
| David F. Larcker (Born 1950) | | Trustee, since 2009 | | James Irvin Miller Professor of Accounting at the Graduate School of Business, Stanford University, Director of the Corporate Governance Research Initiative and Senior Faculty of The Rock Center for Corporate Governance since 2006. From 2005 to 2008, Professor of Accounting at the Graduate School of Business, Stanford University. Prior thereto, Ernst & Young Professor of Accounting at The Wharton School, University of Pennsylvania from 1985 to 2005. | | N/A |
| | | | |
| 30 | | Wells Fargo Large Cap Growth Fund | | Other information (unaudited) |
| | | | | | |
Name and
year of birth | | Position held and
length of service* | | Principal occupations during past five years or longer | | Current other
public company or
investment company
directorships |
| | | |
| Olivia S. Mitchell (Born 1953) | | Trustee, since 2006; Nominating and Governance Committee Chairman, since 2018 | | International Foundation of Employee Benefit Plans Professor, Wharton School of the University of Pennsylvania since 1993. Director of Wharton’s Pension Research Council and Boettner Center on Pensions & Retirement Research, and Research Associate at the National Bureau of Economic Research. Previously, Cornell University Professor from 1978 to 1993. | | N/A |
| | | |
| Timothy J. Penny (Born 1951) | | Trustee, since 1996; Chairman, since 2018; Vice Chairman, from 2017 to 2018 | | President and Chief Executive Officer of Southern Minnesota Initiative Foundation, anon-profit organization, since 2007. Member of the Board of Trustees of NorthStar Education Finance, Inc., anon-profit organization, since 2007. | | N/A |
| | | |
| James G. Polisson (Born 1959) | | Trustee, since 2018; Advisory Board Member, from 2017 to 2018 | | Retired. Chief Marketing Officer, Source (ETF) UK Services, Ltd, from 2015 to 2017. From 2012 to 2015, Principal of The Polisson Group, LLC, a management consulting, corporate advisory and principal investing company. Chief Executive Officer and Managing Director at Russell Investments, Global Exchange Traded Funds from 2010 to 2012. Managing Director of Barclays Global Investors from 1998 to 2010 and Global Chief Marketing Officer for iShares and Barclays Global Investors from 2000 to 2010. Trustee of the San Francisco Mechanics’ Institute, anon-profit organization, from 2013 to 2015. Board member of the Russell Exchange Traded Fund Trust from 2011 to 2012. Director of Barclays Global Investors Holdings Deutschland GmbH from 2006 to 2009. Mr. Polisson is an attorney and has a retired status with the Massachusetts and District of Columbia Bar Associations. | | N/A |
| | | |
| Pamela Wheelock (Born 1959) | | Trustee, since 2018; Advisory Board Member, from 2017 to 2018 | | Board member of the Destination Medical Center Economic Development Agency, Rochester, Minnesota since 2019. Chief Operating Officer, Twin Cities Habitat for Humanity from 2017 to 2019. Vice President of University Services, University of Minnesota from 2012 to 2016. Prior thereto, on the Board of Directors, Governance Committee and Finance Committee for the Minnesota Philanthropy Partners (Saint Paul Foundation) from 2012 to 2018, Interim Chief Executive Officer of Blue Cross Blue Shield of Minnesota from 2011 to 2012, Chairman of the Board from 2009 to 2012 and Board Director from 2003 to 2015. Vice President, Leadership and Community Engagement, Bush Foundation, Saint Paul, Minnesota (a private foundation) from 2009 to 2011. Executive Vice President and Chief Financial Officer, Minnesota Sports and Entertainment from 2004 to 2009 and Senior Vice President from 2002 to 2004. Executive Vice President of the Minnesota Wild Foundation from 2004 to 2008. Commissioner of Finance, State of Minnesota, from 1999 to 2002. Currently Board Chair of the Minnesota Wild Foundation since 2010. | | N/A |
| * | Length of service dates reflect the Trustee’s commencement of service with the Trust’s predecessor entities, where applicable. |
| | | | | | |
| Other information (unaudited) | | Wells Fargo Large Cap Growth Fund | | | 31 | |
Officers
| | | | | | |
Name and
year of birth | | Position held and
length of service | | Principal occupations during past five years or longer | | |
| | | |
| Andrew Owen (Born 1960) | | President, since 2017 | | Executive Vice President of Wells Fargo & Company and Head of Affiliated Managers, Wells Fargo Asset Management, since 2014. In addition, Mr. Owen is currently President, Chief Executive Officer and Director of Wells Fargo Funds Management, LLC since 2017. Prior thereto, Executive Vice President responsible for marketing, investments and product development for Wells Fargo Funds Management, LLC, from 2009 to 2014. | | |
| | | |
| Jeremy DePalma1(Born 1974) | | Treasurer, since 2012 | | Senior Vice President of Wells Fargo Funds Management, LLC since 2009. Senior Vice President of Evergreen Investment Management Company, LLC from 2008 to 2010 and head of the Fund Reporting and Control Team within Fund Administration from 2005 to 2010. | | |
| | | |
| Alexander Kymn (Born 1973) | | Secretary, since 2018; Chief Legal Officer, since 2018 | | Senior Company Counsel of Wells Fargo Bank, N.A. since 2018 (previously Senior Counsel from 2007 to 2018). Vice President of Wells Fargo Funds Management, LLC from 2008 to 2014. | | |
| | | |
| Michael H. Whitaker(Born 1967) | | Chief Compliance Officer, since 2016 | | Senior Vice President and Chief Compliance Officer since 2016. Senior Vice President and Chief Compliance Officer for Fidelity Investments from 2007 to 2016. | | |
| | | |
| David Berardi (Born 1975) | | Assistant Treasurer, since 2009 | | Vice President of Wells Fargo Funds Management, LLC since 2009. Vice President of Evergreen Investment Management Company, LLC from 2008 to 2010. Manager of Fund Reporting and Control for Evergreen Investment Management Company, LLC from 2004 to 2010. | | |
| 1 | Jeremy DePalma acts as Treasurer of 76 funds and Assistant Treasurer of 76 funds in the Fund Complex. |
| 2 | The Statement of Additional Information includes additional information about the Trustees and is available, without charge, upon request, by calling1-800-260-5969 or by visiting the website atwellsfargofunds.com. |
| 3 | Mr. Harris became Chairman of the Audit Committee effective January 1, 2019. |
| | | | |
| 32 | | Wells Fargo Large Cap Growth Fund | | Appendix A (unaudited) |
SALES CHARGE REDUCTIONS AND WAIVERS FOR CERTAIN INTERMEDIARIES
Raymond James & Associates, Inc., Raymond James Financial Services & Raymond James affiliates (“Raymond James”)
Effective on or about March 1, 2019, shareholders purchasing Fund shares through a Raymond James platform or account will be eligible only for the following load waivers(front-end sales charge waivers and contingent deferred, orback-end, sales charge waivers) and discounts, which may differ from those disclosed elsewhere in the Fund’s Prospectus or SAI.
Front-end Sales Load Waivers on Class A shares Available at Raymond James
| | • | | Shares purchased in an investment advisory program. |
| | • | | Shares purchased through reinvestment of capital gains distributions and dividend reinvestment when purchasing shares of the same fund (but not any other fund within the fund family). |
| | • | | Employees and registered representatives of Raymond James or its affiliates and their family members as designated by Raymond James. |
| | • | | Shares purchased from the proceeds of redemptions within the same fund family, provided (1) the repurchase occurs within 90 days following the redemption, (2) the redemption and purchase occur in the same account, and (3) redeemed shares were subject to afront-end or deferred sales load (known as Rights of Reinstatement). |
| | • | | A shareholder in the fund’s Class C shares will have their shares automatically exchanged at net asset value to Class A shares (or the appropriate share class) of the fund if the shares are no longer subject to a CDSC and the exchange is in line with the policies and procedures of Raymond James. |
CDSC Waivers on Class A and C Shares Available at Raymond James
| | • | | Death or disability of the shareholder. |
| | • | | Shares sold as part of a systematic withdrawal plan as described in the Fund’s Prospectus. |
| | • | | Return of excess contributions from an IRA Account. |
| | • | | Shares sold as part of a required minimum distribution for IRA and retirement accounts due to the shareholder reaching age 70½ as described in the Fund’s prospectus. |
| | • | | Shares sold to pay Raymond James fees but only if the transaction is initiated by Raymond James. |
| | • | | Shares acquired through a right of reinstatement. |
Front-end Load Discounts Available at Raymond James: Breakpoints, and/or Rights of Accumulation
| | • | | Breakpoints as described in the Fund’s Prospectus. |
| | • | | Rights of accumulation which entitle shareholders to breakpoint discounts will be automatically calculated based on the aggregated holding of fund family assets held by accounts within the purchaser’s household at Raymond James. Eligible fund family assets not held at Raymond James may be included in the rights of accumulation calculation only if the shareholder notifies his or her financial advisor about such assets. |

For more information
More information about Wells Fargo Funds is available free upon request. To obtain literature, please write, visit the Fund’s website, or call:
Wells Fargo Funds
P.O. Box 219967
Kansas City, MO 64121-9967
Website: wellsfargofunds.com
Individual investors: 1-800-222-8222
Retail investment professionals: 1-888-877-9275
Institutional investment professionals: 1-866-765-0778
This report and the financial statements contained herein are submitted for the general information of the shareholders of the Fund. If this report is used for promotional purposes, distribution of the report must be accompanied or preceded by a current prospectus. Before investing, please consider the investment objectives, risks, charges, and expenses of the investment. For a current prospectus and, if available, a summary prospectus, containing this information, call1-800-222-8222 or visit the Fund’s website atwellsfargofunds.com. Read the prospectus carefully before you invest or send money.
Wells Fargo Asset Management (WFAM) is the trade name for certain investment advisory/management firms owned by Wells Fargo & Company. These firms include but are not limited to Wells Capital Management Incorporated and Wells Fargo Funds Management, LLC. Certain products managed by WFAM entities are distributed by Wells Fargo Funds Distributor, LLC (a broker/dealer and Member FINRA).
This material is for general informational and educational purposes only and is NOT intended to provide investment advice or a recommendation of any kind—including a recommendation for any specific investment, strategy, or plan.
INVESTMENT PRODUCTS: NOT FDIC INSURED ◾ NO BANK GUARANTEE ◾ MAY LOSE VALUE
© 2019 Wells Fargo Funds Management, LLC. All rights reserved.
| | |
 | | 320774 03-19 SA209/SAR209 01-19 |
Semi-Annual Report
January 31, 2019

Wells Fargo Large Company Value Fund

Beginning on January 1, 2021, as permitted by new regulations adopted by the Securities and Exchange Commission, paper copies of the Wells Fargo Funds’ annual and semi-annual shareholder reports issued after this date will no longer be sent by mail, unless you specifically request paper copies of the reports. Instead, the reports will be made available on the Funds’ website, and you will be notified by mail each time a report is posted and provided with a website address to access the report.
If you already elected to receive shareholder reports electronically, you will not be affected by this change and you need not take any action. You may elect to receive shareholder reports and other communications from the Fund electronically at any time by contacting your financial intermediary (such as a broker-dealer or bank) or, if you are a direct investor, by calling 1-800-222-8222 or by enrolling at wellsfargo.com/advantagedelivery.
You may elect to receive all future reports in paper free of charge. If you invest through a financial intermediary, you can contact your financial intermediary to request that you continue to receive paper copies of your shareholder reports; if you invest directly with the Fund, you can call 1-800-222-8222. Your election to receive reports in paper will apply to all Wells Fargo Funds held in your account with your financial intermediary or, if you are a direct investor, to all Wells Fargo Funds that you hold.

Reduce clutter. Save trees.
Sign up for electronic delivery of prospectuses and shareholder reports atwellsfargo.com/advantagedelivery
Contents
The views expressed and any forward-looking statements are as of January 31, 2019, unless otherwise noted, and are those of the Fund managers and/or Wells Fargo Funds Management, LLC. Discussions of individual securities, or the markets generally, or any Wells Fargo Fund are not intended as individual recommendations. Future events or results may vary significantly from those expressed in any forward-looking statements. The views expressed are subject to change at any time in response to changing circumstances in the market. Wells Fargo Funds Management, LLC and the Fund disclaim any obligation to publicly update or revise any views expressed or forward-looking statements.
INVESTMENT PRODUCTS: NOT FDIC INSURED ◾ NO BANK GUARANTEE ◾ MAY LOSE VALUE
| | | | |
| 2 | | Wells Fargo Large Company Value Fund | | Letter to shareholders (unaudited) |

Andrew Owen
President
Wells Fargo Funds
Favorable third-quarter economic indicators and corporate earnings reports encouraged domestic stock investors.
Dear Shareholder:
We are pleased to offer you this semi-annual report for the Wells Fargo Large Company Value Fund for the six-month period that ended January 31, 2019. Higher short-term interest rates, inflation concerns, trade tensions, slowing economic growth outside the U.S., and geopolitical events contributed to investment market volatility throughout the period.
For the period, U.S. stocks, as measured by the S&P 500 Index,1 fell 3.00% and international stocks, as measured by the MSCI ACWI ex USA Index (Net),2 declined 6.34%. Based on the MSCI EM Index (Net),3 emerging market stocks lost 2.60%. For bond investors, the Bloomberg Barclays U.S. Aggregate Bond Index4 added 2.71% while the Bloomberg Barclays Global Aggregate ex-USD Index5 gained 1.37%. The Bloomberg Barclays Municipal Bond Index6 added 2.05%, and the ICE BofAML U.S. High Yield Index7 gained 1.02%.
Investors appeared to shake off lingering concerns during the third quarter.
Favorable third-quarter economic indicators and corporate earnings reports encouraged domestic stock investors. U.S. trade negotiations with Mexico and Canada made progress. The Conference Board Consumer Confidence Index®8 reached its highest level in 18 years during September. Several U.S. equity market indices reached records during August. The U.S. Federal Reserve (Fed) raised the federal funds rate by 25 basis points (bps; 100 bps equal 1.00%) to a target range of between 2.00% and 2.25% in September 2018. For the quarter that ended September 30, the S&P 500 Index added 7.71%.
Investors in international markets were not as reassured. Tensions between the U.S. and China increased when the U.S. imposed an additional $200 billion in tariffs on Chinese goods. China responded with $60 billion in tariffs on U.S. products. In addition, economic growth in China drew renewed concerns. The Bank of England, having raised its monetary policy rate to 0.50% in November 2017, increased the rate again in August 2018 to 0.75%. During the three-month period that ended September 30, 2018, the MSCI ACWI ex USA Index (Net) gained 0.71% while the MSCI EM Index (Net) declined 1.09%.
| 1 | The S&P 500 Index consists of 500 stocks chosen for market size, liquidity, and industry group representation. It is a market-value-weighted index with each stock’s weight in the index proportionate to its market value. You cannot invest directly in an index. |
| 2 | The Morgan Stanley Capital International (MSCI) All Country World Index (ACWI) ex USA Index (Net) is a free-float-adjusted market-capitalization-weighted index that is designed to measure the equity market performance of developed markets, excluding the United States and Canada. Source: MSCI. MSCI makes no express or implied warranties or representations and shall have no liability whatsoever with respect to any MSCI data contained herein. The MSCI data may not be further redistributed or used as a basis for other indices or any securities or financial products. This report is not approved, reviewed, or produced by MSCI. You cannot invest directly in an index. |
| 3 | The MSCI Emerging Markets (EM) Index (Net) is a free-float-adjusted market-capitalization-weighted index that is designed to measure large- and mid-cap equity market performance of emerging markets. The MSCI EM Index (Net) consists of the following 24 emerging market country indices: Brazil, Chile, China, Colombia, Czech Republic, Egypt, Greece, Hungary, India, Indonesia, Korea, Malaysia, Mexico, Pakistan, Peru, the Philippines, Poland, Qatar, Russia, South Africa, Taiwan, Thailand, Turkey, and the United Arab Emirates. You cannot invest directly in an index. |
| 4 | The Bloomberg Barclays U.S. Aggregate Bond Index is a broad-based benchmark that measures the investment-grade, U.S. dollar-denominated, fixed-rate taxable bond market, including Treasuries, government-related and corporate securities, mortgage-backed securities (agency fixed-rate and hybrid adjustable-rate mortgage pass-throughs), asset-backed securities, and commercial mortgage-backed securities. You cannot invest directly in an index. |
| 5 | The Bloomberg Barclays Global Aggregate ex-USD Index is an unmanaged index that provides a broad-based measure of the global investment-grade fixed-income markets excluding the U.S. dollar-denominated debt market. You cannot invest directly in an index. |
| 6 | The Bloomberg Barclays Municipal Bond Index is an unmanaged index composed of long-term tax-exempt bonds with a minimum credit rating of Baa. You cannot invest directly in an index. |
| 7 | The ICE BofAML U.S. High Yield Index is a market-capitalization-weighted index of domestic and Yankee high-yield bonds. The index tracks the performance of high-yield securities traded in the U.S. bond market. You cannot invest directly in an index. Copyright 2019. ICE Data Indices, LLC. All rights reserved. |
| 8 | The Conference Board Consumer Confidence Index® measures the degree of optimism on the state of the U.S. economy that consumers are expressing through their activities of savings and spending. You cannot invest directly in an index. |
| | | | | | |
| Letter to shareholders (unaudited) | | Wells Fargo Large Company Value Fund | | | 3 | |
In bond markets, U.S. bonds, as measured by the Bloomberg Barclays U.S. Aggregate Bond Index, were flat. The Bloomberg Barclays Global Aggregateex-USD Index fell 1.74% during the quarter that ended September 30, 2018.
Conflicting data unsettled markets during the fourth quarter.
Negative stock market performance during October and December bracketed a mildly positive November for the S&P 500 Index and the MSCI ACWI ex USA Index (Net). As interest rates and bond yields gained during October, stock markets struggled. December’s S&P 500 Index performance was the worst since 1931. Globally, fixed-income investments fared better than stocks during the last two months of the year.
November’s U.S. midterm elections shifted control of the House of Representatives from Republicans to Democrats, presaging potential partisan disputes. The Bureau of Economic Analysis reported that third-quarter U.S. gross domestic product (GDP) grew at an annualized 3.4% rate, lower than second-quarter GDP growth. Brexit efforts stalled in the U.K. ahead of the March 2019 deadline. The People’s Bank of China cut reserve requirement ratios and accelerated infrastructure spending and tax cuts, and the value of the yuan declined to low levels last seen in 2008. Oil prices fell.
After the Fed increased the federal funds rate by 25 bps to a target range of between 2.25% and 2.50% in December 2018—the ninth such increase since the Fed began raising rates three years ago from near zero—it softened its outlook for further interest rate increases in 2019.
The market climbs a wall of worry.
Investors entered 2019 with reasons to be concerned. A partial U.S. government shutdown driven by partisan disputes over spending and immigration policies extended into January. Globally, economic signals were uneven. Investors expected high levels of stock market volatility to continue, as measured by the VIX9.
January’s returns tended to support the investing adage that the market climbs a wall of worry. The S&P 500 Index gained 8.01% for the month that ended January 31, 2019, its best monthly performance in 30 years. Returns for the MSCI ACWI ex USA Index (Net), the Bloomberg Barclays U.S. Aggregate Bond Index, and the Bloomberg Barclays Global Aggregate ex-USD Index also were positive.
Don’t let short-term uncertainty derail long-term investment goals.
Periods of investment uncertainty can present challenges, but experience has taught us that maintaining long-term investment goals can be an effective way to plan for the future. To help you create a sound strategy based on your personal goals and risk tolerance, Wells Fargo Funds offers more than 100 mutual funds spanning a wide range of asset classes and investment styles. Although diversification cannot guarantee an investment profit or prevent losses, we believe it can be an effective way to manage investment risk and potentially smooth out overall portfolio performance. We encourage investors to know their investments and to understand that appropriate levels of risk-taking may unlock opportunities.
January’s returns tended to support the investing adage that the market climbs a wall of worry.
| 9 | The Chicago Board Options Exchange Market Volatility Index (VIX) is a popular measure of the implied volatility of S&P 500 Index options. It represents one measure of the market’s expectation of stock market volatility over the next 30-day period. You cannot invest directly in an index. |
| | | | |
| 4 | | Wells Fargo Large Company Value Fund | | Letter to shareholders (unaudited) |
Thank you for choosing to invest with Wells Fargo Funds. We appreciate your confidence in us and remain committed to helping you meet your financial needs.
Sincerely,

Andrew Owen
President
Wells Fargo Funds
For further information about your Fund, contact your investment professional, visit our website atwellsfargofunds.com, or call us directly at1-800-222-8222.
This page is intentionally left blank.
| | | | |
| 6 | | Wells Fargo Large Company Value Fund | | Performance highlights (unaudited) |
Investment objective
The Fund seeks long-term capital appreciation.
Manager
Wells Fargo Funds Management, LLC
Subadviser
Wells Capital Management Incorporated
Portfolio managers
Dennis Bein, CFA®‡
Ryan Brown, CFA®‡
Harindra de Silva, Ph.D., CFA®‡
Average annual total returns (%) as of January 31, 2019
| | | | | | | | | | | | | | | | | | | | | | | | | | | | | | | | | | |
| | | | | Including sales charge | | | Excluding sales charge | | | Expense ratios1 (%) | |
| | | Inception date | | 1 year | | | 5 year | | | 10 year | | | 1 year | | | 5 year | | | 10 year | | | Gross | | | Net2 | |
| | | | | | | | | |
| Class A (WLCAX) | | 3-31-2008 | | | -12.52 | | | | 4.72 | | | | 10.69 | | | | -7.18 | | | | 5.96 | | | | 11.34 | | | | 0.95 | | | | 0.84 | |
| | | | | | | | | |
| Class C (WFLVX) | | 3-31-2008 | | | -8.86 | | | | 5.19 | | | | 10.52 | | | | -7.86 | | | | 5.19 | | | | 10.52 | | | | 1.70 | | | | 1.59 | |
| | | | | | | | | |
| Class R6 (WTLVX)3 | | 4-7-2017 | | | – | | | | – | | | | – | | | | -6.72 | | | | 6.43 | | | | 11.85 | | | | 0.52 | | | | 0.41 | |
| | | | | | | | | |
| Administrator Class (WWIDX) | | 12-31-2001 | | | – | | | | – | | | | – | | | | -7.11 | | | | 6.13 | | | | 11.58 | | | | 0.87 | | | | 0.76 | |
| | | | | | | | | |
| Institutional Class (WLCIX) | | 3-31-2008 | | | – | | | | – | | | | – | | | | -6.81 | | | | 6.39 | | | | 11.83 | | | | 0.62 | | | | 0.51 | |
| | | | | | | | | |
| Russell 1000® Value Index4 | | – | | | – | | | | – | | | | – | | | | -4.81 | | | | 8.33 | | | | 13.39 | | | | – | | | | – | |
Figures quoted represent past performance, which is no guarantee of future results, and do not reflect taxes that a shareholder may pay on fund distributions or the redemption of fund shares. Investment return and principal value of an investment will fluctuate so that an investor’s shares, when redeemed, may be worth more or less than their original cost. Performance shown without sales charges would be lower if sales charges were reflected. Current performance may be lower or higher than the performance data quoted, which assumes the reinvestment of dividends and capital gains. Current month-end performance is available on the Fund’s website,wellsfargofunds.com.
Index returns do not include transaction costs associated with buying and selling securities, any mutual fund fees or expenses, or any taxes. It is not possible to invest directly in an index.
For Class A shares, the maximum front-end sales charge is 5.75%. For Class C shares, the maximum contingent deferred sales charge is 1.00%. Performance including a contingent deferred sales charge assumes the sales charge for the corresponding time period. Class R6, Administrator Class, and Institutional Class shares are sold without a front-end sales charge or contingent deferred sales charge.
Stock values fluctuate in response to the activities of individual companies and general market and economic conditions. Certain investment strategies tend to increase the total risk of an investment (relative to the broader market). The Fund is exposed to foreign investment risk. Consult the Fund’s prospectus for additional information on these and other risks.
Please see footnotes on page 7.
| | | | | | |
| Performance highlights (unaudited) | | Wells Fargo Large Company Value Fund | | | 7 | |
| | | | |
| Ten largest holdings (%) as of January 31, 20195 | |
| |
JPMorgan Chase & Company | | | 4.62 | |
| |
Bank of America Corporation | | | 3.95 | |
| |
The Procter & Gamble Company | | | 3.79 | |
| |
Pfizer Incorporated | | | 3.77 | |
| |
Cisco Systems Incorporated | | | 3.73 | |
| |
Berkshire Hathaway Incorporated Class B | | | 3.32 | |
| |
AT&T Incorporated | | | 3.11 | |
| |
Agilent Technologies Incorporated | | | 2.32 | |
| |
ConocoPhillips | | | 2.23 | |
| |
Exxon Mobil Corporation | | | 2.15 | |
|
| Sector distribution as of January 31, 20196 |
|
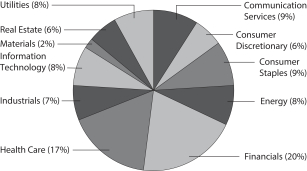
|
| ‡ | CFA® and Chartered Financial Analyst® are trademarks owned by CFA Institute. |
| 1 | Reflects the expense ratios as stated in the most recent prospectus, which include the impact of 0.01% in acquired fund fees and expenses. The expense ratios shown are subject to change and may differ from the annualized expense ratios shown in the financial highlights of this report. |
| 2 | The manager has contractually committed through November 30, 2019, to waive fees and/or reimburse expenses to the extent necessary to cap the expenses of each class after fee waivers at 0.83% for Class A, 1.58% for Class C, 0.40% for Class R6, 0.75% for Administrator Class, and 0.50% for Institutional Class. Brokerage commissions, stamp duty fees, interest, taxes, acquired fund fees and expenses (if any), and extraordinary expenses are excluded from the expense cap. Prior to or after the commitment expiration date, the cap may be increased or the commitment to maintain the cap may be terminated only with the approval of the Board of Trustees. Without this cap, the Fund’s returns would have been lower. The expense ratio paid by an investor is the net expense ratio (the total annual fund operating expenses after fee waivers) as stated in the prospectuses. |
| 3 | Historical performance shown for the Class R6 shares prior to their inception reflects the performance of the Institutional Class shares, and is not adjusted to reflect Class R6 expenses. If these expenses had been included, returns for Class R6 shares would be higher. |
| 4 | The Russell 1000® Value Index measures the performance of those Russell 1000 companies with lower price/book ratios and lower forecasted growth values. You cannot invest directly in an index. |
| 5 | The ten largest holdings, excluding cash, cash equivalents and any money market funds, are calculated based on the value of the investments divided by total net assets of the Fund. Holdings are subject to change and may have changed since the date specified. |
| 6 | Amounts are calculated based on the total long-term investments of the Fund. These amounts are subject to change and may have changed since the date specified. |
| | | | |
| 8 | | Wells Fargo Large Company Value Fund | | Fund expenses (unaudited) |
As a shareholder of the Fund, you incur two types of costs: (1) transaction costs, including sales charges (loads) on purchase payments and contingent deferred sales charges (if any) on redemptions and (2) ongoing costs, including management fees, distribution (12b-1) and/or shareholder servicing fees, and other Fund expenses. This example is intended to help you understand your ongoing costs (in dollars) of investing in the Fund and to compare these costs with the ongoing costs of investing in other mutual funds.
The example is based on an investment of $1,000 invested at the beginning of the six-month period and held for the entire period from August 1, 2018 to January 31, 2019.
Actual expenses
The “Actual” line of the table below provides information about actual account values and actual expenses. You may use the information in this line, together with the amount you invested, to estimate the expenses that you paid over the period. Simply divide your account value by $1,000 (for example, an $8,600 account value divided by $1,000 = 8.6), then multiply the result by the number in the “Actual” line under the heading entitled “Expenses paid during period” for your applicable class of shares to estimate the expenses you paid on your account during this period.
Hypothetical example for comparison purposes
The “Hypothetical” line of the table below provides information about hypothetical account values and hypothetical expenses based on the Fund’s actual expense ratio and an assumed rate of return of 5% per year before expenses, which is not the Fund’s actual return. The hypothetical account values and expenses may not be used to estimate the actual ending account balance or expenses you paid for the period. You may use this information to compare the ongoing costs of investing in the Fund and other funds. To do so, compare this 5% hypothetical example with the 5% hypothetical examples that appear in the shareholder reports of the other funds.
Please note that the expenses shown in the table are meant to highlight your ongoing costs only and do not reflect any transactional costs, such as sales charges (loads) and contingent deferred sales charges. Therefore, the “Hypothetical” line of the table is useful in comparing ongoing costs only and will not help you determine the relative total costs of owning different funds. In addition, if these transactional costs were included, your costs would have been higher.
| | | | | | | | | | | | | | | | |
| | | Beginning
account value
8-1-2018 | | | Ending
account value
1-31-2019 | | | Expenses
paid during
the period¹ | | | Annualized net
expense ratio | |
Class A | | | | | | | | | | | | | | | | |
| | | | |
Actual | | $ | 1,000.00 | | | $ | 953.56 | | | $ | 4.09 | | | | 0.83 | % |
| | | | |
Hypothetical (5% return before expenses) | | $ | 1,000.00 | | | $ | 1,021.02 | | | $ | 4.23 | | | | 0.83 | % |
Class C | | | | | | | | | | | | | | | | |
| | | | |
Actual | | $ | 1,000.00 | | | $ | 950.60 | | | $ | 7.77 | | | | 1.58 | % |
| | | | |
Hypothetical (5% return before expenses) | | $ | 1,000.00 | | | $ | 1,017.24 | | | $ | 8.03 | | | | 1.58 | % |
Class R6 | | | | | | | | | | | | | | | | |
| | | | |
Actual | | $ | 1,000.00 | | | $ | 955.94 | | | $ | 1.97 | | | | 0.40 | % |
| | | | |
Hypothetical (5% return before expenses) | | $ | 1,000.00 | | | $ | 1,023.19 | | | $ | 2.04 | | | | 0.40 | % |
Administrator Class | | | | | | | | | | | | | | | | |
| | | | |
Actual | | $ | 1,000.00 | | | $ | 953.88 | | | $ | 3.69 | | | | 0.75 | % |
| | | | |
Hypothetical (5% return before expenses) | | $ | 1,000.00 | | | $ | 1,021.42 | | | $ | 3.82 | | | | 0.75 | % |
Institutional Class | | | | | | | | | | | | | | | | |
| | | | |
Actual | | $ | 1,000.00 | | | $ | 955.86 | | | $ | 2.46 | | | | 0.50 | % |
| | | | |
Hypothetical (5% return before expenses) | | $ | 1,000.00 | | | $ | 1,022.68 | | | $ | 2.55 | | | | 0.50 | % |
| 1 | Expenses paid is equal to the annualized net expense ratio of each class multiplied by the average account value over the period, multiplied by the number of days in the most recent fiscal half-year divided by the number of days in the fiscal year (to reflect the one-half-year period). |
| | | | | | |
| Portfolio of investments—January 31, 2019 (unaudited) | | Wells Fargo Large Company Value Fund | | | 9 | |
| | | | | | | | | | | | | | | | |
| Security name | | | | | | | | Shares | | | Value | |
| | | | |
Common Stocks: 97.03% | | | | | | | | | | | | | | | | |
| | | | |
Communication Services: 8.91% | | | | | | | | | | | | | | | | |
| | | | |
| Diversified Telecommunication Services: 4.58% | | | | | | | | | | | | | | | | |
| | | | |
AT&T Incorporated | | | | | | | | | | | 223,136 | | | $ | 6,707,468 | |
| | | | |
Verizon Communications Incorporated | | | | | | | | | | | 57,875 | | | | 3,186,598 | |
| | | | |
| | | | | | | | | | | | | | | 9,894,066 | |
| | | | | | | | | | | | | | | | |
| | | | |
| Entertainment: 1.31% | | | | | | | | | | | | | | | | |
| | | | |
Viacom Incorporated Class B | | | | | | | | | | | 96,148 | | | | 2,828,674 | |
| | | | | | | | | | | | | | | | |
| | | | |
| Interactive Media & Services: 2.11% | | | | | | | | | | | | | | | | |
| | | | |
Alphabet Incorporated Class A † | | | | | | | | | | | 1,313 | | | | 1,478,294 | |
| | | | |
Alphabet Incorporated Class C † | | | | | | | | | | | 1,237 | | | | 1,380,950 | |
| | | | |
Cars.com Incorporated † | | | | | | | | | | | 61,962 | | | | 1,692,182 | |
| | | | |
| | | | | | | | | | | | | | | 4,551,426 | |
| | | | | | | | | | | | | | | | |
| | | | |
| Media: 0.91% | | | | | | | | | | | | | | | | |
| | | | |
Comcast Corporation Class A | | | | | | | | | | | 53,936 | | | | 1,972,440 | |
| | | | | | | | | | | | | | | | |
| | | | |
Consumer Discretionary: 5.36% | | | | | | | | | | | | | | | | |
| | | | |
| Hotels, Restaurants & Leisure: 3.03% | | | | | | | | | | | | | | | | |
| | | | |
Carnival Corporation | | | | | | | | | | | 2,549 | | | | 146,771 | |
| | | | |
Las Vegas Sands Corporation | | | | | | | | | | | 41,093 | | | | 2,398,187 | |
| | | | |
McDonald’s Corporation | | | | | | | | | | | 2,303 | | | | 411,730 | |
| | | | |
Wingstop Incorporated | | | | | | | | | | | 6,181 | | | | 405,783 | |
| | | | |
Yum China Holdings Incorporated | | | | | | | | | | | 87,192 | | | | 3,178,148 | |
| | | | |
| | | | | | | | | | | | | | | 6,540,619 | |
| | | | | | | | | | | | | | | | |
| | | | |
| Household Durables: 0.54% | | | | | | | | | | | | | | | | |
| | | | |
Garmin Limited | | | | | | | | | | | 14,675 | | | | 1,015,217 | |
| | | | |
MDC Holdings Incorporated | | | | | | | | | | | 4,996 | | | | 164,518 | |
| | | | |
| | | | | | | | | | | | | | | 1,179,735 | |
| | | | | | | | | | | | | | | | |
| | | | |
| Leisure Products: 0.05% | | | | | | | | | | | | | | | | |
| | | | |
Callaway Golf Company | | | | | | | | | | | 6,373 | | | | 103,816 | |
| | | | | | | | | | | | | | | | |
| | | | |
| Multiline Retail: 1.07% | | | | | | | | | | | | | | | | |
| | | | |
Target Corporation | | | | | | | | | | | 31,726 | | | | 2,315,998 | |
| | | | | | | | | | | | | | | | |
| | | | |
| Specialty Retail: 0.24% | | | | | | | | | | | | | | | | |
| | | | |
Tiffany & Company | | | | | | | | | | | 5,843 | | | | 518,449 | |
| | | | | | | | | | | | | | | | |
| | | | |
| Textiles, Apparel & Luxury Goods: 0.43% | | | | | | | | | | | | | | | | |
| | | | |
Nike Incorporated Class B | | | | | | | | | | | 9,702 | | | | 794,400 | |
| | | | |
PVH Corporation | | | | | | | | | | | 1,197 | | | | 130,605 | |
| | | | |
| | | | | | | | | | | | | | | 925,005 | |
| | | | | | | | | | | | | | | | |
| | | | |
Consumer Staples: 8.47% | | | | | | | | | | | | | | | | |
| | | | |
| Beverages: 1.90% | | | | | | | | | | | | | | | | |
| | | | |
PepsiCo Incorporated | | | | | | | | | | | 36,503 | | | | 4,112,793 | |
| | | | | | | | | | | | | | | | |
The accompanying notes are an integral part of these financial statements.
| | | | |
| 10 | | Wells Fargo Large Company Value Fund | | Portfolio of investments—January 31, 2019 (unaudited) |
| | | | | | | | | | | | | | | | |
| Security name | | | | | | | | Shares | | | Value | |
| | | | |
| Food & Staples Retailing: 0.19% | | | | | | | | | | | | | | | | |
| | | | |
Walgreens Boots Alliance Incorporated | | | | | | | | | | | 5,547 | | | $ | 400,826 | |
| | | | | | | | | | | | | | | | |
| | | | |
| Food Products: 2.52% | | | | | | | | | | | | | | | | |
| | | | |
Cal-Maine Foods Incorporated | | | | | | | | | | | 1,905 | | | | 80,353 | |
| | | | |
Ingredion Incorporated | | | | | | | | | | | 28,688 | | | | 2,840,112 | |
| | | | |
The Kraft Heinz Company | | | | | | | | | | | 8,999 | | | | 432,492 | |
| | | | |
Tyson Foods Incorporated Class A | | | | | | | | | | | 33,750 | | | | 2,089,800 | |
| | | | |
| | | | | | | | | | | | | | | 5,442,757 | |
| | | | | | | | | | | | | | | | |
| | | | |
| Household Products: 3.79% | | | | | | | | | | | | | | | | |
| | | | |
The Procter & Gamble Company | | | | | | | | | | | 84,810 | | | | 8,181,621 | |
| | | | | | | | | | | | | | | | |
| | | | |
| Tobacco: 0.07% | | | | | | | | | | | | | | | | |
| | | | |
Universal Corporation | | | | | | | | | | | 2,766 | | | | 159,598 | |
| | | | | | | | | | | | | | | | |
| | | | |
Energy: 7.85% | | | | | | | | | | | | | | | | |
| | | | |
| Energy Equipment & Services: 0.21% | | | | | | | | | | | | | | | | |
| | | | |
McDermott International Incorporated † | | | | | | | | | | | 51,551 | | | | 454,680 | |
| | | | | | | | | | | | | | | | |
| | | | |
| Oil, Gas & Consumable Fuels: 7.64% | | | | | | | | | | | | | | | | |
| | | | |
Chevron Corporation | | | | | | | | | | | 32,793 | | | | 3,759,717 | |
| | | | |
ConocoPhillips | | | | | | | | | | | 71,172 | | | | 4,817,633 | |
| | | | |
Exxon Mobil Corporation | | | | | | | | | | | 63,466 | | | | 4,650,788 | |
| | | | |
Marathon Petroleum Corporation | | | | | | | | | | | 16,170 | | | | 1,071,424 | |
| | | | |
PBF Energy Incorporated Class A | | | | | | | | | | | 8,326 | | | | 304,898 | |
| | | | |
Pioneer Natural Resources Company | | | | | | | | | | | 13,289 | | | | 1,891,290 | |
| | | | |
| | | | | | | | | | | | | | | 16,495,750 | |
| | | | | | | | | | | | | | | | |
| | | | |
Financials: 19.05% | | | | | | | | | | | | | | | | |
| | | | |
| Banks: 9.45% | | | | | | | | | | | | | | | | |
| | | | |
Bank of America Corporation | | | | | | | | | | | 299,285 | | | | 8,520,644 | |
| | | | |
Bank of N.T. Butterfield & Son Limited | | | | | | | | | | | 4,001 | | | | 140,235 | |
| | | | |
Citigroup Incorporated | | | | | | | | | | | 5,591 | | | | 360,396 | |
| | | | |
Home Bancshares Incorporated | | | | | | | | | | | 6,524 | | | | 119,454 | |
| | | | |
JPMorgan Chase & Company | | | | | | | | | | | 96,428 | | | | 9,980,298 | |
| | | | |
PNC Financial Services Group Incorporated | | | | | | | | | | | 10,507 | | | | 1,288,894 | |
| | | | |
| | | | | | | | | | | | | | | 20,409,921 | |
| | | | | | | | | | | | | | | | |
| | | | |
| Capital Markets: 2.59% | | | | | | | | | | | | | | | | |
| | | | |
Ameriprise Financial Incorporated | | | | | | | | | | | 16,326 | | | | 2,066,872 | |
| | | | |
CME Group Incorporated | | | | | | | | | | | 10,534 | | | | 1,920,138 | |
| | | | |
State Street Corporation | | | | | | | | | | | 22,436 | | | | 1,590,712 | |
| | | | |
T. Rowe Price Group Incorporated | | | | | | | | | | | 125 | | | | 11,683 | |
| | | | |
| | | | | | | | | | | | | | | 5,589,405 | |
| | | | | | | | | | | | | | | | |
| | | | |
| Consumer Finance: 1.32% | | | | | | | | | | | | | | | | |
| | | | |
Capital One Financial Corporation | | | | | | | | | | | 24,473 | | | | 1,972,279 | |
| | | | |
Discover Financial Services | | | | | | | | | | | 13,036 | | | | 879,800 | |
| | | | |
| | | | | | | | | | | | | | | 2,852,079 | |
| | | | | | | | | | | | | | | | |
The accompanying notes are an integral part of these financial statements.
| | | | | | |
| Portfolio of investments—January 31, 2019 (unaudited) | | Wells Fargo Large Company Value Fund | | | 11 | |
| | | | | | | | | | | | | | | | |
| Security name | | | | | | | | Shares | | | Value | |
| | | | |
| Diversified Financial Services: 3.32% | | | | | | | | | | | | | | | | |
| | | | |
Berkshire Hathaway Incorporated Class B † | | | | | | | | | | | 34,834 | | | $ | 7,159,780 | |
| | | | | | | | | | | | | | | | |
| | | | |
| Insurance: 2.28% | | | | | | | | | | | | | | | | |
| | | | |
CNO Financial Group Incorporated | | | | | | | | | | | 9,973 | | | | 178,317 | |
| | | | |
Employers Holdings Incorporated | | | | | | | | | | | 15,654 | | | | 663,260 | |
| | | | |
Kemper Corporation | | | | | | | | | | | 4,627 | | | | 347,858 | |
| | | | |
Old Republic International Corporation | | | | | | | | | | | 120,553 | | | | 2,429,143 | |
| | | | |
The Progressive Corporation | | | | | | | | | | | 19,363 | | | | 1,302,936 | |
| | | | |
| | | | | | | | | | | | | | | 4,921,514 | |
| | | | | | | | | | | | | | | | |
| | | | |
| Thrifts & Mortgage Finance: 0.09% | | | | | | | | | | | | | | | | |
| | | | |
Capitol Federal Financial Incorporated | | | | | | | | | | | 15,832 | | | | 203,758 | |
| | | | | | | | | | | | | | | | |
| | | | |
Health Care: 16.39% | | | | | | | | | | | | | | | | |
| | | | |
| Biotechnology: 1.49% | | | | | | | | | | | | | | | | |
| | | | |
AbbVie Incorporated | | | | | | | | | | | 10,857 | | | | 871,709 | |
| | | | |
Alexion Pharmaceuticals Incorporated † | | | | | | | | | | | 18,767 | | | | 2,307,590 | |
| | | | |
Genomic Health Incorporated † | | | | | | | | | | | 479 | | | | 36,313 | |
| | | | |
| | | | | | | | | | | | | | | 3,215,612 | |
| | | | | | | | | | | | | | | | |
| | | | |
| Health Care Equipment & Supplies: 1.59% | | | | | | | | | | | | | | | | |
| | | | |
Baxter International Incorporated | | | | | | | | | | | 1,519 | | | | 110,112 | |
| | | | |
Intuitive Surgical Incorporated † | | | | | | | | | | | 883 | | | | 462,374 | |
| | | | |
Medtronic plc | | | | | | | | | | | 2,274 | | | | 200,999 | |
| | | | |
West Pharmaceutical Services Incorporated | | | | | | | | | | | 24,559 | | | | 2,659,003 | |
| | | | |
| | | | | | | | | | | | | | | 3,432,488 | |
| | | | | | | | | | | | | | | | |
| | | | |
| Health Care Providers & Services: 2.29% | | | | | | | | | | | | | | | | |
| | | | |
Laboratory Corporation of America Holdings † | | | | | | | | | | | 2,071 | | | | 288,594 | |
| | | | |
Quest Diagnostics Incorporated | | | | | | | | | | | 1,833 | | | | 160,113 | |
| | | | |
UnitedHealth Group Incorporated | | | | | | | | | | | 16,656 | | | | 4,500,451 | |
| | | | |
| | | | | | | | | | | | | | | 4,949,158 | |
| | | | | | | | | | | | | | | | |
| | | | |
| Health Care Technology: 0.23% | | | | | | | | | | | | | | | | |
| | | | |
Evolent Health Incorporated Class A † | | | | | | | | | | | 28,137 | | | | 497,462 | |
| | | | | | | | | | | | | | | | |
| | | | |
| Life Sciences Tools & Services: 2.32% | | | | | | | | | | | | | | | | |
| | | | |
Agilent Technologies Incorporated | | | | | | | | | | | 65,880 | | | | 5,010,174 | |
| | | | | | | | | | | | | | | | |
| | | | |
| Pharmaceuticals: 8.47% | | | | | | | | | | | | | | | | |
| | | | |
Allergan plc | | | | | | | | | | | 17,528 | | | | 2,523,681 | |
| | | | |
Bristol-Myers Squibb Company | | | | | | | | | | | 34,479 | | | | 1,702,228 | |
| | | | |
Johnson & Johnson | | | | | | | | | | | 5,282 | | | | 702,929 | |
| | | | |
Mallinckrodt plc † | | | | | | | | | | | 9,513 | | | | 207,954 | |
| | | | |
Merck & Company Incorporated | | | | | | | | | | | 48,445 | | | | 3,605,761 | |
| | | | |
Mylan NV † | | | | | | | | | | | 47,026 | | | | 1,408,429 | |
| | | | |
Pfizer Incorporated | | | | | | | | | | | 191,886 | | | | 8,145,561 | |
| | | | |
| | | | | | | | | | | | | | | 18,296,543 | |
| | | | | | | | | | | | | | | | |
The accompanying notes are an integral part of these financial statements.
| | | | |
| 12 | | Wells Fargo Large Company Value Fund | | Portfolio of investments—January 31, 2019 (unaudited) |
| | | | | | | | | | | | | | | | |
| Security name | | | | | | | | Shares | | | Value | |
| | | | |
Industrials: 6.63% | | | | | | | | | | | | | | | | |
| | | | |
| Aerospace & Defense: 2.15% | | | | | | | | | | | | | | | | |
| | | | |
Moog Incorporated Class A | | | | | | | | | | | 4,260 | | | $ | 381,142 | |
| | | | |
Raytheon Company | | | | | | | | | | | 25,846 | | | | 4,258,387 | |
| | | | |
| | | | | | | | | | | | | | | 4,639,529 | |
| | | | | | | | | | | | | | | | |
| | | | |
| Airlines: 1.87% | | | | | | | | | | | | | | | | |
| | | | |
Southwest Airlines Company | | | | | | | | | | | 71,211 | | | | 4,041,936 | |
| | | | | | | | | | | | | | | | |
| | | | |
| Construction & Engineering: 0.26% | | | | | | | | | | | | | | | | |
| | | | |
Comfort Systems Incorporated | | | | | | | | | | | 11,416 | | | | 547,626 | |
| | | | | | | | | | | | | | | | |
| | | | |
| Industrial Conglomerates: 0.60% | | | | | | | | | | | | | | | | |
| | | | |
Honeywell International Incorporated | | | | | | | | | | | 9,071 | | | | 1,302,868 | |
| | | | | | | | | | | | | | | | |
| | | | |
| Road & Rail: 1.75% | | | | | | | | | | | | | | | | |
| | | | |
Norfolk Southern Corporation | | | | | | | | | | | 22,502 | | | | 3,774,485 | |
| | | | | | | | | | | | | | | | |
| | | | |
Information Technology: 7.88% | | | | | | | | | | | | | | | | |
| | | | |
| Communications Equipment: 3.73% | | | | | | | | | | | | | | | | |
| | | | |
Cisco Systems Incorporated | | | | | | | | | | | 170,153 | | | | 8,046,535 | |
| | | | | | | | | | | | | | | | |
| | | | |
| Electronic Equipment, Instruments & Components: 0.13% | | | | | | | | | | | | | | | | |
| | | | |
National Instruments Corporation | | | | | | | | | | | 6,542 | | | | 289,287 | |
| | | | | | | | | | | | | | | | |
| | | | |
| IT Services: 1.42% | | | | | | | | | | | | | | | | |
| | | | |
MasterCard Incorporated Class A | | | | | | | | | | | 14,463 | | | | 3,053,573 | |
| | | | | | | | | | | | | | | | |
| | | | |
| Semiconductors & Semiconductor Equipment: 1.50% | | | | | | | | | | | | | | | | |
| | | | |
Cabot Microelectronics Corporation | | | | | | | | | | | 6,436 | | | | 655,764 | |
| | | | |
Intel Corporation | | | | | | | | | | | 49,827 | | | | 2,347,848 | |
| | | | |
Skyworks Solutions Incorporated | | | | | | | | | | | 3,323 | | | | 242,712 | |
| | | | |
| | | | | | | | | | | | | | | 3,246,324 | |
| | | | | | | | | | | | | | | | |
| | | | |
| Software: 1.10% | | | | | | | | | | | | | | | | |
| | | | |
Adobe Systems Incorporated † | | | | | | | | | | | 2,209 | | | | 547,434 | |
| | | | |
Intuit Incorporated | | | | | | | | | | | 3,677 | | | | 793,570 | |
| | | | |
Microsoft Corporation | | | | | | | | | | | 9,889 | | | | 1,032,708 | |
| | | | |
| | | | | | | | | | | | | | | 2,373,712 | |
| | | | | | | | | | | | | | | | |
| | | | |
Materials: 2.38% | | | | | | | | | | | | | | | | |
| | | | |
| Chemicals: 0.99% | | | | | | | | | | | | | | | | |
| | | | |
LyondellBasell Industries NV Class A | | | | | | | | | | | 8,142 | | | | 708,110 | |
| | | | |
The Mosaic Company | | | | | | | | | | | 44,470 | | | | 1,435,492 | |
| | | | |
| | | | | | | | | | | | | | | 2,143,602 | |
| | | | | | | | | | | | | | | | |
| | | | |
| Containers & Packaging: 0.02% | | | | | | | | | | | | | | | | |
| | | | |
International Paper Company | | | | | | | | | | | 910 | | | | 43,161 | |
| | | | | | | | | | | | | | | | |
The accompanying notes are an integral part of these financial statements.
| | | | | | |
| Portfolio of investments—January 31, 2019 (unaudited) | | Wells Fargo Large Company Value Fund | | | 13 | |
| | | | | | | | | | | | | | | | |
| Security name | | | | | | | | Shares | | | Value | |
| | | | |
| Metals & Mining: 1.37% | | | | | | | | | | | | | | | | |
| | | | |
Newmont Mining Corporation | | | | | | | | | | | 23,003 | | | $ | 784,632 | |
| | | | |
Nucor Corporation | | | | | | | | | | | 35,334 | | | | 2,163,854 | |
| | | | |
| | | | | | | | | | | | | | | 2,948,486 | |
| | | | | | | | | | | | | | | | |
| | | | |
Real Estate: 6.10% | | | | | | | | | | | | | | | | |
| | | | |
| Equity REITs: 6.10% | | | | | | | | | | | | | | | | |
| | | | |
AvalonBay Communities Incorporated | | | | | | | | | | | 4,615 | | | | 890,326 | |
| | | | |
CoreCivic Incorporated | | | | | | | | | | | 150,438 | | | | 2,989,203 | |
| | | | |
Duke Realty Corporation | | | | | | | | | | | 14,266 | | | | 417,138 | |
| | | | |
Equity Residential | | | | | | | | | | | 20,116 | | | | 1,459,617 | |
| | | | |
Outfront Media Incorporated | | | | | | | | | | | 16,115 | | | | 334,386 | |
| | | | |
Park Hotels & Resorts Incorporated | | | | | | | | | | | 19,139 | | | | 575,510 | |
| | | | |
PS Business Parks Incorporated | | | | | | | | | | | 4,724 | | | | 685,878 | |
| | | | |
Public Storage Incorporated | | | | | | | | | | | 5,895 | | | | 1,252,805 | |
| | | | |
Senior Housing Properties Trust | | | | | | | | | | | 17,592 | | | | 242,242 | |
| | | | |
The Geo Group Incorporated | | | | | | | | | | | 66,463 | | | | 1,498,741 | |
| | | | |
VICI Properties Incorporated | | | | | | | | | | | 10,189 | | | | 219,369 | |
| | | | |
Weingarten Realty Investors | | | | | | | | | | | 414 | | | | 11,878 | |
| | | | |
Xenia Hotels & Resorts Incorporated | | | | | | | | | | | 138,769 | | | | 2,604,694 | |
| | | | |
| | | | | | | | | | | | | | | 13,181,787 | |
| | | | | | | | | | | | | | | | |
| | | | |
Utilities: 8.01% | | | | | | | | | | | | | | | | |
| | | | |
| Electric Utilities: 4.07% | | | | | | | | | | | | | | | | |
| | | | |
Avangrid Incorporated | | | | | | | | | | | 67,426 | | | | 3,362,535 | |
| | | | |
Duke Energy Corporation | | | | | | | | | | | 27,256 | | | | 2,392,532 | |
| | | | |
NextEra Energy Incorporated | | | | | | | | | | | 2,538 | | | | 454,251 | |
| | | | |
Pinnacle West Capital Corporation | | | | | | | | | | | 29,343 | | | | 2,585,705 | |
| | | | |
| | | | | | | | | | | | | | | 8,795,023 | |
| | | | | | | | | | | | | | | | |
| | | | |
| Gas Utilities: 2.08% | | | | | | | | | | | | | | | | |
| | | | |
UGI Corporation | | | | | | | | | | | 78,659 | | | | 4,485,923 | |
| | | | | | | | | | | | | | | | |
| | | | |
| Multi-Utilities: 1.86% | | | | | | | | | | | | | | | | |
| | | | |
DTE Energy Company | | | | | | | | | | | 2,302 | | | | 271,061 | |
| | | | |
MDU Resources Group Incorporated | | | | | | | | | | | 145,401 | | | | 3,738,260 | |
| | | | |
| | | | | | | | | | | | | | | 4,009,321 | |
| | | | | | | | | | | | | | | | |
| | | | |
Total Common Stocks (Cost $195,844,054) | | | | | | | | | | | | | | | 209,539,325 | |
| | | | | | | | | | | | | | | | |
| | | | |
| | | Yield | | | | | | | | | | |
| Short-Term Investments: 2.45% | | | | | | | | | | | | | | | | |
| | | | |
| Investment Companies: 2.45% | | | | | | | | | | | | | | | | |
| | | | |
Wells Fargo Government Money Market Fund Select Class (l)(u) | | | 2.33 | % | | | | | | | 5,282,073 | | | | 5,282,073 | |
| | | | | | | | | | | | | | | | |
| | | | |
Total Short-Term Investments (Cost $5,282,073) | | | | | | | | | | | | | | | 5,282,073 | |
| | | | | | | | | | | | | | | | |
| | | | | | | | |
| Total investments in securities (Cost $201,126,127) | | | 99.48 | % | | | 214,821,398 | |
| | |
Other assets and liabilities, net | | | 0.52 | | | | 1,124,575 | |
| | | | | | | | |
| Total net assets | | | 100.00 | % | | $ | 215,945,973 | |
| | | | | | | | |
The accompanying notes are an integral part of these financial statements.
| | | | |
| 14 | | Wells Fargo Large Company Value Fund | | Portfolio of investments—January 31, 2019 (unaudited) |
| † | Non-income-earning security |
| (l) | The issuer of the security is an affiliated person of the Fund as defined in the Investment Company Act of 1940. |
| (u) | The rate represents the 7-day annualized yield at period end. |
Abbreviations:
| REIT | Real estate investment trust |
Futures Contracts
| | | | | | | | | | | | | | | | | | | | | | | | |
| Description | | Number of
contracts | | | Expiration
date | | | Notional
cost | | | Notional
value | | | Unrealized
gains | | | Unrealized
losses | |
| | | | | | |
Long | | | | | | | | | | | | | | | | | | | | | | | | |
| | | | | | |
S&P 500 E-Mini Index | | | 43 | | | | 3-15-2019 | | | $ | 5,540,219 | | | $ | 5,814,675 | | | $ | 274,456 | | | $ | 0 | |
Investments in Affiliates
An affiliated investment is an investment in which the Fund owns at least 5% of the outstanding voting shares of the issuer or as a result of other relationships, such as the Fund and the issuer having the same investment manager. Transactions with issuers that were either affiliated persons of the Fund at the beginning of the period or the end of the period were as follows:
| | | | | | | | | | | | | | | | | | | | | | | | | | | | | | | | | | | | |
| | | Shares,
beginning of
period | | | Shares
purchased | | | Shares
sold | | | Shares,
end of
period | | | Net
realized
gains
(losses) | | | Net
change in
unrealized
gains
(losses) | | | Income
from
affiliated
securities | | | Value,
end
of period | | | % of
net
assets | |
Short-Term Investments | | | | | | | | | | | | | | | | | | | | | | | | | | | | | | | | | | | | |
Investment Companies | | | | | | | | | | | | | | | | | | | | | | | | | | | | | | | | | | | | |
Wells Fargo Government Money Market Fund Select Class | | | 4,171,660 | | | | 23,393,833 | | | | 22,283,420 | | | | 5,282,073 | | | $ | 0 | | | $ | 0 | | | $ | 46,053 | | | $ | 5,282,073 | | | | 2.45 | % |
The accompanying notes are an integral part of these financial statements.
| | | | | | |
| Statement of assets and liabilities—January 31, 2019 (unaudited) | | Wells Fargo Large Company Value Fund | | | 15 | |
| | | | |
| | | | |
| |
Assets | | | | |
Investments in unaffiliated securities, at value (cost $195,844,054) | | $ | 209,539,325 | |
Investments in affiliated securities, at value (cost $5,282,073) | | | 5,282,073 | |
Segregated cash for futures contracts | | | 572,733 | |
Receivable for Fund shares sold | | | 2,436 | |
Receivable for dividends | | | 394,847 | |
Receivable for daily variation margin on open futures contracts | | | 274,558 | |
Prepaid expenses and other assets | | | 98,099 | |
| | | | |
Total assets | | | 216,164,071 | |
| | | | |
| |
Liabilities | | | | |
Payable for Fund shares redeemed | | | 72,644 | |
Management fee payable | | | 45,386 | |
Shareholder servicing fees payable | | | 43,214 | |
Administration fees payable | | | 35,871 | |
Professional fees payable | | | 13,455 | |
Trustees’ fees and expenses payable | | | 2,391 | |
Distribution fee payable | | | 1,614 | |
Due to custodian bank | | | 153 | |
Accrued expenses and other liabilities | | | 3,370 | |
| | | | |
Total liabilities | | | 218,098 | |
| | | | |
Total net assets | | $ | 215,945,973 | |
| | | | |
| |
NET ASSETS CONSIST OF | | | | |
Paid-in capital | | $ | 212,193,881 | |
Total distributable earnings | | | 3,752,092 | |
| | | | |
Total net assets | | $ | 215,945,973 | |
| | | | |
| |
COMPUTATION OF NET ASSET VALUE AND OFFERING PRICE PER SHARE | | | | |
Net assets – Class A | | $ | 192,959,130 | |
Shares outstanding – Class A1 | | | 15,762,967 | |
Net asset value per share – Class A | | | $12.24 | |
Maximum offering price per share – Class A2 | | | $12.99 | |
Net assets – Class C | | $ | 2,525,747 | |
Shares outstanding – Class C1 | | | 200,175 | |
Net asset value per share – Class C | | | $12.62 | |
Net assets – Class R6 | | $ | 19,125 | |
Shares outstanding – Class R61 | | | 1,549 | |
Net asset value per share – Class R6 | | | $12.35 | |
Net assets – Administrator Class | | $ | 15,206,529 | |
Shares outstanding – Administrator Class1 | | | 1,229,899 | |
Net asset value per share – Administrator Class | | | $12.36 | |
Net assets – Institutional Class | | $ | 5,235,442 | |
Shares outstanding – Institutional Class1 | | | 424,000 | |
Net asset value per share – Institutional Class | | | $12.35 | |
| 1 | The Fund has an unlimited number of authorized shares. |
| 2 | Maximum offering price is computed as 100/94.25 of net asset value. On investments of $50,000 or more, the offering price is reduced. |
The accompanying notes are an integral part of these financial statements.
| | | | |
| 16 | | Wells Fargo Large Company Value Fund | | Statement of operations—six months ended January 31, 2019 (unaudited) |
| | | | |
| | | | |
| |
Investment income | | | | |
Dividends (net of foreign withholding taxes of $25) | | $ | 3,277,740 | |
Income from affiliated securities | | | 46,053 | |
| | | | |
Total investment income | | | 3,323,793 | |
| | | | |
| |
Expenses | | | | |
Management fee | | | 473,609 | |
Administration fees | | | | |
Class A | | | 213,662 | |
Class C | | | 2,809 | |
Class R6 | | | 3 | |
Administrator Class | | | 10,468 | |
Institutional Class | | | 9,436 | |
Shareholder servicing fees | | | | |
Class A | | | 254,360 | |
Class C | | | 3,344 | |
Administrator Class | | | 20,130 | |
Distribution fee | | | | |
Class C | | | 10,030 | |
Custody and accounting fees | | | 11,090 | |
Professional fees | | | 20,376 | |
Registration fees | | | 40,329 | |
Shareholder report expenses | | | 30,246 | |
Trustees’ fees and expenses | | | 11,090 | |
Interest expense | | | 549 | |
Other fees and expenses | | | 6,732 | |
| | | | |
Total expenses | | | 1,118,263 | |
Less: Fee waivers and/or expense reimbursements | | | (155,392 | ) |
| | | | |
Net expenses | | | 962,871 | |
| | | | |
Net investment income | | | 2,360,922 | |
| | | | |
| |
REALIZED AND UNREALIZED GAINS (LOSSES) ON INVESTMENTS | | | | |
| |
Net realized losses on: | | | | |
Unaffiliated securities | | | (8,580,510 | ) |
Futures contracts | | | (414,825 | ) |
| | | | |
Net realized losses on investments | | | (8,995,335 | ) |
| | | | |
| |
Net change in unrealized gains (losses) on: | | | | |
Unaffiliated securities | | | (5,845,071 | ) |
Futures contracts | | | 175,845 | |
| | | | |
Net change in unrealized gains (losses) on investments | | | (5,669,226 | ) |
| | | | |
Net realized and unrealized gains (losses) on investments | | | (14,664,561 | ) |
| | | | |
Net decrease in net assets resulting from operations | | $ | (12,303,639 | ) |
| | | | |
The accompanying notes are an integral part of these financial statements.
| | | | | | |
| Statement of changes in net assets | | Wells Fargo Large Company Value Fund | | | 17 | |
| | | | | | | | | | | | | | | | |
| | | Six months ended
January 31, 2019
(unaudited) | | | Year ended
July 31, 20181 | |
| | | | |
Operations | | | | | | | | | | | | | | | | |
Net investment income | | | | | | $ | 2,360,922 | | | | | | | $ | 3,343,736 | |
Net realized gains (losses) on investments | | | | | | | (8,995,335 | ) | | | | | | | 26,456,759 | |
Net change in unrealized gains (losses) on investments | | | | | | | (5,669,226 | ) | | | | | | | (6,608,842 | ) |
| | | | |
Net increase (decrease) in net assets resulting from operations | | | | | | | (12,303,639 | ) | | | | | | | 23,191,653 | |
| | | | |
| | | | |
Distributions to shareholders from net investment income and net realized gains | | | | | | | | | | | | | | | | |
Class A | | | | | | | (22,107,555 | ) | | | | | | | (46,029,469 | ) |
Class C | | | | | | | (263,413 | ) | | | | | | | (659,195 | ) |
Class R6 | | | | | | | (2,446 | ) | | | | | | | (6,656 | ) |
Administrator Class | | | | | | | (1,768,262 | ) | | | | | | | (3,673,062 | ) |
Institutional Class | | | | | | | (1,828,753 | ) | | | | | | | (3,556,512 | ) |
| | | | |
Total distributions to shareholders | | | | | | | (25,970,429 | ) | | | | | | | (53,924,894 | ) |
| | | | |
| | | | |
Capital share transactions | | | Shares | | | | | | | | Shares | | | | | |
Proceeds from shares sold | | | | | | | | | | | | | | | | |
Class A | | | 130,224 | | | | 1,695,563 | | | | 243,128 | | | | 3,569,805 | |
Class C | | | 5,267 | | | | 66,983 | | | | 4,796 | | | | 75,911 | |
Class R6 | | | 0 | | | | 0 | | | | 297 | | | | 5,000 | |
Administrator Class | | | 9,776 | | | | 129,415 | | | | 26,318 | | | | 380,870 | |
Institutional Class | | | 22,465 | | | | 319,784 | | | | 128,944 | | | | 1,889,629 | |
| | | | |
| | | | |
| | | | | | | 2,211,745 | | | | | | | | 5,921,215 | |
| | | | |
Reinvestment of distributions | | | | | | | | | | | | | | | | |
Class A | | | 1,760,655 | | | | 21,527,593 | | | | 3,111,809 | | | | 44,581,220 | |
Class C | | | 19,718 | | | | 246,346 | | | | 42,242 | | | | 618,917 | |
Class R6 | | | 0 | | | | 0 | | | | 72 | | | | 1,037 | |
Administrator Class | | | 140,900 | | | | 1,740,415 | | | | 250,317 | | | | 3,619,530 | |
Institutional Class | | | 36,953 | | | | 456,951 | | | | 203,584 | | | | 2,943,466 | |
| | | | |
| | | | |
| | | | | | | 23,971,305 | | | | | | | | 51,764,170 | |
| | | | |
Payment for shares redeemed | | | | | | | | | | | | | | | | |
Class A | | | (948,691 | ) | | | (12,688,315 | ) | | | (1,908,557 | ) | | | (28,835,984 | ) |
Class C | | | (22,339 | ) | | | (317,540 | ) | | | (48,634 | ) | | | (725,165 | ) |
Class R6 | | | 0 | | | | 0 | | | | (369 | ) | | | (5,292 | ) |
Administrator Class | | | (68,543 | ) | | | (839,420 | ) | | | (227,193 | ) | | | (3,486,080 | ) |
Institutional Class | | | (843,330 | ) | | | (9,663,026 | ) | | | (104,675 | ) | | | (1,560,195 | ) |
| | | | |
| | | | |
| | | | | | | (23,508,301 | ) | | | | | | | (34,612,716 | ) |
| | | | |
Net increase in net assets resulting from capital share transactions | | | | | | | 2,674,749 | | | | | | | | 23,072,669 | |
| | | | |
Total decrease in net assets | | | | | | | (35,599,319 | ) | | | | | | | (7,660,572 | ) |
| | | | |
| | | | |
Net assets | | | | | | | | | | | | | | | | |
Beginning of period | | | | | | | 251,545,292 | | | | | | | | 259,205,864 | |
| | | | |
End of period | | | | | | $ | 215,945,973 | | | | | | | $ | 251,545,292 | |
| | | | |
| 1 | Effective for all filings after November 4, 2018, the SEC prospectively eliminated the requirement to parenthetically disclose undistributed net investment income at the end of the period and permitted the aggregation of distributions, with the exception of tax basis returns of capital. Undistributed net investment income at July 31, 2018 was $792,952. The disaggregated distributions information for the year ended July 31, 2018 is included in Note 8,Distributions to Shareholders,in the notes to the financial statements. |
The accompanying notes are an integral part of these financial statements.
| | | | |
| 18 | | Wells Fargo Large Company Value Fund | | Financial highlights |
(For a share outstanding throughout each period)
| | | | | | | | | | | | | | | | | | | | | | | | |
| | | Six months ended
January 31, 2019 (unaudited) | | | Year ended July 31 | |
| CLASS A | | 2018 | | | 2017 | | | 2016 | | | 2015 | | | 2014 | |
Net asset value, beginning of period | | | $14.46 | | | | $16.54 | | | | $14.58 | | | | $16.10 | | | | $16.82 | | | | $16.39 | |
Net investment income | | | 0.13 | | | | 0.19 | | | | 0.14 | | | | 0.17 | | | | 0.13 | 1 | | | 0.10 | |
Net realized and unrealized gains (losses) on investments | | | (0.82 | ) | | | 1.29 | | | | 1.93 | | | | (0.41 | ) | | | 0.78 | | | | 2.04 | |
| | | | | | | | | | | | | | | | | | | | | | | | |
Total from investment operations | | | (0.69 | ) | | | 1.48 | | | | 2.07 | | | | (0.24 | ) | | | 0.91 | | | | 2.14 | |
Distributions to shareholders from | | | | | | | | | | | | | | | | | | | | | | | | |
Net investment income | | | (0.15 | ) | | | (0.18 | ) | | | (0.11 | ) | | | (0.16 | ) | | | (0.13 | ) | | | (0.09 | ) |
Net realized gains | | | (1.38 | ) | | | (3.38 | ) | | | 0.00 | | | | (1.12 | ) | | | (1.50 | ) | | | (1.62 | ) |
| | | | | | | | | | | | | | | | | | | | | | | | |
Total distributions to shareholders | | | (1.53 | ) | | | (3.56 | ) | | | (0.11 | ) | | | (1.28 | ) | | | (1.63 | ) | | | (1.71 | ) |
Net asset value, end of period | | | $12.24 | | | | $14.46 | | | | $16.54 | | | | $14.58 | | | | $16.10 | | | | $16.82 | |
Total return2 | | | (4.64 | )% | | | 9.39 | % | | | 14.24 | % | | | (0.98 | )% | | | 5.72 | % | | | 13.68 | % |
Ratios to average net assets (annualized) | | | | | | | | | | | | | | | | | | | | | | | | |
Gross expenses | | | 0.96 | % | | | 0.94 | % | | | 1.09 | % | | | 1.24 | % | | | 1.27 | % | | | 1.28 | % |
Net expenses | | | 0.83 | % | | | 0.83 | % | | | 0.96 | % | | | 1.10 | % | | | 1.10 | % | | | 1.10 | % |
Net investment income | | | 1.99 | % | | | 1.28 | % | | | 0.91 | % | | | 1.19 | % | | | 0.76 | % | | | 0.61 | % |
Supplemental data | | | | | | | | | | | | | | | | | | | | | | | | |
Portfolio turnover rate | | | 108 | % | | | 258 | % | | | 221 | % | | | 50 | % | | | 71 | % | | | 59 | % |
Net assets, end of period (000s omitted) | | | $192,959 | | | | $214,247 | | | | $221,207 | | | | $218,922 | | | | $104,453 | | | | $116,398 | |
| 1 | Calculated based upon average shares outstanding |
| 2 | Total return calculations do not include any sales charges. Returns for periods of less than one year are not annualized. |
The accompanying notes are an integral part of these financial statements.
| | | | | | |
| Financial highlights | | Wells Fargo Large Company Value Fund | | | 19 | |
(For a share outstanding throughout each period)
| | | | | | | | | | | | | | | | | | | | | | | | |
| | | Six months ended
January 31, 2019 (unaudited) | | | Year ended July 31 | |
| CLASS C | | 2018 | | | 2017 | | | 2016 | | | 2015 | | | 2014 | |
Net asset value, beginning of period | | | $14.81 | | | | $16.86 | | | | $14.90 | | | | $16.41 | | | | $17.12 | | | | $16.70 | |
Net investment income (loss) | | | 0.09 | | | | 0.08 | | | | 0.03 | 1 | | | 0.06 | | | | 0.00 | 2 | | | (0.02 | ) |
Net realized and unrealized gains (losses) on investments | | | (0.84 | ) | | | 1.30 | | | | 1.96 | | | | (0.40 | ) | | | 0.80 | | | | 2.07 | |
| | | | | | | | | | | | | | | | | | | | | | | | |
Total from investment operations | | | (0.75 | ) | | | 1.38 | | | | 1.99 | | | | (0.34 | ) | | | 0.80 | | | | 2.05 | |
Distributions to shareholders from | | | | | | | | | | | | | | | | | | | | | | | | |
Net investment income | | | (0.06 | ) | | | (0.05 | ) | | | (0.03 | ) | | | (0.05 | ) | | | (0.01 | ) | | | (0.01 | ) |
Net realized gains | | | (1.38 | ) | | | (3.38 | ) | | | 0.00 | | | | (1.12 | ) | | | (1.50 | ) | | | (1.62 | ) |
| | | | | | | | | | | | | | | | | | | | | | | | |
Total distributions to shareholders | | | (1.44 | ) | | | (3.43 | ) | | | (0.03 | ) | | | (1.17 | ) | | | (1.51 | ) | | | (1.63 | ) |
Net asset value, end of period | | | $12.62 | | | | $14.81 | | | | $16.86 | | | | $14.90 | | | | $16.41 | | | | $17.12 | |
Total return3 | | | (4.94 | )% | | | 8.49 | % | | | 13.40 | % | | | (1.68 | )% | | | 4.92 | % | | | 12.83 | % |
Ratios to average net assets (annualized) | | | | | | | | | | | | | | | | | | | | | | | | |
Gross expenses | | | 1.71 | % | | | 1.69 | % | | | 1.84 | % | | | 1.99 | % | | | 2.02 | % | | | 2.03 | % |
Net expenses | | | 1.58 | % | | | 1.58 | % | | | 1.72 | % | | | 1.85 | % | | | 1.85 | % | | | 1.85 | % |
Net investment income (loss) | | | 1.23 | % | | | 0.55 | % | | | 0.16 | % | | | 0.44 | % | | | 0.01 | % | | | (0.14 | )% |
Supplemental data | | | | | | | | | | | | | | | | | | | | | | | | |
Portfolio turnover rate | | | 108 | % | | | 258 | % | | | 221 | % | | | 50 | % | | | 71 | % | | | 59 | % |
Net assets, end of period (000s omitted) | | | $2,526 | | | | $2,926 | | | | $3,356 | | | | $3,674 | | | | $4,488 | | | | $4,659 | |
| 1 | Calculated based upon average shares outstanding |
| 2 | Amount is less than $0.005. |
| 3 | Total return calculations do not include any sales charges. Returns for periods of less than one year are not annualized. |
The accompanying notes are an integral part of these financial statements.
| | | | |
| 20 | | Wells Fargo Large Company Value Fund | | Financial highlights |
(For a share outstanding throughout each period)
| | | | | | | | | | | | |
| | | Six months ended
January 31, 2019 (unaudited) | | | Year ended July 31 | |
| CLASS R6 | | 2018 | | | 20171 | |
Net asset value, beginning of period | | | $14.59 | | | | $16.66 | | | | $16.14 | |
Net investment income | | | 0.17 | | | | 0.26 | | | | 0.03 | 2 |
Net realized and unrealized gains (losses) on investments | | | (0.83 | ) | | | 1.30 | | | | 0.49 | |
| | | | | | | | | | | | |
Total from investment operations | | | (0.66 | ) | | | 1.56 | | | | 0.52 | |
Distributions to shareholders from | | | | | | | | | | | | |
Net investment income | | | (0.20 | ) | | | (0.25 | ) | | | 0.00 | |
Net realized gains | | | (1.38 | ) | | | (3.38 | ) | | | 0.00 | |
| | | | | | | | | | | | |
Total distributions to shareholders | | | (1.58 | ) | | | (3.63 | ) | | | 0.00 | |
Net asset value, end of period | | | $12.35 | | | | $14.59 | | | | $16.66 | |
Total return3 | | | (4.41 | )% | | | 9.88 | % | | | 3.22 | % |
Ratios to average net assets (annualized) | | | | | | | | | | | | |
Gross expenses | | | 0.54 | % | | | 0.51 | % | | | 0.49 | % |
Net expenses | | | 0.40 | % | | | 0.40 | % | | | 0.40 | % |
Net investment income | | | 2.40 | % | | | 1.73 | % | | | 0.52 | % |
Supplemental data | | | | | | | | | | | | |
Portfolio turnover rate | | | 108 | % | | | 258 | % | | | 221 | % |
Net assets, end of period (000s omitted) | | | $19 | | | | $23 | | | | $26 | |
| 1 | For the period from April 7, 2017 (commencement of class operations) to July 31, 2017 |
| 2 | Calculated based upon average shares outstanding |
| 3 | Returns for periods of less than one year are not annualized. |
The accompanying notes are an integral part of these financial statements.
| | | | | | |
| Financial highlights | | Wells Fargo Large Company Value Fund | | | 21 | |
(For a share outstanding throughout each period)
| | | | | | | | | | | | | | | | | | | | | | | | |
| | | Six months ended
January 31, 2019 (unaudited) | | | Year ended July 31 | |
| ADMINISTRATOR CLASS | | 2018 | | | 2017 | | | 2016 | | | 2015 | | | 2014 | |
Net asset value, beginning of period | | | $14.59 | | | | $16.66 | | | | $14.68 | | | | $16.20 | | | | $16.93 | | | | $16.47 | |
Net investment income | | | 0.14 | 1 | | | 0.20 | | | | 0.16 | 1 | | | 0.20 | | | | 0.17 | | | | 0.15 | |
Net realized and unrealized gains (losses) on investments | | | (0.83 | ) | | | 1.30 | | | | 1.94 | | | | (0.41 | ) | | | 0.78 | | | | 2.05 | |
| | | | | | | | | | | | | | | | | | | | | | | | |
Total from investment operations | | | (0.69 | ) | | | 1.50 | | | | 2.10 | | | | (0.21 | ) | | | 0.95 | | | | 2.20 | |
Distributions to shareholders from | | | | | | | | | | | | | | | | | | | | | | | | |
Net investment income | | | (0.16 | ) | | | (0.19 | ) | | | (0.12 | ) | | | (0.19 | ) | | | (0.18 | ) | | | (0.12 | ) |
Net realized gains | | | (1.38 | ) | | | (3.38 | ) | | | 0.00 | | | | (1.12 | ) | | | (1.50 | ) | | | (1.62 | ) |
| | | | | | | | | | | | | | | | | | | | | | | | |
Total distributions to shareholders | | | (1.54 | ) | | | (3.57 | ) | | | (0.12 | ) | | | (1.31 | ) | | | (1.68 | ) | | | (1.74 | ) |
Net asset value, end of period | | | $12.36 | | | | $14.59 | | | | $16.66 | | | | $14.68 | | | | $16.20 | | | | $16.93 | |
Total return2 | | | (4.61 | )% | | | 9.44 | % | | | 14.35 | % | | | (0.79 | )% | | | 5.95 | % | | | 13.94 | % |
Ratios to average net assets (annualized) | | | | | | | | | | | | | | | | | | | | | | | | |
Gross expenses | | | 0.88 | % | | | 0.86 | % | | | 1.01 | % | | | 1.16 | % | | | 1.12 | % | | | 1.12 | % |
Net expenses | | | 0.75 | % | | | 0.75 | % | | | 0.87 | % | | | 0.93 | % | | | 0.85 | % | | | 0.85 | % |
Net investment income | | | 2.07 | % | | | 1.37 | % | | | 1.01 | % | | | 1.35 | % | | | 1.01 | % | | | 0.86 | % |
Supplemental data | | | | | | | | | | | | | | | | | | | | | | | | |
Portfolio turnover rate | | | 108 | % | | | 258 | % | | | 221 | % | | | 50 | % | | | 71 | % | | | 59 | % |
Net assets, end of period (000s omitted) | | | $15,207 | | | | $16,744 | | | | $18,296 | | | | $24,164 | | | | $30,177 | | | | $36,002 | |
| 1 | Calculated based upon average shares outstanding |
| 2 | Returns for periods of less than one year are not annualized. |
The accompanying notes are an integral part of these financial statements.
| | | | |
| 22 | | Wells Fargo Large Company Value Fund | | Financial highlights |
(For a share outstanding throughout each period)
| | | | | | | | | | | | | | | | | | | | | | | | |
| | | Six months ended
January 31, 2019 (unaudited) | | | Year ended July 31 | |
| INSTITUTIONAL CLASS | | 2018 | | | 2017 | | | 2016 | | | 2015 | | | 2014 | |
Net asset value, beginning of period | | | $14.58 | | | | $16.65 | | | | $14.66 | | | | $16.17 | | | | $16.91 | | | | $16.44 | |
Net investment income | | | 0.15 | | | | 0.24 | | | | 0.19 | 1 | | | 0.21 | 1 | | | 0.20 | 1 | | | 0.18 | 1 |
Net realized and unrealized gains (losses) on investments | | | (0.81 | ) | | | 1.30 | | | | 1.94 | | | | (0.38 | ) | | | 0.78 | | | | 2.05 | |
| | | | | | | | | | | | | | | | | | | | | | | | |
Total from investment operations | | | (0.66 | ) | | | 1.54 | | | | 2.13 | | | | (0.17 | ) | | | 0.98 | | | | 2.23 | |
Distributions to shareholders from | | | | | | | | | | | | | | | | | | | | | | | | |
Net investment income | | | (0.19 | ) | | | (0.23 | ) | | | (0.14 | ) | | | (0.22 | ) | | | (0.22 | ) | | | (0.14 | ) |
Net realized gains | | | (1.38 | ) | | | (3.38 | ) | | | 0.00 | | | | (1.12 | ) | | | (1.50 | ) | | | (1.62 | ) |
| | | | | | | | | | | | | | | | | | | | | | | | |
Total distributions to shareholders | | | (1.57 | ) | | | (3.61 | ) | | | (0.14 | ) | | | (1.34 | ) | | | (1.72 | ) | | | (1.76 | ) |
Net asset value, end of period | | | $12.35 | | | | $14.58 | | | | $16.65 | | | | $14.66 | | | | $16.17 | | | | $16.91 | |
Total return2 | | | (4.41 | )% | | | 9.77 | % | | | 14.61 | % | | | (0.54 | )% | | | 6.14 | % | | | 14.16 | % |
Ratios to average net assets (annualized) | | | | | | | | | | | | | | | | | | | | | | | | |
Gross expenses | | | 0.63 | % | | | 0.62 | % | | | 0.74 | % | | | 0.91 | % | | | 0.85 | % | | | 0.85 | % |
Net expenses | | | 0.50 | % | | | 0.50 | % | | | 0.61 | % | | | 0.74 | % | | | 0.65 | % | | | 0.65 | % |
Net investment income | | | 2.15 | % | | | 1.60 | % | | | 1.21 | % | | | 1.52 | % | | | 1.23 | % | | | 1.10 | % |
Supplemental data | | | | | | | | | | | | | | | | | | | | | | | | |
Portfolio turnover rate | | | 108 | % | | | 258 | % | | | 221 | % | | | 50 | % | | | 71 | % | | | 59 | % |
Net assets, end of period (000s omitted) | | | $5,235 | | | | $17,606 | | | | $16,321 | | | | $9,343 | | | | $1,483 | | | | $863 | |
| 1 | Calculated based upon average shares outstanding |
| 2 | Returns for periods of less than one year are not annualized. |
The accompanying notes are an integral part of these financial statements.
| | | | | | |
| Notes to financial statements (unaudited) | | Wells Fargo Large Company Value Fund | | | 23 | |
1. ORGANIZATION
Wells Fargo Funds Trust (the “Trust”), a Delaware statutory trust organized on March 10, 1999, is an open-end management investment company registered under the Investment Company Act of 1940, as amended (the “1940 Act”). As an investment company, the Trust follows the accounting and reporting guidance in Financial Accounting Standards Board (“FASB”) Accounting Standards Codification Topic 946, Financial Services – Investment Companies. These financial statements report on the Wells Fargo Large Company Value Fund (the “Fund”) which is a diversified series of the Trust.
2. SIGNIFICANT ACCOUNTING POLICIES
The following significant accounting policies, which are consistently followed in the preparation of the financial statements of the Fund, are in conformity with U.S. generally accepted accounting principles which require management to make estimates and assumptions that affect the reported amounts of assets and liabilities, disclosure of contingent assets and liabilities at the date of the financial statements, and the reported amounts of revenues and expenses during the reporting period. Actual results could differ from those estimates.
Securities valuation
All investments are valued each business day as of the close of regular trading on the New York Stock Exchange (generally 4 p.m. Eastern Time), although the Fund may deviate from this calculation time under unusual or unexpected circumstances.
Equity securities and futures contracts that are listed on a foreign or domestic exchange or market are valued at the official closing price or, if none, the last sales price. If no sale occurs on the principal exchange or market that day, a fair value price will be determined in accordance with the Fund’s Valuation Procedures.
Investments in registered open-end investment companies are valued at net asset value.
Investments which are not valued using any of the methods discussed above are valued at their fair value, as determined in good faith by the Board of Trustees of the Fund. The Board of Trustees has established a Valuation Committee comprised of the Trustees and has delegated to it the authority to take any actions regarding the valuation of portfolio securities that the Valuation Committee deems necessary or appropriate, including determining the fair value of portfolio securities, unless the determination has been delegated to the Wells Fargo Asset Management Pricing Committee at Wells Fargo Funds Management, LLC (“Funds Management”). The Board of Trustees retains the authority to make or ratify any valuation decisions or approve any changes to the Valuation Procedures as it deems appropriate. On a quarterly basis, the Board of Trustees receives reports on any valuation actions taken by the Valuation Committee or the Wells Fargo Asset Management Pricing Committee which may include items for ratification.
Foreign currency translation
The accounting records of the Fund are maintained in U.S. dollars. The values of other assets and liabilities denominated in foreign currencies are translated into U.S. dollars at rates provided by an independent foreign currency pricing source at a time each business day specified by the Wells Fargo Asset Management Pricing Committee. Purchases and sales of securities, and income and expenses are converted at the rate of exchange on the respective dates of such transactions. Net realized foreign exchange gains or losses arise from sales of foreign currencies, currency gains or losses realized between the trade and settlement dates on securities transactions, and the difference between the amounts of dividends, interest and foreign withholding taxes recorded and the U.S. dollar equivalent of the amounts actually paid or received. Net unrealized foreign exchange gains and losses arise from changes in the fair value of assets and liabilities other than investments in securities resulting from changes in exchange rates. The changes in net assets arising from changes in exchange rates of securities and the changes in net assets resulting from changes in market prices of securities are not separately presented. Such changes are included in net realized and unrealized gains or losses from investments.
Futures contracts
The Fund is subject to equity price risk in the normal course of pursuing its investment objectives. Futures contracts are agreements between the Fund and a counterparty to buy or sell a specific amount of a commodity, financial instrument or currency at specified price and on a specified date. The Fund may buy and sell futures contracts in order to gain exposure to, or protect against, changes in security values. The primary risks associated with the use of futures contracts are the imperfect correlation between changes in market values of securities held by the Fund and the prices of futures contracts, and the possibility of an illiquid market. Futures contracts are generally entered into on a regulated futures exchange and cleared through a clearinghouse associated with the exchange. With futures contracts, there is minimal counterparty risk to the Fund since futures contracts are exchange traded and the exchange’s clearinghouse, as counterparty to all exchange traded futures, guarantees the futures contracts against default.
| | | | |
| 24 | | Wells Fargo Large Company Value Fund | | Notes to financial statements (unaudited) |
Upon entering into a futures contracts, the Fund is required to deposit either cash or securities (initial margin) with the broker in an amount equal to a certain percentage of the contract value. Subsequent payments (variation margin) are paid to or from the broker each day equal to the daily changes in the contract value. Such payments are recorded as unrealized gains or losses and, if any, shown as variation margin receivable (payable) in the Statement of Assets and Liabilities. Should the Fund fail to make requested variation margin payments, the broker can gain access to the initial margin to satisfy the Fund’s payment obligations. When the contracts are closed, a realized gain or loss is recorded in the Statement of Operations.
Security transactions and income recognition
Securities transactions are recorded on a trade date basis. Realized gains or losses are recorded on the basis of identified cost.
Dividend income is recognized on the ex-dividend date. Dividend income is recorded net of foreign taxes withheld where recovery of such taxes is not assured.
Distributions to shareholders
Distributions to shareholders from net investment income and any net realized gains are recorded on the ex-dividend date and paid at least annually. Such distributions are determined in accordance with income tax regulations and may differ from U.S. generally accepted accounting principles. Dividend sources are estimated at the time of declaration. The tax character of distributions is determined as of the Fund’s fiscal year end. Therefore, a portion of the Fund’s distributions made prior to the Fund’s fiscal year end may be categorized as a tax return of capital at year end.
Federal and other taxes
The Fund intends to continue to qualify as a regulated investment company by distributing substantially all of its investment company taxable income and any net realized capital gains (after reduction for capital loss carryforwards) sufficient to relieve it from all, or substantially all, federal income taxes. Accordingly, no provision for federal income taxes was required.
The Fund’s income and federal excise tax returns and all financial records supporting those returns for the prior three fiscal years are subject to examination by the federal and Delaware revenue authorities. Management has analyzed the Fund’s tax positions taken on federal, state, and foreign tax returns for all open tax years and does not believe that there are any uncertain tax positions that require recognition of a tax liability.
As of January 31, 2019, the aggregate cost of all investments for federal income tax purposes was $200,139,176 and the unrealized gains (losses) consisted of:
| | | | |
| |
Gross unrealized gains | | $ | 19,946,155 | |
| |
Gross unrealized losses | | | (5,263,933 | ) |
| |
Net unrealized gains | | $ | 14,682,222 | |
Class allocations
The separate classes of shares offered by the Fund differ principally in applicable sales charges, distribution, shareholder servicing, and administration fees. Class specific expenses are charged directly to that share class. Investment income, common expenses, and realized and unrealized gains (losses) on investments are allocated daily to each class of shares based on the relative proportion of net assets of each class.
3. FAIR VALUATION MEASUREMENTS
Fair value measurements of investments are determined within a framework that has established a fair value hierarchy based upon the various data inputs utilized in determining the value of the Fund’s investments. The three-level hierarchy gives the highest priority to unadjusted quoted prices in active markets for identical assets or liabilities (Level 1) and the lowest priority to unobservable inputs (Level 3). The Fund’s investments are classified within the fair value hierarchy based on the lowest level of input that is significant to the fair value measurement. The inputs are summarized into three broad levels as follows:
| ∎ | | Level 1 – quoted prices in active markets for identical securities |
| ∎ | | Level 2 – other significant observable inputs (including quoted prices for similar securities, interest rates, prepayment speeds, credit risk, etc.) |
| ∎ | | Level 3 – significant unobservable inputs (including the Fund’s own assumptions in determining the fair value of investments) |
| | | | | | |
| Notes to financial statements (unaudited) | | Wells Fargo Large Company Value Fund | | | 25 | |
The inputs or methodologies used for valuing investments in securities are not necessarily an indication of the risk associated with investing in those securities.
The following is a summary of the inputs used in valuing the Fund’s assets and liabilities as of January 31, 2019:
| | | | | | | | | | | | | | | | |
| | | | |
| | | Quoted prices
(Level 1) | | | Other significant
observable inputs
(Level 2) | | | Significant
unobservable inputs (Level 3) | | | Total | |
| | | | |
Assets | | | | | | | | | | | | | | | | |
Investments in: | | | | | | | | | | | | | | | | |
| | | | |
Common stocks | | | | | | | | | | | | | | | | |
| | | | |
Communication services | | $ | 19,246,606 | | | $ | 0 | | | $ | 0 | | | $ | 19,246,606 | |
| | | | |
Consumer discretionary | | | 11,583,622 | | | | 0 | | | | 0 | | | | 11,583,622 | |
| | | | |
Consumer staples | | | 18,297,595 | | | | 0 | | | | 0 | | | | 18,297,595 | |
| | | | |
Energy | | | 16,950,430 | | | | 0 | | | | 0 | | | | 16,950,430 | |
| | | | |
Financials | | | 41,136,457 | | | | 0 | | | | 0 | | | | 41,136,457 | |
| | | | |
Health care | | | 35,401,437 | | | | 0 | | | | 0 | | | | 35,401,437 | |
| | | | |
Industrials | | | 14,306,444 | | | | 0 | | | | 0 | | | | 14,306,444 | |
| | | | |
Information technology | | | 17,009,431 | | | | 0 | | | | 0 | | | | 17,009,431 | |
| | | | |
Materials | | | 5,135,249 | | | | 0 | | | | 0 | | | | 5,135,249 | |
| | | | |
Real Estate | | | 13,181,787 | | | | 0 | | | | 0 | | | | 13,181,787 | |
| | | | |
Utilities | | | 17,290,267 | | | | 0 | | | | 0 | | | | 17,290,267 | |
| | | | |
Short-term investments | | | | | | | | | | | | | | | | |
| | | | |
Investment companies | | | 5,282,073 | | | | 0 | | | | 0 | | | | 5,282,073 | |
| | | | |
| | | 214,821,398 | | | | | | | | | | | | 214,821,398 | |
| | | | |
Futures contracts | | | 274,456 | | | | | | | | | | | | 274,456 | |
| | | | |
Total assets | | $ | 215,095,854 | | | $ | 0 | | | $ | 0 | | | $ | 215,095,854 | |
Additional sector, industry or geographic detail is included in the Portfolio of Investments.
Futures contracts are reported at their cumulative unrealized gains (losses) at measurement date as reported in the table following the Portfolio of Investments. For futures contracts the current day’s variation margin is reported on the Statement of Assets and Liabilities. All other assets and liabilities are reported at their market value at measurement date.
At January 31, 2019, the Fund did not have any transfers into/out of Level 3.
4. TRANSACTIONS WITH AFFILIATES
Management fee
Funds Management, an indirect wholly owned subsidiary of Wells Fargo & Company, is the manager of the Fund and provides advisory and fund-level administrative services under an investment management agreement. Under the investment management agreement, Funds Management is responsible for, among other services, implementing the investment objectives and strategies of the Fund, supervising the subadviser and providing fund-level administrative services in connection with the Fund’s operations. As compensation for its services under the investment management agreement, Funds Management is entitled to receive an annual management fee starting at 0.40% and declining to 0.33% as the average daily net assets of the Fund increase. For the six months ended January 31, 2019, the management fee was equivalent to an annual rate of 0.40% of the Fund’s average daily net assets.
Funds Management has retained the services of a subadviser to provide daily portfolio management to the Fund. The fee for subadvisory services is borne by Funds Management. Wells Capital Management Incorporated (“WellsCap”), an affiliate of Funds Management and an indirect wholly owned subsidiary of Wells Fargo, is the subadviser to the Fund and is entitled to receive a fee from Funds Management at an annual rate starting at 0.25% and declining to 0.15% as the average daily net assets of the Fund increase. Prior to November 1, 2018, Analytic Investors, LLC served as the subadviser and received an annual fee from Funds Management at the same rates. On November 1, 2018, Analytic Investors, LLC was consolidated into WellsCap.
| | | | |
| 26 | | Wells Fargo Large Company Value Fund | | Notes to financial statements (unaudited) |
Administration fees
Under a class-level administration agreement, Funds Management provides class-level administrative services to the Fund, which includes paying fees and expenses for services provided by the transfer agent, sub-transfer agents, omnibus account servicers and record-keepers. As compensation for its services under the class-level administration agreement, Funds Management receives an annual fee which is calculated based on the average daily net assets of each class as follows:
| | | | |
| | | Class-level
administration fee | |
| |
Class A, Class C | | | 0.21 | % |
| |
Class R6 | | | 0.03 | |
| |
Administrator Class, Institutional Class | | | 0.13 | |
Funds Management has contractually waived and/or reimbursed management and administration fees to the extent necessary to maintain certain net operating expense ratios for the Fund. When each class of the Fund has exceeded its expense cap, Funds Management has waived fees and/or reimbursed expenses from fund level expenses on a proportionate basis and then from class specific expenses; otherwise, waivers and/or reimbursements are applied against class specific expenses before fund level expenses. Funds Management has committed through November 30, 2019 to waive fees and/or reimburse expenses to the extent necessary to cap the Fund’s expenses at 0.83% for Class A shares, 1.58% for Class C shares, 0.40% for Class R6 shares, 0.75% for Administrator Class shares, and 0.50% for Institutional Class shares. Prior to or after the commitment expiration date, the cap may be increased or the commitment to maintain the cap may be terminated only with the approval of the Board of Trustees.
Distribution fee
The Trust has adopted a distribution plan for Class C of the Fund pursuant to Rule 12b-1 under the 1940 Act. A distribution fee is charged to Class C shares and paid to Wells Fargo Funds Distributor, LLC (“Funds Distributor”), the principal underwriter, at an annual rate of 0.75% of the average daily net assets of Class C shares.
In addition, Funds Distributor is entitled to receive the front-end sales charge from the purchase of Class A shares and a contingent deferred sales charge on the redemption of certain Class A shares. Funds Distributor is also entitled to receive the contingent deferred sales charges from redemptions of Class C shares. For the six months ended January 31, 2019, Funds Distributor received $975 from the sale of Class A. No contingent deferred sales charges were incurred by Class A and Class C shares for the six months ended January 31, 2019.
Shareholder servicing fees
The Trust has entered into contracts with one or more shareholder servicing agents, whereby Class A, Class C, and Administrator Class of the Fund are charged a fee at an annual rate of 0.25% of the average daily net assets of each respective class.
A portion of these total shareholder servicing fees were paid to affiliates of Wells Fargo.
Interfund transactions
The Fund may purchase or sell portfolio investment securities to certain other Wells Fargo affiliates pursuant to Rule 17a-7 under the 1940 Act and under procedures adopted by the Board of Trustees. The procedures have been designed to ensure that these interfund transactions, which do not incur broker commissions, are effected at current market prices.
5. INVESTMENT PORTFOLIO TRANSACTIONS
Purchases and sales of investments, excluding U.S. government obligations (if any) and short-term securities, for the six months ended January 31, 2019 were $249,587,974 and $272,034,287, respectively.
6. DERIVATIVE TRANSACTIONS
During the six months ended January 31, 2019, the Fund entered into futures contracts to gain market exposure. The Fund had an average notional amount of $5,164,942 in long futures contracts during the six months ended January 31, 2019.
The fair value, realized gains or losses and change in unrealized gains or losses, if any, on derivative instruments are reflected in the corresponding financial statement captions.
| | | | | | |
| Notes to financial statements (unaudited) | | Wells Fargo Large Company Value Fund | | | 27 | |
7. BANK BORROWINGS
The Trust (excluding the money market funds), Wells Fargo Master Trust and Wells Fargo Variable Trust are parties to a $280,000,000 revolving credit agreement whereby the Fund is permitted to use bank borrowings for temporary or emergency purposes, such as to fund shareholder redemption requests. Interest under the credit agreement is charged to the Fund based on a borrowing rate equal to the higher of the Federal Funds rate in effect on that day plus 1.25% or the overnight LIBOR rate in effect on that day plus 1.25%. In addition, an annual commitment fee equal to 0.25% of the unused balance is allocated to each participating fund.
During the six months ended January 31, 2019, the Fund had average borrowings outstanding of $14,718 (on an annualized basis) at an average interest rate of 3.73% and paid interest in the amount of $549.
8. DISTRIBUTIONS TO SHAREHOLDERS
Effective for all filings after November 4, 2018, the Securities and Exchange Commission eliminated the requirement to separately state the components of distributions to shareholders under U.S. generally accepted accounting principles. The amounts of distributions to shareholders for the year ended July 31, 2018 were as follows:
| | | | | | | | |
| | | Net investment
income | | | Net realized
gains | |
| | |
Class A | | | $2,599,881 | | | | $43,429,588 | |
| | |
Class C | | | 11.926 | | | | 647,269 | |
| | |
Class R6 | | | 420 | | | | 6,236 | |
| | |
Administrator Class | | | 218,142 | | | | 3,454,920 | |
| | |
Institutional Class | | | 253,844 | | | | 3,302,668 | |
9. INDEMNIFICATION
Under the Trust’s organizational documents, the officers and Trustees have been granted certain indemnification rights against certain liabilities that may arise out of performance of their duties to the Trust. Additionally, in the normal course of business, the Trust may enter into contracts with service providers that contain a variety of indemnification clauses. The Trust’s maximum exposure under these arrangements is dependent on future claims that may be made against the Fund and, therefore, cannot be estimated.
10. NEW ACCOUNTING PRONOUNCEMENT
In August 2018, FASB issued Accounting Standards Update (“ASU”) No. 2018-13, Fair Value Measurement (Topic 820)Disclosure Framework—Changes to the Disclosure Requirements for Fair Value Measurement. ASU 2018-13 updates the disclosure requirements for fair value measurements by modifying or removing certain disclosures and adding certain new disclosures. The amendments are effective for fiscal years, and interim periods within those fiscal years, beginning after December 15, 2019. Early adoption is permitted. Management has adopted the removal and modification of disclosures early, as permitted, and will adopt the additional new disclosures at the effective date.
| | | | |
| 28 | | Wells Fargo Large Company Value Fund | | Other information (unaudited) |
PROXY VOTING INFORMATION
A description of the policies and procedures used to determine how to vote proxies relating to portfolio securities is available, upon request, by calling1-800-222-8222, visiting our website atwellsfargofunds.com, or visiting the SEC website at sec.gov. Information regarding how the Fund voted proxies relating to portfolio securities during the most recent 12-month period ended June 30 is available on the Fund’s website atwellsfargofunds.comor by visiting the SEC website at sec.gov.
PORTFOLIO HOLDINGS INFORMATION
The complete portfolio holdings for the Fund are publicly available monthly on the Fund’s website (wellsfargofunds.com), on a one-month delayed basis. In addition, top ten holdings information (excluding derivative positions) for the Fund is publicly available on the Fund’s website on a monthly, seven-day or more delayed basis. The Fund files its complete schedule of portfolio holdings with the SEC for the first and third quarters of each fiscal year on Form N-Q, which is available by visiting the SEC website at sec.gov. In addition, the Fund’s Form N-Q may be reviewed and copied at the SEC’s Public Reference Room in Washington, DC, and at regional offices in New York City, at 233 Broadway, and in Chicago, at 175 West Jackson Boulevard, Suite 900. Information about the Public Reference Room may be obtained by calling 1-800-SEC-0330.
| | | | | | |
| Other information (unaudited) | | Wells Fargo Large Company Value Fund | | | 29 | |
BOARD OF TRUSTEES AND OFFICERS
Each of the Trustees and Officers1 listed in the table below acts in identical capacities for each fund in the Wells Fargo family of funds, which consists of 152 mutual funds comprising the Wells Fargo Funds Trust, Wells Fargo Variable Trust, Wells Fargo Master Trust and four closed-end funds (collectively the “Fund Complex”). This table should be read in conjunction with the Prospectus and the Statement of Additional Information2. The mailing address of each Trustee and Officer is 525 Market Street, 12th Floor, San Francisco, CA 94105. Each Trustee and Officer serves an indefinite term, however, each Trustee serves such term until reaching the mandatory retirement age established by the Trustees.
Independent Trustees
| | | | | | |
Name and year of birth | | Position held and length of service* | | Principal occupations during past five years or longer | | Current other
public company or
investment company
directorships |
| | | |
William R. Ebsworth (Born 1957) | | Trustee, since 2015 | | Retired. From 1984 to 2013, equities analyst, portfolio manager, research director and chief investment officer at Fidelity Management and Research Company in Boston, Tokyo, and Hong Kong, and retired in 2013 as Chief Investment Officer of Fidelity Strategic Advisers, Inc. where he led a team of investment professionals managing client assets. Prior thereto, Board member of Hong Kong Securities Clearing Co., Hong Kong Options Clearing Corp., the Thailand International Fund, Ltd., Fidelity Investments Life Insurance Company, and Empire Fidelity Investments Life Insurance Company. Audit Committee Chair and Investment Committee Chair of the Vincent Memorial Hospital Endowment (non-profit organization). Mr. Ebsworth is a CFA® charterholder. | | N/A |
| | | |
Jane A. Freeman (Born 1953) | | Trustee, since 2015; Chair Liaison, since 2018 | | Retired. From 2012 to 2014 and 1999 to 2008, Chief Financial Officer of Scientific Learning Corporation. From 2008 to 2012, Ms. Freeman provided consulting services related to strategic business projects. Prior to 1999, Portfolio Manager at Rockefeller & Co. and Scudder, Stevens & Clark. Board member of the Harding Loevner Funds from 1996 to 2014, serving as both Lead Independent Director and chair of the Audit Committee. Board member of the Russell Exchange Traded Funds Trust from 2011 to 2012 and the chair of the Audit Committee. Ms. Freeman is a Board Member of The Ruth Bancroft Garden (non-profit organization). She is also an inactive Chartered Financial Analyst. | | N/A |
| | | |
Isaiah Harris, Jr.3 (Born 1952) | | Trustee, since 2009; Audit Committee Chairman, since 2019 | | Retired. Chairman of the Board of CIGNA Corporation since 2009, and Director since 2005. From 2003 to 2011, Director of Deluxe Corporation. Prior thereto, President and CEO of BellSouth Advertising and Publishing Corp. from 2005 to 2007, President and CEO of BellSouth Enterprises from 2004 to 2005 and President of BellSouth Consumer Services from 2000 to 2003. Emeritus member of the Iowa State University Foundation Board of Governors. Emeritus Member of the Advisory Board of Iowa State University School of Business. Advisory Board Member, Palm Harbor Academy (private school). Advisory Board Member, Child Evangelism Fellowship (non-profit). Mr. Harris is a certified public accountant (inactive status). | | CIGNA Corporation |
| | | |
Judith M. Johnson3 (Born 1949) | | Trustee, since 2008; Audit Committee Chairman, from 2009 to 2018 | | Retired. Prior thereto, Chief Executive Officer and Chief Investment Officer of Minneapolis Employees Retirement Fund from 1996 to 2008. Ms. Johnson is an attorney, certified public accountant and a certified managerial accountant. | | N/A |
| | | |
David F. Larcker (Born 1950) | | Trustee, since 2009 | | James Irvin Miller Professor of Accounting at the Graduate School of Business, Stanford University, Director of the Corporate Governance Research Initiative and Senior Faculty of The Rock Center for Corporate Governance since 2006. From 2005 to 2008, Professor of Accounting at the Graduate School of Business, Stanford University. Prior thereto, Ernst & Young Professor of Accounting at The Wharton School, University of Pennsylvania from 1985 to 2005. | | N/A |
| | | | |
| 30 | | Wells Fargo Large Company Value Fund | | Other information (unaudited) |
| | | | | | |
Name and year of birth | | Position held and length of service* | | Principal occupations during past five years or longer | | Current other
public company or
investment company
directorships |
| | | |
Olivia S. Mitchell (Born 1953) | | Trustee, since 2006; Nominating and Governance Committee Chairman, since 2018 | | International Foundation of Employee Benefit Plans Professor, Wharton School of the University of Pennsylvania since 1993. Director of Wharton’s Pension Research Council and Boettner Center on Pensions & Retirement Research, and Research Associate at the National Bureau of Economic Research. Previously, Cornell University Professor from 1978 to 1993. | | N/A |
| | | |
Timothy J. Penny (Born 1951) | | Trustee, since 1996; Chairman, since 2018; Vice Chairman, from 2017 to 2018 | | President and Chief Executive Officer of Southern Minnesota Initiative Foundation, a non-profit organization, since 2007. Member of the Board of Trustees of NorthStar Education Finance, Inc., a non-profit organization, since 2007. | | N/A |
| | | |
James G. Polisson (Born 1959) | | Trustee, since 2018; Advisory Board Member, from 2017 to 2018 | | Retired. Chief Marketing Officer, Source (ETF) UK Services, Ltd, from 2015 to 2017. From 2012 to 2015, Principal of The Polisson Group, LLC, a management consulting, corporate advisory and principal investing company. Chief Executive Officer and Managing Director at Russell Investments, Global Exchange Traded Funds from 2010 to 2012. Managing Director of Barclays Global Investors from 1998 to 2010 and Global Chief Marketing Officer for iShares and Barclays Global Investors from 2000 to 2010. Trustee of the San Francisco Mechanics’ Institute, a non-profit organization, from 2013 to 2015. Board member of the Russell Exchange Traded Fund Trust from 2011 to 2012. Director of Barclays Global Investors Holdings Deutschland GmbH from 2006 to 2009. Mr. Polisson is an attorney and has a retired status with the Massachusetts and District of Columbia Bar Associations. | | N/A |
| | | |
Pamela Wheelock (Born 1959) | | Trustee, since 2018; Advisory Board Member, from 2017 to 2018 | | Board member of the Destination Medical Center Economic Development Agency, Rochester, Minnesota since 2019. Chief Operating Officer, Twin Cities Habitat for Humanity from 2017 to 2019. Vice President of University Services, University of Minnesota from 2012 to 2016. Prior thereto, on the Board of Directors, Governance Committee and Finance Committee for the Minnesota Philanthropy Partners (Saint Paul Foundation) from 2012 to 2018, Interim Chief Executive Officer of Blue Cross Blue Shield of Minnesota from 2011 to 2012, Chairman of the Board from 2009 to 2012 and Board Director from 2003 to 2015. Vice President, Leadership and Community Engagement, Bush Foundation, Saint Paul, Minnesota (a private foundation) from 2009 to 2011. Executive Vice President and Chief Financial Officer, Minnesota Sports and Entertainment from 2004 to 2009 and Senior Vice President from 2002 to 2004. Executive Vice President of the Minnesota Wild Foundation from 2004 to 2008. Commissioner of Finance, State of Minnesota, from 1999 to 2002. Currently Board Chair of the Minnesota Wild Foundation since 2010. | | N/A |
| * | Length of service dates reflect the Trustee’s commencement of service with the Trust’s predecessor entities, where applicable. |
| | | | | | |
| Other information (unaudited) | | Wells Fargo Large Company Value Fund | | | 31 | |
Officers
| | | | | | |
Name and year of birth | | Position held and length of service | | Principal occupations during past five years or longer | | |
| | | |
Andrew Owen (Born 1960) | | President, since 2017 | | Executive Vice President of Wells Fargo & Company and Head of Affiliated Managers, Wells Fargo Asset Management, since 2014. In addition, Mr. Owen is currently President, Chief Executive Officer and Director of Wells Fargo Funds Management, LLC since 2017. Prior thereto, Executive Vice President responsible for marketing, investments and product development for Wells Fargo Funds Management, LLC, from 2009 to 2014. | | |
| | | |
Jeremy DePalma1 (Born 1974) | | Treasurer, since 2012 | | Senior Vice President of Wells Fargo Funds Management, LLC since 2009. Senior Vice President of Evergreen Investment Management Company, LLC from 2008 to 2010 and head of the Fund Reporting and Control Team within Fund Administration from 2005 to 2010. | | |
| | | |
Alexander Kymn (Born 1973) | | Secretary, since 2018; Chief Legal Officer, since 2018 | | Senior Company Counsel of Wells Fargo Bank, N.A. since 2018 (previously Senior Counsel from 2007 to 2018). Vice President of Wells Fargo Funds Management, LLC from 2008 to 2014. | | |
| | | |
Michael H. Whitaker (Born 1967) | | Chief Compliance Officer, since 2016 | | Senior Vice President and Chief Compliance Officer since 2016. Senior Vice President and Chief Compliance Officer for Fidelity Investments from 2007 to 2016. | | |
| | | |
David Berardi (Born 1975) | | Assistant Treasurer, since 2009 | | Vice President of Wells Fargo Funds Management, LLC since 2009. Vice President of Evergreen Investment Management Company, LLC from 2008 to 2010. Manager of Fund Reporting and Control for Evergreen Investment Management Company, LLC from 2004 to 2010. | | |
| 1 | Jeremy DePalma acts as Treasurer of 76 funds and Assistant Treasurer of 76 funds in the Fund Complex. |
| 2 | The Statement of Additional Information includes additional information about the Trustees and is available, without charge, upon request, by calling 1-800-260-5969 or by visiting the website atwellsfargofunds.com. |
| 3 | Mr. Harris became Chairman of the Audit Committee effective January 1, 2019. |
| | | | |
| 32 | | Wells Fargo Large Company Value Fund | | Appendix A (unaudited) |
SALES CHARGE REDUCTIONS AND WAIVERS FOR CERTAIN INTERMEDIARIES
Raymond James & Associates, Inc., Raymond James Financial Services & Raymond James affiliates (“Raymond James”)
Effective on or about March 1, 2019, shareholders purchasing Fund shares through a Raymond James platform or account will be eligible only for the following load waivers (front-end sales charge waivers and contingent deferred, or back-end, sales charge waivers) and discounts, which may differ from those disclosed elsewhere in the Fund’s Prospectus or SAI.
Front-end Sales Load Waivers on Class A shares Available at Raymond James
| | • | | Shares purchased in an investment advisory program. |
| | • | | Shares purchased through reinvestment of capital gains distributions and dividend reinvestment when purchasing shares of the same fund (but not any other fund within the fund family). |
| | • | | Employees and registered representatives of Raymond James or its affiliates and their family members as designated by Raymond James. |
| | • | | Shares purchased from the proceeds of redemptions within the same fund family, provided (1) the repurchase occurs within 90 days following the redemption, (2) the redemption and purchase occur in the same account, and (3) redeemed shares were subject to a front-end or deferred sales load (known as Rights of Reinstatement). |
| | • | | A shareholder in the fund’s Class C shares will have their shares automatically exchanged at net asset value to Class A shares (or the appropriate share class) of the fund if the shares are no longer subject to a CDSC and the exchange is in line with the policies and procedures of Raymond James. |
CDSC Waivers on Class A and C Shares Available at Raymond James
| | • | | Death or disability of the shareholder. |
| | • | | Shares sold as part of a systematic withdrawal plan as described in the Fund’s Prospectus. |
| | • | | Return of excess contributions from an IRA Account. |
| | • | | Shares sold as part of a required minimum distribution for IRA and retirement accounts due to the shareholder reaching age 70½ as described in the Fund’s prospectus. |
| | • | | Shares sold to pay Raymond James fees but only if the transaction is initiated by Raymond James. |
| | • | | Shares acquired through a right of reinstatement. |
Front-end Load Discounts Available at Raymond James: Breakpoints, and/or Rights of Accumulation
| | • | | Breakpoints as described in the Fund’s Prospectus. |
| | • | | Rights of accumulation which entitle shareholders to breakpoint discounts will be automatically calculated based on the aggregated holding of fund family assets held by accounts within the purchaser’s household at Raymond James. Eligible fund family assets not held at Raymond James may be included in the rights of accumulation calculation only if the shareholder notifies his or her financial advisor about such assets. |

For more information
More information about Wells Fargo Funds is available free upon request. To obtain literature, please write, visit the Fund’s website, or call:
Wells Fargo Funds
P.O. Box 219967
Kansas City, MO 64121-9967
Website: wellsfargofunds.com
Individual investors: 1-800-222-8222
Retail investment professionals: 1-888-877-9275
Institutional investment professionals:1-866-765-0778
This report and the financial statements contained herein are submitted for the general information of the shareholders of the Fund. If this report is used for promotional purposes, distribution of the report must be accompanied or preceded by a current prospectus. Before investing, please consider the investment objectives, risks, charges, and expenses of the investment. For a current prospectus and, if available, a summary prospectus, containing this information, call1-800-222-8222 or visit the Fund’s website atwellsfargofunds.com. Read the prospectus carefully before you invest or send money.
Wells Fargo Asset Management (WFAM) is the trade name for certain investment advisory/management firms owned by Wells Fargo & Company. These firms include but are not limited to Wells Capital Management Incorporated and Wells Fargo Funds Management, LLC. Certain products managed by WFAM entities are distributed by Wells Fargo Funds Distributor, LLC (a broker/dealer and Member FINRA).
This material is for general informational and educational purposes only and is NOT intended to provide investment advice or a recommendation of any kind—including a recommendation for any specific investment, strategy, or plan.
INVESTMENT PRODUCTS: NOT FDIC INSURED ◾ NO BANK GUARANTEE ◾ MAY LOSE VALUE
© 2019 Wells Fargo Funds Management, LLC. All rights reserved.
| | |
 | | 320775 03-19 SA210/SAR210 01-19 |
Semi-Annual Report
January 31, 2019

Wells Fargo Low Volatility U.S. Equity Fund

Beginning on January 1, 2021, as permitted by new regulations adopted by the Securities and Exchange Commission, paper copies of the Wells Fargo Funds’ annual and semi-annual shareholder reports issued after this date will no longer be sent by mail, unless you specifically request paper copies of the reports. Instead, the reports will be made available on the Funds’ website, and you will be notified by mail each time a report is posted and provided with a website address to access the report.
If you already elected to receive shareholder reports electronically, you will not be affected by this change and you need not take any action. You may elect to receive shareholder reports and other communications from the Fund electronically at any time by contacting your financial intermediary (such as a broker-dealer or bank) or, if you are a direct investor, by calling 1-800-222-8222 or by enrolling at wellsfargo.com/advantagedelivery.
You may elect to receive all future reports in paper free of charge. If you invest through a financial intermediary, you can contact your financial intermediary to request that you continue to receive paper copies of your shareholder reports; if you invest directly with the Fund, you can call 1-800-222-8222. Your election to receive reports in paper will apply to all Wells Fargo Funds held in your account with your financial intermediary or, if you are a direct investor, to all Wells Fargo Funds that you hold.

Reduce clutter. Save trees.
Sign up for electronic delivery of prospectuses and shareholder reports atwellsfargo.com/advantagedelivery
Contents
The views expressed and any forward-looking statements are as of January 31, 2019, unless otherwise noted, and are those of the Fund managers and/or Wells Fargo Funds Management, LLC. Discussions of individual securities, or the markets generally, or any Wells Fargo Fund are not intended as individual recommendations. Future events or results may vary significantly from those expressed in any forward-looking statements. The views expressed are subject to change at any time in response to changing circumstances in the market. Wells Fargo Funds Management, LLC and the Fund disclaim any obligation to publicly update or revise any views expressed or forward-looking statements.
INVESTMENT PRODUCTS: NOT FDIC INSURED ◾ NO BANK GUARANTEE ◾ MAY LOSE VALUE
| | | | |
| 2 | | Wells Fargo Low Volatility U.S. Equity Fund | | Letter to shareholders (unaudited) |

Andrew Owen
President
Wells Fargo Funds
Favorable third-quarter economic indicators and corporate earnings reports encouraged domestic stock investors.
Dear Shareholder:
We are pleased to offer you this semi-annual report for the Wells Fargo Low Volatility U.S. Equity Fund for the six-month period that ended January 31, 2019. Highershort-term interest rates, inflation concerns, trade tensions, slowing economic growth outside the U.S., and geopolitical events contributed to investment market volatility throughout the period.
For the period, U.S. stocks, as measured by the S&P 500 Index,1 fell 3.00% and international stocks, as measured by the MSCI ACWI ex USA Index (Net),2 declined 6.34%. Based on the MSCI EM Index (Net),3 emerging market stocks lost 2.60%. For bond investors, the Bloomberg Barclays U.S. Aggregate Bond Index4 added 2.71% while the Bloomberg Barclays Global Aggregate ex-USD Index5 gained 1.37%. The Bloomberg Barclays Municipal Bond Index6 added 2.05%, and the ICE BofAML U.S. High Yield Index7 gained 1.02%.
Investors appeared to shake off lingering concerns during the third quarter.
Favorable third-quarter economic indicators and corporate earnings reports encouraged domestic stock investors. U.S. trade negotiations with Mexico and Canada made progress. The Conference Board Consumer Confidence Index®8 reached its highest level in 18 years during September. Several U.S. equity market indices reached records during August. The U.S. Federal Reserve (Fed) raised the federal funds rate by 25 basis points (bps; 100 bps equal 1.00%) to a target range of between 2.00% and 2.25% in September 2018. For the quarter that ended September 30, the S&P 500 Index added 7.71%.
Investors in international markets were not as reassured. Tensions between the U.S. and China increased when the U.S. imposed an additional $200 billion in tariffs on Chinese goods. China responded with $60 billion in tariffs on U.S. products. In addition, economic growth in China drew renewed concerns. The Bank of England, having raised its monetary policy rate to 0.50% in November 2017, increased the rate again in August 2018 to 0.75%. During the three-month period that ended September 30, 2018, the MSCI ACWI ex USA Index (Net) gained 0.71% while the MSCI EM Index (Net) declined 1.09%.
| 1 | The S&P 500 Index consists of 500 stocks chosen for market size, liquidity, and industry group representation. It is a market-value-weighted index with each stock’s weight in the index proportionate to its market value. You cannot invest directly in an index. |
| 2 | The Morgan Stanley Capital International (MSCI) All Country World Index (ACWI) ex USA Index (Net) is a free-float-adjusted market-capitalization-weighted index that is designed to measure the equity market performance of developed markets, excluding the United States and Canada. Source: MSCI. MSCI makes no express or implied warranties or representations and shall have no liability whatsoever with respect to any MSCI data contained herein. The MSCI data may not be further redistributed or used as a basis for other indices or any securities or financial products. This report is not approved, reviewed, or produced by MSCI. You cannot invest directly in an index. |
| 3 | The MSCI Emerging Markets (EM) Index (Net) is a free-float-adjusted market-capitalization-weighted index that is designed to measure large- and mid-cap equity market performance of emerging markets. The MSCI EM Index (Net) consists of the following 24 emerging market country indices: Brazil, Chile, China, Colombia, Czech Republic, Egypt, Greece, Hungary, India, Indonesia, Korea, Malaysia, Mexico, Pakistan, Peru, the Philippines, Poland, Qatar, Russia, South Africa, Taiwan, Thailand, Turkey, and the United Arab Emirates. You cannot invest directly in an index. |
| 4 | The Bloomberg Barclays U.S. Aggregate Bond Index is a broad-based benchmark that measures the investment-grade, U.S. dollar-denominated, fixed-rate taxable bond market, including Treasuries, government-related and corporate securities, mortgage-backed securities (agency fixed-rate and hybrid adjustable-rate mortgage pass-throughs), asset-backed securities, and commercial mortgage-backed securities. You cannot invest directly in an index. |
| 5 | The Bloomberg Barclays Global Aggregate ex-USD Index is an unmanaged index that provides a broad-based measure of the global investment-grade fixed-income markets excluding the U.S. dollar-denominated debt market. You cannot invest directly in an index. |
| 6 | The Bloomberg Barclays Municipal Bond Index is an unmanaged index composed of long-term tax-exempt bonds with a minimum credit rating of Baa. You cannot invest directly in an index. |
| 7 | The ICE BofAML U.S. High Yield Index is a market-capitalization-weighted index of domestic and Yankee high-yield bonds. The index tracks the performance of high-yield securities traded in the U.S. bond market. You cannot invest directly in an index. Copyright 2019. ICE Data Indices, LLC. All rights reserved. |
| 8 | The Conference Board Consumer Confidence Index® measures the degree of optimism on the state of the U.S. economy that consumers are expressing through their activities of savings and spending. You cannot invest directly in an index. |
| | | | | | |
| Letter to shareholders (unaudited) | | Wells Fargo Low Volatility U.S. Equity Fund | | | 3 | |
In bond markets, U.S. bonds, as measured by the Bloomberg Barclays U.S. Aggregate Bond Index, were flat. The Bloomberg Barclays Global Aggregateex-USD Index fell 1.74% during the quarter that ended September 30, 2018.
Conflicting data unsettled markets during the fourth quarter.
Negative stock market performance during October and December bracketed a mildly positive November for the S&P 500 Index and the MSCI ACWI ex USA Index (Net). As interest rates and bond yields gained during October, stock markets struggled. December’s S&P 500 Index performance was the worst since 1931. Globally, fixed-income investments fared better than stocks during the last two months of the year.
November’s U.S. midterm elections shifted control of the House of Representatives from Republicans to Democrats, presaging potential partisan disputes. The Bureau of Economic Analysis reported that third-quarter U.S. gross domestic product (GDP) grew at an annualized 3.4% rate, lower than second-quarter GDP growth. Brexit efforts stalled in the U.K. ahead of the March 2019 deadline. The People’s Bank of China cut reserve requirement ratios and accelerated infrastructure spending and tax cuts, and the value of the yuan declined to low levels last seen in 2008. Oil prices fell.
After the Fed increased the federal funds rate by 25 bps to a target range of between 2.25% and 2.50% in December 2018—the ninth such increase since the Fed began raising rates three years ago from near zero—it softened its outlook for further interest rate increases in 2019.
The market climbs a wall of worry.
Investors entered 2019 with reasons to be concerned. A partial U.S. government shutdown driven by partisan disputes over spending and immigration policies extended into January. Globally, economic signals were uneven. Investors expected high levels of stock market volatility to continue, as measured by the VIX9.
January’s returns tended to support the investing adage that the market climbs a wall of worry. The S&P 500 Index gained 8.01% for the month that ended January 31, 2019, its best monthly performance in 30 years. Returns for the MSCI ACWI ex USA Index (Net), the Bloomberg Barclays U.S. Aggregate Bond Index, and the Bloomberg Barclays Global Aggregate ex-USD Index also were positive.
Don’t let short-term uncertainty derail long-term investment goals.
Periods of investment uncertainty can present challenges, but experience has taught us that maintaining long-term investment goals can be an effective way to plan for the future. To help you create a sound strategy based on your personal goals and risk tolerance, Wells Fargo Funds offers more than 100 mutual funds spanning a wide range of asset classes and investment styles. Although diversification cannot guarantee an investment profit or prevent losses, we believe it can be an effective way to manage investment risk and potentially smooth out overall portfolio performance. We encourage investors to know their investments and to understand that appropriate levels of risk-taking may unlock opportunities.
January’s returns tended to support the investing adage that the market climbs a wall of worry.
| 9 | The Chicago Board Options Exchange Market Volatility Index (VIX) is a popular measure of the implied volatility of S&P 500 Index options. It represents one measure of the market’s expectation of stock market volatility over the next 30-day period. You cannot invest directly in an index. |
| | | | |
| 4 | | Wells Fargo Low Volatility U.S. Equity Fund | | Letter to shareholders (unaudited) |
Thank you for choosing to invest with Wells Fargo Funds. We appreciate your confidence in us and remain committed to helping you meet your financial needs.
Sincerely,

Andrew Owen
President
Wells Fargo Funds
For further information about your Fund, contact your investment professional, visit our website atwellsfargofunds.com, or call us directly at1-800-222-8222.
This page is intentionally left blank.
| | | | |
| 6 | | Wells Fargo Low Volatility U.S. Equity Fund | | Performance highlights (unaudited) |
Investment objective
The Fund seeks long-term capital appreciation.
Manager
Wells Fargo Funds Management, LLC
Subadviser
Wells Capital Management Incorporated
Portfolio managers
Dennis Bein, CFA®‡
Ryan Brown, CFA®‡
Harindra de Silva, Ph.D., CFA®‡
Average annual total returns (%) as of January 31, 2019
| | | | | | | | | | | | | | | | | | | | | | | | | | |
| | | | | Including sales charge | | | Excluding sales charge | | | Expense ratios1 (%) | |
| | | | | 1 year | | | Since
inception | | | 1 year | | | Since
inception | | | Gross | | | Net2 | |
| | | | | | | |
| Class A (WLVLX) | | 10-31-2016 | | | -7.82 | | | | 4.73 | | | | -2.19 | | | | 7.52 | | | | 1.56 | | | | 0.74 | |
| | | | | | | |
| Class C (WLVKX) | | 10-31-2016 | | | -3.87 | | | | 6.74 | | | | -2.87 | | | | 6.74 | | | | 2.31 | | | | 1.49 | |
| | | | | | | |
| Class R6 (WLVJX) | | 10-31-2016 | | | – | | | | – | | | | -1.74 | | | | 8.00 | | | | 1.13 | | | | 0.31 | |
| | | | | | | |
| Administrator Class (WLVDX) | | 10-31-2016 | | | – | | | | – | | | | -2.09 | | | | 7.60 | | | | 1.48 | | | | 0.66 | |
| | | | | | | |
| Institutional Class (WLVOX) | | 10-31-2016 | | | – | | | | – | | | | -1.83 | | | | 7.88 | | | | 1.23 | | | | 0.41 | |
| | | | | | | |
| Russell 1000® Index3 | | – | | | – | | | | – | | | | -2.17 | | | | 13.49 | | | | – | | | | – | |
Figures quoted represent past performance, which is no guarantee of future results, and do not reflect taxes that a shareholder may pay on fund distributions or the redemption of fund shares. Investment return and principal value of an investment will fluctuate so that an investor’s shares, when redeemed, may be worth more or less than their original cost. Performance shown without sales charges would be lower if sales charges were reflected. Current performance may be lower or higher than the performance data quoted, which assumes the reinvestment of dividends and capital gains. Current month-end performance is available on the Fund’s website,wellsfargofunds.com.
Index returns do not include transaction costs associated with buying and selling securities, any mutual fund fees or expenses, or any taxes. It is not possible to invest directly in an index.
For Class A shares, the maximum front-end sales charge is 5.75%. For Class C shares, the maximum contingent deferred sales charge is 1.00%. Performance including a contingent deferred sales charge assumes the sales charge for the corresponding time period. Class R6, Administrator Class, and Institutional Class shares are sold without a front-end sales charge or contingent deferred sales charge.
Stock values fluctuate in response to the activities of individual companies and general market and economic conditions. Certain investment strategies tend to increase the total risk of an investment (relative to the broader market). The Fund is exposed to smaller-company securities risk. Consult the Fund’s prospectus for additional information on these and other risks.
Please see footnotes on page 7.
| | | | | | |
| Performance highlights (unaudited) | | Wells Fargo Low Volatility U.S. Equity Fund | | | 7 | |
| | | | |
| Ten largest holdings (%) as of January 31, 20194 | |
| |
Waste Management Incorporated | | | 2.49 | |
| |
The Procter & Gamble Company | | | 2.47 | |
| |
NextEra Energy Incorporated | | | 2.46 | |
| |
PepsiCo Incorporated | | | 2.42 | |
| |
CME Group Incorporated | | | 2.33 | |
| |
Merck & Company Incorporated | | | 2.29 | |
| |
VICI Properties Incorporated | | | 2.25 | |
| |
The Hershey Company | | | 2.25 | |
| |
Sysco Corporation | | | 2.17 | |
| |
Costco Wholesale Corporation | | | 2.13 | |
|
| Sector distribution as of January 31, 20195 |
|
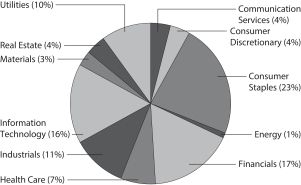 |
| ‡ | CFA® and Chartered Financial Analyst® are trademarks owned by CFA Institute. |
| 1 | Reflects the expense ratios as stated in the most recent prospectus, which include the impact of 0.01% in acquired fund fees and expenses. The expense ratios shown are subject to change and may differ from the annualized expense ratios shown in the financial highlights of this report. |
| 2 | The manager has contractually committed through November 30, 2019, to waive fees and/or reimburse expenses to the extent necessary to cap the expenses of each class after fee waivers at 0.73% for Class A, 1.48% for Class C, 0.30% for Class R6, 0.65% for Administrator Class, and 0.40% for Institutional Class. Brokerage commissions, stamp duty fees, interest, taxes, acquired fund fees and expenses (if any), and extraordinary expenses are excluded from the expense cap. Prior to or after the commitment expiration date, the cap may be increased or the commitment to maintain the cap may be terminated only with the approval of the Board of Trustees. Without this cap, the Fund’s returns would have been lower. The expense ratio paid by an investor is the net expense ratio (the total annual fund operating expenses after fee waivers) as stated in the prospectuses. |
| 3 | The Russell 1000® Index measures the performance of the 1,000 largest companies in the Russell 3000® Index, which represents approximately 92% of the total market capitalization of the Russell 3000® Index. You cannot invest directly in an index. |
| 4 | The ten largest holdings, excluding cash, cash equivalents and any money market funds, are calculated based on the value of the investments divided by total net assets of the Fund. Holdings are subject to change and may have changed since the date specified. |
| 5 | Amounts are calculated based on the total long-term investments of the Fund. These amounts are subject to change and may have changed since the date specified. |
| | | | |
| 8 | | Wells Fargo Low Volatility U.S. Equity Fund | | Fund expenses (unaudited) |
As a shareholder of the Fund, you incur two types of costs: (1) transaction costs, including sales charges (loads) on purchase payments and contingent deferred sales charges (if any) on redemptions and (2) ongoing costs, including management fees, distribution (12b-1) and/or shareholder servicing fees, and other Fund expenses. This example is intended to help you understand your ongoing costs (in dollars) of investing in the Fund and to compare these costs with the ongoing costs of investing in other mutual funds.
The example is based on an investment of $1,000 invested at the beginning of the six-month period and held for the entire period from August 1, 2018 to January 31, 2019.
Actual expenses
The “Actual” line of the table below provides information about actual account values and actual expenses. You may use the information in this line, together with the amount you invested, to estimate the expenses that you paid over the period. Simply divide your account value by $1,000 (for example, an $8,600 account value divided by $1,000 = 8.6), then multiply the result by the number in the “Actual” line under the heading entitled “Expenses paid during period” for your applicable class of shares to estimate the expenses you paid on your account during this period.
Hypothetical example for comparison purposes
The “Hypothetical” line of the table below provides information about hypothetical account values and hypothetical expenses based on the Fund’s actual expense ratio and an assumed rate of return of 5% per year before expenses, which is not the Fund’s actual return. The hypothetical account values and expenses may not be used to estimate the actual ending account balance or expenses you paid for the period. You may use this information to compare the ongoing costs of investing in the Fund and other funds. To do so, compare this 5% hypothetical example with the 5% hypothetical examples that appear in the shareholder reports of the other funds.
Please note that the expenses shown in the table are meant to highlight your ongoing costs only and do not reflect any transactional costs, such as sales charges (loads) and contingent deferred sales charges. Therefore, the “Hypothetical” line of the table is useful in comparing ongoing costs only and will not help you determine the relative total costs of owning different funds. In addition, if these transactional costs were included, your costs would have been higher.
| | | | | | | | | | | | | | | | |
| | | Beginning
account value
8-1-2018 | | | Ending
account value
1-31-2019 | | | Expenses
paid during
the period¹ | | | Annualized net
expense ratio | |
Class A | | | | | | | | | | | | | | | | |
| | | | |
Actual | | $ | 1,000.00 | | | $ | 983.99 | | | $ | 4.00 | | | | 0.80 | % |
| | | | |
Hypothetical (5% return before expenses) | | $ | 1,000.00 | | | $ | 1,021.17 | | | $ | 4.08 | | | | 0.80 | % |
Class C | | | | | | | | | | | | | | | | |
| | | | |
Actual | | $ | 1,000.00 | | | $ | 981.43 | | | $ | 7.74 | | | | 1.55 | % |
| | | | |
Hypothetical (5% return before expenses) | | $ | 1,000.00 | | | $ | 1,017.39 | | | $ | 7.88 | | | | 1.55 | % |
Class R6 | | | | | | | | | | | | | | | | |
| | | | |
Actual | | $ | 1,000.00 | | | $ | 986.86 | | | $ | 1.85 | | | | 0.37 | % |
| | | | |
Hypothetical (5% return before expenses) | | $ | 1,000.00 | | | $ | 1,023.34 | | | $ | 1.89 | | | | 0.37 | % |
Administrator Class | | | | | | | | | | | | | | | | |
| | | | |
Actual | | $ | 1,000.00 | | | $ | 985.01 | | | $ | 3.60 | | | | 0.72 | % |
| | | | |
Hypothetical (5% return before expenses) | | $ | 1,000.00 | | | $ | 1,021.58 | | | $ | 3.67 | | | | 0.72 | % |
Institutional Class | | | | | | | | | | | | | | | | |
| | | | |
Actual | | $ | 1,000.00 | | | $ | 985.97 | | | $ | 2.35 | | | | 0.47 | % |
| | | | |
Hypothetical (5% return before expenses) | | $ | 1,000.00 | | | $ | 1,022.84 | | | $ | 2.40 | | | | 0.47 | % |
| 1 | Expenses paid is equal to the annualized net expense ratio of each class multiplied by the average account value over the period, multiplied by the number of days in the most recent fiscal half-year divided by the number of days in the fiscal year (to reflect the one-half-year period). |
| | | | | | |
| Portfolio of investments—January 31, 2019 (unaudited) | | Wells Fargo Low Volatility U.S. Equity Fund | | | 9 | |
| | | | | | | | | | | | | | | | |
| Security name | | | | | | | | Shares | | | Value | |
|
Common Stocks: 96.97% | |
| | | | |
Communication Services: 3.49% | | | | | | | | | | | | | | | | |
| | | | |
| Entertainment: 2.59% | | | | | | | | | | | | | | | | |
| | | | |
Cinemark Holdings Incorporated | | | | | | | | | | | 9,381 | | | $ | 383,871 | |
| | | | |
The Madison Square Garden Company Class A † | | | | | | | | | | | 1,857 | | | | 516,060 | |
| |
| | | | 899,931 | |
| | | | | | | | | | | | | | | | |
| | | | |
| Media: 0.90% | | | | | | | | | | | | | | | | |
| | | | |
Cable One Incorporated | | | | | | | | | | | 184 | | | | 162,719 | |
| | | | |
Sirius XM Holdings Incorporated | | | | | | | | | | | 25,733 | | | | 150,023 | |
| |
| | | | 312,742 | |
| | | | | | | | | | | | | | | | |
| | | | |
Consumer Discretionary: 3.88% | | | | | | | | | | | | | | | | |
| | | | |
| Diversified Consumer Services: 0.74% | | | | | | | | | | | | | | | | |
| | | | |
H&R Block Incorporated | | | | | | | | | | | 10,825 | | | | 255,362 | |
| | | | | | | | | | | | | | | | |
| | | | |
| Hotels, Restaurants & Leisure: 1.45% | | | | | | | | | | | | | | | | |
| | | | |
Darden Restaurants Incorporated | | | | | | | | | | | 868 | | | | 91,079 | |
| | | | |
Hilton Grand Vacations Incorporated † | | | | | | | | | | | 13,662 | | | | 414,505 | |
| |
| | | | 505,584 | |
| | | | | | | | | | | | | | | | |
| | | | |
| Household Durables: 1.23% | | | | | | | | | | | | | | | | |
| | | | |
NVR Incorporated † | | | | | | | | | | | 160 | | | | 425,600 | |
| | | | | | | | | | | | | | | | |
| | | | |
| Specialty Retail: 0.20% | | | | | | | | | | | | | | | | |
| | | | |
ULTA Beauty Incorporated † | | | | | | | | | | | 242 | | | | 70,645 | |
| | | | | | | | | | | | | | | | |
| | | | |
| Textiles, Apparel & Luxury Goods: 0.26% | | | | | | | | | | | | | | | | |
| | | | |
Carter’s Incorporated | | | | | | | | | | | 1,102 | | | | 91,356 | |
| | | | | | | | | | | | | | | | |
| | | | |
Consumer Staples: 22.84% | | | | | | | | | | | | | | | | |
| | | | |
| Beverages: 3.69% | | | | | | | | | | | | | | | | |
| | | | |
Keurig Dr Pepper Incorporated | | | | | | | | | | | 3,629 | | | | 98,781 | |
| | | | |
PepsiCo Incorporated | | | | | | | | | | | 7,476 | | | | 842,321 | |
| | | | |
The Coca-Cola Company | | | | | | | | | | | 7,126 | | | | 342,974 | |
| |
| | | | 1,284,076 | |
| | | | | | | | | | | | | | | | |
| | | | |
| Food & Staples Retailing: 4.31% | | | | | | | | | | | | | | | | |
| | | | |
Costco Wholesale Corporation | | | | | | | | | | | 3,458 | | | | 742,191 | |
| | | | |
Sysco Corporation | | | | | | | | | | | 11,852 | | | | 756,750 | |
| |
| | | | 1,498,941 | |
| | | | | | | | | | | | | | | | |
| | | | |
| Food Products: 6.45% | | | | | | | | | | | | | | | | |
| | | | |
Bunge Limited | | | | | | | | | | | 50 | | | | 2,753 | |
| | | | |
Flowers Foods Incorporated | | | | | | | | | | | 9,853 | | | | 193,710 | |
| | | | |
Ingredion Incorporated | | | | | | | | | | | 2,020 | | | | 199,980 | |
| | | | |
Lamb Weston Holdings Incorporated | | | | | | | | | | | 7,725 | | | | 558,517 | |
| | | | |
The Hershey Company | | | | | | | | | | | 7,365 | | | | 781,426 | |
| | | | |
Tyson Foods Incorporated Class A | | | | | | | | | | | 8,206 | | | | 508,115 | |
| |
| | | | 2,244,501 | |
| | | | | | | | | | | | | | | | |
The accompanying notes are an integral part of these financial statements.
| | | | |
| 10 | | Wells Fargo Low Volatility U.S. Equity Fund | | Portfolio of investments—January 31, 2019 (unaudited) |
| | | | | | | | | | | | | | | | |
| Security name | | | | | | | | Shares | | | Value | |
|
| Household Products: 5.47% | |
| | | | |
Colgate-Palmolive Company | | | | | | | | | | | 9,683 | | | $ | 626,296 | |
| | | | |
The Clorox Company | | | | | | | | | | | 2,823 | | | | 418,877 | |
| | | | |
The Procter & Gamble Company | | | | | | | | | | | 8,922 | | | | 860,705 | |
| |
| | | | 1,905,878 | |
| | | | | | | | | | | | | | | | |
| | | | |
| Tobacco: 2.92% | | | | | | | | | | | | | | | | |
| | | | |
Altria Group Incorporated | | | | | | | | | | | 10,700 | | | | 528,045 | |
| | | | |
Philip Morris International Incorporated | | | | | | | | | | | 6,349 | | | | 487,095 | |
| |
| | | | 1,015,140 | |
| | | | | | | | | | | | | | | | |
| | | | |
Energy: 0.23% | | | | | | | | | | | | | | | | |
| | | | |
| Energy Equipment & Services: 0.23% | | | | | | | | | | | | | | | | |
| | | | |
Baker Hughes Incorporated | | | | | | | | | | | 3,465 | | | | 81,670 | |
| | | | | | | | | | | | | | | | |
| | | | |
Financials: 16.97% | | | | | | | | | | | | | | | | |
| | | | |
| Banks: 0.16% | | | | | | | | | | | | | | | | |
| | | | |
First Citizens BancShares Corporation Class A | | | | | | | | | | | 135 | | | | 55,017 | |
| | | | | | | | | | | | | | | | |
| | | | |
| Capital Markets: 5.92% | | | | | | | | | | | | | | | | |
| | | | |
CBOE Holdings Incorporated | | | | | | | | | | | 6,519 | | | | 608,027 | |
| | | | |
CME Group Incorporated | | | | | | | | | | | 4,455 | | | | 812,057 | |
| | | | |
FactSet Research Systems Incorporated | | | | | | | | | | | 1,042 | | | | 227,812 | |
| | | | |
Intercontinental Exchange Incorporated | | | | | | | | | | | 1,732 | | | | 132,948 | |
| | | | |
MarketAxess Holdings Incorporated | | | | | | | | | | | 902 | | | | 193,723 | |
| | | | |
Morningstar Incorporated | | | | | | | | | | | 687 | | | | 85,291 | |
| |
| | | | 2,059,858 | |
| | | | | | | | | | | | | | | | |
| | | | |
| Diversified Financial Services: 0.27% | | | | | | | | | | | | | | | | |
| | | | |
AXA Equitable Holdings Incorporated | | | | | | | | | | | 405 | | | | 7,509 | |
| | | | |
Berkshire Hathaway Incorporated Class B † | | | | | | | | | | | 424 | | | | 87,149 | |
| |
| | | | 94,658 | |
| | | | | | | | | | | | | | | | |
| | | | |
| Insurance: 5.27% | | | | | | | | | | | | | | | | |
| | | | |
American Financial Group Incorporated | | | | | | | | | | | 5,506 | | | | 525,217 | |
| | | | |
American National Insurance Company | | | | | | | | | | | 379 | | | | 52,753 | |
| | | | |
Aon plc | | | | | | | | | | | 682 | | | | 106,549 | |
| | | | |
Arch Capital Group Limited † | | | | | | | | | | | 6,753 | | | | 198,201 | |
| | | | |
Mercury General Corporation | | | | | | | | | | | 3,451 | | | | 178,417 | |
| | | | |
Old Republic International Corporation | | | | | | | | | | | 10,458 | | | | 210,729 | |
| | | | |
The Progressive Corporation | | | | | | | | | | | 8,335 | | | | 560,862 | |
| |
| | | | 1,832,728 | |
| | | | | | | | | | | | | | | | |
| | | | |
| Mortgage REITs: 5.35% | | | | | | | | | | | | | | | | |
| | | | |
AGNC Investment Corporation | | | | | | | | | | | 15,735 | | | | 281,814 | |
| | | | |
Annaly Capital Management Incorporated | | | | | | | | | | | 35,362 | | | | 369,179 | |
| | | | |
Chimera Investment Corporation | | | | | | | | | | | 12,137 | | | | 230,967 | |
| | | | |
MFA Financial Incorporated | | | | | | | | | | | 55,154 | | | | 404,279 | |
| | | | |
Starwood Property Trust Incorporated | | | | | | | | | | | 8,023 | | | | 177,148 | |
| | | | |
Two Harbors Investment Corporation | | | | | | | | | | | 27,325 | | | | 398,672 | |
| |
| | | | 1,862,059 | |
| | | | | | | | | | | | | | | | |
The accompanying notes are an integral part of these financial statements.
| | | | | | |
| Portfolio of investments—January 31, 2019 (unaudited) | | Wells Fargo Low Volatility U.S. Equity Fund | | | 11 | |
| | | | | | | | | | | | | | | | |
| Security name | | | | | | | | Shares | | | Value | |
| | | | |
Health Care: 7.26% | | | | | | | | | | | | | | | | |
| | | | |
| Health Care Equipment & Supplies: 1.74% | | | | | | | | | | | | | | | | |
| | | | |
ICU Medical Incorporated † | | | | | | | | | | | 830 | | | $ | 206,504 | |
| | | | |
IDEXX Laboratories Incorporated † | | | | | | | | | | | 1,134 | | | | 241,292 | |
| | | | |
Varian Medical Systems Incorporated † | | | | | | | | | | | 1,189 | | | | 156,984 | |
| |
| | | | 604,780 | |
| | | | | | | | | | | | | | | | |
| | | | |
| Health Care Providers & Services: 1.62% | | | | | | | | | | | | | | | | |
| | | | |
Humana Incorporated | | | | | | | | | | | 1,824 | | | | 563,598 | |
| | | | | | | | | | | | | | | | |
| | | | |
| Life Sciences Tools & Services: 1.61% | | | | | | | | | | | | | | | | |
| | | | |
Bio-Rad Laboratories Incorporated Class A † | | | | | | | | | | | 2,236 | | | | 558,709 | |
| | | | | | | | | | | | | | | | |
| | | | |
| Pharmaceuticals: 2.29% | | | | | | | | | | | | | | | | |
| | | | |
Merck & Company Incorporated | | | | | | | | | | | 10,725 | | | | 798,262 | |
| | | | | | | | | | | | | | | | |
| | | | |
Industrials: 10.60% | | | | | | | | | | | | | | | | |
| | | | |
| Aerospace & Defense: 4.19% | | | | | | | | | | | | | | | | |
| | | | |
BWX Technologies Incorporated | | | | | | | | | | | 6,993 | | | | 324,615 | |
| | | | |
Lockheed Martin Corporation | | | | | | | | | | | 1,927 | | | | 558,233 | |
| | | | |
Northrop Grumman Corporation | | | | | | | | | | | 136 | | | | 37,475 | |
| | | | |
Raytheon Company | | | | | | | | | | | 3,258 | | | | 536,788 | |
| |
| | | | 1,457,111 | |
| | | | | | | | | | | | | | | | |
| | | | |
| Air Freight & Logistics: 0.88% | | | | | | | | | | | | | | | | |
| | | | |
Expeditors International of Washington Incorporated | | | | | | | | | | | 4,435 | | | | 307,345 | |
| | | | | | | | | | | | | | | | |
| | | | |
| Commercial Services & Supplies: 4.42% | | | | | | | | | | | | | | | | |
| | | | |
ADT Incorporated | | | | | | | | | | | 2,494 | | | | 18,007 | |
| | | | |
Republic Services Incorporated | | | | | | | | | | | 8,478 | | | | 650,347 | |
| | | | |
Waste Management Incorporated | | | | | | | | | | | 9,072 | | | | 867,918 | |
| |
| | | | 1,536,272 | |
| | | | | | | | | | | | | | | | |
| | | | |
| Industrial Conglomerates: 0.33% | | | | | | | | | | | | | | | | |
| | | | |
Honeywell International Incorporated | | | | | | | | | | | 791 | | | | 113,611 | |
| | | | | | | | | | | | | | | | |
| | | | |
| Machinery: 0.33% | | | | | | | | | | | | | | | | |
| | | | |
The Toro Company | | | | | | | | | | | 1,951 | | | | 116,085 | |
| | | | | | | | | | | | | | | | |
| | | | |
| Road & Rail: 0.45% | | | | | | | | | | | | | | | | |
| | | | |
Schneider National Incorporated Class B | | | | | | | | | | | 7,416 | | | | 157,516 | |
| | | | | | | | | | | | | | | | |
| | | | |
Information Technology: 15.43% | | | | | | | | | | | | | | | | |
| | | | |
| Communications Equipment: 1.52% | | | | | | | | | | | | | | | | |
| | | | |
Motorola Solutions Incorporated | | | | | | | | | | | 4,536 | | | | 530,304 | |
| | | | | | | | | | | | | | | | |
| | | | |
| Electronic Equipment, Instruments & Components: 1.42% | | | | | | | | | | | | | | | | |
| | | | |
National Instruments Corporation | | | | | | | | | | | 11,172 | | | | 494,026 | |
| | | | | | | | | | | | | | | | |
The accompanying notes are an integral part of these financial statements.
| | | | |
| 12 | | Wells Fargo Low Volatility U.S. Equity Fund | | Portfolio of investments—January 31, 2019 (unaudited) |
| | | | | | | | | | | | | | | | |
| Security name | | | | | | | | Shares | | | Value | |
| | | | |
| IT Services: 6.49% | | | | | | | | | | | | | | | | |
| | | | |
Amdocs Limited | | | | | | | | | | | 10,754 | | | $ | 600,934 | |
| | | | |
Automatic Data Processing Incorporated | | | | | | | | | | | 3,728 | | | | 521,324 | |
| | | | |
Booz Allen Hamilton Holding Corporation | | | | | | | | | | | 11,321 | | | | 556,201 | |
| | | | |
Genpact Limited | | | | | | | | | | | 12,749 | | | | 380,303 | |
| | | | |
Jack Henry & Associates Incorporated | | | | | | | | | | | 1,493 | | | | 199,390 | |
| |
| | | | 2,258,152 | |
| | | | | | | | | | | | | | | | |
|
| Semiconductors & Semiconductor Equipment: 1.21% | |
| | | | |
Maxim Integrated Products Incorporated | | | | | | | | | | | 3,725 | | | | 202,156 | |
| | | | |
NXP Semiconductors N.V. | | | | | | | | | | | 2,506 | | | | 218,097 | |
| |
| | | | 420,253 | |
| | | | | | | | | | | | | | | | |
| | | | |
| Software: 4.79% | | | | | | | | | | | | | | | | |
| | | | |
Aspen Technology Incorporated † | | | | | | | | | | | 2,000 | | | | 193,260 | |
| | | | |
Cadence Design Systems Incorporated † | | | | | | | | | | | 4,764 | | | | 228,815 | |
| | | | |
CDK Global Incorporated | | | | | | | | | | | 6,652 | | | | 325,349 | |
| | | | |
Symantec Corporation | | | | | | | | | | | 20,398 | | | | 428,766 | |
| | | | |
Synopsys Incorporated † | | | | | | | | | | | 5,253 | | | | 490,368 | |
| |
| | | | 1,666,558 | |
| | | | | | | | | | | | | | | | |
| | | | |
Materials: 2.60% | | | | | | | | | | | | | | | | |
| | | | |
| Chemicals: 0.52% | | | | | | | | | | | | | | | | |
| | | | |
Valvoline Incorporated | | | | | | | | | | | 8,208 | | | | 181,479 | |
| | | | | | | | | | | | | | | | |
| | | | |
| Containers & Packaging: 0.39% | | | | | | | | | | | | | | | | |
| | | | |
Ardagh Group SA | | | | | | | | | | | 4,415 | | | | 53,510 | |
| | | | |
Avery Dennison Corporation | | | | | | | | | | | 791 | | | | 82,620 | |
| |
| | | | 136,130 | |
| | | | | | | | | | | | | | | | |
| | | | |
| Metals & Mining: 1.69% | | | | | | | | | | | | | | | | |
| | | | |
Newmont Mining Corporation | | | | | | | | | | | 12,726 | | | | 434,084 | |
| | | | |
Royal Gold Incorporated | | | | | | | | | | | 1,746 | | | | 152,548 | |
| |
| | | | 586,632 | |
| | | | | | | | | | | | | | | | |
| | | | |
Real Estate: 3.60% | | | | | | | | | | | | | | | | |
| | | | |
| Equity REITs: 3.60% | | | | | | | | | | | | | | | | |
| | | | |
Apple Hospitality REIT Incorporated | | | | | | | | | | | 15,864 | | | | 260,328 | |
| | | | |
Equity Commonwealth | | | | | | | | | | | 3,215 | | | | 104,037 | |
| | | | |
Outfront Media Incorporated | | | | | | | | | | | 4,980 | | | | 103,335 | |
| | | | |
VICI Properties Incorporated | | | | | | | | | | | 36,399 | | | | 783,670 | |
| |
| | | | 1,251,370 | |
| | | | | | | | | | | | | | | | |
| | | | |
Utilities: 10.07% | | | | | | | | | | | | | | | | |
| | | | |
| Electric Utilities: 6.82% | | | | | | | | | | | | | | | | |
| | | | |
American Electric Power Company Incorporated | | | | | | | | | | | 2,997 | | | | 237,123 | |
| | | | |
Avangrid Incorporated | | | | | | | | | | | 1,784 | | | | 88,968 | |
| | | | |
Hawaiian Electric Industries Incorporated | | | | | | | | | | | 8,736 | | | | 324,892 | |
The accompanying notes are an integral part of these financial statements.
| | | | | | |
| Portfolio of investments—January 31, 2019 (unaudited) | | Wells Fargo Low Volatility U.S. Equity Fund | | | 13 | |
| | | | | | | | | | | | | | | | |
| Security name | | | | | | | | Shares | | | Value | |
| | | | |
| Electric Utilities(continued) | | | | | | | | | | | | | | | | |
| | | | |
NextEra Energy Incorporated | | | | | | | | | | | 4,782 | | | $ | 855,882 | |
| | | | |
Pinnacle West Capital Corporation | | | | | | | | | | | 7,372 | | | | 649,621 | |
| | | | |
Xcel Energy Incorporated | | | | | | | | | | | 4,132 | | | | 216,351 | |
| |
| | | | 2,372,837 | |
| | | | | | | | | | | | | | | | |
| | | | |
| Gas Utilities: 0.42% | | | | | | | | | | | | | | | | |
| | | | |
UGI Corporation | | | | | | | | | | | 2,569 | | | | 146,510 | |
| | | | | | | | | | | | | | | | |
| | | | |
| Multi-Utilities: 2.83% | | | | | | | | | | | | | | | | |
| | | | |
Ameren Corporation | | | | | | | | | | | 1,347 | | | | 93,401 | |
| | | | |
CenterPoint Energy Incorporated | | | | | | | | | | | 3,079 | | | | 95,203 | |
| | | | |
CMS Energy Corporation | | | | | | | | | | | 8,189 | | | | 426,974 | |
| | | | |
DTE Energy Company | | | | | | | | | | | 3,144 | | | | 370,206 | |
| |
| | | | 985,784 | |
| | | | | | | | | | | | | | | | |
| |
Total Common Stocks (Cost $32,529,833) | | | | 33,739,070 | |
| | | | | | | | | | | | | | | | |
| | | | |
| | | Yield | | | | | | | | | | |
| Short-Term Investments: 2.92% | | | | | | | | | | | | | | | | |
| | | | |
| Investment Companies: 2.92% | | | | | | | | | | | | | | | | |
| | | | |
Wells Fargo Government Money Market Fund Select Class (l)(u) | | | 2.33 | % | | | | | | | 1,016,458 | | | | 1,016,458 | |
| | | | | | | | | | | | | | | | |
| |
Total Short-Term Investments (Cost $1,016,458) | | | | 1,016,458 | |
| | | | | | | | | | | | | | | | |
| | | | | | | | |
| Total investments in securities (Cost $33,546,291) | | | 99.89 | % | | | 34,755,528 | |
| | |
Other assets and liabilities, net | | | 0.11 | | | | 38,438 | |
| | | | | | | | |
| Total net assets | | | 100.00 | % | | $ | 34,793,966 | |
| | | | | | | | |
| † | Non-income-earning security |
| (l) | The issuer of the security is an affiliated person of the Fund as defined in the Investment Company Act of 1940. |
| (u) | The rate represents the 7-day annualized yield at period end. |
Abbreviations:
| REIT | Real estate investment trust |
Investments in Affiliates
An affiliated investment is an investment in which the Fund owns at least 5% of the outstanding voting shares of the issuer or as a result of other relationships, such as the Fund and the issuer having the same investment manager. Transactions with issuers that were either affiliated persons of the Fund at the beginning of the period or the end of the period were as follows:
| | | | | | | | | | | | | | | | | | | | | | | | | | | | | | | | | | | | |
| | | Shares,
beginning of
period | | | Shares
purchased | | | Shares
sold | | | Shares,
end of
period | | | Net
realized
gains
(losses) | | | Net
change in
unrealized
gains
(losses) | | | Income
from
affiliated
securities | | | Value,
end
of period | | | % of
net
assets | |
Short-Term Investments | | | | | | | | | | | | | | | | | | | | | | | | | | | | | | | | | | | | |
Investment companies | | | | | | | | | | | | | | | | | | | | | | | | | | | | | | | | | | | | |
Wells Fargo Government Money Market Fund Select Class | | | 922,225 | | | | 5,942,273 | | | | 5,848,040 | | | | 1,016,458 | | | $ | 0 | | | $ | 0 | | | $ | 9,549 | | | $ | 1,016,458 | | | | 2.92 | % |
The accompanying notes are an integral part of these financial statements.
| | | | |
| 14 | | Wells Fargo Low Volatility U.S. Equity Fund | | Statement of assets and liabilities—January 31, 2019 (unaudited) |
| | | | |
| | | | |
| |
Assets | | | | |
Investments in unaffiliated securities, at value (cost $32,529,833) | | $ | 33,739,070 | |
Investments in affiliated securities, at value (cost $1,016,458) | | | 1,016,458 | |
Receivable for dividends | | | 28,476 | |
Receivable from manager | | | 12,385 | |
Receivable for Fund shares sold | | | 2,075 | |
Prepaid expenses and other assets | | | 85,495 | |
| | | | |
Total assets | | | 34,883,959 | |
| | | | |
| |
Liabilities | | | | |
Shareholder report expenses payable | | | 45,768 | |
Professional fees payable | | | 30,152 | |
Custodian and accounting fees payable | | | 7,680 | |
Administration fees payable | | | 3,710 | |
Trustees’ fees and expenses payable | | | 2,506 | |
Distribution fee payable | | | 137 | |
Accrued expenses and other liabilities | | | 40 | |
| | | | |
Total liabilities | | | 89,993 | |
| | | | |
Total net assets | | $ | 34,793,966 | |
| | | | |
| |
NET ASSETS CONSIST OF | | | | |
Paid-in capital | | $ | 33,714,381 | |
Total distributable earnings | | | 1,079,585 | |
| | | | |
Total net assets | | $ | 34,793,966 | |
| | | | |
| |
COMPUTATION OF NET ASSET VALUE AND OFFERING PRICE PER SHARE | | | | |
Net assets – Class A | | $ | 1,263,811 | |
Shares outstanding – Class A¹ | | | 119,877 | |
Net asset value per share – Class A | | | $10.54 | |
Maximum offering price per share – Class A² | | | $11.18 | |
Net assets – Class C | | $ | 221,773 | |
Shares outstanding – Class C¹ | | | 21,106 | |
Net asset value per share – Class C | | | $10.51 | |
Net assets – Class R6 | | $ | 1,058,679 | |
Shares outstanding – Class R6¹ | | | 100,480 | |
Net asset value per share – Class R6 | | | $10.54 | |
Net assets – Administrator Class | | $ | 105,755 | |
Shares outstanding – Administrator Class¹ | | | 10,042 | |
Net asset value per share – Administrator Class | | | $10.53 | |
Net assets – Institutional Class | | $ | 32,143,948 | |
Shares outstanding – Institutional Class¹ | | | 3,049,842 | |
Net asset value per share – Institutional Class | | | $10.54 | |
| ¹ | The Fund has an unlimited number of authorized shares. |
| ² | Maximum offering price is computed as 100/94.25 of net asset value. On investments of $50,000 or more, the offering price is reduced. |
The accompanying notes are an integral part of these financial statements.
| | | | | | |
| Statement of operations—six months ended January 31, 2019 (unaudited) | | Wells Fargo Low Volatility U.S. Equity Fund | | | 15 | |
| | | | |
| | | | |
| |
Investment income | | | | |
Dividends (net of foreign withholding taxes of $220) | | $ | 492,818 | |
Income from affiliated securities | | | 9,549 | |
| | | | |
Total investment income | | | 502,367 | |
| | | | |
| |
Expenses | | | | |
Management fee | | | 73,874 | |
Administration fees | | | | |
Class A | | | 1,354 | |
Class C | | | 211 | |
Class R6 | | | 171 | |
Administrator Class | | | 74 | |
Institutional Class | | | 22,228 | |
Shareholder servicing fees | | | | |
Class A | | | 1,612 | |
Class C | | | 251 | |
Administrator Class | | | 142 | |
Distribution fee | | | | |
Class C | | | 753 | |
Custody and accounting fees | | | 6,414 | |
Professional fees | | | 26,890 | |
Registration fees | | | 44,933 | |
Shareholder report expenses | | | 25,204 | |
Trustees’ fees and expenses | | | 11,090 | |
Other fees and expenses | | | 4,573 | |
| | | | |
Total expenses | | | 219,774 | |
Less: Fee waivers and/or expense reimbursements | | | (130,228 | ) |
| | | | |
Net expenses | | | 89,546 | |
| | | | |
Net investment income | | | 412,821 | |
| | | | |
| |
REALIZED AND UNREALIZED GAINS (LOSSES) ON INVESTMENTS | | | | |
Net realized gains on investments | | | 539,423 | |
Net change in unrealized gains (losses) on investments | | | (1,490,557 | ) |
| | | | |
Net realized and unrealized gains (losses) on investments | | | (951,134 | ) |
| | | | |
Net decrease in net assets resulting from operations | | $ | (538,313 | ) |
| | | | |
The accompanying notes are an integral part of these financial statements.
| | | | |
| 16 | | Wells Fargo Low Volatility U.S. Equity Fund | | Statement of changes in net assets |
| | | | | | | | | | | | | | | | |
| | | Six months ended
January 31, 2019 (unaudited) | | | Year ended
July 31, 2018¹ | |
| |
Operations | | | | | |
Net investment income | | | | | | $ | 412,821 | | | | | | | $ | 709,204 | |
Net realized gains on investments | | | | | | | 539,423 | | | | | | | | 1,575,047 | |
Net change in unrealized gains (losses) on investments | | | | | | | (1,490,557 | ) | | | | | | | 219,615 | |
| | | | |
Net increase (decrease) in net assets resulting from operations | | | | | | | (538,313 | ) | | | | | | | 2,503,866 | |
| | | | |
| | | |
Distributions to shareholders from net investment income and net realized gains | | | | | | | | | | | | |
Class A | | | | | | | (97,183 | ) | | | | | | | (39,204 | ) |
Class C | | | | | | | (13,678 | ) | | | | | | | (2,805 | ) |
Class R6 | | | | | | | (88,854 | ) | | | | | | | (41,008 | ) |
Administrator Class | | | | | | | (8,480 | ) | | | | | | | (3,707 | ) |
Institutional Class | | | | | | | (2,610,423 | ) | | | | | | | (1,251,431 | ) |
| | | | |
Total distributions to shareholders | | | | | | | (2,818,618 | ) | | | | | | | (1,338,155 | ) |
| | | | |
| | | | |
Capital share transactions | | | Shares | | | | | | | | Shares | | | | | |
Proceeds from shares sold | | | | | | | | | | | | | | | | |
Class A | | | 12,356 | | | | 139,406 | | | | 36,479 | | | | 411,267 | |
Class C | | | 6,977 | | | | 77,744 | | | | 7,545 | | | | 83,872 | |
Institutional Class | | | 58,188 | | | | 630,999 | | | | 321,940 | | | | 3,618,353 | |
| | | | |
| | | | |
| | | | | | | 848,149 | | | | | | | | 4,113,492 | |
| | | | |
Reinvestment of distributions | | | | | | | | | | | | | | | | |
Class A | | | 8,338 | | | | 88,821 | | | | 3,092 | | | | 35,640 | |
Class C | | | 567 | | | | 5,999 | | | | 3 | | | | 37 | |
Institutional Class | | | 50,399 | | | | 537,420 | | | | 25,951 | | | | 299,171 | |
| | | | |
| | | | |
| | | | | | | 632,240 | | | | | | | | 334,848 | |
| | | | |
Payment for shares redeemed | | | | | | | | | | | | | | | | |
Class A | | | (14,350 | ) | | | (153,841 | ) | | | (23,744 | ) | | | (260,000 | ) |
Class C | | | (2,683 | ) | | | (31,181 | ) | | | (1,331 | ) | | | (15,125 | ) |
Class R | | | N/A | | | | N/A | | | | (10,037 | )² | | | (114,115 | )² |
Institutional Class | | | (132,867 | ) | | | (1,516,334 | ) | | | (227,303 | ) | | | (2,583,866 | ) |
| | | | |
| | | | |
| | | | | | | (1,701,356 | ) | | | | | | | (2,973,106 | ) |
| | | | |
Net increase (decrease) in net assets resulting from capital share transactions | | | | | | | (220,967 | ) | | | | | | | 1,475,234 | |
| | | | |
Total increase (decrease) in net assets | | | | | | | (3,577,898 | ) | | | | | | | 2,640,945 | |
| | | | |
| | |
Net assets | | | | | | | | |
Beginning of period | | | | | | | 38,371,864 | | | | | | | | 35,730,919 | |
| | | | |
End of period | | | | | | $ | 34,793,966 | | | | | | | $ | 38,371,864 | |
| | | | |
| 1 | Effective for all filings after November 4, 2018, the SEC prospectively eliminated the requirement to parenthetically disclose undistributed net investment income at the end of the period and permitted the aggregation of distributions, with the exception of tax basis returns of capital. Undistributed net investment income at July 31, 2018 was $364,175. The disaggregated distributions information for the year ended July 31, 2018 is included in Note 7,Distributions to Shareholders,in the notes to the financial statements. |
| ² | For the period from August 1, 2017 to November 13, 2017. Effective at the close of business on November 13, 2017, Class R shares were liquidated and the class was subsequently closed. Class R shares are no longer offered by the Fund. |
The accompanying notes are an integral part of these financial statements.
| | | | | | |
| Financial highlights | | Wells Fargo Low Volatility U.S. Equity Fund | | | 17 | |
(For a share outstanding throughout each period)
| | | | | | | | | | | | |
| | | Six months ended January 31, 2019 (unaudited) | | | Year ended July 31 | |
| CLASS A | | 2018 | | | 20171 | |
Net asset value, beginning of period | | | $11.56 | | | | $11.21 | | | | $10.00 | |
Net investment income | | | 0.10 | | | | 0.16 | | | | 0.13 | |
Net realized and unrealized gains (losses) on investments | | | (0.29 | ) | | | 0.54 | | | | 1.12 | |
| | | | | | | | | | | | |
Total from investment operations | | | (0.19 | ) | | | 0.70 | | | | 1.25 | |
Distributions to shareholders from | | | | | | | | | | | | |
Net investment income | | | (0.18 | ) | | | (0.17 | ) | | | (0.04 | ) |
Net realized gains | | | (0.65 | ) | | | (0.18 | ) | | | 0.00 | |
| | | | | | | | | | | | |
Total distributions to shareholders | | | (0.83 | ) | | | (0.35 | ) | | | (0.04 | ) |
Net asset value, end of period | | | $10.54 | | | | $11.56 | | | | $11.21 | |
Total return2 | | | (1.60 | )% | | | 6.32 | % | | | 12.53 | % |
Ratios to average net assets (annualized) | | | | | | | | | | | | |
Gross expenses | | | 1.51 | % | | | 1.55 | % | | | 1.61 | % |
Net expenses | | | 0.80 | % | | | 0.83 | % | | | 0.82 | % |
Net investment income | | | 1.93 | % | | | 1.53 | % | | | 1.78 | % |
Supplemental data | | | | | | | | | | | | |
Portfolio turnover rate | | | 45 | % | | | 75 | % | | | 39 | % |
Net assets, end of period (000s omitted) | | | $1,264 | | | | $1,312 | | | | $1,096 | |
| 1 | For the period from October 31, 2016 (commencement of class operations) to July 31, 2017 |
| 2 | Total return calculations do not include any sales charges. Returns for periods of less than one year are not annualized. |
The accompanying notes are an integral part of these financial statements.
| | | | |
| 18 | | Wells Fargo Low Volatility U.S. Equity Fund | | Financial highlights |
(For a share outstanding throughout each period)
| | | | | | | | | | | | |
| | | Six months ended January 31, 2019 (unaudited) | | | Year ended July 31 | |
| CLASS C | | 2018 | | | 20171 | |
Net asset value, beginning of period | | | $11.49 | | | | $11.16 | | | | $10.00 | |
Net investment income | | | 0.05 | | | | 0.08 | | | | 0.08 | |
Net realized and unrealized gains (losses) on investments | | | (0.27 | ) | | | 0.52 | | | | 1.11 | |
| | | | | | | | | | | | |
Total from investment operations | | | (0.22 | ) | | | 0.60 | | | | 1.19 | |
Distributions to shareholders from | | | | | | | | | | | | |
Net investment income | | | (0.11 | ) | | | (0.09 | ) | | | (0.03 | ) |
Net realized gains | | | (0.65 | ) | | | (0.18 | ) | | | 0.00 | |
| | | | | | | | | | | | |
Total distributions to shareholders | | | (0.76 | ) | | | (0.27 | ) | | | (0.03 | ) |
Net asset value, end of period | | | $10.51 | | | | $11.49 | | | | $11.16 | |
Total return2 | | | (1.86 | )% | | | 5.45 | % | | | 11.91 | % |
Ratios to average net assets (annualized) | | | | | | | | | | | | |
Gross expenses | | | 2.26 | % | | | 2.31 | % | | | 2.40 | % |
Net expenses | | | 1.55 | % | | | 1.58 | % | | | 1.58 | % |
Net investment income | | | 1.22 | % | | | 0.76 | % | | | 1.03 | % |
Supplemental data | | | | | | | | | | | | |
Portfolio turnover rate | | | 45 | % | | | 75 | % | | | 39 | % |
Net assets, end of period (000s omitted) | | | $222 | | | | $187 | | | | $112 | |
| 1 | For the period from October 31, 2016 (commencement of class operations) to July 31, 2017 |
| 2 | Total return calculations do not include any sales charges. Returns for periods of less than one year are not annualized. |
The accompanying notes are an integral part of these financial statements.
| | | | | | |
| Financial highlights | | Wells Fargo Low Volatility U.S. Equity Fund | | | 19 | |
(For a share outstanding throughout each period)
| | | | | | | | | | | | |
| | | Six months ended January 31, 2019 (unaudited) | | | Year ended July 31 | |
| CLASS R6 | | 2018 | | | 20171 | |
Net asset value, beginning of period | | | $11.58 | | | | $11.24 | | | | $10.00 | |
Net investment income | | | 0.13 | | | | 0.22 | | | | 0.18 | |
Net realized and unrealized gains (losses) on investments | | | (0.29 | ) | | | 0.52 | | | | 1.11 | |
| | | | | | | | | | | | |
Total from investment operations | | | (0.16 | ) | | | 0.74 | | | | 1.29 | |
Distributions to shareholders from | | | | | | | | | | | | |
Net investment income | | | (0.23 | ) | | | (0.22 | ) | | | (0.05 | ) |
Net realized gains | | | (0.65 | ) | | | (0.18 | ) | | | 0.00 | |
| | | | | | | | | | | | |
Total distributions to shareholders | | | (0.88 | ) | | | (0.40 | ) | | | (0.05 | ) |
Net asset value, end of period | | | $10.54 | | | | $11.58 | | | | $11.24 | |
Total return2 | | | (1.31 | )% | | | 6.70 | % | | | 12.94 | % |
Ratios to average net assets (annualized) | | | | | | | | | | | | |
Gross expenses | | | 1.08 | % | | | 1.12 | % | | | 1.22 | % |
Net expenses | | | 0.37 | % | | | 0.40 | % | | | 0.40 | % |
Net investment income | | | 2.35 | % | | | 1.96 | % | | | 2.19 | % |
Supplemental data | | | | | | | | | | | | |
Portfolio turnover rate | | | 45 | % | | | 75 | % | | | 39 | % |
Net assets, end of period (000s omitted) | | | $1,059 | | | | $1,164 | | | | $1,129 | |
| 1 | For the period from October 31, 2016 (commencement of class operations) to July 31, 2017 |
| 2 | Returns for periods of less than one year are not annualized. |
The accompanying notes are an integral part of these financial statements.
| | | | |
| 20 | | Wells Fargo Low Volatility U.S. Equity Fund | | Financial highlights |
(For a share outstanding throughout each period)
| | | | | | | | | | | | |
| | | Six months ended
January 31, 2019 (unaudited) | | | Year ended July 31 | |
| ADMINISTRATOR CLASS | | 2018 | | | 20171 | |
Net asset value, beginning of period | | | $11.55 | | | | $11.21 | | | | $10.00 | |
Net investment income | | | 0.11 | | | | 0.18 | | | | 0.15 | |
Net realized and unrealized gains (losses) on investments | | | (0.29 | ) | | | 0.53 | | | | 1.10 | |
| | | | | | | | | | | | |
Total from investment operations | | | (0.18 | ) | | | 0.71 | | | | 1.25 | |
Distributions to shareholders from | | | | | | | | | | | | |
Net investment income | | | (0.19 | ) | | | (0.19 | ) | | | (0.04 | ) |
Net realized gains | | | (0.65 | ) | | | (0.18 | ) | | | 0.00 | |
| | | | | | | | | | | | |
Total distributions to shareholders | | | (0.84 | ) | | | (0.37 | ) | | | (0.04 | ) |
Net asset value, end of period | | | $10.53 | | | | $11.55 | | | | $11.21 | |
Total return2 | | | (1.50 | )% | | | 6.36 | % | | | 12.57 | % |
Ratios to average net assets (annualized) | | | | | | | | | | | | |
Gross expenses | | | 1.43 | % | | | 1.47 | % | | | 1.57 | % |
Net expenses | | | 0.72 | % | | | 0.75 | % | | | 0.75 | % |
Net investment income | | | 2.00 | % | | | 1.61 | % | | | 1.87 | % |
Supplemental data | | | | | | | | | | | | |
Portfolio turnover rate | | | 45 | % | | | 75 | % | | | 39 | % |
Net assets, end of period (000s omitted) | | | $106 | | | | $116 | | | | $113 | |
| 1 | For the period from October 31, 2016 (commencement of class operations) to July 31, 2017 |
| 2 | Returns for periods of less than one year are not annualized. |
The accompanying notes are an integral part of these financial statements.
| | | | | | |
| Financial highlights | | Wells Fargo Low Volatility U.S. Equity Fund | | | 21 | |
(For a share outstanding throughout each period)
| | | | | | | | | | | | |
| | | Six months ended
January 31, 2019 (unaudited) | | | Year ended July 31 | |
| INSTITUTIONAL CLASS | | 2018 | | | 20171 | |
Net asset value, beginning of period | | | $11.58 | | | | $11.23 | | | | $10.00 | |
Net investment income | | | 0.13 | | | | 0.20 | | | | 0.16 | |
Net realized and unrealized gains (losses) on investments | | | (0.30 | ) | | | 0.54 | | | | 1.12 | |
| | | | | | | | | | | | |
Total from investment operations | | | (0.17 | ) | | | 0.74 | | | | 1.28 | |
Distributions to shareholders from | | | | | | | | | | | | |
Net investment income | | | (0.22 | ) | | | (0.21 | ) | | | (0.05 | ) |
Net realized gains | | | (0.65 | ) | | | (0.18 | ) | | | 0.00 | |
| | | | | | | | | | | | |
Total distributions to shareholders | | | (0.87 | ) | | | (0.39 | ) | | | (0.05 | ) |
Net asset value, end of period | | | $10.54 | | | | $11.58 | | | | $11.23 | |
Total return2 | | | (1.40 | )% | | | 6.64 | % | | | 12.82 | % |
Ratios to average net assets (annualized) | | | | | | | | | | | | |
Gross expenses | | | 1.17 | % | | | 1.22 | % | | | 1.31 | % |
Net expenses | | | 0.47 | % | | | 0.50 | % | | | 0.50 | % |
Net investment income | | | 2.25 | % | | | 1.87 | % | | | 2.09 | % |
Supplemental data | | | | | | | | | | | | |
Portfolio turnover rate | | | 45 | % | | | 75 | % | | | 39 | % |
Net assets, end of period (000s omitted) | | | $32,144 | | | | $35,593 | | | | $33,169 | |
| 1 | For the period from October 31, 2016 (commencement of class operations) to July 31, 2017 |
| 2 | Returns for periods of less than one year are not annualized. |
The accompanying notes are an integral part of these financial statements.
| | | | |
| 22 | | Wells Fargo Low Volatility U.S. Equity Fund | | Notes to financial statements (unaudited) |
1. ORGANIZATION
Wells Fargo Funds Trust (the “Trust”), a Delaware statutory trust organized on March 10, 1999, is an open-end management investment company registered under the Investment Company Act of 1940, as amended (the “1940 Act”). As an investment company, the Trust follows the accounting and reporting guidance in Financial Accounting Standards Board (“FASB”) Accounting Standards Codification Topic 946, Financial Services – Investment Companies. These financial statements report on the Wells Fargo Low Volatility U.S. Equity Fund (the “Fund”) which is a diversified series of the Trust.
Effective at the close of business on November 13, 2017, Class R shares were liquidated and the class was subsequently closed. Class R shares are no longer offered by the Fund. Information for Class R shares reflected in the financial statements represents activity through November 13, 2017.
2. SIGNIFICANT ACCOUNTING POLICIES
The following significant accounting policies, which are consistently followed in the preparation of the financial statements of the Fund, are in conformity with U.S. generally accepted accounting principles which require management to make estimates and assumptions that affect the reported amounts of assets and liabilities, disclosure of contingent assets and liabilities at the date of the financial statements, and the reported amounts of revenues and expenses during the reporting period. Actual results could differ from those estimates.
Securities valuation
All investments are valued each business day as of the close of regular trading on the New York Stock Exchange (generally 4 p.m. Eastern Time), although the Fund may deviate from this calculation time under unusual or unexpected circumstances.
Equity securities that are listed on a foreign or domestic exchange or market are valued at the official closing price or, if none, the last sales price. If no sale occurs on the principal exchange or market that day, a fair value price will be determined in accordance with the Fund’s Valuation Procedures.
Investments in registered open-end investment companies are valued at net asset value.
Investments which are not valued using any of the methods discussed above are valued at their fair value, as determined in good faith by the Board of Trustees of the Fund. The Board of Trustees has established a Valuation Committee comprised of the Trustees and has delegated to it the authority to take any actions regarding the valuation of portfolio securities that the Valuation Committee deems necessary or appropriate, including determining the fair value of portfolio securities, unless the determination has been delegated to the Wells Fargo Asset Management Pricing Committee at Wells Fargo Funds Management, LLC (“Funds Management”). The Board of Trustees retains the authority to make or ratify any valuation decisions or approve any changes to the Valuation Procedures as it deems appropriate. On a quarterly basis, the Board of Trustees receives reports on any valuation actions taken by the Valuation Committee or the Wells Fargo Asset Management Pricing Committee which may include items for ratification.
Security transactions and income recognition
Securities transactions are recorded on a trade date basis. Realized gains or losses are recorded on the basis of identified cost.
Dividend income is recognized on the ex-dividend date. Dividend income is recorded net of foreign taxes withheld where recovery of such taxes is not assured.
Distributions to shareholders
Distributions to shareholders from net investment income and any net realized gains are recorded on the ex-dividend date and paid at least annually. Such distributions are determined in accordance with income tax regulations and may differ from U.S. generally accepted accounting principles. Dividend sources are estimated at the time of declaration. The tax character of distributions is determined as of the Fund’s fiscal year end. Therefore, a portion of the Fund’s distributions made prior to the Fund’s fiscal year end may be categorized as a tax return of capital at year end.
Federal and other taxes
The Fund intends to continue to qualify as a regulated investment company by distributing substantially all of its investment company taxable income and any net realized capital gains (after reduction for capital loss carryforwards) sufficient to relieve it from all, or substantially all, federal income taxes. Accordingly, no provision for federal income taxes was required.
The Fund’s income and federal excise tax returns and all financial records supporting those returns for the prior three fiscal years are subject to examination by the federal and Delaware revenue authorities. Management has analyzed the Fund’s tax positions taken on federal, state, and foreign tax returns for all open tax years and does not believe that there are any uncertain tax positions that require recognition of a tax liability.
| | | | | | |
| Notes to financial statements (unaudited) | | Wells Fargo Low Volatility U.S. Equity Fund | | | 23 | |
As of January 31, 2019, the aggregate cost of all investments for federal income tax purposes was $33,428,590 and the unrealized gains (losses) consisted of:
| | | | |
| |
Gross unrealized gains | | $ | 2,624,577 | |
| |
Gross unrealized losses | | | (1,297,639 | ) |
| |
Net unrealized gains | | $ | 1,326,938 | |
Class allocations
The separate classes of shares offered by the Fund differ principally in applicable sales charges, distribution, shareholder servicing, and administration fees. Class specific expenses are charged directly to that share class. Investment income, common expenses, and realized gains (losses) on investments are allocated daily to each class of shares based on the relative proportion of net assets of each class.
3. FAIR VALUATION MEASUREMENTS
Fair value measurements of investments are determined within a framework that has established a fair value hierarchy based upon the various data inputs utilized in determining the value of the Fund’s investments. The three-level hierarchy gives the highest priority to unadjusted quoted prices in active markets for identical assets or liabilities (Level 1) and the lowest priority to unobservable inputs (Level 3). The Fund’s investments are classified within the fair value hierarchy based on the lowest level of input that is significant to the fair value measurement. The inputs are summarized into three broad levels as follows:
| ∎ | | Level 1 – quoted prices in active markets for identical securities |
| ∎ | | Level 2 – other significant observable inputs (including quoted prices for similar securities, interest rates, prepayment speeds, credit risk, etc.) |
| ∎ | | Level 3 – significant unobservable inputs (including the Fund’s own assumptions in determining the fair value of investments) |
The inputs or methodologies used for valuing investments in securities are not necessarily an indication of the risk associated with investing in those securities.
The following is a summary of the inputs used in valuing the Fund’s assets and liabilities as of January 31, 2019:
| | | | | | | | | | | | | | | | |
| | | | |
| | | Quoted prices
(Level 1) | | | Other significant
observable inputs
(Level 2) | | | Significant
unobservable inputs (Level 3) | | | Total | |
| | | | |
Assets | | | | | | | | | | | | | | | | |
Investments in: | | | | | | | | | | | | | | | | |
| | | | |
Common stocks | | | | | | | | | | | | | | | | |
| | | | |
Communication services | | $ | 1,212,673 | | | $ | 0 | | | $ | 0 | | | $ | 1,212,673 | |
| | | | |
Consumer discretionary | | | 1,348,547 | | | | 0 | | | | 0 | | | | 1,348,547 | |
| | | | |
Consumer staples | | | 7,948,536 | | | | 0 | | | | 0 | | | | 7,948,536 | |
| | | | |
Energy | | | 81,670 | | | | 0 | | | | 0 | | | | 81,670 | |
| | | | |
Financials | | | 5,904,320 | | | | 0 | | | | 0 | | | | 5,904,320 | |
| | | | |
Health care | | | 2,525,349 | | | | 0 | | | | 0 | | | | 2,525,349 | |
| | | | |
Industrials | | | 3,687,940 | | | | 0 | | | | 0 | | | | 3,687,940 | |
| | | | |
Information technology | | | 5,369,293 | | | | 0 | | | | 0 | | | | 5,369,293 | |
| | | | |
Materials | | | 904,241 | | | | 0 | | | | 0 | | | | 904,241 | |
| | | | |
Real estate | | | 1,251,370 | | | | 0 | | | | 0 | | | | 1,251,370 | |
| | | | |
Utilities | | | 3,505,131 | | | | 0 | | | | 0 | | | | 3,505,131 | |
| | | | |
Short-term investments | | | | | | | | | | | | | | | | |
| | | | |
Investment companies | | | 1,016,458 | | | | 0 | | | | 0 | | | | 1,016,458 | |
| | | | |
Total assets | | $ | 34,755,528 | | | $ | 0 | | | $ | 0 | | | $ | 34,755,528 | |
Additional sector, industry or geographic detail is included in the Portfolio of Investments.
At January 31, 2019, the Fund did not have any transfers into/out of Level 3.
| | | | |
| 24 | | Wells Fargo Low Volatility U.S. Equity Fund | | Notes to financial statements (unaudited) |
4. TRANSACTIONS WITH AFFILIATES
Management fee
Funds Management, an indirect wholly owned subsidiary of Wells Fargo & Company (“Wells Fargo”), is the manager of the Fund and provides advisory and fund-level administrative services under an investment management agreement. Under the investment management agreement, Funds Management is responsible for, among other services, implementing the investment objectives and strategies of the Fund, supervising the subadviser and providing fund-level administrative services in connection with the Fund’s operations. As compensation for its services under the investment management agreement, Funds Management is entitled to receive an annual management fee starting at 0.40% and declining to 0.33% as the average daily net assets of the Fund increase. For the six months ended January 31, 2019, the management fee was equivalent to an annual rate of 0.40% of the Fund’s average daily net assets.
Funds Management has retained the services of a subadviser to provide daily portfolio management to the Fund. The fee for subadvisory services is borne by Funds Management. Wells Capital Management Incorporated (“WellsCap”), an affiliate of Funds Management and an indirect wholly owned subsidiary of Wells Fargo, is the subadviser to the Fund and is entitled to receive a fee from Funds Management at an annual rate starting at 0.20% and declining to 0.12% as the average daily net assets of the Fund increase. Prior to November 1, 2018, Analytic Investors, LLC served as the subadviser and received an annual fee from Funds Management at the same rates. On November 1, 2018, Analytic Investors, LLC was consolidated into WellsCap.
Administration fees
Under a class-level administration agreement, Funds Management provides class-level administrative services to the Fund, which includes paying fees and expenses for services provided by the transfer agent, sub-transfer agents, omnibus account servicers and record-keepers. As compensation for its services under the class-level administration agreement, Funds Management receives an annual fee which is calculated based on the average daily net assets of each class as follows:
| | | | |
| | | Class-level
administration fee | |
| |
Class A, Class C | | | 0.21 | % |
| |
Class R6 | | | 0.03 | |
| |
Administrator Class, Institutional Class | | | 0.13 | |
Funds Management has contractually waived and/or reimbursed management and administration fees to the extent necessary to maintain certain net operating expense ratios for the Fund. When each class of the Fund has exceeded its expense cap, Funds Management has waived fees and/or reimbursed expenses from fund level expenses on a proportionate basis and then from class specific expenses; otherwise, waivers and/or reimbursements are applied against class specific expenses before fund level expenses. Funds Management has committed through November 30, 2019 to waive fees and/or reimburse expenses to the extent necessary to cap the Fund’s expenses at 0.73% for Class A shares, 1.48% for Class C shares, 0.30% for Class R6 shares, 0.65% for Administrator Class shares, and 0.40% for Institutional Class shares. Prior to or after the commitment expiration date, the cap may be increased or the commitment to maintain the cap may be terminated only with the approval of the Board of Trustees. Prior to December 1, 2018, the Fund’s expenses were capped at 0.83% for Class A shares, 1.58% for Class C shares, 0.40% for Class R6, 0.75% for Administrator Class shares, and 0.50% for Institutional Class.
Distribution fee
The Trust has adopted a distribution plan for Class C shares of the Fund pursuant to Rule 12b-1 under the 1940 Act. A distribution fee is charged to Class C shares and paid to Wells Fargo Funds Distributor, LLC (“Funds Distributor”), the principal underwriter, at an annual rate of 0.75% of the average daily net assets of Class C shares.
In addition, Funds Distributor is entitled to receive the front-end sales charge from the purchase of Class A shares and a contingent deferred sales charge on the redemption of certain Class A shares. Funds Distributor is also entitled to receive the contingent deferred sales charges from redemptions of Class C shares. Funds Distributor did not receive any front-end or contingent deferred sales charges from Class A or Class C shares for the six months ended January 31, 2019.
Shareholder servicing fees
The Trust has entered into contracts with one or more shareholder servicing agents, whereby Class A, Class C, and Administrator Class of the Fund are charged a fee at an annual rate of 0.25% of the respective average daily net assets of each class.
| | | | | | |
| Notes to financial statements (unaudited) | | Wells Fargo Low Volatility U.S. Equity Fund | | | 25 | |
A portion of these total shareholder servicing fees were paid to affiliates of Wells Fargo.
Interfund transactions
The Fund may purchase or sell portfolio investment securities to certain other Wells Fargo affiliates pursuant to Rule 17a-7 under the 1940 Act and under procedures adopted by the Board of Trustees. The procedures have been designed to ensure that these interfund transactions, which do not incur broker commissions, are effected at current market prices.
5. INVESTMENT PORTFOLIO TRANSACTIONS
Purchases and sales of investments, excluding U.S. government obligations (if any) and short-term securities, for the six months ended January 31, 2019 were $15,979,149 and $18,687,363, respectively.
6. BANK BORROWINGS
The Trust (excluding the money market funds), Wells Fargo Master Trust and Wells Fargo Variable Trust are parties to a $280,000,000 revolving credit agreement whereby the Fund is permitted to use bank borrowings for temporary or emergency purposes, such as to fund shareholder redemption requests. Interest under the credit agreement is charged to the Fund based on a borrowing rate equal to the higher of the Federal Funds rate in effect on that day plus 1.25% or the overnight LIBOR rate in effect on that day plus 1.25%. In addition, an annual commitment fee equal to 0.25% of the unused balance is allocated to each participating fund.
For the six months ended January 31, 2019, there were no borrowings by the Fund under the agreement.
7. DISTRIBUTIONS TO SHAREHOLDERS
Effective for all filings after November 4, 2018, the Securities and Exchange Commission eliminated the requirement to separately state the components of distributions to shareholders under U.S. generally accepted accounting principles. The amounts of distributions to shareholders for the year ended July 31, 2018 were as follows:
| | | | | | | | |
| | | Net investment
income | | | Net realized gains | |
| | |
Class A | | $ | 19,083 | | | $ | 20,121 | |
| | |
Class C | | | 941 | | | | 1,864 | |
| | |
Class R6 | | | 22,574 | | | | 18,434 | |
| | |
Administrator Class | | | 1,865 | | | | 1,842 | |
| | |
Institutional Class | | | 119,172 | | | | 586,361 | |
8. INDEMNIFICATION
Under the Trust’s organizational documents, the officers and Trustees have been granted certain indemnification rights against certain liabilities that may arise out of performance of their duties to the Trust. Additionally, in the normal course of business, the Trust may enter into contracts with service providers that contain a variety of indemnification clauses. The Trust’s maximum exposure under these arrangements is dependent on future claims that may be made against the Fund and, therefore, cannot be estimated.
9. NEW ACCOUNTING PRONOUNCEMENT
In August 2018, FASB issued Accounting Standards Update (“ASU”) No. 2018-13, Fair Value Measurement (Topic 820)Disclosure Framework—Changes to the Disclosure Requirements for Fair Value Measurement.ASU 2018-13 updates the disclosure requirements for fair value measurements by modifying or removing certain disclosures and adding certain new disclosures. The amendments are effective for fiscal years, and interim periods within those fiscal years, beginning after December 15, 2019. Early adoption is permitted. Management has adopted the removal and modification of disclosures early, as permitted, and will adopt the additional new disclosures at the effective date.
| | | | |
| 26 | | Wells Fargo Low Volatility U.S. Equity Fund | | Other information (unaudited) |
PROXY VOTING INFORMATION
A description of the policies and procedures used to determine how to vote proxies relating to portfolio securities is available, upon request, by calling1-800-222-8222, visiting our website atwellsfargofunds.com, or visiting the SEC website at sec.gov. Information regarding how the Fund voted proxies relating to portfolio securities during the most recent 12-month period ended June 30 is available on the Fund’s website atwellsfargofunds.com or by visiting the SEC website at sec.gov.
PORTFOLIO HOLDINGS INFORMATION
The complete portfolio holdings for the Fund are publicly available monthly on the Fund’s website (wellsfargofunds.com), on a one-month delayed basis. In addition, top ten holdings information (excluding derivative positions) for the Fund is publicly available on the Fund’s website on a monthly, seven-day or more delayed basis. The Fund files its complete schedule of portfolio holdings with the SEC for the first and third quarters of each fiscal year on Form N-Q, which is available by visiting the SEC website at sec.gov. In addition, the Fund’s Form N-Q may be reviewed and copied at the SEC’s Public Reference Room in Washington, DC, and at regional offices in New York City, at 233 Broadway, and in Chicago, at 175 West Jackson Boulevard, Suite 900. Information about the Public Reference Room may be obtained by calling 1-800-SEC-0330.
| | | | | | |
| Other information (unaudited) | | Wells Fargo Low Volatility U.S. Equity Fund | | | 27 | |
BOARD OF TRUSTEES AND OFFICERS
Each of the Trustees and Officers1 listed in the table below acts in identical capacities for each fund in the Wells Fargo family of funds, which consists of 152 mutual funds comprising the Wells Fargo Funds Trust, Wells Fargo Variable Trust, Wells Fargo Master Trust and four closed-end funds (collectively the “Fund Complex”). This table should be read in conjunction with the Prospectus and the Statement of Additional Information2. The mailing address of each Trustee and Officer is 525 Market Street, 12th Floor, San Francisco, CA 94105. Each Trustee and Officer serves an indefinite term, however, each Trustee serves such term until reaching the mandatory retirement age established by the Trustees.
Independent Trustees
| | | | | | |
Name and year of birth | | Position held and length of service* | | Principal occupations during past five years or longer | | Current other public company or
investment company
directorships |
| | | |
William R. Ebsworth (Born 1957) | | Trustee, since 2015 | | Retired. From 1984 to 2013, equities analyst, portfolio manager, research director and chief investment officer at Fidelity Management and Research Company in Boston, Tokyo, and Hong Kong, and retired in 2013 as Chief Investment Officer of Fidelity Strategic Advisers, Inc. where he led a team of investment professionals managing client assets. Prior thereto, Board member of Hong Kong Securities Clearing Co., Hong Kong Options Clearing Corp., the Thailand International Fund, Ltd., Fidelity Investments Life Insurance Company, and Empire Fidelity Investments Life Insurance Company. Audit Committee Chair and Investment Committee Chair of the Vincent Memorial Hospital Endowment (non-profit organization). Mr. Ebsworth is a CFA® charterholder. | | N/A |
| | | |
Jane A. Freeman (Born 1953) | | Trustee, since 2015; Chair Liaison, since 2018 | | Retired. From 2012 to 2014 and 1999 to 2008, Chief Financial Officer of Scientific Learning Corporation. From 2008 to 2012, Ms. Freeman provided consulting services related to strategic business projects. Prior to 1999, Portfolio Manager at Rockefeller & Co. and Scudder, Stevens & Clark. Board member of the Harding Loevner Funds from 1996 to 2014, serving as both Lead Independent Director and chair of the Audit Committee. Board member of the Russell Exchange Traded Funds Trust from 2011 to 2012 and the chair of the Audit Committee. Ms. Freeman is a Board Member of The Ruth Bancroft Garden (non-profit organization). She is also an inactive Chartered Financial Analyst. | | N/A |
| | | |
Isaiah Harris, Jr.3 (Born 1952) | | Trustee, since 2009; Audit Committee Chairman, since 2019 | | Retired. Chairman of the Board of CIGNA Corporation since 2009, and Director since 2005. From 2003 to 2011, Director of Deluxe Corporation. Prior thereto, President and CEO of BellSouth Advertising and Publishing Corp. from 2005 to 2007, President and CEO of BellSouth Enterprises from 2004 to 2005 and President of BellSouth Consumer Services from 2000 to 2003. Emeritus member of the Iowa State University Foundation Board of Governors. Emeritus Member of the Advisory Board of Iowa State University School of Business. Advisory Board Member, Palm Harbor Academy (private school). Advisory Board Member, Child Evangelism Fellowship (non-profit). Mr. Harris is a certified public accountant (inactive status). | | CIGNA Corporation |
| | | |
Judith M. Johnson3 (Born 1949) | | Trustee, since 2008; Audit Committee Chairman, from 2009 to 2018 | | Retired. Prior thereto, Chief Executive Officer and Chief Investment Officer of Minneapolis Employees Retirement Fund from 1996 to 2008. Ms. Johnson is an attorney, certified public accountant and a certified managerial accountant. | | N/A |
| | | |
David F. Larcker (Born 1950) | | Trustee, since 2009 | | James Irvin Miller Professor of Accounting at the Graduate School of Business, Stanford University, Director of the Corporate Governance Research Initiative and Senior Faculty of The Rock Center for Corporate Governance since 2006. From 2005 to 2008, Professor of Accounting at the Graduate School of Business, Stanford University. Prior thereto, Ernst & Young Professor of Accounting at The Wharton School, University of Pennsylvania from 1985 to 2005. | | N/A |
| | | | |
| 28 | | Wells Fargo Low Volatility U.S. Equity Fund | | Other information (unaudited) |
| | | | | | |
Name and year of birth | | Position held and length of service* | | Principal occupations during past five years or longer | | Current other public company or
investment company
directorships |
| | | |
Olivia S. Mitchell (Born 1953) | | Trustee, since 2006; Nominating and Governance Committee Chairman, since 2018 | | International Foundation of Employee Benefit Plans Professor, Wharton School of the University of Pennsylvania since 1993. Director of Wharton’s Pension Research Council and Boettner Center on Pensions & Retirement Research, and Research Associate at the National Bureau of Economic Research. Previously, Cornell University Professor from 1978 to 1993. | | N/A |
| | | |
Timothy J. Penny (Born 1951) | | Trustee, since 1996; Chairman, since 2018; Vice Chairman, from 2017 to 2018 | | President and Chief Executive Officer of Southern Minnesota Initiative Foundation, a non-profit organization, since 2007. Member of the Board of Trustees of NorthStar Education Finance, Inc., a non-profit organization, since 2007. | | N/A |
| | | |
James G. Polisson (Born 1959) | | Trustee, since 2018; Advisory Board Member, from 2017 to 2018 | | Retired. Chief Marketing Officer, Source (ETF) UK Services, Ltd, from 2015 to 2017. From 2012 to 2015, Principal of The Polisson Group, LLC, a management consulting, corporate advisory and principal investing company. Chief Executive Officer and Managing Director at Russell Investments, Global Exchange Traded Funds from 2010 to 2012. Managing Director of Barclays Global Investors from 1998 to 2010 and Global Chief Marketing Officer for iShares and Barclays Global Investors from 2000 to 2010. Trustee of the San Francisco Mechanics’ Institute, a non-profit organization, from 2013 to 2015. Board member of the Russell Exchange Traded Fund Trust from 2011 to 2012. Director of Barclays Global Investors Holdings Deutschland GmbH from 2006 to 2009. Mr. Polisson is an attorney and has a retired status with the Massachusetts and District of Columbia Bar Associations. | | N/A |
| | | |
Pamela Wheelock (Born 1959) | | Trustee, since 2018; Advisory Board Member, from 2017 to 2018 | | Board member of the Destination Medical Center Economic Development Agency, Rochester, Minnesota since 2019. Chief Operating Officer, Twin Cities Habitat for Humanity from 2017 to 2019. Vice President of University Services, University of Minnesota from 2012 to 2016. Prior thereto, on the Board of Directors, Governance Committee and Finance Committee for the Minnesota Philanthropy Partners (Saint Paul Foundation) from 2012 to 2018, Interim Chief Executive Officer of Blue Cross Blue Shield of Minnesota from 2011 to 2012, Chairman of the Board from 2009 to 2012 and Board Director from 2003 to 2015. Vice President, Leadership and Community Engagement, Bush Foundation, Saint Paul, Minnesota (a private foundation) from 2009 to 2011. Executive Vice President and Chief Financial Officer, Minnesota Sports and Entertainment from 2004 to 2009 and Senior Vice President from 2002 to 2004. Executive Vice President of the Minnesota Wild Foundation from 2004 to 2008. Commissioner of Finance, State of Minnesota, from 1999 to 2002. Currently Board Chair of the Minnesota Wild Foundation since 2010. | | N/A |
| * | Length of service dates reflect the Trustee’s commencement of service with the Trust’s predecessor entities, where applicable. |
| | | | | | |
| Other information (unaudited) | | Wells Fargo Low Volatility U.S. Equity Fund | | | 29 | |
Officers
| | | | | | |
Name and year of birth | | Position held and length of service | | Principal occupations during past five years or longer | | |
| | | |
Andrew Owen (Born 1960) | | President, since 2017 | | Executive Vice President of Wells Fargo & Company and Head of Affiliated Managers, Wells Fargo Asset Management, since 2014. In addition, Mr. Owen is currently President, Chief Executive Officer and Director of Wells Fargo Funds Management, LLC since 2017. Prior thereto, Executive Vice President responsible for marketing, investments and product development for Wells Fargo Funds Management, LLC, from 2009 to 2014. | | |
| | | |
Jeremy DePalma1 (Born 1974) | | Treasurer, since 2012 | | Senior Vice President of Wells Fargo Funds Management, LLC since 2009. Senior Vice President of Evergreen Investment Management Company, LLC from 2008 to 2010 and head of the Fund Reporting and Control Team within Fund Administration from 2005 to 2010. | | |
| | | |
Alexander Kymn (Born 1973) | | Secretary, since 2018; Chief Legal Officer, since 2018 | | Senior Company Counsel of Wells Fargo Bank, N.A. since 2018 (previously Senior Counsel from 2007 to 2018). Vice President of Wells Fargo Funds Management, LLC from 2008 to 2014. | | |
| | | |
Michael H. Whitaker (Born 1967) | | Chief Compliance Officer, since 2016 | | Senior Vice President and Chief Compliance Officer since 2016. Senior Vice President and Chief Compliance Officer for Fidelity Investments from 2007 to 2016. | | |
| | | |
David Berardi (Born 1975) | | Assistant Treasurer, since 2009 | | Vice President of Wells Fargo Funds Management, LLC since 2009. Vice President of Evergreen Investment Management Company, LLC from 2008 to 2010. Manager of Fund Reporting and Control for Evergreen Investment Management Company, LLC from 2004 to 2010. | | |
| 1 | Jeremy DePalma acts as Treasurer of 76 funds and Assistant Treasurer of 76 funds in the Fund Complex. |
| 2 | The Statement of Additional Information includes additional information about the Trustees and is available, without charge, upon request, by calling1-800-260-5969 or by visiting the website atwellsfargofunds.com. |
| 3 | Mr. Harris became Chairman of the Audit Committee effective January 1, 2019. |
| | | | |
| 30 | | Wells Fargo Low Volatility U.S. Equity Fund | | Appendix A (unaudited) |
SALES CHARGE REDUCTIONS AND WAIVERS FOR CERTAIN INTERMEDIARIES
Raymond James & Associates, Inc., Raymond James Financial Services & Raymond James affiliates (“Raymond James”)
Effective on or about March 1, 2019, shareholders purchasing Fund shares through a Raymond James platform or account will be eligible only for the following load waivers (front-end sales charge waivers and contingent deferred, or back-end, sales charge waivers) and discounts, which may differ from those disclosed elsewhere in the Fund’s Prospectus or SAI.
Front-end Sales Load Waivers on Class A shares Available at Raymond James
| | • | | Shares purchased in an investment advisory program. |
| | • | | Shares purchased through reinvestment of capital gains distributions and dividend reinvestment when purchasing shares of the same fund (but not any other fund within the fund family). |
| | • | | Employees and registered representatives of Raymond James or its affiliates and their family members as designated by Raymond James. |
| | • | | Shares purchased from the proceeds of redemptions within the same fund family, provided (1) the repurchase occurs within 90 days following the redemption, (2) the redemption and purchase occur in the same account, and (3) redeemed shares were subject to a front-end or deferred sales load (known as Rights of Reinstatement). |
| | • | | A shareholder in the fund’s Class C shares will have their shares automatically exchanged at net asset value to Class A shares (or the appropriate share class) of the fund if the shares are no longer subject to a CDSC and the exchange is in line with the policies and procedures of Raymond James. |
CDSC Waivers on Class A and C Shares Available at Raymond James
| | • | | Death or disability of the shareholder. |
| | • | | Shares sold as part of a systematic withdrawal plan as described in the Fund’s Prospectus. |
| | • | | Return of excess contributions from an IRA Account. |
| | • | | Shares sold as part of a required minimum distribution for IRA and retirement accounts due to the shareholder reaching age 70½ as described in the Fund’s prospectus. |
| | • | | Shares sold to pay Raymond James fees but only if the transaction is initiated by Raymond James. |
| | • | | Shares acquired through a right of reinstatement. |
Front-end Load Discounts Available at Raymond James: Breakpoints, and/or Rights of Accumulation
| | • | | Breakpoints as described in the Fund’s Prospectus. |
| | • | | Rights of accumulation which entitle shareholders to breakpoint discounts will be automatically calculated based on the aggregated holding of fund family assets held by accounts within the purchaser’s household at Raymond James. Eligible fund family assets not held at Raymond James may be included in the rights of accumulation calculation only if the shareholder notifies his or her financial advisor about such assets. |
This page is intentionally left blank.
This page is intentionally left blank.

For more information
More information about Wells Fargo Funds is available free upon request. To obtain literature, please write, visit the Fund’s website, or call:
Wells Fargo Funds
P.O. Box 219967
Kansas City, MO 64121-9967
Website: wellsfargofunds.com
Individual investors: 1-800-222-8222
Retail investment professionals: 1-888-877-9275
Institutional investment professionals:1-866-765-0778
This report and the financial statements contained herein are submitted for the general information of the shareholders of the Fund. If this report is used for promotional purposes, distribution of the report must be accompanied or preceded by a current prospectus. Before investing, please consider the investment objectives, risks, charges, and expenses of the investment. For a current prospectus and, if available, a summary prospectus, containing this information, call1-800-222-8222 or visit the Fund’s website atwellsfargofunds.com. Read the prospectus carefully before you invest or send money.
Wells Fargo Asset Management (WFAM) is the trade name for certain investment advisory/management firms owned by Wells Fargo & Company. These firms include but are not limited to Wells Capital Management Incorporated and Wells Fargo Funds Management, LLC. Certain products managed by WFAM entities are distributed by Wells Fargo Funds Distributor, LLC (a broker/dealer and Member FINRA).
This material is for general informational and educational purposes only and is NOT intended to provide investment advice or a recommendation of any kind—including a recommendation for any specific investment, strategy, or plan.
INVESTMENT PRODUCTS: NOT FDIC INSURED ◾ NO BANK GUARANTEE ◾ MAY LOSE VALUE
© 2019 Wells Fargo Funds Management, LLC. All rights reserved.
| | |
 | | 320776 03-19 SA270/SAR270 01-19 |
Semi-Annual Report
January 31, 2019

Wells Fargo Omega Growth Fund

Beginning on January 1, 2021, as permitted by new regulations adopted by the Securities and Exchange Commission, paper copies of the Wells Fargo Funds’ annual and semi-annual shareholder reports issued after this date will no longer be sent by mail, unless you specifically request paper copies of the reports. Instead, the reports will be made available on the Funds’ website, and you will be notified by mail each time a report is posted and provided with a website address to access the report.
If you already elected to receive shareholder reports electronically, you will not be affected by this change and you need not take any action. You may elect to receive shareholder reports and other communications from the Fund electronically at any time by contacting your financial intermediary (such as a broker-dealer or bank) or, if you are a direct investor, by calling 1-800-222-8222 or by enrolling at wellsfargo.com/advantagedelivery.
You may elect to receive all future reports in paper free of charge. If you invest through a financial intermediary, you can contact your financial intermediary to request that you continue to receive paper copies of your shareholder reports; if you invest directly with the Fund, you can call 1-800-222-8222. Your election to receive reports in paper will apply to all Wells Fargo Funds held in your account with your financial intermediary or, if you are a direct investor, to all Wells Fargo Funds that you hold.

Reduce clutter. Save trees.
Sign up for electronic delivery of prospectuses and shareholder reports atwellsfargo.com/advantagedelivery
Contents
The views expressed and any forward-looking statements are as of January 31, 2019, unless otherwise noted, and are those of the Fund managers and/or Wells Fargo Funds Management, LLC. Discussions of individual securities, or the markets generally, or any Wells Fargo Fund are not intended as individual recommendations. Future events or results may vary significantly from those expressed in any forward-looking statements. The views expressed are subject to change at any time in response to changing circumstances in the market. Wells Fargo Funds Management, LLC and the Fund disclaim any obligation to publicly update or revise any views expressed or forward-looking statements.
INVESTMENT PRODUCTS: NOT FDIC INSURED ◾ NO BANK GUARANTEE ◾ MAY LOSE VALUE
| | | | |
| 2 | | Wells Fargo Omega Growth Fund | | Letter to shareholders (unaudited) |

Andrew Owen
President
Wells Fargo Funds
Favorable third-quarter economic indicators and corporate earnings reports encouraged domestic stock investors.
Dear Shareholder:
We are pleased to offer you this semi-annual report for the Wells Fargo Omega Growth Fund for the six-month period that ended January 31, 2019. Highershort-term interest rates, inflation concerns, trade tensions, slowing economic growth outside the U.S., and geopolitical events contributed to investment market volatility throughout the period.
For the period, U.S. stocks, as measured by the S&P 500 Index,1 fell 3.00% and international stocks, as measured by the MSCI ACWI ex USA Index (Net),2 declined 6.34%. Based on the MSCI EM Index (Net),3 emerging market stocks lost 2.60%. For bond investors, the Bloomberg Barclays U.S. Aggregate Bond Index4 added 2.71% while the Bloomberg Barclays Global Aggregate ex-USD Index5 gained 1.37%. The Bloomberg Barclays Municipal Bond Index6 added 2.05%, and the ICE BofAML U.S. High Yield Index7 gained 1.02%.
Investors appeared to shake off lingering concerns during the third quarter.
Favorable third-quarter economic indicators and corporate earnings reports encouraged domestic stock investors. U.S. trade negotiations with Mexico and Canada made progress. The Conference Board Consumer Confidence Index®8 reached its highest level in 18 years during September. Several U.S. equity market indices reached records during August. The U.S. Federal Reserve (Fed) raised the federal funds rate by 25 basis points (bps; 100 bps equal 1.00%) to a target range of between 2.00% and 2.25% in September 2018. For the quarter that ended September 30, the S&P 500 Index added 7.71%.
Investors in international markets were not as reassured. Tensions between the U.S. and China increased when the U.S. imposed an additional $200 billion in tariffs on Chinese goods. China responded with $60 billion in tariffs on U.S. products. In addition, economic growth in China drew renewed concerns. The Bank of England, having raised its monetary policy rate to 0.50% in November 2017, increased the rate again in August 2018 to 0.75%. During the three-month period that ended September 30, 2018, the MSCI ACWI ex USA Index (Net) gained 0.71% while the MSCI EM Index (Net) declined 1.09%.
| 1 | The S&P 500 Index consists of 500 stocks chosen for market size, liquidity, and industry group representation. It is a market-value-weighted index with each stock’s weight in the index proportionate to its market value. You cannot invest directly in an index. |
| 2 | The Morgan Stanley Capital International (MSCI) All Country World Index (ACWI) ex USA Index (Net) is a free-float-adjusted market-capitalization-weighted index that is designed to measure the equity market performance of developed markets, excluding the United States and Canada. Source: MSCI. MSCI makes no express or implied warranties or representations and shall have no liability whatsoever with respect to any MSCI data contained herein. The MSCI data may not be further redistributed or used as a basis for other indices or any securities or financial products. This report is not approved, reviewed, or produced by MSCI. You cannot invest directly in an index. |
| 3 | The MSCI Emerging Markets (EM) Index (Net) is a free-float-adjusted market-capitalization-weighted index that is designed to measure large- and mid-cap equity market performance of emerging markets. The MSCI EM Index (Net) consists of the following 24 emerging market country indices: Brazil, Chile, China, Colombia, Czech Republic, Egypt, Greece, Hungary, India, Indonesia, Korea, Malaysia, Mexico, Pakistan, Peru, the Philippines, Poland, Qatar, Russia, South Africa, Taiwan, Thailand, Turkey, and the United Arab Emirates. You cannot invest directly in an index. |
| 4 | The Bloomberg Barclays U.S. Aggregate Bond Index is a broad-based benchmark that measures the investment-grade, U.S. dollar-denominated, fixed-rate taxable bond market, including Treasuries, government-related and corporate securities, mortgage-backed securities (agency fixed-rate and hybrid adjustable-rate mortgage pass-throughs), asset-backed securities, and commercial mortgage-backed securities. You cannot invest directly in an index. |
| 5 | The Bloomberg Barclays Global Aggregate ex-USD Index is an unmanaged index that provides a broad-based measure of the global investment-grade fixed-income markets excluding the U.S. dollar-denominated debt market. You cannot invest directly in an index. |
| 6 | The Bloomberg Barclays Municipal Bond Index is an unmanaged index composed of long-term tax-exempt bonds with a minimum credit rating of Baa. You cannot invest directly in an index. |
| 7 | The ICE BofAML U.S. High Yield Index is a market-capitalization-weighted index of domestic and Yankee high-yield bonds. The index tracks the performance of high-yield securities traded in the U.S. bond market. You cannot invest directly in an index. Copyright 2019. ICE Data Indices, LLC. All rights reserved. |
| 8 | The Conference Board Consumer Confidence Index® measures the degree of optimism on the state of the U.S. economy that consumers are expressing through their activities of savings and spending. You cannot invest directly in an index. |
| | | | | | |
| Letter to shareholders (unaudited) | | Wells Fargo Omega Growth Fund | | | 3 | |
In bond markets, U.S. bonds, as measured by the Bloomberg Barclays U.S. Aggregate Bond Index, were flat. The Bloomberg Barclays Global Aggregateex-USD Index fell 1.74% during the quarter that ended September 30, 2018.
Conflicting data unsettled markets during the fourth quarter.
Negative stock market performance during October and December bracketed a mildly positive November for the S&P 500 Index and the MSCI ACWI ex USA Index (Net). As interest rates and bond yields gained during October, stock markets struggled. December’s S&P 500 Index performance was the worst since 1931. Globally, fixed-income investments fared better than stocks during the last two months of the year.
November’s U.S. midterm elections shifted control of the House of Representatives from Republicans to Democrats, presaging potential partisan disputes. The Bureau of Economic Analysis reported that third-quarter U.S. gross domestic product (GDP) grew at an annualized 3.4% rate, lower than second-quarter GDP growth. Brexit efforts stalled in the U.K. ahead of the March 2019 deadline. The People’s Bank of China cut reserve requirement ratios and accelerated infrastructure spending and tax cuts, and the value of the yuan declined to low levels last seen in 2008. Oil prices fell.
After the Fed increased the federal funds rate by 25 bps to a target range of between 2.25% and 2.50% in December 2018—the ninth such increase since the Fed began raising rates three years ago from near zero—it softened its outlook for further interest rate increases in 2019.
The market climbs a wall of worry.
Investors entered 2019 with reasons to be concerned. A partial U.S. government shutdown driven by partisan disputes over spending and immigration policies extended into January. Globally, economic signals were uneven. Investors expected high levels of stock market volatility to continue, as measured by the VIX9.
January’s returns tended to support the investing adage that the market climbs a wall of worry. The S&P 500 Index gained 8.01% for the month that ended January 31, 2019, its best monthly performance in 30 years. Returns for the MSCI ACWI ex USA Index (Net), the Bloomberg Barclays U.S. Aggregate Bond Index, and the Bloomberg Barclays Global Aggregate ex-USD Index also were positive.
Don’t let short-term uncertainty derail long-term investment goals.
Periods of investment uncertainty can present challenges, but experience has taught us that maintaining long-term investment goals can be an effective way to plan for the future. To help you create a sound strategy based on your personal goals and risk tolerance, Wells Fargo Funds offers more than 100 mutual funds spanning a wide range of asset classes and investment styles. Although diversification cannot guarantee an investment profit or prevent losses, we believe it can be an effective way to manage investment risk and potentially smooth out overall portfolio performance. We encourage investors to know their investments and to understand that appropriate levels of risk-taking may unlock opportunities.
January’s returns tended to support the investing adage that the market climbs a wall of worry.
| 9 | The Chicago Board Options Exchange Market Volatility Index (VIX) is a popular measure of the implied volatility of S&P 500 Index options. It represents one measure of the market’s expectation of stock market volatility over the next 30-day period. You cannot invest directly in an index. |
| | | | |
| 4 | | Wells Fargo Omega Growth Fund | | Letter to shareholders (unaudited) |
Thank you for choosing to invest with Wells Fargo Funds. We appreciate your confidence in us and remain committed to helping you meet your financial needs.
Sincerely,

Andrew Owen
President
Wells Fargo Funds
For further information about your Fund, contact your investment professional, visit our website atwellsfargofunds.com, or call us directly at1-800-222-8222.
This page is intentionally left blank.
| | | | |
| 6 | | Wells Fargo Omega Growth Fund | | Performance highlights (unaudited) |
Investment objective
The Fund seeks long-term capital appreciation.
Manager
Wells Fargo Funds Management, LLC
Subadviser
Wells Capital Management Incorporated
Portfolio managers
Michael T. Smith, CFA®‡
Christopher J. Warner, CFA®‡
Average annual total returns (%) as of January 31, 20191
| | | | | | | | | | | | | | | | | | | | | | | | | | | | | | | | | | |
| | | | | Including sales charge | | | Excluding sales charge | | | Expense ratios2 (%) | |
| | | Inception date | | 1 year | | | 5 year | | | 10 year | | | 1 year | | | 5 year | | | 10 year | | | Gross | | | Net3 | |
| | | | | | | | | |
| Class A (EKOAX) | | 4-29-1968 | | | -4.34 | | | | 8.59 | | | | 15.35 | | | | 1.50 | | | | 9.88 | | | | 16.03 | | | | 1.28 | | | | 1.28 | |
| | | | | | | | | |
| Class C (EKOCX) | | 8-2-1993 | | | -0.27 | | | | 9.06 | | | | 15.16 | | | | 0.73 | | | | 9.06 | | | | 15.16 | | | | 2.03 | | | | 2.03 | |
| | | | | | | | | |
| Class R (EKORX) | | 10-10-2003 | | | – | | | | – | | | | – | | | | 1.25 | | | | 9.62 | | | | 15.74 | | | | 1.53 | | | | 1.53 | |
| | | | | | | | | |
| Administrator Class (EOMYX) | | 1-13-1997 | | | – | | | | – | | | | – | | | | 1.69 | | | | 10.11 | | | | 16.29 | | | | 1.20 | | | | 1.10 | |
| | | | | | | | | |
| Institutional Class (EKONX)4 | | 7-30-2010 | | | – | | | | – | | | | – | | | | 1.94 | | | | 10.39 | | | | 16.54 | | | | 0.95 | | | | 0.85 | |
| | | | | | | | | |
| Russell 3000® Growth Index5 | | – | | | – | | | | – | | | | – | | | | 0.03 | | | | 12.57 | | | | 16.77 | | | | – | | | | – | |
Figures quoted represent past performance, which is no guarantee of future results, and do not reflect taxes that a shareholder may pay on fund distributions or the redemption of fund shares. Investment return and principal value of an investment will fluctuate so that an investor’s shares, when redeemed, may be worth more or less than their original cost. Performance shown without sales charges would be lower if sales charges were reflected. Current performance may be lower or higher than the performance data quoted, which assumes the reinvestment of dividends and capital gains. Current month-end performance is available on the Fund’s website,wellsfargofunds.com.
Index returns do not include transaction costs associated with buying and selling securities, any mutual fund fees or expenses, or any taxes. It is not possible to invest directly in an index.
For Class A shares, the maximum front-end sales charge is 5.75%. For Class C shares, the maximum contingent deferred sales charge is 1.00%. Performance including a contingent deferred sales charge assumes the sales charge for the corresponding time period. Class R, Administrator Class, and Institutional Class shares are sold without a front-end sales charge or contingent deferred sales charge.
Stock values fluctuate in response to the activities of individual companies and general market and economic conditions. Certain investment strategies tend to increase the total risk of an investment (relative to the broader market). The Fund is exposed to foreign investment risk and smaller-company securities risk. Consult the Fund’s prospectus for additional information on these and other risks.
Please see footnotes on page 7.
| | | | | | |
| Performance highlights (unaudited) | | Wells Fargo Omega Growth Fund | | | 7 | |
| | | | |
| Ten largest holdings (%) as of January 31, 20196 | |
| |
Amazon.com Incorporated | | | 6.75 | |
| |
Microsoft Corporation | | | 6.64 | |
| |
UnitedHealth Group Incorporated | | | 4.18 | |
| |
Visa Incorporated Class A | | | 4.07 | |
| |
Alphabet Incorporated Class A | | | 3.94 | |
| |
Waste Connections Incorporated | | | 2.54 | |
| |
Union Pacific Corporation | | | 2.36 | |
| |
First Data Corporation Class A | | | 2.03 | |
| |
EPAM Systems Incorporated | | | 1.97 | |
| |
PayPal Holdings Incorporated | | | 1.83 | |
|
| Sector distribution as of January 31, 20197 |
|
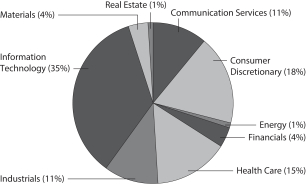
|
| ‡ | CFA® and Chartered Financial Analyst® are trademarks owned by CFA Institute. |
| 1 | Historical performance shown for all classes of the Fund prior to July 19, 2010, is based on the performance of the Fund’s predecessor, Evergreen Omega Fund. |
| 2 | Reflects the expense ratios as stated in the most recent prospectuses. The expense ratios shown are subject to change and may differ from the annualized expense ratios shown in the financial highlights of this report. |
| 3 | The manager has contractually committed through November 30, 2019, to waive fees and/or reimburse expenses to the extent necessary to cap the expenses of each class after fee waivers at 1.30% for Class A, 2.05% for Class C, 1.55% for Class R, 1.10% for Administrator Class, and 0.85% for Institutional Class. Brokerage commissions, stamp duty fees, interest, taxes, acquired fund fees and expenses (if any), and extraordinary expenses are excluded from the expense cap. Prior to or after the commitment expiration date, the cap may be increased or the commitment to maintain the cap may be terminated only with the approval of the Board of Trustees. Without this cap, the Fund’s returns would have been lower. The expense ratio paid by an investor is the net expense ratio (the total annual fund operating expenses after fee waivers) as stated in the prospectuses. |
| 4 | Historical performance shown for Institutional Class shares prior to their inception reflects the performance of Administrator Class shares, and includes the higher expenses applicable to Administrator Class shares. If these expenses had not been included, returns for Institutional Class shares would be higher. |
| 5 | The Russell 3000® Growth Index measures the performance of those Russell 3000® Index companies with higher price/book ratios and higher forecasted growth values. You cannot invest directly in an index. |
| 6 | The ten largest holdings, excluding cash, cash equivalents and any money market funds, are calculated based on the value of the investments divided by total net assets of the Fund. Holdings are subject to change and may have changed since the date specified. |
| 7 | Amounts are calculated based on the total long-term investments of the Fund. These amounts are subject to change and may have changed since the date specified. |
| | | | |
| 8 | | Wells Fargo Omega Growth Fund | | Fund expenses (unaudited) |
As a shareholder of the Fund, you incur two types of costs: (1) transaction costs, including sales charges (loads) on purchase payments and contingent deferred sales charges (if any) on redemptions and (2) ongoing costs, including management fees, distribution (12b-1) and/or shareholder servicing fees, and other Fund expenses. This example is intended to help you understand your ongoing costs (in dollars) of investing in the Fund and to compare these costs with the ongoing costs of investing in other mutual funds.
The example is based on an investment of $1,000 invested at the beginning of the six-month period and held for the entire period from August 1, 2018 to January 31, 2019.
Actual expenses
The “Actual” line of the table below provides information about actual account values and actual expenses. You may use the information in this line, together with the amount you invested, to estimate the expenses that you paid over the period. Simply divide your account value by $1,000 (for example, an $8,600 account value divided by $1,000 = 8.6), then multiply the result by the number in the “Actual” line under the heading entitled “Expenses paid during period” for your applicable class of shares to estimate the expenses you paid on your account during this period.
Hypothetical example for comparison purposes
The “Hypothetical” line of the table below provides information about hypothetical account values and hypothetical expenses based on the Fund’s actual expense ratio and an assumed rate of return of 5% per year before expenses, which is not the Fund’s actual return. The hypothetical account values and expenses may not be used to estimate the actual ending account balance or expenses you paid for the period. You may use this information to compare the ongoing costs of investing in the Fund and other funds. To do so, compare this 5% hypothetical example with the 5% hypothetical examples that appear in the shareholder reports of the other funds.
Please note that the expenses shown in the table are meant to highlight your ongoing costs only and do not reflect any transactional costs, such as sales charges (loads) and contingent deferred sales charges. Therefore, the “Hypothetical” line of the table is useful in comparing ongoing costs only and will not help you determine the relative total costs of owning different funds. In addition, if these transactional costs were included, your costs would have been higher.
| | | | | | | | | | | | | | | | |
| | | Beginning
account value
8-1-2018 | | | Ending
account value
1-31-2019 | | | Expenses
paid during
the period¹ | | | Annualized net
expense ratio | |
Class A | | | | | | | | | | | | | | | | |
| | | | |
Actual | | $ | 1,000.00 | | | $ | 969.03 | | | $ | 6.40 | | | | 1.29 | % |
| | | | |
Hypothetical (5% return before expenses) | | $ | 1,000.00 | | | $ | 1,018.70 | | | $ | 6.56 | | | | 1.29 | % |
Class C | | | | | | | | | | | | | | | | |
| | | | |
Actual | | $ | 1,000.00 | | | $ | 965.44 | | | $ | 10.11 | | | | 2.04 | % |
| | | | |
Hypothetical (5% return before expenses) | | $ | 1,000.00 | | | $ | 1,014.92 | | | $ | 10.36 | | | | 2.04 | % |
Class R | | | | | | | | | | | | | | | | |
| | | | |
Actual | | $ | 1,000.00 | | | $ | 968.07 | | | $ | 7.59 | | | | 1.53 | % |
| | | | |
Hypothetical (5% return before expenses) | | $ | 1,000.00 | | | $ | 1,017.49 | | | $ | 7.78 | | | | 1.53 | % |
Administrator Class | | | | | | | | | | | | | | | | |
| | | | |
Actual | | $ | 1,000.00 | | | $ | 970.13 | | | $ | 5.46 | | | | 1.10 | % |
| | | | |
Hypothetical (5% return before expenses) | | $ | 1,000.00 | | | $ | 1,019.66 | | | $ | 5.60 | | | | 1.10 | % |
Institutional Class | | | | | | | | | | | | | | | | |
| | | | |
Actual | | $ | 1,000.00 | | | $ | 971.32 | | | $ | 4.22 | | | | 0.85 | % |
| | | | |
Hypothetical (5% return before expenses) | | $ | 1,000.00 | | | $ | 1,020.92 | | | $ | 4.33 | | | | 0.85 | % |
| 1 | Expenses paid is equal to the annualized net expense ratio of each class multiplied by the average account value over the period, multiplied by the number of days in the most recent fiscal half-year divided by the number of days in the fiscal year (to reflect the one-half-year period). |
| | | | | | |
| Portfolio of investments—January 31, 2019 (unaudited) | | Wells Fargo Omega Growth Fund | | | 9 | |
| | | | | | | | | | | | | | | | |
| Security name | | | | | | | | Shares | | | Value | |
| | | | |
Common Stocks: 100.34% | | | | | | | | | | | | | | | | |
| | | | |
Communication Services: 10.66% | | | | | | | | | | | | | | | | |
| | | | |
| Entertainment: 4.07% | | | | | | | | | | | | | | | | |
| | | | |
Netflix Incorporated † | | | | | | | | | | | 32,200 | | | $ | 10,931,900 | |
| | | | |
Nintendo Company Limited ADR | | | | | | | | | | | 249,538 | | | | 9,292,795 | |
| | | | |
Take-Two Interactive Software Incorporated † | | | | | | | | | | | 98,900 | | | | 10,438,895 | |
| | | | |
| | | | | | | | | | | | | | | 30,663,590 | |
| | | | | | | | | | | | | | | | |
| | | | |
| Interactive Media & Services: 6.59% | | | | | | | | | | | | | | | | |
| | | | |
Alphabet Incorporated Class A † | | | | | | | | | | | 26,400 | | | | 29,723,496 | |
| | | | |
Alphabet Incorporated Class C † | | | | | | | | | | | 8,685 | | | | 9,695,673 | |
| | | | |
Tencent Holdings Limited ADR | | | | | | | | | | | 230,600 | | | | 10,287,066 | |
| | | | |
| | | | | | | | | | | | | | | 49,706,235 | |
| | | | | | | | | | | | | | | | |
| | | | |
Consumer Discretionary: 18.62% | | | | | | | | | | | | | | | | |
| | | | |
| Auto Components: 1.58% | | | | | | | | | | | | | | | | |
| | | | |
Aptiv plc | | | | | | | | | | | 150,300 | | | | 11,893,239 | |
| | | | | | | | | | | | | | | | |
| | | | |
| Automobiles: 0.83% | | | | | | | | | | | | | | | | |
| | | | |
Ferrari NV | | | | | | | | | | | 49,900 | | | | 6,302,370 | |
| | | | | | | | | | | | | | | | |
| | | | |
| Diversified Consumer Services: 2.59% | | | | | | | | | | | | | | | | |
| | | | |
Adtalem Global Education Incorporated † | | | | | | | | | | | 214,400 | | | | 10,484,160 | |
| | | | |
Bright Horizons Family Solutions Incorporated † | | | | | | | | | | | 78,157 | | | | 9,049,799 | |
| | | | |
| | | | | | | | | | | | | | | 19,533,959 | |
| | | | | | | | | | | | | | | | |
| | | | |
| Hotels, Restaurants & Leisure: 2.83% | | | | | | | | | | | | | | | | |
| | | | |
Chipotle Mexican Grill Incorporated † | | | | | | | | | | | 21,500 | | | | 11,386,615 | |
| | | | |
Vail Resorts Incorporated | | | | | | | | | | | 52,902 | | | | 9,959,331 | |
| | | | |
| | | | | | | | | | | | | | | 21,345,946 | |
| | | | | | | | | | | | | | | | |
| | | | |
| Internet & Direct Marketing Retail: 9.28% | | | | | | | | | | | | | | | | |
| | | | |
Alibaba Group Holding Limited ADR † | | | | | | | | | | | 47,000 | | | | 7,919,030 | |
| | | | |
Amazon.com Incorporated † | | | | | | | | | | | 29,600 | | | | 50,874,408 | |
| | | | |
MercadoLibre Incorporated † | | | | | | | | | | | 30,700 | | | | 11,174,800 | |
| | | | |
| | | | | | | | | | | | | | | 69,968,238 | |
| | | | | | | | | | | | | | | | |
| | | | |
| Specialty Retail: 1.51% | | | | | | | | | | | | | | | | |
| | | | |
The Home Depot Incorporated | | | | | | | | | | | 61,900 | | | | 11,360,507 | |
| | | | | | | | | | | | | | | | |
| | | | |
Energy: 0.82% | | | | | | | | | | | | | | | | |
| | | | |
| Oil, Gas & Consumable Fuels: 0.82% | | | | | | | | | | | | | | | | |
| | | | |
Pioneer Natural Resources Company | | | | | | | | | | | 43,400 | | | | 6,176,688 | |
| | | | | | | | | | | | | | | | |
| | | | |
Financials: 4.35% | | | | | | | | | | | | | | | | |
| | | | |
| Capital Markets: 3.04% | | | | | | | | | | | | | | | | |
| | | | |
Intercontinental Exchange Incorporated | | | | | | | | | | | 168,800 | | | | 12,957,088 | |
| | | | |
Raymond James Financial Incorporated | | | | | | | | | | | 123,702 | | | | 9,958,011 | |
| | | | |
| | | | | | | | | | | | | | | 22,915,099 | |
| | | | | | | | | | | | | | | | |
The accompanying notes are an integral part of these financial statements.
| | | | |
| 10 | | Wells Fargo Omega Growth Fund | | Portfolio of investments—January 31, 2019 (unaudited) |
| | | | | | | | | | | | | | | | |
| Security name | | | | | | | | Shares | | | Value | |
| | | | |
| Consumer Finance: 1.31% | | | | | | | | | | | | | | | | |
| | | | |
SLM Corporation | | | | | | | | | | | 921,100 | | | $ | 9,864,981 | |
| | | | | | | | | | | | | | | | |
| | | | |
Health Care: 15.37% | | | | | | | | | | | | | | | | |
| | | | |
| Biotechnology: 3.09% | | | | | | | | | | | | | | | | |
| | | | |
Celgene Corporation † | | | | | | | | | | | 148,775 | | | | 13,160,637 | |
| | | | |
Exact Sciences Corporation † | | | | | | | | | | | 80,400 | | | | 7,242,432 | |
| | | | |
Sarepta Therapeutics Incorporated † | | | | | | | | | | | 20,500 | | | | 2,864,055 | |
| | | | |
| | | | | | | | | | | | | | | 23,267,124 | |
| | | | | | | | | | | | | | | | |
| | | | |
| Health Care Equipment & Supplies: 5.08% | | | | | | | | | | | | | | | | |
| | | | |
Align Technology Incorporated † | | | | | | | | | | | 34,200 | | | | 8,514,090 | |
| | | | |
Boston Scientific Corporation † | | | | | | | | | | | 279,600 | | | | 10,666,740 | |
| | | | |
Edwards Lifesciences Corporation † | | | | | | | | | | | 56,300 | | | | 9,594,646 | |
| | | | |
Medtronic plc | | | | | | | | | | | 108,000 | | | | 9,546,120 | |
| | | | |
| | | | | | | | | | | | | | | 38,321,596 | |
| | | | | | | | | | | | | | | | |
| | | | |
| Health Care Providers & Services: 5.58% | | | | | | | | | | | | | | | | |
| | | | |
UnitedHealth Group Incorporated | | | | | | | | | | | 116,700 | | | | 31,532,340 | |
| | | | |
WellCare Health Plans Incorporated † | | | | | | | | | | | 38,200 | | | | 10,561,536 | |
| | | | |
| | | | | | | | | | | | | | | 42,093,876 | |
| | | | | | | | | | | | | | | | |
| | | | |
| Life Sciences Tools & Services: 0.97% | | | | | | | | | | | | | | | | |
| | | | |
Illumina Incorporated † | | | | | | | | | | | 26,200 | | | | 7,330,498 | |
| | | | | | | | | | | | | | | | |
| | | | |
| Pharmaceuticals: 0.65% | | | | | | | | | | | | | | | | |
| | | | |
Elanco Animal Health Incorporated †« | | | | | | | | | | | 166,377 | | | | 4,854,881 | |
| | | | | | | | | | | | | | | | |
| | | | |
Industrials: 10.85% | | | | | | | | | | | | | | | | |
| | | | |
| Aerospace & Defense: 1.26% | | | | | | | | | | | | | | | | |
| | | | |
Teledyne Technologies Incorporated † | | | | | | | | | | | 42,200 | | | | 9,462,084 | |
| | | | | | | | | | | | | | | | |
| | | | |
| Commercial Services & Supplies: 3.89% | | | | | | | | | | | | | | | | |
| | | | |
Cintas Corporation | | | | | | | | | | | 54,000 | | | | 10,125,540 | |
| | | | |
Waste Connections Incorporated | | | | | | | | | | | 229,522 | | | | 19,178,858 | |
| | | | |
| | | | | | | | | | | | | | | 29,304,398 | |
| | | | | | | | | | | | | | | | |
| | | | |
| Electrical Equipment: 1.41% | | | | | | | | | | | | | | | | |
| | | | |
Rockwell Automation Incorporated | | | | | | | | | | | 62,800 | | | | 10,645,856 | |
| | | | | | | | | | | | | | | | |
| | | | |
| Road & Rail: 2.36% | | | | | | | | | | | | | | | | |
| | | | |
Union Pacific Corporation | | | | | | | | | | | 111,800 | | | | 17,784,026 | |
| | | | | | | | | | | | | | | | |
| | | | |
| Trading Companies & Distributors: 1.93% | | | | | | | | | | | | | | | | |
| | | | |
SiteOne Landscape Supply Incorporated † | | | | | | | | | | | 105,500 | | | | 5,623,150 | |
| | | | |
Univar Incorporated † | | | | | | | | | | | 429,828 | | | | 8,953,317 | |
| | | | |
| | | | | | | | | | | | | | | 14,576,467 | |
| | | | | | | | | | | | | | | | |
The accompanying notes are an integral part of these financial statements.
| | | | | | |
| Portfolio of investments—January 31, 2019 (unaudited) | | Wells Fargo Omega Growth Fund | | | 11 | |
| | | | | | | | | | | | | | | | |
| Security name | | | | | | | | Shares | | | Value | |
| | | | |
Information Technology: 35.14% | | | | | | | | | | | | | | | | |
| | | | |
| Communications Equipment: 1.70% | | | | | | | | | | | | | | | | |
| | | | |
Motorola Solutions Incorporated | | | | | | | | | | | 109,900 | | | $ | 12,848,409 | |
| | | | | | | | | | | | | | | | |
| | | | |
| Electronic Equipment, Instruments & Components: 2.01% | | | | | | | | | | | | | | | | |
| | | | |
Littelfuse Incorporated | | | | | | | | | | | 32,200 | | | | 5,658,184 | |
| | | | |
Zebra Technologies Corporation Class A † | | | | | | | | | | | 54,800 | | | | 9,513,280 | |
| | | | |
| | | | | | | | | | | | | | | 15,171,464 | |
| | | | | | | | | | | | | | | | |
| | | | |
| IT Services: 19.15% | | | | | | | | | | | | | | | | |
| | | | |
Black Knight Incorporated † | | | | | | | | | | | 246,100 | | | | 12,105,659 | |
| | | | |
EPAM Systems Incorporated † | | | | | | | | | | | 104,741 | | | | 14,818,757 | |
| | | | |
Euronet Worldwide Incorporated † | | | | | | | | | | | 85,400 | | | | 9,821,854 | |
| | | | |
Fidelity National Information Services Incorporated | | | | | | | | | | | 84,200 | | | | 8,801,426 | |
| | | | |
First Data Corporation Class A † | | | | | | | | | | | 619,900 | | | | 15,280,535 | |
| | | | |
Gartner Incorporated † | | | | | | | | | | | 59,700 | | | | 8,112,633 | |
| | | | |
PayPal Holdings Incorporated † | | | | | | | | | | | 155,600 | | | | 13,811,056 | |
| | | | |
Shopify Incorporated Class A †« | | | | | | | | | | | 50,600 | | | | 8,524,582 | |
| | | | |
Total System Services Incorporated | | | | | | | | | | | 114,000 | | | | 10,215,540 | |
| | | | |
Visa Incorporated Class A | | | | | | | | | | | 227,404 | | | | 30,701,814 | |
| | | | |
WEX Incorporated † | | | | | | | | | | | 75,302 | | | | 12,148,472 | |
| | | | |
| | | | | | | | | | | | | | | 144,342,328 | |
| | | | | | | | | | | | | | | | |
| | | | |
| Semiconductors & Semiconductor Equipment: 0.76% | | | | | | | | | | | | | | | | |
| | | | |
Infineon Technologies AG ADR | | | | | | | | | | | 258,800 | | | | 5,760,888 | |
| | | | | | | | | | | | | | | | |
| | | | |
| Software: 11.52% | | | | | | | | | | | | | | | | |
| | | | |
Autodesk Incorporated † | | | | | | | | | | | 49,500 | | | | 7,286,400 | |
| | | | |
Microsoft Corporation | | | | | | | | | | | 479,400 | | | | 50,063,742 | |
| | | | |
Salesforce.com Incorporated † | | | | | | | | | | | 80,800 | | | | 12,279,176 | |
| | | | |
ServiceNow Incorporated † | | | | | | | | | | | 53,300 | | | | 11,727,066 | |
| | | | |
The Ultimate Software Group Incorporated † | | | | | | | | | | | 20,000 | | | | 5,461,400 | |
| | | | |
| | | | | | | | | | | | | | | 86,817,784 | |
| | | | | | | | | | | | | | | | |
| | | | |
Materials: 3.91% | | | | | | | | | | | | | | | | |
| | | | |
| Chemicals: 3.03% | | | | | | | | | | | | | | | | |
| | | | |
Ingevity Corporation † | | | | | | | | | | | 103,900 | | | | 9,773,873 | |
| | | | |
The Sherwin-Williams Company | | | | | | | | | | | 31,100 | | | | 13,109,272 | |
| | | | |
| | | | | | | | | | | | | | | 22,883,145 | |
| | | | | | | | | | | | | | | | |
| | | | |
| Construction Materials: 0.88% | | | | | | | | | | | | | | | | |
| | | | |
Vulcan Materials Company | | | | | | | | | | | 65,000 | | | | 6,607,250 | |
| | | | | | | | | | | | | | | | |
| | | | |
Real Estate: 0.62% | | | | | | | | | | | | | | | | |
| | | | |
| Equity REITs: 0.62% | | | | | | | | | | | | | | | | |
| | | | |
SBA Communications Corporation † | | | | | | | | | | | 25,600 | | | | 4,672,768 | |
| | | | | | | | | | | | | | | | |
| | | | |
Total Common Stocks (Cost $515,964,643) | | | | | | | | | | | | | | | 756,475,694 | |
| | | | | | | | | | | | | | | | |
The accompanying notes are an integral part of these financial statements.
| | | | |
| 12 | | Wells Fargo Omega Growth Fund | | Portfolio of investments—January 31, 2019 (unaudited) |
| | | | | | | | | | | | | | | | |
| Security name | | Yield | | | | | | Shares | | | Value | |
| Short-Term Investments: 2.74% | | | | | | | | | | | | | | | | |
| | | | |
| Investment Companies: 2.74% | | | | | | | | | | | | | | | | |
| | | | |
Securities Lending Cash Investments LLC (l)(r)(u) | | | 2.57 | % | | | | | | | 12,131,527 | | | $ | 12,132,740 | |
| | | | |
Wells Fargo Government Money Market Fund Select Class (l)(u) | | | 2.33 | | | | | | | | 8,496,291 | | | | 8,496,291 | |
| |
Total Short-Term Investments (Cost $20,629,031) | | | | 20,629,031 | |
| | | | | | | | | | | | | | | | |
| | | | | | | | |
| Total investments in securities (Cost $536,593,674) | | | 103.08 | % | | | 777,104,725 | |
| | |
Other assets and liabilities, net | | | (3.08 | ) | | | (23,195,545 | ) |
| | | | | | | | |
| Total net assets | | | 100.00 | % | | $ | 753,909,180 | |
| | | | | | | | |
| † | Non-income-earning security |
| « | All or a portion of this security is on loan. |
| (l) | The issuer of the security is an affiliated person of the Fund as defined in the Investment Company Act of 1940. |
| (r) | The investment is a non-registered investment company purchased with cash collateral received from securities on loan. |
| (u) | The rate represents the 7-day annualized yield at period end. |
Abbreviations:
| ADR | American depositary receipt |
| REIT | Real estate investment trust |
Investments in Affiliates
An affiliated investment is an investment in which the Fund owns at least 5% of the outstanding voting shares of the issuer or as a result of other relationships, such as the Fund and the issuer having the same investment manager. Transactions with issuers that were either affiliated persons of the Fund at the beginning of the period or the end of the period were as follows:
| | | | | | | | | | | | | | | | | | | | | | | | | | | | | | | | | | | | |
| | | Shares,
beginning of
period | | | Shares
purchased | | | Shares
sold | | | Shares,
end of
period | | | Net
realized
gains
(losses) | | | Net
change in
unrealized
gains
(losses) | | | Income
from
affiliated
securities | | | Value,
end
of period | | | % of
net
assets | |
Short-Term Investments | | | | | | | | | | | | | | | | | | | | | | | | | | | | | | | | | | | | |
Investment Companies | | | | | | | | | | | | | | | | | | | | | | | | | | | | | | | | | | | | |
Securities Lending Cash Investments LLC | | | 6,508,449 | | | | 94,620,463 | | | | 88,997,385 | | | | 12,131,527 | | | $ | (3,860 | ) | | $ | 0 | | | $ | 172,108 | | | $ | 12,132,740 | | | | | |
Wells Fargo Government Money Market Fund Select Class | | | 5,594,599 | | | | 87,542,327 | | | | 84,640,635 | | | | 8,496,291 | | | | 0 | | | | 0 | | | | 71,246 | | | | 8,496,291 | | | | | |
| | | | | | | | | | | | | | | | | | | | | | | | | | | | | | | | | | | | |
| | | | | | | | | |
| | | | | | | | | | | | | | | | | | $ | (3,860 | ) | | $ | 0 | | | $ | 243,354 | | | $ | 20,629,031 | | | | 2.74 | % |
| | | | | | | | | | | | | | | | | | | | | | | | | | | | | | | | | | | | |
The accompanying notes are an integral part of these financial statements.
| | | | | | |
| Statement of assets and liabilities—January 31, 2019 (unaudited) | | Wells Fargo Omega Growth Fund | | | 13 | |
| | | | |
| | | | |
| |
Assets | | | | |
Investments in unaffiliated securities (including $11,857,400 of securities loaned), at value (cost $515,964,643) | | $ | 756,475,694 | |
Investments in affiliated securities, at value (cost $20,629,031) | | | 20,629,031 | |
Receivable for Fund shares sold | | | 211,141 | |
Receivable for dividends | | | 21,638 | |
Receivable for securities lending income | | | 6,233 | |
Prepaid expenses and other assets | | | 64,981 | |
| | | | |
Total assets | | | 777,408,718 | |
| | | | |
| |
Liabilities | | | | |
Payable upon receipt of securities loaned | | | 12,136,565 | |
Payable for investments purchased | | | 9,712,201 | |
Payable for Fund shares redeemed | | | 861,471 | |
Management fee payable | | | 471,203 | |
Administration fees payable | | | 122,619 | |
Distribution fees payable | | | 33,060 | |
Trustees’ fees and expenses payable | | | 2,530 | |
Due to custodian bank | | | 463 | |
Accrued expenses and other liabilities | | | 159,426 | |
| | | | |
Total liabilities | | | 23,499,538 | |
| | | | |
Total net assets | | $ | 753,909,180 | |
| | | | |
| |
NET ASSETS CONSIST OF | | | | |
Paid-in capital | | $ | 501,257,432 | |
Total distributable earnings | | | 252,651,748 | |
| | | | |
Total net assets | | $ | 753,909,180 | |
| | | | |
| |
COMPUTATION OF NET ASSET VALUE AND OFFERING PRICE PER SHARE | | | | |
Net assets – Class A | | $ | 609,740,814 | |
Shares outstanding – Class A1 | | | 12,982,513 | |
Net asset value per share – Class A | | | $46.97 | |
Maximum offering price per share – Class A2 | | | $49.84 | |
Net assets – Class C | | $ | 51,886,195 | |
Shares outstanding – Class C1 | | | 1,695,307 | |
Net asset value per share – Class C | | | $30.61 | |
Net assets – Class R | | $ | 6,205,383 | |
Shares outstanding – Class R1 | | | 140,554 | |
Net asset value per share – Class R | | | $44.15 | |
Net assets – Administrator Class | | $ | 23,249,767 | |
Shares outstanding – Administrator Class1 | | | 451,406 | |
Net asset value per share – Administrator Class | | | $51.51 | |
Net assets – Institutional Class | | $ | 62,827,021 | |
Shares outstanding – Institutional Class1 | | | 1,180,206 | |
Net asset value per share – Institutional Class | | | $53.23 | |
| 1 | The Fund has an unlimited number of authorized shares. |
| 2 | Maximum offering price is computed as 100/94.25 of net asset value. On investments of $50,000 or more, the offering price is reduced. |
The accompanying notes are an integral part of these financial statements.
| | | | |
| 14 | | Wells Fargo Omega Growth Fund | | Statement of operations—six months ended January 31, 2019 (unaudited) |
| | | | |
| | | | |
| |
Investment income | | | | |
Dividends (net of foreign withholding taxes of $14,377) | | $ | 2,285,605 | |
Income from affiliated securities | | | 102,874 | |
| | | | |
Total investment income | | | 2,388,479 | |
| | | | |
| |
Expenses | | | | |
Management fee | | | 3,056,617 | |
Administration fees | | | | |
Class A | | | 663,158 | |
Class C | | | 59,484 | |
Class R | | | 6,674 | |
Administrator Class | | | 15,296 | |
Institutional Class | | | 41,192 | |
Shareholder servicing fees | | | | |
Class A | | | 789,473 | |
Class C | | | 70,814 | |
Class R | | | 7,704 | |
Administrator Class | | | 28,209 | |
Distribution fees | | | | |
Class C | | | 212,441 | |
Class R | | | 7,945 | |
Custody and accounting fees | | | 21,383 | |
Professional fees | | | 26,303 | |
Registration fees | | | 42,636 | |
Shareholder report expenses | | | 60,494 | |
Trustees’ fees and expenses | | | 11,090 | |
Other fees and expenses | | | 10,565 | |
| | | | |
Total expenses | | | 5,131,478 | |
Less: Fee waivers and/or expense reimbursements | | | (45,390 | ) |
| | | | |
Net expenses | | | 5,086,088 | |
| | | | |
Net investment loss | | | (2,697,609 | ) |
| | | | |
| |
REALIZED AND UNREALIZED GAINS (LOSSES) ON INVESTMENTS | | | | |
| |
Net realized gains (losses) on: | | | | |
Unaffiliated securities | | | 26,835,513 | |
Affiliated securities | | | (3,860 | ) |
| | | | |
Net realized gains on investments | | | 26,831,653 | |
Net change in unrealized gains (losses) on investments | | | (50,404,153 | ) |
| | | | |
Net realized and unrealized gains (losses) on investments | | | (23,572,500 | ) |
| | | | |
Net decrease in net assets resulting from operations | | $ | (26,270,109 | ) |
| | | | |
The accompanying notes are an integral part of these financial statements.
| | | | | | |
| Statement of changes in net assets | | Wells Fargo Omega Growth Fund | | | 15 | |
| | | | | | | | | | | | | | | | |
| | | Six months ended
January 31, 2019
(unaudited) | | | Year ended
July 31, 20181 | |
| | | |
Operations | | | | | | | | | | | | |
Net investment loss | | | | | | $ | (2,697,609 | ) | | | | | | $ | (5,063,493 | ) |
Net realized gains on investments | | | | | | | 26,831,653 | | | | | | | | 102,987,066 | |
Net change in unrealized gains (losses) on investments | | | | | | | (50,404,153 | ) | | | | | | | 85,525,118 | |
| | | | |
Net increase (decrease) in net assets resulting from operations | | | | | | | (26,270,109 | ) | | | | | | | 183,448,691 | |
| | | | |
| | | | |
Distributions to shareholders from net investment income and net realized gains | | | | | | | | | | | | | | | | |
Class A | | | | | | | (68,419,305 | ) | | | | | | | (78,031,973 | ) |
Class C | | | | | | | (8,678,201 | ) | | | | | | | (10,985,719 | ) |
Class R | | | | | | | (707,933 | ) | | | | | | | (974,995 | ) |
Administrator Class | | | | | | | (2,403,661 | ) | | | | | | | (2,304,666 | ) |
Institutional Class | | | | | | | (6,323,228 | ) | | | | | | | (6,956,178 | ) |
| | | | |
Total distributions to shareholders | | | | | | | (86,532,328 | ) | | | | | | | (99,253,531 | ) |
| | | | |
| | | | |
Capital share transactions | | | Shares | | | | | | | | Shares | | | | | |
Proceeds from shares sold | | | | | | | | | | | | | | | | |
Class A | | | 262,117 | | | | 13,012,930 | | | | 362,012 | | | | 18,469,654 | |
Class C | | | 61,850 | | | | 1,907,713 | | | | 55,872 | | | | 2,013,265 | |
Class R | | | 19,279 | | | | 872,696 | | | | 59,297 | | | | 2,898,358 | |
Administrator Class | | | 17,211 | | | | 998,035 | | | | 59,693 | | | | 3,308,304 | |
Institutional Class | | | 125,838 | | | | 7,309,385 | | | | 204,162 | | | | 11,775,351 | |
| | | | |
| | | | |
| | | | | | | 24,100,759 | | | | | | | | 38,464,932 | |
| | | | |
Reinvestment of distributions | | | | | | | | | | | | | | | | |
Class A | | | 1,458,710 | | | | 65,102,208 | | | | 1,554,465 | | | | 74,101,364 | |
Class C | | | 288,212 | | | | 8,392,731 | | | | 318,920 | | | | 10,604,105 | |
Class R | | | 9,582 | | | | 402,155 | | | | 11,375 | | | | 514,829 | |
Administrator Class | | | 44,842 | | | | 2,194,127 | | | | 39,989 | | | | 2,065,019 | |
Institutional Class | | | 123,606 | | | | 6,249,540 | | | | 123,732 | | | | 6,562,759 | |
| | | | |
| | | | |
| | | | | | | 82,340,761 | | | | | | | | 93,848,076 | |
| | | | |
Payment for shares redeemed | | | | | | | | | | | | | | | | |
Class A | | | (839,766 | ) | | | (41,657,646 | ) | | | (1,588,303 | ) | | | (81,411,378 | ) |
Class C | | | (287,332 | ) | | | (9,519,264 | ) | | | (456,893 | ) | | | (16,729,771 | ) |
Class R | | | (32,634 | ) | | | (1,634,137 | ) | | | (59,515 | ) | | | (2,895,636 | ) |
Administrator Class | | | (17,076 | ) | | | (905,325 | ) | | | (66,020 | ) | | | (3,608,448 | ) |
Institutional Class | | | (129,658 | ) | | | (7,264,547 | ) | | | (429,386 | ) | | | (24,161,795 | ) |
| | | | |
| | | | |
| | | | | | | (60,980,919 | ) | | | | | | | (128,807,028 | ) |
| | | | |
Net increase in net assets resulting from capital share transactions | | | | | | | 45,460,601 | | | | | | | | 3,505,980 | |
| | | | |
Total increase (decrease) in net assets | | | | | | | (67,341,836 | ) | | | | | | | 87,701,140 | |
| | | | |
| | |
Net assets | | | | | | | | |
Beginning of period | | | | | | | 821,251,016 | | | | | | | | 733,549,876 | |
| | | | |
End of period | | | | | | $ | 753,909,180 | | | | | | | $ | 821,251,016 | |
| | | | |
| 1 | Effective for all filings after November 4, 2018, the SEC prospectively eliminated the requirement to parenthetically disclose undistributed net investment income at the end of the period and permitted the aggregation of distributions, with the exception of tax basis returns of capital. Accumulated net investment loss at July 31, 2018 was $23,665. The disaggregated distributions information for the year ended July 31, 2018 is included in Note 7,Distributions to Shareholders, in the notes to the financial statements. |
The accompanying notes are an integral part of these financial statements.
| | | | |
| 16 | | Wells Fargo Omega Growth Fund | | Financial highlights |
(For a share outstanding throughout each period)
| | | | | | | | | | | | | | | | | | | | | | | | |
| | | Six months ended
January 31, 2019 (unaudited) | | | Year ended July 31 | |
| CLASS A | | 2018 | | | 2017 | | | 2016 | | | 2015 | | | 2014 | |
Net asset value, beginning of period | | | $54.77 | | | | $49.43 | | | | $42.73 | | | | $48.29 | | | | $49.99 | | | | $47.97 | |
Net investment loss | | | (0.17 | )1 | | | (0.32 | )1 | | | (0.22 | )1 | | | (0.19 | )1 | | | (0.28 | )1 | | | (0.49 | ) |
Net realized and unrealized gains (losses) on investments | | | (1.82 | ) | | | 12.57 | | | | 8.07 | | | | (1.44 | ) | | | 5.12 | | | | 8.28 | |
| | | | | | | | | | | | | | | | | | | | | | | | |
Total from investment operations | | | (1.99 | ) | | | 12.25 | | | | 7.85 | | | | (1.63 | ) | | | 4.84 | | | | 7.79 | |
Distributions to shareholders from | | | | | | | | | | | | | | | | | | | | |
Net realized gains | | | (5.81 | ) | | | (6.91 | ) | | | (1.15 | ) | | | (3.93 | ) | | | (6.54 | ) | | | (5.77 | ) |
Net asset value, end of period | | | $46.97 | | | | $54.77 | | | | $49.43 | | | | $42.73 | | | | $48.29 | | | | $49.99 | |
Total return2 | | | (3.10 | )% | | | 26.86 | % | | | 18.88 | % | | | (3.07 | )% | | | 10.65 | % | | | 16.58 | % |
Ratios to average net assets (annualized) | | | | | | | | | | | | | | | | | | | | |
Gross expenses | | | 1.29 | % | | | 1.28 | % | | | 1.28 | % | | | 1.28 | % | | | 1.32 | % | | | 1.32 | % |
Net expenses | | | 1.29 | % | | | 1.28 | % | | | 1.28 | % | | | 1.28 | % | | | 1.30 | % | | | 1.30 | % |
Net investment loss | | | (0.68 | )% | | | (0.63 | )% | | | (0.50 | )% | | | (0.47 | )% | | | (0.58 | )% | | | (0.84 | )% |
Supplemental data | | | | | | | | | | | | | | | | | | | | | | | | |
Portfolio turnover rate | | | 24 | % | | | 48 | % | | | 76 | % | | | 84 | % | | | 94 | % | | | 101 | % |
Net assets, end of period (000s omitted) | | | $609,741 | | | | $662,751 | | | | $581,967 | | | | $573,304 | | | | $685,005 | | | | $724,071 | |
| 1 | Calculated based upon average shares outstanding |
| 2 | Total return calculations do not include any sales charges. Returns for periods of less than one year are not annualized. |
The accompanying notes are an integral part of these financial statements.
| | | | | | |
| Financial highlights | | Wells Fargo Omega Growth Fund | | | 17 | |
(For a share outstanding throughout each period)
| | | | | | | | | | | | | | | | | | | | | | | | |
| | | Six months ended
January 31, 2019 (unaudited) | | | Year ended July 31 | |
| CLASS C | | 2018 | | | 2017 | | | 2016 | | | 2015 | | | 2014 | |
Net asset value, beginning of period | | | $38.02 | | | | $36.47 | | | | $32.07 | | | | $37.55 | | | | $40.56 | | | | $40.15 | |
Net investment loss | | | (0.25 | )1 | | | (0.50 | )1 | | | (0.41 | )1 | | | (0.39 | )1 | | | (0.51 | )1 | | | (0.65 | )1 |
Net realized and unrealized gains (losses) on investments | | | (1.35 | ) | | | 8.96 | | | | 5.96 | | | | (1.16 | ) | | | 4.04 | | | | 6.83 | |
| | | | | | | | | | | | | | | | | | | | | | | | |
Total from investment operations | | | (1.60 | ) | | | 8.46 | | | | 5.55 | | | | (1.55 | ) | | | 3.53 | | | | 6.18 | |
Distributions to shareholders from | | | | | | | | | | | | | | | | | | | | |
Net realized gains | | | (5.81 | ) | | | (6.91 | ) | | | (1.15 | ) | | | (3.93 | ) | | | (6.54 | ) | | | (5.77 | ) |
Net asset value, end of period | | | $30.61 | | | | $38.02 | | | | $36.47 | | | | $32.07 | | | | $37.55 | | | | $40.56 | |
Total return2 | | | (3.46 | )% | | | 25.88 | % | | | 18.00 | % | | | (3.75 | )% | | | 9.79 | % | | | 15.73 | % |
Ratios to average net assets (annualized) | | | | | | | | | | | | | | | | | | | | |
Gross expenses | | | 2.04 | % | | | 2.03 | % | | | 2.03 | % | | | 2.03 | % | | | 2.07 | % | | | 2.07 | % |
Net expenses | | | 2.04 | % | | | 2.03 | % | | | 2.03 | % | | | 2.03 | % | | | 2.05 | % | | | 2.05 | % |
Net investment loss | | | (1.42 | )% | | | (1.38 | )% | | | (1.24 | )% | | | (1.22 | )% | | | (1.33 | )% | | | (1.59 | )% |
Supplemental data | | | | | | | | | | | | | | | | | | | | | | | | |
Portfolio turnover rate | | | 24 | % | | | 48 | % | | | 76 | % | | | 84 | % | | | 94 | % | | | 101 | % |
Net assets, end of period (000s omitted) | | | $51,886 | | | | $62,074 | | | | $62,543 | | | | $74,337 | | | | $99,100 | | | | $108,073 | |
| 1 | Calculated based upon average shares outstanding |
| 2 | Total return calculations do not include any sales charges. Returns for periods of less than one year are not annualized. |
The accompanying notes are an integral part of these financial statements.
| | | | |
| 18 | | Wells Fargo Omega Growth Fund | | Financial highlights |
(For a share outstanding throughout each period)
| | | | | | | | | | | | | | | | | | | | | | | | |
| | | Six months ended
January 31, 2019 (unaudited) | | | Year ended July 31 | |
| CLASS R | | 2018 | | | 2017 | | | 2016 | | | 2015 | | | 2014 | |
Net asset value, beginning of period | | | $51.92 | | | | $47.30 | | | | $41.04 | | | | $46.66 | | | | $48.62 | | | | $46.90 | |
Net investment loss | | | (0.22 | )1 | | | (0.43 | )1 | | | (0.30 | )1 | | | (0.29 | )1 | | | (0.39 | )1 | | | (0.53 | )1 |
Net realized and unrealized gains (losses) on investments | | | (1.74 | ) | | | 11.96 | | | | 7.71 | | | | (1.40 | ) | | | 4.97 | | | | 8.02 | |
| | | | | | | | | | | | | | | | | | | | | | | | |
Total from investment operations | | | (1.96 | ) | | | 11.53 | | | | 7.41 | | | | (1.69 | ) | | | 4.58 | | | | 7.49 | |
Distributions to shareholders from | | | | | | | | | | | | | | | | | | | | |
Net realized gains | | | (5.81 | ) | | | (6.91 | ) | | | (1.15 | ) | | | (3.93 | ) | | | (6.54 | ) | | | (5.77 | ) |
Net asset value, end of period | | | $44.15 | | | | $51.92 | | | | $47.30 | | | | $41.04 | | | | $46.66 | | | | $48.62 | |
Total return2 | | | (3.19 | )% | | | 26.53 | % | | | 18.58 | % | | | (3.30 | )% | | | 10.38 | % | | | 16.30 | % |
Ratios to average net assets (annualized) | | | | | | | | | | | | | | | | | | | | |
Gross expenses | | | 1.53 | % | | | 1.53 | % | | | 1.53 | % | | | 1.53 | % | | | 1.57 | % | | | 1.57 | % |
Net expenses | | | 1.53 | % | | | 1.53 | % | | | 1.53 | % | | | 1.53 | % | | | 1.55 | % | | | 1.55 | % |
Net investment loss | | | (0.92 | )% | | | (0.88 | )% | | | (0.72 | )% | | | (0.71 | )% | | | (0.83 | )% | | | (1.09 | )% |
Supplemental data | | | | | | | | | | | | | | | | | | | | | | | | |
Portfolio turnover rate | | | 24 | % | | | 48 | % | | | 76 | % | | | 84 | % | | | 94 | % | | | 101 | % |
Net assets, end of period (000s omitted) | | | $6,205 | | | | $7,494 | | | | $6,298 | | | | $10,122 | | | | $17,199 | | | | $20,095 | |
| 1 | Calculated based upon average shares outstanding |
| 2 | Returns for periods of less than one year are not annualized. |
The accompanying notes are an integral part of these financial statements.
| | | | | | |
| Financial highlights | | Wells Fargo Omega Growth Fund | | | 19 | |
(For a share outstanding throughout each period)
| | | | | | | | | | | | | | | | | | | | | | | | |
| | | Six months ended
January 31, 2019 (unaudited) | | | Year ended July 31 | |
| ADMINISTRATOR CLASS | | 2018 | | | 2017 | | | 2016 | | | 2015 | | | 2014 | |
Net asset value, beginning of period | | | $59.39 | | | | $52.99 | | | | $45.65 | | | | $51.20 | | | | $52.50 | | | | $50.00 | |
Net investment loss | | | (0.14 | )1 | | | (0.25 | )1 | | | (0.12 | )1 | | | (0.12 | )1 | | | (0.17 | )1 | | | (0.31 | )1 |
Net realized and unrealized gains (losses) on investments | | | (1.93 | ) | | | 13.56 | | | | 8.61 | | | | (1.50 | ) | | | 5.41 | | | | 8.58 | |
| | | | | | | | | | | | | | | | | | | | | | | | |
Total from investment operations | | | (2.07 | ) | | | 13.31 | | | | 8.49 | | | | (1.62 | ) | | | 5.24 | | | | 8.27 | |
Distributions to shareholders from | | | | | | | | | | | | | | | | | | | | |
Net realized gains | | | (5.81 | ) | | | (6.91 | ) | | | (1.15 | ) | | | (3.93 | ) | | | (6.54 | ) | | | (5.77 | ) |
Net asset value, end of period | | | $51.51 | | | | $59.39 | | | | $52.99 | | | | $45.65 | | | | $51.20 | | | | $52.50 | |
Total return2 | | | (2.99 | )% | | | 27.07 | % | | | 19.08 | % | | | (2.84 | )% | | | 10.91 | % | | | 16.89 | % |
Ratios to average net assets (annualized) | | | | | | | | | | | | | | | | | | | | |
Gross expenses | | | 1.20 | % | | | 1.20 | % | | | 1.20 | % | | | 1.19 | % | | | 1.15 | % | | | 1.15 | % |
Net expenses | | | 1.10 | % | | | 1.10 | % | | | 1.10 | % | | | 1.08 | % | | | 1.05 | % | | | 1.05 | % |
Net investment loss | | | (0.49 | )% | | | (0.45 | )% | | | (0.25 | )% | | | (0.27 | )% | | | (0.33 | )% | | | (0.59 | )% |
Supplemental data | | | | | | | | | | | | | | | | | | | | | | | | |
Portfolio turnover rate | | | 24 | % | | | 48 | % | | | 76 | % | | | 84 | % | | | 94 | % | | | 101 | % |
Net assets, end of period (000s omitted) | | | $23,250 | | | | $24,140 | | | | $19,754 | | | | $38,039 | | | | $86,756 | | | | $115,281 | |
| 1 | Calculated based upon average shares outstanding |
| 2 | Returns for periods of less than one year are not annualized. |
The accompanying notes are an integral part of these financial statements.
| | | | |
| 20 | | Wells Fargo Omega Growth Fund | | Financial highlights |
(For a share outstanding throughout each period)
| | | | | | | | | | | | | | | | | | | | | | | | |
| | | Six months ended
January 31, 2019 (unaudited) | | | Year ended July 31 | |
| INSTITUTIONAL CLASS | | 2018 | | | 2017 | | | 2016 | | | 2015 | | | 2014 | |
Net asset value, beginning of period | | | $61.10 | | | | $54.21 | | | | $46.55 | | | | $52.01 | | | | $53.10 | | | | $50.40 | |
Net investment loss | | | (0.07 | )1 | | | (0.11 | )1 | | | (0.03 | )1 | | | (0.00 | )2 | | | (0.04 | )1 | | | (0.24 | ) |
Net realized and unrealized gains (losses) on investments | | | (1.99 | ) | | | 13.91 | | | | 8.84 | | | | (1.53 | ) | | | 5.49 | | | | 8.71 | |
| | | | | | | | | | | | | | | | | | | | | | | | |
Total from investment operations | | | (2.06 | ) | | | 13.80 | | | | 8.81 | | | | (1.53 | ) | | | 5.45 | | | | 8.47 | |
Distributions to shareholders from | | | | | | | | | | | | | | | | | | | | |
Net realized gains | | | (5.81 | ) | | | (6.91 | ) | | | (1.15 | ) | | | (3.93 | ) | | | (6.54 | ) | | | (5.77 | ) |
Net asset value, end of period | | | $53.23 | | | | $61.10 | | | | $54.21 | | | | $46.55 | | | | $52.01 | | | | $53.10 | |
Total return3 | | | (2.87 | )% | | | 27.39 | % | | | 19.40 | % | | | (2.61 | )% | | | 11.20 | % | | | 17.17 | % |
Ratios to average net assets (annualized) | | | | | | | | | | | | | | | | | | | | |
Gross expenses | | | 0.96 | % | | | 0.95 | % | | | 0.95 | % | | | 0.95 | % | | | 0.90 | % | | | 0.89 | % |
Net expenses | | | 0.85 | % | | | 0.85 | % | | | 0.85 | % | | | 0.83 | % | | | 0.80 | % | | | 0.80 | % |
Net investment loss | | | (0.24 | )% | | | (0.20 | )% | | | (0.06 | )% | | | (0.01 | )% | | | (0.09 | )% | | | (0.36 | )% |
Supplemental data | | | | | | | | | | | | | | | | | | | | | | | | |
Portfolio turnover rate | | | 24 | % | | | 48 | % | | | 76 | % | | | 84 | % | | | 94 | % | | | 101 | % |
Net assets, end of period (000s omitted) | | | $62,827 | | | | $64,792 | | | | $62,987 | | | | $76,980 | | | | $87,085 | | | | $49,960 | |
| 1 | Calculated based upon average shares outstanding |
| 2 | Amount is more than $(0.005). |
| 3 | Returns for periods of less than one year are not annualized. |
The accompanying notes are an integral part of these financial statements.
| | | | | | |
| Notes to financial statements (unaudited) | | Wells Fargo Omega Growth Fund | | | 21 | |
1. ORGANIZATION
Wells Fargo Funds Trust (the “Trust”), a Delaware statutory trust organized on March 10, 1999, is an open-end management investment company registered under the Investment Company Act of 1940, as amended (the “1940 Act”). As an investment company, the Trust follows the accounting and reporting guidance in Financial Accounting Standards Board (“FASB”) Accounting Standards Codification Topic 946, Financial Services – Investment Companies. These financial statements report on the Wells Fargo Omega Growth Fund (the “Fund”) which is a diversified series of the Trust.
2. SIGNIFICANT ACCOUNTING POLICIES
The following significant accounting policies, which are consistently followed in the preparation of the financial statements of the Fund, are in conformity with U.S. generally accepted accounting principles which require management to make estimates and assumptions that affect the reported amounts of assets and liabilities, disclosure of contingent assets and liabilities at the date of the financial statements, and the reported amounts of revenues and expenses during the reporting period. Actual results could differ from those estimates.
Securities valuation
All investments are valued each business day as of the close of regular trading on the New York Stock Exchange (generally 4 p.m. Eastern Time), although the Fund may deviate from this calculation time under unusual or unexpected circumstances.
Equity securities that are listed on a foreign or domestic exchange or market are valued at the official closing price or, if none, the last sales price. If no sale occurs on the principal exchange or market that day, a fair value price will be determined in accordance with the Fund’s Valuation Procedures.
Investments in registered open-end investment companies are valued at net asset value. Interests in non-registered investment companies that are redeemable at net asset value are fair valued normally at net asset value.
Investments which are not valued using any of the methods discussed above are valued at their fair value, as determined in good faith by the Board of Trustees of the Fund. The Board of Trustees has established a Valuation Committee comprised of the Trustees and has delegated to it the authority to take any actions regarding the valuation of portfolio securities that the Valuation Committee deems necessary or appropriate, including determining the fair value of portfolio securities, unless the determination has been delegated to the Wells Fargo Asset Management Pricing Committee at Wells Fargo Funds Management, LLC (“Funds Management”). The Board of Trustees retains the authority to make or ratify any valuation decisions or approve any changes to the Valuation Procedures as it deems appropriate. On a quarterly basis, the Board of Trustees receives reports on any valuation actions taken by the Valuation Committee or the Wells Fargo Asset Management Pricing Committee which may include items for ratification.
Foreign currency translation
The accounting records of the Fund are maintained in U.S. dollars. The values of other assets and liabilities denominated in foreign currencies are translated into U.S. dollars at rates provided by an independent foreign currency pricing source at a time each business day specified by the Wells Fargo Asset Management Pricing Committee. Purchases and sales of securities, and income and expenses are converted at the rate of exchange on the respective dates of such transactions. Net realized foreign exchange gains or losses arise from sales of foreign currencies, currency gains or losses realized between the trade and settlement dates on securities transactions, and the difference between the amounts of dividends, interest and foreign withholding taxes recorded and the U.S. dollar equivalent of the amounts actually paid or received. Net unrealized foreign exchange gains and losses arise from changes in the fair value of assets and liabilities other than investments in securities resulting from changes in exchange rates. The changes in net assets arising from changes in exchange rates of securities and the changes in net assets resulting from changes in market prices of securities are not separately presented. Such changes are included in net realized and unrealized gains or losses from investments.
Securities lending
The Fund may lend its securities from time to time in order to earn additional income in the form of fees or interest on securities received as collateral or the investment of any cash received as collateral. The Fund continues to receive interest or dividends on the securities loaned. The Fund receives collateral in the form of cash or securities with a value at least equal to the value of the securities on loan. The value of the loaned securities is determined at the close of each business day and any additional required collateral is delivered to the Fund on the next business day. In a securities lending transaction, the net asset value of the Fund will be affected by an increase or decrease in the value of the securities loaned and by an increase or decrease in the value of the instrument in which collateral is invested. The amount
| | | | |
| 22 | | Wells Fargo Omega Growth Fund | | Notes to financial statements (unaudited) |
of securities lending activity undertaken by the Fund fluctuates from time to time. In the event of default or bankruptcy by the borrower, the Fund may be prevented from recovering the loaned securities or gaining access to the collateral or may experience delays or costs in doing so. In addition, the investment of any cash collateral received may lose all or part of its value. The Fund has the right under the lending agreement to recover the securities from the borrower on demand.
The Fund lends its securities through an unaffiliated securities lending agent. Cash collateral received in connection with its securities lending transactions is invested in Securities Lending Cash Investments, LLC (the “Securities Lending Fund”). The Securities Lending Fund is exempt from registration under Section 3(c)(7) of the 1940 Act and is managed by Funds Management and is subadvised by Wells Capital Management Incorporated (“WellsCap”), an affiliate of Funds Management and an indirect wholly owned subsidiary of Wells Fargo & Company (“Wells Fargo”). Funds Management receives an advisory fee starting at 0.05% and declining to 0.01% as the average daily net assets of the Securities Lending Fund increase. All of the fees received by Funds Management are paid to WellsCap for its services as subadviser. The Securities Lending Fund seeks to provide a positive return compared to the daily Fed Funds Open Rate by investing in high-quality, U.S. dollar-denominated short-term money market instruments. Securities Lending Fund investments are valued at the evaluated bid price provided by an independent pricing service. Income earned from investment in the Securities Lending Fund (net of fees and rebates), if any, is included in income from affiliated securities on the Statement of Operations.
Security transactions and income recognition
Securities transactions are recorded on a trade date basis. Realized gains or losses are recorded on the basis of identified cost.
Dividend income is recognized on the ex-dividend date. Dividend income from foreign securities is recorded net of foreign taxes withheld where recovery of such taxes is not assured.
Distributions to shareholders
Distributions to shareholders from net investment income and any net realized gains are recorded on the ex-dividend date and paid at least annually. Such distributions are determined in accordance with income tax regulations and may differ from U.S. generally accepted accounting principles. Dividend sources are estimated at the time of declaration. The tax character of distributions is determined as of the Fund’s fiscal year end. Therefore, a portion of the Fund’s distributions made prior to the Fund’s fiscal year end may be categorized as a tax return of capital at year end.
Federal and other taxes
The Fund intends to continue to qualify as a regulated investment company by distributing substantially all of its investment company taxable income and any net realized capital gains (after reduction for capital loss carryforwards) sufficient to relieve it from all, or substantially all, federal income taxes. Accordingly, no provision for federal income taxes was required.
The Fund’s income and federal excise tax returns and all financial records supporting those returns for the prior three fiscal years are subject to examination by the federal and Delaware revenue authorities. Management has analyzed the Fund’s tax positions taken on federal, state, and foreign tax returns for all open tax years and does not believe that there are any uncertain tax positions that require recognition of a tax liability.
As of January 31, 2019, the aggregate cost of all investments for federal income tax purposes was $536,209,336 and the unrealized gains (losses) consisted of:
| | | | |
| |
Gross unrealized gains | | $ | 253,010,536 | |
| |
Gross unrealized losses | | | (12,115,147 | ) |
| |
Net unrealized gains | | $ | 240,895,389 | |
Class allocations
The separate classes of shares offered by the Fund differ principally in applicable sales charges, distribution, shareholder servicing, and administration fees. Class specific expenses are charged directly to that share class. Investment income, common expenses, and realized and unrealized gains (losses) on investments are allocated daily to each class of shares based on the relative proportion of net assets of each class.
3. FAIR VALUATION MEASUREMENTS
Fair value measurements of investments are determined within a framework that has established a fair value hierarchy based upon the various data inputs utilized in determining the value of the Fund’s investments. The three-level hierarchy gives the highest priority to unadjusted quoted prices in active markets for identical assets or liabilities (Level 1) and the
| | | | | | |
| Notes to financial statements (unaudited) | | Wells Fargo Omega Growth Fund | | | 23 | |
lowest priority to unobservable inputs (Level 3). The Fund’s investments are classified within the fair value hierarchy based on the lowest level of input that is significant to the fair value measurement. The inputs are summarized into three broad levels as follows:
| ∎ | | Level 1 – quoted prices in active markets for identical securities |
| ∎ | | Level 2 – other significant observable inputs (including quoted prices for similar securities, interest rates, prepayment speeds, credit risk, etc.) |
| ∎ | | Level 3 – significant unobservable inputs (including the Fund’s own assumptions in determining the fair value of investments) |
The inputs or methodologies used for valuing investments in securities are not necessarily an indication of the risk associated with investing in those securities.
The following is a summary of the inputs used in valuing the Fund’s assets and liabilities as of January 31, 2019:
| | | | | | | | | | | | | | | | |
| | | | |
| | | Quoted prices
(Level 1) | | | Other significant
observable inputs
(Level 2) | | | Significant
unobservable inputs (Level 3) | | | Total | |
| | | | |
Assets | | | | | | | | | | | | | | | | |
Investments in: | | | | | | | | | | | | | | | | |
| | | | |
Common stocks | | | | | | | | | | | | | | | | |
| | | | |
Communication services | | $ | 80,369,825 | | | $ | 0 | | | $ | 0 | | | $ | 80,369,825 | |
| | | | |
Consumer discretionary | | | 140,404,259 | | | | 0 | | | | 0 | | | | 140,404,259 | |
| | | | |
Energy | | | 6,176,688 | | | | 0 | | | | 0 | | | | 6,176,688 | |
| | | | |
Financials | | | 32,780,080 | | | | 0 | | | | 0 | | | | 32,780,080 | |
| | | | |
Health care | | | 115,867,975 | | | | 0 | | | | 0 | | | | 115,867,975 | |
| | | | |
Industrials | | | 81,772,831 | | | | 0 | | | | 0 | | | | 81,772,831 | |
| | | | |
Information technology | | | 264,940,873 | | | | 0 | | | | 0 | | | | 264,940,873 | |
| | | | |
Materials | | | 29,490,395 | | | | 0 | | | | 0 | | | | 29,490,395 | |
| | | | |
Real estate | | | 4,672,768 | | | | 0 | | | | 0 | | | | 4,672,768 | |
| | | | |
Short-term investments | | | | | | | | | | | | | | | | |
| | | | |
Investment companies | | | 8,496,291 | | | | 12,132,740 | | | | 0 | | | | 20,629,031 | |
| | | | |
Total assets | | $ | 764,971,985 | | | $ | 12,132,740 | | | $ | 0 | | | $ | 777,104,725 | |
Additional sector, industry or geographic detail is included in the Portfolio of Investments.
At January 31, 2019, the Fund did not have any transfers into/out of Level 3.
4. TRANSACTIONS WITH AFFILIATES
Management fee
Funds Management, an indirect wholly owned subsidiary of Wells Fargo, is the manager of the Fund and provides advisory and fund-level administrative services under an investment management agreement. Under the investment management agreement, Funds Management is responsible for, among other services, implementing the investment objectives and strategies of the Fund, supervising the subadviser and providing fund-level administrative services in connection with the Fund’s operations. As compensation for its services under the investment management agreement, Funds Management is entitled to receive an annual management fee starting at 0.80% and declining to 0.555% as the average daily net assets of the Fund increase. For the six months ended January 31, 2019, the management fee was equivalent to an annual rate of 0.78% of the Fund’s average daily net assets.
Funds Management has retained the services of a subadviser to provide daily portfolio management to the Fund. The fee for subadvisory services is borne by Funds Management. WellsCap is the subadviser to the Fund and is entitled to receive a fee from Funds Management at an annual rate starting at 0.45% and declining to 0.30% as the average daily net assets of the Fund increase.
| | | | |
| 24 | | Wells Fargo Omega Growth Fund | | Notes to financial statements (unaudited) |
Administration fees
Under a class-level administration agreement, Funds Management provides class-level administrative services to the Fund, which includes paying fees and expenses for services provided by the transfer agent, sub-transfer agents, omnibus account servicers and record-keepers. As compensation for its services under the class-level administration agreement, Funds Management receives an annual fee which is calculated based on the average daily net assets of each class as follows:
| | | | |
| | | Class-level
administration fee | |
| |
Class A, Class C, Class R | | | 0.21 | % |
| |
Administrator Class, Institutional Class | | | 0.13 | |
Funds Management has contractually waived and/or reimbursed management and administration fees to the extent necessary to maintain certain net operating expense ratios for the Fund. When each class of the Fund has exceeded its expense cap, Funds Management has waived fees and/or reimbursed expenses from fund level expenses on a proportionate basis and then from class specific expenses; otherwise, waivers and/or reimbursements are applied against class specific expenses before fund level expenses. Funds Management has committed through November 30, 2019 to waive fees and/or reimburse expenses to the extent necessary to cap the Fund’s expenses at 1.30% for Class A shares, 2.05% for Class C shares, 1.55% for Class R shares, 1.10% for Administrator Class shares, and 0.85% for Institutional Class shares. Prior to or after the commitment expiration date, the cap may be increased or the commitment to maintain the cap may be terminated only with the approval of the Board of Trustees.
Distribution fees
The Trust has adopted a distribution plan for Class C and Class R shares of the Fund pursuant to Rule 12b-1 under the 1940 Act. Distribution fees are charged to Class C and Class R shares and paid to Wells Fargo Funds Distributor, LLC (“Funds Distributor”), the principal underwriter, at an annual rate of 0.75% of the average daily net assets of Class C shares and 0.25% of the average daily net assets of Class R shares.
In addition, Funds Distributor is entitled to receive the front-end sales charge from the purchase of Class A shares and a contingent deferred sales charge on the redemption of certain Class A shares. Funds Distributor is also entitled to receive the contingent deferred sales charges from redemptions of Class C shares. For the six months ended January 31, 2019, Funds Distributor received $7,830 from the sale of Class A shares and $24 in contingent deferred sales charges from redemptions of Class C shares. No contingent deferred sales charges were incurred by Class A shares for the six months ended January 31, 2019.
Shareholder servicing fees
The Trust has entered into contracts with one or more shareholder servicing agents, whereby Class A, Class C, Class R, and Administrator Class of the Fund are charged a fee at an annual rate of 0.25% of the average daily net assets of each respective class.
A portion of these total shareholder servicing fees were paid to affiliates of Wells Fargo.
Interfund transactions
The Fund may purchase or sell portfolio investment securities to certain other Wells Fargo affiliates pursuant toRule 17a-7 under the 1940 Act and under procedures adopted by the Board of Trustees. The procedures have been designed to ensure that these interfund transactions, which do not incur broker commissions, are effected at current market prices.
5. INVESTMENT PORTFOLIO TRANSACTIONS
Purchases and sales of investments, excluding U.S. government obligations (if any) and short-term securities, for the six months ended January 31, 2019 were $184,631,778 and $220,192,633, respectively.
6. BANK BORROWINGS
The Trust (excluding the money market funds), Wells Fargo Master Trust and Wells Fargo Variable Trust are parties to a $280,000,000 revolving credit agreement whereby the Fund is permitted to use bank borrowings for temporary or emergency purposes, such as to fund shareholder redemption requests. Interest under the credit agreement is charged to the Fund based on a borrowing rate equal to the higher of the Federal Funds rate in effect on that day plus 1.25% or the overnight LIBOR rate in effect on that day plus 1.25%. In addition, an annual commitment fee equal to 0.25% of the unused balance is allocated to each participating fund.
| | | | | | |
| Notes to financial statements (unaudited) | | Wells Fargo Omega Growth Fund | | | 25 | |
For the six months ended January 31, 2019, there were no borrowings by the Fund under the agreement.
7. DISTRIBUTIONS TO SHAREHOLDERS
Effective for all filings after November 4, 2018, the Securities and Exchange Commission eliminated the requirement to separately state the components of distributions to shareholders under U.S. generally accepted accounting principles. The amounts of distributions to shareholders for the year ended July 31, 2018 were as follows:
| | | | |
| | | Net realized
gains | |
| |
Class A | | | $78,031,973 | |
| |
Class C | | | 10,985,719 | |
| |
Class R | | | 974,995 | |
| |
Administrator Class | | | 2,304,666 | |
| |
Institutional Class | | | 6,956,178 | |
8. CONCENTRATION RISK
Concentration risk result from exposure to a limited number of sectors. A fund that invests a substantial portion of its assets in any sector may be more affected by changes in that sector than would be a fund whose investments are not heavily weighted in any sector.
9. INDEMNIFICATION
Under the Trust’s organizational documents, the officers and Trustees have been granted certain indemnification rights against certain liabilities that may arise out of performance of their duties to the Trust. Additionally, in the normal course of business, the Trust may enter into contracts with service providers that contain a variety of indemnification clauses. The Trust’s maximum exposure under these arrangements is dependent on future claims that may be made against the Fund and, therefore, cannot be estimated.
10. NEW ACCOUNTING PRONOUNCEMENT
In August 2018, FASB issued Accounting Standards Update (“ASU”) No. 2018-13, Fair Value Measurement (Topic 820)Disclosure Framework—Changes to the Disclosure Requirements for Fair Value Measurement. ASU 2018-13 updates the disclosure requirements for fair value measurements by modifying or removing certain disclosures and adding certain new disclosures. The amendments are effective for fiscal years, and interim periods within those fiscal years, beginning after December 15, 2019. Early adoption is permitted. Management has adopted the removal and modification of disclosures early, as permitted, and will adopt the additional new disclosures at the effective date.
| | | | |
| 26 | | Wells Fargo Omega Growth Fund | | Other information (unaudited) |
PROXY VOTING INFORMATION
A description of the policies and procedures used to determine how to vote proxies relating to portfolio securities is available, upon request, by calling1-800-222-8222, visiting our website at wellsfargofunds.com, or visiting the SEC website at sec.gov. Information regarding how the Fund voted proxies relating to portfolio securities during the most recent 12-month period ended June 30 is available on the Fund’s website atwellsfargofunds.comor by visiting the SEC website at sec.gov.
PORTFOLIO HOLDINGS INFORMATION
The complete portfolio holdings for the Fund are publicly available monthly on the Fund’s website (wellsfargofunds.com), on a one-month delayed basis. In addition, top ten holdings information (excluding derivative positions) for the Fund is publicly available on the Fund’s website on a monthly, seven-day or more delayed basis. The Fund files its complete schedule of portfolio holdings with the SEC for the first and third quarters of each fiscal year on Form N-Q, which is available by visiting the SEC website at sec.gov. In addition, the Fund’s Form N-Q may be reviewed and copied at the SEC’s Public Reference Room in Washington, DC, and at regional offices in New York City, at 233 Broadway, and in Chicago, at 175 West Jackson Boulevard, Suite 900. Information about the Public Reference Room may be obtained by calling 1-800-SEC-0330.
| | | | | | |
| Other information (unaudited) | | Wells Fargo Omega Growth Fund | | | 27 | |
BOARD OF TRUSTEES AND OFFICERS
Each of the Trustees and Officers1 listed in the table below acts in identical capacities for each fund in the Wells Fargo family of funds, which consists of 152 mutual funds comprising the Wells Fargo Funds Trust, Wells Fargo Variable Trust, Wells Fargo Master Trust and four closed-end funds (collectively the “Fund Complex”). This table should be read in conjunction with the Prospectus and the Statement of Additional Information2. The mailing address of each Trustee and Officer is 525 Market Street, 12th Floor, San Francisco, CA 94105. Each Trustee and Officer serves an indefinite term, however, each Trustee serves such term until reaching the mandatory retirement age established by the Trustees.
Independent Trustees
| | | | | | |
Name and
year of birth | | Position held and
length of service* | | Principal occupations during past five years or longer | | Current other
public company or
investment company
directorships |
| | | |
William R. Ebsworth
(Born 1957) | | Trustee, since 2015 | | Retired. From 1984 to 2013, equities analyst, portfolio manager, research director and chief investment officer at Fidelity Management and Research Company in Boston, Tokyo, and Hong Kong, and retired in 2013 as Chief Investment Officer of Fidelity Strategic Advisers, Inc. where he led a team of investment professionals managing client assets. Prior thereto, Board member of Hong Kong Securities Clearing Co., Hong Kong Options Clearing Corp., the Thailand International Fund, Ltd., Fidelity Investments Life Insurance Company, and Empire Fidelity Investments Life Insurance Company. Audit Committee Chair and Investment Committee Chair of the Vincent Memorial Hospital Endowment (non-profit organization). Mr. Ebsworth is a CFA® charterholder. | | N/A |
| | | |
Jane A. Freeman
(Born 1953) | | Trustee, since 2015; Chair Liaison, since 2018 | | Retired. From 2012 to 2014 and 1999 to 2008, Chief Financial Officer of Scientific Learning Corporation. From 2008 to 2012, Ms. Freeman provided consulting services related to strategic business projects. Prior to 1999, Portfolio Manager at Rockefeller & Co. and Scudder, Stevens & Clark. Board member of the Harding Loevner Funds from 1996 to 2014, serving as both Lead Independent Director and chair of the Audit Committee. Board member of the Russell Exchange Traded Funds Trust from 2011 to 2012 and the chair of the Audit Committee. Ms. Freeman is a Board Member of The Ruth Bancroft Garden (non-profit organization). She is also an inactive Chartered Financial Analyst. | | N/A |
| | | |
Isaiah Harris, Jr.3
(Born 1952) | | Trustee, since 2009; Audit Committee Chairman, since 2019 | | Retired. Chairman of the Board of CIGNA Corporation since 2009, and Director since 2005. From 2003 to 2011, Director of Deluxe Corporation. Prior thereto, President and CEO of BellSouth Advertising and Publishing Corp. from 2005 to 2007, President and CEO of BellSouth Enterprises from 2004 to 2005 and President of BellSouth Consumer Services from 2000 to 2003. Emeritus member of the Iowa State University Foundation Board of Governors. Emeritus Member of the Advisory Board of Iowa State University School of Business. Advisory Board Member, Palm Harbor Academy (private school). Advisory Board Member, Child Evangelism Fellowship (non-profit). Mr. Harris is a certified public accountant (inactive status). | | CIGNA Corporation |
| | | |
Judith M. Johnson3
(Born 1949) | | Trustee, since 2008; Audit Committee Chairman, from 2009 to 2018 | | Retired. Prior thereto, Chief Executive Officer and Chief Investment Officer of Minneapolis Employees Retirement Fund from 1996 to 2008. Ms. Johnson is an attorney, certified public accountant and a certified managerial accountant. | | N/A |
| | | |
David F. Larcker
(Born 1950) | | Trustee, since 2009 | | James Irvin Miller Professor of Accounting at the Graduate School of Business, Stanford University, Director of the Corporate Governance Research Initiative and Senior Faculty of The Rock Center for Corporate Governance since 2006. From 2005 to 2008, Professor of Accounting at the Graduate School of Business, Stanford University. Prior thereto, Ernst & Young Professor of Accounting at The Wharton School, University of Pennsylvania from 1985 to 2005. | | N/A |
| | | | |
| 28 | | Wells Fargo Omega Growth Fund | | Other information (unaudited) |
| | | | | | |
Name and
year of birth | | Position held and
length of service* | | Principal occupations during past five years or longer | | Current other
public company or
investment company
directorships |
| | | |
Olivia S. Mitchell
(Born 1953) | | Trustee, since 2006; Nominating and Governance Committee Chairman, since 2018 | | International Foundation of Employee Benefit Plans Professor, Wharton School of the University of Pennsylvania since 1993. Director of Wharton’s Pension Research Council and Boettner Center on Pensions & Retirement Research, and Research Associate at the National Bureau of Economic Research. Previously, Cornell University Professor from 1978 to 1993. | | N/A |
| | | |
Timothy J. Penny
(Born 1951) | | Trustee, since 1996; Chairman, since 2018; Vice Chairman, from 2017 to 2018 | | President and Chief Executive Officer of Southern Minnesota Initiative Foundation, a non-profit organization, since 2007. Member of the Board of Trustees of NorthStar Education Finance, Inc., a non-profit organization, since 2007. | | N/A |
| | | |
James G. Polisson
(Born 1959) | | Trustee, since 2018; Advisory Board Member, from 2017 to 2018 | | Retired. Chief Marketing Officer, Source (ETF) UK Services, Ltd, from 2015 to 2017. From 2012 to 2015, Principal of The Polisson Group, LLC, a management consulting, corporate advisory and principal investing company. Chief Executive Officer and Managing Director at Russell Investments, Global Exchange Traded Funds from 2010 to 2012. Managing Director of Barclays Global Investors from 1998 to 2010 and Global Chief Marketing Officer for iShares and Barclays Global Investors from 2000 to 2010. Trustee of the San Francisco Mechanics’ Institute, a non-profit organization, from 2013 to 2015. Board member of the Russell Exchange Traded Fund Trust from 2011 to 2012. Director of Barclays Global Investors Holdings Deutschland GmbH from 2006 to 2009. Mr. Polisson is an attorney and has a retired status with the Massachusetts and District of Columbia Bar Associations. | | N/A |
| | | |
Pamela Wheelock
(Born 1959) | | Trustee, since 2018; Advisory Board Member, from 2017 to 2018 | | Board member of the Destination Medical Center Economic Development Agency, Rochester, Minnesota since 2019. Chief Operating Officer, Twin Cities Habitat for Humanity from 2017 to 2019. Vice President of University Services, University of Minnesota from 2012 to 2016. Prior thereto, on the Board of Directors, Governance Committee and Finance Committee for the Minnesota Philanthropy Partners (Saint Paul Foundation) from 2012 to 2018, Interim Chief Executive Officer of Blue Cross Blue Shield of Minnesota from 2011 to 2012, Chairman of the Board from 2009 to 2012 and Board Director from 2003 to 2015. Vice President, Leadership and Community Engagement, Bush Foundation, Saint Paul, Minnesota (a private foundation) from 2009 to 2011. Executive Vice President and Chief Financial Officer, Minnesota Sports and Entertainment from 2004 to 2009 and Senior Vice President from 2002 to 2004. Executive Vice President of the Minnesota Wild Foundation from 2004 to 2008. Commissioner of Finance, State of Minnesota, from 1999 to 2002. Currently Board Chair of the Minnesota Wild Foundation since 2010. | | N/A |
| * | Length of service dates reflect the Trustee’s commencement of service with the Trust’s predecessor entities, where applicable. |
| | | | | | |
| Other information (unaudited) | | Wells Fargo Omega Growth Fund | | | 29 | |
Officers
| | | | | | |
Name and
year of birth | | Position held and
length of service | | Principal occupations during past five years or longer | | |
| | | |
Andrew Owen
(Born 1960) | | President, since 2017 | | Executive Vice President of Wells Fargo & Company and Head of Affiliated Managers, Wells Fargo Asset Management, since 2014. In addition, Mr. Owen is currently President, Chief Executive Officer and Director of Wells Fargo Funds Management, LLC since 2017. Prior thereto, Executive Vice President responsible for marketing, investments and product development for Wells Fargo Funds Management, LLC, from 2009 to 2014. | | |
| | | |
Jeremy DePalma1
(Born 1974) | | Treasurer, since 2012 | | Senior Vice President of Wells Fargo Funds Management, LLC since 2009. Senior Vice President of Evergreen Investment Management Company, LLC from 2008 to 2010 and head of the Fund Reporting and Control Team within Fund Administration from 2005 to 2010. | | |
| | | |
Alexander Kymn
(Born 1973) | | Secretary, since 2018; Chief Legal Officer, since 2018 | | Senior Company Counsel of Wells Fargo Bank, N.A. since 2018 (previously Senior Counsel from 2007 to 2018). Vice President of Wells Fargo Funds Management, LLC from 2008 to 2014. | | |
| | | |
Michael H. Whitaker
(Born 1967) | | Chief Compliance Officer, since 2016 | | Senior Vice President and Chief Compliance Officer since 2016. Senior Vice President and Chief Compliance Officer for Fidelity Investments from 2007 to 2016. | | |
| | | |
David Berardi
(Born 1975) | | Assistant Treasurer, since 2009 | | Vice President of Wells Fargo Funds Management, LLC since 2009. Vice President of Evergreen Investment Management Company, LLC from 2008 to 2010. Manager of Fund Reporting and Control for Evergreen Investment Management Company, LLC from 2004 to 2010. | | |
| 1 | Jeremy DePalma acts as Treasurer of 76 funds and Assistant Treasurer of 76 funds in the Fund Complex. |
| 2 | The Statement of Additional Information includes additional information about the Trustees and is available, without charge, upon request, by calling1-800-260-5969 or by visiting the website atwellsfargofunds.com. |
| 3 | Mr. Harris became Chairman of the Audit Committee effective January 1, 2019. |
| | | | |
| 30 | | Wells Fargo Omega Growth Fund | | Appendix A (unaudited) |
SALES CHARGE REDUCTIONS AND WAIVERS FOR CERTAIN INTERMEDIARIES
Raymond James & Associates, Inc., Raymond James Financial Services & Raymond James affiliates (“Raymond James”)
Effective on or about March 1, 2019, shareholders purchasing Fund shares through a Raymond James platform or account will be eligible only for the following load waivers (front-end sales charge waivers and contingent deferred, or back-end, sales charge waivers) and discounts, which may differ from those disclosed elsewhere in the Fund’s Prospectus or SAI.
Front-end Sales Load Waivers on Class A shares Available at Raymond James
| | • | | Shares purchased in an investment advisory program. |
| | • | | Shares purchased through reinvestment of capital gains distributions and dividend reinvestment when purchasing shares of the same fund (but not any other fund within the fund family). |
| | • | | Employees and registered representatives of Raymond James or its affiliates and their family members as designated by Raymond James. |
| | • | | Shares purchased from the proceeds of redemptions within the same fund family, provided (1) the repurchase occurs within 90 days following the redemption, (2) the redemption and purchase occur in the same account, and (3) redeemed shares were subject to a front-end or deferred sales load (known as Rights of Reinstatement). |
| | • | | A shareholder in the fund’s Class C shares will have their shares automatically exchanged at net asset value to Class A shares (or the appropriate share class) of the fund if the shares are no longer subject to a CDSC and the exchange is in line with the policies and procedures of Raymond James. |
CDSC Waivers on Class A and C Shares Available at Raymond James
| | • | | Death or disability of the shareholder. |
| | • | | Shares sold as part of a systematic withdrawal plan as described in the Fund’s Prospectus. |
| | • | | Return of excess contributions from an IRA Account. |
| | • | | Shares sold as part of a required minimum distribution for IRA and retirement accounts due to the shareholder reaching age 70½ as described in the Fund’s prospectus. |
| | • | | Shares sold to pay Raymond James fees but only if the transaction is initiated by Raymond James. |
| | • | | Shares acquired through a right of reinstatement. |
Front-end Load Discounts Available at Raymond James: Breakpoints, and/or Rights of Accumulation
| | • | | Breakpoints as described in the Fund’s Prospectus. |
| | • | | Rights of accumulation which entitle shareholders to breakpoint discounts will be automatically calculated based on the aggregated holding of fund family assets held by accounts within the purchaser’s household at Raymond James. Eligible fund family assets not held at Raymond James may be included in the rights of accumulation calculation only if the shareholder notifies his or her financial advisor about such assets. |
This page is intentionally left blank.
This page is intentionally left blank.

For more information
More information about Wells Fargo Funds is available free upon request. To obtain literature, please write, visit the Fund’s website, or call:
Wells Fargo Funds
P.O. Box 219967
Kansas City, MO 64121-9967
Website: wellsfargofunds.com
Individual investors: 1-800-222-8222
Retail investment professionals: 1-888-877-9275
Institutional investment professionals:1-866-765-0778
This report and the financial statements contained herein are submitted for the general information of the shareholders of the Fund. If this report is used for promotional purposes, distribution of the report must be accompanied or preceded by a current prospectus. Before investing, please consider the investment objectives, risks, charges, and expenses of the investment. For a current prospectus and, if available, a summary prospectus, containing this information, call1-800-222-8222 or visit the Fund’s website atwellsfargofunds.com. Read the prospectus carefully before you invest or send money.
Wells Fargo Asset Management (WFAM) is the trade name for certain investment advisory/management firms owned by Wells Fargo & Company. These firms include but are not limited to Wells Capital Management Incorporated and Wells Fargo Funds Management, LLC. Certain products managed by WFAM entities are distributed by Wells Fargo Funds Distributor, LLC (a broker/dealer and Member FINRA).
This material is for general informational and educational purposes only and is NOT intended to provide investment advice or a recommendation of any kind—including a recommendation for any specific investment, strategy, or plan.
INVESTMENT PRODUCTS: NOT FDIC INSURED ◾ NO BANK GUARANTEE ◾ MAY LOSE VALUE
© 2019 Wells Fargo Funds Management, LLC. All rights reserved.
| | |
 | | 320777 03-19 SA211/SAR211 01-19 |
Semi-Annual Report
January 31, 2019

Wells Fargo
Premier Large Company Growth Fund

Beginning on January 1, 2021, as permitted by new regulations adopted by the Securities and Exchange Commission, paper copies of the Wells Fargo Funds’ annual and semi-annual shareholder reports issued after this date will no longer be sent by mail, unless you specifically request paper copies of the reports. Instead, the reports will be made available on the Funds’ website, and you will be notified by mail each time a report is posted and provided with a website address to access the report.
If you already elected to receive shareholder reports electronically, you will not be affected by this change and you need not take any action. You may elect to receive shareholder reports and other communications from the Fund electronically at any time by contacting your financial intermediary (such as a broker-dealer or bank) or, if you are a direct investor, by calling 1-800-222-8222 or by enrolling at wellsfargo.com/advantagedelivery.
You may elect to receive all future reports in paper free of charge. If you invest through a financial intermediary, you can contact your financial intermediary to request that you continue to receive paper copies of your shareholder reports; if you invest directly with the Fund, you can call 1-800-222-8222. Your election to receive reports in paper will apply to all Wells Fargo Funds held in your account with your financial intermediary or, if you are a direct investor, to all Wells Fargo Funds that you hold.

Reduce clutter. Save trees.
Sign up for electronic delivery of prospectuses and shareholder reports atwellsfargo.com/advantagedelivery
Contents
The views expressed and any forward-looking statements are as of January 31, 2019, unless otherwise noted, and are those of the Fund managers and/or Wells Fargo Funds Management, LLC. Discussions of individual securities, or the markets generally, or any Wells Fargo Fund are not intended as individual recommendations. Future events or results may vary significantly from those expressed in any forward-looking statements. The views expressed are subject to change at any time in response to changing circumstances in the market. Wells Fargo Funds Management, LLC and the Fund disclaim any obligation to publicly update or revise any views expressed or forward-looking statements.
INVESTMENT PRODUCTS: NOT FDIC INSURED ◾ NO BANK GUARANTEE ◾ MAY LOSE VALUE
| | | | |
| 2 | | Wells Fargo Premier Large Company Growth Fund | | Letter to shareholders (unaudited) |

Andrew Owen
President
Wells Fargo Funds
Favorable third-quarter economic indicators and corporate earnings reports encouraged domestic stock investors.
Dear Shareholder:
We are pleased to offer you this semi-annual report for the Wells Fargo Premier Large Company Growth Fund for thesix-month period that ended January 31, 2019. Higher short-term interest rates, inflation concerns, trade tensions, slowing economic growth outside the U.S., and geopolitical events contributed to investment market volatility throughout the period.
For the period, U.S. stocks, as measured by the S&P 500 Index,1 fell 3.00% and international stocks, as measured by the MSCI ACWI ex USA Index (Net),2 declined 6.34%. Based on the MSCI EM Index (Net),3 emerging market stocks lost 2.60%. For bond investors, the Bloomberg Barclays U.S. Aggregate Bond Index4 added 2.71% while the Bloomberg Barclays Global Aggregateex-USD Index5 gained 1.37%. The Bloomberg Barclays Municipal Bond Index6 added 2.05%, and the ICE BofAML U.S. High Yield Index7 gained 1.02%.
Investors appeared to shake off lingering concerns during the third quarter.
Favorable third-quarter economic indicators and corporate earnings reports encouraged domestic stock investors. U.S. trade negotiations with Mexico and Canada made progress. The Conference Board Consumer Confidence Index®8 reached its highest level in 18 years during September. Several U.S. equity market indices reached records during August. The U.S. Federal Reserve (Fed) raised the federal funds rate by 25 basis points (bps; 100 bps equal 1.00%) to a target range of between 2.00% and 2.25% in September 2018. For the quarter that ended September 30, the S&P 500 Index added 7.71%.
Investors in international markets were not as reassured. Tensions between the U.S. and China increased when the U.S. imposed an additional $200 billion in tariffs on Chinese goods. China responded with $60 billion in tariffs on U.S. products. In addition, economic growth in China drew renewed concerns. The Bank of England, having raised its monetary policy rate to 0.50% in November 2017, increased the rate again in August 2018 to 0.75%. During the three-month period that ended September 30, 2018, the MSCI ACWI ex USA Index (Net) gained 0.71% while the MSCI EM Index (Net) declined 1.09%.
| 1 | The S&P 500 Index consists of 500 stocks chosen for market size, liquidity, and industry group representation. It is a market-value-weighted index with each stock’s weight in the index proportionate to its market value. You cannot invest directly in an index. |
| 2 | The Morgan Stanley Capital International (MSCI) All Country World Index (ACWI) ex USA Index (Net) is a free-float-adjusted market-capitalization-weighted index that is designed to measure the equity market performance of developed markets, excluding the United States and Canada. Source: MSCI. MSCI makes no express or implied warranties or representations and shall have no liability whatsoever with respect to any MSCI data contained herein. The MSCI data may not be further redistributed or used as a basis for other indices or any securities or financial products. This report is not approved, reviewed, or produced by MSCI. You cannot invest directly in an index. |
| 3 | The MSCI Emerging Markets (EM) Index (Net) is a free-float-adjusted market-capitalization-weighted index that is designed to measure large- andmid-cap equity market performance of emerging markets. The MSCI EM Index (Net) consists of the following 24 emerging market country indices: Brazil, Chile, China, Colombia, Czech Republic, Egypt, Greece, Hungary, India, Indonesia, Korea, Malaysia, Mexico, Pakistan, Peru, the Philippines, Poland, Qatar, Russia, South Africa, Taiwan, Thailand, Turkey, and the United Arab Emirates. You cannot invest directly in an index. |
| 4 | The Bloomberg Barclays U.S. Aggregate Bond Index is a broad-based benchmark that measures the investment-grade, U.S. dollar-denominated, fixed-rate taxable bond market, including Treasuries, government-related and corporate securities, mortgage-backed securities (agency fixed-rate and hybrid adjustable-rate mortgage pass-throughs), asset-backed securities, and commercial mortgage-backed securities. You cannot invest directly in an index. |
| 5 | The Bloomberg Barclays Global Aggregateex-USD Index is an unmanaged index that provides a broad-based measure of the global investment-grade fixed-income markets excluding the U.S. dollar-denominated debt market. You cannot invest directly in an index. |
| 6 | The Bloomberg Barclays Municipal Bond Index is an unmanaged index composed of long-termtax-exempt bonds with a minimum credit rating of Baa. You cannot invest directly in an index. |
| 7 | The ICE BofAML U.S. High Yield Index is a market-capitalization-weighted index of domestic and Yankee high-yield bonds. The index tracks the performance of high-yield securities traded in the U.S. bond market. You cannot invest directly in an index. Copyright 2019. ICE Data Indices, LLC. All rights reserved. |
| 8 | The Conference Board Consumer Confidence Index® measures the degree of optimism on the state of the U.S. economy that consumers are expressing through their activities of savings and spending. You cannot invest directly in an index. |
| | | | | | |
| Letter to shareholders (unaudited) | | Wells Fargo Premier Large Company Growth Fund | | | 3 | |
In bond markets, U.S. bonds, as measured by the Bloomberg Barclays U.S. Aggregate Bond Index, were flat. The Bloomberg Barclays Global Aggregateex-USD Index fell 1.74% during the quarter that ended September 30, 2018.
Conflicting data unsettled markets during the fourth quarter.
Negative stock market performance during October and December bracketed a mildly positive November for the S&P 500 Index and the MSCI ACWI ex USA Index (Net). As interest rates and bond yields gained during October, stock markets struggled. December’s S&P 500 Index performance was the worst since 1931. Globally, fixed-income investments fared better than stocks during the last two months of the year.
November’s U.S. midterm elections shifted control of the House of Representatives from Republicans to Democrats, presaging potential partisan disputes. The Bureau of Economic Analysis reported that third-quarter U.S. gross domestic product (GDP) grew at an annualized 3.4% rate, lower than second-quarter GDP growth. Brexit efforts stalled in the U.K. ahead of the March 2019 deadline. The People’s Bank of China cut reserve requirement ratios and accelerated infrastructure spending and tax cuts, and the value of the yuan declined to low levels last seen in 2008. Oil prices fell.
After the Fed increased the federal funds rate by 25 bps to a target range of between 2.25% and 2.50% in December 2018—the ninth such increase since the Fed began raising rates three years ago from near zero—it softened its outlook for further interest rate increases in 2019.
The market climbs a wall of worry.
Investors entered 2019 with reasons to be concerned. A partial U.S. government shutdown driven by partisan disputes over spending and immigration policies extended into January. Globally, economic signals were uneven. Investors expected high levels of stock market volatility to continue, as measured by the VIX9.
January’s returns tended to support the investing adage that the market climbs a wall of worry. The S&P 500 Index gained 8.01% for the month that ended January 31, 2019, its best monthly performance in 30 years. Returns for the MSCI ACWI ex USA Index (Net), the Bloomberg Barclays U.S. Aggregate Bond Index, and the Bloomberg Barclays Global Aggregateex-USD Index also were positive.
Don’t let short-term uncertainty derail long-term investment goals.
Periods of investment uncertainty can present challenges, but experience has taught us that maintaining long-term investment goals can be an effective way to plan for the future. To help you create a sound strategy based on your personal goals and risk tolerance, Wells Fargo Funds offers more than 100 mutual funds spanning a wide range of asset classes and investment styles. Although diversification cannot guarantee an investment profit or prevent losses, we believe it can be an effective way to manage investment risk and potentially smooth out overall portfolio performance. We encourage investors to know their investments and to understand that appropriate levels of risk-taking may unlock opportunities.
January’s returns tended to support the investing adage that the market climbs a wall of worry.
| 9 | The Chicago Board Options Exchange Market Volatility Index (VIX) is a popular measure of the implied volatility of S&P 500 Index options. It represents one measure of the market’s expectation of stock market volatility over the next30-day period. You cannot invest directly in an index. |
| | | | |
| 4 | | Wells Fargo Premier Large Company Growth Fund | | Letter to shareholders (unaudited) |
Thank you for choosing to invest with Wells Fargo Funds. We appreciate your confidence in us and remain committed to helping you meet your financial needs.
Sincerely,

Andrew Owen
President
Wells Fargo Funds
For further information about your Fund, contact your investment professional, visit our website atwellsfargofunds.com, or call us directly at1-800-222-8222.
This page is intentionally left blank.
| | | | |
| 6 | | Wells Fargo Premier Large Company Growth Fund | | Performance highlights (unaudited) |
Investment objective
The Fund seeks long-term capital appreciation.
Manager
Wells Fargo Funds Management, LLC
Subadviser
Wells Capital Management Incorporated
Portfolio managers
Joseph M. Eberhardy, CFA®‡, CPA
Bob Gruendyke, CFA®‡
Thomas C. Ognar, CFA®‡
Average annual total returns (%) as of January 31, 20191
| | | | | | | | | | | | | | | | | | | | | | | | | | | | | | | | | | |
| | | | | Including sales charge | | | Excluding sales charge | | | Expense ratios2 (%) | |
| | | Inception date | | 1 year | | | 5 year | | | 10 year | | | 1 year | | | 5 year | | | 10 year | | | Gross | | | Net3 | |
| | | | | | | | | |
| Class A (EKJAX) | | 1-20-1998 | | | -3.87 | | | | 8.94 | | | | 15.06 | | | | 2.01 | | | | 10.23 | | | | 15.73 | | | | 1.15 | | | | 1.11 | |
| | | | | | | | | |
| Class C (EKJCX) | | 1-22-1998 | | | 0.30 | | | | 9.42 | | | | 14.87 | | | | 1.30 | | | | 9.42 | | | | 14.87 | | | | 1.90 | | | | 1.86 | |
| | | | | | | | | |
| Class R4 (EKJRX)4 | | 11-30-2012 | | | – | | | | – | | | | – | | | | 2.34 | | | | 10.57 | | | | 16.10 | | | | 0.87 | | | | 0.80 | |
| | | | | | | | | |
| Class R6 (EKJFX)5 | | 11-30-2012 | | | – | | | | – | | | | – | | | | 2.45 | | | | 10.75 | | | | 16.20 | | | | 0.72 | | | | 0.65 | |
| | | | | | | | | |
| Administrator Class (WFPDX)6 | | 7-16-2010 | | | – | | | | – | | | | – | | | | 2.11 | | | | 10.38 | | | | 15.88 | | | | 1.07 | | | | 1.00 | |
| | | | | | | | | |
| Institutional Class (EKJYX) | | 6-30-1999 | | | – | | | | – | | | | – | | | | 2.39 | | | | 10.69 | | | | 16.17 | | | | 0.82 | | | | 0.70 | |
| | | | | | | | | |
| Russell 1000® Growth Index7 | | – | | | – | | | | – | | | | – | | | | 0.24 | | | | 12.97 | | | | 16.86 | | | | – | | | | – | |
Figures quoted represent past performance, which is no guarantee of future results, and do not reflect taxes that a shareholder may pay on fund distributions or the redemption of fund shares. Investment return and principal value of an investment will fluctuate so that an investor’s shares, when redeemed, may be worth more or less than their original cost. Performance shown without sales charges would be lower if sales charges were reflected. Current performance may be lower or higher than the performance data quoted, which assumes the reinvestment of dividends and capital gains. Currentmonth-end performance is available on the Fund’s website, wellsfargofunds.com.
Index returns do not include transaction costs associated with buying and selling securities, any mutual fund fees or expenses, or any taxes. It is not possible to invest directly in an index.
For Class A shares, the maximumfront-end sales charge is 5.75%. For Class C shares, the maximum contingent deferred sales charge is 1.00%. Performance including a contingent deferred sales charge assumes the sales charge for the corresponding time period. Class R4, Class R6, Administrator Class, and Institutional Class shares are sold without afront-end sales charge or contingent deferred sales charge.
Stock values fluctuate in response to the activities of individual companies and general market and economic conditions. Certain investment strategies tend to increase the total risk of an investment (relative to the broader market). The Fund is exposed to foreign investment risk. Consult the Fund’s prospectus for additional information on these and other risks.
Please see footnotes on page 7.
| | | | | | |
| Performance highlights (unaudited) | | Wells Fargo Premier Large Company Growth Fund | | | 7 | |
| | | | |
| Ten largest holdings (%) as of January 31, 20198 | |
| |
Amazon.com Incorporated | | | 7.53 | |
| |
Alphabet Incorporated Class A | | | 6.40 | |
| |
Microsoft Corporation | | | 4.48 | |
| |
Visa Incorporated Class A | | | 3.79 | |
| |
MasterCard Incorporated Class A | | | 3.55 | |
| |
Microchip Technology Incorporated | | | 2.89 | |
| |
PayPal Holdings Incorporated | | | 2.88 | |
| |
The Boeing Company | | | 2.35 | |
| |
Texas Instruments Incorporated | | | 2.06 | |
| |
Union Pacific Corporation | | | 2.00 | |
| | |
| Sector distribution as of January 31, 20199 |
|
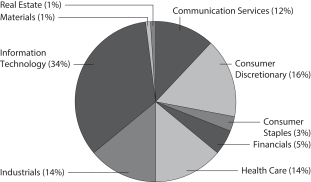
|
| ‡ | CFA® and Chartered Financial Analyst® are trademarks owned by CFA Institute. |
| 1 | Historical performance shown for all classes of the Fund prior to July 19, 2010, is based on the performance of the Fund’s predecessor, Evergreen Large Company Growth Fund. |
| 2 | Reflects the expense ratios as stated in the most recent prospectuses. The expense ratios shown are subject to change and may differ from the annualized expense ratios shown in the financial highlights of this report. |
| 3 | The manager has contractually committed through November 30, 2019, to waive fees and/or reimburse expenses to the extent necessary to cap the expenses of each class after fee waivers at the amounts shown. Brokerage commissions, stamp duty fees, interest, taxes, acquired fund fees and expenses (if any), and extraordinary expenses are excluded from the expense cap. Prior to or after the commitment expiration date, the cap may be increased or the commitment to maintain the cap may be terminated only with the approval of the Board of Trustees. Without this cap, the Fund’s returns would have been lower. The expense ratio paid by an investor is the net expense ratio (the total annual fund operating expenses after fee waivers) as stated in the prospectuses. |
| 4 | Historical performance shown for Class R4 shares prior to their inception reflects the performance of Institutional Class shares, adjusted to reflect the higher expenses applicable to Class R4 shares. |
| 5 | Historical performance shown for Class R6 shares prior to their inception reflects the performance of Institutional Class shares and includes the higher expenses applicable to Institutional Class shares. If these expenses had not been included, returns for Class R6 shares would be higher. |
| 6 | Historical performance shown for Administrator Class shares prior to their inception reflects the performance of Institutional Class shares, adjusted to reflect the higher expenses applicable to Administrator Class shares. |
| 7 | The Russell 1000® Growth Index measures the performance of those Russell 1000 companies with higher price/book ratios and higher forecasted growth values. You cannot invest directly in an index. |
| 8 | The ten largest holdings, excluding cash, cash equivalents and any money market funds, are calculated based on the value of the investments divided by total net assets of the Fund. Holdings are subject to change and may have changed since the date specified. |
| 9 | Amounts are calculated based on the total long-term investments of the Fund. These amounts are subject to change and may have changed since the date specified. |
| | | | |
| 8 | | Wells Fargo Premier Large Company Growth Fund | | Fund expenses (unaudited) |
As a shareholder of the Fund, you incur two types of costs: (1) transaction costs, including sales charges (loads) on purchase payments and contingent deferred sales charges (if any) on redemptions and (2) ongoing costs, including management fees, distribution(12b-1) and/or shareholder servicing fees, and other Fund expenses. This example is intended to help you understand your ongoing costs (in dollars) of investing in the Fund and to compare these costs with the ongoing costs of investing in other mutual funds.
The example is based on an investment of $1,000 invested at the beginning of thesix-month period and held for the entire period from August 1, 2018 to January 31, 2019.
Actual expenses
The “Actual” line of the table below provides information about actual account values and actual expenses. You may use the information in this line, together with the amount you invested, to estimate the expenses that you paid over the period. Simply divide your account value by $1,000 (for example, an $8,600 account value divided by $1,000 = 8.6), then multiply the result by the number in the “Actual” line under the heading entitled “Expenses paid during period” for your applicable class of shares to estimate the expenses you paid on your account during this period.
Hypothetical example for comparison purposes
The “Hypothetical” line of the table below provides information about hypothetical account values and hypothetical expenses based on the Fund’s actual expense ratio and an assumed rate of return of 5% per year before expenses, which is not the Fund’s actual return. The hypothetical account values and expenses may not be used to estimate the actual ending account balance or expenses you paid for the period. You may use this information to compare the ongoing costs of investing in the Fund and other funds. To do so, compare this 5% hypothetical example with the 5% hypothetical examples that appear in the shareholder reports of the other funds.
Please note that the expenses shown in the table are meant to highlight your ongoing costs only and do not reflect any transactional costs, such as sales charges (loads) and contingent deferred sales charges. Therefore, the “Hypothetical” line of the table is useful in comparing ongoing costs only and will not help you determine the relative total costs of owning different funds. In addition, if these transactional costs were included, your costs would have been higher.
| | | | | | | | | | | | | | | | |
| | | Beginning
account value
8-1-2018 | | | Ending
account value
1-31-2019 | | | Expenses
paid during
the period¹ | | | Annualized net
expense ratio | |
Class A | | | | | | | | | | | | | | | | |
| | | | |
Actual | | $ | 1,000.00 | | | $ | 972.10 | | | $ | 5.52 | | | | 1.11 | % |
| | | | |
Hypothetical (5% return before expenses) | | $ | 1,000.00 | | | $ | 1,019.61 | | | $ | 5.65 | | | | 1.11 | % |
Class C | | | | | | | | | | | | | | | | |
| | | | |
Actual | | $ | 1,000.00 | | | $ | 968.62 | | | $ | 9.23 | | | | 1.86 | % |
| | | | |
Hypothetical (5% return before expenses) | | $ | 1,000.00 | | | $ | 1,015.83 | | | $ | 9.45 | | | | 1.86 | % |
Class R4 | | | | | | | | | | | | | | | | |
| | | | |
Actual | | $ | 1,000.00 | | | $ | 973.19 | | | $ | 3.98 | | | | 0.80 | % |
| | | | |
Hypothetical (5% return before expenses) | | $ | 1,000.00 | | | $ | 1,021.17 | | | $ | 4.08 | | | | 0.80 | % |
Class R6 | | | | | | | | | | | | | | | | |
| | | | |
Actual | | $ | 1,000.00 | | | $ | 973.51 | | | $ | 3.23 | | | | 0.65 | % |
| | | | |
Hypothetical (5% return before expenses) | | $ | 1,000.00 | | | $ | 1,021.93 | | | $ | 3.31 | | | | 0.65 | % |
Administrator Class | | | | | | | | | | | | | | | | |
| | | | |
Actual | | $ | 1,000.00 | | | $ | 972.53 | | | $ | 4.97 | | | | 1.00 | % |
| | | | |
Hypothetical (5% return before expenses) | | $ | 1,000.00 | | | $ | 1,020.16 | | | $ | 5.09 | | | | 1.00 | % |
Institutional Class | | | | | | | | | | | | | | | | |
| | | | |
Actual | | $ | 1,000.00 | | | $ | 973.46 | | | $ | 3.48 | | | | 0.70 | % |
| | | | |
Hypothetical (5% return before expenses) | | $ | 1,000.00 | | | $ | 1,021.68 | | | $ | 3.57 | | | | 0.70 | % |
| 1 | Expenses paid is equal to the annualized net expense ratio of each class multiplied by the average account value over the period, multiplied by the number of days in the most recent fiscal half-year divided by the number of days in the fiscal year (to reflect theone-half-year period). |
| | | | | | |
| Portfolio of investments—January 31, 2019 (unaudited) | | Wells Fargo Premier Large Company Growth Fund | | | 9 | |
| | | | | | | | | | | | | | | | |
| Security name | | | | | | | | Shares | | | Value | |
|
Common Stocks: 99.71% | |
|
Communication Services: 11.84% | |
|
| Entertainment: 2.95% | |
| | | | |
Activision Blizzard Incorporated | | | | | | | | | | | 115,930 | | | $ | 5,476,533 | |
| | | | |
Live Nation Incorporated † | | | | | | | | | | | 346,790 | | | | 18,556,733 | |
| | | | |
Netflix Incorporated † | | | | | | | | | | | 63,800 | | | | 21,660,100 | |
| | | | |
Take-Two Interactive Software Incorporated † | | | | | | | | | | | 191,260 | | | | 20,187,493 | |
| | | | |
| | | | | | | | | | | | | | | 65,880,859 | |
| | | | | | | | | | | | | | | | |
|
| Interactive Media & Services: 8.89% | |
| | | | |
Alphabet Incorporated Class A † | | | | | | | | | | | 126,850 | | | | 142,819,147 | |
| | | | |
Alphabet Incorporated Class C † | | | | | | | | | | | 19,348 | | | | 21,599,527 | |
| | | | |
Facebook Incorporated Class A † | | | | | | | | | | | 114,010 | | | | 19,004,327 | |
| | | | |
Match Group Incorporated « | | | | | | | | | | | 277,300 | | | | 14,832,777 | |
| | | | |
| | | | | | | | | | | | | | | 198,255,778 | |
| | | | | | | | | | | | | | | | |
|
Consumer Discretionary: 15.46% | |
|
| Hotels, Restaurants & Leisure: 2.31% | |
| | | | |
Planet Fitness Incorporated Class A † | | | | | | | | | | | 355,230 | | | | 20,574,922 | |
| | | | |
Royal Caribbean Cruises Limited | | | | | | | | | | | 247,980 | | | | 29,769,999 | |
| | | | |
Vail Resorts Incorporated | | | | | | | | | | | 5,870 | | | | 1,105,086 | |
| | | | |
| | | | | | | | | | | | | | | 51,450,007 | |
| | | | | | | | | | | | | | | | |
|
| Household Durables: 0.61% | |
| | | | |
Roku Incorporated †« | | | | | | | | | | | 304,870 | | | | 13,703,907 | |
| | | | | | | | | | | | | | | | |
|
| Internet & Direct Marketing Retail: 7.98% | |
| | | | |
Amazon.com Incorporated † | | | | | | | | | | | 97,760 | | | | 168,023,045 | |
| | | | |
Farfetch Limited Class A † | | | | | | | | | | | 243,051 | | | | 4,897,478 | |
| | | | |
MercadoLibre Incorporated † | | | | | | | | | | | 13,700 | | | | 4,986,800 | |
| | | | |
| | | | | | | | | | | | | | | 177,907,323 | |
| | | | | | | | | | | | | | | | |
|
| Specialty Retail: 4.56% | |
| | | | |
Burlington Stores Incorporated † | | | | | | | | | | | 213,710 | | | | 36,696,144 | |
| | | | |
Five Below Incorporated † | | | | | | | | | | | 136,360 | | | | 16,871,823 | |
| | | | |
O’Reilly Automotive Incorporated † | | | | | | | | | | | 70,640 | | | | 24,346,782 | |
| | | | |
Ross Stores Incorporated | | | | | | | | | | | 24,000 | | | | 2,210,880 | |
| | | | |
The Home Depot Incorporated | | | | | | | | | | | 6,330 | | | | 1,161,745 | |
| | | | |
ULTA Beauty Incorporated † | | | | | | | | | | | 69,700 | | | | 20,346,824 | |
| | | | |
| | | | | | | | | | | | | | | 101,634,198 | |
| | | | | | | | | | | | | | | | |
|
Consumer Staples: 2.88% | |
|
| Beverages: 1.76% | |
| | | | |
Constellation Brands Incorporated Class A | | | | | | | | | | | 71,420 | | | | 12,402,797 | |
| | | | |
The Coca-Cola Company | | | | | | | | | | | 557,070 | | | | 26,811,779 | |
| | | | |
| | | | | | | | | | | | | | | 39,214,576 | |
| | | | | | | | | | | | | | | | |
The accompanying notes are an integral part of these financial statements.
| | | | |
| 10 | | Wells Fargo Premier Large Company Growth Fund | | Portfolio of investments—January 31, 2019 (unaudited) |
| | | | | | | | | | | | | | | | |
| Security name | | | | | | | | Shares | | | Value | |
|
| Food & Staples Retailing: 0.47% | |
| | | | |
Costco Wholesale Corporation | | | | | | | | | | | 49,380 | | | $ | 10,598,429 | |
| | | | | | | | | | | | | | | | |
|
| Personal Products: 0.65% | |
| | | | |
The Estee Lauder Companies Incorporated Class A | | | | | | | | | | | 105,570 | | | | 14,401,859 | |
| | | | | | | | | | | | | | | | |
|
Energy: 0.36% | |
|
| Oil, Gas & Consumable Fuels: 0.36% | |
| | | | |
Concho Resources Incorporated † | | | | | | | | | | | 66,130 | | | | 7,925,019 | |
| | | | | | | | | | | | | | | | |
|
Financials: 5.06% | |
|
| Capital Markets: 5.06% | |
| | | | |
CME Group Incorporated | | | | | | | | | | | 200,140 | | | | 36,481,519 | |
| | | | |
MarketAxess Holdings Incorporated | | | | | | | | | | | 160,650 | | | | 34,502,801 | |
| | | | |
Raymond James Financial Incorporated | | | | | | | | | | | 247,746 | | | | 19,943,553 | |
| | | | |
The Charles Schwab Corporation | | | | | | | | | | | 469,230 | | | | 21,945,887 | |
| | | | |
| | | | | | | | | | | | | | | 112,873,760 | |
| | | | | | | | | | | | | | | | |
|
Health Care: 13.99% | |
|
| Biotechnology: 4.82% | |
| | | | |
Alexion Pharmaceuticals Incorporated † | | | | | | | | | | | 139,882 | | | | 17,199,891 | |
| | | | |
BioMarin Pharmaceutical Incorporated † | | | | | | | | | | | 34,300 | | | | 3,367,231 | |
| | | | |
Fibrogen Incorporated † | | | | | | | | | | | 122,600 | | | | 6,957,550 | |
| | | | |
Ligand Pharmaceuticals Incorporated † | | | | | | | | | | | 64,710 | | | | 7,642,251 | |
| | | | |
Neurocrine Biosciences Incorporated † | | | | | | | | | | | 76,210 | | | | 6,723,246 | |
| | | | |
Regeneron Pharmaceuticals Incorporated † | | | | | | | | | | | 26,300 | | | | 11,289,801 | |
| | | | |
Sage Therapeutics Incorporated † | | | | | | | | | | | 75,590 | | | | 10,778,378 | |
| | | | |
Sarepta Therapeutics Incorporated † | | | | | | | | | | | 116,770 | | | | 16,313,937 | |
| | | | |
Vertex Pharmaceuticals Incorporated † | | | | | | | | | | | 142,970 | | | | 27,294,403 | |
| | | | |
| | | | | | | | | | | | | | | 107,566,688 | |
| | | | | | | | | | | | | | | | |
|
| Health Care Equipment & Supplies: 3.69% | |
| | | | |
Abbott Laboratories | | | | | | | | | | | 422,750 | | | | 30,852,295 | |
| | | | |
Boston Scientific Corporation † | | | | | | | | | | | 925,590 | | | | 35,311,259 | |
| | | | |
Intuitive Surgical Incorporated † | | | | | | | | | | | 30,650 | | | | 16,049,566 | |
| | | | |
| | | | | | | | | | | | | | | 82,213,120 | |
| | | | | | | | | | | | | | | | |
|
| Health Care Providers & Services: 0.40% | |
| | | | |
Centene Corporation † | | | | | | | | | | | 68,720 | | | | 8,972,770 | |
| | | | | | | | | | | | | | | | |
|
| Health Care Technology: 0.70% | |
| | | | |
Veeva Systems Incorporated Class A † | | | | | | | | | | | 142,130 | | | | 15,500,698 | |
| | | | | | | | | | | | | | | | |
|
| Life Sciences Tools & Services: 2.28% | |
| | | | |
Agilent Technologies Incorporated | | | | | | | | | | | 385,190 | | | | 29,293,700 | |
| | | | |
PRA Health Sciences Incorporated † | | | | | | | | | | | 203,900 | | | | 21,607,283 | |
| | | | |
| | | | | | | | | | | | | | | 50,900,983 | |
| | | | | | | | | | | | | | | | |
The accompanying notes are an integral part of these financial statements.
| | | | | | |
| Portfolio of investments—January 31, 2019 (unaudited) | | Wells Fargo Premier Large Company Growth Fund | | | 11 | |
| | | | | | | | | | | | | | | | |
| Security name | | | | | | | | Shares | | | Value | |
|
| Pharmaceuticals: 2.10% | |
| | | | |
Elanco Animal Health Incorporated †« | | | | | | | | | | | 255,470 | | | $ | 7,454,615 | |
| | | | |
Zoetis Incorporated | | | | | | | | | | | 458,368 | | | | 39,492,987 | |
| | | | |
| | | | | | | | | | | | | | | 46,947,602 | |
| | | | | | | | | | | | | | | | |
|
Industrials: 14.07% | |
|
| Aerospace & Defense: 3.25% | |
| | | | |
HEICO Corporation | | | | | | | | | | | 236,882 | | | | 20,016,529 | |
| | | | |
The Boeing Company | | | | | | | | | | | 136,120 | | | | 52,490,594 | |
| | | | |
| | | | | | | | | | | | | | | 72,507,123 | |
| | | | | | | | | | | | | | | | |
|
| Commercial Services & Supplies: 3.25% | |
| | | | |
KAR Auction Services Incorporated | | | | | | | | | | | 227,417 | | | | 11,827,958 | |
| | | | |
Rollins Incorporated | | | | | | | | | | | 561,955 | | | | 20,927,204 | |
| | | | |
Waste Connections Incorporated | | | | | | | | | | | 476,015 | | | | 39,775,813 | |
| | | | |
| | | | | | | | | | | | | | | 72,530,975 | |
| | | | | | | | | | | | | | | | |
|
| Industrial Conglomerates: 1.05% | |
| | | | |
Roper Industries Incorporated | | | | | | | | | | | 82,550 | | | | 23,383,113 | |
| | | | | | | | | | | | | | | | |
|
| Machinery: 0.88% | |
| | | | |
Fortive Corporation | | | | | | | | | | | 261,425 | | | | 19,604,261 | |
| | | | | | | | | | | | | | | | |
|
| Professional Services: 2.25% | |
| | | | |
CoStar Group Incorporated † | | | | | | | | | | | 85,800 | | | | 33,525,492 | |
| | | | |
TransUnion | | | | | | | | | | | 275,030 | | | | 16,727,325 | |
| | | | |
| | | | | | | | | | | | | | | 50,252,817 | |
| | | | | | | | | | | | | | | | |
|
| Road & Rail: 3.39% | |
| | | | |
CSX Corporation | | | | | | | | | | | 134,200 | | | | 8,816,940 | |
| | | | |
Norfolk Southern Corporation | | | | | | | | | | | 132,110 | | | | 22,160,131 | |
| | | | |
Union Pacific Corporation | | | | | | | | | | | 280,260 | | | | 44,580,958 | |
| | | | |
| | | | | | | | | | | | | | | 75,558,029 | |
| | | | | | | | | | | | | | | | |
|
Information Technology: 33.59% | |
|
| IT Services: 13.51% | |
| | | | |
Euronet Worldwide Incorporated † | | | | | | | | | | | 124,096 | | | | 14,272,281 | |
| | | | |
Global Payments Incorporated | | | | | | | | | | | 167,130 | | | | 18,765,356 | |
| | | | |
MasterCard Incorporated Class A | | | | | | | | | | | 375,110 | | | | 79,196,974 | |
| | | | |
PayPal Holdings Incorporated † | | | | | | | | | | | 723,180 | | | | 64,189,457 | |
| | | | |
Shopify Incorporated Class A †« | | | | | | | | | | | 88,130 | | | | 14,847,261 | |
| | | | |
Square Incorporated Class A † | | | | | | | | | | | 102,328 | | | | 7,301,103 | |
| | | | |
Visa Incorporated Class A | | | | | | | | | | | 626,230 | | | | 84,547,312 | |
| | | | |
WEX Incorporated † | | | | | | | | | | | 113,240 | | | | 18,269,009 | |
| | | | |
| | | | | | | | | | | | | | | 301,388,753 | |
| | | | | | | | | | | | | | | | |
|
| Semiconductors & Semiconductor Equipment: 5.69% | |
| | | | |
Microchip Technology Incorporated « | | | | | | | | | | | 803,140 | | | | 64,548,362 | |
| | | | |
Monolithic Power Systems Incorporated | | | | | | | | | | | 129,150 | | | | 16,345,224 | |
The accompanying notes are an integral part of these financial statements.
| | | | |
| 12 | | Wells Fargo Premier Large Company Growth Fund | | Portfolio of investments—January 31, 2019 (unaudited) |
| | | | | | | | | | | | | | | | |
| Security name | | | | | | | | Shares | | | Value | |
|
| Semiconductors & Semiconductor Equipment(continued) | |
| | | | |
Texas Instruments Incorporated | | | | | | | | | | | 456,150 | | | $ | 45,925,182 | |
| | | | |
| | | | | | | | | | | | | | | 126,818,768 | |
| | | | | | | | | | | | | | | | |
|
| Software: 13.99% | |
| | | | |
Adobe Systems Incorporated † | | | | | | | | | | | 154,169 | | | | 38,206,162 | |
| | | | |
Dropbox Incorporated Class A †« | | | | | | | | | | | 809,800 | | | | 20,010,158 | |
| | | | |
Microsoft Corporation | | | | | | | | | | | 957,620 | | | | 100,004,257 | |
| | | | |
Pivotal Software Incorporated Class A † | | | | | | | | | | | 536,236 | | | | 9,915,004 | |
| | | | |
Proofpoint Incorporated † | | | | | | | | | | | 214,760 | | | | 21,877,601 | |
| | | | |
RealPage Incorporated † | | | | | | | | | | | 249,850 | | | | 13,934,135 | |
| | | | |
Salesforce.com Incorporated † | | | | | | | | | | | 279,420 | | | | 42,463,457 | |
| | | | |
ServiceNow Incorporated † | | | | | | | | | | | 152,680 | | | | 33,592,654 | |
| | | | |
Splunk Incorporated † | | | | | | | | | | | 116,385 | | | | 14,529,503 | |
| | | | |
The Ultimate Software Group Incorporated † | | | | | | | | | | | 64,092 | | | | 17,501,602 | |
| | | | |
| | | | | | | | | | | | | | | 312,034,533 | |
| | | | | | | | | | | | | | | | |
|
| Technology Hardware, Storage & Peripherals: 0.40% | |
| | | |
Apple Incorporated | | | | | | | | 52,750 | | | | 8,779,710 | |
| | | | | | | | | | | | | | | | |
|
Materials: 1.26% | |
| | | | |
| Chemicals: 1.26% | | | | | | | | | | | | | | | | |
| | | |
Linde plc | | | | | | | | 172,900 | | | | 28,184,429 | |
| | | | | | | | | | | | | | | | |
|
Real Estate: 1.20% | |
|
| Equity REITs: 0.69% | |
| | | |
SBA Communications Corporation † | | | | | | | | 83,800 | | | | 15,296,014 | |
| | | | | | | | | | | | | | | | |
|
| Real Estate Management & Development: 0.51% | |
| | | |
CBRE Group Incorporated Class A † | | | | | | | | 250,510 | | | | 11,460,831 | |
| | | | | | | | | | | | | | | | |
| |
Total Common Stocks (Cost $1,254,692,373) | | | | 2,223,746,932 | |
| | | | | | | | | | | | | | | | |
| | | | |
| | | Yield | | | | | | | | | | |
| Short-Term Investments: 5.01% | |
|
| Investment Companies: 5.01% | |
| | | | |
Securities Lending Cash Investments LLC (l)(r)(u) | | | 2.57 | % | | | | | | | 98,277,497 | | | | 98,287,325 | |
| | | | |
Wells Fargo Government Money Market Fund Select Class (l)(u) | | | 2.33 | | | | | | | | 13,592,723 | | | | 13,592,723 | |
| |
Total Short-Term Investments (Cost $111,880,048) | | | | 111,880,048 | |
| | | | | | | | | | | | | | | | |
| | | | | | | | |
| Total investments in securities (Cost $1,366,572,421) | | | 104.72 | % | | | 2,335,626,980 | |
| | |
Other assets and liabilities, net | | | (4.72 | ) | | | (105,368,654 | ) |
| | | | | | | | |
| Total net assets | | | 100.00 | % | | $ | 2,230,258,326 | |
| | | | | | | | |
| † | Non-income-earning security |
| « | All or a portion of this security is on loan. |
| (l) | The issuer of the security is an affiliated person of the Fund as defined in the Investment Company Act of 1940. |
| (r) | The investment is anon-registered investment company purchased with cash collateral received from securities on loan. |
| (u) | The rate represents the7-day annualized yield at period end. |
Abbreviations:
| REIT | Real estate investment trust |
The accompanying notes are an integral part of these financial statements.
| | | | | | |
| Portfolio of investments—January 31, 2019 (unaudited) | | Wells Fargo Premier Large Company Growth Fund | | | 13 | |
Investments in Affiliates
An affiliated investment is an investment in which the Fund owns at least 5% of the outstanding voting shares of the issuer or as a result of other relationships, such as the Fund and the issuer having the same investment manager. Transactions with issuers that were either affiliated persons of the Fund at the beginning of the period or the end of the period were as follows:
| | | | | | | | | | | | | | | | | | | | | | | | | | | | | | | | | | | | |
| | | Shares,
beginning of
period | | | Shares
purchased | | | Shares
sold | | | Shares,
end of
period | | | Net
realized
gains
(losses) | | | Net
change in
unrealized
gains
(losses) | | | Income
from
affiliated
securities | | | Value,
end
of period | | | % of
net
assets | |
Short-Term Investments | | | | | | | | | | | | | | | | | | | | | | | | | | | | | | | | | | | | |
Investment Companies | | | | | | | | | | | | | | | | | | | | | | | | | | | | | | | | | | | | |
Securities Lending Cash Investments LLC | | | 94,411,945 | | | | 309,236,998 | | | | 305,371,446 | | | | 98,277,497 | | | $ | (2,806 | ) | | $ | 0 | | | $ | 1,185,984 | | | $ | 98,287,325 | | | | | |
Wells Fargo Government Money Market Fund Select Class | | | 9,566,578 | | | | 225,319,341 | | | | 221,293,196 | | | | 13,592,723 | | | | 0 | | | | 0 | | | | 118,261 | | | | 13,592,723 | | | | | |
| | | | | | | | | | | | | | | | | | | | | | | | | | | | | | | | | | | | |
| | | | | | | | | |
| | | | | | | | | | | | | | | | | | $ | (2,806 | ) | | $ | 0 | | | $ | 1,304,245 | | | $ | 111,880,048 | | | | 5.01 | % |
| | | | | | | | | | | | | | | | | | | | | | | | | | | | | | | | | | | | |
The accompanying notes are an integral part of these financial statements.
| | | | |
| 14 | | Wells Fargo Premier Large Company Growth Fund | | Statement of assets and liabilities—January 31, 2019 (unaudited) |
| | | | |
| | | | |
| |
Assets | | | | |
Investments in unaffiliated securities (including $96,113,591 of securities loaned), at value (cost $1,254,692,373) | | $ | 2,223,746,932 | |
Investments in affiliated securities, at value (cost $111,880,048) | | | 111,880,048 | |
Receivable for investments sold | | | 6,620,032 | |
Receivable for Fund shares sold | | | 1,479,349 | |
Receivable for dividends | | | 703,680 | |
Receivable for securities lending income | | | 24,627 | |
Prepaid expenses and other assets | | | 114,012 | |
| | | | |
Total assets | | | 2,344,568,680 | |
| | | | |
| |
Liabilities | | | | |
Payable upon receipt of securities loaned | | | 98,287,171 | |
Payable for investments purchased | | | 10,656,963 | |
Payable for Fund shares redeemed | | | 3,336,190 | |
Management fee payable | | | 1,062,244 | |
Administration fees payable | | | 293,224 | |
Distribution fee payable | | | 100,655 | |
Trustees’ fees and expenses payable | | | 2,538 | |
Due to custodian bank | | | 265 | |
Accrued expenses and other liabilities | | | 571,104 | |
| | | | |
Total liabilities | | | 114,310,354 | |
| | | | |
Total net assets | | $ | 2,230,258,326 | |
| | | | |
| |
NET ASSETS CONSIST OF | | | | |
Paid-in capital | | $ | 1,213,940,337 | |
Total distributable earnings | | | 1,016,317,989 | |
| | | | |
Total net assets | | $ | 2,230,258,326 | |
| | | | |
| |
COMPUTATION OF NET ASSET VALUE AND OFFERING PRICE PER SHARE | | | | |
Net assets – Class A | | $ | 942,604,802 | |
Shares outstanding – Class A1 | | | 77,205,558 | |
Net asset value per share – Class A | | | $12.21 | |
Maximum offering price per share – Class A2 | | | $12.95 | |
Net assets – Class C | | $ | 164,186,669 | |
Shares outstanding – Class C1 | | | 18,192,049 | |
Net asset value per share – Class C | | | $9.03 | |
Net assets – Class R4 | | $ | 3,746,288 | |
Share outstanding – Class R41 | | | 292,715 | |
Net asset value per share – Class R4 | | | $12.80 | |
Net assets – Class R6 | | $ | 170,783,922 | |
Shares outstanding – Class R61 | | | 13,155,392 | |
Net asset value per share – Class R6 | | | $12.98 | |
Net assets – Administrator Class | | $ | 48,086,938 | |
Shares outstanding – Administrator Class1 | | | 3,859,739 | |
Net asset value per share – Administrator Class | | | $12.46 | |
Net assets – Institutional Class | | $ | 900,849,707 | |
Shares outstanding – Institutional Class1 | | | 69,654,897 | |
Net asset value per share – Institutional Class | | | $12.93 | |
| 1 | The Fund has an unlimited number of authorized shares. |
| 2 | Maximum offering price is computed as 100/94.25 of net asset value. On investments of $50,000 or more, the offering price is reduced. |
The accompanying notes are an integral part of these financial statements.
| | | | | | |
| Statement of operations—six months ended January 31, 2019 (unaudited) | | Wells Fargo Premier Large Company Growth Fund | | | 15 | |
| | | | |
| | | | |
| |
Investment income | | | | |
Dividends (net of foreign withholding taxes of $22,584) | | $ | 9,135,006 | |
Income from affiliated securities | | | 303,609 | |
| | | | |
Total investment income | | | 9,438,615 | |
| | | | |
| |
Expenses | | | | |
Management fee | | | 8,001,272 | |
Administration fees | |
Class A | | | 1,048,317 | |
Class C | | | 196,442 | |
Class R4 | | | 1,430 | |
Class R6 | | | 27,713 | |
Administrator Class | | | 33,707 | |
Institutional Class | | | 645,865 | |
Shareholder servicing fees | | | | |
Class A | | | 1,247,997 | |
Class C | | | 233,859 | |
Class R4 | | | 1,788 | |
Administrator Class | | | 64,821 | |
Distribution fee | |
Class C | | | 701,578 | |
Custody and accounting fees | | | 60,494 | |
Professional fees | | | 27,197 | |
Registration fees | | | 65,662 | |
Shareholder report expenses | | | 106,418 | |
Trustees’ fees and expenses | | | 11,090 | |
Other fees and expenses | | | 26,853 | |
| | | | |
Total expenses | | | 12,502,503 | |
Less: Fee waivers and/or expense reimbursements | | | (869,711 | ) |
| | | | |
Net expenses | | | 11,632,792 | |
| | | | |
Net investment loss | | | (2,194,177 | ) |
| | | | |
| |
REALIZED AND UNREALIZED GAINS (LOSSES) ON INVESTMENTS | | | | |
| |
Net realized gains (losses) on: | | | | |
Unaffiliated securities | | | 134,466,715 | |
Affiliated securities | | | (2,806 | ) |
| | | | |
Net realized gains on investments | | | 134,463,909 | |
Net change in unrealized gains (losses) on investments | | | (211,430,091 | ) |
| | | | |
Net realized and unrealized gains (losses) on investments | | | (76,966,182 | ) |
| | | | |
Net decrease in net assets resulting from operations | | $ | (79,160,359 | ) |
| | | | |
The accompanying notes are an integral part of these financial statements.
| | | | |
| 16 | | Wells Fargo Premier Large Company Growth Fund | | Statement of changes in net assets |
| | | | | | | | | | | | | | | | |
| | | Six months ended
January 31, 2019 (unaudited) | | | Year ended
July 31, 20181 | |
| |
Operations | | | | | |
Net investment loss | | | | | | $ | (2,194,177 | ) | | | | | | $ | (5,025,277 | ) |
Net realized gains on investments | | | | | | | 134,463,909 | | | | | | | | 395,034,238 | |
Net change in unrealized gains (losses) on investments | | | | | | | (211,430,091 | ) | | | | | | | 194,196,842 | |
| | | | |
Net increase (decrease) in net assets resulting from operations | | | | | | | (79,160,359 | ) | | | | | | | 584,205,803 | |
| | | | |
| | | |
Distributions to shareholders from net investment income and net realized gains | | | | | | | | | | | | |
Class A | | | | | | | (157,260,447 | ) | | | | | | | (227,679,727 | ) |
Class C | | | | | | | (37,119,006 | ) | | | | | | | (54,543,209 | ) |
Class R4 | | | | | | | (524,816 | ) | | | | | | | (746,155 | ) |
Class R6 | | | | | | | (27,912,392 | ) | | | | | | | (37,680,602 | ) |
Administrator Class | | | | | | | (7,935,426 | ) | | | | | | | (18,099,486 | ) |
Institutional Class | | | | | | | (149,877,161 | ) | | | | | | | (222,234,431 | ) |
| | | | |
Total distributions to shareholders | | | | | | | (380,629,248 | ) | | | | | | | (560,983,610 | ) |
| | | | |
| | | | |
Capital share transactions | | | Shares | | | | | | | | Shares | | | | | |
Proceeds from shares sold | |
Class A | | | 2,626,923 | | | | 34,420,274 | | | | 3,267,334 | | | | 47,146,306 | |
Class C | | | 1,196,732 | | | | 10,866,992 | | | | 1,584,503 | | | | 17,609,853 | |
Class R4 | | | 32,705 | | | | 395,164 | | | | 75,453 | | | | 1,179,600 | |
Class R6 | | | 740,461 | | | | 10,404,628 | | | | 1,545,725 | | | | 24,664,037 | |
Administrator Class | | | 217,733 | | | | 2,857,902 | | | | 561,343 | | | | 8,469,670 | |
Institutional Class | | | 6,611,297 | | | | 92,065,619 | | | | 13,231,358 | | | | 209,203,798 | |
| | | | |
| | | | | | | 151,010,579 | | | | | | | | 308,273,264 | |
| | | | |
Reinvestment of distributions | |
Class A | | | 12,562,848 | | | | 146,357,178 | | | | 15,972,127 | | | | 209,554,313 | |
Class C | | | 3,761,731 | | | | 32,426,128 | | | | 4,459,739 | �� | | | 46,202,895 | |
Class R4 | | | 42,767 | | | | 522,194 | | | | 54,558 | | | | 741,983 | |
Class R6 | | | 2,036,360 | | | | 25,210,147 | | | | 2,631,345 | | | | 36,154,683 | |
Administrator Class | | | 643,092 | | | | 7,646,354 | | | | 1,320,910 | | | | 17,607,730 | |
Institutional Class | | | 11,058,800 | | | | 136,355,009 | | | | 14,695,591 | | | | 201,476,557 | |
| | | | |
| | | | | | | 348,517,010 | | | | | | | | 511,738,161 | |
| | | | |
Payment for shares redeemed | |
Class A | | | (7,407,256 | ) | | | (98,526,304 | ) | | | (14,159,720 | ) | | | (208,175,400 | ) |
Class C | | | (3,710,023 | ) | | | (35,465,687 | ) | | | (5,118,687 | ) | | | (60,638,200 | ) |
Class R4 | | | (20,318 | ) | | | (336,252 | ) | | | (118,356 | ) | | | (1,890,437 | ) |
Class R6 | | | (2,034,376 | ) | | | (27,856,630 | ) | | | (2,515,229 | ) | | | (39,250,052 | ) |
Administrator Class | | | (751,683 | ) | | | (10,672,637 | ) | | | (3,480,442 | ) | | | (50,915,269 | ) |
Institutional Class | | | (13,957,080 | ) | | | (187,795,572 | ) | | | (21,905,645 | ) | | | (330,565,468 | ) |
| | | | |
| | | | | | | (360,653,082 | ) | | | | | | | (691,434,826 | ) |
| | | | |
Net increase in net assets resulting from capital share transactions | | | | | | | 138,874,507 | | | | | | | | 128,576,599 | |
| | | | |
Total increase (decrease) in net assets | | | | | | | (320,915,100 | ) | | | | | | | 151,798,792 | |
| | | | |
| | |
Net assets | | | | | | | | |
Beginning of period | | | | | | | 2,551,173,426 | | | | | | | | 2,399,374,634 | |
| | | | |
End of period | | | | | | $ | 2,230,258,326 | | | | | | | $ | 2,551,173,426 | |
| | | | |
| 1 | Effective for all filings after November 4, 2018, the SEC prospectively eliminated the requirement to parenthetically disclose undistributed net investment income at the end of the period and permitted the aggregation of distributions, with the exception of tax basis returns of capital. Accumulated net investment loss at July 31, 2018 was $18,243. The disaggregated distributions information for the year ended July 31, 2018 is included in Note 7,Distributions to Shareholders, in the notes to the financial statements. |
The accompanying notes are an integral part of these financial statements.
| | | | | | |
| Financial highlights | | Wells Fargo Premier Large Company Growth Fund | | | 17 | |
(For a share outstanding throughout each period)
| | | | | | | | | | | | | | | | | | | | | | | | |
| | | Six months ended January 31, 2019 (unaudited) | | | Year ended July 31 | |
| CLASS A | | 2018 | | | 2017 | | | 2016 | | | 2015 | | | 2014 | |
Net asset value, beginning of period | | | $15.10 | | | | $15.34 | | | | $14.68 | | | | $16.28 | | | | $14.55 | | | | $12.57 | |
Net investment loss | | | (0.02 | )1 | | | (0.05 | ) | | | (0.03 | )1 | | | (0.03 | ) | | | (0.03 | ) | | | (0.05 | ) |
Net realized and unrealized gains (losses) on investments | | | (0.51 | ) | | | 3.56 | | | | 2.12 | | | | (0.52 | ) | | | 1.97 | | | | 2.03 | |
| | | | | | | | | | | | | | | | | | | | | | | | |
Total from investment operations | | | (0.53 | ) | | | 3.51 | | | | 2.09 | | | | (0.55 | ) | | | 1.94 | | | | 1.98 | |
Distributions to shareholders from | | | | | | | | | | | | | | | | | | | | | | | | |
Net realized gains | | | (2.36 | ) | | | (3.75 | ) | | | (1.43 | ) | | | (1.05 | ) | | | (0.21 | ) | | | 0.00 | |
Net asset value, end of period | | | $12.21 | | | | $15.10 | | | | $15.34 | | | | $14.68 | | | | $16.28 | | | | $14.55 | |
Total return2 | | | (2.79 | )% | | | 26.54 | % | | | 16.01 | % | | | (3.22 | )% | | | 13.46 | % | | | 15.75 | % |
Ratios to average net assets (annualized) | | | | | | | | | | | | | | | | | | | | | | | | |
Gross expenses | | | 1.15 | % | | | 1.15 | % | | | 1.14 | % | | | 1.13 | % | | | 1.16 | % | | | 1.17 | % |
Net expenses | | | 1.11 | % | | | 1.11 | % | | | 1.11 | % | | | 1.11 | % | | | 1.12 | % | | | 1.12 | % |
Net investment loss | | | (0.33 | )% | | | (0.34 | )% | | | (0.20 | )% | | | (0.17 | )% | | | (0.18 | )% | | | (0.36 | )% |
Supplemental data | | | | | | | | | | | | | | | | | | | | | | | | |
Portfolio turnover rate | | | 22 | % | | | 45 | % | | | 65 | % | | | 47 | % | | | 44 | % | | | 37 | % |
Net assets, end of period (000s omitted) | | | $942,605 | | | | $1,048,632 | | | | $986,791 | | | | $1,697,746 | | | | $2,280,107 | | | | $1,908,455 | |
| 1 | Calculated based upon average shares outstanding |
| 2 | Total return calculations do not include any sales charges. Returns for periods of less than one year are not annualized. |
The accompanying notes are an integral part of these financial statements.
| | | | |
| 18 | | Wells Fargo Premier Large Company Growth Fund | | Financial highlights |
(For a share outstanding throughout each period)
| | | | | | | | | | | | | | | | | | | | | | | | |
| | | Six months ended January 31, 2019 (unaudited) | | | Year ended July 31 | |
| CLASS C | | 2018 | | | 2017 | | | 2016 | | | 2015 | | | 2014 | |
Net asset value, beginning of period | | | $11.87 | | | | $12.86 | | | | $12.64 | | | | $14.27 | | | | $12.87 | | | | $11.20 | |
Net investment loss | | | (0.06 | )1 | | | (0.13 | )1 | | | (0.12 | )1 | | | (0.12 | )1 | | | (0.13 | )1 | | | (0.14 | )1 |
Net realized and unrealized gains (losses) on investments | | | (0.42 | ) | | | 2.89 | | | | 1.77 | | | | (0.46 | ) | | | 1.74 | | | | 1.81 | |
| | | | | | | | | | | | | | | | | | | | | | | | |
Total from investment operations | | | (0.48 | ) | | | 2.76 | | | | 1.65 | | | | (0.58 | ) | | | 1.61 | | | | 1.67 | |
Distributions to shareholders from | | | | | | | | | | | | | | | | | | | | | | | | |
Net realized gains | | | (2.36 | ) | | | (3.75 | ) | | | (1.43 | ) | | | (1.05 | ) | | | (0.21 | ) | | | 0.00 | |
Net asset value, end of period | | | $9.03 | | | | $11.87 | | | | $12.86 | | | | $12.64 | | | | $14.27 | | | | $12.87 | |
Total return2 | | | (3.14 | )% | | | 25.68 | % | | | 15.05 | % | | | (3.92 | )% | | | 12.65 | % | | | 14.91 | % |
Ratios to average net assets (annualized) | | | | | | | | | | | | | | | | | | | | | | | | |
Gross expenses | | | 1.90 | % | | | 1.90 | % | | | 1.89 | % | | | 1.88 | % | | | 1.91 | % | | | 1.92 | % |
Net expenses | | | 1.86 | % | | | 1.86 | % | | | 1.86 | % | | | 1.86 | % | | | 1.87 | % | | | 1.87 | % |
Net investment loss | | | (1.08 | )% | | | (1.09 | )% | | | (0.95 | )% | | | (0.92 | )% | | | (0.93 | )% | | | (1.11 | )% |
Supplemental data | | | | | | | | | | | | | | | | | | | | | | | | |
Portfolio turnover rate | | | 22 | % | | | 45 | % | | | 65 | % | | | 47 | % | | | 44 | % | | | 37 | % |
Net assets, end of period (000s omitted) | | | $164,187 | | | | $201,138 | | | | $206,026 | | | | $296,896 | | | | $388,290 | | | | $374,136 | |
| 1 | Calculated based upon average shares outstanding |
| 2 | Total return calculations do not include any sales charges. Returns for periods of less than one year are not annualized. |
The accompanying notes are an integral part of these financial statements.
| | | | | | |
| Financial highlights | | Wells Fargo Premier Large Company Growth Fund | | | 19 | |
(For a share outstanding throughout each period)
| | | | | | | | | | | | | | | | | | | | | | | | |
| | | Six months ended January 31, 2019 (unaudited) | | | Year ended July 31 | |
| CLASS R4 | | 2018 | | | 2017 | | | 2016 | | | 2015 | | | 2014 | |
Net asset value, beginning of period | | | $15.69 | | | | $15.75 | | | | $15.00 | | | | $16.56 | | | | $14.75 | | | | $12.70 | |
Net investment income (loss) | | | (0.00 | )1,2 | | | (0.00 | )1,2 | | | 0.01 | 1 | | | 0.02 | 1 | | | 0.02 | | | | (0.01 | ) |
Net realized and unrealized gains (losses) on investments | | | (0.53 | ) | | | 3.69 | | | | 2.17 | | | | (0.53 | ) | | | 2.00 | | | | 2.06 | |
| | | | | | | | | | | | | | | | | | | | | | | | |
Total from investment operations | | | (0.53 | ) | | | 3.69 | | | | 2.18 | | | | (0.51 | ) | | | 2.02 | | | | 2.05 | |
Distributions to shareholders from | | | | | | | | | | | | | | | | | | | | | | | | |
Net realized gains | | | (2.36 | ) | | | (3.75 | ) | | | (1.43 | ) | | | (1.05 | ) | | | (0.21 | ) | | | 0.00 | |
Net asset value, end of period | | | $12.80 | | | | $15.69 | | | | $15.75 | | | | $15.00 | | | | $16.56 | | | | $14.75 | |
Total return3 | | | (2.68 | )% | | | 27.06 | % | | | 16.30 | % | | | (2.91 | )% | | | 13.82 | % | | | 16.14 | % |
Ratios to average net assets (annualized) | | | | | | | | | | | | | | | | | | | | | | | | |
Gross expenses | | | 0.87 | % | | | 0.87 | % | | | 0.86 | % | | | 0.85 | % | | | 0.83 | % | | | 0.84 | % |
Net expenses | | | 0.80 | % | | | 0.80 | % | | | 0.80 | % | | | 0.80 | % | | | 0.80 | % | | | 0.80 | % |
Net investment income (loss) | | | (0.03 | )% | | | (0.02 | )% | | | 0.09 | % | | | 0.13 | % | | | 0.13 | % | | | (0.11 | )% |
Supplemental data | | | | | | | | | | | | | | | | | | | | | | | | |
Portfolio turnover rate | | | 22 | % | | | 45 | % | | | 65 | % | | | 47 | % | | | 44 | % | | | 37 | % |
Net assets, end of period (000s omitted) | | | $3,746 | | | | $3,727 | | | | $3,559 | | | | $3,988 | | | | $2,129 | | | | $765 | |
| 1 | Calculated based upon average shares outstanding |
| 2 | Amount is more than $(0.005). |
| 3 | Returns for periods of less than one year are not annualized. |
The accompanying notes are an integral part of these financial statements.
| | | | |
| 20 | | Wells Fargo Premier Large Company Growth Fund | | Financial highlights |
(For a share outstanding throughout each period)
| | | | | | | | | | | | | | | | | | | | | | | | |
| | | Six months ended January 31, 2019 (unaudited) | | | Year ended July 31 | |
| CLASS R6 | | 2018 | | | 2017 | | | 2016 | | | 2015 | | | 2014 | |
Net asset value, beginning of period | | | $15.87 | | | | $15.87 | | | | $15.08 | | | | $16.62 | | | | $14.77 | | | | $12.71 | |
Net investment income | | | 0.01 | 1 | | | 0.02 | 1 | | | 0.03 | 1 | | | 0.04 | 1 | | | 0.05 | | | | 0.01 | |
Net realized and unrealized gains (losses) on investments | | | (0.54 | ) | | | 3.73 | | | | 2.19 | | | | (0.53 | ) | | | 2.01 | | | | 2.05 | |
| | | | | | | | | | | | | | | | | | | | | | | | |
Total from investment operations | | | (0.53 | ) | | | 3.75 | | | | 2.22 | | | | (0.49 | ) | | | 2.06 | | | | 2.06 | |
Distributions to shareholders from | | | | | | | | | | | | | | | | | | | | | | | | |
Net realized gains | | | (2.36 | ) | | | (3.75 | ) | | | (1.43 | ) | | | (1.05 | ) | | | (0.21 | ) | | | 0.00 | |
Net asset value, end of period | | | $12.98 | | | | $15.87 | | | | $15.87 | | | | $15.08 | | | | $16.62 | | | | $14.77 | |
Total return2 | | | (2.65 | )% | | | 27.27 | % | | | 16.48 | % | | | (2.78 | )% | | | 14.00 | % | | | 16.29 | % |
Ratios to average net assets (annualized) | | | | | | | | | | | | | | | | | | | | | | | | |
Gross expenses | | | 0.72 | % | | | 0.72 | % | | | 0.71 | % | | | 0.70 | % | | | 0.68 | % | | | 0.69 | % |
Net expenses | | | 0.65 | % | | | 0.65 | % | | | 0.65 | % | | | 0.65 | % | | | 0.65 | % | | | 0.65 | % |
Net investment income | | | 0.13 | % | | | 0.12 | % | | | 0.25 | % | | | 0.28 | % | | | 0.29 | % | | | 0.09 | % |
Supplemental data | | | | | | | | | | | | | | | | | | | | | | | | |
Portfolio turnover rate | | | 22 | % | | | 45 | % | | | 65 | % | | | 47 | % | | | 44 | % | | | 37 | % |
Net assets, end of period (000s omitted) | | | $170,784 | | | | $196,934 | | | | $170,657 | | | | $179,198 | | | | $166,768 | | | | $163,871 | |
| 1 | Calculated based upon average shares outstanding |
| 2 | Returns for periods of less than one year are not annualized. |
The accompanying notes are an integral part of these financial statements.
| | | | | | |
| Financial highlights | | Wells Fargo Premier Large Company Growth Fund | | | 21 | |
(For a share outstanding throughout each period)
| | | | | | | | | | | | | | | | | | | | | | | | |
| | | Six months ended
January 31, 2019 (unaudited) | | | Year ended July 31 | |
| ADMINISTRATOR CLASS | | 2018 | | | 2017 | | | 2016 | | | 2015 | | | 2014 | |
Net asset value, beginning of period | | | $15.35 | | | | $15.52 | | | | $14.82 | | | | $16.41 | | | | $14.63 | | | | $12.62 | |
Net investment loss | | | (0.02 | )1 | | | (0.03 | )1 | | | (0.01 | )1 | | | (0.00 | )1,2 | | | (0.00 | )2 | | | (0.02 | ) |
Net realized and unrealized gains (losses) on investments | | | (0.51 | ) | | | 3.61 | | | | 2.14 | | | | (0.54 | ) | | | 1.99 | | | | 2.03 | |
| | | | | | | | | | | | | | | | | | | | | | | | |
Total from investment operations | | | (0.53 | ) | | | 3.58 | | | | 2.13 | | | | (0.54 | ) | | | 1.99 | | | | 2.01 | |
Distributions to shareholders from | | | | | | | | | | | | | | | | | | | | | | | | |
Net realized gains | | | (2.36 | ) | | | (3.75 | ) | | | (1.43 | ) | | | (1.05 | ) | | | (0.21 | ) | | | 0.00 | |
Net asset value, end of period | | | $12.46 | | | | $15.35 | | | | $15.52 | | | | $14.82 | | | | $16.41 | | | | $14.63 | |
Total return3 | | | (2.75 | )% | | | 26.70 | % | | | 16.14 | % | | | (3.13 | )% | | | 13.73 | % | | | 15.93 | % |
Ratios to average net assets (annualized) | | | | | | | | | | | | | | | | | | | | | | | | |
Gross expenses | | | 1.07 | % | | | 1.07 | % | | | 1.06 | % | | | 1.04 | % | | | 1.00 | % | | | 1.00 | % |
Net expenses | | | 1.00 | % | | | 1.00 | % | | | 1.00 | % | | | 0.98 | % | | | 0.95 | % | | | 0.95 | % |
Net investment loss | | | (0.22 | )% | | | (0.22 | )% | | | (0.06 | )% | | | (0.02 | )% | | | (0.01 | )% | | | (0.19 | )% |
Supplemental data | | | | | | | | | | | | | | | | | | | | | | | | |
Portfolio turnover rate | | | 22 | % | | | 45 | % | | | 65 | % | | | 47 | % | | | 44 | % | | | 37 | % |
Net assets, end of period (000s omitted) | | | $48,087 | | | | $57,582 | | | | $82,998 | | | | $292,900 | | | | $1,129,970 | | | | $1,325,864 | |
| 1 | Calculated based upon average shares outstanding |
| 2 | Amount is more than $(0.005). |
| 3 | Returns for periods of less than one year are not annualized. |
The accompanying notes are an integral part of these financial statements.
| | | | |
| 22 | | Wells Fargo Premier Large Company Growth Fund | | Financial highlights |
(For a share outstanding throughout each period)
| | | | | | | | | | | | | | | | | | | | | | | | |
| | | Six months ended
January 31, 2019 (unaudited) | | | Year ended July 31 | |
| INSTITUTIONAL CLASS | | 2018 | | | 2017 | | | 2016 | | | 2015 | | | 2014 | |
Net asset value, beginning of period | | | $15.82 | | | | $15.84 | | | | $15.06 | | | | $16.61 | | | | $14.77 | | | | $12.71 | |
Net investment income | | | 0.01 | 1 | | | 0.01 | 1 | | | 0.02 | 1 | | | 0.03 | 1 | | | 0.03 | | | | 0.01 | 1 |
Net realized and unrealized gains (losses) on investments | | | (0.54 | ) | | | 3.72 | | | | 2.19 | | | | (0.53 | ) | | | 2.02 | | | | 2.05 | |
| | | | | | | | | | | | | | | | | | | | | | | | |
Total from investment operations | | | (0.53 | ) | | | 3.73 | | | | 2.21 | | | | (0.50 | ) | | | 2.05 | | | | 2.06 | |
Distributions to shareholders from | | | | | | | | | | | | | | | | | | | | | | | | |
Net realized gains | | | (2.36 | ) | | | (3.75 | ) | | | (1.43 | ) | | | (1.05 | ) | | | (0.21 | ) | | | 0.00 | |
Net asset value, end of period | | | $12.93 | | | | $15.82 | | | | $15.84 | | | | $15.06 | | | | $16.61 | | | | $14.77 | |
Total return2 | | | (2.65 | )% | | | 27.17 | % | | | 16.44 | % | | | (2.85 | )% | | | 14.01 | % | | | 16.21 | % |
Ratios to average net assets (annualized) | | | | | | | | | | | | | | | | | | | | | | | | |
Gross expenses | | | 0.82 | % | | | 0.82 | % | | | 0.81 | % | | | 0.80 | % | | | 0.74 | % | | | 0.74 | % |
Net expenses | | | 0.70 | % | | | 0.70 | % | | | 0.70 | % | | | 0.70 | % | | | 0.70 | % | | | 0.70 | % |
Net investment income | | | 0.08 | % | | | 0.07 | % | | | 0.19 | % | | | 0.23 | % | | | 0.23 | % | | | 0.07 | % |
Supplemental data | | | | | | | | | | | | | | | | | | | | | | | | |
Portfolio turnover rate | | | 22 | % | | | 45 | % | | | 65 | % | | | 47 | % | | | 44 | % | | | 37 | % |
Net assets, end of period (000s omitted) | | | $900,850 | | | | $1,043,161 | | | | $949,344 | | | | $1,097,976 | | | | $1,313,281 | | | | $1,031,979 | |
| 1 | Calculated based upon average shares outstanding |
| 2 | Returns for periods of less than one year are not annualized. |
The accompanying notes are an integral part of these financial statements.
| | | | | | |
| Notes to financial statements (unaudited) | | Wells Fargo Premier Large Company Growth Fund | | | 23 | |
1. ORGANIZATION
Wells Fargo Fund Trust (the “Trust”), a Delaware statutory trust organized on March 10, 1999, is anopen-end management investment company registered under the Investment Company Act of 1940, as amended (the “1940 Act”). As an investment company, the Trust follows the accounting and reporting guidance in Financial Accounting Standards Board (“FASB”) Accounting Standards Codification Topic 946,Financial Services – Investment Companies. These financial statements report on the Wells Fargo Premier Large Company Growth Fund (the “Fund”) which is a diversified series of the Trust.
2. SIGNIFICANT ACCOUNTING POLICIES
The following significant accounting policies, which are consistently followed in the preparation of the financial statements of the Fund, are in conformity with U.S. generally accepted accounting principles which require management to make estimates and assumptions that affect the reported amounts of assets and liabilities, disclosure of contingent assets and liabilities at the date of the financial statements, and the reported amounts of revenues and expenses during the reporting period. Actual results could differ from those estimates.
Securities valuation
All investments are valued each business day as of the close of regular trading on the New York Stock Exchange (generally 4 p.m. Eastern Time), although the Fund may deviate from this calculation time under unusual or unexpected circumstances.
Equity securities that are listed on a foreign or domestic exchange or market are valued at the official closing price or, if none, the last sales price. If no sale occurs on the principal exchange or market that day, a fair value price will be determined in accordance with the Fund’s Valuation Procedures.
Investments in registeredopen-end investment companies are valued at net asset value. Interests innon-registered investment companies that are redeemable at net asset value are fair valued normally at net asset value.
Investments which are not valued using any of the methods discussed above are valued at their fair value, as determined in good faith by the Board of Trustees of the Fund. The Board of Trustees has established a Valuation Committee comprised of the Trustees and has delegated to it the authority to take any actions regarding the valuation of portfolio securities that the Valuation Committee deems necessary or appropriate, including determining the fair value of portfolio securities, unless the determination has been delegated to the Wells Fargo Asset Management Pricing Committee at Wells Fargo Funds Management, LLC (“Funds Management”). The Board of Trustees retains the authority to make or ratify any valuation decisions or approve any changes to the Valuation Procedures as it deems appropriate. On a quarterly basis, the Board of Trustees receives reports on any valuation actions taken by the Valuation Committee or the Wells Fargo Asset Management Pricing Committee which may include items for ratification.
Foreign currency translation
The accounting records of the Fund are maintained in U.S. dollars. The values of other assets and liabilities denominated in foreign currencies are translated into U.S. dollars at rates provided by an independent foreign currency pricing source at a time each business day specified by the Wells Fargo Asset Management Pricing Committee. Purchases and sales of securities, and income and expenses are converted at the rate of exchange on the respective dates of such transactions. Net realized foreign exchange gains or losses arise from sales of foreign currencies, currency gains or losses realized between the trade and settlement dates on securities transactions, and the difference between the amounts of dividends, interest and foreign withholding taxes recorded and the U.S. dollar equivalent of the amounts actually paid or received. Net unrealized foreign exchange gains and losses arise from changes in the fair value of assets and liabilities other than investments in securities resulting from changes in exchange rates. The changes in net assets arising from changes in exchange rates of securities and the changes in net assets resulting from changes in market prices of securities are not separately presented. Such changes are included in net realized and unrealized gains or losses from investments.
Securities lending
The Fund may lend its securities from time to time in order to earn additional income in the form of fees or interest on securities received as collateral or the investment of any cash received as collateral. The Fund continues to receive interest or dividends on the securities loaned. The Fund receives collateral in the form of cash or securities with a value at least equal to the value of the securities on loan. The value of the loaned securities is determined at the close of each business day and any additional required collateral is delivered to the Fund on the next business day. In a securities lending transaction, the net asset value of the Fund will be affected by an increase or decrease in the value of the
| | | | |
| 24 | | Wells Fargo Premier Large Company Growth Fund | | Notes to financial statements (unaudited) |
securities loaned and by an increase or decrease in the value of the instrument in which collateral is invested. The amount of securities lending activity undertaken by the Fund fluctuates from time to time. In the event of default or bankruptcy by the borrower, the Fund may be prevented from recovering the loaned securities or gaining access to the collateral or may experience delays or costs in doing so. In addition, the investment of any cash collateral received may lose all or part of its value. The Fund has the right under the lending agreement to recover the securities from the borrower on demand.
The Fund lends its securities through an unaffiliated securities lending agent. Cash collateral received in connection with its securities lending transactions is invested in Securities Lending Cash Investments, LLC (the “Securities Lending Fund”). The Securities Lending Fund is exempt from registration under Section 3(c)(7) of the 1940 Act and is managed by Funds Management and is subadvised by Wells Capital Management Incorporated (“WellsCap”), an affiliate of Funds Management and an indirect wholly owned subsidiary of Wells Fargo & Company (“Wells Fargo”). Funds Management receives an advisory fee starting at 0.05% and declining to 0.01% as the average daily net assets of the Securities Lending Fund increase. All of the fees received by Funds Management are paid to WellsCap for its services as subadviser. The Securities Lending Fund seeks to provide a positive return compared to the daily Fed Funds Open Rate by investing in high-quality, U.S. dollar-denominated short-term money market instruments. Securities Lending Fund investments are valued at the evaluated bid price provided by an independent pricing service. Income earned from investment in the Securities Lending Fund (net of fees and rebates), if any, is included in income from affiliated securities on the Statement of Operations.
Security transactions and income recognition
Securities transactions are recorded on a trade date basis. Realized gains or losses are recorded on the basis of identified cost.
Dividend income is recognized on theex-dividend date. Dividend income is recorded net of foreign taxes withheld where recovery of such taxes is not assured.
Distributions to shareholders
Distributions to shareholders from net investment income and any net realized gains are recorded on theex-dividend date and paid at least annually. Such distributions are determined in accordance with income tax regulations and may differ from U.S. generally accepted accounting principles. Dividend sources are estimated at the time of declaration. The tax character of distributions is determined as of the Fund’s fiscal year end. Therefore, a portion of the Fund’s distributions made prior to the Fund’s fiscal year end may be categorized as a tax return of capital at year end.
Federal and other taxes
The Fund intends to continue to qualify as a regulated investment company by distributing substantially all of its investment company taxable income and any net realized capital gains (after reduction for capital loss carryforwards) sufficient to relieve it from all, or substantially all, federal income taxes. Accordingly, no provision for federal income taxes was required.
The Fund’s income and federal excise tax returns and all financial records supporting those returns for the prior three fiscal years are subject to examination by the federal and Delaware revenue authorities. Management has analyzed the Fund’s tax positions taken on federal, state, and foreign tax returns for all open tax years and does not believe that there are any uncertain tax positions that require recognition of a tax liability.
As of January 31, 2019, the aggregate cost of all investments for federal income tax purposes was $1,364,492,667 and the unrealized gains (losses) consisted of:
| | | | |
| |
Gross unrealized gains | | $ | 983,672,342 | |
| |
Gross unrealized losses | | | (12,538,029 | ) |
| |
Net unrealized gains | | $ | 971,134,313 | |
Class allocations
The separate classes of shares offered by the Fund differ principally in applicable sales charges, distribution, shareholder servicing, and administration fees. Class specific expenses are charged directly to that share class. Investment income, common expenses, and realized and unrealized gains (losses) on investments are allocated daily to each class of shares based on the relative proportion of net assets of each class.
| | | | | | |
| Notes to financial statements (unaudited) | | Wells Fargo Premier Large Company Growth Fund | | | 25 | |
3. FAIR VALUATION MEASUREMENTS
Fair value measurements of investments are determined within a framework that has established a fair value hierarchy based upon the various data inputs utilized in determining the value of the Fund’s investments. The three-level hierarchy gives the highest priority to unadjusted quoted prices in active markets for identical assets or liabilities (Level 1) and the lowest priority to unobservable inputs (Level 3). The Fund’s investments are classified within the fair value hierarchy based on the lowest level of input that is significant to the fair value measurement. The inputs are summarized into three broad levels as follows:
| ∎ | | Level 1 – quoted prices in active markets for identical securities |
| ∎ | | Level 2 – other significant observable inputs (including quoted prices for similar securities, interest rates, prepayment speeds, credit risk, etc.) |
| ∎ | | Level 3 – significant unobservable inputs (including the Fund’s own assumptions in determining the fair value of investments) |
The inputs or methodologies used for valuing investments in securities are not necessarily an indication of the risk associated with investing in those securities.
The following is a summary of the inputs used in valuing the Fund’s assets and liabilities as of January 31, 2019:
| | | | | | | | | | | | | | | | |
| | | | |
| | | Quoted prices (Level 1) | | | Other significant
observable inputs
(Level 2) | | | Significant
unobservable inputs (Level 3) | | | Total | |
| | | | |
Assets | | | | | | | | | | | | | | | | |
Investments in: | | | | | | | | | | | | | | | | |
| | | | |
Common stocks | | | | | | | | | | | | | | | | |
| | | | |
Communication services | | $ | 264,136,637 | | | $ | 0 | | | $ | 0 | | | $ | 264,136,637 | |
| | | | |
Consumer discretionary | | | 344,695,435 | | | | 0 | | | | 0 | | | | 344,695,435 | |
| | | | |
Consumer staples | | | 64,214,864 | | | | 0 | | | | 0 | | | | 64,214,864 | |
| | | | |
Energy | | | 7,925,019 | | | | 0 | | | | 0 | | | | 7,925,019 | |
| | | | |
Financials | | | 112,873,760 | | | | 0 | | | | 0 | | | | 112,873,760 | |
| | | | |
Health care | | | 312,101,861 | | | | 0 | | | | 0 | | | | 312,101,861 | |
| | | | |
Industrials | | | 313,836,318 | | | | 0 | | | | 0 | | | | 313,836,318 | |
| | | | |
Information technology | | | 749,021,764 | | | | 0 | | | | 0 | | | | 749,021,764 | |
| | | | |
Materials | | | 28,184,429 | | | | 0 | | | | 0 | | | | 28,184,429 | |
| | | | |
Real estate | | | 26,756,845 | | | | 0 | | | | 0 | | | | 26,756,845 | |
| | | | |
Short-term investments | | | | | | | | | | | | | | | | |
| | | | |
Investment companies | | | 13,592,723 | | | | 98,287,325 | | | | 0 | | | | 111,880,048 | |
| | | | |
Total assets | | $ | 2,237,339,655 | | | $ | 98,287,325 | | | $ | 0 | | | $ | 2,335,626,980 | |
Additional sector, industry or geographic detail is included in the Portfolio of Investments.
At January 31, 2019, the Fund did not have any transfers into/out of Level 3.
4. TRANSACTIONS WITH AFFILIATES
Management fee
Funds Management, an indirect wholly owned subsidiary of Wells Fargo, is the manager of the Fund and provides advisory and fund-level administrative services under an investment management agreement. Under the investment management agreement, Funds Management is responsible for, among other services, implementing the investment objectives and strategies of the Fund, supervising the subadviser and providing fund-level administrative services in connection with the Fund’s operations. As compensation for its services under the investment management agreement, Funds Management is entitled to receive an annual management fee starting at 0.70% and declining to 0.505% as the average daily net assets of the Fund increase. For the six months ended January 31, 2019, the management fee was equivalent to an annual rate of 0.66% of the Fund’s average daily net assets.
| | | | |
| 26 | | Wells Fargo Premier Large Company Growth Fund | | Notes to financial statements (unaudited) |
Funds Management has retained the services of a subadviser to provide daily portfolio management to the Fund. The fee for subadvisory services is borne by Funds Management. WellsCap is the subadviser to the Fund and is entitled to receive a fee from Funds Management at an annual rate starting at 0.35% and declining to 0.275% as the average daily net assets of the Fund increase.
Administration fees
Under a class-level administration agreement, Funds Management provides class-level administrative services to the Fund, which includes paying fees and expenses for services provided by the transfer agent,sub-transfer agents, omnibus account servicers and record-keepers. As compensation for its services under the class-level administration agreement, Funds Management receives an annual fee which is calculated based on the average daily net assets of each class as follows:
| | | | |
| | | Class-level
administration fee | |
| |
Class A, Class C | | | 0.21 | % |
| |
Class R4 | | | 0.08 | |
| |
Class R6 | | | 0.03 | |
| |
Administrator Class, Institutional Class | | | 0.13 | |
Funds Management has contractually waived and/or reimbursed management and administration fees to the extent necessary to maintain certain net operating expense ratios for the Fund. When each class of the Fund has exceeded its expense cap, Funds Management has waived fees and/or reimbursed expenses from fund level expenses on a proportionate basis and then from class specific expenses; otherwise, waivers and/or reimbursements are applied against class specific expenses before fund level expenses. Funds Management has committed through November 30, 2019 to waive fees and/or reimburse expenses to the extent necessary to cap the Fund’s expenses at 1.11% for Class A shares, 1.86% for Class C shares, 0.80% for Class R4 shares, 0.65% for Class R6 shares, 1.00% for Administrator Class, and 0.70% for Institutional Class shares. Prior to or after the commitment expiration date, the cap may be increased or the commitment to maintain the cap may be terminated only with the approval of the Board of Trustees.
Distribution fee
The Trust has adopted a distribution plan for Class C shares of the Fund pursuant to Rule12b-1 under the 1940 Act. A distribution fee is charged to Class C shares and paid to Wells Fargo Funds Distributor, LLC (“Funds Distributor”), the principal underwriter, at an annual rate of 0.75% of the average daily net assets of Class C shares.
In addition, Funds Distributor is entitled to receive thefront-end sales charge from the purchase of Class A shares and a contingent deferred sales charge on the redemption of certain Class A shares. Funds Distributor is also entitled to receive the contingent deferred sales charges from redemptions of Class C shares. For the six months ended January 31, 2019, Funds Distributor received $19,668 from the sale of Class A shares. No contingent deferred sales charges were incurred by Class A and Class C shares for the six months ended January 31, 2019.
Shareholder servicing fees
The Trust has entered into contracts with one or more shareholder servicing agents, whereby Class A, Class C, and Administrator Class of the Fund are charged a fee at an annual rate of 0.25% of the average daily net assets of each respective class. Class R4 is charged a fee at an annual rate of 0.10% of its average daily net assets.
A portion of these total shareholder servicing fees were paid to affiliates of Wells Fargo.
Interfund transactions
The Fund may purchase or sell portfolio investment securities to certain other Wells Fargo affiliates pursuant to Rule17a-7 under the 1940 Act and under procedures adopted by the Board of Trustees. The procedures have been designed to ensure that these interfund transactions, which do not incur broker commissions, are effected at current market prices.
5. INVESTMENT PORTFOLIO TRANSACTIONS
Purchases and sales of investments, excluding U.S. government obligations (if any) and short-term securities, for the six months ended January 31, 2019 were $522,392,809 and $765,309,311, respectively.
| | | | | | |
| Notes to financial statements (unaudited) | | Wells Fargo Premier Large Company Growth Fund | | | 27 | |
6. BANK BORROWINGS
The Trust (excluding the money market funds), Wells Fargo Master Trust and Wells Fargo Variable Trust are parties to a $280,000,000 revolving credit agreement whereby the Fund is permitted to use bank borrowings for temporary or emergency purposes, such as to fund shareholder redemption requests. Interest under the credit agreement is charged to the Fund based on a borrowing rate equal to the higher of the Federal Funds rate in effect on that day plus 1.25% or the overnight LIBOR rate in effect on that day plus 1.25%. In addition, an annual commitment fee equal to 0.25% of the unused balance is allocated to each participating fund.
For the six months ended January 31, 2019, there were no borrowings by the Fund under the agreement.
7. DISTRIBUTIONS TO SHAREHOLDERS
Effective for all filings after November 4, 2018, the Securities and Exchange Commission eliminated the requirement to separately state the components of distributions to shareholders under U.S. generally accepted accounting principles. The amounts of distributions to shareholders for the year ended July 31, 2018 were as follows:
| | | | |
| | | Net realized
gains | |
| |
Class A | | | $227,679,727 | |
| |
Class C | | | 54,543,209 | |
| |
Class R4 | | | 746,155 | |
| |
Class R6 | | | 37,680,602 | |
| |
Administrator Class | | | 18,099,486 | |
| |
Institutional Class | | | 222,234,431 | |
8. CONCENTRATION RISK
Concentration risk result from exposure to a limited number of sectors. A fund that invests a substantial portion of its assets in any sector may be more affected by changes in that sector than would be a fund whose investments are not heavily weighted in any sector.
9. INDEMNIFICATION
Under the Trust’s organizational documents, the officers and Trustees have been granted certain indemnification rights against certain liabilities that may arise out of performance of their duties to the Trust. Additionally, in the normal course of business, the Trust may enter into contracts with service providers that contain a variety of indemnification clauses. The Trust’s maximum exposure under these arrangements is dependent on future claims that may be made against the Fund and, therefore, cannot be estimated.
10. NEW ACCOUNTING PRONOUNCEMENT
In August 2018, FASB issued Accounting Standards Update (“ASU”)No. 2018-13, Fair Value Measurement (Topic 820)Disclosure Framework—Changes to the Disclosure Requirements for Fair Value Measurement. ASU2018-13 updates the disclosure requirements for fair value measurements by modifying or removing certain disclosures and adding certain new disclosures. The amendments are effective for fiscal years, and interim periods within those fiscal years, beginning after December 15, 2019. Early adoption is permitted. Management has adopted the removal and modification of disclosures early, as permitted, and will adopt the additional new disclosures at the effective date.
| | | | |
| 28 | | Wells Fargo Premier Large Company Growth Fund | | Other information (unaudited) |
PROXY VOTING INFORMATION
A description of the policies and procedures used to determine how to vote proxies relating to portfolio securities is available, upon request, by calling1-800-222-8222, visiting our website atwellsfargofunds.com, or visiting the SEC website at sec.gov. Information regarding how the Fund voted proxies relating to portfolio securities during the most recent12-month period ended June 30 is available on the Fund’s website atwellsfargofunds.comor by visiting the SEC website at sec.gov.
PORTFOLIO HOLDINGS INFORMATION
The complete portfolio holdings for the Fund are publicly available monthly on the Fund’s website (wellsfargofunds.com), on aone-month delayed basis. In addition, top ten holdings information (excluding derivative positions) for the Fund is publicly available on the Fund’s website on a monthly,seven-day or more delayed basis. The Fund files its complete schedule of portfolio holdings with the SEC for the first and third quarters of each fiscal year on FormN-Q, which is available by visiting the SEC website at sec.gov. In addition, the Fund’s FormN-Q may be reviewed and copied at the SEC’s Public Reference Room in Washington, DC, and at regional offices in New York City, at 233 Broadway, and in Chicago, at 175 West Jackson Boulevard, Suite 900. Information about the Public Reference Room may be obtained by calling1-800-SEC-0330.
| | | | | | |
| Other information (unaudited) | | Wells Fargo Premier Large Company Growth Fund | | | 29 | |
BOARD OF TRUSTEES AND OFFICERS
Each of the Trustees and Officers1 listed in the table below acts in identical capacities for each fund in the Wells Fargo family of funds, which consists of 152 mutual funds comprising the Wells Fargo Funds Trust, Wells Fargo Variable Trust, Wells Fargo Master Trust and fourclosed-end funds (collectively the “Fund Complex”). This table should be read in conjunction with the Prospectus and the Statement of Additional Information2. The mailing address of each Trustee and Officer is 525 Market Street, 12th Floor, San Francisco, CA 94105. Each Trustee and Officer serves an indefinite term, however, each Trustee serves such term until reaching the mandatory retirement age established by the Trustees.
Independent Trustees
| | | | | | |
Name and year of birth | | Position held and
length of service* | | Principal occupations during past five years or longer | | Current other
public company or
investment company
directorships |
| | | |
| William R. Ebsworth (Born 1957) | | Trustee, since 2015 | | Retired. From 1984 to 2013, equities analyst, portfolio manager, research director and chief investment officer at Fidelity Management and Research Company in Boston, Tokyo, and Hong Kong, and retired in 2013 as Chief Investment Officer of Fidelity Strategic Advisers, Inc. where he led a team of investment professionals managing client assets. Prior thereto, Board member of Hong Kong Securities Clearing Co., Hong Kong Options Clearing Corp., the Thailand International Fund, Ltd., Fidelity Investments Life Insurance Company, and Empire Fidelity Investments Life Insurance Company. Audit Committee Chair and Investment Committee Chair of the Vincent Memorial Hospital Endowment(non-profit organization). Mr. Ebsworth is a CFA® charterholder. | | N/A |
| | | |
| Jane A. Freeman (Born 1953) | | Trustee, since 2015; Chair Liaison, since 2018 | | Retired. From 2012 to 2014 and 1999 to 2008, Chief Financial Officer of Scientific Learning Corporation. From 2008 to 2012, Ms. Freeman provided consulting services related to strategic business projects. Prior to 1999, Portfolio Manager at Rockefeller & Co. and Scudder, Stevens & Clark. Board member of the Harding Loevner Funds from 1996 to 2014, serving as both Lead Independent Director and chair of the Audit Committee. Board member of the Russell Exchange Traded Funds Trust from 2011 to 2012 and the chair of the Audit Committee. Ms. Freeman is a Board Member of The Ruth Bancroft Garden(non-profit organization). She is also an inactive Chartered Financial Analyst. | | N/A |
| | | |
| Isaiah Harris, Jr.3 (Born 1952) | | Trustee, since 2009; Audit Committee Chairman, since 2019 | | Retired. Chairman of the Board of CIGNA Corporation since 2009, and Director since 2005. From 2003 to 2011, Director of Deluxe Corporation. Prior thereto, President and CEO of BellSouth Advertising and Publishing Corp. from 2005 to 2007, President and CEO of BellSouth Enterprises from 2004 to 2005 and President of BellSouth Consumer Services from 2000 to 2003. Emeritus member of the Iowa State University Foundation Board of Governors. Emeritus Member of the Advisory Board of Iowa State University School of Business. Advisory Board Member, Palm Harbor Academy (private school). Advisory Board Member, Child Evangelism Fellowship(non-profit). Mr. Harris is a certified public accountant (inactive status). | | CIGNA Corporation |
| | | |
| Judith M. Johnson3 (Born 1949) | | Trustee, since 2008; Audit Committee Chairman, from 2009 to 2018 | | Retired. Prior thereto, Chief Executive Officer and Chief Investment Officer of Minneapolis Employees Retirement Fund from 1996 to 2008. Ms. Johnson is an attorney, certified public accountant and a certified managerial accountant. | | N/A |
| | | |
| David F. Larcker (Born 1950) | | Trustee, since 2009 | | James Irvin Miller Professor of Accounting at the Graduate School of Business, Stanford University, Director of the Corporate Governance Research Initiative and Senior Faculty of The Rock Center for Corporate Governance since 2006. From 2005 to 2008, Professor of Accounting at the Graduate School of Business, Stanford University. Prior thereto, Ernst & Young Professor of Accounting at The Wharton School, University of Pennsylvania from 1985 to 2005. | | N/A |
| | | | |
| 30 | | Wells Fargo Premier Large Company Growth Fund | | Other information (unaudited) |
| | | | | | |
Name and year of birth | | Position held and
length of service* | | Principal occupations during past five years or longer | | Current other
public company or
investment company
directorships |
| | | |
| Olivia S. Mitchell (Born 1953) | | Trustee, since 2006; Nominating and Governance Committee Chairman, since 2018 | | International Foundation of Employee Benefit Plans Professor, Wharton School of the University of Pennsylvania since 1993. Director of Wharton’s Pension Research Council and Boettner Center on Pensions & Retirement Research, and Research Associate at the National Bureau of Economic Research. Previously, Cornell University Professor from 1978 to 1993. | | N/A |
| | | |
| Timothy J. Penny (Born 1951) | | Trustee, since 1996; Chairman, since 2018; Vice Chairman, from 2017 to 2018 | | President and Chief Executive Officer of Southern Minnesota Initiative Foundation, anon-profit organization, since 2007. Member of the Board of Trustees of NorthStar Education Finance, Inc., anon-profit organization, since 2007. | | N/A |
| | | |
| James G. Polisson (Born 1959) | | Trustee, since 2018; Advisory Board Member, from 2017 to 2018 | | Retired. Chief Marketing Officer, Source (ETF) UK Services, Ltd, from 2015 to 2017. From 2012 to 2015, Principal of The Polisson Group, LLC, a management consulting, corporate advisory and principal investing company. Chief Executive Officer and Managing Director at Russell Investments, Global Exchange Traded Funds from 2010 to 2012. Managing Director of Barclays Global Investors from 1998 to 2010 and Global Chief Marketing Officer for iShares and Barclays Global Investors from 2000 to 2010. Trustee of the San Francisco Mechanics’ Institute, anon-profit organization, from 2013 to 2015. Board member of the Russell Exchange Traded Fund Trust from 2011 to 2012. Director of Barclays Global Investors Holdings Deutschland GmbH from 2006 to 2009. Mr. Polisson is an attorney and has a retired status with the Massachusetts and District of Columbia Bar Associations. | | N/A |
| | | |
| Pamela Wheelock (Born 1959) | | Trustee, since 2018; Advisory Board Member, from 2017 to 2018 | | Board member of the Destination Medical Center Economic Development Agency, Rochester, Minnesota since 2019. Chief Operating Officer, Twin Cities Habitat for Humanity from 2017 to 2019. Vice President of University Services, University of Minnesota from 2012 to 2016. Prior thereto, on the Board of Directors, Governance Committee and Finance Committee for the Minnesota Philanthropy Partners (Saint Paul Foundation) from 2012 to 2018, Interim Chief Executive Officer of Blue Cross Blue Shield of Minnesota from 2011 to 2012, Chairman of the Board from 2009 to 2012 and Board Director from 2003 to 2015. Vice President, Leadership and Community Engagement, Bush Foundation, Saint Paul, Minnesota (a private foundation) from 2009 to 2011. Executive Vice President and Chief Financial Officer, Minnesota Sports and Entertainment from 2004 to 2009 and Senior Vice President from 2002 to 2004. Executive Vice President of the Minnesota Wild Foundation from 2004 to 2008. Commissioner of Finance, State of Minnesota, from 1999 to 2002. Currently Board Chair of the Minnesota Wild Foundation since 2010. | | N/A |
| * | Length of service dates reflect the Trustee’s commencement of service with the Trust’s predecessor entities, where applicable. |
| | | | | | |
| Other information (unaudited) | | Wells Fargo Premier Large Company Growth Fund | | | 31 | |
Officers
| | | | | | |
Name and
year of birth | | Position held and
length of service | | Principal occupations during past five years or longer | | |
| | | |
Andrew Owen (Born 1960) | | President, since 2017 | | Executive Vice President of Wells Fargo & Company and Head of Affiliated Managers, Wells Fargo Asset Management, since 2014. In addition, Mr. Owen is currently President, Chief Executive Officer and Director of Wells Fargo Funds Management, LLC since 2017. Prior thereto, Executive Vice President responsible for marketing, investments and product development for Wells Fargo Funds Management, LLC, from 2009 to 2014. | | |
| | | |
| Jeremy DePalma1 (Born 1974) | | Treasurer, since 2012 | | Senior Vice President of Wells Fargo Funds Management, LLC since 2009. Senior Vice President of Evergreen Investment Management Company, LLC from 2008 to 2010 and head of the Fund Reporting and Control Team within Fund Administration from 2005 to 2010. | | |
| | | |
| Alexander Kymn (Born 1973) | | Secretary, since 2018; Chief Legal Officer, since 2018 | | Senior Company Counsel of Wells Fargo Bank, N.A. since 2018 (previously Senior Counsel from 2007 to 2018). Vice President of Wells Fargo Funds Management, LLC from 2008 to 2014. | | |
| | | |
| Michael H. Whitaker(Born 1967) | | Chief Compliance Officer, since 2016 | | Senior Vice President and Chief Compliance Officer since 2016. Senior Vice President and Chief Compliance Officer for Fidelity Investments from 2007 to 2016. | | |
| | | |
David Berardi (Born 1975) | | Assistant Treasurer, since 2009 | | Vice President of Wells Fargo Funds Management, LLC since 2009. Vice President of Evergreen Investment Management Company, LLC from 2008 to 2010. Manager of Fund Reporting and Control for Evergreen Investment Management Company, LLC from 2004 to 2010. | | |
| 1 | Jeremy DePalma acts as Treasurer of 76 funds and Assistant Treasurer of 76 funds in the Fund Complex. |
| 2 | The Statement of Additional Information includes additional information about the Trustees and is available, without charge, upon request, by calling1-800-260-5969 or by visiting the website atwellsfargofunds.com. |
| 3 | Mr. Harris became Chairman of the Audit Committee effective January 1, 2019. |
| | | | |
| 32 | | Wells Fargo Premier Large Company Growth Fund | | Appendix A (unaudited) |
SALES CHARGE REDUCTIONS AND WAIVERS FOR CERTAIN INTERMEDIARIES
Raymond James & Associates, Inc., Raymond James Financial Services & Raymond James affiliates (“Raymond James”)
Effective on or about March 1, 2019, shareholders purchasing Fund shares through a Raymond James platform or account will be eligible only for the following load waivers(front-end sales charge waivers and contingent deferred, orback-end, sales charge waivers) and discounts, which may differ from those disclosed elsewhere in the Fund’s Prospectus or SAI.
Front-end Sales Load Waivers on Class A shares Available at Raymond James
| | • | | Shares purchased in an investment advisory program. |
| | • | | Shares purchased through reinvestment of capital gains distributions and dividend reinvestment when purchasing shares of the same fund (but not any other fund within the fund family). |
| | • | | Employees and registered representatives of Raymond James or its affiliates and their family members as designated by Raymond James. |
| | • | | Shares purchased from the proceeds of redemptions within the same fund family, provided (1) the repurchase occurs within 90 days following the redemption, (2) the redemption and purchase occur in the same account, and (3) redeemed shares were subject to afront-end or deferred sales load (known as Rights of Reinstatement). |
| | • | | A shareholder in the fund’s Class C shares will have their shares automatically exchanged at net asset value to Class A shares (or the appropriate share class) of the fund if the shares are no longer subject to a CDSC and the exchange is in line with the policies and procedures of Raymond James. |
CDSC Waivers on Class A and C Shares Available at Raymond James
| | • | | Death or disability of the shareholder. |
| | • | | Shares sold as part of a systematic withdrawal plan as described in the Fund’s Prospectus. |
| | • | | Return of excess contributions from an IRA Account. |
| | • | | Shares sold as part of a required minimum distribution for IRA and retirement accounts due to the shareholder reaching age 70½ as described in the Fund’s prospectus. |
| | • | | Shares sold to pay Raymond James fees but only if the transaction is initiated by Raymond James. |
| | • | | Shares acquired through a right of reinstatement. |
Front-end Load Discounts Available at Raymond James: Breakpoints, and/or Rights of Accumulation
| | • | | Breakpoints as described in the Fund’s Prospectus. |
| | • | | Rights of accumulation which entitle shareholders to breakpoint discounts will be automatically calculated based on the aggregated holding of fund family assets held by accounts within the purchaser’s household at Raymond James. Eligible fund family assets not held at Raymond James may be included in the rights of accumulation calculation only if the shareholder notifies his or her financial advisor about such assets. |

For more information
More information about Wells Fargo Funds is available free upon request. To obtain literature, please write, visit the Fund’s website, or call:
Wells Fargo Funds
P.O. Box 219967
Kansas City, MO 64121-9967
Website: wellsfargofunds.com
Individual investors: 1-800-222-8222
Retail investment professionals: 1-888-877-9275
Institutional investment professionals: 1-866-765-0778
This report and the financial statements contained herein are submitted for the general information of the shareholders of the Fund. If this report is used for promotional purposes, distribution of the report must be accompanied or preceded by a current prospectus. Before investing, please consider the investment objectives, risks, charges, and expenses of the investment. For a current prospectus and, if available, a summary prospectus, containing this information, call1-800-222-8222 or visit the Fund’s website atwellsfargofunds.com. Read the prospectus carefully before you invest or send money.
Wells Fargo Asset Management (WFAM) is the trade name for certain investment advisory/management firms owned by Wells Fargo & Company. These firms include but are not limited to Wells Capital Management Incorporated and Wells Fargo Funds Management, LLC. Certain products managed by WFAM entities are distributed by Wells Fargo Funds Distributor, LLC (a broker/dealer and Member FINRA).
This material is for general informational and educational purposes only and is NOT intended to provide investment advice or a recommendation of any kind—including a recommendation for any specific investment, strategy, or plan.
INVESTMENT PRODUCTS: NOT FDIC INSURED ◾ NO BANK GUARANTEE ◾ MAY LOSE VALUE
© 2019 Wells Fargo Funds Management, LLC. All rights reserved.
| | |
 | | 320778 03-19 SA212/SAR212 01-19 |
Not applicable.
| ITEM 3. | AUDIT COMMITTEE FINANCIAL EXPERT |
Not applicable.
| ITEM 4. | PRINCIPAL ACCOUNTANT FEES AND SERVICES |
Not applicable.
| ITEM 5. | AUDIT COMMITTEE OF LISTED REGISTRANTS |
Not applicable.
A Portfolio of Investments for each series of Wells Fargo Funds Trust is included as part of the report to shareholders filed under Item 1 of this Form.
| ITEM 7. | DISCLOSURE OF PROXY VOTING POLICIES AND PROCEDURES FORCLOSED-END MANAGEMENT INVESTMENT COMPANIES |
Not applicable.
| ITEM 8. | PORTFOLIO MANAGERS OFCLOSED-END MANAGEMENT INVESTMENT COMPANIES |
Not applicable.
| ITEM 9. | PURCHASES OF EQUITY SECURITIES BYCLOSED-END MANAGEMENT INVESTMENT COMPANY AND AFFILIATED PURCHASERS |
Not applicable.
| ITEM 10. | SUBMISSION OF MATTERS TO A VOTE OF SECURITY HOLDERS |
There have been no material changes to the procedures by which shareholders may recommend nominees to the registrant’s Board of Trustees that have been implemented since the registrant’s last provided disclosure in response to the requirements of this Item.
| ITEM 11. | CONTROLS AND PROCEDURES |
(a) The President and Treasurer have concluded that the Wells Fargo Funds Trust (the “Trust”) disclosure controls and procedures (as defined in Rule30a-3(c) under the Investment Company Act of 1940) provide reasonable assurances that material information relating to the Trust is made known to them by the appropriate persons, based on their evaluation of these controls and procedures as of a date within 90 days of the filing of this report.
(b) There were no significant changes in the Trust’s internal controls over financial reporting (as defined in Rule30a-3(d) under the Investment Company Act of 1940) that occurred during the second fiscal quarter of the period covered by this report that materially affected, or is reasonably likely to materially affect, the registrant’s internal control over financial reporting.
| ITEM 12. | DISCLOSURES OF SECURITIES LENDING ACTIVITIES FORCLOSED-END MANAGEMENT INVESTMENT COMPANIES |
Not applicable.
(a)(1) Not applicable.
(a)(2) Certification pursuant to Rule30a-2(a) under the Investment Company Act of 1940 (17 CFR270.30a-2(a)) is filed and attached hereto as Exhibit 99.CERT.
(a)(3) Not applicable.
(b) Certification pursuant to Rule30a-2(b) under the Investment Company Act of 1940 (17 CFR270.30a-2(b)) is filed and attached hereto as Exhibit 99.906CERT.
SIGNATURES
Pursuant to the requirements of the Securities Exchange Act of 1934 and the Investment Company Act of 1940, the registrant has duly caused this report to be signed on its behalf by the undersigned, thereunto duly authorized.
| | |
| Wells Fargo Funds Trust |
| |
| By: | | /s/ Andrew Owen |
| |
| | Andrew Owen |
| | President |
|
| Date: March 27, 2019 |
Pursuant to the requirements of the Securities Exchange Act of 1934 and the Investment Company Act of 1940, this report has been signed below by the following persons on behalf of the registrant and in the capacities and on the date indicated.
| | |
| Wells Fargo Funds Trust |
| |
| By: | | /s/ Andrew Owen |
| |
| | Andrew Owen |
| | President |
| | |
| |
| By: | | /s/ Jeremy DePalma |
| |
| | Jeremy DePalma |
| | Treasurer |