
UNITED STATES
SECURITIES AND EXCHANGE COMMISSION
Washington, D.C. 20549
FORMN-CSRS
CERTIFIED SHAREHOLDER REPORT OF REGISTERED
MANAGEMENT INVESTMENT COMPANIES
Investment Company Act file number:811-09253
Wells Fargo Funds Trust
(Exact name of registrant as specified in charter)
525 Market St., San Francisco, CA 94105
(Address of principal executive offices) (Zip code)
Alexander Kymn
Wells Fargo Funds Management, LLC
525 Market St., San Francisco, CA 94105
(Name and address of agent for service)
Registrant’s telephone number, including area code:800-222-8222
Date of fiscal year end: August 31
Registrant is making a filing for 9 of its series:
Wells Fargo Adjustable Rate Government Fund, Wells Fargo Conservative Income Fund, Wells Fargo Government Securities Fund, Wells Fargo High Yield Bond Fund, Wells Fargo Core Plus Bond Fund, Wells Fargo Short Duration Government Bond Fund, Wells Fargo Short-Term Bond Fund, Wells Fargo Short-Term High Yield Bond Fund, and Wells Fargo Ultra Short-Term Income Fund.
Date of reporting period: February 28, 2019
| ITEM 1. | REPORT TO STOCKHOLDERS |
Semi-Annual Report
February 28, 2019

Wells Fargo Core Plus Bond Fund

Beginning on January 1, 2021, as permitted by new regulations adopted by the Securities and Exchange Commission, paper copies of the Wells Fargo Funds’ annual and semi-annual shareholder reports issued after this date will no longer be sent by mail, unless you specifically request paper copies of the reports. Instead, the reports will be made available on the Funds’ website, and you will be notified by mail each time a report is posted and provided with a website address to access the report.
If you already elected to receive shareholder reports electronically, you will not be affected by this change and you need not take any action. You may elect to receive shareholder reports and other communications from the Fund electronically at any time by contacting your financial intermediary (such as a broker-dealer or bank) or, if you are a direct investor, by calling 1-800-222-8222 or by enrolling at wellsfargo.com/advantagedelivery.
You may elect to receive all future reports in paper free of charge. If you invest through a financial intermediary, you can contact your financial intermediary to request that you continue to receive paper copies of your shareholder reports; if you invest directly with the Fund, you can call 1-800-222-8222. Your election to receive reports in paper will apply to all Wells Fargo Funds held in your account with your financial intermediary or, if you are a direct investor, to all Wells Fargo Funds that you hold.

Reduce clutter. Save trees.
Sign up for electronic delivery of prospectuses and shareholder reports atwellsfargo.com/advantagedelivery
Contents
The views expressed and any forward-looking statements are as of February 28, 2019, unless otherwise noted, and are those of the Fund managers and/or Wells Fargo Funds Management, LLC. Discussions of individual securities, or the markets generally, or any Wells Fargo Fund are not intended as individual recommendations. Future events or results may vary significantly from those expressed in any forward-looking statements. The views expressed are subject to change at any time in response to changing circumstances in the market. Wells Fargo Funds Management, LLC and the Fund disclaim any obligation to publicly update or revise any views expressed or forward-looking statements.
INVESTMENT PRODUCTS: NOT FDIC INSURED ◾ NO BANK GUARANTEE ◾ MAY LOSE VALUE
| | | | |
| 2 | | Wells Fargo Core Plus Bond Fund | | Letter to shareholders (unaudited) |

Andrew Owen
President
Wells Fargo Funds
Favorable third-quarter economic indicators and corporate earnings reports encouraged domestic stock investors.
Dear Shareholder:
We are pleased to offer you this semi-annual report for the Wells Fargo Core Plus Bond Fund for the six-month period that ended February 28, 2019. Highershort-term interest rates, inflation concerns, trade tensions, slowing economic growth outside the U.S., and geopolitical events contributed to investment market volatility throughout the period.
For the period, U.S. stocks, as measured by the S&P 500 Index,1 fell 3.04% and international stocks, as measured by the MSCI ACWI ex USA Index (Net),2 declined 2.47%. Based on the MSCI EM Index (Net),3 emerging market stocks gained 0.33%. For bond investors, the Bloomberg Barclays U.S. Aggregate Bond Index4 added 1.99% while the Bloomberg Barclays Global Aggregate ex-USD Index5 gained 0.63%. The Bloomberg Barclays Municipal Bond Index6 added 2.34%, and the ICE BofAML U.S. High Yield Index7 advanced 1.98%.
Investors appeared to shake off lingering concerns during the third quarter.
Favorable third-quarter economic indicators and corporate earnings reports encouraged domestic stock investors. U.S. trade negotiations with Mexico and Canada progressed. The Conference Board Consumer Confidence Index®8 reached its highest level in 18 years during September 2018. The U.S. Federal Reserve (Fed) raised the federal funds rate by 25 basis points (bps; 100 bps equal 1.00%) to a target range of between 2.00% and 2.25% in September 2018. For the quarter that ended September 30, 2018, the S&P 500 Index added 7.71%.
Investors in international markets were not as confident. Tensions between the U.S. and China increased. The U.S. imposed $200 billion in tariffs on Chinese goods. China reacted with $60 billion in tariffs on U.S. goods. Economic growth in China caused concern. The Bank of England (BOE) raised its monetary policy rate to 0.75% in August. During the quarter, the MSCI ACWI ex USA Index (Net) gained 0.71%. The MSCI EM Index (Net) declined 1.09%. In fixed-income markets, U.S. bonds were flat, as measured by the Bloomberg Barclays U.S. Aggregate Bond Index. The Bloomberg Barclays Global Aggregate ex-USD Index fell 1.74%.
| 1 | The S&P 500 Index consists of 500 stocks chosen for market size, liquidity, and industry group representation. It is a market-value-weighted index with each stock’s weight in the index proportionate to its market value. You cannot invest directly in an index. |
| 2 | The Morgan Stanley Capital International (MSCI) All Country World Index (ACWI) ex USA Index (Net) is a free-float-adjusted market-capitalization-weighted index that is designed to measure the equity market performance of developed markets, excluding the United States and Canada. Source: MSCI. MSCI makes no express or implied warranties or representations and shall have no liability whatsoever with respect to any MSCI data contained herein. The MSCI data may not be further redistributed or used as a basis for other indices or any securities or financial products. This report is not approved, reviewed, or produced by MSCI. You cannot invest directly in an index. |
| 3 | The MSCI Emerging Markets (EM) Index (Net) is a free-float-adjusted market-capitalization-weighted index that is designed to measure large- and mid-cap equity market performance of emerging markets. The MSCI EM Index (Net) consists of the following 24 emerging market country indices: Brazil, Chile, China, Colombia, Czech Republic, Egypt, Greece, Hungary, India, Indonesia, Korea, Malaysia, Mexico, Pakistan, Peru, the Philippines, Poland, Qatar, Russia, South Africa, Taiwan, Thailand, Turkey, and the United Arab Emirates. You cannot invest directly in an index. |
| 4 | The Bloomberg Barclays U.S. Aggregate Bond Index is a broad-based benchmark that measures the investment-grade, U.S. dollar-denominated, fixed-rate taxable bond market, including Treasuries, government-related and corporate securities, mortgage-backed securities (agency fixed-rate and hybrid adjustable-rate mortgage pass-throughs), asset-backed securities, and commercial mortgage-backed securities. You cannot invest directly in an index. |
| 5 | The Bloomberg Barclays Global Aggregate ex-USD Index is an unmanaged index that provides a broad-based measure of the global investment-grade fixed-income markets excluding the U.S. dollar-denominated debt market. You cannot invest directly in an index. |
| 6 | The Bloomberg Barclays Municipal Bond Index is an unmanaged index composed of long-term tax-exempt bonds with a minimum credit rating of Baa. You cannot invest directly in an index. |
| 7 | The ICE BofAML U.S. High Yield Index is a market-capitalization-weighted index of domestic and Yankee high-yield bonds. The index tracks the performance of high-yield securities traded in the U.S. bond market. You cannot invest directly in an index. Copyright 2019. ICE Data Indices, LLC. All rights reserved. |
| 8 | The Conference Board Consumer Confidence Index® measures the degree of optimism on the state of the U.S. economy that consumers are expressing through their activities of savings and spending. You cannot invest directly in an index. |
| | | | | | |
| Letter to shareholders (unaudited) | | Wells Fargo Core Plus Bond Fund | | | 3 | |
Conflicting data unsettled markets during the fourth quarter.
November’s U.S. midterm elections shifted control of the House of Representatives from Republicans to Democrats, presaging potential partisan clashes.Third-quarter U.S. gross domestic product (GDP) was announced at an annualized 3.4% rate, lower than the second-quarter rate. Brexit efforts stalled ahead of the March 2019 deadline. The People’s Bank of China cut reserve requirement ratios, accelerated infrastructure spending, and cut taxes even as the value of the yuan declined to low levels last seen in 2008.
December’s S&P 500 Index performance was the worst since 1931. Globally,fixed-income investments fared better than stocks during the last two months of the year. The Fed increased the federal funds rate by 25 bps in December 2018 to a target range of between 2.25% and 2.50% and softened its outlook for 2019 rate increases.
The market climbs a wall of worry.
Investors entered 2019 with reasons to be concerned. A partial U.S. government shutdown driven by partisan spending and immigration policy disputes extended into January. Investors expected high levels of stock market volatility to continue based on the VIX9.
January’s returns tended to support the investing adage that markets climb a wall of worry. The S&P 500 Index gained 8.01% for the month that ended January 31, 2019, its best monthly performance in 30 years. Returns for the MSCI ACWI ex USA Index (Net), the Bloomberg Barclays U.S. Aggregate Bond Index, and the Bloomberg Barclays Global Aggregate ex-USD Index also were positive.
In February, concerns over slowing global growth reemerged. The Bureau of Economic Analysis announced fourth-quarter 2018 GDP grew at an annualized 2.2% rate, down from the 4.2% annualized rate for the second quarter and the 3.4% annualized rate for the third quarter. Analysts attributed the lower growth rate to a slowing housing market and larger trade deficit. The U.S. Labor Department said that the economy created just 20,000 jobs in February. In a February report, the BOE forecast the slowest growth since the financial crisis for 2019. China and the U.S., while putting future tariffs on hold for the time being, continued to wrangle over trade issues.
Don’t let short-term uncertainty derail long-term investment goals.
Periods of investment uncertainty can present challenges, but experience has taught us that maintaining long-term investment goals can be an effective way to plan for the future. To help you create a sound strategy based on your personal goals and risk tolerance, Wells Fargo Funds offers more than 100 mutual funds spanning a wide range of asset classes and investment styles. Although diversification cannot guarantee an investment profit or prevent losses, we believe it can be an effective way to manage investment risk and potentially smooth out overall portfolio performance. We encourage investors to know their investments and to understand that appropriate levels of risk-taking may unlock opportunities.
January’s returns tended to support the investing adage that markets climb a wall of worry.
| 9 | The Chicago Board Options Exchange Market Volatility Index (VIX) is a popular measure of the implied volatility of S&P 500 Index options. It represents one measure of the market’s expectation of stock market volatility over the next 30-day period. You cannot invest directly in an index. |
| | | | |
| 4 | | Wells Fargo Core Plus Bond Fund | | Letter to shareholders (unaudited) |
Thank you for choosing to invest with Wells Fargo Funds. We appreciate your confidence in us and remain committed to helping you meet your financial needs.
Sincerely,

Andrew Owen
President
Wells Fargo Funds
For further information about your Fund, contact your investment professional, visit our website atwfam.com, or call us directly at1-800-222-8222.
This page is intentionally left blank.
| | | | |
| 6 | | Wells Fargo Core Plus Bond Fund | | Performance highlights (unaudited) |
Investment objective
The Fund seeks total return, consisting of current income and capital appreciation.
Manager
Wells Fargo Funds Management, LLC
Subadviser
Wells Capital Management Incorporated
Portfolio managers
Christopher Y. Kauffman, CFA®‡
Jay N. Mueller, CFA®‡
Thomas M. Price, CFA®‡
Janet S. Rilling, CFA®‡, CPA
Michael J. Schueller, CFA®‡
Noah M. Wise, CFA®‡
Average annual total returns (%) as of February 28, 2019
| | | | | | | | | | | | | | | | | | | | | | | | | | | | | | | | | | |
| | | | | Including sales charge | | | Excluding sales charge | | | Expense ratios1 (%) | |
| | | Inception date | | 1 year | | | 5 year | | | 10 year | | | 1 year | | | 5 year | | | 10 year | | | Gross | | | Net2 | |
| | | | | | | | | |
| Class A (STYAX) | | 7-13-1998 | | | -1.72 | | | | 2.28 | | | | 4.52 | | | | 2.89 | | | | 3.22 | | | | 4.99 | | | | 0.93 | | | | 0.74 | |
| | | | | | | | | |
| Class C (WFIPX) | | 7-13-1998 | | | 1.09 | | | | 2.44 | | | | 4.22 | | | | 2.09 | | | | 2.44 | | | | 4.22 | | | | 1.68 | | | | 1.49 | |
| | | | | | | | | |
| Class R6 (STYJX)3 | | 10-31-2016 | | | – | | | | – | | | | – | | | | 3.28 | | | | 3.55 | | | | 5.34 | | | | 0.55 | | | | 0.36 | |
| | | | | | | | | |
| Administrator Class (WIPDX)4 | | 7-30-2010 | | | – | | | | – | | | | – | | | | 3.00 | | | | 3.33 | | | | 5.13 | | | | 0.87 | | | | 0.63 | |
| | | | | | | | | |
| Institutional Class (WIPIX) | | 7-18-2008 | | | – | | | | – | | | | – | | | | 3.14 | | | | 3.51 | | | | 5.32 | | | | 0.60 | | | | 0.41 | |
| | | | | | | | | |
| Bloomberg Barclays U.S. Aggregate Bond Index5 | | – | | | – | | | | – | | | | – | | | | 3.17 | | | | 2.32 | | | | 3.71 | | | | – | | | | – | |
Figures quoted represent past performance, which is no guarantee of future results, and do not reflect taxes that a shareholder may pay on fund distributions or the redemption of fund shares. Investment return and principal value of an investment will fluctuate so that an investor’s shares, when redeemed, may be worth more or less than their original cost. Performance shown without sales charges would be lower if sales charges were reflected. Current performance may be lower or higher than the performance data quoted, which assumes the reinvestment of dividends and capital gains. Current month-end performance is available on the Fund’s website, wfam.com.
Index returns do not include transaction costs associated with buying and selling securities, any mutual fund fees or expenses, or any taxes. It is not possible to invest directly in an index.
For Class A shares, the maximum front-end sales charge is 4.50%. For Class C shares, the maximum contingent deferred sales charge is 1.00%. Performance including a contingent deferred sales charge assumes the sales charge for the corresponding time period. Class R6, Administrator Class, and Institutional Class shares are sold without a front-end sales charge or contingent deferred sales charge.
Bond values fluctuate in response to the financial condition of individual issuers, general market and economic conditions, and changes in interest rates. Changes in market conditions and government policies may lead to periods of heightened volatility in the bond market and reduced liquidity for certain bonds held by the Fund. In general, when interest rates rise, bond values fall and investors may lose principal value. Interest-rate changes and their impact on the Fund and its share price can be sudden and unpredictable. Loans are subject to risks similar to those associated with other below-investment-grade bond investments, such as risk of greater volatility in value, credit risk (for example, risk of issuer default), and risk that the loan may become illiquid or difficult to price. The use of derivatives may reduce returns and/or increase volatility. Certain investment strategies tend to increase the total risk of an investment (relative to the broader market). The Fund is exposed to foreign investment risk, high-yield securities risk, and mortgage and asset-backed securities risk. High-yield securities have a greater risk of default and tend to be more volatile than higher rated debt securities. Consult the Fund’s prospectus for additional information on these and other risks.
Please see footnotes on page 7.
| | | | | | |
| Performance highlights (unaudited) | | Wells Fargo Core Plus Bond Fund | | | 7 | |
| | | | |
| Ten largest holdings (%) as of February 28, 20196 | |
| |
FNMA, 3.50%, 3-1-2048 | | | 2.28 | |
| |
Vaneck Vectors JP Morgan Emerging Markets Local Currency Bond ETF | | | 1.83 | |
| |
FNMA, 3.00%, 11-1-2047 | | | 1.38 | |
| |
U.S. Treasury Note, 2.00%, 10-31-2022 | | | 1.34 | |
| |
FNMA, 4.00%, 6-1-2048 | | | 1.26 | |
| |
U.S. Treasury Bond, 0.00%, 11-15-2027 | | | 1.26 | |
| |
FNMA, 4.50%, 3-13-2049 | | | 1.26 | |
| |
GNMA, 3.50%, 12-20-2047 | | | 1.25 | |
| |
U.S. Treasury Bond, 4.25%, 11-15-2040 | | | 1.21 | |
| |
U.S. Treasury Bond, 3.00%, 8-15-2048 | | | 1.11 | |
|
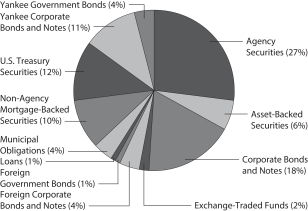
| Portfolio composition as of February 28, 20197 |
|
 |
| ‡ | CFA® and Chartered Financial Analyst® are trademarks owned by CFA Institute. |
| 1 | Reflects the expense ratios as stated in the most recent prospectuses, which include the impact of 0.01% in acquired fund fees and expenses. The expense ratios shown are subject to change and may differ from the annualized expense ratios shown in the financial highlights of this report, which do not include acquired fund fees and expenses. |
| 2 | The manager has contractually committed through December 31, 2019, to waive fees and/or reimburse expenses to the extent necessary to cap the expenses of each class after fee waivers at 0.73% for Class A, 1.48% for Class C, 0.35% for Class R6, 0.62% for Administrator Class, and 0.40% for Institutional Class. Brokerage commissions, stamp duty fees, interest, taxes, acquired fund fees and expenses (if any), and extraordinary expenses are excluded from the expense cap. Prior to or after the commitment expiration date, the cap may be increased or the commitment to maintain the cap may be terminated only with the approval of the Board of Trustees. Without this cap, the Fund’s returns would have been lower. The expense ratio paid by an investor is the net expense ratio (the total annual fund operating expenses after fee waivers) as stated in the prospectuses. |
| 3 | Historical performance shown for Class R6 shares prior to their inception reflects the performance of the Institutional Class shares, and includes the higher expenses applicable to the Institutional Class shares. If these expenses had not been included, returns for Class R6 shares would be higher. |
| 4 | Historical performance shown for Administrator Class shares prior to their inception reflects the performance of Institutional Class shares and has been adjusted to include the higher expenses applicable to Administrator Class shares. |
| 5 | The Bloomberg Barclays U.S. Aggregate Bond Index is a broad-based benchmark that measures the investment-grade, U.S. dollar–denominated, fixed-rate taxable bond market, including Treasuries, government-related and corporate securities, mortgage-backed securities (agency fixed-rate and hybrid adjustable-rate mortgage pass-throughs), asset-backed securities, and commercial mortgage-backed securities. You cannot invest directly in an index. |
| 6 | The ten largest holdings, excluding cash, cash equivalents and any money market funds, are calculated based on the value of the investments divided by total net assets of the Fund. Holdings are subject to change and may have changed since the date specified. |
| 7 | Amounts are calculated based on the total long-term investments of the Fund. These amounts are subject to change and may have changed since the date specified. |
| | | | |
| 8 | | Wells Fargo Core Plus Bond Fund | | Fund expenses (unaudited) |
As a shareholder of the Fund, you incur two types of costs: (1) transaction costs, including sales charges (loads) on purchase payments and contingent deferred sales charges (if any) on redemptions and (2) ongoing costs, including management fees, distribution (12b-1) and/or shareholder servicing fees, and other Fund expenses. This example is intended to help you understand your ongoing costs (in dollars) of investing in the Fund and to compare these costs with the ongoing costs of investing in other mutual funds.
The example is based on an investment of $1,000 invested at the beginning of the six-month period and held for the entire period from September 1, 2018 to February 28, 2019.
Actual expenses
The “Actual” line of the table below provides information about actual account values and actual expenses. You may use the information in this line, together with the amount you invested, to estimate the expenses that you paid over the period. Simply divide your account value by $1,000 (for example, an $8,600 account value divided by $1,000 = 8.6), then multiply the result by the number in the “Actual” line under the heading entitled “Expenses paid during period” for your applicable class of shares to estimate the expenses you paid on your account during this period.
Hypothetical example for comparison purposes
The “Hypothetical” line of the table below provides information about hypothetical account values and hypothetical expenses based on the Fund’s actual expense ratio and an assumed rate of return of 5% per year before expenses, which is not the Fund’s actual return. The hypothetical account values and expenses may not be used to estimate the actual ending account balance or expenses you paid for the period. You may use this information to compare the ongoing costs of investing in the Fund and other funds. To do so, compare this 5% hypothetical example with the 5% hypothetical examples that appear in the shareholder reports of the other funds.
Please note that the expenses shown in the table are meant to highlight your ongoing costs only and do not reflect any transactional costs, such as sales charges (loads) and contingent deferred sales charges. Therefore, the “Hypothetical” line of the table is useful in comparing ongoing costs only and will not help you determine the relative total costs of owning different funds. In addition, if these transactional costs were included, your costs would have been higher.
| | | | | | | | | | | | | | | | |
| | | Beginning
account value
9-1-2018 | | | Ending
account value
2-28-2019 | | | Expenses
paid during
the period¹ | | | Annualized net
expense ratio | |
Class A | | | | | | | | | | | | | | | | |
| | | | |
Actual | | $ | 1,000.00 | | | $ | 1,022.96 | | | $ | 3.66 | | | | 0.73 | % |
| | | | |
Hypothetical (5% return before expenses) | | $ | 1,000.00 | | | $ | 1,021.17 | | | $ | 3.66 | | | | 0.73 | % |
Class C | | | | | | | | | | | | | | | | |
| | | | |
Actual | | $ | 1,000.00 | | | $ | 1,019.00 | | | $ | 7.41 | | | | 1.48 | % |
| | | | |
Hypothetical (5% return before expenses) | | $ | 1,000.00 | | | $ | 1,017.46 | | | $ | 7.40 | | | | 1.48 | % |
Class R6 | | | | | | | | | | | | | | | | |
| | | | |
Actual | | $ | 1,000.00 | | | $ | 1,024.82 | | | $ | 1.76 | | | | 0.35 | % |
| | | | |
Hypothetical (5% return before expenses) | | $ | 1,000.00 | | | $ | 1,023.06 | | | $ | 1.76 | | | | 0.35 | % |
Administrator Class | | | | | | | | | | | | | | | | |
| | | | |
Actual | | $ | 1,000.00 | | | $ | 1,023.50 | | | $ | 3.11 | | | | 0.62 | % |
| | | | |
Hypothetical (5% return before expenses) | | $ | 1,000.00 | | | $ | 1,021.72 | | | $ | 3.11 | | | | 0.62 | % |
Institutional Class | | | | | | | | | | | | | | | | |
| | | | |
Actual | | $ | 1,000.00 | | | $ | 1,024.59 | | | $ | 2.01 | | | | 0.40 | % |
| | | | |
Hypothetical (5% return before expenses) | | $ | 1,000.00 | | | $ | 1,022.81 | | | $ | 2.01 | | | | 0.40 | % |
| 1 | Expenses paid is equal to the annualized net expense ratio of each class multiplied by the average account value over the period, multiplied by the number of days in the most recent fiscal half-year divided by the number of days in the fiscal year (to reflect the one-half-year period). |
| | | | | | |
| Portfolio of investments—February 28, 2019 (unaudited) | | Wells Fargo Core Plus Bond Fund | | | 9 | |
| | | | | | | | | | | | | | | | |
| Security name | | Interest rate | | | Maturity date | | | Principal | | | Value | |
| | | | |
Agency Securities: 24.70% | | | | | | | | | | | | | | | | |
| | | | |
FHLB | | | 3.25 | % | | | 11-16-2028 | | | $ | 5,850,000 | | | $ | 5,968,591 | |
| | | | |
FHLMC | | | 3.50 | | | | 12-1-2045 | | | | 3,452,415 | | | | 3,468,127 | |
| | | | |
FHLMC | | | 3.50 | | | | 12-1-2045 | | | | 1,217,744 | | | | 1,223,286 | |
| | | | |
FHLMC | | | 4.00 | | | | 6-1-2044 | | | | 2,579,033 | | | | 2,640,778 | |
| | | | |
FHLMC (12 Month LIBOR +1.33%) ± | | | 4.15 | | | | 1-1-2036 | | | | 20,872 | | | | 21,536 | |
| | | | |
FHLMC | | | 5.00 | | | | 6-1-2036 | | | | 247,257 | | | | 264,524 | |
| | | | |
FHLMC | | | 5.00 | | | | 8-1-2040 | | | | 226,495 | | | | 242,819 | |
| | | | |
FHLMC | | | 5.50 | | | | 8-1-2038 | | | | 55,097 | | | | 59,689 | |
| | | | |
FHLMC | | | 5.50 | | | | 12-1-2038 | | | | 491,227 | | | | 532,332 | |
| | | | |
FHLMC | | | 5.50 | | | | 6-1-2040 | | | | 808,773 | | | | 872,497 | |
| | | | |
FHLMC | | | 8.00 | | | | 2-1-2030 | | | | 208 | | | | 237 | |
| | | | |
FHLMC Series 2015-SC01 Class 1A | | | 3.50 | | | | 5-25-2045 | | | | 879,540 | | | | 873,294 | |
| | | | |
FHLMC Series 3774 Class AB | | | 3.50 | | | | 12-15-2020 | | | | 62,320 | | | | 62,606 | |
| | | | |
FHLMC Series K020 Class X1 ±±(c) | | | 1.41 | | | | 5-25-2022 | | | | 13,212,539 | | | | 499,011 | |
| | | | |
FHLMC Series T-42 Class A5 | | | 7.50 | | | | 2-25-2042 | | | | 1,445,001 | | | | 1,681,330 | |
| | | | |
FHLMC Series T-57 Class 2A1 ±± | | | 4.10 | | | | 7-25-2043 | | | | 44,135 | | | | 46,696 | |
| | | | |
FHLMC Series T-59 Class 2A1 ±± | | | 3.97 | | | | 10-25-2043 | | | | 223,772 | | | | 227,106 | |
| | | | |
FNMA | | | 3.50 | | | | 3-1-2048 | | | | 13,683,782 | | | | 13,701,910 | |
| | | | |
FNMA ¤ | | | 0.00 | | | | 10-9-2019 | | | | 5,000,000 | | | | 4,922,312 | |
| | | | |
FNMA | | | 2.27 | | | | 3-1-2019 | | | | 2,397,455 | | | | 2,392,730 | |
| | | | |
FNMA (12 Month LIBOR +1.61%) ± | | | 2.49 | | | | 5-1-2046 | | | | 1,355,806 | | | | 1,346,530 | |
| | | | |
FNMA (12 Month LIBOR +1.61%) ± | | | 2.51 | | | | 3-1-2046 | | | | 1,236,140 | | | | 1,229,482 | |
| | | | |
FNMA | | | 3.00 | | | | 2-1-2034 | | | | 1,843,254 | | | | 1,840,462 | |
| | | | |
FNMA | | | 3.00 | | | | 11-1-2045 | | | | 2,050,565 | | | | 2,006,585 | |
| | | | |
FNMA | | | 3.00 | | | | 12-1-2045 | | | | 5,194,762 | | | | 5,081,739 | |
| | | | |
FNMA | | | 3.00 | | | | 12-1-2046 | | | | 2,388,562 | | | | 2,335,842 | |
| | | | |
FNMA | | | 3.00 | | | | 11-1-2047 | | | | 8,448,289 | | | | 8,259,377 | |
| | | | |
FNMA | | | 3.00 | | | | 4-1-2048 | | | | 5,867,802 | | | | 5,734,821 | |
| | | | |
FNMA | | | 3.02 | | | | 2-1-2026 | | | | 3,176,692 | | | | 3,167,104 | |
| | | | |
FNMA | | | 3.27 | | | | 7-1-2022 | | | | 1,200,581 | | | | 1,219,229 | |
| | | | |
FNMA | | | 3.50 | | | | 10-1-2043 | | | | 1,001,244 | | | | 1,008,577 | |
| | | | |
FNMA | | | 3.50 | | | | 4-1-2045 | | | | 271,169 | | | | 272,442 | |
| | | | |
FNMA | | | 3.50 | | | | 8-1-2045 | | | | 6,174,468 | | | | 6,201,547 | |
| | | | |
FNMA | | | 3.95 | | | | 9-1-2021 | | | | 401,782 | | | | 412,104 | |
| | | | |
FNMA | | | 4.00 | | | | 2-1-2046 | | | | 488,592 | | | | 500,004 | |
| | | | |
FNMA | | | 4.00 | | | | 4-1-2046 | | | | 2,718,755 | | | | 2,782,535 | |
| | | | |
FNMA | | | 4.00 | | | | 6-1-2048 | | | | 7,419,019 | | | | 7,567,361 | |
| | | | |
FNMA | | | 4.00 | | | | 9-1-2048 | | | | 4,909,293 | | | | 5,007,943 | |
| | | | |
FNMA | | | 4.00 | | | | 9-1-2048 | | | | 3,988,529 | | | | 4,068,675 | |
| | | | |
FNMA | | | 4.00 | | | | 10-1-2048 | | | | 689,085 | | | | 702,863 | |
| | | | |
FNMA | | | 4.26 | | | | 4-1-2021 | | | | 2,643,464 | | | | 2,721,248 | |
| | | | |
FNMA %% | | | 4.50 | | | | 3-13-2049 | | | | 7,295,000 | | | | 7,547,360 | |
| | | | |
FNMA (1 Year Treasury Constant Maturity +2.26%) ± | | | 4.50 | | | | 8-1-2036 | | | | 776,940 | | | | 817,191 | |
| | | | |
FNMA (12 Month LIBOR +1.78%) ± | | | 4.56 | | | | 8-1-2036 | | | | 20,827 | | | | 21,765 | |
| | | | |
FNMA (12 Month LIBOR +1.73%) ± | | | 4.60 | | | | 9-1-2036 | | | | 16,347 | | | | 17,017 | |
| | | | |
FNMA (1 Year Treasury Constant Maturity +2.27%) ± | | | 4.91 | | | | 1-1-2036 | | | | 66,227 | | | | 69,813 | |
| | | | |
FNMA | | | 5.00 | | | | 1-1-2024 | | | | 59,295 | | | | 60,704 | |
| | | | |
FNMA | | | 5.00 | | | | 2-1-2036 | | | | 25,846 | | | | 27,610 | |
| | | | |
FNMA | | | 5.00 | | | | 6-1-2040 | | | | 89,789 | | | | 96,124 | |
| | | | |
FNMA | | | 5.00 | | | | 8-1-2040 | | | | 1,522,046 | | | | 1,629,432 | |
The accompanying notes are an integral part of these financial statements.
| | | | |
| 10 | �� | Wells Fargo Core Plus Bond Fund | | Portfolio of investments—February 28, 2019 (unaudited) |
| | | | | | | | | | | | | | | | |
| Security name | | Interest rate | | | Maturity date | | | Principal | | | Value | |
| | | | |
Agency Securities(continued) | | | | | | | | | | | | | | | | |
| | | | |
FNMA | | | 5.50 | % | | | 11-1-2023 | | | $ | 41,904 | | | $ | 43,528 | |
| | | | |
FNMA | | | 5.50 | | | | 8-1-2034 | | | | 89,210 | | | | 97,077 | |
| | | | |
FNMA | | | 5.50 | | | | 2-1-2035 | | | | 27,294 | | | | 29,702 | |
| | | | |
FNMA | | | 5.50 | | | | 8-1-2038 | | | | 103,746 | | | | 109,982 | |
| | | | |
FNMA | | | 5.50 | | | | 8-1-2038 | | | | 305,044 | | | | 323,380 | |
| | | | |
FNMA | | | 6.00 | | | | 10-1-2037 | | | | 464,958 | | | | 511,287 | |
| | | | |
FNMA | | | 6.00 | | | | 11-1-2037 | | | | 35,495 | | | | 39,095 | |
| | | | |
FNMA | | | 6.50 | | | | 7-1-2036 | | | | 21,258 | | | | 23,786 | |
| | | | |
FNMA | | | 6.50 | | | | 7-1-2036 | | | | 10,749 | | | | 12,004 | |
| | | | |
FNMA | | | 6.50 | | | | 11-1-2036 | | | | 4,665 | | | | 5,130 | |
| | | | |
FNMA | | | 7.00 | | | | 12-1-2022 | | | | 118,314 | | | | 121,219 | |
| | | | |
FNMA | | | 7.00 | | | | 7-1-2036 | | | | 10,709 | | | | 11,347 | |
| | | | |
FNMA | | | 7.00 | | | | 11-1-2037 | | | | 6,071 | | | | 6,621 | |
| | | | |
FNMA | | | 7.50 | | | | 5-1-2038 | | | | 1,924 | | | | 1,939 | |
| | | | |
FNMA Series 2002-T12 Class A3 | | | 7.50 | | | | 5-25-2042 | | | | 6,192 | | | | 7,194 | |
| | | | |
FNMA Series 2003-W08 Class 4A ±± | | | 4.46 | | | | 11-25-2042 | | | | 142,883 | | | | 146,374 | |
| | | | |
FNMA Series 2003-W14 Class 2A ±± | | | 4.25 | | | | 6-25-2045 | | | | 102,984 | | | | 108,755 | |
| | | | |
FNMA Series 2003-W14 Class 2A ±± | | | 4.59 | | | | 1-25-2043 | | | | 248,321 | | | | 259,205 | |
| | | | |
FNMA Series 2004-W11 Class 1A3 | | | 7.00 | | | | 5-25-2044 | | | | 1,155,273 | | | | 1,344,963 | |
| | | | |
FNMA Series 2004-W15 Class 1A3 | | | 7.00 | | | | 8-25-2044 | | | | 580,438 | | | | 659,176 | |
| | | | |
GNMA | | | 3.00 | | | | 11-20-2045 | | | | 4,299,250 | | | | 4,256,445 | |
| | | | |
GNMA | | | 3.50 | | | | 9-20-2047 | | | | 3,534,577 | | | | 3,567,068 | |
| | | | |
GNMA | | | 3.50 | | | | 12-20-2047 | | | | 7,440,032 | | | | 7,508,423 | |
| | | | |
GNMA | | | 4.00 | | | | 12-20-2047 | | | | 4,491,774 | | | | 4,613,239 | |
| | | | |
GNMA | | | 4.50 | | | | 10-20-2048 | | | | 2,011,485 | | | | 2,083,232 | |
| | | | |
GNMA | | | 5.00 | | | | 7-20-2040 | | | | 612,362 | | | | 655,569 | |
| | | | |
GNMA %% | | | 5.00 | | | | 3-21-2049 | | | | 1,110,000 | | | | 1,155,996 | |
| | | | |
GNMA | | | 7.50 | | | | 12-15-2029 | | | | 654 | | | | 714 | |
| | | | |
GNMA Series 2008-22 Class XM ±±(c) | | | 0.96 | | | | 2-16-2050 | | | | 1,042,650 | | | | 26,258 | |
| | | | |
STRIPS ¤ | | | 0.00 | | | | 5-15-2039 | | | | 4,670,000 | | | | 2,521,109 | |
| | | | |
TVA | | | 5.88 | | | | 4-1-2036 | | | | 3,540,000 | | | | 4,579,047 | |
| | | | |
Total Agency Securities (Cost $148,195,551) | | | | | | | | | | | | | | | 148,283,761 | |
| | | | | | | | | | | | | | | | |
| | | | |
Asset-Backed Securities: 5.16% | | | | | | | | | | | | | | | | |
| | | | |
CarMax Auto Owner Trust Series 2015-3 Class A3 | | | 1.63 | | | | 5-15-2020 | | | | 31,353 | | | | 31,340 | |
| | | | |
CCG Receivables Trust Series 2016-1 Class A2 144A | | | 1.69 | | | | 9-14-2022 | | | | 397,634 | | | | 396,667 | |
| | | | |
Citibank Credit Card Issuance Trust Series 2014-A6 Class A6 | | | 2.15 | | | | 7-15-2021 | | | | 2,650,000 | | | | 2,645,490 | |
| | | | |
Citibank Credit Card Issuance Trust Series 2016-A1 Class A1 | | | 1.75 | | | | 11-19-2021 | | | | 370,000 | | | | 367,519 | |
| | | | |
Dell Equipment Finance Trust Series 2017-2 Class A2B (1 Month LIBOR +0.30%) 144A± | | | 2.78 | | | | 2-24-2020 | | | | 445,914 | | | | 445,914 | |
| | | | |
Discover Card Execution Note Trust Series 2014 Class A4 | | | 2.12 | | | | 12-15-2021 | | | | 1,015,000 | | | | 1,013,490 | |
| | | | |
Educational Services of America Series 2015-1 Class A (1 Month LIBOR +0.80%) 144A± | | | 3.29 | | | | 10-25-2056 | | | | 1,115,725 | | | | 1,106,640 | |
| | | | |
Five Guys Funding LLC Series 17-1A Class A2 144A | | | 4.60 | | | | 7-25-2047 | | | | 1,597,925 | | | | 1,622,156 | |
| | | | |
GMF Floorplan Owner Revolving Trust Series 2016-1 Class A2 (1 Month LIBOR +0.85%) 144A± | | | 3.34 | | | | 5-17-2021 | | | | 2,105,000 | | | | 2,107,666 | |
| | | | |
Hertz Vehicle Financing LLC Series 2018-2A Class A 144A | | | 3.65 | | | | 6-27-2022 | | | | 1,800,000 | | | | 1,808,244 | |
| | | | |
Lendmark Funding Trust Series 2018-1A Class A 144A | | | 3.81 | | | | 12-21-2026 | | | | 2,085,000 | | | | 2,099,614 | |
| | | | |
MMAF Equipment Finance LLC Series 2017-AA Class A4 144A | | | 2.41 | | | | 8-16-2024 | | | | 1,975,000 | | | | 1,944,601 | |
| | | | |
Navient Student Loan Trust Series 2017-A Class A1 (1 Month LIBOR +0.40%) 144A± | | | 2.89 | | | | 12-16-2058 | | | | 841,109 | | | | 841,516 | |
| | | | |
Nissan Auto Lease Trust Series 2017-B Class A3 | | | 2.05 | | | | 9-15-2020 | | | | 1,625,000 | | | | 1,619,100 | |
The accompanying notes are an integral part of these financial statements.
| | | | | | |
| Portfolio of investments—February 28, 2019 (unaudited) | | Wells Fargo Core Plus Bond Fund | | | 11 | |
| | | | | | | | | | | | | | | | |
| Security name | | Interest rate | | | Maturity date | | | Principal | | | Value | |
| | | | |
Asset-Backed Securities(continued) | | | | | | | | | | | | | | | | |
| | | | |
SLM Student Loan Trust Series 2004-1 Class A4 (3 Month LIBOR +0.26%) ± | | | 3.03 | % | | | 10-27-2025 | | | $ | 1,558,972 | | | $ | 1,557,880 | |
| | | | |
South Carolina Student Loan Corporation Series 2014-1 Class A1 (1 Month LIBOR +0.75%) ± | | | 3.26 | | | | 5-1-2030 | | | | 2,120,252 | | | | 2,126,793 | |
| | | | |
Student Loan Consolidation Center Series 2011-1 Class A (1 Month LIBOR +1.22%) 144A± | | | 3.71 | | | | 10-25-2027 | | | | 1,808,523 | | | | 1,815,972 | |
| | | | |
Towd Point Asset Trust Series 2018-SL1 Class A (1 Month LIBOR +0.60%) 144A± | | | 3.11 | | | | 1-25-2046 | | | | 3,278,370 | | | | 3,242,334 | |
| | | | |
Volvo Financial Equipment LLC Series 2018-AA (1 Month LIBOR +0.52%) 144A± | | | 3.01 | | | | 7-17-2023 | | | | 2,590,000 | | | | 2,594,147 | |
| | | | |
Wheels SPV LLC Series 2018-1A Class A2 144A | | | 3.06 | | | | 4-20-2027 | | | | 1,600,000 | | | | 1,599,833 | |
| | | | |
Total Asset-Backed Securities (Cost $30,999,092) | | | | | | | | | | | | | | | 30,986,916 | |
| | | | | | | | | | | | | | | | |
| | | | |
Corporate Bonds and Notes: 16.85% | | | | | | | | | | | | | | | | |
| | | | |
Communication Services: 2.42% | | | | | | | | | | | | | | | | |
| | | | |
| Diversified Telecommunication Services: 1.03% | | | | | | | | | | | | | | | | |
| | | | |
AT&T Incorporated | | | 4.75 | | | | 5-15-2046 | | | | 1,075,000 | | | | 998,140 | |
| | | | |
AT&T Incorporated | | | 5.65 | | | | 2-15-2047 | | | | 1,050,000 | | | | 1,092,072 | |
| | | | |
Hughes Satellite Systems Corporation | | | 6.50 | | | | 6-15-2019 | | | | 2,400,000 | | | | 2,415,000 | |
| | | | |
Verizon Communications Incorporated | | | 5.01 | | | | 4-15-2049 | | | | 882,000 | | | | 923,220 | |
| | | | |
Verizon Communications Incorporated | | | 5.50 | | | | 3-16-2047 | | | | 675,000 | | | | 750,400 | |
| | | | |
| | | | | | | | | | | | | | | 6,178,832 | |
| | | | | | | | | | | | | | | | |
| | | | |
| Media: 0.54% | | | | | | | | | | | | | | | | |
| | | | |
CCO Holdings LLC 144A | | | 5.13 | | | | 5-1-2027 | | | | 1,300,000 | | | | 1,275,625 | |
| | | | |
Charter Communications Operating LLC | | | 5.38 | | | | 4-1-2038 | | | | 705,000 | | | | 681,601 | |
| | | | |
Charter Communications Operating LLC | | | 6.48 | | | | 10-23-2045 | | | | 655,000 | | | | 704,504 | |
| | | | |
Discovery Communications LLC | | | 6.35 | | | | 6-1-2040 | | | | 550,000 | | | | 588,032 | |
| | | | |
| | | | | | | | | | | | | | | 3,249,762 | |
| | | | | | | | | | | | | | | | |
| | | | |
| Wireless Telecommunication Services: 0.85% | | | | | | | | | | | | | | | | |
| | | | |
Crown Castle Towers LLC 144A | | | 3.22 | | | | 5-15-2042 | | | | 2,600,000 | | | | 2,586,218 | |
| | | | |
SBA Tower Trust 144A | | | 3.72 | | | | 4-9-2048 | | | | 1,968,000 | | | | 1,969,971 | |
| | | | |
Sprint Spectrum Company 144A | | | 5.15 | | | | 9-20-2029 | | | | 530,000 | | | | 533,975 | |
| | | | |
| | | | | | | | | | | | | | | 5,090,164 | |
| | | | | | | | | | | | | | | | |
| | | | |
Consumer Discretionary: 0.48% | | | | | | | | | | | | | | | | |
| | | | |
| Internet & Direct Marketing Retail: 0.15% | | | | | | | | | | | | | | | | |
| | | | |
Amazon.com Incorporated | | | 4.95 | | | | 12-5-2044 | | | | 815,000 | | | | 927,891 | |
| | | | | | | | | | | | | | | | |
| | | | |
| Multiline Retail: 0.16% | | | | | | | | | | | | | | | | |
| | | | |
Macy’s Retail Holdings Incorporated | | | 3.45 | | | | 1-15-2021 | | | | 940,000 | | | | 935,606 | |
| | | | | | | | | | | | | | | | |
| | | | |
| Specialty Retail: 0.17% | | | | | | | | | | | | | | | | |
| | | | |
Asbury Automotive Group Incorporated | | | 6.00 | | | | 12-15-2024 | | | | 1,000,000 | | | | 1,015,000 | |
| | | | | | | | | | | | | | | | |
| | | | |
Consumer Staples: 0.28% | | | | | | | | | | | | | | | | |
| | | | |
| Beverages: 0.28% | | | | | | | | | | | | | | | | |
| | | | |
Anheuser-Busch InBev Worldwide Incorporated | | | 4.60 | | | | 4-15-2048 | | | | 1,810,000 | | | | 1,668,239 | |
| | | | | | | | | | | | | | | | |
The accompanying notes are an integral part of these financial statements.
| | | | |
| 12 | | Wells Fargo Core Plus Bond Fund | | Portfolio of investments—February 28, 2019 (unaudited) |
| | | | | | | | | | | | | | | | |
| Security name | | Interest rate | | | Maturity date | | | Principal | | | Value | |
| | | | |
Energy: 1.69% | | | | | | | | | | | | | | | | |
| | | | |
| Energy Equipment & Services: 0.11% | | | | | | | | | | | | | | | | |
| | | | |
Oceaneering International Incorporated | | | 6.00 | % | | | 2-1-2028 | | | $ | 680,000 | | | $ | 642,600 | |
| | | | | | | | | | | | | | | | |
| | | | |
| Oil, Gas & Consumable Fuels: 1.58% | | | | | | | | | | | | | | | | |
| | | | |
Baker Hughes LLC | | | 2.77 | | | | 12-15-2022 | | | | 1,870,000 | | | | 1,840,496 | |
| | | | |
BP Capital Markets America Incorporated | | | 3.22 | | | | 11-28-2023 | | | | 2,170,000 | | | | 2,173,279 | |
| | | | |
Energy Transfer Operating Partners LP | | | 5.25 | | | | 4-15-2029 | | | | 905,000 | | | | 946,347 | |
| | | | |
Energy Transfer Partners LP | | | 6.13 | | | | 12-15-2045 | | | | 1,330,000 | | | | 1,389,000 | |
| | | | |
Rockies Express Pipeline LLC 144A | | | 5.63 | | | | 4-15-2020 | | | | 2,250,000 | | | | 2,295,000 | |
| | | | |
SemGroup Corporation « | | | 7.25 | | | | 3-15-2026 | | | | 875,000 | | | | 846,563 | |
| | | | |
| | | | | | | | | | | | | | | 9,490,685 | |
| | | | | | | | | | | | | | | | |
| | | | |
Financials: 6.84% | | | | | | | | | | | | | | | | |
| | | | |
| Banks: 1.93% | | | | | | | | | | | | | | | | |
| | | | |
Bank of America Corporation (3 Month LIBOR +0.94%) ± | | | 3.86 | | | | 7-23-2024 | | | | 1,310,000 | | | | 1,331,222 | |
| | | | |
Bank of America Corporation | | | 3.95 | | | | 4-21-2025 | | | | 1,170,000 | | | | 1,169,161 | |
| | | | |
Bank of America Corporation (3 Month LIBOR +3.90%) ± | | | 6.10 | | | | 12-29-2049 | | | | 1,290,000 | | | | 1,371,257 | |
| | | | |
BBVA Bancomer SA of Texas 144A | | | 7.25 | | | | 4-22-2020 | | | | 1,000,000 | | | | 1,033,760 | |
| | | | |
Citigroup Incorporated (3 Month LIBOR +4.52%) ± | | | 6.25 | | | | 12-29-2049 | | | | 1,030,000 | | | | 1,082,695 | |
| | | | |
JPMorgan Chase & Company | | | 2.97 | | | | 1-15-2023 | | | | 2,550,000 | | | | 2,534,664 | |
| | | | |
JPMorgan Chase & Company (3 Month LIBOR +3.25%) ± | | | 5.15 | | | | 12-29-2049 | | | | 1,370,000 | | | | 1,359,725 | |
| | | | |
PNC Financial Services (3 Month LIBOR +3.30%) ± | | | 5.00 | | | | 12-29-2049 | | | | 565,000 | | | | 546,638 | |
| | | | |
Santander Holdings USA Incorporated | | | 3.70 | | | | 3-28-2022 | | | | 1,125,000 | | | | 1,124,311 | |
| | | | |
| | | | | | | | | | | | | | | 11,553,433 | |
| | | | | | | | | | | | | | | | |
| | | | |
| Capital Markets: 1.02% | | | | | | | | | | | | | | | | |
| | | | |
Blackstone Holdings Finance Company LLC 144A | | | 5.00 | | | | 6-15-2044 | | | | 1,015,000 | | | | 1,018,378 | |
| | | | |
Goldman Sachs Group Incorporated (3 Month LIBOR +0.82%) ± | | | 2.88 | | | | 10-31-2022 | | | | 1,910,000 | | | | 1,881,381 | |
| | | | |
Morgan Stanley | | | 3.70 | | | | 10-23-2024 | | | | 3,235,000 | | | | 3,249,127 | |
| | | | |
| | | | | | | | | | | | | | | 6,148,886 | |
| | | | | | | | | | | | | | | | |
| | | | |
| Consumer Finance: 2.24% | | | | | | | | | | | | | | | | |
| | | | |
Daimler Finance NA LLC 144A | | | 1.75 | | | | 10-30-2019 | | | | 2,215,000 | | | | 2,195,659 | |
| | | | |
ERAC USA Finance LLC 144A | | | 4.50 | | | | 2-15-2045 | | | | 1,695,000 | | | | 1,593,304 | |
| | | | |
Ford Motor Credit Company LLC | | | 3.20 | | | | 1-15-2021 | | | | 2,890,000 | | | | 2,843,635 | |
| | | | |
General Motors Financial Company Incorporated | | | 5.65 | | | | 1-17-2029 | | | | 1,330,000 | | | | 1,352,800 | |
| | | | |
PACCAR Financial Corporation | | | 2.30 | | | | 8-10-2022 | | | | 3,000,000 | | | | 2,908,494 | |
| | | | |
Synchrony Financial | | | 3.95 | | | | 12-1-2027 | | | | 2,800,000 | | | | 2,563,968 | |
| | | | |
| | | | | | | | | | | | | | | 13,457,860 | |
| | | | | | | | | | | | | | | | |
| | | | |
| Diversified Financial Services: 0.44% | | | | | | | | | | | | | | | | |
| | | | |
Brookfield Finance LLC | | | 4.00 | | | | 4-1-2024 | | | | 2,005,000 | | | | 2,007,830 | |
| | | | |
LPL Holdings Incorporated 144A | | | 5.75 | | | | 9-15-2025 | | | | 600,000 | | | | 606,750 | |
| | | | |
| | | | | | | | | | | | | | | 2,614,580 | |
| | | | | | | | | | | | | | | | |
| | | | |
| Insurance: 1.21% | | | | | | | | | | | | | | | | |
| | | | |
Brighthouse Financial Incorporated | | | 3.70 | | | | 6-22-2027 | | | | 1,035,000 | | | | 929,017 | |
| | | | |
Brighthouse Financial Incorporated | | | 4.70 | | | | 6-22-2047 | | | | 1,345,000 | | | | 1,065,735 | |
| | | | |
Guardian Life Insurance Company 144A | | | 4.85 | | | | 1-24-2077 | | | | 1,045,000 | | | | 1,049,382 | |
The accompanying notes are an integral part of these financial statements.
| | | | | | |
| Portfolio of investments—February 28, 2019 (unaudited) | | Wells Fargo Core Plus Bond Fund | | | 13 | |
| | | | | | | | | | | | | | | | |
| Security name | | Interest rate | | | Maturity date | | | Principal | | | Value | |
| | | | |
| Insurance(continued) | | | | | | | | | | | | | | | | |
| | | | |
National Life Insurance Company (3 Month LIBOR +3.31%) 144A± | | | 5.25 | % | | | 7-19-2068 | | | $ | 1,668,000 | | | $ | 1,641,085 | |
| | | | |
PartnerRe Finance II Incorporated (3 Month LIBOR +2.33%) ± | | | 4.95 | | | | 12-1-2066 | | | | 1,345,000 | | | | 1,103,371 | |
| | | | |
Transatlantic Holdings Incorporated | | | 8.00 | | | | 11-30-2039 | | | | 1,100,000 | | | | 1,462,487 | |
| | | | |
| | | | | | | | | | | | | | | 7,251,077 | |
| | | | | | | | | | | | | | | | |
| | | | |
Health Care: 0.63% | | | | | | | | | | | | | | | | |
| | | | |
| Health Care Providers & Services: 0.63% | | | | | | | | | | | | | | | | |
| | | | |
CHS Incorporated « | | | 5.13 | | | | 8-1-2021 | | | | 1,000,000 | | | | 981,250 | |
| | | | |
CVS Health Corporation | | | 4.78 | | | | 3-25-2038 | | | | 2,100,000 | | | | 2,042,803 | |
| | | | |
Highmark Incorporated 144A | | | 6.13 | | | | 5-15-2041 | | | | 710,000 | | | | 768,362 | |
| | | | |
| | | | | | | | | | | | | | | 3,792,415 | |
| | | | | | | | | | | | | | | | |
| | | | |
Industrials: 1.54% | | | | | | | | | | | | | | | | |
| | | | |
| Industrial Conglomerates: 0.68% | | | | | | | | | | | | | | | | |
| | | | |
General Electric Company | | | 2.70 | | | | 10-9-2022 | | | | 1,355,000 | | | | 1,309,796 | |
| | | | |
General Electric Company (3 Month LIBOR +3.33%) ± | | | 5.00 | | | | 12-29-2049 | | | | 2,930,000 | | | | 2,763,283 | |
| | | | |
| | | | | | | | | | | | | | | 4,073,079 | |
| | | | | | | | | | | | | | | | |
| | | | |
| Transportation Infrastructure: 0.86% | | | | | | | | | | | | | | | | |
| | | | |
Toll Road Investors Partnership II LP 144A ¤ | | | 0.00 | | | | 2-15-2026 | | | | 5,630,000 | | | | 3,777,817 | |
| | | | |
Toll Road Investors Partnership II LP 144A ¤ | | | 0.00 | | | | 2-15-2027 | | | | 1,050,000 | | | | 681,979 | |
| | | | |
Toll Road Investors Partnership II LP 144A ¤ | | | 0.00 | | | | 2-15-2028 | | | | 1,150,000 | �� | | | 705,474 | |
| | | | |
| | | | | | | | | | | | | | | 5,165,270 | |
| | | | | | | | | | | | | | | | |
| | | | |
Information Technology: 0.81% | | | | | | | | | | | | | | | | |
| | | | |
| Communications Equipment: 0.16% | | | | | | | | | | | | | | | | |
| | | | |
Motorola Solutions Incorporated | | | 4.60 | | | | 2-23-2028 | | | | 1,000,000 | | | | 980,169 | |
| | | | | | | | | | | | | | | | |
| | | | |
| Semiconductors & Semiconductor Equipment: 0.25% | | | | | | | | | | | | | | | | |
| | | | |
Broadcom Corporation | | | 3.88 | | | | 1-15-2027 | | | | 1,640,000 | | | | 1,519,089 | |
| | | | | | | | | | | | | | | | |
| | | | |
| Software: 0.17% | | | | | | | | | | | | | | | | |
| | | | |
Citrix Systems Incorporated | | | 4.50 | | | | 12-1-2027 | | | | 1,045,000 | | | | 1,001,485 | |
| | | | | | | | | | | | | | | | |
| | | | |
| Technology Hardware, Storage & Peripherals: 0.23% | | | | | | | | | | | | | | | | |
| | | | |
Diamond 1 Finance Corporation 144A | | | 8.35 | | | | 7-15-2046 | | | | 1,175,000 | | | | 1,375,051 | |
| | | | | | | | | | | | | | | | |
| | | | |
Materials: 0.35% | | | | | | | | | | | | | | | | |
| | | | |
| Containers & Packaging: 0.35% | | | | | | | | | | | | | | | | |
| | | | |
Silgan Holdings Incorporated | | | 3.25 | | | | 3-15-2025 | | | | 1,800,000 | | | | 2,108,831 | |
| | | | | | | | | | | | | | | | |
| | | | |
Real Estate: 1.19% | | | | | | | | | | | | | | | | |
| | | | |
| Equity REITs: 0.48% | | | | | | | | | | | | | | | | |
| | | | |
Federal Realty Investment Trust | | | 3.63 | | | | 8-1-2046 | | | | 915,000 | | | | 798,781 | |
| | | | |
Omega Healthcare Investors Incorporated | | | 4.50 | | | | 1-15-2025 | | | | 2,130,000 | | | | 2,119,750 | |
| | | | |
| | | | | | | | | | | | | | | 2,918,531 | |
| | | | | | | | | | | | | | | | |
The accompanying notes are an integral part of these financial statements.
| | | | |
| 14 | | Wells Fargo Core Plus Bond Fund | | Portfolio of investments—February 28, 2019 (unaudited) |
| | | | | | | | | | | | | | | | |
| Security name | | Interest rate | | | Maturity date | | | Principal | | | Value | |
| | | | |
| Real Estate Management & Development: 0.71% | | | | | | | | | | | | | | | | |
| | | | |
Newmark Group Incorporated 144A | | | 6.13 | % | | | 11-15-2023 | | | $ | 1,985,000 | | | $ | 1,994,862 | |
| | | | |
Washington Prime Group | | | 3.85 | | | | 4-1-2020 | | | | 2,275,000 | | | | 2,249,602 | |
| | | | |
| | | | | | | | | | | | | | | 4,244,464 | |
| | | | | | | | | | | | | | | | |
| | | | |
Utilities: 0.62% | | | | | | | | | | | | | | | | |
| | | | |
| Electric Utilities: 0.49% | | | | | | | | | | | | | | | | |
| | | | |
Basin Electric Power Cooperative 144A | | | 4.75 | | | | 4-26-2047 | | | | 1,315,000 | | | | 1,342,180 | |
| | | | |
Oglethorpe Power Corporation 144A | | | 5.05 | | | | 10-1-2048 | | | | 1,060,000 | | | | 1,099,951 | |
| | | | |
South Carolina Edison Company | | | 4.13 | | | | 3-1-2048 | | | | 505,000 | | | | 464,815 | |
| | | | |
| | | | | | | | | | | | | | | 2,906,946 | |
| | | | | | | | | | | | | | | | |
| | | | |
| Independent Power & Renewable Electricity Producers: 0.13% | | | | | | | | | | | | | | | | |
| | | | |
Tri-State Generation and Transmission Association Incorporated | | | 4.25 | | | | 6-1-2046 | | | | 850,000 | | | | 791,289 | |
| | | | | | | | | | | | | | | | |
| | | | |
Total Corporate Bonds and Notes (Cost $100,442,304) | | | | | | | | | | | | | | | 101,101,234 | |
| | | | | | | | | | | | | | | | |
| | | | |
| | | | | | | | | Shares | | | | |
| Exchange-Traded Funds: 2.27% | | | | | | | | | | | | | | | | |
| | | | |
SPDR Barclays High Yield Bond ETF « | | | | | | | | | | | 74,000 | | | | 2,641,060 | |
| | | | |
Vaneck Vectors JP Morgan Emerging Markets Local Currency Bond ETF | | | | | | | | | | | 322,000 | | | | 10,989,860 | |
| | | | |
Total Exchange-Traded Funds (Cost $13,566,037) | | | | | | | | | | | | | | | 13,630,920 | |
| | | | | | | | | | | | | | | | |
| | | | |
| | | | | | | | | Principal | | | | |
| Foreign Corporate Bonds and Notes @: 3.44% | | | | | | | | | | | | | | | | |
| | | | |
Communication Services: 0.34% | | | | | | | | | | | | | | | | |
| | | | |
| Media: 0.34% | | | | | | | | | | | | | | | | |
| | | | |
Altice SA (EUR) 144A | | | 7.25 | | | | 5-15-2022 | | | | 1,800,000 | | | | 2,044,678 | |
| | | | | | | | | | | | | | | | |
| | | | |
Consumer Discretionary: 0.56% | | | | | | | | | | | | | | | | |
| | | | |
| Auto Components: 0.22% | | | | | | | | | | | | | | | | |
| | | | |
HP Pelzer Holding GmbH (EUR) 144A | | | 4.13 | | | | 4-1-2024 | | | | 1,200,000 | | | | 1,303,517 | |
| | | | | | | | | | | | | | | | |
| | | | |
| Automobiles: 0.34% | | | | | | | | | | | | | | | | |
| | | | |
Peugeot SA Company (EUR) | | | 2.00 | | | | 3-20-2025 | | | | 1,800,000 | | | | 2,031,152 | |
| | | | | | | | | | | | | | | | |
| | | | |
Consumer Staples: 0.74% | | | | | | | | | | | | | | | | |
| | | | |
| Food Products: 0.74% | | | | | | | | | | | | | | | | |
| | | | |
Danone SA (EUR) (5 Year EUR Swap +1.43%) ± | | | 1.75 | | | | 12-31-2099 | | | | 2,600,000 | | | | 2,861,254 | |
| | | | |
Sigma Holdings Company BV (EUR) 144A | | | 5.75 | | | | 5-15-2026 | | | | 1,500,000 | | | | 1,593,140 | |
| | | | |
| | | | | | | | | | | | | | | 4,454,394 | |
| | | | | | | | | | | | | | | | |
| | | | |
Energy: 0.60% | | | | | | | | | | | | | | | | |
| | | | |
| Oil, Gas & Consumable Fuels: 0.60% | | | | | | | | | | | | | | | | |
| | | | |
Petroleos Mexicanos (EUR) | | | 3.75 | | | | 2-21-2024 | | | | 1,000,000 | | | | 1,140,903 | |
| | | | |
Total SA (EUR) (5 Year EUR Swap +3.78%) ± | | | 3.88 | | | | 12-29-2049 | | | | 2,000,000 | | | | 2,468,693 | |
| | | | |
| | | | | | | | | | | | | | | 3,609,596 | |
| | | | | | | | | | | | | | | | |
The accompanying notes are an integral part of these financial statements.
| | | | | | |
| Portfolio of investments—February 28, 2019 (unaudited) | | Wells Fargo Core Plus Bond Fund | | | 15 | |
| | | | | | | | | | | | | | | | |
| Security name | | Interest rate | | | Maturity date | | | Principal | | | Value | |
| | | | |
Financials: 0.57% | | | | | | | | | | | | | | | | |
| | | | |
| Banks: 0.22% | | | | | | | | | | | | | | | | |
| | | | |
Bankia SA (EUR) (5 Year EUR Swap +5.82%) ± | | | 6.00 | % | | | 12-31-2099 | | | | 1,200,000 | | | $ | 1,340,436 | |
| | | | | | | | | | | | | | | | |
| | | | |
| Diversified Financial Services: 0.35% | | | | | | | | | | | | | | | | |
| | | | |
LKQ European Holdings BV Company (EUR) 144A | | | 3.63 | | | | 4-1-2026 | | | | 1,800,000 | | | | 2,078,120 | |
| | | | | | | | | | | | | | | | |
| | | | |
Industrials: 0.53% | | | | | | | | | | | | | | | | |
| | | | |
| Commercial Services & Supplies: 0.19% | | | | | | | | | | | | | | | | |
| | | | |
Paprec Holding SA (EUR) 144A | | | 4.00 | | | | 3-31-2025 | | | | 1,200,000 | | | | 1,159,347 | |
| | | | | | | | | | | | | | | | |
| | | | |
| Road & Rail: 0.34% | | | | | | | | | | | | | | | | |
| | | | |
Europcar Groupe SA (EUR) 144A | | | 4.13 | | | | 11-15-2024 | | | | 1,800,000 | | | | 2,034,613 | |
| | | | | | | | | | | | | | | | |
| | | | |
Real Estate: 0.10% | | | | | | | | | | | | | | | | |
| | | | |
| Real Estate Management & Development: 0.10% | | | | | | | | | | | | | | | | |
| | | | |
ATF Netherlands BV (EUR) | | | 1.50 | | | | 7-15-2024 | | | | 500,000 | | | | 564,462 | |
| | | | | | | | | | | | | | | | |
| | | | |
Total Foreign Corporate Bonds and Notes (Cost $21,750,786) | | | | | | | | | | | | | | | 20,620,315 | |
| | | | | | | | | | | | | | | | |
| | | | |
Foreign Government Bonds @: 1.09% | | | | | | | | | | | | | | | | |
| | | | |
Brazil (BRL) | | | 10.00 | | | | 1-1-2025 | | | | 8,600,000 | | | | 2,423,128 | |
| | | | |
Brazil (BRL) | | | 10.00 | | | | 1-1-2027 | | | | 4,700,000 | | | | 1,325,306 | |
| | | | |
Indonesia (IDR) | | | 7.88 | | | | 4-15-2019 | | | | 25,000,000,000 | | | | 1,780,736 | |
| | | | |
Mexico (MXN) | | | 6.50 | | | | 6-9-2022 | | | | 20,000,000 | | | | 991,878 | |
| | | | |
Total Foreign Government Bonds (Cost $7,143,740) | | | | | | | | | | | | | | | 6,521,048 | |
| | | | | | | | | | | | | | | | |
| | | | |
Loans: 1.27% | | | | | | | | | | | | | | | | |
| | | | |
Communication Services: 0.55% | | | | | | | | | | | | | | | | |
| | | | |
| Interactive Media & Services: 0.15% | | | | | | | | | | | | | | | | |
| | | | |
Match Group Incorporated (2 Month LIBOR +2.50%) ±‡ | | | 5.09 | | | | 11-16-2022 | | | $ | 880,000 | | | | 876,154 | |
| | | | | | | | | | | | | | | | |
| | | | |
| Media: 0.20% | | | | | | | | | | | | | | | | |
| | | | |
Ancestry.com Incorporated (1 Month LIBOR +3.25%) ± | | | 5.75 | | | | 10-19-2023 | | | | 1,215,625 | | | | 1,207,517 | |
| | | | | | | | | | | | | | | | |
| | | | |
| Wireless Telecommunication Services: 0.20% | | | | | | | | | | | | | | | | |
| | | | |
Sprint Communications Incorporated (1 Month LIBOR +2.50%) ± | | | 5.00 | | | | 2-2-2024 | | | | 1,228,125 | | | | 1,211,238 | |
| | | | | | | | | | | | | | | | |
| | | | |
Energy: 0.19% | | | | | | | | | | | | | | | | |
| | | | |
| Oil, Gas & Consumable Fuels: 0.19% | | | | | | | | | | | | | | | | |
| | | | |
Lucid Energy Group II Borrower LLC (1 Month LIBOR +3.00%) ± | | | 5.49 | | | | 2-17-2025 | | | | 1,240,625 | | | | 1,155,779 | |
| | | | | | | | | | | | | | | | |
| | | | |
Health Care: 0.20% | | | | | | | | | | | | | | | | |
| | | | |
| Health Care Providers & Services: 0.20% | | | | | | | | | | | | | | | | |
| | | | |
Surgery Center Holdings Incorporated (1 Month LIBOR +3.25%) ± | | | 5.75 | | | | 9-2-2024 | | | | 1,234,375 | | | | 1,202,997 | |
| | | | | | | | | | | | | | | | |
| | | | |
Industrials: 0.21% | | | | | | | | | | | | | | | | |
| | | | |
| Communications Equipment: 0.21% | | | | | | | | | | | | | | | | |
| | | | |
Virgin Media Bristol LLC (1 Month LIBOR +2.50%) ± | | | 4.99 | | | | 1-15-2026 | | | | 1,250,000 | | | | 1,240,638 | |
| | | | | | | | | | | | | | | | |
The accompanying notes are an integral part of these financial statements.
| | | | |
| 16 | | Wells Fargo Core Plus Bond Fund | | Portfolio of investments—February 28, 2019 (unaudited) |
| | | | | | | | | | | | | | | | |
| Security name | | Interest rate | | | Maturity date | | | Principal | | | Value | |
| | | | |
Information Technology: 0.12% | | | | | | | | | | | | | | | | |
| | | | |
| IT Services: 0.12% | | | | | | | | | | | | | | | | |
| | | | |
First Data Corporation (1 Month LIBOR +2.00%) ± | | | 4.49 | % | | | 7-8-2022 | | | $ | 736,879 | | | $ | 735,898 | |
| | | | | | | | | | | | | | | | |
| | | | |
Total Loans (Cost $7,784,110) | | | | | | | | | | | | | | | 7,630,221 | |
| | | | | | | | | | | | | | | | |
| | | | |
Municipal Obligations: 3.46% | | | | | | | | | | | | | | | | |
| | | | |
California: 0.59% | | | | | | | | | | | | | | | | |
| | | | |
| Airport Revenue: 0.36% | | | | | | | | | | | | | | | | |
| | | | |
San Jose CA Series B (AGM Insured) | | | 6.60 | | | | 3-1-2041 | | | | 2,000,000 | | | | 2,128,140 | |
| | | | | | | | | | | | | | | | |
| | | | |
| Transportation Revenue: 0.23% | | | | | | | | | | | | | | | | |
| | | | |
Alameda CA Corridor Transportation Authority CAB Refunding Bond Subordinated Series B (Ambac Insured) ¤ | | | 0.00 | | | | 10-1-2028 | | | | 2,115,000 | | | | 1,386,425 | |
| | | | | | | | | | | | | | | | |
| | | | |
| | | | | | | | | | | | | | | 3,514,565 | |
| | | | | | | | | | | | | | | | |
| | | | |
Illinois: 1.50% | | | | | | | | | | | | | | | | |
| | | | |
| GO Revenue: 0.98% | | | | | | | | | | | | | | | | |
| | | | |
Chicago IL | | | 5.43 | | | | 1-1-2042 | | | | 1,000,000 | | | | 886,200 | |
| | | | |
Cook County IL Series B (Build America Mutual Assurance Company Insured) | | | 6.36 | | | | 11-15-2033 | | | | 1,745,000 | | | | 2,164,847 | |
| | | | |
Illinois Taxable Pension | | | 5.10 | | | | 6-1-2033 | | | | 1,395,000 | | | | 1,323,144 | |
| | | | |
Will County IL Lincoln-Way Community High School District #210 Unrefunded CAB (AGM Insured) ¤ | | | 0.00 | | | | 1-1-2025 | | | | 1,820,000 | | | | 1,518,189 | |
| | | | |
| | | | | | | | | | | | | | | 5,892,380 | |
| | | | | | | | | | | | | | | | |
| | | | |
| Tax Revenue: 0.52% | | | | | | | | | | | | | | | | |
| | | | |
Chicago IL Transit Authority Taxable Pension Funding Series A | | | 6.90 | | | | 12-1-2040 | | | | 1,075,000 | | | | 1,369,045 | |
| | | | |
Metropolitan Pier & Exposition Authority Illinois CAB McCormick Place Expansion Project Series 2010-B1 (AGM Insured) ¤ | | | 0.00 | | | | 6-15-2026 | | | | 1,975,000 | | | | 1,579,783 | |
| | | | |
Metropolitan Pier & Exposition Authority Illinois CAB McCormick Place Expansion Project Series 2012-B ¤ | | | 0.00 | | | | 12-15-2051 | | | | 765,000 | | | | 153,803 | |
| | | | |
| | | | | | | | | | | | | | | 3,102,631 | |
| | | | | | | | | | | | | | | | |
| | | | |
| | | | | | | | | | | | | | | 8,995,011 | |
| | | | | | | | | | | | | | | | |
| | | | |
Maryland: 0.16% | | | | | | | | | | | | | | | | |
| | | | |
| Education Revenue: 0.16% | | | | | | | | | | | | | | | | |
| | | | |
Maryland Health & HEFAR Green Street Academy Series B 144A | | | 6.75 | | | | 7-1-2023 | | | | 975,000 | | | | 961,233 | |
| | | | | | | | | | | | | | | | |
| | | | |
Michigan: 0.28% | | | | | | | | | | | | | | | | |
| | | | |
| Miscellaneous Revenue: 0.28% | | | | | | | | | | | | | | | | |
| | | | |
Michigan Finance Authority Local Government Loan Program Project Series E | | | 7.19 | | | | 11-1-2022 | | | | 1,585,000 | | | | 1,710,294 | |
| | | | | | | | | | | | | | | | |
| | | | |
New Jersey: 0.17% | | | | | | | | | | | | | | | | |
| | | | |
| Miscellaneous Revenue: 0.17% | | | | | | | | | | | | | | | | |
| | | | |
New Jersey EDA Series B | | | 3.29 | | | | 7-1-2019 | | | | 1,000,000 | | | | 999,970 | |
| | | | | | | | | | | | | | | | |
The accompanying notes are an integral part of these financial statements.
| | | | | | |
| Portfolio of investments—February 28, 2019 (unaudited) | | Wells Fargo Core Plus Bond Fund | | | 17 | |
| | | | | | | | | | | | | | | | |
| Security name | | Interest rate | | | Maturity date | | | Principal | | | Value | |
| | | | |
Pennsylvania: 0.48% | | | | | | | | | | | | | | | | |
| | | | |
| Health Revenue: 0.15% | | | | | | | | | | | | | | | | |
| | | | |
Quakertown PA General Authority USDA Loan Anticipation Notes Series 2017-B | | | 3.80 | % | | | 7-1-2021 | | | $ | 900,000 | | | $ | 892,089 | |
| | | | | | | | | | | | | | | | |
| | | | |
| Miscellaneous Revenue: 0.33% | | | | | | | | | | | | | | | | |
| | | | |
Commonwealth of Pennsylvania Financing Authority Series A | | | 4.14 | | | | 6-1-2038 | | | | 1,995,000 | | | | 2,009,085 | |
| | | | | | | | | | | | | | | | |
| | | | |
| | | | | | | | | | | | | | | 2,901,174 | |
| | | | | | | | | | | | | | | | |
| | | | |
Texas: 0.28% | | | | | | | | | | | | | | | | |
| | | | |
| Transportation Revenue: 0.28% | | | | | | | | | | | | | | | | |
| | | | |
North Texas Tollway Authority Build America Bonds Subordinate Lien Series B-2 | | | 8.91 | | | | 2-1-2030 | | | | 1,595,000 | | | | 1,672,039 | |
| | | | | | | | | | | | | | | | |
| | | | |
Total Municipal Obligations (Cost $19,821,947) | | | | | | | | | | | | | | | 20,754,286 | |
| | | | | | | | | | | | | | | | |
| | | | |
Non-Agency Mortgage-Backed Securities: 8.78% | | | | | | | | | | | | | | | | |
| | | | |
American Money Management Corporation Series 2015-16A Class AR (3 Month LIBOR +1.26%) 144A± | | | 4.06 | | | | 4-14-2029 | | | | 3,000,000 | | | | 2,995,857 | |
| | | | |
Arbor Realty Collateralized Series 2016-FL Class A (1 Month LIBOR +1.70%) 144A± | | | 4.19 | | | | 9-15-2026 | | | | 1,000,000 | | | | 991,611 | |
| | | | |
Banc of America Commercial Mortgage Securities Incorporated Series 2007-1 Class AMFX ±± | | | 5.48 | | | | 1-15-2049 | | | | 662,241 | | | | 664,330 | |
| | | | |
Banc of America Funding Corporation Series 2016-R1 Class A1 144A±± | | | 2.50 | | | | 3-25-2040 | | | | 771,019 | | | | 748,322 | |
| | | | |
BDS Limited Series 2018-FL2 Class A (1 Month LIBOR +0.95%) 144A± | | | 3.44 | | | | 8-15-2035 | | | | 1,767,920 | | | | 1,756,864 | |
| | | | |
Bluemountain CLO Limited Series 2012-2A Class AR2 (3 Month LIBOR +1.05%) 144A± | | | 3.69 | | | | 11-20-2028 | | | | 935,000 | | | | 932,822 | |
| | | | |
BX Trust 2017 Series A (1 Month LIBOR +1.05%) 144A± | | | 3.54 | | | | 10-15-2032 | | | | 2,860,000 | | | | 2,859,514 | |
| | | | |
Cascade Funding Mortgage Trust Series 2018- RM2 Class A 144A±±‡ | | | 4.00 | | | | 10-25-2068 | | | | 617,174 | | | | 622,321 | |
| | | | |
CD Commercial Mortgage Trust Series 2017-6 Class A5 | | | 3.46 | | | | 11-13-2050 | | | | 1,035,000 | | | | 1,028,862 | |
| | | | |
CIFC Funding Limited Series 2012-2RA Class A1 (3 Month LIBOR +0.80%) 144A± | | | 3.56 | | | | 1-20-2028 | | | | 2,525,000 | | | | 2,502,815 | |
| | | | |
Commercial Mortgage Trust Series 2014-CR15 Class A2 | | | 2.93 | | | | 2-10-2047 | | | | 510,482 | | | | 510,057 | |
| | | | |
Credit Suisse First Boston Commercial Mortgage Trust Series 1998-C2 Class AX ±±(c) | | | 0.23 | | | | 11-15-2030 | | | | 93,534 | | | | 0 | |
| | | | |
Crown Point Limited Series 2015-3A Class A1AR (3 Month LIBOR +0.91%) 144A± | | | 3.70 | | | | 12-31-2027 | | | | 2,500,000 | | | | 2,488,643 | |
| | | | |
Crown Point Limited Series 2018-6A Class A1 (3 Month LIBOR +1.17%) 144A± | | | 3.98 | | | | 10-20-2028 | | | | 3,500,000 | | | | 3,488,814 | |
| | | | |
CSAIL Commercial Mortgage Trust Series 2015-C4 Class A1 | | | 2.01 | | | | 11-15-2048 | | | | 1,641,275 | | | | 1,628,757 | |
| | | | |
Financial Asset Securitization Incorporated Series 1997-NAM2 Class B2 ±±† | | | 7.88 | | | | 7-25-2027 | | | | 21,600 | | | | 1,076 | |
| | | | |
FirstKey Mortgage Trust Series 2014-1 Class A2 144A±± | | | 3.00 | | | | 11-25-2044 | | | | 1,259,965 | | | | 1,252,805 | |
| | | | |
GAHR Commercial Mortgage Trust Series 2015-NRF Class AFX 144A | | | 3.23 | | | | 12-15-2034 | | | | 1,600,000 | | | | 1,598,960 | |
| | | | |
Great Wolf Trust Series 2017-A (1 Month LIBOR +0.85%) 144A± | | | 3.49 | | | | 9-15-2034 | | | | 2,350,000 | | | | 2,344,066 | |
| | | | |
GS Mortgage Securities Trust Series 2007 Class AM ±± | | | 5.77 | | | | 8-10-2045 | | | | 79,072 | | | | 79,359 | |
| | | | |
Jamestown Collateralized Loan Obligation Limited Series 2016-9A Class A1A (3 Month LIBOR +1.57%) 144A± | | | 4.33 | | | | 10-20-2028 | | | | 2,000,000 | | | | 2,000,796 | |
| | | | |
JPMorgan Chase Commercial Mortgage Securities Trust Series 2007-CB18 Class AMFL (1 Month LIBOR +0.17%) ± | | | 2.68 | | | | 6-12-2047 | | | | 3,883 | | | | 3,876 | |
| | | | |
JPMorgan Chase Commercial Mortgage Securities Trust Series 2007-LDPX Class AM ±± | | | 5.46 | | | | 1-15-2049 | | | | 242,119 | | | | 242,228 | |
| | | | |
Lendmark Funding Trust Series 2018 -2A Class A 144A | | | 4.23 | | | | 4-20-2027 | | | | 600,000 | | | | 610,705 | |
| | | | |
Mach One Trust Commercial Mortgage Backed Series 2004-1 Class X 144A±±(c) | | | 0.66 | | | | 5-28-2040 | | | | 87,252 | | | | 0 | |
| | | | |
Morgan Stanley Capital I Series 2004-RR2 Class X 144A±±(c) | | | 0.35 | | | | 10-28-2033 | | | | 5,938 | | | | 24 | |
| | | | |
Neuberger Berman Limited Series 2015-20A Class AR (3 Month LIBOR +0.80%) 144A± | | | 3.59 | | | | 1-15-2028 | | | | 1,575,000 | | | | 1,561,664 | |
| | | | |
Octagon Investment Partners Series 2015-1A Class A1R (3 Month LIBOR +0.90%) 144A± | | | 3.54 | | | | 5-21-2027 | | | | 3,000,000 | | | | 2,986,242 | |
| | | | |
Octagon Investment Partners Series 2017-1A Class B1 (3 Month LIBOR +1.70%) 144A± | | | 4.46 | | | | 7-20-2030 | | | | 1,000,000 | | | | 992,490 | |
| | | | |
RAIT Trust Series 2017-FL8 Class A (1 Month LIBOR +0.85%) 144A± | | | 3.34 | | | | 12-15-2037 | | | | 648,214 | | | | 647,929 | |
The accompanying notes are an integral part of these financial statements.
| | | | |
| 18 | | Wells Fargo Core Plus Bond Fund | | Portfolio of investments—February 28, 2019 (unaudited) |
| | | | | | | | | | | | | | | | |
| Security name | | Interest rate | | | Maturity date | | | Principal | | | Value | |
| | | | |
Non-Agency Mortgage-Backed Securities(continued) | | | | | | | | | | | | | | | | |
| | | | |
Sound Point Collateralized Loan Obligation Limited Series 2013-2RA Class A1 (3 Month LIBOR +0.95%) 144A± | | | 3.74 | % | | | 4-15-2029 | | | $ | 2,825,000 | | | $ | 2,795,038 | |
| | | | |
Stonemont Portfolio Trust Series 2017 Class A (1 Month LIBOR +0.85%) 144A± | | | 3.33 | | | | 8-20-2030 | | | | 2,501,613 | | | | 2,492,173 | |
| | | | |
UBS Commercial Mortgage Trust Series 2017-C5 Class A5 | | | 3.47 | | | | 11-15-2050 | | | | 1,140,000 | | | | 1,130,134 | |
| | | | |
Voya Collateralized Loan Obligation Limited Series 2015-2A Class AR (3 Month LIBOR +0.97%) 144A± | | | 3.74 | | | | 7-23-2027 | | | | 2,900,000 | | | | 2,882,615 | |
| | | | |
West Collateralized Loan Obligation Limited Series 2014-2A Class A1 (3 Month LIBOR +0.87%) 144A± | | | 3.65 | | | | 1-16-2027 | | | | 3,000,000 | | | | 2,988,885 | |
| | | | |
Whitehorse Limited Series 2014-1A Class AR (3 Month LIBOR +0.90%) 144A± | | | 3.64 | | | | 5-1-2026 | | | | 2,869,592 | | | | 2,863,167 | |
| | | | |
Total Non-Agency Mortgage-Backed Securities (Cost $53,107,264) | | | | | | | | | | | | | | | 52,693,821 | |
| | | | | | | | | | | | | | | | |
| | | | |
U.S. Treasury Securities: 10.56% | | | | | | | | | | | | | | | | |
| | | | |
TIPS | | | 1.38 | | | | 2-15-2044 | | | | 3,029,461 | | | | 3,196,496 | |
| | | | |
U.S. Treasury Bond ¤ | | | 0.00 | | | | 5-15-2044 | | | | 9,125,000 | | | | 4,151,247 | |
| | | | |
U.S. Treasury Bond ¤ | | | 0.00 | | | | 11-15-2027 | | | | 9,620,000 | | | | 7,552,304 | |
| | | | |
U.S. Treasury Bond | | | 2.75 | | | | 11-15-2042 | | | | 4,850,000 | | | | 4,588,934 | |
| | | | |
U.S. Treasury Bond | | | 2.88 | | | | 8-15-2045 | | | | 2,495,000 | | | | 2,401,243 | |
| | | | |
U.S. Treasury Bond | | | 3.00 | | | | 8-15-2048 | | | | 6,755,000 | | | | 6,638,635 | |
| | | | |
U.S. Treasury Bond | | | 3.38 | | | | 11-15-2048 | | | | 975,000 | | | | 1,030,758 | |
| | | | |
U.S. Treasury Bond | | | 3.63 | | | | 2-15-2044 | | | | 2,820,000 | | | | 3,089,442 | |
| | | | |
U.S. Treasury Bond | | | 3.75 | | | | 8-15-2041 | | | | 3,965,000 | | | | 4,428,409 | |
| | | | |
U.S. Treasury Bond | | | 4.25 | | | | 11-15-2040 | | | | 6,040,000 | | | | 7,235,259 | |
| | | | |
U.S. Treasury Bond | | | 6.13 | | | | 11-15-2027 | | | | 3,875,000 | | | | 4,899,302 | |
| | | | |
U.S. Treasury Note | | | 1.63 | | | | 8-31-2022 | | | | 465,000 | | | | 451,250 | |
| | | | |
U.S. Treasury Note | | | 2.00 | | | | 10-31-2022 | | | | 8,210,000 | | | | 8,062,156 | |
| | | | |
U.S. Treasury Note | | | 2.63 | | | | 2-15-2029 | | | | 1,540,000 | | | | 1,527,247 | |
| | | | |
U.S. Treasury Note | | | 2.88 | | | | 9-30-2023 | | | | 4,080,000 | | | | 4,140,403 | |
| | | | |
Total U.S. Treasury Securities (Cost $62,842,081) | | | | | | | | | | | | | | | 63,393,085 | |
| | | | | | | | | | | | | | | | |
| | | | |
Yankee Corporate Bonds and Notes: 9.97% | | | | | | | | | | | | | | | | |
| | | | |
Communication Services: 0.61% | | | | | | | | | | | | | | | | |
| | | | |
| Diversified Telecommunication Services: 0.14% | | | | | | | | | | | | | | | | |
| | | | |
Telefonica Emisiones SAU | | | 5.21 | | | | 3-8-2047 | | | | 885,000 | | | | 847,739 | |
| | | | | | | | | | | | | | | | |
| | | | |
| Wireless Telecommunication Services: 0.47% | | | | | | | | | | | | | | | | |
| | | | |
British Telecommunication | | | 5.13 | | | | 12-4-2028 | | | | 2,740,000 | | | | 2,838,879 | |
| | | | | | | | | | | | | | | | |
| | | | |
Consumer Staples: 0.31% | | | | | | | | | | | | | | | | |
| | | | |
| Beverages: 0.31% | | | | | | | | | | | | | | | | |
| | | | |
Coca-Cola Femsa SAB de CV | | | 3.88 | | | | 11-26-2023 | | | | 1,810,000 | | | | 1,843,100 | |
| | | | | | | | | | | | | | | | |
| | | | |
Energy: 0.47% | | | | | | | | | | | | | | | | |
| | | | |
| Energy Equipment & Services: 0.16% | | | | | | | | | | | | | | | | |
| | | | |
Ensco plc | | | 5.75 | | | | 10-1-2044 | | | | 1,500,000 | | | | 963,750 | |
| | | | | | | | | | | | | | | | |
| | | | |
| Oil, Gas & Consumable Fuels: 0.31% | | | | | | | | | | | | | | | | |
| | | | |
Comision Federal de Electricidad 144A | | | 4.75 | | | | 2-23-2027 | | | | 1,140,000 | | | | 1,117,211 | |
| | | | |
Petroleos Mexicanos | | | 6.50 | | | | 1-23-2029 | | | | 765,000 | | | | 723,958 | |
| | | | |
| | | | | | | | | | | | | | | 1,841,169 | |
| | | | | | | | | | | | | | | | |
The accompanying notes are an integral part of these financial statements.
| | | | | | |
| Portfolio of investments—February 28, 2019 (unaudited) | | Wells Fargo Core Plus Bond Fund | | | 19 | |
| | | | | | | | | | | | | | | | |
| Security name | | Interest rate | | | Maturity date | | | Principal | | | Value | |
| | | | |
Financials: 6.71% | | | | | | | | | | | | | | | | |
| | | | |
| Banks: 3.48% | | | | | | | | | | | | | | | | |
| | | | |
ABN AMRO Bank NV 144A | | | 4.75 | % | | | 7-28-2025 | | | $ | 1,800,000 | | | $ | 1,833,631 | |
| | | | |
Banco de Bogota SA 144A | | | 4.38 | | | | 8-3-2027 | | | | 1,110,000 | | | | 1,074,214 | |
| | | | |
Banco do Brasil SA 144A | | | 4.63 | | | | 1-15-2025 | | | | 1,615,000 | | | | 1,598,850 | |
| | | | |
Banco General SA 144A | | | 4.13 | | | | 8-7-2027 | | | | 1,035,000 | | | | 985,838 | |
| | | | |
Banco Internacional del Peru SAA Interbank 144A | | | 3.38 | | | | 1-18-2023 | | | | 1,526,000 | | | | 1,493,954 | |
| | | | |
Banco Safra SA 144A | | | 4.13 | | | | 2-8-2023 | | | | 1,695,000 | | | | 1,678,050 | |
| | | | |
Banco Santander Mexico (5 Year Treasury Constant Maturity +3.00%) 144A± | | | 5.95 | | | | 10-1-2028 | | | | 1,700,000 | | | | 1,731,450 | |
| | | | |
Banco Santander SA | | | 4.25 | | | | 4-11-2027 | | | | 1,600,000 | | | | 1,558,148 | |
| | | | |
Banistmo SA 144A | | | 3.65 | | | | 9-19-2022 | | | | 1,160,000 | | | | 1,131,000 | |
| | | | |
Banque Ouest Africaine de Developpement 144A | | | 5.00 | | | | 7-27-2027 | | | | 2,520,000 | | | | 2,488,500 | |
| | | | |
BPCE SA 144A | | | 5.15 | | | | 7-21-2024 | | | | 1,725,000 | | | | 1,769,365 | |
| | | | |
Danske Bank 144A | | | 5.38 | | | | 1-12-2024 | | | | 1,705,000 | | | | 1,756,240 | |
| | | | |
Perrigo Finance Unlimited Company %% | | | 4.38 | | | | 3-15-2026 | | | | 1,365,000 | | | | 1,292,368 | |
| | | | |
Sumitomo Mitsui Financial Group Incorporated | | | 2.44 | | | | 10-19-2021 | | | | 500,000 | | | | 490,120 | |
| | | | |
| | | | | | | | | | | | | | | 20,881,728 | |
| | | | | | | | | | | | | | | | |
| | | | |
| Capital Markets: 0.54% | | | | | | | | | | | | | | | | |
| | | | |
Cadillac Fairview Corporation Limited 144A | | | 4.13 | | | | 2-1-2029 | | | | 1,760,000 | | | | 1,799,119 | |
| | | | |
Credit Suisse Group Funding Limited (3 Month LIBOR +1.20%) 144A± | | | 3.00 | | | | 12-14-2023 | | | | 1,485,000 | | | | 1,436,858 | |
| | | | |
| | | | | | | | | | | | | | | 3,235,977 | |
| | | | | | | | | | | | | | | | |
| | | | |
| Consumer Finance: 0.19% | | | | | | | | | | | | | | | | |
| | | | |
UBS Group Funding Switzerland 144A | | | 3.49 | | | | 5-23-2023 | | | | 1,165,000 | | | | 1,161,441 | |
| | | | | | | | | | | | | | | | |
| | | | |
| Diversified Financial Services: 1.24% | | | | | | | | | | | | | | | | |
| | | | |
Banco Nacional de Comercio Exterior SNC 144A | | | 4.38 | | | | 10-14-2025 | | | | 2,350,000 | | | | 2,279,500 | |
| | | | |
Corporacion Financiera de Desarrollo SA (3 Month LIBOR +5.61%) 144A± | | | 5.25 | | | | 7-15-2029 | | | | 1,185,000 | | | | 1,207,231 | |
| | | | |
General Electric Capital International Funding Company | | | 2.34 | | | | 11-15-2020 | | | | 1,390,000 | | | | 1,366,512 | |
| | | | |
Teva Pharmaceutical Finance Netherlands III BV | | | 6.75 | | | | 3-1-2028 | | | | 800,000 | | | | 817,830 | |
| | | | |
UBS Group Funding Switzerland AG (5 Year USD Swap +4.87%) ± | | | 7.00 | | | | 12-29-2049 | | | | 1,650,000 | | | | 1,751,063 | |
| | | | |
| | | | | | | | | | | | | | | 7,422,136 | |
| | | | | | | | | | | | | | | | |
| | | | |
| Insurance: 0.88% | | | | | | | | | | | | | | | | |
| | | | |
Axis Specialty Finance plc | | | 2.65 | | | | 4-1-2019 | | | | 1,970,000 | | | | 1,969,063 | |
| | | | |
Sompo International Holdings Limited | | | 7.00 | | | | 7-15-2034 | | | | 1,330,000 | | | | 1,579,909 | |
| | | | |
Validus Holdings Limited | | | 8.88 | | | | 1-26-2040 | | | | 1,210,000 | | | | 1,758,307 | |
| | | | |
| | | | | | | | | | | | | | | 5,307,279 | |
| | | | | | | | | | | | | | | | |
| | | | |
| Thrifts & Mortgage Finance: 0.38% | | | | | | | | | | | | | | | | |
| | | | |
Nationwide Building Society (5 Year USD Swap Rate +1.85%) 144A± | | | 4.13 | | | | 10-18-2032 | | | | 2,500,000 | | | | 2,281,373 | |
| | | | | | | | | | | | | | | | |
| | | | |
Health Care: 1.05% | | | | | | | | | | | | | | | | |
| | | | |
| Pharmaceuticals: 1.05% | | | | | | | | | | | | | | | | |
| | | | |
Bausch Health Companies Incorporated 144A | | | 6.13 | | | | 4-15-2025 | | | | 750,000 | | | | 721,875 | |
| | | | |
Perrigo Finance Unlimited Company | | | 3.50 | | | | 3-15-2021 | | | | 1,305,000 | | | | 1,273,450 | |
| | | | |
Shire Acquisitions Investment Ireland Limited | | | 2.40 | | | | 9-23-2021 | | | | 2,550,000 | | | | 2,492,012 | |
| | | | |
Teva Pharmaceutical Finance BV | | | 2.20 | | | | 7-21-2021 | | | | 600,000 | | | | 570,082 | |
| | | | |
Teva Pharmaceutical Finance BV | | | 4.10 | | | | 10-1-2046 | | | | 1,700,000 | | | | 1,229,549 | |
| | | | |
| | | | | | | | | | | | | | | 6,286,968 | |
| | | | | | | | | | | | | | | | |
The accompanying notes are an integral part of these financial statements.
| | | | |
| 20 | | Wells Fargo Core Plus Bond Fund | | Portfolio of investments—February 28, 2019 (unaudited) |
| | | | | | | | | | | | | | | | |
| Security name | | Interest rate | | | Maturity date | | | Principal | | | Value | |
| | | | |
Industrials: 0.37% | | | | | | | | | | | | | | | | |
| | | | |
| Trading Companies & Distributors: 0.29% | | | | | | | | | | | | | | | | |
| | | | |
Aercap Ireland Limited | | | 4.88 | % | | | 1-16-2024 | | | $ | 1,705,000 | | | $ | 1,744,725 | |
| | | | | | | | | | | | | | | | |
| | | | |
| Transportation Infrastructure: 0.08% | | | | | | | | | | | | | | | | |
| | | | |
Mexico City Airport Trust 144A | | | 5.50 | | | | 7-31-2047 | | | | 570,000 | | | | 491,625 | |
| | | | | | | | | | | | | | | | |
| | | | |
Utilities: 0.45% | | | | | | | | | | | | | | | | |
| | | | |
| Electric Utilities: 0.45% | | | | | | | | | | | | | | | | |
| | | | |
Western Power Distributions Holdings Limited 144A | | | 7.38 | | | | 12-15-2028 | | | | 2,265,000 | | | | 2,698,861 | |
| | | | | | | | | | | | | | | | |
| | | | |
Total Yankee Corporate Bonds and Notes (Cost $59,474,114) | | | | | | | | | | | | | | | 59,846,750 | |
| | | | | | | | | | | | | | | | |
| | | | |
Yankee Government Bonds: 3.69% | | | | | | | | | | | | | | | | |
| | | | |
Bermuda 144A | | | 3.72 | | | | 1-25-2027 | | | | 995,000 | | | | 970,453 | |
| | | | |
Bermuda 144A | | | 4.14 | | | | 1-3-2023 | | | | 1,210,000 | | | | 1,229,130 | |
| | | | |
Federative Republic of Brazil | | | 4.63 | | | | 1-13-2028 | | | | 1,795,000 | | | | 1,783,350 | |
| | | | |
Hashemite Kingdom of Jordan | | | 3.00 | | | | 6-30-2025 | | | | 3,000,000 | | | | 3,013,689 | |
| | | | |
Province of Santa Fe 144A | | | 7.00 | | | | 3-23-2023 | | | | 2,000,000 | | | | 1,743,000 | |
| | | | |
Republic of Argentina | | | 6.88 | | | | 4-22-2021 | | | | 1,280,000 | | | | 1,212,800 | |
| | | | |
Republic of Argentina | | | 6.88 | | | | 1-11-2048 | | | | 1,000,000 | | | | 749,010 | |
| | | | |
Republic of Argentina | | | 7.50 | | | | 4-22-2026 | | | | 1,350,000 | | | | 1,173,825 | |
| | | | |
Republic of Chile | | | 3.86 | | | | 6-21-2047 | | | | 1,000,000 | | | | 972,500 | |
| | | | |
Republic of Kenya 144A | | | 8.25 | | | | 2-28-2048 | | | | 750,000 | | | | 755,025 | |
| | | | |
Republic of Paraguay 144A | | | 5.40 | | | | 3-30-2050 | | | | 1,000,000 | | | | 1,013,490 | |
| | | | |
Republic of Senegal 144A | | | 6.25 | | | | 5-23-2033 | | | | 750,000 | | | | 712,500 | |
| | | | |
Saudi Arabia 144A | | | 4.38 | | | | 4-16-2029 | | | | 2,840,000 | | | | 2,896,743 | |
| | | | |
Ukraine | | | 1.47 | | | | 9-29-2021 | | | | 3,000,000 | | | | 2,915,610 | |
| | | | |
Ukraine 144A | | | 7.38 | | | | 9-25-2032 | | | | 1,200,000 | | | | 1,033,585 | |
| | | | |
Total Yankee Government Bonds (Cost $23,236,574) | | | | | | | | | | | | | | | 22,174,710 | |
| | | | | | | | | | | | | | | | |
| | | | |
| | | Yield | | | | | | Shares | | | | |
| Short-Term Investments: 9.66% | | | | | | | | | | | | | | | | |
| | | | |
| Investment Companies: 9.32% | | | | | | | | | | | | | | | | |
| | | | |
Securities Lending Cash Investments LLC (l)(u)(r) | | | 2.56 | | | | | | | | 3,511,916 | | | | 3,512,267 | |
| | | | |
Wells Fargo Government Money Market Fund Select Class (l)(u)## | | | 2.34 | | | | | | | | 52,397,075 | | | | 52,397,075 | |
| | | | |
| | | | | | | | | | | | | | | 55,909,342 | |
| | | | | | | | | | | | | | | | |
| | | | |
| | | | | | | | | Principal | | | | |
| U.S. Treasury Securities: 0.34% | | | | | | | | | | | | | | | | |
| | | | |
U.S. Treasury Bill (z)# | | | 2.21 | | | | 3-14-2019 | | | $ | 1,900,000 | | | | 1,898,387 | |
| | | | |
U.S. Treasury Bill (z)# | | | 2.29 | | | | 3-28-2019 | | | | 180,000 | | | | 179,684 | |
| | | | |
| | | | | | | | | | | | | | | 2,078,071 | |
| | | | | | | | | | | | | | | | |
| | | | |
Total Short-Term Investments (Cost $57,987,329) | | | | | | | | | | | | | | | 57,987,413 | |
| | | | | | | | | | | | | | | | |
| | | | | | | | |
| Total investments in securities (Cost $606,350,929) | | | 100.90 | % | | | 605,624,480 | |
| | |
Other assets and liabilities, net | | | (0.90 | ) | | | (5,388,888 | ) |
| | | | | | | | |
| Total net assets | | | 100.00 | % | | $ | 600,235,592 | |
| | | | | | | | |
The accompanying notes are an integral part of these financial statements.
| | | | | | |
| Portfolio of investments—February 28, 2019 (unaudited) | | Wells Fargo Core Plus Bond Fund | | | 21 | |
| ± | Variable rate investment. The rate shown is the rate in effect at period end. |
| ±± | The coupon of the security is adjusted based on the principal and interest payments received from the underlying pool of mortgages as well as the credit quality and the actual prepayment speed of the underlying mortgages. |
| (c) | Investment in an interest-only security entitles holders to receive only the interest payments on the underlying mortgages. The principal amount shown is the notional amount of the underlying mortgages. The rate represents the coupon rate. |
| ¤ | The security is issued in zero coupon form with no periodic interest payments. |
| %% | The security is issued on a when-issued basis. |
| 144A | The security may be resold in transactions exempt from registration, normally to qualified institutional buyers, pursuant to Rule 144A under the Securities Act of 1933. |
| « | All or a portion of this security is on loan. |
| @ | Foreign bond principal is denominated in the local currency of the issuer. |
| ‡ | Security is valued using significant unobservable inputs. |
| † | Non-income-earning security |
| (l) | The issuer of the security is an affiliated person of the Fund as defined in the Investment Company Act of 1940. |
| (r) | The investment is a non-registered investment company purchased with cash collateral received from securities on loan. |
| (u) | The rate represents the 7-day annualized yield at period end. |
| ## | All or a portion of this security is segregated for when-issued securities. |
| (z) | Zero coupon security. The rate represents the purchase yield to maturity. |
| # | All or a portion of this security is segregated as collateral for investments in derivative instruments. |
Abbreviations:
| AGM | Assured Guaranty Municipal |
| Ambac | Ambac Financial Group Incorporated |
| CAB | Capital appreciation bond |
| EDA | Economic Development Authority |
| FHLB | Federal Home Loan Bank |
| FHLMC | Federal Home Loan Mortgage Corporation |
| FNMA | Federal National Mortgage Association |
| GNMA | Government National Mortgage Association |
| HEFAR | Higher Education Facilities Authority Revenue |
| LIBOR | London Interbank Offered Rate |
| REIT | Real estate investment trust |
| STRIPS | Separate trading of registered interest and principal securities |
| TIPS | Treasury inflation-protected securities |
| TVA | Tennessee Valley Authority |
The accompanying notes are an integral part of these financial statements.
| | | | |
| 22 | | Wells Fargo Core Plus Bond Fund | | Portfolio of investments—February 28, 2019 (unaudited) |
Futures Contracts
| | | | | | | | | | | | | | | | | | | | | | | | |
| Description | | Number of
contracts | | | Expiration
date | | | Notional cost | | | Notional value | | | Unrealized gains | | | Unrealized losses | |
| | | | | | |
Long | | | | | | | | | | | | | | | | | | | | | | | | |
| | | | | | |
Euro BTP Future | | | 20 | | | | 3-7-2019 | | | $ | 2,808,878 | | | $ | 2,917,330 | | | $ | 108,452 | | | $ | 0 | |
| | | | | | |
U.S. Long Term Bond | | | 44 | | | | 6-19-2019 | | | | 6,386,952 | | | | 6,356,625 | | | | 0 | | | | (30,327 | ) |
| | | | | | |
10-Year U.S. Treasury Notes | | | 165 | | | | 6-19-2019 | | | | 20,164,167 | | | | 20,130,000 | | | | 0 | | | | (34,167 | ) |
| | | | | | |
10-Year Ultra Futures | | | 10 | | | | 6-19-2019 | | | | 1,297,986 | | | | 1,294,531 | | | | 0 | | | | (3,455 | ) |
| | | | | | |
5-Year U.S. Treasury Notes | | | 208 | | | | 6-28-2019 | | | | 23,832,737 | | | | 23,829,000 | | | | 0 | | | | (3,737 | ) |
| | | | | | |
2-Year U.S. Treasury Notes | | | 258 | | | | 6-28-2019 | | | | 54,742,724 | | | | 54,746,391 | | | | 3,667 | | | | 0 | |
| | | | | | |
Short | | | | | | | | | | | | | | | | | | | | | | | | |
| | | | | | |
Euro-Bund Futures | | | (60) | | | | 3-7-2019 | | | | (11,079,116 | ) | | | (11,281,905 | ) | | | 0 | | | | (202,789 | ) |
| | | | | | |
Euro-BOBL Futures | | | (85) | | | | 3-7-2019 | | | | (12,779,450 | ) | | | (12,831,794 | ) | | | 0 | | | | (52,344 | ) |
| | | | | | |
U.S. Ultra Bond | | | (4) | | | | 6-19-2019 | | | | (647,993 | ) | | | (638,375 | ) | | | 9,618 | | | | 0 | |
| | | | | | | | | | | | | | | | | | | | | | | | |
| | | | | | |
| | | | | | | | | | | | | | | | | | $ | 121,737 | | | $ | (326,819 | ) |
| | | | | | | | | | | | | | | | | | | | | | | | |
Forward Foreign Currency Contracts
| | | | | | | | | | | | | | |
Currency to be received | | Currency to be
delivered | | Counterparty | | Settlement date | | Unrealized gains | | | Unrealized losses | |
| | | | | |
| 6,669,500 EUR | | 7,625,906 USD | | Citibank | | 3-29-2019 | | $ | 0 | | | $ | (23,687 | ) |
| | | | | |
| 2,840,673 USD | | 4,000,000 AUD | | Citibank | | 3-29-2019 | | | 2,023 | | | | 0 | |
| | | | | |
| 36,620,562 USD | | 32,055,000 EUR | | Citibank | | 3-29-2019 | | | 82,718 | | | | 0 | |
| | | | | |
| 1,423,334 USD | | 1,900,000 CAD | | Citibank | | 3-29-2019 | | | 0 | | | | (21,489 | ) |
| | | | | |
| 2,950,000 EUR | | 3,355,823 USD | | Citibank | | 3-29-2019 | | | 6,730 | | | | 0 | |
| | | | | |
| 1,225,000 EUR | | 1,409,715 USD | | Citibank | | 3-29-2019 | | | 0 | | | | (13,401 | ) |
| | | | | |
| 314,000,000 JPY | | 2,802,700 USD | | Citibank | | 3-29-2019 | | | 19,944 | | | | 0 | |
| | | | | | | | | | | | | | |
| | | | | |
| | | | | | | | $ | 111,415 | | | $ | (58,577 | ) |
| | | | | | | | | | | | | | |
Centrally Cleared Credit Default Swaps
| | | | | | | | | | | | | | | | | | | | | | | | | | | | | | | | |
| Reference index | | Fixed rate
received | | | Payment
frequency | | | Maturity
date | | | Notional
amount | | | Value | | | Premiums
paid | | | Unrealized
gains | | | Unrealized
losses | |
| | | | | | | | |
Sell protection | | | | | | | | | | | | | | | | | | | | | | | | | | | | | | | | |
| | | | | | | | |
Markit iTraxx Europe Index | | | 1.00 | % | | | Quarterly | | | | 12-20-2023 | | | | 4,000,000 EUR | | | $ | 83,723 | | | $ | 70,600 | | | $ | 13,123 | | | $ | 0 | |
| | | | | | | | |
Markit CDX North American High Yield Index | | | 5.00 | | | | Quarterly | | | | 12-20-2023 | | | | 5,390,000 USD | | | | 337,666 | | | | 107,419 | | | | 230,247 | | | | 0 | |
| | | | | | | | | | | | | | | | | | | | | | | | | | | | | | | | |
| | | | | | | | |
| | | | | | | | | | | | | | | | | | | | | | $ | 178,019 | | | $ | 243,370 | | | $ | 0 | |
| | | | | | | | | | | | | | | | | | | | | | | | | | | | | | | | |
The accompanying notes are an integral part of these financial statements.
| | | | | | |
| Portfolio of investments—February 28, 2019 (unaudited) | | Wells Fargo Core Plus Bond Fund | | | 23 | |
Investments in Affiliates
An affiliated investment is an investment in which the Fund owns at least 5% of the outstanding voting shares of the issuer or as a result of other relationships, such as the Fund and the issuer having the same investment manager. Transactions with issuers that were either affiliated persons of the Fund at the beginning of the period or the end of the period were as follows:
| | | | | | | | | | | | | | | | | | | | | | | | | | | | | | | | | | | | |
| | | Shares,
beginning of
period | | | Shares
purchased | | | Shares sold | | | Shares,
end of
period | | | Net
realized
gains
(losses) | | | Net
change in
unrealized
gains
(losses) | | | Income
from
affiliated
securities | | | Value, end of period | | | % of net assets | |
Short-Term Investments | | | | | | | | | | | | | | | | | | | | | | | | | | | | | | | | | | | | |
Investment Companies | | | | | | | | | | | | | | | | | | | | | | | | | | | | | | | | | | | | |
Securities Lending Cash Investments LLC | | | 892,078 | | | | 36,742,238 | | | | 34,122,400 | | | | 3,511,916 | | | $ | (2 | ) | | $ | 3 | | | $ | 25,621 | | | $ | 3,512,267 | | | | | |
Wells Fargo Government Money Market Fund Select Class | | | 25,332,190 | | | | 157,212,593 | | | | 130,147,708 | | | | 52,397,075 | | | | 0 | | | | 0 | | | | 237,110 | | | | 52,397,075 | | | | | |
| | | | | | | | | | | | | | | | | | | | | | | | | | | | | | | | | | | | |
| | | | | | | | | |
| | | | | | | | | | | | | | | | | | $ | (2 | ) | | $ | 3 | | | $ | 262,731 | | | $ | 55,909,342 | | | | 9.32 | % |
| | | | | | | | | | | | | | | | | | | | | | | | | | | | | | | | | | | | |
The accompanying notes are an integral part of these financial statements.
| | | | |
| 24 | | Wells Fargo Core Plus Bond Fund | | Statement of assets and liabilities—February 28, 2019 (unaudited) |
| | | | |
| | | | |
| |
Assets | | | | |
Investments in unaffiliated securities (including $3,436,608 of securities loaned), at value (cost $550,441,650) | | $ | 549,715,138 | |
Investments in affiliated securities, at value (cost $55,909,279) | | | 55,909,342 | |
Cash | | | 30,938 | |
Cash at broker segregated for centrally cleared swaps | | | 672,827 | |
Foreign currency, at value (cost $1,769,042) | | | 1,789,727 | |
Principal paydown receivable | | | 1,757 | |
Receivable for investments sold | | | 918,091 | |
Receivable for Fund shares sold | | | 2,549,313 | |
Receivable for interest | | | 4,058,015 | |
Receivable for daily variation margin on open futures contracts | | | 46,563 | |
Receivable for securities lending income | | | 2,465 | |
Unrealized gains on forward foreign currency contracts | | | 111,415 | |
Prepaid expenses and other assets | | | 269,673 | |
| | | | |
Total assets | | | 616,075,264 | |
| | | | |
| |
Liabilities | | | | |
Payable for investments purchased | | | 11,143,394 | |
Payable upon receipt of securities loaned | | | 3,511,340 | |
Payable for Fund shares redeemed | | | 325,226 | |
Cash collateral due to broker for forward foreign currency contracts | | | 280,000 | |
Management fee payable | | | 117,323 | |
Payable for daily variation margin on open futures contracts | | | 110,188 | |
Payable for daily variation margin on centrally cleared swaps | | | 72,756 | |
Unrealized losses on forward foreign currency contracts | | | 58,577 | |
Administration fees payable | | | 49,808 | |
Distribution fee payable | | | 9,388 | |
Trustees’ fees and expenses payable | | | 2,963 | |
Accrued expenses and other liabilities | | | 158,709 | |
| | | | |
Total liabilities | | | 15,839,672 | |
| | | | |
Total net assets | | $ | 600,235,592 | |
| | | | |
| |
NET ASSETS CONSIST OF | | | | |
Paid-in capital | | $ | 602,134,515 | |
Total distributable loss | | | (1,898,923 | ) |
| | | | |
Total net assets | | $ | 600,235,592 | |
| | | | |
| |
COMPUTATION OF NET ASSET VALUE AND OFFERING PRICE PER SHARE | | | | |
Net assets – Class A | | $ | 231,612,519 | |
Shares outstanding – Class A1 | | | 18,705,930 | |
Net asset value per share – Class A | | | $12.38 | |
Maximum offering price per share – Class A2 | | | $12.96 | |
Net assets – Class C | | $ | 15,426,924 | |
Shares outstanding – Class C1 | | | 1,246,021 | |
Net asset value per share – Class C | | | $12.38 | |
Net assets – Class R6 | | $ | 55,405,677 | |
Shares outstanding – Class R61 | | | 4,468,308 | |
Net asset value per share – Class R6 | | | $12.40 | |
Net assets – Administrator Class | | $ | 19,664,611 | |
Shares outstanding – Administrator Class1 | | | 1,590,538 | |
Net asset value per share – Administrator Class | | | $12.36 | |
Net assets – Institutional Class | | $ | 278,125,861 | |
Shares outstanding – Institutional Class1 | | | 22,439,587 | |
Net asset value per share – Institutional Class | | | $12.39 | |
| 1 | The Fund has an unlimited number of authorized shares. |
| 2 | Maximum offering price is computed as 100/95.50 of net asset value. On investments of $50,000 or more, the offering price is reduced. |
The accompanying notes are an integral part of these financial statements.
| | | | | | |
| Statement of operations—six months ended February 28, 2019 (unaudited) | | Wells Fargo Core Plus Bond Fund | | | 25 | |
| | | | |
| | | | |
| |
Investment income | | | | |
Interest (net of foreign interest withholding taxes of $12,374) | | $ | 10,599,951 | |
Income from affiliated securities | | | 249,028 | |
Dividends | | | 144,654 | |
| | | | |
Total investment income | | | 10,993,633 | |
| | | | |
| |
Expenses | | | | |
Management fee | | | 1,247,214 | |
Administration fees | | | | |
Class A | | | 176,743 | |
Class C | | | 15,188 | |
Class R6 | | | 6,886 | |
Administrator Class | | | 12,755 | |
Institutional Class | | | 98,764 | |
Shareholder servicing fees | | | | |
Class A | | | 276,161 | |
Class C | | | 23,731 | |
Administrator Class | | | 31,886 | |
Distribution fee | | | | |
Class C | | | 71,192 | |
Custody and accounting fees | | | 29,260 | |
Professional fees | | | 33,234 | |
Registration fees | | | 48,767 | |
Shareholder report expenses | | | 44,377 | |
Trustees’ fees and expenses | | | 10,728 | |
Other fees and expenses | | | 6,823 | |
| | | | |
Total expenses | | | 2,133,709 | |
Less: Fee waivers and/or expense reimbursements | | | (533,600 | ) |
| | | | |
Net expenses | | | 1,600,109 | |
| | | | |
Net investment income | | | 9,393,524 | |
| | | | |
| |
REALIZED AND UNREALIZED GAINS (LOSSES) ON INVESTMENTS | | | | |
| |
Net realized gains (losses) on: | | | | |
Unaffiliated securities | | | (4,008,592 | ) |
Affiliated securities | | | (2 | ) |
Futures contracts | | | 1,019,603 | |
Forward foreign currency contracts | | | 1,288,411 | |
Credit default swap contracts | | | 163,574 | |
| | | | |
Net realized losses on investments | | | (1,537,006 | ) |
| | | | |
| |
Net change in unrealized gains (losses) on: | | | | |
Unaffiliated securities | | | 5,300,887 | |
Affiliated securities | | | 3 | |
Futures contracts | | | (107,191 | ) |
Forward foreign currency contracts | | | (31,997 | ) |
Credit default swap contracts | | | 275,606 | |
| | | | |
Net change in unrealized gains (losses) on investments | | | 5,437,308 | |
| | | | |
Net realized and unrealized gains (losses) on investments | | | 3,900,302 | |
| | | | |
Net increase in net assets resulting from operations | | $ | 13,293,826 | |
| | | | |
The accompanying notes are an integral part of these financial statements.
| | | | |
| 26 | | Wells Fargo Core Plus Bond Fund | | Statement of changes in net assets |
| | | | | | | | | | | | | | | | |
| | | Six months ended
February 28, 2019 (unaudited) | | | Year ended
August 31, 20181 | |
| | | | |
Operations | | | | | | | | | | | | | | | | |
Net investment income | | | | | | $ | 9,393,524 | | | | | | | $ | 16,082,992 | |
Net realized losses on investments | | | | | | | (1,537,006 | ) | | | | | | | (2,470,659 | ) |
Net change in unrealized gains (losses) on investments | | | | | | | 5,437,308 | | | | | | | | (17,907,347 | ) |
| | | | |
Net increase (decrease) in net assets resulting from operations | | | | | | | 13,293,826 | | | | | | | | (4,295,014 | ) |
| | | | |
| | | | |
Distributions to shareholders from net investment income and net realized gains | | | | | | | | | | | | | | | | |
Class A | | | | | | | (3,116,010 | ) | | | | | | | (6,592,901 | ) |
Class C | | | | | | | (192,760 | ) | | | | | | | (396,945 | ) |
Class R6 | | | | | | | (737,293 | ) | | | | | | | (1,205,963 | ) |
Administrator Class | | | | | | | (358,842 | ) | | | | | | | (1,057,877 | ) |
Institutional Class | | | | | | | (3,885,248 | ) | | | | | | | (7,080,934 | ) |
| | | | |
Total distributions to shareholders | | | | | | | (8,290,153 | ) | | | | | | | (16,334,620 | ) |
| | | | |
| | | | |
Capital share transactions | | | Shares | | | | | | | | Shares | | | | | |
Proceeds from shares sold | | | | | | | | | | | | | | | | |
Class A | | | 1,405,968 | | | | 17,242,733 | | | | 3,153,880 | | | | 39,493,506 | |
Class C | | | 143,170 | | | | 1,753,397 | | | | 574,528 | | | | 7,177,070 | |
Class R6 | | | 867,188 | | | | 10,704,103 | | | | 1,231,456 | | | | 15,394,192 | |
Administrator Class | | | 150,463 | | | | 1,833,286 | | | | 1,331,903 | | | | 16,514,724 | |
Institutional Class | | | 7,696,233 | | | | 94,476,046 | | | | 15,277,371 | | | | 190,922,160 | |
| | | | |
| | | | |
| | | | | | | 126,009,565 | | | | | | | | 269,501,652 | |
| | | | |
Reinvestment of distributions | | | | | | | | | | | | | | | | |
Class A | | | 236,491 | | | | 2,888,174 | | | | 490,954 | | | | 6,097,803 | |
Class C | | | 14,700 | | | | 179,425 | | | | 29,298 | | | | 363,379 | |
Class R6 | | | 46,574 | | | | 569,720 | | | | 81,463 | | | | 1,012,889 | |
Administrator Class | | | 29,293 | | | | 356,872 | | | | 84,932 | | | | 1,053,385 | |
Institutional Class | | | 295,167 | | | | 3,607,520 | | | | 530,646 | | | | 6,583,306 | |
| | | | |
| | | | |
| | | | | | | 7,601,711 | | | | | | | | 15,110,762 | |
| | | | |
Payment for shares redeemed | | | | | | | | | | | | | | | | |
Class A | | | (1,661,849 | ) | | | (20,287,434 | ) | | | (5,034,990 | ) | | | (62,673,141 | ) |
Class C | | | (587,776 | ) | | | (7,245,609 | ) | | | (426,093 | ) | | | (5,284,028 | ) |
Class R6 | | | (121,594 | ) | | | (1,490,679 | ) | | | (107,920 | ) | | | (1,336,675 | ) |
Administrator Class | | | (1,221,993 | ) | | | (14,929,001 | ) | | | (2,078,726 | ) | | | (25,750,208 | ) |
Institutional Class | | | (7,076,312 | ) | | | (86,356,610 | ) | | | (7,127,474 | ) | | | (88,356,112 | ) |
| | | | |
| | | | |
| | | | | | | (130,309,333 | ) | | | | | | | (183,400,164 | ) |
| | | | |
Net increase in net assets resulting from capital share transactions | | | | | | | 3,301,943 | | | | | | | | 101,212,250 | |
| | | | |
Total increase in net assets | | | | | | | 8,305,616 | | | | | | | | 80,582,616 | |
| | | | |
| | | | |
Net assets | | | | | | | | | | | | | | | | |
Beginning of period | | | | | | | 591,929,976 | | | | | | | | 511,347,360 | |
| | | | |
End of period | | | | | | $ | 600,235,592 | | | | | | | $ | 591,929,976 | |
| | | | |
| 1 | Effective for all filings after November 4, 2018, the SEC prospectively eliminated the requirement to parenthetically disclose undistributed net investment income at the end of the period and permitted the aggregation of distributions, with the exception of tax basis returns of capital. Undistributed net investment income at August 31, 2018 was $2,094,155. The disaggregated distributions information for the year ended August 31, 2018 is included in Note 8,Distributions to Shareholders, in the notes to the financial statements. |
The accompanying notes are an integral part of these financial statements.
| | | | | | |
| Financial highlights | | Wells Fargo Core Plus Bond Fund | | | 27 | |
(For a share outstanding throughout each period)
| | | | | | | | | | | | | | | | | | | | | | | | |
| | | Six months ended February 28, 2019 (unaudited) | | | Year ended August 31 | |
| CLASS A | | 2018 | | | 2017 | | | 2016 | | | 2015 | | | 2014 | |
Net asset value, beginning of period | | | $12.27 | | | | $12.71 | | | | $12.70 | | | | $12.14 | | | | $12.24 | | | | $11.66 | |
Net investment income | | | 0.19 | | | | 0.34 | | | | 0.36 | 1 | | | 0.33 | | | | 0.21 | 1 | | | 0.26 | |
Net realized and unrealized gains (losses) on investments | | | 0.09 | | | | (0.45 | ) | | | (0.01 | ) | | | 0.60 | | | | (0.08 | ) | | | 0.57 | |
| | | | | | | | | | | | | | | | | | | | | | | | |
Total from investment operations | | | 0.28 | | | | (0.11 | ) | | | 0.35 | | | | 0.93 | | | | 0.13 | | | | 0.83 | |
Distributions to shareholders from | | | | | | | | | | | | | | | | | | | | | | | | |
Net investment income | | | (0.17 | ) | | | (0.33 | ) | | | (0.33 | ) | | | (0.33 | ) | | | (0.21 | ) | | | (0.25 | ) |
Net realized gains | | | 0.00 | | | | 0.00 | | | | (0.01 | ) | | | (0.04 | ) | | | (0.02 | ) | | | 0.00 | |
| | | | | | | | | | | | | | | | | | | | | | | | |
Total distributions to shareholders | | | (0.17 | ) | | | (0.33 | ) | | | (0.34 | ) | | | (0.37 | ) | | | (0.23 | ) | | | (0.25 | ) |
Net asset value, end of period | | | $12.38 | | | | $12.27 | | | | $12.71 | | | | $12.70 | | | | $12.14 | | | | $12.24 | |
Total return2 | | | 2.30 | % | | | (0.84 | )% | | | 2.78 | % | | | 7.78 | % | | | 1.04 | % | | | 7.16 | % |
Ratios to average net assets (annualized) | | | | | | | | | | | | | | | | | | | | | | | | |
Gross expenses | | | 0.92 | % | | | 0.92 | % | | | 0.93 | % | | | 0.93 | % | | | 0.91 | % | | | 0.93 | % |
Net expenses | | | 0.73 | % | | | 0.73 | % | | | 0.76 | % | | | 0.84 | % | | | 0.84 | % | | | 0.85 | % |
Net investment income | | | 3.19 | % | | | 2.63 | % | | | 2.88 | % | | | 2.76 | % | | | 1.69 | % | | | 2.10 | % |
Supplemental data | | | | | | | | | | | | | | | | | | | | | | | | |
Portfolio turnover rate | | | 52 | % | | | 148 | % | | | 199 | % | | | 288 | % | | | 322 | % | | | 267 | % |
Net assets, end of period (000s omitted) | | | $231,613 | | | | $229,688 | | | | $255,668 | | | | $349,852 | | | | $223,755 | | | | $129,646 | |
| 1 | Calculated based upon average shares outstanding |
| 2 | Total return calculations do not include any sales charges. Returns for periods of less than one year are not annualized. |
The accompanying notes are an integral part of these financial statements.
| | | | |
| 28 | | Wells Fargo Core Plus Bond Fund | | Financial highlights |
(For a share outstanding throughout each period)
| | | | | | | | | | | | | | | | | | | | | | | | |
| | �� | Six months ended
February 28, 2019 (unaudited) | | | Year ended August 31 | |
| CLASS C | | 2018 | | | 2017 | | | 2016 | | | 2015 | | | 2014 | |
Net asset value, beginning of period | | | $12.26 | | | | $12.71 | | | | $12.70 | | | | $12.14 | | | | $12.23 | | | | $11.65 | |
Net investment income | | | 0.14 | 1 | | | 0.23 | | | | 0.26 | | | | 0.24 | 1 | | | 0.12 | 1 | | | 0.16 | |
Net realized and unrealized gains (losses) on investments | | | 0.10 | | | | (0.44 | ) | | | (0.01 | ) | | | 0.59 | | | | (0.08 | ) | | | 0.58 | |
| | | | | | | | | | | | | | | | | | | | | | | | |
Total from investment operations | | | 0.24 | | | | (0.21 | ) | | | 0.25 | | | | 0.83 | | | | 0.04 | | | | 0.74 | |
Distributions to shareholders from | | | | | | | | | | | | | | | | | | | | | | | | |
Net investment income | | | (0.12 | ) | | | (0.24 | ) | | | (0.23 | ) | | | (0.23 | ) | | | (0.11 | ) | | | (0.16 | ) |
Net realized gains | | | 0.00 | | | | 0.00 | | | | (0.01 | ) | | | (0.04 | ) | | | (0.02 | ) | | | 0.00 | |
| | | | | | | | | | | | | | | | | | | | | | | | |
Total distributions to shareholders | | | (0.12 | ) | | | (0.24 | ) | | | (0.24 | ) | | | (0.27 | ) | | | (0.13 | ) | | | (0.16 | ) |
Net asset value, end of period | | | $12.38 | | | | $12.26 | | | | $12.71 | | | | $12.70 | | | | $12.14 | | | | $12.23 | |
Total return2 | | | 1.90 | % | | | (1.66 | )% | | | 2.01 | % | | | 6.99 | % | | | 0.35 | % | | | 6.35 | % |
Ratios to average net assets (annualized) | | | | | | | | | | | | | | | | | | | | | | | | |
Gross expenses | | | 1.67 | % | | | 1.67 | % | | | 1.68 | % | | | 1.68 | % | | | 1.66 | % | | | 1.68 | % |
Net expenses | | | 1.48 | % | | | 1.48 | % | | | 1.51 | % | | | 1.59 | % | | | 1.59 | % | | | 1.60 | % |
Net investment income | | | 2.44 | % | | | 1.89 | % | | | 2.12 | % | | | 2.00 | % | | | 0.95 | % | | | 1.35 | % |
Supplemental data | | | | | | | | | | | | | | | | | | | | | | | | |
Portfolio turnover rate | | | 52 | % | | | 148 | % | | | 199 | % | | | 288 | % | | | 322 | % | | | 267 | % |
Net assets, end of period (000s omitted) | | | $15,427 | | | | $20,550 | | | | $19,036 | | | | $21,216 | | | | $20,381 | | | | $24,212 | |
| 1 | Calculated based upon average shares outstanding |
| 2 | Total return calculations do not include any sales charges. Returns for periods of less than one year are not annualized. |
The accompanying notes are an integral part of these financial statements.
| | | | | | |
| Financial highlights | | Wells Fargo Core Plus Bond Fund | | | 29 | |
(For a share outstanding throughout each period)
| | | | | | | | | | | | |
| | | Six months ended
February 28, 2019 (unaudited) | | | Year ended August 31 | |
| CLASS R6 | | 2018 | | | 20171 | |
Net asset value, beginning of period | | | $12.28 | | | | $12.73 | | | | $12.59 | |
Net investment income | | | 0.21 | | | | 0.39 | | | | 0.33 | 2 |
Net realized and unrealized gains (losses) on investments | | | 0.10 | | | | (0.46 | ) | | | 0.12 | |
| | | | | | | | | | | | |
Total from investment operations | | | 0.31 | | | | (0.07 | ) | | | 0.45 | |
Distributions to shareholders from | | | | | | | | | | | | |
Net investment income | | | (0.19 | ) | | | (0.38 | ) | | | (0.30 | ) |
Net realized gains | | | 0.00 | | | | 0.00 | | | | (0.01 | ) |
| | | | | | | | | | | | |
Total distributions to shareholders | | | (0.19 | ) | | | (0.38 | ) | | | (0.31 | ) |
Net asset value, end of period | | | $12.40 | | | | $12.28 | | | | $12.73 | |
Total return3 | | | 2.48 | % | | | (0.55 | )% | | | 3.64 | % |
Ratios to average net assets (annualized) | | | | | | | | | | | | |
Gross expenses | | | 0.54 | % | | | 0.54 | % | | | 0.55 | % |
Net expenses | | | 0.35 | % | | | 0.35 | % | | | 0.35 | % |
Net investment income | | | 3.57 | % | | | 3.05 | % | | | 3.12 | % |
Supplemental data | | | | | | | | | | | | |
Portfolio turnover rate | | | 52 | % | | | 148 | % | | | 199 | % |
Net assets, end of period (000s omitted) | | | $55,406 | | | | $45,159 | | | | $31,451 | |
| 1 | For the period from October 31, 2016 (commencement of class operations) to August 31, 2017 |
| 2 | Calculated based upon average shares outstanding |
| 3 | Returns for periods of less than one year are not annualized. |
The accompanying notes are an integral part of these financial statements.
| | | | |
| 30 | | Wells Fargo Core Plus Bond Fund | | Financial highlights |
(For a share outstanding throughout each period)
| | | | | | | | | | | | | | | | | | | | | | | | |
| | | Six months ended
February 28, 2019 (unaudited) | | | Year ended August 31 | |
| ADMINISTRATOR CLASS | | 2018 | | | 2017 | | | 2016 | | | 2015 | | | 2014 | |
Net asset value, beginning of period | | | $12.25 | | | | $12.69 | | | | $12.68 | | | | $12.12 | | | | $12.22 | | | | $11.64 | |
Net investment income | | | 0.19 | 1 | | | 0.35 | | | | 0.37 | | | | 0.34 | | | | 0.22 | | | | 0.27 | 1 |
Net realized and unrealized gains (losses) on investments | | | 0.09 | | | | (0.44 | ) | | | (0.01 | ) | | | 0.60 | | | | (0.08 | ) | | | 0.57 | |
| | | | | | | | | | | | | | | | | | | | | | | | |
Total from investment operations | | | 0.28 | | | | (0.09 | ) | | | 0.36 | | | | 0.94 | | | | 0.14 | | | | 0.84 | |
Distributions to shareholders from | | | | | | | | | | | | | | | | | | | | | | | | |
Net investment income | | | (0.17 | ) | | | (0.35 | ) | | | (0.34 | ) | | | (0.34 | ) | | | (0.22 | ) | | | (0.26 | ) |
Net realized gains | | | 0.00 | | | | 0.00 | | | | (0.01 | ) | | | (0.04 | ) | | | (0.02 | ) | | | 0.00 | |
| | | | | | | | | | | | | | | | | | | | | | | | |
Total distributions to shareholders | | | (0.17 | ) | | | (0.35 | ) | | | (0.35 | ) | | | (0.38 | ) | | | (0.24 | ) | | | (0.26 | ) |
Net asset value, end of period | | | $12.36 | | | | $12.25 | | | | $12.69 | | | | $12.68 | | | | $12.12 | | | | $12.22 | |
Total return2 | | | 2.35 | % | | | (0.74 | )% | | | 2.90 | % | | | 7.92 | % | | | 1.15 | % | | | 7.31 | % |
Ratios to average net assets (annualized) | | | | | | | | | | | | | | | | | | | | | | | | |
Gross expenses | | | 0.86 | % | | | 0.86 | % | | | 0.87 | % | | | 0.87 | % | | | 0.85 | % | | | 0.87 | % |
Net expenses | | | 0.62 | % | | | 0.62 | % | | | 0.66 | % | | | 0.72 | % | | | 0.72 | % | | | 0.72 | % |
Net investment income | | | 3.28 | % | | | 2.74 | % | | | 2.97 | % | | | 2.84 | % | | | 1.82 | % | | | 2.24 | % |
Supplemental data | | | | | | | | | | | | | | | | | | | | | | | | |
Portfolio turnover rate | | | 52 | % | | | 148 | % | | | 199 | % | | | 288 | % | | | 322 | % | | | 267 | % |
Net assets, end of period (000s omitted) | | | $19,665 | | | | $32,241 | | | | $41,806 | | | | $71,133 | | | | $85,431 | | | | $101,653 | |
| 1 | Calculated based upon average shares outstanding |
| 2 | Returns for periods of less than one year are not annualized. |
The accompanying notes are an integral part of these financial statements.
| | | | | | |
| Financial highlights | | Wells Fargo Core Plus Bond Fund | | | 31 | |
(For a share outstanding throughout each period)
| | | | | | | | | | | | | | | | | | | | | | | | |
| | | Six months ended
February 28, 2019 (unaudited) | | | Year ended August 31 | |
| INSTITUTIONAL CLASS | | 2018 | | | 2017 | | | 2016 | | | 2015 | | | 2014 | |
Net asset value, beginning of period | | | $12.28 | | | | $12.72 | | | | $12.71 | | | | $12.15 | | | | $12.24 | | | | $11.67 | |
Net investment income | | | 0.21 | | | | 0.37 | 1 | | | 0.38 | | | | 0.36 | | | | 0.24 | 1 | | | 0.28 | |
Net realized and unrealized gains (losses) on investments | | | 0.09 | | | | (0.44 | ) | | | 0.01 | | | | 0.60 | | | | (0.07 | ) | | | 0.57 | |
| | | | | | | | | | | | | | | | | | | | | | | | |
Total from investment operations | | | 0.30 | | | | (0.07 | ) | | | 0.39 | | | | 0.96 | | | | 0.17 | | | | 0.85 | |
Distributions to shareholders from | | | | | | | | | | | | | | | | | | | | | | | | |
Net investment income | | | (0.19 | ) | | | (0.37 | ) | | | (0.37 | ) | | | (0.36 | ) | | | (0.24 | ) | | | (0.28 | ) |
Net realized gains | | | 0.00 | | | | 0.00 | | | | (0.01 | ) | | | (0.04 | ) | | | (0.02 | ) | | | 0.00 | |
| | | | | | | | | | | | | | | | | | | | | | | | |
Total distributions to shareholders | | | (0.19 | ) | | | (0.37 | ) | | | (0.38 | ) | | | (0.40 | ) | | | (0.26 | ) | | | (0.28 | ) |
Net asset value, end of period | | | $12.39 | | | | $12.28 | | | | $12.72 | | | | $12.71 | | | | $12.15 | | | | $12.24 | |
Total return2 | | | 2.46 | % | | | (0.52 | )% | | | 3.10 | % | | | 8.05 | % | | | 1.37 | % | | | 7.36 | % |
Ratios to average net assets (annualized) | | | | | | | | | | | | | | | | | | | | | | | | |
Gross expenses | | | 0.59 | % | | | 0.59 | % | | | 0.60 | % | | | 0.60 | % | | | 0.58 | % | | | 0.60 | % |
Net expenses | | | 0.40 | % | | | 0.40 | % | | | 0.44 | % | | | 0.58 | % | | | 0.58 | % | | | 0.58 | % |
Net investment income | | | 3.52 | % | | | 3.00 | % | | | 3.17 | % | | | 3.04 | % | | | 1.95 | % | | | 2.38 | % |
Supplemental data | | | | | | | | | | | | | | | | | | | | | | | | |
Portfolio turnover rate | | | 52 | % | | | 148 | % | | | 199 | % | | | 288 | % | | | 322 | % | | | 267 | % |
Net assets, end of period (000s omitted) | | | $278,126 | | | | $264,292 | | | | $163,387 | | | | $79,687 | | | | $54,419 | | | | $32,438 | |
| 1 | Calculated based upon average shares outstanding |
| 2 | Returns for periods of less than one year are not annualized. |
The accompanying notes are an integral part of these financial statements.
| | | | |
| 32 | | Wells Fargo Core Plus Bond Fund | | Notes to financial statements (unaudited) |
1. ORGANIZATION
Wells Fargo Funds Trust (the “Trust”), a Delaware statutory trust organized on March 10, 1999, is an open-end management investment company registered under the Investment Company Act of 1940, as amended (the “1940 Act”). As an investment company, the Trust follows the accounting and reporting guidance in Financial Accounting Standards Board (“FASB”) Accounting Standards Codification Topic 946, Financial Services – Investment Companies. These financial statements report on the Wells Fargo Core Plus Bond Fund (the “Fund”) which is a diversified series of the Trust.
2. SIGNIFICANT ACCOUNTING POLICIES
The following significant accounting policies, which are consistently followed in the preparation of the financial statements of the Fund, are in conformity with U.S. generally accepted accounting principles which require management to make estimates and assumptions that affect the reported amounts of assets and liabilities, disclosure of contingent assets and liabilities at the date of the financial statements, and the reported amounts of revenues and expenses during the reporting period. Actual results could differ from those estimates.
Securities valuation
All investments are valued each business day as of the close of regular trading on the New York Stock Exchange (generally 4 p.m. Eastern Time), although the Fund may deviate from this calculation time under unusual or unexpected circumstances.
Debt securities are valued at the evaluated bid price provided by an independent pricing service (e.g. taking into account various factors, including yields, maturities, or credit ratings) or, if a reliable price is not available, the quoted bid price from an independent broker-dealer.
Equity securities and futures contracts that are listed on a foreign or domestic exchange or market are valued at the official closing price or, if none, the last sales price. If no sale occurs on the principal exchange or market that day, a fair value price will be determined in accordance with the Fund’s Valuation Procedures.
Swap contracts are valued at the evaluated price provided by an independent pricing service or, if a reliable price is not available, the quoted bid price from an independent broker-dealer.
The values of securities denominated in foreign currencies are translated into U.S. dollars at rates provided by an independent foreign currency pricing source at a time each business day specified by the Wells Fargo Asset Management Pricing Committee at Wells Fargo Funds Management, LLC (“Funds Management”).
Investments in registered open-end investment companies are valued at net asset value. Interests in non-registered investment companies that are redeemable at net asset value are fair valued normally at net asset value.
Investments which are not valued using any of the methods discussed above are valued at their fair value, as determined in good faith by the Board of Trustees of the Fund. The Board of Trustees has established a Valuation Committee comprised of the Trustees and has delegated to it the authority to take any actions regarding the valuation of portfolio securities that the Valuation Committee deems necessary or appropriate, including determining the fair value of portfolio securities, unless the determination has been delegated to the Wells Fargo Asset Management Pricing Committee at Funds Management. The Board of Trustees retains the authority to make or ratify any valuation decisions or approve any changes to the Valuation Procedures as it deems appropriate. On a quarterly basis, the Board of Trustees receives reports on any valuation actions taken by the Valuation Committee or the Wells Fargo Asset Management Pricing Committee which may include items for ratification.
Foreign currency translation
The accounting records of the Fund are maintained in U.S. dollars. The values of other assets and liabilities denominated in foreign currencies are translated into U.S. dollars at rates provided by an independent foreign currency pricing source at a time each business day specified by the Wells Fargo Asset Management Pricing Committee. Purchases and sales of securities, and income and expenses are converted at the rate of exchange on the respective dates of such transactions. Net realized foreign exchange gains or losses arise from sales of foreign currencies, currency gains or losses realized between the trade and settlement dates on securities transactions, and the difference between the amounts of dividends, interest and foreign withholding taxes recorded and the U.S. dollar equivalent of the amounts actually paid or received. Net unrealized foreign exchange gains and losses arise from changes in the fair value of assets and liabilities other than investments in securities resulting from changes in exchange rates. The changes in net assets arising from changes in exchange rates of securities and the changes in net assets resulting from changes in market prices of securities are not separately presented. Such changes are included in net realized and unrealized gains or losses from investments.
| | | | | | |
| Notes to financial statements (unaudited) | | Wells Fargo Core Plus Bond Fund | | | 33 | |
Forward foreign currency contracts
The Fund is subject to foreign currency risk in the normal course of pursuing its investment objectives. A forward foreign currency contract is an agreement between two parties to purchase or sell a specific currency for an agreed-upon price at a future date. The Fund enters into forward foreign currency contracts to facilitate transactions in foreign-denominated securities and to attempt to minimize the risk to the Fund from adverse changes in the relationship between currencies. Forward foreign currency contracts are recorded at the forward rate and marked-to-market daily. When the contracts are closed, realized gains and losses arising from such transactions are recorded as realized gains or losses on forward foreign currency contracts. The Fund could be exposed to risks if the counterparties to the contracts are unable to meet the terms of their contracts or if the value of the foreign currency changes unfavorably. The Fund’s maximum risk of loss from counterparty credit risk is the unrealized gains on the contracts. This risk may be mitigated if there is a master netting arrangement between the Fund and the counterparty.
Securities lending
The Fund may lend its securities from time to time in order to earn additional income in the form of fees or interest on securities received as collateral or the investment of any cash received as collateral. The Fund continues to receive interest or dividends on the securities loaned. The Fund receives collateral in the form of cash or securities with a value at least equal to the value of the securities on loan. The value of the loaned securities is determined at the close of each business day and any additional required collateral is delivered to the Fund on the next business day. In a securities lending transaction, the net asset value of the Fund will be affected by an increase or decrease in the value of the securities loaned and by an increase or decrease in the value of the instrument in which collateral is invested. The amount of securities lending activity undertaken by the Fund fluctuates from time to time. In the event of default or bankruptcy by the borrower, the Fund may be prevented from recovering the loaned securities or gaining access to the collateral or may experience delays or costs in doing so. In addition, the investment of any cash collateral received may lose all or part of its value. The Fund has the right under the lending agreement to recover the securities from the borrower on demand.
The Fund lends its securities through an unaffiliated securities lending agent. Cash collateral received in connection with its securities lending transactions is invested in Securities Lending Cash Investments, LLC (the “Securities Lending Fund”). The Securities Lending Fund is exempt from registration under Section 3(c)(7) of the 1940 Act and is managed by Funds Management and is subadvised by Wells Capital Management Incorporated (“WellsCap”), an affiliate of Funds Management and an indirect wholly owned subsidiary of Wells Fargo & Company (“Wells Fargo”). Funds Management receives an advisory fee starting at 0.05% and declining to 0.01% as the average daily net assets of the Securities Lending Fund increase. All of the fees received by Funds Management are paid to WellsCap for its services as subadviser. The Securities Lending Fund seeks to provide a positive return compared to the daily Fed Funds Open Rate by investing in high-quality, U.S. dollar-denominated short-term money market instruments. Securities Lending Fund investments are valued at the evaluated bid price provided by an independent pricing service. Income earned from investment in the Securities Lending Fund (net of fees and rebates), if any, is included in income from affiliated securities on the Statement of Operations.
When-issued transactions
The Fund may purchase securities on a forward commitment or when-issued basis. The Fund records a when-issued transaction on the trade date and will segregate assets in an amount at least equal in value to the Fund’s commitment to purchase when-issued securities. Securities purchased on a when-issued basis are marked-to-market daily and the Fund begins earning interest on the settlement date. Losses may arise due to changes in the market value of the underlying securities or if the counterparty does not perform under the contract.
Loans
The Fund may invest in direct debt instruments which are interests in amounts owed to lenders by corporate or other borrowers. The loans pay interest at rates which are periodically reset by reference to a base lending rate plus a spread. Investments in loans may be in the form of participations in loans or assignments of all or a portion of loans from third parties. When the Fund purchases participations, it generally has no rights to enforce compliance with terms of the loan agreement with the borrower. As a result, the Fund assumes the credit risk of both the borrower and the lender that is selling the participation. When the Fund purchases assignments from lenders, it acquires direct rights against the borrower on the loan and may enforce compliance by the borrower with the terms of the loan agreement. Loans may include fully funded term loans or unfunded loan commitments, which are contractual obligations for future funding.
Futures contracts
The Fund is subject to interest rate risk and foreign currency risk in the normal course of pursuing its investment objectives. Futures contracts are agreements between the Fund and a counterparty to buy or sell a specific amount of a commodity, financial instrument or currency at specified price and on a specified date. The Fund may buy and sell futures
| | | | |
| 34 | | Wells Fargo Core Plus Bond Fund | | Notes to financial statements (unaudited) |
contracts in order to gain exposure to, or protect against, changes in interest rates and foreign exchange rates. The primary risks associated with the use of futures contracts are the imperfect correlation between changes in market values of securities held by the Fund and the prices of futures contracts, and the possibility of an illiquid market. Futures contracts are generally entered into on a regulated futures exchange and cleared through a clearinghouse associated with the exchange. With futures contracts, there is minimal counterparty risk to the Fund since futures contracts are exchange traded and the exchange’s clearinghouse, as counterparty to all exchange traded futures, guarantees the futures contracts against default.
Upon entering into a futures contracts, the Fund is required to deposit either cash or securities (initial margin) with the broker in an amount equal to a certain percentage of the contract value. Subsequent payments (variation margin) are paid to or from the broker each day equal to the daily changes in the contract value. Such payments are recorded as unrealized gains or losses and, if any, shown as variation margin receivable (payable) in the Statement of Assets and Liabilities. Should the Fund fail to make requested variation margin payments, the broker can gain access to the initial margin to satisfy the Fund’s payment obligations. When the contracts are closed, a realized gain or loss is recorded in the Statement of Operations.
Swap contracts
Swap contracts are agreements between the Fund and a counterparty to exchange a series of cash flows over a specified period. Swap agreements are privately negotiated contracts between the Fund and a counterparty in the OTC market and may be entered into as a bilateral contract (“OTC swaps”) or centrally cleared (“centrally cleared swaps”) with a central clearinghouse.
For OTC swaps, any upfront premiums paid and any upfront fees received are shown as swap premiums paid and swap premiums received, respectively, in the Statement of Assets and Liabilities and amortized over the term of the contract. The daily fluctuations in market value are recorded as unrealized gains or losses on OTC swaps in the Statement of Assets and Liabilities. Payments received or paid are recorded in the Statement of Operations as realized gains or losses, respectively. When an OTC swap is terminated, a realized gain or loss is recorded in the Statement of Operations equal to the difference between the proceeds from (or cost of) the closing transaction and the Fund’s basis in the contract, if any. Generally, the basis of the contract is the premium received or paid.
In a centrally cleared swap, immediately following execution of the swap contract, the swap contract is novated to a central counterparty (the “CCP”) and the Fund’s counterparty on the swap agreement becomes the CCP. Upon entering into a centrally cleared swap, the Fund is required to deposit an initial margin with the broker in the form of cash or securities. Securities deposited as initial margin are designated in the Portfolio of Investments and cash deposited is shown as cash segregated for centrally cleared swaps in the Statement of Assets and Liabilities. Pursuant to the contract, the Fund agrees to receive from or pay to the broker an amount of cash equal to the daily fluctuation in market value of the contract (“variation margin”). The variation margin is recorded as an unrealized gain (or loss) and shown as variation margin receivable (or payable) on centrally cleared swaps in the Statement of Assets and Liabilities. Payments received from (paid to) the counterparty, including at termination, are recorded as realized gains (losses) in the Statement of Operations.
Credit default swaps
The Fund is subject to credit risk in the normal course of pursuing its investment objectives. The Fund may enter into credit default swaps for hedging or speculative purposes to provide or receive a measure of protection against default on a referenced entity, obligation or index or a basket of single-name issuers or traded indexes. An index credit default swap references all the names in the index, and if a credit event is triggered, the credit event is settled based on that name’s weight in the index. Credit default swaps are agreements in which the protection buyer pays fixed periodic payments to the protection seller in consideration for a promise from the protection seller to make a specific payment should a negative credit event take place with respect to the referenced entity (e.g., bankruptcy, failure to pay, obligation acceleration, repudiation, moratorium or restructuring).
The Fund may enter into credit default swaps as either the seller of protection or the buyer of protection. If the Fund is the buyer of protection and a credit event occurs, the Fund will either receive from the seller an amount equal to the notional amount of the swap and deliver the referenced security or underlying securities comprising the index, or receive a net settlement of cash equal to the notional amount of the swap less the recovery value of the security or underlying securities comprising the index. If the Fund is the seller of protection and a credit event occurs, the Fund will either pay the buyer an amount equal to the notional amount of the swap and take delivery of the referenced security or underlying securities comprising the index or pay a net settlement of cash equal to the notional amount of the swap less the recovery value of the security or underlying securities comprising the index.
| | | | | | |
| Notes to financial statements (unaudited) | | Wells Fargo Core Plus Bond Fund | | | 35 | |
As the seller of protection, the Fund is subject to investment exposure on the notional amount of the swap and has assumed the risk of default of the underlying security or index. As the buyer of protection, the Fund could be exposed to risks if the seller of the protection defaults on its obligation to perform, or if there are unfavorable changes in the fluctuation of interest rates.
Certain credit default swap contracts entered into by the Fund provide for conditions that result in events of default or termination that enable the counterparty to the agreement to cause an early termination of the transactions under those agreements.
Security transactions and income recognition
Securities transactions are recorded on a trade date basis. Realized gains or losses are recorded on the basis of identified cost.
Interest income is accrued daily and bond discounts are accreted and premiums are amortized daily. To the extent debt obligations are placed on non-accrual status, any related interest income may be reduced by writing off interest receivables when the collection of all or a portion of interest has been determined to be doubtful based on consistently applied procedures and the fair value has decreased. If the issuer subsequently resumes interest payments or when the collectability of interest is reasonably assured, the debt obligation is removed from non-accrual status.
Income dividends and capital gain distributions from investment companies are recorded on the ex-dividend date. Capital gain distributions from investment companies are treated as realized gains.
Income from foreign securities is recorded net of foreign taxes withheld where recovery of such taxes is not assured.
Distributions to shareholders
Distributions to shareholders are recorded on the ex-dividend date and paid from net investment income monthly and any net realized gains are paid at least annually. Such distributions are determined in accordance with income tax regulations and may differ from U.S. generally accepted accounting principles. Dividend sources are estimated at the time of declaration. The tax character of distributions is determined as of the Fund’s fiscal year end. Therefore, a portion of the Fund’s distributions made prior to the Fund’s fiscal year end may be categorized as a tax return of capital at year end.
Federal and other taxes
The Fund intends to continue to qualify as a regulated investment company by distributing substantially all of its investment company taxable income and any net realized capital gains (after reduction for capital loss carryforwards) sufficient to relieve it from all, or substantially all, federal income taxes. Accordingly, no provision for federal income taxes was required.
The Fund’s income and federal excise tax returns and all financial records supporting those returns for the prior three fiscal years are subject to examination by the federal and Delaware revenue authorities. Management has analyzed the Fund’s tax positions taken on federal, state, and foreign tax returns for all open tax years and does not believe that there are any uncertain tax positions that require recognition of a tax liability.
As of February 28, 2019, the aggregate cost of all investments for federal income tax purposes was $604,220,631 and the unrealized gains (losses) consisted of:
| | | | |
| |
Gross unrealized gains | | $ | 9,279,403 | |
| |
Gross unrealized losses | | | (7,784,428 | ) |
| |
Net unrealized gains | | $ | 1,494,975 | |
As of August 31, 2018, the Fund had capital loss carryforwards which consisted of $2,883,692 in short-term capital losses and $57,244 in long-term capital losses.
Class allocations
The separate classes of shares offered by the Fund differ principally in applicable sales charges, distribution, shareholder servicing, and administration fees. Class specific expenses are charged directly to that share class. Investment income, common expenses, and realized and unrealized gains (losses) on investments are allocated daily to each class of shares based on the relative proportion of net assets of each class.
3. FAIR VALUATION MEASUREMENTS
Fair value measurements of investments are determined within a framework that has established a fair value hierarchy based upon the various data inputs utilized in determining the value of the Fund’s investments. The three-level hierarchy gives the highest priority to unadjusted quoted prices in active markets for identical assets or liabilities (Level 1) and the lowest priority
| | | | |
| 36 | | Wells Fargo Core Plus Bond Fund | | Notes to financial statements (unaudited) |
to unobservable inputs (Level 3). The Fund’s investments are classified within the fair value hierarchy based on the lowest level of input that is significant to the fair value measurement. The inputs are summarized into three broad levels as follows:
| ∎ | | Level 1 – quoted prices in active markets for identical securities |
| ∎ | | Level 2 – other significant observable inputs (including quoted prices for similar securities, interest rates, prepayment speeds, credit risk, etc.) |
| ∎ | | Level 3 – significant unobservable inputs (including the Fund’s own assumptions in determining the fair value of investments) |
The inputs or methodologies used for valuing investments in securities are not necessarily an indication of the risk associated with investing in those securities.
The following is a summary of the inputs used in valuing the Fund’s assets and liabilities as of February 28, 2019:
| | | | | | | | | | | | | | | | |
| | | | |
| | | Quoted prices
(Level 1) | | | Other significant
observable inputs
(Level 2) | | | Significant
unobservable inputs (Level 3) | | | Total | |
| | | | |
Assets | | | | | | | | | | | | | | | | |
Investments in: | | | | | | | | | | | | | | | | |
| | | | |
Agency securities | | $ | 0 | | | $ | 148,283,761 | | | $ | 0 | | | $ | 148,283,761 | |
| | | | |
Asset-backed securities | | | 0 | | | | 30,986,916 | | | | 0 | | | | 30,986,916 | |
| | | | |
Corporate bonds and notes | | | 0 | | | | 101,101,234 | | | | 0 | | | | 101,101,234 | |
| | | | |
Exchange-traded funds | | | 13,630,920 | | | | 0 | | | | 0 | | | | 13,630,920 | |
| | | | |
Foreign corporate bonds and notes | | | 0 | | | | 20,620,315 | | | | 0 | | | | 20,620,315 | |
| | | | |
Foreign government bonds | | | 0 | | | | 6,521,048 | | | | 0 | | | | 6,521,048 | |
| | | | |
Loans | | | 0 | | | | 6,754,067 | | | | 876,154 | | | | 7,630,221 | |
| | | | |
Municipal obligations | | | 0 | | | | 20,754,286 | | | | 0 | | | | 20,754,286 | |
| | | | |
Non-agency mortgage-backed securities | | | 0 | | | | 52,071,500 | | | | 622,321 | | | | 52,693,821 | |
| | | | |
U.S. Treasury securities | | | 51,689,534 | | | | 11,703,551 | | | | 0 | | | | 63,393,085 | |
| | | | |
Yankee corporate bonds and notes | | | 0 | | | | 59,846,750 | | | | 0 | | | | 59,846,750 | |
| | | | |
Yankee government bonds | | | 0 | | | | 22,174,710 | | | | 0 | | | | 22,174,710 | |
| | | | |
Short-term investments | | | | | | | | | | | | | | | | |
| | | | |
Investment companies | | | 52,397,075 | | | | 3,512,267 | | | | 0 | | | | 55,909,342 | |
| | | | |
U.S. Treasury securities | | | 2,078,071 | | | | 0 | | | | 0 | | | | 2,078,071 | |
| | | 119,795,600 | | | | 484,330,405 | | | | 1,498,475 | | | | 605,624,480 | |
| | | | |
Futures contracts | | | 121,737 | | | | 0 | | | | 0 | | | | 121,737 | |
| | | | |
Forward foreign currency contracts | | | 0 | | | | 111,415 | | | | 0 | | | | 111,415 | |
| | | | |
Credit default swap contracts | | | 0 | | | | 243,370 | | | | 0 | | | | 243,370 | |
| | | | |
Total assets | | $ | 119,917,337 | | | $ | 484,685,190 | | | $ | 1,498,475 | | | $ | 606,101,002 | |
| | | | |
Liabilities | | | | | | | | | | | | | | | | |
| | | | |
Futures contracts | | $ | 326,819 | | | $ | 0 | | | $ | 0 | | | $ | 326,819 | |
| | | | |
Forward foreign currency contracts | | | 0 | | | | 58,577 | | | | 0 | | | | 58,577 | |
| | | | |
Total liabilities | | $ | 326,819 | | | $ | 58,577 | | | $ | 0 | | | $ | 385,396 | |
Additional sector, industry or geographic detail is included in the Portfolio of Investments.
Futures contracts, forward foreign currency contracts and swap contracts are reported at their cumulative unrealized gains (losses) at measurement date as reported in the tables following the Portfolio of Investments. For futures contracts and centrally cleared swaps, the current day’s variation margin is reported on the Statement of Assets and Liabilities. All other assets and liabilities are reported at their market value at measurement date.
At February 28, 2019, the Fund did not have any transfers into/out of Level 3.
| | | | | | |
| Notes to financial statements (unaudited) | | Wells Fargo Core Plus Bond Fund | | | 37 | |
4. TRANSACTIONS WITH AFFILIATES
Management fee
Funds Management, an indirect wholly owned subsidiary of Wells Fargo, is the manager of the Fund and provides advisory and fund-level administrative services under an investment management agreement. Under the investment management agreement, Funds Management is responsible for, among other services, implementing the investment objectives and strategies of the Fund, supervising the subadviser and providing fund-level administrative services in connection with the Fund’s operations. As compensation for its services under the investment management agreement, Funds Management is entitled to receive a management fee at the following annual rate based on the Fund’s average daily net assets:
| | | | |
| Average daily net assets | | Annual fee rate | |
| |
First $500 million | | | 0.450 | % |
| |
Next $500 million | | | 0.425 | |
| |
Next $2 billion | | | 0.400 | |
| |
Next $2 billion | | | 0.375 | |
| |
Next $5 billion | | | 0.340 | |
| |
Over $10 billion | | | 0.320 | |
For the six months ended February 28, 2019, the management fee was equivalent to an annual rate of 0.44% of the Fund’s average daily net assets.
Funds Management has retained the services of a subadviser to provide daily portfolio management to the Fund. The fee for subadvisory services is borne by Funds Management. WellsCap is the subadviser to the Fund and is entitled to receive a fee from Funds Management at an annual rate starting at 0.20% and declining to 0.10% as the average daily net assets of the Fund increase.
Administration fees
Under a class-level administration agreement, Funds Management provides class-level administrative services to the Fund, which includes paying fees and expenses for services provided by the transfer agent, sub-transfer agents, omnibus account servicers and record-keepers. As compensation for its services under the class-level administration agreement, Funds Management receives an annual fee which is calculated based on the average daily net assets of each class as follows:
| | | | |
| | | Class-level
administration fee | |
| |
Class A, Class C | | | 0.16 | % |
| |
Class R6 | | | 0.03 | |
| |
Administrator Class | | | 0.10 | |
| |
Institutional Class | | | 0.08 | |
Funds Management has contractually waived and/or reimbursed management and administration fees to the extent necessary to maintain certain net operating expense ratios for the Fund. When each class of the Fund has exceeded its expense cap, Funds Management has waived fees and/or reimbursed expenses from fund level expenses on a proportionate basis and then from class specific expenses. When only certain classes exceed their expense caps, waivers and/or reimbursements are applied against class specific expenses before fund level expenses. Funds Management has committed through December 31, 2019 to waive fees and/or reimburse expenses to the extent necessary to cap the Fund’s expenses at 0.73% for Class A shares, 1.48% for Class C shares, 0.35% for Class R6 shares, 0.62% for Administrator Class shares, and 0.40% for Institutional Class shares. Prior to or after the commitment expiration date, the cap may be increased or the commitment to maintain the cap may be terminated only with the approval of the Board of Trustees.
Distribution fee
The Trust has adopted a distribution plan for Class C shares of the Fund pursuant to Rule 12b-1 under the 1940 Act. A distribution fee is charged to Class C shares and paid to Wells Fargo Funds Distributor, LLC (“Funds Distributor”), the principal underwriter, at an annual rate of 0.75% of the average daily net assets of Class C shares.
| | | | |
| 38 | | Wells Fargo Core Plus Bond Fund | | Notes to financial statements (unaudited) |
In addition, Funds Distributor is entitled to receive the front-end sales charge from the purchase of Class A shares and a contingent deferred sales charge on the redemption of certain Class A shares. Funds Distributor is also entitled to receive the contingent deferred sales charges from redemptions of Class C shares. For the six months ended February 28, 2019, Funds Distributor received $3,276 from the sale of Class A shares. No contingent deferred sales charges were incurred by Class A and Class C shares for the six months ended February 28, 2019.
Shareholder servicing fees
The Trust has entered into contracts with one or more shareholder servicing agents, whereby Class A, Class C, and Administrator Class of the Fund are charged a fee at an annual rate of 0.25% of the average daily net assets of each respective class. A portion of these total shareholder servicing fees were paid to affiliates of Wells Fargo.
Interfund transactions
The Fund may purchase or sell portfolio investment securities to certain other Wells Fargo affiliates pursuant to Rule 17a-7 under the 1940 Act and under procedures adopted by the Board of Trustees. The procedures have been designed to ensure that these interfund transactions, which do not incur broker commissions, are effected at current market prices.
5. INVESTMENT PORTFOLIO TRANSACTIONS
Purchases and sales of investments, excluding short-term securities, for the six months ended February 28, 2019 were as follows:
| | | | | | |
Purchases at cost | | Sales proceeds |
U.S.
government | | Non-U.S.
government | | U.S.
government | | Non-U.S.
government |
| $177,334,088 | | $106,919,490 | | $179,382,557 | | $109,778,448 |
6. DERIVATIVE TRANSACTIONS
During the six months ended February 28, 2019, the Fund entered into futures contracts to speculate on interest rates and to help manage the duration of the portfolio and entered into forward foreign currency contracts for economic hedging purposes. The Fund entered into credit default swap contracts to hedge risks and/or enhance total returns.
The volume of the Fund’s derivative activity during the six months ended February 28, 2019 was as follows:
| | | | |
| |
Futures contracts | | | | |
| |
Average notional balance on long futures | | $ | 106,848,764 | |
| |
Average notional balance on short futures | | | 27,703,751 | |
| |
Forward foreign currency contracts | | | | |
| |
Average contract amounts to buy | | | 10,839,762 | |
| |
Average contract amounts to sell | | | 43,264,806 | |
| |
Credit default swap contracts | | | | |
| |
Average notional balance | | | 13,382,759 | |
The Fund’s credit default swaps may contain provisions for early termination in the event the net assets of the Fund declines below specific levels identified by the counterparty. If these levels are triggered, the counterparty may terminate the transaction and seek payment or request full collateralization of the derivative transactions in net liability positions.
| | | | | | |
| Notes to financial statements (unaudited) | | Wells Fargo Core Plus Bond Fund | | | 39 | |
A summary of the location of derivative instruments on the financial statements by primary risk exposure is outlined following tables.
The fair value of derivative instruments as of February 28, 2019 was as follows for the Fund:
| | | | | | | | | | | | |
| | | Asset derivatives | | | Liability derivatives | |
| | | Statement of Assets and
Liabilities location | | Fair value | | | Statement of Assets and
Liabilities location | | Fair value | |
| | | | |
Interest rate risk | | Unrealized gains on futures contracts | | $ | 13,285 | * | | Unrealized losses on futures contracts | | $ | 71,686 | * |
| | | | |
Foreign currency risk | | Unrealized gains on futures contracts | | | 108,452 | * | | Unrealized losses on futures contracts | | | 255,133 | * |
| | | | |
Foreign currency risk | | Unrealized gains on forward foreign currency contracts | | | 111,415 | | | Unrealized losses on forward foreign currency contracts | | | 58,577 | |
| | | | |
Credit risk | | Unrealized gains on swap contracts | | | 243,370 | * | | Unrealized losses on swap contracts | | | 0 | * |
| | | | |
| | | | | $ | 476,522 | | | | | $ | 385,396 | |
| * | Amount represents cumulative unrealized gains (losses) as reported in the tables following the Portfolio of Investments. Only the current day’s variation margin as of February 28, 2019 is reported separately on the Statement of Assets and Liabilities. |
The effect of derivative instruments on the Statement of Operations for the six months ended February 28, 2019 was as follows for the Fund:
| | | | | | | | | | | | | | | | |
| | | Amount of realized gains (losses) on derivatives | |
| | | Futures
contracts | | | Forward
foreign
currency
contracts | | | Swap
contracts | | | Total | |
| | | | |
Interest rate risk | | $ | 1,138,116 | | | $ | 0 | | | $ | 0 | | | $ | 1,138,116 | |
| | | | |
Foreign currency risk | | | (118,513 | ) | | | 1,288,411 | | | | 0 | | | | 1,169,898 | |
| | | | |
Credit risk | | | 0 | | | | 0 | | | | 163,574 | | | | 163,574 | |
| | | | |
| | | $ | 1,019,603 | | | $ | 1,288,411 | | | $ | 163,574 | | | $ | 2,471,588 | |
| |
| | | Change in unrealized gains (losses) on derivatives | |
| | | Futures
contracts | | | Forward
foreign
currency
contracts | | | Swap
contracts | | | Total | |
| | | | |
Interest rate risk | | $ | (8,624 | ) | | $ | 0 | | | $ | 0 | | | $ | (8,624 | ) |
| | | | |
Foreign currency risk | | | (98,567 | ) | | | (31,997 | ) | | | 0 | | | | (130,564 | ) |
| | | | |
Credit risk | | | 0 | | | | 0 | | | | 275,606 | | | | 275,606 | |
| | | | |
| | | $ | (107,191 | ) | | $ | (31,997 | ) | | $ | 275,606 | | | $ | 136,418 | |
For certain types of derivative transactions, the Fund has entered into International Swaps and Derivatives Association, Inc. master agreements (“ISDA Master Agreements”) or similar agreements with approved counterparties. The ISDA Master Agreements or similar agreements may have requirements to deliver/deposit securities or cash to/with an exchange or broker-dealer as collateral and allows the Fund to offset, with each counterparty, certain derivative financial instrument’s assets and/or liabilities with collateral held or pledged. Collateral requirements differ by type of derivative. Collateral or margin requirements are set by the broker or exchange clearinghouse for exchange traded derivatives while collateral terms are contract specific for over-the-counter traded derivatives. Cash collateral that has been pledged to cover obligations of the Fund under ISDA Master Agreements or similar agreements, if any, are reported separately in the Statement of Assets and Liabilities. Securities pledged as collateral, if any, are noted in the Portfolio of Investments. With respect to balance sheet offsetting, absent an event of default by the counterparty or a termination of the agreement, the reported amounts of financial assets and financial liabilities in the Statement of Assets and Liabilities are not offset across
| | | | |
| 40 | | Wells Fargo Core Plus Bond Fund | | Notes to financial statements (unaudited) |
transactions between the Fund and the applicable counterparty. A reconciliation of the gross amounts on the Statement of Assets and Liabilities to the net amounts by counterparty, including any collateral exposure, is as follows:
| | | | | | | | | | | | | | | | |
| | | | |
| Counterparty | | Gross amounts
of assets in the
Statement of
Assets and
Liabilities | | | Amounts
subject to
netting
agreements | | | Collateral
received | | | Net amount
of assets | |
| | | | |
Citibank | | $ | 111,415 | | | $ | (58,577 | ) | | $ | 0 | | | $ | 52,838 | |
| | | | | | | | | | | | | | | | |
| | | | |
| Counterparty | | Gross amounts
of liabilities in the
Statement of
Assets and
Liabilities | | | Amounts
subject to
netting
agreements | | | Collateral
pledged | | | Net amount
of liabilities | |
| | | | |
Citibank | | $ | 58,577 | | | $ | (58,577 | ) | | $ | 0 | | | $ | 0 | |
7. BANK BORROWINGS
The Trust (excluding the money market funds), Wells Fargo Master Trust and Wells Fargo Variable Trust are parties to a $280,000,000 revolving credit agreement whereby the Fund is permitted to use bank borrowings for temporary or emergency purposes, such as to fund shareholder redemption requests. Interest under the credit agreement is charged to the Fund based on a borrowing rate equal to the higher of the Federal Funds rate in effect on that day plus 1.25% or the overnight LIBOR rate in effect on that day plus 1.25%. In addition, an annual commitment fee equal to 0.25% of the unused balance is allocated to each participating fund.
For the six months ended February 28, 2019, there were no borrowings by the Fund under the agreement.
8. DISTRIBUTIONS TO SHAREHOLDERS
Effective for all filings after November 4, 2018, the Securities and Exchange Commission eliminated the requirement to separately state the components of distributions to shareholders under U.S. generally accepted accounting principles. The amounts of distributions to shareholders for the year ended August 31, 2018 were as follows:
| | | | |
| | | Net investment
income | |
| |
Class A | | | $6,592,901 | |
| |
Class C | | | 396,945 | |
| |
Class R6 | | | 1,205,963 | |
| |
Administrator Class | | | 1,057,877 | |
| |
Institutional Class | | | 7,080,934 | |
9. INDEMNIFICATION
Under the Trust’s organizational documents, the officers and Trustees have been granted certain indemnification rights against certain liabilities that may arise out of performance of their duties to the Trust. Additionally, in the normal course of business, the Trust may enter into contracts with service providers that contain a variety of indemnification clauses. The Trust’s maximum exposure under these arrangements is dependent on future claims that may be made against the Fund and, therefore, cannot be estimated.
10. NEW ACCOUNTING PRONOUNCEMENTS
In August 2018, FASB issued Accounting Standards Update (“ASU”) No. 2018-13, Fair Value Measurement (Topic 820) Disclosure Framework—Changes to the Disclosure Requirements for Fair Value Measurement. ASU 2018-13 updates the disclosure requirements for fair value measurements by modifying or removing certain disclosures and adding certain new disclosures. The amendments are effective for fiscal years, and interim periods within those fiscal years, beginning after December 15, 2019. Early adoption is permitted. Management has adopted the removal and modification of disclosures early, as permitted, and will adopt the additional new disclosures at the effective date.
| | | | | | |
| Notes to financial statements (unaudited) | | Wells Fargo Core Plus Bond Fund | | | 41 | |
In March 2017, FASB issued ASU No. 2017-08,Premium Amortization on Purchased Callable Debt Securities. ASU 2017-08 shortens the amortization period for certain callable debt securities held at a premium. The amendments require the premium to be amortized to the earliest call date. The amendments do not require an accounting change for securities held at a discount; the discount continues to be amortized to maturity. ASU 2017-08 is effective for fiscal years beginning after December 15, 2018 and for interim periods within those fiscal years. Management is currently evaluating the potential impact of this new guidance to the financial statements.
| | | | |
| 42 | | Wells Fargo Core Plus Bond Fund | | Other information (unaudited) |
PROXY VOTING INFORMATION
A description of the policies and procedures used to determine how to vote proxies relating to portfolio securities is available, upon request, by calling1-800-222-8222, visiting our website at wfam.com, or visiting the SEC website at sec.gov. Information regarding how the Fund voted proxies relating to portfolio securities during the most recent12-month period ended June 30 is available on the Fund’s website atwfam.comor by visiting the SEC website at sec.gov.
PORTFOLIO HOLDINGS INFORMATION
The complete portfolio holdings for the Fund are publicly available monthly on the Fund’s website (wfam.com), on a one-month delayed basis. In addition, top ten holdings information (excluding derivative positions) for the Fund is publicly available on the Fund’s website on a monthly, seven-day or more delayed basis. The Fund files its complete schedule of portfolio holdings with the SEC for the first and third quarters of each fiscal year on Form N-Q, which is available by visiting the SEC website at sec.gov. In addition, the Fund’s Form N-Q may be reviewed and copied at the SEC’s Public Reference Room in Washington, DC, and at regional offices in New York City, at 233 Broadway, and in Chicago, at 175 West Jackson Boulevard, Suite 900. Information about the Public Reference Room may be obtained by calling 1-800-SEC-0330.
| | | | | | |
| Other information (unaudited) | | Wells Fargo Core Plus Bond Fund | | | 43 | |
BOARD OF TRUSTEES AND OFFICERS
Each of the Trustees and Officers1 listed in the table below acts in identical capacities for each fund in the Wells Fargo family of funds, which consists of 152 mutual funds comprising the Wells Fargo Funds Trust, Wells Fargo Variable Trust, Wells Fargo Master Trust and four closed-end funds (collectively the “Fund Complex”). This table should be read in conjunction with the Prospectus and the Statement of Additional Information2. The mailing address of each Trustee and Officer is 525 Market Street, 12th Floor, San Francisco, CA 94105. Each Trustee and Officer serves an indefinite term, however, each Trustee serves such term until reaching the mandatory retirement age established by the Trustees.
Independent Trustees
| | | | | | |
Name and year of birth | | Position held and length of service* | | Principal occupations during past five years or longer | | Current other public company or
investment company
directorships |
| | | |
William R. Ebsworth (Born 1957) | | Trustee, since 2015 | | Retired. From 1984 to 2013, equities analyst, portfolio manager, research director and chief investment officer at Fidelity Management and Research Company in Boston, Tokyo, and Hong Kong, and retired in 2013 as Chief Investment Officer of Fidelity Strategic Advisers, Inc. where he led a team of investment professionals managing client assets. Prior thereto, Board member of Hong Kong Securities Clearing Co., Hong Kong Options Clearing Corp., the Thailand International Fund, Ltd., Fidelity Investments Life Insurance Company, and Empire Fidelity Investments Life Insurance Company. Board member of the Vincent Memorial Hospital Endowment (non-profit organization), where he serves on the Investment Committee and as a Chair of the Audit Committee. Mr. Ebsworth is a CFA® charterholder. | | N/A |
| | | |
Jane A. Freeman (Born 1953) | | Trustee, since 2015; Chair Liaison, since 2018 | | Retired. From 2012 to 2014 and 1999 to 2008, Chief Financial Officer of Scientific Learning Corporation. From 2008 to 2012, Ms. Freeman provided consulting services related to strategic business projects. Prior to 1999, Portfolio Manager at Rockefeller & Co. and Scudder, Stevens & Clark. Board member of the Harding Loevner Funds from 1996 to 2014, serving as both Lead Independent Director and chair of the Audit Committee. Board member of the Russell Exchange Traded Funds Trust from 2011 to 2012 and the chair of the Audit Committee. Ms. Freeman is a Board Member of The Ruth Bancroft Garden (non-profit organization). She is also an inactive Chartered Financial Analyst. | | N/A |
| | | |
Isaiah Harris, Jr.3 (Born 1952) | | Trustee, since 2009; Audit Committee Chairman, since 2019 | | Retired. Chairman of the Board of CIGNA Corporation since 2009, and Director since 2005. From 2003 to 2011, Director of Deluxe Corporation. Prior thereto, President and CEO of BellSouth Advertising and Publishing Corp. from 2005 to 2007, President and CEO of BellSouth Enterprises from 2004 to 2005 and President of BellSouth Consumer Services from 2000 to 2003. Emeritus member of the Iowa State University Foundation Board of Governors. Emeritus Member of the Advisory Board of Iowa State University School of Business. Advisory Board Member, Palm Harbor Academy (private school). Advisory Board Member, Child Evangelism Fellowship (non-profit). Mr. Harris is a certified public accountant (inactive status). | | CIGNA Corporation |
| | | |
Judith M. Johnson3 (Born 1949) | | Trustee, since 2008; Audit Committee Chairman, from 2009 to 2018 | | Retired. Prior thereto, Chief Executive Officer and Chief Investment Officer of Minneapolis Employees Retirement Fund from 1996 to 2008. Ms. Johnson is an attorney, certified public accountant and a certified managerial accountant. | | N/A |
| | | |
David F. Larcker (Born 1950) | | Trustee, since 2009 | | James Irvin Miller Professor of Accounting at the Graduate School of Business, Stanford University, Director of the Corporate Governance Research Initiative and Senior Faculty of The Rock Center for Corporate Governance since 2006. From 2005 to 2008, Professor of Accounting at the Graduate School of Business, Stanford University. Prior thereto, Ernst & Young Professor of Accounting at The Wharton School, University of Pennsylvania from 1985 to 2005. | | N/A |
| | | | |
| 44 | | Wells Fargo Core Plus Bond Fund | | Other information (unaudited) |
| | | | | | |
Name and year of birth | | Position held and length of service* | | Principal occupations during past five years or longer | | Current other public company or
investment company
directorships |
| | | |
Olivia S. Mitchell (Born 1953) | | Trustee, since 2006; Nominating and Governance Committee Chairman, since 2018 | | International Foundation of Employee Benefit Plans Professor, Wharton School of the University of Pennsylvania since 1993. Director of Wharton’s Pension Research Council and Boettner Center on Pensions & Retirement Research, and Research Associate at the National Bureau of Economic Research. Previously, Cornell University Professor from 1978 to 1993. | | N/A |
| | | |
Timothy J. Penny (Born 1951) | | Trustee, since 1996; Chairman, since 2018 | | President and Chief Executive Officer of Southern Minnesota Initiative Foundation, a non-profit organization, since 2007. Member of the Board of Trustees of NorthStar Education Finance, Inc., a non-profit organization, since 2007. | | N/A |
| | | |
James G. Polisson (Born 1959) | | Trustee, since 2018 | | Retired. Chief Marketing Officer, Source (ETF) UK Services, Ltd, from 2015 to 2017. From 2012 to 2015, Principal of The Polisson Group, LLC, a management consulting, corporate advisory and principal investing company. Chief Executive Officer and Managing Director at Russell Investments, Global Exchange Traded Funds from 2010 to 2012. Managing Director of Barclays Global Investors from 1998 to 2010 and Global Chief Marketing Officer for iShares and Barclays Global Investors from 2000 to 2010. Trustee of the San Francisco Mechanics’ Institute, a non-profit organization, from 2013 to 2015. Board member of the Russell Exchange Traded Fund Trust from 2011 to 2012. Director of Barclays Global Investors Holdings Deutschland GmbH from 2006 to 2009. Mr. Polisson is an attorney and has a retired status with the Massachusetts and District of Columbia Bar Associations. | | N/A |
| | | |
Pamela Wheelock (Born 1959) | | Trustee, since 2018 | | Chief Operating Officer, Twin Cities Habitat for Humanity, since January, 2017. Vice President of University Services, University of Minnesota from 2012 to 2017. Prior thereto, on the Board of Directors, Governance Committee and Finance Committee for the Minnesota Philanthropy Partners (Saint Paul Foundation) from 2012 to 2018, Interim President and Chief Executive Officer of Blue Cross Blue Shield of Minnesota from 2010 to 2011, Chairman of the Board from 2009 to 2011 and Board Director from 2003 to 2015. Vice President, Leadership and Community Engagement, Bush Foundation, Saint Paul, Minnesota (a private foundation) from 2009 to 2011. Executive Vice President and Chief Financial Officer, Minnesota Sports and Entertainment from 2004 to 2009 and Senior Vice President from 2002 to 2004. Commissioner of Finance, State of Minnesota, from 1999 to 2002. Currently the Board Chair of the Minnesota Wild Foundation since 2010. | | N/A |
| * | Length of service dates reflect the Trustee’s commencement of service with the Trust’s predecessor entities, where applicable. |
| | | | | | |
| Other information (unaudited) | | Wells Fargo Core Plus Bond Fund | | | 45 | |
Officers
| | | | | | |
Name and year of birth | | Position held and length of service | | Principal occupations during past five years or longer | | |
| | | |
Andrew Owen (Born 1960) | | President, since 2017 | | Executive Vice President of Wells Fargo & Company and Head of Affiliated Managers, Wells Fargo Asset Management, since 2014. In addition, Mr. Owen is currently President, Chief Executive Officer and Director of Wells Fargo Funds Management, LLC since 2017. Prior thereto, Executive Vice President responsible for marketing, investments and product development for Wells Fargo Funds Management, LLC, from 2009 to 2014. | | |
| | | |
Nancy Wiser1 (Born 1967) | | Treasurer, since 2012 | | Executive Vice President of Wells Fargo Funds Management, LLC since 2011. Chief Operating Officer and Chief Compliance Officer at LightBox Capital Management LLC, from 2008 to 2011. | | |
| | | |
Alexander Kymn (Born 1973) | | Secretary and Chief Legal Officer, since 2018 | | Senior Company Counsel of Wells Fargo Bank, N.A. since 2018 (previously Senior Counsel from 2007 to 2018). Vice President of Wells Fargo Funds Management, LLC from 2008 to 2014. | | |
| | | |
Michael H. Whitaker (Born 1967) | | Chief Compliance Officer, since 2016 | | Senior Vice President and Chief Compliance Officer since 2016. Senior Vice President and Chief Compliance Officer for Fidelity Investments from 2007 to 2016. | | |
| | | |
David Berardi (Born 1975) | | Assistant Treasurer, since 2009 | | Vice President of Wells Fargo Funds Management, LLC since 2009. Vice President of Evergreen Investment Management Company, LLC from 2008 to 2010. Manager of Fund Reporting and Control for Evergreen Investment Management Company, LLC from 2004 to 2010. | | |
| | | |
Jeremy DePalma1 (Born 1974) | | Assistant Treasurer, since 2009 | | Senior Vice President of Wells Fargo Funds Management, LLC since 2009. Senior Vice President of Evergreen Investment Management Company, LLC from 2008 to 2010 and head of the Fund Reporting and Control Team within Fund Administration from 2005 to 2010. | | |
| 1 | Nancy Wiser acts as Treasurer of 76 funds in the Fund Complex. Jeremy DePalma acts as Treasurer of 76 funds and Assistant Treasurer of 76 funds in the Fund Complex. |
| 2 | The Statement of Additional Information includes additional information about the Trustees and is available, without charge, upon request, by calling 1-800-222-8222 or by visiting the website atwfam.com. |
| 3 | Mr. Harris became Chairman of the Audit Committee effective January 1, 2019. |
| | | | |
| 46 | | Wells Fargo Core Plus Bond Fund | | Appendix A (unaudited) |
SALES CHARGE REDUCTIONS AND WAIVERS FOR CERTAIN INTERMEDIARIES
Raymond James & Associates, Inc., Raymond James Financial Services & Raymond James affiliates (“Raymond James”)
Effective on or about March 1, 2019, shareholders purchasing Fund shares through a Raymond James platform or account will be eligible only for the following load waivers (front-end sales charge waivers and contingent deferred, or back-end, sales charge waivers) and discounts, which may differ from those disclosed elsewhere in the Fund’s Prospectus or SAI.
Front-end Sales Load Waivers on Class A shares Available at Raymond James
| | • | | Shares purchased in an investment advisory program. |
| | • | | Shares purchased through reinvestment of capital gains distributions and dividend reinvestment when purchasing shares of the same fund (but not any other fund within the fund family). |
| | • | | Employees and registered representatives of Raymond James or its affiliates and their family members as designated by Raymond James. |
| | • | | Shares purchased from the proceeds of redemptions within the same fund family, provided (1) the repurchase occurs within 90 days following the redemption, (2) the redemption and purchase occur in the same account, and (3) redeemed shares were subject to a front-end or deferred sales load (known as Rights of Reinstatement). |
| | • | | A shareholder in the fund’s Class C shares will have their shares automatically exchanged at net asset value to Class A shares (or the appropriate share class) of the fund if the shares are no longer subject to a CDSC and the exchange is in line with the policies and procedures of Raymond James. |
CDSC Waivers on Class A and C Shares Available at Raymond James
| | • | | Death or disability of the shareholder. |
| | • | | Shares sold as part of a systematic withdrawal plan as described in the Fund’s Prospectus. |
| | • | | Return of excess contributions from an IRA Account. |
| | • | | Shares sold as part of a required minimum distribution for IRA and retirement accounts due to the shareholder reaching age 70½ as described in the Fund’s prospectus. |
| | • | | Shares sold to pay Raymond James fees but only if the transaction is initiated by Raymond James. |
| | • | | Shares acquired through a right of reinstatement. |
Front-end Load Discounts Available at Raymond James: Breakpoints, and/or Rights of Accumulation
| | • | | Breakpoints as described in the Fund’s Prospectus. |
| | • | | Rights of accumulation which entitle shareholders to breakpoint discounts will be automatically calculated based on the aggregated holding of fund family assets held by accounts within the purchaser’s household at Raymond James. Eligible fund family assets not held at Raymond James may be included in the rights of accumulation calculation only if the shareholder notifies his or her financial advisor about such assets. |
This page is intentionally left blank.
This page is intentionally left blank.

For more information
More information about Wells Fargo Funds is available free upon request. To obtain literature, please write, visit the Fund’s website, or call:
Wells Fargo Funds
P.O. Box 219967
Kansas City, MO 64121-9967
Website: wfam.com
Individual investors: 1-800-222-8222
Retail investment professionals: 1-888-877-9275
Institutional investment professionals:1-866-765-0778
This report and the financial statements contained herein are submitted for the general information of the shareholders of the Fund. If this report is used for promotional purposes, distribution of the report must be accompanied or preceded by a current prospectus. Before investing, please consider the investment objectives, risks, charges, and expenses of the investment. For a current prospectus and, if available, a summary prospectus, containing this information, call1-800-222-8222 or visit the Fund’s website atwfam.com. Read the prospectus carefully before you invest or send money.
Wells Fargo Asset Management (WFAM) is the trade name for certain investment advisory/management firms owned by Wells Fargo & Company. These firms include but are not limited to Wells Capital Management Incorporated and Wells Fargo Funds Management, LLC. Certain products managed by WFAM entities are distributed by Wells Fargo Funds Distributor, LLC (a broker-dealer and Member FINRA).
This material is for general informational and educational purposes only and is NOT intended to provide investment advice or a recommendation of any kind—including a recommendation for any specific investment, strategy, or plan.
INVESTMENT PRODUCTS: NOT FDIC INSURED ◾ NO BANK GUARANTEE ◾ MAY LOSE VALUE
© 2019 Wells Fargo Funds Management, LLC. All rights reserved.
| | |
 | | 321627 04-19 SA219/SAR219 02-19 |
Semi-Annual Report
February 28, 2019

Wells Fargo
Short Duration Government Bond Fund

Beginning on January 1, 2021, as permitted by new regulations adopted by the Securities and Exchange Commission, paper copies of the Wells Fargo Funds’ annual and semi-annual shareholder reports issued after this date will no longer be sent by mail, unless you specifically request paper copies of the reports. Instead, the reports will be made available on the Funds’ website, and you will be notified by mail each time a report is posted and provided with a website address to access the report.
If you already elected to receive shareholder reports electronically, you will not be affected by this change and you need not take any action. You may elect to receive shareholder reports and other communications from the Fund electronically at any time by contacting your financial intermediary (such as a broker-dealer or bank) or, if you are a direct investor, by calling 1-800-222-8222 or by enrolling at wellsfargo.com/advantagedelivery.
You may elect to receive all future reports in paper free of charge. If you invest through a financial intermediary, you can contact your financial intermediary to request that you continue to receive paper copies of your shareholder reports; if you invest directly with the Fund, you can call 1-800-222-8222. Your election to receive reports in paper will apply to all Wells Fargo Funds held in your account with your financial intermediary or, if you are a direct investor, to all Wells Fargo Funds that you hold.

Reduce clutter. Save trees.
Sign up for electronic delivery of prospectuses and shareholder reports atwellsfargo.com/advantagedelivery
Contents
The views expressed and any forward-looking statements are as of February 28, 2019, unless otherwise noted, and are those of the Fund managers and/or Wells Fargo Funds Management, LLC. Discussions of individual securities, or the markets generally, or any Wells Fargo Fund are not intended as individual recommendations. Future events or results may vary significantly from those expressed in any forward-looking statements. The views expressed are subject to change at any time in response to changing circumstances in the market. Wells Fargo Funds Management, LLC and the Fund disclaim any obligation to publicly update or revise any views expressed or forward-looking statements.
INVESTMENT PRODUCTS: NOT FDIC INSURED ◾ NO BANK GUARANTEE ◾ MAY LOSE VALUE
| | | | |
| 2 | | Wells Fargo Short Duration Government Bond Fund | | Letter to shareholders (unaudited) |

Andrew Owen
President
Wells Fargo Funds
Favorable third-quarter economic indicators and corporate earnings reports encouraged domestic stock investors.
Dear Shareholder:
We are pleased to offer you this semi-annual report for the Wells Fargo Short Duration Government Bond Fund for thesix-month period that ended February 28, 2019. Higher short-term interest rates, inflation concerns, trade tensions, slowing economic growth outside the U.S., and geopolitical events contributed to investment market volatility throughout the period.
For the period, U.S. stocks, as measured by the S&P 500 Index,1 fell 3.04% and international stocks, as measured by the MSCI ACWI ex USA Index (Net),2 declined 2.47%. Based on the MSCI EM Index (Net),3 emerging market stocks gained 0.33%. For bond investors, the Bloomberg Barclays U.S. Aggregate Bond Index4 added 1.99% while the Bloomberg Barclays Global Aggregateex-USD Index5 gained 0.63%. The Bloomberg Barclays Municipal Bond Index6 added 2.34%, and the ICE BofAML U.S. High Yield Index7 advanced 1.98%.
Investors appeared to shake off lingering concerns during the third quarter.
Favorable third-quarter economic indicators and corporate earnings reports encouraged domestic stock investors. U.S. trade negotiations with Mexico and Canada progressed. The Conference Board Consumer Confidence Index®8 reached its highest level in 18 years during September 2018. The U.S. Federal Reserve (Fed) raised the federal funds rate by 25 basis points (bps; 100 bps equal 1.00%) to a target range of between 2.00% and 2.25% in September 2018. For the quarter that ended September 30, 2018, the S&P 500 Index added 7.71%.
Investors in international markets were not as confident. Tensions between the U.S. and China increased. The U.S. imposed $200 billion in tariffs on Chinese goods. China reacted with $60 billion in tariffs on U.S. goods. Economic growth in China caused concern. The Bank of England (BOE) raised its monetary policy rate to 0.75% in August. During the quarter, the MSCI ACWI ex USA Index (Net) gained 0.71%. The MSCI EM Index (Net) declined 1.09%. In fixed-income markets, U.S. bonds were flat, as measured by the Bloomberg Barclays U.S. Aggregate Bond Index. The Bloomberg Barclays Global Aggregateex-USD Index fell 1.74%.
| 1 | The S&P 500 Index consists of 500 stocks chosen for market size, liquidity, and industry group representation. It is a market-value-weighted index with each stock’s weight in the index proportionate to its market value. You cannot invest directly in an index. |
| 2 | The Morgan Stanley Capital International (MSCI) All Country World Index (ACWI) ex USA Index (Net) is a free-float-adjusted market-capitalization-weighted index that is designed to measure the equity market performance of developed markets, excluding the United States and Canada. Source: MSCI. MSCI makes no express or implied warranties or representations and shall have no liability whatsoever with respect to any MSCI data contained herein. The MSCI data may not be further redistributed or used as a basis for other indices or any securities or financial products. This report is not approved, reviewed, or produced by MSCI. You cannot invest directly in an index. |
| 3 | The MSCI Emerging Markets (EM) Index (Net) is a free-float-adjusted market-capitalization-weighted index that is designed to measure large- andmid-cap equity market performance of emerging markets. The MSCI EM Index (Net) consists of the following 24 emerging market country indices: Brazil, Chile, China, Colombia, Czech Republic, Egypt, Greece, Hungary, India, Indonesia, Korea, Malaysia, Mexico, Pakistan, Peru, the Philippines, Poland, Qatar, Russia, South Africa, Taiwan, Thailand, Turkey, and the United Arab Emirates. You cannot invest directly in an index. |
| 4 | The Bloomberg Barclays U.S. Aggregate Bond Index is a broad-based benchmark that measures the investment-grade, U.S. dollar-denominated, fixed-rate taxable bond market, including Treasuries, government-related and corporate securities, mortgage-backed securities (agency fixed-rate and hybrid adjustable-rate mortgage pass-throughs), asset-backed securities, and commercial mortgage-backed securities. You cannot invest directly in an index. |
| 5 | The Bloomberg Barclays Global Aggregateex-USD Index is an unmanaged index that provides a broad-based measure of the global investment-grade fixed-income markets excluding the U.S. dollar-denominated debt market. You cannot invest directly in an index. |
| 6 | The Bloomberg Barclays Municipal Bond Index is an unmanaged index composed of long-termtax-exempt bonds with a minimum credit rating of Baa. You cannot invest directly in an index. |
| 7 | The ICE BofAML U.S. High Yield Index is a market-capitalization-weighted index of domestic and Yankee high-yield bonds. The index tracks the performance of high-yield securities traded in the U.S. bond market. You cannot invest directly in an index. Copyright 2019. ICE Data Indices, LLC. All rights reserved. |
| 8 | The Conference Board Consumer Confidence Index® measures the degree of optimism on the state of the U.S. economy that consumers are expressing through their activities of savings and spending. You cannot invest directly in an index. |
| | | | | | |
| Letter to shareholders (unaudited) | | Wells Fargo Short Duration Government Bond Fund | | | 3 | |
Conflicting data unsettled markets during the fourth quarter.
November’s U.S. midterm elections shifted control of the House of Representatives from Republicans to Democrats, presaging potential partisan clashes. Third-quarter U.S. gross domestic product (GDP) was announced at an annualized 3.4% rate, lower than the second-quarter rate. Brexit efforts stalled ahead of the March 2019 deadline. The People’s Bank of China cut reserve requirement ratios, accelerated infrastructure spending, and cut taxes even as the value of the yuan declined to low levels last seen in 2008.
December’s S&P 500 Index performance was the worst since 1931. Globally,fixed-income investments fared better than stocks during the last two months of the year. The Fed increased the federal funds rate by 25 bps in December 2018 to a target range of between 2.25% and 2.50% and softened its outlook for 2019 rate increases.
The market climbs a wall of worry.
Investors entered 2019 with reasons to be concerned. A partial U.S. government shutdown driven by partisan spending and immigration policy disputes extended into January. Investors expected high levels of stock market volatility to continue based on the VIX9.
January’s returns tended to support the investing adage that markets climb a wall of worry. The S&P 500 Index gained 8.01% for the month that ended January 31, 2019, its best monthly performance in 30 years. Returns for the MSCI ACWI ex USA Index (Net), the Bloomberg Barclays U.S. Aggregate Bond Index, and the Bloomberg Barclays Global Aggregateex-USD Index also were positive.
In February, concerns over slowing global growth reemerged. The Bureau of Economic Analysis announced fourth-quarter 2018 GDP grew at an annualized 2.2% rate, down from the 4.2% annualized rate for the second quarter and the 3.4% annualized rate for the third quarter. Analysts attributed the lower growth rate to a slowing housing market and larger trade deficit. The U.S. Labor Department said that the economy created just 20,000 jobs in February. In a February report, the BOE forecast the slowest growth since the financial crisis for 2019. China and the U.S., while putting future tariffs on hold for the time being, continued to wrangle over trade issues.
Don’t let short-term uncertainty derail long-term investment goals.
Periods of investment uncertainty can present challenges, but experience has taught us that maintaining long-term investment goals can be an effective way to plan for the future. To help you create a sound strategy based on your personal goals and risk tolerance, Wells Fargo Funds offers more than 100 mutual funds spanning a wide range of asset classes and investment styles. Although diversification cannot guarantee an investment profit or prevent losses, we believe it can be an effective way to manage investment risk and potentially smooth out overall portfolio performance. We encourage investors to know their investments and to understand that appropriate levels of risk-taking may unlock opportunities.
January’s returns tended to support the investing adage that markets climb a wall of worry.
| 9 | The Chicago Board Options Exchange Market Volatility Index (VIX) is a popular measure of the implied volatility of S&P 500 Index options. It represents one measure of the market’s expectation of stock market volatility over the next30-day period. You cannot invest directly in an index. |
| | | | |
| 4 | | Wells Fargo Short Duration Government Bond Fund | | Letter to shareholders (unaudited) |
Thank you for choosing to invest with Wells Fargo Funds. We appreciate your confidence in us and remain committed to helping you meet your financial needs.
Sincerely,

Andrew Owen
President
Wells Fargo Funds
For further information about your Fund, contact your investment professional, visit our website atwfam.com, or call us directly at1-800-222-8222.
This page is intentionally left blank.
| | | | |
| 6 | | Wells Fargo Short Duration Government Bond Fund | | Performance highlights (unaudited) |
Investment objective
The Fund seeks to provide current income consistent with capital preservation.
Manager
Wells Fargo Funds Management, LLC
Subadviser
Wells Capital Management Incorporated
Portfolio managers
Maulik Bhansali, CFA®‡
Thomas O’Connor, CFA®‡
Jarad Vasquez
Average annual total returns (%) as of February 28, 2019
| | | | | | | | | | | | | | | | | | | | | | | | | | | | | | | | | | |
| | | | | Including sales charge | | | Excluding sales charge | | | Expense ratios1 (%) | |
| | | Inception date | | 1 year | | | 5 year | | | 10 Year | | | 1 year | | | 5 year | | | 10 Year | | | Gross | | | Net2 | |
| | | | | | | | | |
| Class A (MSDAX) | | 3-11-1996 | | | -0.59 | | | | 0.13 | | | | 1.27 | | | | 1.44 | | | | 0.54 | | | | 1.48 | | | | 0.80 | | | | 0.78 | |
| | | | | | | | | |
| Class C (MSDCX) | | 5-31-2002 | | | -0.31 | | | | -0.19 | | | | 0.73 | | | | 0.69 | | | | -0.19 | | | | 0.73 | | | | 1.55 | | | | 1.53 | |
| | | | | | | | | |
| Class R6 (MSDRX)3 | | 11-30-2012 | | | – | | | | – | | | | – | | | | 1.86 | | | | 0.97 | | | | 1.93 | | | | 0.42 | | | | 0.37 | |
| | | | | | | | | |
| Administrator Class (MNSGX) | | 12-18-1992 | | | – | | | | – | | | | – | | | | 1.63 | | | | 0.74 | | | | 1.69 | | | | 0.74 | | | | 0.60 | |
| | | | | | | | | |
| Institutional Class (WSGIX) | | 4-8-2005 | | | – | | | | – | | | | – | | | | 1.81 | | | | 0.92 | | | | 1.88 | | | | 0.47 | | | | 0.42 | |
| | | | | | | | | |
| Bloomberg Barclays U.S.1-3 Year Government Bond Index4 | | – | | | – | | | | – | | | | – | | | | 2.30 | | | | 0.84 | | | | 1.09 | | | | – | | | | – | |
Figures quoted represent past performance, which is no guarantee of future results, and do not reflect taxes that a shareholder may pay on fund distributions or the redemption of fund shares.Investment return and principal value of an investment will fluctuate so that an investor’s shares, when redeemed, may be worth more or less than their original cost. Performance shown without sales charges would be lower if sales charges were reflected. Current performance may be lower or higher than the performance data quoted, which assumes the reinvestment of dividends and capital gains. Currentmonth-end performance is available on the Fund’s website,wfam.com.
Index returns do not include transaction costs associated with buying and selling securities, any mutual fund fees or expenses, or any taxes. It is not possible to invest directly in an index.
For Class A shares, the maximumfront-end sales charge is 2.00%. For Class C shares, the maximum contingent deferred sales charge is 1.00%. Performance including a contingent deferred sales charge assumes the sales charge for the corresponding time period. Class R6, Administrator Class, and Institutional Class shares are sold without afront-end sales charge or contingent deferred sales charge.
Bond values fluctuate in response to the financial condition of individual issuers, general market and economic conditions, and changes in interest rates. Changes in market conditions and government policies may lead to periods of heightened volatility in the bond market and reduced liquidity for certain bonds held by the Fund. In general, when interest rates rise, bond values fall and investors may lose principal value. Interest-rate changes and their impact on the Fund and its share price can be sudden and unpredictable. Securities issued by U.S. government agencies or government sponsored entities may not be guaranteed by the U.S. Treasury. Certain investment strategies tend to increase the total risk of an investment (relative to the broader market). The Fund is exposed to mortgage- and asset-backed securities risk. The U.S. government guarantee applies to certain underlying securities and not to shares of the Fund. Consult the Fund’s prospectus for additional information on these and other risks.
Please see footnotes on page 7.
| | | | | | |
| Performance highlights (unaudited) | | Wells Fargo Short Duration Government Bond Fund | | | 7 | |
| | | | |
| Ten largest holdings (%) as of February 28, 20195 | |
| |
U.S. Treasury Note, 2.00%,8-31-2021 | | | 11.14% | |
| |
GNMA, 5.00%,12-20-2048 | | | 7.46% | |
| |
U.S. Treasury Note, 2.50%,2-15-2022 | | | 7.45% | |
| |
U.S. Treasury Note, 2.13%,8-15-2021 | | | 4.53% | |
| |
U.S. Treasury Note, 2.50%,1-15-2022 | | | 4.05% | |
| |
U.S. Treasury Note, 2.63%,5-15-2021 | | | 3.78% | |
| |
GNMA, 5.00%,11-20-2048 | | | 3.66% | |
| |
FNMA, 3.00%,7-1-2026 | | | 3.40% | |
| |
GNMA, 5.00%,4-20-2049 | | | 2.52% | |
| |
FNMA, 4.50%,3-13-2049 | | | 2.41% | |
|
| Portfolio composition as of February 28, 20196 |
|
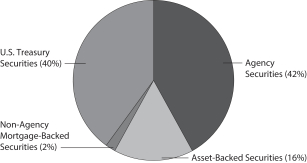
|
| 1 | Reflects the expense ratios as stated in the most recent prospectuses. The expense ratios shown are subject to change and may differ from the annualized expense ratios shown in the financial highlights of this report. |
| 2 | The manager has contractually committed through December 31, 2019, to waive fees and/or reimburse expenses to the extent necessary to cap the expenses of each class after fee waivers at the amounts shown. Brokerage commissions, stamp duty fees, interest, taxes, acquired fund fees and expenses (if any), and extraordinary expenses are excluded from the expense cap. Prior to or after the commitment expiration date, the cap may be increased or the commitment to maintain the cap may be terminated only with the approval of the Board of Trustees. Without this cap, the Fund’s returns would have been lower. The expense ratio paid by an investor is the net expense ratio (the total annual fund operating expenses after fee waivers) as stated in the prospectuses. |
| 3 | Historical performance shown for Class R6 shares prior to their inception reflects the performance of Institutional Class shares and includes the higher expenses applicable to Institutional Class shares. If these expenses had not been included, returns for Class R6 shares would be higher. |
| 4 | The Bloomberg Barclays U.S. 1–3 Year Government Bond Index is composed of all publicly issued, nonconvertible domestic debt of the U.S. government and its agencies. The index also includes corporate debt guaranteed by the U.S. government. Only notes and bonds with a minimum maturity of one year up to a maximum maturity of 2.9 years are included. You cannot invest directly in an index. |
| 5 | The ten largest holdings, excluding cash, cash equivalents and any money market funds, are calculated based on the value of the investments divided by total net assets of the Fund. Holdings are subject to change and may have changed since the date specified. |
| 6 | Amounts are calculated based on the total long-term investments of the Fund. These amounts are subject to change and may have changed since the date specified. |
| | | | |
| 8 | | Wells Fargo Short Duration Government Bond Fund | | Fund expenses (unaudited) |
As a shareholder of the Fund, you incur two types of costs: (1) transaction costs, including sales charges (loads) on purchase payments and contingent deferred sales charges (if any) on redemptions and (2) ongoing costs, including management fees, distribution(12b-1) and/or shareholder servicing fees, and other Fund expenses. This example is intended to help you understand your ongoing costs (in dollars) of investing in the Fund and to compare these costs with the ongoing costs of investing in other mutual funds.
The example is based on an investment of $1,000 invested at the beginning of thesix-month period and held for the entire period from September 1, 2018 to February 28, 2019.
Actual expenses
The “Actual” line of the table below provides information about actual account values and actual expenses. You may use the information in this line, together with the amount you invested, to estimate the expenses that you paid over the period. Simply divide your account value by $1,000 (for example, an $8,600 account value divided by $1,000 = 8.6), then multiply the result by the number in the “Actual” line under the heading entitled “Expenses paid during period” for your applicable class of shares to estimate the expenses you paid on your account during this period.
Hypothetical example for comparison purposes
The “Hypothetical” line of the table below provides information about hypothetical account values and hypothetical expenses based on the Fund’s actual expense ratio and an assumed rate of return of 5% per year before expenses, which is not the Fund’s actual return. The hypothetical account values and expenses may not be used to estimate the actual ending account balance or expenses you paid for the period. You may use this information to compare the ongoing costs of investing in the Fund and other funds. To do so, compare this 5% hypothetical example with the 5% hypothetical examples that appear in the shareholder reports of the other funds.
Please note that the expenses shown in the table are meant to highlight your ongoing costs only and do not reflect any transactional costs, such as sales charges (loads) and contingent deferred sales charges. Therefore, the “Hypothetical” line of the table is useful in comparing ongoing costs only and will not help you determine the relative total costs of owning different funds. In addition, if these transactional costs were included, your costs would have been higher.
| | | | | | | | | | | | | | | | |
| | | Beginning
account value
9-1-2018 | | | Ending
account value
2-28-2019 | | | Expenses
paid during
the period¹ | | | Annualized net
expense ratio | |
Class A | | | | | | | | | | | | | | | | |
| | | | |
Actual | | $ | 1,000.00 | | | $ | 1,011.89 | | | $ | 3.89 | | | | 0.78 | % |
| | | | |
Hypothetical (5% return before expenses) | | $ | 1,000.00 | | | $ | 1,020.93 | | | $ | 3.91 | | | | 0.78 | % |
Class C | | | | | | | | | | | | | | | | |
| | | | |
Actual | | $ | 1,000.00 | | | $ | 1,008.14 | | | $ | 7.62 | | | | 1.53 | % |
| | | | |
Hypothetical (5% return before expenses) | | $ | 1,000.00 | | | $ | 1,017.21 | | | $ | 7.65 | | | | 1.53 | % |
Class R6 | | | | | | | | | | | | | | | | |
| | | | |
Actual | | $ | 1,000.00 | | | $ | 1,013.94 | | | $ | 1.85 | | | | 0.37 | % |
| | | | |
Hypothetical (5% return before expenses) | | $ | 1,000.00 | | | $ | 1,022.96 | | | $ | 1.86 | | | | 0.37 | % |
Administrator Class | | | | | | | | | | | | | | | | |
| | | | |
Actual | | $ | 1,000.00 | | | $ | 1,012.79 | | | $ | 2.99 | | | | 0.60 | % |
| | | | |
Hypothetical (5% return before expenses) | | $ | 1,000.00 | | | $ | 1,021.82 | | | $ | 3.01 | | | | 0.60 | % |
Institutional Class | | | | | | | | | | | | | | | | |
| | | | |
Actual | | $ | 1,000.00 | | | $ | 1,013.68 | | | $ | 2.10 | | | | 0.42 | % |
| | | | |
Hypothetical (5% return before expenses) | | $ | 1,000.00 | | | $ | 1,022.71 | | | $ | 2.11 | | | | 0.42 | % |
| 1 | Expenses paid is equal to the annualized net expense ratio of each class multiplied by the average account value over the period, multiplied by the number of days in the most recent fiscal half-year divided by the number of days in the fiscal year (to reflect theone-half-year period). |
| | | | | | |
| Portfolio of investments—February 28, 2019 (unaudited) | | Wells Fargo Short Duration Government Bond Fund | | | 9 | |
| | | | | | | | | | | | | | | | |
| Security name | | Interest rate | | | Maturity date | | | Principal | | | Value | |
| | | |
Agency Securities: 43.16% | | | | | | | | | | | | | |
| | | | |
FHLMC (12 Month LIBOR +1.84%) ± | | | 3.40 | % | | | 5-1-2042 | | | $ | 2,288,923 | | | $ | 2,317,203 | |
| | | | |
FHLMC | | | 4.00 | | | | 10-1-2033 | | | | 720,433 | | | | 746,527 | |
| | | | |
FHLMC | | | 4.00 | | | | 1-1-2034 | | | | 639,691 | | | | 662,863 | |
| | | | |
FHLMC | | | 4.50 | | | | 4-1-2031 | | | | 1,545,657 | | | | 1,616,782 | |
| | | | |
FHLMC Multifamily Structured Pass-Through Certificates Series KI02 Class A
(1 Month LIBOR +0.20%) ± | | | 2.71 | | | | 2-25-2023 | | | | 2,440,992 | | | | 2,437,323 | |
| | | | |
FHLMC Series 3632 Class PK | | | 5.00 | | | | 2-15-2040 | | | | 4,260,901 | | | | 4,518,078 | |
| | | | |
FHLMC Series 3653 Class AU | | | 4.00 | | | | 4-15-2040 | | | | 1,434,965 | | | | 1,487,004 | |
| | | | |
FNMA | | | 2.00 | | | | 3-25-2028 | | | | 2,142,246 | | | | 2,088,782 | |
| | | | |
FNMA (12 Month LIBOR +1.61%) ± | | | 2.76 | | | | 3-1-2047 | | | | 7,207,189 | | | | 7,191,467 | |
| | | | |
FNMA (12 Month LIBOR +1.60%) ± | | | 2.95 | | | | 8-1-2047 | | | | 4,330,825 | | | | 4,342,462 | |
| | | | |
FNMA | | | 3.00 | | | | 7-1-2026 | | | | 19,508,445 | | | | 19,774,267 | |
| | | | |
FNMA (12 Month LIBOR +1.62%) ± | | | 3.75 | | | | 8-1-2048 | | | | 3,434,648 | | | | 3,509,914 | |
| | | | |
FNMA (12 Month LIBOR +1.62%) ± | | | 3.83 | | | | 9-1-2048 | | | | 2,093,748 | | | | 2,139,855 | |
| | | | |
FNMA (12 Month LIBOR +1.61%) ± | | | 3.86 | | | | 12-1-2048 | | | | 522,571 | | | | 534,255 | |
| | | | |
FNMA | | | 4.00 | | | | 4-1-2032 | | | | 668,164 | | | | 691,294 | |
| | | | |
FNMA | | | 4.00 | | | | 10-1-2033 | | | | 1,069,070 | | | | 1,103,489 | |
| | | | |
FNMA | | | 4.00 | | | | 1-1-2034 | | | | 5,734,382 | | | | 5,926,230 | |
| | | | |
FNMA | | | 4.00 | | | | 1-1-2034 | | | | 5,038,271 | | | | 5,200,607 | |
| | | | |
FNMA | | | 4.00 | | | | 2-1-2034 | | | | 5,893,577 | | | | 6,097,765 | |
| | | | |
FNMA | | | 4.00 | | | | 7-1-2034 | | | | 1,437,092 | | | | 1,482,926 | |
| | | | |
FNMA | | | 4.50 | | | | 2-1-2034 | | | | 1,444,000 | | | | 1,494,223 | |
| | | | |
FNMA | | | 4.50 | | | | 2-1-2034 | | | | 3,012,000 | | | | 3,135,356 | |
| | | | |
FNMA | | | 4.50 | | | | 9-1-2037 | | | | 651,453 | | | | 686,454 | |
| | | | |
FNMA | | | 4.50 | | | | 11-1-2048 | | | | 9,093,806 | | | | 9,415,989 | |
| | | | |
FNMA %% | | | 4.50 | | | | 3-13-2049 | | | | 13,500,000 | | | | 13,990,693 | |
| | | | |
FNMA | | | 5.00 | | | | 10-1-2040 | | | | 1,302,188 | | | | 1,393,091 | |
| | | | |
FNMA | | | 5.00 | | | | 5-1-2046 | | | | 481,884 | | | | 514,415 | |
| | | | |
FNMA | | | 5.00 | | | | 1-1-2049 | | | | 12,604,000 | | | | 13,414,004 | |
| | | | |
FNMA Series2009-20 Class DT | | | 4.50 | | | | 4-25-2039 | | | | 1,997,358 | | | | 2,119,621 | |
| | | | |
FNMA Series2013-103 Class H | | | 4.50 | | | | 3-25-2038 | | | | 2,446,764 | | | | 2,514,771 | |
| | | | |
FNMA Series2013-90 Class A | | | 4.00 | | | | 11-25-2038 | | | | 3,436,541 | | | | 3,479,515 | |
| | | | |
FNMA Series2015-57 Class AB | | | 3.00 | | | | 8-25-2045 | | | | 3,315,714 | | | | 3,301,128 | |
| | | | |
FNMA Series2015-M10 Class FA (1 Month LIBOR +0.25%) ± | | | 2.75 | | | | 3-25-2019 | | | | 33,470 | | | | 33,410 | |
| | | | |
GNMA | | | 4.50 | | | | 2-20-2049 | | | | 4,821,000 | | | | 5,040,203 | |
| | | | |
GNMA | | | 5.00 | | | | 10-15-2039 | | | | 1,212,577 | | | | 1,290,591 | |
| | | | |
GNMA | | | 5.00 | | | | 3-20-2048 | | | | 3,463,170 | | | | 3,626,051 | |
| | | | |
GNMA | | | 5.00 | | | | 9-20-2048 | | | | 6,360,760 | | | | 6,644,322 | |
| | | | |
GNMA | | | 5.00 | | | | 11-20-2048 | | | | 20,413,609 | | | | 21,310,068 | |
| | | | |
GNMA | | | 5.00 | | | | 12-20-2048 | | | | 41,490,056 | | | | 43,381,808 | |
| | | | |
GNMA | | | 5.00 | | | | 12-20-2048 | | | | 4,622,845 | | | | 4,751,374 | |
| | | | |
GNMA | | | 5.00 | | | | 1-20-2049 | | | | 8,692,799 | | | | 9,083,816 | |
| | | | |
GNMA | | | 5.00 | | | | 2-20-2049 | | | | 499,000 | | | | 521,446 | |
| | | | |
GNMA %% (a) | | | 5.00 | | | | 4-20-2049 | | | | 14,066,000 | | | | 14,656,113 | |
| | | | |
GNMA2012-124 Class PT | | | 6.00 | | | | 10-20-2042 | | | | 2,402,757 | | | | 2,642,982 | |
| | | | |
GNMA2012-141 Class WD ±± | | | 4.97 | | | | 7-20-2040 | | | | 2,543,983 | | | | 2,730,429 | |
| | | | |
GNMA Series2011-137 Class WA ±± | | | 5.56 | | | | 7-20-2040 | | | | 2,882,443 | | | | 3,169,337 | |
| | | | |
GNMA Series2016-112 Class AW ±± | | | 7.12 | | | | 12-20-2040 | | | | 2,397,790 | | | | 2,737,896 | |
| | | |
Total Agency Securities (Cost $251,698,418) | | | | | | | | | | | | 250,948,199 | |
| | | | | | | | | | | | | | | | |
The accompanying notes are an integral part of these financial statements.
| | | | |
| 10 | | Wells Fargo Short Duration Government Bond Fund | | Portfolio of investments—February 28, 2019 (unaudited) |
| | | | | | | | | | | | | | | | |
| Security name | | Interest rate | | | Maturity date | | | Principal | | | Value | |
|
Asset-Backed Securities: 14.74% | |
| | | | |
Avis Budget Rental Car Funding LLC Series19-1A Class A 144A | | | 3.45 | % | | | 3-20-2023 | | | $ | 4,179,000 | | | $ | 4,196,489 | |
| | | | |
Ford Credit Auto Owner Trust Series2017-1 Class A 144A | | | 2.62 | | | | 8-15-2028 | | | | 6,085,000 | | | | 6,008,355 | |
| | | | |
Hertz Fleet Lease Funding LP Series2018-1 Class A2 144A | | | 3.23 | | | | 5-10-2032 | | | | 4,640,000 | | | | 4,644,788 | |
| | | | |
Hertz Vehicle Financing LLC Series2015-3A Class A 144A | | | 2.67 | | | | 9-25-2021 | | | | 2,652,000 | | | | 2,626,674 | |
| | | | |
Hertz Vehicle Financing LLC Series2019-1A Class A 144A | | | 3.71 | | | | 3-25-2023 | | | | 4,975,000 | | | | 5,007,454 | |
| | | | |
Navient Student Loan Trust Series2014-CTA Class A (1 Month LIBOR +0.70%) ±144A | | | 3.19 | | | | 9-16-2024 | | | | 2,303,047 | | | | 2,306,789 | |
| | | | |
Nelnet Student Loan Trust Series2004-4 Class A5 (3 Month LIBOR +0.16%) ± | | | 2.93 | | | | 1-25-2037 | | | | 4,211,444 | | | | 4,144,999 | |
| | | | |
Nelnet Student Loan Trust Series2016-1A Class A (1 Month LIBOR +0.80%) ±144A | | | 3.29 | | | | 9-25-2065 | | | | 5,937,768 | | | | 5,964,283 | |
| | | | |
Nelnet Student Loan Trust Series2018-3A Class A2 (1 Month LIBOR +0.44%) ±144A | | | 2.93 | | | | 9-27-2066 | | | | 3,773,000 | | | | 3,766,924 | |
| | | | |
SLC Student Loan Trust Series2010-1 Class A (3 Month LIBOR +0.88%) ± | | | 3.53 | | | | 11-25-2042 | | | | 1,360,693 | | | | 1,366,453 | |
| | | | |
SLM Student Loan Trust Series2004-10 Class A7A (3 Month LIBOR +0.60%) ±144A | | | 3.37 | | | | 10-25-2029 | | | | 3,874,000 | | | | 3,878,167 | |
| | | | |
SLM Student Loan Trust Series2004-10 Class A7B (3 Month LIBOR +0.60%) ±144A | | | 3.37 | | | | 10-25-2029 | | | | 6,174,000 | | | | 6,177,606 | |
| | | | |
SLM Student Loan Trust Series2005-6 Class A6 (3 Month LIBOR +0.14%) ± | | | 2.91 | | | | 10-27-2031 | | | | 3,182,950 | | | | 3,163,886 | |
| | | | |
SLM Student Loan Trust Series2010-A Class 1A (PRIME-0.05%) 144A± | | | 5.45 | | | | 5-16-2044 | | | | 400,654 | | | | 404,257 | |
| | | | |
SLM Student Loan Trust Series2012-3 Class A (1 Month LIBOR +0.65%) ± | | | 3.14 | | | | 12-27-2038 | | | | 5,993,235 | | | | 5,978,096 | |
| | | | |
SLM Student Loan Trust Series2014-A Class A2A 144A | | | 2.59 | | | | 1-15-2026 | | | | 500,746 | | | | 500,378 | |
| | | | |
SLM Student Loan Trust Series2014-A Class A2B (1 Month LIBOR +1.15%) ±144A | | | 3.64 | | | | 1-15-2026 | | | | 730,330 | | | | 731,497 | |
| | | | |
SMB Private Education Loan Trust Series2015-A Class A2A 144A | | | 2.49 | | | | 6-15-2027 | | | | 3,035,119 | | | | 3,009,365 | |
| | | | |
SMB Private Education Loan Trust Series2015-C Class A2A 144A | | | 2.75 | | | | 7-15-2027 | | | | 3,194,274 | | | | 3,179,580 | |
| | | | |
SMB Private Education Loan Trust Series2016-B Class A2B (1 Month LIBOR +1.45%) ±144A | | | 3.94 | | | | 2-17-2032 | | | | 2,253,361 | | | | 2,294,473 | |
| | | | |
SMB Private Education Loan Trust Series2017-B Class A2B (1 Month LIBOR +0.75%) ±144A | | | 3.24 | | | | 10-15-2035 | | | | 3,950,000 | | | | 3,947,267 | |
| | | | |
SoFi Professional Loan Program LLC Series2016-C Class A1 (1 Month LIBOR +1.10%) ±144A | | | 3.59 | | | | 10-27-2036 | | | | 1,382,021 | | | | 1,399,969 | |
| | | | |
SoFi Professional Loan Program LLC Series2016-D Class A1 (1 Month LIBOR +0.95%) ±144A | | | 3.44 | | | | 1-25-2039 | | | | 3,002,203 | | | | 3,020,898 | |
| | | | |
SoFi Professional Loan Program LLC Series2016-E Class A1 (1 Month LIBOR +0.85%) ±144A | | | 3.34 | | | | 7-25-2039 | | | | 1,298,047 | | | | 1,303,766 | |
| | | | |
SoFi Professional Loan Program LLC Series2017-A Class A1 (1 Month LIBOR +0.70%) ±144A | | | 3.19 | | | | 3-26-2040 | | | | 1,676,632 | | | | 1,681,061 | |
| | | | |
SoFi Professional Loan Program LLC Series2017-C Class A1 (1 Month LIBOR +0.60%) ±144A | | | 3.09 | | | | 7-25-2040 | | | | 1,570,719 | | | | 1,573,658 | |
| | | | |
World Financial Network Credit Card Master Trust Series2019-A Class A | | | 3.14 | | | | 12-15-2025 | | | | 2,812,000 | | | | 2,817,821 | |
| | | |
Total Asset-Backed Securities (Cost $76,170,029) | | | | | | | | | | | | 85,094,953 | |
| | | | | | | | | | | | | | | | |
|
Non-Agency Mortgage-Backed Securities: 1.65% | |
| | | | |
Colt Funding LLC Series2018-3 Class A1 ±±144A | | | 3.69 | | | | 10-26-2048 | | | | 2,471,926 | | | | 2,475,508 | |
| | | | |
Colt Funding LLC Series2018-4 Class A1 ±±144A | | | 4.01 | | | | 12-28-2048 | | | | 1,728,339 | | | | 1,733,610 | |
| | | | |
Colt Funding LLC Series2019-1 Class A1 ±±144A | | | 3.71 | | | | 3-25-2049 | | | | 1,037,561 | | | | 1,039,717 | |
| | | | |
Commercial Mortgage Trust Series 2013 - LC6 Class A3 | | | 2.67 | | | | 1-10-2046 | | | | 3,099,489 | | | | 3,063,616 | |
| | | | |
DBUBS Mortgage Trust Series 2011-LC2A Class A1 144A | | | 3.53 | | | | 7-10-2044 | | | | 272,036 | | | | 272,923 | |
| | | | |
GS Mortgage Securities Trust Series2010-C1 Class A1 144A | | | 3.68 | | | | 8-10-2043 | | | | 493,536 | | | | 494,883 | |
| | | | |
GS Mortgage Securities Trust Series2010-C2 Class A1 144A | | | 3.85 | | | | 12-10-2043 | | | | 433,483 | | | | 436,665 | |
| | | | |
GS Mortgage Securities Trust Series 2012-GCJ7 Class AAB | | | 2.94 | | | | 5-10-2045 | | | | 1,467,397 | | | | 1,465,695 | |
| | | | |
JPMorgan Chase Commercial Mortgage Securities Trust Series2010-C1 Class A2 144A | | | 4.61 | | | | 6-15-2043 | | | | 1,347,244 | | | | 1,363,622 | |
| | | | |
JPMorgan Chase Commercial Mortgage Securities Trust Series2012-CBX Class A3 | | | 3.14 | | | | 6-15-2045 | | | | 611,020 | | | | 610,364 | |
| | | | |
JPMorgan Mortgage Trust Series2017-5 Class A1 ±±144A | | | 3.18 | | | | 10-26-2048 | | | | 3,160,552 | | | | 3,147,742 | |
| | | | |
Morgan Stanley Capital I Trust Series2011-C2 Class A3 144A | | | 4.21 | | | | 6-15-2044 | | | | 259,991 | | | | 262,663 | |
| | | | |
Verus Securitization Trust Series2018-2 Class A1 ±±144A | | | 3.68 | | | | 6-1-2058 | | | | 3,112,366 | | | | 3,124,215 | |
The accompanying notes are an integral part of these financial statements.
| | | | | | |
| Portfolio of investments—February 28, 2019 (unaudited) | | Wells Fargo Short Duration Government Bond Fund | | | 11 | |
| | | | | | | | | | | | | | | | |
| Security name | | Interest rate | | | Maturity date | | | Principal | | | Value | |
|
Non-Agency Mortgage-Backed Securities(continued) | |
| | | | |
Verus Securitization Trust Series2019-1 Class A1 ±±144A | | | 3.84 | % | | | 2-25-2059 | | | $ | 3,064,000 | | | $ | 3,063,961 | |
| | | |
TotalNon-Agency Mortgage-Backed Securities (Cost $31,748,379) | | | | | | | | | | | | 22,555,184 | |
| | | | | | | | | | | | | | | | |
|
U.S. Treasury Securities: 40.30% | |
| | | | |
U.S. Treasury Note | | | 2.00 | | | | 8-31-2021 | | | | 65,579,000 | | | | 64,761,824 | |
| | | | |
U.S. Treasury Note | | | 2.13 | | | | 8-15-2021 | | | | 26,608,000 | | | | 26,361,667 | |
| | | | |
U.S. Treasury Note | | | 2.38 | | | | 4-15-2021 | | | | 6,129,000 | | | | 6,109,847 | |
| | | | |
U.S. Treasury Note ## | | | 2.50 | | | | 1-31-2021 | | | | 2,621,000 | | | | 2,619,464 | |
| | | | |
U.S. Treasury Note | | | 2.50 | | | | 2-28-2021 | | | | 12,823,000 | | | | 12,817,991 | |
| | | | |
U.S. Treasury Note ## | | | 2.50 | | | | 1-15-2022 | | | | 23,532,000 | | | | 23,528,323 | |
| | | | |
U.S. Treasury Note | | | 2.50 | | | | 2-15-2022 | | | | 43,342,000 | | | | 43,347,079 | |
| | | | |
U.S. Treasury Note | | | 2.50 | | | | 1-31-2024 | | | | 8,785,000 | | | | 8,775,391 | |
| | | | |
U.S. Treasury Note | | | 2.63 | | | | 5-15-2021 | | | | 21,921,000 | | | | 21,966,383 | |
| | | | |
U.S. Treasury Note | | | 2.63 | | | | 7-15-2021 | | | | 2,833,000 | | | | 2,840,083 | |
| | | | |
U.S. Treasury Note | | | 2.75 | | | | 8-15-2021 | | | | 6,332,000 | | | | 6,367,370 | |
| | | | |
U.S. Treasury Note | | | 2.88 | | | | 10-15-2021 | | | | 13,563,000 | | | | 13,686,444 | |
| | | | |
U.S. Treasury Note | | | 2.88 | | | | 11-15-2021 | | | | 1,151,000 | | | | 1,161,836 | |
| | |
Total U.S. Treasury Securities (Cost $234,266,166) | | | | | | | | 234,343,702 | |
| | | | | | | | | | | | | | | | |
| | | | |
| | | Yield | | | | | | Shares | | | | |
| Short-Term Investments: 0.84% | | | | | | | | | | | | | | | | |
| | |
| Investment Companies: 0.84% | | | | | | | | | |
| | | | |
Wells Fargo Government Money Market Fund Select Class (l)(u)## | | | 2.34 | | | | | | | | 4,855,779 | | | | 4,855,779 | |
| | | | | | | | | | | | | | | | |
| | |
Total Short-Term Investments (Cost $4,855,779) | | | | | | | | 4,855,779 | |
| | | | | | | | | | | | | | | | |
| | | | | | | | |
| Total investments in securities (Cost $598,738,771) | | | 102.81 | % | | | 597,797,817 | |
| | |
Other assets and liabilities, net | | | (2.81 | ) | | | (16,329,502 | ) |
| | | | | | | | |
| Total net assets | | | 100.00 | % | | $ | 581,468,315 | |
| | | | | | | | |
| ± | Variable rate investment. The rate shown is the rate in effect at period end. |
| %% | The security is issued on a when-issued basis. |
| (a) | The security is fair valued in accordance with procedures approved by the Board of Trustees. |
| ±± | The coupon of the security is adjusted based on the principal and interest payments received from the underlying pool of mortgages as well as the credit quality and the actual prepayment speed of the underlying mortgages. |
| 144A | The security may be resold in transactions exempt from registration, normally to qualified institutional buyers, pursuant to Rule 144A under the Securities Act of 1933. |
| (l) | The issuer of the security is an affiliated person of the Fund as defined in the Investment Company Act of 1940. |
| (u) | The rate represents the7-day annualized yield at period end. |
| ## | All or a portion of this security is segregated for when-issued securities. |
Futures Contracts
| | | | | | | | | | | | | | | | | | | | | | | | |
| Description | | Number of
contracts | | | Expiration
date | | | Notional
cost | | | Notional
value | | | Unrealized
gains | | | Unrealized
losses | |
| | | | | | |
Long | | | | | | | | | | | | | | | | | | | | | | | | |
| | | | | | |
2-Year U.S. Treasury Notes | | | 595 | | | | 6-28-2019 | | | $ | 126,317,771 | | | $ | 126,256,211 | | | $ | 0 | | | $ | (61,560 | ) |
| | | | | | |
Short | | | | | | | | | | | | | | | | | | | | | | | | |
| | | | | | |
10-Year Ultra Futures | | | (73) | | | | 6-19-2019 | | | | (9,478,444 | ) | | | (9,450,078 | ) | | | 28,366 | | | | 0 | |
| | | | | | |
5-Year U.S. Treasury Notes | | | (552) | | | | 6-28-2019 | | | | (63,319,388 | ) | | | (63,238,500 | ) | | | 80,888 | | | | 0 | |
| | | | | | | | | | | | | | | | | | | | | | | | |
| | | | | | |
| | | | | | | | | | | | | | | | | | $ | 109,254 | | | $ | (61,560 | ) |
| | | | | | | | | | | | | | | | | | | | | | | | |
The accompanying notes are an integral part of these financial statements.
| | | | |
| 12 | | Wells Fargo Short Duration Government Bond Fund | | Portfolio of investments—February 28, 2019 (unaudited) |
Investments in Affiliates
An affiliated investment is an investment in which the Fund owns at least 5% of the outstanding voting shares of the issuer or as a result of other relationships, such as the Fund and the issuer having the same investment manager. Transactions with issuers that were either affiliated persons of the Fund at the beginning of the period or the end of the period were as follows:
| | | | | | | | | | | | | | | | | | | | | | | | | | | | | | | | | | | | |
| | | Shares,
beginning of
period | | | Shares
purchased | | | Shares sold | | | Shares,
end of
period | | | Net
realized
gains
(losses) | | | Net change in
unrealized
gains
(losses) | | | Income
from
affiliated
securities | | | Value,
end
of period | | | % of
net
assets | |
Short-Term Investments | | | | | | | | | | | | | | | | | | | | | | | | | | | | | | | | | | | | |
Investment Companies | | | | | | | | | | | | | | | | | | | | | | | | | | | | | | | | | | | | |
Wells Fargo Government Money Market Fund Select Class | | | 11,514,693 | | | | 339,258,662 | | | | 345,917,576 | | | | 4,855,779 | | | $ | 0 | | | $ | 0 | | | $ | 168,135 | | | $ | 4,855,779 | | | | 0.84 | % |
The accompanying notes are an integral part of these financial statements.
| | | | | | |
| Statement of assets and liabilities—February 28, 2019 (unaudited) | | Wells Fargo Short Duration Government Bond Fund | | | 13 | |
| | | | |
| | | | |
| |
Assets | | | | |
Investments in unaffiliated securities, at value (cost $593,882,992) | | $ | 592,942,038 | |
Investments in affiliated securities, at value (cost $4,855,779) | | | 4,855,779 | |
Segregated cash for future contracts | | | 503,746 | |
Receivable for investments sold | | | 95,748,558 | |
Principal paydown receivable | | | 24,395 | |
Receivable for Fund shares sold | | | 770,944 | |
Receivable for interest | | | 1,652,387 | |
Receivable for daily variation margin on open futures contracts | | | 110,452 | |
Prepaid expenses and other assets | | | 104,689 | |
| | | | |
Total assets | | | 696,712,988 | |
| | | | |
| |
Liabilities | | | | |
Payable for investments purchased | | | 113,863,688 | |
Payable for Fund shares redeemed | | | 956,850 | |
Management fee payable | | | 121,216 | |
Dividends payable | | | 61,794 | |
Payable for daily variation margin on open futures contracts | | | 60,427 | |
Administration fees payable | | | 37,033 | |
Distribution fee payable | | | 7,533 | |
Trustees’ fees and expenses payable | | | 2,702 | |
Accrued expenses and other liabilities | | | 133,430 | |
| | | | |
Total liabilities | | | 115,244,673 | |
| | | | |
Total net assets | | $ | 581,468,315 | |
| | | | |
| |
NET ASSETS CONSIST OF | | | | |
Paid-in capital | | $ | 662,819,036 | |
Total distributable loss | | | (81,350,721 | ) |
| | | | |
Total net assets | | $ | 581,468,315 | |
| | | | |
| |
COMPUTATION OF NET ASSET VALUE AND OFFERING PRICE PER SHARE | | | | |
Net assets – Class A | | $ | 31,728,058 | |
Shares outstanding – Class A1 | | | 3,306,814 | |
Net asset value per share – Class A | | | $9.59 | |
Maximum offering price per share – Class A2 | | | $9.79 | |
Net assets – Class C | | | $12,595,522 | |
Shares outstanding – Class C1 | | | 1,310,477 | |
Net asset value per share – Class C | | | $9.61 | |
Net assets – Class R6 | | | $37,696,040 | |
Shares outstanding – Class R61 | | | 3,914,002 | |
Net asset value per share – Class R6 | | | $9.63 | |
Net assets – Administrator Class | | | $56,251,840 | |
Shares outstanding – Administrator Class1 | | | 5,851,363 | |
Net asset value per share – Administrator Class | | | $9.61 | |
Net assets – Institutional Class | | | $443,196,855 | |
Shares outstanding – Institutional Class1 | | | 46,115,639 | |
Net asset value per share – Institutional Class | | | $9.61 | |
| 1 | The Fund has an unlimited number of authorized shares. |
| 2 | Maximum offering price is computed as 100/98 of net asset value. On investments of $50,000 or more, the offering price is reduced. |
The accompanying notes are an integral part of these financial statements.
| | | | |
| 14 | | Wells Fargo Short Duration Government Bond Fund | | Statement of operations—six months ended February 28, 2019 (unaudited) |
| | | | |
| | | | |
| |
Investment income | | | | |
Interest | | $ | 8,968,864 | |
Income from affiliated securities | | | 168,135 | |
| | | | |
Total investment income | | | 9,136,999 | |
| | | | |
| |
Expenses | | | | |
Management fee | | | 1,032,707 | |
Administration fees | | | | |
Class A | | | 23,363 | |
Class C | | | 11,285 | |
Class R6 | | | 5,271 | |
Administrator Class | | | 29,862 | |
Institutional Class | | | 180,777 | |
Shareholder servicing fees | | | | |
Class A | | | 36,505 | |
Class C | | | 17,633 | |
Administrator Class | | | 74,314 | |
Distribution fee | | | | |
Class C | | | 52,899 | |
Custody and accounting fees | | | 32,516 | |
Professional fees | | | 26,332 | |
Registration fees | | | 39,012 | |
Shareholder report expenses | | | 34,137 | |
Trustees’ fees and expenses | | | 10,728 | |
Other fees and expenses | | | 9,752 | |
| | | | |
Total expenses | | | 1,617,093 | |
Less: Fee waivers and/or expense reimbursements | | | (202,652 | ) |
| | | | |
Net expenses | | | 1,414,441 | |
| | | | |
Net investment income | | | 7,722,558 | |
| | | | |
| |
REALIZED AND UNREALIZED GAINS (LOSSES) ON INVESTMENTS | | | | |
| |
Net realized losses on: | | | | |
Unaffiliated securities | | | (2,622,056 | ) |
Futures contracts | | | (619,184 | ) |
| | | | |
Net realized losses on investments | | | (3,241,240 | ) |
| | | | |
| |
Net change in unrealized gains (losses) on: | | | | |
Unaffiliated securities | | | 3,244,007 | |
Futures contracts | | | 104,886 | |
| | | | |
Net change in unrealized gains (losses) on investments | | | 3,348,893 | |
| | | | |
Net realized and unrealized gains (losses) on investments | | | 107,653 | |
| | | | |
Net increase in net assets resulting from operations | | $ | 7,830,211 | |
| | | | |
The accompanying notes are an integral part of these financial statements.
| | | | | | |
| Statement of changes in net assets | | Wells Fargo Short Duration Government Bond Fund | | | 15 | |
| | | | | | | | | | | | | | | | |
| | | Six months ended
February 28, 2019 (unaudited) | | | Year ended
August 31, 20181 | |
| |
Operations | | | | | |
Net investment income | | | | | | $ | 7,722,558 | | | | | | | $ | 12,199,482 | |
Net realized losses on investments | | | | | | | (3,241,240 | ) | | | | | | | (11,314,289 | ) |
Net change in unrealized gains (losses) on investments | | | | | | | 3,348,893 | | | | | | | | (3,340,788 | ) |
| | | | |
Net increase (decrease) in net assets resulting from operations | | | | | | | 7,830,211 | | | | | | | | (2,455,595 | ) |
| | | | |
| |
Distributions to shareholders from net investment income and net realized gains | | | | | |
Class A | | | | | | | (380,637 | ) | | | | | | | (735,153 | ) |
Class C | | | | | | | (130,351 | ) | | | | | | | (217,568 | ) |
Class R6 | | | | | | | (529,365 | ) | | | | | | | (1,398,687 | ) |
Administrator Class | | | | | | | (828,835 | ) | | | | | | | (1,726,039 | ) |
Institutional Class | | | | | | | (6,662,406 | ) | | | | | | | (12,631,240 | ) |
| | | | |
Total distributions to shareholders | | | | | | | (8,531,594 | ) | | | | | | | (160,619,718 | ) |
| | | | |
| | | | |
Capital share transactions | | | Shares | | | | | | | | Shares | | | | | |
Proceeds from shares sold | | | | | | | | | | | | | | | | |
Class A | | | 447,299 | | | | 4,289,519 | | | | 376,228 | | | | 3,627,108 | |
Class C | | | 97,739 | | | | 937,540 | | | | 22,308 | | | | 218,154 | |
Class R6 | | | 908,516 | | | | 8,730,085 | | | | 2,144,288 | | | | 20,939,039 | |
Administrator Class | | | 153,572 | | | | 1,473,187 | | | | 395,318 | | | | 3,847,681 | |
Institutional Class | | | 6,451,931 | | | | 61,924,486 | | | | 13,527,957 | | | | 131,987,736 | |
| | | | |
| | | | | | | 77,354,817 | | | | | | | | 160,619,718 | |
| | | | |
Reinvestment of distributions | | | | | | | | | | | | | | | | |
Class A | | | 37,874 | | | | 362,912 | | | | 71,432 | | | | 692,759 | |
Class C | | | 12,466 | | | | 119,679 | | | | 20,781 | | | | 201,738 | |
Class R6 | | | 46,318 | | | | 445,590 | | | | 126,725 | | | | 1,239,028 | |
Administrator Class | | | 85,921 | | | | 824,753 | | | | 178,230 | | | | 1,730,952 | |
Institutional Class | | | 661,399 | | | | 6,348,799 | | | | 1,256,662 | | | | 12,199,437 | |
| | | | |
| | | | | | | 8,101,733 | | | | | | | | 16,063,914 | |
| | | | |
Payment for shares redeemed | | | | | | | | | | | | | | | | |
Class A | | | (358,697 | ) | | | (3,437,047 | ) | | | (2,532,682 | ) | | | (24,674,032 | ) |
Class C | | | (368,780 | ) | | | (3,542,155 | ) | | | (502,772 | ) | | | (4,888,594 | ) |
Class R6 | | | (721,260 | ) | | | (6,929,455 | ) | | | (15,996,524 | ) | | | (157,173,416 | ) |
Administrator Class | | | (1,871,973 | ) | | | (17,927,486 | ) | | | (2,179,946 | ) | | | (21,230,405 | ) |
Institutional Class | | | (12,294,938 | ) | | | (117,922,102 | ) | | | (22,222,211 | ) | | | (216,535,537 | ) |
| | | | |
| | | | | | | (149,758,245 | ) | | | | | | | (424,501,984 | ) |
| | | | |
Net decrease in net assets resulting from capital share transactions | | | | | | | (64,301,695 | ) | | | | | | | (247,818,352 | ) |
| | | | |
Total decrease in net assets | | | | | | | (65,003,078 | ) | | | | | | | (266,982,634 | ) |
| | | | |
| | | | |
Net assets | | | | | | | | | | | | | | | | |
Beginning of period | | | | | | | 646,471,393 | | | | | | | | 913,454,027 | |
| | | | |
End of period | | | | | | $ | 581,468,315 | | | | | | | $ | 646,471,393 | |
| | | | |
| 1 | Effective for all filings after November 4, 2018, the SEC prospectively eliminated the requirement to parenthetically disclose undistributed net investment income at the end of the period and permitted the aggregation of distributions, with the exception of tax basis returns of capital. Undistributed net investment income at August 31, 2018 was $480,677. The disaggregated distributions information for the year ended August 31, 2018 is included in Note 8,Distributions to Shareholders, in the notes to the financial statements. |
The accompanying notes are an integral part of these financial statements.
| | | | |
| 16 | | Wells Fargo Short Duration Government Bond Fund | | Financial highlights |
(For a share outstanding throughout each period)
| | | | | | | | | | | | | | | | | | | | | | | | |
| | | Six months ended
February 28, 2019 (unaudited) | | | Year ended August 31 | |
| CLASS A | | 2018 | | | 2017 | | | 2016 | | | 2015 | | | 2014 | |
Net asset value, beginning of period | | | $9.60 | | | | $9.85 | | | | $9.96 | | | | $10.02 | | | | $10.08 | | | | $10.09 | |
Net investment income | | | 0.11 | | | | 0.14 | | | | 0.07 | | | | 0.07 | | | | 0.04 | | | | 0.03 | |
Net realized and unrealized gains (losses) on investments | | | 0.00 | 1 | | | (0.20 | ) | | | (0.03 | ) | | | 0.02 | | | | 0.02 | | | | 0.07 | |
| | | | | | | | | | | | | | | | | | | | | | | | |
Total from investment operations | | | 0.11 | | | | (0.06 | ) | | | 0.04 | | | | 0.09 | | | | 0.06 | | | | 0.10 | |
Distributions to shareholders from | | | | | | | | | | | | | | | | | | | | | | | | |
Net investment income | | | (0.12 | ) | | | (0.19 | ) | | | (0.15 | ) | | | (0.15 | ) | | | (0.12 | ) | | | (0.11 | ) |
Net asset value, end of period | | | $9.59 | | | | $9.60 | | | | $9.85 | | | | $9.96 | | | | $10.02 | | | | $10.08 | |
Total return2 | | | 1.19 | % | | | (0.56 | )% | | | 0.45 | % | | | 0.90 | % | | | 0.55 | % | | | 1.03 | % |
Ratios to average net assets (annualized) | | | | | | | | | | | | | | | | | | | | | | | | |
Gross expenses | | | 0.81 | % | | | 0.80 | % | | | 0.79 | % | | | 0.78 | % | | | 0.78 | % | | | 0.80 | % |
Net expenses | | | 0.78 | % | | | 0.78 | % | | | 0.78 | % | | | 0.78 | % | | | 0.78 | % | | | 0.78 | % |
Net investment income | | | 2.34 | % | | | 1.36 | % | | | 0.79 | % | | | 0.70 | % | | | 0.55 | % | | | 0.38 | % |
Supplemental data | | | | | | | | | | | | | | | | | | | | | | | | |
Portfolio turnover rate | | | 317 | % | | | 331 | % | | | 348 | % | | | 284 | % | | | 500 | % | | | 408 | % |
Net assets, end of period (000s omitted) | | | $31,728 | | | | $30,538 | | | | $51,890 | | | | $57,976 | | | | $62,504 | | | | $107,005 | |
| 1 | Amount is less than $0.005. |
| 2 | Total return calculations do not include any sales charges. Returns for periods of less than one year are not annualized. |
The accompanying notes are an integral part of these financial statements.
| | | | | | |
| Financial highlights | | Wells Fargo Short Duration Government Bond Fund | | | 17 | |
(For a share outstanding throughout each period)
| | | | | | | | | | | | | | | | | | | | | | | | |
| | | Six months ended
February 28, 2019 (unaudited) | | | Year ended August 31 | |
| CLASS C | | 2018 | | | 2017 | | | 2016 | | | 2015 | | | 2014 | |
Net asset value, beginning of period | | | $9.62 | | | | $9.87 | | | | $9.98 | | | | $10.03 | | | | $10.10 | | | | $10.11 | |
Net investment income (loss) | | | 0.07 | | | | 0.06 | 1 | | | (0.00 | )1,2 | | | (0.01 | ) | | | (0.03 | ) | | | (0.05 | ) |
Net realized and unrealized gains (losses) on investments | | | 0.01 | | | | (0.19 | ) | | | (0.03 | ) | | | 0.03 | | | | 0.00 | 2 | | | 0.08 | |
| | | | | | | | | | | | | | | | | | | | | | | | |
Total from investment operations | | | 0.08 | | | | (0.13 | ) | | | (0.03 | ) | | | 0.02 | | | | (0.03 | ) | | | 0.03 | |
Distributions to shareholders from | | | | | | | | | | | | | | | | | | | | | | | | |
Net investment income | | | (0.09 | ) | | | (0.12 | ) | | | (0.08 | ) | | | (0.07 | ) | | | (0.04 | ) | | | (0.04 | ) |
Net asset value, end of period | | | $9.61 | | | | $9.62 | | | | $9.87 | | | | $9.98 | | | | $10.03 | | | | $10.10 | |
Total return3 | | | 0.81 | % | | | (1.30 | )% | | | (0.30 | )% | | | 0.25 | % | | | (0.30 | )% | | | 0.28 | % |
Ratios to average net assets (annualized) | | | | | | | | | | | | | | | | | | | | | | | | |
Gross expenses | | | 1.56 | % | | | 1.55 | % | | | 1.54 | % | | | 1.53 | % | | | 1.53 | % | | | 1.55 | % |
Net expenses | | | 1.53 | % | | | 1.53 | % | | | 1.53 | % | | | 1.53 | % | | | 1.53 | % | | | 1.53 | % |
Net investment income (loss) | | | 1.57 | % | | | 0.62 | % | | | 0.04 | % | | | (0.05 | )% | | | (0.20 | )% | | | (0.37 | )% |
Supplemental data | | | | | | | | | | | | | | | | | | | | | | | | |
Portfolio turnover rate | | | 317 | % | | | 331 | % | | | 348 | % | | | 284 | % | | | 500 | % | | | 408 | % |
Net assets, end of period (000s omitted) | | | $12,596 | | | | $15,093 | | | | $20,026 | | | | $27,454 | | | | $31,910 | | | | $44,423 | |
| 1 | Calculated based upon average shares outstanding |
| 2 | Amount is more than $(0.005). |
| 3 | Total return calculations do not include any sales charges. Returns for periods of less than one year are not annualized. |
The accompanying notes are an integral part of these financial statements.
| | | | |
| 18 | | Wells Fargo Short Duration Government Bond Fund | | Financial highlights |
(For a share outstanding throughout each period)
| | | | | | | | | | | | | | | | | | | | | | | | |
| | | Six months ended February 28, 2019 (unaudited) | | | Year ended August 31 | |
| CLASS R6 | | 2018 | | | 2017 | | | 2016 | | | 2015 | | | 2014 | |
Net asset value, beginning of period | | | $9.64 | | | | $9.89 | | | | $9.99 | | | | $10.05 | | | | $10.11 | | | | $10.13 | |
Net investment income | | | 0.13 | | | | 0.16 | 1 | | | 0.12 | 1 | | | 0.12 | | | | 0.09 | 1 | | | 0.08 | 1 |
Net realized and unrealized gains (losses) on investments | | | 0.00 | 2 | | | (0.17 | ) | | | (0.02 | ) | | | 0.01 | | | | 0.01 | | | | 0.05 | |
| | | | | | | | | | | | | | | | | | | | | | | | |
Total from investment operations | | | 0.13 | | | | (0.01 | ) | | | 0.10 | | | | 0.13 | | | | 0.10 | | | | 0.13 | |
Distributions to shareholders from | | | | | | | | | | | | | | | | | | | | | | | | |
Net investment income | | | (0.14 | ) | | | (0.24 | ) | | | (0.20 | ) | | | (0.19 | ) | | | (0.16 | ) | | | (0.15 | ) |
Net asset value, end of period | | | $9.63 | | | | $9.64 | | | | $9.89 | | | | $9.99 | | | | $10.05 | | | | $10.11 | |
Total return2 | | | 1.39 | % | | | (0.14 | )% | | | 0.96 | % | | | 1.32 | % | | | 0.96 | % | | | 1.35 | % |
Ratios to average net assets (annualized) | | | | | | | | | | | | | | | | | | | | | | | | |
Gross expenses | | | 0.43 | % | | | 0.42 | % | | | 0.41 | % | | | 0.40 | % | | | 0.40 | % | | | 0.41 | % |
Net expenses | | | 0.37 | % | | | 0.37 | % | | | 0.37 | % | | | 0.37 | % | | | 0.37 | % | | | 0.37 | % |
Net investment income | | | 2.74 | % | | | 1.64 | % | | | 1.19 | % | | | 1.11 | % | | | 0.88 | % | | | 0.76 | % |
Supplemental data | | | | | | | | | | | | | | | | | | | | | | | | |
Portfolio turnover rate | | | 317 | % | | | 331 | % | | | 348 | % | | | 284 | % | | | 500 | % | | | 408 | % |
Net assets, end of period (000s omitted) | | | $37,696 | | | | $35,472 | | | | $172,106 | | | | $233,993 | | | | $231,878 | | | | $48,446 | |
| 1 | Calculated based upon average shares outstanding |
| 2 | Amount is less than $0.005. |
| 3 | Returns for periods of less than one year are not annualized. |
The accompanying notes are an integral part of these financial statements.
| | | | | | |
| Financial highlights | | Wells Fargo Short Duration Government Bond Fund | | | 19 | |
(For a share outstanding throughout each period)
| | | | | | | | | | | | | | | | | | | | | | | | |
| | | Six months ended February 28, 2019 (unaudited) | | | Year ended August 31 | |
| ADMINISTRATOR CLASS | | 2018 | | | 2017 | | | 2016 | | | 2015 | | | 2014 | |
Net asset value, beginning of period | | | $9.62 | | | | $9.87 | | | | $9.98 | | | | $10.03 | | | | $10.10 | | | | $10.11 | |
Net investment income | | | 0.12 | 1 | | | 0.15 | 1 | | | 0.08 | | | | 0.08 | | | | 0.06 | | | | 0.06 | 1 |
Net realized and unrealized gains (losses) on investments | | | 0.00 | 2 | | | (0.19 | ) | | | (0.02 | ) | | | 0.04 | | | | 0.00 | 2 | | | 0.06 | |
| | | | | | | | | | | | | | | | | | | | | | | | |
Total from investment operations | | | 0.12 | | | | (0.04 | ) | | | 0.06 | | | | 0.12 | | | | 0.06 | | | | 0.12 | |
Distributions to shareholders from | | | | | | | | | | | | | | | | | | | | | | | | |
Net investment income | | | (0.13 | ) | | | (0.21 | ) | | | (0.17 | ) | | | (0.17 | ) | | | (0.13 | ) | | | (0.13 | ) |
Net asset value, end of period | | | $9.61 | | | | $9.62 | | | | $9.87 | | | | $9.98 | | | | $10.03 | | | | $10.10 | |
Total return3 | | | 1.28 | % | | | (0.37 | )% | | | 0.63 | % | | | 1.18 | % | | | 0.63 | % | | | 1.21 | % |
Ratios to average net assets (annualized) | | | | | | | | | | | | | | | | | | | | | | | | |
Gross expenses | | | 0.75 | % | | | 0.74 | % | | | 0.73 | % | | | 0.72 | % | | | 0.72 | % | | | 0.74 | % |
Net expenses | | | 0.60 | % | | | 0.60 | % | | | 0.60 | % | | | 0.60 | % | | | 0.60 | % | | | 0.60 | % |
Net investment income | | | 2.49 | % | | | 1.56 | % | | | 0.96 | % | | | 0.87 | % | | | 0.73 | % | | | 0.56 | % |
Supplemental data | | | | | | | | | | | | | | | | | | | | | | | | |
Portfolio turnover rate | | | 317 | % | | | 331 | % | | | 348 | % | | | 284 | % | | | 500 | % | | | 408 | % |
Net assets, end of period (000s omitted) | | | $56,252 | | | | $71,997 | | | | $89,743 | | | | $121,576 | | | | $156,669 | | | | $191,469 | |
| 1 | Calculated based upon average shares outstanding |
| 2 | Amount is less than $0.005. |
| 3 | Returns for periods of less than one year are not annualized. |
The accompanying notes are an integral part of these financial statements.
| | | | |
| 20 | | Wells Fargo Short Duration Government Bond Fund | | Financial highlights |
(For a share outstanding throughout each period)
| | | | | | | | | | | | | | | | | | | | | | | | |
| | | Six months ended February 28, 2019 (unaudited) | | | Year ended August 31 | |
| INSTITUTIONAL CLASS | | 2018 | | | 2017 | | | 2016 | | | 2015 | | | 2014 | |
Net asset value, beginning of period | | | $9.62 | | | | $9.87 | | | | $9.98 | | | | $10.03 | | | | $10.10 | | | | $10.10 | |
Net investment income | | | 0.13 | | | | 0.17 | | | | 0.11 | | | | 0.11 | | | | 0.09 | 1 | | | 0.07 | |
Net realized and unrealized gains (losses) on investments | | | 0.00 | 2 | | | (0.19 | ) | | | (0.03 | ) | | | 0.03 | | | | (0.01 | ) | | | 0.08 | |
| | | | | | | | | | | | | | | | | | | | | | | | |
Total from investment operations | | | 0.13 | | | | (0.02 | ) | | | 0.08 | | | | 0.14 | | | | 0.08 | | | | 0.15 | |
Distributions to shareholders from | | | | | | | | | | | | | | | | | | | | | | | | |
Net investment income | | | (0.14 | ) | | | (0.23 | ) | | | (0.19 | ) | | | (0.19 | ) | | | (0.15 | ) | | | (0.15 | ) |
Net asset value, end of period | | | $9.61 | | | | $9.62 | | | | $9.87 | | | | $9.98 | | | | $10.03 | | | | $10.10 | |
Total return3 | | | 1.37 | % | | | (0.20 | )% | | | 0.81 | % | | | 1.37 | % | | | 0.81 | % | | | 1.50 | % |
Ratios to average net assets (annualized) | | | | | | | | | | | | | | | | | | | | | | | | |
Gross expenses | | | 0.48 | % | | | 0.47 | % | | | 0.46 | % | | | 0.45 | % | | | 0.45 | % | | | 0.47 | % |
Net expenses | | | 0.42 | % | | | 0.42 | % | | | 0.42 | % | | | 0.42 | % | | | 0.42 | % | | | 0.42 | % |
Net investment income | | | 2.67 | % | | | 1.75 | % | | | 1.15 | % | | | 1.06 | % | | | 0.92 | % | | | 0.74 | % |
Supplemental data | | | | | | | | | | | | | | | | | | | | | | | | |
Portfolio turnover rate | | | 317 | % | | | 331 | % | | | 348 | % | | | 284 | % | | | 500 | % | | | 408 | % |
Net assets, end of period (000s omitted) | | | $443,197 | | | | $493,372 | | | | $579,690 | | | | $664,047 | | | | $587,835 | | | | $903,096 | |
| 1 | Calculated based upon average shares outstanding |
| 2 | Amount is less than $0.005. |
| 3 | Returns for periods of less than one year are not annualized. |
The accompanying notes are an integral part of these financial statements.
| | | | | | |
| Notes to financial statements (unaudited) | | Wells Fargo Short Duration Government Bond Fund | | | 21 | |
1. ORGANIZATION
Wells Fargo Funds Trust (the “Trust”), a Delaware statutory trust organized on March 10, 1999, is anopen-end management investment company registered under the Investment Company Act of 1940, as amended (the “1940 Act”). As an investment company, the Trust follows the accounting and reporting guidance in Financial Accounting Standards Board (“FASB”)Accounting Standards Codification Topic 946, Financial Services – Investment Companies. These financial statements report on the Wells Fargo Short Duration Government Bond Fund (the “Fund”) which is a diversified series of the Trust.
2. SIGNIFICANT ACCOUNTING POLICIES
The following significant accounting policies, which are consistently followed in the preparation of the financial statements of the Fund, are in conformity with U.S. generally accepted accounting principles which require management to make estimates and assumptions that affect the reported amounts of assets and liabilities, disclosure of contingent assets and liabilities at the date of the financial statements, and the reported amounts of revenues and expenses during the reporting period. Actual results could differ from those estimates.
Securities valuation
All investments are valued each business day as of the close of regular trading on the New York Stock Exchange (generally 4 p.m. Eastern Time), although the Fund may deviate from this calculation time under unusual or unexpected circumstances.
Debt securities are valued at the evaluated bid price provided by an independent pricing service service (e.g. taking into account various factors, including yields, maturities, or credit ratings) or, if a reliable price is not available, the quoted bid price from an independent broker-dealer.
Futures contracts that are listed on a foreign or domestic exchange or market are valued at the official closing price or, if none, the last sales price.
Investments in registeredopen-end investment companies are valued at net asset value.
Investments which are not valued using any of the methods discussed above are valued at their fair value, as determined in good faith by the Board of Trustees of the Fund. The Board of Trustees has established a Valuation Committee comprised of the Trustees and has delegated to it the authority to take any actions regarding the valuation of portfolio securities that the Valuation Committee deems necessary or appropriate, including determining the fair value of portfolio securities, unless the determination has been delegated to the Wells Fargo Asset Management Pricing Committee at Wells Fargo Funds Management, LLC (“Funds Management”). The Board of Trustees retains the authority to make or ratify any valuation decisions or approve any changes to the Valuation Procedures as it deems appropriate. On a quarterly basis, the Board of Trustees receives reports on any valuation actions taken by the Valuation Committee or the Wells Fargo Asset Management Pricing Committee which may include items for ratification.
When-issued transactions
The Fund may purchase securities on a forward commitment or when-issued basis. The Fund records a when-issued transaction on the trade date and will segregate assets in an amount at least equal in value to the Fund’s commitment to purchase when-issued securities. Securities purchased on a when-issued basis aremarked-to-market daily and the Fund begins earning interest on the settlement date. Losses may arise due to changes in the market value of the underlying securities or if the counterparty does not perform under the contract.
Futures contracts
The Fund is subject to interest rate risk in the normal course of pursuing its investment objectives. Futures contracts are agreements between the Fund and a counterparty to buy or sell a specific amount of a commodity, financial instrument or currency at specified price and on a specified date. The Fund may buy and sell futures contracts in order to gain exposure to, or protect against, changes in interest rates. The primary risks associated with the use of futures contracts are the imperfect correlation between changes in market values of securities held by the Fund and the prices of futures contracts, and the possibility of an illiquid market. Futures contracts are generally entered into on a regulated futures exchange and cleared through a clearinghouse associated with the exchange. With futures contracts, there is minimal counterparty risk to the Fund since futures contracts are exchange traded and the exchange’s clearinghouse, as counterparty to all exchange traded futures, guarantees the futures contracts against default.
Upon entering into a futures contracts, the Fund is required to deposit either cash or securities (initial margin) with the broker in an amount equal to a certain percentage of the contract value. Subsequent payments (variation margin) are
| | | | |
| 22 | | Wells Fargo Short Duration Government Bond Fund | | Notes to financial statements (unaudited) |
paid to or from the broker each day equal to the daily changes in the contract value. Such payments are recorded as unrealized gains or losses and, if any, shown as variation margin receivable (payable) in the Statement of Assets and Liabilities. Should the Fund fail to make requested variation margin payments, the broker can gain access to the initial margin to satisfy the Fund’s payment obligations. When the contracts are closed, a realized gain or loss is recorded in the Statement of Operations.
Security transactions and income recognition
Securities transactions are recorded on a trade date basis. Realized gains or losses are recorded on the basis of identified cost.
Interest income is accrued daily and bond discounts are accreted and premiums are amortized daily. To the extent debt obligations are placed onnon-accrual status, any related interest income may be reduced by writing off interest receivables when the collection of all or a portion of interest has been determined to be doubtful based on consistently applied procedures and the fair value has decreased. If the issuer subsequently resumes interest payments or when the collectability of interest is reasonably assured, the debt obligation is removed fromnon-accrual status.
Distributions to shareholders
Distributions to shareholders from net investment income are declared daily and paid monthly. Distributions from net realized gains, if any, are recorded on theex-dividend date and paid at least annually. Such distributions are determined in accordance with income tax regulations and may differ from U.S. generally accepted accounting principles. Dividend sources are estimated at the time of declaration. The tax character of distributions is determined as of the Fund’s fiscal year end. Therefore, a portion of the Fund’s distributions made prior to the Fund’s fiscal year end may be categorized as a tax return of capital at year end.
Federal and other taxes
The Fund intends to continue to qualify as a regulated investment company by distributing substantially all of its investment company taxable income and any net realized capital gains (after reduction for capital loss carryforwards) sufficient to relieve it from all, or substantially all, federal income taxes. Accordingly, no provision for federal income taxes was required.
The Fund’s income and federal excise tax returns and all financial records supporting those returns for the prior three fiscal years are subject to examination by the federal and Delaware revenue authorities. Management has analyzed the Fund’s tax positions taken on federal, state, and foreign tax returns for all open tax years and does not believe that there are any uncertain tax positions that require recognition of a tax liability.
As of February 28, 2019 the aggregate cost of all investments for federal income tax purposes was $598,571,973 and the unrealized gains (losses) consisted of:
| | | | |
| |
Gross unrealized gains | | $ | 1,317,966 | |
| |
Gross unrealized losses | | | (2,044,428 | ) |
| |
Net unrealized losses | | $ | (726,462 | ) |
As of August 31, 2018, the Fund had capital loss carryforwards which consisted of $44,623,890 in short-term capital losses and $32,137,541 in long-term capital losses.
Class allocations
The separate classes of shares offered by the Fund differ principally in applicable sales charges, distribution, shareholder servicing, and administration fees. Class specific expenses are charged directly to that share class. Investment income, common expenses, and realized and unrealized gains (losses) on investments are allocated daily to each class of shares based on the relative proportion of net assets of each class.
3. FAIR VALUATION MEASUREMENTS
Fair value measurements of investments are determined within a framework that has established a fair value hierarchy based upon the various data inputs utilized in determining the value of the Fund’s investments. The three-level hierarchy gives the highest priority to unadjusted quoted prices in active markets for identical assets or liabilities (Level 1) and the
| | | | | | |
| Notes to financial statements (unaudited) | | Wells Fargo Short Duration Government Bond Fund | | | 23 | |
lowest priority to unobservable inputs (Level 3). The Fund’s investments are classified within the fair value hierarchy based on the lowest level of input that is significant to the fair value measurement. The inputs are summarized into three broad levels as follows:
| ∎ | | Level 1 – quoted prices in active markets for identical securities |
| ∎ | | Level 2 – other significant observable inputs (including quoted prices for similar securities, interest rates, prepayment speeds, credit risk, etc.) |
| ∎ | | Level 3 – significant unobservable inputs (including the Fund’s own assumptions in determining the fair value of investments) |
The inputs or methodologies used for valuing investments in securities are not necessarily an indication of the risk associated with investing in those securities.
The following is a summary of the inputs used in valuing the Fund’s assets and liabilities as of February 28, 2019:
| | | | | | | | | | | | | | | | |
| | | | |
| | | Quoted prices (Level 1) | | | Other significant
observable inputs
(Level 2) | | | Significant
unobservable inputs (Level 3) | | | Total | |
| | | | |
Assets | | | | | | | | | | | | | | | | |
Investments in: | | | | | | | | | | | | | | | | |
| | | | |
Agency securities | | $ | 0 | | | $ | 250,948,199 | | | $ | 0 | | | $ | 250,948,199 | |
| | | | |
Asset-backed securities | | | 0 | | | | 85,094,953 | | | | 0 | | | | 85,094,953 | |
| | | | |
Non-agency mortgage-backed securities | | | 0 | | | | 22,555,184 | | | | 0 | | | | 22,555,184 | |
| | | | |
U.S. Treasury securities | | | 234,343,702 | | | | 0 | | | | 0 | | | | 234,343,702 | |
| | | | |
Short-term investments | | | | | | | | | | | | | | | | |
| | | | |
Investment companies | | | 4,855,779 | | | | 0 | | | | 0 | | | | 4,855,779 | |
| | | | |
| | | 239,199,481 | | | | 358,598,336 | | | | 0 | | | | 597,797,817 | |
| | | | |
Futures contracts | | | 109,254 | | | | 0 | | | | 0 | | | | 109,254 | |
| | | | |
Total assets | | $ | 239,308,735 | | | $ | 358,598,336 | | | $ | 0 | | | $ | 597,907,071 | |
| | | | |
Liabilities | | | | | | | | | | | | | | | | |
| | | | |
Futures contracts | | $ | 61,560 | | | $ | 0 | | | $ | 0 | | | $ | 61,560 | |
| | | | |
Total liabilities | | $ | 61,560 | | | $ | 0 | | | $ | 0 | | | $ | 61,560 | |
Additional sector, industry or geographic detail is included in the Portfolio of Investments.
Futures contracts are reported at their cumulative unrealized gains (losses) at measurement date as reported in the table following the Portfolio of Investments. For futures contracts, the current day’s variation margin is reported on the Statement of Assets and Liabilities. All other assets and liabilities are reported at their market value at measurement date.
At February 28, 2019, the Fund did not have any transfers into/out of Level 3.
4. TRANSACTIONS WITH AFFILIATES
Management fee
Funds Management, an indirect wholly owned subsidiary of Wells Fargo & Company (“Wells Fargo”), is the manager of the Fund and provides advisory and fund-level administrative services under an investment management agreement. Under the investment management agreement, Funds Management is responsible for, among other services, implementing the investment objectives and strategies of the Fund, supervising the subadviser and providing fund-level administrative services in connection with the Fund’s operations. As compensation for its services under the investment management agreement, Funds Management is entitled to receive a management fee at the following annual rate based on the Fund’s average daily net assets:
| | |
| Average daily net assets | | Annual fee rate |
| |
First $1 billion | | 0.350% |
| |
Next $4 billion | | 0.325 |
| |
Next $3 billion | | 0.290 |
| |
Next $2 billion | | 0.265 |
| |
Over $10 billion | | 0.255 |
| | | | |
| 24 | | Wells Fargo Short Duration Government Bond Fund | | Notes to financial statements (unaudited) |
For the six months ended February 28, 2019, the management fee was equivalent to an annual rate of 0.35% of the Fund’s average daily net assets.
Administration fees
Under a class-level administration agreement, Funds Management provides class-level administrative services to the Fund, which includes paying fees and expenses for services provided by the transfer agent,sub-transfer agents, omnibus account servicers and record-keepers. As compensation for its services under the class-level administration agreement, Funds Management receives an annual fee which is calculated based on the average daily net assets of each class as follows:
| | | | |
| | | Class-level
administration fee | |
| |
Class A, Class C | | | 0.16 | % |
| |
Class R6 | | | 0.03 | |
| |
Administrator Class | | | 0.10 | |
| |
Institutional Class | | | 0.08 | |
Funds Management has contractually waived and/or reimbursed management and administration fees to the extent necessary to maintain certain net operating expense ratios for the Fund. When each class of the Fund has exceeded its expense cap, Funds Management has waived fees and/or reimbursed expenses from fund level expenses on a proportionate basis and then from class specific expenses. When only certain classes exceed their expense caps, waivers and/or reimbursements are applied against class specific expenses before fund level expenses. Funds Management has committed through December 31, 2019 to waive fees and/or reimburse expenses to the extent necessary to cap the Fund’s expenses at 0.78% for Class A shares, 1.53% for Class C shares, 0.37% for Class R6 shares, 0.60% for Administrator Class shares, and 0.42% for Institutional Class shares. Prior to or after the commitment expiration date, the cap may be increased or the commitment to maintain the cap may be terminated only with the approval of the Board of Trustees.
Distribution fee
The Trust has adopted a distribution plan for Class C shares of the Fund pursuant to Rule12b-1 under the 1940 Act. A distribution fee is charged to Class C shares and paid to Wells Fargo Funds Distributor, LLC (“Funds Distributor”), the principal underwriter, at an annual rate of 0.75% of the average daily net assets of Class C shares.
In addition, Funds Distributor is entitled to receive thefront-end sales charge from the purchase of Class A shares and a contingent deferred sales charge on the redemption of certain Class A shares. Funds Distributor is also entitled to receive the contingent deferred sales charges from redemptions of Class C shares. For the six months ended February 28, 2019, Funds Distributor received $247 from the sale of Class A shares. No contingent deferred sales charges were incurred by Class A and Class C shares for the six months ended February 28, 2019.
Shareholder servicing fees
The Trust has entered into contracts with one or more shareholder servicing agents, whereby Class A, Class C, and Administrator Class of the Fund are charged a fee at an annual rate of 0.25% of the average daily net assets of each respective class. A portion of these total shareholder servicing fees were paid to affiliates of Wells Fargo.
Interfund transactions
The Fund may purchase or sell portfolio investment securities to certain other Wells Fargo affiliates pursuant to Rule17a-7 under the 1940 Act and under procedures adopted by the Board of Trustees. The procedures have been designed to ensure that these interfund transactions, which do not incur broker commissions, are effected at current market prices.
5. INVESTMENT PORTFOLIO TRANSACTIONS
Purchases and sales of investments, excluding short-term securities, for the six months ended February 28, 2019 were as follows:
| | | | | | |
Purchases at cost | | Sales proceeds |
U.S.
government | | Non-U.S.
government | | U.S.
government | | Non-U.S.
government |
| $1,892,215,510 | | $45,321,211 | | $1,917,500,548 | | $46,216,198 |
| | | | | | |
| Notes to financial statements (unaudited) | | Wells Fargo Short Duration Government Bond Fund | | | 25 | |
6. DERIVATIVE TRANSACTIONS
During the six months ended February 28, 2019, the Fund entered into futures contracts to speculate on interest rates and to help manage the duration of the portfolio. The Fund had an average notional amount of $142,510,771 in long futures contracts and $80,244,775 in short futures contracts during the six months ended February 28, 2019.
7. BANK BORROWINGS
The Trust (excluding the money market funds), Wells Fargo Master Trust and Wells Fargo Variable Trust are parties to a $280,000,000 revolving credit agreement whereby the Fund is permitted to use bank borrowings for temporary or emergency purposes, such as to fund shareholder redemption requests. Interest under the credit agreement is charged to the Fund based on a borrowing rate equal to the higher of the Federal Funds rate in effect on that day plus 1.25% or the overnight LIBOR rate in effect on that day plus 1.25%. In addition, an annual commitment fee equal to 0.25% of the unused balance is allocated to each participating fund.
For the six months ended February 28, 2019, there were no borrowings by the Fund under the agreement.
8. DISTRIBUTIONS TO SHAREHOLDERS
Effective for all filings after November 4, 2018, the Securities and Exchange Commission eliminated the requirement to separately state the components of distributions to shareholders under U.S. generally accepted accounting principles. The amounts of distributions to shareholders for the year ended August 31, 2018 were as follows:
| | | | |
| | | Net investment
income | |
| |
Class A | | $ | 735,153 | |
| |
Class C | | | 217,568 | |
| |
Class R6 | | | 1,398,687 | |
| |
Administrator Class | | | 1,726,039 | |
| |
Institutional Class | | | 12,631,240 | |
9. INDEMNIFICATION
Under the Trust’s organizational documents, the officers and Trustees have been granted certain indemnification rights against certain liabilities that may arise out of performance of their duties to the Trust. Additionally, in the normal course of business, the Trust may enter into contracts with service providers that contain a variety of indemnification clauses. The Trust’s maximum exposure under these arrangements is dependent on future claims that may be made against the Fund and, therefore, cannot be estimated.
10. NEW ACCOUNTING PRONOUNCEMENTS
In August 2018, FASB issued Accounting Standards Update (“ASU”)No. 2018-13, Fair Value Measurement (Topic 820)Disclosure Framework—Changes to the Disclosure Requirements for Fair Value Measurement. ASU2018-13 updates the disclosure requirements for fair value measurements by modifying or removing certain disclosures and adding certain new disclosures. The amendments are effective for fiscal years, and interim periods within those fiscal years, beginning after December 15, 2019. Early adoption is permitted. Management has adopted the removal and modification of disclosures early, as permitted, and will adopt the additional new disclosures at the effective date.
In March 2017, FASB issued ASUNo. 2017-08, Premium Amortization on Purchased Callable Debt Securities. ASU2017-08 shortens the amortization period for certain callable debt securities held at a premium. The amendments require the premium to be amortized to the earliest call date. The amendments do not require an accounting change for securities held at a discount; the discount continues to be amortized to maturity. ASU2017-08 is effective for fiscal years beginning after December 15, 2018 and for interim periods within those fiscal years . Management is currently evaluating the potential impact of this new guidance to the financial statements.
| | | | |
| 26 | | Wells Fargo Short Duration Government Bond Fund | | Other information (unaudited) |
PROXY VOTING INFORMATION
A description of the policies and procedures used to determine how to vote proxies relating to portfolio securities is available, upon request, by calling1-800-222-8222, visiting our website atwfam.com, or visiting the SEC website at sec.gov. Information regarding how the Fund voted proxies relating to portfolio securities during the most recent12-month period ended June 30 is available on the Fund’s website atwfam.comor by visiting the SEC website at sec.gov.
PORTFOLIO HOLDINGS INFORMATION
The complete portfolio holdings for the Fund are publicly available monthly on the Fund’s website (wfam.com), on aone-month delayed basis. In addition, top ten holdings information (excluding derivative positions) for the Fund is publicly available on the Fund’s website on a monthly,seven-day or more delayed basis. The Fund files its complete schedule of portfolio holdings with the SEC for the first and third quarters of each fiscal year on FormN-Q, which is available by visiting the SEC website at sec.gov. In addition, the Fund’s FormN-Q may be reviewed and copied at the SEC’s Public Reference Room in Washington, DC, and at regional offices in New York City, at 233 Broadway, and in Chicago, at 175 West Jackson Boulevard, Suite 900. Information about the Public Reference Room may be obtained by calling1-800-SEC-0330.
| | | | | | |
| Other information (unaudited) | | Wells Fargo Short Duration Government Bond Fund | | | 27 | |
BOARD OF TRUSTEES AND OFFICERS
Each of the Trustees and Officers1 listed in the table below acts in identical capacities for each fund in the Wells Fargo family of funds, which consists of 152 mutual funds comprising the Wells Fargo Funds Trust, Wells Fargo Variable Trust, Wells Fargo Master Trust and fourclosed-end funds (collectively the “Fund Complex”). This table should be read in conjunction with the Prospectus and the Statement of Additional Information2. The mailing address of each Trustee and Officer is 525 Market Street, 12th Floor, San Francisco, CA 94105. Each Trustee and Officer serves an indefinite term, however, each Trustee serves such term until reaching the mandatory retirement age established by the Trustees.
Independent Trustees
| | | | | | |
Name and
year of birth | | Position held and
length of service* | | Principal occupations during past five years or longer | | Current other
public company or
investment company
directorships |
| | | |
William R. Ebsworth (Born 1957) | | Trustee, since 2015 | | Retired. From 1984 to 2013, equities analyst, portfolio manager, research director and chief investment officer at Fidelity Management and Research Company in Boston, Tokyo, and Hong Kong, and retired in 2013 as Chief Investment Officer of Fidelity Strategic Advisers, Inc. where he led a team of investment professionals managing client assets. Prior thereto, Board member of Hong Kong Securities Clearing Co., Hong Kong Options Clearing Corp., the Thailand International Fund, Ltd., Fidelity Investments Life Insurance Company, and Empire Fidelity Investments Life Insurance Company. Board member of the Vincent Memorial Hospital Endowment(non-profit organization), where he serves on the Investment Committee and as a Chair of the Audit Committee. Mr. Ebsworth is a CFA® charterholder. | | N/A |
| | | |
Jane A. Freeman (Born 1953) | | Trustee, since 2015; Chair Liaison, since 2018 | | Retired. From 2012 to 2014 and 1999 to 2008, Chief Financial Officer of Scientific Learning Corporation. From 2008 to 2012, Ms. Freeman provided consulting services related to strategic business projects. Prior to 1999, Portfolio Manager at Rockefeller & Co. and Scudder, Stevens & Clark. Board member of the Harding Loevner Funds from 1996 to 2014, serving as both Lead Independent Director and chair of the Audit Committee. Board member of the Russell Exchange Traded Funds Trust from 2011 to 2012 and the chair of the Audit Committee. Ms. Freeman is a Board Member of The Ruth Bancroft Garden(non-profit organization). She is also an inactive Chartered Financial Analyst. | | N/A |
| | | |
Isaiah Harris, Jr.3 (Born 1952) | | Trustee, since 2009; Audit Committee Chairman, since 2019 | | Retired. Chairman of the Board of CIGNA Corporation since 2009, and Director since 2005. From 2003 to 2011, Director of Deluxe Corporation. Prior thereto, President and CEO of BellSouth Advertising and Publishing Corp. from 2005 to 2007, President and CEO of BellSouth Enterprises from 2004 to 2005 and President of BellSouth Consumer Services from 2000 to 2003. Emeritus member of the Iowa State University Foundation Board of Governors. Emeritus Member of the Advisory Board of Iowa State University School of Business. Advisory Board Member, Palm Harbor Academy (private school). Advisory Board Member, Child Evangelism Fellowship(non-profit). Mr. Harris is a certified public accountant (inactive status). | | CIGNA Corporation |
| | | |
Judith M. Johnson3 (Born 1949) | | Trustee, since 2008; Audit Committee Chairman, from 2009 to 2018 | | Retired. Prior thereto, Chief Executive Officer and Chief Investment Officer of Minneapolis Employees Retirement Fund from 1996 to 2008. Ms. Johnson is an attorney, certified public accountant and a certified managerial accountant. | | N/A |
| | | |
David F. Larcker (Born 1950) | | Trustee, since 2009 | | James Irvin Miller Professor of Accounting at the Graduate School of Business, Stanford University, Director of the Corporate Governance Research Initiative and Senior Faculty of The Rock Center for Corporate Governance since 2006. From 2005 to 2008, Professor of Accounting at the Graduate School of Business, Stanford University. Prior thereto, Ernst & Young Professor of Accounting at The Wharton School, University of Pennsylvania from 1985 to 2005. | | N/A |
| | | | |
| 28 | | Wells Fargo Short Duration Government Bond Fund | | Other information (unaudited) |
| | | | | | |
Name and
year of birth | | Position held and
length of service* | | Principal occupations during past five years or longer | | Current other
public company or
investment company
directorships |
| | | |
Olivia S. Mitchell (Born 1953) | | Trustee, since 2006; Nominating and Governance Committee Chairman, since 2018 | | International Foundation of Employee Benefit Plans Professor, Wharton School of the University of Pennsylvania since 1993. Director of Wharton’s Pension Research Council and Boettner Center on Pensions & Retirement Research, and Research Associate at the National Bureau of Economic Research. Previously, Cornell University Professor from 1978 to 1993. | | N/A |
| | | |
Timothy J. Penny (Born 1951) | | Trustee, since 1996; Chairman, since 2018 | | President and Chief Executive Officer of Southern Minnesota Initiative Foundation, anon-profit organization, since 2007. Member of the Board of Trustees of NorthStar Education Finance, Inc., anon-profit organization, since 2007. | | N/A |
| | | |
James G. Polisson (Born 1959) | | Trustee, since 2018 | | Retired. Chief Marketing Officer, Source (ETF) UK Services, Ltd, from 2015 to 2017. From 2012 to 2015, Principal of The Polisson Group, LLC, a management consulting, corporate advisory and principal investing company. Chief Executive Officer and Managing Director at Russell Investments, Global Exchange Traded Funds from 2010 to 2012. Managing Director of Barclays Global Investors from 1998 to 2010 and Global Chief Marketing Officer for iShares and Barclays Global Investors from 2000 to 2010. Trustee of the San Francisco Mechanics’ Institute, anon-profit organization, from 2013 to 2015. Board member of the Russell Exchange Traded Fund Trust from 2011 to 2012. Director of Barclays Global Investors Holdings Deutschland GmbH from 2006 to 2009. Mr. Polisson is an attorney and has a retired status with the Massachusetts and District of Columbia Bar Associations. | | N/A |
| | | |
Pamela Wheelock (Born 1959) | | Trustee, since 2018 | | Chief Operating Officer, Twin Cities Habitat for Humanity, since January, 2017. Vice President of University Services, University of Minnesota from 2012 to 2017. Prior thereto, on the Board of Directors, Governance Committee and Finance Committee for the Minnesota Philanthropy Partners (Saint Paul Foundation) from 2012 to 2018, Interim President and Chief Executive Officer of Blue Cross Blue Shield of Minnesota from 2010 to 2011, Chairman of the Board from 2009 to 2011 and Board Director from 2003 to 2015. Vice President, Leadership and Community Engagement, Bush Foundation, Saint Paul, Minnesota (a private foundation) from 2009 to 2011. Executive Vice President and Chief Financial Officer, Minnesota Sports and Entertainment from 2004 to 2009 and Senior Vice President from 2002 to 2004. Commissioner of Finance, State of Minnesota, from 1999 to 2002. Currently the Board Chair of the Minnesota Wild Foundation since 2010. | | N/A |
| * | Length of service dates reflect the Trustee’s commencement of service with the Trust’s predecessor entities, where applicable. |
| | | | | | |
| Other information (unaudited) | | Wells Fargo Short Duration Government Bond Fund | | | 29 | |
Officers
| | | | | | |
Name and
year of birth | | Position held and
length of service | | Principal occupations during past five years or longer | | |
| | | |
Andrew Owen
(Born 1960) | | President, since 2017 | | Executive Vice President of Wells Fargo & Company and Head of Affiliated Managers, Wells Fargo Asset Management, since 2014. In addition, Mr. Owen is currently President, Chief Executive Officer and Director of Wells Fargo Funds Management, LLC since 2017. Prior thereto, Executive Vice President responsible for marketing, investments and product development for Wells Fargo Funds Management, LLC, from 2009 to 2014. | | |
| | | |
Nancy Wiser1
(Born 1967) | | Treasurer, since 2012 | | Executive Vice President of Wells Fargo Funds Management, LLC since 2011. Chief Operating Officer and Chief Compliance Officer at LightBox Capital Management LLC, from 2008 to 2011. | | |
| | | |
Alexander Kymn
(Born 1973) | | Secretary and Chief Legal Officer, since 2018 | | Senior Company Counsel of Wells Fargo Bank, N.A. since 2018 (previously Senior Counsel from 2007 to 2018). Vice President of Wells Fargo Funds Management, LLC from 2008 to 2014. | | |
| | | |
Michael H. Whitaker
(Born 1967) | | Chief Compliance Officer, since 2016 | | Senior Vice President and Chief Compliance Officer since 2016. Senior Vice President and Chief Compliance Officer for Fidelity Investments from 2007 to 2016. | | |
| | | |
David Berardi
(Born 1975) | | Assistant Treasurer, since 2009 | | Vice President of Wells Fargo Funds Management, LLC since 2009. Vice President of Evergreen Investment Management Company, LLC from 2008 to 2010. Manager of Fund Reporting and Control for Evergreen Investment Management Company, LLC from 2004 to 2010. | | |
| | | |
Jeremy DePalma1
(Born 1974) | | Assistant Treasurer, since 2009 | | Senior Vice President of Wells Fargo Funds Management, LLC since 2009. Senior Vice President of Evergreen Investment Management Company, LLC from 2008 to 2010 and head of the Fund Reporting and Control Team within Fund Administration from 2005 to 2010. | | |
| 1 | Nancy Wiser acts as Treasurer of 76 funds in the Fund Complex. Jeremy DePalma acts as Treasurer of 76 funds and Assistant Treasurer of 76 funds in the Fund Complex. |
| 2 | The Statement of Additional Information includes additional information about the Trustees and is available, without charge, upon request, by calling1-800-222-8222 or by visiting the website atwfam.com. |
| 3 | Mr. Harris became Chairman of the Audit Committee effective January 1, 2019. |
| | | | |
| 30 | | Wells Fargo Short Duration Government Bond Fund | | Appendix A (unaudited) |
SALES CHARGE REDUCTIONS AND WAIVERS FOR CERTAIN INTERMEDIARIES
Raymond James & Associates, Inc., Raymond James Financial Services & Raymond James affiliates (“Raymond James”)
Effective on or about March 1, 2019, shareholders purchasing Fund shares through a Raymond James platform or account will be eligible only for the following load waivers(front-end sales charge waivers and contingent deferred, orback-end, sales charge waivers) and discounts, which may differ from those disclosed elsewhere in the Fund’s Prospectus or SAI.
Front-end Sales Load Waivers on Class A shares Available at Raymond James
| | • | | Shares purchased in an investment advisory program. |
| | • | | Shares purchased through reinvestment of capital gains distributions and dividend reinvestment when purchasing shares of the same fund (but not any other fund within the fund family). |
| | • | | Employees and registered representatives of Raymond James or its affiliates and their family members as designated by Raymond James. |
| | • | | Shares purchased from the proceeds of redemptions within the same fund family, provided (1) the repurchase occurs within 90 days following the redemption, (2) the redemption and purchase occur in the same account, and (3) redeemed shares were subject to afront-end or deferred sales load (known as Rights of Reinstatement). |
| | • | | A shareholder in the fund’s Class C shares will have their shares automatically exchanged at net asset value to Class A shares (or the appropriate share class) of the fund if the shares are no longer subject to a CDSC and the exchange is in line with the policies and procedures of Raymond James. |
CDSC Waivers on Class A and C Shares Available at Raymond James
| | • | | Death or disability of the shareholder. |
| | • | | Shares sold as part of a systematic withdrawal plan as described in the Fund’s Prospectus. |
| | • | | Return of excess contributions from an IRA Account. |
| | • | | Shares sold as part of a required minimum distribution for IRA and retirement accounts due to the shareholder reaching age 70½ as described in the Fund’s prospectus. |
| | • | | Shares sold to pay Raymond James fees but only if the transaction is initiated by Raymond James. |
| | • | | Shares acquired through a right of reinstatement. |
Front-end Load Discounts Available at Raymond James: Breakpoints, and/or Rights of Accumulation
| | • | | Breakpoints as described in the Fund’s Prospectus. |
| | • | | Rights of accumulation which entitle shareholders to breakpoint discounts will be automatically calculated based on the aggregated holding of fund family assets held by accounts within the purchaser’s household at Raymond James. Eligible fund family assets not held at Raymond James may be included in the rights of accumulation calculation only if the shareholder notifies his or her financial advisor about such assets. |
This page is intentionally left blank.
This page is intentionally left blank.

For more information
More information about Wells Fargo Funds is available free upon request. To obtain literature, please write, visit the Fund’s website, or call:
Wells Fargo Funds
P.O. Box 219967
Kansas City, MO 64121-9967
Website: wfam.com
Individual investors: 1-800-222-8222
Retail investment professionals: 1-888-877-9275
Institutional investment professionals: 1-866-765-0778
This report and the financial statements contained herein are submitted for the general information of the shareholders of the Fund. If this report is used for promotional purposes, distribution of the report must be accompanied or preceded by a current prospectus. Before investing, please consider the investment objectives, risks, charges, and expenses of the investment. For a current prospectus and, if available, a summary prospectus, containing this information, call1-800-222-8222 or visit the Fund’s website atwfam.com. Read the prospectus carefully before you invest or send money.
Wells Fargo Asset Management (WFAM) is the trade name for certain investment advisory/management firms owned by Wells Fargo & Company. These firms include but are not limited to Wells Capital Management Incorporated and Wells Fargo Funds Management, LLC. Certain products managed by WFAM entities are distributed by Wells Fargo Funds Distributor, LLC (a broker-dealer and Member FINRA).
This material is for general informational and educational purposes only and is NOT intended to provide investment advice or a recommendation of any kind—including a recommendation for any specific investment, strategy, or plan.
INVESTMENT PRODUCTS: NOT FDIC INSURED ◾ NO BANK GUARANTEE ◾ MAY LOSE VALUE
© 2019 Wells Fargo Funds Management, LLC. All rights reserved.
| | |
 | | 321628 04-19 SA220/SAR220 02-19 |
Semi-Annual Report
February 28, 2019

Wells Fargo Government Securities Fund

Beginning on January 1, 2021, as permitted by new regulations adopted by the Securities and Exchange Commission, paper copies of the Wells Fargo Funds’ annual and semi-annual shareholder reports issued after this date will no longer be sent by mail, unless you specifically request paper copies of the reports. Instead, the reports will be made available on the Funds’ website, and you will be notified by mail each time a report is posted and provided with a website address to access the report.
If you already elected to receive shareholder reports electronically, you will not be affected by this change and you need not take any action. You may elect to receive shareholder reports and other communications from the Fund electronically at any time by contacting your financial intermediary (such as a broker-dealer or bank) or, if you are a direct investor, by calling 1-800-222-8222 or by enrolling at wellsfargo.com/advantagedelivery.
You may elect to receive all future reports in paper free of charge. If you invest through a financial intermediary, you can contact your financial intermediary to request that you continue to receive paper copies of your shareholder reports; if you invest directly with the Fund, you can call 1-800-222-8222. Your election to receive reports in paper will apply to all Wells Fargo Funds held in your account with your financial intermediary or, if you are a direct investor, to all Wells Fargo Funds that you hold.

Reduce clutter. Save trees.
Sign up for electronic delivery of prospectuses and shareholder reports atwellsfargo.com/advantagedelivery
Contents
The views expressed and any forward-looking statements are as of February 28, 2019, unless otherwise noted, and are those of the Fund managers and/or Wells Fargo Funds Management, LLC. Discussions of individual securities, or the markets generally, or any Wells Fargo Fund are not intended as individual recommendations. Future events or results may vary significantly from those expressed in any forward-looking statements. The views expressed are subject to change at any time in response to changing circumstances in the market. Wells Fargo Funds Management, LLC and the Fund disclaim any obligation to publicly update or revise any views expressed or forward-looking statements.
INVESTMENT PRODUCTS: NOT FDIC INSURED ◾ NO BANK GUARANTEE ◾ MAY LOSE VALUE
| | | | |
| 2 | | Wells Fargo Government Securities Fund | | Letter to shareholders (unaudited) |

Andrew Owen
President
Wells Fargo Funds
Favorable third-quarter economic indicators and corporate earnings reports encouraged domestic stock investors.
Dear Shareholder:
We are pleased to offer you this semi-annual report for the Wells Fargo Government Securities Fund for the six-month period that ended February 28, 2019. Highershort-term interest rates, inflation concerns, trade tensions, slowing economic growth outside the U.S., and geopolitical events contributed to investment market volatility throughout the period.
For the period, U.S. stocks, as measured by the S&P 500 Index,1 fell 3.04% and international stocks, as measured by the MSCI ACWI ex USA Index (Net),2 declined 2.47%. Based on the MSCI EM Index (Net),3 emerging market stocks gained 0.33%. For bond investors, the Bloomberg Barclays U.S. Aggregate Bond Index4 added 1.99% while the Bloomberg Barclays Global Aggregate ex-USD Index5 gained 0.63%. The Bloomberg Barclays Municipal Bond Index6 added 2.34%, and the ICE BofAML U.S. High Yield Index7 advanced 1.98%.
Investors appeared to shake off lingering concerns during the third quarter.
Favorable third-quarter economic indicators and corporate earnings reports encouraged domestic stock investors. U.S. trade negotiations with Mexico and Canada progressed. The Conference Board Consumer Confidence Index®8 reached its highest level in 18 years during September 2018. The U.S. Federal Reserve (Fed) raised the federal funds rate by 25 basis points (bps; 100 bps equal 1.00%) to a target range of between 2.00% and 2.25% in September 2018. For the quarter that ended September 30, 2018, the S&P 500 Index added 7.71%.
Investors in international markets were not as confident. Tensions between the U.S. and China increased. The U.S. imposed $200 billion in tariffs on Chinese goods. China reacted with $60 billion in tariffs on U.S. goods. Economic growth in China caused concern. The Bank of England (BOE) raised its monetary policy rate to 0.75% in August. During the quarter, the MSCI ACWI ex USA Index (Net) gained 0.71%. The MSCI EM Index (Net) declined 1.09%. In fixed-income markets, U.S. bonds were flat, as measured by the Bloomberg Barclays U.S. Aggregate Bond Index. The Bloomberg Barclays Global Aggregate ex-USD Index fell 1.74%.
| 1 | The S&P 500 Index consists of 500 stocks chosen for market size, liquidity, and industry group representation. It is a market-value-weighted index with each stock’s weight in the index proportionate to its market value. You cannot invest directly in an index. |
| 2 | The Morgan Stanley Capital International (MSCI) All Country World Index (ACWI) ex USA Index (Net) is a free-float-adjusted market-capitalization-weighted index that is designed to measure the equity market performance of developed markets, excluding the United States and Canada. Source: MSCI. MSCI makes no express or implied warranties or representations and shall have no liability whatsoever with respect to any MSCI data contained herein. The MSCI data may not be further redistributed or used as a basis for other indices or any securities or financial products. This report is not approved, reviewed, or produced by MSCI. You cannot invest directly in an index. |
| 3 | The MSCI Emerging Markets (EM) Index (Net) is a free-float-adjusted market-capitalization-weighted index that is designed to measure large- and mid-cap equity market performance of emerging markets. The MSCI EM Index (Net) consists of the following 24 emerging market country indices: Brazil, Chile, China, Colombia, Czech Republic, Egypt, Greece, Hungary, India, Indonesia, Korea, Malaysia, Mexico, Pakistan, Peru, the Philippines, Poland, Qatar, Russia, South Africa, Taiwan, Thailand, Turkey, and the United Arab Emirates. You cannot invest directly in an index. |
| 4 | The Bloomberg Barclays U.S. Aggregate Bond Index is a broad-based benchmark that measures the investment-grade, U.S. dollar-denominated, fixed-rate taxable bond market, including Treasuries, government-related and corporate securities, mortgage-backed securities (agency fixed-rate and hybrid adjustable-rate mortgage pass-throughs), asset-backed securities, and commercial mortgage-backed securities. You cannot invest directly in an index. |
| 5 | The Bloomberg Barclays Global Aggregate ex-USD Index is an unmanaged index that provides a broad-based measure of the global investment-grade fixed-income markets excluding the U.S. dollar-denominated debt market. You cannot invest directly in an index. |
| 6 | The Bloomberg Barclays Municipal Bond Index is an unmanaged index composed of long-term tax-exempt bonds with a minimum credit rating of Baa. You cannot invest directly in an index. |
| 7 | The ICE BofAML U.S. High Yield Index is a market-capitalization-weighted index of domestic and Yankee high-yield bonds. The index tracks the performance of high-yield securities traded in the U.S. bond market. You cannot invest directly in an index. Copyright 2019. ICE Data Indices, LLC. All rights reserved. |
| 8 | The Conference Board Consumer Confidence Index® measures the degree of optimism on the state of the U.S. economy that consumers are expressing through their activities of savings and spending. You cannot invest directly in an index. |
| | | | | | |
| Letter to shareholders (unaudited) | | Wells Fargo Government Securities Fund | | | 3 | |
Conflicting data unsettled markets during the fourth quarter.
November’s U.S. midterm elections shifted control of the House of Representatives from Republicans to Democrats, presaging potential partisan clashes.Third-quarter U.S. gross domestic product (GDP) was announced at an annualized 3.4% rate, lower than the second-quarter rate. Brexit efforts stalled ahead of the March 2019 deadline. The People’s Bank of China cut reserve requirement ratios, accelerated infrastructure spending, and cut taxes even as the value of the yuan declined to low levels last seen in 2008.
December’s S&P 500 Index performance was the worst since 1931. Globally,fixed-income investments fared better than stocks during the last two months of the year. The Fed increased the federal funds rate by 25 bps in December 2018 to a target range of between 2.25% and 2.50% and softened its outlook for 2019 rate increases.
The market climbs a wall of worry.
Investors entered 2019 with reasons to be concerned. A partial U.S. government shutdown driven by partisan spending and immigration policy disputes extended into January. Investors expected high levels of stock market volatility to continue based on the VIX9.
January’s returns tended to support the investing adage that markets climb a wall of worry. The S&P 500 Index gained 8.01% for the month that ended January 31, 2019, its best monthly performance in 30 years. Returns for the MSCI ACWI ex USA Index (Net), the Bloomberg Barclays U.S. Aggregate Bond Index, and the Bloomberg Barclays Global Aggregate ex-USD Index also were positive.
In February, concerns over slowing global growth reemerged. The Bureau of Economic Analysis announced fourth-quarter 2018 GDP grew at an annualized 2.2% rate, down from the 4.2% annualized rate for the second quarter and the 3.4% annualized rate for the third quarter. Analysts attributed the lower growth rate to a slowing housing market and larger trade deficit. The U.S. Labor Department said that the economy created just 20,000 jobs in February. In a February report, the BOE forecast the slowest growth since the financial crisis for 2019. China and the U.S., while putting future tariffs on hold for the time being, continued to wrangle over trade issues.
Don’t let short-term uncertainty derail long-term investment goals.
Periods of investment uncertainty can present challenges, but experience has taught us that maintaining long-term investment goals can be an effective way to plan for the future. To help you create a sound strategy based on your personal goals and risk tolerance, Wells Fargo Funds offers more than 100 mutual funds spanning a wide range of asset classes and investment styles. Although diversification cannot guarantee an investment profit or prevent losses, we believe it can be an effective way to manage investment risk and potentially smooth out overall portfolio performance. We encourage investors to know their investments and to understand that appropriate levels of risk-taking may unlock opportunities.
January’s returns tended to support the investing adage that markets climb a wall of worry.
| 9 | The Chicago Board Options Exchange Market Volatility Index (VIX) is a popular measure of the implied volatility of S&P 500 Index options. It represents one measure of the market’s expectation of stock market volatility over the next 30-day period. You cannot invest directly in an index. |
| | | | |
| 4 | | Wells Fargo Government Securities Fund | | Letter to shareholders (unaudited) |
Thank you for choosing to invest with Wells Fargo Funds. We appreciate your confidence in us and remain committed to helping you meet your financial needs.
Sincerely,

Andrew Owen
President
Wells Fargo Funds
For further information about your Fund, contact your investment professional, visit our website atwfam.com, or call us directly at1-800-222-8222.
This page is intentionally left blank.
| | | | |
| 6 | | Wells Fargo Government Securities Fund | | Performance highlights (unaudited) |
Investment objective
The Fund seeks current income.
Manager
Wells Fargo Funds Management, LLC
Subadviser
Wells Capital Management Incorporated
Portfolio managers
Christopher Y. Kauffman, CFA®‡
Jay N. Mueller, CFA®‡
Michal Stanczyk
Average annual total returns (%) as of February 28, 2019
| | | | | | | | | | | | | | | | | | | | | | | | | | | | | | | | | | |
| | | | | Including sales charge | | | Excluding sales charge | | | Expense ratios1 (%) | |
| | | Inception date | | 1 year | | | 5 year | | | 10 year | | | 1 year | | | 5 year | | | 10 year | | | Gross | | | Net2 | |
| | | | | | | | | |
| Class A (SGVDX) | | 8-31-1999 | | | -1.94 | | | | 0.56 | | | | 2.10 | | | | 2.68 | | | | 1.49 | | | | 2.58 | | | | 0.90 | | | | 0.85 | |
| | | | | | | | | |
| Class C (WGSCX) | | 12-26-2002 | | | 0.92 | | | | 0.75 | | | | 1.81 | | | | 1.92 | | | | 0.75 | | | | 1.81 | | | | 1.65 | | | | 1.60 | |
| | | | | | | | | |
| Administrator Class (WGSDX) | | 4-8-2005 | | | – | | | | – | | | | – | | | | 2.90 | | | | 1.72 | | | | 2.79 | | | | 0.84 | | | | 0.64 | |
| | | | | | | | | |
| Institutional Class (SGVIX) | | 8-31-1999 | | | – | | | | – | | | | – | | | | 3.16 | | | | 1.89 | | | | 2.97 | | | | 0.57 | | | | 0.48 | |
| | | | | | | | | |
| Bloomberg Barclays U.S. Aggregate ex Credit Index3 | | – | | | – | | | | – | | | | – | | | | 3.38 | | | | 1.96 | | | | 2.97 | | | | – | | | | – | |
| | | | | | | | | |
| Bloomberg Barclays Intermediate U.S. Government Bond Index4 | | – | | | – | | | | – | | | | – | | | | 3.07 | | | | 1.33 | | | | 2.02 | | | | – | | | | – | |
Figures quoted represent past performance, which is no guarantee of future results, and do not reflect taxes that a shareholder may pay on fund distributions or the redemption of fund shares. Investment return and principal value of an investment will fluctuate so that an investor’s shares, when redeemed, may be worth more or less than their original cost. Performance shown without sales charges would be lower if sales charges were reflected. Current performance may be lower or higher than the performance data quoted, which assumes the reinvestment of dividends and capital gains. Current month-end performance is available on the Fund’s website,wfam.com.
Index returns do not include transaction costs associated with buying and selling securities, any mutual fund fees or expenses, or any taxes. It is not possible to invest directly in an index.
For Class A shares, the maximum front-end sales charge is 4.50%. For Class C shares, the maximum contingent deferred sales charge is 1.00%. Performance including a contingent deferred sales charge assumes the sales charge for the corresponding time period. Administrator Class and Institutional Class shares are sold without a front-end sales charge or contingent deferred sales charge.
Bond values fluctuate in response to the financial condition of individual issuers, general market and economic conditions, and changes in interest rates. Changes in market conditions and government policies may lead to periods of heightened volatility in the bond market and reduced liquidity for certain bonds held by the Fund. In general, when interest rates rise, bond values fall and investors may lose principal value. Interest rate changes and their impact on the Fund and its share price can be sudden and unpredictable. The use of derivatives may reduce returns and/or increase volatility. Securities issued by U.S. government agencies or government sponsored entities may not be guaranteed by the U.S. Treasury. Certain investment strategies tend to increase the total risk of an investment (relative to the broader market). The Fund is exposed to mortgage- and asset-backed securities risk. The U.S. government guarantee applies to certain underlying securities and not to shares of the Fund. Consult the Fund’s prospectus for additional information on these and other risks.
Please see footnotes on page 7.
| | | | | | |
| Performance highlights (unaudited) | | Wells Fargo Government Securities Fund | | | 7 | |
| | | | |
| Ten largest holdings (%) as of February 28, 20195 | |
| |
FNMA, 3.00%, 12-1-2045 | | | 3.93 | |
| |
FNMA, 4.50%, 3-13-2049 | | | 3.59 | |
| |
FNMA, 4.00%, 4-1-2046 | | | 2.61 | |
| |
FNMA, 3.00%, 3-18-2034 | | | 2.56 | |
| |
GNMA, 3.50%, 12-20-2047 | | | 2.45 | |
| |
Resolution Funding Corporation STRIPS, 0.00%,
7-15-2020 | | | 2.37 | |
| |
FNMA, 3.50%, 3-18-2034 | | | 2.32 | |
| |
U.S. Treasury Bond, 4.25%, 11-15-2040 | | | 2.13 | |
| |
GNMA, 4.00%, 12-20-2047 | | | 1.89 | |
| |
U.S. Treasury Bond, 3.75%, 11-15-2043 | | | 1.88 | |
|
| Portfolio composition as of February 28, 20196 |
|
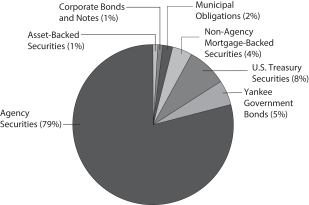
|
| ‡ | CFA® and Chartered Financial Analyst® are trademarks owned by CFA Institute. |
| 1 | Reflects the expense ratios as stated in the most recent prospectuses. The expense ratios shown are subject to change and may differ from the annualized expense ratios shown in the financial highlights of this report. |
| 2 | The manager has contractually committed through December 31, 2019, to waive fees and/or reimburse expenses to the extent necessary to cap the expenses of each class after fee waivers at the amounts shown. Brokerage commissions, stamp duty fees, interest, taxes, acquired fund fees and expenses (if any), and extraordinary expenses are excluded from the expense cap. Prior to or after the commitment expiration date, the cap may be increased or the commitment to maintain the cap may be terminated only with the approval of the Board of Trustees. Without this cap, the Fund’s returns would have been lower. The expense ratio paid by an investor is the net expense ratio (the total annual fund operating expenses after fee waivers) as stated in the prospectuses. |
| 3 | The Bloomberg Barclays U.S. Aggregate ex Credit Index is composed of the Bloomberg Barclays U.S. Government Bond Index and the Bloomberg Barclays U.S. Mortgage-Backed Securities Index and it includes Treasury issues, agency issues, and mortgage-backed securities. You cannot invest directly in an index. |
| 4 | The Bloomberg Barclays Intermediate U.S. Government Bond Index is an unmanaged index composed of U.S. government securities with maturities in the one to 10-year range, including securities issued by the U.S. Treasury and U.S. government agencies. You cannot invest directly in an index. |
| 5 | The ten largest holdings, excluding cash, cash equivalents and any money market funds, are calculated based on the value of the investments divided by total net assets of the Fund. Holdings are subject to change and may have changed since the date specified. |
| 6 | Amounts are calculated based on the total long-term investments of the Fund. These amounts are subject to change and may have changed since the date specified. |
| | | | |
| 8 | | Wells Fargo Government Securities Fund | | Fund expenses (unaudited) |
As a shareholder of the Fund, you incur two types of costs: (1) transaction costs, including sales charges (loads) on purchase payments and contingent deferred sales charges (if any) on redemptions and (2) ongoing costs, including management fees, distribution (12b-1) and/or shareholder servicing fees, and other Fund expenses. This example is intended to help you understand your ongoing costs (in dollars) of investing in the Fund and to compare these costs with the ongoing costs of investing in other mutual funds.
The example is based on an investment of $1,000 invested at the beginning of the six-month period and held for the entire period from September 1, 2018 to February 28, 2019.
Actual expenses
The “Actual” line of the table below provides information about actual account values and actual expenses. You may use the information in this line, together with the amount you invested, to estimate the expenses that you paid over the period. Simply divide your account value by $1,000 (for example, an $8,600 account value divided by $1,000 = 8.6), then multiply the result by the number in the “Actual” line under the heading entitled “Expenses paid during period” for your applicable class of shares to estimate the expenses you paid on your account during this period.
Hypothetical example for comparison purposes
The “Hypothetical” line of the table below provides information about hypothetical account values and hypothetical expenses based on the Fund’s actual expense ratio and an assumed rate of return of 5% per year before expenses, which is not the Fund’s actual return. The hypothetical account values and expenses may not be used to estimate the actual ending account balance or expenses you paid for the period. You may use this information to compare the ongoing costs of investing in the Fund and other funds. To do so, compare this 5% hypothetical example with the 5% hypothetical examples that appear in the shareholder reports of the other funds.
Please note that the expenses shown in the table are meant to highlight your ongoing costs only and do not reflect any transactional costs, such as sales charges (loads) and contingent deferred sales charges. Therefore, the “Hypothetical” line of the table is useful in comparing ongoing costs only and will not help you determine the relative total costs of owning different funds. In addition, if these transactional costs were included, your costs would have been higher.
| | | | | | | | | | | | | | | | |
| | | Beginning
account value
9-1-2018 | | | Ending
account value
2-28-2019 | | | Expenses
paid during
the period¹ | | | Annualized net
expense ratio | |
Class A | | | | | | | | | | | | | | | | |
| | | | |
Actual | | $ | 1,000.00 | | | $ | 1,017.70 | | | $ | 4.25 | | | | 0.85 | % |
| | | | |
Hypothetical (5% return before expenses) | | $ | 1,000.00 | | | $ | 1,020.58 | | | $ | 4.26 | | | | 0.85 | % |
Class C | | | | | | | | | | | | | | | | |
| | | | |
Actual | | $ | 1,000.00 | | | $ | 1,013.92 | | | $ | 7.99 | | | | 1.60 | % |
| | | | |
Hypothetical (5% return before expenses) | | $ | 1,000.00 | | | $ | 1,016.86 | | | $ | 8.00 | | | | 1.60 | % |
Administrator Class | | | | | | | | | | | | | | | | |
| | | | |
Actual | | $ | 1,000.00 | | | $ | 1,018.75 | | | $ | 3.20 | | | | 0.64 | % |
| | | | |
Hypothetical (5% return before expenses) | | $ | 1,000.00 | | | $ | 1,021.62 | | | $ | 3.21 | | | | 0.64 | % |
Institutional Class | | | | | | | | | | | | | | | | |
| | | | |
Actual | | $ | 1,000.00 | | | $ | 1,019.56 | | | $ | 2.40 | | | | 0.48 | % |
| | | | |
Hypothetical (5% return before expenses) | | $ | 1,000.00 | | | $ | 1,022.41 | | | $ | 2.41 | | | | 0.48 | % |
| 1 | Expenses paid is equal to the annualized net expense ratio of each class multiplied by the average account value over the period, multiplied by the number of days in the most recent fiscal half-year divided by the number of days in the fiscal year (to reflect the one-half-year period). |
| | | | | | |
| Portfolio of investments—February 28, 2019 (unaudited) | | Wells Fargo Government Securities Fund | | | 9 | |
| | | | | | | | | | | | | | | | |
| Security name | | Interest rate | | | Maturity date | | | Principal | | | Value | |
|
Agency Securities: 88.04% | |
| | | | |
FDIC Series 2010-R1 Class A 144A | | | 2.18 | % | | | 5-25-2050 | | | $ | 140,916 | | | $ | 140,850 | |
| | | | |
FDIC Series 2013-R1 Class A 144A | | | 1.15 | | | | 3-25-2033 | | | | 1,293,208 | | | | 1,274,178 | |
| | | | |
FHLB | | | 3.25 | | | | 11-16-2028 | | | | 7,155,000 | | | | 7,300,046 | |
| | | | |
FHLB | | | 5.63 | | | | 3-14-2036 | | | | 6,020,000 | | | | 7,750,238 | |
| | | | |
FHLMC | | | 5.00 | | | | 6-1-2026 | | | | 1,673,988 | | | | 1,737,518 | |
| | | | |
FHLMC | | | 2.38 | | | | 4-25-2023 | | | | 1,171,895 | | | | 1,163,313 | |
| | | | |
FHLMC | | | 2.46 | | | | 3-25-2022 | | | | 3,048,315 | | | | 3,027,960 | |
| | | | |
FHLMC | | | 2.62 | | | | 12-25-2026 | | | | 4,013,828 | | | | 3,935,336 | |
| | | | |
FHLMC | | | 2.75 | | | | 3-25-2027 | | | | 6,022,210 | | | | 5,979,572 | |
| | | | |
FHLMC | | | 2.90 | | | | 4-25-2026 | | | | 6,422,589 | | | | 6,448,638 | |
| | | | |
FHLMC | | | 3.00 | | | | 5-15-2026 | | | | 703,699 | | | | 702,790 | |
| | | | |
FHLMC | | | 3.00 | | | | 1-15-2054 | | | | 154,309 | | | | 153,672 | |
| | | | |
FHLMC | | | 3.50 | | | | 8-1-2045 | | | | 5,480,019 | | | | 5,504,957 | |
| | | | |
FHLMC | | | 3.50 | | | | 11-1-2045 | | | | 9,919,391 | | | | 9,964,533 | |
| | | | |
FHLMC | | | 3.50 | | | | 12-1-2045 | | | | 7,007,029 | | | | 7,038,918 | |
| | | | |
FHLMC | | | 3.50 | | | | 12-1-2045 | | | | 2,215,942 | | | | 2,226,027 | |
| | | | |
FHLMC (11th District Cost of Funds +1.25%) ± | | | 3.51 | | | | 7-1-2032 | | | | 387,744 | | | | 390,298 | |
| | | | |
FHLMC (3 Year Treasury Constant Maturity +2.24%) ± | | | 3.62 | | | | 5-1-2026 | | | | 32,106 | | | | 32,129 | |
| | | | |
FHLMC (1 Month LIBOR +1.18%) ± | | | 3.67 | | | | 12-15-2036 | | | | 362,144 | | | | 374,621 | |
| | | | |
FHLMC | | | 4.00 | | | | 12-15-2024 | | | | 1,850,000 | | | | 1,892,009 | |
| | | | |
FHLMC | | | 4.00 | | | | 6-1-2044 | | | | 4,853,569 | | | | 4,969,769 | |
| | | | |
FHLMC (1 Year Treasury Constant Maturity +2.25%) ± | | | 4.33 | | | | 6-1-2032 | | | | 20,562 | | | | 21,196 | |
| | | | |
FHLMC (1 Year Treasury Constant Maturity +2.14%) ± | | | 4.34 | | | | 10-1-2026 | | | | 132,229 | | | | 136,241 | |
| | | | |
FHLMC (1 Year Treasury Constant Maturity +2.40%) ± | | | 4.37 | | | | 7-1-2029 | | | | 91,215 | | | | 94,139 | |
| | | | |
FHLMC (12 Month LIBOR +1.75%) ± | | | 4.42 | | | | 7-1-2038 | | | | 1,679,563 | | | | 1,759,178 | |
| | | | |
FHLMC | | | 4.50 | | | | 3-1-2042 | | | | 411,024 | | | | 432,289 | |
| | | | |
FHLMC | | | 4.50 | | | | 9-1-2044 | | | | 3,655,661 | | | | 3,808,583 | |
| | | | |
FHLMC (12 Month LIBOR +1.91%) ± | | | 4.66 | | | | 9-1-2031 | | | | 3,266 | | | | 3,304 | |
| | | | |
FHLMC (12 Month LIBOR +1.91%) ± | | | 4.66 | | | | 9-1-2031 | | | | 43,894 | | | | 44,139 | |
| | | | |
FHLMC (12 Month LIBOR +2.00%) ± | | | 4.97 | | | | 1-1-2038 | | | | 1,048,179 | | | | 1,107,340 | |
| | | | |
FHLMC | | | 5.00 | | | | 4-1-2019 | | | | 821 | | | | 825 | |
| | | | |
FHLMC | | | 5.00 | | | | 4-1-2019 | | | | 542 | | | | 545 | |
| | | | |
FHLMC | | | 5.00 | | | | 6-1-2019 | | | | 10,303 | | | | 10,359 | |
| | | | |
FHLMC | | | 5.00 | | | | 8-1-2019 | | | | 44,900 | | | | 45,556 | |
| | | | |
FHLMC | | | 5.00 | | | | 10-1-2019 | | | | 28,204 | | | | 28,358 | |
| | | | |
FHLMC | | | 5.00 | | | | 2-1-2020 | | | | 99,193 | | | | 99,736 | |
| | | | |
FHLMC | | | 5.00 | | | | 8-1-2040 | | | | 1,058,315 | | | | 1,134,587 | |
| | | | |
FHLMC | | | 5.50 | | | | 7-1-2035 | | | | 3,148,821 | | | | 3,415,828 | |
| | | | |
FHLMC | | | 5.50 | | | | 12-1-2038 | | | | 1,966,245 | | | | 2,130,777 | |
| | | | |
FHLMC | | | 6.00 | | | | 10-1-2032 | | | | 27,057 | | | | 29,726 | |
| | | | |
FHLMC | | | 6.00 | | | | 5-25-2043 | | | | 4,304,971 | | | | 4,713,245 | |
| | | | |
FHLMC (1 Year Treasury Constant Maturity +2.13%) ± | | | 6.38 | | | | 1-1-2026 | | | | 53,480 | | | | 51,513 | |
| | | | |
FHLMC | | | 6.50 | | | | 4-1-2021 | | | | 1,298 | | | | 1,313 | |
| | | | |
FHLMC | | | 6.50 | | | | 4-1-2022 | | | | 30,204 | | | | 33,156 | |
| | | | |
FHLMC | | | 6.50 | | | | 9-1-2028 | | | | 15,102 | | | | 16,577 | |
| | | | |
FHLMC | | | 6.50 | | | | 9-1-2028 | | | | 18,353 | | | | 20,146 | |
| | | | |
FHLMC | | | 6.50 | | | | 7-1-2031 | | | | 2 | | | | 3 | |
| | | | |
FHLMC | | | 7.00 | | | | 12-1-2023 | | | | 2,270 | | | | 2,427 | |
| | | | |
FHLMC | | | 7.00 | | | | 12-1-2026 | | | | 1,861 | | | | 1,891 | |
| | | | |
FHLMC | | | 7.00 | | | | 12-1-2026 | | | | 382 | | | | 405 | |
The accompanying notes are an integral part of these financial statements.
| | | | |
| 10 | | Wells Fargo Government Securities Fund | | Portfolio of investments—February 28, 2019 (unaudited) |
| | | | | | | | | | | | | | | | |
| Security name | | Interest rate | | | Maturity date | | | Principal | | | Value | |
|
Agency Securities(continued) | |
| | | | |
FHLMC | | | 7.00 | % | | | 4-1-2029 | | | $ | 1,374 | | | $ | 1,539 | |
| | | | |
FHLMC | | | 7.00 | | | | 5-1-2029 | | | | 8,297 | | | | 9,334 | |
| | | | |
FHLMC | | | 7.00 | | | | 4-1-2032 | | | | 90,827 | | | | 102,964 | |
| | | | |
FHLMC | | | 7.50 | | | | 11-1-2031 | | | | 185,288 | | | | 210,063 | |
| | | | |
FHLMC | | | 7.50 | | | | 4-1-2032 | | | | 158,908 | | | | 178,442 | |
| | | | |
FHLMC | | | 8.00 | | | | 8-1-2023 | | | | 6,503 | | | | 6,821 | |
| | | | |
FHLMC | | | 8.00 | | | | 6-1-2024 | | | | 3,561 | | | | 3,794 | |
| | | | |
FHLMC | | | 8.00 | | | | 6-1-2024 | | | | 2,570 | | | | 2,596 | |
| | | | |
FHLMC | | | 8.00 | | | | 6-1-2024 | | | | 4,853 | | | | 4,974 | |
| | | | |
FHLMC | | | 8.00 | | | | 8-1-2026 | | | | 13,687 | | | | 15,416 | |
| | | | |
FHLMC | | | 8.00 | | | | 11-1-2026 | | | | 13,006 | | | | 14,541 | |
| | | | |
FHLMC | | | 8.00 | | | | 11-1-2028 | | | | 8,677 | | | | 9,300 | |
| | | | |
FHLMC | | | 8.50 | | | | 7-1-2022 | | | | 891 | | | | 900 | |
| | | | |
FHLMC | | | 8.50 | | | | 12-1-2025 | | | | 8,782 | | | | 9,479 | |
| | | | |
FHLMC | | | 8.50 | | | | 5-1-2026 | | | | 1,211 | | | | 1,292 | |
| | | | |
FHLMC | | | 8.50 | | | | 8-1-2026 | | | | 4,748 | | | | 4,798 | |
| | | | |
FHLMC | | | 8.50 | | | | 8-1-2026 | | | | 16,652 | | | | 16,697 | |
| | | | |
FHLMC | | | 9.00 | | | | 1-1-2020 | | | | 1 | | | | 1 | |
| | | | |
FHLMC | | | 9.00 | | | | 2-1-2020 | | | | 24 | | | | 24 | |
| | | | |
FHLMC | | | 9.00 | | | | 3-1-2020 | | | | 176 | | | | 175 | |
| | | | |
FHLMC | | | 9.00 | | | | 9-1-2020 | | | | 8 | | | | 8 | |
| | | | |
FHLMC | | | 9.00 | | | | 9-1-2020 | | | | 190 | | | | 191 | |
| | | | |
FHLMC | | | 9.00 | | | | 12-1-2020 | | | | 3 | | | | 3 | |
| | | | |
FHLMC | | | 9.00 | | | | 3-1-2021 | | | | 444 | | | | 447 | |
| | | | |
FHLMC | | | 9.00 | | | | 4-1-2021 | | | | 111 | | | | 112 | |
| | | | |
FHLMC | | | 9.00 | | | | 4-1-2021 | | | | 74 | | | | 76 | |
| | | | |
FHLMC | | | 9.00 | | | | 7-1-2021 | | | | 1,239 | | | | 1,242 | |
| | | | |
FHLMC | | | 9.00 | | | | 7-1-2021 | | | | 1,798 | | | | 1,804 | |
| | | | |
FHLMC | | | 9.00 | | | | 8-1-2021 | | | | 90 | | | | 93 | |
| | | | |
FHLMC | | | 9.00 | | | | 7-1-2022 | | | | 53 | | | | 53 | |
| | | | |
FHLMC | | | 9.00 | | | | 9-1-2024 | | | | 271 | | | | 274 | |
| | | | |
FHLMC | | | 9.50 | | | | 8-1-2019 | | | | 5 | | | | 5 | |
| | | | |
FHLMC | | | 9.50 | | | | 6-1-2020 | | | | 8 | | | | 8 | |
| | | | |
FHLMC | | | 9.50 | | | | 8-1-2020 | | | | 42 | | | | 43 | |
| | | | |
FHLMC | | | 9.50 | | | | 9-1-2020 | | | | 14 | | | | 14 | |
| | | | |
FHLMC | | | 9.50 | | | | 9-1-2020 | | | | 173 | | | | 174 | |
| | | | |
FHLMC | | | 9.50 | | | | 10-1-2020 | | | | 22 | | | | 22 | |
| | | | |
FHLMC | | | 9.50 | | | | 11-1-2020 | | | | 17 | | | | 18 | |
| | | | |
FHLMC | | | 9.50 | | | | 5-1-2021 | | | | 68 | | | | 70 | |
| | | | |
FHLMC | | | 9.50 | | | | 9-17-2022 | | | | 37,312 | | | | 37,379 | |
| | | | |
FHLMC | | | 9.50 | | | | 4-1-2025 | | | | 13,370 | | | | 13,511 | |
| | | | |
FHLMC | | | 10.00 | | | | 12-1-2019 | | | | 24 | | | | 24 | |
| | | | |
FHLMC | | | 10.00 | | | | 3-1-2020 | | | | 1 | | | | 1 | |
| | | | |
FHLMC | | | 10.00 | | | | 6-1-2020 | | | | 4 | | | | 4 | |
| | | | |
FHLMC | | | 10.00 | | | | 8-1-2020 | | | | 7 | | | | 7 | |
| | | | |
FHLMC | | | 10.00 | | | | 10-1-2021 | | | | 1,473 | | | | 1,482 | |
| | | | |
FHLMC | | | 10.00 | | | | 8-17-2022 | | | | 1,081 | | | | 1,081 | |
| | | | |
FHLMC | | | 10.00 | | | | 2-17-2025 | | | | 59,429 | | | | 59,678 | |
The accompanying notes are an integral part of these financial statements.
| | | | | | |
| Portfolio of investments—February 28, 2019 (unaudited) | | Wells Fargo Government Securities Fund | | | 11 | |
| | | | | | | | | | | | | | | | |
| Security name | | Interest rate | | | Maturity date | | | Principal | | | Value | |
|
Agency Securities(continued) | |
| | | | |
FHLMC | | | 10.50 | % | | | 8-1-2019 | | | $ | 146 | | | $ | 146 | |
| | | | |
FHLMC | | | 10.50 | | | | 12-1-2019 | | | | 3,072 | | | | 3,074 | |
| | | | |
FHLMC | | | 10.50 | | | | 5-1-2020 | | | | 625 | | | | 625 | |
| | | | |
FHLMC | | | 10.50 | | | | 8-1-2020 | | | | 1,810 | | | | 1,817 | |
| | | | |
FHLMC Multifamily Structured Pass-through Series K075 Class A2 ±± | | | 3.65 | | | | 2-25-2028 | | | | 4,370,000 | | | | 4,505,304 | |
| | | | |
FHLMC Series 2015-SC01 Class 1A | | | 3.50 | | | | 5-25-2045 | | | | 2,282,806 | | | | 2,266,594 | |
| | | | |
FHLMC Series 2882 Class TF (1 Month LIBOR +0.25%) ± | | | 2.74 | | | | 10-15-2034 | | | | 198,638 | | | | 198,739 | |
| | | | |
FHLMC Series 3767 Class PD | | | 4.00 | | | | 7-15-2040 | | | | 4,215 | | | | 4,210 | |
| | | | |
FHLMC Series 3948 Class DA | | | 3.00 | | | | 12-15-2024 | | | | 104,841 | | | | 104,842 | |
| | | | |
FHLMC Series 4218 Class DF (1 Month LIBOR +0.25%) ± | | | 2.74 | | | | 7-15-2042 | | | | 696,350 | | | | 693,381 | |
| | | | |
FHLMC Series K020 Class X1 ±±(c) | | | 1.41 | | | | 5-25-2022 | | | | 43,974,658 | | | | 1,660,835 | |
| | | | |
FHLMC Series K032 Class A2 ±± | | | 3.31 | | | | 5-25-2023 | | | | 2,800,000 | | | | 2,848,078 | |
| | | | |
FHLMC Series K039 Class A2 | | | 3.30 | | | | 7-25-2024 | | | | 325,000 | | | | 330,699 | |
| | | | |
FHLMC Series KF15 Class A (1 Month LIBOR +0.67%) ± | | | 3.18 | | | | 2-25-2023 | | | | 393,695 | | | | 394,123 | |
| | | | |
FHLMC Series KJ14 Class A1 | | | 2.20 | | | | 11-25-2023 | | | | 4,001,677 | | | | 3,912,041 | |
| | | | |
FHLMC Series M036 Class A | | | 4.16 | | | | 12-15-2029 | | | | 3,660,000 | | | | 3,827,372 | |
| | | | |
FHLMC Series T-15 Class A6 (1 Month LIBOR +0.40%) ± | | | 2.89 | | | | 11-25-2028 | | | | 206,691 | | | | 206,361 | |
| | | | |
FHLMC Series T-23 Class A (1 Month LIBOR +0.14%) ± | | | 2.63 | | | | 5-25-2030 | | | | 600,508 | | | | 599,170 | |
| | | | |
FHLMC Series T-35 Class A (1 Month LIBOR +0.14%) ± | | | 2.79 | | | | 9-25-2031 | | | | 733,896 | | | | 726,707 | |
| | | | |
FHLMC Series T-42 Class A6 | | | 9.50 | | | | 2-25-2042 | | | | 775,869 | | | | 930,094 | |
| | | | |
FHLMC Series T-55 Class 2A1 ±± | | | 3.83 | | | | 3-25-2043 | | | | 418,022 | | | | 413,632 | |
| | | | |
FHLMC Series T-57 Class 1A1 | | | 6.50 | | | | 7-25-2043 | | | | 1,004,920 | | | | 1,142,231 | |
| | | | |
FHLMC Series T-57 Class 2A1 ±± | | | 4.10 | | | | 7-25-2043 | | | | 1,956,867 | | | | 2,070,441 | |
| | | | |
FHLMC Series T-62 Class 1A1 (12 Month Treasury Average +1.20%) ± | | | 3.53 | | | | 10-25-2044 | | | | 1,078,411 | | | | 1,090,695 | |
| | | | |
FHLMC Series T-67 Class 1A1C ±± | | | 3.93 | | | | 3-25-2036 | | | | 734,902 | | | | 739,115 | |
| | | | |
FHLMC Series T-67 Class 2A1C ±± | | | 3.61 | | | | 3-25-2036 | | | | 1,374,126 | | | | 1,355,973 | |
| | | | |
FHLMC Series T-75 Class A1 (1 Month LIBOR +0.04%) ± | | | 2.55 | | | | 12-25-2036 | | | | 669,905 | | | | 669,494 | |
| | | | |
FNMA ¤ | | | 0.00 | | | | 10-9-2019 | | | | 9,590,000 | | | | 9,440,995 | |
| | | | |
FNMA ¤ | | | 0.00 | | | | 5-15-2030 | | | | 7,700,000 | | | | 5,316,177 | |
| | | | |
FNMA | | | 1.71 | | | | 12-1-2022 | | | | 3,123,299 | | | | 3,054,265 | |
| | | | |
FNMA | | | 1.78 | | | | 5-1-2020 | | | | 892,923 | | | | 881,649 | |
| | | | |
FNMA (11th District Cost of Funds +1.26%) ± | | | 2.41 | | | | 5-1-2036 | | | | 1,261,726 | | | | 1,256,973 | |
| | | | |
FNMA (12 Month LIBOR +1.61%) ± | | | 2.49 | | | | 5-1-2046 | | | | 5,078,858 | | | | 5,044,112 | |
| | | | |
FNMA | | | 2.50 | | | | 4-25-2039 | | | | 46,945 | | | | 46,488 | |
| | | | |
FNMA | | | 2.55 | | | | 3-1-2022 | | | | 1,606,199 | | | | 1,597,176 | |
| | | | |
FNMA (11th District Cost of Funds +1.58%) ± | | | 2.68 | | | | 5-1-2023 | | | | 92,628 | | | | 92,796 | |
| | | | |
FNMA (11th District Cost of Funds +1.25%) ± | | | 2.73 | | | | 9-1-2027 | | | | 180,200 | | | | 181,282 | |
| | | | |
FNMA (1 Month LIBOR +0.25%) ± | | | 2.74 | | | | 6-27-2036 | | | | 102,811 | | | | 100,901 | |
| | | | |
FNMA ±± | | | 2.79 | | | | 2-25-2027 | | | | 10,000,000 | | | | 9,744,895 | |
| | | | |
FNMA (1 Month LIBOR +0.35%) ± | | | 2.84 | | | | 2-25-2032 | | | | 558,413 | | | | 558,854 | |
| | | | |
FNMA | | | 2.86 | | | | 11-1-2021 | | | | 2,548,104 | | | | 2,556,091 | |
| | | | |
FNMA | | | 2.91 | | | | 1-1-2024 | | | | 2,790,837 | | | | 2,846,648 | |
| | | | |
FNMA | | | 3.00 | | | | 5-1-2027 | | | | 1,386,920 | | | | 1,390,534 | |
| | | | |
FNMA %% | | | 3.00 | | | | 3-18-2034 | | | | 14,910,000 | | | | 14,879,714 | |
| | | | |
FNMA | | | 3.00 | | | | 4-1-2045 | | | | 126,520 | | | | 123,924 | |
| | | | |
FNMA | | | 3.00 | | | | 11-1-2045 | | | | 10,157,288 | | | | 9,939,440 | |
| | | | |
FNMA | | | 3.00 | | | | 12-1-2045 | | | | 23,358,738 | | | | 22,850,515 | |
| | | | |
FNMA | | | 3.00 | | | | 12-1-2046 | | | | 783,206 | | | | 765,919 | |
| | | | |
FNMA | | | 3.02 | | | | 2-1-2026 | | | | 6,193,816 | | | | 6,175,122 | |
| | | | |
FNMA | | | 3.31 | | | | 9-25-2020 | | | | 3,214,790 | | | | 3,227,994 | |
The accompanying notes are an integral part of these financial statements.
| | | | |
| 12 | | Wells Fargo Government Securities Fund | | Portfolio of investments—February 28, 2019 (unaudited) |
| | | | | | | | | | | | | | | | |
| Security name | | Interest rate | | | Maturity date | | | Principal | | | Value | |
|
Agency Securities(continued) | |
| | | | |
FNMA (11th District Cost of Funds +1.25%) ± | | | 3.36 | % | | | 5-1-2036 | | | $ | 427,494 | | | $ | 439,410 | |
| | | | |
FNMA | | | 3.38 | | | | 9-1-2020 | | | | 1,864,051 | | | | 1,878,821 | |
| | | | |
FNMA | | | 3.49 | | | | 12-1-2020 | | | | 3,360,375 | | | | 3,397,620 | |
| | | | |
FNMA %% | | | 3.50 | | | | 3-18-2034 | | | | 13,320,000 | | | | 13,527,755 | |
| | | | |
FNMA | | | 3.50 | | | | 2-1-2043 | | | | 61,825 | | | | 62,344 | |
| | | | |
FNMA | | | 3.50 | | | | 2-1-2045 | | | | 1,923,581 | | | | 1,934,398 | |
| | | | |
FNMA ## | | | 3.50 | | | | 4-1-2045 | | | | 5,429,828 | | | | 5,455,319 | |
| | | | |
FNMA | | | 3.50 | | | | 8-1-2045 | | | | 702,983 | | | | 706,066 | |
| | | | |
FNMA | | | 3.50 | | | | 12-1-2045 | | | | 2,586,926 | | | | 2,598,272 | |
| | | | |
FNMA | | | 3.50 | | | | 2-1-2046 | | | | 2,490,310 | | | | 2,501,231 | |
| | | | |
FNMA (12 Month LIBOR +1.64%) ± | | | 3.89 | | | | 4-1-2032 | | | | 75,362 | | | | 76,195 | |
| | | | |
FNMA | | | 4.00 | | | | 10-25-2025 | | | | 248,008 | | | | 4,352 | |
| | | | |
FNMA ## | | | 4.00 | | | | 4-1-2046 | | | | 14,852,458 | | | | 15,200,885 | |
| | | | |
FNMA | | | 4.00 | | | | 3-1-2047 | | | | 1,532,223 | | | | 1,577,418 | |
| | | | |
FNMA %% | | | 4.00 | | | | 3-13-2049 | | | | 1,475,000 | | | | 1,503,665 | |
| | | | |
FNMA (1 Year Treasury Constant Maturity +2.20%) ± | | | 4.09 | | | | 2-1-2027 | | | | 3,143 | | | | 3,133 | |
| | | | |
FNMA (1 Year Treasury Constant Maturity +2.22%) ± | | | 4.19 | | | | 6-1-2032 | | | | 114,111 | | | | 118,586 | |
| | | | |
FNMA (1 Year Treasury Constant Maturity +2.21%) ± | | | 4.31 | | | | 9-1-2031 | | | | 29,686 | | | | 31,107 | |
| | | | |
FNMA (1 Year Treasury Constant Maturity +2.23%) ± | | | 4.38 | | | | 12-1-2040 | | | | 25,181 | | | | 26,392 | |
| | | | |
FNMA (1 Year Treasury Constant Maturity +2.30%) ± | | | 4.42 | | | | 6-1-2034 | | | | 459,330 | | | | 478,020 | |
| | | | |
FNMA (1 Year Treasury Constant Maturity +2.27%) ± | | | 4.48 | | | | 9-1-2031 | | | | 237,287 | | | | 247,118 | |
| | | | |
FNMA (12 Month LIBOR +1.54%) ± | | | 4.50 | | | | 1-1-2043 | | | | 362,881 | | | | 374,426 | |
| | | | |
FNMA | | | 4.50 | | | | 1-1-2026 | | | | 123,088 | | | | 125,081 | |
| | | | |
FNMA | | | 4.50 | | | | 10-1-2046 | | | | 424,846 | | | | 440,209 | |
| | | | |
FNMA %% | | | 4.50 | | | | 3-13-2049 | | | | 20,177,000 | | | | 20,874,995 | |
| | | | |
FNMA (12 Month LIBOR +1.78%) ± | | | 4.56 | | | | 8-1-2036 | | | | 544,502 | | | | 569,046 | |
| | | | |
FNMA (12 Month LIBOR +1.73%) ± | | | 4.60 | | | | 9-1-2036 | | | | 445,279 | | | | 463,520 | |
| | | | |
FNMA (1 Year Treasury Constant Maturity +2.19%) ± | | | 4.64 | | | | 11-1-2031 | | | | 124,530 | | | | 130,543 | |
| | | | |
FNMA | | | 4.68 | | | | 2-1-2020 | | | | 3,014,272 | | | | 3,062,208 | |
| | | | |
FNMA (1 Year Treasury Constant Maturity +2.23%) ± | | | 4.69 | | | | 12-1-2034 | | | | 599,328 | | | | 625,812 | |
| | | | |
FNMA (1 Year Treasury Constant Maturity +2.42%) ± | | | 4.79 | | | | 10-1-2027 | | | | 119,327 | | | | 123,351 | |
| | | | |
FNMA | | | 5.00 | | | | 4-1-2023 | | | | 186,581 | | | | 193,210 | |
| | | | |
FNMA | | | 5.00 | | | | 6-1-2023 | | | | 377,790 | | | | 387,004 | |
| | | | |
FNMA | | | 5.00 | | | | 3-1-2034 | | | | 466,162 | | | | 497,875 | |
| | | | |
FNMA | | | 5.00 | | | | 8-1-2040 | | | | 5,798,006 | | | | 6,207,080 | |
| | | | |
FNMA | | | 5.00 | | | | 10-1-2040 | | | | 690,886 | | | | 739,633 | |
| | | | |
FNMA | | | 5.00 | | | | 1-1-2042 | | | | 546,031 | | | | 584,477 | |
| | | | |
FNMA %% | | | 5.00 | | | | 3-13-2049 | | | | 4,025,000 | | | | 4,220,087 | |
| | | | |
FNMA (1 Year Treasury Constant Maturity +2.32%) ± | | | 5.01 | | | | 7-1-2026 | | | | 124,018 | | | | 128,383 | |
| | | | |
FNMA | | | 5.39 | | | | 1-1-2024 | | | | 1,558,099 | | | | 1,636,250 | |
| | | | |
FNMA | | | 5.50 | | | | 6-1-2020 | | | | 106,593 | | | | 107,186 | |
| | | | |
FNMA | | | 5.50 | | | | 11-1-2023 | | | | 62,051 | | | | 64,456 | |
| | | | |
FNMA | | | 5.50 | | | | 1-1-2025 | | | | 29,579 | | | | 30,467 | |
| | | | |
FNMA | | | 5.50 | | | | 1-1-2025 | | | | 142,417 | | | | 146,885 | |
| | | | |
FNMA | | | 5.50 | | | | 9-1-2033 | | | | 1,869,027 | | | | 2,034,279 | |
| | | | |
FNMA | | | 5.50 | | | | 9-1-2033 | | | | 754,421 | | | | 820,562 | |
| | | | |
FNMA | | | 5.50 | | | | 8-1-2035 | | | | 558,900 | | | | 607,980 | |
| | | | |
FNMA | | | 5.50 | | | | 1-1-2037 | | | | 552,793 | | | | 601,504 | |
| | | | |
FNMA | | | 5.50 | | | | 4-1-2040 | | | | 1,442,291 | | | | 1,569,627 | |
| | | | |
FNMA | | | 5.61 | | | | 2-1-2021 | | | | 945,845 | | | | 961,658 | |
The accompanying notes are an integral part of these financial statements.
| | | | | | |
| Portfolio of investments—February 28, 2019 (unaudited) | | Wells Fargo Government Securities Fund | | | 13 | |
| | | | | | | | | | | | | | | | |
| Security name | | Interest rate | | | Maturity date | | | Principal | | | Value | |
|
Agency Securities(continued) | |
| | | | |
FNMA | | | 5.67 | % | | | 11-1-2021 | | | $ | 4,992,485 | | | $ | 5,196,300 | |
| | | | |
FNMA | | | 5.75 | | | | 5-1-2021 | | | | 3,118,110 | | | | 3,237,513 | |
| | | | |
FNMA (6 Month LIBOR +2.86%) ± | | | 5.86 | | | | 4-1-2033 | | | | 11,668 | | | | 12,085 | |
| | | | |
FNMA | | | 5.95 | | | | 6-1-2024 | | | | 1,582,882 | | | | 1,671,484 | |
| | | | |
FNMA | | | 6.00 | | | | 3-1-2024 | | | | 58,832 | | | | 63,235 | |
| | | | |
FNMA | | | 6.00 | | | | 1-1-2028 | | | | 841,260 | | | | 904,270 | |
| | | | |
FNMA | | | 6.00 | | | | 2-1-2035 | | | | 1,218,630 | | | | 1,314,560 | |
| | | | |
FNMA | | | 6.00 | | | | 11-1-2037 | | | | 458,145 | | | | 504,602 | |
| | | | |
FNMA | | | 6.00 | | | | 7-1-2038 | | | | 161,834 | | | | 178,046 | |
| | | | |
FNMA | | | 6.50 | | | | 1-1-2024 | | | | 18,160 | | | | 19,918 | |
| | | | |
FNMA | | | 6.50 | | | | 3-1-2028 | | | | 13,714 | | | | 14,294 | |
| | | | |
FNMA | | | 6.50 | | | | 12-1-2029 | | | | 198,123 | | | | 219,541 | |
| | | | |
FNMA | | | 6.50 | | | | 11-1-2031 | | | | 46,246 | | | | 50,724 | |
| | | | |
FNMA | | | 6.50 | | | | 7-1-2036 | | | | 323,690 | | | | 362,175 | |
| | | | |
FNMA | | | 6.50 | | | | 7-1-2036 | | | | 299,214 | | | | 334,151 | |
| | | | |
FNMA | | | 6.50 | | | | 7-25-2042 | | | | 1,398,037 | | | | 1,566,254 | |
| | | | |
FNMA (6 Month LIBOR +3.13%) ± | | | 6.61 | | | | 7-1-2033 | | | | 139,817 | | | | 143,387 | |
| | | | |
FNMA | | | 7.00 | | | | 11-1-2026 | | | | 5,001 | | | | 5,292 | |
| | | | |
FNMA | | | 7.00 | | | | 9-1-2031 | | | | 3,739 | | | | 3,741 | |
| | | | |
FNMA | | | 7.00 | | | | 1-1-2032 | | | | 2,054 | | | | 2,236 | |
| | | | |
FNMA | | | 7.00 | | | | 2-1-2032 | | | | 81,586 | | | | 93,569 | |
| | | | |
FNMA | | | 7.00 | | | | 10-1-2032 | | | | 173,143 | | | | 197,139 | |
| | | | |
FNMA | | | 7.00 | | | | 2-1-2034 | | | | 1,924 | | | | 2,126 | |
| | | | |
FNMA | | | 7.00 | | | | 4-1-2034 | | | | 127,891 | | | | 145,966 | |
| | | | |
FNMA | | | 7.00 | | | | 1-1-2036 | | | | 6,276 | | | | 6,592 | |
| | | | |
FNMA | | | 7.50 | | | | 9-1-2031 | | | | 80,756 | | | | 92,180 | |
| | | | |
FNMA | | | 7.50 | | | | 11-25-2031 | | | | 362,372 | | | | 413,103 | |
| | | | |
FNMA | | | 7.50 | | | | 2-1-2032 | | | | 30,939 | | | | 35,212 | |
| | | | |
FNMA | | | 7.50 | | | | 10-1-2037 | | | | 818,457 | | | | 963,187 | |
| | | | |
FNMA | | | 8.00 | | | | 5-1-2027 | | | | 27,005 | | | | 27,165 | |
| | | | |
FNMA | | | 8.00 | | | | 6-1-2028 | | | | 4,901 | | | | 5,295 | |
| | | | |
FNMA | | | 8.00 | | | | 2-1-2030 | | | | 52,893 | | | | 57,012 | |
| | | | |
FNMA | | | 8.00 | | | | 7-1-2031 | | | | 898,939 | | | | 1,010,211 | |
| | | | |
FNMA | | | 8.50 | | | | 8-1-2024 | | | | 5,118 | | | | 5,127 | |
| | | | |
FNMA | | | 8.50 | | | | 5-1-2026 | | | | 94,308 | | | | 101,175 | |
| | | | |
FNMA | | | 8.50 | | | | 7-1-2026 | | | | 21,215 | | | | 21,752 | |
| | | | |
FNMA | | | 8.50 | | | | 8-1-2026 | | | | 10,992 | | | | 11,031 | |
| | | | |
FNMA | | | 8.50 | | | | 10-1-2026 | | | | 55 | | | | 55 | |
| | | | |
FNMA | | | 8.50 | | | | 10-1-2026 | | | | 3,534 | | | | 3,540 | |
| | | | |
FNMA | | | 8.50 | | | | 11-1-2026 | | | | 26,453 | | | | 26,749 | |
| | | | |
FNMA | | | 8.50 | | | | 11-1-2026 | | | | 6,916 | | | | 7,100 | |
| | | | |
FNMA | | | 8.50 | | | | 12-1-2026 | | | | 119,304 | | | | 131,381 | |
| | | | |
FNMA | | | 8.50 | | | | 12-1-2026 | | | | 14,805 | | | | 16,108 | |
| | | | |
FNMA | | | 8.50 | | | | 12-1-2026 | | | | 250 | | | | 250 | |
| | | | |
FNMA | | | 8.50 | | | | 2-1-2027 | | | | 166 | | | | 181 | |
| | | | |
FNMA | | | 8.50 | | | | 2-1-2027 | | | | 6,052 | | | | 6,063 | |
| | | | |
FNMA | | | 8.50 | | | | 3-1-2027 | | | | 741 | | | | 783 | |
| | | | |
FNMA | | | 8.50 | | | | 6-1-2027 | | | | 61,352 | | | | 63,163 | |
| | | | |
FNMA | | | 9.00 | | | | 3-1-2021 | | | | 4,669 | | | | 4,697 | |
| | | | |
FNMA | | | 9.00 | | | | 6-1-2021 | | | | 55 | | | | 57 | |
The accompanying notes are an integral part of these financial statements.
| | | | |
| 14 | | Wells Fargo Government Securities Fund | | Portfolio of investments—February 28, 2019 (unaudited) |
| | | | | | | | | | | | | | | | |
| Security name | | Interest rate | | | Maturity date | | | Principal | | | Value | |
|
Agency Securities(continued) | |
| | | | |
FNMA | | | 9.00 | % | | | 7-1-2021 | | | $ | 1,912 | | | $ | 1,917 | |
| | | | |
FNMA | | | 9.00 | | | | 8-1-2021 | | | | 64 | | | | 67 | |
| | | | |
FNMA | | | 9.00 | | | | 10-1-2021 | | | | 691 | | | | 695 | |
| | | | |
FNMA | | | 9.00 | | | | 1-1-2025 | | | | 14,881 | | | | 15,996 | |
| | | | |
FNMA | | | 9.00 | | | | 3-1-2025 | | | | 1,784 | | | | 1,787 | |
| | | | |
FNMA | | | 9.00 | | | | 3-1-2025 | | | | 900 | | | | 902 | |
| | | | |
FNMA | | | 9.00 | | | | 4-1-2025 | | | | 320 | | | | 320 | |
| | | | |
FNMA | | | 9.00 | | | | 7-1-2028 | | | | 4,152 | | | | 4,182 | |
| | | | |
FNMA | | | 9.50 | | | | 11-1-2020 | | | | 22 | | | | 22 | |
| | | | |
FNMA | | | 9.50 | | | | 12-15-2020 | | | | 5,322 | | | | 5,369 | |
| | | | |
FNMA | | | 9.50 | | | | 6-1-2022 | | | | 406 | | | | 409 | |
| | | | |
FNMA | | | 9.50 | | | | 7-1-2028 | | | | 5,427 | | | | 5,440 | |
| | | | |
FNMA | | | 11.00 | | | | 10-15-2020 | | | | 168 | | | | 170 | |
| | | | |
FNMA Series 1989-100 Class Z | | | 8.75 | | | | 12-25-2019 | | | | 1,829 | | | | 1,846 | |
| | | | |
FNMA Series 1989-12 Class Y | | | 10.00 | | | | 3-25-2019 | | | | 125 | | | | 125 | |
| | | | |
FNMA Series 1989-22 Class G | | | 10.00 | | | | 5-25-2019 | | | | 1,959 | | | | 1,962 | |
| | | | |
FNMA Series 1989-63 Class Z | | | 9.40 | | | | 10-25-2019 | | | | 297 | | | | 300 | |
| | | | |
FNMA Series 1990-144 Class W | | | 9.50 | | | | 12-25-2020 | | | | 10,896 | | | | 11,368 | |
| | | | |
FNMA Series 1990-75 Class Z | | | 9.50 | | | | 7-25-2020 | | | | 21,655 | | | | 22,300 | |
| | | | |
FNMA Series 1990-84 Class Y | | | 9.00 | | | | 7-25-2020 | | | | 2,034 | | | | 2,091 | |
| | | | |
FNMA Series 1990-96 Class Z | | | 9.67 | | | | 8-25-2020 | | | | 27,935 | | | | 28,849 | |
| | | | |
FNMA Series 1991-5 Class Z | | | 8.75 | | | | 1-25-2021 | | | | 4,116 | | | | 4,162 | |
| | | | |
FNMA Series 1991-85 Class Z | | | 8.00 | | | | 6-25-2021 | | | | 14,650 | | | | 15,203 | |
| | | | |
FNMA Series 1992-45 Class Z | | | 8.00 | | | | 4-25-2022 | | | | 39,502 | | | | 41,525 | |
| | | | |
FNMA Series 1999-W6 Class A ±± | | | 9.73 | | | | 9-25-2028 | | | | 438 | | | | 437 | |
| | | | |
FNMA Series 2000-T6 Class A2 | | | 9.50 | | | | 11-25-2040 | | | | 670,535 | | | | 753,939 | |
| | | | |
FNMA Series 2001-T10 Class A3 | | | 9.50 | | | | 12-25-2041 | | | | 872,101 | | | | 1,001,493 | |
| | | | |
FNMA Series 2001-T12 Class A3 | | | 9.50 | | | | 8-25-2041 | | | | 241,474 | | | | 285,000 | |
| | | | |
FNMA Series 2002-T12 Class A5 ±± | | | 4.80 | | | | 10-25-2041 | | | | 826,109 | | | | 843,501 | |
| | | | |
FNMA Series 2002-T19 Class A1 | | | 6.50 | | | | 7-25-2042 | | | | 3,890,028 | | | | 4,406,731 | |
| | | | |
FNMA Series 2002-T5 Class A1 (1 Month LIBOR +0.24%) ± | | | 2.73 | | | | 5-25-2032 | | | | 176,696 | | | | 174,194 | |
| | | | |
FNMA Series 2002-W4 Class A4 | | | 6.25 | | | | 5-25-2042 | | | | 597,305 | | | | 658,457 | |
| | | | |
FNMA Series 2003-T2 Class A1 (1 Month LIBOR +0.14%) ± | | | 2.79 | | | | 3-25-2033 | | | | 1,032,894 | | | | 1,012,542 | |
| | | | |
FNMA Series 2003-W09 Class A (1 Month LIBOR +0.12%) ± | | | 2.84 | | | | 6-25-2033 | | | | 87,752 | | | | 86,196 | |
| | | | |
FNMA Series 2003-W1 Class 1A1 ±± | | | 5.37 | | | | 12-25-2042 | | | | 567,394 | | | | 597,211 | |
| | | | |
FNMA Series 2003-W11 Class A1 ±± | | | 5.63 | | | | 6-25-2033 | | | | 50,376 | | | | 52,613 | |
| | | | |
FNMA Series 2003-W3 Class 1A4 ±± | | | 4.17 | | | | 8-25-2042 | | | | 2,440,467 | | | | 2,525,036 | |
| | | | |
FNMA Series 2003-W5 Class A (1 Month LIBOR +0.11%) ± | | | 2.82 | | | | 4-25-2033 | | | | 303,942 | | | | 297,287 | |
| | | | |
FNMA Series 2003-W6 Class 6A ±± | | | 4.42 | | | | 8-25-2042 | | | | 1,463,531 | | | | 1,490,080 | |
| | | | |
FNMA Series 2003-W6 Class PT4 ±± | | | 8.66 | | | | 10-25-2042 | | | | 1,417,074 | | | | 1,724,565 | |
| | | | |
FNMA Series 2003-W8 Class PT1 ±± | | | 10.64 | | | | 12-25-2042 | | | | 533,034 | | | | 600,427 | |
| | | | |
FNMA Series 2004-79 Class FA (1 Month LIBOR +0.29%) ± | | | 2.78 | | | | 8-25-2032 | | | | 191,854 | | | | 191,914 | |
| | | | |
FNMA Series 2004-T1 Class 1A2 | | | 6.50 | | | | 1-25-2044 | | | | 543,548 | | | | 607,777 | |
| | | | |
FNMA Series 2004-W01 Class 2A2 | | | 7.00 | | | | 12-25-2033 | | | | 1,166,374 | | | | 1,334,899 | |
| | | | |
FNMA Series 2004-W15 Class 1A3 | | | 7.00 | | | | 8-25-2044 | | | | 737,428 | | | | 837,462 | |
| | | | |
FNMA Series 2005-71 Class DB | | | 4.50 | | | | 8-25-2025 | | | | 541,092 | | | | 547,428 | |
| | | | |
FNMA Series 2007-W10 Class 2A ±± | | | 6.34 | | | | 8-25-2047 | | | | 356,409 | | | | 383,779 | |
| | | | |
FNMA Series 2011-15 Class HI (c) | | | 5.50 | | | | 3-25-2026 | | | | 274,529 | | | | 9,363 | |
| | | | |
FNMA Series 2013-17 Class PC | | | 2.00 | | | | 3-25-2039 | | | | 1,627,454 | | | | 1,607,495 | |
| | | | |
FNMA Series 2014-20 Class TM ±± | | | 4.60 | | | | 4-25-2044 | | | | 1,414,220 | | | | 1,559,177 | |
The accompanying notes are an integral part of these financial statements.
| | | | | | |
| Portfolio of investments—February 28, 2019 (unaudited) | | Wells Fargo Government Securities Fund | | | 15 | |
| | | | | | | | | | | | | | | | |
| Security name | | Interest rate | | | Maturity date | | | Principal | | | Value | |
|
Agency Securities(continued) | |
| | | | |
FNMA Series 2015-M10 Class FA (1 Month LIBOR +0.25%) ± | | | 2.75 | % | | | 3-25-2019 | | | $ | 10,743 | | | $ | 10,724 | |
| | | | |
FNMA Series 2018-M13 Class A2 ±± | | | 3.70 | | | | 9-25-2030 | | | | 460,000 | | | | 472,382 | |
| | | | |
FNMA Series 265 Class 2 | | | 9.00 | | | | 3-25-2024 | | | | 59,929 | | | | 66,676 | |
| | | | |
FNMA Series G-8 Class E | | | 9.00 | | | | 4-25-2021 | | | | 18,902 | | | | 19,400 | |
| | | | |
FNMA Series G92-30 Class Z | | | 7.00 | | | | 6-25-2022 | | | | 26,686 | | | | 27,400 | |
| | | | |
FNMA Series G93-39 Class ZQ | | | 6.50 | | | | 12-25-2023 | | | | 919,051 | | | | 966,593 | |
| | | | |
GNMA | | | 3.00 | | | | 11-20-2045 | | | | 10,996,528 | | | | 10,887,043 | |
| | | | |
GNMA (1 Year Treasury Constant Maturity +0.45%) ± | | | 3.04 | | | | 5-20-2066 | | | | 5,529,539 | | | | 5,526,629 | |
| | | | |
GNMA (1 Month LIBOR +0.70%) ± | | | 3.21 | | | | 8-20-2065 | | | | 3,570,855 | | | | 3,601,007 | |
| | | | |
GNMA (1 Month LIBOR +0.73%) ± | | | 3.24 | | | | 9-20-2063 | | | | 4,115,958 | | | | 4,139,013 | |
| | | | |
GNMA (1 Month LIBOR +0.90%) ± | | | 3.41 | | | | 8-20-2065 | | | | 3,766,469 | | | | 3,808,655 | |
| | | | |
GNMA (1 Month LIBOR +0.90%) ± | | | 3.41 | | | | 4-20-2066 | | | | 4,926,040 | | | | 4,984,395 | |
| | | | |
GNMA | | | 3.50 | | | | 12-20-2047 | | | | 14,108,784 | | | | 14,238,476 | |
| | | | |
GNMA %% | | | 3.50 | | | | 3-21-2049 | | | | 8,105,000 | | | | 8,173,861 | |
| | | | |
GNMA (1 Year Treasury Constant Maturity +1.50%) ± | | | 4.00 | | | | 8-20-2020 | | | | 28,867 | | | | 28,869 | |
| | | | |
GNMA | | | 4.00 | | | | 11-15-2024 | | | | 1,406,752 | | | | 1,442,678 | |
| | | | |
GNMA | | | 4.00 | | | | 12-20-2047 | | | | 10,723,288 | | | | 11,013,265 | |
| | | | |
GNMA (1 Year Treasury Constant Maturity +1.50%) ± | | | 4.13 | | | | 11-20-2020 | | | | 16,445 | | | | 16,460 | |
| | | | |
GNMA | | | 4.25 | | | | 6-20-2036 | | | | 483,414 | | | | 505,093 | |
| | | | |
GNMA | | | 4.50 | | | | 10-20-2048 | | | | 3,158,081 | | | | 3,270,726 | |
| | | | |
GNMA | | | 5.00 | | | | 7-20-2040 | | | | 1,201,371 | | | | 1,286,138 | |
| | | | |
GNMA %% | | | 5.00 | | | | 3-21-2049 | | | | 6,085,000 | | | | 6,337,148 | |
| | | | |
GNMA | | | 5.50 | | | | 4-20-2034 | | | | 727,510 | | | | 767,951 | |
| | | | |
GNMA | | | 6.00 | | | | 8-20-2034 | | | | 105,396 | | | | 112,078 | |
| | | | |
GNMA | | | 6.50 | | | | 12-15-2025 | | | | 23,719 | | | | 26,058 | |
| | | | |
GNMA | | | 6.50 | | | | 5-15-2029 | | | | 638 | | | | 701 | |
| | | | |
GNMA | | | 6.50 | | | | 5-15-2031 | | | | 1,246 | | | | 1,369 | |
| | | | |
GNMA | | | 6.50 | | | | 9-20-2033 | | | | 46,786 | | | | 52,651 | |
| | | | |
GNMA | | | 7.00 | | | | 12-15-2022 | | | | 12,513 | | | | 12,904 | |
| | | | |
GNMA | | | 7.00 | | | | 5-15-2026 | | | | 1,827 | | | | 1,915 | |
| | | | |
GNMA | | | 7.00 | | | | 3-15-2028 | | | | 36,172 | | | | 38,061 | |
| | | | |
GNMA | | | 7.00 | | | | 4-15-2031 | | | | 925 | | | | 938 | |
| | | | |
GNMA | | | 7.00 | | | | 8-15-2031 | | | | 18,919 | | | | 19,493 | |
| | | | |
GNMA | | | 7.00 | | | | 3-15-2032 | | | | 14,180 | | | | 14,395 | |
| | | | |
GNMA | | | 7.34 | | | | 10-20-2021 | | | | 21,987 | | | | 22,125 | |
| | | | |
GNMA | | | 7.34 | | | | 2-20-2022 | | | | 533 | | | | 532 | |
| | | | |
GNMA | | | 7.34 | | | | 9-20-2022 | | | | 6,980 | | | | 6,989 | |
| | | | |
GNMA | | | 8.00 | | | | 6-15-2023 | | | | 2,825 | | | | 2,969 | |
| | | | |
GNMA | | | 8.00 | | | | 12-15-2023 | | | | 163,379 | | | | 174,765 | |
| | | | |
GNMA | | | 8.00 | | | | 2-15-2024 | | | | 558 | | | | 591 | |
| | | | |
GNMA | | | 8.00 | | | | 9-15-2024 | | | | 2,865 | | | | 2,902 | |
| | | | |
GNMA | | | 8.00 | | | | 6-15-2025 | | | | 55 | | | | 56 | |
| | | | |
GNMA | | | 8.35 | | | | 4-15-2020 | | | | 12,245 | | | | 12,265 | |
| | | | |
GNMA | | | 8.40 | | | | 5-15-2020 | | | | 13,644 | | | | 13,670 | |
| | | | |
GNMA | | | 9.50 | | | | 10-20-2019 | | | | 121 | | | | 121 | |
| | | | |
GNMA Series 2002-53 Class IO ±±(c) | | | 0.60 | | | | 4-16-2042 | | | | 411,754 | | | | 20 | |
| | | | |
GNMA Series 2005-23 Class IO ±±(c) | | | 0.02 | | | | 6-17-2045 | | | | 1,901,765 | | | | 977 | |
| | | | |
GNMA Series 2006-32 Class XM ±±(c) | | | 0.03 | | | | 11-16-2045 | | | | 5,936,887 | | | | 5,657 | |
| | | | |
GNMA Series 2006-68 Class D ±± | | | 5.31 | | | | 12-16-2037 | | | | 458,982 | | | | 459,534 | |
| | | | |
GNMA Series 2007-69 Class D ±± | | | 5.25 | | | | 6-16-2041 | | | | 475,001 | | | | 485,820 | |
The accompanying notes are an integral part of these financial statements.
| | | | |
| 16 | | Wells Fargo Government Securities Fund | | Portfolio of investments—February 28, 2019 (unaudited) |
| | | | | | | | | | | | | | | | |
| Security name | | Interest rate | | | Maturity date | | | Principal | | | Value | |
|
Agency Securities(continued) | |
| | | | |
GNMA Series 2008-22 Class XM ±±(c) | | | 1.00 | % | | | 2-16-2050 | | | $ | 14,265,257 | | | $ | 359,251 | |
| | | | |
GNMA Series 2010-158 Class EI | | | 4.00 | | | | 12-16-2025 | | | | 9,290,070 | | | | 773,681 | |
| | | | |
GNMA Series 2012-12 Class HD | | | 2.00 | | | | 5-20-2062 | | | | 915,523 | | | | 910,194 | |
| | | | |
GNMA Series 2016-H07 Class FE (1 Month LIBOR +1.15%) ± | | | 3.66 | | | | 3-20-2066 | | | | 4,306,936 | | | | 4,401,192 | |
| | | | |
GNMA Series 2016-H07 Class FH (1 Month LIBOR +1.00%) ± | | | 3.51 | | | | 2-20-2066 | | | | 3,978,547 | | | | 4,040,974 | |
| | | | |
Resolution Funding Corporation STRIPS ¤ | | | 0.00 | | | | 7-15-2020 | | | | 14,300,000 | | | | 13,796,338 | |
| | | | |
Resolution Funding Corporation STRIPS ¤ | | | 0.00 | | | | 4-15-2030 | | | | 6,100,000 | | | | 4,261,746 | |
| | | | |
Resolution Funding Corporation STRIPS ¤ | | | 0.00 | | | | 5-15-2039 | | | | 8,275,000 | | | | 4,467,276 | |
| | | | |
TVA ¤ | | | 0.00 | | | | 11-1-2025 | | | | 10,000,000 | | | | 8,181,028 | |
| | | | |
TVA | | | 2.88 | | | | 2-1-2027 | | | | 2,430,000 | | | | 2,412,256 | |
| | | | |
TVA | | | 4.63 | | | | 9-15-2060 | | | | 7,550,000 | | | | 9,055,183 | |
| | | | |
TVA | | | 5.38 | | | | 4-1-2056 | | | | 2,385,000 | | | | 3,200,773 | |
| | | | |
TVA | | | 5.88 | | | | 4-1-2036 | | | | 4,380,000 | | | | 5,665,600 | |
| |
Total Agency Securities (Cost $511,615,628) | | | | 512,319,303 | |
| | | | | | | | | | | | | | | | |
| | | | |
Asset-Backed Securities: 1.03% | | | | | | | | | | | | | | | | |
| | | | |
MMAF Equipment Finance LLC Series 2017-AA Class A4 144A | | | 2.41 | | | | 8-16-2024 | | | | 4,445,000 | | | | 4,376,583 | |
| | | | |
Tesla Auto Lease Trust Series 2018-B Class A 144A | | | 3.71 | | | | 8-20-2021 | | | | 1,595,223 | | | | 1,611,211 | |
| |
Total Asset-Backed Securities (Cost $6,040,119) | | | | 5,987,794 | |
| | | | | | | | | | | | | | | | |
| | | | |
Corporate Bonds and Notes: 1.09% | | | | | | | | | | | | | | | | |
| | | | |
Financials: 1.09% | | | | | | | | | | | | | | | | |
| | | | |
| Banks: 0.42% | | | | | | | | | | | | | | | | |
| | | | |
Inter-American Development Bank | | | 7.00 | | | | 6-15-2025 | | | | 2,000,000 | | | | 2,428,156 | |
| | | | | | | | | | | | | | | | |
| | | | |
| Mortgage REITs: 0.67% | | | | | | | | | | | | | | | | |
| | | | |
American Tower Trust I 144A | | | 3.65 | | | | 3-15-2048 | | | | 4,000,000 | | | | 3,926,642 | |
| | | | | | | | | | | | | | | | |
| | | | |
Total Corporate Bonds and Notes (Cost $6,409,685) | | | | | | | | | | | | | | | 6,354,798 | |
| | | | | | | | | | | | | | | | |
| | | | |
Municipal Obligations: 1.67% | | | | | | | | | | | | | | | | |
| | | | |
New Jersey: 0.61% | | | | | | | | | | | | | | | | |
| | | | |
| GO Revenue: 0.61% | | | | | | | | | | | | | | | | |
| | | | |
Newark NJ | | | 3.75 | | | | 11-1-2019 | | | | 3,515,000 | | | | 3,524,384 | |
| | | | | | | | | | | | | | | | |
| | | | |
Texas: 1.06% | | | | | | | | | | | | | | | | |
| | | | |
| Miscellaneous Revenue: 1.06% | | | | | | | | | | | | | | | | |
| | | | |
San Antonio TX Retama Development Corporation | | | 10.00 | | | | 12-15-2020 | | | | 5,405,000 | | | | 6,182,077 | |
| | | | | | | | | | | | | | | | |
| |
Total Municipal Obligations (Cost $9,367,233) | | | | 9,706,461 | |
| | | | | | | | | | | | | | | | |
| | | | |
Non-Agency Mortgage-Backed Securities: 4.82% | | | | | | | | | | | | | | | | |
| | | | |
Benchmark Mortgage Trust Series 2018-B1 Class A4 | | | 3.40 | | | | 1-15-2051 | | | | 305,000 | | | | 302,744 | |
| | | | |
CD Commercial Mortgage Trust Series 2017-6 Class A5 | | | 3.46 | | | | 11-13-2050 | | | | 2,340,000 | | | | 2,326,122 | |
| | | | |
CGBAM Commercial Mortgage Trust Series 2015-SMRT Class A 144A | | | 2.81 | | | | 4-10-2028 | | | | 5,000,000 | | | | 4,988,091 | |
| | | | |
GS Mortgage Securities Trust Series 2013-G1 Class A2 144A±± | | | 3.56 | | | | 4-10-2031 | | | | 5,349,842 | | | | 5,316,797 | |
| | | | |
JPMorgan Chase Commercial Mortgage Securities Corporation Series 2015-C28 Class A4 | | | 3.23 | | | | 10-15-2048 | | | | 5,000,000 | | | | 4,976,688 | |
| | | | |
Morgan Stanley Capital I Trust Series 2011-C2 Class A4 144A | | | 4.66 | | | | 6-15-2044 | | | | 4,900,000 | | | | 5,036,058 | |
| | | | |
Northwood %%(a) | | | 3.86 | | | | 2-1-2049 | | | | 849,000 | | | | 879,113 | |
The accompanying notes are an integral part of these financial statements.
| | | | | | |
| Portfolio of investments—February 28, 2019 (unaudited) | | Wells Fargo Government Securities Fund | | | 17 | |
| | | | | | | | | | | | | | | | |
| Security name | | Interest rate | | | Maturity date | | | Principal | | | Value | |
| | | | |
Non-Agency Mortgage-Backed Securities(continued) | | | | | | | | | | | | | | | | |
| | | | |
UBS Commercial Mortgage Trust Series 2017-C5 Class A5 | | | 3.47 | % | | | 11-15-2050 | | | $ | 2,581,000 | | | $ | 2,558,664 | |
| | | | |
Vendee Mortgage Trust Series 1995-1 Class 4 ±± | | | 8.30 | | | | 2-15-2025 | | | | 152,347 | | | | 167,013 | |
| | | | |
Vendee Mortgage Trust Series 1995-2C Class 3A | | | 8.79 | | | | 6-15-2025 | | | | 203,817 | | | | 227,780 | |
| | | | |
Vendee Mortgage Trust Series 2011-1 Class DA | | | 3.75 | | | | 2-15-2035 | | | | 1,275,376 | | | | 1,288,032 | |
| |
Total Non-Agency Mortgage-Backed Securities (Cost $28,556,011) | | | | 28,067,102 | |
| | | | | | | | | | | | | | | | |
| | | | |
U.S. Treasury Securities: 8.91% | | | | | | | | | | | | | | | | |
| | | | |
TIPS | | | 1.38 | | | | 2-15-2044 | | | | 2,959,385 | | | | 3,122,555 | |
| | | | |
U.S. Treasury Bond ## | | | 2.88 | | | | 5-15-2028 | | | | 1,170,000 | | | | 1,185,722 | |
| | | | |
U.S. Treasury Bond ## | | | 3.63 | | | | 8-15-2043 | | | | 5,170,000 | | | | 5,660,746 | |
| | | | |
U.S. Treasury Bond ## | | | 3.63 | | | | 2-15-2044 | | | | 7,065,000 | | | | 7,740,039 | |
| | | | |
U.S. Treasury Bond ## | | | 3.75 | | | | 8-15-2041 | | | | 3,310,000 | | | | 3,696,856 | |
| | | | |
U.S. Treasury Bond ## | | | 3.75 | | | | 11-15-2043 | | | | 9,770,000 | | | | 10,913,395 | |
| | | | |
U.S. Treasury Bond ## | | | 4.25 | | | | 11-15-2040 | | | | 10,330,000 | | | | 12,374,210 | |
| | | | |
U.S. Treasury Note ## | | | 2.88 | | | | 9-30-2023 | | | | 4,000,000 | | | | 4,059,219 | |
| | | | |
U.S. Treasury Note ## | | | 3.00 | | | | 2-15-2049 | | | | 3,170,000 | | | | 3,117,249 | |
| |
Total U.S. Treasury Securities (Cost $52,006,139) | | | | 51,869,991 | |
| | | | | | | | | | | | | | | | |
| | | | |
Yankee Government Bonds: 5.43% | | | | | | | | | | | | | | | | |
| | | | |
Hashemite Kingdom of Jordan | | | 3.00 | | | | 6-30-2025 | | | | 10,636,000 | | | | 10,684,533 | |
| | | | |
State of Israel | | | 5.50 | | | | 12-4-2023 | | | | 9,030,000 | | | | 10,165,047 | |
| | | | |
Ukraine | | | 1.47 | | | | 9-29-2021 | | | | 11,090,000 | | | | 10,778,038 | |
| |
Total Yankee Government Bonds (Cost $32,861,176) | | | | 31,627,618 | |
| | | | | | | | | | | | | | | | |
| | | | |
| | | Yield | | | | | | Shares | | | | |
| Short-Term Investments: 0.83% | | | | | | | | | | | | | | | | |
| | | |
| Investment Companies: 0.45% | | | | | | | | | | | | | |
| | | | |
Wells Fargo Government Money Market Fund Select Class (l)(u)## | | | 2.34 | | | | | | | | 2,599,775 | | | | 2,599,775 | |
| | | | | | | | | | | | | | | | |
| | | | |
| | | Interest rate | | | | | | Principal | | | | |
| U.S. Treasury Securities: 0.38% | | | | | | | | | | | | | | | | |
| | | | |
U.S. Treasury Bill (z)# | | | 2.21 | | | | 3-14-2019 | | | $ | 2,225,000 | | | | 2,223,111 | |
| | | | | | | | | | | | | | | | |
| |
Total Short-Term Investments (Cost $4,822,867) | | | | 4,822,886 | |
| | | | | | | | | | | | | | | | |
| | | | | | | | |
| Total investments in securities (Cost $651,678,858) | | | 111.82 | % | | | 650,755,953 | |
| | |
Other assets and liabilities, net | | | (11.82 | ) | | | (68,805,616 | ) |
| | | | | | | | |
| Total net assets | | | 100.00 | % | | $ | 581,950,337 | |
| | | | | | | | |
The accompanying notes are an integral part of these financial statements.
| | | | |
| 18 | | Wells Fargo Government Securities Fund | | Portfolio of investments—February 28, 2019 (unaudited) |
| 144A | The security may be resold in transactions exempt from registration, normally to qualified institutional buyers, pursuant to Rule 144A under the Securities Act of 1933. |
| ± | Variable rate investment. The rate shown is the rate in effect at period end. |
| ±± | The coupon of the security is adjusted based on the principal and interest payments received from the underlying pool of mortgages as well as the credit quality and the actual prepayment speed of the underlying mortgages. |
| (c) | Investment in an interest-only security entitles holders to receive only the interest payments on the underlying mortgages. The principal amount shown is the notional amount of the underlying mortgages. The rate represents the coupon rate. |
| %% | The security is issued on a when-issued basis. |
| ## | All or a portion of this security is segregated for when-issued securities. |
| ¤ | The security is issued in zero coupon form with no periodic interest payments. |
| (a) | The security is fair valued in accordance with procedures approved by the Board of Trustees. |
| (l) | The issuer of the security is an affiliated person of the Fund as defined in the Investment Company Act of 1940. |
| (u) | The rate represents the 7-day annualized yield at period end. |
| (z) | Zero coupon security. The rate represents the current yield to maturity. |
| # | All or a portion of this security is segregated as collateral for investments in derivative instruments. |
Abbreviations:
| FDIC | Federal Deposit Insurance Corporation |
| FHLB | Federal Home Loan Bank |
| FHLMC | Federal Home Loan Mortgage Corporation |
| FNMA | Federal National Mortgage Association |
| GNMA | Government National Mortgage Association |
| LIBOR | London Interbank Offered Rate |
| STRIPS | Separate trading of registered interest and principal securities |
| TIPS | Treasury inflation-protected securities |
| TVA | Tennessee Valley Authority |
Futures Contracts
| | | | | | | | | | | | | | | | | | | | | | | | |
| Description | | Number of
contracts | | | Expiration
date | | | Notional
cost | | | Notional
value | | | Unrealized
gains | | | Unrealized
losses | |
| | | | | | |
Long | | | | | | | | | | | | | | | | | | | | | | | | |
| | | | | | |
5-Year U.S. Treasury Notes | | | 259 | | | | 6-28-2019 | | | $ | 29,687,387 | | | $ | 29,671,688 | | | $ | 0 | | | $ | (15,699 | ) |
| | | | | | |
10-Year U.S. Treasury Notes | | | 55 | | | | 6-19-2019 | | | | 6,720,363 | | | | 6,710,000 | | | | 0 | | | | (10,363 | ) |
| | | | | | |
Short | | | | | | | | | | | | | | | | | | | | | | | | |
| | | | | | |
U.S. Long Term Bonds | | | (132) | | | | 6-19-2019 | | | | (19,185,144 | ) | | | (19,069,875 | ) | | | 115,269 | | | | 0 | |
| | | | | | |
U.S. Ultra Bond | | | (35) | | | | 6-19-2019 | | | | (5,654,459 | ) | | | (5,585,781 | ) | | | 68,678 | | | | 0 | |
| | | | | | |
10-Year Ultra Futures | | | (69) | | | | 6-19-2019 | | | | (8,973,600 | ) | | | (8,932,266 | ) | | | 41,334 | | | | 0 | |
| | | | | | |
2-Year U.S. Treasury Notes | | | (105) | | | | 6-28-2019 | | | | (22,293,313 | ) | | | (22,280,508 | ) | | | 12,805 | | | | 0 | |
| | | | | | | | | | | | | | | | | | | | | | | | |
| | | | | | |
| | | | | | | | | | | | | | | | | | $ | 238,086 | | | $ | (26,062 | ) |
| | | | | | | | | | | | | | | | | | | | | | | | |
Investments in Affiliates
An affiliated investment is an investment in which the Fund owns at least 5% of the outstanding voting shares of the issuer or as a result of other relationships, such as the Fund and the issuer having the same investment manager. Transactions with issuers that were either affiliated persons of the Fund at the beginning of the period or the end of the period were as follows:
| | | | | | | | | | | | | | | | | | | | | | | | | | | | | | | | | | | | |
| | | Shares,
beginning of
period | | | Shares
purchased | | | Shares
sold | | | Shares,
end of
period | | | Net
realized
gains
(losses) | | | Net
change in
unrealized
gains
(losses) | | | Income
from
affiliated
securities | | | Value,
end
of period | | | % of
net
assets | |
Short-Term Investments | | | | | | | | | | | | | | | | | | | | | | | | | | | | | | | | | | | | |
Investment Companies | | | | | | | | | | | | | | | | | | | | | | | | | | | | | | | | | | | | |
Wells Fargo Government Money Market Fund Select Class | | | 18,303,812 | | | | 106,002,394 | | | | 121,706,431 | | | | 2,599,775 | | | $ | 0 | | | $ | 0 | | | $ | 317,033 | | | $ | 2,599,775 | | | | 0.45 | % |
The accompanying notes are an integral part of these financial statements.
| | | | | | |
| Statement of assets and liabilities—February 28, 2019 (unaudited) | | Wells Fargo Government Securities Fund | | | 19 | |
| | | | |
| | | | |
| |
Assets | | | | |
Investments in unaffiliated securities, at value (cost $649,079,083) | | $ | 648,156,178 | |
Investments in affiliated securities, at value (cost $2,599,775) | | | 2,599,775 | |
Receivable for investments sold | | | 31,441,950 | |
Receivable for interest | | | 2,698,235 | |
Receivable for Fund shares sold | | | 641,172 | |
Receivable for daily variation margin on open futures contracts | | | 110,016 | |
Principal paydown receivable | | | 84,010 | |
Prepaid expenses and other assets | | | 52,014 | |
| | | | |
Total assets | | | 685,783,350 | |
| | | | |
| |
Liabilities | | | | |
Payable for investments purchased | | | 102,278,776 | |
Payable for Fund shares redeemed | | | 754,755 | |
Distributions payable | | | 196,047 | |
Management fee payable | | | 184,609 | |
Collateral due to broker | | | 146,357 | |
Administration fees payable | | | 61,379 | |
Payable for daily variation margin on open futures contracts | | | 42,383 | |
Distribution fee payable | | | 6,969 | |
Trustees’ fees and expenses payable | | | 2,847 | |
Accrued expenses and other liabilities | | | 158,891 | |
| | | | |
Total liabilities | | | 103,833,013 | |
| | | | |
Total net assets | | $ | 581,950,337 | |
| | | | |
| |
NET ASSETS CONSIST OF | | | | |
Paid-in capital | | $ | 616,739,061 | |
Total distributable loss | | | (34,788,724 | ) |
| | | | |
Total net assets | | $ | 581,950,337 | |
| | | | |
| |
COMPUTATION OF NET ASSET VALUE AND OFFERING PRICE PER SHARE | | | | |
Net assets – Class A | | $ | 273,946,112 | |
Shares outstanding – Class A1 | | | 25,569,160 | |
Net asset value per share – Class A | | | $10.71 | |
Maximum offering price per share – Class A2 | | | $11.21 | |
Net assets – Class C | | $ | 11,313,424 | |
Shares outstanding – Class C1 | | | 1,056,129 | |
Net asset value per share – Class C | | | $10.71 | |
Net assets – Administrator Class | | $ | 86,122,392 | |
Shares outstanding – Administrator Class1 | | | 8,040,585 | |
Net asset value per share – Administrator Class | | | $10.71 | |
Net assets – Institutional Class | | $ | 210,568,409 | |
Shares outstanding – Institutional Class1 | | | 19,661,225 | |
Net asset value per share – Institutional Class | | | $10.71 | |
| 1 | The Fund has an unlimited number of authorized shares. |
| 2 | Maximum offering price is computed as 100/95.50 of net asset value. On investments of $50,000 or more, the offering price is reduced. |
The accompanying notes are an integral part of these financial statements.
| | | | |
| 20 | | Wells Fargo Government Securities Fund | | Statement of operations—six months ended February 28, 2019 (unaudited) |
| | | | |
| | | | |
| |
Investment income | | | | |
Interest | | $ | 9,857,939 | |
Income from affiliated securities | | | 317,033 | |
| | | | |
Total investment income | | | 10,174,972 | |
| | | | |
| |
Expenses | | | | |
Management fee | | | 1,515,100 | |
Administration fees | | | | |
Class A | | | 219,657 | |
Class C | | | 11,121 | |
Administrator Class | | | 43,130 | |
Institutional Class | | | 123,827 | |
Shareholder servicing fees | | | | |
Class A | | | 343,214 | |
Class C | | | 17,377 | |
Administrator Class | | | 107,040 | |
Distribution fee | | | | |
Class C | | | 52,130 | |
Custody and accounting fees | | | 37,186 | |
Professional fees | | | 39,500 | |
Registration fees | | | 31,698 | |
Shareholder report expenses | | | 56,082 | |
Trustees’ fees and expenses | | | 10,728 | |
Other fees and expenses | | | 8,424 | |
| | | | |
Total expenses | | | 2,616,214 | |
Less: Fee waivers and/or expense reimbursements | | | (319,076 | ) |
| | | | |
Net expenses | | | 2,297,138 | |
| | | | |
Net investment income | | | 7,877,834 | |
| | | | |
| |
REALIZED AND UNREALIZED GAINS (LOSSES) ON INVESTMENTS | | | | |
| |
Net realized gains (losses) on: | | | | |
Unaffiliated securities | | | (1,539,648 | ) |
Futures contracts | | | 7,725 | |
| | | | |
Net realized losses on investments | | | (1,531,923 | ) |
| | | | |
| |
Net change in unrealized gains (losses) on: | | | | |
Unaffiliated securities | | | 6,784,052 | |
Futures contracts | | | 289,016 | |
| | | | |
Net change in unrealized gains (losses) on investments | | | 7,073,068 | |
| | | | |
Net realized and unrealized gains (losses) on investments | | | 5,541,145 | |
| | | | |
Net increase in net assets resulting from operations | | $ | 13,418,979 | |
| | | | |
The accompanying notes are an integral part of these financial statements.
| | | | | | |
| Statement of changes in net assets | | Wells Fargo Government Securities Fund | | | 21 | |
| | | | | | | | | | | | | | | | |
| | | Six months ended
February 28, 2019 (unaudited) | | | Year ended
August 31, 2018¹ | |
| | | | |
Operations | | | | | | | | | | | | | | | | |
Net investment income | | | | | | $ | 7,877,834 | | | | | | | $ | 16,455,144 | |
Net realized losses on investments | | | | | | | (1,531,923 | ) | | | | | | | (5,443,980 | ) |
Net change in unrealized gains (losses) on investments | | | | | | | 7,073,068 | | | | | | | | (23,108,606 | ) |
| | | | |
Net increase (decrease) in net assets resulting from operations | | | | | | | 13,418,979 | | | | | | | | (12,097,442 | ) |
| | | | |
| | | | |
Distributions to shareholders from net investment income and net realized gains | | | | | | | | | | | | | | | | |
Class A | | | | | | | (3,309,205 | ) | | | | | | | (6,375,215 | ) |
Class C | | | | | | | (114,898 | ) | | | | | | | (199,378 | ) |
Administrator Class | | | | | | | (1,130,536 | ) | | | | | | | (4,147,365 | ) |
Institutional Class | | | | | | | (4,308,581 | ) | | | | | | | (5,781,887 | ) |
| | | | |
Total distributions to shareholders | | | | | | | (8,863,220 | ) | | | | | | | (16,503,845 | ) |
| | | | |
| | | | |
Capital share transactions | | | Shares | | | | | | | | Shares | | | | | |
Proceeds from shares sold | | | | | | | | | | | | | | | | |
Class A | | | 1,898,521 | | | | 20,202,404 | | | | 3,569,871 | | | | 38,348,367 | |
Class C | | | 100,070 | | | | 1,063,151 | | | | 63,470 | | | | 684,459 | |
Administrator Class | | | 1,044,970 | | | | 11,091,835 | | | | 6,511,960 | | | | 70,326,132 | |
Institutional Class | | | 6,741,502 | | | | 71,638,856 | | | | 19,558,475 | | | | 209,166,296 | |
| | | | |
| | | | |
| | | | | | | 103,996,246 | | | | | | | | 318,525,254 | |
| | | | |
Reinvestment of distributions | | | | | | | | | | | | | | | | |
Class A | | | 271,815 | | | | 2,889,410 | | | | 525,663 | | | | 5,649,695 | |
Class C | | | 4,456 | | | | 47,365 | | | | 7,721 | | | | 82,914 | |
Administrator Class | | | 103,983 | | | | 1,105,137 | | | | 380,074 | | | | 4,081,678 | |
Institutional Class | | | 343,117 | | | | 3,645,783 | | | | 438,702 | | | | 4,717,547 | |
| | | | |
| | | | |
| | | | | | | 7,687,695 | | | | | | | | 14,531,834 | |
| | | | |
Payment for shares redeemed | | | | | | | | | | | | | | | | |
Class A | | | (4,068,529 | ) | | | (43,269,913 | ) | | | (12,470,498 | ) | | | (133,691,683 | ) |
Class C | | | (504,610 | ) | | | (5,375,155 | ) | | | (443,637 | ) | | | (4,768,963 | ) |
Administrator Class | | | (1,717,694 | ) | | | (18,246,268 | ) | | | (16,318,494 | ) | | | (174,401,645 | ) |
Institutional Class | | | (16,633,915 | ) | | | (178,092,481 | ) | | | (28,678,375 | ) | | | (311,030,462 | ) |
| | | | |
| | | | |
| | | | | | | (244,983,817 | ) | | | | | | | (623,892,753 | ) |
| | | | |
Net decrease in net assets resulting from capital share transactions | | | | | | | (133,299,876 | ) | | | | | | | (290,835,665 | ) |
| | | | |
Total decrease in net assets | | | | | | | (128,744,117 | ) | | | | | | | (319,436,952 | ) |
| | | | |
| | | | |
Net assets | | | | | | | | | | | | | | | | |
Beginning of period | | | | | | | 710,694,454 | | | | | | | | 1,030,131,406 | |
| | | | |
End of period | | | | | | $ | 581,950,337 | | | | | | | $ | 710,694,454 | |
| | | | |
| 1 | Effective for all filings after November 4, 2018, the SEC prospectively eliminated the requirement to parenthetically disclose undistributed net investment income at the end of the period and permitted the aggregation of distributions, with the exception of tax basis returns of capital. Overdistributed net investment income at August 31, 2018 was $12,956,930. The disaggregated distributions information for the year ended August 31, 2018 is included in Note 8,Distributions to Shareholders,in the notes to the financial statements. |
The accompanying notes are an integral part of these financial statements.
| | | | |
| 22 | | Wells Fargo Government Securities Fund | | Financial highlights |
(For a share outstanding throughout each period)
| | | | | | | | | | | | | | | | | | | | | | | | |
| | | Six months ended
February 28, 2019 (unaudited) | | | Year ended August 31 | |
| CLASS A | | 2018 | | | 2017 | | | 2016 | | | 2015 | | | 2014 | |
Net asset value, beginning of period | | | $10.65 | | | | $11.01 | | | | $11.51 | | | | $11.22 | | | | $11.11 | | | | $10.77 | |
Net investment income | | | 0.11 | 1 | | | 0.19 | | | | 0.15 | | | | 0.11 | 1 | | | 0.07 | 1 | | | 0.05 | |
Net realized and unrealized gains (losses) on investments | | | 0.07 | | | | (0.35 | ) | | | (0.22 | ) | | | 0.34 | | | | 0.13 | | | | 0.40 | |
| | | | | | | | | | | | | | | | | | | | | | | | |
Total from investment operations | | | 0.18 | | | | (0.16 | ) | | | (0.07 | ) | | | 0.45 | | | | 0.20 | | | | 0.45 | |
Distributions to shareholders from | | | | | | | | | | | | | | | | | | | | | | | | |
Net investment income | | | (0.12 | ) | | | (0.20 | ) | | | (0.16 | ) | | | (0.10 | ) | | | (0.09 | ) | | | (0.11 | ) |
Net realized gains | | | 0.00 | | | | 0.00 | | | | (0.27 | ) | | | (0.06 | ) | | | 0.00 | | | | 0.00 | |
| | | | | | | | | | | | | | | | | | | | | | | | |
Total distributions to shareholders | | | (0.12 | ) | | | (0.20 | ) | | | (0.43 | ) | | | (0.16 | ) | | | (0.09 | ) | | | (0.11 | ) |
Net asset value, end of period | | | $10.71 | | | | $10.65 | | | | $11.01 | | | | $11.51 | | | | $11.22 | | | | $11.11 | |
Total return2 | | | 1.77 | % | | | (1.44 | )% | | | (0.52 | )% | | | 4.03 | % | | | 1.84 | % | | | 4.19 | % |
Ratios to average net assets (annualized) | | | | | | | | | | | | | | | | | | | | | | | | |
Gross expenses | | | 0.91 | % | | | 0.90 | % | | | 0.88 | % | | | 0.87 | % | | | 0.87 | % | | | 0.88 | % |
Net expenses | | | 0.85 | % | | | 0.85 | % | | | 0.85 | % | | | 0.85 | % | | | 0.85 | % | | | 0.86 | % |
Net investment income | | | 2.11 | % | | | 1.86 | % | | | 1.38 | % | | | 0.94 | % | | | 0.59 | % | | | 0.56 | % |
Supplemental data | | | | | | | | | | | | | | | | | | | | | | | | |
Portfolio turnover rate | | | 97 | % | | | 197 | % | | | 299 | % | | | 397 | % | | | 349 | % | | | 349 | % |
Net assets, end of period (000s omitted) | | | $273,946 | | | | $292,550 | | | | $394,645 | | | | $483,112 | | | | $232,545 | | | | $173,772 | |
| 1 | Calculated based upon average shares outstanding |
| 2 | Total return calculations do not include any sales charges. Returns for periods of less than one year are not annualized. |
The accompanying notes are an integral part of these financial statements.
| | | | | | |
| Financial highlights | | Wells Fargo Government Securities Fund | | | 23 | |
(For a share outstanding throughout each period)
| | | | | | | | | | | | | | | | | | | | | | | | |
| | | Six months ended
February 28, 2019 (unaudited) | | | Year ended August 31 | |
| CLASS C | | 2018 | | | 2017 | | | 2016 | | | 2015 | | | 2014 | |
Net asset value, beginning of period | | | $10.65 | | | | $11.01 | | | | $11.51 | | | | $11.21 | | | | $11.11 | | | | $10.77 | |
Net investment income (loss) | | | 0.07¹ | | | | 0.12 | 1 | | | 0.07 | 1 | | | 0.02 | 1 | | | (0.01 | )1 | | | (0.02 | )1 |
Net realized and unrealized gains (losses) on investments | | | 0.08 | | | | (0.36 | ) | | | (0.23 | ) | | | 0.36 | | | | 0.12 | | | | 0.39 | |
| | | | | | | | | | | | | | | | | | | | | | | | |
Total from investment operations | | | 0.15 | | | | (0.24 | ) | | | (0.16 | ) | | | 0.38 | | | | 0.11 | | | | 0.37 | |
Distributions to shareholders from | | | | | | | | | | | | | | | | | | | | | | | | |
Net investment income | | | (0.09 | ) | | | (0.12 | ) | | | (0.07 | ) | | | (0.02 | ) | | | (0.01 | ) | | | (0.03 | ) |
Net realized gains | | | 0.00 | | | | 0.00 | | | | (0.27 | ) | | | (0.06 | ) | | | 0.00 | | | | 0.00 | |
| | | | | | | | | | | | | | | | | | | | | | | | |
Total distributions to shareholders | | | (0.09 | ) | | | (0.12 | ) | | | (0.34 | ) | | | (0.08 | ) | | | (0.01 | ) | | | (0.03 | ) |
Net asset value, end of period | | | $10.71 | | | | $10.65 | | | | $11.01 | | | | $11.51 | | | | $11.21 | | | | $11.11 | |
Total return2 | | | 1.39 | % | | | (2.18 | )% | | | (1.26 | )% | | | 3.25 | % | | | 1.08 | % | | | 3.42 | % |
Ratios to average net assets (annualized) | | | | | | | | | | | | | | | | | | | | | | | | |
Gross expenses | | | 1.66 | % | | | 1.65 | % | | | 1.61 | % | | | 1.62 | % | | | 1.62 | % | | | 1.63 | % |
Net expenses | | | 1.60 | % | | | 1.60 | % | | | 1.60 | % | | | 1.60 | % | | | 1.60 | % | | | 1.61 | % |
Net investment income (loss) | | | 1.36 | % | | | 1.12 | % | | | 0.63 | % | | | 0.16 | % | | | (0.13 | )% | | | (0.20 | )% |
Supplemental data | | | | | | | | | | | | | | | | | | | | | | | | |
Portfolio turnover rate | | | 97 | % | | | 197 | % | | | 299 | % | | | 397 | % | | | 349 | % | | | 349 | % |
Net assets, end of period (000s omitted) | | | $11,313 | | | | $15,508 | | | | $20,132 | | | | $27,085 | | | | $26,981 | | | | $31,908 | |
| 1 | Calculated based upon average shares outstanding |
| 2 | Total return calculations do not include any sales charges. Returns for periods of less than one year are not annualized. |
The accompanying notes are an integral part of these financial statements.
| | | | |
| 24 | | Wells Fargo Government Securities Fund | | Financial highlights |
(For a share outstanding throughout each period)
| | | | | | | | | | | | | | | | | | | | | | | | |
| | | Six months ended
February 28, 2019 (unaudited) | | | Year ended August 31 | |
| ADMINISTRATOR CLASS | | 2018 | | | 2017 | | | 2016 | | | 2015 | | | 2014 | |
Net asset value, beginning of period | | | $10.65 | | | | $11.01 | | | | $11.51 | | | | $11.21 | | | | $11.11 | | | | $10.76 | |
Net investment income | | | 0.12 | 1 | | | 0.22 | 1 | | | 0.18 | 1 | | | 0.13 | | | | 0.10 | | | | 0.06 | |
Net realized and unrealized gains (losses) on investments | | | 0.08 | | | | (0.35 | ) | | | (0.23 | ) | | | 0.36 | | | | 0.12 | | | | 0.42 | |
| | | | | | | | | | | | | | | | | | | | | | | | |
Total from investment operations | | | 0.20 | | | | (0.13 | ) | | | (0.05 | ) | | | 0.49 | | | | 0.22 | | | | 0.48 | |
Distributions to shareholders from | | | | | | | | | | | | | | | | | | | | | | | | |
Net investment income | | | (0.14 | ) | | | (0.23 | ) | | | (0.18 | ) | | | (0.13 | ) | | | (0.12 | ) | | | (0.13 | ) |
Net realized gains | | | 0.00 | | | | 0.00 | | | | (0.27 | ) | | | (0.06 | ) | | | 0.00 | | | | 0.00 | |
| | | | | | | | | | | | | | | | | | | | | | | | |
Total distributions to shareholders | | | (0.14 | ) | | | (0.23 | ) | | | (0.45 | ) | | | (0.19 | ) | | | (0.12 | ) | | | (0.13 | ) |
Net asset value, end of period | | | $10.71 | | | | $10.65 | | | | $11.01 | | | | $11.51 | | | | $11.21 | | | | $11.11 | |
Total return2 | | | 1.88 | % | | | (1.23 | )% | | | (0.31 | )% | | | 4.34 | % | | | 1.97 | % | | | 4.51 | % |
Ratios to average net assets (annualized) | | | | | | | | | | | | | | | | | | | | | | | | |
Gross expenses | | | 0.84 | % | | | 0.84 | % | | | 0.82 | % | | | 0.81 | % | | | 0.80 | % | | | 0.81 | % |
Net expenses | | | 0.64 | % | | | 0.64 | % | | | 0.64 | % | | | 0.64 | % | | | 0.64 | % | | | 0.64 | % |
Net investment income | | | 2.32 | % | | | 2.07 | % | | | 1.60 | % | | | 1.13 | % | | | 0.82 | % | | | 0.79 | % |
Supplemental data | | | | | | | | | | | | | | | | | | | | | | | | |
Portfolio turnover rate | | | 97 | % | | | 197 | % | | | 299 | % | | | 397 | % | | | 349 | % | | | 349 | % |
Net assets, end of period (000s omitted) | | | $86,122 | | | | $91,671 | | | | $198,520 | | | | $229,169 | | | | $216,428 | | | | $211,589 | |
| 1 | Calculated based upon average shares outstanding |
| 2 | Returns for periods of less than one year are not annualized. |
The accompanying notes are an integral part of these financial statements.
| | | | | | |
| Financial highlights | | Wells Fargo Government Securities Fund | | | 25 | |
(For a share outstanding throughout each period)
| | | | | | | | | | | | | | | | | | | | | | | | |
| | | Six months ended
February 28, 2019 (unaudited) | | | Year ended August 31 | |
| INSTITUTIONAL CLASS | | 2018 | | | 2017 | | | 2016 | | | 2015 | | | 2014 | |
Net asset value, beginning of period | | | $10.65 | | | | $11.00 | | | | $11.50 | | | | $11.21 | | | | $11.10 | | | | $10.76 | |
Net investment income | | | 0.13 | 1 | | | 0.24 | 1 | | | 0.19 | 1 | | | 0.15 | | | | 0.11 | 1 | | | 0.10 | |
Net realized and unrealized gains (losses) on investments | | | 0.07 | | | | (0.35 | ) | | | (0.22 | ) | | | 0.35 | | | | 0.14 | | | | 0.39 | |
| | | | | | | | | | | | | | | | | | | | | | | | |
Total from investment operations | | | 0.20 | | | | (0.11 | ) | | | (0.03 | ) | | | 0.50 | | | | 0.25 | | | | 0.49 | |
Distributions to shareholders from | | | | | | | | | | | | | | | | | | | | | | | | |
Net investment income | | | (0.14 | ) | | | (0.24 | ) | | | (0.20 | ) | | | (0.15 | ) | | | (0.14 | ) | | | (0.15 | ) |
Net realized gains | | | 0.00 | | | | 0.00 | | | | (0.27 | ) | | | (0.06 | ) | | | 0.00 | | | | 0.00 | |
| | | | | | | | | | | | | | | | | | | | | | | | |
Total distributions to shareholders | | | (0.14 | ) | | | (0.24 | ) | | | (0.47 | ) | | | (0.21 | ) | | | (0.14 | ) | | | (0.15 | ) |
Net asset value, end of period | | | $10.71 | | | | $10.65 | | | | $11.00 | | | | $11.50 | | | | $11.21 | | | | $11.10 | |
Total return2 | | | 1.96 | % | | | (0.99 | )% | | | (0.15 | )% | | | 4.42 | % | | | 2.22 | % | | | 4.59 | % |
Ratios to average net assets (annualized) | | | | | | | | | | | | | | | | | | | | | | | | |
Gross expenses | | | 0.58 | % | | | 0.57 | % | | | 0.55 | % | | | 0.54 | % | | | 0.54 | % | | | 0.55 | % |
Net expenses | | | 0.48 | % | | | 0.48 | % | | | 0.48 | % | | | 0.48 | % | | | 0.48 | % | | | 0.48 | % |
Net investment income | | | 2.48 | % | | | 2.22 | % | | | 1.75 | % | | | 1.28 | % | | | 0.99 | % | | | 0.94 | % |
Supplemental data | | | | | | | | | | | | | | | | | | | | | | | | |
Portfolio turnover rate | | | 97 | % | | | 197 | % | | | 299 | % | | | 397 | % | | | 349 | % | | | 349 | % |
Net assets, end of period (000s omitted) | | | $210,568 | | | | $310,966 | | | | $416,834 | | | | $487,113 | | | | $468,859 | | | | $540,684 | |
| 1 | Calculated based upon average shares outstanding |
| 2 | Returns for periods of less than one year are not annualized. |
The accompanying notes are an integral part of these financial statements.
| | | | |
| 26 | | Wells Fargo Government Securities Fund | | Notes to financial statements (unaudited) |
1. ORGANIZATION
Wells Fargo Funds Trust (the “Trust”), a Delaware statutory trust organized on March 10, 1999, is an open-end management investment company registered under the Investment Company Act of 1940, as amended (the “1940 Act”). As an investment company, the Trust follows the accounting and reporting guidance in Financial Accounting Standards Board (“FASB”) Accounting Standards Codification Topic 946, Financial Services – Investment Companies. These financial statements report on the Wells Fargo Government Securities Fund (the “Fund”) which is a diversified series of the Trust.
2. SIGNIFICANT ACCOUNTING POLICIES
The following significant accounting policies, which are consistently followed in the preparation of the financial statements of the Fund, are in conformity with U.S. generally accepted accounting principles which require management to make estimates and assumptions that affect the reported amounts of assets and liabilities, disclosure of contingent assets and liabilities at the date of the financial statements, and the reported amounts of revenues and expenses during the reporting period. Actual results could differ from those estimates.
Securities valuation
All investments are valued each business day as of the close of regular trading on the New York Stock Exchange (generally 4 p.m. Eastern Time), although the Fund may deviate from this calculation time under unusual or unexpected circumstances.
Debt securities are valued at the evaluated bid price provided by an independent pricing service (e.g. taking into account various factors, including yields, maturities, or credit ratings) or, if a reliable price is not available, the quoted bid price from an independent broker-dealer.
Futures contracts that are listed on a foreign or domestic exchange or market are valued at the official closing price or, if none, the last sales price.
Investments in registered open-end investment companies are valued at net asset value.
Investments which are not valued using any of the methods discussed above are valued at their fair value, as determined in good faith by the Board of Trustees of the Fund. The Board of Trustees has established a Valuation Committee comprised of the Trustees and has delegated to it the authority to take any actions regarding the valuation of portfolio securities that the Valuation Committee deems necessary or appropriate, including determining the fair value of portfolio securities, unless the determination has been delegated to the Wells Fargo Asset Management Pricing Committee at Wells Fargo Funds Management, LLC (“Funds Management”). The Board of Trustees retains the authority to make or ratify any valuation decisions or approve any changes to the Valuation Procedures as it deems appropriate. On a quarterly basis, the Board of Trustees receives reports on any valuation actions taken by the Valuation Committee or the Wells Fargo Asset Management Pricing Committee which may include items for ratification.
When-issued transactions
The Fund may purchase securities on a forward commitment or when-issued basis. The Fund records a when-issued transaction on the trade date and will segregate assets in an amount at least equal in value to the Fund’s commitment to purchase when-issued securities. Securities purchased on a when-issued basis are marked-to-market daily and the Fund begins earning interest on the settlement date. Losses may arise due to changes in the market value of the underlying securities or if the counterparty does not perform under the contract.
Futures contracts
The Fund is subject to interest rate risk in the normal course of pursuing its investment objectives. Futures contracts are agreements between the Fund and a counterparty to buy or sell a specific amount of a commodity, financial instrument or currency at specified price and on a specified date. The Fund may buy and sell futures contracts in order to gain exposure to, or protect against, changes in interest rates. The primary risks associated with the use of futures contracts are the imperfect correlation between changes in market values of securities held by the Fund and the prices of futures contracts, and the possibility of an illiquid market. Futures contracts are generally entered into on a regulated futures exchange and cleared through a clearinghouse associated with the exchange. With futures contracts, there is minimal counterparty risk to the Fund since futures contracts are exchange traded and the exchange’s clearinghouse, as counterparty to all exchange traded futures, guarantees the futures contracts against default.
Upon entering into a futures contracts, the Fund is required to deposit either cash or securities (initial margin) with the broker in an amount equal to a certain percentage of the contract value. Subsequent payments (variation margin) are paid to or from the broker each day equal to the daily changes in the contract value. Such payments are recorded as unrealized gains or losses and,
| | | | | | |
| Notes to financial statements (unaudited) | | Wells Fargo Government Securities Fund | | | 27 | |
if any, shown as variation margin receivable (payable) in the Statement of Assets and Liabilities. Should the Fund fail to make requested variation margin payments, the broker can gain access to the initial margin to satisfy the Fund’s payment obligations. When the contracts are closed, a realized gain or loss is recorded in the Statement of Operations.
Security transactions and income recognition
Securities transactions are recorded on a trade date basis. Realized gains or losses are recorded on the basis of identified cost.
Interest income is accrued daily and bond discounts are accreted and premiums are amortized daily. To the extent debt obligations are placed on non-accrual status, any related interest income may be reduced by writing off interest receivables when the collection of all or a portion of interest has been determined to be doubtful based on consistently applied procedures and the fair value has decreased. If the issuer subsequently resumes interest payments or when the collectability of interest is reasonably assured, the debt obligation is removed from non-accrual status.
Distributions to shareholders
Distributions to shareholders from net investment income are declared daily and paid monthly. Distributions from net realized gains, if any, are recorded on the ex-dividend date and paid at least annually. Such distributions are determined in accordance with income tax regulations and may differ from U.S. generally accepted accounting principles. Dividend sources are estimated at the time of declaration. The tax character of distributions is determined as of the Fund’s fiscal year end. Therefore, a portion of the Fund’s distributions made prior to the Fund’s fiscal year end may be categorized as a tax return of capital at year end.
Federal and other taxes
The Fund intends to continue to qualify as a regulated investment company by distributing substantially all of its investment company taxable income and any net realized capital gains (after reduction for capital loss carryforwards) sufficient to relieve it from all, or substantially all, federal income taxes. Accordingly, no provision for federal income taxes was required.
The Fund’s income and federal excise tax returns and all financial records supporting those returns for the prior three fiscal years are subject to examination by the federal and Delaware revenue authorities. Management has analyzed the Fund’s tax positions taken on federal, state, and foreign tax returns for all open tax years and does not believe that there are any uncertain tax positions that require recognition of a tax liability.
As of February 28, 2019, the aggregate cost of all investments for federal income tax purposes was $665,256,913 and the unrealized gains (losses) consisted of:
| | | | |
| |
Gross unrealized gains | | $ | 7,917,088 | |
| |
Gross unrealized losses | | | (22,206,024 | ) |
| |
Net unrealized losses | | $ | (14,288,936 | ) |
As of August 31, 2018, the Fund had capital loss carryforwards which consist of $16,765,738 in short-term capital losses and $1,766,136 in long-term capital losses.
Class allocations
The separate classes of shares offered by the Fund differ principally in applicable sales charges, distribution, shareholder servicing, and administration fees. Class specific expenses are charged directly to that share class. Investment income, common expenses, and realized and unrealized gains (losses) on investments are allocated daily to each class of shares based on the relative proportion of net assets of each class.
3. FAIR VALUATION MEASUREMENTS
Fair value measurements of investments are determined within a framework that has established a fair value hierarchy based upon the various data inputs utilized in determining the value of the Fund’s investments. The three-level hierarchy gives the highest priority to unadjusted quoted prices in active markets for identical assets or liabilities (Level 1) and the lowest priority to unobservable inputs (Level 3). The Fund’s investments are classified within the fair value hierarchy based on the lowest level of input that is significant to the fair value measurement. The inputs are summarized into three broad levels as follows:
| ∎ | | Level 1 – quoted prices in active markets for identical securities |
| ∎ | | Level 2 – other significant observable inputs (including quoted prices for similar securities, interest rates, prepayment speeds, credit risk, etc.) |
| ∎ | | Level 3 – significant unobservable inputs (including the Fund’s own assumptions in determining the fair value of investments) |
| | | | |
| 28 | | Wells Fargo Government Securities Fund | | Notes to financial statements (unaudited) |
The inputs or methodologies used for valuing investments in securities are not necessarily an indication of the risk associated with investing in those securities.
The following is a summary of the inputs used in valuing the Fund’s assets and liabilities as of February 28, 2019:
| | | | | | | | | | | | | | | | |
| | | | |
| | | Quoted prices
(Level 1) | | | Other significant
observable inputs
(Level 2) | | | Significant
unobservable inputs (Level 3) | | | Total | |
| | | | |
Assets | | | | | | | | | | | | | | | | |
Investments in: | | | | | | | | | | | | | | | | |
| | | | |
Agency securities | | $ | 0 | | | $ | 512,319,303 | | | $ | 0 | | | $ | 512,319,303 | |
| | | | |
Asset-backed securities | | | 0 | | | | 5,987,794 | | | | 0 | | | | 5,987,794 | |
| | | | |
Corporate bonds and notes | | | 0 | | | | 6,354,798 | | | | 0 | | | | 6,354,798 | |
| | | | |
Municipal obligations | | | 0 | | | | 9,706,461 | | | | 0 | | | | 9,706,461 | |
| | | | |
Non-agency mortgage-backed securities | | | 0 | | | | 28,067,102 | | | | 0 | | | | 28,067,102 | |
| | | | |
U.S. Treasury securities | | | 51,869,991 | | | | 0 | | | | 0 | | | | 51,869,991 | |
| | | | |
Yankee corporate bonds and notes | | | 0 | | | | 31,627,618 | | | | 0 | | | | 31,627,618 | |
| | | | |
Short-term investments | | | | | | | | | | | | | | | | |
| | | | |
Investment companies | | | 2,599,775 | | | | 0 | | | | 0 | | | | 2,599,775 | |
| | | | |
U.S. Treasury securities | | | 2,223,111 | | | | 0 | | | | 0 | | | | 2,223,111 | |
| | | 56,692,877 | | | | 594,063,076 | | | | 0 | | | | 650,755,953 | |
| | | | |
Futures contracts | | | 238,086 | | | | 0 | | | | 0 | | | | 238,086 | |
| | | | |
Total assets | | $ | 56,930,963 | | | $ | 594,063,076 | | | $ | 0 | | | $ | 650,994,039 | |
| | | | |
Liabilities | | | | | | | | | | | | | | | | |
| | | | |
Futures contracts | | $ | 26,062 | | | $ | 0 | | | $ | 0 | | | $ | 26,062 | |
| | | | |
Total liabilities | | $ | 26,062 | | | $ | 0 | | | $ | 0 | | | $ | 26,062 | |
Additional sector, industry or geographic detail is included in the Portfolio of Investments.
Futures contracts are reported at their cumulative unrealized gains (losses) at measurement date as reported in the table following the Portfolio of Investments. For futures contracts, the current day’s variation margin is reported on the Statement of Assets and Liabilities. All other assets and liabilities are reported at their market value at measurement date.
At February 28, 2019, the Fund did not have any transfers into/out of Level 3.
4. TRANSACTIONS WITH AFFILIATES
Management fee
Funds Management, an indirect wholly owned subsidiary of Wells Fargo & Company (“Wells Fargo”), is the manager of the Fund and provides advisory and fund-level administrative services under an investment management agreement. Under the investment management agreement, Funds Management is responsible for, among other services, implementing the investment objectives and strategies of the Fund, supervising the subadviser and providing fund-level administrative services in connection with the Fund’s operations. As compensation for its services under the investment management agreement, Funds Management is entitled to receive a management fee at the following annual rate based on the Fund’s average daily net assets:
| | | | |
| Average daily net assets | | Annual fee rate | |
| |
First $500 million | | | 0.450 | % |
| |
Next $500 million | | | 0.425 | |
| |
Next $2 billion | | | 0.400 | |
| |
Next $2 billion | | | 0.375 | |
| |
Next $5 billion | | | 0.340 | |
| |
Over $10 billion | | | 0.320 | |
| | | | | | |
| Notes to financial statements (unaudited) | | Wells Fargo Government Securities Fund | | | 29 | |
For the six months ended February 28, 2019, the management fee was equivalent to an annual rate of 0.44% of the Fund’s average daily net assets.
Funds Management has retained the services of a subadviser to provide daily portfolio management to the Fund. The fee for subadvisory services is borne by Funds Management. Wells Capital Management Incorporated, an affiliate of Funds Management and an indirect wholly owned subsidiary of Wells Fargo, is the subadviser to the Fund and is entitled to receive a fee from Funds Management at an annual rate starting at 0.20% and declining to 0.10% as the average daily net assets of the Fund increase.
Administration fees
Under a class-level administration agreement, Funds Management provides class-level administrative services to the Fund, which includes paying fees and expenses for services provided by the transfer agent, sub-transfer agents, omnibus account servicers and record-keepers. As compensation for its services under the class-level administration agreement, Funds Management receives an annual fee which is calculated based on the average daily net assets of each class as follows:
| | | | |
| | | Class-level
administration fee | |
| |
Class A, Class C | | | 0.16 | % |
| |
Administrator Class | | | 0.10 | |
| |
Institutional Class | | | 0.08 | |
Funds Management has contractually waived and/or reimbursed management and administration fees to the extent necessary to maintain certain net operating expense ratios for the Fund. When each class of the Fund has exceeded its expense cap, Funds Management has waived fees and/or reimbursed expenses from fund level expenses on a proportionate basis and then from class specific expenses. When only certain classes exceed their expense caps, waivers and/or reimbursements are applied against class specific expenses before fund level expenses. Funds Management has committed through December 31, 2019 to waive fees and/or reimburse expenses to the extent necessary to cap the Fund’s expenses at 0.85% for Class A shares, 1.60% for Class C shares, 0.64% for Administrator Class shares, and 0.48% for Institutional Class shares. Prior to or after the commitment expiration date, the cap may be increased or the commitment to maintain the cap may be terminated only with the approval of the Board of Trustees.
Distribution fee
The Trust has adopted a distribution plan for Class C shares of the Fund pursuant to Rule 12b-1 under the 1940 Act. A distribution fee is charged to Class C shares and paid to Wells Fargo Funds Distributor, LLC (“Funds Distributor”), the principal underwriter, at an annual rate of 0.75% of the average daily net assets of Class C shares.
In addition, Funds Distributor is entitled to receive the front-end sales charge from the purchase of Class A shares and a contingent deferred sales charge on the redemption of certain Class A shares. Funds Distributor is also entitled to receive the contingent deferred sales charges from redemptions of Class C shares. For the six months ended February 28, 2019, Funds Distributor received $1,738 from the sale of Class A shares and $163 in contingent deferred sales charges from redemptions of Class C shares. No contingent deferred sales charges were incurred by Class A shares for the six months ended February 28, 2019.
Shareholder servicing fees
The Trust has entered into contracts with one or more shareholder servicing agents, whereby Class A, Class C, and Administrator Class of the Fund are charged a fee at an annual rate of 0.25% of the average daily net assets of each respective class. A portion of these total shareholder servicing fees were paid to affiliates of Wells Fargo.
Interfund transactions
The Fund may purchase or sell portfolio investment securities to certain other Wells Fargo affiliates pursuant to Rule 17a-7 under the 1940 Act and under procedures adopted by the Board of Trustees. The procedures have been designed to ensure that these interfund transactions, which do not incur broker commissions, are effected at current market prices.
5. INVESTMENT PORTFOLIO TRANSACTIONS
Purchases and sales of investments, excluding short-term securities, for the six months ended February 28, 2019 were as follows:
| | | | | | |
Purchases at cost | | Sales proceeds |
U.S.
government | | Non-U.S.
government | | U.S.
government | | Non-U.S.
government |
| $691,780,965 | | $38,227,192 | | $793,376,912 | | $49,141,630 |
| | | | |
| 30 | | Wells Fargo Government Securities Fund | | Notes to financial statements (unaudited) |
6. DERIVATIVE TRANSACTIONS
During the six months ended February 28, 2019, the Fund entered into futures contracts to help manage duration. The Fund had an average notional amount of $19,883,369 in long futures contracts and $48,630,057 in short futures contracts during the six months ended February 28, 2019.
7. BANK BORROWINGS
The Trust (excluding the money market funds), Wells Fargo Master Trust and Wells Fargo Variable Trust are parties to a $280,000,000 revolving credit agreement whereby the Fund is permitted to use bank borrowings for temporary or emergency purposes, such as to fund shareholder redemption requests. Interest under the credit agreement is charged to the Fund based on a borrowing rate equal to the higher of the Federal Funds rate in effect on that day plus 1.25% or the overnight LIBOR rate in effect on that day plus 1.25%. In addition, an annual commitment fee equal to 0.25% of the unused balance is allocated to each participating fund.
For the six months ended February 28, 2019, there were no borrowings by the Fund under the agreement.
8. DISTRIBUTIONS TO SHAREHOLDERS
Effective for all filings after November 4, 2018, the Securities and Exchange Commission eliminated the requirement to separately state the components of distributions to shareholders under U.S. generally accepted accounting principles. The amounts of distributions to shareholders for the year ended August 31, 2018 were as follows:
| | | | |
| | | Net investment
income | |
| |
Class A | | $ | 6,375,215 | |
| |
Class C | | | 199,378 | |
| |
Administrator Class | | | 4,147,365 | |
| |
Institutional Class | | | 5,781,887 | |
9. INDEMNIFICATION
Under the Trust’s organizational documents, the officers and Trustees have been granted certain indemnification rights against certain liabilities that may arise out of performance of their duties to the Trust. Additionally, in the normal course of business, the Trust may enter into contracts with service providers that contain a variety of indemnification clauses. The Trust’s maximum exposure under these arrangements is dependent on future claims that may be made against the Fund and, therefore, cannot be estimated.
10. NEW ACCOUNTING PRONOUNCEMENTS
In August 2018, FASB issued Accounting Standards Update (“ASU”) No. 2018-13, Fair Value Measurement (Topic 820) Disclosure Framework—Changes to the Disclosure Requirements for Fair Value Measurement. ASU 2018-13 updates the disclosure requirements for fair value measurements by modifying or removing certain disclosures and adding certain new disclosures. The amendments are effective for fiscal years, and interim periods within those fiscal years, beginning after December 15, 2019. Early adoption is permitted. Management has adopted the removal and modification of disclosures early, as permitted, and will adopt the additional new disclosures at the effective date.
In March 2017, FASB issued ASU No. 2017-08,Premium Amortization on Purchased Callable Debt Securities. ASU 2017-08 shortens the amortization period for certain callable debt securities held at a premium. The amendments require the premium to be amortized to the earliest call date. The amendments do not require an accounting change for securities held at a discount; the discount continues to be amortized to maturity. ASU 2017-08 is effective for fiscal years beginning after December 15, 2018 and for interim periods within those fiscal years. Management is currently evaluating the potential impact of this new guidance to the financial statements.
| | | | | | |
| Other information (unaudited) | | Wells Fargo Government Securities Fund | | | 31 | |
PROXY VOTING INFORMATION
A description of the policies and procedures used to determine how to vote proxies relating to portfolio securities is available, upon request, by calling1-800-222-8222, visiting our website atwfam.com, or visiting the SEC website at sec.gov. Information regarding how the Fund voted proxies relating to portfolio securities during the most recent 12-month period ended June 30 is available on the Fund’s website at wfam.com or by visiting the SEC website at sec.gov.
PORTFOLIO HOLDINGS INFORMATION
The complete portfolio holdings for the Fund are publicly available monthly on the Fund’s website (wfam.com), on a one-month delayed basis. In addition, top ten holdings information (excluding derivative positions) for the Fund is publicly available on the Fund’s website on a monthly, seven-day or more delayed basis. The Fund files its complete schedule of portfolio holdings with the SEC for the first and third quarters of each fiscal year on Form N-Q, which is available by visiting the SEC website at sec.gov. In addition, the Fund’s Form N-Q may be reviewed and copied at the SEC’s Public Reference Room in Washington, DC, and at regional offices in New York City, at 233 Broadway, and in Chicago, at 175 West Jackson Boulevard, Suite 900. Information about the Public Reference Room may be obtained by calling 1-800-SEC-0330.
| | | | |
| 32 | | Wells Fargo Government Securities Fund | | Other information (unaudited) |
BOARD OF TRUSTEES AND OFFICERS
Each of the Trustees and Officers1 listed in the table below acts in identical capacities for each fund in the Wells Fargo family of funds, which consists of 152 mutual funds comprising the Wells Fargo Funds Trust, Wells Fargo Variable Trust, Wells Fargo Master Trust and four closed-end funds (collectively the “Fund Complex”). This table should be read in conjunction with the Prospectus and the Statement of Additional Information2. The mailing address of each Trustee and Officer is 525 Market Street, 12th Floor, San Francisco, CA 94105. Each Trustee and Officer serves an indefinite term, however, each Trustee serves such term until reaching the mandatory retirement age established by the Trustees.
Independent Trustees
| | | | | | |
Name and year of birth | | Position held and length of service* | | Principal occupations during past five years or longer | | Current other
public company or
investment company
directorships |
| | | |
William R. Ebsworth (Born 1957) | | Trustee, since 2015 | | Retired. From 1984 to 2013, equities analyst, portfolio manager, research director and chief investment officer at Fidelity Management and Research Company in Boston, Tokyo, and Hong Kong, and retired in 2013 as Chief Investment Officer of Fidelity Strategic Advisers, Inc. where he led a team of investment professionals managing client assets. Prior thereto, Board member of Hong Kong Securities Clearing Co., Hong Kong Options Clearing Corp., the Thailand International Fund, Ltd., Fidelity Investments Life Insurance Company, and Empire Fidelity Investments Life Insurance Company. Board member of the Vincent Memorial Hospital Endowment (non-profit organization), where he serves on the Investment Committee and as a Chair of the Audit Committee. Mr. Ebsworth is a CFA® charterholder. | | N/A |
| | | |
Jane A. Freeman (Born 1953) | | Trustee, since 2015; Chair Liaison, since 2018 | | Retired. From 2012 to 2014 and 1999 to 2008, Chief Financial Officer of Scientific Learning Corporation. From 2008 to 2012, Ms. Freeman provided consulting services related to strategic business projects. Prior to 1999, Portfolio Manager at Rockefeller & Co. and Scudder, Stevens & Clark. Board member of the Harding Loevner Funds from 1996 to 2014, serving as both Lead Independent Director and chair of the Audit Committee. Board member of the Russell Exchange Traded Funds Trust from 2011 to 2012 and the chair of the Audit Committee. Ms. Freeman is a Board Member of The Ruth Bancroft Garden (non-profit organization). She is also an inactive Chartered Financial Analyst. | | N/A |
| | | |
Isaiah Harris, Jr.3 (Born 1952) | | Trustee, since 2009; Audit Committee Chairman, since 2019 | | Retired. Chairman of the Board of CIGNA Corporation since 2009, and Director since 2005. From 2003 to 2011, Director of Deluxe Corporation. Prior thereto, President and CEO of BellSouth Advertising and Publishing Corp. from 2005 to 2007, President and CEO of BellSouth Enterprises from 2004 to 2005 and President of BellSouth Consumer Services from 2000 to 2003. Emeritus member of the Iowa State University Foundation Board of Governors. Emeritus Member of the Advisory Board of Iowa State University School of Business. Advisory Board Member, Palm Harbor Academy (private school). Advisory Board Member, Child Evangelism Fellowship (non-profit). Mr. Harris is a certified public accountant (inactive status). | | CIGNA Corporation |
| | | |
Judith M. Johnson3 (Born 1949) | | Trustee, since 2008; Audit Committee Chairman, from 2009 to 2018 | | Retired. Prior thereto, Chief Executive Officer and Chief Investment Officer of Minneapolis Employees Retirement Fund from 1996 to 2008. Ms. Johnson is an attorney, certified public accountant and a certified managerial accountant. | | N/A |
| | | |
David F. Larcker (Born 1950) | | Trustee, since 2009 | | James Irvin Miller Professor of Accounting at the Graduate School of Business, Stanford University, Director of the Corporate Governance Research Initiative and Senior Faculty of The Rock Center for Corporate Governance since 2006. From 2005 to 2008, Professor of Accounting at the Graduate School of Business, Stanford University. Prior thereto, Ernst & Young Professor of Accounting at The Wharton School, University of Pennsylvania from 1985 to 2005. | | N/A |
| | | | | | |
| Other information (unaudited) | | Wells Fargo Government Securities Fund | | | 33 | |
| | | | | | |
Name and year of birth | | Position held and length of service* | | Principal occupations during past five years or longer | | Current other
public company or
investment company
directorships |
| | | |
Olivia S. Mitchell (Born 1953) | | Trustee, since 2006; Nominating and Governance Committee Chairman, since 2018 | | International Foundation of Employee Benefit Plans Professor, Wharton School of the University of Pennsylvania since 1993. Director of Wharton’s Pension Research Council and Boettner Center on Pensions & Retirement Research, and Research Associate at the National Bureau of Economic Research. Previously, Cornell University Professor from 1978 to 1993. | | N/A |
| | | |
Timothy J. Penny (Born 1951) | | Trustee, since 1996; Chairman, since 2018 | | President and Chief Executive Officer of Southern Minnesota Initiative Foundation, a non-profit organization, since 2007. Member of the Board of Trustees of NorthStar Education Finance, Inc., a non-profit organization, since 2007. | | N/A |
| | | |
James G. Polisson (Born 1959) | | Trustee, since 2018 | | Retired. Chief Marketing Officer, Source (ETF) UK Services, Ltd, from 2015 to 2017. From 2012 to 2015, Principal of The Polisson Group, LLC, a management consulting, corporate advisory and principal investing company. Chief Executive Officer and Managing Director at Russell Investments, Global Exchange Traded Funds from 2010 to 2012. Managing Director of Barclays Global Investors from 1998 to 2010 and Global Chief Marketing Officer for iShares and Barclays Global Investors from 2000 to 2010. Trustee of the San Francisco Mechanics’ Institute, a non-profit organization, from 2013 to 2015. Board member of the Russell Exchange Traded Fund Trust from 2011 to 2012. Director of Barclays Global Investors Holdings Deutschland GmbH from 2006 to 2009. Mr. Polisson is an attorney and has a retired status with the Massachusetts and District of Columbia Bar Associations. | | N/A |
| | | |
Pamela Wheelock (Born 1959) | | Trustee, since 2018 | | Chief Operating Officer, Twin Cities Habitat for Humanity, since January, 2017. Vice President of University Services, University of Minnesota from 2012 to 2017. Prior thereto, on the Board of Directors, Governance Committee and Finance Committee for the Minnesota Philanthropy Partners (Saint Paul Foundation) from 2012 to 2018, Interim President and Chief Executive Officer of Blue Cross Blue Shield of Minnesota from 2010 to 2011, Chairman of the Board from 2009 to 2011 and Board Director from 2003 to 2015. Vice President, Leadership and Community Engagement, Bush Foundation, Saint Paul, Minnesota (a private foundation) from 2009 to 2011. Executive Vice President and Chief Financial Officer, Minnesota Sports and Entertainment from 2004 to 2009 and Senior Vice President from 2002 to 2004. Commissioner of Finance, State of Minnesota, from 1999 to 2002. Currently the Board Chair of the Minnesota Wild Foundation since 2010. | | N/A |
| * | Length of service dates reflect the Trustee’s commencement of service with the Trust’s predecessor entities, where applicable. |
| | | | |
| 34 | | Wells Fargo Government Securities Fund | | Other information (unaudited) |
Officers
| | | | | | |
Name and year of birth | | Position held and
length of service | | Principal occupations during past five years or longer | | |
| | | |
Andrew Owen (Born 1960) | | President, since 2017 | | Executive Vice President of Wells Fargo & Company and Head of Affiliated Managers, Wells Fargo Asset Management, since 2014. In addition, Mr. Owen is currently President, Chief Executive Officer and Director of Wells Fargo Funds Management, LLC since 2017. Prior thereto, Executive Vice President responsible for marketing, investments and product development for Wells Fargo Funds Management, LLC, from 2009 to 2014. | | |
| | | |
Nancy Wiser1 (Born 1967) | | Treasurer, since 2012 | | Executive Vice President of Wells Fargo Funds Management, LLC since 2011. Chief Operating Officer and Chief Compliance Officer at LightBox Capital Management LLC, from 2008 to 2011. | | |
| | | |
Alexander Kymn (Born 1973) | | Secretary and Chief Legal Officer, since 2018 | | Senior Company Counsel of Wells Fargo Bank, N.A. since 2018 (previously Senior Counsel from 2007 to 2018). Vice President of Wells Fargo Funds Management, LLC from 2008 to 2014. | | |
| | | |
Michael H. Whitaker (Born 1967) | | Chief Compliance Officer, since 2016 | | Senior Vice President and Chief Compliance Officer since 2016. Senior Vice President and Chief Compliance Officer for Fidelity Investments from 2007 to 2016. | | |
| | | |
David Berardi (Born 1975) | | Assistant Treasurer, since 2009 | | Vice President of Wells Fargo Funds Management, LLC since 2009. Vice President of Evergreen Investment Management Company, LLC from 2008 to 2010. Manager of Fund Reporting and Control for Evergreen Investment Management Company, LLC from 2004 to 2010. | | |
| | | |
Jeremy DePalma1 (Born 1974) | | Assistant Treasurer, since 2009 | | Senior Vice President of Wells Fargo Funds Management, LLC since 2009. Senior Vice President of Evergreen Investment Management Company, LLC from 2008 to 2010 and head of the Fund Reporting and Control Team within Fund Administration from 2005 to 2010. | | |
| 1 | Nancy Wiser acts as Treasurer of 76 funds in the Fund Complex. Jeremy DePalma acts as Treasurer of 76 funds and Assistant Treasurer of 76 funds in the Fund Complex. |
| 2 | The Statement of Additional Information includes additional information about the Trustees and is available, without charge, upon request, by calling1-800-222-8222 or by visiting the website atwfam.com. |
| 3 | Mr. Harris became Chairman of the Audit Committee effective January 1, 2019. |
| | | | | | |
| Appendix A (unaudited) | | Wells Fargo Government Securities Fund | | | 35 | |
SALES CHARGE REDUCTIONS AND WAIVERS FOR CERTAIN INTERMEDIARIES
Raymond James & Associates, Inc., Raymond James Financial Services & Raymond James affiliates (“Raymond James”)
Effective on or about March 1, 2019, shareholders purchasing Fund shares through a Raymond James platform or account will be eligible only for the following load waivers (front-end sales charge waivers and contingent deferred, or back-end, sales charge waivers) and discounts, which may differ from those disclosed elsewhere in the Fund’s Prospectus or SAI.
Front-end Sales Load Waivers on Class A shares Available at Raymond James
| | • | | Shares purchased in an investment advisory program. |
| | • | | Shares purchased through reinvestment of capital gains distributions and dividend reinvestment when purchasing shares of the same fund (but not any other fund within the fund family). |
| | • | | Employees and registered representatives of Raymond James or its affiliates and their family members as designated by Raymond James. |
| | • | | Shares purchased from the proceeds of redemptions within the same fund family, provided (1) the repurchase occurs within 90 days following the redemption, (2) the redemption and purchase occur in the same account, and (3) redeemed shares were subject to a front-end or deferred sales load (known as Rights of Reinstatement). |
| | • | | A shareholder in the fund’s Class C shares will have their shares automatically exchanged at net asset value to Class A shares (or the appropriate share class) of the fund if the shares are no longer subject to a CDSC and the exchange is in line with the policies and procedures of Raymond James. |
CDSC Waivers on Class A and C Shares Available at Raymond James
| | • | | Death or disability of the shareholder. |
| | • | | Shares sold as part of a systematic withdrawal plan as described in the Fund’s Prospectus. |
| | • | | Return of excess contributions from an IRA Account. |
| | • | | Shares sold as part of a required minimum distribution for IRA and retirement accounts due to the shareholder reaching age 70½ as described in the Fund’s prospectus. |
| | • | | Shares sold to pay Raymond James fees but only if the transaction is initiated by Raymond James. |
| | • | | Shares acquired through a right of reinstatement. |
Front-end Load Discounts Available at Raymond James: Breakpoints, and/or Rights of Accumulation
| | • | | Breakpoints as described in the Fund’s Prospectus. |
| | • | | Rights of accumulation which entitle shareholders to breakpoint discounts will be automatically calculated based on the aggregated holding of fund family assets held by accounts within the purchaser’s household at Raymond James. Eligible fund family assets not held at Raymond James may be included in the rights of accumulation calculation only if the shareholder notifies his or her financial advisor about such assets. |
This page is intentionally left blank.

For more information
More information about Wells Fargo Funds is available free upon request. To obtain literature, please write, visit the Fund’s website, or call:
Wells Fargo Funds
P.O. Box 219967
Kansas City, MO 64121-9967
Website: wfam.com
Individual investors: 1-800-222-8222
Retail investment professionals: 1-888-877-9275
Institutional investment professionals:
1-866-765-0778
This report and the financial statements contained herein are submitted for the general information of the shareholders of the Fund. If this report is used for promotional purposes, distribution of the report must be accompanied or preceded by a current prospectus. Before investing, please consider the investment objectives, risks, charges, and expenses of the investment. For a current prospectus and, if available, a summary prospectus, containing this information, call1-800-222-8222 or visit the Fund’s website atwfam.com. Read the prospectus carefully before you invest or send money.
Wells Fargo Asset Management (WFAM) is the trade name for certain investment advisory/management firms owned by Wells Fargo & Company. These firms include but are not limited to Wells Capital Management Incorporated and Wells Fargo Funds Management, LLC. Certain products managed by WFAM entities are distributed by Wells Fargo Funds Distributor, LLC (a broker-dealer and Member FINRA).
This material is for general informational and educational purposes only and is NOT intended to provide investment advice or a recommendation of any kind—including a recommendation for any specific investment, strategy, or plan.
INVESTMENT PRODUCTS: NOT FDIC INSURED ◾ NO BANK GUARANTEE ◾ MAY LOSE VALUE
© 2019 Wells Fargo Funds Management, LLC. All rights reserved.
| | |
 | | 321625 04-19 SA216/SAR216 02-19 |
Semi-Annual Report
February 28, 2019

Wells Fargo Short-Term Bond Fund

Beginning on January 1, 2021, as permitted by new regulations adopted by the Securities and Exchange Commission, paper copies of the Wells Fargo Funds’ annual and semi-annual shareholder reports issued after this date will no longer be sent by mail, unless you specifically request paper copies of the reports. Instead, the reports will be made available on the Funds’ website, and you will be notified by mail each time a report is posted and provided with a website address to access the report.
If you already elected to receive shareholder reports electronically, you will not be affected by this change and you need not take any action. You may elect to receive shareholder reports and other communications from the Fund electronically at any time by contacting your financial intermediary (such as a broker-dealer or bank) or, if you are a direct investor, by calling 1-800-222-8222 or by enrolling at wellsfargo.com/advantagedelivery.
You may elect to receive all future reports in paper free of charge. If you invest through a financial intermediary, you can contact your financial intermediary to request that you continue to receive paper copies of your shareholder reports; if you invest directly with the Fund, you can call 1-800-222-8222. Your election to receive reports in paper will apply to all Wells Fargo Funds held in your account with your financial intermediary or, if you are a direct investor, to all Wells Fargo Funds that you hold.

Reduce clutter. Save trees.
Sign up for electronic delivery of prospectuses and shareholder reports atwellsfargo.com/advantagedelivery
Contents
The views expressed and any forward-looking statements are as of February 28, 2019, unless otherwise noted, and are those of the Fund managers and/or Wells Fargo Funds Management, LLC. Discussions of individual securities, or the markets generally, or any Wells Fargo Fund are not intended as individual recommendations. Future events or results may vary significantly from those expressed in any forward-looking statements. The views expressed are subject to change at any time in response to changing circumstances in the market. Wells Fargo Funds Management, LLC and the Fund disclaim any obligation to publicly update or revise any views expressed or forward-looking statements.
INVESTMENT PRODUCTS: NOT FDIC INSURED ◾ NO BANK GUARANTEE ◾ MAY LOSE VALUE
| | | | |
| 2 | | Wells Fargo Short-Term Bond Fund | | Letter to shareholders (unaudited) |

Andrew Owen
President
Wells Fargo Funds
Favorable third-quarter economic indicators and corporate earnings reports encouraged domestic stock investors.
Dear Shareholder:
We are pleased to offer you this semi-annual report for the Wells Fargo Short-Term Bond Fund for the six-month period that ended February 28, 2019. Highershort-term interest rates, inflation concerns, trade tensions, slowing economic growth outside the U.S., and geopolitical events contributed to investment market volatility throughout the period.
For the period, U.S. stocks, as measured by the S&P 500 Index,1 fell 3.04% and international stocks, as measured by the MSCI ACWI ex USA Index (Net),2 declined 2.47%. Based on the MSCI EM Index (Net),3 emerging market stocks gained 0.33%. For bond investors, the Bloomberg Barclays U.S. Aggregate Bond Index4 added 1.99% while the Bloomberg Barclays Global Aggregate ex-USD Index5 gained 0.63%. The Bloomberg Barclays Municipal Bond Index6 added 2.34%, and the ICE BofAML U.S. High Yield Index7 advanced 1.98%.
Investors appeared to shake off lingering concerns during the third quarter.
Favorable third-quarter economic indicators and corporate earnings reports encouraged domestic stock investors. U.S. trade negotiations with Mexico and Canada progressed. The Conference Board Consumer Confidence Index®8 reached its highest level in 18 years during September 2018. The U.S. Federal Reserve (Fed) raised the federal funds rate by 25 basis points (bps; 100 bps equal 1.00%) to a target range of between 2.00% and 2.25% in September 2018. For the quarter that ended September 30, 2018, the S&P 500 Index added 7.71%.
Investors in international markets were not as confident. Tensions between the U.S. and China increased. The U.S. imposed $200 billion in tariffs on Chinese goods. China reacted with $60 billion in tariffs on U.S. goods. Economic growth in China caused concern. The Bank of England (BOE) raised its monetary policy rate to 0.75% in August. During the quarter, the MSCI ACWI ex USA Index (Net) gained 0.71%. The MSCI EM Index (Net) declined 1.09%. In fixed-income markets, U.S. bonds were flat, as measured by the Bloomberg Barclays U.S. Aggregate Bond Index. The Bloomberg Barclays Global Aggregate ex-USD Index fell 1.74%.
| 1 | The S&P 500 Index consists of 500 stocks chosen for market size, liquidity, and industry group representation. It is a market-value-weighted index with each stock’s weight in the index proportionate to its market value. You cannot invest directly in an index. |
| 2 | The Morgan Stanley Capital International (MSCI) All Country World Index (ACWI) ex USA Index (Net) is a free-float-adjusted market-capitalization-weighted index that is designed to measure the equity market performance of developed markets, excluding the United States and Canada. Source: MSCI. MSCI makes no express or implied warranties or representations and shall have no liability whatsoever with respect to any MSCI data contained herein. The MSCI data may not be further redistributed or used as a basis for other indices or any securities or financial products. This report is not approved, reviewed, or produced by MSCI. You cannot invest directly in an index. |
| 3 | The MSCI Emerging Markets (EM) Index (Net) is a free-float-adjusted market-capitalization-weighted index that is designed to measure large- and mid-cap equity market performance of emerging markets. The MSCI EM Index (Net) consists of the following 24 emerging market country indices: Brazil, Chile, China, Colombia, Czech Republic, Egypt, Greece, Hungary, India, Indonesia, Korea, Malaysia, Mexico, Pakistan, Peru, the Philippines, Poland, Qatar, Russia, South Africa, Taiwan, Thailand, Turkey, and the United Arab Emirates. You cannot invest directly in an index. |
| 4 | The Bloomberg Barclays U.S. Aggregate Bond Index is a broad-based benchmark that measures the investment-grade, U.S. dollar-denominated, fixed-rate taxable bond market, including Treasuries, government-related and corporate securities, mortgage-backed securities (agency fixed-rate and hybrid adjustable-rate mortgage pass-throughs), asset-backed securities, and commercial mortgage-backed securities. You cannot invest directly in an index. |
| 5 | The Bloomberg Barclays Global Aggregate ex-USD Index is an unmanaged index that provides a broad-based measure of the global investment-grade fixed-income markets excluding the U.S. dollar-denominated debt market. You cannot invest directly in an index. |
| 6 | The Bloomberg Barclays Municipal Bond Index is an unmanaged index composed of long-term tax-exempt bonds with a minimum credit rating of Baa. You cannot invest directly in an index. |
| 7 | The ICE BofAML U.S. High Yield Index is a market-capitalization-weighted index of domestic and Yankee high-yield bonds. The index tracks the performance of high-yield securities traded in the U.S. bond market. You cannot invest directly in an index. Copyright 2019. ICE Data Indices, LLC. All rights reserved. |
| 8 | The Conference Board Consumer Confidence Index® measures the degree of optimism on the state of the U.S. economy that consumers are expressing through their activities of savings and spending. You cannot invest directly in an index. |
| | | | | | |
| Letter to shareholders (unaudited) | | Wells Fargo Short-Term Bond Fund | | | 3 | |
Conflicting data unsettled markets during the fourth quarter.
November’s U.S. midterm elections shifted control of the House of Representatives from Republicans to Democrats, presaging potential partisan clashes.Third-quarter U.S. gross domestic product (GDP) was announced at an annualized 3.4% rate, lower than the second-quarter rate. Brexit efforts stalled ahead of the March 2019 deadline. The People’s Bank of China cut reserve requirement ratios, accelerated infrastructure spending, and cut taxes even as the value of the yuan declined to low levels last seen in 2008.
December’s S&P 500 Index performance was the worst since 1931. Globally,fixed-income investments fared better than stocks during the last two months of the year. The Fed increased the federal funds rate by 25 bps in December 2018 to a target range of between 2.25% and 2.50% and softened its outlook for 2019 rate increases.
The market climbs a wall of worry.
Investors entered 2019 with reasons to be concerned. A partial U.S. government shutdown driven by partisan spending and immigration policy disputes extended into January. Investors expected high levels of stock market volatility to continue based on the VIX9.
January’s returns tended to support the investing adage that markets climb a wall of worry. The S&P 500 Index gained 8.01% for the month that ended January 31, 2019, its best monthly performance in 30 years. Returns for the MSCI ACWI ex USA Index (Net), the Bloomberg Barclays U.S. Aggregate Bond Index, and the Bloomberg Barclays Global Aggregate ex-USD Index also were positive.
In February, concerns over slowing global growth reemerged. The Bureau of Economic Analysis announced fourth-quarter 2018 GDP grew at an annualized 2.2% rate, down from the 4.2% annualized rate for the second quarter and the 3.4% annualized rate for the third quarter. Analysts attributed the lower growth rate to a slowing housing market and larger trade deficit. The U.S. Labor Department said that the economy created just 20,000 jobs in February. In a February report, the BOE forecast the slowest growth since the financial crisis for 2019. China and the U.S., while putting future tariffs on hold for the time being, continued to wrangle over trade issues.
Don’t let short-term uncertainty derail long-term investment goals.
Periods of investment uncertainty can present challenges, but experience has taught us that maintaining long-term investment goals can be an effective way to plan for the future. To help you create a sound strategy based on your personal goals and risk tolerance, Wells Fargo Funds offers more than 100 mutual funds spanning a wide range of asset classes and investment styles. Although diversification cannot guarantee an investment profit or prevent losses, we believe it can be an effective way to manage investment risk and potentially smooth out overall portfolio performance. We encourage investors to know their investments and to understand that appropriate levels of risk-taking may unlock opportunities.
January’s returns tended to support the investing adage that markets climb a wall of worry.
| 9 | The Chicago Board Options Exchange Market Volatility Index (VIX) is a popular measure of the implied volatility of S&P 500 Index options. It represents one measure of the market’s expectation of stock market volatility over the next 30-day period. You cannot invest directly in an index. |
| | | | |
| 4 | | Wells Fargo Short-Term Bond Fund | | Letter to shareholders (unaudited) |
Thank you for choosing to invest with Wells Fargo Funds. We appreciate your confidence in us and remain committed to helping you meet your financial needs.
Sincerely,

Andrew Owen
President
Wells Fargo Funds
For further information about your Fund, contact your investment professional, visit our website atwfam.com, or call us directly at1-800-222-8222.
This page is intentionally left blank.
| | | | |
| 6 | | Wells Fargo Short-Term Bond Fund | | Performance highlights (unaudited) |
Investment objective
The Fund seeks current income consistent with capital preservation.
Manager
Wells Fargo Funds Management, LLC
Subadviser
Wells Capital Management Incorporated
Portfolio managers
Christopher Y. Kauffman, CFA®‡
Jay N. Mueller, CFA®‡
Noah M. Wise, CFA®‡
Average annual total returns (%) as of February 28, 2019
| | | | | | | | | | | | | | | | | | | | | | | | | | | | | | | | | | |
| | | | | Including sales charge | | | Excluding sales charge | | | Expense ratios1 (%) | |
| | | Inception date | | 1 year | | | 5 year | | | 10 year | | | 1 year | | | 5 year | | | 10 year | | | Gross | | | Net2 | |
| | | | | | | | | |
| Class A (SSTVX) | | 8-31-1999 | | | 0.39 | | | | 0.82 | | | | 2.23 | | | | 2.44 | | | | 1.23 | | | | 2.44 | | | | 0.83 | | | | 0.73 | |
| | | | | | | | | |
| Class C (WFSHX) | | 3-31-2008 | | | 0.67 | | | | 0.48 | | | | 1.67 | | | | 1.67 | | | | 0.48 | | | | 1.67 | | | | 1.58 | | | | 1.48 | |
| | | | | | | | | |
| Class R6 (SSTYX)3 | | 7-31-2018 | | | – | | | | – | | | | – | | | | 2.63 | | | | 1.50 | | | | 2.72 | | | | 0.45 | | | | 0.41 | |
| | | | | | | | | |
| Institutional Class (SSHIX) | | 8-31-1999 | | | – | | | | – | | | | – | | | | 2.71 | | | | 1.52 | | | | 2.73 | | | | 0.50 | | | | 0.46 | |
| | | | | | | | | |
| Bloomberg Barclays U.S. 1-3 Year Government/Credit Bond Index4 | | – | | | – | | | | – | | | | – | | | | 2.52 | | | | 1.07 | | | | 1.57 | | | | – | | | | – | |
Figures quoted represent past performance, which is no guarantee of future results, and do not reflect taxes that a shareholder may pay on fund distributions or the redemption of fund shares. Investment return and principal value of an investment will fluctuate so that an investor’s shares, when redeemed, may be worth more or less than their original cost. Performance shown without sales charges would be lower if sales charges were reflected. Current performance may be lower or higher than the performance data quoted, which assumes the reinvestment of dividends and capital gains. Current month-end performance is available on the Fund’s website,wfam.com.
Index returns do not include transaction costs associated with buying and selling securities, any mutual fund fees or expenses, or any taxes. It is not possible to invest directly in an index.
For Class A shares, the maximum front-end sales charge is 2.00%. For Class C shares, the maximum contingent deferred sales charge is 1.00%. Performance including a contingent deferred sales charge assumes the sales charge for the corresponding time period. Class R6 and Institutional Class shares are sold without a front-end sales charge or contingent deferred sales charge.
Bond values fluctuate in response to the financial condition of individual issuers, general market and economic conditions, and changes in interest rates. Changes in market conditions and government policies may lead to periods of heightened volatility in the bond market and reduced liquidity for certain bonds held by the Fund. In general, when interest rates rise, bond values fall and investors may lose principal value. Interest-rate changes and their impact on the Fund and its share price can be sudden and unpredictable. Loans are subject to risks similar to those associated with other below-investment-grade bond investments, such as credit risk (for example, risk of issuer default), below investment- grade bond risk (for example, risk of greater volatility in value), and risk that the loan may become illiquid or difficult to price. The use of derivatives may reduce returns and/or increase volatility. Certain investment strategies tend to increase the total risk of an investment (relative to the broader market). Foreign investments are especially volatile and can rise or fall dramatically due to differences in the political and economic conditions of the host country. These risks are generally intensified in emerging markets. The Fund is exposed to high-yield securities risk and mortgage- and asset backed securities risk. Consult the Fund’s prospectus for additional information on these and other risks.
Please see footnotes on page 7.
| | | | | | |
| Performance highlights (unaudited) | | Wells Fargo Short-Term Bond Fund | | | 7 | |
| | | | |
| Ten largest holdings (%) as of February 28, 20195 | |
| |
Jackson National Life Global Company, 2.50%, 6-27-2022 | | | 1.16 | |
| |
BX Trust 2017 Series A, 3.54%, 10-15-2032 | | | 0.92 | |
| |
GS Mortgage Securities Trust Series 2010-C1 Class A2, 4.59%, 8-10-2043 | | | 0.77 | |
| |
Illinois Series 2014, 5.00%, 5-1-2019 | | | 0.73 | |
| |
HSBC Bank USA NA, 4.88%, 8-24-2020 | | | 0.73 | |
| |
Comcast Corporation, 3.45%, 10-1-2021 | | | 0.72 | |
| |
Duke Energy Corporation, 5.05%, 9-15-2019 | | | 0.72 | |
| |
Charter Communications Operating LLC, 3.58%, 7-23-2020 | | | 0.72 | |
| |
SBA Tower Trust Series 2014-1A Class C, 2.90%, 10-15-2044 | | | 0.71 | |
| |
Enable Midstream Partner LP, 2.40%, 5-15-2019 | | | 0.71 | |
|
| Portfolio composition as of February 28, 20196 |
|
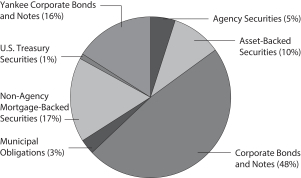 |
| ‡ | CFA® and Chartered Financial Analyst® are trademarks owned by CFA Institute. |
| 1 | Reflects the expense ratios as stated in the most recent prospectuses, which include the impact of 0.01% in acquired fund fees and expenses. The expense ratios shown are subject to change and may differ from the annualized expense ratios shown in the financial highlights of this report, which do not include acquired fund fees and expenses. |
| 2 | The manager has contractually committed through December 31, 2019, to waive fees and/or reimburse expenses to the extent necessary to cap the expenses of each class after fee waivers at 0.72% for Class A, 1.47% for Class C, 0.40% for Class R6, and 0.45% for Institutional Class. Brokerage commissions, stamp duty fees, interest, taxes, acquired fund fees and expenses (if any), and extraordinary expenses are excluded from the expense cap. Prior to or after the commitment expiration date, the cap may be increased or the commitment to maintain the cap may be terminated only with the approval of the Board of Trustees. Without this cap, the Fund’s returns would have been lower. The expense ratio paid by an investor is the net expense ratio (the total annual fund operating expenses after fee waivers) as stated in the prospectuses. |
| 3 | Historical performance shown for Class R6 shares prior to their inception reflects the performance of Institutional Class shares and includes the higher expenses applicable to Institutional Class shares. If these expenses had not been included, returns for Class R6 shares would be higher. |
| 4 | The Bloomberg Barclays U.S. 1-3 Year Government/Credit Bond Index is the one- to three-year component of the Bloomberg Barclays U.S. Government/Credit Bond Index that includes securities in the Government and Credit Indexes. The Government Index includes Treasuries (that is, public obligations of the U.S. Treasury that have remaining maturities of more than one year) and agencies (that is, publicly issued debt of U.S. government agencies, quasi-federal corporations, and corporate or foreign debt guaranteed by the U.S. government). The Credit Index includes publicly issued U.S. corporate and foreign debentures and secured notes that meet specified maturity, liquidity, and quality requirements. You cannot invest directly in an index. |
| 5 | The ten largest holdings, excluding cash, cash equivalents and any money market funds, are calculated based on the value of the investments divided by total net assets of the Fund. Holdings are subject to change and may have changed since the date specified. |
| 6 | Amounts are calculated based on the total long-term investments of the Fund. These amounts are subject to change and may have changed since the date specified. |
| | | | |
| 8 | | Wells Fargo Short-Term Bond Fund | | Fund expenses (unaudited) |
As a shareholder of the Fund, you incur two types of costs: (1) transaction costs, including sales charges (loads) on purchase payments and contingent deferred sales charges (if any) on redemptions and (2) ongoing costs, including management fees, distribution (12b-1) and/or shareholder servicing fees, and other Fund expenses. This example is intended to help you understand your ongoing costs (in dollars) of investing in the Fund and to compare these costs with the ongoing costs of investing in other mutual funds.
The example is based on an investment of $1,000 invested at the beginning of the six-month period and held for the entire period from September 1, 2018 to February 28, 2019.
Actual expenses
The “Actual” line of the table below provides information about actual account values and actual expenses. You may use the information in this line, together with the amount you invested, to estimate the expenses that you paid over the period. Simply divide your account value by $1,000 (for example, an $8,600 account value divided by $1,000 = 8.6), then multiply the result by the number in the “Actual” line under the heading entitled “Expenses paid during period” for your applicable class of shares to estimate the expenses you paid on your account during this period.
Hypothetical example for comparison purposes
The “Hypothetical” line of the table below provides information about hypothetical account values and hypothetical expenses based on the Fund’s actual expense ratio and an assumed rate of return of 5% per year before expenses, which is not the Fund’s actual return. The hypothetical account values and expenses may not be used to estimate the actual ending account balance or expenses you paid for the period. You may use this information to compare the ongoing costs of investing in the Fund and other funds. To do so, compare this 5% hypothetical example with the 5% hypothetical examples that appear in the shareholder reports of the other funds.
Please note that the expenses shown in the table are meant to highlight your ongoing costs only and do not reflect any transactional costs, such as sales charges (loads) and contingent deferred sales charges. Therefore, the “Hypothetical” line of the table is useful in comparing ongoing costs only and will not help you determine the relative total costs of owning different funds. In addition, if these transactional costs were included, your costs would have been higher.
| | | | | | | | | | | | | | | | |
| | | Beginning
account value
9-1-2018 | | | Ending
account value
2-28-2019 | | | Expenses
paid during
the period¹ | | | Annualized net
expense ratio | |
Class A | | | | | | | | | | | | | | | | |
| | | | |
Actual | | $ | 1,000.00 | | | $ | 1,015.98 | | | $ | 3.60 | | | | 0.72 | % |
| | | | |
Hypothetical (5% return before expenses) | | $ | 1,000.00 | | | $ | 1,021.22 | | | $ | 3.61 | | | | 0.72 | % |
Class C | | | | | | | | | | | | | | | | |
| | | | |
Actual | | $ | 1,000.00 | | | $ | 1,012.22 | | | $ | 7.33 | | | | 1.47 | % |
| | | | |
Hypothetical (5% return before expenses) | | $ | 1,000.00 | | | $ | 1,017.50 | | | $ | 7.35 | | | | 1.47 | % |
Class R6 | | | | | | | | | | | | | | | | |
| | | | |
Actual | | $ | 1,000.00 | | | $ | 1,016.42 | | | $ | 2.00 | | | | 0.40 | % |
| | | | |
Hypothetical (5% return before expenses) | | $ | 1,000.00 | | | $ | 1,022.81 | | | $ | 2.01 | | | | 0.40 | % |
Institutional Class | | | | | | | | | | | | | | | | |
| | | | |
Actual | | $ | 1,000.00 | | | $ | 1,018.51 | | | $ | 2.25 | | | | 0.45 | % |
| | | | |
Hypothetical (5% return before expenses) | | $ | 1,000.00 | | | $ | 1,022.56 | | | $ | 2.26 | | | | 0.45 | % |
| 1 | Expenses paid is equal to the annualized net expense ratio of each class multiplied by the average account value over the period, multiplied by the number of days in the most recent fiscal half-year divided by the number of days in the fiscal year (to reflect the one-half-year period). |
| | | | | | |
| Portfolio of investments—February 28, 2019 (unaudited) | | Wells Fargo Short-Term Bond Fund | | | 9 | |
| | | | | | | | | | | | | | | | |
| Security name | | Interest rate | | | Maturity date | | | Principal | | | Value | |
| | | | |
Agency Securities: 4.52% | | | | | | | | | | | | | | | | |
| | | | |
FDIC Series 2010-R1 Class A 144A | | | 2.18 | % | | | 5-25-2050 | | | $ | 331,678 | | | $ | 331,523 | |
| | | | |
FDIC Series 2013-R1 Class A 144A | | | 1.15 | | | | 3-25-2033 | | | | 404,127 | | | | 398,181 | |
| | | | |
FHLMC | | | 3.50 | | | | 10-15-2025 | | | | 466,934 | | | | 475,874 | |
| | | | |
FHLMC | | | 3.50 | | | | 6-15-2038 | | | | 189,954 | | | | 190,160 | |
| | | | |
FHLMC (3 Year Treasury Constant Maturity +2.24%) ± | | | 3.62 | | | | 5-1-2026 | | | | 28,127 | | | | 28,146 | |
| | | | |
FHLMC | | | 4.00 | | | | 5-1-2025 | | | | 853,528 | | | | 877,300 | |
| | | | |
FHLMC (1 Year Treasury Constant Maturity +2.25%) ± | | | 4.12 | | | | 4-1-2032 | | | | 35,967 | | | | 37,648 | |
| | | | |
FHLMC (1 Year Treasury Constant Maturity +2.40%) ± | | | 4.37 | | | | 7-1-2029 | | | | 2,209 | | | | 2,280 | |
| | | | |
FHLMC (12 Month LIBOR +1.91%) ± | | | 4.66 | | | | 9-1-2031 | | | | 2,450 | | | | 2,478 | |
| | | | |
FHLMC (1 Year Treasury Constant Maturity +2.25%) ± | | | 4.74 | | | | 4-1-2038 | | | | 241,671 | | | | 254,095 | |
| | | | |
FHLMC | | | 6.00 | | | | 10-1-2021 | | | | 101,360 | | | | 103,802 | |
| | | | |
FHLMC | | | 9.00 | | | | 6-1-2019 | | | | 392 | | | | 392 | |
| | | | |
FHLMC | | | 9.00 | | | | 10-1-2019 | | | | 7,187 | | | | 7,201 | |
| | | | |
FHLMC | | | 9.50 | | | | 12-1-2022 | | | | 4,207 | | | | 4,241 | |
| | | | |
FHLMC | | | 10.50 | | | | 4-1-2019 | | | | 11 | | | | 11 | |
| | | | |
FHLMC | | | 10.50 | | | | 5-1-2019 | | | | 10 | | | | 10 | |
| | | | |
FHLMC | | | 10.50 | | | | 6-1-2019 | | | | 22 | | | | 22 | |
| | | | |
FHLMC | | | 10.50 | | | | 7-1-2019 | | | | 47 | | | | 47 | |
| | | | |
FHLMC Series 2597 Series AE | | | 5.50 | | | | 4-15-2033 | | | | 56,809 | | | | 59,963 | |
| | | | |
FHLMC Series 2642 Class AR | | | 4.50 | | | | 7-15-2023 | | | | 207,753 | | | | 211,151 | |
| | | | |
FHLMC Series 3266 Class D | | | 5.00 | | | | 1-15-2022 | | | | 232 | | | | 232 | |
| | | | |
FHLMC Series 3609 Class LA | | | 4.00 | | | | 12-15-2024 | | | | 10,502 | | | | 10,501 | |
| | | | |
FHLMC Series 3855 Class HL | | | 3.50 | | | | 2-15-2026 | | | | 58,303 | | | | 58,301 | |
| | | | |
FHLMC Series 3920 Class AB | | | 3.00 | | | | 9-15-2025 | | | | 264,748 | | | | 265,322 | |
| | | | |
FHLMC Series KI01 Class A (1 Month LIBOR +0.16%) ± | | | 2.67 | | | | 9-25-2022 | | | | 132,619 | | | | 132,331 | |
| | | | |
FHLMC Series KP04 Class AG1 (1 Month LIBOR +0.22%) ± | | | 2.73 | | | | 7-25-2020 | | | | 1,485,000 | | | | 1,484,404 | |
| | | | |
FHLMC Series QO04 Class AFL (12 Month Treasury Average +0.74%) ± | | | 3.07 | | | | 5-25-2044 | | | | 1,126,965 | | | | 1,128,313 | |
| | | | |
FHLMC Series T-42 Class A6 | | | 9.50 | | | | 2-25-2042 | | | | 313,676 | | | | 376,028 | |
| | | | |
FHLMC Series T-57 Class 2A1 ±± | | | 4.10 | | | | 7-25-2043 | | | | 76,133 | | | | 80,551 | |
| | | | |
FHLMC Series T-59 Class 2A1 ±± | | | 3.97 | | | | 10-25-2043 | | | | 879,963 | | | | 893,073 | |
| | | | |
FNMA | | | 3.02 | | | | 11-1-2020 | | | | 251,599 | | | | 251,800 | |
| | | | |
FNMA (1 Year Treasury Constant Maturity +1.27%) ± | | | 3.71 | | | | 8-1-2034 | | | | 245,058 | | | | 248,194 | |
| | | | |
FNMA | | | 4.00 | | | | 6-25-2026 | | | | 471,507 | | | | 492,838 | |
| | | | |
FNMA | | | 4.00 | | | | 8-25-2037 | | | | 349,276 | | | | 354,115 | |
| | | | |
FNMA (12 Month LIBOR +1.81%) ± | | | 4.44 | | | | 9-1-2040 | | | | 723,989 | | | | 757,600 | |
| | | | |
FNMA (1 Year Treasury Constant Maturity +2.26%) ± | | | 4.50 | | | | 8-1-2036 | | | | 1,165,410 | | | | 1,225,786 | |
| | | | |
FNMA (12 Month Treasury Average +2.29%) ± | | | 4.57 | | | | 10-1-2036 | | | | 850,669 | | | | 884,516 | |
| | | | |
FNMA (1 Year Treasury Constant Maturity +2.19%) ± | | | 4.64 | | | | 11-1-2031 | | | | 41,510 | | | | 43,514 | |
| | | | |
FNMA (12 Month Treasury Average +2.43%) ± | | | 4.68 | | | | 7-1-2036 | | | | 926,812 | | | | 968,756 | |
| | | | |
FNMA | | | 5.50 | | | | 3-1-2023 | | | | 394,464 | | | | 407,221 | |
| | | | |
FNMA | | | 6.00 | | | | 4-1-2021 | | | | 38,894 | | | | 39,524 | |
| | | | |
FNMA | | | 6.00 | | | | 3-1-2033 | | | | 477,205 | | | | 516,773 | |
| | | | |
FNMA | | | 6.50 | | | | 8-1-2031 | | | | 195,176 | | | | 220,881 | |
| | | | |
FNMA | | | 8.00 | | | | 9-1-2023 | | | | 893 | | | | 898 | |
| | | | |
FNMA | | | 8.33 | | | | 7-15-2020 | | | | 1,217 | | | | 1,224 | |
| | | | |
FNMA | | | 9.00 | | | | 2-15-2020 | | | | 85 | | | | 86 | |
| | | | |
FNMA | | | 9.00 | | | | 11-1-2024 | | | | 37,281 | | | | 39,789 | |
| | | | |
FNMA | | | 11.00 | | | | 10-15-2020 | | | | 1,081 | | | | 1,093 | |
| | | | |
FNMA Grantor Trust Series 2002-T12 Class A4 | | | 9.50 | | | | 5-25-2042 | | | | 516,086 | | | | 604,632 | |
| | | | |
FNMA Series 1989-29 Class Z | | | 10.00 | | | | 6-25-2019 | | | | 3,155 | | | | 3,169 | |
The accompanying notes are an integral part of these financial statements.
| | | | |
| 10 | | Wells Fargo Short-Term Bond Fund | | Portfolio of investments—February 28, 2019 (unaudited) |
| | | | | | | | | | | | | | | | |
| Security name | | Interest rate | | | Maturity date | | | Principal | | | Value | |
| | | | |
Agency Securities(continued) | | | | | | | | | | | | | | | | |
| | | | |
FNMA Series 1989-63 Class Z | | | 9.40 | % | | | 10-25-2019 | | | $ | 636 | | | $ | 643 | |
| | | | |
FNMA Series 2002-T1 Class A4 | | | 9.50 | | | | 11-25-2031 | | | | 33,649 | | | | 38,959 | |
| | | | |
FNMA Series 2003-41 Class PE | | | 5.50 | | | | 5-25-2023 | | | | 243,100 | | | | 247,319 | |
| | | | |
FNMA Series 2003-W11 Class A1 ±± | | | 5.63 | | | | 6-25-2033 | | | | 6,919 | | | | 7,227 | |
| | | | |
FNMA Series 2003-W6 Class 6A ±± | | | 4.42 | | | | 8-25-2042 | | | | 685,054 | | | | 697,481 | |
| | | | |
FNMA Series 2003-W6 Class PT4 ±± | | | 8.66 | | | | 10-25-2042 | | | | 64,487 | | | | 78,480 | |
| | | | |
FNMA Series 2004-32 Class AY | | | 4.00 | | | | 5-25-2019 | | | | 1,430 | | | | 1,430 | |
| | | | |
FNMA Series 2005-84 Class MB | | | 5.75 | | | | 10-25-2035 | | | | 378,199 | | | | 406,272 | |
| | | | |
FNMA Series 2008-53 Class CA | | | 5.00 | | | | 7-25-2023 | | | | 40,147 | | | | 40,191 | |
| | | | |
FNMA Series 2009-M01 Class A2 | | | 4.29 | | | | 7-25-2019 | | | | 204,593 | | | | 204,471 | |
| | | | |
FNMA Series 2010-37 Class A1 | | | 5.41 | | | | 5-25-2035 | | | | 1,650,402 | | | | 1,700,226 | |
| | | | |
FNMA Series 2011-133 Class A | | | 3.50 | | | | 6-25-2029 | | | | 158,346 | | | | 158,522 | |
| | | | |
FNMA Series 2011-39 Class CA | | | 3.00 | | | | 5-25-2024 | | | | 821 | | | | 820 | |
| | | | |
GNMA | | | 4.50 | | | | 4-20-2035 | | | | 100,040 | | | | 102,576 | |
| | | | |
GNMA | | | 8.00 | | | | 12-15-2023 | | | | 12,550 | | | | 13,424 | |
| | | | |
GNMA | | | 9.00 | | | | 11-15-2024 | | | | 3,111 | | | | 3,216 | |
| | | | |
GNMA Series 2011-70 Class BE | | | 3.00 | | | | 8-25-2026 | | | | 28,318 | | | | 28,282 | |
| | | | |
GNMA Series 2017-H13 Class FJ (1 Month LIBOR +0.20%) ± | | | 2.71 | | | | 5-20-2067 | | | | 346,773 | | | | 346,426 | |
| | | | |
GNMA Series 2017-H16 Class FD (1 Month LIBOR +0.20%) ± | | | 2.71 | | | | 8-20-2067 | | | | 513,191 | | | | 512,977 | |
| | | | |
Total Agency Securities (Cost $18,846,414) | | | | | | | | | | | | | | | 19,064,932 | |
| | | | | | | | | | | | | | | | |
| | | | |
Asset-Backed Securities: 9.38% | | | | | | | | | | | | | | | | |
| | | | |
Ascentium Equipment Receivables LLC Series 2017-2A Class A2 144A | | | 2.00 | | | | 5-11-2020 | | | | 1,100,136 | | | | 1,096,907 | |
| | | | |
Chesapeake Funding LLC Series 2017-3A Class A1 144A | | | 1.91 | | | | 8-15-2029 | | | | 2,012,255 | | | | 1,991,865 | |
| | | | |
Dell Equipment Finance Trust Series 2017-2 Class A2B (1 Month LIBOR +0.30%) 144A± | | | 2.78 | | | | 2-24-2020 | | | | 388,191 | | | | 388,191 | |
| | | | |
DT Auto Owner Trust Series 2017-2A Class D 144A | | | 3.89 | | | | 1-15-2023 | | | | 535,000 | | | | 537,797 | |
| | | | |
Education Loan Asset-Backed Trust Series 2013-1 Class A1 (1 Month LIBOR +0.80%) 144A± | | | 3.29 | | | | 6-25-2026 | | | | 924,404 | | | | 925,515 | |
| | | | |
Enterprise Fleet Financing Trust Series 2017-1 Class A2 144A | | | 2.13 | | | | 7-20-2022 | | | | 2,028,500 | | | | 2,019,898 | |
| | | | |
Flagship Credit Auto Trust Series 2014-2 Class C 144A | | | 3.95 | | | | 12-15-2020 | | | | 1,497,832 | | | | 1,500,830 | |
| | | | |
Ford Credit Auto Lease Trust Series 2017-B Class A2A | | | 1.80 | | | | 6-15-2020 | | | | 516,196 | | | | 515,515 | |
| | | | |
GM Financial Securitized Term Auto Receivables Trust Series 2018-1 Class A2A | | | 2.08 | | | | 1-19-2021 | | | | 2,244,676 | | | | 2,240,476 | |
| | | | |
GMF Floorplan Owner Revolving Trust Series 2016-1 Class A2 (1 Month LIBOR +0.85%) 144A± | | | 3.34 | | | | 5-17-2021 | | | | 1,830,000 | | | | 1,832,318 | |
| | | | |
Home Equity Asset Trust Series 2003-6 Class M1 (1 Month LIBOR +1.05%) ± | | | 3.54 | | | | 2-25-2034 | | | | 932,129 | | | | 911,081 | |
| | | | |
Jimmy John’s Funding LLC Series 2017-1A Class A2I 144A | | | 3.61 | | | | 7-30-2047 | | | | 1,231,250 | | | | 1,218,876 | |
| | | | |
John Deere Owner Trust Series 2016-A Class A3 | | | 1.36 | | | | 4-15-2020 | | | | 145,545 | | | | 145,382 | |
| | | | |
Lendmark Funding Trust Series 2018-1A Class A 144A | | | 3.81 | | | | 12-21-2026 | | | | 1,855,000 | | | | 1,868,002 | |
| | | | |
Navistar Financial Dealer Note Master Trust Series 2017-1 Class A (1 Month LIBOR +0.78%) 144A± | | | 3.27 | | | | 6-27-2022 | | | | 2,000,000 | | | | 2,001,407 | |
| | | | |
Nissan Auto Lease Trust Series 2017-B Class A3 | | | 2.05 | | | | 9-15-2020 | | | | 1,775,000 | | | | 1,768,555 | |
| | | | |
Santander Retail Auto Lease Trust Series 2017-A Class A2A 144A | | | 2.02 | | | | 3-20-2020 | | | | 1,556,755 | | | | 1,554,725 | |
| | | | |
SLC Student Loan Trust Series 2006-2 Class A5 (3 Month LIBOR +0.10%) ± | | | 2.89 | | | | 9-15-2026 | | | | 1,386,023 | | | | 1,383,532 | |
| | | | |
SLM Student Loan Trust Series 2007- 4 Class B1 (3 Month LIBOR +0.14%) ± | | | 2.91 | | | | 7-25-2025 | | | | 1,985,463 | | | | 1,974,650 | |
| | | | |
SLM Student Loan Trust Series 2011-1 Class A1 (1 Month LIBOR +0.52%) ± | | | 3.01 | | | | 3-25-2026 | | | | 330,910 | | | | 331,210 | |
| | | | |
SLM Student Loan Trust Series 2011-2 Class A1 (1 Month LIBOR +0.60%) ± | | | 3.09 | | | | 11-25-2027 | | | | 307,754 | | | | 308,940 | |
| | | | |
SLM Student Loan Trust Series 2012-3 Class A (1 Month LIBOR +0.65%) ± | | | 3.14 | | | | 12-27-2038 | | | | 1,984,163 | | | | 1,979,150 | |
| | | | |
Student Loan Consolidation Center Series 2011-1 Class A (1 Month LIBOR +1.22%) 144A± | | | 3.71 | | | | 10-25-2027 | | | | 1,811,771 | | | | 1,819,235 | |
| | | | |
Tesla Auto Lease Trust Series 2018-B Class A 144A | | | 3.71 | | | | 8-20-2021 | | | | 927,786 | | | | 937,084 | |
The accompanying notes are an integral part of these financial statements.
| | | | | | |
| Portfolio of investments—February 28, 2019 (unaudited) | | Wells Fargo Short-Term Bond Fund | | | 11 | |
| | | | | | | | | | | | | | | | |
| Security name | | Interest rate | | | Maturity date | | | Principal | | | Value | |
| | | | |
Asset-Backed Securities(continued) | | | | | | | | | | | | | | | | |
| | | | |
Towd Point Asset Trust Series 2018-SL1 Class A (1 Month LIBOR +0.60%) 144A± | | | 3.11 | % | | | 1-25-2046 | | | $ | 2,458,778 | | | $ | 2,431,751 | |
| | | | |
Verizon Owner Trust Series 2017-1A Class A 144A | | | 2.06 | | | | 9-20-2021 | | | | 1,800,000 | | | | 1,793,120 | |
| | | | |
Volvo Financial Equipment LLC Series 2016-1A Class A3 144A | | | 1.67 | | | | 2-18-2020 | | | | 158,026 | | | | 157,903 | |
| | | | |
Volvo Financial Equipment LLC Series 2018-AA (1 Month LIBOR +0.52%) 144A± | | | 3.01 | | | | 7-17-2023 | | | | 2,240,000 | | | | 2,243,587 | |
| | | | |
Wheels SPV LLC Series 2018-1A Class A2 144A | | | 3.06 | | | | 4-20-2027 | | | | 1,375,000 | | | | 1,374,856 | |
| | | | |
World Omni Auto Receivables Trust Series 2017-A Class A2 | | | 1.68 | | | | 12-16-2019 | | | | 266,062 | | | | 265,921 | |
| | | | |
Total Asset-Backed Securities (Cost $39,584,555) | | | | | | | | | | | | | | | 39,518,279 | |
| | | | | | | | | | | | | | | | |
| | | | |
Corporate Bonds and Notes: 45.12% | | | | | | | | | | | | | | | | |
| | | | |
Communication Services: 5.21% | | | | | | | | | | | | | | | | |
| | | | |
| Diversified Telecommunication Services: 1.45% | | | | | | | | | | | | | | | | |
| | | | |
AT&T Incorporated | | | 2.80 | | | | 2-17-2021 | | | | 1,910,000 | | | | 1,897,924 | |
| | | | |
AT&T Incorporated | | | 5.00 | | | | 3-1-2021 | | | | 1,085,000 | | | | 1,131,350 | |
| | | | |
Broadcom Corporation | | | 3.00 | | | | 1-15-2022 | | | | 1,415,000 | | | | 1,388,742 | |
| | | | |
Hughes Satellite Systems Corporation | | | 6.50 | | | | 6-15-2019 | | | | 1,700,000 | | | | 1,710,625 | |
| | | | |
| | | | | | | | | | | | | | | 6,128,641 | |
| | | | | | | | | | | | | | | | |
| | | | |
| Media: 3.47% | | | | | | | | | | | | | | | | |
| | | | |
Charter Communications Operating LLC | | | 3.58 | | | | 7-23-2020 | | | | 3,000,000 | | | | 3,013,574 | |
| | | | |
Comcast Corporation | | | 3.45 | | | | 10-1-2021 | | | | 3,000,000 | | | | 3,034,849 | |
| | | | |
Discovery Communications LLC 144A | | | 3.50 | | | | 6-15-2022 | | | | 2,025,000 | | �� | | 2,003,218 | |
| | | | |
Fox Corporation 144A | | | 4.03 | | | | 1-25-2024 | | | | 1,070,000 | | | | 1,090,472 | |
| | | | |
Interpublic Group Companies | | | 3.75 | | | | 2-15-2023 | | | | 2,025,000 | | | | 2,019,855 | |
| | | | |
NBCUniversal Enterprise Incorporated 144A | | | 5.25 | | | | 12-31-2049 | | | | 1,655,000 | | | | 1,681,662 | |
| | | | |
TEGNA Incorporated | | | 5.13 | | | | 7-15-2020 | | | | 1,740,000 | | | | 1,755,225 | |
| | | | |
| | | | | | | | | | | | | | | 14,598,855 | |
| | | | | | | | | | | | | | | | |
| | | | |
| Wireless Telecommunication Services: 0.29% | | | | | | | | | | | | | | | | |
| | | | |
Sprint Spectrum Company LLC 144A | | | 3.36 | | | | 3-20-2023 | | | | 1,210,000 | | | | 1,203,950 | |
| | | | | | | | | | | | | | | | |
| | | | |
Consumer Discretionary: 2.07% | | | | | | | | | | | | | | | | |
| | | | |
| Hotels, Restaurants & Leisure: 0.65% | | | | | | | | | | | | | | | | |
| | | | |
GLP Capital LP | | | 4.88 | | | | 11-1-2020 | | | | 1,340,000 | | | | 1,360,100 | |
| | | | |
MGM Resorts International | | | 5.25 | | | | 3-31-2020 | | | | 1,340,000 | | | | 1,363,785 | |
| | | | |
| | | | | | | | | | | | | | | 2,723,885 | |
| | | | | | | | | | | | | | | | |
| | | | |
| Household Durables: 0.65% | | | | | | | | | | | | | | | | |
| | | | |
D.R. Horton Incorporated | | | 4.75 | | | | 2-15-2023 | | | | 2,000,000 | | | | 2,035,753 | |
| | | | |
Lennar Corporation | | | 4.50 | | | | 11-15-2019 | | | | 445,000 | | | | 446,669 | |
| | | | |
Lennar Corporation | | | 4.75 | | | | 11-15-2022 | | | | 251,000 | | | | 256,569 | |
| | | | |
| | | | | | | | | | | | | | | 2,738,991 | |
| | | | | | | | | | | | | | | | |
| | | | |
| Internet & Direct Marketing Retail: 0.18% | | | | | | | | | | | | | | | | |
| | | | |
Amazon.com Incorporated | | | 1.90 | | | | 8-21-2020 | | | | 765,000 | | | | 756,196 | |
| | | | | | | | | | | | | | | | |
| | | | |
| Multiline Retail: 0.28% | | | | | | | | | | | | | | | | |
| | | | |
Macy’s Retail Holdings Incorporated | | | 3.45 | | | | 1-15-2021 | | | | 1,205,000 | | | | 1,199,368 | |
| | | | | | | | | | | | | | | | |
The accompanying notes are an integral part of these financial statements.
| | | | |
| 12 | | Wells Fargo Short-Term Bond Fund | | Portfolio of investments—February 28, 2019 (unaudited) |
| | | | | | | | | | | | | | | | |
| Security name | | Interest rate | | | Maturity date | | | Principal | | | Value | |
| | | | |
| Specialty Retail: 0.31% | | | | | | | | | | | | | | | | |
| | | | |
Group 1 Automotive Incorporated | | | 5.00 | % | | | 6-1-2022 | | | $ | 1,300,000 | | | $ | 1,306,500 | |
| | | | | | | | | | | | | | | | |
| | | | |
Consumer Staples: 3.12% | | | | | | | | | | | | | | | | |
| | | | |
| Food Products: 2.05% | | | | | | | | | | | | | | | | |
| | | | |
Campbell Soup Company | | | 3.30 | | | | 3-15-2021 | | | | 2,380,000 | | | | 2,376,235 | |
| | | | |
Conagra Brands Incorporated | | | 3.80 | | | | 10-22-2021 | | | | 1,440,000 | | | | 1,452,254 | |
| | | | |
General Mills Incorporated | | | 3.20 | | | | 4-16-2021 | | | | 1,800,000 | | | | 1,804,605 | |
| | | | |
Hershey Company | | | 3.38 | | | | 5-15-2023 | | | | 2,950,000 | | | | 2,992,890 | |
| | | | |
| | | | | | | | | | | | | | | 8,625,984 | |
| | | | | | | | | | | | | | | | |
| | | | |
| Tobacco: 1.07% | | | | | | | | | | | | | | | | |
| | | | |
Altria Group Incorporated | | | 2.85 | | | | 8-9-2022 | | | | 2,805,000 | | | | 2,757,211 | |
| | | | |
British American Tobacco Capital Corporation | | | 2.30 | | | | 8-14-2020 | | | | 1,785,000 | | | | 1,758,678 | |
| | | | |
| | | | | | | | | | | | | | | 4,515,889 | |
| | | | | | | | | | | | | | | | |
| | | | |
Energy: 2.53% | | | | | | | | | | | | | | | | |
| | | | |
| Oil, Gas & Consumable Fuels: 2.53% | | | | | | | | | | | | | | | | |
| | | | |
Baker Hughes LLC | | | 2.77 | | | | 12-15-2022 | | | | 1,360,000 | | | | 1,338,543 | |
| | | | |
BP AMI Leasing Incorporated 144A | | | 5.52 | | | | 5-8-2019 | | | | 825,000 | | | | 829,097 | |
| | | | |
DCP Midstream Operating LP 144A | | | 5.35 | | | | 3-15-2020 | | | | 1,005,000 | | | | 1,022,588 | |
| | | | |
Enable Midstream Partner LP | | | 2.40 | | | | 5-15-2019 | | | | 3,000,000 | | | | 2,995,852 | |
| | | | |
Energy Transfer Partners LP | | | 5.20 | | | | 2-1-2022 | | | | 2,060,000 | | | | 2,146,956 | |
| | | | |
Rockies Express Pipeline LLC 144A | | | 5.63 | | | | 4-15-2020 | | | | 2,300,000 | | | | 2,346,000 | |
| | | | |
| | | | | | | | | | | | | | | 10,679,036 | |
| | | | | | | | | | | | | | | | |
| | | | |
Financials: 16.33% | | | | | | | | | | | | | | | | |
| | | | |
| Banks: 5.99% | | | | | | | | | | | | | | | | |
| | | | |
Australia & New Zealand Banking Group Limited | | | 2.25 | | | | 11-9-2020 | | | | 2,210,000 | | | | 2,184,405 | |
| | | | |
Bank of America Corporation | | | 2.15 | | | | 11-9-2020 | | | | 2,000,000 | | | | 1,974,497 | |
| | | | |
Bank of America NA (3 Month LIBOR +0.65%) ± | | | 3.34 | | | | 1-25-2023 | | | | 1,000,000 | | | | 1,004,749 | |
| | | | |
BBVA Bancomer SA 144A | | | 7.25 | | | | 4-22-2020 | | | | 2,240,000 | | | | 2,315,622 | |
| | | | |
Citibank NA | | | 3.40 | | | | 7-23-2021 | | | | 2,000,000 | | | | 2,016,530 | |
| | | | |
Citigroup Incorporated | | | 2.50 | | | | 7-29-2019 | | | | 2,235,000 | | | | 2,232,064 | |
| | | | |
Citizens Bank | | | 2.20 | | | | 5-26-2020 | | | | 2,000,000 | | | | 1,978,919 | |
| | | | |
Fifth Third Bank | | | 2.30 | | | | 3-15-2019 | | | | 1,845,000 | | | | 1,844,820 | |
| | | | |
HSBC Bank USA NA | | | 4.88 | | | | 8-24-2020 | | | | 3,000,000 | | | | 3,077,331 | |
| | | | |
JPMorgan Chase | | | 1.65 | | | | 9-23-2019 | | | | 2,000,000 | | | | 1,987,957 | |
| | | | |
JPMorgan Chase (3 Month LIBOR +0.61%) ± | | | 3.51 | | | | 6-18-2022 | | | | 1,000,000 | | | | 1,009,257 | |
| | | | |
Synchrony Bank | | | 3.65 | | | | 5-24-2021 | | | | 1,075,000 | | | | 1,079,629 | |
| | | | |
US Bank NA | | | 2.05 | | | | 10-23-2020 | | | | 2,540,000 | | | | 2,507,252 | |
| | | | |
| | | | | | | | | | | | | | | 25,213,032 | |
| | | | | | | | | | | | | | | | |
| | | | |
| Capital Markets: 0.91% | | | | | | | | | | | | | | | | |
| | | | |
Goldman Sachs Group Incorporated | | | 2.30 | | | | 12-13-2019 | | | | 1,000,000 | | | | 995,609 | |
| | | | |
Goldman Sachs Group Incorporated (3 Month LIBOR +0.82%) ± | | | 2.88 | | | | 10-31-2022 | | | | 2,900,000 | | | | 2,856,548 | |
| | | | |
| | | | | | | | | | | | | | | 3,852,157 | |
| | | | | | | | | | | | | | | | |
The accompanying notes are an integral part of these financial statements.
| | | | | | |
| Portfolio of investments—February 28, 2019 (unaudited) | | Wells Fargo Short-Term Bond Fund | | | 13 | |
| | | | | | | | | | | | | | | | |
| Security name | | Interest rate | | | Maturity date | | | Principal | | | Value | |
| | | | |
| Consumer Finance: 4.39% | | | | | | | | | | | | | | | | |
| | | | |
American Express Company | | | 3.40 | % | | | 2-27-2023 | | | $ | 1,120,000 | | | $ | 1,127,380 | |
| | | | |
Capital One Financial Corporation | | | 2.50 | | | | 5-12-2020 | | | | 3,000,000 | | | | 2,979,799 | |
| | | | |
Daimler Finance North America LLC 144A | | | 2.20 | | | | 5-5-2020 | | | | 520,000 | | | | 514,047 | |
| | | | |
Daimler Finance North America LLC 144A | | | 3.00 | | | | 2-22-2021 | | | | 2,850,000 | | | | 2,830,586 | |
| | | | |
Ford Motor Credit Company LLC | | | 3.20 | | | | 1-15-2021 | | | | 1,335,000 | | | | 1,313,582 | |
| | | | |
Ford Motor Credit Company LLC (3 Month LIBOR +0.88%) ± | | | 3.68 | | | | 10-12-2021 | | | | 1,160,000 | | | | 1,118,312 | |
| | | | |
General Motors Financial Company Incorporated | | | 3.45 | | | | 4-10-2022 | | | | 3,000,000 | | | | 2,978,248 | |
| | | | |
Nissan Motor Acceptance Corporation 144A | | | 2.00 | | | | 3-8-2019 | | | | 2,000,000 | | | | 1,999,856 | |
| | | | |
Nissan Motor Acceptance Corporation 144A | | | 3.88 | | | | 9-21-2023 | | | | 2,030,000 | | | | 2,012,077 | |
| | | | |
Synchrony Financial | | | 2.70 | | | | 2-3-2020 | | | | 1,645,000 | | | | 1,638,052 | |
| | | | |
| | | | | | | | | | | | | | | 18,511,939 | |
| | | | | | | | | | | | | | | | |
| | | | |
| Diversified Financial Services: 1.15% | | | | | | | | | | | | | | | | |
| | | | |
IBM Credit LLC | | | 3.45 | | | | 11-30-2020 | | | | 2,590,000 | | | | 2,614,031 | |
| | | | |
WEA Finance LLC 144A | | | 3.25 | | | | 10-5-2020 | | | | 2,205,000 | | | | 2,208,440 | |
| | | | |
| | | | | | | | | | | | | | | 4,822,471 | |
| | | | | | | | | | | | | | | | |
| | | | |
| Insurance: 3.89% | | | | | | | | | | | | | | | | |
| | | | |
Axis Specialty Finance LLC | | | 5.88 | | | | 6-1-2020 | | | | 1,794,000 | | | | 1,846,746 | |
| | | | |
Jackson National Life Global Company 144A | | | 3.30 | | | | 6-11-2021 | | | | 2,340,000 | | | | 2,349,039 | |
| | | | |
Jackson National Life Global Company 144A | | | 2.50 | | | | 6-27-2022 | | | | 5,000,000 | | | | 4,868,282 | |
| | | | |
Metropolitan Life Global Funding Incorporated 144A | | | 1.55 | | | | 9-13-2019 | | | | 1,820,000 | | | | 1,808,753 | |
| | | | |
OneBeacon US Holdings Incorporated | | | 4.60 | | | | 11-9-2022 | | | | 2,075,000 | | | | 2,095,226 | |
| | | | |
Protective Life Global Funding 144A | | | 2.26 | | | | 4-8-2020 | | | | 1,450,000 | | | | 1,440,225 | |
| | | | |
Reliance Standard Life Insurance 144A | | | 2.38 | | | | 5-4-2020 | | | | 2,000,000 | | | | 1,981,641 | |
| | | | |
| | | | | | | | | | | | | | | 16,389,912 | |
| | | | | | | | | | | | | | | | |
| | | | |
Health Care: 4.41% | | | | | | | | | | | | | | | | |
| | | | |
| Biotechnology: 0.49% | | | | | | | | | | | | | | | | |
| | | | |
Abbvie Incorporated | | | 3.38 | | | | 11-14-2021 | | | | 2,065,000 | | | | 2,078,338 | |
| | | | | | | | | | | | | | | | |
| | | | |
| Health Care Providers & Services: 2.00% | | | | | | | | | | | | | | | | |
| | | | |
Anthem Incorporated | | | 2.50 | | | | 11-21-2020 | | | | 1,235,000 | | | | 1,223,472 | |
| | | | |
Cigna Holding Company | | | 4.00 | | | | 2-15-2022 | | | | 2,095,000 | | | | 2,135,049 | |
| | | | |
CVS Health Corporation | | | 2.80 | | | | 7-20-2020 | | | | 2,360,000 | | | | 2,347,672 | |
| | | | |
HCA Incorporated | | | 6.50 | | | | 2-15-2020 | | | | 1,315,000 | | | | 1,354,325 | |
| | | | |
Tenet Healthcare Corporation | | | 6.00 | | | | 10-1-2020 | | | | 1,340,000 | | | | 1,381,875 | |
| | | | |
| | | | | | | | | | | | | | | 8,442,393 | |
| | | | | | | | | | | | | | | | |
| | | | |
| Pharmaceuticals: 1.92% | | | | | | | | | | | | | | | | |
| | | | |
Bayer US Finance LLC 144A | | | 3.88 | | | | 12-15-2023 | | | | 1,725,000 | | | | 1,719,802 | |
| | | | |
Eli Lilly and Company | | | 2.35 | | | | 5-15-2022 | | | | 3,000,000 | | | | 2,954,802 | |
| | | | |
EMD Finance LLC 144A | | | 2.40 | | | | 3-19-2020 | | | | 1,925,000 | | | | 1,912,634 | |
| | | | |
Teva Pharmaceutical Finance LLC | | | 2.25 | | | | 3-18-2020 | | | | 1,500,000 | | | | 1,477,479 | |
| | | | |
| | | | | | | | | | | | | | | 8,064,717 | |
| | | | | | | | | | | | | | | | |
The accompanying notes are an integral part of these financial statements.
| | | | |
| 14 | | Wells Fargo Short-Term Bond Fund | | Portfolio of investments—February 28, 2019 (unaudited) |
| | | | | | | | | | | | | | | | |
| Security name | | Interest rate | | | Maturity date | | | Principal | | | Value | |
| | | | |
Industrials: 2.32% | | | | | | | | | | | | | | | | |
| | | | |
| Aerospace & Defense: 0.95% | | | | | | | | | | | | | | | | |
| | | | |
Rockwell Collins Incorporated | | | 1.95 | % | | | 7-15-2019 | | | $ | 1,530,000 | | | $ | 1,524,885 | |
| | | | |
Spirit AeroSystems Incorporated (3 Month LIBOR +0.80%) ± | | | 3.59 | | | | 6-15-2021 | | | | 2,500,000 | | | | 2,483,229 | |
| | | | |
| | | | | | | | | | | | | | | 4,008,114 | |
| | | | | | | | | | | | | | | | |
| | | | |
| Airlines: 0.54% | | | | | | | | | | | | | | | | |
| | | | |
Delta Air Lines Incorporated | | | 3.40 | | | | 4-19-2021 | | | | 1,000,000 | | | | 998,500 | |
| | | | |
Delta Air Lines Incorporated | | | 4.75 | | | | 11-7-2021 | | | | 1,273,140 | | | | 1,288,799 | |
| | | | |
| | | | | | | | | | | | | | | 2,287,299 | |
| | | | | | | | | | | | | | | | |
| | | | |
| Industrial Conglomerates: 0.71% | | | | | | | | | | | | | | | | |
| | | | |
General Electric Company | | | 2.50 | | | | 3-28-2020 | | | | 3,000,000 | | | | 2,975,277 | |
| | | | | | | | | | | | | | | | |
| | | | |
| Professional Services: 0.12% | | | | | | | | | | | | | | | | |
| | | | |
Equifax Incorporated | | | 3.60 | | | | 8-15-2021 | | | | 500,000 | | | | 499,634 | |
| | | | | | | | | | | | | | | | |
| | | | |
Information Technology: 3.69% | | | | | | | | | | | | | | | | |
| | | | |
| IT Services: 0.57% | | | | | | | | | | | | | | | | |
| | | | |
IBM Corporation | | | 1.80 | | | | 5-17-2019 | | | | 2,405,000 | | | | 2,401,079 | |
| | | | | | | | | | | | | | | | |
| | | | |
| Semiconductors & Semiconductor Equipment: 1.16% | | | | | | | | | | | | | | | | |
| | | | |
Broadcom Corporation | | | 2.65 | | | | 1-15-2023 | | | | 3,000,000 | | | | 2,859,532 | |
| | | | |
KLA-Tencor Corporation | | | 3.38 | | | | 11-1-2019 | | | | 2,000,000 | | | | 2,004,313 | |
| | | | |
| | | | | | | | | | | | | | | 4,863,845 | |
| | | | | | | | | | | | | | | | |
| | | | |
| Technology Hardware, Storage & Peripherals: 1.96% | | | | | | | | | | | | | | | | |
| | | | |
Apple Incorporated | | | 2.15 | | | | 2-9-2022 | | | | 3,000,000 | | | | 2,950,125 | |
| | | | |
EMC Corporation | | | 2.65 | | | | 6-1-2020 | | | | 2,840,000 | | | | 2,811,047 | |
| | | | |
Hewlett Packard Enterprise Company | | | 3.60 | | | | 10-15-2020 | | | | 2,500,000 | | | | 2,513,162 | |
| | | | |
| | | | | | | | | | | | | | | 8,274,334 | |
| | | | | | | | | | | | | | | | |
| | | | |
Materials: 1.08% | | | | | | | | | | | | | | | | |
| | | | |
| Chemicals: 0.49% | | | | | | | | | | | | | | | | |
| | | | |
DowDuPont Incorporated | | | 4.21 | | | | 11-15-2023 | | | | 2,010,000 | | | | 2,074,133 | |
| | | | | | | | | | | | | | | | |
| | | | |
| Paper & Forest Products: 0.59% | | | | | | | | | | | | | | | | |
| | | | |
Georgia Pacific LLC 144A | | | 2.54 | | | | 11-15-2019 | | | | 2,495,000 | | | | 2,489,355 | |
| | | | | | | | | | | | | | | | |
| | | | |
Real Estate: 1.61% | | | | | | | | | | | | | | | | |
| | | | |
| Equity REITs: 0.71% | | | | | | | | | | | | | | | | |
| | | | |
DDR Corporation | | | 4.63 | | | | 7-15-2022 | | | | 739,000 | | | | 756,163 | |
| | | | |
Sabra Health Care LP | | | 5.50 | | | | 2-1-2021 | | | | 2,200,000 | | | | 2,231,625 | |
| | | | |
| | | | | | | | | | | | | | | 2,987,788 | |
| | | | | | | | | | | | | | | | |
| | | | |
| Real Estate Management & Development: 0.90% | | | | | | | | | | | | | | | | |
| | | | |
Newmark Group Incorporated 144A | | | 6.13 | | | | 11-15-2023 | | | | 1,745,000 | | | | 1,753,670 | |
| | | | |
Washington Prime Group | | | 3.85 | | | | 4-1-2020 | | | | 2,065,000 | | | | 2,041,947 | |
| | | | |
| | | | | | | | | | | | | | | 3,795,617 | |
| | | | | | | | | | | | | | | | |
The accompanying notes are an integral part of these financial statements.
| | | | | | |
| Portfolio of investments—February 28, 2019 (unaudited) | | Wells Fargo Short-Term Bond Fund | | | 15 | |
| | | | | | | | | | | | | | | | |
| Security name | | Interest rate | | | Maturity date | | | Principal | | | Value | |
| | | | |
Utilities: 2.75% | | | | | | | | | | | | | | | | |
| | | | |
| Electric Utilities: 1.95% | | | | | | | | | | | | | | | | |
| | | | |
Duke Energy Corporation | | | 5.05 | % | | | 9-15-2019 | | | $ | 3,000,000 | | | $ | 3,033,583 | |
| | | | |
Edison International | | | 2.13 | | | | 4-15-2020 | | | | 1,200,000 | | | | 1,175,913 | |
| | | | |
Exelon Corporation | | | 3.50 | | | | 6-1-2022 | | | | 1,895,000 | | | | 1,881,369 | |
| | | | |
NV Energy Incorporated | | | 6.25 | | | | 11-15-2020 | | | | 2,000,000 | | | | 2,102,664 | |
| | | | |
| | | | | | | | | | | | | | | 8,193,529 | |
| | | | | | | | | | | | | | | | |
| | | | |
| Multi-Utilities: 0.80% | | | | | | | | | | | | | | | | |
| | | | |
Centerpoint Energy Incorporated | | | 3.60 | | | | 11-1-2021 | | | | 2,000,000 | | | | 2,014,366 | |
| | | | |
Dominion Resources Incorporated | | | 2.96 | | | | 7-1-2019 | | | | 1,365,000 | | | | 1,364,832 | |
| | | | |
| | | | | | | | | | | | | | | 3,379,198 | |
| | | | | | | | | | | | | | | | |
| | | | |
Total Corporate Bonds and Notes (Cost $190,213,240) | | | | | | | | | | | | | | | 190,081,456 | |
| | | | | | | | | | | | | | | | |
| | | | |
Municipal Obligations: 2.55% | | | | | | | | | | | | | | | | |
| | | | |
California: 0.23% | | | | | | | | | | | | | | | | |
| | | | |
| Miscellaneous Revenue: 0.23% | | | | | | | | | | | | | | | | |
| | | | |
Roman Catholic Diocese of Oakland CA | | | 6.04 | | | | 11-1-2019 | | | | 935,000 | | | | 951,479 | |
| | | | | | | | | | | | | | | | |
| | | | |
Georgia: 0.25% | | | | | | | | | | | | | | | | |
| | | | |
| Health Revenue: 0.25% | | | | | | | | | | | | | | | | |
| | | | |
Medical Center GA Hospital Authority Taxable Refunding Bond Columbus Regional Healthcare System Incorporated Project | | | 4.88 | | | | 8-1-2022 | | | | 1,000,000 | | | | 1,047,060 | |
| | | | | | | | | | | | | | | | |
| | | | |
Illinois: 0.95% | | | | | | | | | | | | | | | | |
| | | | |
| Miscellaneous Revenue: 0.73% | | | | | | | | | | | | | | | | |
| | | | |
Illinois Series 2014 | | | 5.00 | | | | 5-1-2019 | | | | 3,070,000 | | | | 3,083,324 | |
| | | | | | | | | | | | | | | | |
| | | | |
| Tax Revenue: 0.22% | | | | | | | | | | | | | | | | |
| | | | |
Chicago IL Retiree Health Series B | | | 6.30 | | | | 12-1-2021 | | | | 870,000 | | | | 912,447 | |
| | | | | | | | | | | | | | | | |
| | | | |
| | | | | | | | | | | | | | | 3,995,771 | |
| | | | | | | | | | | | | | | | |
| | | | |
Michigan: 0.47% | | | | | | | | | | | | | | | | |
| | | | |
| Water & Sewer Revenue: 0.47% | | | | | | | | | | | | | | | | |
| | | | |
Michigan Finance Authority Series D5 | | | 2.85 | | | | 7-1-2019 | | | | 2,000,000 | | | | 1,999,120 | |
| | | | | | | | | | | | | | | | |
| | | | |
Oregon: 0.24% | | | | | | | | | | | | | | | | |
| | | | |
| GO Revenue: 0.24% | | | | | | | | | | | | | | | | |
| | | | |
Portland OR Taxable Pension (m)(n) | | | 2.98 | | | | 6-1-2019 | | | | 1,000,000 | | | | 1,000,000 | |
| | | | | | | | | | | | | | | | |
| | | | |
Pennsylvania: 0.21% | | | | | | | | | | | | | | | | |
| | | | |
| Miscellaneous Revenue: 0.21% | | | | | | | | | | | | | | | | |
| | | | |
Philadelphia PA IDA Pension Funding Series B (Ambac Insured) ¤ | | | 0.00 | | | | 4-15-2021 | | | | 970,000 | | | | 901,479 | |
| | | | | | | | | | | | | | | | |
The accompanying notes are an integral part of these financial statements.
| | | | |
| 16 | | Wells Fargo Short-Term Bond Fund | | Portfolio of investments—February 28, 2019 (unaudited) |
| | | | | | | | | | | | | | | | |
| Security name | | Interest rate | | | Maturity date | | | Principal | | | Value | |
| | | | |
Rhode Island: 0.20% | | | | | | | | | | | | | | | | |
| | | | |
| Industrial Development Revenue: 0.20% | | | | | | | | | | | | | | | | |
| | | | |
Rhode Island EDA (AGM Insured) | | | 7.75 | % | | | 11-1-2020 | | | $ | 800,000 | | | $ | 829,616 | |
| | | | | | | | | | | | | | | | |
| | | | |
Total Municipal Obligations (Cost $10,711,393) | | | | | | | | | | | | | | | 10,724,525 | |
| | | | | | | | | | | | | | | | |
| | | | |
Non-Agency Mortgage-Backed Securities: 16.07% | | | | | | | | | | | | | | | | |
| | | | |
Barclays Commercial Mortgage Trust Series 2015-STP Class A 144A | | | 3.32 | | | | 9-10-2028 | | | | 1,988,157 | | | | 1,993,813 | |
| | | | |
BDS Limited Series 2018-FL2 Class A (1 Month LIBOR +0.95%) 144A± | | | 3.44 | | | | 8-15-2035 | | | | 1,157,094 | | | | 1,149,857 | |
| | | | |
Benefit Street Partners CLO Limited Series 2014 - IVA Class A1R (3 Month LIBOR +1.49%) 144A± | | | 4.25 | | | | 1-20-2029 | | | | 2,300,000 | | | | 2,304,407 | |
| | | | |
BlueMountain CLO Limited Series 2012-2A Class AR2 (3 Month LIBOR +1.05%) 144A± | | | 3.69 | | | | 11-20-2028 | | | | 1,400,000 | | | | 1,396,739 | |
| | | | |
BX Trust 2017 Series A (1 Month LIBOR +1.05%) 144A± | | | 3.54 | | | | 10-15-2032 | | | | 3,890,000 | | | | 3,889,339 | |
| | | | |
Cascade Funding Mortgage Trust Series 2018- RM2 Class A 144A±±‡ | | | 4.00 | | | | 10-25-2068 | | | | 529,700 | | | | 534,118 | |
| | | | |
CD Commercial Mortgage Trust Series 2017-CD3 Class A1 | | | 1.97 | | | | 2-10-2050 | | | | 1,131,092 | | | | 1,117,988 | |
| | | | |
CGBAM Commercial Mortgage Trust Series 2015-SMRT Class A 144A | | | 2.81 | | | | 4-10-2028 | | | | 1,365,000 | | | | 1,361,749 | |
| | | | |
CGDBB Commercial Mortgage Trust Series 2017-BIOC Class A (1 Month LIBOR +0.79%) 144A± | | | 3.28 | | | | 7-15-2032 | | | | 2,850,000 | | | | 2,846,310 | |
| | | | |
CIFC Funding Limited Series 2012-2RA Class A1 (3 Month LIBOR +0.80%) 144A± | | | 3.56 | | | | 1-20-2028 | | | | 2,440,000 | | | | 2,418,562 | |
| | | | |
Citigroup Commercial Mortgage Trust Series 2016-P5 Class A2 | | | 2.40 | | | | 10-10-2049 | | | | 128,000 | | | | 126,503 | |
| | | | |
Citigroup Commercial Mortgage Trust Series 2017-1500 Class A (1 Month LIBOR +0.85%) 144A± | | | 3.34 | | | | 7-15-2032 | | | | 2,100,000 | | | | 2,100,655 | |
| | | | |
Citigroup Commercial Mortgage Trust Series 2017-MDRB Class A (1 Month LIBOR +1.10%) 144A± | | | 3.59 | | | | 7-15-2030 | | | | 1,056,867 | | | | 1,056,967 | |
| | | | |
Commercial Mortgage Trust Series 2012-CR1 Class ASB | | | 3.05 | | | | 5-15-2045 | | | | 1,943,136 | | | | 1,945,141 | |
| | | | |
Commercial Mortgage Trust Series 2014-LC17 Class A2 | | | 3.16 | | | | 10-10-2047 | | | | 2,113,278 | | | | 2,114,764 | |
| | | | |
Commercial Mortgage Trust Series 2015-CR27 Class A1 | | | 1.58 | | | | 10-10-2048 | | | | 1,242,157 | | | | 1,230,709 | |
| | | | |
ContiMortgage Home Equity Trust Series 1996-2 Class IO ±±(c) | | | 0.00 | | | | 7-15-2027 | | | | 617,259 | | | | 11,376 | |
| | | | |
Countrywide Home Loans Mortgage Pass-Through TrustSeries 2001-HYB1 Class 2A1 ±± | | | 4.46 | | | | 6-19-2031 | | | | 103,080 | | | | 101,926 | |
| | | | |
Credit Suisse Mortgage Trust Series 2019-SKLZ Class A (1 Month LIBOR +1.25%) 144A± | | | 3.76 | | | | 1-15-2034 | | | | 1,400,000 | | | | 1,403,475 | |
| | | | |
Crown Point Limited Series 2018-6A Class A1 (3 Month LIBOR +1.17%) 144A± | | | 3.98 | | | | 10-20-2028 | | | | 2,350,000 | | | | 2,342,489 | |
| | | | |
Deutsche Bank UBS Securities Mortgage Trust Series 2011-LC2A Class A4 144A | | | 4.54 | | | | 7-10-2044 | | | | 704,384 | | | | 723,608 | |
| | | | |
EquiFirst Mortgage Loan Trust Series 2003-2 Class 3A3 (1 Month LIBOR +1.13%) ± | | | 3.61 | | | | 9-25-2033 | | | | 247,526 | | | | 242,617 | |
| | | | |
Golden National Mortgage Asset-Backed CertificatesSeries 1998-GN1 Class M2 †† | | | 1.00 | | | | 2-25-2027 | | | | 34,322 | | | | 34,198 | |
| | | | |
Great Wolf Trust Series 2017-A (1 Month LIBOR +0.85%) 144A± | | | 3.49 | | | | 9-15-2034 | | | | 2,150,000 | | | | 2,144,571 | |
| | | | |
GS Mortgage Securities Trust Series 2010-C1 Class A2 144A | | | 4.59 | | | | 8-10-2043 | | | | 3,210,000 | | | | 3,259,585 | |
| | | | |
GS Mortgage Securities Trust Series 2013-G1 Class A2 144A±± | | | 3.56 | | | | 4-10-2031 | | | | 530,140 | | | | 526,865 | |
| | | | |
GS Mortgage Securities Trust Series 2016-GS3 Class A1 | | | 1.43 | | | | 10-10-2049 | | | | 1,607,956 | | | | 1,582,539 | |
| | | | |
GSMPS Mortgage Loan Trust Series 1998-1 Class A 144A±± | | | 8.00 | | | | 9-19-2027 | | | | 171,720 | | | | 169,417 | |
| | | | |
Hospitality Mortgage Trust Series 2017-HIT Class A (1 Month LIBOR +0.85%) 144A± | | | 3.36 | | | | 5-8-2030 | | | | 750,000 | | | | 748,731 | |
| | | | |
JPMorgan Chase Commercial Mortgage Securities TrustSeries 2007-CB18 Class AMFL (1 Month LIBOR +0.17%) ± | | | 2.68 | | | | 6-12-2047 | | | | 5,572 | | | | 5,561 | |
| | | | |
JPMorgan Chase Commercial Mortgage Securities TrustSeries 2007-LDPX Class AM ±± | | | 5.46 | | | | 1-15-2049 | | | | 403,532 | | | | 403,713 | |
| | | | |
JPMorgan Chase Commercial Mortgage Securities TrustSeries 2018-PHH Class A (1 Month LIBOR +0.91%) 144A± | | | 3.40 | | | | 6-15-2035 | | | | 1,085,000 | | | | 1,082,602 | |
| | | | |
KKR Financial Holdings LLC (3 Month LIBOR +1.34%) 144A± | | | 4.13 | | | | 4-15-2029 | | | | 2,250,000 | | | | 2,250,054 | |
| | | | |
Lendmark Funding Trust Series 2018 -2A Class A 144A | | | 4.23 | | | | 4-20-2027 | | | | 160,000 | | | | 162,855 | |
| | | | |
LStar Commercial Mortgage Trust Series 2017-5 Class A1 144A | | | 2.42 | | | | 3-10-2050 | | | | 502,123 | | | | 497,757 | |
| | | | |
Master Mortgages Trust Series 2002-3 Class 4A1 ±± | | | 4.32 | | | | 10-25-2032 | | | | 3,016 | | | | 3,016 | |
| | | | |
Mello Warehouse Securitization Series 2018 - W1 Class A (1 Month LIBOR +0.85%) 144A± | | | 3.34 | | | | 11-25-2051 | | | | 2,000,000 | | | | 2,001,015 | |
| | | | |
Morgan Stanley Capital I Trust Series 2016-C30 Class A1 | | | 1.39 | | | | 9-15-2049 | | | | 1,287,801 | | | | 1,263,819 | |
The accompanying notes are an integral part of these financial statements.
| | | | | | |
| Portfolio of investments—February 28, 2019 (unaudited) | | Wells Fargo Short-Term Bond Fund | | | 17 | |
| | | | | | | | | | | | | | | | |
| Security name | | Interest rate | | | Maturity date | | | Principal | | | Value | |
| | | | |
Non-Agency Mortgage-Backed Securities(continued) | | | | | | | | | | | | | | | | |
| | | | |
Neuberger Berman Limited Series 2015-20A Class AR (3 Month LIBOR +0.80%) 144A± | | | 3.59 | % | | | 1-15-2028 | | | $ | 1,340,000 | | | $ | 1,328,654 | |
| | | | |
Oaktree CLO Limited Series 15-1A Class A1R (3 Month LIBOR +0.87%) 144A± | | | 3.63 | | | | 10-20-2027 | | | | 1,500,000 | | | | 1,490,684 | |
| | | | |
Octagon Investment Partners Series 2015-1A Class A1R (3 Month LIBOR +0.90%) 144A± | | | 3.54 | | | | 5-21-2027 | | | | 2,000,000 | | | | 1,990,828 | |
| | | | |
Palmer Square Loan Funding Limited Series 2017-1A Class A1 (3 Month LIBOR +0.74%) 144A± | | | 3.53 | | | | 10-15-2025 | | | | 1,614,723 | | | | 1,606,733 | |
| | | | |
Palmer Square Loan Funding Limited Series 2018 - 4A Class A1 (3 Month LIBOR +0.90%) 144A± | | | 3.52 | | | | 11-15-2026 | | | | 1,661,619 | | | | 1,653,944 | |
| | | | |
RAIT Trust Series 2017-FL7 Class A (1 Month LIBOR +0.95%) 144A± | | | 3.44 | | | | 6-15-2037 | | | | 714,522 | | | | 706,436 | |
| | | | |
RAIT Trust Series 2017-FL8 Class A (1 Month LIBOR +0.85%) 144A± | | | 3.34 | | | | 12-15-2037 | | | | 630,647 | | | | 630,370 | |
| | | | |
ReadyCap Commercial Mortgage Trust Series 2019-5 Class A 144A | | | 3.67 | | | | 2-25-2052 | | | | 1,688,742 | | | | 1,697,471 | |
| | | | |
RETL Series 2018 - RVP Class A (1 Month LIBOR +1.10%) 144A± | | | 3.59 | | | | 3-15-2033 | | | | 740,287 | | | | 738,411 | |
| | | | |
Salem Fields CLO Limited Series 2016 - 2a Class A (3 Month LIBOR +1.15%) 144A± | | | 3.92 | | | | 10-25-2028 | | | | 1,800,000 | | | | 1,792,769 | |
| | | | |
SBA Tower Trust Series 2014-1A Class C 144A | | | 2.90 | | | | 10-15-2044 | | | | 3,000,000 | | | | 2,998,417 | |
| | | | |
Stonemont Portfolio Trust Series 2017 Class A (1 Month LIBOR +0.85%) 144A± | | | 3.33 | | | | 8-20-2030 | | | | 1,734,517 | | | | 1,727,971 | |
| | | | |
Vendee Mortgage Trust Series 2011-1 Class DA | | | 3.75 | | | | 2-15-2035 | | | | 591,456 | | | | 597,326 | |
| | | | |
Wilshire Funding Corporation Series 1996-3 Class M2 ±± | | | 7.09 | | | | 8-25-2032 | | | | 81,560 | | | | 79,472 | |
| | | | |
Wilshire Funding Corporation Series 1996-3 Class M3 ±± | | | 7.09 | | | | 8-25-2032 | | | | 86,727 | | | | 83,354 | |
| | | | |
Wilshire Funding Corporation Series 1998-2 Class M1 ±± | | | 2.00 | | | | 12-28-2037 | | | | 10,801 | | | | 10,796 | |
| | | | |
Total Non-Agency Mortgage-Backed Securities (Cost $68,042,421) | | | | | | | | | | | | | | | 67,683,046 | |
| | | | | | | | | | | | | | | | |
| | | | |
U.S. Treasury Securities: 0.37% | | | | | | | | | | | | | | | | |
| | | | |
U.S. Treasury Note | | | 2.50 | | | | 1-15-2022 | | | | 1,545,000 | | | | 1,544,759 | |
| | | | | | | | | | | | | | | | |
| | | | |
Total U.S. Treasury Securities (Cost $1,543,817) | | | | | | | | | | | | | | | 1,544,759 | |
| | | | | | | | | | | | | | | | |
| | | | |
Yankee Corporate Bonds and Notes: 15.46% | | | | | | | | | | | | | | | | |
| | | | |
Consumer Discretionary: 0.26% | | | | | | | | | | | | | | | | |
| | | | |
| Auto Components: 0.15% | | | | | | | | | | | | | | | | |
| | | | |
IHO Verwaltungs GmbH 144A | | | 4.13 | | | | 9-15-2021 | | | | 650,000 | | | | 643,500 | |
| | | | | | | | | | | | | | | | |
| | | | |
| Automobiles: 0.11% | | | | | | | | | | | | | | | | |
| | | | |
Jaguar Land Rover Limited 144A | | | 4.25 | | | | 11-15-2019 | | | | 445,000 | | | | 442,775 | |
| | | | | | | | | | | | | | | | |
| | | | |
Consumer Staples: 0.68% | | | | | | | | | | | | | | | | |
| | | | |
| Beverages: 0.68% | | | | | | | | | | | | | | | | |
| | | | |
Suntory Holdings Limited 144A | | | 2.55 | | | | 6-28-2022 | | | | 2,975,000 | | | | 2,869,441 | |
| | | | | | | | | | | | | | | | |
| | | | |
Energy: 0.24% | | | | | | | | | | | | | | | | |
| | | | |
| Oil, Gas & Consumable Fuels: 0.24% | | | | | | | | | | | | | | | | |
| | | | |
Petroleos Mexicanos Company | | | 5.38 | | | | 3-13-2022 | | | | 995,000 | | | | 997,139 | |
| | | | | | | | | | | | | | | | |
| | | | |
Financials: 11.93% | | | | | | | | | | | | | | | | |
| | | | |
| Banks: 9.59% | | | | | | | | | | | | | | | | |
| | | | |
Banco de Credito del Peru 144A | | | 2.25 | | | | 10-25-2019 | | | | 1,500,000 | | | | 1,490,250 | |
| | | | |
Banco Internacional del Peru 144A | | | 3.38 | | | | 1-18-2023 | | | | 1,305,000 | | | | 1,277,595 | |
| | | | |
Banco Santander SA 144A | | | 4.13 | | | | 11-9-2022 | | | | 2,095,000 | | | | 2,102,856 | |
| | | | |
Banque Federative du Credit Mutuel SA 144A | | | 2.20 | | | | 7-20-2020 | | | | 2,530,000 | | | | 2,498,775 | |
| | | | |
BPCE SA | | | 2.50 | | | | 7-15-2019 | | | | 755,000 | | | | 753,241 | |
| | | | |
Commonwealth Bank of Australia 144A | | | 1.75 | | | | 11-7-2019 | | | | 1,750,000 | | | | 1,737,765 | |
| | | | |
Cooperatieve Rabobank U.A. | | | 2.75 | | | | 1-10-2022 | | | | 3,000,000 | | | | 2,978,645 | |
| | | | |
Corporacion Andina de Fomento | | | 2.13 | | | | 9-27-2021 | | | | 3,000,000 | | | | 2,917,710 | |
The accompanying notes are an integral part of these financial statements.
| | | | |
| 18 | | Wells Fargo Short-Term Bond Fund | | Portfolio of investments—February 28, 2019 (unaudited) |
| | | | | | | | | | | | | | | | |
| Security name | | Interest rate | | | Maturity date | | | Principal | | | Value | |
| | | | |
| Banks(continued) | | | | | | | | | | | | | | | | |
| | | | |
Credit Suisse Group Funding Limited | | | 3.13 | % | | | 12-10-2020 | | | $ | 2,110,000 | | | $ | 2,105,138 | |
| | | | |
Danske Bank AS 144A | | | 1.65 | | | | 9-6-2019 | | | | 3,000,000 | | | | 2,975,968 | |
| | | | |
Danske Bank AS 144A | | | 5.00 | | | | 1-12-2022 | | | | 1,405,000 | | | | 1,433,632 | |
| | | | |
Global Bank Corporation 144A | | | 4.50 | | | | 10-20-2021 | | | | 470,000 | | | | 472,491 | |
| | | | |
Macquarie Bank Limited 144A« | | | 2.85 | | | | 7-29-2020 | | | | 3,000,000 | | | | 2,990,709 | |
| | | | |
Mitsubishi UFJ Trust and Banking Corporation 144A | | | 2.45 | | | | 10-16-2019 | | | | 3,000,000 | | | | 2,992,342 | |
| | | | |
Mizuho Financial Group 144A | | | 2.63 | | | | 4-12-2021 | | | | 1,000,000 | | | | 987,246 | |
| | | | |
Nordea Bank AB 144A | | | 3.75 | | | | 8-30-2023 | | | | 2,000,000 | | | | 1,998,892 | |
| | | | |
Santander UK plc | | | 3.40 | | | | 6-1-2021 | | | | 2,000,000 | | | | 2,004,086 | |
| | | | |
Sumitomo Mitsui Financial Group (3 Month LIBOR +0.80%) ± | | | 3.58 | | | | 10-16-2023 | | | | 2,000,000 | | | | 1,998,606 | |
| | | | |
Svenska Handelsbanken AB | | | 1.88 | | | | 9-7-2021 | | | | 2,500,000 | | | | 2,433,675 | |
| | | | |
UniCredit SpA 144A | | | 6.57 | | | | 1-14-2022 | | | | 2,220,000 | | | | 2,275,854 | |
| | | | |
| | | | | | | | | | | | | | | 40,425,476 | |
| | | | | | | | | | | | | | | | |
| | | | |
| Diversified Financial Services: 1.84% | | | | | | | | | | | | | | | | |
| | | | |
AerCap Ireland Capital DAC | | | 4.45 | | | | 12-16-2021 | | | | 1,410,000 | | | | 1,428,526 | |
| | | | |
Enel Finance International NV 144A | | | 4.25 | | | | 9-14-2023 | | | | 2,500,000 | | | | 2,517,401 | |
| | | | |
General Electric Capital International Funding Company | | | 2.34 | | | | 11-15-2020 | | | | 1,300,000 | | | | 1,278,033 | |
| | | | |
UBS AG 144A | | | 2.20 | | | | 6-8-2020 | | | | 1,275,000 | | | | 1,262,110 | |
| | | | |
UBS AG | | | 2.38 | | | | 8-14-2019 | | | | 1,270,000 | | | | 1,268,195 | |
| | | | |
| | | | | | | | | | | | | | | 7,754,265 | |
| | | | | | | | | | | | | | | | |
| | | | |
| Insurance: 0.50% | | | | | | | | | | | | | | | | |
| | | | |
Sompo International Holdings Limited | | | 4.70 | | | | 10-15-2022 | | | | 2,058,000 | | | | 2,095,837 | |
| | | | | | | | | | | | | | | | |
| | | | |
Health Care: 0.97% | | | | | | | | | | | | | | | | |
| | | | |
| Pharmaceuticals: 0.97% | | | | | | | | | | | | | | | | |
| | | | |
Perrigo Company plc | | | 4.00 | | | | 11-15-2023 | | | | 323,000 | | | | 306,061 | |
| | | | |
Perrigo Finance Unlimited Company | | | 3.50 | | | | 3-15-2021 | | | | 1,065,000 | | | | 1,039,252 | |
| | | | |
Shire Acquisitions Investment Ireland Limited | | | 1.90 | | | | 9-23-2019 | | | | 1,010,000 | | | | 1,002,936 | |
| | | | |
Shire Acquisitions Investment Ireland Limited | | | 2.40 | | | | 9-23-2021 | | | | 980,000 | | | | 957,714 | |
| | | | |
Teva Pharmaceutical Finance BV | | | 2.20 | | | | 7-21-2021 | | | | 805,000 | | | | 764,860 | |
| | | | |
| | | | | | | | | | | | | | | 4,070,823 | |
| | | | | | | | | | | | | | | | |
| | | | |
Industrials: 0.58% | | | | | | | | | | | | | | | | |
| | | | |
| Semiconductors & Semiconductor Equipment: 0.14% | | | | | | | | | | | | | | | | |
| | | | |
NXP BV 144A | | | 4.13 | | | | 6-1-2021 | | | | 585,000 | | | | 589,183 | |
| | | | | | | | | | | | | | | | |
| | | | |
| Transportation Infrastructure: 0.44% | | | | | | | | | | | | | | | | |
| | | | |
Asciano Finance Limited 144A | | | 4.63 | | | | 9-23-2020 | | | | 1,821,000 | | | | 1,842,662 | |
| | | | | | | | | | | | | | | | |
| | | | |
Materials: 0.80% | | | | | | | | | | | | | | | | |
| | | | |
| Chemicals: 0.47% | | | | | | | | | | | | | | | | |
| | | | |
Syngenta Finance NV 144A | | | 4.44 | | | | 4-24-2023 | | | | 2,000,000 | | | | 2,000,343 | |
| | | | | | | | | | | | | | | | |
| | | | |
| Metals & Mining: 0.33% | | | | | | | | | | | | | | | | |
| | | | |
ArcelorMittal SA | | | 5.50 | | | | 3-1-2021 | | | | 1,340,000 | | | | 1,392,252 | |
| | | | | | | | | | | | | | | | |
| | | | |
Total Yankee Corporate Bonds and Notes (Cost $65,189,885) | | | | | | | | | | | | | | | 65,123,696 | |
| | | | | | | | | | | | | | | | |
The accompanying notes are an integral part of these financial statements.
| | | | | | |
| Portfolio of investments—February 28, 2019 (unaudited) | | Wells Fargo Short-Term Bond Fund | | | 19 | |
| | | | | | | | | | | | | | | | |
| Security name | | Yield | | | | | | Shares | | | Value | |
| | | | |
Short-Term Investments: 6.11% | | | | | | | | | | | | | | | | |
| | | | |
| Investment Companies: 5.96% | | | | | | | | | | | | | | | | |
| | | | |
Securities Lending Cash Investments LLC (l)(r)(u) | | | 2.56 | % | | | | | | | 2,906,709 | | | $ | 2,907,000 | |
| | | | |
Wells Fargo Government Money Market Fund Select Class (l)(u) | | | 2.34 | | | | | | | | 22,212,805 | | | | 22,212,805 | |
| | | | |
| | | | | | | | | | | | | | | 25,119,805 | |
| | | | | | | | | | | | | | | | |
| | | | |
| | | | | | Maturity date | | | Principal | | | | |
| U.S. Treasury Securities: 0.15% | | | | | | | | | | | | | | | | |
| | | | |
U.S. Treasury Bill #(z) | | | 2.21 | | | | 3-14-2019 | | | $ | 625,000 | | | | 624,469 | |
| | | | | | | | | | | | | | | | |
| | | | |
Total Short-Term Investments (Cost $25,744,269) | | | | | | | | | | | | | | | 25,744,274 | |
| | | | | | | | | | | | | | | | |
| | | | | | | | |
| Total investments in securities (Cost $419,875,994) | | | 99.58 | % | | | 419,484,967 | |
| | |
Other assets and liabilities, net | | | 0.42 | | | | 1,790,310 | |
| | | | | | | | |
| Total net assets | | | 100.00 | % | | $ | 421,275,277 | |
| | | | | | | | |
| 144A | The security may be resold in transactions exempt from registration, normally to qualified institutional buyers, pursuant to Rule 144A under the Securities Act of 1933. |
| ± | Variable rate investment. The rate shown is the rate in effect at period end. |
| ±± | The coupon of the security is adjusted based on the principal and interest payments received from the underlying pool of mortgages as well as the credit quality and the actual prepayment speed of the underlying mortgages. |
| (m) | The security is an auction-rate security which has an interest rate that resets at predetermined short-term intervals through a Dutch auction. The rate shown is the rate in effect at period end. |
| (n) | The auction to set the interest rate on the security failed at period end due to insufficient investor interest. A failed auction does not itself cause a default. |
| ¤ | The security is issued in zero coupon form with no periodic interest payments. |
| ‡ | Security is valued using significant unobservable inputs. |
| (c) | Investment in an interest-only security entitles holders to receive only the interest payments on the underlying mortgages. The principal amount shown is the notional amount of the underlying mortgages. The rate represents the coupon rate. |
| †† | On the last interest date, partial interest was paid |
| « | All or a portion of this security is on loan. |
| (l) | The issuer of the security is an affiliated person of the Fund as defined in the Investment Company Act of 1940. |
| (r) | The investment is a non-registered investment company purchased with cash collateral received from securities on loan. |
| (u) | The rate represents the 7-day annualized yield at period end. |
| # | All or a portion of this security is segregated as collateral for investments in derivative instruments. |
| (z) | Zero coupon security. The rate represents the purchase yield to maturity. |
Abbreviations:
| AGM | Assured Guaranty Municipal |
| Ambac | Ambac Financial Group Incorporated |
| EDA | Economic Development Authority |
| FDIC | Federal Deposit Insurance Corporation |
| FHLMC | Federal Home Loan Mortgage Corporation |
| FNMA | Federal National Mortgage Association |
| GNMA | Government National Mortgage Association |
| IDA | Industrial Development Authority |
| LIBOR | London Interbank Offered Rate |
| REIT | Real Estate Investment Trust |
The accompanying notes are an integral part of these financial statements.
| | | | |
| 20 | | Wells Fargo Short-Term Bond Fund | | Portfolio of investments—February 28, 2019 (unaudited) |
Futures Contracts
| | | | | | | | | | | | | | | | | | | | | | | | |
| Description | | Number of
contracts | | | Expiration
date | | | Notional
cost | | | Notional
value | | | Unrealized
gains | | | Unrealized
losses | |
| | | | | | |
Long | | | | | | | | | | | | | | | | | | | | | | | | |
| | | | | | |
2-Year U.S. Treasury Notes | | | 761 | | | | 6-28-2019 | | | $ | 161,473,104 | | | $ | 161,480,632 | | | $ | 7,528 | | | $ | 0 | |
| | | | | | |
Short | | | | | | | | | | | | | | | | | | | | | | | | |
| | | | | | |
5-Year U.S. Treasury Notes | | | (265) | | | | 6-28-2019 | | | | (30,393,398 | ) | | | (30,359,062 | ) | | | 34,336 | | | | 0 | |
| | | | | | | | | | | | | | | | | | | | | | | | |
| | | | | | |
| | | | | | | | | | | | | | | | | | $ | 41,864 | | | $ | 0 | |
| | | | | | | | | | | | | | | | | | | | | | | | |
Investments in Affiliates
An affiliated investment is an investment in which the Fund owns at least 5% of the outstanding voting shares of the issuer or as a result of other relationships, such as the Fund and the issuer having the same investment manager. Transactions with issuers that were either affiliated persons of the Fund at the beginning of the period or the end of the period were as follows:
| | | | | | | | | | | | | | | | | | | | | | | | | | | | | | | | | | | | |
| | | Shares,
beginning of
period | | | Shares
purchased | | | Shares
sold | | | Shares,
end of
period | | | Net
realized
gains
(losses) | | | Net
change in
unrealized
gains
(losses) | | | Income
from
affiliated
securities | | | Value,
end
of period | | | % of
net
assets | |
Short-Term Investments | | | | | | | | | | | | | | | | | | | | | | | | | | | | | | | | | | | | |
Investment Companies | | | | | | | | | | | | | | | | | | | | | | | | | | | | | | | | | | | | |
Securities Lending Cash Investments LLC | | | 0 | | | | 6,416,160 | | | | 3,509,451 | | | | 2,906,709 | | | $ | 0 | | | $ | 0 | | | $ | 5,788 | | | $ | 2,907,000 | | | | | |
Wells Fargo Government Money Market Fund Select Class | | | 14,823,405 | | | | 97,014,992 | | | | 89,625,592 | | | | 22,212,805 | | | | 0 | | | | 0 | | | | 180,126 | | | | 22,212,805 | | | | | |
| | | | | | | | | | | | | | | | | | | | | | | | | | | | | | | | | | | | |
| | | | | | | | | |
| | | | | | | | | | | | | | | | | | $ | 0 | | | $ | 0 | | | $ | 185,914 | | | $ | 25,119,805 | | | | 5.96 | % |
| | | | | | | | | | | | | | | | | | | | | | | | | | | | | | | | | | | | |
The accompanying notes are an integral part of these financial statements.
| | | | | | |
| Statement of assets and liabilities—February 28, 2019 (unaudited) | | Wells Fargo Short-Term Bond Fund | | | 21 | |
| | | | |
| | | | |
| |
Assets | | | | |
Investments in unaffiliated securities (including $2,847,055 of securities loaned), at value (cost $394,756,189) | | $ | 394,365,162 | |
Investments in affiliated securities, at value (cost $25,119,805) | | | 25,119,805 | |
Receivable for investments sold | | | 2,148,857 | |
Principal paydown receivable | | | 7,481 | |
Receivable for Fund shares sold | | | 708,264 | |
Receivable for interest | | | 2,699,297 | |
Receivable for daily variation margin on open futures contracts | | | 31,055 | |
Receivable for securities lending income | | | 60 | |
Prepaid expenses and other assets | | | 31,665 | |
| | | | |
Total assets | | | 425,111,646 | |
| | | | |
| |
Liabilities | | | | |
Payable upon receipt of securities loaned | | | 2,906,937 | |
Payable for Fund shares redeemed | | | 415,325 | |
Dividends payable | | | 220,943 | |
Management fee payable | | | 90,938 | |
Payable for daily variation margin on open futures contracts | | | 71,336 | |
Administration fees payable | | | 35,316 | |
Distribution fee payable | | | 4,499 | |
Trustees’ fees and expenses payable | | | 2,774 | |
Accrued expenses and other liabilities | | | 88,301 | |
| | | | |
Total liabilities | | | 3,836,369 | |
| | | | |
Total net assets | | $ | 421,275,277 | |
| | | | |
| |
NET ASSETS CONSIST OF | | | | |
Paid-in capital | | $ | 424,915,585 | |
Total distributable loss | | | (3,640,308 | ) |
| | | | |
Total net assets | | $ | 421,275,277 | |
| | | | |
| |
COMPUTATION OF NET ASSET VALUE AND OFFERING PRICE PER SHARE | | | | |
Net assets – Class A | | $ | 170,208,365 | |
Shares outstanding – Class A1 | | | 19,581,140 | |
Net asset value per share – Class A | | | $8.69 | |
Maximum offering price per share – Class A2 | | | $8.87 | |
Net assets – Class C | | $ | 7,652,467 | |
Shares outstanding – Class C1 | | | 881,396 | |
Net asset value per share – Class C | | | $8.68 | |
Net assets – Class R6 | | $ | 33,767,888 | |
Shares outstanding – Class R61 | | | 3,887,029 | |
Net asset value per share – Class R6 | | | $8.69 | |
Net assets – Institutional Class | | $ | 209,646,557 | |
Shares outstanding – Institutional Class1 | | | 24,107,234 | |
Net asset value per share – Institutional Class | | | $8.70 | |
| 1 | The Fund has an unlimited number of authorized shares. |
| 2 | Maximum offering price is computed as 100/98 of net asset value. On investments of $50,000 or more, the offering price is reduced. |
The accompanying notes are an integral part of these financial statements.
| | | | |
| 22 | | Wells Fargo Short-Term Bond Fund | | Statement of operations—six months ended February 28, 2019 (unaudited) |
| | | | |
| | | | |
| |
Investment income | | | | |
Interest | | $ | 5,858,069 | |
Income from affiliated securities | | | 180,956 | |
| | | | |
Total investment income | | | 6,039,025 | |
| | | | |
| |
Expenses | | | | |
Management fee | | | 706,113 | |
Administration fees | | | | |
Class A | | | 134,889 | |
Class C | | | 6,539 | |
Class R6 | | | 2,796 | |
Institutional Class | | | 83,228 | |
Shareholder servicing fees | | | | |
Class A | | | 210,764 | |
Class C | | | 10,217 | |
Distribution fee | | | | |
Class C | | | 30,651 | |
Custody and accounting fees | | | 20,434 | |
Professional fees | | | 26,603 | |
Registration fees | | | 34,137 | |
Shareholder report expenses | | | 27,309 | |
Trustees’ fees and expenses | | | 10,728 | |
Other fees and expenses | | | 5,365 | |
| | | | |
Total expenses | | | 1,309,773 | |
Less: Fee waivers and/or expense reimbursements | | | (137,264 | ) |
| | | | |
Net expenses | | | 1,172,509 | |
| | | | |
Net investment income | | | 4,866,516 | |
| | | | |
| |
REALIZED AND UNREALIZED GAINS (LOSSES) ON INVESTMENTS | | | | |
| |
Net realized gains (losses) on: | | | | |
Unaffiliated securities | | | (317,564 | ) |
Futures contracts | | | 102,754 | |
| | | | |
Net realized losses on investments | | | (214,810 | ) |
| | | | |
| |
Net change in unrealized gains (losses) on: | | | | |
Unaffiliated securities | | | 2,265,806 | |
Futures contracts | | | 32,034 | |
| | | | |
Net change in unrealized gains (losses) on investments | | | 2,297,840 | |
| | | | |
Net realized and unrealized gains (losses) on investments | | | 2,083,030 | |
| | | | |
Net increase in net assets resulting from operations | | $ | 6,949,546 | |
| | | | |
The accompanying notes are an integral part of these financial statements.
| | | | | | |
| Statement of changes in net assets | | Wells Fargo Short-Term Bond Fund | | | 23 | |
| | | | | | | | | | | | | | | | |
| | | Six months ended
February 28, 2019
(unaudited) | | | Year ended
August 31, 20181 | |
| | | | |
Operations | | | | | | | | | | | | | | | | |
Net investment income | | | | | | $ | 4,866,516 | | | | | | | $ | 8,088,723 | |
Net realized losses on investments | | | | | | | (214,810 | ) | | | | | | | (2,019,738 | ) |
Net change in unrealized gains (losses) on investments | | | | | | | 2,297,840 | | | | | | | | (4,384,603 | ) |
| | | | |
Net increase in net assets resulting from operations | | | | | | | 6,949,546 | | | | | | | | 1,684,382 | |
| | | | |
| | | | |
Distributions to shareholders from net investment income and net realized gains | | | | | | | | | | | | | | | | |
Class A | | | | | | | (1,915,216 | ) | | | | | | | (3,469,175 | ) |
Class C | | | | | | | (62,140 | ) | | | | | | | (90,525 | ) |
Class R6 | | | | | | | (252,806 | ) | | | | | | | (4,529 | )2 |
Institutional Class | | | | | | | (2,644,207 | ) | | | | | | | (4,526,238 | ) |
| | | | |
Total distributions to shareholders | | | | | | | (4,874,369 | ) | | | | | | | (8,090,467 | ) |
| | | | |
| | | | |
Capital share transactions | | | Shares | | | | | | | | Shares | | | | | |
Proceeds from shares sold | | | | | | | | | | | | | | | | |
Class A | | | 1,170,757 | | | | 10,116,439 | | | | 2,950,320 | | | | 25,683,232 | |
Class C | | | 140,778 | | | | 1,214,874 | | | | 199,067 | | | | 1,725,463 | |
Class R6 | | | 4,464,437 | | | | 38,468,844 | | | | 295,683 | 2 | | | 2,557,641 | 2 |
Institutional Class | | | 5,147,411 | | | | 44,475,891 | | | | 9,805,488 | | | | 85,201,932 | |
| | | | |
| | | | |
| | | | | | | 94,276,048 | | | | | | | | 115,168,268 | |
| | | | |
Reinvestment of distributions | | | | | | | | | | | | | | | | |
Class A | | | 208,144 | | | | 1,800,290 | | | | 376,379 | | | | 3,266,179 | |
Class C | | | 6,164 | | | | 53,251 | | | | 8,860 | | | | 76,773 | |
Class R6 | | | 130 | | | | 1,126 | | | | 517 | 2 | | | 4,475 | 2 |
Institutional Class | | | 214,736 | | | | 1,858,208 | | | | 346,975 | | | | 3,011,667 | |
| | | | |
| | | | |
| | | | | | | 3,712,875 | | | | | | | | 6,359,094 | |
| | | | |
Payment for shares redeemed | | | | | | | | | | | | | | | | |
Class A | | | (2,860,720 | ) | | | (24,699,754 | ) | | | (8,005,429 | ) | | | (69,532,343 | ) |
Class C | | | (259,623 | ) | | | (2,243,519 | ) | | | (510,548 | ) | | | (4,431,866 | ) |
Class R6 | | | (872,427 | ) | | | (7,536,242 | ) | | | (1,311 | )2 | | | (11,344 | )2 |
Institutional Class | | | (7,448,437 | ) | | | (64,284,131 | ) | | | (10,231,298 | ) | | | (88,878,420 | ) |
| | | | |
| | | | |
| | | | | | | (98,763,646 | ) | | | | | | | (162,853,973 | ) |
| | | | |
Net decrease in net assets resulting from capital share transactions | | | | | | | (774,723 | ) | | | | | | | (41,326,611 | ) |
| | | | |
Total increase (decrease) in net assets | | | | | | | 1,300,454 | | | | | | | | (47,732,696 | ) |
| | | | |
| | | | |
Net assets | | | | | | | | | | | | | | | | |
Beginning of period | | | | | | | 419,974,823 | | | | | | | | 467,707,519 | |
| | | | |
End of period | | | | | | $ | 421,275,277 | | | | | | | $ | 419,974,823 | |
| | | | |
| 1 | Effective for all filings after November 4, 2018, the SEC prospectively eliminated the requirement to parenthetically disclose undistributed net investment income at the end of the period and permitted the aggregation of distributions, with the exception of tax basis returns of capital. Undistributed net investment income at August 31, 2018 was $37,877. The disaggregated distributions information for the year ended August 31, 2018 is included in Note 8,Distributions to Shareholders, in the notes to the financial statements. |
| 2 | For the period from July 31, 2018 (commencement of class operations) to August 31, 2018 |
The accompanying notes are an integral part of these financial statements.
| | | | |
| 24 | | Wells Fargo Short-Term Bond Fund | | Financial highlights |
(For a share outstanding throughout each period)
| | | | | | | | | | | | | | | | | | | | | | | | |
| | | Six months ended
February 28, 2019
(unaudited) | | | Year ended August 31 | |
| CLASS A | | 2018 | | | 2017 | | | 2016 | | | 2015 | | | 2014 | |
Net asset value, beginning of period | | | $8.65 | | | | $8.77 | | | | $8.78 | | | | $8.77 | | | | $8.82 | | | | $8.77 | |
Net investment income | | | 0.10 | | | | 0.15 | | | | 0.12 | | | | 0.11 | | | | 0.09 | | | | 0.10 | |
Net realized and unrealized gains (losses) on investments | | | 0.04 | | | | (0.12 | ) | | | (0.01 | ) | | | 0.04 | | | | (0.03 | ) | | | 0.05 | |
| | | | | | | | | | | | | | | | | | | | | | | | |
Total from investment operations | | | 0.14 | | | | 0.03 | | | | 0.11 | | | | 0.15 | | | | 0.06 | | | | 0.15 | |
Distributions to shareholders from | | | | | | | | | | | | | | | | | | | | | | | | |
Net investment income | | | (0.10 | ) | | | (0.15 | ) | | | (0.12 | ) | | | (0.11 | ) | | | (0.09 | ) | | | (0.10 | ) |
Net realized gains | | | 0.00 | | | | 0.00 | | | | 0.00 | | | | (0.03 | ) | | | (0.02 | ) | | | 0.00 | |
| | | | | | | | | | | | | | | | | | | | | | | | |
Total distributions to shareholders | | | (0.10 | ) | | | (0.15 | ) | | | (0.12 | ) | | | (0.14 | ) | | | (0.11 | ) | | | (0.10 | ) |
Net asset value, end of period | | | $8.69 | | | | $8.65 | | | | $8.77 | | | | $8.78 | | | | $8.77 | | | | $8.82 | |
Total return1 | | | 1.60 | % | | | 0.31 | % | | | 1.25 | % | | | 1.77 | % | | | 0.66 | % | | | 1.72 | % |
Ratios to average net assets (annualized) | | | | | | | | | | | | | | | | | | | | | | | | |
Gross expenses | | | 0.82 | % | | | 0.82 | % | | | 0.81 | % | | | 0.81 | % | | | 0.80 | % | | | 0.82 | % |
Net expenses | | | 0.72 | % | | | 0.72 | % | | | 0.72 | % | | | 0.72 | % | | | 0.74 | % | | | 0.78 | % |
Net investment income | | | 2.25 | % | | | 1.68 | % | | | 1.35 | % | | | 1.29 | % | | | 1.00 | % | | | 1.12 | % |
Supplemental data | | | | | | | | | | | | | | | | | | | | | | | | |
Portfolio turnover rate | | | 26 | % | | | 43 | % | | | 50 | % | | | 59 | % | | | 57 | % | | | 70 | % |
Net assets, end of period (000s omitted) | | | $170,208 | | | | $182,179 | | | | $225,797 | | | | $278,802 | | | | $65,454 | | | | $59,962 | |
| 1 | Total return calculations do not include any sales charges. Returns for periods of less than one year are not annualized. |
The accompanying notes are an integral part of these financial statements.
| | | | | | |
| Financial highlights | | Wells Fargo Short-Term Bond Fund | | | 25 | |
(For a share outstanding throughout each period)
| | | | | | | | | | | | | | | | | | | | | | | | |
| | | Six months ended
February 28, 2019
(unaudited) | | | Year ended August 31 | |
| CLASS C | | 2018 | | | 2017 | | | 2016 | | | 2015 | | | 2014 | |
Net asset value, beginning of period | | | $8.64 | | | | $8.76 | | | | $8.77 | | | | $8.76 | | | | $8.81 | | | | $8.76 | |
Net investment income | | | 0.06 | | | | 0.08 | | | | 0.05 | | | | 0.05 | | | | 0.02 | | | | 0.03 | |
Net realized and unrealized gains (losses) on investments | | | 0.04 | | | | (0.12 | ) | | | (0.01 | ) | | | 0.04 | | | | (0.03 | ) | | | 0.05 | |
| | | | | | | | | | | | | | | | | | | | | | | | |
Total from investment operations | | | 0.10 | | | | (0.04 | ) | | | 0.04 | | | | 0.09 | | | | (0.01 | ) | | | 0.08 | |
Distributions to shareholders from | | | | | | | | | | | | | | | | | | | | | | | | |
Net investment income | | | (0.06 | ) | | | (0.08 | ) | | | (0.05 | ) | | | (0.05 | ) | | | (0.02 | ) | | | (0.03 | ) |
Net realized gains | | | 0.00 | | | | 0.00 | | | | 0.00 | | | | (0.03 | ) | | | (0.02 | ) | | | 0.00 | |
| | | | | | | | | | | | | | | | | | | | | | | | |
Total distributions to shareholders | | | (0.06 | ) | | | (0.08 | ) | | | (0.05 | ) | | | (0.08 | ) | | | (0.04 | ) | | | (0.03 | ) |
Net asset value, end of period | | | $8.68 | | | | $8.64 | | | | $8.76 | | | | $8.77 | | | | $8.76 | | | | $8.81 | |
Total return1 | | | 1.22 | % | | | (0.44 | )% | | | 0.49 | % | | | 1.01 | % | | | (0.09 | )% | | | 0.97 | % |
Ratios to average net assets (annualized) | | | | | | | | | | | | | | | | | | | | | | | | |
Gross expenses | | | 1.57 | % | | | 1.57 | % | | | 1.56 | % | | | 1.56 | % | | | 1.55 | % | | | 1.57 | % |
Net expenses | | | 1.47 | % | | | 1.47 | % | | | 1.47 | % | | | 1.47 | % | | | 1.49 | % | | | 1.53 | % |
Net investment income | | | 1.51 | % | | | 0.93 | % | | | 0.61 | % | | | 0.53 | % | | | 0.25 | % | | | 0.37 | % |
Supplemental data | | | | | | | | | | | | | | | | | | | | | | | | |
Portfolio turnover rate | | | 26 | % | | | 43 | % | | | 50 | % | | | 59 | % | | | 57 | % | | | 70 | % |
Net assets, end of period (000s omitted) | | | $7,652 | | | | $8,588 | | | | $11,361 | | | | $14,204 | | | | $11,508 | | | | $14,852 | |
| 1 | Total return calculations do not include any sales charges. Returns for periods of less than one year are not annualized. |
The accompanying notes are an integral part of these financial statements.
| | | | |
| 26 | | Wells Fargo Short-Term Bond Fund | | Financial highlights |
(For a share outstanding throughout each period)
| | | | | | | | |
| CLASS R6 | | Six months ended
February 28, 2019
(unaudited) | | | Year ended
August 31, 20181 | |
Net asset value, beginning of period | | | $8.66 | | | | $8.64 | |
Net investment income | | | 0.12 | 2 | | | 0.02 | 2 |
Net realized and unrealized gains (losses) on investments | | | 0.02 | | | | 0.02 | |
| | | | | | | | |
Total from investment operations | | | 0.14 | | | | 0.04 | |
Distributions to shareholders from | | | | | | | | |
Net investment income | | | (0.11 | ) | | | (0.02 | ) |
Net asset value, end of period | | | $8.69 | | | | $8.66 | |
Total return3 | | | 1.64 | % | | | 0.42 | % |
Ratios to average net assets (annualized) | | | | | | | | |
Gross expenses | | | 0.44 | % | | | 0.44 | % |
Net expenses | | | 0.40 | % | | | 0.40 | % |
Net investment income | | | 2.70 | % | | | 2.24 | % |
Supplemental data | | | | | | | | |
Portfolio turnover rate | | | 26 | % | | | 43 | % |
Net assets, end of period (000s omitted) | | | $33,768 | | | | $2,553 | |
| 1 | For the period from July 31, 2018 (commencement of class operations) to August 31, 2018 |
| 2 | Calculated based upon average shares outstanding |
| 3 | Returns for periods of less than one year are not annualized. |
The accompanying notes are an integral part of these financial statements.
| | | | | | |
| Financial highlights | | Wells Fargo Short-Term Bond Fund | | | 27 | |
(For a share outstanding throughout each period)
| | | | | | | | | | | | | | | | | | | | | | | | |
| | | Six months ended
February 28, 2019
(unaudited) | | | Year ended August 31 | |
| INSTITUTIONAL CLASS | | 2018 | | | 2017 | | | 2016 | | | 2015 | | | 2014 | |
Net asset value, beginning of period | | | $8.65 | | | | $8.78 | | | | $8.79 | | | | $8.77 | | | | $8.83 | | | | $8.77 | |
Net investment income | | | 0.11 | | | | 0.17 | | | | 0.14 | | | | 0.13 | | | | 0.11 | | | | 0.12 | |
Net realized and unrealized gains (losses) on investments | | | 0.05 | | | | (0.13 | ) | | | (0.01 | ) | | | 0.05 | | | | (0.04 | ) | | | 0.07 | |
| | | | | | | | | | | | | | | | | | | | | | | | |
Total from investment operations | | | 0.16 | | | | 0.04 | | | | 0.13 | | | | 0.18 | | | | 0.07 | | | | 0.19 | |
Distributions to shareholders from | | | | | | | | | | | | | | | | | | | | | | | | |
Net investment income | | | (0.11 | ) | | | (0.17 | ) | | | (0.14 | ) | | | (0.13 | ) | | | (0.11 | ) | | | (0.13 | ) |
Net realized gains | | | 0.00 | | | | 0.00 | | | | 0.00 | | | | (0.03 | ) | | | (0.02 | ) | | | 0.00 | |
| | | | | | | | | | | | | | | | | | | | | | | | |
Total distributions to shareholders | | | (0.11 | ) | | | (0.17 | ) | | | (0.14 | ) | | | (0.16 | ) | | | (0.13 | ) | | | (0.13 | ) |
Net asset value, end of period | | | $8.70 | | | | $8.65 | | | | $8.78 | | | | $8.79 | | | | $8.77 | | | | $8.83 | |
Total return1 | | | 1.85 | % | | | 0.46 | % | | | 1.49 | % | | | 2.14 | % | | | 0.82 | % | | | 2.15 | % |
Ratios to average net assets (annualized) | | | | | | | | | | | | | | | | | | | | | | | | |
Gross expenses | | | 0.49 | % | | | 0.49 | % | | | 0.48 | % | | | 0.48 | % | | | 0.47 | % | | | 0.49 | % |
Net expenses | | | 0.45 | % | | | 0.46 | % | | | 0.48 | % | | | 0.48 | % | | | 0.47 | % | | | 0.47 | % |
Net investment income | | | 2.52 | % | | | 1.95 | % | | | 1.59 | % | | | 1.51 | % | | | 1.26 | % | | | 1.42 | % |
Supplemental data | | | | | | | | | | | | | | | | | | | | | | | | |
Portfolio turnover rate | | | 26 | % | | | 43 | % | | | 50 | % | | | 59 | % | | | 57 | % | | | 70 | % |
Net assets, end of period (000s omitted) | | | $209,647 | | | | $226,655 | | | | $230,549 | | | | $252,961 | | | | $306,832 | | | | $330,613 | |
| 1 | Returns for periods of less than one year are not annualized. |
The accompanying notes are an integral part of these financial statements.
| | | | |
| 28 | | Wells Fargo Short-Term Bond Fund | | Notes to financial statements (unaudited) |
1. ORGANIZATION
Wells Fargo Funds Trust (the “Trust”), a Delaware statutory trust organized on March 10, 1999, is an open-end management investment company registered under the Investment Company Act of 1940, as amended (the “1940 Act”). As an investment company, the Trust follows the accounting and reporting guidance in Financial Accounting Standards Board (“FASB”) Accounting Standards Codification Topic 946, Financial Services – Investment Companies. These financial statements report on the Wells Fargo Short-Term Bond Fund (the “Fund”) which is a diversified series of the Trust.
2. SIGNIFICANT ACCOUNTING POLICIES
The following significant accounting policies, which are consistently followed in the preparation of the financial statements of the Fund, are in conformity with U.S. generally accepted accounting principles which require management to make estimates and assumptions that affect the reported amounts of assets and liabilities, disclosure of contingent assets and liabilities at the date of the financial statements, and the reported amounts of revenues and expenses during the reporting period. Actual results could differ from those estimates.
Securities valuation
All investments are valued each business day as of the close of regular trading on the New York Stock Exchange (generally 4 p.m. Eastern Time), although the Fund may deviate from this calculation time under unusual or unexpected circumstances.
Debt securities are valued at the evaluated bid price provided by an independent pricing service (e.g. taking into account various factors, including yields, maturities, or credit ratings) or, if a reliable price is not available, the quoted bid price from an independent broker-dealer.
Futures contracts that are listed on a foreign or domestic exchange or market are valued at the official closing price or, if none, the last sales price.
Investments in registered open-end investment companies are valued at net asset value. Interests in non-registered investment companies that are redeemable at net asset value are fair valued normally at net asset value.
Investments which are not valued using any of the methods discussed above are valued at their fair value, as determined in good faith by the Board of Trustees of the Fund. The Board of Trustees has established a Valuation Committee comprised of the Trustees and has delegated to it the authority to take any actions regarding the valuation of portfolio securities that the Valuation Committee deems necessary or appropriate, including determining the fair value of portfolio securities, unless the determination has been delegated to the Wells Fargo Asset Management Pricing Committee at Wells Fargo Funds Management, LLC (“Funds Management”). The Board of Trustees retains the authority to make or ratify any valuation decisions or approve any changes to the Valuation Procedures as it deems appropriate. On a quarterly basis, the Board of Trustees receives reports on any valuation actions taken by the Valuation Committee or the Wells Fargo Asset Management Pricing Committee which may include items for ratification.
Securities lending
The Fund may lend its securities from time to time in order to earn additional income in the form of fees or interest on securities received as collateral or the investment of any cash received as collateral. The Fund continues to receive interest or dividends on the securities loaned. The Fund receives collateral in the form of cash or securities with a value at least equal to the value of the securities on loan. The value of the loaned securities is determined at the close of each business day and any additional required collateral is delivered to the Fund on the next business day. In a securities lending transaction, the net asset value of the Fund will be affected by an increase or decrease in the value of the securities loaned and by an increase or decrease in the value of the instrument in which collateral is invested. The amount of securities lending activity undertaken by the Fund fluctuates from time to time. In the event of default or bankruptcy by the borrower, the Fund may be prevented from recovering the loaned securities or gaining access to the collateral or may experience delays or costs in doing so. In addition, the investment of any cash collateral received may lose all or part of its value. The Fund has the right under the lending agreement to recover the securities from the borrower on demand.
The Fund lends its securities through an unaffiliated securities lending agent. Cash collateral received in connection with its securities lending transactions is invested in Securities Lending Cash Investments, LLC (the “Securities Lending Fund”). The Securities Lending Fund is exempt from registration under Section 3(c)(7) of the 1940 Act and is managed by Funds Management and is subadvised by Wells Capital Management Incorporated (“WellsCap”), an affiliate of Funds Management and an indirect wholly owned subsidiary of Wells Fargo & Company (“Wells Fargo”). Funds Management receives an advisory fee starting at 0.05% and declining to 0.01% as the average daily net assets of the Securities Lending Fund increase. All of the fees received by Funds Management are paid to WellsCap for its services as subadviser. The
| | | | | | |
| Notes to financial statements (unaudited) | | Wells Fargo Short-Term Bond Fund | | | 29 | |
Securities Lending Fund seeks to provide a positive return compared to the daily Fed Funds Open Rate by investing in high-quality, U.S. dollar-denominated short-term money market instruments. Securities Lending Fund investments are valued at the evaluated bid price provided by an independent pricing service. Income earned from investment in the Securities Lending Fund (net of fees and rebates), if any, is included in income from affiliated securities on the Statement of Operations.
Futures contracts
The Fund is subject to interest rate risk in the normal course of pursuing its investment objectives. Futures contracts are agreements between the Fund and a counterparty to buy or sell a specific amount of a commodity, financial instrument or currency at specified price and on a specified date. The Fund may buy and sell futures contracts in order to gain exposure to, or protect against, changes in interest rates. The primary risks associated with the use of futures contracts are the imperfect correlation between changes in market values of securities held by the Fund and the prices of futures contracts, and the possibility of an illiquid market. Futures contracts are generally entered into on a regulated futures exchange and cleared through a clearinghouse associated with the exchange. With futures contracts, there is minimal counterparty risk to the Fund since futures contracts are exchange traded and the exchange’s clearinghouse, as counterparty to all exchange traded futures, guarantees the futures contracts against default.
Upon entering into a futures contracts, the Fund is required to deposit either cash or securities (initial margin) with the broker in an amount equal to a certain percentage of the contract value. Subsequent payments (variation margin) are paid to or from the broker each day equal to the daily changes in the contract value. Such payments are recorded as unrealized gains or losses and, if any, shown as variation margin receivable (payable) in the Statement of Assets and Liabilities. Should the Fund fail to make requested variation margin payments, the broker can gain access to the initial margin to satisfy the Fund’s payment obligations. When the contracts are closed, a realized gain or loss is recorded in the Statement of Operations.
Security transactions and income recognition
Securities transactions are recorded on a trade date basis. Realized gains or losses are recorded on the basis of identified cost.
Interest income is accrued daily and bond discounts are accreted and premiums are amortized daily. To the extent debt obligations are placed on non-accrual status, any related interest income may be reduced by writing off interest receivables when the collection of all or a portion of interest has been determined to be doubtful based on consistently applied procedures and the fair value has decreased. If the issuer subsequently resumes interest payments or when the collectability of interest is reasonably assured, the debt obligation is removed from non-accrual status.
Income from foreign securities is recorded net of foreign taxes withheld where recovery of such taxes is not assured.
Distributions to shareholders
Distributions to shareholders from net investment income are declared daily and paid monthly. Distributions from net realized gains, if any, are recorded on the ex-dividend date and paid at least annually. Such distributions are determined in accordance with income tax regulations and may differ from U.S. generally accepted accounting principles. Dividend sources are estimated at the time of declaration. The tax character of distributions is determined as of the Fund’s fiscal year end. Therefore, a portion of the Fund’s distributions made prior to the Fund’s fiscal year end may be categorized as a tax return of capital at year end.
Federal and other taxes
The Fund intends to continue to qualify as a regulated investment company by distributing substantially all of its investment company taxable income and any net realized capital gains (after reduction for capital loss carryforwards) sufficient to relieve it from all, or substantially all, federal income taxes. Accordingly, no provision for federal income taxes was required.
The Fund’s income and federal excise tax returns and all financial records supporting those returns for the prior three fiscal years are subject to examination by the federal and Delaware revenue authorities. Management has analyzed the Fund’s tax positions taken on federal, state, and foreign tax returns for all open tax years and does not believe that there are any uncertain tax positions that require recognition of a tax liability.
| | | | |
| 30 | | Wells Fargo Short-Term Bond Fund | | Notes to financial statements (unaudited) |
As of February 28, 2019, the aggregate cost of all investments for federal income tax purposes was $419,866,164 and the unrealized gains (losses) consisted of:
| | | | |
| |
Gross unrealized gains | | $ | 1,577,565 | |
| |
Gross unrealized losses | | | (1,916,898 | ) |
| |
Net unrealized losses | | $ | (339,333 | ) |
As of August 30, 2018, the Fund had capital loss carryforwards which consisted of $170,149 in short-term capital losses and $1,246,541 in long-term capital losses.
As of August 30, 2018, the Fund had current year deferred post-October capital losses consisting of $744,588 in short-term losses and $935,251 in long-term losses which were recognized on the first day of the current fiscal year.
Class allocations
The separate classes of shares offered by the Fund differ principally in applicable sales charges, distribution, shareholder servicing, and administration fees. Class specific expenses are charged directly to that share class. Investment income, common expenses, and realized and unrealized gains (losses) on investments are allocated daily to each class of shares based on the relative proportion of net assets of each class.
3. FAIR VALUATION MEASUREMENTS
Fair value measurements of investments are determined within a framework that has established a fair value hierarchy based upon the various data inputs utilized in determining the value of the Fund’s investments. The three-level hierarchy gives the highest priority to unadjusted quoted prices in active markets for identical assets or liabilities (Level 1) and the lowest priority to unobservable inputs (Level 3). The Fund’s investments are classified within the fair value hierarchy based on the lowest level of input that is significant to the fair value measurement. The inputs are summarized into three broad levels as follows:
| ∎ | | Level 1 – quoted prices in active markets for identical securities |
| ∎ | | Level 2 – other significant observable inputs (including quoted prices for similar securities, interest rates, prepayment speeds, credit risk, etc.) |
| ∎ | | Level 3 – significant unobservable inputs (including the Fund’s own assumptions in determining the fair value of investments) |
The inputs or methodologies used for valuing investments in securities are not necessarily an indication of the risk associated with investing in those securities.
The following is a summary of the inputs used in valuing the Fund’s assets and liabilities as of February 28, 2019:
| | | | | | | | | | | | | | | | |
| | | | |
| | | Quoted prices
(Level 1) | | | Other significant
observable inputs
(Level 2) | | | Significant
unobservable inputs (Level 3) | | | Total | |
| | | | |
Assets | | | | | | | | | | | | | | | | |
Investments in: | | | | | | | | | | | | | | | | |
| | | | |
Agency securities | | $ | 0 | | | $ | 19,064,932 | | | $ | 0 | | | $ | 19,064,932 | |
| | | | |
Asset-backed securities | | | 0 | | | | 39,518,279 | | | | 0 | | | | 39,518,279 | |
| | | | |
Corporate bonds and notes | | | 0 | | | | 190,081,456 | | | | 0 | | | | 190,081,456 | |
| | | | |
Municipal obligations | | | 0 | | | | 10,724,525 | | | | 0 | | | | 10,724,525 | |
| | | | |
Non-agency mortgage-backed securities | | | 0 | | | | 67,148,928 | | | | 534,118 | | | | 67,683,046 | |
| | | | |
U.S. Treasury securities | | | 1,544,759 | | | | 0 | | | | 0 | | | | 1,544,759 | |
| | | | |
Yankee corporate bonds and notes | | | 0 | | | | 65,123,696 | | | | 0 | | | | 65,123,696 | |
| | | | |
Short-term investments | | | | | | | | | | | | | | | | |
| | | | |
Investment companies | | | 22,212,805 | | | | 2,907,000 | | | | 0 | | | | 25,119,805 | |
| | | | |
U.S. Treasury securities | | | 624,469 | | | | 0 | | | | 0 | | | | 624,469 | |
| | | | |
| | | 24,382,033 | | | | 394,568,816 | | | | 534,118 | | | | 419,484,967 | |
| | | | |
Futures contracts | | | 41,864 | | | | 0 | | | | 0 | | | | 41,864 | |
| | | | |
Total assets | | $ | 24,423,897 | | | $ | 394,568,816 | | | $ | 534,118 | | | $ | 419,526,831 | |
| | | | | | |
| Notes to financial statements (unaudited) | | Wells Fargo Short-Term Bond Fund | | | 31 | |
Additional sector, industry or geographic detail is included in the Portfolio of Investments.
Futures contracts are reported at their cumulative unrealized gains (losses) at measurement date as reported in the table following the Portfolio of Investments. For futures contracts, the current day’s variation margin is reported on the Statement of Assets and Liabilities. All other assets and liabilities are reported at their market value at measurement date.
At February 28, 2019, the Fund did not have any transfers into/out of Level 3.
4. TRANSACTIONS WITH AFFILIATES
Management fee
Funds Management, an indirect wholly owned subsidiary of Wells Fargo, is the manager of the Fund and provides advisory and fund-level administrative services under an investment management agreement. Under the investment management agreement, Funds Management is responsible for, among other services, implementing the investment objectives and strategies of the Fund, supervising the subadviser and providing fund-level administrative services in connection with the Fund’s operations. As compensation for its services under the investment management agreement, Funds Management is entitled to receive a management fee at the following annual rate based on the Fund’s average daily net assets:
| | | | |
| Average daily net assets | | Annual fee rate | |
| |
First $1 billion | | | 0.350 | % |
| |
Next $4 billion | | | 0.325 | |
| |
Next $3 billion | | | 0.290 | |
| |
Next $2 billion | | | 0.265 | |
| |
Over $10 billion | | | 0.255 | |
For the six months ended February 28, 2019, the management fee was equivalent to an annual rate of 0.35% of the Fund’s average daily net assets.
Funds Management has retained the services of a subadviser to provide daily portfolio management to the Fund. The fee for subadvisory services is borne by Funds Management. WellsCap is the subadviser to the Fund and is entitled to receive a fee from Funds Management at an annual rate starting at 0.15% and declining to 0.05% as the average daily net assets of the Fund increase.
Administration fees
Under a class-level administration agreement, Funds Management provides class-level administrative services to the Fund, which includes paying fees and expenses for services provided by the transfer agent, sub-transfer agents, omnibus account servicers and record-keepers. As compensation for its services under the class-level administration agreement, Funds Management receives an annual fee which is calculated based on the average daily net assets of each class as follows:
| | | | |
| | | Class-level
administration fee | |
| |
Class A, Class C | | | 0.16 | % |
| |
Class R6 | | | 0.03 | |
| |
Institutional Class | | | 0.08 | |
Funds Management has contractually waived and/or reimbursed management and administration fees to the extent necessary to maintain certain net operating expense ratios for the Fund. When each class of the Fund has exceeded its expense cap, Funds Management has waived fees and/or reimbursed expenses from fund level expenses on a proportionate basis and then from class specific expenses. When only certain classes exceed their expense caps, waivers and/or reimbursements are applied against class specific expenses before fund level expenses. Funds Management has committed through December 31, 2019 to waive fees and/or reimburse expenses to the extent necessary to cap the Fund’s expenses at 0.72% for Class A shares, 1.47% for Class C shares, 0.40% for Class R6 shares, and 0.45% for Institutional Class shares. Prior to or after the commitment expiration date, the cap may be increased or the commitment to maintain the cap may be terminated only with the approval of the Board of Trustees.
| | | | |
| 32 | | Wells Fargo Short-Term Bond Fund | | Notes to financial statements (unaudited) |
Distribution fee
The Trust has adopted a distribution plan for Class C shares of the Fund pursuant to Rule 12b-1 under the 1940 Act. A distribution fee is charged to Class C shares and paid to Wells Fargo Funds Distributor, LLC (“Funds Distributor”), the principal underwriter, at an annual rate of 0.75% of the average daily net assets of Class C shares.
In addition, Funds Distributor is entitled to receive the front-end sales charge from the purchase of Class A shares and a contingent deferred sales charge on the redemption of certain Class A shares. Funds Distributor is also entitled to receive the contingent deferred sales charges from redemptions of Class C shares. For the six months ended February 28, 2019, Funds Distributor received $42 from the sale of Class A shares. No contingent deferred sales charges were incurred by Class A and Class C shares for the six months ended February 28, 2019.
Shareholder servicing fees
The Trust has entered into contracts with one or more shareholder servicing agents, whereby Class A and Class C of the Fund are charged a fee at an annual rate of 0.25% of the average daily net assets of each respective class. A portion of these total shareholder servicing fees were paid to affiliates of Wells Fargo.
Interfund transactions
The Fund may purchase or sell portfolio investment securities to certain other Wells Fargo affiliates pursuant toRule 17a-7 under the 1940 Act and under procedures adopted by the Board of Trustees. The procedures have been designed to ensure that these interfund transactions, which do not incur broker commissions, are effected at current market prices.
5. INVESTMENT PORTFOLIO TRANSACTIONS
Purchases and sales of investments, excluding short-term securities, for the six months ended February 28, 2019 were as follows:
| | | | | | |
Purchases at cost | | Sales proceeds |
U.S.
government | | Non-U.S.
government | | U.S.
government | | Non-U.S.
government |
| $2,113,774 | | $123,663,659 | | $1,373,135 | | $99,608,831 |
6. DERIVATIVE TRANSACTIONS
During the six months ended February 28, 2019, the Fund entered into futures contracts to help manage the duration. The Fund had an average notional amount of $166,714,413 in long futures contracts and $31,429,933 in short futures contracts during the six months ended February 28, 2019.
7. BANK BORROWINGS
The Trust (excluding the money market funds), Wells Fargo Master Trust and Wells Fargo Variable Trust are parties to a $280,000,000 revolving credit agreement whereby the Fund is permitted to use bank borrowings for temporary or emergency purposes, such as to fund shareholder redemption requests. Interest under the credit agreement is charged to the Fund based on a borrowing rate equal to the higher of the Federal Funds rate in effect on that day plus 1.25% or the overnight LIBOR rate in effect on that day plus 1.25%. In addition, an annual commitment fee equal to 0.25% of the unused balance is allocated to each participating fund.
For the six months ended February 28, 2019, there were no borrowings by the Fund under the agreement.
8. DISTRIBUTIONS TO SHAREHOLDERS
Effective for all filings after November 4, 2018, the Securities and Exchange Commission eliminated the requirement to separately state the components of distributions to shareholders under U.S. generally accepted accounting principles. The amounts of distributions to shareholders for the year ended August 31, 2018 were as follows:
| | | | |
| | | Net investment
income | |
| |
Class A | | | $3,469,175 | |
| |
Class C | | | 90,525 | |
| |
Class R6 | | | 4,5291 | |
| |
Institutional Class | | | 4,526,238 | |
| 1 | For the period from July 31, 2018 (commencement of class operations) to August 31, 2018. |
| | | | | | |
| Notes to financial statements (unaudited) | | Wells Fargo Short-Term Bond Fund | | | 33 | |
9. INDEMNIFICATION
Under the Trust’s organizational documents, the officers and Trustees have been granted certain indemnification rights against certain liabilities that may arise out of performance of their duties to the Trust. Additionally, in the normal course of business, the Trust may enter into contracts with service providers that contain a variety of indemnification clauses. The Trust’s maximum exposure under these arrangements is dependent on future claims that may be made against the Fund and, therefore, cannot be estimated.
10. NEW ACCOUNTING PRONOUNCEMENTS
In August 2018, FASB issued Accounting Standards Update (“ASU”) No. 2018-13, Fair Value Measurement (Topic 820)Disclosure Framework—Changes to the Disclosure Requirements for Fair Value Measurement. ASU 2018-13 updates the disclosure requirements for fair value measurements by modifying or removing certain disclosures and adding certain new disclosures. The amendments are effective for fiscal years, and interim periods within those fiscal years, beginning after December 15, 2019. Early adoption is permitted. Management has adopted the removal and modification of disclosures early, as permitted, and will adopt the additional new disclosures at the effective date.
In March 2017, FASB issued ASU No. 2017-08,Premium Amortization on Purchased Callable Debt Securities. ASU 2017-08 shortens the amortization period for certain callable debt securities held at a premium. The amendments require the premium to be amortized to the earliest call date. The amendments do not require an accounting change for securities held at a discount; the discount continues to be amortized to maturity. ASU 2017-08 is effective for fiscal years beginning after December 15, 2018 and for interim periods within those fiscal years. Management is currently evaluating the potential impact of this new guidance to the financial statements.
| | | | |
| 34 | | Wells Fargo Short-Term Bond Fund | | Other information (unaudited) |
PROXY VOTING INFORMATION
A description of the policies and procedures used to determine how to vote proxies relating to portfolio securities is available, upon request, by calling1-800-222-8222, visiting our website at wfam.com, or visiting the SEC website at sec.gov. Information regarding how the Fund voted proxies relating to portfolio securities during the most recent12-month period ended June 30 is available on the Fund’s website atwfam.comor by visiting the SEC website at sec.gov.
PORTFOLIO HOLDINGS INFORMATION
The complete portfolio holdings for the Fund are publicly available monthly on the Fund’s website (wfam.com), on a one-month delayed basis. In addition, top ten holdings information (excluding derivative positions) for the Fund is publicly available on the Fund’s website on a monthly, seven-day or more delayed basis. The Fund files its complete schedule of portfolio holdings with the SEC for the first and third quarters of each fiscal year on Form N-Q, which is available by visiting the SEC website at sec.gov. In addition, the Fund’s Form N-Q may be reviewed and copied at the SEC’s Public Reference Room in Washington, DC, and at regional offices in New York City, at 233 Broadway, and in Chicago, at 175 West Jackson Boulevard, Suite 900. Information about the Public Reference Room may be obtained by calling1-800-SEC-0330.
| | | | | | |
| Other information (unaudited) | | Wells Fargo Short-Term Bond Fund | | | 35 | |
BOARD OF TRUSTEES AND OFFICERS
Each of the Trustees and Officers1 listed in the table below acts in identical capacities for each fund in the Wells Fargo family of funds, which consists of 152 mutual funds comprising the Wells Fargo Funds Trust, Wells Fargo Variable Trust, Wells Fargo Master Trust and four closed-end funds (collectively the “Fund Complex”). This table should be read in conjunction with the Prospectus and the Statement of Additional Information2. The mailing address of each Trustee and Officer is 525 Market Street, 12th Floor, San Francisco, CA 94105. Each Trustee and Officer serves an indefinite term, however, each Trustee serves such term until reaching the mandatory retirement age established by the Trustees.
Independent Trustees
| | | | | | |
Name and
year of birth | | Position held and
length of service* | | Principal occupations during past five years or longer | | Current other
public company or
investment company
directorships |
| | | |
William R. Ebsworth (Born 1957) | | Trustee, since 2015 | | Retired. From 1984 to 2013, equities analyst, portfolio manager, research director and chief investment officer at Fidelity Management and Research Company in Boston, Tokyo, and Hong Kong, and retired in 2013 as Chief Investment Officer of Fidelity Strategic Advisers, Inc. where he led a team of investment professionals managing client assets. Prior thereto, Board member of Hong Kong Securities Clearing Co., Hong Kong Options Clearing Corp., the Thailand International Fund, Ltd., Fidelity Investments Life Insurance Company, and Empire Fidelity Investments Life Insurance Company. Board member of the Vincent Memorial Hospital Endowment (non-profit organization), where he serves on the Investment Committee and as a Chair of the Audit Committee. Mr. Ebsworth is a CFA® charterholder. | | N/A |
| | | |
Jane A. Freeman (Born 1953) | | Trustee, since 2015; Chair Liaison, since 2018 | | Retired. From 2012 to 2014 and 1999 to 2008, Chief Financial Officer of Scientific Learning Corporation. From 2008 to 2012, Ms. Freeman provided consulting services related to strategic business projects. Prior to 1999, Portfolio Manager at Rockefeller & Co. and Scudder, Stevens & Clark. Board member of the Harding Loevner Funds from 1996 to 2014, serving as both Lead Independent Director and chair of the Audit Committee. Board member of the Russell Exchange Traded Funds Trust from 2011 to 2012 and the chair of the Audit Committee. Ms. Freeman is a Board Member of The Ruth Bancroft Garden (non-profit organization). She is also an inactive Chartered Financial Analyst. | | N/A |
| | | |
Isaiah Harris, Jr.3 (Born 1952) | | Trustee, since 2009; Audit Committee Chairman, since 2019 | | Retired. Chairman of the Board of CIGNA Corporation since 2009, and Director since 2005. From 2003 to 2011, Director of Deluxe Corporation. Prior thereto, President and CEO of BellSouth Advertising and Publishing Corp. from 2005 to 2007, President and CEO of BellSouth Enterprises from 2004 to 2005 and President of BellSouth Consumer Services from 2000 to 2003. Emeritus member of the Iowa State University Foundation Board of Governors. Emeritus Member of the Advisory Board of Iowa State University School of Business. Advisory Board Member, Palm Harbor Academy (private school). Advisory Board Member, Child Evangelism Fellowship (non-profit). Mr. Harris is a certified public accountant (inactive status). | | CIGNA Corporation |
| | | |
Judith M. Johnson3 (Born 1949) | | Trustee, since 2008; Audit Committee Chairman, from 2009 to 2018 | | Retired. Prior thereto, Chief Executive Officer and Chief Investment Officer of Minneapolis Employees Retirement Fund from 1996 to 2008. Ms. Johnson is an attorney, certified public accountant and a certified managerial accountant. | | N/A |
| | | |
David F. Larcker (Born 1950) | | Trustee, since 2009 | | James Irvin Miller Professor of Accounting at the Graduate School of Business, Stanford University, Director of the Corporate Governance Research Initiative and Senior Faculty of The Rock Center for Corporate Governance since 2006. From 2005 to 2008, Professor of Accounting at the Graduate School of Business, Stanford University. Prior thereto, Ernst & Young Professor of Accounting at The Wharton School, University of Pennsylvania from 1985 to 2005. | | N/A |
| | | | |
| 36 | | Wells Fargo Short-Term Bond Fund | | Other information (unaudited) |
| | | | | | |
Name and
year of birth | | Position held and
length of service* | | Principal occupations during past five years or longer | | Current other
public company or
investment company
directorships |
| | | |
Olivia S. Mitchell (Born 1953) | | Trustee, since 2006; Nominating and Governance Committee Chairman, since 2018 | | International Foundation of Employee Benefit Plans Professor, Wharton School of the University of Pennsylvania since 1993. Director of Wharton’s Pension Research Council and Boettner Center on Pensions & Retirement Research, and Research Associate at the National Bureau of Economic Research. Previously, Cornell University Professor from 1978 to 1993. | | N/A |
| | | |
Timothy J. Penny (Born 1951) | | Trustee, since 1996; Chairman, since 2018 | | President and Chief Executive Officer of Southern Minnesota Initiative Foundation, a non-profit organization, since 2007. Member of the Board of Trustees of NorthStar Education Finance, Inc., a non-profit organization, since 2007. | | N/A |
| | | |
James G. Polisson (Born 1959) | | Trustee, since 2018 | | Retired. Chief Marketing Officer, Source (ETF) UK Services, Ltd, from 2015 to 2017. From 2012 to 2015, Principal of The Polisson Group, LLC, a management consulting, corporate advisory and principal investing company. Chief Executive Officer and Managing Director at Russell Investments, Global Exchange Traded Funds from 2010 to 2012. Managing Director of Barclays Global Investors from 1998 to 2010 and Global Chief Marketing Officer for iShares and Barclays Global Investors from 2000 to 2010. Trustee of the San Francisco Mechanics’ Institute, a non-profit organization, from 2013 to 2015. Board member of the Russell Exchange Traded Fund Trust from 2011 to 2012. Director of Barclays Global Investors Holdings Deutschland GmbH from 2006 to 2009. Mr. Polisson is an attorney and has a retired status with the Massachusetts and District of Columbia Bar Associations. | | N/A |
| | | |
Pamela Wheelock (Born 1959) | | Trustee, since 2018 | | Chief Operating Officer, Twin Cities Habitat for Humanity, since January, 2017. Vice President of University Services, University of Minnesota from 2012 to 2017. Prior thereto, on the Board of Directors, Governance Committee and Finance Committee for the Minnesota Philanthropy Partners (Saint Paul Foundation) from 2012 to 2018, Interim President and Chief Executive Officer of Blue Cross Blue Shield of Minnesota from 2010 to 2011, Chairman of the Board from 2009 to 2011 and Board Director from 2003 to 2015. Vice President, Leadership and Community Engagement, Bush Foundation, Saint Paul, Minnesota (a private foundation) from 2009 to 2011. Executive Vice President and Chief Financial Officer, Minnesota Sports and Entertainment from 2004 to 2009 and Senior Vice President from 2002 to 2004. Commissioner of Finance, State of Minnesota, from 1999 to 2002. Currently the Board Chair of the Minnesota Wild Foundation since 2010. | | N/A |
| * | Length of service dates reflect the Trustee’s commencement of service with the Trust’s predecessor entities, where applicable. |
| | | | | | |
| Other information (unaudited) | | Wells Fargo Short-Term Bond Fund | | | 37 | |
Officers
| | | | | | |
Name and
year of birth | | Position held and
length of service | | Principal occupations during past five years or longer | | |
| | | |
Andrew Owen
(Born 1960) | | President, since 2017 | | Executive Vice President of Wells Fargo & Company and Head of Affiliated Managers, Wells Fargo Asset Management, since 2014. In addition, Mr. Owen is currently President, Chief Executive Officer and Director of Wells Fargo Funds Management, LLC since 2017. Prior thereto, Executive Vice President responsible for marketing, investments and product development for Wells Fargo Funds Management, LLC, from 2009 to 2014. | | |
| | | |
Nancy Wiser1
(Born 1967) | | Treasurer, since 2012 | | Executive Vice President of Wells Fargo Funds Management, LLC since 2011. Chief Operating Officer and Chief Compliance Officer at LightBox Capital Management LLC, from 2008 to 2011. | | |
| | | |
Alexander Kymn
(Born 1973) | | Secretary and Chief Legal Officer, since 2018 | | Senior Company Counsel of Wells Fargo Bank, N.A. since 2018 (previously Senior Counsel from 2007 to 2018). Vice President of Wells Fargo Funds Management, LLC from 2008 to 2014. | | |
| | | |
Michael H. Whitaker
(Born 1967) | | Chief Compliance Officer, since 2016 | | Senior Vice President and Chief Compliance Officer since 2016. Senior Vice President and Chief Compliance Officer for Fidelity Investments from 2007 to 2016. | | |
| | | |
David Berardi
(Born 1975) | | Assistant Treasurer, since 2009 | | Vice President of Wells Fargo Funds Management, LLC since 2009. Vice President of Evergreen Investment Management Company, LLC from 2008 to 2010. Manager of Fund Reporting and Control for Evergreen Investment Management Company, LLC from 2004 to 2010. | | |
| | | |
Jeremy DePalma1
(Born 1974) | | Assistant Treasurer, since 2009 | | Senior Vice President of Wells Fargo Funds Management, LLC since 2009. Senior Vice President of Evergreen Investment Management Company, LLC from 2008 to 2010 and head of the Fund Reporting and Control Team within Fund Administration from 2005 to 2010. | | |
| 1 | Nancy Wiser acts as Treasurer of 76 funds in the Fund Complex. Jeremy DePalma acts as Treasurer of 76 funds and Assistant Treasurer of 76 funds in the Fund Complex. |
| 2 | The Statement of Additional Information includes additional information about the Trustees and is available, without charge, upon request, by calling1-800-222-8222 or by visiting the website atwfam.com. |
| 3 | Mr. Harris became Chairman of the Audit Committee effective January 1, 2019. |
| | | | |
| 38 | | Wells Fargo Short-Term Bond Fund | | Appendix A (unaudited) |
SALES CHARGE REDUCTIONS AND WAIVERS FOR CERTAIN INTERMEDIARIES
Raymond James & Associates, Inc., Raymond James Financial Services & Raymond James affiliates (“Raymond James”)
Effective on or about March 1, 2019, shareholders purchasing Fund shares through a Raymond James platform or account will be eligible only for the following load waivers (front-end sales charge waivers and contingent deferred, or back-end, sales charge waivers) and discounts, which may differ from those disclosed elsewhere in the Fund’s Prospectus or SAI.
Front-end Sales Load Waivers on Class A shares Available at Raymond James
| | • | | Shares purchased in an investment advisory program. |
| | • | | Shares purchased through reinvestment of capital gains distributions and dividend reinvestment when purchasing shares of the same fund (but not any other fund within the fund family). |
| | • | | Employees and registered representatives of Raymond James or its affiliates and their family members as designated by Raymond James. |
| | • | | Shares purchased from the proceeds of redemptions within the same fund family, provided (1) the repurchase occurs within 90 days following the redemption, (2) the redemption and purchase occur in the same account, and (3) redeemed shares were subject to a front-end or deferred sales load (known as Rights of Reinstatement). |
| | • | | A shareholder in the fund’s Class C shares will have their shares automatically exchanged at net asset value to Class A shares (or the appropriate share class) of the fund if the shares are no longer subject to a CDSC and the exchange is in line with the policies and procedures of Raymond James. |
CDSC Waivers on Class A and C Shares Available at Raymond James
| | • | | Death or disability of the shareholder. |
| | • | | Shares sold as part of a systematic withdrawal plan as described in the Fund’s Prospectus. |
| | • | | Return of excess contributions from an IRA Account. |
| | • | | Shares sold as part of a required minimum distribution for IRA and retirement accounts due to the shareholder reaching age 70½ as described in the Fund’s prospectus. |
| | • | | Shares sold to pay Raymond James fees but only if the transaction is initiated by Raymond James. |
| | • | | Shares acquired through a right of reinstatement. |
Front-end Load Discounts Available at Raymond James: Breakpoints, and/or Rights of Accumulation
| | • | | Breakpoints as described in the Fund’s Prospectus. |
| | • | | Rights of accumulation which entitle shareholders to breakpoint discounts will be automatically calculated based on the aggregated holding of fund family assets held by accounts within the purchaser’s household at Raymond James. Eligible fund family assets not held at Raymond James may be included in the rights of accumulation calculation only if the shareholder notifies his or her financial advisor about such assets. |
This page is intentionally left blank.
This page is intentionally left blank.

For more information
More information about Wells Fargo Funds is available free upon request. To obtain literature, please write, visit the Fund’s website, or call:
Wells Fargo Funds
P.O. Box 219967
Kansas City, MO 64121-9967
Website: wfam.com
Individual investors: 1-800-222-8222
Retail investment professionals: 1-888-877-9275
Institutional investment professionals:1-866-765-0778
This report and the financial statements contained herein are submitted for the general information of the shareholders of the Fund. If this report is used for promotional purposes, distribution of the report must be accompanied or preceded by a current prospectus. Before investing, please consider the investment objectives, risks, charges, and expenses of the investment. For a current prospectus and, if available, a summary prospectus, containing this information, call1-800-222-8222 or visit the Fund’s website atwfam.com. Read the prospectus carefully before you invest or send money.
Wells Fargo Asset Management (WFAM) is the trade name for certain investment advisory/management firms owned by Wells Fargo & Company. These firms include but are not limited to Wells Capital Management Incorporated and Wells Fargo Funds Management, LLC. Certain products managed by WFAM entities are distributed by Wells Fargo Funds Distributor, LLC (a broker-dealer and Member FINRA).
This material is for general informational and educational purposes only and is NOT intended to provide investment advice or a recommendation of any kind—including a recommendation for any specific investment, strategy, or plan.
INVESTMENT PRODUCTS: NOT FDIC INSURED ◾ NO BANK GUARANTEE ◾ MAY LOSE VALUE
© 2019 Wells Fargo Funds Management, LLC. All rights reserved.
| | |
 | | 321629 04-19 SA221/SAR221 02-19 |
Semi-Annual Report
February 28, 2019

Wells Fargo Short-Term High Yield Bond Fund

Beginning on January 1, 2021, as permitted by new regulations adopted by the Securities and Exchange Commission, paper copies of the Wells Fargo Funds’ annual and semi-annual shareholder reports issued after this date will no longer be sent by mail, unless you specifically request paper copies of the reports. Instead, the reports will be made available on the Funds’ website, and you will be notified by mail each time a report is posted and provided with a website address to access the report.
If you already elected to receive shareholder reports electronically, you will not be affected by this change and you need not take any action. You may elect to receive shareholder reports and other communications from the Fund electronically at any time by contacting your financial intermediary (such as a broker-dealer or bank) or, if you are a direct investor, by calling 1-800-222-8222 or by enrolling at wellsfargo.com/advantagedelivery.
You may elect to receive all future reports in paper free of charge. If you invest through a financial intermediary, you can contact your financial intermediary to request that you continue to receive paper copies of your shareholder reports; if you invest directly with the Fund, you can call 1-800-222-8222. Your election to receive reports in paper will apply to all Wells Fargo Funds held in your account with your financial intermediary or, if you are a direct investor, to all Wells Fargo Funds that you hold.

Reduce clutter. Save trees.
Sign up for electronic delivery of prospectuses and shareholder reports atwellsfargo.com/advantagedelivery
Contents
The views expressed and any forward-looking statements are as of February 28, 2019, unless otherwise noted, and are those of the Fund managers and/or Wells Fargo Funds Management, LLC. Discussions of individual securities, or the markets generally, or any Wells Fargo Fund are not intended as individual recommendations. Future events or results may vary significantly from those expressed in any forward-looking statements. The views expressed are subject to change at any time in response to changing circumstances in the market. Wells Fargo Funds Management, LLC and the Fund disclaim any obligation to publicly update or revise any views expressed or forward-looking statements.
INVESTMENT PRODUCTS: NOT FDIC INSURED ◾ NO BANK GUARANTEE ◾ MAY LOSE VALUE
| | | | |
| 2 | | Wells Fargo Short-Term High Yield Bond Fund | | Letter to shareholders (unaudited) |

Andrew Owen
President
Wells Fargo Funds
Favorable third-quarter economic indicators and corporate earnings reports encouraged domestic stock investors.
Dear Shareholder:
We are pleased to offer you this semi-annual report for the Wells Fargo Short-Term High Yield Bond Fund for the six-month period that ended February 28, 2019. Highershort-term interest rates, inflation concerns, trade tensions, slowing economic growth outside the U.S., and geopolitical events contributed to investment market volatility throughout the period.
For the period, U.S. stocks, as measured by the S&P 500 Index,1 fell 3.04% and international stocks, as measured by the MSCI ACWI ex USA Index (Net),2 declined 2.47%. Based on the MSCI EM Index (Net),3 emerging market stocks gained 0.33%. For bond investors, the Bloomberg Barclays U.S. Aggregate Bond Index4 added 1.99% while the Bloomberg Barclays Global Aggregate ex-USD Index5 gained 0.63%. The Bloomberg Barclays Municipal Bond Index6 added 2.34%, and the ICE BofAML U.S. High Yield Index7 advanced 1.98%.
Investors appeared to shake off lingering concerns during the third quarter.
Favorable third-quarter economic indicators and corporate earnings reports encouraged domestic stock investors. U.S. trade negotiations with Mexico and Canada progressed. The Conference Board Consumer Confidence Index®8 reached its highest level in 18 years during September 2018. The U.S. Federal Reserve (Fed) raised the federal funds rate by 25 basis points (bps; 100 bps equal 1.00%) to a target range of between 2.00% and 2.25% in September 2018. For the quarter that ended September 30, 2018, the S&P 500 Index added 7.71%.
Investors in international markets were not as confident. Tensions between the U.S. and China increased. The U.S. imposed $200 billion in tariffs on Chinese goods. China reacted with $60 billion in tariffs on U.S. goods. Economic growth in China caused concern. The Bank of England (BOE) raised its monetary policy rate to 0.75% in August. During the quarter, the MSCI ACWI ex USA Index (Net) gained 0.71%. The MSCI EM Index (Net) declined 1.09%. In fixed-income markets, U.S. bonds were flat, as measured by the Bloomberg Barclays U.S. Aggregate Bond Index. The Bloomberg Barclays Global Aggregate ex-USD Index fell 1.74%.
| 1 | The S&P 500 Index consists of 500 stocks chosen for market size, liquidity, and industry group representation. It is a market-value-weighted index with each stock’s weight in the index proportionate to its market value. You cannot invest directly in an index. |
| 2 | The Morgan Stanley Capital International (MSCI) All Country World Index (ACWI) ex USA Index (Net) is a free-float-adjusted market-capitalization-weighted index that is designed to measure the equity market performance of developed markets, excluding the United States and Canada. Source: MSCI. MSCI makes no express or implied warranties or representations and shall have no liability whatsoever with respect to any MSCI data contained herein. The MSCI data may not be further redistributed or used as a basis for other indices or any securities or financial products. This report is not approved, reviewed, or produced by MSCI. You cannot invest directly in an index. |
| 3 | The MSCI Emerging Markets (EM) Index (Net) is a free-float-adjusted market-capitalization-weighted index that is designed to measure large- and mid-cap equity market performance of emerging markets. The MSCI EM Index (Net) consists of the following 24 emerging market country indices: Brazil, Chile, China, Colombia, Czech Republic, Egypt, Greece, Hungary, India, Indonesia, Korea, Malaysia, Mexico, Pakistan, Peru, the Philippines, Poland, Qatar, Russia, South Africa, Taiwan, Thailand, Turkey, and the United Arab Emirates. You cannot invest directly in an index. |
| 4 | The Bloomberg Barclays U.S. Aggregate Bond Index is a broad-based benchmark that measures the investment-grade, U.S. dollar-denominated, fixed-rate taxable bond market, including Treasuries, government-related and corporate securities, mortgage-backed securities (agency fixed-rate and hybrid adjustable-rate mortgage pass-throughs), asset-backed securities, and commercial mortgage-backed securities. You cannot invest directly in an index. |
| 5 | The Bloomberg Barclays Global Aggregate ex-USD Index is an unmanaged index that provides a broad-based measure of the global investment-grade fixed-income markets excluding the U.S. dollar-denominated debt market. You cannot invest directly in an index. |
| 6 | The Bloomberg Barclays Municipal Bond Index is an unmanaged index composed of long-term tax-exempt bonds with a minimum credit rating of Baa. You cannot invest directly in an index. |
| 7 | The ICE BofAML U.S. High Yield Index is a market-capitalization-weighted index of domestic and Yankee high-yield bonds. The index tracks the performance of high-yield securities traded in the U.S. bond market. You cannot invest directly in an index. Copyright 2019. ICE Data Indices, LLC. All rights reserved. |
| 8 | The Conference Board Consumer Confidence Index® measures the degree of optimism on the state of the U.S. economy that consumers are expressing through their activities of savings and spending. You cannot invest directly in an index. |
| | | | | | |
| Letter to shareholders (unaudited) | | Wells Fargo Short-Term High Yield Bond Fund | | | 3 | |
Conflicting data unsettled markets during the fourth quarter.
November’s U.S. midterm elections shifted control of the House of Representatives from Republicans to Democrats, presaging potential partisan clashes.Third-quarter U.S. gross domestic product (GDP) was announced at an annualized 3.4% rate, lower than the second-quarter rate. Brexit efforts stalled ahead of the March 2019 deadline. The People’s Bank of China cut reserve requirement ratios, accelerated infrastructure spending, and cut taxes even as the value of the yuan declined to low levels last seen in 2008.
December’s S&P 500 Index performance was the worst since 1931. Globally,fixed-income investments fared better than stocks during the last two months of the year. The Fed increased the federal funds rate by 25 bps in December 2018 to a target range of between 2.25% and 2.50% and softened its outlook for 2019 rate increases.
The market climbs a wall of worry.
Investors entered 2019 with reasons to be concerned. A partial U.S. government shutdown driven by partisan spending and immigration policy disputes extended into January. Investors expected high levels of stock market volatility to continue based on the VIX9.
January’s returns tended to support the investing adage that markets climb a wall of worry. The S&P 500 Index gained 8.01% for the month that ended January 31, 2019, its best monthly performance in 30 years. Returns for the MSCI ACWI ex USA Index (Net), the Bloomberg Barclays U.S. Aggregate Bond Index, and the Bloomberg Barclays Global Aggregate ex-USD Index also were positive.
In February, concerns over slowing global growth reemerged. The Bureau of Economic Analysis announced fourth-quarter 2018 GDP grew at an annualized 2.2% rate, down from the 4.2% annualized rate for the second quarter and the 3.4% annualized rate for the third quarter. Analysts attributed the lower growth rate to a slowing housing market and larger trade deficit. The U.S. Labor Department said that the economy created just 20,000 jobs in February. In a February report, the BOE forecast the slowest growth since the financial crisis for 2019. China and the U.S., while putting future tariffs on hold for the time being, continued to wrangle over trade issues.
Don’t let short-term uncertainty derail long-term investment goals.
Periods of investment uncertainty can present challenges, but experience has taught us that maintaining long-term investment goals can be an effective way to plan for the future. To help you create a sound strategy based on your personal goals and risk tolerance, Wells Fargo Funds offers more than 100 mutual funds spanning a wide range of asset classes and investment styles. Although diversification cannot guarantee an investment profit or prevent losses, we believe it can be an effective way to manage investment risk and potentially smooth out overall portfolio performance. We encourage investors to know their investments and to understand that appropriate levels of risk-taking may unlock opportunities.
January’s returns tended to support the investing adage that markets climb a wall of worry.
| 9 | The Chicago Board Options Exchange Market Volatility Index (VIX) is a popular measure of the implied volatility of S&P 500 Index options. It represents one measure of the market’s expectation of stock market volatility over the next 30-day period. You cannot invest directly in an index. |
| | | | |
| 4 | | Wells Fargo Short-Term High Yield Bond Fund | | Letter to shareholders (unaudited) |
Thank you for choosing to invest with Wells Fargo Funds. We appreciate your confidence in us and remain committed to helping you meet your financial needs.
Sincerely,

Andrew Owen
President
Wells Fargo Funds
For further information about your Fund, contact your investment professional, visit our website atwfam.com, or call us directly at1-800-222-8222.
This page is intentionally left blank.
| | | | |
| 6 | | Wells Fargo Short-Term High Yield Bond Fund | | Performance highlights (unaudited) |
Investment objective
The Fund seeks total return, consisting of a high level of current income and capital appreciation.
Manager
Wells Fargo Funds Management, LLC
Subadviser
Wells Capital Management Incorporated
Portfolio managers
Kevin J. Maas, CFA®‡
Thomas M. Price, CFA®‡
Michael J. Schueller, CFA®‡
Average annual total returns (%) as of February 28, 2019
| | | | | | | | | | | | | | | | | | | | | | | | | | | | | | | | | | |
| | | | | Including sales charge | | | Excluding sales charge | | | Expense ratios1 (%) | |
| | | Inception date | | 1 year | | | 5 year | | | 10 year | | | 1 year | | | 5 year | | | 10 year | | | Gross | | | Net2 | |
| | | | | | | | | |
| Class A (SSTHX) | | 2-29-2000 | | | 0.25 | | | | 1.81 | | | | 4.02 | | | | 3.36 | | | | 2.43 | | | | 4.34 | | | | 0.94 | | | | 0.82 | |
| | | | | | | | | |
| Class C (WFHYX) | | 3-31-2008 | | | 1.58 | | | | 1.66 | | | | 3.56 | | | | 2.58 | | | | 1.66 | | | | 3.56 | | | | 1.69 | | | | 1.57 | |
| | | | | | | | | |
| Administrator Class (WDHYX)3 | | 7-30-2010 | | | – | | | | – | | | | – | | | | 3.39 | | | | 2.57 | | | | 4.47 | | | | 0.88 | | | | 0.66 | |
| | | | | | | | | |
| Institutional Class (STYIX)4 | | 11-30-2012 | | | – | | | | – | | | | – | | | | 3.55 | | | | 2.72 | | | | 4.54 | | | | 0.61 | | | | 0.51 | |
| | | | | | | | | |
| Short-Term High Yield Bond Index III5 | | – | | | – | | | | – | | | | – | | | | 5.07 | | | | 4.02 | | | | 8.97 | | | | – | | | | – | |
| | | | | | | | | |
| ICE BofAML High Yield U.S. Corporates, Cash Pay, B Rated, 1-5 Year Index6 | | – | | | – | | | | – | | | | – | | | | 5.59 | | | | 3.86 | | | | 9.78 | | | | – | | | | – | |
| | | | | | | | | |
| ICE BofAML High Yield U.S. Corporates, Cash Pay, BB Rated, 1-5 Year Index7 | | – | | | – | | | | – | | | | – | | | | 4.84 | | | | 4.08 | | | | 8.62 | | | | – | | | | – | |
Figures quoted represent past performance, which is no guarantee of future results, and do not reflect taxes that a shareholder may pay on fund distributions or the redemption of fund shares. Investment return and principal value of an investment will fluctuate so that an investor’s shares, when redeemed, may be worth more or less than their original cost. Performance shown without sales charges would be lower if sales charges were reflected. Current performance may be lower or higher than the performance data quoted, which assumes the reinvestment of dividends and capital gains. Current month-end performance is available on the Fund’s website, wfam.com.
Index returns do not include transaction costs associated with buying and selling securities, any mutual fund fees or expenses, or any taxes. It is not possible to invest directly in an index.
For Class A shares, the maximum front-end sales charge is 3.00%. For Class C shares, the maximum contingent deferred sales charge is 1.00%. Performance including a contingent deferred sales charge assumes the sales charge for the corresponding time period. Administrator Class and Institutional Class shares are sold without a front-end sales charge or contingent deferred sales charge.
Bond values fluctuate in response to the financial condition of individual issuers, general market and economic conditions, and changes in interest rates. Changes in market conditions and government policies may lead to periods of heightened volatility in the bond market and reduced liquidity for certain bonds held by the Fund. In general, when interest rates rise, bond values fall and investors may lose principal value. Interest rate changes and their impact on the Fund and its share price can be sudden and unpredictable. High-yield securities have a greater risk of default and tend to be more volatile than higher-rated debt securities. Loans are subject to risks similar to those associated with other below investment- grade bond investments, such as credit risk (for example, risk of issuer default), below-investment-grade bond risk (for example, risk of greater volatility in value), and risk that the loan may become illiquid or difficult to price. The use of derivatives may reduce returns and/or increase volatility. Certain investment strategies tend to increase the total risk of an investment (relative to the broader market). The Fund is exposed to foreign investment risk. Consult the Fund’s prospectus for additional information on these and other risks.
Please see footnotes on page 7.
| | | | | | |
| Performance highlights (unaudited) | | Wells Fargo Short-Term High Yield Bond Fund | | | 7 | |
| | | | |
| Ten largest holdings (%) as of February 28, 20198 | |
| |
Charter Communications Operating LLC, 4.50%, 4-30-2025 | | | 1.85 | |
| |
Ally Financial Incorporated, 3.75%, 11-18-2019 | | | 1.73 | |
| |
Ineos US Finance LLC, 4.49%, 3-31-2024 | | | 1.64 | |
| |
Sabra Health Care LP, 5.50%, 2-1-2021 | | | 1.61 | |
| |
Cable One Incorporated, 5.75%, 6-15-2022 | | | 1.47 | |
| |
B&G Foods Incorporated, 4.63%, 6-1-2021 | | | 1.45 | |
| |
Service Corporation International, 5.38%, 1-15-2022 | | | 1.44 | |
| |
Netflix Incorporated, 5.38%, 2-1-2021 | | | 1.44 | |
| |
Teva Pharmaceutical Finance BV, 2.20%, 7-21-2021 | | | 1.44 | |
| |
Sinclair Television Group Incorporated, 6.13%, 10-1-2022 | | | 1.40 | |
|
| Credit quality as of February 28, 20199 |
|
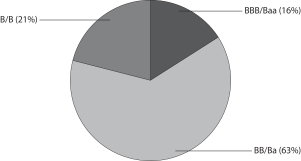
|
| ‡ | CFA® and Chartered Financial Analyst® are trademarks owned by CFA Institute. |
| 1 | Reflects the expense ratios as stated in the most recent prospectuses, which include the impact of 0.01% in acquired fund fees and expenses. The expense ratios shown are subject to change and may differ from the annualized expense ratios shown in the financial highlights of this report, which do not include acquired fund fees and expenses. |
| 2 | The manager has contractually committed through December 31, 2019, to waive fees and/or reimburse expenses to the extent necessary to cap the the expenses of each class after fee waivers at 0.81% for Class A, 1.56% for Class C, 0.65% for Administrator Class, and 0.50% for Institutional Class. Brokerage commissions, stamp duty fees, interest, taxes, acquired fund fees and expenses (if any), and extraordinary expenses are excluded from the expense cap. Prior to or after the commitment expiration date, the cap may be increased or the commitment to maintain the cap may be terminated only with the approval of the Board of Trustees. Without this cap, the Fund’s returns would have been lower. The expense ratio paid by an investor is the net expense ratio (the total annual fund operating expenses after fee waivers) as stated in the prospectuses. |
| 3 | Historical performance shown for Administrator Class shares prior to their inception reflects the performance of Class A shares and includes the higher expenses applicable to Class A shares. If these expenses had not been included, returns for Administrator Class shares would be higher. |
| 4 | Historical performance shown for Institutional Class shares prior to their inception reflects the performance of Administrator Class shares and includes the higher expenses applicable to Administrator Class shares. If these expenses had not been included, returns for Institutional Class shares would be higher. |
| 5 | Source: Wells Fargo Funds Management, LLC. The Short-Term High Yield Bond Index III is comprised of 70% of ICE BofAML High Yield U.S. Corporates, Cash Pay, BB Rated, 1-5 Year Index and 30% of ICE BofAML High Yield U.S. Corporates, Cash Pay, B Rated, 1-5 Year Index. You cannot invest directly in an index. Copyright 2018. ICE Data Indices, LLC. All rights reserved. |
| 6 | The ICE BofAML High Yield U.S. Corporates, Cash Pay, B Rated, 1-5 Year Index is an unmanaged index that generally tracks the performance of B rated U.S. dollar-denominated corporate bonds publicly issued in the U.S. domestic market with maturities of one to five years. You cannot invest directly in an index. |
| 7 | The ICE BofAML High Yield U.S. Corporates, Cash Pay, BB Rated, 1-5 Year Index is an unmanaged index that generally tracks the performance of BB rated U.S. dollar-denominated corporate bonds publicly issued in the U.S. domestic market with maturities of one to five years. You cannot invest directly in an index. |
| 8 | The ten largest holdings, excluding cash, cash equivalents and any money market funds, are calculated based on the value of the investments divided by total net assets of the Fund. Holdings are subject to change and may have changed since the date specified. |
| 9 | The credit quality distribution of portfolio holdings reflected in the chart is based on ratings from Standard & Poor’s, Moody’s Investors Service, and/or Fitch Ratings Ltd. Credit quality ratings apply to the underlying holdings of the Fund and not to the Fund itself. The percentages of the Fund’s portfolio with the ratings depicted in the chart are calculated based on the total market value of fixed income securities held by the Fund. If a security was rated by all three rating agencies, the middle rating was utilized. If rated by two of three rating agencies, the lower rating was utilized, and if rated by one of the rating agencies, that rating was utilized. Standard & Poor’s rates the creditworthiness of bonds, ranging from AAA (highest) to D (lowest). Ratings from A to CCC may be modified by the addition of a plus (+) or minus (-) sign to show relative standing within the rating categories. Standard & Poor’s rates the creditworthiness of short-term notes from SP-1 (highest) to SP-3 (lowest). Moody’s rates the creditworthiness of bonds, ranging from Aaa (highest) to C (lowest). Ratings Aa to B may be modified by the addition of a number 1 (highest) to 3 (lowest) to show relative standing within the ratings categories. Moody’s rates the creditworthiness of short-term U.S. tax-exempt municipal securities from MIG 1/VMIG 1 (highest) to SG (lowest). Fitch rates the creditworthiness of bonds, ranging from AAA (highest) to D (lowest). Credit quality distribution is subject to change and may have changed since the date specified. |
| | | | |
| 8 | | Wells Fargo Short-Term High Yield Bond Fund | | Fund expenses (unaudited) |
As a shareholder of the Fund, you incur two types of costs: (1) transaction costs, including sales charges (loads) on purchase payments and contingent deferred sales charges (if any) on redemptions and (2) ongoing costs, including management fees, distribution (12b-1) and/or shareholder servicing fees, and other Fund expenses. This example is intended to help you understand your ongoing costs (in dollars) of investing in the Fund and to compare these costs with the ongoing costs of investing in other mutual funds.
The example is based on an investment of $1,000 invested at the beginning of the six-month period and held for the entire period from September 1, 2018 to February 28, 2019.
Actual expenses
The “Actual” line of the table below provides information about actual account values and actual expenses. You may use the information in this line, together with the amount you invested, to estimate the expenses that you paid over the period. Simply divide your account value by $1,000 (for example, an $8,600 account value divided by $1,000 = 8.6), then multiply the result by the number in the “Actual” line under the heading entitled “Expenses paid during period” for your applicable class of shares to estimate the expenses you paid on your account during this period.
Hypothetical example for comparison purposes
The “Hypothetical” line of the table below provides information about hypothetical account values and hypothetical expenses based on the Fund’s actual expense ratio and an assumed rate of return of 5% per year before expenses, which is not the Fund’s actual return. The hypothetical account values and expenses may not be used to estimate the actual ending account balance or expenses you paid for the period. You may use this information to compare the ongoing costs of investing in the Fund and other funds. To do so, compare this 5% hypothetical example with the 5% hypothetical examples that appear in the shareholder reports of the other funds.
Please note that the expenses shown in the table are meant to highlight your ongoing costs only and do not reflect any transactional costs, such as sales charges (loads) and contingent deferred sales charges. Therefore, the “Hypothetical” line of the table is useful in comparing ongoing costs only and will not help you determine the relative total costs of owning different funds. In addition, if these transactional costs were included, your costs would have been higher.
| | | | | | | | | | | | | | | | |
| | | Beginning
account value
9-1-2018 | | | Ending
account value
2-28-2019 | | | Expenses
paid during
the period¹ | | | Annualized net
expense ratio | |
Class A | | | | | | | | | | | | | | | | |
| | | | |
Actual | | $ | 1,000.00 | | | $ | 1,020.32 | | | $ | 4.06 | | | | 0.81 | % |
| | | | |
Hypothetical (5% return before expenses) | | $ | 1,000.00 | | | $ | 1,020.78 | | | $ | 4.06 | | | | 0.81 | % |
Class C | | | | | | | | | | | | | | | | |
| | | | |
Actual | | $ | 1,000.00 | | | $ | 1,015.27 | | | $ | 7.79 | | | | 1.56 | % |
| | | | |
Hypothetical (5% return before expenses) | | $ | 1,000.00 | | | $ | 1,017.06 | | | $ | 7.80 | | | | 1.56 | % |
Administrator Class | | | | | | | | | | | | | | | | |
| | | | |
Actual | | $ | 1,000.00 | | | $ | 1,019.86 | | | $ | 3.26 | | | | 0.65 | % |
| | | | |
Hypothetical (5% return before expenses) | | $ | 1,000.00 | | | $ | 1,021.57 | | | $ | 3.26 | | | | 0.65 | % |
Institutional Class | | | | | | | | | | | | | | | | |
| | | | |
Actual | | $ | 1,000.00 | | | $ | 1,020.62 | | | $ | 2.51 | | | | 0.50 | % |
| | | | |
Hypothetical (5% return before expenses) | | $ | 1,000.00 | | | $ | 1,022.32 | | | $ | 2.51 | | | | 0.50 | % |
| 1 | Expenses paid is equal to the annualized net expense ratio of each class multiplied by the average account value over the period, multiplied by the number of days in the most recent fiscal half-year divided by the number of days in the fiscal year (to reflect theone-half-year period). |
| | | | | | |
| Portfolio of investments—February 28, 2019 (unaudited) | | Wells Fargo Short-Term High Yield Bond Fund | | | 9 | |
| | | | | | | | | | | | | | | | |
| Security name | | Interest rate | | | Maturity date | | | Principal | | | Value | |
|
Corporate Bonds and Notes: 62.92% | |
| | | | |
Communication Services: 13.74% | | | | | | | | | | | | | | | | |
| | | | |
| Diversified Telecommunication Services: 0.53% | | | | | | | | | | | | | | | | |
| | | | |
Hughes Satellite Systems Corporation | | | 6.50 | % | | | 6-15-2019 | | | $ | 5,115,000 | | | $ | 5,146,969 | |
| | | | | | | | | | | | | | | | |
| | | | |
| Entertainment: 1.44% | | | | | | | | | | | | | | | | |
| | | | |
Netflix Incorporated | | | 5.38 | | | | 2-1-2021 | | | | 13,445,000 | | | | 13,898,769 | |
| | | | | | | | | | | | | | | | |
| | | | |
| Media: 10.30% | | | | | | | | | | | | | | | | |
| | | | |
Cable One Incorporated 144A | | | 5.75 | | | | 6-15-2022 | | | | 13,918,000 | | | | 14,161,565 | |
| | | | |
DISH DBS Corporation | | | 7.88 | | | | 9-1-2019 | | | | 11,065,000 | | | | 11,286,300 | |
| | | | |
Lamar Media Corporation | | | 5.00 | | | | 5-1-2023 | | | | 5,115,000 | | | | 5,204,513 | |
| | | | |
National CineMedia LLC | | | 6.00 | | | | 4-15-2022 | | | | 10,175,000 | | | | 10,288,451 | |
| | | | |
Nexstar Broadcasting Group Incorporated | | | 5.88 | | | | 11-15-2022 | | | | 1,220,000 | | | | 1,247,450 | |
| | | | |
Nexstar Broadcasting Group Incorporated 144A | | | 6.13 | | | | 2-15-2022 | | | | 11,535,000 | | | | 11,708,025 | |
| | | | |
Outfront Media Capital Corporation | | | 5.25 | | | | 2-15-2022 | | | | 10,515,000 | | | | 10,675,880 | |
| | | | |
Sinclair Television Group Incorporated | | | 6.13 | | | | 10-1-2022 | | | | 13,200,000 | | | | 13,493,040 | |
| | | | |
Sirius XM Radio Incorporated «144A | | | 3.88 | | | | 8-1-2022 | | | | 10,730,000 | | | | 10,659,719 | |
| | | | |
TEGNA Incorporated | | | 5.13 | | | | 10-15-2019 | | | | 6,174,000 | | | | 6,189,435 | |
| | | | |
TEGNA Incorporated | | | 5.13 | | | | 7-15-2020 | | | | 4,505,000 | | | | 4,544,419 | |
| |
| | | | 99,458,797 | |
| | | | | | | | | | | | | | | | |
| | | | |
| Wireless Telecommunication Services: 1.47% | | | | | | | | | | | | | | | | |
| | | | |
Sprint Corporation | | | 7.25 | | | | 9-15-2021 | | | | 5,010,000 | | | | 5,291,813 | |
| | | | |
T-Mobile USA Incorporated | | | 4.00 | | | | 4-15-2022 | | | | 8,922,000 | | | | 8,944,305 | |
| |
| | | | 14,236,118 | |
| | | | | | | | | | | | | | | | |
| | | | |
Consumer Discretionary: 12.44% | | | | | | | | | | | | | | | | |
| | | | |
| Auto Components: 0.49% | | | | | | | | | | | | | | | | |
| | | | |
American Axle & Manufacturing Incorporated | | | 7.75 | | | | 11-15-2019 | | | | 2,040,000 | | | | 2,088,715 | |
| | | | |
Cooper Tire & Rubber Company | | | 8.00 | | | | 12-15-2019 | | | | 2,568,000 | | | | 2,641,830 | |
| |
| | | | 4,730,545 | |
| | | | | | | | | | | | | | | | |
| | | | |
| Diversified Consumer Services: 2.28% | | | | | | | | | | | | | | | | |
| | | | |
Service Corporation International | | | 5.38 | | | | 1-15-2022 | | | | 13,800,000 | | | | 13,938,000 | |
| | | | |
TRI Pointe Group Incorporated | | | 4.38 | | | | 6-15-2019 | | | | 8,142,000 | | | | 8,131,823 | |
| |
| | | | 22,069,823 | |
| | | | | | | | | | | | | | | | |
| | | | |
| Hotels, Restaurants & Leisure: 2.91% | | | | | | | | | | | | | | | | |
| | | | |
GLP Capital LP | | | 4.88 | | | | 11-1-2020 | | | | 11,929,000 | | | | 12,107,935 | |
| | | | |
MGM Resorts International | | | 5.25 | | | | 3-31-2020 | | | | 9,365,000 | | | | 9,531,229 | |
| | | | |
NCL Corporation Limited 144A | | | 4.75 | | | | 12-15-2021 | | | | 6,382,000 | | | | 6,491,579 | |
| |
| | | | 28,130,743 | |
| | | | | | | | | | | | | | | | |
| | | | |
| Household Durables: 2.59% | | | | | | | | | | | | | | | | |
| | | | |
KB Home | | | 4.75 | | | | 5-15-2019 | | | | 7,835,000 | | | | 7,835,784 | |
| | | | |
Lennar Corporation | | | 4.50 | | | | 6-15-2019 | | | | 3,400,000 | | | | 3,408,500 | |
| | | | |
Lennar Corporation | | | 6.63 | | | | 5-1-2020 | | | | 2,485,000 | | | | 2,562,656 | |
| | | | |
Pulte Group Incorporated | | | 4.25 | | | | 3-1-2021 | | | | 11,145,000 | | | | 11,228,588 | |
| |
| | | | 25,035,528 | |
| | | | | | | | | | | | | | | | |
The accompanying notes are an integral part of these financial statements.
| | | | |
| 10 | | Wells Fargo Short-Term High Yield Bond Fund | | Portfolio of investments—February 28, 2019 (unaudited) |
| | | | | | | | | | | | | | | | |
| Security name | | Interest rate | | | Maturity date | | | Principal | | | Value | |
| | | | |
| Specialty Retail: 3.13% | | | | | | | | | | | | | | | | |
| | | | |
Gap Incorporated | | | 5.95 | % | | | 4-12-2021 | | | $ | 8,965,000 | | | $ | 9,317,722 | |
| | | | |
Group 1 Automotive Incorporated | | | 5.00 | | | | 6-1-2022 | | | | 7,855,000 | | | | 7,894,275 | |
| | | | |
Penske Auto Group Incorporated | | | 3.75 | | | | 8-15-2020 | | | | 1,905,000 | | | | 1,892,846 | |
| | | | |
Penske Auto Group Incorporated | | | 5.75 | | | | 10-1-2022 | | | | 10,920,000 | | | | 11,083,800 | |
| | | | |
| | | | | | | | | | | | | | | 30,188,643 | |
| | | | | | | | | | | | | | | | |
| | | | |
| Textiles, Apparel & Luxury Goods: 1.04% | | | | | | | | | | | | | | | | |
| | | | |
The William Carter Company | | | 5.25 | | | | 8-15-2021 | | | | 9,890,000 | | | | 10,025,988 | |
| | | | | | | | | | | | | | | | |
| | | | |
Consumer Staples: 2.52% | | | | | | | | | | | | | | | | |
| | | | |
| Food Products: 1.46% | | | | | | | | | | | | | | | | |
| | | | |
B&G Foods Incorporated | | | 4.63 | | | | 6-1-2021 | | | | 14,070,000 | | | | 14,052,413 | |
| | | | | | | | | | | | | | | | |
| | | | |
| Personal Products: 1.06% | | | | | | | | | | | | | | | | |
| | | | |
Edgewell Personal Care Company | | | 4.70 | | | | 5-19-2021 | | | | 10,124,000 | | | | 10,250,550 | |
| | | | | | | | | | | | | | | | |
| | | | |
Energy: 3.95% | | | | | | | | | | | | | | | | |
| | | | |
| Oil, Gas & Consumable Fuels: 3.95% | | | | | | | | | | | | | | | | |
| | | | |
DCP Midstream Operating LP | | | 2.70 | | | | 4-1-2019 | | | | 9,700,000 | | | | 9,688,360 | |
| | | | |
DCP Midstream Operating LP 144A | | | 5.35 | | | | 3-15-2020 | | | | 5,668,000 | | | | 5,767,190 | |
| | | | |
Rockies Express Pipeline LLC 144A | | | 5.63 | | | | 4-15-2020 | | | | 3,390,000 | | | | 3,457,800 | |
| | | | |
Sabine Pass Liquefaction LLC | | | 5.63 | | | | 2-1-2021 | | | | 10,000,000 | | | | 10,341,564 | |
| | | | |
Southern Star Central Corporation 144A | | | 5.13 | | | | 7-15-2022 | | | | 8,995,000 | | | | 8,905,050 | |
| | | | |
| | | | | | | | | | | | | | | 38,159,964 | |
| | | | | | | | | | | | | | | | |
| | | | |
Financials: 5.84% | | | | | | | | | | | | | | | | |
| | | | |
| Consumer Finance: 4.84% | | | | | | | | | | | | | | | | |
| | | | |
Ally Financial Incorporated | | | 3.75 | | | | 11-18-2019 | | | | 16,660,000 | | | | 16,709,980 | |
| | | | |
Ford Motor Credit Company LLC | | | 3.34 | | | | 3-18-2021 | | | | 4,840,000 | | | | 4,749,685 | |
| | | | |
Ford Motor Credit Company LLC | | | 5.60 | | | | 1-7-2022 | | | | 4,840,000 | | | | 4,958,499 | |
| | | | |
Navient Corporation | | | 5.00 | | | | 10-26-2020 | | | | 4,950,000 | | | | 4,993,313 | |
| | | | |
Navient Corporation | | | 8.00 | | | | 3-25-2020 | | | | 5,000,000 | | | | 5,221,650 | |
| | | | |
Springleaf Finance Corporation | | | 5.25 | | | | 12-15-2019 | | | | 9,980,000 | | | | 10,129,700 | |
| | | | |
| | | | | | | | | | | | | | | 46,762,827 | |
| | | | | | | | | | | | | | | | |
| | | | |
| Real Estate Management & Development: 1.00% | | | | | | | | | | | | | | | | |
| | | | |
Realogy Group LLC «144A | | | 5.25 | | | | 12-1-2021 | | | | 9,645,000 | | | | 9,620,888 | |
| | | | | | | | | | | | | | | | |
| | | | |
Health Care: 6.46% | | | | | | | | | | | | | | | | |
| | | | |
| Health Care Equipment & Supplies: 0.85% | | | | | | | | | | | | | | | | |
| | | | |
Kinetics Concepts Incorporated 144A | | | 7.88 | | | | 2-15-2021 | | | | 8,042,000 | | | | 8,212,893 | |
| | | | | | | | | | | | | | | | |
| | | | |
| Health Care Providers & Services: 5.61% | | | | | | | | | | | | | | | | |
| | | | |
Acadia Healthcare Company Incorporated | | | 5.13 | | | | 7-1-2022 | | | | 7,232,000 | | | | 7,123,520 | |
| | | | |
Acadia Healthcare Company Incorporated | | | 6.13 | | | | 3-15-2021 | | | | 1,618,000 | | | | 1,620,023 | |
| | | | |
Centene Corporation | | | 4.75 | | | | 5-15-2022 | | | | 10,555,000 | | | | 10,752,906 | |
| | | | |
DaVita HealthCare Partners Incorporated | | | 5.75 | | | | 8-15-2022 | | | | 7,755,000 | | | | 7,895,986 | |
| | | | |
HCA Incorporated | | | 6.50 | | | | 2-15-2020 | | | | 4,120,000 | | | | 4,243,209 | |
The accompanying notes are an integral part of these financial statements.
| | | | | | |
| Portfolio of investments—February 28, 2019 (unaudited) | | Wells Fargo Short-Term High Yield Bond Fund | | | 11 | |
| | | | | | | | | | | | | | | | |
| Security name | | Interest rate | | | Maturity date | | | Principal | | | Value | |
| | | | |
| Health Care Providers & Services(continued) | | | | | | | | | | | | | | | | |
| | | | |
MEDNAX Incorporated 144A | | | 5.25 | % | | | 12-1-2023 | | | $ | 4,985,000 | | | $ | 5,041,081 | |
| | | | |
Select Medical Corporation | | | 6.38 | | | | 6-1-2021 | | | | 5,345,000 | | | | 5,365,044 | |
| | | | |
Tenet Healthcare Corporation | | | 6.00 | | | | 10-1-2020 | | | | 8,550,000 | | | | 8,817,188 | |
| | | | |
Vizient Incorporated 144A | | | 10.38 | | | | 3-1-2024 | | | | 3,120,000 | | | | 3,377,400 | |
| | | | |
| | | | | | | | | | | | | | | 54,236,357 | |
| | | | | | | | | | | | | | | | |
| | | | |
Industrials: 4.14% | | | | | | | | | | | | | | | | |
| | | | |
| Aerospace & Defense: 2.30% | | | | | | | | | | | | | | | | |
| | | | |
Alcoa Incorporated | | | 6.15 | | | | 8-15-2020 | | | | 8,830,000 | | | | 9,116,975 | |
| | | | |
Moog Incorporated 144A | | | 5.25 | | | | 12-1-2022 | | | | 12,865,000 | | | | 13,068,653 | |
| | | | |
| | | | | | | | | | | | | | | 22,185,628 | |
| | | | | | | | | | | | | | | | |
| | | | |
| Commercial Services & Supplies: 1.16% | | | | | | | | | | | | | | | | |
| | | | |
Clean Harbors Incorporated | | | 5.13 | | | | 6-1-2021 | | | | 11,195,000 | | | | 11,195,000 | |
| | | | | | | | | | | | | | | | |
| | | | |
| Industrial Conglomerates: 0.53% | | | | | | | | | | | | | | | | |
| | | | |
General Electric Company | | | 5.55 | | | | 5-4-2020 | | | | 5,025,000 | | | | 5,139,703 | |
| | | | | | | | | | | | | | | | |
| | | | |
| Machinery: 0.15% | | | | | | | | | | | | | | | | |
| | | | |
CNH Industrial Capital LLC | | | 4.38 | | | | 11-6-2020 | | | | 1,425,000 | | | | 1,438,253 | |
| | | | | | | | | | | | | | | | |
| | | | |
Information Technology: 4.14% | | | | | | | | | | | | | | | | |
| | | | |
| Electronic Equipment, Instruments & Components: 1.25% | | | | | | | | | | | | | | | | |
| | | | |
Sanmina Corporation 144A | | | 4.38 | | | | 6-1-2019 | | | | 12,100,000 | | | | 12,100,000 | |
| | | | | | | | | | | | | | | | |
| | | | |
| Software: 0.49% | | | | | | | | | | | | | | | | |
| | | | |
Symantec Corporation | | | 4.20 | | | | 9-15-2020 | | | | 4,635,000 | | | | 4,685,892 | |
| | | | | | | | | | | | | | | | |
| | | | |
| Technology Hardware, Storage & Peripherals: 2.40% | | | | | | | | | | | | | | | | |
| | | | |
Dell International LLC 144A | | | 5.88 | | | | 6-15-2021 | | | | 2,170,000 | | | | 2,212,753 | |
| | | | |
EMC Corporation | | | 2.65 | | | | 6-1-2020 | | | | 11,850,000 | | | | 11,729,193 | |
| | | | |
NCR Corporation | | | 4.63 | | | | 2-15-2021 | | | | 9,333,000 | | | | 9,286,335 | |
| | | | |
| | | | | | | | | | | | | | | 23,228,281 | |
| | | | | | | | | | | | | | | | |
| | | | |
Materials: 5.16% | | | | | | | | | | | | | | | | |
| | | | |
| Chemicals: 1.35% | | | | | | | | | | | | | | | | |
| | | | |
Chemours Company | | | 6.63 | | | | 5-15-2023 | | | | 9,445,000 | | | | 9,799,660 | |
| | | | |
Huntsman International LLC | | | 4.88 | | | | 11-15-2020 | | | | 3,175,000 | | | | 3,256,359 | |
| | | | |
| | | | | | | | | | | | | | | 13,056,019 | |
| | | | | | | | | | | | | | | | |
| | | | |
| Containers & Packaging: 1.60% | | | | | | | | | | | | | | | | |
| | | | |
Ball Corporation | | | 4.38 | | | | 12-15-2020 | | | | 10,425,000 | | | | 10,633,500 | |
| | | | |
Reynolds Group Holdings | | | 5.75 | | | | 10-15-2020 | | | | 4,768,010 | | | | 4,777,546 | |
| | | | |
| | | | | | | | | | | | | | | 15,411,046 | |
| | | | | | | | | | | | | | | | |
| | | | |
| Metals & Mining: 2.21% | | | | | | | | | | | | | | | | |
| | | | |
Freeport-McMoRan Incorporated | | | 3.10 | | | | 3-15-2020 | | | | 1,840,000 | | | | 1,844,232 | |
| | | | |
Freeport-McMoRan Incorporated | | | 4.00 | | | | 11-14-2021 | | | | 6,530,000 | | | | 6,530,000 | |
| | | | |
Steel Dynamics Incorporated | | | 5.13 | | | | 10-1-2021 | | | | 12,883,000 | | | | 12,955,467 | |
| | | | |
| | | | | | | | | | | | | | | 21,329,699 | |
| | | | | | | | | | | | | | | | |
The accompanying notes are an integral part of these financial statements.
| | | | |
| 12 | | Wells Fargo Short-Term High Yield Bond Fund | | Portfolio of investments—February 28, 2019 (unaudited) |
| | | | | | | | | | | | | | | | |
| Security name | | Interest rate | | | Maturity date | | | Principal | | | Value | |
| | | | |
Real Estate: 4.01% | | | | | | | | | | | | | | | | |
| | | | |
| Equity REITs: 3.15% | | | | | | | | | | | | | | | | |
| | | | |
CoreCivic Incorporated | | | 4.13 | % | | | 4-1-2020 | | | $ | 2,545,000 | | | $ | 2,541,819 | |
| | | | |
Equinix Incorporated | | | 5.38 | | | | 1-1-2022 | | | | 12,030,000 | | | | 12,368,344 | |
| | | | |
Sabra Health Care LP | | | 5.50 | | | | 2-1-2021 | | | | 15,339,000 | | | | 15,559,498 | |
| | | | |
| | | | | | | | | | | | | | | 30,469,661 | |
| | | | | | | | | | | | | | | | |
| | | | |
| Real Estate Management & Development: 0.86% | | | | | | | | | | | | | | | | |
| | | | |
Taylor Morrison Communities Incorporated 144A | | | 5.25 | | | | 4-15-2021 | | | | 8,285,000 | | | | 8,295,356 | |
| | | | | | | | | | | | | | | | |
| | | | |
Utilities: 0.52% | | | | | | | | | | | | | | | | |
| | | | |
| Independent Power & Renewable Electricity Producers: 0.52% | | | | | | | | | | | | | | | | |
| | | | |
TerraForm Power Operating LLC 144A | | | 4.25 | | | | 1-31-2023 | | | | 5,035,000 | | | | 4,988,214 | |
| | | | | | | | | | | | | | | | |
| | | | |
Total Corporate Bonds and Notes (Cost $611,387,150) | | | | | | | | | | | | | | | 607,740,567 | |
| | | | | | | | | | | | | | | | |
| | | | |
Loans: 24.13% | | | | | | | | | | | | | | | | |
| | | | |
Communication Services: 2.48% | | | | | | | | | | | | | | | | |
| | | | |
| Diversified Telecommunication Services: 0.54% | | | | | | | | | | | | | | | | |
| | | | |
Level 3 Financing Incorporated (3 Month LIBOR +2.25%) ± | | | 4.73 | | | | 2-22-2024 | | | | 5,258,850 | | | | 5,234,449 | |
| | | | | | | | | | | | | | | | |
| | | | |
| Media: 1.39% | | | | | | | | | | | | | | | | |
| | | | |
CSC Holdings LLC (3 Month LIBOR +2.50%) ± | | | 4.99 | | | | 1-25-2026 | | | | 10,979,683 | | | | 10,911,060 | |
| | | | |
Neptune Finco Corporation (3 Month LIBOR +2.25%) ± | | | 4.74 | | | | 1-15-2026 | | | | 2,475,000 | | | | 2,441,588 | |
| | | | |
| | | | | | | | | | | | | | | 13,352,648 | |
| | | | | | | | | | | | | | | | |
| | | | |
| Wireless Telecommunication Services: 0.55% | | | | | | | | | | | | | | | | |
| | | | |
SBA Senior Finance II LLC (3 Month LIBOR +2.00%) ± | | | 4.50 | | | | 4-11-2025 | | | | 5,387,869 | | | | 5,332,751 | |
| | | | | | | | | | | | | | | | |
| | | | |
Consumer Discretionary: 2.06% | | | | | | | | | | | | | | | | |
| | | | |
| Auto Components: 0.77% | | | | | | | | | | | | | | | | |
| | | | |
Allison Transmission Incorporated (3 Month LIBOR +1.75%) ± | | | 3.75 | | | | 9-23-2022 | | | | 7,515,033 | | | | 7,499,401 | |
| | | | | | | | | | | | | | | | |
| | | | |
| Household Products: 1.05% | | | | | | | | | | | | | | | | |
| | | | |
Michaels Stores Incorporated 31 Month LIBOR +2.50%) ±‡ | | | 4.99 | | | | 1-30-2023 | | | | 5,377,321 | | | | 5,325,806 | |
| | | | |
The ServiceMaster Company LLC (3 Month LIBOR +2.50%) ± | | | 4.99 | | | | 11-8-2023 | | | | 4,828,273 | | | | 4,804,132 | |
| | | | |
| | | | | | | | | | | | | | | 10,129,938 | |
| | | | | | | | | | | | | | | | |
| | | | |
| Specialty Retail: 0.24% | | | | | | | | | | | | | | | | |
| | | | |
Sally Beauty Holdings Incorporated (3 Month LIBOR +2.25%) ± | | | 4.75 | | | | 7-5-2024 | | | | 2,335,438 | | | | 2,301,877 | |
| | | | | | | | | | | | | | | | |
| | | | |
Consumer Staples: 0.69% | | | | | | | | | | | | | | | | |
| | | | |
| Food Products: 0.69% | | | | | | | | | | | | | | | | |
| | | | |
Post Holdings Incorporated 3 Month LIBOR +2.00%) ± | | | 4.49 | | | | 5-24-2024 | | | | 6,651,665 | | | | 6,623,927 | |
| | | | | | | | | | | | | | | | |
| | | | |
Financials: 3.06% | | | | | | | | | | | | | | | | |
| | | | |
| Diversified Consumer Services: 0.71% | | | | | | | | | | | | | | | | |
| | | | |
TransUnion LLC (3 Month LIBOR +2.00%) ± | | | 4.49 | | | | 6-19-2025 | | | | 6,854,291 | | | | 6,811,451 | |
| | | | | | | | | | | | | | | | |
The accompanying notes are an integral part of these financial statements.
| | | | | | |
| Portfolio of investments—February 28, 2019 (unaudited) | | Wells Fargo Short-Term High Yield Bond Fund | | | 13 | |
| | | | | | | | | | | | | | | | |
| Security name | | Interest rate | | | Maturity date | | | Principal | | | Value | |
| | | | |
| Diversified Financial Services: 2.35% | | | | | | | | | | | | | | | | |
| | | | |
Delos Finance SARL (3 Month LIBOR +1.75%) ± | | | 4.55 | % | | | 10-6-2023 | | | $ | 9,865,000 | | | $ | 9,856,911 | |
| | | | |
LPL Holdings Incorporated (3 Month LIBOR +2.25%) ± | | | 4.73 | | | | 9-23-2024 | | | | 12,998,523 | | | | 12,884,786 | |
| | | | |
| | | | | | | | | | | | | | | 22,741,697 | |
| | | | | | | | | | | | | | | | |
| | | | |
Health Care: 1.58% | | | | | | | | | | | | | | | | |
| | | | |
| Health Care Providers & Services: 1.58% | | | | | | | | | | | | | | | | |
| | | | |
HCA Incorporated (3 Month LIBOR +1.75%) | | | 4.24 | | | | 3-18-2023 | | | | 10,032,035 | | | | 10,023,106 | |
| | | | |
Select Medical Corporation (3 Month LIBOR +2.50%) ±‡ | | | 4.99 | | | | 3-6-2025 | | | | 5,330,147 | | | | 5,283,509 | |
| | | | |
| | | | | | | | | | | | | | | 15,306,615 | |
| | | | | | | | | | | | | | | | |
| | | | |
Industrials: 8.54% | | | | | | | | | | | | | | | | |
| | | | |
| Airlines: 0.79% | | | | | | | | | | | | | | | | |
| | | | |
United Airlines Incorporated (3 Month LIBOR +1.75%) ± | | | 4.24 | | | | 4-1-2024 | | | | 7,791,225 | | | | 7,674,357 | |
| | | | | | | | | | | | | | | | |
| | | | |
| Commercial Services & Supplies: 4.18% | | | | | | | | | | | | | | | | |
| | | | |
Advanced Disposal Services Incorporated (3 Month LIBOR +2.25%) ± | | | 4.67 | | | | 11-10-2023 | | | | 12,005,937 | | | | 11,985,888 | |
| | | | |
Aramark Services Incorporated (3 Month LIBOR +1.75%) ± | | | 4.24 | | | | 3-28-2024 | | | | 5,082,497 | | | | 5,058,660 | |
| | | | |
Aramark Services Incorporated (3 Month LIBOR +1.75%) ± | | | 4.24 | | | | 3-11-2025 | | | | 5,931,734 | | | | 5,902,075 | |
| | | | |
KAR Auction Services Incorporated (3 Month LIBOR +2.25%) ±‡ | | | 5.06 | | | | 3-11-2021 | | | | 13,195,203 | | | | 13,195,203 | |
| | | | |
Sensata Technologies BV (3 Month LIBOR +1.75%) ± | | | 4.25 | | | | 10-14-2021 | | | | 4,187,303 | | | | 4,191,657 | |
| | | | |
| | | | | | | | | | | | | | | 40,333,483 | |
| | | | | | | | | | | | | | | | |
| | | | |
| Communications Equipment: 2.32% | | | | | | | | | | | | | | | | |
| | | | |
Charter Communications Operating LLC (3 Month LIBOR +2.00%) ± | | | 4.50 | | | | 4-30-2025 | | | | 17,926,369 | | | | 17,867,212 | |
| | | | |
Virgin Media Bristol LLC (3 Month LIBOR +2.50%) ± | | | 4.99 | | | | 1-15-2026 | | | | 4,615,000 | | | | 4,580,434 | |
| | | | |
| | | | | | | | | | | | | | | 22,447,646 | |
| | | | | | | | | | | | | | | | |
| | | | |
| Machinery: 1.25% | | | | | | | | | | | | | | | | |
| | | | |
Columbus McKinnon Corporation (3 Month LIBOR +2.50%) ±‡ | | | 5.30 | | | | 1-31-2024 | | | | 5,429,738 | | | | 5,402,590 | |
| | | | |
RBS Global Incorporated (3 Month LIBOR +2.00%) ± | | | 4.49 | | | | 8-21-2024 | | | | 6,706,250 | | | | 6,680,163 | |
| | | | |
| | | | | | | | | | | | | | | 12,082,753 | |
| | | | | | | | | | | | | | | | |
| | | | |
Information Technology: 1.97% | | | | | | | | | | | | | | | | |
| | | | |
| Communications Equipment: 0.19% | | | | | | | | | | | | | | | | |
| | | | |
CommScope Incorporated (3 Month LIBOR +2.00%) ± | | | 4.49 | | | | 12-29-2022 | | | | 1,805,217 | | | | 1,800,704 | |
| | | | | | | | | | | | | | | | |
| | | | |
| Electronic Equipment, Instruments & Components: 0.61% | | | | | | | | | | | | | | | | |
| | | | |
Dell Incorporated (3 Month LIBOR +2.00%) ± | | | 4.50 | | | | 9-7-2023 | | | | 2,640,831 | | | | 2,630,559 | |
| | | | |
Zebra Technologies Corporation (3 Month LIBOR +1.75%) ± | | | 4.26 | | | | 11-15-2021 | | | | 3,302,863 | | | | 3,302,863 | |
| | | | |
| | | | | | | | | | | | | | | 5,933,422 | |
| | | | | | | | | | | | | | | | |
| | | | |
| IT Services: 0.85% | | | | | | | | | | | | | | | | |
| | | | |
First Data Corporation (3 Month LIBOR +2.00%) ± | | | 4.49 | | | | 7-8-2022 | | | | 8,253,040 | | | | 8,242,063 | |
| | | | | | | | | | | | | | | | |
| | | | |
| Semiconductors & Semiconductor Equipment: 0.32% | | | | | | | | | | | | | | | | |
| | | | |
Micron Technology Incorporated (3 Month LIBOR +1.75%) ± | | | 4.25 | | | | 4-26-2022 | | | | 3,064,286 | | | | 3,054,082 | |
| | | | | | | | | | | | | | | | |
The accompanying notes are an integral part of these financial statements.
| | | | |
| 14 | | Wells Fargo Short-Term High Yield Bond Fund | | Portfolio of investments—February 28, 2019 (unaudited) |
| | | | | | | | | | | | | | | | |
| Security name | | Interest rate | | | Maturity date | | | Principal | | | Value | |
| | | | |
Materials: 3.22% | | | | | | | | | | | | | | | | |
| | | | |
| Chemicals: 2.22% | | | | | | | | | | | | | | | | |
| | | | |
Ashland LLC (3 Month LIBOR +1.75%) ± | | | 4.24 | % | | | 5-17-2024 | | | $ | 5,658,825 | | | $ | 5,637,604 | |
| | | | |
Ineos US Finance LLC (3 Month LIBOR +2.00%) ± | | | 4.49 | | | | 3-31-2024 | | | | 16,056,883 | | | | 15,836,101 | |
| | | | |
| | | | | | | | | | | | | | | 21,473,705 | |
| | | | | | | | | | | | | | | | |
| | | | |
| Containers & Packaging: 1.00% | | | | | | | | | | | | | | | | |
| | | | |
Berry Plastics Group Incorporated (3 Month LIBOR +1.75%) ± | | | 4.27 | | | | 2-8-2020 | | | | 9,650,545 | | | | 9,632,498 | |
| | | | | | | | | | | | | | | | |
| | | | |
Real Estate: 0.53% | | | | | | | | | | | | | | | | |
| | | | |
| Equity REITs: 0.53% | | | | | | | | | | | | | | | | |
| | | | |
MGM Growth Properties LLC (3 Month LIBOR +2.00%) ± | | | 4.49 | | | | 3-21-2025 | | | | 5,101,060 | | | | 5,070,096 | |
| | | | | | | | | | | | | | | | |
| | | | |
Total Loans (Cost $235,052,387) | | | | | | | | | | | | | | | 233,079,563 | |
| | | | | | | | | | | | | | | | |
| | | | |
Non-Agency Mortgage-Backed Securities: 0.00% | | | | | | | | | | | | | | | | |
| | | | |
Salomon Brothers Mortgage Securities VII Series 1994-5 Class B2 ±± | | | 4.89 | | | | 4-25-2024 | | | | 24,874 | | | | 22,616 | |
| | | | | | | | | | | | | | | | |
| | | | |
Total Non-Agency Mortgage-Backed Securities (Cost $24,634) | | | | | | | | | | | | | | | 22,616 | |
| | | | | | | | | | | | | | | | |
| | | | |
Yankee Corporate Bonds and Notes: 9.01% | | | | | | | | | | | | | | | | |
| | | | |
Communication Services: 1.33% | | | | | | | | | | | | | | | | |
| | | | |
| Media: 1.33% | | | | | | | | | | | | | | | | |
| | | | |
Nielsen Holding and Finance BV 144A | | | 5.50 | | | | 10-1-2021 | | | | 12,710,000 | | | | 12,821,213 | |
| | | | | | | | | | | | | | | | |
| | | | |
Consumer Discretionary: 1.32% | | | | | | | | | | | | | | | | |
| | | | |
| Auto Components: 1.32% | | | | | | | | | | | | | | | | |
| | | | |
IHO Verwaltungs GmbH 144A | | | 4.13 | | | | 9-15-2021 | | | | 12,890,000 | | | | 12,761,100 | |
| | | | | | | | | | | | | | | | |
| | | | |
Financials: 0.54% | | | | | | | | | | | | | | | | |
| | | | |
| Diversified Financial Services: 0.54% | | | | | | | | | | | | | | | | |
| | | | |
General Electric Capital International Funding Company | | | 2.34 | | | | 11-15-2020 | | | | 5,225,000 | | | | 5,136,708 | |
| | | | |
Virgin Media Finance plc | | | 5.25 | | | | 1-15-2021 | | | | 75,000 | | | | 76,568 | |
| | | | |
| | | | | | | | | | | | | | | 5,213,276 | |
| | | | | | | | | | | | | | | | |
| | | | |
Health Care: 2.69% | | | | | | | | | | | | | | | | |
| | | | |
| Pharmaceuticals: 2.69% | | | | | | | | | | | | | | | | |
| | | | |
Bausch Health Companies Incorporated 144A | | | 6.50 | | | | 3-15-2022 | | | | 11,695,000 | | | | 12,118,944 | |
| | | | |
Teva Pharmaceutical Finance BV | | | 2.20 | | | | 7-21-2021 | | | | 14,600,000 | | | | 13,871,991 | |
| | | | |
| | | | | | | | | | | | | | | 25,990,935 | |
| | | | | | | | | | | | | | | | |
| | | | |
Industrials: 0.56% | | | | | | | | | | | | | | | | |
| | | | |
| Airlines: 0.56% | | | | | | | | | | | | | | | | |
| | | | |
Air Canada Company 144A | | | 7.75 | | | | 4-15-2021 | | | | 5,000,000 | | | | 5,350,000 | |
| | | | | | | | | | | | | | | | |
| | | | |
Information Technology: 0.52% | | | | | | | | | | | | | | | | |
| | | | |
| Communications Equipment: 0.32% | | | | | | | | | | | | | | | | |
| | | | |
Nokia Corporation | | | 5.38 | | | | 5-15-2019 | | | | 3,094,000 | | | | 3,101,735 | |
| | | | | | | | | | | | | | | | |
The accompanying notes are an integral part of these financial statements.
| | | | | | |
| Portfolio of investments—February 28, 2019 (unaudited) | | Wells Fargo Short-Term High Yield Bond Fund | | | 15 | |
| | | | | | | | | | | | | | | | |
| Security name | | Interest rate | | | Maturity date | | | Principal | | | Value | |
| | | | |
| Semiconductors & Semiconductor Equipment: 0.20% | | | | | | | | | | | | | | | | |
| | | | |
NXP BV/NXP Funding LLC 144A | | | 4.13 | % | | | 6-15-2020 | | | $ | 1,900,000 | | | $ | 1,913,775 | |
| | | | | | | | | | | | | | | | |
| | | | |
Materials: 2.06% | | | | | | | | | | | | | | | | |
| | | | |
| Chemicals: 0.99% | | | | | | | | | | | | | | | | |
| | | | |
Park Aerospace Holdings Company 144A | | | 5.25 | | | | 8-15-2022 | | | | 9,305,000 | | | | 9,525,622 | |
| | | | | | | | | | | | | | | | |
| | | | |
| Metals & Mining: 1.07% | | | | | | | | | | | | | | | | |
| | | | |
ArcelorMittal SA | | | 5.50 | | | | 3-1-2021 | | | | 9,970,000 | | | | 10,358,802 | |
| | | | | | | | | | | | | | | | |
| | | | |
Total Yankee Corporate Bonds and Notes (Cost $87,096,335) | | | | | | | | | | | | | | | 87,036,458 | |
| | | | | | | | | | | | | | | | |
| | | | |
| | | Yield | | | | | | Shares | | | | |
| Investment Companies: 4.40% | | | | | | | | | | | | | | | | |
| | | | |
Securities Lending Cash Investments LLC (l)(r)(u) | | | 2.56 | | | | | | | | 2,978,816 | | | | 2,979,114 | |
| | | | |
Wells Fargo Government Money Market Fund Select Class (l)(u) | | | 2.34 | | | | | | | | 39,518,481 | | | | 39,518,481 | |
| |
Total Short-Term Investments (Cost $42,497,595) | | | | 42,497,595 | |
| | | | | | | | | | | | | | | | |
| | | | | | | | |
| Total investments in securities (Cost $976,058,101) | | | 100.46 | % | | | 970,376,799 | |
| | |
Other assets and liabilities, net | | | (0.46 | ) | | | (4,397,324 | ) |
| | | | | | | | |
| Total net assets | | | 100.00 | % | | $ | 965,979,475 | |
| | | | | | | | |
| 144A | The security may be resold in transactions exempt from registration, normally to qualified institutional buyers, pursuant to Rule 144A under the Securities Act of 1933. |
| « | All or a portion of this security is on loan. |
| ± | Variable rate investment. The rate shown is the rate in effect at period end. |
| ‡ | Security is valued using significant unobservable inputs. |
| ±± | The coupon of the security is adjusted based on the principal and interest payments received from the underlying pool of mortgages as well as the credit quality and the actual prepayment speed of the underlying mortgages. |
| (l) | The issuer of the security is an affiliated person of the Fund as defined in the Investment Company Act of 1940. |
| (r) | The investment is a non-registered investment company purchased with cash collateral received from securities on loan. |
| (u) | The rate represents the 7-day annualized yield at period end. |
Abbreviations:
| LIBOR | London Interbank Offered Rate |
| REIT | Real estate investment trust |
Investments in Affiliates
An affiliated investment is an investment in which the Fund owns at least 5% of the outstanding voting shares of the issuer or as a result of other relationships, such as the Fund and the issuer having the same investment manager. Transactions with issuers that were either affiliated persons of the Fund at the beginning of the period or the end of the period were as follows:
| | | | | | | | | | | | | | | | | | | | | | | | | | | | | | | | | | | | |
| | | Shares,
beginning of
period | | | Shares
purchased | | | Shares
sold | | | Shares,
end of
period | | | Net
realized
gains
(losses) | | | Net
change in
unrealized
gains
(losses) | | | Income
from
affiliated
securities | | | Value,
end
of period | | | % of
net
assets | |
Short-Term Investments | | | | | | | | | | | | | | | | | | | | | | | | | | | | | | | | | | | | |
Investment Companies | | | | | | | | | | | | | | | | | | | | | | | | | | | | | | | | | | | | |
Securities Lending Cash Investments LLC | | | 146,956 | | | | 11,398,711 | | | | 8,566,851 | | | | 2,978,816 | | | $ | 0 | | | $ | 0 | | | $ | 33,315 | | | $ | 2,979,114 | | | | | |
Wells Fargo Government Money Market Fund Select Class | | | 48,392,907 | | | | 239,327,224 | | | | 248,201,650 | | | | 39,518,481 | | | | 0 | | | | 0 | | | | 458,778 | | | | 39,518,481 | | | | | |
| | | | | | | | | | | | | | | | | | | | | | | | | | | | | | | | | | | | |
| | | | | | | | | |
| | | | | | | | | | | | | | | | | | $ | 0 | | | $ | 0 | | | $ | 492,093 | | | $ | 42,497,595 | | | | 4.40 | % |
| | | | | | | | | | | | | | | | | | | | | | | | | | | | | | | | | | | | |
The accompanying notes are an integral part of these financial statements.
| | | | |
| 16 | | Wells Fargo Short-Term High Yield Bond Fund | | Statement of assets and liabilities—February 28, 2019 (unaudited) |
| | | | |
| | | | |
| |
Assets | | | | |
Investments in unaffiliated securities (including $2,919,011 of securities loaned), at value (cost $933,560,506) | | $ | 927,879,204 | |
Investments in affiliated securities, at value (cost $42,497,595) | | | 42,497,595 | |
Receivable for investments sold | | | 7,245,204 | |
Receivable for Fund shares sold | | | 710,117 | |
Receivable for interest | | | 10,534,363 | |
Receivable for securities lending income | | | 682 | |
Prepaid expenses and other assets | | | 14,421 | |
| | | | |
Total assets | | | 988,881,586 | |
| | | | |
| |
Liabilities | | | | |
Payable for investments purchased | | | 16,483,409 | |
Payable upon receipt of securities loaned | | | 2,979,113 | |
Payable for Fund shares redeemed | | | 2,064,958 | |
Dividends payable | | | 726,714 | |
Management fee payable | | | 268,939 | |
Administration fees payable | | | 71,326 | |
Distribution fee payable | | | 37,769 | |
Trustees’ fees and expenses payable | | | 2,706 | |
Accrued expenses and other liabilities | | | 267,177 | |
| | | | |
Total liabilities | | | 22,902,111 | |
| | | | |
Total net assets | | $ | 965,979,475 | |
| | | | |
| |
NET ASSETS CONSIST OF | | | | |
Paid-in capital | | $ | 1,008,669,951 | |
Total distributable loss | | | (42,690,476 | ) |
| | | | |
Total net assets | | $ | 965,979,475 | |
| | | | |
| |
COMPUTATION OF NET ASSET VALUE AND OFFERING PRICE PER SHARE | | | | |
Net assets – Class A | | $ | 113,090,962 | |
Shares outstanding – Class A1 | | | 14,109,378 | |
Net asset value per share – Class A | | | $8.02 | |
Maximum offering price per share – Class A2 | | | $8.27 | |
Net assets – Class C | | $ | 65,178,757 | |
Shares outstanding – Class C1 | | | 8,129,308 | |
Net asset value per share – Class C | | | $8.02 | |
Net assets – Administrator Class | | $ | 89,530,269 | |
Shares outstanding – Administrator Class1 | | | 11,170,517 | |
Net asset value per share – Administrator Class | | | $8.01 | |
Net assets – Institutional Class | | $ | 698,179,487 | |
Shares outstanding – Institutional Class1 | | | 87,230,618 | |
Net asset value per share – Institutional Class | | | $8.00 | |
| 1 | The Fund has an unlimited number of authorized shares. |
| 2 | Maximum offering price is computed as 100/97 of net asset value. On investments of $50,000 or more, the offering price is reduced. |
The accompanying notes are an integral part of these financial statements.
| | | | | | |
| Statement of operations—six months ended February 28, 2019 (unaudited) | | Wells Fargo Short-Term High Yield Bond Fund | | | 17 | |
| | | | |
| | | | |
| |
Investment income | | | | |
Interest | | $ | 20,050,923 | |
Income from affiliated securities | | | 463,248 | |
| | | | |
Total investment income | | | 20,514,171 | |
| | | | |
| |
Expenses | | | | |
Management fee | | | 2,388,109 | |
Administration fees | | | | |
Class A | | | 93,390 | |
Class C | | | 55,311 | |
Administrator Class | | | 46,020 | |
Institutional Class | | | 281,318 | |
Shareholder servicing fees | | | | |
Class A | | | 145,922 | |
Class C | | | 86,423 | |
Administrator Class | | | 112,104 | |
Distribution fee | | | | |
Class C | | | 259,269 | |
Custody and accounting fees | | | 39,012 | |
Professional fees | | | 27,307 | |
Registration fees | | | 48,767 | |
Shareholder report expenses | | | 48,226 | |
Trustees’ fees and expenses | | | 10,728 | |
Other fees and expenses | | | 13,165 | |
| | | | |
Total expenses | | | 3,655,071 | |
Less: Fee waivers and/or expense reimbursements | | | (530,134 | ) |
| | | | |
Net expenses | | | 3,124,937 | |
| | | | |
Net investment income | | | 17,389,234 | |
| | | | |
| |
REALIZED AND UNREALIZED GAINS (LOSSES) ON INVESTMENTS | | | | |
Net realized losses on investments | | | (2,267,049 | ) |
Net change in unrealized gains (losses) on investments | | | 3,487,882 | |
| | | | |
Net realized and unrealized gains (losses) on investments | | | 1,220,833 | |
| | | | |
Net increase in net assets resulting from operations | | $ | 18,610,067 | |
| | | | |
The accompanying notes are an integral part of these financial statements.
| | | | |
| 18 | | Wells Fargo Short-Term High Yield Bond Fund | | Statement of changes in net assets |
| | | | | | | | | | | | | | | | |
| | | Six months ended
February 28, 2019
(unaudited) | | | Year ended
August 31, 20181 | |
| | | |
Operations | | | | | | | | | | | | |
Net investment income | | | | | | $ | 17,389,234 | | | | | | | $ | 39,073,468 | |
Net realized losses on investments | | | | | | | (2,267,049 | ) | | | | | | | (3,235,869 | ) |
Net change in unrealized gains (losses) on investments | | | | | | | 3,487,882 | | | | | | | | (9,350,210 | ) |
| | | | |
Net increase in net assets resulting from operations | | | | | | | 18,610,067 | | | | | | | | 26,487,389 | |
| | | | |
| | | | |
Distributions to shareholders from net investment income and net realized gains | | | | | | | | | | | | | | | | |
Class A | | | | | | | (1,960,679 | ) | | | | | | | (4,410,776 | ) |
Class C | | | | | | | (896,502 | ) | | | | | | | (2,041,138 | ) |
Administrator Class | | | | | | | (1,617,576 | ) | | | | | | | (3,531,933 | ) |
Institutional Class | | | | | | | (12,914,636 | ) | | | | | | | (29,089,633 | ) |
| | | | |
Total distributions to shareholders | | | | | | | (17,389,393 | ) | | | | | | | (39,073,480 | ) |
| | | | |
| | | | |
Capital share transactions | | | Shares | | | | | | | | Shares | | | | | |
Proceeds from shares sold | | | | | | | | | | | | | | | | |
Class A | | | 1,285,886 | | | | 10,234,431 | | | | 3,772,243 | | | | 30,248,401 | |
Class C | | | 361,323 | | | | 2,875,947 | | | | 821,295 | | | | 6,596,115 | |
Administrator Class | | | 1,560,821 | | | | 12,441,163 | | | | 4,344,267 | | | | 34,806,968 | |
Institutional Class | | | 19,712,046 | | | | 156,773,585 | | | | 40,175,145 | | | | 322,039,713 | |
| | | | |
| | | | |
| | | | | | | 182,325,126 | | | | | | | | 393,691,197 | |
| | | | |
Reinvestment of distributions | | | | | | | | | | | | | | | | |
Class A | | | 234,345 | | | | 1,864,563 | | | | 534,775 | | | | 4,287,383 | |
Class C | | | 108,361 | | | | 862,341 | | | | 250,383 | | | | 2,008,417 | |
Administrator Class | | | 194,262 | | | | 1,545,443 | | | | 424,158 | | | | 3,399,349 | |
Institutional Class | | | 1,276,663 | | | | 10,142,684 | | | | 2,938,060 | | | | 23,529,667 | |
| | | | |
| | | | |
| | | | | | | 14,415,031 | | | | | | | | 33,224,816 | |
| | | | |
Payment for shares redeemed | | | | | | | | | | | | | | | | |
Class A | | | (3,299,345 | ) | | | (26,225,756 | ) | | | (9,754,483 | ) | | | (78,216,370 | ) |
Class C | | | (1,989,727 | ) | | | (15,845,832 | ) | | | (5,207,987 | ) | | | (41,812,691 | ) |
Administrator Class | | | (3,427,902 | ) | | | (27,226,806 | ) | | | (8,542,255 | ) | | | (68,570,248 | ) |
Institutional Class | | | (29,538,101 | ) | | | (234,228,735 | ) | | | (72,766,723 | ) | | | (582,432,153 | ) |
| | | | |
| | | | |
| | | | | | | (303,527,129 | ) | | | | | | | (771,031,462 | ) |
| | | | |
Net decrease in net assets resulting from capital share transactions | | | | | | | (106,786,972 | ) | | | | | | | (344,115,449 | ) |
| | | | |
Total decrease in net assets | | | | | | | (105,566,298 | ) | | | | | | | (356,701,540 | ) |
| | | | |
| | | | |
Net assets | | | | | | | | | | | | | | | | |
Beginning of period | | | | | | | 1,071,545,773 | | | | | | | | 1,428,247,313 | |
| | | | |
End of period | | | | | | $ | 965,979,475 | | | | | | | $ | 1,071,545,773 | |
| | | | |
| 1 | Effective for all filings after November 4, 2018, the SEC prospectively eliminated the requirement to parenthetically disclose undistributed net investment income at the end of the period and permitted the aggregation of distributions, with the exception of tax basis returns of capital. Undistributed net investment income at August 31, 2018 was $7. The disaggregated distributions information for the year ended August 31, 2018 is included in Note 7,Distributions to Shareholders, in the notes to the financial statements. |
The accompanying notes are an integral part of these financial statements.
| | | | | | |
| Financial highlights | | Wells Fargo Short-Term High Yield Bond Fund | | | 19 | |
(For a share outstanding throughout each period)
| | | | | | | | | | | | | | | | | | | | | | | | |
| | | Six months ended
February 28, 2019
(unaudited) | | | Year ended August 31 | |
| CLASS A | | 2018 | | | 2017 | | | 2016 | | | 2015 | | | 2014 | |
Net asset value, beginning of period | | | $7.99 | | | | $8.07 | | | | $8.10 | | | | $8.07 | | | | $8.20 | | | | $8.21 | |
Net investment income | | | 0.13 | | | | 0.24 | | | | 0.23 | | | | 0.24 | | | | 0.25 | | | | 0.27 | |
Net realized and unrealized gains (losses) on investments | | | 0.03 | | | | (0.08 | ) | | | (0.03 | ) | | | 0.03 | | | | (0.13 | ) | | | 0.01 | |
| | | | | | | | | | | | | | | | | | | | | | | | |
Total from investment operations | | | 0.16 | | | | 0.16 | | | | 0.20 | | | | 0.27 | | | | 0.12 | | | | 0.28 | |
Distributions to shareholders from | | | | | | | | | | | | | | | | | | | | | | | | |
Net investment income | | | (0.13 | ) | | | (0.24 | ) | | | (0.23 | ) | | | (0.24 | ) | | | (0.25 | ) | | | (0.27 | ) |
Net realized gains | | | 0.00 | | | | 0.00 | | | | 0.00 | | | | 0.00 | | | | 0.00 | | | | (0.02 | ) |
| | | | | | | | | | | | | | | | | | | | | | | | |
Total distributions to shareholders | | | (0.13 | ) | | | (0.24 | ) | | | (0.23 | ) | | | (0.24 | ) | | | (0.25 | ) | | | (0.29 | ) |
Net asset value, end of period | | | $8.02 | | | | $7.99 | | | | $8.07 | | | | $8.10 | | | | $8.07 | | | | $8.20 | |
Total return1 | | | 2.03 | % | | | 2.00 | % | | | 2.51 | % | | | 3.37 | % | | | 1.46 | % | | | 3.40 | % |
Ratios to average net assets (annualized) | | | | | | | | | | | | | | | | | | | | | | | | |
Gross expenses | | | 0.93 | % | | | 0.93 | % | | | 0.92 | % | | | 0.92 | % | | | 0.92 | % | | | 0.91 | % |
Net expenses | | | 0.81 | % | | | 0.81 | % | | | 0.81 | % | | | 0.81 | % | | | 0.81 | % | | | 0.81 | % |
Net investment income | | | 3.30 | % | | | 2.96 | % | | | 2.88 | % | | | 2.95 | % | | | 3.11 | % | | | 3.27 | % |
Supplemental data | | | | | | | | | | | | | | | | | | | | | | | | |
Portfolio turnover rate | | | 20 | % | | | 34 | % | | | 35 | % | | | 32 | % | | | 40 | % | | | 28 | % |
Net assets, end of period (000s omitted) | | | $113,091 | | | | $127,024 | | | | $172,151 | | | | $296,817 | | | | $203,856 | | | | $276,436 | |
| 1 | Total return calculations do not include any sales charges. Returns for periods of less than one year are not annualized. |
The accompanying notes are an integral part of these financial statements.
| | | | |
| 20 | | Wells Fargo Short-Term High Yield Bond Fund | | Financial highlights |
(For a share outstanding throughout each period)
| | | | | | | | | | | | | | | | | | | | | | | | |
| | | Six months ended
February 28, 2019
(unaudited) | | | Year ended August 31 | |
| CLASS C | | 2018 | | | 2017 | | | 2016 | | | 2015 | | | 2014 | |
Net asset value, beginning of period | | | $8.00 | | | | $8.07 | | | | $8.10 | | | | $8.07 | | | | $8.20 | | | | $8.21 | |
Net investment income | | | 0.10 | | | | 0.18 | | | | 0.17 | | | | 0.18 | | | | 0.19 | | | | 0.21 | |
Net realized and unrealized gains (losses) on investments | | | 0.02 | | | | (0.07 | ) | | | (0.03 | ) | | | 0.03 | | | | (0.13 | ) | | | 0.01 | |
| | | | | | | | | | | | | | | | | | | | | | | | |
Total from investment operations | | | 0.12 | | | | 0.11 | | | | 0.14 | | | | 0.21 | | | | 0.06 | | | | 0.22 | |
Distributions to shareholders from | | | | | | | | | | | | | | | | | | | | | | | | |
Net investment income | | | (0.10 | ) | | | (0.18 | ) | | | (0.17 | ) | | | (0.18 | ) | | | (0.19 | ) | | | (0.21 | ) |
Net realized gains | | | 0.00 | | | | 0.00 | | | | 0.00 | | | | 0.00 | | | | 0.00 | | | | (0.02 | ) |
| | | | | | | | | | | | | | | | | | | | | | | | |
Total distributions to shareholders | | | (0.10 | ) | | | (0.18 | ) | | | (0.17 | ) | | | (0.18 | ) | | | (0.19 | ) | | | (0.23 | ) |
Net asset value, end of period | | | $8.02 | | | | $8.00 | | | | $8.07 | | | | $8.10 | | | | $8.07 | | | | $8.20 | |
Total return1 | | | 1.53 | % | | | 1.36 | % | | | 1.75 | % | | | 2.60 | % | | | 0.70 | % | | | 2.62 | % |
Ratios to average net assets (annualized) | | | | | | | | | | | | | | | | | | | | | | | | |
Gross expenses | | | 1.69 | % | | | 1.68 | % | | | 1.67 | % | | | 1.67 | % | | | 1.67 | % | | | 1.66 | % |
Net expenses | | | 1.56 | % | | | 1.56 | % | | | 1.56 | % | | | 1.56 | % | | | 1.56 | % | | | 1.56 | % |
Net investment income | | | 2.55 | % | | | 2.21 | % | | | 2.11 | % | | | 2.20 | % | | | 2.36 | % | | | 2.52 | % |
Supplemental data | | | | | | | | | | | | | | | | | | | | | | | | |
Portfolio turnover rate | | | 20 | % | | | 34 | % | | | 35 | % | | | 32 | % | | | 40 | % | | | 28 | % |
Net assets, end of period (000s omitted) | | | $65,179 | | | | $77,169 | | | | $111,268 | | | | $123,745 | | | | $123,521 | | | | $143,444 | |
| 1 | Total return calculations do not include any sales charges. Returns for periods of less than one year are not annualized. |
The accompanying notes are an integral part of these financial statements.
| | | | | | |
| Financial highlights | | Wells Fargo Short-Term High Yield Bond Fund | | | 21 | |
(For a share outstanding throughout each period)
| | | | | | | | | | | | | | | | | | | | | | | | |
| | | Six months ended
February 28, 2019
(unaudited) | | | Year ended August 31 | |
| ADMINISTRATOR CLASS | | 2018 | | | 2017 | | | 2016 | | | 2015 | | | 2014 | |
Net asset value, beginning of period | | | $7.99 | | | | $8.07 | | | | $8.10 | | | | $8.07 | | | | $8.20 | | | | $8.20 | |
Net investment income | | | 0.13 | | | | 0.25 | | | | 0.24 | | | | 0.25 | | | | 0.26 | | | | 0.28 | |
Net realized and unrealized gains (losses) on investments | | | 0.02 | | | | (0.08 | ) | | | (0.03 | ) | | | 0.03 | | | | (0.13 | ) | | | 0.02 | |
| | | | | | | | | | | | | | | | | | | | | | | | |
Total from investment operations | | | 0.15 | | | | 0.17 | | | | 0.21 | | | | 0.28 | | | | 0.13 | | | | 0.30 | |
Distributions to shareholders from | | | | | | | | | | | | | | | | | | | | | | | | |
Net investment income | | | (0.13 | ) | | | (0.25 | ) | | | (0.24 | ) | | | (0.25 | ) | | | (0.26 | ) | | | (0.28 | ) |
Net realized gains | | | 0.00 | | | | 0.00 | | | | 0.00 | | | | 0.00 | | | | 0.00 | | | | (0.02 | ) |
| | | | | | | | | | | | | | | | | | | | | | | | |
Total distributions to shareholders | | | (0.13 | ) | | | (0.25 | ) | | | (0.24 | ) | | | (0.25 | ) | | | (0.26 | ) | | | (0.30 | ) |
Net asset value, end of period | | | $8.01 | | | | $7.99 | | | | $8.07 | | | | $8.10 | | | | $8.07 | | | | $8.20 | |
Total return1 | | | 1.99 | % | | | 2.16 | % | | | 2.68 | % | | | 3.54 | % | | | 1.62 | % | | | 3.69 | % |
Ratios to average net assets (annualized) | | | | | | | | | | | | | | | | | | | | | | | | |
Gross expenses | | | 0.87 | % | | | 0.86 | % | | | 0.86 | % | | | 0.86 | % | | | 0.85 | % | | | 0.84 | % |
Net expenses | | | 0.65 | % | | | 0.65 | % | | | 0.65 | % | | | 0.65 | % | | | 0.65 | % | | | 0.65 | % |
Net investment income | | | 3.45 | % | | | 3.13 | % | | | 3.03 | % | | | 3.11 | % | | | 3.28 | % | | | 3.44 | % |
Supplemental data | | | | | | | | | | | | | | | | | | | | | | | | |
Portfolio turnover rate | | | 20 | % | | | 34 | % | | | 35 | % | | | 32 | % | | | 40 | % | | | 28 | % |
Net assets, end of period (000s omitted) | | | $89,530 | | | | $102,673 | | | | $134,070 | | | | $274,878 | | | | $328,934 | | | | $509,059 | |
| 1 | Returns for periods of less than one year are not annualized. |
The accompanying notes are an integral part of these financial statements.
| | | | |
| 22 | | Wells Fargo Short-Term High Yield Bond Fund | | Financial highlights |
(For a share outstanding throughout each period)
| | | | | | | | | | | | | | | | | | | | | | | | |
| | | Six months ended
February 28, 2019
(unaudited) | | | Year ended August 31 | |
| INSTITUTIONAL CLASS | | 2018 | | | 2017 | | | 2016 | | | 2015 | | | 2014 | |
Net asset value, beginning of period | | | $7.98 | | | | $8.06 | | | | $8.09 | | | | $8.06 | | | | $8.18 | | | | $8.19 | |
Net investment income | | | 0.14 | | | | 0.27 | | | | 0.25 | | | | 0.26 | | | | 0.28 | | | | 0.29 | |
Net realized and unrealized gains (losses) on investments | | | 0.02 | | | | (0.08 | ) | | | (0.02 | ) | | | 0.03 | | | | (0.13 | ) | | | 0.01 | |
| | | | | | | | | | | | | | | | | | | | | | | | |
Total from investment operations | | | 0.16 | | | | 0.19 | | | | 0.23 | | | | 0.29 | | | | 0.15 | | | | 0.30 | |
Distributions to shareholders from | | | | | | | | | | | | | | | | | | | | | | | | |
Net investment income | | | (0.14 | ) | | | (0.27 | ) | | | (0.26 | ) | | | (0.26 | ) | | | (0.27 | ) | | | (0.29 | ) |
Net realized gains | | | 0.00 | | | | 0.00 | | | | 0.00 | | | | 0.00 | | | | 0.00 | | | | (0.02 | ) |
| | | | | | | | | | | | | | | | | | | | | | | | |
Total distributions to shareholders | | | (0.14 | ) | | | (0.27 | ) | | | (0.26 | ) | | | (0.26 | ) | | | (0.27 | ) | | | (0.31 | ) |
Net asset value, end of period | | | $8.00 | | | | $7.98 | | | | $8.06 | | | | $8.09 | | | | $8.06 | | | | $8.18 | |
Total return1 | | | 2.06 | % | | | 2.31 | % | | | 2.83 | % | | | 3.69 | % | | | 1.90 | % | | | 3.72 | % |
Ratios to average net assets (annualized) | | | | | | | | | | | | | | | | | | | | | | | | |
Gross expenses | | | 0.60 | % | | | 0.59 | % | | | 0.59 | % | | | 0.59 | % | | | 0.59 | % | | | 0.58 | % |
Net expenses | | | 0.50 | % | | | 0.50 | % | | | 0.50 | % | | | 0.50 | % | | | 0.50 | % | | | 0.50 | % |
Net investment income | | | 3.61 | % | | | 3.27 | % | | | 3.16 | % | | | 3.26 | % | | | 3.40 | % | | | 3.58 | % |
Supplemental data | | | | | | | | | | | | | | | | | | | | | | | | |
Portfolio turnover rate | | | 20 | % | | | 34 | % | | | 35 | % | | | 32 | % | | | 40 | % | | | 28 | % |
Net assets, end of period (000s omitted) | | | $698,179 | | | | $764,680 | | | | $1,010,757 | | | | $735,285 | | | | $608,704 | | | | $540,824 | |
| 1 | Returns for periods of less than one year are not annualized. |
The accompanying notes are an integral part of these financial statements.
| | | | | | |
| Notes to financial statements (unaudited) | | Wells Fargo Short-Term High Yield Bond Fund | | | 23 | |
1. ORGANIZATION
Wells Fargo Funds Trust (the “Trust”), a Delaware statutory trust organized on March 10, 1999, is an open-end management investment company registered under the Investment Company Act of 1940, as amended (the “1940 Act”). As an investment company, the Trust follows the accounting and reporting guidance in Financial Accounting Standards Board (“FASB”) Accounting Standards Codification Topic 946, Financial Services – Investment Companies. These financial statements report on the Wells Fargo Short-Term High Yield Bond Fund (the “Fund”) which is a diversified series of the Trust.
2. SIGNIFICANT ACCOUNTING POLICIES
The following significant accounting policies, which are consistently followed in the preparation of the financial statements of the Fund, are in conformity with U.S. generally accepted accounting principles which require management to make estimates and assumptions that affect the reported amounts of assets and liabilities, disclosure of contingent assets and liabilities at the date of the financial statements, and the reported amounts of revenues and expenses during the reporting period. Actual results could differ from those estimates.
Securities valuation
All investments are valued each business day as of the close of regular trading on the New York Stock Exchange (generally 4 p.m. Eastern Time), although the Fund may deviate from this calculation time under unusual or unexpected circumstances.
Debt securities are valued at the evaluated bid price provided by an independent pricing service (e.g. taking into account various factors, including yields, maturities, or credit ratings) or, if a reliable price is not available, the quoted bid price from an independent broker-dealer.
Investments in registered open-end investment companies are valued at net asset value. Interests in non-registered investment companies that are redeemable at net asset value are fair valued normally at net asset value.
Investments which are not valued using any of the methods discussed above are valued at their fair value, as determined in good faith by the Board of Trustees of the Fund. The Board of Trustees has established a Valuation Committee comprised of the Trustees and has delegated to it the authority to take any actions regarding the valuation of portfolio securities that the Valuation Committee deems necessary or appropriate, including determining the fair value of portfolio securities, unless the determination has been delegated to the Wells Fargo Asset Management Pricing Committee at Wells Fargo Funds Management, LLC (“Funds Management”). The Board of Trustees retains the authority to make or ratify any valuation decisions or approve any changes to the Valuation Procedures as it deems appropriate. On a quarterly basis, the Board of Trustees receives reports on any valuation actions taken by the Valuation Committee or the Wells Fargo Asset Management Pricing Committee which may include items for ratification.
Securities lending
The Fund may lend its securities from time to time in order to earn additional income in the form of fees or interest on securities received as collateral or the investment of any cash received as collateral. The Fund continues to receive interest or dividends on the securities loaned. The Fund receives collateral in the form of cash or securities with a value at least equal to the value of the securities on loan. The value of the loaned securities is determined at the close of each business day and any additional required collateral is delivered to the Fund on the next business day. In a securities lending transaction, the net asset value of the Fund will be affected by an increase or decrease in the value of the securities loaned and by an increase or decrease in the value of the instrument in which collateral is invested. The amount of securities lending activity undertaken by the Fund fluctuates from time to time. In the event of default or bankruptcy by the borrower, the Fund may be prevented from recovering the loaned securities or gaining access to the collateral or may experience delays or costs in doing so. In addition, the investment of any cash collateral received may lose all or part of its value. The Fund has the right under the lending agreement to recover the securities from the borrower on demand.
The Fund lends its securities through an unaffiliated securities lending agent. Cash collateral received in connection with its securities lending transactions is invested in Securities Lending Cash Investments, LLC (the “Securities Lending Fund”). The Securities Lending Fund is exempt from registration under Section 3(c)(7) of the 1940 Act and is managed by Funds Management and is subadvised by Wells Capital Management Incorporated (“WellsCap”), an affiliate of Funds Management and an indirect wholly owned subsidiary of Wells Fargo & Company (“Wells Fargo”). Funds Management receives an advisory fee starting at 0.05% and declining to 0.01% as the average daily net assets of the Securities Lending Fund increase. All of the fees received by Funds Management are paid to WellsCap for its services as subadviser. The Securities Lending Fund seeks to provide a positive return compared to the daily Fed Funds Open Rate by investing in high-quality, U.S. dollar-denominated short-term money market instruments. Securities Lending Fund investments are
| | | | |
| 24 | | Wells Fargo Short-Term High Yield Bond Fund | | Notes to financial statements (unaudited) |
valued at the evaluated bid price provided by an independent pricing service. Income earned from investment in the Securities Lending Fund (net of fees and rebates), if any, is included in income from affiliated securities on the Statement of Operations.
Loans
The Fund may invest in direct debt instruments which are interests in amounts owed to lenders by corporate or other borrowers. The loans pay interest at rates which are periodically reset by reference to a base lending rate plus a spread. Investments in loans may be in the form of participations in loans or assignments of all or a portion of loans from third parties. When the Fund purchases participations, it generally has no rights to enforce compliance with terms of the loan agreement with the borrower. As a result, the Fund assumes the credit risk of both the borrower and the lender that is selling the participation. When the Fund purchases assignments from lenders, it acquires direct rights against the borrower on the loan and may enforce compliance by the borrower with the terms of the loan agreement. Loans may include fully funded term loans or unfunded loan commitments, which are contractual obligations for future funding.
Security transactions and income recognition
Securities transactions are recorded on a trade date basis. Realized gains or losses are recorded on the basis of identified cost.
Interest income is accrued daily and bond discounts are accreted and premiums are amortized daily. To the extent debt obligations are placed on non-accrual status, any related interest income may be reduced by writing off interest receivables when the collection of all or a portion of interest has been determined to be doubtful based on consistently applied procedures and the fair value has decreased. If the issuer subsequently resumes interest payments or when the collectability of interest is reasonably assured, the debt obligation is removed from non-accrual status.
Distributions to shareholders
Distributions to shareholders from net investment income are declared daily and paid monthly. Distributions from net realized gains, if any, are recorded on the ex-dividend date and paid at least annually. Such distributions are determined in accordance with income tax regulations and may differ from U.S. generally accepted accounting principles. Dividend sources are estimated at the time of declaration. The tax character of distributions is determined as of the Fund’s fiscal year end. Therefore, a portion of the Fund’s distributions made prior to the Fund’s fiscal year end may be categorized as a tax return of capital at year end.
Federal and other taxes
The Fund intends to continue to qualify as a regulated investment company by distributing substantially all of its investment company taxable income and any net realized capital gains (after reduction for capital loss carryforwards) sufficient to relieve it from all, or substantially all, federal income taxes. Accordingly, no provision for federal income taxes was required.
The Fund’s income and federal excise tax returns and all financial records supporting those returns for the prior three fiscal years are subject to examination by the federal and Delaware revenue authorities. Management has analyzed the Fund’s tax positions taken on federal, state, and foreign tax returns for all open tax years and does not believe that there are any uncertain tax positions that require recognition of a tax liability.
As of February 28, 2019, the aggregate cost of all investments for federal income tax purposes was $976,061,406 and the unrealized gains (losses) consisted of:
| | | | |
| |
Gross unrealized gains | | $ | 1,615,775 | |
| |
Gross unrealized losses | | | (7,300,382 | ) |
| |
Net unrealized losses | | $ | (5,684,607 | ) |
As of August 31, 2018, the Fund had capital loss carryforwards which consisted of $11,356,983 in short-term capital losses and $23,380,190 in long-term capital losses.
Class allocations
The separate classes of shares offered by the Fund differ principally in applicable sales charges, distribution, shareholder servicing, and administration fees. Class specific expenses are charged directly to that share class. Investment income, common expenses, and realized and unrealized gains (losses) on investments are allocated daily to each class of shares based on the relative proportion of net assets of each class.
| | | | | | |
| Notes to financial statements (unaudited) | | Wells Fargo Short-Term High Yield Bond Fund | | | 25 | |
3. FAIR VALUATION MEASUREMENTS
Fair value measurements of investments are determined within a framework that has established a fair value hierarchy based upon the various data inputs utilized in determining the value of the Fund’s investments. The three-level hierarchy gives the highest priority to unadjusted quoted prices in active markets for identical assets or liabilities (Level 1) and the lowest priority to unobservable inputs (Level 3). The Fund’s investments are classified within the fair value hierarchy based on the lowest level of input that is significant to the fair value measurement. The inputs are summarized into three broad levels as follows:
| ∎ | | Level 1 – quoted prices in active markets for identical securities |
| ∎ | | Level 2 – other significant observable inputs (including quoted prices for similar securities, interest rates, prepayment speeds, credit risk, etc.) |
| ∎ | | Level 3 – significant unobservable inputs (including the Fund’s own assumptions in determining the fair value of investments) |
The inputs or methodologies used for valuing investments in securities are not necessarily an indication of the risk associated with investing in those securities.
The following is a summary of the inputs used in valuing the Fund’s assets and liabilities as of February 28, 2019:
| | | | | | | | | | | | | | | | |
| | | | |
| | | Quoted prices
(Level 1) | | | Other significant
observable inputs
(Level 2) | | | Significant
unobservable inputs (Level 3) | | | Total | |
| | | | |
Assets | | | | | | | | | | | | | | | | |
Investments in: | | | | | | | | | | | | | | | | |
| | | | |
Corporate bonds and notes | | $ | 0 | | | $ | 607,740,567 | | | $ | 0 | | | $ | 607,740,567 | |
| | | | |
Loans | | | 0 | | | | 203,872,455 | | | | 29,207,108 | | | | 233,079,563 | |
| | | | |
Non-agency mortgage-backed securities | | | 0 | | | | 22,616 | | | | 0 | | | | 22,616 | |
| | | | |
Yankee corporate bonds and notes | | | 0 | | | | 87,036,458 | | | | 0 | | | | 87,036,458 | |
| | | | |
Short-term investments | | | | | | | | | | | | | | | | |
| | | | |
Investment companies | | | 39,518,481 | | | | 2,979,114 | | | | 0 | | | | 42,497,595 | |
| | | | |
Total assets | | $ | 39,518,481 | | | $ | 901,651,210 | | | $ | 29,207,108 | | | $ | 970,376,799 | |
The following is a reconciliation of assets in which significant unobservable inputs (Level 3) were used in determining fair value:
| | | | |
| |
| | | Loans | |
Balance as of August 30, 2018 | | $ | 6,104,686 | |
| |
Accrued discounts (premiums) | | | (1,612 | ) |
| |
Realized gains (losses) | | | (2,051 | ) |
| |
Change in unrealized gains (losses) | | | (31,107 | ) |
| |
Purchases | | | 0 | |
| |
Sales | | | (667,326 | ) |
| |
Transfer into Level 3 | | | 23,804,518 | |
| |
Transfer out of Level 3 | | | 0 | |
| |
Balance as of February 28, 2019 | | $ | 29,207,108 | |
| |
Change in unrealized gains (losses) relating to securities still held at February 28, 2019 | | $ | (33,936 | ) |
The investment type categorized above was valued using indicative broker quotes. These indicative broker quotes are considered Level 3 inputs. Quantitative unobservable inputs used by the brokers are often proprietary and not provided to the Fund and therefore the disclosure that would address these inputs is not included above.
Additional sector, industry or geographic detail is included in the Portfolio of Investments.
| | | | |
| 26 | | Wells Fargo Short-Term High Yield Bond Fund | | Notes to financial statements (unaudited) |
4. TRANSACTIONS WITH AFFILIATES
Management fee
Funds Management, an indirect wholly owned subsidiary of Wells Fargo, is the manager of the Fund and provides advisory and fund-level administrative services under an investment management agreement. Under the investment management agreement, Funds Management is responsible for, among other services, implementing the investment objectives and strategies of the Fund, supervising the subadviser and providing fund-level administrative services in connection with the Fund’s operations. As compensation for its services under the investment management agreement, Funds Management is entitled to receive a management fee at the following annual rate based on the Fund’s average daily net assets:
| | | | |
| Average daily net assets | | Annual fee rate | |
| |
First $500 million | | | 0.500 | % |
| |
Next $500 million | | | 0.475 | |
| |
Next $2 billion | | | 0.450 | |
| |
Next $2 billion | | | 0.425 | |
| |
Next $5 billion | | | 0.390 | |
| |
Over $10 billion | | | 0.380 | |
For the six months ended February 28, 2019, the management fee was equivalent to an annual rate of 0.48% of the Fund’s average daily net assets.
Funds Management has retained the services of a subadviser to provide daily portfolio management to the Fund. The fee for subadvisory services is borne by Funds Management. WellsCap is the subadviser to the Fund and is entitled to receive a fee from Funds Management at an annual rate starting at 0.35% and declining to 0.20% as the average daily net assets of the Fund increase.
Administration fees
Under a class-level administration agreement, Funds Management provides class-level administrative services to the Fund, which includes paying fees and expenses for services provided by the transfer agent, sub-transfer agents, omnibus account servicers and record-keepers. As compensation for its services under the class-level administration agreement, Funds Management receives an annual fee which is calculated based on the average daily net assets of each class as follows:
| | | | |
| | | Class-level
administration fee | |
| |
Class A, Class C | | | 0.16 | % |
| |
Administrator Class | | | 0.10 | |
| |
Institutional Class | | | 0.08 | |
Funds Management has contractually waived and/or reimbursed management and administration fees to the extent necessary to maintain certain net operating expense ratios for the Fund. When each class of the Fund has exceeded its expense cap, Funds Management has waived fees and/or reimbursed expenses from fund level expenses on a proportionate basis and then from class specific expenses. When only certain classes exceed their expense caps, waivers and/or reimbursements are applied against class specific expenses before fund level expenses. Funds Management has committed through December 31, 2019 to waive fees and/or reimburse expenses to the extent necessary to cap the Fund’s expenses at 0.81% for Class A shares, 1.56% for Class C shares, 0.65% for Administrator Class shares, and 0.50% for Institutional Class shares. Prior to or after the commitment expiration date, the cap may be increased or the commitment to maintain the cap may be terminated only with the approval of the Board of Trustees.
Distribution fee
The Trust has adopted a distribution plan for Class C shares of the Fund pursuant to Rule 12b-1 under the 1940 Act. A distribution fee is charged to Class C shares and paid to Wells Fargo Funds Distributor, LLC (“Funds Distributor”), the principal underwriter, at an annual rate of 0.75% of the average daily net assets of Class C shares.
In addition, Funds Distributor is entitled to receive the front-end sales charge from the purchase of Class A shares and a contingent deferred sales charge on the redemption of certain Class A shares. Funds Distributor is also entitled to receive the contingent deferred sales charges from redemptions of Class C shares. For the six months ended February 28, 2019, Funds Distributor received $1,495 from the sale of Class A shares and $320 in contingent deferred sales charges from redemptions of Class C shares. No contingent deferred sales charges were incurred by Class A shares for the six months ended February 28, 2019.
| | | | | | |
| Notes to financial statements (unaudited) | | Wells Fargo Short-Term High Yield Bond Fund | | | 27 | |
Shareholder servicing fees
The Trust has entered into contracts with one or more shareholder servicing agents, whereby Class A and Class C and Administrator Class of the Fund are charged a fee at an annual rate of 0.25% of the average daily net assets of each respective class. A portion of these total shareholder servicing fees were paid to affiliates of Wells Fargo.
Interfund transactions
The Fund may purchase or sell portfolio investment securities to certain other Wells Fargo affiliates pursuant to Rule 17a-7 under the 1940 Act and under procedures adopted by the Board of Trustees. The procedures have been designed to ensure that these interfund transactions, which do not incur broker commissions, are effected at current market prices.
5. INVESTMENT PORTFOLIO TRANSACTIONS
Purchases and sales of investments, excluding U.S. government obligations (if any) and short-term securities, for the six months ended February 28, 2019 were $189,779,588 and $233,342,013, respectively.
6. BANK BORROWINGS
The Trust (excluding the money market funds), Wells Fargo Master Trust and Wells Fargo Variable Trust are parties to a $280,000,000 revolving credit agreement whereby the Fund is permitted to use bank borrowings for temporary or emergency purposes, such as to fund shareholder redemption requests. Interest under the credit agreement is charged to the Fund based on a borrowing rate equal to the higher of the Federal Funds rate in effect on that day plus 1.25% or the overnight LIBOR rate in effect on that day plus 1.25%. In addition, an annual commitment fee equal to 0.25% of the unused balance is allocated to each participating fund.
For the six months ended February 28, 2019, there were no borrowings by the Fund under the agreement.
7. DISTRIBUTIONS TO SHAREHOLDERS
Effective for all filings after November 4, 2018, the Securities and Exchange Commission eliminated the requirement to separately state the components of distributions to shareholders under U.S. generally accepted accounting principles. The amounts of distributions to shareholders for the year ended August 31, 2018 were as follows:
| | | | |
| | | Net investment
income | |
| |
Class A | | $ | 4,410,776 | |
| |
Class C | | | 2,041,138 | |
| |
Administrator Class | | | 3,531,933 | |
| |
Institutional Class | | | 29,089,633 | |
8. INDEMNIFICATION
Under the Trust’s organizational documents, the officers and Trustees have been granted certain indemnification rights against certain liabilities that may arise out of performance of their duties to the Trust. Additionally, in the normal course of business, the Trust may enter into contracts with service providers that contain a variety of indemnification clauses. The Trust’s maximum exposure under these arrangements is dependent on future claims that may be made against the Fund and, therefore, cannot be estimated.
9. NEW ACCOUNTING PRONOUNCEMENTS
In August 2018, FASB issued Accounting Standards Update (“ASU”) No. 2018-13, Fair Value Measurement (Topic 820)Disclosure Framework—Changes to the Disclosure Requirements for Fair Value Measurement. ASU 2018-13 updates the disclosure requirements for fair value measurements by modifying or removing certain disclosures and adding certain new disclosures. The amendments are effective for fiscal years, and interim periods within those fiscal years, beginning after December 15, 2019. Early adoption is permitted. Management has adopted the removal and modification of disclosures early, as permitted, and will adopt the additional new disclosures at the effective date.
In March 2017, FASB issued ASU No. 2017-08,Premium Amortization on Purchased Callable Debt Securities. ASU 2017-08 shortens the amortization period for certain callable debt securities held at a premium. The amendments require the premium to be amortized to the earliest call date. The amendments do not require an accounting change for securities held at a discount; the discount continues to be amortized to maturity. ASU 2017-08 is effective for fiscal years beginning after December 15, 2018 and for interim periods within those fiscal years. Management is currently evaluating the potential impact of this new guidance to the financial statements.
| | | | |
| 28 | | Wells Fargo Short-Term High Yield Bond Fund | | Other information (unaudited) |
PROXY VOTING INFORMATION
A description of the policies and procedures used to determine how to vote proxies relating to portfolio securities is available, upon request, by calling1-800-222-8222, visiting our website at wfam.com, or visiting the SEC website at sec.gov. Information regarding how the Fund voted proxies relating to portfolio securities during the most recent12-month period ended June 30 is available on the Fund’s website atwfam.comor by visiting the SEC website at sec.gov.
PORTFOLIO HOLDINGS INFORMATION
The complete portfolio holdings for the Fund are publicly available monthly on the Fund’s website (wfam.com), on a one-month delayed basis. In addition, top ten holdings information (excluding derivative positions) for the Fund is publicly available on the Fund’s website on a monthly, seven-day or more delayed basis. The Fund files its complete schedule of portfolio holdings with the SEC for the first and third quarters of each fiscal year on Form N-Q, which is available by visiting the SEC website at sec.gov. In addition, the Fund’s Form N-Q may be reviewed and copied at the SEC’s Public Reference Room in Washington, DC, and at regional offices in New York City, at 233 Broadway, and in Chicago, at 175 West Jackson Boulevard, Suite 900. Information about the Public Reference Room may be obtained by calling 1-800-SEC-0330.
| | | | | | |
| Other information (unaudited) | | Wells Fargo Short-Term High Yield Bond Fund | | | 29 | |
BOARD OF TRUSTEES AND OFFICERS
Each of the Trustees and Officers1 listed in the table below acts in identical capacities for each fund in the Wells Fargo family of funds, which consists of 152 mutual funds comprising the Wells Fargo Funds Trust, Wells Fargo Variable Trust, Wells Fargo Master Trust and four closed-end funds (collectively the “Fund Complex”). This table should be read in conjunction with the Prospectus and the Statement of Additional Information2. The mailing address of each Trustee and Officer is 525 Market Street, 12th Floor, San Francisco, CA 94105. Each Trustee and Officer serves an indefinite term, however, each Trustee serves such term until reaching the mandatory retirement age established by the Trustees.
Independent Trustees
| | | | | | |
Name and
year of birth | | Position held and
length of service* | | Principal occupations during past five years or longer | | Current other
public company or
investment company
directorships |
| | | |
William R. Ebsworth (Born 1957) | | Trustee, since 2015 | | Retired. From 1984 to 2013, equities analyst, portfolio manager, research director and chief investment officer at Fidelity Management and Research Company in Boston, Tokyo, and Hong Kong, and retired in 2013 as Chief Investment Officer of Fidelity Strategic Advisers, Inc. where he led a team of investment professionals managing client assets. Prior thereto, Board member of Hong Kong Securities Clearing Co., Hong Kong Options Clearing Corp., the Thailand International Fund, Ltd., Fidelity Investments Life Insurance Company, and Empire Fidelity Investments Life Insurance Company. Board member of the Vincent Memorial Hospital Endowment (non-profit organization), where he serves on the Investment Committee and as a Chair of the Audit Committee. Mr. Ebsworth is a CFA® charterholder. | | N/A |
| | | |
Jane A. Freeman (Born 1953) | | Trustee, since 2015; Chair Liaison, since 2018 | | Retired. From 2012 to 2014 and 1999 to 2008, Chief Financial Officer of Scientific Learning Corporation. From 2008 to 2012, Ms. Freeman provided consulting services related to strategic business projects. Prior to 1999, Portfolio Manager at Rockefeller & Co. and Scudder, Stevens & Clark. Board member of the Harding Loevner Funds from 1996 to 2014, serving as both Lead Independent Director and chair of the Audit Committee. Board member of the Russell Exchange Traded Funds Trust from 2011 to 2012 and the chair of the Audit Committee. Ms. Freeman is a Board Member of The Ruth Bancroft Garden (non-profit organization). She is also an inactive Chartered Financial Analyst. | | N/A |
| | | |
Isaiah Harris, Jr.3 (Born 1952) | | Trustee, since 2009; Audit Committee Chairman, since 2019 | | Retired. Chairman of the Board of CIGNA Corporation since 2009, and Director since 2005. From 2003 to 2011, Director of Deluxe Corporation. Prior thereto, President and CEO of BellSouth Advertising and Publishing Corp. from 2005 to 2007, President and CEO of BellSouth Enterprises from 2004 to 2005 and President of BellSouth Consumer Services from 2000 to 2003. Emeritus member of the Iowa State University Foundation Board of Governors. Emeritus Member of the Advisory Board of Iowa State University School of Business. Advisory Board Member, Palm Harbor Academy (private school). Advisory Board Member, Child Evangelism Fellowship (non-profit). Mr. Harris is a certified public accountant (inactive status). | | CIGNA Corporation |
| | | |
Judith M. Johnson3 (Born 1949) | | Trustee, since 2008; Audit Committee Chairman, from 2009 to 2018 | | Retired. Prior thereto, Chief Executive Officer and Chief Investment Officer of Minneapolis Employees Retirement Fund from 1996 to 2008. Ms. Johnson is an attorney, certified public accountant and a certified managerial accountant. | | N/A |
| | | |
David F. Larcker (Born 1950) | | Trustee, since 2009 | | James Irvin Miller Professor of Accounting at the Graduate School of Business, Stanford University, Director of the Corporate Governance Research Initiative and Senior Faculty of The Rock Center for Corporate Governance since 2006. From 2005 to 2008, Professor of Accounting at the Graduate School of Business, Stanford University. Prior thereto, Ernst & Young Professor of Accounting at The Wharton School, University of Pennsylvania from 1985 to 2005. | | N/A |
| | | | |
| 30 | | Wells Fargo Short-Term High Yield Bond Fund | | Other information (unaudited) |
| | | | | | |
Name and
year of birth | | Position held and
length of service* | | Principal occupations during past five years or longer | | Current other
public company or
investment company
directorships |
| | | |
Olivia S. Mitchell (Born 1953) | | Trustee, since 2006; Nominating and Governance Committee Chairman, since 2018 | | International Foundation of Employee Benefit Plans Professor, Wharton School of the University of Pennsylvania since 1993. Director of Wharton’s Pension Research Council and Boettner Center on Pensions & Retirement Research, and Research Associate at the National Bureau of Economic Research. Previously, Cornell University Professor from 1978 to 1993. | | N/A |
| | | |
Timothy J. Penny (Born 1951) | | Trustee, since 1996; Chairman, since 2018 | | President and Chief Executive Officer of Southern Minnesota Initiative Foundation, a non-profit organization, since 2007. Member of the Board of Trustees of NorthStar Education Finance, Inc., a non-profit organization, since 2007. | | N/A |
| | | |
James G. Polisson (Born 1959) | | Trustee, since 2018 | | Retired. Chief Marketing Officer, Source (ETF) UK Services, Ltd, from 2015 to 2017. From 2012 to 2015, Principal of The Polisson Group, LLC, a management consulting, corporate advisory and principal investing company. Chief Executive Officer and Managing Director at Russell Investments, Global Exchange Traded Funds from 2010 to 2012. Managing Director of Barclays Global Investors from 1998 to 2010 and Global Chief Marketing Officer for iShares and Barclays Global Investors from 2000 to 2010. Trustee of the San Francisco Mechanics’ Institute, a non-profit organization, from 2013 to 2015. Board member of the Russell Exchange Traded Fund Trust from 2011 to 2012. Director of Barclays Global Investors Holdings Deutschland GmbH from 2006 to 2009. Mr. Polisson is an attorney and has a retired status with the Massachusetts and District of Columbia Bar Associations. | | N/A |
| | | |
Pamela Wheelock (Born 1959) | | Trustee, since 2018 | | Chief Operating Officer, Twin Cities Habitat for Humanity, since January, 2017. Vice President of University Services, University of Minnesota from 2012 to 2017. Prior thereto, on the Board of Directors, Governance Committee and Finance Committee for the Minnesota Philanthropy Partners (Saint Paul Foundation) from 2012 to 2018, Interim President and Chief Executive Officer of Blue Cross Blue Shield of Minnesota from 2010 to 2011, Chairman of the Board from 2009 to 2011 and Board Director from 2003 to 2015. Vice President, Leadership and Community Engagement, Bush Foundation, Saint Paul, Minnesota (a private foundation) from 2009 to 2011. Executive Vice President and Chief Financial Officer, Minnesota Sports and Entertainment from 2004 to 2009 and Senior Vice President from 2002 to 2004. Commissioner of Finance, State of Minnesota, from 1999 to 2002. Currently the Board Chair of the Minnesota Wild Foundation since 2010. | | N/A |
| * | Length of service dates reflect the Trustee’s commencement of service with the Trust’s predecessor entities, where applicable. |
| | | | | | |
| Other information (unaudited) | | Wells Fargo Short-Term High Yield Bond Fund | | | 31 | |
Officers
| | | | | | |
Name and
year of birth | | Position held and
length of service | | Principal occupations during past five years or longer | | |
| | | |
Andrew Owen (Born 1960) | | President, since 2017 | | Executive Vice President of Wells Fargo & Company and Head of Affiliated Managers, Wells Fargo Asset Management, since 2014. In addition, Mr. Owen is currently President, Chief Executive Officer and Director of Wells Fargo Funds Management, LLC since 2017. Prior thereto, Executive Vice President responsible for marketing, investments and product development for Wells Fargo Funds Management, LLC, from 2009 to 2014. | | |
| | | |
Nancy Wiser1 (Born 1967) | | Treasurer, since 2012 | | Executive Vice President of Wells Fargo Funds Management, LLC since 2011. Chief Operating Officer and Chief Compliance Officer at LightBox Capital Management LLC, from 2008 to 2011. | | |
| | | |
Alexander Kymn (Born 1973) | | Secretary and Chief Legal Officer, since 2018 | | Senior Company Counsel of Wells Fargo Bank, N.A. since 2018 (previously Senior Counsel from 2007 to 2018). Vice President of Wells Fargo Funds Management, LLC from 2008 to 2014. | | |
| | | |
Michael H. Whitaker (Born 1967) | | Chief Compliance Officer, since 2016 | | Senior Vice President and Chief Compliance Officer since 2016. Senior Vice President and Chief Compliance Officer for Fidelity Investments from 2007 to 2016. | | |
| | | |
David Berardi (Born 1975) | | Assistant Treasurer, since 2009 | | Vice President of Wells Fargo Funds Management, LLC since 2009. Vice President of Evergreen Investment Management Company, LLC from 2008 to 2010. Manager of Fund Reporting and Control for Evergreen Investment Management Company, LLC from 2004 to 2010. | | |
| | | |
Jeremy DePalma1 (Born 1974) | | Assistant Treasurer, since 2009 | | Senior Vice President of Wells Fargo Funds Management, LLC since 2009. Senior Vice President of Evergreen Investment Management Company, LLC from 2008 to 2010 and head of the Fund Reporting and Control Team within Fund Administration from 2005 to 2010. | | |
| 1 | Nancy Wiser acts as Treasurer of 76 funds in the Fund Complex. Jeremy DePalma acts as Treasurer of 76 funds and Assistant Treasurer of 76 funds in the Fund Complex. |
| 2 | The Statement of Additional Information includes additional information about the Trustees and is available, without charge, upon request, by calling1-800-222-8222 or by visiting the website atwfam.com. |
| 3 | Mr. Harris became Chairman of the Audit Committee effective January 1, 2019. |
| | | | |
| 32 | | Wells Fargo Short-Term High Yield Bond Fund | | Appendix A (unaudited) |
SALES CHARGE REDUCTIONS AND WAIVERS FOR CERTAIN INTERMEDIARIES
Raymond James & Associates, Inc., Raymond James Financial Services & Raymond James affiliates (“Raymond James”)
Effective on or about March 1, 2019, shareholders purchasing Fund shares through a Raymond James platform or account will be eligible only for the following load waivers (front-end sales charge waivers and contingent deferred, or back-end, sales charge waivers) and discounts, which may differ from those disclosed elsewhere in the Fund’s Prospectus or SAI.
Front-end Sales Load Waivers on Class A shares Available at Raymond James
| | • | | Shares purchased in an investment advisory program. |
| | • | | Shares purchased through reinvestment of capital gains distributions and dividend reinvestment when purchasing shares of the same fund (but not any other fund within the fund family). |
| | • | | Employees and registered representatives of Raymond James or its affiliates and their family members as designated by Raymond James. |
| | • | | Shares purchased from the proceeds of redemptions within the same fund family, provided (1) the repurchase occurs within 90 days following the redemption, (2) the redemption and purchase occur in the same account, and (3) redeemed shares were subject to a front-end or deferred sales load (known as Rights of Reinstatement). |
| | • | | A shareholder in the fund’s Class C shares will have their shares automatically exchanged at net asset value to Class A shares (or the appropriate share class) of the fund if the shares are no longer subject to a CDSC and the exchange is in line with the policies and procedures of Raymond James. |
CDSC Waivers on Class A and C Shares Available at Raymond James
| | • | | Death or disability of the shareholder. |
| | • | | Shares sold as part of a systematic withdrawal plan as described in the Fund’s Prospectus. |
| | • | | Return of excess contributions from an IRA Account. |
| | • | | Shares sold as part of a required minimum distribution for IRA and retirement accounts due to the shareholder reaching age 70½ as described in the Fund’s prospectus. |
| | • | | Shares sold to pay Raymond James fees but only if the transaction is initiated by Raymond James. |
| | • | | Shares acquired through a right of reinstatement. |
Front-end Load Discounts Available at Raymond James: Breakpoints, and/or Rights of Accumulation
| | • | | Breakpoints as described in the Fund’s Prospectus. |
| | • | | Rights of accumulation which entitle shareholders to breakpoint discounts will be automatically calculated based on the aggregated holding of fund family assets held by accounts within the purchaser’s household at Raymond James. Eligible fund family assets not held at Raymond James may be included in the rights of accumulation calculation only if the shareholder notifies his or her financial advisor about such assets. |

For more information
More information about Wells Fargo Funds is available free upon request. To obtain literature, please write, visit the Fund’s website, or call:
Wells Fargo Funds
P.O. Box 219967
Kansas City, MO 64121-9967
Website: wfam.com
Individual investors: 1-800-222-8222
Retail investment professionals: 1-888-877-9275
Institutional investment professionals:1-866-765-0778
This report and the financial statements contained herein are submitted for the general information of the shareholders of the Fund. If this report is used for promotional purposes, distribution of the report must be accompanied or preceded by a current prospectus. Before investing, please consider the investment objectives, risks, charges, and expenses of the investment. For a current prospectus and, if available, a summary prospectus, containing this information, call1-800-222-8222 or visit the Fund’s website atwfam.com. Read the prospectus carefully before you invest or send money.
Wells Fargo Asset Management (WFAM) is the trade name for certain investment advisory/management firms owned by Wells Fargo & Company. These firms include but are not limited to Wells Capital Management Incorporated and Wells Fargo Funds Management, LLC. Certain products managed by WFAM entities are distributed by Wells Fargo Funds Distributor, LLC (a broker-dealer and Member FINRA).
This material is for general informational and educational purposes only and is NOT intended to provide investment advice or a recommendation of any kind—including a recommendation for any specific investment, strategy, or plan.
INVESTMENT PRODUCTS: NOT FDIC INSURED ◾ NO BANK GUARANTEE ◾ MAY LOSE VALUE
© 2019 Wells Fargo Funds Management, LLC. All rights reserved.
| | |
 | | 321630 04-19 SA222/SAR222 02-19 |
Semi-Annual Report
February 28, 2019

Wells Fargo Ultra Short-Term Income Fund

Beginning on January 1, 2021, as permitted by new regulations adopted by the Securities and Exchange Commission, paper copies of the Wells Fargo Funds’ annual and semi-annual shareholder reports issued after this date will no longer be sent by mail, unless you specifically request paper copies of the reports. Instead, the reports will be made available on the Funds’ website, and you will be notified by mail each time a report is posted and provided with a website address to access the report.
If you already elected to receive shareholder reports electronically, you will not be affected by this change and you need not take any action. You may elect to receive shareholder reports and other communications from the Fund electronically at any time by contacting your financial intermediary (such as a broker-dealer or bank) or, if you are a direct investor, by calling 1-800-222-8222 or by enrolling at wellsfargo.com/advantagedelivery.
You may elect to receive all future reports in paper free of charge. If you invest through a financial intermediary, you can contact your financial intermediary to request that you continue to receive paper copies of your shareholder reports; if you invest directly with the Fund, you can call 1-800-222-8222. Your election to receive reports in paper will apply to all Wells Fargo Funds held in your account with your financial intermediary or, if you are a direct investor, to all Wells Fargo Funds that you hold.

Reduce clutter. Save trees.
Sign up for electronic delivery of prospectuses and shareholder reports atwellsfargo.com/advantagedelivery
Contents
The views expressed and any forward-looking statements are as of February 28, 2019, unless otherwise noted, and are those of the Fund managers and/or Wells Fargo Funds Management, LLC. Discussions of individual securities, or the markets generally, or any Wells Fargo Fund are not intended as individual recommendations. Future events or results may vary significantly from those expressed in any forward-looking statements. The views expressed are subject to change at any time in response to changing circumstances in the market. Wells Fargo Funds Management, LLC and the Fund disclaim any obligation to publicly update or revise any views expressed or forward-looking statements.
INVESTMENT PRODUCTS: NOT FDIC INSURED ◾ NO BANK GUARANTEE ◾ MAY LOSE VALUE
| | | | |
| 2 | | Wells Fargo Ultra Short-Term Income Fund | | Letter to shareholders (unaudited) |

Andrew Owen
President
Wells Fargo Funds
Favorable third-quarter economic indicators and corporate earnings reports encouraged domestic stock investors.
Dear Shareholder:
We are pleased to offer you this semi-annual report for the Wells Fargo Ultra Short-Term Income Fund for the six-month period that ended February 28, 2019. Higher short-term interest rates, inflation concerns, trade tensions, slowing economic growth outside the U.S., and geopolitical events contributed to investment market volatility throughout the period.
For the period, U.S. stocks, as measured by the S&P 500 Index,1 fell 3.04% and international stocks, as measured by the MSCI ACWI ex USA Index (Net),2 declined 2.47%. Based on the MSCI EM Index (Net),3 emerging market stocks gained 0.33%. For bond investors, the Bloomberg Barclays U.S. Aggregate Bond Index4 added 1.99% while the Bloomberg Barclays Global Aggregate ex-USD Index5 gained 0.63%. The Bloomberg Barclays Municipal Bond Index6 added 2.34%, and the ICE BofAML U.S. High Yield Index7 advanced 1.98%.
Investors appeared to shake off lingering concerns during the third quarter.
Favorable third-quarter economic indicators and corporate earnings reports encouraged domestic stock investors. U.S. trade negotiations with Mexico and Canada progressed. The Conference Board Consumer Confidence Index®8 reached its highest level in 18 years during September 2018. The U.S. Federal Reserve (Fed) raised the federal funds rate by 25 basis points (bps; 100 bps equal 1.00%) to a target range of between 2.00% and 2.25% in September 2018. For the quarter that ended September 30, 2018, the S&P 500 Index added 7.71%.
Investors in international markets were not as confident. Tensions between the U.S. and China increased. The U.S. imposed $200 billion in tariffs on Chinese goods. China reacted with $60 billion in tariffs on U.S. goods. Economic growth in China caused concern. The Bank of England (BOE) raised its monetary policy rate to 0.75% in August. During the quarter, the MSCI ACWI ex USA Index (Net) gained 0.71%. The MSCI EM Index (Net) declined 1.09%. In fixed-income markets, U.S. bonds were flat, as measured by the Bloomberg Barclays U.S. Aggregate Bond Index. The Bloomberg Barclays Global Aggregate ex-USD Index fell 1.74%.
| 1 | The S&P 500 Index consists of 500 stocks chosen for market size, liquidity, and industry group representation. It is a market-value-weighted index with each stock’s weight in the index proportionate to its market value. You cannot invest directly in an index. |
| 2 | The Morgan Stanley Capital International (MSCI) All Country World Index (ACWI) ex USA Index (Net) is a free-float-adjusted market-capitalization-weighted index that is designed to measure the equity market performance of developed markets, excluding the United States and Canada. Source: MSCI. MSCI makes no express or implied warranties or representations and shall have no liability whatsoever with respect to any MSCI data contained herein. The MSCI data may not be further redistributed or used as a basis for other indices or any securities or financial products. This report is not approved, reviewed, or produced by MSCI. You cannot invest directly in an index. |
| 3 | The MSCI Emerging Markets (EM) Index (Net) is a free-float-adjusted market-capitalization-weighted index that is designed to measure large- and mid-cap equity market performance of emerging markets. The MSCI EM Index (Net) consists of the following 24 emerging market country indices: Brazil, Chile, China, Colombia, Czech Republic, Egypt, Greece, Hungary, India, Indonesia, Korea, Malaysia, Mexico, Pakistan, Peru, the Philippines, Poland, Qatar, Russia, South Africa, Taiwan, Thailand, Turkey, and the United Arab Emirates. You cannot invest directly in an index. |
| 4 | The Bloomberg Barclays U.S. Aggregate Bond Index is a broad-based benchmark that measures the investment-grade, U.S. dollar-denominated, fixed-rate taxable bond market, including Treasuries, government-related and corporate securities, mortgage-backed securities (agency fixed-rate and hybrid adjustable-rate mortgage pass-throughs), asset-backed securities, and commercial mortgage-backed securities. You cannot invest directly in an index. |
| 5 | The Bloomberg Barclays Global Aggregate ex-USD Index is an unmanaged index that provides a broad-based measure of the global investment-grade fixed-income markets excluding the U.S. dollar-denominated debt market. You cannot invest directly in an index. |
| 6 | The Bloomberg Barclays Municipal Bond Index is an unmanaged index composed of long-term tax-exempt bonds with a minimum credit rating of Baa. You cannot invest directly in an index. |
| 7 | The ICE BofAML U.S. High Yield Index is a market-capitalization-weighted index of domestic and Yankee high-yield bonds. The index tracks the performance of high-yield securities traded in the U.S. bond market. You cannot invest directly in an index. Copyright 2019. ICE Data Indices, LLC. All rights reserved. |
| 8 | The Conference Board Consumer Confidence Index® measures the degree of optimism on the state of the U.S. economy that consumers are expressing through their activities of savings and spending. You cannot invest directly in an index. |
| | | | | | |
| Letter to shareholders (unaudited) | | Wells Fargo Ultra Short-Term Income Fund | | | 3 | |
Conflicting data unsettled markets during the fourth quarter.
November’s U.S. midterm elections shifted control of the House of Representatives from Republicans to Democrats, presaging potential partisan clashes. Third-quarter U.S. gross domestic product (GDP) was announced at an annualized 3.4% rate, lower than the second-quarter rate. Brexit efforts stalled ahead of the March 2019 deadline. The People’s Bank of China cut reserve requirement ratios, accelerated infrastructure spending, and cut taxes even as the value of the yuan declined to low levels last seen in 2008.
December’s S&P 500 Index performance was the worst since 1931. Globally,fixed-income investments fared better than stocks during the last two months of the year. The Fed increased the federal funds rate by 25 bps in December 2018 to a target range of between 2.25% and 2.50% and softened its outlook for 2019 rate increases.
The market climbs a wall of worry.
Investors entered 2019 with reasons to be concerned. A partial U.S. government shutdown driven by partisan spending and immigration policy disputes extended into January. Investors expected high levels of stock market volatility to continue based on the VIX9.
January’s returns tended to support the investing adage that markets climb a wall of worry. The S&P 500 Index gained 8.01% for the month that ended January 31, 2019, its best monthly performance in 30 years. Returns for the MSCI ACWI ex USA Index (Net), the Bloomberg Barclays U.S. Aggregate Bond Index, and the Bloomberg Barclays Global Aggregate ex-USD Index also were positive.
In February, concerns over slowing global growth reemerged. The Bureau of Economic Analysis announced fourth-quarter 2018 GDP grew at an annualized 2.2% rate, down from the 4.2% annualized rate for the second quarter and the 3.4% annualized rate for the third quarter. Analysts attributed the lower growth rate to a slowing housing market and larger trade deficit. The U.S. Labor Department said that the economy created just 20,000 jobs in February. In a February report, the BOE forecast the slowest growth since the financial crisis for 2019. China and the U.S., while putting future tariffs on hold for the time being, continued to wrangle over trade issues.
Don’t let short-term uncertainty derail long-term investment goals.
Periods of investment uncertainty can present challenges, but experience has taught us that maintaining long-term investment goals can be an effective way to plan for the future. To help you create a sound strategy based on your personal goals and risk tolerance, Wells Fargo Funds offers more than 100 mutual funds spanning a wide range of asset classes and investment styles. Although diversification cannot guarantee an investment profit or prevent losses, we believe it can be an effective way to manage investment risk and potentially smooth out overall portfolio performance. We encourage investors to know their investments and to understand that appropriate levels of risk-taking may unlock opportunities.
January’s returns tended to support the investing adage that markets climb a wall of worry.
| 9 | The Chicago Board Options Exchange Market Volatility Index (VIX) is a popular measure of the implied volatility of S&P 500 Index options. It represents one measure of the market’s expectation of stock market volatility over the next 30-day period. You cannot invest directly in an index. |
| | | | |
| 4 | | Wells Fargo Ultra Short-Term Income Fund | | Letter to shareholders (unaudited) |
Thank you for choosing to invest with Wells Fargo Funds. We appreciate your confidence in us and remain committed to helping you meet your financial needs.
Sincerely,

Andrew Owen
President
Wells Fargo Funds
Notice to shareholders
At a meeting held February 20 - 21, 2019, the Board of Trustees of the Fund approved the following change to the Fund’s strategy:
“While we may purchase securities of any maturity or duration, under normal circumstances, we expect the Fund’s dollar-weighted average effective maturity to be 1.5 years or less and the Fund’s dollar-weighted average effective duration to be 1 year or less.”
This change was made effective immediately and is now included in the Fund’s prospectus.
For further information about your Fund, contact your investment professional, visit our website atwfam.com, or call us directly at1-800-222-8222.
This page is intentionally left blank.
| | | | |
| 6 | | Wells Fargo Ultra Short-Term Income Fund | | Performance highlights (unaudited) |
Investment objective
The Fund seeks current income consistent with capital preservation.
Manager
Wells Fargo Funds Management, LLC
Subadviser
Wells Capital Management Incorporated
Portfolio managers
Christopher Y. Kauffman, CFA®‡
Jay N. Mueller, CFA®‡
Noah M. Wise, CFA®‡
Average annual total returns (%) as of February 28, 2019
| | | | | | | | | | | | | | | | | | | | | | | | | | | | | | | | | | |
| | | | | Including sales charge | | | Excluding sales charge | | | Expense ratios1 (%) | |
| | | Inception date | | 1 year | | | 5 year | | | 10 year | | | 1 year | | | 5 year | | | 10 year | | | Gross | | | Net2 | |
| | | | | | | | | |
| Class A (SADAX) | | 8-31-1999 | | | 0.36 | | | | 0.62 | | | | 1.71 | | | | 2.41 | | | | 1.02 | | | | 1.92 | | | | 0.81 | | | | 0.71 | |
| | | | | | | | | |
| Class C (WUSTX) | | 7-18-2008 | | | 0.64 | | | | 0.25 | | | | 1.16 | | | | 1.64 | | | | 0.25 | | | | 1.16 | | | | 1.56 | | | | 1.46 | |
| | | | | | | | | |
| Administrator Class (WUSDX) | | 4-8-2005 | | | – | | | | – | | | | – | | | | 2.44 | | | | 1.15 | | | | 2.05 | | | | 0.75 | | | | 0.56 | |
| | | | | | | | | |
| Institutional Class (SADIX) | | 8-31-1999 | | | – | | | | – | | | | – | | | | 2.64 | | | | 1.35 | | | | 2.27 | | | | 0.48 | | | | 0.36 | |
| | | | | | | | | |
| Bloomberg Barclays Short-Term Government/Corporate Bond Index3 | | – | | | – | | | | – | | | | – | | | | 2.31 | | | | 0.93 | | | | 0.77 | | | | – | | | | – | |
Figures quoted represent past performance, which is no guarantee of future results, and do not reflect taxes that a shareholder may pay on fund distributions or the redemption of fund shares. Investment return and principal value of an investment will fluctuate so that an investor’s shares, when redeemed, may be worth more or less than their original cost. Performance shown without sales charges would be lower if sales charges were reflected. Current performance may be lower or higher than the performance data quoted, which assumes the reinvestment of dividends and capital gains. Currentmonth-end performance is available on the Fund’s website,wfam.com.
Index returns do not include transaction costs associated with buying and selling securities, any mutual fund fees or expenses, or any taxes. It is not possible to invest directly in an index.
For Class A shares, the maximumfront-end sales charge is 2.00%. For Class C shares, the maximum contingent deferred sales charge is 1.00%. Performance including a contingent deferred sales charge assumes the sales charge for the corresponding time period. Administrator Class and Institutional Class shares are sold without afront-end sales charge or contingent deferred sales charge.
Bond values fluctuate in response to the financial condition of individual issuers, general market and economic conditions, and changes in interest rates. Changes in market conditions and government policies may lead to periods of heightened volatility in the bond market and reduced liquidity for certain bonds held by the Fund. In general, when interest rates rise, bond values fall and investors may lose principal value. Interest rate changes and their impact on the Fund and its share price can be sudden and unpredictable. Loans are subject to risks similar to those associated with other below-investment-grade bond investments, such as credit risk (for example, risk of issuer default), below-investment-grade bond risk (for example, risk of greater volatility in value), and risk that the loan may become illiquid or difficult to price. The use of derivatives may reduce returns and/or increase volatility. Foreign investments are especially volatile and can rise or fall dramatically due to differences in the political and economic conditions of the host country. These risks are generally intensified in emerging markets. Certain investment strategies tend to increase the total risk of an investment (relative to the broader market). The Fund is exposed to high-yield securities risk and mortgage- and asset-backed securities risk. Consult the Fund’s prospectus for additional information on these and other risks.
Please see footnotes on page 7.
| | | | | | |
| Performance highlights (unaudited) | | Wells Fargo Ultra Short-Term Income Fund | | | 7 | |
| | | | |
| Ten largest holdings (%) as of February 28, 20194 | |
| |
SPDR Portfolio Short Term Corporate Bond ETF | | | 2.88 | |
| |
AT&T Incorporated, 5.00%,3-1-2021 | | | 0.98 | |
| |
Deutsche Telekom International Finance BV,2.23%, 1-17-2020 | | | 0.94 | |
| |
Volvo Financial Equipment LLC Series 2017-1A Class A3, 1.92%,3-15-2021 | | | 0.94 | |
| |
General Electric Capital International Funding Company, 2.34%,11-15-2020 | | | 0.93 | |
| |
Drive Auto Receivables Trust Series 2016 - CA Class C, 3.02%,11-15-2021 | | | 0.85 | |
| |
ANZ New Zealand International Limited, 2.60%,9-23-2019 | | | 0.77 | |
| |
Banco Santander Chile, 2.50%,12-15-2020 | | | 0.77 | |
| |
Connecticut Series A, 4.41%,4-1-2019 | | | 0.77 | |
| |
Corporacion Andina de Fomento, 2.00%,5-10-2019 | | | 0.76 | |
|
| Portfolio composition as of February 28, 20195 |
|
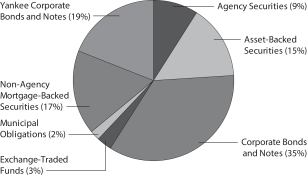
|
| ‡ | CFA® and Chartered Financial Analyst® are trademarks owned by CFA Institute. |
| 1 | Reflects the expense ratios as stated in the most recent prospectuses, which include the impact of 0.01% in acquired fund fees and expenses. The expense ratios shown are subject to change and may differ from the annualized expense ratios shown in the financial highlights of this report, which do not include acquired fund fees and expenses. |
| 2 | The manager has contractually committed through December 31, 2019 to waive fees and/or reimburse expenses to the extent necessary to cap the expenses of each class after fee waivers at 0.70% for Class A, 1.45% for Class C, 0.55% for Administrator Class, and 0.35% for Institutional Class. Brokerage commissions, stamp duty fees, interest, taxes, acquired fund fees and expenses (if any), and extraordinary expenses are excluded from the expense cap. Prior to or after the commitment expiration date, the cap may be increased or the commitment to maintain the cap may be terminated only with the approval of the Board of Trustees. Without this cap, the Fund’s returns would have been lower. The expense ratio paid by an investor is the net expense ratio (the total annual fund operating expenses after fee waivers) as stated in the prospectuses. |
| 3 | The Bloomberg Barclays Short-Term Government/Corporate Bond Index contains securities that have fallen out of the Bloomberg Barclays U.S. Government/Credit Bond Index because of the standard minimumone-year-to-maturity constraint. Securities in the Bloomberg Barclays Short-Term Government/Corporate Bond Index must have a maturity from 1 up to (but not including) 12 months. You cannot invest directly in an index. |
| 4 | The ten largest holdings, excluding cash, cash equivalents and any money market funds, are calculated based on the value of the investments divided by total net assets of the Fund. Holdings are subject to change and may have changed since the date specified. |
| 5 | Amounts are calculated based on the total long-term investments of the Fund. These amounts are subject to change and may have changed since the date specified. |
| | | | |
| 8 | | Wells Fargo Ultra Short-Term Income Fund | | Fund expenses (unaudited) |
As a shareholder of the Fund, you incur two types of costs: (1) transaction costs, including sales charges (loads) on purchase payments and contingent deferred sales charges (if any) on redemptions and (2) ongoing costs, including management fees, distribution(12b-1) and/or shareholder servicing fees, and other Fund expenses. This example is intended to help you understand your ongoing costs (in dollars) of investing in the Fund and to compare these costs with the ongoing costs of investing in other mutual funds.
The example is based on an investment of $1,000 invested at the beginning of thesix-month period and held for the entire period from September 1, 2018 to February 28, 2019.
Actual expenses
The “Actual” line of the table below provides information about actual account values and actual expenses. You may use the information in this line, together with the amount you invested, to estimate the expenses that you paid over the period. Simply divide your account value by $1,000 (for example, an $8,600 account value divided by $1,000 = 8.6), then multiply the result by the number in the “Actual” line under the heading entitled “Expenses paid during period” for your applicable class of shares to estimate the expenses you paid on your account during this period.
Hypothetical example for comparison purposes
The “Hypothetical” line of the table below provides information about hypothetical account values and hypothetical expenses based on the Fund’s actual expense ratio and an assumed rate of return of 5% per year before expenses, which is not the Fund’s actual return. The hypothetical account values and expenses may not be used to estimate the actual ending account balance or expenses you paid for the period. You may use this information to compare the ongoing costs of investing in the Fund and other funds. To do so, compare this 5% hypothetical example with the 5% hypothetical examples that appear in the shareholder reports of the other funds.
Please note that the expenses shown in the table are meant to highlight your ongoing costs only and do not reflect any transactional costs, such as sales charges (loads) and contingent deferred sales charges. Therefore, the “Hypothetical” line of the table is useful in comparing ongoing costs only and will not help you determine the relative total costs of owning different funds. In addition, if these transactional costs were included, your costs would have been higher.
| | | | | | | | | | | | | | | | |
| | | Beginning
account value
9-1-2018 | | | Ending
account value
2-28-2019 | | | Expenses
paid during
the period¹ | | | Annualized net
expense ratio | |
Class A | | | | | | | | | | | | | | | | |
| | | | |
Actual | | $ | 1,000.00 | | | $ | 1,014.59 | | | $ | 3.50 | | | | 0.70 | % |
| | | | |
Hypothetical (5% return before expenses) | | $ | 1,000.00 | | | $ | 1,021.32 | | | $ | 3.51 | | | | 0.70 | % |
Class C | | | | | | | | | | | | | | | | |
| | | | |
Actual | | $ | 1,000.00 | | | $ | 1,009.64 | | | $ | 7.23 | | | | 1.45 | % |
| | | | |
Hypothetical (5% return before expenses) | | $ | 1,000.00 | | | $ | 1,017.60 | | | $ | 7.25 | | | | 1.45 | % |
Administrator Class | | | | | | | | | | | | | | | | |
| | | | |
Actual | | $ | 1,000.00 | | | $ | 1,014.16 | | | $ | 2.75 | | | | 0.55 | % |
| | | | |
Hypothetical (5% return before expenses) | | $ | 1,000.00 | | | $ | 1,022.07 | | | $ | 2.76 | | | | 0.55 | % |
Institutional Class | | | | | | | | | | | | | | | | |
| | | | |
Actual | | $ | 1,000.00 | | | $ | 1,015.15 | | | $ | 1.75 | | | | 0.35 | % |
| | | | |
Hypothetical (5% return before expenses) | | $ | 1,000.00 | | | $ | 1,023.06 | | | $ | 1.76 | | | | 0.35 | % |
| 1 | Expenses paid is equal to the annualized net expense ratio of each class multiplied by the average account value over the period, multiplied by the number of days in the most recent fiscal half-year divided by the number of days in the fiscal year (to reflect theone-half-year period). |
| | | | | | |
| Portfolio of investments—February 28, 2019 (unaudited) | | Wells Fargo Ultra Short-Term Income Fund | | | 9 | |
| | | | | | | | | | | | | | | | |
| Security name | | Interest rate | | | Maturity date | | | Principal | | | Value | |
|
Agency Securities: 8.22% | |
| | | | |
FDIC Series2013-R1 Class A 144A | | | 1.15 | % | | | 3-25-2033 | | | $ | 889,080 | | | $ | 875,997 | |
| | | | |
FHLMC | | | 1.73 | | | | 7-25-2019 | | | | 3,296,966 | | | | 3,282,601 | |
| | | | |
FHLMC (1 Month LIBOR +0.50%) ± | | | 2.99 | | | | 9-15-2041 | | | | 1,748,669 | | | | 1,754,766 | |
| | | | |
FHLMC (1 Year Treasury Constant Maturity +2.25%) ± | | | 4.12 | | | | 4-1-2032 | | | | 85,421 | | | | 89,414 | |
| | | | |
FHLMC (1 Year Treasury Constant Maturity +2.19%) ± | | | 4.14 | | | | 5-1-2035 | | | | 307,224 | | | | 322,614 | |
| | | | |
FHLMC (1 Year Treasury Constant Maturity +2.33%) ± | | | 4.21 | | | | 1-1-2029 | | | | 35,413 | | | | 35,556 | |
| | | | |
FHLMC (1 Year Treasury Constant Maturity +2.25%) ± | | | 4.33 | | | | 6-1-2032 | | | | 1,588 | | | | 1,637 | |
| | | | |
FHLMC (1 Year Treasury Constant Maturity +2.40%) ± | | | 4.37 | | | | 7-1-2029 | | | | 2,209 | | | | 2,280 | |
| | | | |
FHLMC (1 Year Treasury Constant Maturity +2.23%) ± | | | 4.39 | | | | 3-1-2035 | | | | 699,398 | | | | 733,716 | |
| | | | |
FHLMC (1 Year Treasury Constant Maturity +2.25%) ± | | | 4.46 | | | | 11-1-2035 | | | | 2,177,811 | | | | 2,285,799 | |
| | | | |
FHLMC (1 Year Treasury Constant Maturity +2.25%) ± | | | 4.49 | | | | 10-1-2038 | | | | 783,046 | | | | 830,614 | |
| | | | |
FHLMC | | | 4.50 | | | | 2-1-2020 | | | | 124,739 | | | | 126,756 | |
| | | | |
FHLMC | | | 4.50 | | | | 8-1-2020 | | | | 79,996 | | | | 81,289 | |
| | | | |
FHLMC | | | 4.50 | | | | 1-1-2022 | | | | 78,058 | | | | 79,321 | |
| | | | |
FHLMC | | | 4.50 | | | | 6-1-2024 | | | | 1,039,000 | | | | 1,069,493 | |
| | | | |
FHLMC | | | 4.50 | | | | 9-1-2026 | | | | 1,636,155 | | | | 1,683,867 | |
| | | | |
FHLMC (1 Year Treasury Constant Maturity +2.25%) ± | | | 4.58 | | | | 9-1-2038 | | | | 1,324,601 | | | | 1,393,121 | |
| | | | |
FHLMC (1 Year Treasury Constant Maturity +2.25%) ± | | | 4.74 | | | | 4-1-2038 | | | | 728,413 | | | | 765,858 | |
| | | | |
FHLMC | | | 5.00 | | | | 12-1-2019 | | | | 173,990 | | | | 176,450 | |
| | | | |
FHLMC | | | 5.50 | | | | 12-1-2022 | | | | 459,317 | | | | 475,151 | |
| | | | |
FHLMC | | | 5.50 | | | | 12-1-2023 | | | | 478,305 | | | | 496,288 | |
| | | | |
FHLMC | | | 6.00 | | | | 10-1-2021 | | | | 521,970 | | | | 534,792 | |
| | | | |
FHLMC | | | 6.00 | | | | 10-1-2021 | | | | 566,517 | | | | 580,166 | |
| | | | |
FHLMC | | | 6.00 | | | | 1-1-2024 | | | | 441,870 | | | | 456,577 | |
| | | | |
FHLMC | | | 7.00 | | | | 6-1-2031 | | | | 246,597 | | | | 270,232 | |
| | | | |
FHLMC | | | 9.00 | | | | 10-1-2019 | | | | 2,106 | | | | 2,110 | |
| | | | |
FHLMC | | | 9.50 | | | | 9-1-2020 | | | | 10,390 | | | | 10,441 | |
| | | | |
FHLMC | | | 9.50 | | | | 12-1-2022 | | | | 7,193 | | | | 7,252 | |
| | | | |
FHLMC | | | 10.00 | | | | 11-17-2021 | | | | 3,451 | | | | 3,464 | |
| | | | |
FHLMC | | | 10.50 | | | | 5-1-2020 | | | | 12,507 | | | | 12,589 | |
| | | | |
FHLMC Series 2611 Class HD | | | 5.00 | | | | 5-15-2023 | | | | 537,355 | | | | 553,543 | |
| | | | |
FHLMC Series 2649 Class WL | | | 4.00 | | | | 7-15-2023 | | | | 1,053,967 | | | | 1,062,876 | |
| | | | |
FHLMC Series 2704 Class BH | | | 4.50 | | | | 11-15-2023 | | | | 377,177 | | | | 382,705 | |
| | | | |
FHLMC Series 2849 Class B | | | 5.00 | | | | 8-15-2019 | | | | 16,454 | | | | 16,468 | |
| | | | |
FHLMC Series 2855 Class WN | | | 4.00 | | | | 9-15-2019 | | | | 3,250 | | | | 3,251 | |
| | | | |
FHLMC Series 2881 Class AE | | | 5.00 | | | | 8-15-2034 | | | | 197,361 | | | | 201,381 | |
| | | | |
FHLMC Series 2896 Class CB | | | 4.50 | | | | 11-15-2019 | | | | 10,440 | | | | 10,484 | |
| | | | |
FHLMC Series 2953 Class LD | | | 5.00 | | | | 12-15-2034 | | | | 170,049 | | | | 171,181 | |
| | | | |
FHLMC Series 3166 Class AC | | | 5.00 | | | | 6-15-2021 | | | | 907,155 | | | | 909,592 | |
| | | | |
FHLMC Series 3266 Class D | | | 5.00 | | | | 1-15-2022 | | | | 537 | | | | 538 | |
| | | | |
FHLMC Series 3609 Class LA | | | 4.00 | | | | 12-15-2024 | | | | 16,328 | | | | 16,328 | |
| | | | |
FHLMC Series 3821 Class LA | | | 3.50 | | | | 4-15-2025 | | | | 133,179 | | | | 133,211 | |
| | | | |
FHLMC Series 3834 Class EA | | | 3.50 | | | | 6-15-2029 | | | | 240,023 | | | | 242,505 | |
| | | | |
FHLMC Series 3888 Class NA | | | 2.25 | | | | 1-15-2040 | | | | 1,630,987 | | | | 1,611,187 | |
| | | | |
FHLMC Series 3898 Class NE | | | 4.00 | | | | 7-15-2040 | | | | 145,859 | | | | 145,460 | |
| | | | |
FHLMC Series 4172 Class PB | | | 1.50 | | | | 7-15-2040 | | | | 346,383 | | | | 337,245 | |
| | | | |
FHLMC Series 4318 Class LC | | | 2.00 | | | | 6-15-2038 | | | | 411,000 | | | | 405,450 | |
| | | | |
FHLMC Series 4348 Class MH | | | 3.00 | | | | 6-15-2039 | | | | 2,230,464 | | | | 2,229,309 | |
| | | | |
FHLMC Series K005 Class A2 | | | 4.32 | | | | 11-25-2019 | | | | 500,000 | | | | 501,874 | |
| | | | |
FHLMC Series KF15 Class A (1 Month LIBOR +0.67%) ± | | | 3.18 | | | | 2-25-2023 | | | | 1,040,603 | | | | 1,041,736 | |
The accompanying notes are an integral part of these financial statements.
| | | | |
| 10 | | Wells Fargo Ultra Short-Term Income Fund | | Portfolio of investments—February 28, 2019 (unaudited) |
| | | | | | | | | | | | | | | | |
| Security name | | Interest rate | | | Maturity date | | | Principal | | | Value | |
|
Agency Securities(continued) | |
| | | | |
FHLMC Series KJ13 Class A1 | | | 2.06 | % | | | 9-25-2021 | | | $ | 1,388,863 | | | $ | 1,380,955 | |
| | | | |
FHLMC Series KP04 Class AG1 (1 Month LIBOR +0.22%) ± | | | 2.73 | | | | 7-25-2020 | | | | 4,515,000 | | | | 4,513,189 | |
| | | | |
FHLMC Series QO04 Class AFL (12 Month Treasury Average +0.74%) ± | | | 3.07 | | | | 5-25-2044 | | | | 3,532,331 | | | | 3,536,556 | |
| | | | |
FHLMC SeriesT-42 Class A6 | | | 9.50 | | | | 2-25-2042 | | | | 603,224 | | | | 723,131 | |
| | | | |
FNMA | | | 2.00 | | | | 4-1-2023 | | | | 3,210,440 | | | | 3,161,801 | |
| | | | |
FNMA (1 Year Treasury Constant Maturity +1.86%) ± | | | 3.86 | | | | 1-1-2023 | | | | 5,911 | | | | 5,904 | |
| | | | |
FNMA (6 Month LIBOR +1.39%) ± | | | 4.04 | | | | 10-1-2031 | | | | 118,717 | | | | 121,573 | |
| | | | |
FNMA (6 Month LIBOR +1.51%) ± | | | 4.11 | | | | 9-1-2037 | | | | 339,971 | | | | 351,285 | |
| | | | |
FNMA (1 Year Treasury Constant Maturity +2.22%) ± | | | 4.19 | | | | 6-1-2032 | | | | 95,853 | | | | 99,612 | |
| | | | |
FNMA (1 Year Treasury Constant Maturity +2.22%) ± | | | 4.25 | | | | 6-1-2034 | | | | 879,156 | | | | 926,831 | |
| | | | |
FNMA (1 Year Treasury Constant Maturity +2.27%) ± | | | 4.29 | | | | 2-1-2033 | | | | 360,294 | | | | 376,066 | |
| | | | |
FNMA (1 Year Treasury Constant Maturity +2.23%) ± | | | 4.38 | | | | 12-1-2040 | | | | 132,198 | | | | 138,557 | |
| | | | |
FNMA (1 Year Treasury Constant Maturity +2.19%) ± | | | 4.40 | | | | 2-1-2035 | | | | 949,645 | | | | 996,177 | |
| | | | |
FNMA (1 Year Treasury Constant Maturity +2.13%) ± | | | 4.40 | | | | 5-1-2032 | | | | 4,965 | | | | 5,112 | |
| | | | |
FNMA (1 Year Treasury Constant Maturity +2.02%) ± | | | 4.41 | | | | 12-1-2034 | | | | 378,485 | | | | 395,189 | |
| | | | |
FNMA (12 Month LIBOR +1.81%) ± | | | 4.44 | | | | 9-1-2040 | | | | 2,171,966 | | | | 2,272,799 | |
| | | | |
FNMA (1 Year Treasury Constant Maturity +2.19%) ± | | | 4.44 | | | | 4-1-2038 | | | | 1,906,782 | | | | 2,001,175 | |
| | | | |
FNMA (12 Month Treasury Average +2.25%) ± | | | 4.50 | | | | 8-1-2045 | | | | 620,186 | | | | 644,600 | |
| | | | |
FNMA | | | 4.50 | | | | 6-1-2019 | | | | 4,795 | | | | 4,872 | |
| | | | |
FNMA | | | 4.50 | | | | 1-1-2027 | | | | 1,884,366 | | | | 1,936,269 | |
| | | | |
FNMA (1 Year Treasury Constant Maturity +2.21%) ± | | | 4.50 | | | | 7-1-2038 | | | | 1,297,774 | | | | 1,364,009 | |
| | | | |
FNMA (1 Year Treasury Constant Maturity +2.26%) ± | | | 4.50 | | | | 8-1-2036 | | | | 1,981,196 | | | | 2,083,836 | |
| | | | |
FNMA (12 Month Treasury Average +2.29%) ± | | | 4.56 | | | | 5-1-2036 | | | | 794,764 | | | | 819,124 | |
| | | | |
FNMA (1 Year Treasury Constant Maturity +2.25%) ± | | | 4.58 | | | | 11-1-2033 | | | | 1,610,445 | | | | 1,693,063 | |
| | | | |
FNMA (1 Year Treasury Constant Maturity +2.19%) ± | | | 4.64 | | | | 11-1-2031 | | | | 59,662 | | | | 62,543 | |
| | | | |
FNMA (1 Year Treasury Constant Maturity +2.31%) ± | | | 4.66 | | | | 5-1-2036 | | | | 633,089 | | | | 666,424 | |
| | | | |
FNMA (1 Year Treasury Constant Maturity +2.28%) ± | | | 4.71 | | | | 11-1-2032 | | | | 467,570 | | | | 489,125 | |
| | | | |
FNMA (1 Year Treasury Constant Maturity +2.36%) ± | | | 4.72 | | | | 11-1-2034 | | | | 898,663 | | | | 949,665 | |
| | | | |
FNMA (1 Year Treasury Constant Maturity +2.26%) ± | | | 4.76 | | | | 11-1-2035 | | | | 153,596 | | | | 161,479 | |
| | | | |
FNMA (1 Year Treasury Constant Maturity +2.27%) ± | | | 4.98 | | | | 2-1-2036 | | | | 1,528,781 | | | | 1,605,825 | |
| | | | |
FNMA | | | 5.00 | | | | 5-1-2022 | | | | 352,431 | | | | 359,061 | |
| | | | |
FNMA | | | 5.00 | | | | 6-1-2024 | | | | 2,006,469 | | | | 2,055,656 | |
| | | | |
FNMA (6 Month LIBOR +2.86%) ± | | | 5.86 | | | | 4-1-2033 | | | | 778 | | | | 806 | |
| | | | |
FNMA | | | 6.00 | | | | 4-1-2021 | | | | 72,232 | | | | 73,401 | |
| | | | |
FNMA | | | 6.00 | | | | 1-1-2023 | | | | 1,121,200 | | | | 1,161,308 | |
| | | | |
FNMA | | | 6.50 | | | | 8-1-2031 | | | | 314,014 | | | | 355,371 | |
| | | | |
FNMA | | | 8.33 | | | | 7-15-2020 | | | | 1,695 | | | | 1,704 | |
| | | | |
FNMA | | | 9.00 | | | | 2-15-2020 | | | | 9,618 | | | | 9,773 | |
| | | | |
FNMA | | | 9.00 | | | | 10-15-2021 | | | | 5,692 | | | | 5,767 | |
| | | | |
FNMA | | | 9.00 | | | | 6-1-2024 | | | | 11,289 | | | | 11,366 | |
| | | | |
FNMA | | | 9.50 | | | | 12-1-2020 | | | | 9,237 | | | | 9,310 | |
| | | | |
FNMA | | | 10.50 | | | | 4-1-2022 | | | | 117 | | | | 118 | |
| | | | |
FNMA Series1989-30 Class Z | | | 9.50 | | | | 6-25-2019 | | | | 623 | | | | 624 | |
| | | | |
FNMA Series1990-111 Class Z | | | 8.75 | | | | 9-25-2020 | | | | 1,629 | | | | 1,675 | |
| | | | |
FNMA Series1990-119 Class J | | | 9.00 | | | | 10-25-2020 | | | | 10,882 | | | | 11,251 | |
| | | | |
FNMA Series1990-124 Class Z | | | 9.00 | | | | 10-25-2020 | | | | 4,188 | | | | 4,306 | |
| | | | |
FNMA Series1990-21 Class Z | | | 9.00 | | | | 3-25-2020 | | | | 16,090 | | | | 16,411 | |
| | | | |
FNMA Series1990-27 Class Z | | | 9.00 | | | | 3-25-2020 | | | | 7,521 | | | | 7,662 | |
| | | | |
FNMA Series1990-30 Class D | | | 9.75 | | | | 3-25-2020 | | | | 2,191 | | | | 2,246 | |
| | | | |
FNMA Series1990-77 Class D | | | 9.00 | | | | 6-25-2020 | | | | 6,965 | | | | 7,044 | |
The accompanying notes are an integral part of these financial statements.
| | | | | | |
| Portfolio of investments—February 28, 2019 (unaudited) | | Wells Fargo Ultra Short-Term Income Fund | | | 11 | |
| | | | | | | | | | | | | | | | |
| Security name | | Interest rate | | | Maturity date | | | Principal | | | Value | |
|
Agency Securities(continued) | |
| | | | |
FNMA Series1991-132 Class Z | | | 8.00 | % | | | 10-25-2021 | | | $ | 26,064 | | | $ | 27,235 | |
| | | | |
FNMA Series1992-71 Class X | | | 8.25 | | | | 5-25-2022 | | | | 15,683 | | | | 16,691 | |
| | | | |
FNMA Series2000-T6 Class A2 | | | 9.50 | | | | 11-25-2040 | | | | 322,043 | | | | 362,100 | |
| | | | |
FNMA Series2001-T10 Class A3 | | | 9.50 | | | | 12-25-2041 | | | | 572,803 | | | | 657,789 | |
| | | | |
FNMA Series2001-T12 Class A3 | | | 9.50 | | | | 8-25-2041 | | | | 530,729 | | | | 626,395 | |
| | | | |
FNMA Series2002-T1 Class A4 | | | 9.50 | | | | 11-25-2031 | | | | 627,737 | | | | 726,807 | |
| | | | |
FNMA Series2002-W04 Class A6 ±± | | | 4.56 | | | | 5-25-2042 | | | | 664,857 | | | | 679,147 | |
| | | | |
FNMA Series2003-W11 Class A1 ±± | | | 5.63 | | | | 6-25-2033 | | | | 17,840 | | | | 18,632 | |
| | | | |
FNMA Series2003-W3 Class 1A4 ±± | | | 4.17 | | | | 8-25-2042 | | | | 34,144 | | | | 35,327 | |
| | | | |
FNMA Series2004-10 Class FA (1 Month LIBOR +0.35%) ± | | | 2.84 | | | | 2-25-2034 | | | | 77,211 | | | | 77,241 | |
| | | | |
FNMA Series2004-32 Class AY | | | 4.00 | | | | 5-25-2019 | | | | 608 | | | | 608 | |
| | | | |
FNMA Series2004-92 Class QY | | | 4.50 | | | | 8-25-2034 | | | | 56,889 | | | | 56,815 | |
| | | | |
FNMA Series2007-W2 Class 1A1 (1 Month LIBOR +0.32%) ± | | | 2.81 | | | | 3-25-2037 | | | | 334,443 | | | | 334,490 | |
| | | | |
FNMA Series2008-76 Class GF (1 Month LIBOR +0.65%) ± | | | 3.14 | | | | 9-25-2023 | | | | 5,613 | | | | 5,608 | |
| | | | |
FNMA Series2009-31 Class B | | | 4.00 | | | | 5-25-2024 | | | | 646,932 | | | | 646,947 | |
| | | | |
FNMA Series2010-115 Class NC | | | 2.75 | | | | 1-25-2039 | | | | 802,620 | | | | 797,108 | |
| | | | |
FNMA Series2010-25 Class ND | | | 3.50 | | | | 3-25-2025 | | | | 22,693 | | | | 22,560 | |
| | | | |
FNMA Series2010-37 Class A1 | | | 5.41 | | | | 5-25-2035 | | | | 4,971,788 | | | | 5,121,881 | |
| | | | |
FNMA Series2010-57 Class DQ | | | 3.00 | | | | 6-25-2025 | | | | 227,017 | | | | 225,511 | |
| | | | |
FNMA Series2010-89 Class DP | | | 3.00 | | | | 6-25-2038 | | | | 1,125,567 | | | | 1,126,151 | |
| | | | |
FNMA Series2011-122 Class A | | | 3.00 | | | | 12-25-2025 | | | | 227,122 | | | | 226,676 | |
| | | | |
FNMA Series2011-33 Class GA | | | 3.50 | | | | 10-25-2028 | | | | 31,729 | | | | 31,670 | |
| | | | |
FNMA Series2011-40 Class CA | | | 3.50 | | | | 12-25-2028 | | | | 204,166 | | | | 204,046 | |
| | | | |
FNMA Series2012-72 Class QE | | | 3.00 | | | | 1-25-2038 | | | | 386,483 | | | | 386,884 | |
| | | | |
FNMA Series2012-94 Class E | | | 3.00 | | | | 6-25-2022 | | | | 13,742 | | | | 13,725 | |
| | | | |
FNMA Series2013-26 Class AK | | | 2.50 | | | | 11-25-2038 | | | | 3,556,395 | | | | 3,524,812 | |
| | | | |
FNMA Series2014-19 Class HA | | | 2.00 | | | | 6-25-2040 | | | | 899,131 | | | | 872,168 | |
| | | | |
GNMA | | | 7.00 | | | | 6-15-2033 | | | | 399,949 | | | | 464,232 | |
| | | | |
GNMA Series2011-70 Class BE | | | 3.00 | | | | 8-25-2026 | | | | 70,715 | | | | 70,624 | |
| | | | |
GNMA Series2012-57 Class LG | | | 1.50 | | | | 3-16-2035 | | | | 119,025 | | | | 118,434 | |
| | | | |
GNMA Series2016-H19 Class FE (1 Month LIBOR +0.37%) ± | | | 2.88 | | | | 6-20-2061 | | | | 675,793 | | | | 675,653 | |
| | | | |
GNMA Series2017-H13 Class FJ (1 Month LIBOR +0.20%) ± | | | 2.71 | | | | 5-20-2067 | | | | 1,040,319 | | | | 1,039,279 | |
| | | | |
GNMA Series2017-H16 Class FD (1 Month LIBOR +0.20%) ± | | | 2.71 | | | | 8-20-2067 | | | | 1,595,364 | | | | 1,594,699 | |
| | | | |
Total Agency Securities (Cost $86,549,389) | | | | | | | | | | | | | | | 86,786,086 | |
| | | | | | | | | | | | | | | | |
| | | | |
Asset-Backed Securities: 13.99% | | | | | | | | | | | | | | | | |
| | | | |
AmeriCredit Automobile Receivables Trust Series2017-2 Class A3 | | | 1.98 | | | | 12-20-2021 | | | | 5,305,000 | | | | 5,284,366 | |
| | | | |
Avis Budget Rental Car Funding LLC Series2014-1A Class A 144A | | | 2.46 | | | | 7-20-2020 | | | | 833,333 | | | | 832,690 | |
| | | | |
Bank of the West Auto Trust Series2018-1 Class A2 144A | | | 3.09 | | | | 4-15-2021 | | | | 5,000,000 | | | | 5,007,360 | |
| | | | |
CCG Receivables Trust Series2016-1 Class A2 144A | | | 1.69 | | | | 9-14-2022 | | | | 917,434 | | | | 915,201 | |
| | | | |
CCG Receivables Trust Series2017-1 Class A2 144A | | | 1.84 | | | | 11-14-2023 | | | | 3,718,643 | | | | 3,696,466 | |
| | | | |
Chesapeake Funding II LLC Series2017-3A Class A1 144A | | | 1.91 | | | | 8-15-2029 | | | | 5,870,167 | | | | 5,810,683 | |
| | | | |
Chesapeake Funding II LLC Series2018-3A Class A1 144A | | | 3.39 | | | | 1-15-2031 | | | | 6,500,000 | | | | 6,543,516 | |
| | | | |
Dell Equipment Finance Trust Series2017-2 Class A2B (1 Month LIBOR +0.30%) 144A± | | | 2.78 | | | | 2-24-2020 | | | | 988,515 | | | | 988,515 | |
| | | | |
DLL Securitization Trust Series2017-A Class A2 144A | | | 1.89 | | | | 7-15-2020 | | | | 1,742,041 | | | | 1,738,387 | |
| | | | |
Drive Auto Receivables Trust Series 2016 - BA Class C 144A | | | 3.19 | | | | 7-15-2022 | | | | 936,350 | | | | 936,932 | |
| | | | |
Drive Auto Receivables Trust Series 2016 - CA Class C 144A | | | 3.02 | | | | 11-15-2021 | | | | 9,007,514 | | | | 9,009,651 | |
| | | | |
DT Auto Owner Trust Series2018-3A Class A 144A | | | 3.02 | | | | 2-15-2022 | | | | 3,461,839 | | | | 3,461,403 | |
The accompanying notes are an integral part of these financial statements.
| | | | |
| 12 | | Wells Fargo Ultra Short-Term Income Fund | | Portfolio of investments—February 28, 2019 (unaudited) |
| | | | | | | | | | | | | | | | |
| Security name | | Interest rate | | | Maturity date | | | Principal | | | Value | |
| | | | |
Asset-Backed Securities(continued) | | | | | | | | | | | | | | | | |
| | | | |
Education Loan Asset-Backed Trust Series2013-1 Class A1 (1 Month LIBOR +0.80%) 144A± | | | 3.29 | % | | | 6-25-2026 | | | $ | 2,793,890 | | | $ | 2,797,247 | |
| | | | |
Educational Services of America Incorporated Series2015-2 Class A (1 Month LIBOR +1.00%) 144A± | | | 3.49 | | | | 12-25-2056 | | | | 1,020,369 | | | | 1,027,754 | |
| | | | |
Enterprise Fleet Financing Trust Series 2016-2 Class A2 144A | | | 1.74 | | | | 2-22-2022 | | | | 3,872,271 | | | | 3,860,984 | |
| | | | |
Enterprise Fleet Financing Trust Series2017-1 Class A2 144A | | | 2.13 | | | | 7-20-2022 | | | | 5,655,074 | | | | 5,631,092 | |
| | | | |
Enterprise Fleet Financing Trust Series2017-2 Class A2 144A | | | 1.97 | | | | 1-20-2023 | | | | 751,210 | | | | 746,808 | |
| | | | |
GMF Floorplan Owner Revolving Trust Series2016-1 Class A2 (1 Month LIBOR +0.85%) 144A± | | | 3.34 | | | | 5-17-2021 | | | | 4,655,000 | | | | 4,660,895 | |
| | | | |
Honda Auto Receivables Owner Trust Series2018-3 Class A2 | | | 2.67 | | | | 12-21-2020 | | | | 6,365,269 | | | | 6,367,023 | |
| | | | |
Hyundai Auto Lease Securitization Trust Series2017-C Class A3 144A | | | 2.12 | | | | 2-16-2021 | | | | 5,320,000 | | | | 5,297,974 | |
| | | | |
John Deere Owner Trust Series2016-A Class A3 | | | 1.36 | | | | 4-15-2020 | | | | 145,545 | | | | 145,382 | |
| | | | |
Kubota Credit Owner Trust Series2017-1A Class A2 144A | | | 1.66 | | | | 5-15-2020 | | | | 870,163 | | | | 868,538 | |
| | | | |
Mercedes-Benz Auto Lease Trust Series2019-A Class A2 | | | 3.01 | | | | 2-16-2021 | | | | 5,750,000 | | | | 5,762,903 | |
| | | | |
MMAF Equipment Finance LLC Series2015-AA Class A4 144A | | | 1.93 | | | | 7-16-2021 | | | | 4,152,114 | | | | 4,143,009 | |
| | | | |
Navistar Financial Dealer Note Master Trust Series2017-1 Class A (1 Month LIBOR +0.78%) 144A± | | | 3.27 | | | | 6-27-2022 | | | | 6,000,000 | | | | 6,004,221 | |
| | | | |
Prestige Auto Receivables Trust Series 2016 - 2A Class A3 144A | | | 1.76 | | | | 1-15-2021 | | | | 1,843,378 | | | | 1,842,567 | |
| | | | |
Santander Retail Auto Lease Trust Series2017-A Class A2A 144A | | | 2.02 | | | | 3-20-2020 | | | | 1,240,956 | | | | 1,239,338 | |
| | | | |
SLC Student Loan Trust Series2006-2 Class A5 (3 Month LIBOR +0.10%) ± | | | 2.89 | | | | 9-15-2026 | | | | 1,528,572 | | | | 1,525,826 | |
| | | | |
SLM Student Loan Trust Series2004-8A Class A5 (3 Month LIBOR +0.50%) 144A± | | | 3.27 | | | | 4-25-2024 | | | | 368,706 | | | | 369,309 | |
| | | | |
SLM Student Loan Trust Series2006-10 Class A5A (3 Month LIBOR +0.10%) ± | | | 2.87 | | | | 4-25-2027 | | | | 1,377,357 | | | | 1,374,978 | |
| | | | |
SLM Student Loan Trust Series2011-2 Class A1 (1 Month LIBOR +0.60%) ± | | | 3.09 | | | | 11-25-2027 | | | | 1,788,049 | | | | 1,794,940 | |
| | | | |
SLM Student Loan Trust Series2012-3 Class A (1 Month LIBOR +0.65%) ± | | | 3.14 | | | | 12-27-2038 | | | | 5,038,047 | | | | 5,025,321 | |
| | | | |
SLM Student Loan Trust Series2013-1 Class A3 (1 Month LIBOR +0.55%) ± | | | 3.04 | | | | 5-26-2055 | | | | 4,631,922 | | | | 4,614,466 | |
| | | | |
South Texas Higher Education2012-1 Class A2 (3 Month LIBOR +0.85%) ± | | | 3.65 | | | | 10-1-2024 | | | | 4,364,217 | | | | 4,367,272 | |
| | | | |
Structured Asset Securities Corporation Series1998-2 Class A (1 Month LIBOR +0.52%) ± | | | 3.01 | | | | 2-25-2028 | | | | 70,353 | | | | 69,913 | |
| | | | |
Student Loan Consolidation Center Series2011-1 Class A (1 Month LIBOR +1.22%) 144A± | | | 3.71 | | | | 10-25-2027 | | | | 5,517,618 | | | | 5,540,347 | |
| | | | |
Tesla Auto Lease Trust Series2018-B Class A 144A | | | 3.71 | | | | 8-20-2021 | | | | 2,333,665 | | | | 2,357,053 | |
| | | | |
Towd Point Asset Trust Series2018-SL1 Class A (1 Month LIBOR +0.60%) 144A± | | | 3.11 | | | | 1-25-2046 | | | | 4,917,555 | | | | 4,863,501 | |
| | | | |
Verizon Owner Trust Series2017-1A Class A 144A | | | 2.06 | | | | 9-20-2021 | | | | 5,175,000 | | | | 5,155,220 | |
| | | | |
Volvo Financial Equipment LLC Series2016-1A Class A3 144A | | | 1.67 | | | | 2-18-2020 | | | | 32,505 | | | | 32,480 | |
| | | | |
Volvo Financial Equipment LLC Series 2017-1A Class A3 144A | | | 1.92 | | | | 3-15-2021 | | | | 9,951,107 | | | | 9,899,133 | |
| | | | |
Wheels SPV LLC Series2018-1A Class A2 144A | | | 3.06 | | | | 4-20-2027 | | | | 3,385,000 | | | | 3,384,646 | |
| | | | |
World Omni Auto Receivables Trust Series2016-B Class A3 | | | 1.30 | | | | 2-15-2022 | | | | 2,678,119 | | | | 2,654,063 | |
| | | | |
Total Asset-Backed Securities (Cost $147,646,047) | | | | | | | | | | | | | | | 147,649,373 | |
| | | | | | | | | | | | | | | | |
| | | | |
Corporate Bonds and Notes: 33.56% | | | | | | | | | | | | | | | | |
| | | | |
Communication Services: 4.62% | | | | | | | | | | | | | | | | |
| | | | |
| Diversified Telecommunication Services: 2.38% | | | | | | | | | | | | | | | | |
| | | | |
AT&T Incorporated | | | 5.00 | | | | 3-1-2021 | | | | 9,915,000 | | | | 10,338,554 | |
| | | | |
Broadcom Corporation | | | 2.20 | | | | 1-15-2021 | | | | 7,000,000 | | | | 6,836,693 | |
| | | | |
Broadcom Corporation | | | 3.00 | | | | 1-15-2022 | | | | 3,585,000 | | | | 3,518,474 | |
| | | | |
Hughes Satellite Systems Corporation | | | 6.50 | | | | 6-15-2019 | | | | 4,400,000 | | | | 4,427,500 | |
| | | | |
| | | | | | | | | | | | | | | 25,121,221 | |
| | | | | | | | | | | | | | | | |
The accompanying notes are an integral part of these financial statements.
| | | | | | |
| Portfolio of investments—February 28, 2019 (unaudited) | | Wells Fargo Ultra Short-Term Income Fund | | | 13 | |
| | | | | | | | | | | | | | | | |
| Security name | | Interest rate | | | Maturity date | | | Principal | | | Value | |
| | | | |
| Media: 1.95% | | | | | | | | | | | | | | | | |
| | | | |
Discovery Communications LLC | | | 2.20 | % | | | 9-20-2019 | | | $ | 3,725,000 | | | $ | 3,706,779 | |
| | | | |
Fox Corporation 144A | | | 3.67 | | | | 1-25-2022 | | | | 3,880,000 | | | | 3,925,168 | |
| | | | |
Interpublic Group Companies | | | 3.50 | | | | 10-1-2020 | | | | 2,000,000 | | | | 2,009,904 | |
| | | | |
NBCUniversal Enterprise Incorporated 144A | | | 5.25 | | | | 12-31-2049 | | | | 6,000,000 | | | | 6,096,660 | |
| | | | |
TEGNA Incorporated | | | 5.13 | | | | 7-15-2020 | | | | 4,755,000 | | | | 4,796,606 | |
| | | | |
| | | | | | | | | | | | | | | 20,535,117 | |
| | | | | | | | | | | | | | | | |
| | | | |
| Wireless Telecommunication Services: 0.29% | | | | | | | | | | | | | | | | |
| | | | |
Sprint Spectrum Company LLC 144A | | | 3.36 | | | | 3-20-2023 | | | | 3,093,750 | | | | 3,078,281 | |
| | | | | | | | | | | | | | | | |
| | | | |
Consumer Discretionary: 1.10% | | | | | | | | | | | | | | | | |
| | | | |
| Hotels, Restaurants & Leisure: 0.70% | | | | | | | | | | | | | | | | |
| | | | |
GLP Capital LP | | | 4.88 | | | | 11-1-2020 | | | | 3,660,000 | | | | 3,714,900 | |
| | | | |
MGM Resorts International | | | 5.25 | | | | 3-31-2020 | | | | 3,660,000 | | | | 3,724,965 | |
| | | | |
| | | | | | | | | | | | | | | 7,439,865 | |
| | | | | | | | | | | | | | | | |
| | | | |
| Household Durables: 0.40% | | | | | | | | | | | | | | | | |
| | | | |
D.R. Horton Incorporated | | | 3.75 | | | | 3-1-2019 | | | | 2,990,000 | | | | 2,990,000 | |
| | | | |
Lennar Corporation | | | 4.50 | | | | 11-15-2019 | | | | 1,220,000 | | | | 1,224,575 | |
| | | | |
| | | | | | | | | | | | | | | 4,214,575 | |
| | | | | | | | | | | | | | | | |
| | | | |
Consumer Staples: 2.06% | | | | | | | | | | | | | | | | |
| | | | |
| Food Products: 0.91% | | | | | | | | | | | | | | | | |
| | | | |
Campbell Soup Company | | | 3.30 | | | | 3-15-2021 | | | | 6,040,000 | | | | 6,030,446 | |
| | | | |
Conagra Brands Incorporated | | | 3.80 | | | | 10-22-2021 | | | | 3,560,000 | | | | 3,590,296 | |
| | | | |
| | | | | | | | | | | | | | | 9,620,742 | |
| | | | | | | | | | | | | | | | |
| | | | |
| Tobacco: 1.15% | | | | | | | | | | | | | | | | |
| | | | |
Altria Group Incorporated | | | 4.75 | | | | 5-5-2021 | | | | 5,000,000 | | | | 5,169,681 | |
| | | | |
British American Tobacco Capital Corporation | | | 2.30 | | | | 8-14-2020 | | | | 5,215,000 | | | | 5,138,097 | |
| | | | |
Reynolds American Incorporated | | | 8.13 | | | | 6-23-2019 | | | | 1,793,000 | | | | 1,820,452 | |
| | | | |
| | | | | | | | | | | | | | | 12,128,230 | |
| | | | | | | | | | | | | | | | |
|
Energy: 2.40% | |
|
| Oil, Gas & Consumable Fuels: 2.40% | |
| | | | |
DCP Midstream Operating LP 144A | | | 5.35 | | | | 3-15-2020 | | | | 2,510,000 | | | | 2,553,925 | |
| | | | |
Enable Midstream Partner LP | | | 2.40 | | | | 5-15-2019 | | | | 7,465,000 | | | | 7,454,677 | |
| | | | |
Energy Transfer Partners LP | | | 5.20 | | | | 2-1-2022 | | | | 5,435,000 | | | | 5,664,420 | |
| | | | |
Rockies Express Pipeline LLC 144A | | | 5.63 | | | | 4-15-2020 | | | | 5,950,000 | | | | 6,069,000 | |
| | | | |
Sabine Pass Liquefaction LLC | | | 5.63 | | | | 2-1-2021 | | | | 3,500,000 | | | | 3,619,547 | |
| | | | |
| | | | | | | | | | | | | | | 25,361,569 | |
| | | | | | | | | | | | | | | | |
|
Financials: 14.60% | |
|
| Banks: 6.56% | |
| | | | |
Australia & New Zealand Banking Group Limited | | | 2.25 | | | | 11-9-2020 | | | | 5,790,000 | | | | 5,722,942 | |
| | | | |
Bank of America Corporation (3 Month LIBOR +0.63%) ± | | | 2.33 | | | | 10-1-2021 | | | | 5,000,000 | | | | 4,949,132 | |
The accompanying notes are an integral part of these financial statements.
| | | | |
| 14 | | Wells Fargo Ultra Short-Term Income Fund | | Portfolio of investments—February 28, 2019 (unaudited) |
| | | | | | | | | | | | | | | | |
| Security name | | Interest rate | | | Maturity date | | | Principal | | | Value | |
| | | | |
| Banks(continued) | | | | | | | | | | | | | | | | |
| | | | |
BB&T Corporation | | | 2.15 | % | | | 2-1-2021 | | | $ | 7,000,000 | | | $ | 6,897,522 | |
| | | | |
BBVA Bancomer SA of Texas 144A | | | 7.25 | | | | 4-22-2020 | | | | 5,000,000 | | | | 5,168,800 | |
| | | | |
Citigroup Incorporated | | | 2.45 | | | | 1-10-2020 | | | | 4,000,000 | | | | 3,984,110 | |
| | | | |
Citigroup Incorporated | | | 2.50 | | | | 7-29-2019 | | | | 6,087,000 | | | | 6,079,003 | |
| | | | |
Fifth Third Bank | | | 2.30 | | | | 3-15-2019 | | | | 4,470,000 | | | | 4,469,565 | |
| | | | |
Huntington National Bank | | | 2.38 | | | | 3-10-2020 | | | | 8,000,000 | | | | 7,954,839 | |
| | | | |
JPMorgan Chase & Company (3 Month LIBOR +0.61%) ± | | | 3.51 | | | | 6-18-2022 | | | | 7,000,000 | | | | 7,064,802 | |
| | | | |
PNC Bank | | | 2.45 | | | | 11-5-2020 | | | | 7,000,000 | | | | 6,938,812 | |
| | | | |
Synchrony Bank | | | 3.65 | | | | 5-24-2021 | | | | 2,650,000 | | | | 2,661,412 | |
| | | | |
US Bank NA | | | 2.05 | | | | 10-23-2020 | | | | 7,460,000 | | | | 7,363,818 | |
| | | | |
| | | | | | | | | | | | | | | 69,254,757 | |
| | | | | | | | | | | | | | | | |
|
| Capital Markets: 0.86% | |
| | | | |
Goldman Sachs Group Incorporated | | | 2.00 | | | | 4-25-2019 | | | | 4,000,000 | | | | 3,995,756 | |
| | | | |
Goldman Sachs Group Incorporated | | | 5.38 | | | | 3-15-2020 | | | | 5,000,000 | | | | 5,117,181 | |
| | | | |
| | | | | | | | | | | | | | | 9,112,937 | |
| | | | | | | | | | | | | | | | |
|
| Consumer Finance: 4.43% | |
| | | | |
BMW US Capital LLC 144A | | | 2.15 | | | | 4-6-2020 | | | | 1,000,000 | | | | 992,797 | |
| | | | |
Capital One Financial Corporation | | | 2.50 | | | | 5-12-2020 | | | | 7,000,000 | | | | 6,952,864 | |
| | | | |
Daimler Finance North America LLC 144A | | | 1.50 | | | | 7-5-2019 | | | | 3,000,000 | | | | 2,986,580 | |
| | | | |
Daimler Finance North America LLC 144A | | | 2.20 | | | | 5-5-2020 | | | | 1,480,000 | | | | 1,463,057 | |
| | | | |
Daimler Finance North America LLC 144A | | | 2.30 | | | | 2-12-2021 | | | | 4,000,000 | | | | 3,929,186 | |
| | | | |
Ford Motor Credit Company LLC | | | 3.20 | | | | 1-15-2021 | | | | 3,665,000 | | | | 3,606,202 | |
| | | | |
Ford Motor Credit Company LLC (3 Month LIBOR +0.88%) ± | | | 3.68 | | | | 10-12-2021 | | | | 2,840,000 | | | | 2,737,937 | |
| | | | |
General Motors Financial Company Incorporated | | | 4.20 | | | | 11-6-2021 | | | | 5,000,000 | | | | 5,063,884 | |
| | | | |
Hyundai Capital America Incorporated 144A | | | 2.75 | | | | 9-18-2020 | | | | 4,000,000 | | | | 3,951,650 | |
| | | | |
John Deere Capital Corporation | | | 1.95 | | | | 6-22-2020 | | | | 3,000,000 | | | | 2,966,748 | |
| | | | |
Nissan Motor Acceptance Corporation 144A | | | 2.25 | | | | 1-13-2020 | | | | 4,000,000 | | | | 3,965,750 | |
| | | | |
Nissan Motor Acceptance Corporation 144A | | | 3.65 | | | | 9-21-2021 | | | | 4,000,000 | | | | 3,981,300 | |
| | | | |
Synchrony Financial | | | 2.70 | | | | 2-3-2020 | | | | 4,140,000 | | | | 4,122,515 | |
| | | | |
| | | | | | | | | | | | | | | 46,720,470 | |
| | | | | | | | | | | | | | | | |
|
| Diversified Financial Services: 1.00% | |
| | | | |
IBM Credit LLC | | | 3.45 | | | | 11-30-2020 | | | | 6,500,000 | | | | 6,560,310 | |
| | | | |
WEA Finance LLC 144A | | | 2.70 | | | | 9-17-2019 | | | | 2,975,000 | | | | 2,971,956 | |
| | | | |
WEA Finance LLC 144A | | | 3.25 | | | | 10-5-2020 | | | | 1,000,000 | | | | 1,001,560 | |
| | | | |
| | | | | | | | | | | | | | | 10,533,826 | |
| | | | | | | | | | | | | | | | |
|
| Insurance: 1.75% | |
| | | | |
Axis Specialty Finance LLC | | | 5.88 | | | | 6-1-2020 | | | | 1,685,000 | | | | 1,734,541 | |
| | | | |
Jackson National Life Global Funding 144A | | | 2.30 | | | | 4-16-2019 | | | | 3,251,000 | | | | 3,250,108 | |
| | | | |
Metropolitan Life Global Funding Incorporated 144A | | | 1.55 | | | | 9-13-2019 | | | | 5,180,000 | | | | 5,147,991 | |
| | | | |
Metropolitan Life Global Funding Incorporated 144A | | | 1.75 | | | | 9-19-2019 | | | | 3,000,000 | | | | 2,984,265 | |
| | | | |
PartnerRe Finance B LLC | | | 5.50 | | | | 6-1-2020 | | | | 1,000,000 | | | | 1,023,871 | |
| | | | |
Protective Life Global Funding 144A | | | 2.26 | | | | 4-8-2020 | | | | 4,415,000 | | | | 4,385,236 | |
| | | | |
| | | | | | | | | | | | | | | 18,526,012 | |
| | | | | | | | | | | | | | | | |
The accompanying notes are an integral part of these financial statements.
| | | | | | |
| Portfolio of investments—February 28, 2019 (unaudited) | | Wells Fargo Ultra Short-Term Income Fund | | | 15 | |
| | | | | | | | | | | | | | | | |
| Security name | | Interest rate | | | Maturity date | | | Principal | | | Value | |
|
Health Care: 3.30% | |
|
| Biotechnology: 0.47% | |
| | | | |
Abbvie Incorporated | | | 3.38 | % | | | 11-14-2021 | | | $ | 4,935,000 | | | $ | 4,966,875 | |
| | | | | | | | | | | | | | | | |
|
| Health Care Providers & Services: 2.27% | |
| | | | |
Anthem Incorporated | | | 2.50 | | | | 11-21-2020 | | | | 5,040,000 | | | | 4,992,956 | |
| | | | |
Cigna Holding Company | | | 4.00 | | | | 2-15-2022 | | | | 5,375,000 | | | | 5,477,750 | |
| | | | |
CVS Health Corporation | | | 2.80 | | | | 7-20-2020 | | | | 5,910,000 | | | | 5,879,129 | |
| | | | |
HCA Incorporated | | | 6.50 | | | | 2-15-2020 | | | | 3,685,000 | | | | 3,795,200 | |
| | | | |
Tenet Healthcare Corporation | | | 6.00 | | | | 10-1-2020 | | | | 3,660,000 | | | | 3,774,375 | |
| | | | |
| | | | | | | | | | | | | | | 23,919,410 | |
| | | | | | | | | | | | | | | | |
|
| Pharmaceuticals: 0.56% | |
| | | | |
EMD Finance LLC 144A | | | 2.40 | | | | 3-19-2020 | | | | 5,965,000 | | | | 5,926,682 | |
| | | | | | | | | | | | | | | | |
|
Industrials: 1.71% | |
|
| Air Freight & Logistics: 0.48% | |
| | | | |
FedEx Corporation | | | 3.40 | | | | 1-14-2022 | | | | 5,000,000 | | | | 5,041,842 | |
| | | | | | | | | | | | | | | | |
|
| Airlines: 0.57% | |
| | | | |
Delta Air Lines Incorporated | | | 3.40 | | | | 4-19-2021 | | | | 3,000,000 | | | | 2,995,500 | |
| | | | |
Delta Air Lines Incorporated | | | 3.63 | | | | 3-15-2022 | | | | 3,000,000 | | | | 2,989,827 | |
| | | | |
| | | | | | | | | | | | | | | 5,985,327 | |
| | | | | | | | | | | | | | | | |
|
| Machinery: 0.32% | |
| | | | |
CNH Industrial Capital LLC | | | 4.38 | | | | 11-6-2020 | | | | 3,375,000 | | | | 3,406,388 | |
| | | | | | | | | | | | | | | | |
|
| Road & Rail: 0.34% | |
| | | | |
ERAC USA Finance LLC 144A | | | 2.35 | | | | 10-15-2019 | | | | 3,605,000 | | | | 3,588,637 | |
| | | | | | | | | | | | | | | | |
|
Information Technology: 1.29% | |
|
| Technology Hardware, Storage & Peripherals: 1.29% | |
| | | | |
EMC Corporation | | | 2.65 | | | | 6-1-2020 | | | | 6,660,000 | | | | 6,592,104 | |
| | | | |
Hewlett Packard Enterprise Company | | | 3.60 | | | | 10-15-2020 | | | | 7,000,000 | | | | 7,036,853 | |
| | | | |
| | | | | | | | | | | | | | | 13,628,957 | |
| | | | | | | | | | | | | | | | |
|
Materials: 1.21% | |
|
| Chemicals: 0.48% | |
| | | | |
DowDuPont Incorporated | | | 3.77 | | | | 11-15-2020 | | | | 5,000,000 | | | | 5,059,400 | |
| | | | | | | | | | | | | | | | |
|
| Paper & Forest Products: 0.73% | |
| | | | |
Georgia Pacific LLC 144A | | | 2.54 | | | | 11-15-2019 | | | | 7,740,000 | | | | 7,722,490 | |
| | | | | | | | | | | | | | | | |
|
Real Estate: 0.55% | |
|
| Equity REITs: 0.55% | |
| | | | |
Sabra Health Care LP | | | 5.50 | | | | 2-1-2021 | | | | 5,700,000 | | | | 5,781,938 | |
| | | | | | | | | | | | | | | | |
The accompanying notes are an integral part of these financial statements.
| | | | |
| 16 | | Wells Fargo Ultra Short-Term Income Fund | | Portfolio of investments—February 28, 2019 (unaudited) |
| | | | | | | | | | | | | | | | |
| Security name | | Interest rate | | | Maturity date | | | Principal | | | Value | |
| | | | |
Utilities: 0.72% | | | | | | | | | | | | | | | | |
| | | | |
| Electric Utilities: 0.37% | | | | | | | | | | | | | | | | |
| | | | |
Duke Energy Florida LLC | | | 2.10 | % | | | 12-15-2019 | | | $ | 1,000,000 | | | $ | 997,160 | |
| | | | |
Pinnacle West Capital Corporation | | | 2.25 | | | | 11-30-2020 | | | | 3,000,000 | | | | 2,948,733 | |
| | | | |
| | | | | | | | | | | | | | | 3,945,893 | |
| | | | | | | | | | | | | | | | |
| | | | |
| Multi-Utilities: 0.35% | | | | | | | | | | | | | | | | |
| | | | |
Dominion Resources Incorporated | | | 2.96 | | | | 7-1-2019 | | | | 3,635,000 | | | | 3,634,554 | |
| | | | | | | | | | | | | | | | |
| | | | |
Total Corporate Bonds and Notes (Cost $355,127,816) | | | | | | | | | | | | | | | 354,255,995 | |
| | | | | | | | | | | | | | | | |
| | | | |
| | | | | | | | | Shares | | | | |
| Exchange-Traded Funds: 2.88% | | | | | | | | | | | | | | | | |
| | | | |
SPDR Portfolio Short Term Corporate Bond ETF | | | | | | | | | | | 1,000,000 | | | | 30,420,000 | |
| | | | | | | | | | | | | | | | |
| | | | |
Total Exchange-Traded Funds (Cost $30,200,000) | | | | | | | | | | | | | | | 30,420,000 | |
| | | | | | | | | | | | | | | | |
| | | | |
| | | | | | | | | Principal | | | | |
| Municipal Obligations: 1.65% | | | | | | | | | | | | | | | | |
| | | | |
Connecticut: 0.90% | | | | | | | | | | | | | | | | |
| | | | |
| GO Revenue: 0.90% | | | | | | | | | | | | | | | | |
| | | | |
Connecticut Series A | | | 4.41 | | | | 4-1-2019 | | | $ | 8,100,000 | | | | 8,108,586 | |
| | | | |
Connecticut Series A | | | 5.46 | | | | 3-1-2019 | | | | 1,420,000 | | | | 1,420,000 | |
| | | | |
| | | | | | | | | | | | | | | 9,528,586 | |
| | | | | | | | | | | | | | | | |
| | | | |
Illinois: 0.47% | | | | | | | | | | | | | | | | |
| | | | |
| Miscellaneous Revenue: 0.47% | | | | | | | | | | | | | | | | |
| | | | |
Illinois Series 2014 | | | 5.00 | | | | 5-1-2019 | | | | 4,930,000 | | | | 4,951,396 | |
| | | | | | | | | | | | | | | | |
| | | | |
Michigan: 0.05% | | | | | | | | | | | | | | | | |
| | | | |
| Miscellaneous Revenue: 0.05% | | | | | | | | | | | | | | | | |
| | | | |
Michigan Finance Authority Subordinated Bond SeriesC-4 (Municipal Government Guaranty Insured) | | | 2.27 | | | | 4-1-2019 | | | | 500,000 | | | | 499,780 | |
| | | | | | | | | | | | | | | | |
| | | | |
Wisconsin: 0.23% | | | | | | | | | | | | | | | | |
| | | | |
| Housing Revenue: 0.23% | | | | | | | | | | | | | | | | |
| | | | |
Wisconsin Public Finance Authority Affinity Living Group Project (Citizens Bank LOC) | | | 3.75 | | | | 2-1-2022 | | | | 2,500,000 | | | | 2,496,800 | |
| | | | | | | | | | | | | | | | |
| | | | |
Total Municipal Obligations (Cost $17,473,819) | | | | | | | | | | | | | | | 17,476,562 | |
| | | | | | | | | | | | | | | | |
| | | | |
Non-Agency Mortgage-Backed Securities: 16.25% | | | | | | | | | | | | | | | | |
| | | | |
Banc of America Funding Corporation Series2016-R1 Class A1 144A±± | | | 2.50 | | | | 3-25-2040 | | | | 1,638,416 | | | | 1,590,184 | |
| | | | |
BDS Limited Series2018-FL2 Class A (1 Month LIBOR +0.95%) 144A± | | | 3.44 | | | | 8-15-2035 | | | | 2,835,625 | | | | 2,817,891 | |
| | | | |
BX Trust 2017 Series A (1 Month LIBOR +1.05%) 144A± | | | 3.54 | | | | 10-15-2032 | | | | 1,615,000 | | | | 1,614,726 | |
| | | | |
Cascade Funding Mortgage Trust Series 2018- RM2 Class A 144A±±‡ | | | 4.00 | | | | 10-25-2068 | | | | 1,302,383 | | | | 1,313,245 | |
| | | | |
CD Commercial Mortgage Trust Series2017-CD3 Class A1 | | | 1.97 | | | | 2-10-2050 | | | | 3,512,686 | | | | 3,471,991 | |
| | | | |
CGDBB Commercial Mortgage Trust Series 2017-BIOC Class A (1 Month LIBOR +0.79%) 144A± | | | 3.28 | | | | 7-15-2032 | | | | 5,600,000 | | | | 5,592,750 | |
| | | | |
CIFC Funding Limited Series2012-2RA Class A1 (3 Month LIBOR +0.80%) 144A± | | | 3.56 | | | | 1-20-2028 | | | | 7,550,000 | | | | 7,483,666 | |
The accompanying notes are an integral part of these financial statements.
| | | | | | |
| Portfolio of investments—February 28, 2019 (unaudited) | | Wells Fargo Ultra Short-Term Income Fund | | | 17 | |
| | | | | | | | | | | | | | | | |
| Security name | | Interest rate | | | Maturity date | | | Principal | | | Value | |
| | | | |
Non-Agency Mortgage-Backed Securities(continued) | | | | | | | | | | | | | | | | |
| | | | |
CIFC Funding Limited Series2015-2A Class AR (3 Month LIBOR +0.78%) 144A± | | | 3.57 | % | | | 4-15-2027 | | | $ | 7,000,000 | | | $ | 6,950,874 | |
| | | | |
Citigroup Commercial Mortgage Trust Series2008-C7 Class AMA ±± | | | 6.33 | | | | 12-10-2049 | | | | 102,729 | | | | 102,729 | |
| | | | |
Citigroup Commercial Mortgage Trust Series 2014-GC25 Class A2 | | | 3.26 | | | | 10-10-2047 | | | | 3,563,000 | | | | 3,566,863 | |
| | | | |
Citigroup Commercial Mortgage Trust Series 2017-1500 Class A (1 Month LIBOR +0.85%) 144A± | | | 3.34 | | | | 7-15-2032 | | | | 6,150,000 | | | | 6,151,918 | |
| | | | |
Citigroup Commercial Mortgage Trust Series 2017-MDRB Class A (1 Month LIBOR +1.10%) 144A± | | | 3.59 | | | | 7-15-2030 | | | | 3,104,805 | | | | 3,105,099 | |
| | | | |
Collateralized Mortgage Obligation Trust Series 66 Class Z | | | 8.00 | | | | 9-20-2021 | | | | 6,600 | | | | 6,756 | |
| | | | |
Commercial Mortgage Pass-Through Certificate Series2010-C1 Class A3 144A | | | 4.21 | | | | 7-10-2046 | | | | 2,078,190 | | | | 2,105,440 | |
| | | | |
Commercial Mortgage Trust Series 2014-CR15 Class A2 | | | 2.93 | | | | 2-10-2047 | | | | 4,105,809 | | | | 4,102,390 | |
| | | | |
Commercial Mortgage Trust Series 2014-CR16 Class ASB | | | 3.65 | | | | 4-10-2047 | | | | 4,055,000 | | | | 4,120,371 | |
| | | | |
Commercial Mortgage Trust Series 2014-CR19 Class A2 | | | 2.97 | | | | 8-10-2047 | | | | 1,310,000 | | | | 1,309,557 | |
| | | | |
Commercial Mortgage Trust Series 2014-LC17 Class A2 | | | 3.16 | | | | 10-10-2047 | | | | 7,281,621 | | | | 7,286,740 | |
| | | | |
Commercial Mortgage Trust Series 2014-UBS5 Class A2 | | | 3.03 | | | | 9-10-2047 | | | | 4,726,759 | | | | 4,726,811 | |
| | | | |
Commercial Mortgage Trust Series 2015-LC23 Class A1 | | | 1.81 | | | | 10-10-2048 | | | | 3,920,577 | | | | 3,886,913 | |
| | | | |
Countrywide Home Loans Mortgage Pass-Through Trust Series 2001-HYB1 Class 1A1 ±± | | | 3.81 | | | | 6-19-2031 | | | | 142,251 | | | | 142,244 | |
| | | | |
Countrywide Home Loans Mortgage Pass-Through Trust Series 2001-HYB1 Class 2A1 ±± | | | 4.46 | | | | 6-19-2031 | | | | 88,006 | | | | 87,021 | |
| | | | |
Credit Suisse Mortgage Trust Series 2019-SKLZ Class A (1 Month LIBOR +1.25%) 144A± | | | 3.76 | | | | 1-15-2034 | | | | 3,600,000 | | | | 3,608,936 | |
| | | | |
Crown Point Limited Series2015-3A Class A1AR (3 Month LIBOR +0.91%) 144A± | | | 3.70 | | | | 12-31-2027 | | | | 7,030,000 | | | | 6,998,063 | |
| | | | |
CSAIL Commercial Mortgage Trust Series2015-C4 Class A1 | | | 2.01 | | | | 11-15-2048 | | | | 1,176,509 | | | | 1,167,536 | |
| | | | |
DLJ Mortgage Acceptance Corporation Series1990-2 Class A ±± | | | 3.57 | | | | 1-25-2022 | | | | 5,458 | | | | 5,492 | |
| | | | |
EquiFirst Mortgage Loan Trust Series2003-2 Class 3A3 (1 Month LIBOR +1.13%) ± | | | 3.61 | | | | 9-25-2033 | | | | 327,747 | | | | 321,247 | |
| | | | |
FirstKey Mortgage Trust Series2014-1 Class A2 144A±± | | | 3.00 | | | | 11-25-2044 | | | | 2,796,620 | | | | 2,780,728 | |
| | | | |
GS Mortgage Securities Trust Series2010-C1 Class A1 144A | | | 3.68 | | | | 8-10-2043 | | | | 1,171,623 | | | | 1,174,822 | |
| | | | |
GS Mortgage Securities Trust Series2010-C2 Class A2 144A±± | | | 5.16 | | | | 12-10-2043 | | | | 3,190,000 | | | | 3,297,633 | |
| | | | |
GS Mortgage Securities Trust Series2011-GC3 Class A4 144A | | | 4.75 | | | | 3-10-2044 | | | | 5,999,051 | | | | 6,163,983 | |
| | | | |
GS Mortgage Securities Trust Series2015-GS1 Class A1 | | | 1.94 | | | | 11-10-2048 | | | | 453,319 | | | | 449,626 | |
| | | | |
GS Mortgage Securities Trust Series2016-GS3 Class A1 | | | 1.43 | | | | 10-10-2049 | | | | 1,315,600 | | | | 1,294,805 | |
| | | | |
GSMPS Mortgage Loan Trust Series1998-1 Class A 144A±± | | | 8.00 | | | | 9-19-2027 | | | | 39,496 | | | | 38,966 | |
| | | | |
Halcyon Loan Advisors Funding Series2014-3A Class AR (3 Month LIBOR +1.10%) 144A± | | | 3.86 | | | | 10-22-2025 | | | | 5,702,668 | | | | 5,698,893 | |
| | | | |
Housing Securities Incorporated Series1992-8 Class E ±± | | | 5.29 | | | | 6-25-2024 | | | | 33,035 | | | | 33,396 | |
| | | | |
JPMorgan Chase Commercial Mortgage Securities Trust Series 2007-CB18 Class AMFL (1 Month LIBOR +0.17%) ± | | | 2.68 | | | | 6-12-2047 | | | | 13,406 | | | | 13,381 | |
| | | | |
JPMorgan Chase Commercial Mortgage Securities Trust Series2011-C5 Class A3 | | | 4.17 | | | | 8-15-2046 | | | | 5,057,937 | | | | 5,168,961 | |
| | | | |
JPMorgan Chase Commercial Mortgage Securities Trust Series2015-C28 Class A2 | | | 2.77 | | | | 10-15-2048 | | | | 98,688 | | | | 98,432 | |
| | | | |
JPMorgan Chase Commercial Mortgage Securities Trust Series2015-C33 Class A1 | | | 1.90 | | | | 12-15-2048 | | | | 2,774,323 | | | | 2,757,234 | |
| | | | |
JPMorgan Chase Commercial Mortgage Securities Trust Series2017-JP5 Class A1 | | | 2.09 | | | | 3-15-2050 | | | | 3,306,688 | | | | 3,263,588 | |
| | | | |
JPMorgan Chase Commercial Mortgage Securities Trust Series2018-PHH Class A (1 Month LIBOR +0.91%) 144A± | | | 3.40 | | | | 6-15-2035 | | | | 3,915,000 | | | | 3,906,348 | |
| | | | |
Master Mortgages Trust Series2002-3 Class 4A1 ±± | | | 4.32 | | | | 10-25-2032 | | | | 6,032 | | | | 6,033 | |
| | | | |
Mello Warehouse Securitization Series 2018 - W1 Class A (1 Month LIBOR +0.85%) 144A± | | | 3.34 | | | | 11-25-2051 | | | | 5,500,000 | | | | 5,502,790 | |
| | | | |
Morgan Stanley Bank of America Merrill Lynch Trust Series2013-C11 Class A2 | | | 3.09 | | | | 8-15-2046 | | | | 685,279 | | | | 684,709 | |
| | | | |
Morgan Stanley Bank of America Merrill Lynch Trust Series2016-C28 Class A1 | | | 1.53 | | | | 1-15-2049 | | | | 1,076,158 | | | | 1,063,820 | |
| | | | |
Morgan Stanley Capital I Trust Series2011-C2 Class A4 144A | | | 4.66 | | | | 6-15-2044 | | | | 3,125,000 | | | | 3,211,772 | |
| | | | |
Morgan Stanley Capital I Trust Series2016-C30 Class A1 | | | 1.39 | | | | 9-15-2049 | | | | 4,829,252 | | | | 4,739,321 | |
The accompanying notes are an integral part of these financial statements.
| | | | |
| 18 | | Wells Fargo Ultra Short-Term Income Fund | | Portfolio of investments—February 28, 2019 (unaudited) |
| | | | | | | | | | | | | | | | |
| Security name | | Interest rate | | | Maturity date | | | Principal | | | Value | |
| | | | |
Non-Agency Mortgage-Backed Securities(continued) | | | | | | | | | | | | | | | | |
| | | | |
Neuberger Berman Limited Series2015-20A Class AR (3 Month LIBOR +0.80%) 144A± | | | 3.59 | % | | | 1-15-2028 | | | $ | 4,085,000 | | | $ | 4,050,412 | |
| | | | |
Octagon Investment Partners Series2015-1A Class A1R (3 Month LIBOR +0.90%) 144A± | | | 3.54 | | | | 5-21-2027 | | | | 6,300,000 | | | | 6,271,108 | |
| | | | |
Palmer Square Loan Funding Limited Series 2018 - 4A Class A1 (3 Month LIBOR +0.90%) 144A± | | | 3.52 | | | | 11-15-2026 | | | | 4,202,920 | | | | 4,183,506 | |
| | | | |
RAIT Trust Series2017-FL7 Class A (1 Month LIBOR +0.95%) 144A± | | | 3.44 | | | | 6-15-2037 | | | | 1,932,850 | | | | 1,910,977 | |
| | | | |
ReadyCap Commercial Mortgage Trust Series2019-5 Class A 144A | | | 3.78 | | | | 2-25-2052 | | | | 4,271,523 | | | | 4,293,604 | |
| | | | |
Salomon Brothers Mortgage Securities VII Series1990-2 Class A ±± | | | 2.87 | | | | 11-25-2020 | | | | 132,657 | | | | 132,676 | |
| | | | |
Stonemont Portfolio Trust Series 2017 Class A (1 Month LIBOR +0.85%) 144A± | | | 3.33 | | | | 8-20-2030 | | | | 5,081,402 | | | | 5,062,226 | |
| | | | |
Structured Asset Mortgage Investments Incorporated Series2001-4 Class A2 ±± | | | 8.15 | | | | 10-25-2024 | | | | 6,228 | | | | 6,232 | |
| | | | |
UBS Commercial Mortgage Trust Series2012-C1 Class A3 | | | 3.40 | | | | 5-10-2045 | | | | 1,450,550 | | | | 1,463,144 | |
| | | | |
Vendee Mortgage Trust Series2011-1 Class DA | | | 3.75 | | | | 2-15-2035 | | | | 1,774,367 | | | | 1,791,977 | |
| | | | |
Venture CDO Limited Series2015-20A Class AR (3 Month LIBOR +0.82%) 144A± | | | 3.61 | | | | 4-15-2027 | | | | 7,000,000 | | | | 6,960,982 | |
| | | | |
Wilshire Funding Corporation Series1996-3 Class M2 ±± | | | 7.09 | | | | 8-25-2032 | | | | 134,807 | | | | 131,357 | |
| | | | |
Wilshire Funding Corporation Series1996-3 Class M3 ±± | | | 7.09 | | | | 8-25-2032 | | | | 126,374 | | | | 121,459 | |
| | | | |
Wilshire Funding Corporation Series1998-2 Class M1 ±± | | | 2.00 | | | | 12-28-2037 | | | | 206,298 | | | | 206,199 | |
| | | | |
TotalNon-Agency Mortgage-Backed Securities (Cost $172,311,609) | | | | | | | | | | | | | | | 171,572,553 | |
| | | | | | | | | | | | | | | | |
| | | | |
Yankee Corporate Bonds and Notes: 18.48% | | | | | | | | | | | | | | | | |
| | | | |
Communication Services: 0.94% | | | | | | | | | | | | | | | | |
| | | | |
| Diversified Telecommunication Services: 0.94% | | | | | | | | | | | | | | | | |
| | | | |
Deutsche Telekom International Finance BV 144A | | | 2.23 | | | | 1-17-2020 | | | | 10,000,000 | | | | 9,928,333 | |
| | | | | | | | | | | | | | | | |
| | | | |
Consumer Discretionary: 0.11% | | | | | | | | | | | | | | | | |
| | | | |
| Automobiles: 0.11% | | | | | | | | | | | | | | | | |
| | | | |
Jaguar Land Rover Limited 144A | | | 4.25 | | | | 11-15-2019 | | | | 1,220,000 | | | | 1,213,900 | |
| | | | | | | | | | | | | | | | |
| | | | |
Consumer Staples: 0.51% | | | | | | | | | | | | | | | | |
| | | | |
| Beverages: 0.08% | | | | | | | | | | | | | | | | |
| | | | |
Suntory Holdings Limited 144A | | | 2.55 | | | | 9-29-2019 | | | | 850,000 | | | | 846,749 | |
| | | | | | | | | | | | | | | | |
| | | | |
| Food & Staples Retailing: 0.43% | | | | | | | | | | | | | | | | |
| | | | |
Seven & I Holdings Company Limited 144A | | | 3.35 | | | | 9-17-2021 | | | | 4,500,000 | | | | 4,526,777 | |
| | | | | | | | | | | | | | | | |
| | | | |
Energy: 0.89% | | | | | | | | | | | | | | | | |
| | | | |
| Oil, Gas & Consumable Fuels: 0.89% | | | | | | | | | | | | | | | | |
| | | | |
Petroleos Mexicanos Company | | | 5.38 | | | | 3-13-2022 | | | | 2,525,000 | | | | 2,530,429 | |
| | | | |
TransCanada PipeLines Limited | | | 9.88 | | | | 1-1-2021 | | | | 6,200,000 | | | | 6,898,359 | |
| | | | |
| | | | | | | | | | | | | | | 9,428,788 | |
| | | | | | | | | | | | | | | | |
| | | | |
Financials: 13.67% | | | | | | | | | | | | | | | | |
| | | | |
| Banks: 9.64% | | | | | | | | | | | | | | | | |
| | | | |
ABN AMRO Bank NV 144A | | | 3.40 | | | | 8-27-2021 | | | | 7,000,000 | | | | 7,041,006 | |
| | | | |
ANZ New Zealand International Limited 144A | | | 2.60 | | | | 9-23-2019 | | | | 8,175,000 | | | | 8,166,751 | |
| | | | |
Banco de Credito del Peru 144A | | | 2.25 | | | | 10-25-2019 | | | | 4,500,000 | | | | 4,470,750 | |
| | | | |
Banco Santander Chile 144A | | | 2.50 | | | | 12-15-2020 | | | | 8,255,000 | | | | 8,151,813 | |
| | | | |
Banque Federative du Credit Mutuel SA 144A | | | 2.20 | | | | 7-20-2020 | | | | 7,470,000 | | | | 7,377,806 | |
The accompanying notes are an integral part of these financial statements.
| | | | | | |
| Portfolio of investments—February 28, 2019 (unaudited) | | Wells Fargo Ultra Short-Term Income Fund | | | 19 | |
| | | | | | | | | | | | | | | | |
| Security name | | Interest rate | | | Maturity date | | | Principal | | | Value | |
| | | | |
| Banks(continued) | | | | | | | | | | | | | | | | |
| | | | |
BPCE SA | | | 2.50 | % | | | 7-15-2019 | | | $ | 2,245,000 | | | $ | 2,239,769 | |
| | | | |
Commonwealth Bank of Australia 144A | | | 1.75 | | | | 11-7-2019 | | | | 5,250,000 | | | | 5,213,295 | |
| | | | |
Cooperatieve Rabobank | | | 1.38 | | | | 8-9-2019 | | | | 7,000,000 | | | | 6,960,233 | |
| | | | |
Danske Bank AS 144A | | | 5.00 | | | | 1-12-2022 | | | | 3,565,000 | | | | 3,637,650 | |
| | | | |
DNB Bank ASA 144A | | | 2.13 | | | | 10-2-2020 | | | | 7,000,000 | | | | 6,902,760 | |
| | | | |
Federation des Caisses Desjardins du Quebec 144A« | | | 2.25 | | | | 10-30-2020 | | | | 5,000,000 | | | | 4,940,642 | |
| | | | |
Global Bank Corporation 144A | | | 4.50 | | | | 10-20-2021 | | | | 1,180,000 | | | | 1,186,254 | |
| | | | |
ING Bank NV 144A | | | 1.65 | | | | 8-15-2019 | | | | 7,000,000 | | | | 6,966,948 | |
| | | | |
Sumitomo Mitsui Banking Corporation (3 Month LIBOR +0.37%) ± | | | 3.15 | | | | 10-16-2020 | | | | 5,000,000 | | | | 4,999,111 | |
| | | | |
Sumitomo Mitsui Trust Bank Limited 144A | | | 1.95 | | | | 9-19-2019 | | | | 7,000,000 | | | | 6,966,396 | |
| | | | |
Suncorp-Metway Limited 144A | | | 2.38 | | | | 11-9-2020 | | | | 4,000,000 | | | | 3,948,883 | |
| | | | |
Svenska Handelsbanken AB | | | 1.88 | | | | 9-7-2021 | | | | 7,000,000 | | | | 6,814,289 | |
| | | | |
UniCredit SpA 144A | | | 6.57 | | | | 1-14-2022 | | | | 5,615,000 | | | | 5,756,269 | |
| | | | |
| | | | | | | | | | | | | | | 101,740,625 | |
| | | | | | | | | | | | | | | | |
| | | | |
| Capital Markets: 0.66% | | | | | | | | | | | | | | | | |
| | | | |
BP Capital Markets plc | | | 1.68 | | | | 5-3-2019 | | | | 7,000,000 | | | | 6,988,309 | |
| | | | | | | | | | | | | | | | |
| | | | |
| Diversified Financial Services: 2.74% | | | | | | | | | | | | | | | | |
| | | | |
AerCap Ireland Capital DAC | | | 4.45 | | | | 12-16-2021 | | | | 3,590,000 | | | | 3,637,168 | |
| | | | |
Corporacion Andina de Fomento | | | 2.00 | | | | 5-10-2019 | | | | 8,000,000 | | | | 7,974,606 | |
| | | | |
General Electric Capital International Funding Company | | | 2.34 | | | | 11-15-2020 | | | | 10,027,000 | | | | 9,857,565 | |
| | | | |
UBS AG 144A | | | 2.20 | | | | 6-8-2020 | | | | 3,725,000 | | | | 3,687,340 | |
| | | | |
UBS AG | | | 2.38 | | | | 8-14-2019 | | | | 3,730,000 | | | | 3,724,700 | |
| | | | |
| | | | | | | | | | | | | | | 28,881,379 | |
| | | | | | | | | | | | | | | | |
| | | | |
| Insurance: 0.63% | | | | | | | | | | | | | | | | |
| | | | |
Axis Specialty Finance plc | | | 2.65 | | | | 4-1-2019 | | | | 6,641,000 | | | | 6,637,840 | |
| | | | | | | | | | | | | | | | |
| | | | |
Health Care: 1.31% | | | | | | | | | | | | | | | | |
| | | | |
| Pharmaceuticals: 1.31% | | | | | | | | | | | | | | | | |
| | | | |
Perrigo Finance Unlimited Company | | | 3.50 | | | | 3-15-2021 | | | | 2,665,000 | | | | 2,600,569 | |
| | | | |
Shire Acquisitions Investment Ireland Limited | | | 1.90 | | | | 9-23-2019 | | | | 2,880,000 | | | | 2,859,856 | |
| | | | |
Shire Acquisitions Investment Ireland Limited | | | 2.40 | | | | 9-23-2021 | | | | 2,520,000 | | | | 2,462,694 | |
| | | | |
Teva Pharmaceutical Finance BV | | | 1.70 | | | | 7-19-2019 | | | | 4,029,000 | | | | 4,004,613 | |
| | | | |
Teva Pharmaceutical Finance BV | | | 2.20 | | | | 7-21-2021 | | | | 1,965,000 | | | | 1,867,018 | |
| | | | |
| | | | | | | | | | | | | | | 13,794,750 | |
| | | | | | | | | | | | | | | | |
| | | | |
Industrials: 0.21% | | | | | | | | | | | | | | | | |
| | | | |
| Semiconductors & Semiconductor Equipment: 0.21% | | | | | | | | | | | | | | | | |
| | | | |
NXP BV 144A | | | 4.13 | | | | 6-1-2021 | | | | 2,215,000 | | | | 2,230,837 | |
| | | | | | | | | | | | | | | | |
| | | | |
Materials: 0.84% | | | | | | | | | | | | | | | | |
| | | | |
| Chemicals: 0.48% | | | | | | | | | | | | | | | | |
| | | | |
Syngenta Finance NV 144A | | | 3.70 | | | | 4-24-2020 | | | | 5,000,000 | | | | 5,011,593 | |
| | | | | | | | | | | | | | | | |
| | | | |
| Metals & Mining: 0.36% | | | | | | | | | | | | | | | | |
| | | | |
ArcelorMittal SA | | | 5.50 | | | | 3-1-2021 | | | | 3,660,000 | | | | 3,802,712 | |
| | | | | | | | | | | | | | | | |
| | | | |
Total Yankee Corporate Bonds and Notes (Cost $195,226,715) | | | | | | | | | | | | | | | 195,032,592 | |
| | | | | | | | | | | | | | | | |
The accompanying notes are an integral part of these financial statements.
| | | | |
| 20 | | Wells Fargo Ultra Short-Term Income Fund | | Portfolio of investments—February 28, 2019 (unaudited) |
| | | | | | | | | | | | | | | | |
| Security name | | Yield | | | | | | Shares | | | Value | |
| Short-Term Investments: 4.47% | | | | | | | | | | | | | | | | |
| | | | |
| Investment Companies: 4.28% | | | | | | | | | | | | | | | | |
| | | | |
Securities Lending Cash Investments LLC (l)(r)(u) | | | 2.56 | % | | | | | | | 798,658 | | | $ | 798,738 | |
| | | | |
Wells Fargo Government Money Market Fund Select Class (l)(u) | | | 2.34 | | | | | | | | 44,399,604 | | | | 44,399,604 | |
| | | | |
| | | | | | | | | | | | | | | 45,198,342 | |
| | | | | | | | | | | | | | | | |
| | | | |
| | | | | | Maturity date | | | Principal | | | | |
| U.S. Treasury Securities: 0.19% | | | | | | | | | | | | | | | | |
| | | | |
U.S. Treasury Bill (z)# | | | 2.21 | | | | 3-14-2019 | | | $ | 1,950,000 | | | | 1,948,344 | |
| | | | | | | | | | | | | | | | |
| | | | |
Total Short-Term Investments (Cost $47,146,669) | | | | | | | | | | | | | | | 47,146,686 | |
| | | | | | | | | | | | | | | | |
| | | | | | | | |
| Total investments in securities (Cost $1,051,682,064) | | | 99.50 | % | | | 1,050,339,847 | |
| | |
Other assets and liabilities, net | | | 0.50 | | | | 5,313,704 | |
| | | | | | | | |
| Total net assets | | | 100.00 | % | | $ | 1,055,653,551 | |
| | | | | | | | |
| 144A | The security may be resold in transactions exempt from registration, normally to qualified institutional buyers, pursuant to Rule 144A under the Securities Act of 1933. |
| ± | Variable rate investment. The rate shown is the rate in effect at period end. |
| ±± | The coupon of the security is adjusted based on the principal and interest payments received from the underlying pool of mortgages as well as the credit quality and the actual prepayment speed of the underlying mortgages. |
| ‡ | Security is valued using significant unobservable inputs. |
| « | All or a portion of this security is on loan. |
| (l) | The issuer of the security is an affiliated person of the Fund as defined in the Investment Company Act of 1940. |
| (r) | The investment is anon-registered investment company purchased with cash collateral received from securities on loan. |
| (u) | The rate represents the7-day annualized yield at period end. |
| (z) | Zero coupon security. The rate represents the current yield to maturity. |
| # | All or a portion of this security is segregated as collateral for investments in derivative instruments. |
Abbreviations:
| CDO | Collateralized debt obligation |
| FDIC | Federal Deposit Insurance Corporation |
| FHLMC | Federal Home Loan Mortgage Corporation |
| FNMA | Federal National Mortgage Association |
| GNMA | Government National Mortgage Association |
| LIBOR | London Interbank Offered Rate |
| REIT | Real estate investment trust |
Futures Contracts
| | | | | | | | | | | | | | | | | | | | | | | | |
| Description | | Number of
contracts | | | Expiration
date | | | Notional
cost | | | Notional
value | | | Unrealized
gains | | | Unrealized
losses | |
| | | | | | |
Short | | | | | | | | | | | | | | | | | | | | | | | | |
| | | | | | |
2-Year U.S. Treasury Notes | | | (1,337) | | | | 6-28-2019 | | | $ | (283,817,817 | ) | | $ | (283,705,132 | ) | | $ | 112,685 | | | $ | 0 | |
| | | | | | |
5-Year U.S. Treasury Notes | | | (24) | | | | 6-28-2019 | | | | (2,752,610 | ) | | | (2,749,500 | ) | | | 3,110 | | | | 0 | |
| | | | | | | | | | | | | | | | | | | | | | | | |
| | | | | | |
| | | | | | | | | | | | | | | | | | $ | 115,795 | | | $ | 0 | |
| | | | | | | | | | | | | | | | | | | | | | | | |
The accompanying notes are an integral part of these financial statements.
| | | | | | |
| Portfolio of investments—February 28, 2019 (unaudited) | | Wells Fargo Ultra Short-Term Income Fund | | | 21 | |
Investments in Affiliates
An affiliated investment is an investment in which the Fund owns at least 5% of the outstanding voting shares of the issuer or as a result of other relationships, such as the Fund and the issuer having the same investment manager. Transactions with issuers that were either affiliated persons of the Fund at the beginning of the period or the end of the period were as follows:
| | | | | | | | | | | | | | | | | | | | | | | | | | | | | | | | | | | | |
| | | Shares,
beginning of
period | | | Shares
purchased | | | Shares
sold | | | Shares,
end of
period | | | Net
realized
gains
(losses) | | | Net
change in
unrealized
gains
(losses) | | | Income
from
affiliated
securities | | | Value,
end
of period | | | % of
net
assets | |
Short-Term Investments | | | | | | | | | | | | | | | | | | | | | | | | | | | | | | | | | | | | |
Investment Companies | | | | | | | | | | | | | | | | | | | | | | | | | | | | | | | | | | | | |
Securities Lending Cash Investments LLC | | | 6,848,410 | | | | 25,603,690 | | | | 31,653,442 | | | | 798,658 | | | $ | 0 | | | $ | 0 | | | $ | 14,612 | | | $ | 798,738 | | | | | |
Wells Fargo Government Money Market Fund Select Class | | | 33,367,503 | | | | 332,282,960 | | | | 321,250,859 | | | | 44,399,604 | | | | 0 | | | | 0 | | | | 569,961 | | | | 44,399,604 | | | | | |
| | | | | | | | | | | | | | | | | | | | | | | | | | | | | | | | | | | | |
| | | | | | | | | |
| | | | | | | | | | | | | | | | | | $ | 0 | | | $ | 0 | | | $ | 584,573 | | | $ | 45,198,342 | | | | 4.28 | % |
| | | | | | | | | | | | | | | | | | | | | | | | | | | | | | | | | | | | |
The accompanying notes are an integral part of these financial statements.
| | | | |
| 22 | | Wells Fargo Ultra Short-Term Income Fund | | Statement of assets and liabilities—February 28, 2019 (unaudited) |
| | | | |
| | | | |
| |
Assets | | | | |
Investments in unaffiliated securities (including $781,556 of securities loaned), at value (cost $1,006,483,722) | | $ | 1,005,141,505 | |
Investments in affiliated securities, at value (cost $45,198,342) | | | 45,198,342 | |
Cash at broker | | | 10,168 | |
Receivable for investments sold | | | 3,708,051 | |
Principal paydown receivable | | | 142,960 | |
Receivable for Fund shares sold | | | 1,329,264 | |
Receivable for interest | | | 6,071,172 | |
Receivable for daily variation margin on open futures contracts | | | 117,972 | |
Receivable for securities lending income | | | 172 | |
| | | | |
Total assets | | | 1,061,719,606 | |
| | | | |
| |
Liabilities | | | | |
Payable for Fund shares redeemed | | | 3,657,335 | |
Dividends payable | | | 904,403 | |
Payable upon receipt of securities loaned | | | 798,738 | |
Management fee payable | | | 189,459 | |
Administration fees payable | | | 79,141 | |
Distribution fee payable | | | 3,166 | |
Trustees’ fees and expenses payable | | | 2,956 | |
Accrued expenses and other liabilities | | | 430,857 | |
| | | | |
Total liabilities | | | 6,066,055 | |
| | | | |
Total net assets | | $ | 1,055,653,551 | |
| | | | |
| |
NET ASSETS CONSIST OF | | | | |
Paid-in capital | | $ | 1,091,170,823 | |
Total distributable loss | | | (35,517,272 | ) |
| | | | |
Total net assets | | $ | 1,055,653,551 | |
| | | | |
| |
COMPUTATION OF NET ASSET VALUE AND OFFERING PRICE PER SHARE | | | | |
Net assets – Class A | | $ | 226,102,075 | |
Shares outstanding – Class A1 | | | 26,610,668 | |
Net asset value per share – Class A | | | $8.50 | |
Maximum offering price per share – Class A2 | | | $8.67 | |
Net assets – Class C | | $ | 4,906,714 | |
Shares outstanding – Class C1 | | | 578,130 | |
Net asset value per share – Class C | | | $8.49 | |
Net assets – Administrator Class | | $ | 13,635,230 | |
Shares outstanding – Administrator Class1 | | | 1,611,757 | |
Net asset value per share – Administrator Class | | | $8.46 | |
Net assets – Institutional Class | | $ | 811,009,532 | |
Shares outstanding – Institutional Class1 | | | 95,497,312 | |
Net asset value per share – Institutional Class | | | $8.49 | |
| 1 | The Fund has an unlimited number of authorized shares. |
| 2 | Maximum offering price is computed as 100/98 of net asset value. On investments of $50,000 or more, the offering price is reduced. |
The accompanying notes are an integral part of these financial statements.
| | | | | | |
| Statement of operations—six months ended February 28, 2019 (unaudited) | | Wells Fargo Ultra Short-Term Income Fund | | | 23 | |
| | | | |
| | | | |
| |
Investment income | | | | |
Interest (net of foreign interest withholding taxes of $1,924) | | $ | 12,521,683 | |
Income from affiliated securities | | | 579,248 | |
Dividends | | | 415,345 | |
| | | | |
Total investment income | | | 13,516,276 | |
| | | | |
| |
Expenses | | | | |
Management fee | | | 1,757,221 | |
Administration fees | | | | |
Class A | | | 183,897 | |
Class C | | | 4,448 | |
Administrator Class | | | 6,873 | |
Institutional Class | | | 302,871 | |
Shareholder servicing fees | | | | |
Class A | | | 287,340 | |
Class C | | | 6,949 | |
Administrator Class | | | 16,978 | |
Distribution fee | | | | |
Class C | | | 20,848 | |
Custody and accounting fees | | | 43,889 | |
Professional fees | | | 36,086 | |
Registration fees | | | 65,835 | |
Shareholder report expenses | | | 34,137 | |
Trustees’ fees and expenses | | | 10,728 | |
Other fees and expenses | | | 10,910 | |
| | | | |
Total expenses | | | 2,789,010 | |
Less: Fee waivers and/or expense reimbursements | | | (581,289 | ) |
| | | | |
Net expenses | | | 2,207,721 | |
| | | | |
Net investment income | | | 11,308,555 | |
| | | | |
| |
REALIZED AND UNREALIZED GAINS (LOSSES) ON INVESTMENTS | | | | |
| |
Net realized losses on: | | | | |
Unaffiliated securities | | | (361,079 | ) |
Futures contracts | | | (1,180,073 | ) |
| | | | |
Net realized losses on investments | | | (1,541,152 | ) |
| | | | |
| |
Net change in unrealized gains (losses) on: | | | | |
Unaffiliated securities | | | 5,243,997 | |
Futures contracts | | | 276,093 | |
| | | | |
Net change in unrealized gains (losses) on investments | | | 5,520,090 | |
| | | | |
Net realized and unrealized gains (losses) on investments | | | 3,978,938 | |
| | | | |
Net increase in net assets resulting from operations | | $ | 15,287,493 | |
| | | | |
The accompanying notes are an integral part of these financial statements.
| | | | |
| 24 | | Wells Fargo Ultra Short-Term Income Fund | | Statement of changes in net assets |
| | | | | | | | | | | | | | | | |
| | | Six months ended
February 28, 2019
(unaudited) | | | Year ended
August 31, 20181 | |
| | | | |
Operations | | | | | | | | | | | | | | | | |
Net investment income | | | | | | $ | 11,308,555 | | | | | | | $ | 20,741,167 | |
Net realized gains (losses) on investments | | | | | | | (1,541,152 | ) | | | | | | | 5,245,220 | |
Net change in unrealized gains (losses) on investments | | | | | | | 5,520,090 | | | | | | | | (8,633,812 | ) |
| | | | |
Net increase in net assets resulting from operations | | | | | | | 15,287,493 | | | | | | | | 17,352,575 | |
| | | | |
| | | | |
Distributions to shareholders from net investment income and net realized gains | | | | | | | | | | | | | | | | |
Class A | | | | | | | (2,268,052 | ) | | | | | | | (3,917,235 | ) |
Class C | | | | | | | (34,401 | ) | | | | | | | (37,856 | ) |
Administrator Class | | | | | | | (145,856 | ) | | | | | | | (394,368 | ) |
Institutional Class | | | | | | | (8,837,015 | ) | | | | | | | (16,292,768 | ) |
| | | | |
Total distributions to shareholders | | | | | | | (11,285,324 | ) | | | | | | | (20,642,227 | ) |
| | | | |
| | | | |
Capital share transactions | | | Shares | | | | | | | | Shares | | | | | |
Proceeds from shares sold | | | | | | | | | | | | | | | | |
Class A | | | 1,731,618 | | | | 14,655,251 | | | | 9,821,346 | | | | 83,149,259 | |
Class C | | | 293,792 | | | | 2,481,741 | | | | 132,182 | | | | 1,117,321 | |
Administrator Class | | | 152,055 | | | | 1,281,451 | | | | 5,167,624 | | | | 43,651,565 | |
Institutional Class | | | 44,581,420 | | | | 377,089,321 | | | | 96,798,778 | | | | 819,199,382 | |
| | | | |
| | | | |
| | | | | | | 395,507,764 | | | | | | | | 947,117,527 | |
| | | | |
Reinvestment of distributions | | | | | | | | | | | | | | | | |
Class A | | | 259,588 | | | | 2,198,863 | | | | 449,252 | | | | 3,800,963 | |
Class C | | | 4,017 | | | | 33,993 | | | | 4,431 | | | | 37,441 | |
Administrator Class | | | 17,275 | | | | 145,661 | | | | 46,300 | | | | 390,336 | |
Institutional Class | | | 459,250 | | | | 3,888,113 | | | | 710,263 | | | | 6,007,655 | |
| | | | |
| | | | |
| | | | | | | 6,266,630 | | | | | | | | 10,236,395 | |
| | | | |
Payment for shares redeemed | | | | | | | | | | | | | | | | |
Class A | | | (4,194,975 | ) | | | (35,505,616 | ) | | | (13,762,670 | ) | | | (116,485,682 | ) |
Class C | | | (317,655 | ) | | | (2,689,720 | ) | | | (218,323 | ) | | | (1,846,435 | ) |
Administrator Class | | | (341,727 | ) | | | (2,879,067 | ) | | | (6,654,246 | ) | | | (56,159,888 | ) |
Institutional Class | | | (37,577,289 | ) | | | (317,893,976 | ) | | | (134,706,249 | ) | | | (1,139,718,949 | ) |
| | | | |
| | | | |
| | | | | | | (358,968,379 | ) | | | | | | | (1,314,210,954 | ) |
| | | | |
Net increase (decrease) in net assets resulting from capital share transactions | | | | | | | 42,806,015 | | | | | | | | (356,857,032 | ) |
| | | | |
Total increase (decrease) in net assets | | | | | | | 46,808,184 | | | | | | | | (360,146,684 | ) |
| | | | |
| | | | |
Net assets | | | | | | | | | | | | | | | | |
Beginning of period | | | | | | | 1,008,845,367 | | | | | | | | 1,368,992,051 | |
| | | | |
End of period | | | | | | $ | 1,055,653,551 | | | | | | | $ | 1,008,845,367 | |
| | | | |
| 1 | Effective for all filings after November 4, 2018, the SEC prospectively eliminated the requirement to parenthetically disclose undistributed net investment income at the end of the period and permitted the aggregation of distributions, with the exception of tax basis returns of capital. Overdistributed net investment income at August 31, 2018 was $597,033. The disaggregated distributions information for the year ended August 31, 2018 is included in Note 8,Distributions to Shareholders, in the notes to the financial statements. |
The accompanying notes are an integral part of these financial statements.
| | | | | | |
| Financial highlights | | Wells Fargo Ultra Short-Term Income Fund | | | 25 | |
(For a share outstanding throughout each period)
| | | | | | | | | | | | | | | | | | | | | | | | |
| | | Six months ended
February 28, 2019 (unaudited) | | | Year ended August 31 | |
| CLASS A | | 2018 | | | 2017 | | | 2016 | | | 2015 | | | 2014 | |
Net asset value, beginning of period | | | $8.46 | | | | $8.48 | | | | $8.49 | | | | $8.46 | | | | $8.53 | | | | $8.53 | |
Net investment income | | | 0.08 | | | | 0.13 | | | | 0.09 | | | | 0.08 | | | | 0.05 | | | | 0.06 | |
Net realized and unrealized gains (losses) on investments | | | 0.04 | | | | (0.02 | ) | | | (0.01 | ) | | | 0.03 | | | | (0.06 | ) | | | 0.00 | |
| | | | | | | | | | | | | | | | | | | | | | | | |
Total from investment operations | | | 0.12 | | | | 0.11 | | | | 0.08 | | | | 0.11 | | | | (0.01 | ) | | | 0.06 | |
Distributions to shareholders from | | | | | | | | | | | | | | | | | | | | | | | | |
Net investment income | | | (0.08 | ) | | | (0.13 | ) | | | (0.09 | ) | | | (0.08 | ) | | | (0.05 | ) | | | (0.06 | ) |
Tax basis return of capital | | | 0.00 | | | | 0.00 | | | | 0.00 | | | | 0.00 | | | | (0.01 | ) | | | 0.00 | |
| | | | | | | | | | | | | | | | | | | | | | | | |
Total distributions to shareholders | | | (0.08 | ) | | | (0.13 | ) | | | (0.09 | ) | | | (0.08 | ) | | | (0.06 | ) | | | (0.06 | ) |
Net asset value, end of period | | | $8.50 | | | | $8.46 | | | | $8.48 | | | | $8.49 | | | | $8.46 | | | | $8.53 | |
Total return1 | | | 1.46 | % | | | 1.24 | % | | | 0.97 | % | | | 1.28 | % | | | (0.07 | )% | | | 0.74 | % |
Ratios to average net assets (annualized) | | | | | | | | | | | | | | | | | | | | | | | | |
Gross expenses | | | 0.80 | % | | | 0.80 | % | | | 0.79 | % | | | 0.79 | % | | | 0.77 | % | | | 0.78 | % |
Net expenses | | | 0.70 | % | | | 0.70 | % | | | 0.70 | % | | | 0.70 | % | | | 0.70 | % | | | 0.70 | % |
Net investment income | | | 1.97 | % | | | 1.47 | % | | | 1.09 | % | | | 0.93 | % | | | 0.64 | % | | | 0.70 | % |
Supplemental data | | | | | | | | | | | | | | | | | | | | | | | | |
Portfolio turnover rate | | | 19 | % | | | 55 | % | | | 56 | % | | | 51 | % | | | 70 | % | | | 47 | % |
Net assets, end of period (000s omitted) | | | $226,102 | | | | $243,909 | | | | $274,079 | | | | $319,565 | | | | $151,561 | | | | $196,459 | |
| 1 | Total return calculations do not include any sales charges. Returns for periods of less than one year are not annualized. |
The accompanying notes are an integral part of these financial statements.
| | | | |
| 26 | | Wells Fargo Ultra Short-Term Income Fund | | Financial highlights |
(For a share outstanding throughout each period)
| | | | | | | | | | | | | | | | | | | | | | | | |
| | | Six months ended
February 28, 2019 (unaudited) | | | Year ended August 31 | |
| CLASS C | | 2018 | | | 2017 | | | 2016 | | | 2015 | | | 2014 | |
Net asset value, beginning of period | | | $8.46 | | | | $8.47 | | | | $8.48 | | | | $8.45 | | | | $8.52 | | | | $8.52 | |
Net investment income (loss) | | | 0.05 | | | | 0.06 | | | | 0.02 | | | | 0.01 | | | | (0.01 | ) | | | (0.01 | ) |
Net realized and unrealized gains (losses) on investments | | | 0.03 | | | | (0.01 | ) | | | 0.00 | | | | 0.03 | | | | (0.06 | ) | | | 0.01 | |
| | | | | | | | | | | | | | | | | | | | | | | | |
Total from investment operations | | | 0.08 | | | | 0.05 | | | | 0.02 | | | | 0.04 | | | | (0.07 | ) | | | 0.00 | |
Distributions to shareholders from | | | | | | | | | | | | | | | | | | | | | | | | |
Net investment income | | | (0.05 | ) | | | (0.06 | ) | | | (0.03 | ) | | | (0.01 | ) | | | (0.00 | )1 | | | (0.00 | )1 |
Tax basis return of capital | | | 0.00 | | | | 0.00 | | | | 0.00 | | | | 0.00 | | | | (0.00 | )1 | | | 0.00 | |
| | | | | | | | | | | | | | | | | | | | | | | | |
Total distributions to shareholders | | | (0.05 | ) | | | (0.06 | ) | | | (0.03 | ) | | | (0.01 | ) | | | (0.00 | )1 | | | (0.00 | )1 |
Net asset value, end of period | | | $8.49 | | | | $8.46 | | | | $8.47 | | | | $8.48 | | | | $8.45 | | | | $8.52 | |
Total return2 | | | 0.96 | % | | | 0.60 | % | | | 0.22 | % | | | 0.52 | % | | | (0.81 | )% | | | 0.05 | % |
Ratios to average net assets (annualized) | | | | | | | | | | | | | | | | | | | | | | | | |
Gross expenses | | | 1.55 | % | | | 1.55 | % | | | 1.54 | % | | | 1.54 | % | | | 1.52 | % | | | 1.53 | % |
Net expenses | | | 1.45 | % | | | 1.45 | % | | | 1.45 | % | | | 1.45 | % | | | 1.45 | % | | | 1.45 | % |
Net investment income (loss) | | | 1.24 | % | | | 0.72 | % | | | 0.34 | % | | | 0.17 | % | | | (0.10 | )% | | | (0.05 | )% |
Supplemental data | | | | | | | | | | | | | | | | | | | | | | | | |
Portfolio turnover rate | | | 19 | % | | | 55 | % | | | 56 | % | | | 51 | % | | | 70 | % | | | 47 | % |
Net assets, end of period (000s omitted) | | | $4,907 | | | | $5,056 | | | | $5,760 | | | | $7,464 | | | | $7,642 | | | | $9,078 | |
| 1 | Amount is less than $0.005. |
| 2 | Total return calculations do not include any sales charges. Returns for periods of less than one year are not annualized. |
The accompanying notes are an integral part of these financial statements.
| | | | | | |
| Financial highlights | | Wells Fargo Ultra Short-Term Income Fund | | | 27 | |
(For a share outstanding throughout each period)
| | | | | | | | | | | | | | | | | | | | | | | | |
| | | Six months ended
February 28, 2019 (unaudited) | | | Year ended August 31 | |
| ADMINISTRATOR CLASS | | 2018 | | | 2017 | | | 2016 | | | 2015 | | | 2014 | |
Net asset value, beginning of period | | | $8.43 | | | | $8.45 | | | | $8.46 | | | | $8.42 | | | | $8.50 | | | | $8.50 | |
Net investment income | | | 0.09 | | | | 0.13 | | | | 0.10 | | | | 0.09 | | | | 0.07 | 1 | | | 0.07 | |
Net realized and unrealized gains (losses) on investments | | | 0.03 | | | | (0.01 | ) | | | (0.01 | ) | | | 0.04 | | | | (0.07 | ) | | | 0.01 | |
| | | | | | | | | | | | | | | | | | | | | | | | |
Total from investment operations | | | 0.12 | | | | 0.12 | | | | 0.09 | | | | 0.13 | | | | 0.00 | | | | 0.08 | |
Distributions to shareholders from | | | | | | | | | | | | | | | | | | | | | | | | |
Net investment income | | | (0.09 | ) | | | (0.14 | ) | | | (0.10 | ) | | | (0.09 | ) | | | (0.07 | ) | | | (0.08 | ) |
Tax basis return of capital | | | 0.00 | | | | 0.00 | | | | 0.00 | | | | 0.00 | | | | (0.01 | ) | | | 0.00 | |
| | | | | | | | | | | | | | | | | | | | | | | | |
Total distributions to shareholders | | | (0.09 | ) | | | (0.14 | ) | | | (0.10 | ) | | | (0.09 | ) | | | (0.08 | ) | | | (0.08 | ) |
Net asset value, end of period | | | $8.46 | | | | $8.43 | | | | $8.45 | | | | $8.46 | | | | $8.42 | | | | $8.50 | |
Total return2 | | | 1.42 | % | | | 1.39 | % | | | 1.12 | % | | | 1.55 | % | | | (0.04 | )% | | | 0.89 | % |
Ratios to average net assets (annualized) | | | | | | | | | | | | | | | | | | | | | | | | |
Gross expenses | | | 0.74 | % | | | 0.74 | % | | | 0.73 | % | | | 0.73 | % | | | 0.71 | % | | | 0.72 | % |
Net expenses | | | 0.55 | % | | | 0.55 | % | | | 0.55 | % | | | 0.55 | % | | | 0.55 | % | | | 0.55 | % |
Net investment income | | | 2.11 | % | | | 1.54 | % | | | 1.24 | % | | | 1.05 | % | | | 0.81 | % | | | 0.84 | % |
Supplemental data | | | | | | | | | | | | | | | | | | | | | | | | |
Portfolio turnover rate | | | 19 | % | | | 55 | % | | | 56 | % | | | 51 | % | | | 70 | % | | | 47 | % |
Net assets, end of period (000s omitted) | | | $13,635 | | | | $15,037 | | | | $27,245 | | | | $26,679 | | | | $44,682 | | | | $119,884 | |
| 1 | Calculated based upon average shares outstanding |
| 2 | Returns for periods of less than one year are not annualized. |
The accompanying notes are an integral part of these financial statements.
| | | | |
| 28 | | Wells Fargo Ultra Short-Term Income Fund | | Financial highlights |
(For a share outstanding throughout each period)
| | | | | | | | | | | | | | | | | | | | | | | | |
| | | Six months ended
February 28, 2019 (unaudited) | | | Year ended August 31 | |
| INSTITUTIONAL CLASS | | 2018 | | | 2017 | | | 2016 | | | 2015 | | | 2014 | |
Net asset value, beginning of period | | | $8.46 | | | | $8.48 | | | | $8.49 | | | | $8.45 | | | | $8.53 | | | | $8.52 | |
Net investment income | | | 0.10 | | | | 0.15 | | | | 0.12 | | | | 0.11 | | | | 0.08 | | | | 0.09 | |
Net realized and unrealized gains (losses) on investments | | | 0.03 | | | | (0.02 | ) | | | (0.01 | ) | | | 0.04 | | | | (0.07 | ) | | | 0.01 | |
| | | | | | | | | | | | | | | | | | | | | | | | |
Total from investment operations | | | 0.13 | | | | 0.13 | | | | 0.11 | | | | 0.15 | | | | 0.01 | | | | 0.10 | |
Distributions to shareholders from | | | | | | | | | | | | | | | | | | | | | | | | |
Net investment income | | | (0.10 | ) | | | (0.15 | ) | | | (0.12 | ) | | | (0.11 | ) | | | (0.08 | ) | | | (0.09 | ) |
Tax basis return of capital | | | 0.00 | | | | 0.00 | | | | 0.00 | | | | 0.00 | | | | (0.01 | ) | | | 0.00 | |
| | | | | | | | | | | | | | | | | | | | | | | | |
Total distributions to shareholders | | | (0.10 | ) | | | (0.15 | ) | | | (0.12 | ) | | | (0.11 | ) | | | (0.09 | ) | | | (0.09 | ) |
Net asset value, end of period | | | $8.49 | | | | $8.46 | | | | $8.48 | | | | $8.49 | | | | $8.45 | | | | $8.53 | |
Total return1 | | | 1.51 | % | | | 1.59 | % | | | 1.33 | % | | | 1.75 | % | | | 0.16 | % | | | 1.21 | % |
Ratios to average net assets (annualized) | | | | | | | | | | | | | | | | | | | | | | | | |
Gross expenses | | | 0.47 | % | | | 0.47 | % | | | 0.46 | % | | | 0.46 | % | | | 0.44 | % | | | 0.45 | % |
Net expenses | | | 0.35 | % | | | 0.35 | % | | | 0.35 | % | | | 0.35 | % | | | 0.35 | % | | | 0.35 | % |
Net investment income | | | 2.33 | % | | | 1.80 | % | | | 1.43 | % | | | 1.27 | % | | | 0.99 | % | | | 1.05 | % |
Supplemental data | | | | | | | | | | | | | | | | | | | | | | | | |
Portfolio turnover rate | | | 19 | % | | | 55 | % | | | 56 | % | | | 51 | % | | | 70 | % | | | 47 | % |
Net assets, end of period (000s omitted) | | | $811,010 | | | | $744,844 | | | | $1,061,908 | | | | $1,197,514 | | | | $1,137,808 | | | | $1,418,101 | |
| 1 | Returns for periods of less than one year are not annualized. |
The accompanying notes are an integral part of these financial statements.
| | | | | | |
| Notes to financial statements (unaudited) | | Wells Fargo Ultra Short-Term Income Fund | | | 29 | |
1. ORGANIZATION
Wells Fargo Funds Trust (the “Trust”), a Delaware statutory trust organized on March 10, 1999, is anopen-end management investment company registered under the Investment Company Act of 1940, as amended (the “1940 Act”). As an investment company, the Trust follows the accounting and reporting guidance in Financial Accounting Standards Board (“FASB”)Accounting Standards Codification Topic 946, Financial Services – Investment Companies. These financial statements report on the Wells Fargo Ultra Short-Term Income Fund (the “Fund”) which is a diversified series of the Trust.
2. SIGNIFICANT ACCOUNTING POLICIES
The following significant accounting policies, which are consistently followed in the preparation of the financial statements of the Fund, are in conformity with U.S. generally accepted accounting principles which require management to make estimates and assumptions that affect the reported amounts of assets and liabilities, disclosure of contingent assets and liabilities at the date of the financial statements, and the reported amounts of revenues and expenses during the reporting period. Actual results could differ from those estimates.
Securities valuation
All investments are valued each business day as of the close of regular trading on the New York Stock Exchange (generally 4 p.m. Eastern Time), although the Fund may deviate from this calculation time under unusual or unexpected circumstances.
Debt securities are valued at the evaluated bid price provided by an independent pricing service (e.g. taking into account various factors, including yields, maturities, or credit ratings) or, if a reliable price is not available, the quoted bid price from an independent broker-dealer.
Equity securities and futures contracts that are listed on a foreign or domestic exchange or market are valued at the official closing price or, if none, the last sales price. If no sale occurs on the principal exchange or market that day, a fair value price will be determined in accordance with the Fund’s Valuation Procedures.
Investments in registeredopen-end investment companies are valued at net asset value. Interests innon-registered investment companies that are redeemable at net asset value are fair valued normally at net asset value.
Investments which are not valued using any of the methods discussed above are valued at their fair value, as determined in good faith by the Board of Trustees of the Fund. The Board of Trustees has established a Valuation Committee comprised of the Trustees and has delegated to it the authority to take any actions regarding the valuation of portfolio securities that the Valuation Committee deems necessary or appropriate, including determining the fair value of portfolio securities, unless the determination has been delegated to the Wells Fargo Asset Management Pricing Committee at Wells Fargo Funds Management, LLC (“Funds Management”). The Board of Trustees retains the authority to make or ratify any valuation decisions or approve any changes to the Valuation Procedures as it deems appropriate. On a quarterly basis, the Board of Trustees receives reports on any valuation actions taken by the Valuation Committee or the Wells Fargo Asset Management Pricing Committee which may include items for ratification.
Securities lending
The Fund may lend its securities from time to time in order to earn additional income in the form of fees or interest on securities received as collateral or the investment of any cash received as collateral. The Fund continues to receive interest or dividends on the securities loaned. The Fund receives collateral in the form of cash or securities with a value at least equal to the value of the securities on loan. The value of the loaned securities is determined at the close of each business day and any additional required collateral is delivered to the Fund on the next business day. In a securities lending transaction, the net asset value of the Fund will be affected by an increase or decrease in the value of the securities loaned and by an increase or decrease in the value of the instrument in which collateral is invested. The amount of securities lending activity undertaken by the Fund fluctuates from time to time. In the event of default or bankruptcy by the borrower, the Fund may be prevented from recovering the loaned securities or gaining access to the collateral or may experience delays or costs in doing so. In addition, the investment of any cash collateral received may lose all or part of its value. The Fund has the right under the lending agreement to recover the securities from the borrower on demand.
The Fund lends its securities through an unaffiliated securities lending agent. Cash collateral received in connection with its securities lending transactions is invested in Securities Lending Cash Investments, LLC (the “Securities Lending Fund”). The Securities Lending Fund is exempt from registration under Section 3(c)(7) of the 1940 Act and is managed by Funds Management and is subadvised by Wells Capital Management Incorporated (“WellsCap”), an affiliate of Funds Management and an indirect wholly owned subsidiary of Wells Fargo & Company (“Wells Fargo”). Funds Management receives an advisory fee starting at 0.05% and declining to 0.01% as the average daily net assets of the Securities Lending Fund increase. All of the
| | | | |
| 30 | | Wells Fargo Ultra Short-Term Income Fund | | Notes to financial statements (unaudited) |
fees received by Funds Management are paid to WellsCap for its services as subadviser. The Securities Lending Fund seeks to provide a positive return compared to the daily Fed Funds Open Rate by investing in high-quality, U.S. dollar-denominated short-term money market instruments. Securities Lending Fund investments are valued at the evaluated bid price provided by an independent pricing service. Income earned from investment in the Securities Lending Fund (net of fees and rebates), if any, is included in income from affiliated securities on the Statement of Operations.
When-issued transactions
The Fund may purchase securities on a forward commitment or when-issued basis. The Fund records a when-issued transaction on the trade date and will segregate assets in an amount at least equal in value to the Fund’s commitment to purchase when-issued securities. Securities purchased on a when-issued basis aremarked-to-market daily and the Fund begins earning interest on the settlement date. Losses may arise due to changes in the market value of the underlying securities or if the counterparty does not perform under the contract.
Futures contracts
The Fund is subject to interest rate risk in the normal course of pursuing its investment objectives. Futures contracts are agreements between the Fund and a counterparty to buy or sell a specific amount of a commodity, financial instrument or currency at specified price and on a specified date. The Fund may buy and sell futures contracts in order to gain exposure to, or protect against, changes in interest rates. The primary risks associated with the use of futures contracts are the imperfect correlation between changes in market values of securities held by the Fund and the prices of futures contracts, and the possibility of an illiquid market. Futures contracts are generally entered into on a regulated futures exchange and cleared through a clearinghouse associated with the exchange. With futures contracts, there is minimal counterparty risk to the Fund since futures contracts are exchange traded and the exchange’s clearinghouse, as counterparty to all exchange traded futures, guarantees the futures contracts against default.
Upon entering into a futures contracts, the Fund is required to deposit either cash or securities (initial margin) with the broker in an amount equal to a certain percentage of the contract value. Subsequent payments (variation margin) are paid to or from the broker each day equal to the daily changes in the contract value. Such payments are recorded as unrealized gains or losses and, if any, shown as variation margin receivable (payable) in the Statement of Assets and Liabilities. Should the Fund fail to make requested variation margin payments, the broker can gain access to the initial margin to satisfy the Fund’s payment obligations. When the contracts are closed, a realized gain or loss is recorded in the Statement of Operations.
Security transactions and income recognition
Securities transactions are recorded on a trade date basis. Realized gains or losses are recorded on the basis of identified cost.
Interest income is accrued daily and bond discounts are accreted and premiums are amortized daily. To the extent debt obligations are placed onnon-accrual status, any related interest income may be reduced by writing off interest receivables when the collection of all or a portion of interest has been determined to be doubtful based on consistently applied procedures and the fair value has decreased. If the issuer subsequently resumes interest payments or when the collectability of interest is reasonably assured, the debt obligation is removed fromnon-accrual status.
Income is recorded net of foreign taxes withheld where recovery of such taxes is not assured.
Income dividends and capital gain distributions from investment companies are recorded on theex-dividend date. Capital gain distributions from investment companies are treated as realized gains.
Distributions to shareholders
Distributions to shareholders from net investment income are declared daily and paid monthly. Distributions from net realized gains, if any, are recorded on theex-dividend date and paid at least annually. Such distributions are determined in accordance with income tax regulations and may differ from U.S. generally accepted accounting principles. Dividend sources are estimated at the time of declaration. The tax character of distributions is determined as of the Fund’s fiscal year end. Therefore, a portion of the Fund’s distributions made prior to the Fund’s fiscal year end may be categorized as a tax return of capital at year end.
Federal and other taxes
The Fund intends to continue to qualify as a regulated investment company by distributing substantially all of its investment company taxable income and any net realized capital gains (after reduction for capital loss carryforwards) sufficient to relieve it from all, or substantially all, federal income taxes. Accordingly, no provision for federal income taxes was required.
| | | | | | |
| Notes to financial statements (unaudited) | | Wells Fargo Ultra Short-Term Income Fund | | | 31 | |
The Fund’s income and federal excise tax returns and all financial records supporting those returns for the prior three fiscal years are subject to examination by the federal and Delaware revenue authorities. Management has analyzed the Fund’s tax positions taken on federal, state, and foreign tax returns for all open tax years and does not believe that there are any uncertain tax positions that require recognition of a tax liability.
As of February 28, 2019, the aggregate cost of all investments for federal income tax purposes was $1,051,521,766 and the unrealized gains (losses) consisted of:
| | | | |
| |
Gross unrealized gains | | $ | 3,232,646 | |
| |
Gross unrealized losses | | | (4,298,770 | ) |
| |
Net unrealized losses | | $ | (1,066,124 | ) |
Capital loss carryforwards that do not expire are required to be utilized prior to capital loss carryforwards that expire. As of August 31, 2018, capital loss carryforwards available to offset future net realized capital gains were as follows through the indicated expiration dates:
| | | | |
| | | No expiration |
| 2019 | | Short-term | | Long-term |
| | |
| $7,448,920 | | $1,631,759 | | $23,255,515 |
Class allocations
The separate classes of shares offered by the Fund differ principally in applicable sales charges, distribution, shareholder servicing, and administration fees. Class specific expenses are charged directly to that share class. Investment income, common expenses, and realized and unrealized gains (losses) on investments are allocated daily to each class of shares based on the relative proportion of net assets of each class.
3. FAIR VALUATION MEASUREMENTS
Fair value measurements of investments are determined within a framework that has established a fair value hierarchy based upon the various data inputs utilized in determining the value of the Fund’s investments. The three-level hierarchy gives the highest priority to unadjusted quoted prices in active markets for identical assets or liabilities (Level 1) and the lowest priority to unobservable inputs (Level 3). The Fund’s investments are classified within the fair value hierarchy based on the lowest level of input that is significant to the fair value measurement. The inputs are summarized into three broad levels as follows:
| ∎ | | Level 1 – quoted prices in active markets for identical securities |
| ∎ | | Level 2 – other significant observable inputs (including quoted prices for similar securities, interest rates, prepayment speeds, credit risk, etc.) |
| ∎ | | Level 3 – significant unobservable inputs (including the Fund’s own assumptions in determining the fair value of investments) |
The inputs or methodologies used for valuing investments in securities are not necessarily an indication of the risk associated with investing in those securities.
| | | | |
| 32 | | Wells Fargo Ultra Short-Term Income Fund | | Notes to financial statements (unaudited) |
The following is a summary of the inputs used in valuing the Fund’s assets and liabilities as of February 28, 2019:
| | | | | | | | | | | | | | | | |
| | | | |
| | | Quoted prices
(Level 1) | | | Other significant
observable inputs
(Level 2) | | | Significant
unobservable inputs (Level 3) | | | Total | |
| | | | |
Assets | | | | | | | | | | | | | | | | |
Investments in: | | | | | | | | | | | | | | | | |
| | | | |
Agency securities | | $ | 0 | | | $ | 86,786,086 | | | $ | 0 | | | $ | 86,786,086 | |
| | | | |
Asset-backed securities | | | 0 | | | | 147,649,373 | | | | 0 | | | | 147,649,373 | |
| | | | |
Corporate bonds and notes | | | 0 | | | | 354,255,995 | | | | 0 | | | | 354,255,995 | |
| | | | |
Exchange-traded funds | | | 30,420,000 | | | | 0 | | | | 0 | | | | 30,420,000 | |
| | | | |
Municipal obligations | | | 0 | | | | 17,476,562 | | | | 0 | | | | 17,476,562 | |
| | | | |
Non-agency mortgage-backed securities | | | 0 | | | | 170,259,308 | | | | 1,313,245 | | | | 171,572,553 | |
| | | | |
Yankee corporate bonds and notes | | | 0 | | | | 195,032,592 | | | | 0 | | | | 195,032,592 | |
| | | | |
Short-term investments | | | | | | | | | | | | | | | | |
| | | | |
Investment companies | | | 44,399,604 | | | | 798,738 | | | | 0 | | | | 45,198,342 | |
| | | | |
U.S. Treasury securities | | | 1,948,344 | | | | 0 | | | | 0 | | | | 1,948,344 | |
| | | | |
| | | 76,767,948 | | | | 972,258,654 | | | | 1,313,245 | | | | 1,050,339,847 | |
| | | | |
Futures contracts | | | 115,795 | | | | 0 | | | | 0 | | | | 115,795 | |
| | | | |
Total assets | | $ | 76,883,743 | | | $ | 972,258,654 | | | $ | 1,313,245 | | | $ | 1,050,455,642 | |
Additional sector, industry or geographic detail is included in the Portfolio of Investments.
Futures contracts are reported at their cumulative unrealized gains (losses) at measurement date as reported in the table following the Portfolio of Investments. For futures contracts, the current day’s variation margin is reported on the Statement of Assets and Liabilities. All other assets and liabilities are reported at their market value at measurement date.
At February 28, 2019, the Fund did not have any transfers into/out of Level 3.
4. TRANSACTIONS WITH AFFILIATES
Management fee
Funds Management, an indirect wholly owned subsidiary of Wells Fargo, is the manager of the Fund and provides advisory and fund-level administrative services under an investment management agreement. Under the investment management agreement, Funds Management is responsible for, among other services, implementing the investment objectives and strategies of the Fund, supervising the subadviser and providing fund-level administrative services in connection with the Fund’s operations. As compensation for its services under the investment management agreement, Funds Management is entitled to receive a management fee at the following annual rate based on the Fund’s average daily net assets:
| | | | |
| Average daily net assets | | Annual fee rate | |
| |
First $1 billion | | | 0.350 | % |
| |
Next $4 billion | | | 0.325 | |
| |
Next $3 billion | | | 0.290 | |
| |
Next $2 billion | | | 0.265 | |
| |
Over $10 billion | | | 0.255 | |
For the six months ended February 28, 2019, the management fee was equivalent to an annual rate of 0.35% of the Fund’s average daily net assets.
Funds Management has retained the services of a subadviser to provide daily portfolio management to the Fund. The fee for subadvisory services is borne by Funds Management. WellsCap is the subadviser to the Fund and is entitled to receive a fee from Funds Management at an annual rate starting at 0.15% and declining to 0.05% as the average daily net assets of the Fund increase.
| | | | | | |
| Notes to financial statements (unaudited) | | Wells Fargo Ultra Short-Term Income Fund | | | 33 | |
Administration fees
Under a class-level administration agreement, Funds Management provides class-level administrative services to the Fund, which includes paying fees and expenses for services provided by the transfer agent,sub-transfer agents, omnibus account servicers and record-keepers. As compensation for its services under the class-level administration agreement, Funds Management receives an annual fee which is calculated based on the average daily net assets of each class as follows:
| | | | |
| | | Class-level
administration fee | |
| |
Class A, Class C | | | 0.16 | % |
| |
Administrator Class | | | 0.10 | |
| |
Institutional Class | | | 0.08 | |
Funds Management has contractually waived and/or reimbursed management and administration fees to the extent necessary to maintain certain net operating expense ratios for the Fund. When each class of the Fund has exceeded its expense cap, Funds Management has waived fees and/or reimbursed expenses from fund level expenses on a proportionate basis and then from class specific expenses. When only certain classes exceed their expense caps, waivers and/or reimbursements are applied against class specific expenses before fund level expenses. Funds Management has committed through December 31, 2019 to waive fees and/or reimburse expenses to the extent necessary to cap the Fund’s expenses at 0.70% for Class A shares, 1.45% for Class C shares, 0.55% for Administrator Class��shares, and 0.35% for Institutional Class shares. Prior to or after the commitment expiration date, the cap may be increased or the commitment to maintain the cap may be terminated only with the approval of the Board of Trustees.
Distribution fee
The Trust has adopted a distribution plan for Class C shares of the Fund pursuant to Rule12b-1 under the 1940 Act. A distribution fee is charged to Class C shares and paid to Wells Fargo Funds Distributor, LLC (“Funds Distributor”), the principal underwriter, at an annual rate of 0.75% of the average daily net assets of Class C shares.
In addition, Funds Distributor is entitled to receive thefront-end sales charge from the purchase of Class A shares and a contingent deferred sales charge on the redemption of certain Class A shares. Funds Distributor is also entitled to receive the contingent deferred sales charges from redemptions of Class C shares. For the six months ended February 28, 2019, Funds Distributor received $472 from the sale of Class A shares. No contingent deferred sales charges were incurred by Class A and Class C shares for the six months ended February 28, 2019.
Shareholder servicing fees
The Trust has entered into contracts with one or more shareholder servicing agents, whereby Class A, Class C, and Administrator Class of the Fund are charged a fee at an annual rate of 0.25% of the average daily net assets of each respective class. A portion of these total shareholder servicing fees were paid to affiliates of Wells Fargo.
Interfund transactions
The Fund may purchase or sell portfolio investment securities to certain other Wells Fargo affiliates pursuant toRule 17a-7 under the 1940 Act and under procedures adopted by the Board of Trustees. The procedures have been designed to ensure that these interfund transactions, which do not incur broker commissions, are effected at current market prices.
5. INVESTMENT PORTFOLIO TRANSACTIONS
Purchases and sales of investments, excluding short-term securities, for the six months ended February 28, 2019 were as follows:
| | | | | | |
Purchases at cost | | Sales proceeds |
U.S.
government | | Non-U.S.
government | | U.S.
government | | Non-U.S.
government |
| $7,557,270 | | $318,184,273 | | $5,044,279 | | $174,915,554 |
| | | | |
| 34 | | Wells Fargo Ultra Short-Term Income Fund | | Notes to financial statements (unaudited) |
6. DERIVATIVE TRANSACTIONS
During the six months ended February 28, 2019, the Fund entered into futures contracts to help manage duration. The Fund had an average notional amount of $264,416,859 in short futures contracts during the six months ended February 28, 2019.
7. BANK BORROWINGS
The Trust (excluding the money market funds), Wells Fargo Master Trust and Wells Fargo Variable Trust are parties to a $280,000,000 revolving credit agreement whereby the Fund is permitted to use bank borrowings for temporary or emergency purposes, such as to fund shareholder redemption requests. Interest under the credit agreement is charged to the Fund based on a borrowing rate equal to the higher of the Federal Funds rate in effect on that day plus 1.25% or the overnight LIBOR rate in effect on that day plus 1.25%. In addition, an annual commitment fee equal to 0.25% of the unused balance is allocated to each participating fund.
For the six months ended February 28, 2019, there were no borrowings by the Fund under the agreement.
8. DISTRIBUTIONS TO SHAREHOLDERS
Effective for all filings after November 4, 2018, the Securities and Exchange Commission eliminated the requirement to separately state the components of distributions to shareholders under U.S. generally accepted accounting principles. The amounts of distributions to shareholders for the year ended August 31, 2018 were as follows:
| | | | |
| | | Net investment
income | |
| |
Class A | | | $3,917,235 | |
| |
Class C | | | 37,856 | |
| |
Administrator Class | | | 394,368 | |
| |
Institutional Class | | | 16,292,768 | |
9. INDEMNIFICATION
Under the Trust’s organizational documents, the officers and Trustees have been granted certain indemnification rights against certain liabilities that may arise out of performance of their duties to the Trust. Additionally, in the normal course of business, the Trust may enter into contracts with service providers that contain a variety of indemnification clauses. The Trust’s maximum exposure under these arrangements is dependent on future claims that may be made against the Fund and, therefore, cannot be estimated.
10. NEW ACCOUNTING PRONOUNCEMENTS
In August 2018, FASB issued Accounting Standards Update (“ASU”)No. 2018-13, Fair Value Measurement (Topic 820)Disclosure Framework—Changes to the Disclosure Requirements for Fair Value Measurement. ASU2018-13 updates the disclosure requirements for fair value measurements by modifying or removing certain disclosures and adding certain new disclosures. The amendments are effective for fiscal years, and interim periods within those fiscal years, beginning after December 15, 2019. Early adoption is permitted. Management has adopted the removal and modification of disclosures early, as permitted, and will adopt the additional new disclosures at the effective date.
In March 2017, FASB issued ASUNo. 2017-08,Premium Amortization on Purchased Callable Debt Securities. ASU2017-08 shortens the amortization period for certain callable debt securities held at a premium. The amendments require the premium to be amortized to the earliest call date. The amendments do not require an accounting change for securities held at a discount; the discount continues to be amortized to maturity. ASU2017-08 is effective for fiscal years beginning after December 15, 2018 and for interim periods within those fiscal years. Management is currently evaluating the potential impact of this new guidance to the financial statements.
| | | | | | |
| Other information (unaudited) | | Wells Fargo Ultra Short-Term Income Fund | | | 35 | |
PROXY VOTING INFORMATION
A description of the policies and procedures used to determine how to vote proxies relating to portfolio securities is available, upon request, by calling1-800-222-8222, visiting our website atwfam.com, or visiting the SEC website at sec.gov. Information regarding how the Fund voted proxies relating to portfolio securities during the most recent12-month period ended June 30 is available on the Fund’s website atwfam.comor by visiting the SEC website at sec.gov.
PORTFOLIO HOLDINGS INFORMATION
The complete portfolio holdings for the Fund are publicly available monthly on the Fund’s website (wfam.com), on aone-month delayed basis. In addition, top ten holdings information (excluding derivative positions) for the Fund is publicly available on the Fund’s website on a monthly,seven-day or more delayed basis. The Fund files its complete schedule of portfolio holdings with the SEC for the first and third quarters of each fiscal year on FormN-Q, which is available by visiting the SEC website at sec.gov. In addition, the Fund’s FormN-Q may be reviewed and copied at the SEC’s Public Reference Room in Washington, DC, and at regional offices in New York City, at 233 Broadway, and in Chicago, at 175 West Jackson Boulevard, Suite 900. Information about the Public Reference Room may be obtained by calling1-800-SEC-0330.
| | | | |
| 36 | | Wells Fargo Ultra Short-Term Income Fund | | Other information (unaudited) |
BOARD OF TRUSTEES AND OFFICERS
Each of the Trustees and Officers1 listed in the table below acts in identical capacities for each fund in the Wells Fargo family of funds, which consists of 152 mutual funds comprising the Wells Fargo Funds Trust, Wells Fargo Variable Trust, Wells Fargo Master Trust and fourclosed-end funds (collectively the “Fund Complex”). This table should be read in conjunction with the Prospectus and the Statement of Additional Information2. The mailing address of each Trustee and Officer is 525 Market Street, 12th Floor, San Francisco, CA 94105. Each Trustee and Officer serves an indefinite term, however, each Trustee serves such term until reaching the mandatory retirement age established by the Trustees.
Independent Trustees
| | | | | | |
Name and
year of birth | | Position held and
length of service* | | Principal occupations during past five years or longer | | Current other
public company or
investment company
directorships |
| | | |
William R. Ebsworth (Born 1957) | | Trustee, since 2015 | | Retired. From 1984 to 2013, equities analyst, portfolio manager, research director and chief investment officer at Fidelity Management and Research Company in Boston, Tokyo, and Hong Kong, and retired in 2013 as Chief Investment Officer of Fidelity Strategic Advisers, Inc. where he led a team of investment professionals managing client assets. Prior thereto, Board member of Hong Kong Securities Clearing Co., Hong Kong Options Clearing Corp., the Thailand International Fund, Ltd., Fidelity Investments Life Insurance Company, and Empire Fidelity Investments Life Insurance Company. Board member of the Vincent Memorial Hospital Endowment(non-profit organization), where he serves on the Investment Committee and as a Chair of the Audit Committee. Mr. Ebsworth is a CFA® charterholder. | | N/A |
| | | |
Jane A. Freeman (Born 1953) | | Trustee, since 2015; Chair Liaison, since 2018 | | Retired. From 2012 to 2014 and 1999 to 2008, Chief Financial Officer of Scientific Learning Corporation. From 2008 to 2012, Ms. Freeman provided consulting services related to strategic business projects. Prior to 1999, Portfolio Manager at Rockefeller & Co. and Scudder, Stevens & Clark. Board member of the Harding Loevner Funds from 1996 to 2014, serving as both Lead Independent Director and chair of the Audit Committee. Board member of the Russell Exchange Traded Funds Trust from 2011 to 2012 and the chair of the Audit Committee. Ms. Freeman is a Board Member of The Ruth Bancroft Garden(non-profit organization). She is also an inactive Chartered Financial Analyst. | | N/A |
| | | |
Isaiah Harris, Jr.3 (Born 1952) | | Trustee, since 2009; Audit Committee Chairman, since 2019 | | Retired. Chairman of the Board of CIGNA Corporation since 2009, and Director since 2005. From 2003 to 2011, Director of Deluxe Corporation. Prior thereto, President and CEO of BellSouth Advertising and Publishing Corp. from 2005 to 2007, President and CEO of BellSouth Enterprises from 2004 to 2005 and President of BellSouth Consumer Services from 2000 to 2003. Emeritus member of the Iowa State University Foundation Board of Governors. Emeritus Member of the Advisory Board of Iowa State University School of Business. Advisory Board Member, Palm Harbor Academy (private school). Advisory Board Member, Child Evangelism Fellowship(non-profit). Mr. Harris is a certified public accountant (inactive status). | | CIGNA Corporation |
| | | |
Judith M. Johnson3 (Born 1949) | | Trustee, since 2008; Audit Committee Chairman, from 2009 to 2018 | | Retired. Prior thereto, Chief Executive Officer and Chief Investment Officer of Minneapolis Employees Retirement Fund from 1996 to 2008. Ms. Johnson is an attorney, certified public accountant and a certified managerial accountant. | | N/A |
| | | |
David F. Larcker (Born 1950) | | Trustee, since 2009 | | James Irvin Miller Professor of Accounting at the Graduate School of Business, Stanford University, Director of the Corporate Governance Research Initiative and Senior Faculty of The Rock Center for Corporate Governance since 2006. From 2005 to 2008, Professor of Accounting at the Graduate School of Business, Stanford University. Prior thereto, Ernst & Young Professor of Accounting at The Wharton School, University of Pennsylvania from 1985 to 2005. | | N/A |
| | | | | | |
| Other information (unaudited) | | Wells Fargo Ultra Short-Term Income Fund | | | 37 | |
| | | | | | |
Name and
year of birth | | Position held and
length of service* | | Principal occupations during past five years or longer | | Current other
public company or
investment company
directorships |
| | | |
Olivia S. Mitchell (Born 1953) | | Trustee, since 2006; Nominating and Governance Committee Chairman, since 2018 | | International Foundation of Employee Benefit Plans Professor, Wharton School of the University of Pennsylvania since 1993. Director of Wharton’s Pension Research Council and Boettner Center on Pensions & Retirement Research, and Research Associate at the National Bureau of Economic Research. Previously, Cornell University Professor from 1978 to 1993. | | N/A |
| | | |
Timothy J. Penny (Born 1951) | | Trustee, since 1996; Chairman, since 2018 | | President and Chief Executive Officer of Southern Minnesota Initiative Foundation, anon-profit organization, since 2007. Member of the Board of Trustees of NorthStar Education Finance, Inc., anon-profit organization, since 2007. | | N/A |
| | | |
James G. Polisson (Born 1959) | | Trustee, since 2018 | | Retired. Chief Marketing Officer, Source (ETF) UK Services, Ltd, from 2015 to 2017. From 2012 to 2015, Principal of The Polisson Group, LLC, a management consulting, corporate advisory and principal investing company. Chief Executive Officer and Managing Director at Russell Investments, Global Exchange Traded Funds from 2010 to 2012. Managing Director of Barclays Global Investors from 1998 to 2010 and Global Chief Marketing Officer for iShares and Barclays Global Investors from 2000 to 2010. Trustee of the San Francisco Mechanics’ Institute, anon-profit organization, from 2013 to 2015. Board member of the Russell Exchange Traded Fund Trust from 2011 to 2012. Director of Barclays Global Investors Holdings Deutschland GmbH from 2006 to 2009. Mr. Polisson is an attorney and has a retired status with the Massachusetts and District of Columbia Bar Associations. | | N/A |
| | | |
Pamela Wheelock (Born 1959) | | Trustee, since 2018 | | Chief Operating Officer, Twin Cities Habitat for Humanity, since January, 2017. Vice President of University Services, University of Minnesota from 2012 to 2017. Prior thereto, on the Board of Directors, Governance Committee and Finance Committee for the Minnesota Philanthropy Partners (Saint Paul Foundation) from 2012 to 2018, Interim President and Chief Executive Officer of Blue Cross Blue Shield of Minnesota from 2010 to 2011, Chairman of the Board from 2009 to 2011 and Board Director from 2003 to 2015. Vice President, Leadership and Community Engagement, Bush Foundation, Saint Paul, Minnesota (a private foundation) from 2009 to 2011. Executive Vice President and Chief Financial Officer, Minnesota Sports and Entertainment from 2004 to 2009 and Senior Vice President from 2002 to 2004. Commissioner of Finance, State of Minnesota, from 1999 to 2002. Currently the Board Chair of the Minnesota Wild Foundation since 2010. | | N/A |
| * | Length of service dates reflect the Trustee’s commencement of service with the Trust’s predecessor entities, where applicable. |
| | | | |
| 38 | | Wells Fargo Ultra Short-Term Income Fund | | Other information (unaudited) |
Officers
| | | | | | |
Name and
year of birth | | Position held and
length of service | | Principal occupations during past five years or longer | | |
| | | |
Andrew Owen (Born 1960) | | President, since 2017 | | Executive Vice President of Wells Fargo & Company and Head of Affiliated Managers, Wells Fargo Asset Management, since 2014. In addition, Mr. Owen is currently President, Chief Executive Officer and Director of Wells Fargo Funds Management, LLC since 2017. Prior thereto, Executive Vice President responsible for marketing, investments and product development for Wells Fargo Funds Management, LLC, from 2009 to 2014. | | |
| | | |
Nancy Wiser1 (Born 1967) | | Treasurer, since 2012 | | Executive Vice President of Wells Fargo Funds Management, LLC since 2011. Chief Operating Officer and Chief Compliance Officer at LightBox Capital Management LLC, from 2008 to 2011. | | |
| | | |
Alexander Kymn (Born 1973) | | Secretary and Chief Legal Officer, since 2018 | | Senior Company Counsel of Wells Fargo Bank, N.A. since 2018 (previously Senior Counsel from 2007 to 2018). Vice President of Wells Fargo Funds Management, LLC from 2008 to 2014. | | |
| | | |
Michael H. Whitaker (Born 1967) | | Chief Compliance Officer, since 2016 | | Senior Vice President and Chief Compliance Officer since 2016. Senior Vice President and Chief Compliance Officer for Fidelity Investments from 2007 to 2016. | | |
| | | |
David Berardi (Born 1975) | | Assistant Treasurer, since 2009 | | Vice President of Wells Fargo Funds Management, LLC since 2009. Vice President of Evergreen Investment Management Company, LLC from 2008 to 2010. Manager of Fund Reporting and Control for Evergreen Investment Management Company, LLC from 2004 to 2010. | | |
| | | |
Jeremy DePalma1 (Born 1974) | | Assistant Treasurer, since 2009 | | Senior Vice President of Wells Fargo Funds Management, LLC since 2009. Senior Vice President of Evergreen Investment Management Company, LLC from 2008 to 2010 and head of the Fund Reporting and Control Team within Fund Administration from 2005 to 2010. | | |
| 1 | Nancy Wiser acts as Treasurer of 76 funds in the Fund Complex. Jeremy DePalma acts as Treasurer of 76 funds and Assistant Treasurer of 76 funds in the Fund Complex. |
| 2 | The Statement of Additional Information includes additional information about the Trustees and is available, without charge, upon request, by calling1-800-222-8222 or by visiting the website atwfam.com. |
| 3 | Mr. Harris became Chairman of the Audit Committee effective January 1, 2019. |
| | | | | | |
| Appendix A (unaudited) | | Wells Fargo Ultra Short-Term Income Fund | | | 39 | |
SALES CHARGE REDUCTIONS AND WAIVERS FOR CERTAIN INTERMEDIARIES
Raymond James & Associates, Inc., Raymond James Financial Services & Raymond James affiliates (“Raymond James”)
Effective on or about March 1, 2019, shareholders purchasing Fund shares through a Raymond James platform or account will be eligible only for the following load waivers(front-end sales charge waivers and contingent deferred, orback-end, sales charge waivers) and discounts, which may differ from those disclosed elsewhere in the Fund’s Prospectus or SAI.
Front-end Sales Load Waivers on Class A shares Available at Raymond James
| | • | | Shares purchased in an investment advisory program. |
| | • | | Shares purchased through reinvestment of capital gains distributions and dividend reinvestment when purchasing shares of the same fund (but not any other fund within the fund family). |
| | • | | Employees and registered representatives of Raymond James or its affiliates and their family members as designated by Raymond James. |
| | • | | Shares purchased from the proceeds of redemptions within the same fund family, provided (1) the repurchase occurs within 90 days following the redemption, (2) the redemption and purchase occur in the same account, and (3) redeemed shares were subject to afront-end or deferred sales load (known as Rights of Reinstatement). |
| | • | | A shareholder in the fund’s Class C shares will have their shares automatically exchanged at net asset value to Class A shares (or the appropriate share class) of the fund if the shares are no longer subject to a CDSC and the exchange is in line with the policies and procedures of Raymond James. |
CDSC Waivers on Class A and C Shares Available at Raymond James
| | • | | Death or disability of the shareholder. |
| | • | | Shares sold as part of a systematic withdrawal plan as described in the Fund’s Prospectus. |
| | • | | Return of excess contributions from an IRA Account. |
| | • | | Shares sold as part of a required minimum distribution for IRA and retirement accounts due to the shareholder reaching age 70½ as described in the Fund’s prospectus. |
| | • | | Shares sold to pay Raymond James fees but only if the transaction is initiated by Raymond James. |
| | • | | Shares acquired through a right of reinstatement. |
Front-end Load Discounts Available at Raymond James: Breakpoints, and/or Rights of Accumulation
| | • | | Breakpoints as described in the Fund’s Prospectus. |
| | • | | Rights of accumulation which entitle shareholders to breakpoint discounts will be automatically calculated based on the aggregated holding of fund family assets held by accounts within the purchaser’s household at Raymond James. Eligible fund family assets not held at Raymond James may be included in the rights of accumulation calculation only if the shareholder notifies his or her financial advisor about such assets. |
This page is intentionally left blank.

For more information
More information about Wells Fargo Funds is available free upon request. To obtain literature, please write, visit the Fund’s website, or call:
Wells Fargo Funds
P.O. Box 219967
Kansas City, MO 64121-9967
Website: wfam.com
Individual investors: 1-800-222-8222
Retail investment professionals: 1-888-877-9275
Institutional investment professionals: 1-866-765-0778
This report and the financial statements contained herein are submitted for the general information of the shareholders of the Fund. If this report is used for promotional purposes, distribution of the report must be accompanied or preceded by a current prospectus. Before investing, please consider the investment objectives, risks, charges, and expenses of the investment. For a current prospectus and, if available, a summary prospectus, containing this information, call1-800-222-8222 or visit the Fund’s website atwfam.com. Read the prospectus carefully before you invest or send money.
Wells Fargo Asset Management (WFAM) is the trade name for certain investment advisory/management firms owned by Wells Fargo & Company. These firms include but are not limited to Wells Capital Management Incorporated and Wells Fargo Funds Management, LLC. Certain products managed by WFAM entities are distributed by Wells Fargo Funds Distributor, LLC (a broker-dealer and Member FINRA).
This material is for general informational and educational purposes only and is NOT intended to provide investment advice or a recommendation of any kind—including a recommendation for any specific investment, strategy, or plan.
INVESTMENT PRODUCTS: NOT FDIC INSURED ◾ NO BANK GUARANTEE ◾ MAY LOSE VALUE
© 2019 Wells Fargo Funds Management, LLC. All rights reserved.
| | |
 | | 321631 04-19 SA223/SAR223 02-19 |
Semi-Annual Report
February 28, 2019

Wells Fargo
Adjustable Rate Government Fund

Beginning on January 1, 2021, as permitted by new regulations adopted by the Securities and Exchange Commission, paper copies of the Wells Fargo Funds’ annual and semi-annual shareholder reports issued after this date will no longer be sent by mail, unless you specifically request paper copies of the reports. Instead, the reports will be made available on the Funds’ website, and you will be notified by mail each time a report is posted and provided with a website address to access the report.
If you already elected to receive shareholder reports electronically, you will not be affected by this change and you need not take any action. You may elect to receive shareholder reports and other communications from the Fund electronically at any time by contacting your financial intermediary (such as a broker-dealer or bank) or, if you are a direct investor, by calling 1-800-222-8222 or by enrolling at wellsfargo.com/advantagedelivery.
You may elect to receive all future reports in paper free of charge. If you invest through a financial intermediary, you can contact your financial intermediary to request that you continue to receive paper copies of your shareholder reports; if you invest directly with the Fund, you can call 1-800-222-8222. Your election to receive reports in paper will apply to all Wells Fargo Funds held in your account with your financial intermediary or, if you are a direct investor, to all Wells Fargo Funds that you hold.

Reduce clutter. Save trees.
Sign up for electronic delivery of prospectuses and shareholder reports atwellsfargo.com/advantagedelivery
Contents
The views expressed and any forward-looking statements are as of February 28, 2019, unless otherwise noted, and are those of the Fund managers and/or Wells Fargo Funds Management, LLC. Discussions of individual securities, or the markets generally, or any Wells Fargo Fund are not intended as individual recommendations. Future events or results may vary significantly from those expressed in any forward-looking statements. The views expressed are subject to change at any time in response to changing circumstances in the market. Wells Fargo Funds Management, LLC and the Fund disclaim any obligation to publicly update or revise any views expressed or forward-looking statements.
INVESTMENT PRODUCTS: NOT FDIC INSURED ◾ NO BANK GUARANTEE ◾ MAY LOSE VALUE
| | | | |
| 2 | | Wells Fargo Adjustable Rate Government Fund | | Letter to shareholders (unaudited) |

Andrew Owen
President
Wells Fargo Funds
Favorable third-quarter economic indicators and corporate earnings reports encouraged domestic stock investors.
Dear Shareholder:
We are pleased to offer you this semi-annual report for the Wells Fargo Adjustable Rate Government Fund for thesix-month period that ended February 28, 2019. Higher short-term interest rates, inflation concerns, trade tensions, slowing economic growth outside the U.S., and geopolitical events contributed to investment market volatility throughout the period.
For the period, U.S. stocks, as measured by the S&P 500 Index,1 fell 3.04% and international stocks, as measured by the MSCI ACWI ex USA Index (Net),2 declined 2.47%. Based on the MSCI EM Index (Net),3 emerging market stocks gained 0.33%. For bond investors, the Bloomberg Barclays U.S. Aggregate Bond Index4 added 1.99% while the Bloomberg Barclays Global Aggregateex-USD Index5 gained 0.63%. The Bloomberg Barclays Municipal Bond Index6 added 2.34%, and the ICE BofAML U.S. High Yield Index7 advanced 1.98%.
Investors appeared to shake off lingering concerns during the third quarter.
Favorable third-quarter economic indicators and corporate earnings reports encouraged domestic stock investors. U.S. trade negotiations with Mexico and Canada progressed. The Conference Board Consumer Confidence Index®8 reached its highest level in 18 years during September 2018. The U.S. Federal Reserve (Fed) raised the federal funds rate by 25 basis points (bps; 100 bps equal 1.00%) to a target range of between 2.00% and 2.25% in September 2018. For the quarter that ended September 30, 2018, the S&P 500 Index added 7.71%.
Investors in international markets were not as confident. Tensions between the U.S. and China increased. The U.S. imposed $200 billion in tariffs on Chinese goods. China reacted with $60 billion in tariffs on U.S. goods. Economic growth in China caused concern. The Bank of England (BOE) raised its monetary policy rate to 0.75% in August. During the quarter, the MSCI ACWI ex USA Index (Net) gained 0.71%. The MSCI EM Index (Net) declined 1.09%. In fixed-income markets, U.S. bonds were flat, as measured by the Bloomberg Barclays U.S. Aggregate Bond Index. The Bloomberg Barclays Global Aggregateex-USD Index fell 1.74%.
| 1 | The S&P 500 Index consists of 500 stocks chosen for market size, liquidity, and industry group representation. It is a market-value-weighted index with each stock’s weight in the index proportionate to its market value. You cannot invest directly in an index. |
| 2 | The Morgan Stanley Capital International (MSCI) All Country World Index (ACWI) ex USA Index (Net) is a free-float-adjusted market-capitalization-weighted index that is designed to measure the equity market performance of developed markets, excluding the United States and Canada. Source: MSCI. MSCI makes no express or implied warranties or representations and shall have no liability whatsoever with respect to any MSCI data contained herein. The MSCI data may not be further redistributed or used as a basis for other indices or any securities or financial products. This report is not approved, reviewed, or produced by MSCI. You cannot invest directly in an index. |
| 3 | The MSCI Emerging Markets (EM) Index (Net) is a free-float-adjusted market-capitalization-weighted index that is designed to measure large- andmid-cap equity market performance of emerging markets. The MSCI EM Index (Net) consists of the following 24 emerging market country indices: Brazil, Chile, China, Colombia, Czech Republic, Egypt, Greece, Hungary, India, Indonesia, Korea, Malaysia, Mexico, Pakistan, Peru, the Philippines, Poland, Qatar, Russia, South Africa, Taiwan, Thailand, Turkey, and the United Arab Emirates. You cannot invest directly in an index. |
| 4 | The Bloomberg Barclays U.S. Aggregate Bond Index is a broad-based benchmark that measures the investment-grade, U.S. dollar-denominated, fixed-rate taxable bond market, including Treasuries, government-related and corporate securities, mortgage-backed securities (agency fixed-rate and hybrid adjustable-rate mortgage pass-throughs), asset-backed securities, and commercial mortgage-backed securities. You cannot invest directly in an index. |
| 5 | The Bloomberg Barclays Global Aggregateex-USD Index is an unmanaged index that provides a broad-based measure of the global investment-grade fixed-income markets excluding the U.S. dollar-denominated debt market. You cannot invest directly in an index. |
| 6 | The Bloomberg Barclays Municipal Bond Index is an unmanaged index composed of long-termtax-exempt bonds with a minimum credit rating of Baa. You cannot invest directly in an index. |
| 7 | The ICE BofAML U.S. High Yield Index is a market-capitalization-weighted index of domestic and Yankee high-yield bonds. The index tracks the performance of high-yield securities traded in the U.S. bond market. You cannot invest directly in an index. Copyright 2019. ICE Data Indices, LLC. All rights reserved. |
| 8 | The Conference Board Consumer Confidence Index® measures the degree of optimism on the state of the U.S. economy that consumers are expressing through their activities of savings and spending. You cannot invest directly in an index. |
| | | | | | |
| Letter to shareholders (unaudited) | | Wells Fargo Adjustable Rate Government Fund | | | 3 | |
Conflicting data unsettled markets during the fourth quarter.
November’s U.S. midterm elections shifted control of the House of Representatives from Republicans to Democrats, presaging potential partisan clashes. Third-quarter U.S. gross domestic product (GDP) was announced at an annualized 3.4% rate, lower than the second-quarter rate. Brexit efforts stalled ahead of the March 2019 deadline. The People’s Bank of China cut reserve requirement ratios, accelerated infrastructure spending, and cut taxes even as the value of the yuan declined to low levels last seen in 2008.
December’s S&P 500 Index performance was the worst since 1931. Globally,fixed-income investments fared better than stocks during the last two months of the year. The Fed increased the federal funds rate by 25 bps in December 2018 to a target range of between 2.25% and 2.50% and softened its outlook for 2019 rate increases.
The market climbs a wall of worry.
Investors entered 2019 with reasons to be concerned. A partial U.S. government shutdown driven by partisan spending and immigration policy disputes extended into January. Investors expected high levels of stock market volatility to continue based on the VIX9.
January’s returns tended to support the investing adage that markets climb a wall of worry. The S&P 500 Index gained 8.01% for the month that ended January 31, 2019, its best monthly performance in 30 years. Returns for the MSCI ACWI ex USA Index (Net), the Bloomberg Barclays U.S. Aggregate Bond Index, and the Bloomberg Barclays Global Aggregateex-USD Index also were positive.
In February, concerns over slowing global growth reemerged. The Bureau of Economic Analysis announced fourth-quarter 2018 GDP grew at an annualized 2.2% rate, down from the 4.2% annualized rate for the second quarter and the 3.4% annualized rate for the third quarter. Analysts attributed the lower growth rate to a slowing housing market and larger trade deficit. The U.S. Labor Department said that the economy created just 20,000 jobs in February. In a February report, the BOE forecast the slowest growth since the financial crisis for 2019. China and the U.S., while putting future tariffs on hold for the time being, continued to wrangle over trade issues.
Don’t let short-term uncertainty derail long-term investment goals.
Periods of investment uncertainty can present challenges, but experience has taught us that maintaining long-term investment goals can be an effective way to plan for the future. To help you create a sound strategy based on your personal goals and risk tolerance, Wells Fargo Funds offers more than 100 mutual funds spanning a wide range of asset classes and investment styles. Although diversification cannot guarantee an investment profit or prevent losses, we believe it can be an effective way to manage investment risk and potentially smooth out overall portfolio performance. We encourage investors to know their investments and to understand that appropriate levels of risk-taking may unlock opportunities.
January’s returns tended to support the investing adage that markets climb a wall of worry.
| 9 | The Chicago Board Options Exchange Market Volatility Index (VIX) is a popular measure of the implied volatility of S&P 500 Index options. It represents one measure of the market’s expectation of stock market volatility over the next30-day period. You cannot invest directly in an index. |
| | | | |
| 4 | | Wells Fargo Adjustable Rate Government Fund | | Letter to shareholders (unaudited) |
Thank you for choosing to invest with Wells Fargo Funds. We appreciate your confidence in us and remain committed to helping you meet your financial needs.
Sincerely,

Andrew Owen
President
Wells Fargo Funds
For further information about your Fund, contact your investment professional, visit our website atwfam.com, or call us directly at1-800-222-8222.
This page is intentionally left blank.
| | | | |
| 6 | | Wells Fargo Adjustable Rate Government Fund | | Performance highlights (unaudited) |
Investment objective
The Fund seeks current income consistent with capital preservation.
Manager
Wells Fargo Funds Management, LLC
Subadviser
Wells Capital Management Incorporated
Portfolio managers
Christopher Y. Kauffman, CFA®‡
Michal Stanczyk
Average annual total returns (%) as of February 28, 20191
| | | | | | | | | | | | | | | | | | | | | | | | | | | | | | | | | | |
| | | | | Including sales charge | | | Excluding sales charge | | | Expense ratios2 (%) | |
| | | Inception date | | 1 year | | | 5 year | | | 10 year | | | 1 year | | | 5 year | | | 10 year | | | Gross | | | Net3 | |
| | | | | | | | | |
| Class A (ESAAX) | | 6-30-2000 | | | -0.39 | | | | 0.12 | | | | 1.21 | | | | 1.61 | | | | 0.53 | | | | 1.42 | | | | 0.83 | | | | 0.74 | |
| | | | | | | | | |
| Class C (ESACX) | | 6-30-2000 | | | -0.26 | | | | -0.25 | | | | 0.65 | | | | 0.74 | | | | -0.25 | | | | 0.65 | | | | 1.58 | | | | 1.49 | |
| | | | | | | | | |
| Administrator Class (ESADX)4 | | 7-30-2010 | | | – | | | | – | | | | – | | | | 1.64 | | | | 0.67 | | | | 1.56 | | | | 0.77 | | | | 0.60 | |
| | | | | | | | | |
| Institutional Class (EKIZX) | | 10-1-1991 | | | – | | | | – | | | | – | | | | 1.78 | | | | 0.81 | | | | 1.69 | | | | 0.50 | | | | 0.46 | |
| | | | | | | | | |
| Bloomberg Barclays6-Month Treasury Bill Index5 | | – | | | – | | | | – | | | | – | | | | 2.16 | | | | 0.87 | | | | 0.59 | | | | – | | | | – | |
Figures quoted represent past performance, which is no guarantee of future results, and do not reflect taxes that a shareholder may pay on fund distributions or the redemption of fund shares. Investment return and principal value of an investment will fluctuate so that an investor’s shares, when redeemed, may be worth more or less than their original cost. Performance shown without sales charges would be lower if sales charges were reflected. Current performance may be lower or higher than the performance data quoted, which assumes the reinvestment of dividends and capital gains. Currentmonth-end performance is available on the Fund’s website,wfam.com.
Index returns do not include transaction costs associated with buying and selling securities, any mutual fund fees or expenses, or any taxes. It is not possible to invest directly in an index.
For Class A shares, the maximumfront-end sales charge is 2.00%. For Class C shares, the maximum contingent deferred sales charge is 1.00%. Performance including a contingent deferred sales charge assumes the sales charge for the corresponding time period. Administrator Class and Institutional Class shares are sold without afront-end sales charge or contingent deferred sales charge.
Bond values fluctuate in response to the financial condition of individual issuers, general market and economic conditions, and changes in interest rates. Changes in market conditions and government policies may lead to periods of heightened volatility in the bond market and reduced liquidity for certain bonds held by the Fund. In general, when interest rates rise, bond values fall and investors may lose principal value. Interest rate changes and their impact on the Fund and its share price can be sudden and unpredictable. The use of derivatives may reduce returns and/or increase volatility. Securities issued by U.S. government agencies or government-sponsored entities may not be guaranteed by the U.S. Treasury. Certain investment strategies tend to increase the total risk of an investment (relative to the broader market). The Fund is exposed to mortgage- and asset-backed securities risk. The U.S. government guarantee applies to certain underlying securities and not to shares of the Fund. Consult the Fund’s prospectus for additional information on these and other risks.
Please see footnotes on page 7.
| | | | | | |
| Performance highlights (unaudited) | | Wells Fargo Adjustable Rate Government Fund | | | 7 | |
| | | | |
| Ten largest holdings (%) as of February 28, 20196 | |
| |
FNMA Series 2002-66 Class A3, 4.34%, 4-25-2042 | | | 2.31 | |
| |
FNMA Series 2004-W15 Class 3A, 4.40%, 6-25-2044 | | | 1.72 | |
| |
GNMA Series 2017-H11 Class FE, 2.84%, 5-20-2067 | | | 1.53 | |
| |
FNMA Series 2006-W01 Class 3A, 4.26%, 10-25-2045 | | | 1.38 | |
| |
FNMA Series 2004-W12 Class 2A, 4.32%, 6-25-2044 | | | 1.36 | |
| |
FHLMC Series T-67 Class 1A1C, 3.93%, 3-25-2036 | | | 1.32 | |
| |
FNMA Series 2001-T12 Class A4, 4.53%, 8-25-2041 | | | 1.19 | |
| |
FNMA Series 2003-W18 Class 2A, 4.30%, 6-25-2043 | | | 1.10 | |
| |
FHLMC Series T-67 Class 2A1C, 3.61%, 3-25-2036 | | | 1.09 | |
| |
FHLMC Series T-62 Class 1A1, 3.53%, 10-25-2044 | | | 1.02 | |
|
| Portfolio composition as of February 28, 20197 |
|
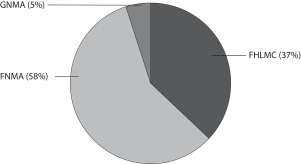
|
| ‡ | CFA®and Chartered Financial Analyst® are trademarks owned by CFA Institute. |
| 1 | Historical performance shown for all classes of the Fund prior to July 12, 2010, is based on the performance of the Fund’s predecessor, Evergreen Adjustable Rate Fund. |
| 2 | Reflects the expense ratios as stated in the most recent prospectuses. The expense ratios shown are subject to change and may differ from the annualized expense ratios shown in the financial highlights of this report. |
| 3 | The manager has contractually committed through December 31, 2019, to waive fees and/or reimburse expenses to the extent necessary to cap the expenses of each class after fee waivers at the amounts shown. Brokerage commissions, stamp duty fees, interest, taxes, acquired fund fees and expenses (if any), and extraordinary expenses are excluded from the expense cap. Prior to or after the commitment expiration date, the cap may be increased or the commitment to maintain the cap may be terminated only with the approval of the Board of Trustees. Without this cap, the Fund’s returns would have been lower. The expense ratio paid by an investor is the net expense ratio (the total annual fund operating expenses after fee waivers) as stated in the prospectuses. |
| 4 | Historical performance shown for Administrator Class shares prior to their inception reflects the performance of Institutional Class shares, adjusted to reflect the higher expenses applicable to Administrator Class shares. |
| 5 | The Bloomberg Barclays6-Month Treasury Bill Index tracks the performance and attributes of recently issued6-Month U.S. Treasury bills. The index follows Bloomberg Barclays’ monthly rebalancing conventions. You cannot invest directly in an index. |
| 6 | The ten largest holdings, excluding cash, cash equivalents and any money market funds, are calculated based on the value of the investments divided by total net assets of the Fund. Holdings are subject to change and may have changed since the date specified. |
| 7 | Amounts are calculated based on the total long-term investments of the Fund. These amounts are subject to change and may have changed since the date specified. |
| | | | |
| 8 | | Wells Fargo Adjustable Rate Government Fund | | Fund expenses (unaudited) |
As a shareholder of the Fund, you incur two types of costs: (1) transaction costs, including sales charges (loads) on management fees, distribution(12b-1) and/or shareholder servicing fees, and other Fund expenses. This example is purchase payments and contingent deferred sales charges (if any) on redemptions and (2) ongoing costs, including intended to help you understand your ongoing costs (in dollars) of investing in the Fund and to compare these costs with the ongoing costs of investing in other mutual funds.
The example is based on an investment of $1,000 invested at the beginning of thesix-month period and held for the entire period from September 1, 2018 to February 28, 2019.
Actual expenses
The “Actual” line of the table below provides information about actual account values and actual expenses. You may use the information in this line, together with the amount you invested, to estimate the expenses that you paid over the period. Simply divide your account value by $1,000 (for example, an $8,600 account value divided by $1,000 = 8.6), then multiply the result by the number in the “Actual” line under the heading entitled “Expenses paid during period” for your applicable class of shares to estimate the expenses you paid on your account during this period.
Hypothetical example for comparison purposes
The “Hypothetical” line of the table below provides information about hypothetical account values and hypothetical expenses based on the Fund’s actual expense ratio and an assumed rate of return of 5% per year before expenses, which is not the Fund’s actual return. The hypothetical account values and expenses may not be used to estimate the actual ending account balance or expenses you paid for the period. You may use this information to compare the ongoing costs of investing in the Fund and other funds. To do so, compare this 5% hypothetical example with the 5% hypothetical examples that appear in the shareholder reports of the other funds.
Please note that the expenses shown in the table are meant to highlight your ongoing costs only and do not reflect any transactional costs, such as sales charges (loads) and contingent deferred sales charges. Therefore, the “Hypothetical” line of the table is useful in comparing ongoing costs only and will not help you determine the relative total costs of owning different funds. In addition, if these transactional costs were included, your costs would have been higher.
| | | | | | | | | | | | | | | | |
| | | Beginning
account value
9-1-2018 | | | Ending
account value
2-28-2019 | | | Expenses
paid during
the period¹ | | | Annualized net expense ratio | |
Class A | | | | | | | | | | | | | | | | |
| | | | |
Actual | | $ | 1,000.00 | | | $ | 1,009.82 | | | $ | 3.69 | | | | 0.74 | % |
| | | | |
Hypothetical (5% return before expenses) | | $ | 1,000.00 | | | $ | 1,021.12 | | | $ | 3.71 | | | | 0.74 | % |
Class C | | | | | | | | | | | | | | | | |
| | | | |
Actual | | $ | 1,000.00 | | | $ | 1,004.95 | | | $ | 7.41 | | | | 1.49 | % |
| | | | |
Hypothetical (5% return before expenses) | | $ | 1,000.00 | | | $ | 1,017.41 | | | $ | 7.45 | | | | 1.49 | % |
Administrator Class | | | | | | | | | | | | | | | | |
| | | | |
Actual | | $ | 1,000.00 | | | $ | 1,010.53 | | | $ | 2.99 | | | | 0.60 | % |
| | | | |
Hypothetical (5% return before expenses) | | $ | 1,000.00 | | | $ | 1,021.82 | | | $ | 3.01 | | | | 0.60 | % |
Institutional Class | | | | | | | | | | | | | | | | |
| | | | |
Actual | | $ | 1,000.00 | | | $ | 1,011.22 | | | $ | 2.29 | | | | 0.46 | % |
| | | | |
Hypothetical (5% return before expenses) | | $ | 1,000.00 | | | $ | 1,022.51 | | | $ | 2.31 | | | | 0.46 | % |
| 1 | Expenses paid is equal to the annualized net expense ratio of each class multiplied by the average account value over the period, multiplied by the number of days in the most recent fiscal half-year divided by the number of days in the fiscal year (to reflect theone-half-year period). |
| | | | | | |
| Portfolio of investments—February 28, 2019 (unaudited) | | Wells Fargo Adjustable Rate Government Fund | | | 9 | |
| | | | | | | | | | | | | | | | |
| Security name | | Interest rate | | | Maturity date | | | Principal | | | Value | |
|
Agency Securities: 96.22% | |
| | | | |
FDIC Series2010-S2 Class 3A (1 Month LIBOR +0.70%) 144A± | | | 3.20 | % | | | 12-29-2045 | | | $ | 407,837 | | | $ | 408,518 | |
| | | | |
FHLMC (10 Year Treasury Constant Maturity-0.85%) ± | | | 1.90 | | | | 3-15-2024 | | | | 320,920 | | | | 318,815 | |
| | | | |
FHLMC (11th District Cost of Funds +1.25%) ± | | | 2.25 | | | | 5-1-2019 | | | | 536 | | | | 534 | |
| | | | |
FHLMC (11th District Cost of Funds +1.25%) ± | | | 2.27 | | | | 1-1-2030 | | | | 2,528 | | | | 2,489 | |
| | | | |
FHLMC (11th District Cost of Funds +1.25%) ± | | | 2.27 | | | | 1-1-2030 | | | | 1,807 | | | | 1,788 | |
| | | | |
FHLMC (11th District Cost of Funds +1.25%) ± | | | 2.27 | | | | 7-1-2030 | | | | 138,442 | | | | 136,592 | |
| | | | |
FHLMC (11th District Cost of Funds +1.39%) ± | | | 2.33 | | | | 1-1-2022 | | | | 1,140 | | | | 1,135 | |
| | | | |
FHLMC (11th District Cost of Funds +1.25%) ± | | | 2.33 | | | | 2-1-2035 | | | | 140,798 | | | | 138,802 | |
| | | | |
FHLMC (11th District Cost of Funds +1.36%) ± | | | 2.38 | | | | 10-1-2030 | | | | 3,773 | | | | 3,756 | |
| | | | |
FHLMC (11th District Cost of Funds +1.88%) ± | | | 2.77 | | | | 6-1-2019 | | | | 2,879 | | | | 2,870 | |
| | | | |
FHLMC (1 Year Treasury Constant Maturity +0.70%) ± | | | 2.84 | | | | 4-1-2030 | | | | 49,274 | | | | 49,607 | |
| | | | |
FHLMC (11th District Cost of Funds +1.82%) ± | | | 2.86 | | | | 3-1-2025 | | | | 32,669 | | | | 32,653 | |
| | | | |
FHLMC (11th District Cost of Funds +1.25%) ± | | | 2.94 | | | | 11-1-2030 | | | | 85,830 | | | | 86,513 | |
| | | | |
FHLMC (11th District Cost of Funds +2.19%) ± | | | 3.10 | | | | 6-1-2029 | | | | 60,875 | | | | 61,638 | |
| | | | |
FHLMC (11th District Cost of Funds +2.25%) ± | | | 3.13 | | | | 8-1-2019 | | | | 2,780 | | | | 2,775 | |
| | | | |
FHLMC (3 Year Treasury Constant Maturity +2.27%) ± | | | 3.19 | | | | 4-1-2032 | | | | 83,481 | | | | 85,443 | |
| | | | |
FHLMC (11th District Cost of Funds +2.39%) ± | | | 3.21 | | | | 6-1-2021 | | | | 29,777 | | | | 29,854 | |
| | | | |
FHLMC (12 Month Treasury Average +1.90%) ± | | | 3.46 | | | | 5-1-2028 | | | | 200,577 | | | | 207,047 | |
| | | | |
FHLMC (1 Year Treasury Constant Maturity +0.00%) ± | | | 3.62 | | | | 5-1-2020 | | | | 14 | | | | 14 | |
| | | | |
FHLMC (2 Year Treasury Constant Maturity +2.44%) ± | | | 3.63 | | | | 8-1-2029 | | | | 96,056 | | | | 99,006 | |
| | | | |
FHLMC (12 Month LIBOR +1.67%) ± | | | 3.67 | | | | 8-1-2035 | | | | 140,037 | | | | 143,025 | |
| | | | |
FHLMC (3 Year Treasury Constant Maturity +2.44%) ± | | | 3.80 | | | | 5-1-2031 | | | | 102,293 | | | | 107,276 | |
| | | | |
FHLMC (5 Year Treasury Constant Maturity +2.44%) ± | | | 3.82 | | | | 8-1-2027 | | | | 33,208 | | | | 33,224 | |
| | | | |
FHLMC (3 Year Treasury Constant Maturity +2.44%) ± | | | 3.89 | | | | 5-1-2032 | | | | 202,057 | | | | 200,055 | |
| | | | |
FHLMC (12 Month LIBOR +1.85%) ± | | | 3.92 | | | | 4-1-2035 | | | | 1,182,804 | | | | 1,240,118 | |
| | | | |
FHLMC (12 Month LIBOR +1.87%) ± | | | 3.99 | | | | 4-1-2037 | | | | 499,012 | | | | 524,754 | |
| | | | |
FHLMC (12 Month Treasury Average +2.46%) ± | | | 4.00 | | | | 10-1-2029 | | | | 96,471 | | | | 98,497 | |
| | | | |
FHLMC (1 Year Treasury Constant Maturity +2.13%) ± | | | 4.01 | | | | 7-1-2019 | | | | 103 | | | | 103 | |
| | | | |
FHLMC (12 Month LIBOR +1.75%) ± | | | 4.05 | | | | 4-1-2035 | | | | 191,842 | | | | 200,568 | |
| | | | |
FHLMC (12 Month LIBOR +1.91%) ± | | | 4.05 | | | | 3-1-2032 | | | | 785,429 | | | | 826,402 | |
| | | | |
FHLMC (1 Year Treasury Constant Maturity +1.88%) ± | | | 4.05 | | | | 5-1-2035 | | | | 293,725 | | | | 306,981 | |
| | | | |
FHLMC (1 Year Treasury Constant Maturity +2.17%) ± | | | 4.06 | | | | 5-1-2037 | | | | 126,787 | | | | 132,845 | |
| | | | |
FHLMC (1 Year Treasury Constant Maturity +2.23%) ± | | | 4.07 | | | | 4-1-2034 | | | | 223,391 | | | | 233,813 | |
| | | | |
FHLMC (12 Month LIBOR +1.75%) ± | | | 4.10 | | | | 2-1-2037 | | | | 209,146 | | | | 220,249 | |
| | | | |
FHLMC (1 Year Treasury Constant Maturity +2.23%) ± | | | 4.11 | | | | 4-1-2034 | | | | 293,232 | | | | 307,280 | |
| | | | |
FHLMC (1 Year Treasury Constant Maturity +2.18%) ± | | | 4.13 | | | | 4-1-2023 | | | | 152,698 | | | | 153,027 | |
| | | | |
FHLMC (1 Year Treasury Constant Maturity +2.25%) ± | | | 4.13 | | | | 5-1-2034 | | | | 174,023 | | | | 182,093 | |
| | | | |
FHLMC (1 Year Treasury Constant Maturity +2.23%) ± | | | 4.14 | | | | 3-1-2034 | | | | 737,884 | | | | 771,446 | |
| | | | |
FHLMC (1 Year Treasury Constant Maturity +2.23%) ± | | | 4.19 | | | | 5-1-2034 | | | | 928,338 | | | | 971,346 | |
| | | | |
FHLMC (1 Year Treasury Constant Maturity +2.04%) ± | | | 4.20 | | | | 1-1-2030 | | | | 14,702 | | | | 15,149 | |
| | | | |
FHLMC (6 Month LIBOR +1.42%) ± | | | 4.21 | | | | 2-1-2037 | | | | 4,572 | | | | 4,695 | |
| | | | |
FHLMC (12 Month Treasury Average +2.30%) ± | | | 4.22 | | | | 6-1-2028 | | | | 87,613 | | | | 89,340 | |
| | | | |
FHLMC (6 Month LIBOR +1.66%) ± | | | 4.22 | | | | 6-1-2037 | | | | 384,166 | | | | 395,428 | |
| | | | |
FHLMC (1 Year Treasury Constant Maturity +2.48%) ± | | | 4.23 | | | | 2-1-2030 | | | | 29,160 | | | | 29,546 | |
| | | | |
FHLMC (1 Year Treasury Constant Maturity +2.23%) ± | | | 4.23 | | | | 5-1-2032 | | | | 41,302 | | | | 42,740 | |
| | | | |
FHLMC (1 Year Treasury Constant Maturity +2.23%) ± | | | 4.23 | | | | 3-1-2034 | | | | 664,990 | | | | 695,839 | |
| | | | |
FHLMC (12 Month LIBOR +1.75%) ± | | | 4.23 | | | | 5-1-2037 | | | | 1,017,062 | | | | 1,064,473 | |
| | | | |
FHLMC (1 Year Treasury Constant Maturity +2.36%) ± | | | 4.23 | | | | 4-1-2038 | | | | 1,103,429 | | | | 1,163,651 | |
| | | | |
FHLMC (1 Year Treasury Constant Maturity +2.05%) ± | | | 4.24 | | | | 8-1-2033 | | | | 1,324,696 | | | | 1,374,270 | |
| | | | |
FHLMC (1 Year Treasury Constant Maturity +2.02%) ± | | | 4.25 | | | | 12-1-2035 | | | | 518,830 | | | | 542,094 | |
The accompanying notes are an integral part of these financial statements.
| | | | |
| 10 | | Wells Fargo Adjustable Rate Government Fund | | Portfolio of investments—February 28, 2019 (unaudited) |
| | | | | | | | | | | | | | | | |
| Security name | | Interest rate | | | Maturity date | | | Principal | | | Value | |
| | | | |
Agency Securities(continued) | | | | | | | | | | | | | | | | |
| | | | |
FHLMC (1 Year Treasury Constant Maturity +2.29%) ± | | | 4.25 | % | | | 9-1-2033 | | | $ | 518,727 | | | $ | 545,805 | |
| | | | |
FHLMC (1 Year Treasury Constant Maturity +2.48%) ± | | | 4.26 | | | | 6-1-2030 | | | | 77,965 | | | | 79,512 | |
| | | | |
FHLMC (1 Year Treasury Constant Maturity +2.01%) ± | | | 4.26 | | | | 6-1-2020 | | | | 61 | | | | 61 | |
| | | | |
FHLMC (12 Month LIBOR +1.77%) ± | | | 4.27 | | | | 10-1-2036 | | | | 423,502 | | | | 443,377 | |
| | | | |
FHLMC (6 Month LIBOR +1.68%) ± | | | 4.27 | | | | 1-1-2037 | | | | 1,001,510 | | | | 1,039,061 | |
| | | | |
FHLMC (1 Year Treasury Constant Maturity +2.25%) ± | | | 4.27 | | | | 3-1-2036 | | | | 525,352 | | | | 550,462 | |
| | | | |
FHLMC (1 Year Treasury Constant Maturity +1.55%) ± | | | 4.28 | | | | 7-1-2030 | | | | 2,628 | | | | 2,622 | |
| | | | |
FHLMC (12 Month LIBOR +1.75%) ± | | | 4.28 | | | | 5-1-2033 | | | | 185,458 | | | | 195,528 | |
| | | | |
FHLMC (1 Year Treasury Constant Maturity +2.25%) ± | | | 4.28 | | | | 4-1-2038 | | | | 868,239 | | | | 912,989 | |
| | | | |
FHLMC (11th District Cost of Funds +2.57%) ± | | | 4.28 | | | | 12-1-2025 | | | | 304,558 | | | | 315,979 | |
| | | | |
FHLMC (1 Year Treasury Constant Maturity +2.03%) ± | | | 4.28 | | | | 3-1-2025 | | | | 36,257 | | | | 37,404 | |
| | | | |
FHLMC (1 Year Treasury Constant Maturity +2.23%) ± | | | 4.28 | | | | 9-1-2035 | | | | 1,263,154 | | | | 1,327,668 | |
| | | | |
FHLMC (1 Year Treasury Constant Maturity +2.25%) ± | | | 4.29 | | | | 9-1-2038 | | | | 181,039 | | | | 186,059 | |
| | | | |
FHLMC (1 Year Treasury Constant Maturity +2.44%) ± | | | 4.32 | | | | 4-1-2029 | | | | 85,457 | | | | 86,416 | |
| | | | |
FHLMC (US Treasury H15 Treasury Bill 6 Month Auction High Discount +1.75%) ± | | | 4.32 | | | | 1-1-2023 | | | | 19,397 | | | | 20,198 | |
| | | | |
FHLMC (Federal Cost of Funds +2.72%) ± | | | 4.32 | | | | 4-1-2023 | | | | 8,362 | | | | 8,417 | |
| | | | |
FHLMC (1 Year Treasury Constant Maturity +2.24%) ± | | | 4.32 | | | | 8-1-2027 | | | | 4,948 | | | | 4,996 | |
| | | | |
FHLMC (11th District Cost of Funds +2.29%) ± | | | 4.33 | | | | 12-1-2025 | | | | 13,641 | | | | 13,719 | |
| | | | |
FHLMC (12 Month LIBOR +1.89%) ± | | | 4.33 | | | | 4-1-2037 | | | | 490,972 | | | | 516,713 | |
| | | | |
FHLMC (1 Year Treasury Constant Maturity +2.40%) ± | | | 4.33 | | | | 7-1-2029 | | | | 52,480 | | | | 54,584 | |
| | | | |
FHLMC (1 Year Treasury Constant Maturity +2.25%) ± | | | 4.36 | | | | 6-1-2035 | | | | 96,567 | | | | 101,498 | |
| | | | |
FHLMC (1 Year Treasury Constant Maturity +2.36%) ± | | | 4.36 | | | | 6-1-2035 | | | | 337,411 | | | | 353,853 | |
| | | | |
FHLMC (1 Year Treasury Constant Maturity +2.23%) ± | | | 4.36 | | | | 5-1-2038 | | | | 751,171 | | | | 788,787 | |
| | | | |
FHLMC (12 Month LIBOR +1.87%) ± | | | 4.37 | | | | 5-1-2035 | | | | 136,629 | | | | 144,638 | |
| | | | |
FHLMC (12 Month LIBOR +1.75%) ± | | | 4.39 | | | | 6-1-2033 | | | | 572,642 | | | | 599,339 | |
| | | | |
FHLMC (1 Year Treasury Constant Maturity +2.28%) ± | | | 4.40 | | | | 4-1-2037 | | | | 1,164,652 | | | | 1,224,339 | |
| | | | |
FHLMC (1 Year Treasury Constant Maturity +2.27%) ± | | | 4.40 | | | | 7-1-2031 | | | | 757,610 | | | | 780,246 | |
| | | | |
FHLMC (1 Year Treasury Constant Maturity +2.10%) ± | | | 4.41 | | | | 10-1-2037 | | | | 1,015,085 | | | | 1,060,288 | |
| | | | |
FHLMC (3 Year Treasury Constant Maturity +2.70%) ± | | | 4.41 | | | | 6-1-2035 | | | | 792,458 | | | | 830,116 | |
| | | | |
FHLMC (1 Year Treasury Constant Maturity +2.20%) ± | | | 4.41 | | | | 11-1-2036 | | | | 891,376 | | | | 938,538 | |
| | | | |
FHLMC (1 Year Treasury Constant Maturity +2.24%) ± | | | 4.41 | | | | 4-1-2037 | | | | 446,471 | | | | 472,631 | |
| | | | |
FHLMC (12 Month LIBOR +1.76%) ± | | | 4.42 | | | | 10-1-2035 | | | | 749,885 | | | | 781,913 | |
| | | | |
FHLMC (1 Year Treasury Constant Maturity +2.26%) ± | | | 4.42 | | | | 7-1-2035 | | | | 503,646 | | | | 528,555 | |
| | | | |
FHLMC (1 Year Treasury Constant Maturity +2.52%) ± | | | 4.44 | | | | 11-1-2029 | | | | 97,284 | | | | 100,153 | |
| | | | |
FHLMC (5 Year Treasury Constant Maturity +2.13%) ± | | | 4.44 | | | | 8-1-2029 | | | | 8,730 | | | | 8,714 | |
| | | | |
FHLMC (1 Year Treasury Constant Maturity +2.26%) ± | | | 4.44 | | | | 5-1-2034 | | | | 1,245,981 | | | | 1,304,064 | |
| | | | |
FHLMC (1 Year Treasury Constant Maturity +2.40%) ± | | | 4.45 | | | | 11-1-2029 | | | | 456,352 | | | | 473,508 | |
| | | | |
FHLMC (1 Year Treasury Constant Maturity +2.34%) ± | | | 4.45 | | | | 7-1-2034 | | | | 476,615 | | | | 494,913 | |
| | | | |
FHLMC (1 Year Treasury Constant Maturity +2.25%) ± | | | 4.45 | | | | 8-1-2035 | | | | 1,542,059 | | | | 1,621,705 | |
| | | | |
FHLMC (1 Year Treasury Constant Maturity +2.25%) ± | | | 4.46 | | | | 11-1-2035 | | | | 747,654 | | | | 784,727 | |
| | | | |
FHLMC (1 Year Treasury Constant Maturity +2.21%) ± | | | 4.46 | | | | 1-1-2037 | | | | 893,315 | | | | 939,724 | |
| | | | |
FHLMC (1 Year Treasury Constant Maturity +2.23%) ± | | | 4.46 | | | | 7-1-2036 | | | | 254,898 | | | | 264,034 | |
| | | | |
FHLMC (12 Month LIBOR +1.74%) ± | | | 4.46 | | | | 9-1-2037 | | | | 330,063 | | | | 345,693 | |
| | | | |
FHLMC (1 Year Treasury Constant Maturity +2.25%) ± | | | 4.47 | | | | 8-1-2035 | | | | 408,912 | | | | 429,254 | |
| | | | |
FHLMC (1 Year Treasury Constant Maturity +2.31%) ± | | | 4.47 | | | | 1-1-2036 | | | | 443,228 | | | | 465,952 | |
| | | | |
FHLMC (1 Year Treasury Constant Maturity +2.47%) ± | | | 4.47 | | | | 7-1-2034 | | | | 781,996 | | | | 820,496 | |
| | | | |
FHLMC (1 Year Treasury Constant Maturity +2.34%) ± | | | 4.47 | | | | 9-1-2032 | | | | 1,364,663 | | | | 1,430,993 | |
| | | | |
FHLMC (1 Year Treasury Constant Maturity +2.22%) ± | | | 4.47 | | | | 8-1-2033 | | | | 223,964 | | | | 235,436 | |
| | | | |
FHLMC (1 Year Treasury Constant Maturity +2.24%) ± | | | 4.47 | | | | 3-1-2035 | | | | 609,793 | | | | 640,131 | |
| | | | |
FHLMC (1 Year Treasury Constant Maturity +2.35%) ± | | | 4.47 | | | | 2-1-2036 | | | | 98,407 | | | | 103,669 | |
The accompanying notes are an integral part of these financial statements.
| | | | | | |
| Portfolio of investments—February 28, 2019 (unaudited) | | Wells Fargo Adjustable Rate Government Fund | | | 11 | |
| | | | | | | | | | | | | | | | |
| Security name | | Interest rate | | | Maturity date | | | Principal | | | Value | |
| | | | |
Agency Securities(continued) | | | | | | | | | | | | | | | | |
| | | | |
FHLMC (1 Year Treasury Constant Maturity +2.25%) ± | | | 4.47 | % | | | 11-1-2036 | | | $ | 791,516 | | | $ | 833,581 | |
| | | | |
FHLMC (1 Year Treasury Constant Maturity +2.24%) ± | | | 4.48 | | | | 3-1-2027 | | | | 85,840 | | | | 87,235 | |
| | | | |
FHLMC (1 Year Treasury Constant Maturity +2.60%) ± | | | 4.48 | | | | 6-1-2032 | | | | 137,366 | | | | 139,092 | |
| | | | |
FHLMC (1 Year Treasury Constant Maturity +2.23%) ± | | | 4.48 | | | | 11-1-2026 | | | | 65,456 | | | | 67,348 | |
| | | | |
FHLMC (1 Year Treasury Constant Maturity +2.25%) ± | | | 4.48 | | | | 10-1-2034 | | | | 791,414 | | | | 830,988 | |
| | | | |
FHLMC (6 Month LIBOR +1.73%) ± | | | 4.48 | | | | 6-1-2024 | | | | 6,310 | | | | 6,320 | |
| | | | |
FHLMC (1 Year Treasury Constant Maturity +1.99%) ± | | | 4.49 | | | | 11-1-2034 | | | | 287,963 | | | | 302,307 | |
| | | | |
FHLMC (1 Year Treasury Constant Maturity +2.35%) ± | | | 4.49 | | | | 7-1-2038 | | | | 462,086 | | | | 485,413 | |
| | | | |
FHLMC (1 Year Treasury Constant Maturity +2.43%) ± | | | 4.50 | | | | 8-1-2029 | | | | 67,002 | | | | 68,041 | |
| | | | |
FHLMC (1 Year Treasury Constant Maturity +2.16%) ± | | | 4.50 | | | | 6-1-2033 | | | | 450,820 | | | | 471,563 | |
| | | | |
FHLMC (1 Year Treasury Constant Maturity +2.40%) ± | | | 4.50 | | | | 9-1-2031 | | | | 64,866 | | | | 65,797 | |
| | | | |
FHLMC (1 Year Treasury Constant Maturity +2.24%) ± | | | 4.50 | | | | 2-1-2036 | | | | 876,538 | | | | 919,969 | |
| | | | |
FHLMC (12 Month LIBOR +1.77%) ± | | | 4.51 | | | | 6-1-2035 | | | | 705,721 | | | | 742,177 | |
| | | | |
FHLMC (1 Year Treasury Constant Maturity +2.36%) ± | | | 4.51 | | | | 7-1-2027 | | | | 468,841 | | | | 471,940 | |
| | | | |
FHLMC (1 Year Treasury Constant Maturity +2.32%) ± | | | 4.51 | | | | 9-1-2029 | | | | 539,226 | | | | 564,940 | |
| | | | |
FHLMC (1 Year Treasury Constant Maturity +2.23%) ± | | | 4.51 | | | | 10-1-2036 | | | | 334,936 | | | | 352,404 | |
| | | | |
FHLMC (1 Year Treasury Constant Maturity +2.48%) ± | | | 4.51 | | | | 10-1-2025 | | | | 55,576 | | | | 56,416 | |
| | | | |
FHLMC (1 Year Treasury Constant Maturity +2.36%) ± | | | 4.52 | | | | 2-1-2031 | | | | 430,826 | | | | 451,616 | |
| | | | |
FHLMC (1 Year Treasury Constant Maturity +2.26%) ± | | | 4.52 | | | | 2-1-2036 | | | | 433,243 | | | | 454,771 | |
| | | | |
FHLMC (1 Year Treasury Constant Maturity +2.17%) ± | | | 4.52 | | | | 6-1-2036 | | | | 834,969 | | | | 874,783 | |
| | | | |
FHLMC (1 Year Treasury Constant Maturity +2.48%) ± | | | 4.52 | | | | 10-1-2024 | | | | 72,887 | | | | 75,357 | |
| | | | |
FHLMC (1 Year Treasury Constant Maturity +2.25%) ± | | | 4.53 | | | | 2-1-2036 | | | | 531,833 | | | | 558,459 | |
| | | | |
FHLMC (12 Month LIBOR +1.77%) ± | | | 4.53 | | | | 9-1-2037 | | | | 456,209 | | | | 477,248 | |
| | | | |
FHLMC (1 Year Treasury Constant Maturity +2.33%) ± | | | 4.54 | | | | 9-1-2030 | | | | 150,105 | | | | 156,785 | |
| | | | |
FHLMC (1 Year Treasury Constant Maturity +2.25%) ± | | | 4.56 | | | | 9-1-2033 | | | | 150,692 | | | | 158,310 | |
| | | | |
FHLMC (1 Year Treasury Constant Maturity +2.25%) ± | | | 4.57 | | | | 2-1-2036 | | | | 922,114 | | | | 968,545 | |
| | | | |
FHLMC (12 Month LIBOR +1.78%) ± | | | 4.57 | | | | 11-1-2035 | | | | 349,410 | | | | 363,937 | |
| | | | |
FHLMC (1 Year Treasury Constant Maturity +2.28%) ± | | | 4.58 | | | | 10-1-2036 | | | | 389,192 | | | | 410,479 | |
| | | | |
FHLMC (1 Year Treasury Constant Maturity +2.24%) ± | | | 4.60 | | | | 7-1-2037 | | | | 440,262 | | | | 462,243 | |
| | | | |
FHLMC (12 Month LIBOR +1.82%) ± | | | 4.60 | | | | 5-1-2039 | | | | 728,396 | | | | 767,272 | |
| | | | |
FHLMC (1 Year Treasury Constant Maturity +2.33%) ± | | | 4.60 | | | | 6-1-2035 | | | | 787,602 | | | | 828,225 | |
| | | | |
FHLMC (1 Year Treasury Constant Maturity +2.33%) ± | | | 4.60 | | | | 9-1-2033 | | | | 751,624 | | | | 793,937 | |
| | | | |
FHLMC (1 Year Treasury Constant Maturity +2.31%) ± | | | 4.60 | | | | 3-1-2037 | | | | 282,121 | | | | 296,927 | |
| | | | |
FHLMC (12 Month LIBOR +1.73%) ± | | | 4.61 | | | | 1-1-2035 | | | | 402,918 | | | | 425,420 | |
| | | | |
FHLMC (1 Year Treasury Constant Maturity +2.31%) ± | | | 4.61 | | | | 7-1-2038 | | | | 552,185 | | | | 581,327 | |
| | | | |
FHLMC (1 Year Treasury Constant Maturity +2.22%) ± | | | 4.61 | | | | 10-1-2033 | | | | 268,194 | | | | 281,404 | |
| | | | |
FHLMC (12 Month LIBOR +1.74%) ± | | | 4.62 | | | | 12-1-2036 | | | | 265,993 | | | | 277,711 | |
| | | | |
FHLMC (1 Year Treasury Constant Maturity +2.38%) ± | | | 4.62 | | | | 6-1-2035 | | | | 1,194,451 | | | | 1,242,724 | |
| | | | |
FHLMC (1 Year Treasury Constant Maturity +2.22%) ± | | | 4.63 | | | | 10-1-2033 | | | | 887,130 | | | | 929,522 | |
| | | | |
FHLMC (1 Year Treasury Constant Maturity +2.43%) ± | | | 4.63 | | | | 6-1-2025 | | | | 51,145 | | | | 51,724 | |
| | | | |
FHLMC (1 Year Treasury Constant Maturity +2.23%) ± | | | 4.63 | | | | 1-1-2034 | | | | 672,400 | | | | 707,832 | |
| | | | |
FHLMC (1 Year Treasury Constant Maturity +2.48%) ± | | | 4.63 | | | | 6-1-2030 | | | | 250,477 | | | | 260,793 | |
| | | | |
FHLMC (1 Year Treasury Constant Maturity +2.36%) ± | | | 4.64 | | | | 1-1-2028 | | | | 2,266 | | | | 2,376 | |
| | | | |
FHLMC (6 Month LIBOR +2.12%) ± | | | 4.64 | | | | 5-1-2037 | | | | 46,465 | | | | 48,666 | |
| | | | |
FHLMC (1 Year Treasury Constant Maturity +2.27%) ± | | | 4.65 | | | | 5-1-2025 | | | | 61,502 | | | | 62,237 | |
| | | | |
FHLMC (1 Year Treasury Constant Maturity +2.22%) ± | | | 4.65 | | | | 10-1-2033 | | | | 530,665 | | | | 558,734 | |
| | | | |
FHLMC (1 Year Treasury Constant Maturity +2.32%) ± | | | 4.66 | | | | 7-1-2031 | | | | 168,170 | | | | 177,577 | |
| | | | |
FHLMC (1 Year Treasury Constant Maturity +2.29%) ± | | | 4.66 | | | | 11-1-2027 | | | | 409,785 | | | | 428,517 | |
| | | | |
FHLMC (1 Year Treasury Constant Maturity +2.25%) ± | | | 4.67 | | | | 4-1-2036 | | | | 446,690 | | | | 469,569 | |
| | | | |
FHLMC (1 Year Treasury Constant Maturity +2.17%) ± | | | 4.68 | | | | 8-1-2034 | | | | 834,071 | | | | 874,022 | |
The accompanying notes are an integral part of these financial statements.
| | | | |
| 12 | | Wells Fargo Adjustable Rate Government Fund | | Portfolio of investments—February 28, 2019 (unaudited) |
| | | | | | | | | | | | | | | | |
| Security name | | Interest rate | | | Maturity date | | | Principal | | | Value | |
| | | | |
Agency Securities(continued) | | | | | | | | | | | | | | | | |
| | | | |
FHLMC (US Treasury H15 Treasury Bill 6 Month Auction High Discount +1.94%) ± | | | 4.69 | % | | | 7-1-2024 | | | $ | 28,059 | | | $ | 27,961 | |
| | | | |
FHLMC (1 Year Treasury Constant Maturity +2.23%) ± | | | 4.69 | | | | 7-1-2034 | | | | 115,151 | | | | 120,932 | |
| | | | |
FHLMC (1 Year Treasury Constant Maturity +2.29%) ± | | | 4.69 | | | | 2-1-2036 | | | | 605,015 | | | | 635,778 | |
| | | | |
FHLMC (1 Year Treasury Constant Maturity +2.38%) ± | | | 4.69 | | | | 1-1-2037 | | | | 1,410,451 | | | | 1,488,542 | |
| | | | |
FHLMC (1 Year Treasury Constant Maturity +2.36%) ± | | | 4.70 | | | | 6-1-2035 | | | | 447,738 | | | | 471,863 | |
| | | | |
FHLMC (6 Month LIBOR +2.08%) ± | | | 4.71 | | | | 6-1-2026 | | | | 710,651 | | | | 729,483 | |
| | | | |
FHLMC (1 Year Treasury Constant Maturity +2.34%) ± | | | 4.71 | | | | 10-1-2033 | | | | 1,212,111 | | | | 1,266,458 | |
| | | | |
FHLMC (12 Month LIBOR +1.99%) ± | | | 4.72 | | | | 7-1-2036 | | | | 692,395 | | | | 727,280 | |
| | | | |
FHLMC (1 Year Treasury Constant Maturity +2.25%) ± | | | 4.72 | | | | 5-1-2034 | | | | 75,577 | | | | 79,515 | |
| | | | |
FHLMC (1 Year Treasury Constant Maturity +2.22%) ± | | | 4.73 | | | | 12-1-2033 | | | | 479,441 | | | | 501,310 | |
| | | | |
FHLMC (1 Year Treasury Constant Maturity +2.25%) ± | | | 4.74 | | | | 2-1-2034 | | | | 541,122 | | | | 574,551 | |
| | | | |
FHLMC (12 Month LIBOR +1.87%) ± | | | 4.74 | | | | 9-1-2036 | | | | 616,378 | | | | 648,767 | |
| | | | |
FHLMC (1 Year Treasury Constant Maturity +2.25%) ± | | | 4.77 | | | | 12-1-2034 | | | | 313,946 | | | | 330,858 | |
| | | | |
FHLMC (1 Year Treasury Constant Maturity +2.27%) ± | | | 4.77 | | | | 11-1-2029 | | | | 39,094 | | | | 39,699 | |
| | | | |
FHLMC (1 Year Treasury Constant Maturity +2.26%) ± | | | 4.77 | | | | 9-1-2038 | | | | 537,084 | | | | 559,885 | |
| | | | |
FHLMC (1 Year Treasury Constant Maturity +2.36%) ± | | | 4.77 | | | | 1-1-2028 | | | | 16,507 | | | | 17,216 | |
| | | | |
FHLMC (1 Year Treasury Constant Maturity +2.38%) ± | | | 4.78 | | | | 4-1-2034 | | | | 365,736 | | | | 380,938 | |
| | | | |
FHLMC (1 Year Treasury Constant Maturity +2.44%) ± | | | 4.78 | | | | 10-1-2030 | | | | 1,282,643 | | | | 1,338,975 | |
| | | | |
FHLMC (1 Year Treasury Constant Maturity +2.29%) ± | | | 4.79 | | | | 11-1-2029 | | | | 64,419 | | | | 65,686 | |
| | | | |
FHLMC (1 Year Treasury Constant Maturity +2.22%) ± | | | 4.79 | | | | 1-1-2033 | | | | 343,801 | | | | 359,169 | |
| | | | |
FHLMC (1 Year Treasury Constant Maturity +2.25%) ± | | | 4.80 | | | | 1-1-2037 | | | | 117,563 | | | | 123,744 | |
| | | | |
FHLMC (1 Year Treasury Constant Maturity +2.61%) ± | | | 4.82 | | | | 9-1-2030 | | | | 97,729 | | | | 99,496 | |
| | | | |
FHLMC (12 Month LIBOR +1.93%) ± | | | 4.84 | | | | 4-1-2035 | | | | 860,447 | | | | 904,478 | |
| | | | |
FHLMC (1 Year Treasury Constant Maturity +2.28%) ± | | | 4.84 | | | | 1-1-2035 | | | | 334,375 | | | | 352,251 | |
| | | | |
FHLMC (1 Year Treasury Constant Maturity +2.28%) ± | | | 4.84 | | | | 2-1-2034 | | | | 1,133,811 | | | | 1,190,523 | |
| | | | |
FHLMC (6 Month LIBOR +2.38%) ± | | | 4.85 | | | | 2-1-2024 | | | | 14,324 | | | | 14,368 | |
| | | | |
FHLMC (12 Month LIBOR +1.98%) ± | | | 4.85 | | | | 11-1-2032 | | | | 111,705 | | | | 114,042 | |
| | | | |
FHLMC (1 Year Treasury Constant Maturity +2.30%) ± | | | 4.88 | | | | 11-1-2035 | | | | 1,035,681 | | | | 1,089,025 | |
| | | | |
FHLMC (1 Year Treasury Constant Maturity +2.25%) ± | | | 4.89 | | | | 11-1-2022 | | | | 70,594 | | | | 72,202 | |
| | | | |
FHLMC (FHLMC National Average Mortgage Contract +3.27%) ± | | | 4.89 | | | | 2-1-2021 | | | | 4,499 | | | | 4,497 | |
| | | | |
FHLMC (1 Year Treasury Constant Maturity +2.41%) ± | | | 4.90 | | | | 12-1-2032 | | | | 267,244 | | | | 280,370 | |
| | | | |
FHLMC (1 Year Treasury Constant Maturity +2.61%) ± | | | 4.94 | | | | 5-1-2028 | | | | 177,256 | | | | 183,468 | |
| | | | |
FHLMC (1 Year Treasury Constant Maturity +2.25%) ± | | | 4.95 | | | | 2-1-2036 | | | | 822,369 | | | | 863,630 | |
| | | | |
FHLMC (1 Year Treasury Constant Maturity +2.55%) ± | | | 4.96 | | | | 9-1-2029 | | | | 121,229 | | | | 122,744 | |
| | | | |
FHLMC (1 Year Treasury Constant Maturity +2.23%) ± | | | 4.96 | | | | 2-1-2034 | | | | 926,919 | | | | 969,235 | |
| | | | |
FHLMC (1 Year Treasury Constant Maturity +2.23%) ± | | | 4.98 | | | | 2-1-2034 | | | | 465,696 | | | | 490,850 | |
| | | | |
FHLMC | | | 5.00 | | | | 10-1-2022 | | | | 7,115 | | | | 7,269 | |
| | | | |
FHLMC (1 Year Treasury Constant Maturity +2.36%) ± | | | 5.00 | | | | 2-1-2035 | | | | 820,884 | | | | 870,709 | |
| | | | |
FHLMC (1 Year Treasury Constant Maturity +2.48%) ± | | | 5.07 | | | | 6-1-2030 | | | | 30,121 | | | | 30,723 | |
| | | | |
FHLMC (1 Year Treasury Constant Maturity +2.32%) ± | | | 5.49 | | | | 8-1-2024 | | | | 189,957 | | | | 189,042 | |
| | | | |
FHLMC (6 Month LIBOR +3.33%) ± | | | 5.97 | | | | 11-1-2026 | | | | 68,869 | | | | 70,507 | |
| | | | |
FHLMC Series 0020 Class F ±± | | | 3.11 | | | | 7-1-2029 | | | | 9,412 | | | | 9,635 | |
| | | | |
FHLMC Series 1671 Class QA (11th District Cost of Funds +0.95%) ± | | | 2.01 | | | | 2-15-2024 | | | | 590,190 | | | | 599,498 | |
| | | | |
FHLMC Series 1686 Class FE (11th District Cost of Funds +1.10%) ± | | | 2.16 | | | | 2-15-2024 | | | | 15,159 | | | | 15,430 | |
| | | | |
FHLMC Series 1730 Class FA (10 Year Treasury Constant Maturity-0.60%) ± | | | 2.15 | | | | 5-15-2024 | | | | 102,274 | | | | 102,149 | |
| | | | |
FHLMC Series 2315 Class FW (1 Month LIBOR +0.55%) ± | | | 3.04 | | | | 4-15-2027 | | | | 70,412 | | | | 70,837 | |
| | | | |
FHLMC Series 2391 Class EF (1 Month LIBOR +0.50%) ± | | | 2.99 | | | | 6-15-2031 | | | | 67,638 | | | | 68,114 | |
| | | | |
FHLMC Series 2454 Class SL (1 Month LIBOR +8.00%) ±(c) | | | 5.51 | | | | 3-15-2032 | | | | 128,376 | | | | 21,234 | |
| | | | |
FHLMC Series 2461 Class FI (1 Month LIBOR +0.50%) ± | | | 2.99 | | | | 4-15-2028 | | | | 90,964 | | | | 91,443 | |
| | | | |
FHLMC Series 2464 Class FE (1 Month LIBOR +1.00%) ± | | | 3.49 | | | | 3-15-2032 | | | | 83,672 | | | | 85,955 | |
The accompanying notes are an integral part of these financial statements.
| | | | | | |
| Portfolio of investments—February 28, 2019 (unaudited) | | Wells Fargo Adjustable Rate Government Fund | | | 13 | |
| | | | | | | | | | | | | | | | |
| Security name | | Interest rate | | | Maturity date | | | Principal | | | Value | |
| | | | |
Agency Securities(continued) | | | | | | | | | | | | | | | | |
| | | | |
FHLMC Series 2466 Class FV (1 Month LIBOR +0.55%) ± | | | 3.04 | % | | | 3-15-2032 | | | $ | 168,309 | | | $ | 169,893 | |
| | | | |
FHLMC Series 2538 Class F (1 Month LIBOR +0.60%) ± | | | 3.09 | | | | 12-15-2032 | | | | 363,483 | | | | 367,640 | |
| | | | |
FHLMC Series 3436 Class A ±± | | | 4.40 | | | | 11-15-2036 | | | | 663,805 | | | | 679,578 | |
| | | | |
FHLMC SeriesT-15 Class A6 (1 Month LIBOR +0.40%) ± | | | 2.89 | | | | 11-25-2028 | | | | 443,447 | | | | 442,740 | |
| | | | |
FHLMC SeriesT-16 Class A (1 Month LIBOR +0.10%) ± | | | 2.59 | | | | 6-25-2029 | | | | 1,221,420 | | | | 1,225,304 | |
| | | | |
FHLMC SeriesT-20 Class A7 (1 Month LIBOR +0.15%) ± | | | 2.81 | | | | 12-25-2029 | | | | 2,459,450 | | | | 2,417,012 | |
| | | | |
FHLMC SeriesT-21 Class A (1 Month LIBOR +0.18%) ± | | | 2.87 | | | | 10-25-2029 | | | | 1,027,065 | | | | 1,020,792 | |
| | | | |
FHLMC SeriesT-23 Class A (1 Month LIBOR +0.14%) ± | | | 2.63 | | | | 5-25-2030 | | | | 1,449,792 | | | | 1,446,563 | |
| | | | |
FHLMC SeriesT-27 Class A (1 Month LIBOR +0.15%) ± | | | 2.81 | | | | 10-25-2030 | | | | 941,138 | | | | 948,501 | |
| | | | |
FHLMC SeriesT-30 Class A7 (1 Month LIBOR +0.24%) ± | | | 2.73 | | | | 12-25-2030 | | | | 1,051,646 | | | | 1,020,419 | |
| | | | |
FHLMC SeriesT-35 Class A (1 Month LIBOR +0.14%) ± | | | 2.79 | | | | 9-25-2031 | | | | 2,574,617 | | | | 2,549,397 | |
| | | | |
FHLMC SeriesT-48 Class 2A ±± | | | 4.18 | | | | 7-25-2033 | | | | 2,004,881 | | | | 2,005,604 | |
| | | | |
FHLMC SeriesT-54 Class 4A ±± | | | 4.13 | | | | 2-25-2043 | | | | 1,412,724 | | | | 1,399,360 | |
| | | | |
FHLMC SeriesT-55 Class 1A1 | | | 6.50 | | | | 3-25-2043 | | | | 57,354 | | | | 63,763 | |
| | | | |
FHLMC SeriesT-56 Class 3AF (1 Month LIBOR +1.00%) ± | | | 3.49 | | | | 5-25-2043 | | | | 946,685 | | | | 967,929 | |
| | | | |
FHLMC SeriesT-62 Class 1A1 (12 Month Treasury Average +1.20%) ± | | | 3.53 | | | | 10-25-2044 | | | | 3,212,126 | | | | 3,248,715 | |
| | | | |
FHLMC SeriesT-63 Class 1A1 (12 Month Treasury Average +1.20%) ± | | | 3.31 | | | | 2-25-2045 | | | | 2,876,980 | | | | 2,878,806 | |
| | | | |
FHLMC SeriesT-66 Class 2A1 ±± | | | 4.23 | | | | 1-25-2036 | | | | 1,835,869 | | | | 1,832,209 | |
| | | | |
FHLMC SeriesT-67 Class 1A1C ±± | | | 3.93 | | | | 3-25-2036 | | | | 4,189,153 | | | | 4,213,167 | |
| | | | |
FHLMC SeriesT-67 Class 2A1C ±± | | | 3.61 | | | | 3-25-2036 | | | | 3,543,850 | | | | 3,497,035 | |
| | | | |
FHLMC SeriesT-75 Class A1 (1 Month LIBOR +0.04%) ± | | | 2.55 | | | | 12-25-2036 | | | | 587,894 | | | | 587,533 | |
| | | | |
FNMA (11th District Cost of Funds +1.25%) ± | | | 2.27 | | | | 11-1-2020 | | | | 87,261 | | | | 86,779 | |
| | | | |
FNMA (11th District Cost of Funds +1.25%) ± | | | 2.27 | | | | 3-1-2033 | | | | 108,854 | | | | 108,873 | |
| | | | |
FNMA (11th District Cost of Funds +1.25%) ± | | | 2.29 | | | | 4-1-2021 | | | | 16,783 | | | | 16,714 | |
| | | | |
FNMA (11th District Cost of Funds +1.25%) ± | | | 2.30 | | | | 11-1-2024 | | | | 1,759 | | | | 1,754 | |
| | | | |
FNMA (11th District Cost of Funds +1.25%) ± | | | 2.31 | | | | 4-1-2042 | | | | 1,850,933 | | | | 1,842,029 | |
| | | | |
FNMA (11th District Cost of Funds +1.25%) ± | | | 2.31 | | | | 10-1-2044 | | | | 953,838 | | | | 948,922 | |
| | | | |
FNMA (11th District Cost of Funds +1.26%) ± | | | 2.33 | | | | 1-1-2035 | | | | 775,779 | | | | 781,015 | |
| | | | |
FNMA (11th District Cost of Funds +1.25%) ± | | | 2.33 | | | | 11-1-2023 | | | | 12,218 | | | | 12,122 | |
| | | | |
FNMA (11th District Cost of Funds +1.25%) ± | | | 2.38 | | | | 3-1-2021 | | | | 34 | | | | 34 | |
| | | | |
FNMA (11th District Cost of Funds +1.25%) ± | | | 2.38 | | | | 1-1-2038 | | | | 77,374 | | | | 77,098 | |
| | | | |
FNMA (11th District Cost of Funds +1.63%) ± | | | 2.44 | | | | 5-1-2028 | | | | 18,821 | | | | 18,790 | |
| | | | |
FNMA (3 Year Treasury Constant Maturity +1.21%) ± | | | 2.45 | | | | 3-1-2030 | | | | 16,583 | | | | 16,624 | |
| | | | |
FNMA (11th District Cost of Funds +1.25%) ± | | | 2.51 | | | | 9-1-2037 | | | | 1,816,484 | | | | 1,808,854 | |
| | | | |
FNMA (11th District Cost of Funds +1.45%) ± | | | 2.54 | | | | 4-1-2024 | | | | 1,431,977 | | | | 1,434,438 | |
| | | | |
FNMA (11th District Cost of Funds +1.78%) ± | | | 2.68 | | | | 1-1-2036 | | | | 203,290 | | | | 204,446 | |
| | | | |
FNMA (11th District Cost of Funds +1.87%) ± | | | 2.75 | | | | 10-1-2024 | | | | 664 | | | | 662 | |
| | | | |
FNMA (11th District Cost of Funds +1.25%) ± | | | 2.77 | | | | 7-1-2020 | | | | 203,298 | | | | 202,797 | |
| | | | |
FNMA (11th District Cost of Funds +1.82%) ± | | | 2.78 | | | | 5-1-2028 | | | | 43,040 | | | | 43,189 | |
| | | | |
FNMA (11th District Cost of Funds +1.92%) ± | | | 2.84 | | | | 9-1-2030 | | | | 228,256 | | | | 227,317 | |
| | | | |
FNMA (11th District Cost of Funds +1.83%) ± | | | 2.85 | | | | 1-1-2036 | | | | 56,960 | | | | 57,183 | |
| | | | |
FNMA (11th District Cost of Funds +1.79%) ± | | | 2.86 | | | | 3-1-2033 | | | | 257,013 | | | | 257,797 | |
| | | | |
FNMA (11th District Cost of Funds +1.78%) ± | | | 2.91 | | | | 11-1-2022 | | | | 15,555 | | | | 15,548 | |
| | | | |
FNMA (11th District Cost of Funds +1.86%) ± | | | 2.97 | | | | 10-1-2027 | | | | 398,000 | | | | 401,846 | |
| | | | |
FNMA (3 Year Treasury Constant Maturity +2.14%) ± | | | 3.02 | | | | 10-1-2025 | | | | 5,885 | | | | 5,893 | |
| | | | |
FNMA (11th District Cost of Funds +2.02%) ± | | | 3.02 | | | | 11-1-2024 | | | | 27,368 | | | | 27,554 | |
| | | | |
FNMA (11th District Cost of Funds +1.70%) ± | | | 3.03 | | | | 4-1-2030 | | | | 870 | | | | 863 | |
| | | | |
FNMA (11th District Cost of Funds +1.99%) ± | | | 3.05 | | | | 1-1-2021 | | | | 6,871 | | | | 6,861 | |
| | | | |
FNMA (11th District Cost of Funds +1.20%) ± | | | 3.05 | | | | 10-1-2034 | | | | 109,449 | | | | 109,850 | |
| | | | |
FNMA (11th District Cost of Funds +2.11%) ± | | | 3.06 | | | | 4-1-2020 | | | | 583,699 | | | | 582,572 | |
The accompanying notes are an integral part of these financial statements.
| | | | |
| 14 | | Wells Fargo Adjustable Rate Government Fund | | Portfolio of investments—February 28, 2019 (unaudited) |
| | | | | | | | | | | | | | | | |
| Security name | | Interest rate | | | Maturity date | | | Principal | | | Value | |
| | | | |
Agency Securities(continued) | | | | | | | | | | | | | | | | |
| | | | |
FNMA (11th District Cost of Funds +1.25%) ± | | | 3.15 | % | | | 4-1-2034 | | | $ | 1,115,831 | | | $ | 1,133,124 | |
| | | | |
FNMA (3 Year Treasury Constant Maturity +2.47%) ± | | | 3.22 | | | | 6-1-2024 | | | | 14,860 | | | | 14,914 | |
| | | | |
FNMA (1 Year Treasury Constant Maturity +1.25%) ± | | | 3.27 | | | | 1-1-2021 | | | | 611 | | | | 616 | |
| | | | |
FNMA (1 Year Treasury Constant Maturity +1.25%) ± | | | 3.28 | | | | 1-1-2021 | | | | 996 | | | | 1,006 | |
| | | | |
FNMA (1 Year Treasury Constant Maturity +1.58%) ± | | | 3.35 | | | | 3-1-2034 | | | | 296,340 | | | | 309,816 | |
| | | | |
FNMA (6 Month LIBOR +1.00%) ± | | | 3.50 | | | | 12-1-2020 | | | | 2,944 | | | | 2,939 | |
| | | | |
FNMA (Federal Cost of Funds +2.00%) ± | | | 3.50 | | | | 8-1-2029 | | | | 38,635 | | | | 40,265 | |
| | | | |
FNMA (1 Year Treasury Constant Maturity +1.67%) ± | | | 3.54 | | | | 4-1-2033 | | | | 177,149 | | | | 184,434 | |
| | | | |
FNMA (1 Month LIBOR +1.17%) ± | | | 3.55 | | | | 5-1-2029 | | | | 42,448 | | | | 43,858 | |
| | | | |
FNMA (6 Month LIBOR +1.00%) ± | | | 3.56 | | | | 6-1-2021 | | | | 13,655 | | | | 13,919 | |
| | | | |
FNMA (6 Month LIBOR +1.08%) ± | | | 3.58 | | | | 9-1-2032 | | | | 52,435 | | | | 52,371 | |
| | | | |
FNMA (5 Year Treasury Constant Maturity +1.90%) ± | | | 3.58 | | | | 9-1-2031 | | | | 192,250 | | | | 196,884 | |
| | | | |
FNMA (12 Month Treasury Average +1.40%) ± | | | 3.65 | | | | 12-1-2030 | | | | 68,630 | | | | 67,897 | |
| | | | |
FNMA (1 Year Treasury Constant Maturity +1.50%) ± | | | 3.72 | | | | 8-1-2030 | | | | 1,035,687 | | | | 1,058,864 | |
| | | | |
FNMA (6 Month LIBOR +1.18%) ± | | | 3.75 | | | | 8-1-2033 | | | | 168,213 | | | | 174,398 | |
| | | | |
FNMA (1 Year Treasury Constant Maturity +1.52%) ± | | | 3.75 | | | | 8-1-2033 | | | | 911,993 | | | | 939,584 | |
| | | | |
FNMA (1 Year Treasury Constant Maturity +1.89%) ± | | | 3.77 | | | | 6-1-2032 | | | | 57,298 | | | | 57,435 | |
| | | | |
FNMA (3 Year Treasury Constant Maturity +2.15%) ± | | | 3.77 | | | | 10-1-2024 | | | | 29,049 | | | | 29,203 | |
| | | | |
FNMA (1 Year Treasury Constant Maturity +2.28%) ± | | | 3.78 | | | | 7-1-2024 | | | | 8,595 | | | | 8,685 | |
| | | | |
FNMA (1 Year Treasury Constant Maturity +1.88%) ± | | | 3.85 | | | | 4-1-2030 | | | | 55,582 | | | | 55,966 | |
| | | | |
FNMA (6 Month LIBOR +1.38%) ± | | | 3.88 | | | | 8-1-2031 | | | | 124,956 | | | | 127,063 | |
| | | | |
FNMA (1 Year Treasury Constant Maturity +2.40%) ± | | | 3.90 | | | | 6-1-2024 | | | | 33,023 | | | | 33,296 | |
| | | | |
FNMA (12 Month LIBOR +1.75%) ± | | | 3.91 | | | | 4-1-2033 | | | | 351,616 | | | | 365,032 | |
| | | | |
FNMA (6 Month LIBOR +1.42%) ± | | | 3.92 | | | | 9-1-2031 | | | | 128,440 | | | | 131,476 | |
| | | | |
FNMA (6 Month LIBOR +1.42%) ± | | | 3.92 | | | | 12-1-2031 | | | | 30,241 | | | | 30,657 | |
| | | | |
FNMA (1 Year Treasury Constant Maturity +1.76%) ± | | | 3.97 | | | | 8-1-2032 | | | | 130,969 | | | | 133,474 | |
| | | | |
FNMA (1 Year Treasury Constant Maturity +2.19%) ± | | | 3.98 | | | | 3-1-2035 | | | | 471,030 | | | | 490,669 | |
| | | | |
FNMA (1 Year Treasury Constant Maturity +2.12%) ± | | | 4.00 | | | | 3-1-2031 | | | | 32,037 | | | | 32,076 | |
| | | | |
FNMA (6 Month LIBOR +1.16%) ± | | | 4.00 | | | | 8-1-2033 | | | | 3,341 | | | | 3,390 | |
| | | | |
FNMA (1 Year Treasury Constant Maturity +1.91%) ± | | | 4.00 | | | | 7-1-2038 | | | | 715,804 | | | | 744,833 | |
| | | | |
FNMA (1 Year Treasury Constant Maturity +2.13%) ± | | | 4.00 | | | | 5-1-2033 | | | | 523,221 | | | | 547,396 | |
| | | | |
FNMA (12 Month LIBOR +1.75%) ± | | | 4.01 | | | | 5-1-2035 | | | | 755,917 | | | | 791,515 | |
| | | | |
FNMA (1 Year Treasury Constant Maturity +2.13%) ± | | | 4.02 | | | | 5-1-2033 | | | | 354,883 | | | | 372,779 | |
| | | | |
FNMA (6 Month LIBOR +1.15%) ± | | | 4.02 | | | | 8-1-2032 | | | | 217,260 | | | | 217,649 | |
| | | | |
FNMA (6 Month LIBOR +1.41%) ± | | | 4.03 | | | | 10-1-2037 | | | | 644,772 | | | | 663,728 | |
| | | | |
FNMA (1 Year Treasury Constant Maturity +2.02%) ± | | | 4.04 | | | | 11-1-2027 | | | | 22,290 | | | | 22,384 | |
| | | | |
FNMA (6 Month LIBOR +1.42%) ± | | | 4.04 | | | | 12-1-2031 | | | | 210,491 | | | | 218,068 | |
| | | | |
FNMA (12 Month LIBOR +1.75%) ± | | | 4.04 | | | | 4-1-2034 | | | | 272,037 | | | | 285,208 | |
| | | | |
FNMA (6 Month LIBOR +1.52%) ± | | | 4.05 | | | | 11-1-2034 | | | | 345,302 | | | | 356,803 | |
| | | | |
FNMA (1 Year Treasury Constant Maturity +1.88%) ± | | | 4.06 | | | | 8-1-2031 | | | | 56,597 | | | | 58,639 | |
| | | | |
FNMA (1 Year Treasury Constant Maturity +2.18%) ± | | | 4.06 | | | | 5-1-2035 | | | | 179,701 | | | | 190,133 | |
| | | | |
FNMA (1 Year Treasury Constant Maturity +2.12%) ± | | | 4.07 | | | | 5-1-2034 | | | | 466,756 | | | | 489,232 | |
| | | | |
FNMA (12 Month LIBOR +1.68%) ± | | | 4.08 | | | | 11-1-2038 | | | | 384,254 | | | | 400,833 | |
| | | | |
FNMA (1 Year Treasury Constant Maturity +2.21%) ± | | | 4.08 | | | | 5-1-2037 | | | | 908,221 | | | | 949,301 | |
| | | | |
FNMA (1 Year Treasury Constant Maturity +2.15%) ± | | | 4.08 | | | | 4-1-2033 | | | | 841,931 | | | | 886,204 | |
| | | | |
FNMA (1 Year Treasury Constant Maturity +2.22%) ± | | | 4.09 | | | | 4-1-2033 | | | | 643,701 | | | | 669,979 | |
| | | | |
FNMA (6 Month LIBOR +1.55%) ± | | | 4.09 | | | | 3-1-2034 | | | | 246,716 | | | | 254,799 | |
| | | | |
FNMA (11th District Cost of Funds +1.87%) ± | | | 4.10 | | | | 5-1-2034 | | | | 159,382 | | | | 163,384 | |
| | | | |
FNMA (1 Year Treasury Constant Maturity +2.12%) ± | | | 4.12 | | | | 8-1-2026 | | | | 28,766 | | | | 29,019 | |
| | | | |
FNMA (Federal Cost of Funds +2.38%) ± | | | 4.12 | | | | 2-1-2029 | | | | 965,611 | | | | 990,049 | |
The accompanying notes are an integral part of these financial statements.
| | | | | | |
| Portfolio of investments—February 28, 2019 (unaudited) | | Wells Fargo Adjustable Rate Government Fund | | | 15 | |
| | | | | | | | | | | | | | | | |
| Security name | | Interest rate | | | Maturity date | | | Principal | | | Value | |
| | | | |
Agency Securities(continued) | | | | | | | | | | | | | | | | |
| | | | |
FNMA (1 Year Treasury Constant Maturity +2.25%) ± | | | 4.13 | % | | | 6-1-2025 | | | $ | 5,541 | | | $ | 5,540 | |
| | | | |
FNMA (1 Year Treasury Constant Maturity +2.26%) ± | | | 4.13 | | | | 5-1-2035 | | | | 412,387 | | | | 433,631 | |
| | | | |
FNMA (12 Month Treasury Average +1.88%) ± | | | 4.14 | | | | 11-1-2035 | | | | 30,817 | | | | 31,535 | |
| | | | |
FNMA (1 Year Treasury Constant Maturity +2.21%) ± | | | 4.14 | | | | 6-1-2033 | | | | 254,490 | | | | 263,550 | |
| | | | |
FNMA (12 Month Treasury Average +1.88%) ± | | | 4.15 | | | | 11-1-2035 | | | | 764,049 | | | | 795,376 | |
| | | | |
FNMA (1 Year Treasury Constant Maturity +2.06%) ± | | | 4.15 | | | | 9-1-2035 | | | | 1,451,941 | | | | 1,521,924 | |
| | | | |
FNMA (12 Month Treasury Average +1.92%) ± | | | 4.15 | | | | 6-1-2035 | | | | 607,057 | | | | 622,125 | |
| | | | |
FNMA (1 Year Treasury Constant Maturity +2.23%) ± | | | 4.15 | | | | 1-1-2032 | | | | 51,974 | | | | 52,732 | |
| | | | |
FNMA (1 Year Treasury Constant Maturity +2.32%) ± | | | 4.16 | | | | 4-1-2028 | | | | 122,755 | | | | 126,095 | |
| | | | |
FNMA (1 Year Treasury Constant Maturity +2.22%) ± | | | 4.16 | | | | 5-1-2033 | | | | 188,116 | | | | 197,934 | |
| | | | |
FNMA (6 Month LIBOR +1.55%) ± | | | 4.17 | | | | 12-1-2022 | | | | 4,503 | | | | 4,511 | |
| | | | |
FNMA (1 Year Treasury Constant Maturity +2.21%) ± | | | 4.17 | | | | 6-1-2035 | | | | 608,176 | | | | 641,189 | |
| | | | |
FNMA (12 Month Treasury Average +1.90%) ± | | | 4.17 | | | | 11-1-2035 | | | | 134,412 | | | | 138,011 | |
| | | | |
FNMA (1 Year Treasury Constant Maturity +2.11%) ± | | | 4.17 | | | | 9-1-2036 | | | | 340,576 | | | | 354,425 | |
| | | | |
FNMA (12 Month Treasury Average +1.95%) ± | | | 4.18 | | | | 7-1-2035 | | | | 685,605 | | | | 703,217 | |
| | | | |
FNMA (1 Year Treasury Constant Maturity +2.03%) ± | | | 4.19 | | | | 12-1-2032 | | | | 599,698 | | | | 621,065 | |
| | | | |
FNMA (1 Year Treasury Constant Maturity +2.24%) ± | | | 4.19 | | | | 7-1-2028 | | | | 143 | | | | 148 | |
| | | | |
FNMA (1 Year Treasury Constant Maturity +2.10%) ± | | | 4.19 | | | | 7-1-2035 | | | | 203,404 | | | | 210,361 | |
| | | | |
FNMA (1 Year Treasury Constant Maturity +2.31%) ± | | | 4.19 | | | | 5-1-2035 | | | | 914,021 | | | | 967,462 | |
| | | | |
FNMA (12 Month Treasury Average +2.48%) ± | | | 4.19 | | | | 6-1-2040 | | | | 739,211 | | | | 760,558 | |
| | | | |
FNMA (12 Month Treasury Average +1.97%) ± | | | 4.19 | | | | 7-1-2035 | | | | 949,362 | | | | 974,591 | |
| | | | |
FNMA (5 Year Treasury Constant Maturity +2.46%) ± | | | 4.21 | | | | 6-1-2019 | | | | 34 | | | | 34 | |
| | | | |
FNMA (5 Year Treasury Constant Maturity +2.43%) ± | | | 4.21 | | | | 6-1-2028 | | | | 27,481 | | | | 27,661 | |
| | | | |
FNMA (1 Year Treasury Constant Maturity +2.19%) ± | | | 4.21 | | | | 7-1-2035 | | | | 958,558 | | | | 1,009,814 | |
| | | | |
FNMA (1 Year Treasury Constant Maturity +2.09%) ± | | | 4.21 | | | | 8-1-2025 | | | | 18,671 | | | | 18,890 | |
| | | | |
FNMA (1 Year Treasury Constant Maturity +2.22%) ± | | | 4.21 | | | | 6-1-2035 | | | | 466,489 | | | | 491,332 | |
| | | | |
FNMA (1 Year Treasury Constant Maturity +2.20%) ± | | | 4.22 | | | | 6-1-2033 | | | | 353,539 | | | | 368,449 | |
| | | | |
FNMA (1 Year Treasury Constant Maturity +2.15%) ± | | | 4.22 | | | | 1-1-2037 | | | | 782,491 | | | | 822,844 | |
| | | | |
FNMA (12 Month Treasury Average +1.97%) ± | | | 4.24 | | | | 11-1-2035 | | | | 877,966 | | | | 905,879 | |
| | | | |
FNMA (6 Month LIBOR +1.74%) ± | | | 4.24 | | | | 10-1-2024 | | | | 35,711 | | | | 35,839 | |
| | | | |
FNMA (12 Month LIBOR +1.74%) ± | | | 4.24 | | | | 5-1-2032 | | | | 163,389 | | | | 165,857 | |
| | | | |
FNMA (6 Month LIBOR +1.37%) ± | | | 4.24 | | | | 1-1-2032 | | | | 207,090 | | | | 214,161 | |
| | | | |
FNMA (6 Month LIBOR +1.73%) ± | | | 4.24 | | | | 4-1-2033 | | | | 312,314 | | | | 328,043 | |
| | | | |
FNMA (12 Month LIBOR +1.72%) ± | | | 4.24 | | | | 12-1-2033 | | | | 908,669 | | | | 948,567 | |
| | | | |
FNMA (11th District Cost of Funds +1.82%) ± | | | 4.24 | | | | 6-1-2034 | | | | 145,143 | | | | 149,293 | |
| | | | |
FNMA (11th District Cost of Funds +1.93%) ± | | | 4.25 | | | | 12-1-2036 | | | | 77,143 | | | | 80,302 | |
| | | | |
FNMA (6 Month LIBOR +1.63%) ± | | | 4.25 | | | | 1-1-2022 | | | | 5,101 | | | | 5,095 | |
| | | | |
FNMA (6 Month LIBOR +1.38%) ± | | | 4.25 | | | | 12-1-2031 | | | | 18,364 | | | | 18,401 | |
| | | | |
FNMA (1 Year Treasury Constant Maturity +2.18%) ± | | | 4.25 | | | | 6-1-2035 | | | | 367,079 | | | | 386,499 | |
| | | | |
FNMA (1 Year Treasury Constant Maturity +2.22%) ± | | | 4.27 | | | | 8-1-2026 | | | | 270,084 | | | | 280,459 | |
| | | | |
FNMA (12 Month Treasury Average +1.99%) ± | | | 4.27 | | | | 10-1-2035 | | | | 454,682 | | | | 467,348 | |
| | | | |
FNMA (12 Month LIBOR +1.53%) ± | | | 4.27 | | | | 9-1-2035 | | | | 1,055,005 | | | | 1,095,520 | |
| | | | |
FNMA (1 Year Treasury Constant Maturity +2.22%) ± | | | 4.28 | | | | 6-1-2027 | | | | 76,299 | | | | 77,676 | |
| | | | |
FNMA (1 Year Treasury Constant Maturity +2.38%) ± | | | 4.29 | | | | 4-1-2038 | | | | 415,820 | | | | 434,722 | |
| | | | |
FNMA (1 Year Treasury Constant Maturity +2.35%) ± | | | 4.29 | | | | 6-1-2027 | | | | 67,291 | | | | 68,052 | |
| | | | |
FNMA (1 Year Treasury Constant Maturity +2.27%) ± | | | 4.30 | | | | 6-1-2036 | | | | 140,109 | | | | 148,008 | |
| | | | |
FNMA (1 Year Treasury Constant Maturity +2.20%) ± | | | 4.31 | | | | 9-1-2035 | | | | 419,734 | | | | 442,351 | |
| | | | |
FNMA (6 Month LIBOR +1.54%) ± | | | 4.32 | | | | 1-1-2035 | | | | 1,151,163 | | | | 1,189,519 | |
| | | | |
FNMA (1 Year Treasury Constant Maturity +2.14%) ± | | | 4.32 | | | | 10-1-2033 | | | | 243,173 | | | | 254,776 | |
| | | | |
FNMA (1 Year Treasury Constant Maturity +2.11%) ± | | | 4.32 | | | | 7-1-2035 | | | | 535,047 | | | | 560,531 | |
The accompanying notes are an integral part of these financial statements.
| | | | |
| 16 | | Wells Fargo Adjustable Rate Government Fund | | Portfolio of investments—February 28, 2019 (unaudited) |
| | | | | | | | | | | | | | | | |
| Security name | | Interest rate | | | Maturity date | | | Principal | | | Value | |
| | | | |
Agency Securities(continued) | | | | | | | | | | | | | | | | |
| | | | |
FNMA (12 Month LIBOR +1.80%) ± | | | 4.32 | % | | | 5-1-2033 | | | $ | 375,670 | | | $ | 392,792 | |
| | | | |
FNMA (12 Month Treasury Average +2.08%) ± | | | 4.33 | | | | 1-1-2035 | | | | 372,419 | | | | 381,589 | |
| | | | |
FNMA (1 Year Treasury Constant Maturity +2.19%) ± | | | 4.33 | | | | 2-1-2036 | | | | 537,788 | | | | 564,370 | |
| | | | |
FNMA (1 Year Treasury Constant Maturity +2.24%) ± | | | 4.33 | | | | 12-1-2040 | | | | 1,272,970 | | | | 1,339,166 | |
| | | | |
FNMA (12 Month LIBOR +1.70%) ± | | | 4.33 | | | | 3-1-2037 | | | | 329,216 | | | | 345,520 | |
| | | | |
FNMA (12 Month LIBOR +1.61%) ± | | | 4.33 | | | | 1-1-2040 | | | | 205,221 | | | | 214,154 | |
| | | | |
FNMA (1 Year Treasury Constant Maturity +2.25%) ± | | | 4.33 | | | | 4-1-2033 | | | | 439,276 | | | | 461,825 | |
| | | | |
FNMA (12 Month LIBOR +1.70%) ± | | | 4.33 | | | | 4-1-2034 | | | | 535,101 | | | | 558,514 | |
| | | | |
FNMA (1 Year Treasury Constant Maturity +2.06%) ± | | | 4.34 | | | | 12-1-2033 | | | | 655,674 | | | | 678,684 | |
| | | | |
FNMA (1 Year Treasury Constant Maturity +2.23%) ± | | | 4.34 | | | | 7-1-2037 | | | | 375,664 | | | | 395,473 | |
| | | | |
FNMA (1 Year Treasury Constant Maturity +2.33%) ± | | | 4.34 | | | | 9-1-2037 | | | | 546,686 | | | | 580,751 | |
| | | | |
FNMA (12 Month LIBOR +1.75%) ± | | | 4.34 | | | | 7-1-2035 | | | | 495,569 | | | | 519,033 | |
| | | | |
FNMA (1 Year Treasury Constant Maturity +2.22%) ± | | | 4.35 | | | | 7-1-2035 | | | | 157,303 | | | | 165,468 | |
| | | | |
FNMA (1 Year Treasury Constant Maturity +1.63%) ± | | | 4.36 | | | | 11-1-2029 | | | | 7,155 | | | | 7,167 | |
| | | | |
FNMA (1 Year Treasury Constant Maturity +2.18%) ± | | | 4.36 | | | | 9-1-2036 | | | | 483,206 | | | | 510,981 | |
| | | | |
FNMA (1 Year Treasury Constant Maturity +2.18%) ± | | | 4.36 | | | | 1-1-2036 | | | | 810,595 | | | | 851,110 | |
| | | | |
FNMA (6 Month LIBOR +1.74%) ± | | | 4.37 | | | | 12-1-2024 | | | | 50,947 | | | | 51,037 | |
| | | | |
FNMA (1 Year Treasury Constant Maturity +1.74%) ± | | | 4.37 | | | | 1-1-2035 | | | | 41,777 | | | | 43,323 | |
| | | | |
FNMA (US Treasury H15 Treasury Bill 6 Month Auction High Discount +2.25%) ± | | | 4.37 | | | | 7-1-2020 | | | | 361 | | | | 360 | |
| | | | |
FNMA (1 Year Treasury Constant Maturity +2.21%) ± | | | 4.38 | | | | 7-1-2033 | | | | 57,640 | | | | 60,538 | |
| | | | |
FNMA (1 Year Treasury Constant Maturity +2.23%) ± | | | 4.38 | | | | 1-1-2035 | | | | 468,133 | | | | 492,120 | |
| | | | |
FNMA (1 Year Treasury Constant Maturity +2.31%) ± | | | 4.39 | | | | 2-1-2035 | | | | 494,654 | | | | 518,940 | |
| | | | |
FNMA (12 Month LIBOR +1.84%) ± | | | 4.39 | | | | 6-1-2041 | | | | 641,883 | | | | 670,407 | |
| | | | |
FNMA (12 Month LIBOR +1.74%) ± | | | 4.39 | | | | 6-1-2041 | | | | 577,219 | | | | 600,089 | |
| | | | |
FNMA (12 Month LIBOR +1.68%) ± | | | 4.40 | | | | 9-1-2038 | | | | 678,540 | | | | 709,043 | |
| | | | |
FNMA (12 Month LIBOR +1.67%) ± | | | 4.40 | | | | 7-1-2035 | | | | 1,117,846 | | | | 1,168,439 | |
| | | | |
FNMA (12 Month LIBOR +1.65%) ± | | | 4.40 | | | | 9-1-2037 | | | | 568,412 | | | | 591,430 | |
| | | | |
FNMA (12 Month LIBOR +1.71%) ± | | | 4.40 | | | | 2-1-2038 | | | | 496,963 | | | | 518,611 | |
| | | | |
FNMA (1 Year Treasury Constant Maturity +2.04%) ± | | | 4.41 | | | | 6-1-2034 | | | | 469,613 | | | | 491,424 | |
| | | | |
FNMA (12 Month LIBOR +1.72%) ± | | | 4.41 | | | | 6-1-2035 | | | | 151,310 | | | | 158,426 | |
| | | | |
FNMA (1 Year Treasury Constant Maturity +2.25%) ± | | | 4.41 | | | | 10-1-2029 | | | | 66,859 | | | | 68,151 | |
| | | | |
FNMA (12 Month LIBOR +1.79%) ± | | | 4.41 | | | | 6-1-2036 | | | | 239,119 | | | | 250,717 | |
| | | | |
FNMA (1 Year Treasury Constant Maturity +2.29%) ± | | | 4.42 | | | | 6-1-2037 | | | | 537,895 | | | | 562,125 | |
| | | | |
FNMA (1 Year Treasury Constant Maturity +1.70%) ± | | | 4.42 | | | | 2-1-2033 | | | | 268,654 | | | | 276,940 | |
| | | | |
FNMA (1 Year Treasury Constant Maturity +2.23%) ± | | | 4.42 | | | | 11-1-2037 | | | | 540,869 | | | | 567,962 | |
| | | | |
FNMA (1 Year Treasury Constant Maturity +2.22%) ± | | | 4.42 | | | | 4-1-2038 | | | | 701,029 | | | | 734,928 | |
| | | | |
FNMA (12 Month LIBOR +1.62%) ± | | | 4.42 | | | | 9-1-2036 | | | | 633,070 | | | | 656,631 | |
| | | | |
FNMA (1 Year Treasury Constant Maturity +2.11%) ± | | | 4.42 | | | | 5-1-2034 | | | | 600,943 | | | | 631,756 | |
| | | | |
FNMA (1 Year Treasury Constant Maturity +2.43%) ± | | | 4.43 | | | | 7-1-2037 | | | | 411,726 | | | | 430,725 | |
| | | | |
FNMA (1 Year Treasury Constant Maturity +2.21%) ± | | | 4.43 | | | | 1-1-2027 | | | | 292,879 | | | | 295,495 | |
| | | | |
FNMA (1 Year Treasury Constant Maturity +2.22%) ± | | | 4.43 | | | | 9-1-2033 | | | | 446,325 | | | | 465,471 | |
| | | | |
FNMA (1 Year Treasury Constant Maturity +2.18%) ± | | | 4.43 | | | | 12-1-2040 | | | | 263,328 | | | | 276,210 | |
| | | | |
FNMA (1 Year Treasury Constant Maturity +2.22%) ± | | | 4.44 | | | | 7-1-2035 | | | | 658,325 | | | | 692,541 | |
| | | | |
FNMA (1 Year Treasury Constant Maturity +2.22%) ± | | | 4.44 | | | | 5-1-2033 | | | | 1,170,823 | | | | 1,215,757 | |
| | | | |
FNMA ±± | | | 4.44 | | | | 11-1-2019 | | | | 31 | | | | 31 | |
| | | | |
FNMA (1 Year Treasury Constant Maturity +2.20%) ± | | | 4.44 | | | | 7-1-2029 | | | | 400,369 | | | | 420,898 | |
| | | | |
FNMA (1 Year Treasury Constant Maturity +2.34%) ± | | | 4.44 | | | | 3-1-2033 | | | | 986,139 | | | | 1,042,118 | |
| | | | |
FNMA (1 Year Treasury Constant Maturity +2.19%) ± | | | 4.44 | | | | 8-1-2033 | | | | 521,463 | | | | 545,081 | |
| | | | |
FNMA (1 Year Treasury Constant Maturity +2.21%) ± | | | 4.44 | | | | 8-1-2035 | | | | 984,533 | | | | 1,039,511 | |
| | | | |
FNMA (1 Year Treasury Constant Maturity +2.43%) ± | | | 4.44 | | | | 7-1-2037 | | | | 1,702,092 | | | | 1,806,405 | |
The accompanying notes are an integral part of these financial statements.
| | | | | | |
| Portfolio of investments—February 28, 2019 (unaudited) | | Wells Fargo Adjustable Rate Government Fund | | | 17 | |
| | | | | | | | | | | | | | | | |
| Security name | | Interest rate | | | Maturity date | | | Principal | | | Value | |
| | | | |
Agency Securities(continued) | | | | | | | | | | | | | | | | |
| | | | |
FNMA (1 Year Treasury Constant Maturity +2.14%) ± | | | 4.45 | % | | | 5-1-2035 | | | $ | 561,065 | | | $ | 588,004 | |
| | | | |
FNMA (1 Year Treasury Constant Maturity +1.82%) ± | | | 4.45 | | | | 4-1-2038 | | | | 382,435 | | | | 400,089 | |
| | | | |
FNMA (1 Year Treasury Constant Maturity +2.14%) ± | | | 4.45 | | | | 4-1-2040 | | | | 131,511 | | | | 137,886 | |
| | | | |
FNMA (1 Year Treasury Constant Maturity +2.58%) ± | | | 4.45 | | | | 12-1-2021 | | | | 2,358 | | | | 2,355 | |
| | | | |
FNMA (1 Year Treasury Constant Maturity +2.32%) ± | | | 4.46 | | | | 10-1-2034 | | | | 250,681 | | | | 265,306 | |
| | | | |
FNMA (1 Year Treasury Constant Maturity +2.22%) ± | | | 4.46 | | | | 5-1-2033 | | | | 222,473 | | | | 228,630 | |
| | | | |
FNMA (1 Year Treasury Constant Maturity +2.19%) ± | | | 4.46 | | | | 6-1-2036 | | | | 1,048,764 | | | | 1,099,581 | |
| | | | |
FNMA (1 Year Treasury Constant Maturity +2.22%) ± | | | 4.46 | | | | 12-1-2040 | | | | 752,009 | | | | 790,046 | |
| | | | |
FNMA (1 Year Treasury Constant Maturity +2.21%) ± | | | 4.46 | | | | 9-1-2022 | | | | 71,485 | | | | 71,945 | |
| | | | |
FNMA (1 Year Treasury Constant Maturity +2.25%) ± | | | 4.46 | | | | 5-1-2036 | | | | 1,382,395 | | | | 1,439,549 | |
| | | | |
FNMA (1 Year Treasury Constant Maturity +2.21%) ± | | | 4.46 | | | | 7-1-2035 | | | | 454,160 | | | | 481,212 | |
| | | | |
FNMA (1 Year Treasury Constant Maturity +2.24%) ± | | | 4.46 | | | | 12-1-2040 | | | | 527,469 | | | | 554,512 | |
| | | | |
FNMA (1 Year Treasury Constant Maturity +2.24%) ± | | | 4.47 | | | | 1-1-2037 | | | | 1,102,955 | | | | 1,159,674 | |
| | | | |
FNMA (1 Year Treasury Constant Maturity +2.22%) ± | | | 4.47 | | | | 6-1-2036 | | | | 571,364 | | | | 600,466 | |
| | | | |
FNMA (1 Year Treasury Constant Maturity +2.25%) ± | | | 4.47 | | | | 5-1-2034 | | | | 236,437 | | | | 248,808 | |
| | | | |
FNMA (1 Year Treasury Constant Maturity +2.28%) ± | | | 4.47 | | | | 10-1-2036 | | | | 524,812 | | | | 551,738 | |
| | | | |
FNMA (1 Year Treasury Constant Maturity +2.30%) ± | | | 4.47 | | | | 9-1-2030 | | | | 94,628 | | | | 95,903 | |
| | | | |
FNMA (1 Year Treasury Constant Maturity +2.18%) ± | | | 4.47 | | | | 1-1-2033 | | | | 1,642,118 | | | | 1,689,583 | |
| | | | |
FNMA (1 Year Treasury Constant Maturity +2.35%) ± | | | 4.48 | | | | 6-1-2030 | | | | 50,007 | | | | 50,715 | |
| | | | |
FNMA (6 Month LIBOR +1.98%) ± | | | 4.48 | | | | 9-1-2033 | | | | 53,582 | | | | 54,004 | |
| | | | |
FNMA (1 Year Treasury Constant Maturity +2.19%) ± | | | 4.48 | | | | 10-1-2036 | | | | 646,430 | | | | 678,759 | |
| | | | |
FNMA (1 Year Treasury Constant Maturity +2.50%) ± | | | 4.48 | | | | 10-1-2029 | | | | 305,667 | | | | 318,145 | |
| | | | |
FNMA (1 Year Treasury Constant Maturity +2.35%) ± | | | 4.48 | | | | 12-1-2030 | | | | 650,256 | | | | 677,980 | |
| | | | |
FNMA (1 Year Treasury Constant Maturity +2.13%) ± | | | 4.49 | | | | 10-1-2025 | | | | 84,096 | | | | 85,465 | |
| | | | |
FNMA (12 Month LIBOR +1.70%) ± | | | 4.49 | | | | 8-1-2036 | | | | 504,069 | | | | 527,167 | |
| | | | |
FNMA (1 Year Treasury Constant Maturity +2.19%) ± | | | 4.50 | | | | 5-1-2036 | | | | 625,270 | | | | 654,418 | |
| | | | |
FNMA (1 Year Treasury Constant Maturity +2.28%) ± | | | 4.50 | | | | 4-1-2024 | | | | 9,380 | | | | 9,620 | |
| | | | |
FNMA (1 Year Treasury Constant Maturity +2.24%) ± | | | 4.50 | | | | 10-1-2035 | | | | 764,746 | | | | 803,694 | |
| | | | |
FNMA (1 Year Treasury Constant Maturity +2.22%) ± | | | 4.51 | | | | 12-1-2036 | | | | 405,688 | | | | 426,405 | |
| | | | |
FNMA (12 Month LIBOR +1.88%) ± | | | 4.51 | | | | 5-1-2037 | | | | 1,531,603 | | | | 1,615,248 | |
| | | | |
FNMA (1 Year Treasury Constant Maturity +2.17%) ± | | | 4.51 | | | | 12-1-2034 | | | | 581,823 | | | | 609,778 | |
| | | | |
FNMA (1 Year Treasury Constant Maturity +2.18%) ± | | | 4.51 | | | | 9-1-2035 | | | | 1,109,662 | | | | 1,165,212 | |
| | | | |
FNMA (6 Month LIBOR +1.64%) ± | | | 4.52 | | | | 2-1-2033 | | | | 127,558 | | | | 131,059 | |
| | | | |
FNMA (1 Year Treasury Constant Maturity +2.28%) ± | | | 4.53 | | | | 9-1-2026 | | | | 31,712 | | | | 32,173 | |
| | | | |
FNMA (1 Year Treasury Constant Maturity +2.47%) ± | | | 4.53 | | | | 9-1-2035 | | | | 45,089 | | | | 47,806 | |
| | | | |
FNMA (1 Year Treasury Constant Maturity +2.19%) ± | | | 4.53 | | | | 12-1-2035 | | | | 287,615 | | | | 302,017 | |
| | | | |
FNMA (1 Year Treasury Constant Maturity +2.28%) ± | | | 4.54 | | | | 4-1-2024 | | | | 32,072 | | | | 32,294 | |
| | | | |
FNMA (1 Year Treasury Constant Maturity +2.29%) ± | | | 4.54 | | | | 12-1-2030 | | | | 20,700 | | | | 21,031 | |
| | | | |
FNMA (12 Month LIBOR +1.67%) ± | | | 4.54 | | | | 9-1-2034 | | | | 838,900 | | | | 882,305 | |
| | | | |
FNMA (1 Year Treasury Constant Maturity +2.20%) ± | | | 4.54 | | | | 11-1-2035 | | | | 1,058,214 | | | | 1,111,545 | |
| | | | |
FNMA (1 Year Treasury Constant Maturity +2.19%) ± | | | 4.55 | | | | 12-1-2032 | | | | 436,090 | | | | 458,804 | |
| | | | |
FNMA (12 Month Treasury Average +2.27%) ± | | | 4.55 | | | | 9-1-2036 | | | | 391,294 | | | | 406,569 | |
| | | | |
FNMA (6 Month LIBOR +1.93%) ± | | | 4.55 | | | | 6-1-2032 | | | | 67,376 | | | | 68,040 | |
| | | | |
FNMA (1 Year Treasury Constant Maturity +2.13%) ± | | | 4.56 | | | | 10-1-2035 | | | | 147,182 | | | | 154,415 | |
| | | | |
FNMA (1 Year Treasury Constant Maturity +2.25%) ± | | | 4.56 | | | | 7-1-2030 | | | | 395,477 | | | | 411,813 | |
| | | | |
FNMA (1 Year Treasury Constant Maturity +2.24%) ± | | | 4.56 | | | | 2-1-2033 | | | | 135,566 | | | | 138,654 | |
| | | | |
FNMA (12 Month LIBOR +1.87%) ± | | | 4.57 | | | | 5-1-2038 | | | | 616,848 | | | | 649,828 | |
| | | | |
FNMA (1 Year Treasury Constant Maturity +2.22%) ± | | | 4.57 | | | | 2-1-2034 | | | | 1,209,712 | | | | 1,262,949 | |
| | | | |
FNMA (12 Month Treasury Average +2.27%) ± | | | 4.57 | | | | 8-1-2035 | | | | 564,230 | | | | 578,728 | |
| | | | |
FNMA (1 Year Treasury Constant Maturity +2.19%) ± | | | 4.58 | | | | 9-1-2035 | | | | 144,449 | | | | 152,063 | |
The accompanying notes are an integral part of these financial statements.
| | | | |
| 18 | | Wells Fargo Adjustable Rate Government Fund | | Portfolio of investments—February 28, 2019 (unaudited) |
| | | | | | | | | | | | | | | | |
| Security name | | Interest rate | | | Maturity date | | | Principal | | | Value | |
| | | | |
Agency Securities(continued) | | | | | | | | | | | | | | | | |
| | | | |
FNMA (1 Year Treasury Constant Maturity +2.18%) ± | | | 4.58 | % | | | 11-1-2038 | | | $ | 481,874 | | | $ | 506,870 | |
| | | | |
FNMA (1 Year Treasury Constant Maturity +2.08%) ± | | | 4.59 | | | | 11-1-2035 | | | | 564,951 | | | | 591,900 | |
| | | | |
FNMA (1 Year Treasury Constant Maturity +2.41%) ± | | | 4.59 | | | | 5-1-2027 | | | | 54,191 | | | | 56,026 | |
| | | | |
FNMA (1 Year Treasury Constant Maturity +2.34%) ± | | | 4.60 | | | | 1-1-2037 | | | | 662,030 | | | | 699,985 | |
| | | | |
FNMA (1 Year Treasury Constant Maturity +2.34%) ± | | | 4.60 | | | | 7-1-2028 | | | | 465,332 | | | | 480,693 | |
| | | | |
FNMA (12 Month Treasury Average +2.35%) ± | | | 4.60 | | | | 8-1-2040 | | | | 441,798 | | | | 453,415 | |
| | | | |
FNMA (1 Year Treasury Constant Maturity +2.22%) ± | | | 4.60 | | | | 6-1-2026 | | | | 15,348 | | | | 15,748 | |
| | | | |
FNMA (1 Year Treasury Constant Maturity +2.64%) ± | | | 4.60 | | | | 3-1-2030 | | | | 6,699 | | | | 6,853 | |
| | | | |
FNMA (1 Year Treasury Constant Maturity +2.69%) ± | | | 4.60 | | | | 5-1-2035 | | | | 574,273 | | | | 613,814 | |
| | | | |
FNMA (1 Year Treasury Constant Maturity +2.31%) ± | | | 4.60 | | | | 4-1-2036 | | | | 516,611 | | | | 544,166 | |
| | | | |
FNMA (1 Year Treasury Constant Maturity +2.40%) ± | | | 4.61 | | | | 9-1-2030 | | | | 253,952 | | | | 268,724 | |
| | | | |
FNMA (1 Year Treasury Constant Maturity +2.17%) ± | | | 4.61 | | | | 12-1-2034 | | | | 890,965 | | | | 934,397 | |
| | | | |
FNMA (12 Month LIBOR +1.83%) ± | | | 4.61 | | | | 4-1-2035 | | | | 880,227 | | | | 922,449 | |
| | | | |
FNMA (6 Month LIBOR +1.99%) ± | | | 4.62 | | | | 10-1-2024 | | | | 66,067 | | | | 67,805 | |
| | | | |
FNMA (1 Year Treasury Constant Maturity +2.38%) ± | | | 4.63 | | | | 7-1-2027 | | | | 85,961 | | | | 87,858 | |
| | | | |
FNMA (1 Year Treasury Constant Maturity +2.36%) ± | | | 4.63 | | | | 1-1-2029 | | | | 204,581 | | | | 211,307 | |
| | | | |
FNMA (1 Year Treasury Constant Maturity +2.33%) ± | | | 4.63 | | | | 11-1-2024 | | | | 60,180 | | | | 61,848 | |
| | | | |
FNMA (1 Year Treasury Constant Maturity +2.26%) ± | | | 4.64 | | | | 1-1-2038 | | | | 534,724 | | | | 563,513 | |
| | | | |
FNMA (1 Year Treasury Constant Maturity +2.37%) ± | | | 4.64 | | | | 9-1-2030 | | | | 634,457 | | | | 671,829 | |
| | | | |
FNMA (12 Month Treasury Average +2.37%) ± | | | 4.64 | | | | 5-1-2036 | | | | 312,674 | | | | 326,086 | |
| | | | |
FNMA (12 Month LIBOR +1.80%) ± | | | 4.64 | | | | 7-1-2033 | | | | 625,445 | | | | 655,415 | |
| | | | |
FNMA (12 Month LIBOR +1.90%) ± | | | 4.65 | | | | 10-1-2034 | | | | 418,989 | | | | 444,594 | |
| | | | |
FNMA (12 Month LIBOR +1.64%) ± | | | 4.65 | | | | 12-1-2033 | | | | 954,309 | | | | 998,199 | |
| | | | |
FNMA (1 Year Treasury Constant Maturity +2.09%) ± | | | 4.65 | | | | 1-1-2036 | | | | 162,783 | | | | 170,700 | |
| | | | |
FNMA (12 Month LIBOR +1.91%) ± | | | 4.66 | | | | 8-1-2034 | | | | 1,458,137 | | | | 1,535,618 | |
| | | | |
FNMA (1 Year Treasury Constant Maturity +2.22%) ± | | | 4.66 | | | | 10-1-2034 | | | | 251,938 | | | | 266,806 | |
| | | | |
FNMA (1 Year Treasury Constant Maturity +2.17%) ± | | | 4.67 | | | | 12-1-2039 | | | | 188,423 | | | | 193,355 | |
| | | | |
FNMA (1 Year Treasury Constant Maturity +2.23%) ± | | | 4.68 | | | | 5-1-2035 | | | | 895,701 | | | | 943,080 | |
| | | | |
FNMA (11th District Cost of Funds +2.21%) ± | | | 4.68 | | | | 7-1-2021 | | | | 3,972 | | | | 3,970 | |
| | | | |
FNMA (US Treasury H15 Treasury Bill 6 Month Auction High Discount +2.23%) ± | | | 4.69 | | | | 7-1-2025 | | | | 1,991 | | | | 2,038 | |
| | | | |
FNMA (1 Year Treasury Constant Maturity +2.30%) ± | | | 4.69 | | | | 1-1-2026 | | | | 180,565 | | | | 186,334 | |
| | | | |
FNMA (1 Year Treasury Constant Maturity +2.50%) ± | | | 4.69 | | | | 9-1-2030 | | | | 488,919 | | | | 510,307 | |
| | | | |
FNMA (1 Year Treasury Constant Maturity +2.47%) ± | | | 4.72 | | | | 9-1-2028 | | | | 37,718 | | | | 38,364 | |
| | | | |
FNMA (1 Year Treasury Constant Maturity +2.36%) ± | | | 4.72 | | | | 11-1-2034 | | | | 357,292 | | | | 377,570 | |
| | | | |
FNMA (6 Month LIBOR +2.10%) ± | | | 4.72 | | | | 2-1-2033 | | | | 349,505 | | | | 366,814 | |
| | | | |
FNMA (12 Month LIBOR +1.98%) ± | | | 4.73 | | | | 9-1-2035 | | | | 435,561 | | | | 460,653 | |
| | | | |
FNMA (1 Year Treasury Constant Maturity +2.87%) ± | | | 4.75 | | | | 8-1-2030 | | | | 77,484 | | | | 78,378 | |
| | | | |
FNMA (12 Month LIBOR +1.75%) ± | | | 4.77 | | | | 1-1-2035 | | | | 514,692 | | | | 539,054 | |
| | | | |
FNMA (12 Month LIBOR +1.82%) ± | | | 4.77 | | | | 12-1-2046 | | | | 627,778 | | | | 665,722 | |
| | | | |
FNMA (1 Year Treasury Constant Maturity +2.31%) ± | | | 4.78 | | | | 12-1-2034 | | | | 681,903 | | | | 718,936 | |
| | | | |
FNMA (1 Year Treasury Constant Maturity +2.18%) ± | | | 4.80 | | | | 12-1-2024 | | | | 22,419 | | | | 22,605 | |
| | | | |
FNMA (12 Month LIBOR +1.83%) ± | | | 4.81 | | | | 1-1-2033 | | | | 658,038 | | | | 690,550 | |
| | | | |
FNMA (1 Year Treasury Constant Maturity +2.41%) ± | | | 4.81 | | | | 9-1-2033 | | | | 488,780 | | | | 516,352 | |
| | | | |
FNMA (1 Year Treasury Constant Maturity +2.32%) ± | | | 4.82 | | | | 5-1-2025 | | | | 30,978 | | | | 31,116 | |
| | | | |
FNMA (1 Year Treasury Constant Maturity +2.29%) ± | | | 4.83 | | | | 1-1-2031 | | | | 307,719 | | | | 324,718 | |
| | | | |
FNMA (1 Year Treasury Constant Maturity +2.20%) ± | | | 4.83 | | | | 2-1-2035 | | | | 168,606 | | | | 177,237 | |
| | | | |
FNMA (1 Year Treasury Constant Maturity +2.22%) ± | | | 4.85 | | | | 8-1-2031 | | | | 104,968 | | | | 107,093 | |
| | | | |
FNMA (6 Month LIBOR +2.25%) ± | | | 4.87 | | | | 3-1-2034 | | | | 1,018,176 | | | | 1,076,793 | |
| | | | |
FNMA (1 Year Treasury Constant Maturity +2.25%) ± | | | 4.87 | | | | 6-1-2027 | | | | 692 | | | | 710 | |
| | | | |
FNMA (1 Year Treasury Constant Maturity +2.37%) ± | | | 4.87 | | | | 7-1-2027 | | | | 20,431 | | | | 20,613 | |
The accompanying notes are an integral part of these financial statements.
| | | | | | |
| Portfolio of investments—February 28, 2019 (unaudited) | | Wells Fargo Adjustable Rate Government Fund | | | 19 | |
| | | | | | | | | | | | | | | | |
| Security name | | Interest rate | | | Maturity date | | | Principal | | | Value | |
| | | | |
Agency Securities(continued) | | | | | | | | | | | | | | | | |
| | | | |
FNMA (3 Year Treasury Constant Maturity +2.15%) ± | | | 4.88 | % | | | 8-1-2031 | | | $ | 33,494 | | | $ | 33,914 | |
| | | | |
FNMA (6 Month LIBOR +2.43%) ± | | | 4.91 | | | | 1-1-2033 | | | | 90,253 | | | | 92,135 | |
| | | | |
FNMA (1 Year Treasury Constant Maturity +2.64%) ± | | | 4.92 | | | | 7-1-2028 | | | | 96,161 | | | | 98,074 | |
| | | | |
FNMA (1 Year Treasury Constant Maturity +2.18%) ± | | | 4.93 | | | | 1-1-2035 | | | | 83,941 | | | | 87,175 | |
| | | | |
FNMA (1 Year Treasury Constant Maturity +2.32%) ± | | | 4.95 | | | | 1-1-2028 | | | | 2,036 | | | | 2,043 | |
| | | | |
FNMA (1 Year Treasury Constant Maturity +2.32%) ± | | | 4.95 | | | | 6-1-2032 | | | | 20,377 | | | | 20,570 | |
| | | | |
FNMA (1 Year Treasury Constant Maturity +2.46%) ± | | | 4.98 | | | | 8-1-2035 | | | | 461,524 | | | | 484,853 | |
| | | | |
FNMA (1 Year Treasury Constant Maturity +2.48%) ± | | | 5.00 | | | | 5-1-2035 | | | | 1,123,107 | | | | 1,190,757 | |
| | | | |
FNMA (1 Year Treasury Constant Maturity +2.50%) ± | | | 5.00 | | | | 3-1-2027 | | | | 76,433 | | | | 78,694 | |
| | | | |
FNMA (1 Year Treasury Constant Maturity +2.52%) ± | | | 5.02 | | | | 11-1-2024 | | | | 55,202 | | | | 55,364 | |
| | | | |
FNMA (1 Year Treasury Constant Maturity +2.60%) ± | | | 5.02 | | | | 10-1-2025 | | | | 7,235 | | | | 7,332 | |
| | | | |
FNMA (1 Year Treasury Constant Maturity +2.28%) ± | | | 5.03 | | | | 2-1-2037 | | | | 671,743 | | | | 710,917 | |
| | | | |
FNMA (1 Year Treasury Constant Maturity +2.58%) ± | | | 5.10 | | | | 3-1-2032 | | | | 112,506 | | | | 115,689 | |
| | | | |
FNMA (6 Month LIBOR +2.64%) ± | | | 5.13 | | | | 4-1-2033 | | | | 247,074 | | | | 258,585 | |
| | | | |
FNMA (1 Year Treasury Constant Maturity +2.64%) ± | | | 5.19 | | | | 10-1-2028 | | | | 109,607 | | | | 112,275 | |
| | | | |
FNMA (1 Year Treasury Constant Maturity +2.60%) ± | | | 5.22 | | | | 2-1-2028 | | | | 34,544 | | | | 34,873 | |
| | | | |
FNMA (6 Month LIBOR +2.48%) ± | | | 5.23 | | | | 7-1-2033 | | | | 34,062 | | | | 34,292 | |
| | | | |
FNMA (1 Year Treasury Constant Maturity +2.50%) ± | | | 5.25 | | | | 6-1-2032 | | | | 85,984 | | | | 87,317 | |
| | | | |
FNMA (6 Month LIBOR +2.65%) ± | | | 5.27 | | | | 4-1-2024 | | | | 161,208 | | | | 168,905 | |
| | | | |
FNMA (6 Month LIBOR +3.11%) ± | | | 5.29 | | | | 9-1-2033 | | | | 37,845 | | | | 38,283 | |
| | | | |
FNMA (6 Month LIBOR +2.70%) ± | | | 5.30 | | | | 1-1-2033 | | | | 60,458 | | | | 61,427 | |
| | | | |
FNMA (1 Year Treasury Constant Maturity +2.89%) ± | | | 5.39 | | | | 1-1-2031 | | | | 21,055 | | | | 21,111 | |
| | | | |
FNMA (6 Month LIBOR +2.72%) ± | | | 5.44 | | | | 5-1-2033 | | | | 959,234 | | | | 1,031,119 | |
| | | | |
FNMA | | | 5.50 | | | | 9-1-2019 | | | | 8 | | | | 8 | |
| | | | |
FNMA (1 Year Treasury Constant Maturity +1.75%) ± | | | 6.00 | | | | 1-1-2020 | | | | 1,088 | | | | 1,079 | |
| | | | |
FNMA (6 Month LIBOR +3.47%) ± | | | 6.08 | | | | 12-1-2032 | | | | 145,627 | | | | 150,077 | |
| | | | |
FNMA (6 Month LIBOR +3.57%) ± | | | 6.32 | | | | 11-1-2031 | | | | 11,848 | | | | 11,828 | |
| | | | |
FNMA (11th District Cost of Funds +1.90%) ± | | | 6.45 | | | | 2-1-2034 | | | | 1,849 | | | | 1,832 | |
| | | | |
FNMA | | | 6.50 | | | | 8-1-2028 | | | | 48,159 | | | | 49,000 | |
| | | | |
FNMA | | | 6.50 | | | | 5-1-2031 | | | | 90,747 | | | | 99,534 | |
| | | | |
FNMA | | | 7.06 | | | | 11-1-2024 | | | | 6,120 | | | | 6,127 | |
| | | | |
FNMA | | | 7.06 | | | | 12-1-2024 | | | | 22,283 | | | | 22,341 | |
| | | | |
FNMA | | | 7.06 | | | | 3-1-2025 | | | | 40,011 | | | | 40,590 | |
| | | | |
FNMA | | | 7.06 | | | | 3-1-2025 | | | | 2,075 | | | | 2,077 | |
| | | | |
FNMA | | | 7.06 | | | | 1-1-2027 | | | | 23,094 | | | | 23,107 | |
| | | | |
FNMA | | | 7.50 | | | | 1-1-2031 | | | | 54,524 | | | | 57,985 | |
| | | | |
FNMA | | | 7.50 | | | | 1-1-2033 | | | | 206,486 | | | | 224,253 | |
| | | | |
FNMA | | | 7.50 | | | | 5-1-2033 | | | | 163,605 | | | | 177,219 | |
| | | | |
FNMA | | | 7.50 | | | | 5-1-2033 | | | | 139,765 | | | | 149,069 | |
| | | | |
FNMA | | | 7.50 | | | | 6-1-2033 | | | | 25,362 | | | | 25,486 | |
| | | | |
FNMA | | | 7.50 | | | | 7-1-2033 | | | | 40,662 | | | | 41,580 | |
| | | | |
FNMA | | | 7.50 | | | | 8-1-2033 | | | | 52,741 | | | | 54,623 | |
| | | | |
FNMA | | | 8.00 | | | | 12-1-2026 | | | | 70,666 | | | | 76,494 | |
| | | | |
FNMA | | | 8.00 | | | | 2-1-2030 | | | | 170 | | | | 171 | |
| | | | |
FNMA | | | 8.00 | | | | 3-1-2030 | | | | 223 | | | | 239 | |
| | | | |
FNMA | | | 8.00 | | | | 5-1-2033 | | | | 83,923 | | | | 89,254 | |
| | | | |
FNMA | | | 8.50 | | | | 10-1-2026 | | | | 1,825 | | | | 1,841 | |
| | | | |
FNMA | | | 8.50 | | | | 8-15-2024 | | | | 28,575 | | | | 28,902 | |
| | | | |
FNMA | | | 10.00 | | | | 1-20-2021 | | | | 768 | | | | 776 | |
| | | | |
FNMA Series1989-74 Class J | | | 9.80 | | | | 10-25-2019 | | | | 820 | | | | 830 | |
The accompanying notes are an integral part of these financial statements.
| | | | |
| 20 | | Wells Fargo Adjustable Rate Government Fund | | Portfolio of investments—February 28, 2019 (unaudited) |
| | | | | | | | | | | | | | | | |
| Security name | | Interest rate | | | Maturity date | | | Principal | | | Value | |
| | | | |
Agency Securities(continued) | | | | | | | | | | | | | | | | |
| | | | |
FNMA Series1989-96 Class H | | | 9.00 | % | | | 12-25-2019 | | | $ | 594 | | | $ | 601 | |
| | | | |
FNMA Series1992-39 Class FA(7-Year Treasury Constant Maturity +0.00%) ± | | | 2.58 | | | | 3-25-2022 | | | | 66,622 | | | | 66,469 | |
| | | | |
FNMA Series1992-45 Class F(7-Year Treasury Constant Maturity +0.00%) ± | | | 2.58 | | | | 4-25-2022 | | | | 10,792 | | | | 10,766 | |
| | | | |
FNMA Series1992-87 Class Z | | | 8.00 | | | | 5-25-2022 | | | | 5,942 | | | | 6,258 | |
| | | | |
FNMA Series1993-113 Class FA (10 Year Treasury Constant Maturity-0.65%) ± | | | 2.02 | | | | 7-25-2023 | | | | 44,600 | | | | 44,529 | |
| | | | |
FNMA Series1993-247 Class FM (11th District Cost of Funds +1.20%) ± | | | 2.26 | | | | 12-25-2023 | | | | 213,057 | | | | 216,808 | |
| | | | |
FNMA Series1994-14 Class F (11th District Cost of Funds +1.60%) ± | | | 2.66 | | | | 10-25-2023 | | | | 119,142 | | | | 122,212 | |
| | | | |
FNMA Series2001-50 Class BA | | | 7.00 | | | | 10-25-2041 | | | | 127,941 | | | | 141,718 | |
| | | | |
FNMA Series2001-63 Class FD (1 Month LIBOR +0.60%) ± | | | 3.08 | | | | 12-18-2031 | | | | 124,815 | | | | 125,978 | |
| | | | |
FNMA Series2001-81 Class F (1 Month LIBOR +0.55%) ± | | | 3.04 | | | | 1-25-2032 | | | | 52,702 | | | | 53,177 | |
| | | | |
FNMA Series2001-T08 Class A1 | | | 7.50 | | | | 7-25-2041 | | | | 118,757 | | | | 134,573 | |
| | | | |
FNMA Series2001-T10 Class A2 | | | 7.50 | | | | 12-25-2041 | | | | 2,081,748 | | | | 2,380,997 | |
| | | | |
FNMA Series2001-T12 Class A2 | | | 7.50 | | | | 8-25-2041 | | | | 167,583 | | | | 191,279 | |
| | | | |
FNMA Series2001-T12 Class A4 ±± | | | 4.53 | | | | 8-25-2041 | | | | 3,668,660 | | | | 3,803,809 | |
| | | | |
FNMA Series2001-W01 Class AV1 (1 Month LIBOR +0.24%) ± | | | 2.84 | | | | 8-25-2031 | | | | 57,911 | | | | 56,500 | |
| | | | |
FNMA Series2001-W03 Class A ±± | | | 7.00 | | | | 9-25-2041 | | | | 460,465 | | | | 490,631 | |
| | | | |
FNMA Series2002-05 Class FD (1 Month LIBOR +0.90%) ± | | | 3.39 | | | | 2-25-2032 | | | | 103,308 | | | | 105,085 | |
| | | | |
FNMA Series2002-33 Class A4 ±± | | | 5.43 | | | | 11-25-2030 | | | | 119,932 | | | | 124,397 | |
| | | | |
FNMA Series2002-59 Class F (1 Month LIBOR +0.40%) ± | | | 2.89 | | | | 9-25-2032 | | | | 351,885 | | | | 352,733 | |
| | | | |
FNMA Series2002-66 Class A3 ±± | | | 4.34 | | | | 4-25-2042 | | | | 7,094,014 | | | | 7,383,695 | |
| | | | |
FNMA Series2002-T12 Class A3 | | | 7.50 | | | | 5-25-2042 | | | | 1,213,562 | | | | 1,410,064 | |
| | | | |
FNMA Series2002-T12 Class A5 ±± | | | 4.80 | | | | 10-25-2041 | | | | 1,464,831 | | | | 1,495,670 | |
| | | | |
FNMA Series2002-T18 Class A5 ±± | | | 4.57 | | | | 5-25-2042 | | | | 3,045,455 | | | | 3,124,450 | |
| | | | |
FNMA Series2002-T19 Class A4 ±± | | | 4.54 | | | | 3-25-2042 | | | | 179,059 | | | | 186,197 | |
| | | | |
FNMA Series2002-W01 Class 3A ±± | | | 4.17 | | | | 4-25-2042 | | | | 977,415 | | | | 978,733 | |
| | | | |
FNMA Series2002-W04 Class A6 ±± | | | 4.56 | | | | 5-25-2042 | | | | 1,641,043 | | | | 1,676,315 | |
| | | | |
FNMA Series2003-07 Class A2 ±± | | | 4.13 | | | | 5-25-2042 | | | | 664,224 | | | | 673,223 | |
| | | | |
FNMA Series2003-63 Class A8 ±± | | | 4.07 | | | | 1-25-2043 | | | | 1,054,045 | | | | 1,090,398 | |
| | | | |
FNMA Series2003-W02 Class 1A3 | | | 7.50 | | | | 7-25-2042 | | | | 357,082 | | | | 414,721 | |
| | | | |
FNMA Series2003-W04 Class 5A ±± | | | 4.29 | | | | 10-25-2042 | | | | 953,591 | | | | 956,648 | |
| | | | |
FNMA Series2003-W08 Class 4A ±± | | | 4.46 | | | | 11-25-2042 | | | | 1,220,770 | | | | 1,250,591 | |
| | | | |
FNMA Series2003-W09 Class A (1 Month LIBOR +0.12%) ± | | | 2.84 | | | | 6-25-2033 | | | | 1,596,846 | | | | 1,568,532 | |
| | | | |
FNMA Series2003-W10 Class 2A ±± | | | 4.10 | | | | 6-25-2043 | | | | 2,334,148 | | | | 2,321,353 | |
| | | | |
FNMA Series2003-W18 Class 2A ±± | | | 4.30 | | | | 6-25-2043 | | | | 3,399,210 | | | | 3,521,584 | |
| | | | |
FNMA Series2004-T03 Class 1A3 | | | 7.00 | | | | 2-25-2044 | | | | 447,627 | | | | 507,033 | |
| | | | |
FNMA Series2004-T03 Class 2A ±± | | | 4.45 | | | | 8-25-2043 | | | | 1,345,146 | | | | 1,393,617 | |
| | | | |
FNMA Series2004-W01 Class 2A2 | | | 7.00 | | | | 12-25-2033 | | | | 238,698 | | | | 273,187 | |
| | | | |
FNMA Series2004-W01 Class 3A ±± | | | 4.35 | | | | 1-25-2043 | | | | 68,880 | | | | 69,506 | |
| | | | |
FNMA Series2004-W02 Class 5A | | | 7.50 | | | | 3-25-2044 | | | | 102,221 | | | | 113,384 | |
| | | | |
FNMA Series2004-W12 Class 2A ±± | | | 4.32 | | | | 6-25-2044 | | | | 4,251,960 | | | | 4,364,214 | |
| | | | |
FNMA Series2004-W15 Class 3A ±± | | | 4.40 | | | | 6-25-2044 | | | | 5,425,173 | | | | 5,510,623 | |
| | | | |
FNMA Series2005-W03 Class 3A ±± | | | 4.14 | | | | 4-25-2045 | | | | 1,080,889 | | | | 1,121,075 | |
| | | | |
FNMA Series2006-15 Class FW (1 Month LIBOR +0.30%) ± | | | 2.79 | | | | 1-25-2036 | | | | 79,051 | | | | 79,124 | |
| | | | |
FNMA Series2006-44 Class FY (1 Month LIBOR +0.57%) ± | | | 3.06 | | | | 6-25-2036 | | | | 968,674 | | | | 981,062 | |
| | | | |
FNMA Series2006-W01 Class 3A ±± | | | 4.26 | | | | 10-25-2045 | | | | 4,250,804 | | | | 4,421,463 | |
| | | | |
FNMA Series2007-95 Class A2 (1 Month LIBOR +0.25%) ± | | | 2.76 | | | | 8-27-2036 | | | | 329,311 | | | | 327,255 | |
| | | | |
FNMA Series2012-47 Class FW (1 Month LIBOR +1.70%) ± | | | 4.19 | | | | 5-25-2027 | | | | 381,267 | | | | 397,612 | |
| | | | |
FNMA SeriesG92-20 Class FB(7-Year Treasury Constant Maturity +0.00%) ± | | | 2.58 | | | | 4-25-2022 | | | | 6,320 | | | | 6,306 | |
| | | | |
FNMA SeriesG93-1 Class K | | | 6.68 | | | | 1-25-2023 | | | | 187,905 | | | | 195,546 | |
| | | | |
FNMA SeriesG93-19 Class FD (10 Year Treasury Constant Maturity-0.65%) ± | | | 2.02 | | | | 4-25-2023 | | | | 86,802 | | | | 86,798 | |
The accompanying notes are an integral part of these financial statements.
| | | | | | |
| Portfolio of investments—February 28, 2019 (unaudited) | | Wells Fargo Adjustable Rate Government Fund | | | 21 | |
| | | | | | | | | | | | | | | | |
| Security name | | Interest rate | | | Maturity date | | | Principal | | | Value | |
| | | | |
Agency Securities(continued) | | | | | | | | | | | | | | | | |
| | | | |
GNMA | | | 6.45 | % | | | 4-20-2025 | | | $ | 32,783 | | | $ | 35,206 | |
| | | | |
GNMA | | | 6.45 | | | | 9-20-2025 | | | | 33,244 | | | | 36,993 | |
| | | | |
GNMA | | | 6.50 | | | | 6-20-2034 | | | | 72,244 | | | | 73,018 | |
| | | | |
GNMA | | | 6.50 | | | | 8-20-2034 | | | | 485,411 | | | | 522,925 | |
| | | | |
GNMA | | | 6.75 | | | | 2-15-2029 | | | | 41,018 | | | | 45,064 | |
| | | | |
GNMA | | | 9.00 | | | | 3-15-2020 | | | | 382 | | | | 383 | |
| | | | |
GNMA | | | 9.00 | | | | 8-20-2024 | | | | 10 | | | | 10 | |
| | | | |
GNMA | | | 9.00 | | | | 9-20-2024 | | | | 867 | | | | 882 | |
| | | | |
GNMA | | | 9.00 | | | | 11-20-2024 | | | | 117 | | | | 118 | |
| | | | |
GNMA | | | 9.00 | | | | 1-20-2025 | | | | 2,767 | | | | 2,877 | |
| | | | |
GNMA | | | 9.00 | | | | 2-20-2025 | | | | 13,039 | | | | 14,255 | |
| | | | |
GNMA Series2008-65 Class FG (1 Month LIBOR +0.75%) ± | | | 3.23 | | | | 8-20-2038 | | | | 1,432,605 | | | | 1,453,884 | |
| | | | |
GNMA Series2008-68 Class FA (1 Month LIBOR +0.95%) ± | | | 3.43 | | | | 8-20-2038 | | | | 1,766,328 | | | | 1,806,322 | |
| | | | |
GNMA Series2009-50 Class FW (1 Month LIBOR +1.00%) ± | | | 3.48 | | | | 7-20-2039 | | | | 1,813,616 | | | | 1,860,675 | |
| | | | |
GNMA Series2009-52 Class FD (1 Month LIBOR +0.95%) ± | | | 3.43 | | | | 7-16-2039 | | | | 869,175 | | | | 889,398 | |
| | | | |
GNMA Series2010-25 Class FH (1 Month LIBOR +0.72%) ± | | | 3.20 | | | | 2-16-2040 | | | | 795,227 | | | | 803,769 | |
| | | | |
GNMA Series2011-H12 Class FA (1 Month LIBOR +0.49%) ± | | | 3.00 | | | | 2-20-2061 | | | | 2,436,449 | | | | 2,437,683 | |
| | | | |
GNMA Series2011-H17 Class FA (1 Month LIBOR +0.53%) ± | | | 3.04 | | | | 6-20-2061 | | | | 988,271 | | | | 989,704 | |
| | | | |
GNMA Series2017-H11 Class FE (12 Month LIBOR +0.18%) ± | | | 2.84 | | | | 5-20-2067 | | | | 4,919,969 | | | | 4,904,917 | |
| | | | |
Total Agency Securities (Cost $303,579,415) | | | | | | | | | | | | | | | 307,825,914 | |
| | | | | | | | | | | | | | | | |
| | | | |
| | | Yield | | | | | | Shares | | | | |
| Short-Term Investments: 3.03% | | | | | | | | | | | | | | | | |
| | | | |
| Investment Companies: 3.03% | | | | | | | | | | | | | | | | |
| | | | |
Wells Fargo Government Money Market Fund Select Class (l)(u) | | | 2.34 | | | | | | | | 9,709,267 | | | | 9,709,267 | |
| | | | | | | | | | | | | | | | |
| | | | |
Total Short-Term Investments (Cost $9,709,267) | | | | | | | | | | | | | | | 9,709,267 | |
| | | | | | | | | | | | | | | | |
| | | | | | | | |
| Total investments in securities (Cost $313,288,682) | | | 99.25 | % | | | 317,535,181 | |
| | |
Other assets and liabilities, net | | | 0.75 | | | | 2,401,259 | |
| | | | | | | | |
| Total net assets | | | 100.00 | % | | $ | 319,936,440 | |
| | | | | | | | |
| 144A | The security may be resold in transactions exempt from registration, normally to qualified institutional buyers, pursuant to Rule 144A under the Securities Act of 1933. |
| ± | Variable rate investment. The rate shown is the rate in effect at period end. |
| ±± | The coupon of the security is adjusted based on the principal and interest payments received from the underlying pool of mortgages as well as the credit quality and the actual prepayment speed of the underlying mortgages. |
| (c) | Investment in an interest-only security entitles holders to receive only the interest payments on the underlying mortgages. The principal amount shown is the notional amount of the underlying mortgages. The rate represents the coupon rate. |
| (l) | The issuer of the security is an affiliated person of the Fund as defined in the Investment Company Act of 1940. |
| (u) | The rate represents the7-day annualized yield at period end. |
Abbreviations:
| FDIC | Federal Deposit Insurance Corporation |
| FHLMC | Federal Home Loan Mortgage Corporation |
| FNMA | Federal National Mortgage Association |
| GNMA | Government National Mortgage Association |
| LIBOR | London Interbank Offered Rate |
The accompanying notes are an integral part of these financial statements.
| | | | |
| 22 | | Wells Fargo Adjustable Rate Government Fund | | Portfolio of investments—February 28, 2019 (unaudited) |
Investments in Affiliates
An affiliated investment is an investment in which the Fund owns at least 5% of the outstanding voting shares of the issuer or as a result of other relationships, such as the Fund and the issuer having the same investment manager. Transactions with issuers that were either affiliated persons of the Fund at the beginning of the period or the end of the period were as follows:
| | | | | | | | | | | | | | | | | | | | | | | | | | | | | | | | | | | | |
| | | Shares,
beginning of
period | | | Shares
purchased | | | Shares
sold | | | Shares,
end of
period | | | Net
realized
gains
(losses) | | | Net
change in
unrealized
gains
(losses) | | | Income
from
affiliated
securities | | | Value,
end
of period | | | % of
net
assets | |
Short-Term Investments | | | | | | | | | | | | | | | | | | | | | | | | | | | | | | | | | | | | |
Investment Companies | | | | | | | | | | | | | | | | | | | | | | | | | | | | | | | | | | | | |
Wells Fargo Government
Money Market Fund Select Class | | | 14,194,527 | | | | 59,398,593 | | | | 63,883,853 | | | | 9,709,267 | | | $ | 0 | | | $ | 0 | | | $ | 83,634 | | | $ | 9,709,267 | | | | 3.03 | % |
The accompanying notes are an integral part of these financial statements.
| | | | | | |
| Statement of assets and liabilities—February 28, 2019 (unaudited) | | Wells Fargo Adjustable Rate Government Fund | | | 23 | |
| | | | |
| | | | |
| |
Assets | | | | |
Investments in unaffiliated securities, at value (cost $303,579,415) | | $ | 307,825,914 | |
Investments in affiliated securities, at value (cost $9,709,267) | | | 9,709,267 | |
Principal paydown receivable | | | 1,708,284 | |
Receivable for Fund shares sold | | | 36,997 | |
Receivable for interest | | | 1,288,962 | |
Prepaid expenses and other assets | | | 78,843 | |
| | | | |
Total assets | | | 320,648,267 | |
| | | | |
| |
Liabilities | | | | |
Payable for Fund shares redeemed | | | 325,724 | |
Dividends payable | | | 115,257 | |
Management fee payable | | | 58,620 | |
Administration fees payable | | | 28,002 | |
Distribution fee payable | | | 8,601 | |
Trustees’ fees and expenses payable | | | 2,939 | |
Accrued expenses and other liabilities | | | 172,684 | |
| | | | |
Total liabilities | | | 711,827 | |
| | | | |
Total net assets | | $ | 319,936,440 | |
| | | | |
| |
NET ASSETS CONSIST OF | | | | |
Paid-in capital | | $ | 316,229,242 | |
Total distributable earnings | | | 3,707,198 | |
| | | | |
Total net assets | | $ | 319,936,440 | |
| | | | |
| |
COMPUTATION OF NET ASSET VALUE AND OFFERING PRICE PER SHARE | | | | |
Net assets – Class A | | $ | 124,689,141 | |
Shares outstanding – Class A1 | | | 13,961,362 | |
Net asset value per share – Class A | | | $8.93 | |
Maximum offering price per share – Class A2 | | | $9.11 | |
Net assets – Class C | | $ | 9,163,795 | |
Shares outstanding – Class C1 | | | 1,027,746 | |
Net asset value per share – Class C | | | $8.92 | |
Net assets – Administrator Class | | $ | 5,802,630 | |
Shares outstanding – Administrator Class1 | | | 649,561 | |
Net asset value per share – Administrator Class | | | $8.93 | |
Net assets – Institutional Class | | $ | 180,280,874 | |
Shares outstanding – Institutional Class1 | | | 20,187,797 | |
Net asset value per share – Institutional Class | | | $8.93 | |
| 1 | The Fund has an unlimited number of authorized shares. |
| 2 | Maximum offering price is computed as 100/98 of net asset value. On investments of $50,000 or more, the offering price is reduced. |
The accompanying notes are an integral part of these financial statements.
| | | | |
| 24 | | Wells Fargo Adjustable Rate Government Fund | | Statement of operations—six months ended February 28, 2019 (unaudited) |
| | | | |
| | | | |
| |
Investment income | | | | |
Interest | | $ | 4,482,917 | |
Income from affiliated securities | | | 83,634 | |
| | | | |
Total investment income | | | 4,566,551 | |
| | | | |
| |
Expenses | | | | |
Management fee | | | 614,950 | |
Administration fees | | | | |
Class A | | | 80,154 | |
Class C | | | 30,367 | |
Administrator Class | | | 3,783 | |
Institutional Class | | | 82,273 | |
Shareholder servicing fees | | | | |
Class A | | | 125,240 | |
Class C | | | 47,449 | |
Administrator Class | | | 9,358 | |
Distribution fee | | | | |
Class C | | | 142,348 | |
Custody and accounting fees | | | 37,887 | |
Professional fees | | | 33,590 | |
Registration fees | | | 47,932 | |
Shareholder report expenses | | | 29,260 | |
Trustees’ fees and expenses | | | 10,728 | |
Other fees and expenses | | | 25,312 | |
| | | | |
Total expenses | | | 1,320,631 | |
Less: Fee waivers and/or expense reimbursements | | | (171,354 | ) |
| | | | |
Net expenses | | | 1,149,277 | |
| | | | |
Net investment income | | | 3,417,274 | |
| | | | |
| |
REALIZED AND UNREALIZED GAINS (LOSSES) ON INVESTMENTS | | | | |
Net realized gains on investments | | | 259,649 | |
Net change in unrealized gains (losses) on investments | | | (89,783 | ) |
| | | | |
Net realized and unrealized gains (losses) on investments | | | 169,866 | |
| | | | |
Net increase in net assets resulting from operations | | $ | 3,587,140 | |
| | | | |
The accompanying notes are an integral part of these financial statements.
| | | | | | |
| Statement of changes in net assets | | Wells Fargo Adjustable Rate Government Fund | | | 25 | |
| | | | | | | | | | | | | | | | |
| | | Six months ended
February 28, 2019
(unaudited) | | | Year ended
August 31, 20181 | |
| | | | |
Operations | | | | | | | | | | | | | | | | |
Net investment income | | | | | | $ | 3,417,274 | | | | | | | $ | 6,407,474 | |
Net realized gains on investments | | | | | | | 259,649 | | | | | | | | 736,194 | |
Net change in unrealized gains (losses) on investments | | | | | | | (89,783 | ) | | | | | | | (2,234,630 | ) |
| | | | |
Net increase in net assets resulting from operations | | | | | | | 3,587,140 | | | | | | | | 4,909,038 | |
| | | | |
| | | |
Distributions to shareholders from net investment income and net realized gains | | | | | | | | | | | | | |
Class A | | | | | | | (991,326 | ) | | | | | | | (1,690,233 | ) |
Class C | | | | | | | (223,032 | ) | | | | | | | (291,921 | ) |
Administrator Class | | | | | | | (78,582 | ) | | | | | | | (197,212 | ) |
Institutional Class | | | | | | | (2,287,123 | ) | | | | | | | (4,228,118 | ) |
| | | | |
Total distributions to shareholders | | | | | | | (3,580,063 | ) | | | | | | | (6,407,484 | ) |
| | | | |
| | | | |
Capital share transactions | | | Shares | | | | | | | | Shares | | | | | |
Proceeds from shares sold | | | | | | | | | | | | | | | | |
Class A | | | 3,775,383 | | | | 33,747,273 | | | | 959,219 | | | | 8,580,205 | |
Class C | | | 80,493 | | | | 718,151 | | | | 96,466 | | | | 864,644 | |
Administrator Class | | | 2,133 | | | | 19,038 | | | | 106,068 | | | | 950,975 | |
Institutional Class | | | 2,173,512 | | | | 19,400,760 | | | | 5,355,474 | | | | 47,989,301 | |
| | | | |
| | | | | | | 53,885,222 | | | | | | | | 58,385,125 | |
| | | | |
Reinvestment of distributions | | | | | | | | | | | | | | | | |
Class A | | | 92,498 | | | | 825,447 | | | | 138,550 | | | | 1,239,446 | |
Class C | | | 24,128 | | | | 215,271 | | | | 31,593 | | | | 282,408 | |
Administrator Class | | | 8,275 | | | | 73,836 | | | | 21,739 | | | | 194,536 | |
Institutional Class | | | 192,732 | | | | 1,719,785 | | | | 358,053 | | | | 3,204,150 | |
| | | | |
| | | | | | | 2,834,339 | | | | | | | | 4,920,540 | |
| | | | |
Payment for shares redeemed | | | | | | | | | | | | | | | | |
Class A | | | (1,550,113 | ) | | | (13,832,618 | ) | | | (6,633,879 | ) | | | (59,360,844 | ) |
Class C | | | (4,194,813 | ) | | | (37,487,858 | ) | | | (1,791,217 | ) | | | (16,036,464 | ) |
Administrator Class | | | (384,388 | ) | | | (3,429,281 | ) | | | (1,202,643 | ) | | | (10,766,120 | ) |
Institutional Class | | | (8,505,532 | ) | | | (75,914,621 | ) | | | (23,742,189 | ) | | | (212,822,264 | ) |
| | | | |
| | | | | | | (130,664,378 | ) | | | | | | | (298,985,692 | ) |
| | | | |
Net decrease in net assets resulting from capital share transactions | | | | | | | (73,944,817 | ) | | | | | | | (235,680,027 | ) |
| | | | |
Total decrease in net assets | | | | | | | (73,937,740 | ) | | | | | | | (237,178,473 | ) |
| | | | |
| | | | |
Net assets | | | | | | | | | | | | | | | | |
Beginning of period | | | | | | | 393,874,180 | | | | | | | | 631,052,653 | |
| | | | |
End of period | | | | | | $ | 319,936,440 | | | | | | | $ | 393,874,180 | |
| | | | |
| 1 | Effective for all filings after November 4, 2018, the SEC prospectively eliminated the requirement to parenthetically disclose undistributed net investment income at the end of the period and permitted the aggregation of distributions, with the exception of tax basis returns of capital. Overdistributed net investment income at August 31, 2018 was $192,257. The disaggregated distributions information for the year ended August 31, 2018 is included in Note 7,Distributions to Shareholders, in the notes to the financial statements. |
The accompanying notes are an integral part of these financial statements.
| | | | |
| 26 | | Wells Fargo Adjustable Rate Government Fund | | Financial highlights |
(For a share outstanding throughout each period)
| | | | | | | | | | | | | | | | | | | | | | | | |
| | | Six months ended
February 28, 2019
(unaudited) | | | Year ended August 31 | |
| CLASS A | | 2018 | | | 2017 | | | 2016 | | | 2015 | | | 2014 | |
Net asset value, beginning of period | | | $8.93 | | | | $8.96 | | | | $9.01 | | | | $9.10 | | | | $9.15 | | | | $9.14 | |
Net investment income | | | 0.08 | 1 | | | 0.10 | | | | 0.06 | | | | 0.04 | | | | 0.05 | | | | 0.06 | |
Net realized and unrealized gains (losses) on investments | | | 0.01 | | | | (0.01 | ) | | | (0.04 | ) | | | (0.06 | ) | | | (0.03 | ) | | | 0.02 | |
| | | | | | | | | | | | | | | | | | | | | | | | |
Total from investment operations | | | 0.09 | | | | 0.09 | | | | 0.02 | | | | (0.02 | ) | | | 0.02 | | | | 0.08 | |
Distributions to shareholders from | | | | | | | | | | | | | | | | | | | | | | | | |
Net investment income | | | (0.09 | ) | | | (0.12 | ) | | | (0.07 | ) | | | (0.05 | ) | | | (0.05 | ) | | | (0.06 | ) |
Tax basis return of capital | | | 0.00 | | | | 0.00 | | | | 0.00 | | | | (0.02 | ) | | | (0.02 | ) | | | (0.01 | ) |
| | | | | | | | | | | | | | | | | | | | | | | | |
Total distributions to shareholders | | | (0.09 | ) | | | (0.12 | ) | | | (0.07 | ) | | | (0.07 | ) | | | (0.07 | ) | | | (0.07 | ) |
Net asset value, end of period | | | $8.93 | | | | $8.93 | | | | $8.96 | | | | $9.01 | | | | $9.10 | | | | $9.15 | |
Total return2 | | | 0.98 | % | | | 0.98 | % | | | 0.23 | % | | | (0.19 | )% | | | 0.24 | % | | | 0.90 | % |
Ratios to average net assets (annualized) | | | | | | | | | | | | | | | | | | | | | | | | |
Gross expenses | | | 0.87 | % | | | 0.83 | % | | | 0.80 | % | | | 0.78 | % | | | 0.79 | % | | | 0.80 | % |
Net expenses | | | 0.74 | % | | | 0.74 | % | | | 0.74 | % | | | 0.74 | % | | | 0.74 | % | | | 0.74 | % |
Net investment income | | | 1.88 | % | | | 1.28 | % | | | 0.72 | % | | | 0.56 | % | | | 0.58 | % | | | 0.64 | % |
Supplemental data | | | | | | | | | | | | | | | | | | | | | | | | |
Portfolio turnover rate | | | 3 | % | | | 3 | % | | | 2 | % | | | 13 | % | | | 10 | % | | | 18 | % |
Net assets, end of period (000s omitted) | | | $124,689 | | | | $103,963 | | | | $153,953 | | | | $172,131 | | | | $215,830 | | | | $251,686 | |
| 1 | Calculated based upon average shares outstanding |
| 2 | Total return calculations do not include any sales charges. Returns for periods of less than one year are not annualized. |
The accompanying notes are an integral part of these financial statements.
| | | | | | |
| Financial highlights | | Wells Fargo Adjustable Rate Government Fund | | | 27 | |
(For a share outstanding throughout each period)
| | | | | | | | | | | | | | | | | | | | | | | | |
| | | Six months ended
February 28, 2019
(unaudited) | | | Year ended August 31 | |
| CLASS C | | 2018 | | | 2017 | | | 2016 | | | 2015 | | | 2014 | |
Net asset value, beginning of period | | | $8.93 | | | | $8.96 | | | | $9.01 | | | | $9.10 | | | | $9.15 | | | | $9.14 | |
Net investment income (loss) | | | 0.05 | 1 | | | 0.05 | 1 | | | (0.00 | )1,2 | | | (0.02 | )1 | | | (0.01 | )1 | | | (0.01 | )1 |
Net realized and unrealized gains (losses) on investments | | | (0.01 | ) | | | (0.03 | ) | | | (0.05 | ) | | | (0.07 | ) | | | (0.04 | ) | | | 0.02 | |
| | | | | | | | | | | | | | | | | | | | | | | | |
Total from investment operations | | | 0.04 | | | | 0.02 | | | | (0.05 | ) | | | (0.09 | ) | | | (0.05 | ) | | | 0.01 | |
Distributions to shareholders from | | | | | | | | | | | | | | | | | | | | | | | | |
Net investment income | | | (0.05 | ) | | | (0.05 | ) | | | (0.00 | )3 | | | (0.00 | )3 | | | (0.00 | )3 | | | (0.00 | )3 |
Tax basis return of capital | | | 0.00 | | | | 0.00 | | | | 0.00 | | | | (0.00 | )3 | | | (0.00 | )3 | | | (0.00 | )3 |
| | | | | | | | | | | | | | | | | | | | | | | | |
Total distributions to shareholders | | | (0.05 | ) | | | (0.05 | ) | | | (0.00 | )3 | | | (0.00 | )3 | | | (0.00 | )3 | | | (0.00 | )3 |
Net asset value, end of period | | | $8.92 | | | | $8.93 | | | | $8.96 | | | | $9.01 | | | | $9.10 | | | | $9.15 | |
Total return4 | | | 0.50 | % | | | 0.23 | % | | | (0.52 | )% | | | (0.94 | )% | | | (0.51 | )% | | | 0.15 | % |
Ratios to average net assets (annualized) | | | | | | | | | | | | | | | | | | | | | | | | |
Gross expenses | | | 1.61 | % | | | 1.59 | % | | | 1.55 | % | | | 1.53 | % | | | 1.54 | % | | | 1.55 | % |
Net expenses | | | 1.49 | % | | | 1.49 | % | | | 1.49 | % | | | 1.49 | % | | | 1.49 | % | | | 1.49 | % |
Net investment income (loss) | | | 1.07 | % | | | 0.54 | % | | | (0.04 | )% | | | (0.19 | )% | | | (0.16 | )% | | | (0.11 | )% |
Supplemental data | | | | | | | | | | | | | | | | | | | | | | | | |
Portfolio turnover rate | | | 3 | % | | | 3 | % | | | 2 | % | | | 13 | % | | | 10 | % | | | 18 | % |
Net assets, end of period (000s omitted) | | | $9,164 | | | | $45,693 | | | | $60,766 | | | | $97,452 | | | | $121,117 | | | | $148,523 | |
| 1 | Calculated based upon average shares outstanding |
| 2 | Amount is more than $(0.005). |
| 3 | Amount is less than $0.005. |
| 4 | Total return calculations do not include any sales charges. Returns for periods of less than one year are not annualized. |
The accompanying notes are an integral part of these financial statements.
| | | | |
| 28 | | Wells Fargo Adjustable Rate Government Fund | | Financial highlights |
(For a share outstanding throughout each period)
| | | | | | | | | | | | | | | | | | | | | | | | |
| | | Six months ended
February 28, 2019
(unaudited) | | | Year ended August 31 | |
| ADMINISTRATOR CLASS | | 2018 | | | 2017 | | | 2016 | | | 2015 | | | 2014 | |
Net asset value, beginning of period | | | $8.93 | | | | $8.96 | | | | $9.01 | | | | $9.10 | | | | $9.15 | | | | $9.14 | |
Net investment income | | | 0.09 | 1 | | | 0.13 | 1 | | | 0.07 | 1 | | | 0.06 | | | | 0.06 | | | | 0.07 | |
Net realized and unrealized gains (losses) on investments | | | 0.00 | 2 | | | (0.03 | ) | | | (0.04 | ) | | | (0.06 | ) | | | (0.03 | ) | | | 0.03 | |
| | | | | | | | | | | | | | | | | | | | | | | | |
Total from investment operations | | | 0.09 | | | | 0.10 | | | | 0.03 | | | | 0.00 | | | | 0.03 | | | | 0.10 | |
Distributions to shareholders from | | | | | | | | | | | | | | | | | | | | | | | | |
Net investment income | | | (0.09 | ) | | | (0.13 | ) | | | (0.08 | ) | | | (0.07 | ) | | | (0.06 | ) | | | (0.07 | ) |
Tax basis return of capital | | | 0.00 | | | | 0.00 | | | | 0.00 | | | | (0.02 | ) | | | (0.02 | ) | | | (0.02 | ) |
| | | | | | | | | | | | | | | | | | | | | | | | |
Total distributions to shareholders | | | (0.09 | ) | | | (0.13 | ) | | | (0.08 | ) | | | (0.09 | ) | | | (0.08 | ) | | | (0.09 | ) |
Net asset value, end of period | | | $8.93 | | | | $8.93 | | | | $8.96 | | | | $9.01 | | | | $9.10 | | | | $9.15 | |
Total return3 | | | 1.05 | % | | | 1.12 | % | | | 0.37 | % | | | (0.05 | )% | | | 0.38 | % | | | 1.05 | % |
Ratios to average net assets (annualized) | | | | | | | | | | | | | | | | | | | | | | | | |
Gross expenses | | | 0.80 | % | | | 0.77 | % | | | 0.74 | % | | | 0.72 | % | | | 0.72 | % | | | 0.73 | % |
Net expenses | | | 0.60 | % | | | 0.60 | % | | | 0.60 | % | | | 0.60 | % | | | 0.60 | % | | | 0.60 | % |
Net investment income | | | 1.97 | % | | | 1.42 | % | | | 0.82 | % | | | 0.71 | % | | | 0.72 | % | | | 0.78 | % |
Supplemental data | | | | | | | | | | | | | | | | | | | | | | | | |
Portfolio turnover rate | | | 3 | % | | | 3 | % | | | 2 | % | | | 13 | % | | | 10 | % | | | 18 | % |
Net assets, end of period (000s omitted) | | | $5,803 | | | | $9,140 | | | | $18,805 | | | | $61,658 | | | | $66,037 | | | | $124,345 | |
| 1 | Calculated based upon average shares outstanding |
| 2 | Amount is less than $0.005. |
| 3 | Returns for periods of less than one year are not annualized. |
The accompanying notes are an integral part of these financial statements.
| | | | | | |
| Financial highlights | | Wells Fargo Adjustable Rate Government Fund | | | 29 | |
(For a share outstanding throughout each period)
| | | | | | | | | | | | | | | | | | | | | | | | |
| | | Six months ended
February 28, 2019
(unaudited) | | | Year ended August 31 | |
| INSTITUTIONAL CLASS | | 2018 | | | 2017 | | | 2016 | | | 2015 | | | 2014 | |
Net asset value, beginning of period | | | $8.93 | | | | $8.96 | | | | $9.01 | | | | $9.10 | | | | $9.15 | | | | $9.14 | |
Net investment income | | | 0.10 | | | | 0.16 | | | | 0.09 | | | | 0.08 | | | | 0.08 | | | | 0.08 | |
Net realized and unrealized gains (losses) on investments | | | 0.00 | 1 | | | (0.05 | ) | | | (0.04 | ) | | | (0.07 | ) | | | (0.03 | ) | | | 0.03 | |
| | | | | | | | | | | | | | | | | | | | | | | | |
Total from investment operations | | | 0.10 | | | | 0.11 | | | | 0.05 | | | | 0.01 | | | | 0.05 | | | | 0.11 | |
Distributions to shareholders from | | | | | | | | | | | | | | | | | | | | | | | | |
Net investment income | | | (0.10 | ) | | | (0.14 | ) | | | (0.10 | ) | | | (0.07 | ) | | | (0.08 | ) | | | (0.08 | ) |
Tax basis return of capital | | | 0.00 | | | | 0.00 | | | | 0.00 | | | | (0.03 | ) | | | (0.02 | ) | | | (0.02 | ) |
| | | | | | | | | | | | | | | | | | | | | | | | |
Total distributions to shareholders | | | (0.10 | ) | | | (0.14 | ) | | | (0.10 | ) | | | (0.10 | ) | | | (0.10 | ) | | | (0.10 | ) |
Net asset value, end of period | | | $8.93 | | | | $8.93 | | | | $8.96 | | | | $9.01 | | | | $9.10 | | | | $9.15 | |
Total return2 | | | 1.12 | % | | | 1.26 | % | | | 0.51 | % | | | 0.09 | % | | | 0.52 | % | | | 1.19 | % |
Ratios to average net assets (annualized) | | | | | | | | | | | | | | | | | | | | | | | | |
Gross expenses | | | 0.53 | % | | | 0.50 | % | | | 0.47 | % | | | 0.45 | % | | | 0.46 | % | | | 0.47 | % |
Net expenses | | | 0.46 | % | | | 0.46 | % | | | 0.46 | % | | | 0.45 | % | | | 0.46 | % | | | 0.46 | % |
Net investment income | | | 2.12 | % | | | 1.55 | % | | | 0.98 | % | | | 0.84 | % | | | 0.87 | % | | | 0.93 | % |
Supplemental data | | | | | | | | | | | | | | | | | | | | | | | | |
Portfolio turnover rate | | | 3 | % | | | 3 | % | | | 2 | % | | | 13 | % | | | 10 | % | | | 18 | % |
Net assets, end of period (000s omitted) | | | $180,281 | | | | $235,078 | | | | $397,529 | | | | $702,617 | | | | $906,536 | | | | $844,221 | |
| 1 | Amount is less than $0.005. |
| 2 | Returns for periods of less than one year are not annualized. |
The accompanying notes are an integral part of these financial statements.
| | | | |
| 30 | | Wells Fargo Adjustable Rate Government Fund | | Notes to financial statements (unaudited) |
1. ORGANIZATION
Wells Fargo Funds Trust (the “Trust”), a Delaware statutory trust organized on March 10, 1999, is anopen-end management investment company registered under the Investment Company Act of 1940, as amended (the “1940 Act”). As an investment company, the Trust follows the accounting and reporting guidance in Financial Accounting Standards Board (“FASB”)Accounting Standards Codification Topic 946, Financial Services – Investment Companies. These financial statements report on the Wells Fargo Adjustable Rate Government Fund (the “Fund”) which is a diversified series of the Trust.
2. SIGNIFICANT ACCOUNTING POLICIES
The following significant accounting policies, which are consistently followed in the preparation of the financial statements of the Fund, are in conformity with U.S. generally accepted accounting principles which require management to make estimates and assumptions that affect the reported amounts of assets and liabilities, disclosure of contingent assets and liabilities at the date of the financial statements, and the reported amounts of revenues and expenses during the reporting period. Actual results could differ from those estimates.
Securities valuation
All investments are valued each business day as of the close of regular trading on the New York Stock Exchange (generally 4 p.m. Eastern Time), although the Fund may deviate from this calculation time under unusual or unexpected circumstances.
Debt securities are valued at the evaluated bid price provided by an independent pricing service (e.g. taking into account various factors, including yields, maturities, or credit ratings) or, if a reliable price is not available, the quoted bid price from an independent broker-dealer.
Investments in registeredopen-end investment companies are valued at net asset value.
Investments which are not valued using any of the methods discussed above are valued at their fair value, as determined in good faith by the Board of Trustees of the Fund. The Board of Trustees has established a Valuation Committee comprised of the Trustees and has delegated to it the authority to take any actions regarding the valuation of portfolio securities that the Valuation Committee deems necessary or appropriate, including determining the fair value of portfolio securities, unless the determination has been delegated to the Wells Fargo Asset Management Pricing Committee at Wells Fargo Funds Management, LLC (“Funds Management”). The Board of Trustees retains the authority to make or ratify any valuation decisions or approve any changes to the Valuation Procedures as it deems appropriate. On a quarterly basis, the Board of Trustees receives reports on any valuation actions taken by the Valuation Committee or the Wells Fargo Asset Management Pricing Committee which may include items for ratification.
When-issued transactions
The Fund may purchase securities on a forward commitment or when-issued basis. The Fund records a when-issued transaction on the trade date and will segregate assets in an amount at least equal in value to the Fund’s commitment to purchase when-issued securities. Securities purchased on a when-issued basis aremarked-to-market daily and the Fund begins earning interest on the settlement date. Losses may arise due to changes in the market value of the underlying securities or if the counterparty does not perform under the contract.
Security transactions and income recognition
Securities transactions are recorded on a trade date basis. Realized gains or losses are recorded on the basis of identified cost.
Interest income is accrued daily and bond discounts are accreted and premiums are amortized daily. To the extent debt obligations are placed onnon-accrual status, any related interest income may be reduced by writing off interest receivables when the collection of all or a portion of interest has been determined to be doubtful based on consistently applied procedures and the fair value has decreased. If the issuer subsequently resumes interest payments or when the collectability of interest is reasonably assured, the debt obligation is removed fromnon-accrual status.
Distributions to shareholders
Distributions to shareholders from net investment income are declared daily and paid monthly. Distributions from net realized gains, if any, are recorded on theex-dividend date and paid at least annually. Such distributions are determined in accordance with income tax regulations and may differ from U.S. generally accepted accounting principles. Dividend sources are estimated at the time of declaration. The tax character of distributions is determined as of the Fund’s fiscal year end. Therefore, a portion of the Fund’s distributions made prior to the Fund’s fiscal year end may be categorized as a tax return of capital at year end.
| | | | | | |
| Notes to financial statements (unaudited) | | Wells Fargo Adjustable Rate Government Fund | | | 31 | |
Federal and other taxes
The Fund intends to continue to qualify as a regulated investment company by distributing substantially all of its investment company taxable income and any net realized capital gains (after reduction for capital loss carryforwards) sufficient to relieve it from all, or substantially all, federal income taxes. Accordingly, no provision for federal income taxes was required.
The Fund’s income and federal excise tax returns and all financial records supporting those returns for the prior three fiscal years are subject to examination by the federal and Delaware revenue authorities. Management has analyzed the Fund’s tax positions taken on federal, state, and foreign tax returns for all open tax years and does not believe that there are any uncertain tax positions that require recognition of a tax liability.
As of February 28, 2019, the aggregate cost of all investments for federal income tax purposes was $313,320,039 and the unrealized gains (losses) consisted of:
| | | | |
| |
Gross unrealized gains | | | $5,230,288 | |
| |
Gross unrealized losses | | | (1,015,146 | ) |
| |
Net unrealized gains | | | $4,215,142 | |
As of August 31, 2018, the Fund had capital loss carryforwards available to offset future net realized capital gains in the amount of $66,443 expiring in 2019.
Class allocations
The separate classes of shares offered by the Fund differ principally in applicable sales charges, distribution, shareholder servicing, and administration fees. Class specific expenses are charged directly to that share class. Investment income, common expenses, and realized and unrealized gains (losses) on investments are allocated daily to each class of shares based on the relative proportion of net assets of each class.
3. FAIR VALUATION MEASUREMENTS
Fair value measurements of investments are determined within a framework that has established a fair value hierarchy based upon the various data inputs utilized in determining the value of the Fund’s investments. The three-level hierarchy gives the highest priority to unadjusted quoted prices in active markets for identical assets or liabilities (Level 1) and the lowest priority to unobservable inputs (Level 3). The Fund’s investments are classified within the fair value hierarchy based on the lowest level of input that is significant to the fair value measurement. The inputs are summarized into three broad levels as follows:
| ∎ | | Level 1 – quoted prices in active markets for identical securities |
| ∎ | | Level 2 – other significant observable inputs (including quoted prices for similar securities, interest rates, prepayment speeds, credit risk, etc.) |
| ∎ | | Level 3 – significant unobservable inputs (including the Fund’s own assumptions in determining the fair value of investments) |
The inputs or methodologies used for valuing investments in securities are not necessarily an indication of the risk associated with investing in those securities.
The following is a summary of the inputs used in valuing the Fund’s assets and liabilities as of February 28, 2019:
| | | | | | | | | | | | | | | | |
| | | | |
| | | Quoted prices
(Level 1) | | | Other significant
observable inputs
(Level 2) | | | Significant
unobservable inputs (Level 3) | | | Total | |
| | | | |
Assets | | | | | | | | | | | | | | | | |
Investments in: | | | | | | | | | | | | | | | | |
| | | | |
Agency securities | | $ | 0 | | | $ | 307,825,914 | | | $ | 0 | | | $ | 307,825,914 | |
| | | | |
Short-term investments | | | | | | | | | | | | | | | | |
| | | | |
Investment companies | | | 9,709,267 | | | | 0 | | | | 0 | | | | 9,709,267 | |
| | | | |
Total assets | | $ | 9,709,267 | | | $ | 307,825,914 | | | $ | 0 | | | $ | 317,535,181 | |
| | | | |
| 32 | | Wells Fargo Adjustable Rate Government Fund | | Notes to financial statements (unaudited) |
Additional sector, industry or geographic detail is included in the Portfolio of Investments.
At February 28, 2019, the Fund did not have any transfers into/out of Level 3.
4. TRANSACTIONS WITH AFFILIATES
Management fee
Funds Management, an indirect wholly owned subsidiary of Wells Fargo & Company (“Wells Fargo”), is the manager of the Fund and provides advisory and fund-level administrative services under an investment management agreement. Under the investment management agreement, Funds Management is responsible for, among other services, implementing the investment objectives and strategies of the Fund, supervising the subadviser and providing fund-level administrative services in connection with the Fund’s operations. As compensation for its services under the investment management agreement, Funds Management is entitled to receive a management fee at the following annual rate based on the Fund’s average daily net assets:
| | |
| Average daily net assets | | Annual fee rate |
| |
First $1 billion | | 0.350% |
| |
Next $4 billion | | 0.325 |
| |
Next $3 billion | | 0.290 |
| |
Next $2 billion | | 0.265 |
| |
Over $10 billion | | 0.255 |
For the six months ended February 28, 2019, the management fee was equivalent to an annual rate of 0.35% of the Fund’s average daily net assets.
Funds Management has retained the services of a subadviser to provide daily portfolio management to the Fund. The fee for subadvisory services is borne by Funds Management. Wells Capital Management Incorporated, an affiliate of Funds Management and an indirect wholly owned subsidiary of Wells Fargo, is the subadviser to the Fund and is entitled to receive a fee from Funds Management at an annual rate starting at 0.20% and declining to 0.10% as the average daily net assets of the Fund increase.
Administration fees
Under a class-level administration agreement, Funds Management provides class-level administrative services to the Fund, which includes paying fees and expenses for services provided by the transfer agent,sub-transfer agents, omnibus account servicers and record-keepers. As compensation for its services under the class-level administration agreement, Funds Management receives an annual fee which is calculated based on the average daily net assets of each class as follows:
| | | | |
| | | Class-level
administration fee | |
| |
Class A, Class C | | | 0.16 | % |
| |
Administrator Class | | | 0.10 | |
| |
Institutional Class | | | 0.08 | |
Funds Management has contractually waived and/or reimbursed management and administration fees to the extent necessary to maintain certain net operating expense ratios for the Fund. When each class of the Fund has exceeded its expense cap, Funds Management has waived fees and/or reimbursed expenses from fund level expenses on a proportionate basis and then from class specific expenses. When only certain classes exceed their expense caps, waivers and/or reimbursements are applied against class specific expenses before fund level expenses. Funds Management has committed through December 31, 2019 to waive fees and/or reimburse expenses to the extent necessary to cap the Fund’s expenses at 0.74% for Class A shares, 1.49% for Class C shares, 0.60% for Administrator Class shares, and 0.46% for Institutional Class shares. Prior to or after the commitment expiration date, the cap may be increased or the commitment to maintain the cap may be terminated only with the approval of the Board of Trustees.
Distribution fee
The Trust has adopted a distribution plan for Class C shares of the Fund pursuant to Rule12b-1 under the 1940 Act. A distribution fee is charged to Class C shares and paid to Wells Fargo Funds Distributor, LLC (“Funds Distributor”), the principal underwriter, at an annual rate of 0.75% of the average daily net assets of Class C shares.
| | | | | | |
| Notes to financial statements (unaudited) | | Wells Fargo Adjustable Rate Government Fund | | | 33 | |
In addition, Funds Distributor is entitled to receive thefront-end sales charge from the purchase of Class A shares and a contingent deferred sales charge on the redemption of certain Class A shares. Funds Distributor is also entitled to receive the contingent deferred sales charges from redemptions of Class C shares. For the six months ended February 28, 2019, Funds Distributor received $141 from the sale of Class A shares. No contingent deferred sales charges were incurred by Class A and Class C shares for the six months ended February 28, 2019.
Shareholder servicing fees
The Trust has entered into contracts with one or more shareholder servicing agents, whereby Class A, Class C, and Administrator Class of the Fund are charged a fee at an annual rate of 0.25% of the average daily net assets of each respective class. A portion of these total shareholder servicing fees were paid to affiliates of Wells Fargo.
Interfund transactions
The Fund may purchase or sell portfolio investment securities to certain other Wells Fargo affiliates pursuant to Rule17a-7 under the 1940 Act and under procedures adopted by the Board of Trustees. The procedures have been designed to ensure that these interfund transactions, which do not incur broker commissions, are effected at current market prices.
5. INVESTMENT PORTFOLIO TRANSACTIONS
Purchases and sales of investments, excluding short-term securities, for the six months ended February 28, 2019 were as follows:
| | | | | | |
Purchases at cost | | Sales proceeds |
U.S.
government | | Non-U.S.
government | | U.S.
government | | Non-U.S.
government |
| $7,890,936 | | $1,919,481 | | $32,819,519 | | $1,482,220 |
6. BANK BORROWINGS
The Trust (excluding the money market funds), Wells Fargo Master Trust and Wells Fargo Variable Trust are parties to a $280,000,000 revolving credit agreement whereby the Fund is permitted to use bank borrowings for temporary or emergency purposes, such as to fund shareholder redemption requests. Interest under the credit agreement is charged to the Fund based on a borrowing rate equal to the higher of the Federal Funds rate in effect on that day plus 1.25% or the overnight LIBOR rate in effect on that day plus 1.25%. In addition, an annual commitment fee equal to 0.25% of the unused balance is allocated to each participating fund.
For the six months ended February 28, 2019, there were no borrowings by the Fund under the agreement.
7. DISTRIBUTIONS TO SHAREHOLDERS
Effective for all filings after November 4, 2018, the Securities and Exchange Commission eliminated the requirement to separately state the components of distributions to shareholders under U.S. generally accepted accounting principles. The amounts of distributions to shareholders for the year ended August 31, 2018 were as follows:
| | | | |
| | | Net investment
income | |
| |
Class A | | $ | 1,690,233 | |
| |
Class C | | | 291,921 | |
| |
Administrator Class | | | 197,212 | |
| |
Institutional Class | | | 4,228,118 | |
8. INDEMNIFICATION
Under the Trust’s organizational documents, the officers and Trustees have been granted certain indemnification rights against certain liabilities that may arise out of performance of their duties to the Trust. Additionally, in the normal course of business, the Trust may enter into contracts with service providers that contain a variety of indemnification clauses. The Trust’s maximum exposure under these arrangements is dependent on future claims that may be made against the Fund and, therefore, cannot be estimated.
| | | | |
| 34 | | Wells Fargo Adjustable Rate Government Fund | | Notes to financial statements (unaudited) |
9. NEW ACCOUNTING PRONOUNCEMENTS
In August 2018, FASB issued Accounting Standards Update (“ASU”)No. 2018-13, Fair Value Measurement (Topic 820)Disclosure Framework—Changes to the Disclosure Requirements for Fair Value Measurement. ASU2018-13 updates the disclosure requirements for fair value measurements by modifying or removing certain disclosures and adding certain new disclosures. The amendments are effective for fiscal years, and interim periods within those fiscal years, beginning after December 15, 2019. Early adoption is permitted. Management has adopted the removal and modification of disclosures early, as permitted, and will adopt the additional new disclosures at the effective date.
In March 2017, FASB issued ASUNo. 2017-08,Premium Amortization on Purchased Callable Debt Securities. ASU2017-08 shortens the amortization period for certain callable debt securities held at a premium. The amendments require the premium to be amortized to the earliest call date. The amendments do not require an accounting change for securities held at a discount; the discount continues to be amortized to maturity. ASU2017-08 is effective for fiscal years beginning after December 15, 2018 and for interim periods within those fiscal years . Management is currently evaluating the potential impact of this new guidance to the financial statements.
| | | | | | |
| Other information (unaudited) | | Wells Fargo Adjustable Rate Government Fund | | | 35 | |
PROXY VOTING INFORMATION
A description of the policies and procedures used to determine how to vote proxies relating to portfolio securities is available, upon request, by calling1-800-222-8222, visiting our website atwfam.com, or visiting the SEC website at sec.gov. Information regarding how the Fund voted proxies relating to portfolio securities during the most recent12-month period ended June 30 is available on the Fund’s website atwfam.comor by visiting the SEC website at sec.gov.
PORTFOLIO HOLDINGS INFORMATION
The complete portfolio holdings for the Fund are publicly available monthly on the Fund’s website (wfam.com), on aone-month delayed basis. In addition, top ten holdings information (excluding derivative positions) for the Fund is publicly available on the Fund’s website on a monthly,seven-day or more delayed basis. The Fund files its complete schedule of portfolio holdings with the SEC for the first and third quarters of each fiscal year on FormN-Q, which is available by visiting the SEC website at sec.gov. In addition, the Fund’s FormN-Q may be reviewed and copied at the SEC’s Public Reference Room in Washington, DC, and at regional offices in New York City, at 233 Broadway, and in Chicago, at 175 West Jackson Boulevard, Suite 900. Information about the Public Reference Room may be obtained by calling1-800-SEC-0330.
| | | | |
| 36 | | Wells Fargo Adjustable Rate Government Fund | | Other information (unaudited) |
BOARD OF TRUSTEES AND OFFICERS
Each of the Trustees and Officers1 listed in the table below acts in identical capacities for each fund in the Wells Fargo family of funds, which consists of 152 mutual funds comprising the Wells Fargo Funds Trust, Wells Fargo Variable Trust, Wells Fargo Master Trust and fourclosed-end funds (collectively the “Fund Complex”). This table should be read in conjunction with the Prospectus and the Statement of Additional Information2. The mailing address of each Trustee and Officer is 525 Market Street, 12th Floor, San Francisco, CA 94105. Each Trustee and Officer serves an indefinite term, however, each Trustee serves such term until reaching the mandatory retirement age established by the Trustees.
Independent Trustees
| | | | | | |
Name and
year of birth | | Position held and
length of service* | | Principal occupations during past five years or longer | | Current other
public company or
investment company
directorships |
| | | |
William R. Ebsworth (Born 1957) | | Trustee, since 2015 | | Retired. From 1984 to 2013, equities analyst, portfolio manager, research director and chief investment officer at Fidelity Management and Research Company in Boston, Tokyo, and Hong Kong, and retired in 2013 as Chief Investment Officer of Fidelity Strategic Advisers, Inc. where he led a team of investment professionals managing client assets. Prior thereto, Board member of Hong Kong Securities Clearing Co., Hong Kong Options Clearing Corp., the Thailand International Fund, Ltd., Fidelity Investments Life Insurance Company, and Empire Fidelity Investments Life Insurance Company. Board member of the Vincent Memorial Hospital Endowment(non-profit organization), where he serves on the Investment Committee and as a Chair of the Audit Committee. Mr. Ebsworth is a CFA® charterholder. | | N/A |
| | | |
Jane A. Freeman (Born 1953) | | Trustee, since 2015; Chair Liaison, since 2018 | | Retired. From 2012 to 2014 and 1999 to 2008, Chief Financial Officer of Scientific Learning Corporation. From 2008 to 2012, Ms. Freeman provided consulting services related to strategic business projects. Prior to 1999, Portfolio Manager at Rockefeller & Co. and Scudder, Stevens & Clark. Board member of the Harding Loevner Funds from 1996 to 2014, serving as both Lead Independent Director and chair of the Audit Committee. Board member of the Russell Exchange Traded Funds Trust from 2011 to 2012 and the chair of the Audit Committee. Ms. Freeman is a Board Member of The Ruth Bancroft Garden(non-profit organization). She is also an inactive Chartered Financial Analyst. | | N/A |
| | | |
Isaiah Harris, Jr.3 (Born 1952) | | Trustee, since 2009; Audit Committee Chairman, since 2019 | | Retired. Chairman of the Board of CIGNA Corporation since 2009, and Director since 2005. From 2003 to 2011, Director of Deluxe Corporation. Prior thereto, President and CEO of BellSouth Advertising and Publishing Corp. from 2005 to 2007, President and CEO of BellSouth Enterprises from 2004 to 2005 and President of BellSouth Consumer Services from 2000 to 2003. Emeritus member of the Iowa State University Foundation Board of Governors. Emeritus Member of the Advisory Board of Iowa State University School of Business. Advisory Board Member, Palm Harbor Academy (private school). Advisory Board Member, Child Evangelism Fellowship(non-profit). Mr. Harris is a certified public accountant (inactive status). | | CIGNA Corporation |
| | | |
Judith M. Johnson3 (Born 1949) | | Trustee, since 2008; Audit Committee Chairman, from 2009 to 2018 | | Retired. Prior thereto, Chief Executive Officer and Chief Investment Officer of Minneapolis Employees Retirement Fund from 1996 to 2008. Ms. Johnson is an attorney, certified public accountant and a certified managerial accountant. | | N/A |
| | | |
David F. Larcker (Born 1950) | | Trustee, since 2009 | | James Irvin Miller Professor of Accounting at the Graduate School of Business, Stanford University, Director of the Corporate Governance Research Initiative and Senior Faculty of The Rock Center for Corporate Governance since 2006. From 2005 to 2008, Professor of Accounting at the Graduate School of Business, Stanford University. Prior thereto, Ernst & Young Professor of Accounting at The Wharton School, University of Pennsylvania from 1985 to 2005. | | N/A |
| | | | | | |
| Other information (unaudited) | | Wells Fargo Adjustable Rate Government Fund | | | 37 | |
| | | | | | |
Name and
year of birth | | Position held and
length of service* | | Principal occupations during past five years or longer | | Current other
public company or
investment company
directorships |
| | | |
| Olivia S. Mitchell (Born 1953) | | Trustee, since 2006; Nominating and Governance Committee Chairman, since 2018 | | International Foundation of Employee Benefit Plans Professor, Wharton School of the University of Pennsylvania since 1993. Director of Wharton’s Pension Research Council and Boettner Center on Pensions & Retirement Research, and Research Associate at the National Bureau of Economic Research. Previously, Cornell University Professor from 1978 to 1993. | | N/A |
| | | |
| Timothy J. Penny (Born 1951) | | Trustee, since 1996; Chairman, since 2018 | | President and Chief Executive Officer of Southern Minnesota Initiative Foundation, anon-profit organization, since 2007. Member of the Board of Trustees of NorthStar Education Finance, Inc., anon-profit organization, since 2007. | | N/A |
| | | |
| James G. Polisson (Born 1959) | | Trustee, since 2018 | | Retired. Chief Marketing Officer, Source (ETF) UK Services, Ltd, from 2015 to 2017. From 2012 to 2015, Principal of The Polisson Group, LLC, a management consulting, corporate advisory and principal investing company. Chief Executive Officer and Managing Director at Russell Investments, Global Exchange Traded Funds from 2010 to 2012. Managing Director of Barclays Global Investors from 1998 to 2010 and Global Chief Marketing Officer for iShares and Barclays Global Investors from 2000 to 2010. Trustee of the San Francisco Mechanics’ Institute, anon-profit organization, from 2013 to 2015. Board member of the Russell Exchange Traded Fund Trust from 2011 to 2012. Director of Barclays Global Investors Holdings Deutschland GmbH from 2006 to 2009. Mr. Polisson is an attorney and has a retired status with the Massachusetts and District of Columbia Bar Associations. | | N/A |
| | | |
| Pamela Wheelock (Born 1959) | | Trustee, since 2018 | | Chief Operating Officer, Twin Cities Habitat for Humanity, since January, 2017. Vice President of University Services, University of Minnesota from 2012 to 2017. Prior thereto, on the Board of Directors, Governance Committee and Finance Committee for the Minnesota Philanthropy Partners (Saint Paul Foundation) from 2012 to 2018, Interim President and Chief Executive Officer of Blue Cross Blue Shield of Minnesota from 2010 to 2011, Chairman of the Board from 2009 to 2011 and Board Director from 2003 to 2015. Vice President, Leadership and Community Engagement, Bush Foundation, Saint Paul, Minnesota (a private foundation) from 2009 to 2011. Executive Vice President and Chief Financial Officer, Minnesota Sports and Entertainment from 2004 to 2009 and Senior Vice President from 2002 to 2004. Commissioner of Finance, State of Minnesota, from 1999 to 2002. Currently the Board Chair of the Minnesota Wild Foundation since 2010. | | N/A |
| * | Length of service dates reflect the Trustee’s commencement of service with the Trust’s predecessor entities, where applicable. |
| | | | |
| 38 | | Wells Fargo Adjustable Rate Government Fund | | Other information (unaudited) |
Officers
| | | | | | |
Name and
year of birth | | Position held and
length of service | | Principal occupations during past five years or longer | | |
| | | |
Andrew Owen
(Born 1960) | | President, since 2017 | | Executive Vice President of Wells Fargo & Company and Head of Affiliated Managers, Wells Fargo Asset Management, since 2014. In addition, Mr. Owen is currently President, Chief Executive Officer and Director of Wells Fargo Funds Management, LLC since 2017. Prior thereto, Executive Vice President responsible for marketing, investments and product development for Wells Fargo Funds Management, LLC, from 2009 to 2014. | | |
| | | |
Nancy Wiser1
(Born 1967) | | Treasurer, since 2012 | | Executive Vice President of Wells Fargo Funds Management, LLC since 2011. Chief Operating Officer and Chief Compliance Officer at LightBox Capital Management LLC, from 2008 to 2011. | | |
| | | |
| Alexander Kymn (Born 1973) | | Secretary and Chief Legal Officer, since 2018 | | Senior Company Counsel of Wells Fargo Bank, N.A. since 2018 (previously Senior Counsel from 2007 to 2018). Vice President of Wells Fargo Funds Management, LLC from 2008 to 2014. | | |
| | | |
| Michael H. Whitaker(Born 1967) | | Chief Compliance Officer, since 2016 | | Senior Vice President and Chief Compliance Officer since 2016. Senior Vice President and Chief Compliance Officer for Fidelity Investments from 2007 to 2016. | | |
| | | |
David Berardi
(Born 1975) | | Assistant Treasurer, since 2009 | | Vice President of Wells Fargo Funds Management, LLC since 2009. Vice President of Evergreen Investment Management Company, LLC from 2008 to 2010. Manager of Fund Reporting and Control for Evergreen Investment Management Company, LLC from 2004 to 2010. | | |
| | | |
| Jeremy DePalma1 (Born 1974) | | Assistant Treasurer, since 2009 | | Senior Vice President of Wells Fargo Funds Management, LLC since 2009. Senior Vice President of Evergreen Investment Management Company, LLC from 2008 to 2010 and head of the Fund Reporting and Control Team within Fund Administration from 2005 to 2010. | | |
| 1 | Nancy Wiser acts as Treasurer of 76 funds in the Fund Complex. Jeremy DePalma acts as Treasurer of 76 funds and Assistant Treasurer of 76 funds in the Fund Complex. |
| 2 | The Statement of Additional Information includes additional information about the Trustees and is available, without charge, upon request, by calling1-800-222-8222 or by visiting the website atwfam.com. |
| 3 | Mr. Harris became Chairman of the Audit Committee effective January 1, 2019. |
| | | | | | |
| Appendix A (unaudited) | | Wells Fargo Adjustable Rate Government Fund | | | 39 | |
SALES CHARGE REDUCTIONS AND WAIVERS FOR CERTAIN INTERMEDIARIES
Raymond James & Associates, Inc., Raymond James Financial Services & Raymond James affiliates (“Raymond James”)
Effective on or about March 1, 2019, shareholders purchasing Fund shares through a Raymond James platform or account will be eligible only for the following load waivers(front-end sales charge waivers and contingent deferred, orback-end, sales charge waivers) and discounts, which may differ from those disclosed elsewhere in the Fund’s Prospectus or SAI.
Front-end Sales Load Waivers on Class A shares Available at Raymond James
| | • | | Shares purchased in an investment advisory program. |
| | • | | Shares purchased through reinvestment of capital gains distributions and dividend reinvestment when purchasing shares of the same fund (but not any other fund within the fund family). |
| | • | | Employees and registered representatives of Raymond James or its affiliates and their family members as designated by Raymond James. |
| | • | | Shares purchased from the proceeds of redemptions within the same fund family, provided (1) the repurchase occurs within 90 days following the redemption, (2) the redemption and purchase occur in the same account, and (3) redeemed shares were subject to afront-end or deferred sales load (known as Rights of Reinstatement). |
| | • | | A shareholder in the fund’s Class C shares will have their shares automatically exchanged at net asset value to Class A shares (or the appropriate share class) of the fund if the shares are no longer subject to a CDSC and the exchange is in line with the policies and procedures of Raymond James. |
CDSC Waivers on Class A and C Shares Available at Raymond James
| | • | | Death or disability of the shareholder. |
| | • | | Shares sold as part of a systematic withdrawal plan as described in the Fund’s Prospectus. |
| | • | | Return of excess contributions from an IRA Account. |
| | • | | Shares sold as part of a required minimum distribution for IRA and retirement accounts due to the shareholder reaching age 70½ as described in the Fund’s prospectus. |
| | • | | Shares sold to pay Raymond James fees but only if the transaction is initiated by Raymond James. |
| | • | | Shares acquired through a right of reinstatement. |
Front-end Load Discounts Available at Raymond James: Breakpoints, and/or Rights of Accumulation
| | • | | Breakpoints as described in the Fund’s Prospectus. |
| | • | | Rights of accumulation which entitle shareholders to breakpoint discounts will be automatically calculated based on the aggregated holding of fund family assets held by accounts within the purchaser’s household at Raymond James. Eligible fund family assets not held at Raymond James may be included in the rights of accumulation calculation only if the shareholder notifies his or her financial advisor about such assets. |
This page is intentionally left blank.

For more information
More information about Wells Fargo Funds is available free upon request. To obtain literature, please write, visit the Fund’s website, or call:
Wells Fargo Funds
P.O. Box 219967
Kansas City, MO 64121-9967
Website: wfam.com
Individual investors: 1-800-222-8222
Retail investment professionals: 1-888-877-9275
Institutional investment professionals: 1-866-765-0778
This report and the financial statements contained herein are submitted for the general information of the shareholders of the Fund. If this report is used for promotional purposes, distribution of the report must be accompanied or preceded by a current prospectus. Before investing, please consider the investment objectives, risks, charges, and expenses of the investment. For a current prospectus and, if available, a summary prospectus, containing this information, call1-800-222-8222 or visit the Fund’s website atwfam.com. Read the prospectus carefully before you invest or send money.
Wells Fargo Asset Management (WFAM) is the trade name for certain investment advisory/management firms owned by Wells Fargo & Company. These firms include but are not limited to Wells Capital Management Incorporated and Wells Fargo Funds Management, LLC. Certain products managed by WFAM entities are distributed by Wells Fargo Funds Distributor, LLC (a broker-dealer and Member FINRA).
This material is for general informational and educational purposes only and is NOT intended to provide investment advice or a recommendation of any kind—including a recommendation for any specific investment, strategy, or plan.
INVESTMENT PRODUCTS: NOT FDIC INSURED ◾ NO BANK GUARANTEE ◾ MAY LOSE VALUE
© 2019 Wells Fargo Funds Management, LLC. All rights reserved.
| | |
 | | 321623 04-19 SA215/SAR215 02-19 |
Semi-Annual Report
February 28, 2019

Wells Fargo High Yield Bond Fund

Beginning on January 1, 2021, as permitted by new regulations adopted by the Securities and Exchange Commission, paper copies of the Wells Fargo Funds’ annual and semi-annual shareholder reports issued after this date will no longer be sent by mail, unless you specifically request paper copies of the reports. Instead, the reports will be made available on the Funds’ website, and you will be notified by mail each time a report is posted and provided with a website address to access the report.
If you already elected to receive shareholder reports electronically, you will not be affected by this change and you need not take any action. You may elect to receive shareholder reports and other communications from the Fund electronically at any time by contacting your financial intermediary (such as a broker-dealer or bank) or, if you are a direct investor, by calling 1-800-222-8222 or by enrolling at wellsfargo.com/advantagedelivery.
You may elect to receive all future reports in paper free of charge. If you invest through a financial intermediary, you can contact your financial intermediary to request that you continue to receive paper copies of your shareholder reports; if you invest directly with the Fund, you can call 1-800-222-8222. Your election to receive reports in paper will apply to all Wells Fargo Funds held in your account with your financial intermediary or, if you are a direct investor, to all Wells Fargo Funds that you hold.

Reduce clutter. Save trees.
Sign up for electronic delivery of prospectuses and shareholder reports atwellsfargo.com/advantagedelivery
Contents
The views expressed and any forward-looking statements are as of February 28, 2019, unless otherwise noted, and are those of the Fund managers and/or Wells Fargo Funds Management, LLC. Discussions of individual securities, or the markets generally, or any Wells Fargo Fund are not intended as individual recommendations. Future events or results may vary significantly from those expressed in any forward-looking statements. The views expressed are subject to change at any time in response to changing circumstances in the market. Wells Fargo Funds Management, LLC and the Fund disclaim any obligation to publicly update or revise any views expressed or forward-looking statements.
INVESTMENT PRODUCTS: NOT FDIC INSURED ◾ NO BANK GUARANTEE ◾ MAY LOSE VALUE
| | | | |
| 2 | | Wells Fargo High Yield Bond Fund | | Letter to shareholders (unaudited) |

Andrew Owen
President
Wells Fargo Funds
Favorable third-quarter economic indicators and corporate earnings reports encouraged domestic stock investors.
Dear Shareholder:
We are pleased to offer you this semi-annual report for the Wells Fargo High Yield Bond Fund for the six-month period that ended February 28, 2019. Highershort-term interest rates, inflation concerns, trade tensions, slowing economic growth outside the U.S., and geopolitical events contributed to investment market volatility throughout the period.
For the period, U.S. stocks, as measured by the S&P 500 Index,1 fell 3.04% and international stocks, as measured by the MSCI ACWI ex USA Index (Net),2 declined 2.47%. Based on the MSCI EM Index (Net),3 emerging market stocks gained 0.33%. For bond investors, the Bloomberg Barclays U.S. Aggregate Bond Index4 added 1.99% while the Bloomberg Barclays Global Aggregate ex-USD Index5 gained 0.63%. The Bloomberg Barclays Municipal Bond Index6 added 2.34%, and the ICE BofAML U.S. High Yield Index7 advanced 1.98%.
Investors appeared to shake off lingering concerns during the third quarter.
Favorable third-quarter economic indicators and corporate earnings reports encouraged domestic stock investors. U.S. trade negotiations with Mexico and Canada progressed. The Conference Board Consumer Confidence Index®8 reached its highest level in 18 years during September 2018. The U.S. Federal Reserve (Fed) raised the federal funds rate by 25 basis points (bps; 100 bps equal 1.00%) to a target range of between 2.00% and 2.25% in September 2018. For the quarter that ended September 30, 2018, the S&P 500 Index added 7.71%.
Investors in international markets were not as confident. Tensions between the U.S. and China increased. The U.S. imposed $200 billion in tariffs on Chinese goods. China reacted with $60 billion in tariffs on U.S. goods. Economic growth in China caused concern. The Bank of England (BOE) raised its monetary policy rate to 0.75% in August. During the quarter, the MSCI ACWI ex USA Index (Net) gained 0.71%. The MSCI EM Index (Net) declined 1.09%. In fixed-income markets, U.S. bonds were flat, as measured by the Bloomberg Barclays U.S. Aggregate Bond Index. The Bloomberg Barclays Global Aggregate ex-USD Index fell 1.74%.
| 1 | The S&P 500 Index consists of 500 stocks chosen for market size, liquidity, and industry group representation. It is a market-value-weighted index with each stock’s weight in the index proportionate to its market value. You cannot invest directly in an index. |
| 2 | The Morgan Stanley Capital International (MSCI) All Country World Index (ACWI) ex USA Index (Net) is a free-float-adjusted market-capitalization-weighted index that is designed to measure the equity market performance of developed markets, excluding the United States and Canada. Source: MSCI. MSCI makes no express or implied warranties or representations and shall have no liability whatsoever with respect to any MSCI data contained herein. The MSCI data may not be further redistributed or used as a basis for other indices or any securities or financial products. This report is not approved, reviewed, or produced by MSCI. You cannot invest directly in an index. |
| 3 | The MSCI Emerging Markets (EM) Index (Net) is a free-float-adjusted market-capitalization-weighted index that is designed to measure large- and mid-cap equity market performance of emerging markets. The MSCI EM Index (Net) consists of the following 24 emerging market country indices: Brazil, Chile, China, Colombia, Czech Republic, Egypt, Greece, Hungary, India, Indonesia, Korea, Malaysia, Mexico, Pakistan, Peru, the Philippines, Poland, Qatar, Russia, South Africa, Taiwan, Thailand, Turkey, and the United Arab Emirates. You cannot invest directly in an index. |
| 4 | The Bloomberg Barclays U.S. Aggregate Bond Index is a broad-based benchmark that measures the investment-grade, U.S. dollar-denominated, fixed-rate taxable bond market, including Treasuries, government-related and corporate securities, mortgage-backed securities (agency fixed-rate and hybrid adjustable-rate mortgage pass-throughs), asset-backed securities, and commercial mortgage-backed securities. You cannot invest directly in an index. |
| 5 | The Bloomberg Barclays Global Aggregate ex-USD Index is an unmanaged index that provides a broad-based measure of the global investment-grade fixed-income markets excluding the U.S. dollar-denominated debt market. You cannot invest directly in an index. |
| 6 | The Bloomberg Barclays Municipal Bond Index is an unmanaged index composed of long-term tax-exempt bonds with a minimum credit rating of Baa. You cannot invest directly in an index. |
| 7 | The ICE BofAML U.S. High Yield Index is a market-capitalization-weighted index of domestic and Yankee high-yield bonds. The index tracks the performance of high-yield securities traded in the U.S. bond market. You cannot invest directly in an index. Copyright 2019. ICE Data Indices, LLC. All rights reserved. |
| 8 | The Conference Board Consumer Confidence Index® measures the degree of optimism on the state of the U.S. economy that consumers are expressing through their activities of savings and spending. You cannot invest directly in an index. |
| | | | | | |
| Letter to shareholders (unaudited) | | Wells Fargo High Yield Bond Fund | | | 3 | |
Conflicting data unsettled markets during the fourth quarter.
November’s U.S. midterm elections shifted control of the House of Representatives from Republicans to Democrats, presaging potential partisan clashes.Third-quarter U.S. gross domestic product (GDP) was announced at an annualized 3.4% rate, lower than the second-quarter rate. Brexit efforts stalled ahead of the March 2019 deadline. The People’s Bank of China cut reserve requirement ratios, accelerated infrastructure spending, and cut taxes even as the value of the yuan declined to low levels last seen in 2008.
December’s S&P 500 Index performance was the worst since 1931. Globally,fixed-income investments fared better than stocks during the last two months of the year. The Fed increased the federal funds rate by 25 bps in December 2018 to a target range of between 2.25% and 2.50% and softened its outlook for 2019 rate increases.
The market climbs a wall of worry.
Investors entered 2019 with reasons to be concerned. A partial U.S. government shutdown driven by partisan spending and immigration policy disputes extended into January. Investors expected high levels of stock market volatility to continue based on the VIX9.
January’s returns tended to support the investing adage that markets climb a wall of worry. The S&P 500 Index gained 8.01% for the month that ended January 31, 2019, its best monthly performance in 30 years. Returns for the MSCI ACWI ex USA Index (Net), the Bloomberg Barclays U.S. Aggregate Bond Index, and the Bloomberg Barclays Global Aggregate ex-USD Index also were positive.
In February, concerns over slowing global growth reemerged. The Bureau of Economic Analysis announced fourth-quarter 2018 GDP grew at an annualized 2.2% rate, down from the 4.2% annualized rate for the second quarter and the 3.4% annualized rate for the third quarter. Analysts attributed the lower growth rate to a slowing housing market and larger trade deficit. The U.S. Labor Department said that the economy created just 20,000 jobs in February. In a February report, the BOE forecast the slowest growth since the financial crisis for 2019. China and the U.S., while putting future tariffs on hold for the time being, continued to wrangle over trade issues.
Don’t let short-term uncertainty derail long-term investment goals.
Periods of investment uncertainty can present challenges, but experience has taught us that maintaining long-term investment goals can be an effective way to plan for the future. To help you create a sound strategy based on your personal goals and risk tolerance, Wells Fargo Funds offers more than 100 mutual funds spanning a wide range of asset classes and investment styles. Although diversification cannot guarantee an investment profit or prevent losses, we believe it can be an effective way to manage investment risk and potentially smooth out overall portfolio performance. We encourage investors to know their investments and to understand that appropriate levels of risk-taking may unlock opportunities.
January’s returns tended to support the investing adage that markets climb a wall of worry.
| 9 | The Chicago Board Options Exchange Market Volatility Index (VIX) is a popular measure of the implied volatility of S&P 500 Index options. It represents one measure of the market’s expectation of stock market volatility over the next 30-day period. You cannot invest directly in an index. |
| | | | |
| 4 | | Wells Fargo High Yield Bond Fund | | Letter to shareholders (unaudited) |
Thank you for choosing to invest with Wells Fargo Funds. We appreciate your confidence in us and remain committed to helping you meet your financial needs.
Sincerely,

Andrew Owen
President
Wells Fargo Funds
For further information about your Fund, contact your investment professional, visit our website atwfam.com, or call us directly at1-800-222-8222.
This page is intentionally left blank.
| | | | |
| 6 | | Wells Fargo High Yield Bond Fund | | Performance highlights (unaudited) |
Investment objective
The Fund seeks total return, consisting of a high level of current income and capital appreciation.
Manager
Wells Fargo Funds Management, LLC
Subadviser
Wells Capital Management Incorporated
Portfolio managers
Robert Junkin‡
Margaret D. Patel
Average annual total returns (%) as of February 28, 20191
| | | | | | | | | | | | | | | | | | | | | | | | | | | | | | | | | | |
| | | | | Including sales charge | | | Excluding sales charge | | | Expense ratios2 (%) | |
| | | Inception date | | 1 year | | | 5 year | | | 10 year | | | 1 year | | | 5 year | | | 10 year | | | Gross | | | Net3 | |
| | | | | | | | | |
| Class A (EKHAX) | | 1-20-1998 | | | -2.99 | | | | 2.90 | | | | 9.42 | | | | 1.67 | | | | 3.88 | | | | 9.91 | | | | 1.02 | | | | 0.93 | |
| | | | | | | | | |
| Class C (EKHCX) | | 1-21-1998 | | | -0.09 | | | | 3.10 | | | | 9.09 | | | | 0.91 | | | | 3.10 | | | | 9.09 | | | | 1.77 | | | | 1.68 | |
| | | | | | | | | |
| Administrator Class (EKHYX) | | 4-14-1998 | | | – | | | | – | | | | – | | | | 2.11 | | | | 4.12 | | | | 10.16 | | | | 0.96 | | | | 0.80 | |
| | | | | | | | | |
| Institutional Class (EKHIX)4 | | 10-31-2014 | | | – | | | | – | | | | – | | | | 2.39 | | | | 4.30 | | | | 10.26 | | | | 0.69 | | | | 0.53 | |
| | | | | | | | | |
| ICE BofAML U.S. High Yield Constrained Index5 | | – | | | – | | | | – | | | | – | | | | 4.26 | | | | 4.55 | | | | 11.43 | | | | – | | | | – | |
Figures quoted represent past performance, which is no guarantee of future results, and do not reflect taxes that a shareholder may pay on fund distributions or the redemption of fund shares. Investment return and principal value of an investment will fluctuate so that an investor’s shares, when redeemed, may be worth more or less than their original cost. Performance shown without sales charges would be lower if sales charges were reflected. Current performance may be lower or higher than the performance data quoted, which assumes the reinvestment of dividends and capital gains. Current month-end performance is available on the Fund’s website,wfam.com.
Index returns do not include transaction costs associated with buying and selling securities, any mutual fund fees or expenses, or any taxes. It is not possible to invest directly in an index.
For Class A shares, the maximum front-end sales charge is 4.50%. For Class C shares, the maximum contingent deferred sales charge is 1.00%. Performance including a contingent deferred sales charge assumes the sales charge for the corresponding time period. Administrator Class and Institutional Class shares are sold without a front-end sales charge or contingent deferred sales charge.
Bond values fluctuate in response to the financial condition of individual issuers, general market and economic conditions, and changes in interest rates. Changes in market conditions and government policies may lead to periods of heightened volatility in the bond market and reduced liquidity for certain bonds held by the Fund. In general, when interest rates rise, bond values fall and investors may lose principal value. Interest rate changes and their impact on the Fund and its share price can be sudden and unpredictable. The use of derivatives may reduce returns and/or increase volatility. High-yield securities have a greater risk of default and tend to be more volatile than higher-rated debt securities. Loans are subject to risks similar to those associated with other below investment-grade bond investments, such as credit risk (for example, risk of issuer default), below investment-grade bond risk (for example, risk of greater volatility in value), and risk that the loan may become illiquid or difficult to price. The Fund is exposed to foreign investment risk. Consult the Fund’s prospectus for additional information on these and other risks.
Please see footnotes on page 7.
| | | | | | |
| Performance highlights (unaudited) | | Wells Fargo High Yield Bond Fund | | | 7 | |
| | | | |
| Ten largest holdings (%) as of February 28, 20196 | |
| |
Mallinckrodt plc, 5.50%, 4-15-2025 | | | 3.23 | |
| |
Iron Mountain Incorporated, 5.38%, 6-1-2026 | | | 2.97 | |
| |
Tronox Finance plc, 5.75%,10-1-2025 | | | 2.68 | |
| |
Post Holdings Incorporated, 5.00%, 8-15-2026 | | | 2.31 | |
| |
HCA Incorporated, 5.38%, 2-1-2025 | | | 2.24 | |
| |
TransDigm Group Incorporated, 6.38%, 6-15-2026 | | | 2.15 | |
| |
Seagate HDD, 4.88%, 6-1-2027 | | | 2.13 | |
| |
TTM Technologies Incorporated, 5.63%, 10-1-2025 | | | 2.05 | |
| |
Olin Corporation, 5.50%, 8-15-2022 | | | 2.04 | |
| |
Micron Technology Incorporated, 5.50%, 2-1-2025 | | | 1.95 | |
|
| Credit quality as of February 28, 20197 |
|
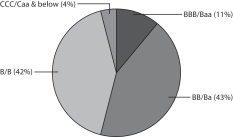
|
| ‡ | Mr. Robert Junkin became a portfolio manager of the Fund on April 1, 2019. |
| 1 | Historical performance shown for all classes of the Fund prior to July 12, 2010 is based on the performance of the Fund’s predecessor, Evergreen High Income Fund. |
| 2 | Reflects the expense ratios as stated in the most recent prospectuses. The expense ratios shown are subject to change and may differ from the annualized expense ratios shown in the financial highlights of this report. |
| 3 | The manager has contractually committed through December 31, 2019, to waive fees and/or reimburse expenses to the extent necessary to cap the expense of each class at amounts shown. Brokerage commissions, stamp duty fees, interest, taxes, acquired fund fees and expenses (if any), and extraordinary expenses are excluded from the expense cap. Prior to or after the commitment expiration date, the cap may be increased or the commitment to maintain the cap may be terminated only with the approval of the Board of Trustees. Without this cap, the Fund’s returns would have been lower. The expense ratio paid by an investor is the net expense ratio (the total annual fund operating expenses after fee waivers) as stated in the prospectuses. |
| 4 | Historical performance shown for the Institutional Class shares prior to their inception reflects the performance of the Administrator Class shares, and is not adjusted to reflect the Institutional Class expenses. If these expenses had been included, returns for the Institutional Class shares would be higher. |
| 5 | The ICE BofAML U.S. High Yield Constrained Index is a market value-weighted index of all domestic and Yankee high-yield bonds, including deferred interest bonds and payment-in kind securities. Issues included in the index have maturities of one year or more and have a credit rating lower than BBB–/Baa3, but are not in default. The ICE BofAML U.S. High Yield Constrained Index limits any individual issuer to a maximum of 2% benchmark exposure. You cannot invest directly in an index. Copyright 2019. ICE Data Indices, LLC. All rights reserved. |
| 6 | The ten largest holdings, excluding cash, cash equivalents and any money market funds, are calculated based on the value of the investments divided by total net assets of the Fund. Holdings are subject to change and may have changed since the date specified. |
| 7 | The credit quality distribution of portfolio holdings reflected in the chart is based on ratings from Standard & Poor’s, Moody’s Investors Service, and/or Fitch Ratings Ltd. Credit quality ratings apply to the underlying holdings of the Fund and not to the Fund itself. The percentages of the Fund’s portfolio with the ratings depicted in the chart are calculated based on the total market value of fixed income securities held by the Fund. If a security was rated by all three rating agencies, the middle rating was utilized. If rated by two of three rating agencies, the lower rating was utilized, and if rated by one of the rating agencies, that rating was utilized. Standard & Poor’s rates the creditworthiness of bonds, ranging from AAA (highest) to D (lowest). Ratings from A to CCC may be modified by the addition of a plus (+) or minus (-) sign to show relative standing within the rating categories. Standard & Poor’s rates the creditworthiness of short-term notes from SP-1 (highest) to SP-3 (lowest). Moody’s rates the creditworthiness of bonds, ranging from Aaa (highest) to C (lowest). Ratings Aa to B may be modified by the addition of a number 1 (highest) to 3 (lowest) to show relative standing within the ratings categories. Moody’s rates the creditworthiness of short-term U.S. tax-exempt municipal securities from MIG 1/VMIG 1 (highest) to SG (lowest). Fitch rates the creditworthiness of bonds, ranging from AAA (highest) to D (lowest). Credit quality distribution is subject to change and may have changed since the date specified. |
| | | | |
| 8 | | Wells Fargo High Yield Bond Fund | | Fund expenses (unaudited) |
As a shareholder of the Fund, you incur two types of costs: (1) transaction costs, including sales charges (loads) on purchase payments and contingent deferred sales charges (if any) on redemptions and (2) ongoing costs, including management fees, distribution (12b-1) and/or shareholder servicing fees, and other Fund expenses. This example is intended to help you understand your ongoing costs (in dollars) of investing in the Fund and to compare these costs with the ongoing costs of investing in other mutual funds.
The example is based on an investment of $1,000 invested at the beginning of the six-month period and held for the entire period from September 1, 2018 to February 28, 2019.
Actual expenses
The “Actual” line of the table below provides information about actual account values and actual expenses. You may use the information in this line, together with the amount you invested, to estimate the expenses that you paid over the period. Simply divide your account value by $1,000 (for example, an $8,600 account value divided by $1,000 = 8.6), then multiply the result by the number in the “Actual” line under the heading entitled “Expenses paid during period” for your applicable class of shares to estimate the expenses you paid on your account during this period.
Hypothetical example for comparison purposes
The “Hypothetical” line of the table below provides information about hypothetical account values and hypothetical expenses based on the Fund’s actual expense ratio and an assumed rate of return of 5% per year before expenses, which is not the Fund’s actual return. The hypothetical account values and expenses may not be used to estimate the actual ending account balance or expenses you paid for the period. You may use this information to compare the ongoing costs of investing in the Fund and other funds. To do so, compare this 5% hypothetical example with the 5% hypothetical examples that appear in the shareholder reports of the other funds.
Please note that the expenses shown in the table are meant to highlight your ongoing costs only and do not reflect any transactional costs, such as sales charges (loads) and contingent deferred sales charges. Therefore, the “Hypothetical” line of the table is useful in comparing ongoing costs only and will not help you determine the relative total costs of owning different funds. In addition, if these transactional costs were included, your costs would have been higher.
| | | | | | | | | | | | | | | | |
| | | Beginning
account value
9-1-2018 | | | Ending
account value
2-28-2019 | | | Expenses
paid during
the period¹ | | | Annualized net
expense ratio | |
Class A | | | | | | | | | | | | | | | | |
| | | | |
Actual | | $ | 1,000.00 | | | $ | 1,010.17 | | | $ | 4.64 | | | | 0.93 | % |
| | | | |
Hypothetical (5% return before expenses) | | $ | 1,000.00 | | | $ | 1,020.18 | | | $ | 4.66 | | | | 0.93 | % |
Class C | | | | | | | | | | | | | | | | |
| | | | |
Actual | | $ | 1,000.00 | | | $ | 1,006.42 | | | $ | 8.36 | | | | 1.68 | % |
| | | | |
Hypothetical (5% return before expenses) | | $ | 1,000.00 | | | $ | 1,016.46 | | | $ | 8.40 | | | | 1.68 | % |
Administrator Class | | | | | | | | | | | | | | | | |
| | | | |
Actual | | $ | 1,000.00 | | | $ | 1,010.86 | | | $ | 3.99 | | | | 0.80 | % |
| | | | |
Hypothetical (5% return before expenses) | | $ | 1,000.00 | | | $ | 1,020.83 | | | $ | 4.01 | | | | 0.80 | % |
Institutional Class | | | | | | | | | | | | | | | | |
| | | | |
Actual | | $ | 1,000.00 | | | $ | 1,015.27 | | | $ | 2.65 | | | | 0.53 | % |
| | | | |
Hypothetical (5% return before expenses) | | $ | 1,000.00 | | | $ | 1,022.17 | | | $ | 2.66 | | | | 0.53 | % |
| 1 | Expenses paid is equal to the annualized net expense ratio of each class multiplied by the average account value over the period, multiplied by the number of days in the most recent fiscal half-year divided by the number of days in the fiscal year (to reflect the one-half-year period). |
| | | | | | |
| Portfolio of investments—February 28, 2019 (unaudited) | | Wells Fargo High Yield Bond Fund | | | 9 | |
| | | | | | | | | | | | | | | | |
| Security name | | | | | | | | Shares | | | Value | |
| | | | |
Common Stocks: 6.43% | | | | | | | | | | | | | | | | |
| | | | |
Consumer Staples: 0.25% | | | | | | | | | | | | | | | | |
| | | | |
| Food Products: 0.25% | | | | | | | | | | | | | | | | |
| | | | |
Lamb Weston Holdings Incorporated | | | | | | | | | | | 15,000 | | | $ | 1,039,650 | |
| | | | | | | | | | | | | | | | |
| | | | |
Energy: 0.57% | | | | | | | | | | | | | | | | |
| | | | |
| Oil, Gas & Consumable Fuels: 0.57% | | | | | | | | | | | | | | | | |
| | | | |
Kinder Morgan Incorporated | | | | | | | | | | | 50,000 | | | | 958,000 | |
| | | | |
Plains All American Pipeline LP | | | | | | | | | | | 60,000 | | | | 1,400,400 | |
| | | | |
| | | | | | | | | | | | | | | 2,358,400 | |
| | | | | | | | | | | | | | | | |
| | | | |
Health Care: 0.46% | | | | | | | | | | | | | | | | |
| | | | |
| Health Care Providers & Services: 0.17% | | | | | | | | | | | | | | | | |
| | | | |
HCA Holdings Incorporated | | | | | | | | | | | 5,000 | | | | 695,200 | |
| | | | | | | | | | | | | | | | |
| | | | |
| Life Sciences Tools & Services: 0.19% | | | | | | | | | | | | | | | | |
| | | | |
Agilent Technologies Incorporated | | | | | | | | | | | 10,000 | | | | 794,400 | |
| | | | | | | | | | | | | | | | |
| | | | |
| Pharmaceuticals: 0.10% | | | | | | | | | | | | | | | | |
| | | | |
Merck KGaA ADR | | | | | | | | | | | 20,000 | | | | 412,900 | |
| | | | | | | | | | | | | | | | |
| | | | |
Industrials: 0.70% | | | | | | | | | | | | | | | | |
| | | | |
| Aerospace & Defense: 0.48% | | | | | | | | | | | | | | | | |
| | | | |
Huntington Ingalls Industries Incorporated | | | | | | | | | | | 5,000 | | | | 1,047,050 | |
| | | | |
Raytheon Company | | | | | | | | | | | 5,000 | | | | 932,500 | |
| | | | |
| | | | | | | | | | | | | | | 1,979,550 | |
| | | | | | | | | | | | | | | | |
| | | | |
| Machinery: 0.22% | | | | | | | | | | | | | | | | |
| | | | |
John Bean Technologies Corporation | | | | | | | | | | | 10,000 | | | | 937,000 | |
| | | | | | | | | | | | | | | | |
| | | | |
Information Technology: 1.72% | | | | | | | | | | | | | | | | |
| | | | |
| Electronic Equipment, Instruments & Components: 0.23% | | | | | | | | | | | | | | | | |
| | | | |
Amphenol Corporation Class A | | | | | | | | | | | 10,000 | | | | 939,700 | |
| | | | | | | | | | | | | | | | |
| | | | |
| IT Services: 0.64% | | | | | | | | | | | | | | | | |
| | | | |
Akamai Technologies Incorporated † | | | | | | | | | | | 20,000 | | | | 1,393,200 | |
| | | | |
Leidos Holdings Incorporated | | | | | | | | | | | 20,000 | | | | 1,291,800 | |
| | | | |
| | | | | | | | | | | | | | | 2,685,000 | |
| | | | | | | | | | | | | | | | |
| | | | |
| Semiconductors & Semiconductor Equipment: 0.57% | | | | | | | | | | | | | | | | |
| | | | |
Applied Materials Incorporated | | | | | | | | | | | 10,000 | | | | 383,400 | |
| | | | |
Cypress Semiconductor Corporation | | | | | | | | | | | 35,000 | | | | 540,050 | |
| | | | |
Microchip Technology Incorporated « | | | | | | | | | | | 5,000 | | | | 434,350 | |
| | | | |
Micron Technology Incorporated † | | | | | | | | | | | 25,000 | | | | 1,022,000 | |
| | | | |
| | | | | | | | | | | | | | | 2,379,800 | |
| | | | | | | | | | | | | | | | |
The accompanying notes are an integral part of these financial statements.
| | | | |
| 10 | | Wells Fargo High Yield Bond Fund | | Portfolio of investments—February 28, 2019 (unaudited) |
| | | | | | | | | | | | | | | | |
| Security name | | | | | | | | Shares | | | Value | |
| | | | |
| Software: 0.26% | | | | | | | | | | | | | | | | |
| | | | |
Nutanix Incorporated Class A † | | | | | | | | | | | 5,000 | | | $ | 250,450 | |
| | | | |
Salesforce.com Incorporated † | | | | | | | | | | | 5,000 | | | | 818,250 | |
| | | | |
| | | | | | | | | | | | | | | 1,068,700 | |
| | | | | | | | | | | | | | | | |
| | | | |
| Technology Hardware, Storage & Peripherals: 0.02% | | | | | | | | | | | | | | | | |
| | | | |
Pure Storage Incorporated Class A † | | | | | | | | | | | 5,000 | | | | 102,400 | |
| | | | | | | | | | | | | | | | |
| | | | |
Materials: 1.52% | | | | | | | | | | | | | | | | |
| | | | |
| Chemicals: 1.52% | | | | | | | | | | | | | | | | |
| | | | |
Celanese Corporation Series A | | | | | | | | | | | 15,000 | | | | 1,534,350 | |
| | | | |
Eastman Chemical Company | | | | | | | | | | | 10,000 | | | | 826,900 | |
| | | | |
Huntsman Corporation | | | | | | | | | | | 22,000 | | | | 545,380 | |
| | | | |
LyondellBasell Industries NV Class A | | | | | | | | | | | 40,000 | | | | 3,420,800 | |
| | | | |
| | | | | | | | | | | | | | | 6,327,430 | |
| | | | | | | | | | | | | | | | |
| | | | |
Real Estate: 0.20% | | | | | | | | | | | | | | | | |
| | | | |
| Equity REITs: 0.20% | | | | | | | | | | | | | | | | |
| | | | |
Saul Centers Incorporated | | | | | | | | | | | 15,000 | | | | 850,050 | |
| | | | | | | | | | | | | | | | |
| | | | |
Utilities: 1.01% | | | | | | | | | | | | | | | | |
| | | | |
| Gas Utilities: 0.71% | | | | | | | | | | | | | | | | |
| | | | |
Atmos Energy Corporation | | | | | | | | | | | 30,000 | | | | 2,965,500 | |
| | | | | | | | | | | | | | | | |
| | | | |
| Multi-Utilities: 0.30% | | | | | | | | | | | | | | | | |
| | | | |
DTE Energy Company | | | | | | | | | | | 10,000 | | | | 1,235,600 | |
| | | | | | | | | | | | | | | | |
| | | | |
Total Common Stocks (Cost $24,773,293) | | | | | | | | | | | | | | | 26,771,280 | |
| | | | | | | | | | | | | | | | |
| | | | |
| | | Interest rate | | | Maturity date | | | Principal | | | | |
| | | | |
Corporate Bonds and Notes: 76.11% | | | | | | | | | | | | | | | | |
| | | | |
Communication Services: 3.28% | | | | | | | | | | | | | | | | |
| | | | |
| Media: 3.28% | | | | | | | | | | | | | | | | |
| | | | |
CCO Holdings LLC 144A | | | 5.75 | % | | | 2-15-2026 | | | $ | 3,000,000 | | | | 3,108,870 | |
| | | | |
Clear Channel Worldwide Holdings Incorporated | | | 6.50 | | | | 11-15-2022 | | | | 3,000,000 | | | | 3,063,750 | |
| | | | |
McGraw-Hill Global Education Holdings LLC «144A | | | 7.88 | | | | 5-15-2024 | | | | 5,500,000 | | | | 4,427,500 | |
| | | | |
Sinclair Television Group Incorporated 144A | | | 5.63 | | | | 8-1-2024 | | | | 3,000,000 | | | | 3,030,000 | |
| | | | |
| | | | | | | | | | | | | | | 13,630,120 | |
| | | | | | | | | | | | | | | | |
| | | | |
Consumer Discretionary: 3.18% | | | | | | | | | | | | | | | | |
| | | | |
| Auto Components: 2.43% | | | | | | | | | | | | | | | | |
| | | | |
Allison Transmission Incorporated 144A | | | 5.00 | | | | 10-1-2024 | | | | 1,000,000 | | | | 1,006,250 | |
| | | | |
Dana Holding Corporation | | | 5.50 | | | | 12-15-2024 | | | | 1,500,000 | | | | 1,486,875 | |
| | | | |
Goodyear Tire & Rubber Company « | | | 5.13 | | | | 11-15-2023 | | | | 2,500,000 | | | | 2,493,750 | |
| | | | |
Tenneco Incorporated | | | 5.00 | | | | 7-15-2026 | | | | 6,000,000 | | | | 5,130,000 | |
| | | | |
| | | | | | | | | | | | | | | 10,116,875 | |
| | | | | | | | | | | | | | | | |
The accompanying notes are an integral part of these financial statements.
| | | | | | |
| Portfolio of investments—February 28, 2019 (unaudited) | | Wells Fargo High Yield Bond Fund | | | 11 | |
| | | | | | | | | | | | | | | | |
| Security name | | Interest rate | | | Maturity date | | | Principal | | | Value | |
| | | | |
| Hotels, Restaurants & Leisure: 0.75% | | | | | | | | | | | | | | | | |
| | | | |
Speedway Motorsports Incorporated | | | 5.13 | % | | | 2-1-2023 | | | $ | 3,115,000 | | | $ | 3,115,000 | |
| | | | | | | | | | | | | | | | |
| | | | |
Consumer Staples: 4.65% | | | | | | | | | | | | | | | | |
| | | | |
| Food Products: 4.18% | | | | | | | | | | | | | | | | |
| | | | |
Dean Foods Company 144A | | | 6.50 | | | | 3-15-2023 | | | | 5,000,000 | | | | 3,787,500 | |
| | | | |
Lamb Weston Holdings Incorporated 144A | | | 4.63 | | | | 11-1-2024 | | | | 1,000,000 | | | | 1,005,000 | |
| | | | |
Lamb Weston Holdings Incorporated 144A | | | 4.88 | | | | 11-1-2026 | | | | 3,000,000 | | | | 3,003,750 | |
| | | | |
Post Holdings Incorporated 144A | | | 5.00 | | | | 8-15-2026 | | | | 10,000,000 | | | | 9,612,500 | |
| | | | |
| | | | | | | | | | | | | | | 17,408,750 | |
| | | | | | | | | | | | | | | | |
| | | | |
| Household Products: 0.47% | | | | | | | | | | | | | | | | |
| | | | |
Spectrum Brands Incorporated | | | 5.75 | | | | 7-15-2025 | | | | 2,000,000 | | | | 1,957,500 | |
| | | | | | | | | | | | | | | | |
| | | | |
Energy: 2.36% | | | | | | | | | | | | | | | | |
| | | | |
| Energy Equipment & Services: 0.24% | | | | | | | | | | | | | | | | |
| | | | |
NGPL PipeCo LLC 144A | | | 4.88 | | | | 8-15-2027 | | | | 1,000,000 | | | | 1,005,935 | |
| | | | | | | | | | | | | | | | |
| | | | |
| Oil, Gas & Consumable Fuels: 2.12% | | | | | | | | | | | | | | | | |
| | | | |
Cheniere Corpus Christi Holdings LLC | | | 5.13 | | | | 6-30-2027 | | | | 3,500,000 | | | | 3,570,000 | |
| | | | |
Tennessee Gas Pipeline Company | | | 7.00 | | | | 3-15-2027 | | | | 4,534,000 | | | | 5,232,690 | |
| | | | |
| | | | | | | | | | | | | | | 8,802,690 | |
| | | | | | | | | | | | | | | | |
| | | | |
Financials: 1.99% | | | | | | | | | | | | | | | | |
| | | | |
| Banks: 0.77% | | | | | | | | | | | | | | | | |
| | | | |
Bank of America Corporation (3 Month LIBOR +3.90%) ± | | | 6.10 | | | | 12-29-2049 | | | | 3,000,000 | | | | 3,188,970 | |
| | | | | | | | | | | | | | | | |
| | | | |
| Consumer Finance: 0.82% | | | | | | | | | | | | | | | | |
| | | | |
Navient Corporation | | | 5.88 | | | | 10-25-2024 | | | | 1,000,000 | | | | 962,500 | |
| | | | |
SLM Corporation | | | 5.50 | | | | 1-25-2023 | | | | 2,500,000 | | | | 2,468,750 | |
| | | | |
| | | | | | | | | | | | | | | 3,431,250 | |
| | | | | | | | | | | | | | | | |
| | | | |
| Insurance: 0.40% | | | | | | | | | | | | | | | | |
| | | | |
Genworth Holdings Incorporated | | | 4.80 | | | | 2-15-2024 | | | | 2,000,000 | | | | 1,650,000 | |
| | | | | | | | | | | | | | | | |
| | | | |
Health Care: 13.77% | | | | | | | | | | | | | | | | |
| | | | |
| Health Care Equipment & Supplies: 1.32% | | | | | | | | | | | | | | | | |
| | | | |
Teleflex Incorporated | | | 4.88 | | | | 6-1-2026 | | | | 5,415,000 | | | | 5,489,456 | |
| | | | | | | | | | | | | | | | |
| | | | |
| Health Care Providers & Services: 7.75% | | | | | | | | | | | | | | | | |
| | | | |
AMN Healthcare Incorporated 144A | | | 5.13 | | | | 10-1-2024 | | | | 6,298,000 | | | | 6,219,275 | |
| | | | |
Encompass Health Corporation | | | 5.75 | | | | 11-1-2024 | | | | 4,000,000 | | | | 4,041,200 | |
| | | | |
HCA Incorporated | | | 5.38 | | | | 2-1-2025 | | | | 9,000,000 | | | | 9,334,710 | |
| | | | |
HealthSouth Corporation | | | 5.13 | | | | 3-15-2023 | | | | 5,000,000 | | | | 5,037,500 | |
| | | | |
Select Medical Corporation | | | 6.38 | | | | 6-1-2021 | | | | 3,500,000 | | | | 3,513,125 | |
| | | | |
West Street Merger Subordinate Bond Incorporated 144A | | | 6.38 | | | | 9-1-2025 | | | | 4,400,000 | | | | 4,103,000 | |
| | | | |
| | | | | | | | | | | | | | | 32,248,810 | |
| | | | | | | | | | | | | | | | |
The accompanying notes are an integral part of these financial statements.
| | | | |
| 12 | | Wells Fargo High Yield Bond Fund | | Portfolio of investments—February 28, 2019 (unaudited) |
| | | | | | | | | | | | | | | | |
| Security name | | Interest rate | | | Maturity date | | | Principal | | | Value | |
| | | | |
| Health Care Technology: 1.22% | | | | | | | | | | | | | | | | |
| | | | |
Quintiles IMS Holdings Incorporated 144A | | | 4.88 | % | | | 5-15-2023 | | | $ | 3,000,000 | | | $ | 3,045,000 | |
| | | | |
Quintiles IMS Holdings Incorporated 144A | | | 5.00 | | | | 10-15-2026 | | | | 2,000,000 | | | | 2,035,000 | |
| | | | |
| | | | | | | | | | | | | | | 5,080,000 | |
| | | | | | | | | | | | | | | | |
| | | | |
| Life Sciences Tools & Services: 1.58% | | | | | | | | | | | | | | | | |
| | | | |
Charles River Laboratories Incorporated 144A | | | 5.50 | | | | 4-1-2026 | | | | 6,300,000 | | | | 6,552,000 | |
| | | | | | | | | | | | | | | | |
| | | | |
| Pharmaceuticals: 1.90% | | | | | | | | | | | | | | | | |
| | | | |
Catalent Pharma Solutions Incorporated 144A | | | 4.88 | | | | 1-15-2026 | | | | 8,000,000 | | | | 7,920,000 | |
| | | | | | | | | | | | | | | | |
| | | | |
Industrials: 12.60% | | | | | | | | | | | | | | | | |
| | | | |
| Aerospace & Defense: 4.47% | | | | | | | | | | | | | | | | |
| | | | |
Huntington Ingalls Industries Incorporated 144A | | | 5.00 | | | | 11-15-2025 | | | | 4,500,000 | | | | 4,590,000 | |
| | | | |
Moog Incorporated 144A | | | 5.25 | | | | 12-1-2022 | | | | 5,000,000 | | | | 5,079,150 | |
| | | | |
TransDigm Group Incorporated | | | 6.38 | | | | 6-15-2026 | | | | 9,200,000 | | | | 8,947,000 | |
| | | | |
| | | | | | | | | | | | | | | 18,616,150 | |
| | | | | | | | | | | | | | | | |
| | | | |
| Commercial Services & Supplies: 1.75% | | | | | | | | | | | | | | | | |
| | | | |
Acco Brands Corporation 144A | | | 5.25 | | | | 12-15-2024 | | | | 7,417,000 | | | | 7,287,203 | |
| | | | | | | | | | | | | | | | |
| | | | |
| Construction & Engineering: 0.68% | | | | | | | | | | | | | | | | |
| | | | |
Aecom Company | | | 5.13 | | | | 3-15-2027 | | | | 3,000,000 | | | | 2,846,250 | |
| | | | | | | | | | | | | | | | |
| | | | |
| Electrical Equipment: 0.99% | | | | | | | | | | | | | | | | |
| | | | |
Resideo Funding Incorporated 144A | | | 6.13 | | | | 11-1-2026 | | | | 4,000,000 | | | | 4,100,000 | |
| | | | | | | | | | | | | | | | |
| | | | |
| Machinery: 2.46% | | | | | | | | | | | | | | | | |
| | | | |
HD Supply Incorporated 144A | | | 5.38 | | | | 10-15-2026 | | | | 1,000,000 | | | | 1,015,000 | |
| | | | |
Oshkosh Corporation | | | 5.38 | | | | 3-1-2025 | | | | 4,163,000 | | | | 4,225,445 | |
| | | | |
SPX FLOW Incorporated 144A | | | 5.63 | | | | 8-15-2024 | | | | 5,000,000 | | | | 5,000,000 | |
| | | | |
| | | | | | | | | | | | | | | 10,240,445 | |
| | | | | | | | | | | | | | | | |
| | | | |
| Trading Companies & Distributors: 2.25% | | | | | | | | | | | | | | | | |
| | | | |
United Rentals North America Incorporated | | | 5.75 | | | | 11-15-2024 | | | | 3,000,000 | | | | 3,090,000 | |
| | | | |
WESCO Distribution Incorporated | | | 5.38 | | | | 6-15-2024 | | | | 6,245,000 | | | | 6,260,613 | |
| | | | |
| | | | | | | | | | | | | | | 9,350,613 | |
| | | | | | | | | | | | | | | | |
| | | | |
Information Technology: 14.41% | | | | | | | | | | | | | | | | |
| | | | |
| Communications Equipment: 2.80% | | | | | | | | | | | | | | | | |
| | | | |
CommScope Incorporated 144A | | | 5.50 | | | | 6-15-2024 | | | | 8,200,000 | | | | 7,872,000 | |
| | | | |
CommScope Technologies Finance LLC 144A | | | 6.00 | | | | 6-15-2025 | | | | 4,000,000 | | | | 3,770,000 | |
| | | | |
| | | | | | | | | | | | | | | 11,642,000 | |
| | | | | | | | | | | | | | | | |
| | | | |
| Electronic Equipment, Instruments & Components: 2.05% | | | | | | | | | | | | | | | | |
| | | | |
TTM Technologies Incorporated 144A | | | 5.63 | | | | 10-1-2025 | | | | 9,000,000 | | | | 8,527,500 | |
| | | | | | | | | | | | | | | | |
The accompanying notes are an integral part of these financial statements.
| | | | | | |
| Portfolio of investments—February 28, 2019 (unaudited) | | Wells Fargo High Yield Bond Fund | | | 13 | |
| | | | | | | | | | | | | | | | |
| Security name | | Interest rate | | | Maturity date | | | Principal | | | Value | |
| | | | |
| IT Services: 1.95% | | | | | | | | | | | | | | | | |
| | | | |
First Data Corporation 144A | | | 5.00 | % | | | 1-15-2024 | | | $ | 3,000,000 | | | $ | 3,078,780 | |
| | | | |
Gartner Incorporated 144A | | | 5.13 | | | | 4-1-2025 | | | | 5,000,000 | | | | 5,037,500 | |
| | | | |
| | | | | | | | | | | | | | | 8,116,280 | |
| | | | | | | | | | | | | | | | |
| | | | |
| Semiconductors & Semiconductor Equipment: 3.42% | | | | | | | | | | | | | | | | |
| | | | |
Micron Technology Incorporated | | | 5.50 | | | | 2-1-2025 | | | | 7,900,000 | | | | 8,116,855 | |
| | | | |
Versum Materials Incorporated 144A | | | 5.50 | | | | 9-30-2024 | | | | 5,901,000 | | | | 6,137,040 | |
| | | | |
| | | | | | | | | | | | | | | 14,253,895 | |
| | | | | | | | | | | | | | | | |
| | | | |
| Software: 2.16% | | | | | | | | | | | | | | | | |
| | | | |
Fair Isaac Corporation 144A | | | 5.25 | | | | 5-15-2026 | | | | 1,000,000 | | | | 1,010,000 | |
| | | | |
Nuance Communications Company | | | 6.00 | | | | 7-1-2024 | | | | 6,760,000 | | | | 6,979,700 | |
| | | | |
Symantec Corporation 144A | | | 5.00 | | | | 4-15-2025 | | | | 1,000,000 | | | | 996,215 | |
| | | | |
| | | | | | | | | | | | | | | 8,985,915 | |
| | | | | | | | | | | | | | | | |
| | | | |
| Technology Hardware, Storage & Peripherals: 2.03% | | | | | | | | | | | | | | | | |
| | | | |
Diebold Incorporated « | | | 8.50 | | | | 4-15-2024 | | | | 7,700,000 | | | | 6,545,000 | |
| | | | |
Western Digital Corporation | | | 4.75 | | | | 2-15-2026 | | | | 2,000,000 | | | | 1,890,000 | |
| | | | |
| | | | | | | | | | | | | | | 8,435,000 | |
| | | | | | | | | | | | | | | | |
| | | | |
Materials: 12.92% | | | | | | | | | | | | | | | | |
| | | | |
| Chemicals: 7.39% | | | | | | | | | | | | | | | | |
| | | | |
Koppers Incorporated 144A | | | 6.00 | | | | 2-15-2025 | | | | 3,363,000 | | | | 2,942,625 | |
| | | | |
Olin Corporation | | | 5.50 | | | | 8-15-2022 | | | | 8,275,000 | | | | 8,481,875 | |
| | | | |
Rayonier Advanced Materials Products Incorporated 144A | | | 5.50 | | | | 6-1-2024 | | | | 7,775,000 | | | | 7,215,822 | |
| | | | |
Tronox Incorporated «144A | | | 6.50 | | | | 4-15-2026 | | | | 2,000,000 | | | | 1,892,500 | |
| | | | |
Valvoline Incorporated | | | 4.38 | | | | 8-15-2025 | | | | 8,000,000 | | | | 7,580,000 | |
| | | | |
Valvoline Incorporated | | | 5.50 | | | | 7-15-2024 | | | | 2,630,000 | | | | 2,639,863 | |
| | | | |
| | | | | | | | | | | | | | | 30,752,685 | |
| | | | | | | | | | | | | | | | |
| | | | |
| Containers & Packaging: 4.90% | | | | | | | | | | | | | | | | |
| | | | |
Ball Corporation | | | 5.25 | | | | 7-1-2025 | | | | 3,000,000 | | | | 3,150,000 | |
| | | | |
Berry Global Incorporated 144A | | | 4.50 | | | | 2-15-2026 | | | | 8,000,000 | | | | 7,570,000 | |
| | | | |
Berry Global Incorporated | | | 5.13 | | | | 7-15-2023 | | | | 4,000,000 | | | | 4,005,000 | |
| | | | |
Crown Americas Capital Corporation IV | | | 4.50 | | | | 1-15-2023 | | | | 2,000,000 | | | | 2,020,000 | |
| | | | |
Owens-Brockway Glass Container Incorporated 144A | | | 5.88 | | | | 8-15-2023 | | | | 2,000,000 | | | | 2,105,000 | |
| | | | |
Sealed Air Corporation 144A | | | 5.25 | | | | 4-1-2023 | | | | 1,500,000 | | | | 1,543,125 | |
| | | | |
| | | | | | | | | | | | | | | 20,393,125 | |
| | | | | | | | | | | | | | | | |
| | | | |
| Metals & Mining: 0.63% | | | | | | | | | | | | | | | | |
| | | | |
Steel Dynamics Incorporated | | | 5.50 | | | | 10-1-2024 | | | | 2,550,000 | | | | 2,620,125 | |
| | | | | | | | | | | | | | | | |
| | | | |
Real Estate: 6.95% | | | | | | | | | | | | | | | | |
| | | | |
| Equity REITs: 6.95% | | | | | | | | | | | | | | | | |
| | | | |
Equinix Incorporated | | | 5.38 | | | | 5-15-2027 | | | | 6,430,000 | | | | 6,655,050 | |
| | | | |
Equinix Incorporated | | | 5.75 | | | | 1-1-2025 | | | | 5,193,000 | | | | 5,407,211 | |
The accompanying notes are an integral part of these financial statements.
| | | | |
| 14 | | Wells Fargo High Yield Bond Fund | | Portfolio of investments—February 28, 2019 (unaudited) |
| | | | | | | | | | | | | | | | |
| Security name | | Interest rate | | | Maturity date | | | Principal | | | Value | |
| | | | |
| Equity REITs(continued) | | | | | | | | | | | | | | | | |
| | | | |
Iron Mountain Incorporated 144A | | | 4.88 | % | | | 9-15-2027 | | | $ | 500,000 | | | $ | 473,125 | |
| | | | |
Iron Mountain Incorporated 144A | | | 5.38 | | | | 6-1-2026 | | | | 12,750,000 | | | | 12,367,500 | |
| | | | |
Sabra Health Care LP | | | 5.38 | | | | 6-1-2023 | | | | 4,000,000 | | | | 4,020,000 | |
| | | | |
| | | | | | | | | | | | | | | 28,922,886 | |
| | | | | | | | | | | | | | | | |
| | | | |
Total Corporate Bonds and Notes (Cost $324,563,372) | | | | | | | | | | | | | | | 316,687,428 | |
| | | | | | | | | | | | | | | | |
| | | | |
Yankee Corporate Bonds and Notes: 15.21% | | | | | | | | | | | | | | | | |
| | | | |
Communication Services: 0.98% | | | | | | | | | | | | | | | | |
| | | | |
| Diversified Telecommunication Services: 0.48% | | | | | | | | | | | | | | | | |
| | | | |
Virgin Media Finance plc 144A | | | 5.75 | | | | 1-15-2025 | | | | 2,000,000 | | | | 1,990,000 | |
| | | | | | | | | | | | | | | | |
| | | | |
| Media: 0.50% | | | | | | | | | | | | | | | | |
| | | | |
Quebecor Media Incorporated | | | 5.75 | | | | 1-15-2023 | | | | 2,000,000 | | | | 2,071,875 | |
| | | | | | | | | | | | | | | | |
| | | | |
Consumer Discretionary: 3.19% | | | | | | | | | | | | | | | | |
| | | | |
| Auto Components: 1.69% | | | | | | | | | | | | | | | | |
| | | | |
Adient Global Holdings Company «144A | | | 4.88 | | | | 8-15-2026 | | | | 9,210,000 | | | | 7,045,650 | |
| | | | | | | | | | | | | | | | |
| | | | |
| Automobiles: 0.73% | | | | | | | | | | | | | | | | |
| | | | |
Fiat Chrysler Automobiles NV | | | 5.25 | | | | 4-15-2023 | | | | 3,000,000 | | | | 3,048,000 | |
| | | | | | | | | | | | | | | | |
| | | | |
| Hotels, Restaurants & Leisure: 0.77% | | | | | | | | | | | | | | | | |
| | | | |
International Game Technology plc 144A | | | 6.50 | | | | 2-15-2025 | | | | 3,000,000 | | | | 3,191,250 | |
| | | | | | | | | | | | | | | | |
| | | | |
Financials: 2.68% | | | | | | | | | | | | | | | | |
| | | | |
| Diversified Financial Services: 2.68% | | | | | | | | | | | | | | | | |
| | | | |
Tronox Finance plc 144A | | | 5.75 | | | | 10-1-2025 | | | | 12,000,000 | | | | 11,160,000 | |
| | | | | | | | | | | | | | | | |
| | | | |
Health Care: 3.23% | | | | | | | | | | | | | | | | |
| | | | |
| Pharmaceuticals: 3.23% | | | | | | | | | | | | | | | | |
| | | | |
Mallinckrodt plc «144A | | | 5.50 | | | | 4-15-2025 | | | | 16,500,000 | | | | 13,447,500 | |
| | | | | | | | | | | | | | | | |
| | | | |
Industrials: 2.00% | | | | | | | | | | | | | | | | |
| | | | |
| Electrical Equipment: 2.00% | | | | | | | | | | | | | | | | |
| | | | |
Sensata Technologies BV 144A | | | 4.88 | | | | 10-15-2023 | | | | 3,000,000 | | | | 3,082,500 | |
| | | | |
Sensata Technologies BV 144A | | | 5.63 | | | | 11-1-2024 | | | | 5,000,000 | | | | 5,250,000 | |
| | | | |
| | | | | | | | | | | | | | | 8,332,500 | |
| | | | | | | | | | | | | | | | |
| | | | |
Information Technology: 3.13% | | | | | | | | | | | | | | | | |
| | | | |
| Technology Hardware, Storage & Peripherals: 3.13% | | | | | | | | | | | | | | | | |
| | | | |
Seagate HDD | | | 4.75 | | | | 6-1-2023 | | | | 4,140,000 | | | | 4,152,572 | |
| | | | |
Seagate HDD | | | 4.88 | | | | 6-1-2027 | | | | 9,500,000 | | | | 8,858,883 | |
| | | | |
| | | | | | | | | | | | | | | 13,011,455 | |
| | | | | | | | | | | | | | | | |
| | | | |
Total Yankee Corporate Bonds and Notes (Cost $68,732,770) | | | | | | | | | | | | | | | 63,298,230 | |
| | | | | | | | | | | | | | | | |
The accompanying notes are an integral part of these financial statements.
| | | | | | |
| Portfolio of investments—February 28, 2019 (unaudited) | | Wells Fargo High Yield Bond Fund | | | 15 | |
| | | | | | | | | | | | | | | | |
| Security name | | Yield | | | | | | Shares | | | Value | |
| Short-Term Investments: 4.31% | | | | | | | | | | | | | | | | |
| | | | |
| Investment Companies: 4.31% | | | | | | | | | | | | | | | | |
| | | | |
Securities Lending Cash Investments LLC (l)(r)(u) | | | 2.56 | % | | | | | | | 15,296,231 | | | $ | 15,297,761 | |
| | | | |
Wells Fargo Government Money Market Fund Select Class (l)(u) | | | 2.34 | | | | | | | | 2,637,237 | | | | 2,637,237 | |
| | | | |
Total Short-Term Investments (Cost $17,934,998) | | | | | | | | | | | | | | | 17,934,998 | |
| | | | | | | | | | | | | | | | |
| | | | | | | | |
| Total investments in securities (Cost $436,004,433) | | | 102.06 | % | | | 424,691,936 | |
| | |
Other assets and liabilities, net | | | (2.06 | ) | | | (8,580,488 | ) |
| | | | | | | | |
| Total net assets | | | 100.00 | % | | $ | 416,111,448 | |
| | | | | | | | |
| † | Non-income-earning security |
| « | All or a portion of this security is on loan. |
| 144A | The security may be resold in transactions exempt from registration, normally to qualified institutional buyers, pursuant to Rule 144A under the Securities Act of 1933. |
| ± | Variable rate investment. The rate shown is the rate in effect at period end. |
| (l) | The issuer of the security is an affiliated person of the Fund as defined in the Investment Company Act of 1940. |
| (r) | The investment is a non-registered investment company purchased with cash collateral received from securities on loan. |
| (u) | The rate represents the 7-day annualized yield at period end. |
Abbreviations:
| ADR | American depositary receipt |
| LIBOR | London Interbank Offered Rate |
| REIT | Real estate investment trust |
Investments in Affiliates
An affiliated investment is an investment in which the Fund owns at least 5% of the outstanding voting shares of the issuer or as a result of other relationships, such as the Fund and the issuer having the same investment manager. Transactions with issuers that were either affiliated persons of the Fund at the beginning of the period or the end of the period were as follows:
| | | | | | | | | | | | | | | | | | | | | | | | | | | | | | | | | | | | |
| | | Shares,
beginning of
period | | | Shares
purchased | | | Shares
sold | | | Shares,
end of
period | | | Net
realized
gains
(losses) | | | Net
change in
unrealized
gains
(losses) | | | Income
from
affiliated
securities | | | Value,
end
of period | | | % of
net
assets | |
Short-Term Investments | | | | | | | | | | | | | | | | | | | | | | | | | | | | | | | | | | | | |
Investment Companies | | | | | | | | | | | | | | | | | | | | | | | | | | | | | | | | | | | | |
Securities Lending Cash Investments LLC | | | 34,166,983 | | | | 38,166,723 | | | | 57,037,475 | | | | 15,296,231 | | | $ | 0 | | | $ | 0 | | | $ | 283,789 | | | $ | 15,297,761 | | | | | |
Wells Fargo Government Money Market Fund Select Class | | | 3,114,436 | | | | 117,795,371 | | | | 118,272,570 | | | | 2,637,237 | | | | 0 | | | | 0 | | | | 56,250 | | | | 2,637,237 | | | | | |
| | | | | | | | | | | | | | | | | | | | | | | | | | | | | | | | | | | | |
| | | | | | | | | |
| | | | | | | | | | | | | | | | | | $ | 0 | | | $ | 0 | | | $ | 340,039 | | | $ | 17,934,998 | | | | 4.31 | % |
| | | | | | | | | | | | | | | | | | | | | | | | | | | | | | | | | | | | |
The accompanying notes are an integral part of these financial statements.
| | | | |
| 16 | | Wells Fargo High Yield Bond Fund | | Statement of assets and liabilities—February 28, 2019 (unaudited) |
| | | | |
| | | | |
| |
Assets | | | | |
Investments in unaffiliated securities (including $14,977,559 of securities loaned), at value (cost $418,069,435) | | $ | 406,756,938 | |
Investments in affiliated securities, at value (cost $17,934,998) | | | 17,934,998 | |
Receivable for investments sold | | | 2,742,930 | |
Receivable for Fund shares sold | | | 93,201 | |
Receivable for dividends and interest | | | 5,441,756 | |
Receivable for securities lending income | | | 8,790 | |
Prepaid expenses and other assets | | | 114,836 | |
| | | | |
Total assets | | | 433,093,449 | |
| | | | |
| |
Liabilities | | | | |
Payable upon receipt of securities loaned | | | 15,296,653 | |
Payable for Fund shares redeemed | | | 684,412 | |
Due to custodian bank | | | 581,319 | |
Management fee payable | | | 131,414 | |
Dividends payable | | | 106,233 | |
Administration fees payable | | | 43,267 | |
Distribution fee payable | | | 11,888 | |
Trustees’ fees and expenses payable | | | 2,784 | |
Accrued expenses and other liabilities | | | 124,031 | |
| | | | |
Total liabilities | | | 16,982,001 | |
| | | | |
Total net assets | | $ | 416,111,448 | |
| | | | |
| |
NET ASSETS CONSIST OF | | | | |
Paid-in capital | | $ | 470,062,486 | |
Total distributable loss | | | (53,951,038 | ) |
| | | | |
Total net assets | | $ | 416,111,448 | |
| | | | |
| |
COMPUTATION OF NET ASSET VALUE AND OFFERING PRICE PER SHARE | | | | |
Net assets – Class A | | $ | 278,019,184 | |
Shares outstanding – Class A1 | | | 85,693,311 | |
Net asset value per share – Class A | | | $3.24 | |
Maximum offering price per share – Class A2 | | | $3.39 | |
Net assets – Class C | | $ | 16,173,617 | |
Shares outstanding – Class C1 | | | 4,990,508 | |
Net asset value per share – Class C | | | $3.24 | |
Net assets – Administrator Class | | $ | 23,012,991 | |
Shares outstanding – Administrator Class1 | | | 7,087,315 | |
Net asset value per share – Administrator Class | | | $3.25 | |
Net assets – Institutional Class | | $ | 98,905,656 | |
Shares outstanding – Institutional Class1 | | | 30,459,720 | |
Net asset value per share – Institutional Class | | | $3.25 | |
| 1 | The Fund has an unlimited number of authorized shares. |
| 2 | Maximum offering price is computed as 100/95.50 of net asset value. On investments of $50,000 or more, the offering price is reduced. |
The accompanying notes are an integral part of these financial statements.
| | | | | | |
| Statement of operations—six months ended February 28, 2019 (unaudited) | | Wells Fargo High Yield Bond Fund | | | 17 | |
| | | | |
| | | | |
| |
Investment income | | | | |
Interest | | $ | 10,858,973 | |
Dividends (net of foreign withholding taxes of $51) | | | 303,198 | |
Income from affiliated securities | | | 119,385 | |
| | | | |
Total investment income | | | 11,281,556 | |
| | | | |
| |
Expenses | | | | |
Management fee | | | 1,134,365 | |
Administration fees | | | | |
Class A | | | 200,531 | |
Class C | | | 30,950 | |
Administrator Class | | | 11,100 | |
Institutional Class | | | 40,378 | |
Shareholder servicing fees | | | | |
Class A | | | 313,329 | |
Class C | | | 48,359 | |
Administrator Class | | | 27,751 | |
Distribution fee | | | | |
Class C | | | 145,078 | |
Custody and accounting fees | | | 15,810 | |
Professional fees | | | 33,112 | |
Registration fees | | | 43,889 | |
Shareholder report expenses | | | 48,768 | |
Trustees’ fees and expenses | | | 10,728 | |
Interest expense | | | 506 | |
Other fees and expenses | | | 8,778 | |
| | | | |
Total expenses | | | 2,113,432 | |
Less: Fee waivers and/or expense reimbursements | | | (266,060 | ) |
| | | | |
Net expenses | | | 1,847,372 | |
| | | | |
Net investment income | | | 9,434,184 | |
| | | | |
| |
REALIZED AND UNREALIZED GAINS (LOSSES) ON INVESTMENTS | | | | |
Net realized losses on investments | | | (2,340,973 | ) |
Net change in unrealized gains (losses) on investments | | | (5,213,458 | ) |
| | | | |
Net realized and unrealized gains (losses) on investments | | | (7,554,431 | ) |
| | | | |
Net increase in net assets resulting from operations | | $ | 1,879,753 | |
| | | | |
The accompanying notes are an integral part of these financial statements.
| | | | |
| 18 | | Wells Fargo High Yield Bond Fund | | Statement of changes in net assets |
| | | | | | | | | | | | | | | | |
| | | Six months ended
February 28, 2019 (unaudited) | | | Year ended
August 31, 20181 | |
| | | | |
Operations | | | | | | | | | | | | | | | | |
Net investment income | | | | | | $ | 9,434,184 | | | | | | | $ | 21,855,801 | |
Net realized gains (losses) on investments | | | | | | | (2,340,973 | ) | | | | | | | 6,373,390 | |
Net change in unrealized gains (losses) on investments | | | | | | | (5,213,458 | ) | | | | | | | (25,332,823 | ) |
| | | | |
Net increase in net assets resulting from operations | | | | | | | 1,879,753 | | | | | | | | 2,896,368 | |
| | | | |
| | | | |
Distributions to shareholders from | | | | | | | | | | | | | | | | |
Net investment income and net realized gains | | | | | | | | | | | | | | | | |
Class A | | | | | | | (5,677,460 | ) | | | | | | | (11,998,114 | ) |
Class C | | | | | | | (719,388 | ) | | | | | | | (1,891,216 | ) |
Administrator Class | | | | | | | (516,427 | ) | | | | | | | (1,158,390 | ) |
Institutional Class | | | | | | | (2,472,890 | ) | | | | | | | (6,020,709 | ) |
Tax basis return of capital | | | | | | | | | | | | | | | | |
Class A | | | | | | | 0 | | | | | | | | (464,808 | ) |
Class C | | | | | | | 0 | | | | | | | | (73,266 | ) |
Administrator Class | | | | | | | 0 | | | | | | | | (44,876 | ) |
Institutional Class | | | | | | | 0 | | | | | | | | (233,242 | ) |
| | | | |
Total distributions to shareholders | | | | | | | (9,386,165 | ) | | | | | | | (21,884,621 | ) |
| | | | |
| | | | |
Capital share transactions | | | Shares | | | | | | | | Shares | | | | | |
Proceeds from shares sold | | | | | | | | | | | | | | | | |
Class A | | | 9,519,033 | | | | 30,403,134 | | | | 4,507,185 | | | | 15,024,416 | |
Class C | | | 55,048 | | | | 175,371 | | | | 604,048 | | | | 2,028,540 | |
Administrator Class | | | 446,631 | | | | 1,422,558 | | | | 1,169,119 | | | | 3,905,011 | |
Institutional Class | | | 15,294,212 | | | | 48,778,970 | | | | 26,302,261 | | | | 88,474,810 | |
| | | | |
| | | | |
| | | | | | | 80,780,033 | | | | | | | | 109,432,777 | |
| | | | |
Reinvestment of distributions | | | | | | | | | | | | | | | | |
Class A | | | 1,613,270 | | | | 5,123,049 | | | | 3,396,062 | | | | 11,304,123 | |
Class C | | | 220,134 | | | | 697,539 | | | | 579,628 | | | | 1,929,924 | |
Administrator Class | | | 154,461 | | | | 490,850 | | | | 345,781 | | | | 1,152,618 | |
Institutional Class | | | 740,708 | | | | 2,354,410 | | | | 1,807,352 | | | | 6,016,786 | |
| | | | |
| | | | |
| | | | | | | 8,665,848 | | | | | | | | 20,403,451 | |
| | | | |
Payment for shares redeemed | | | | | | | | | | | | | | | | |
Class A | | | (8,362,845 | ) | | | (26,591,013 | ) | | | (17,281,250 | ) | | | (57,593,665 | ) |
Class C | | | (9,849,016 | ) | | | (31,466,200 | ) | | | (4,753,703 | ) | | | (15,786,507 | ) |
Administrator Class | | | (800,864 | ) | | | (2,548,670 | ) | | | (3,502,094 | ) | | | (11,686,695 | ) |
Institutional Class | | | (26,606,517 | ) | | | (83,912,627 | ) | | | (24,076,647 | ) | | | (80,563,659 | ) |
| | | | |
| | | | |
| | | | | | | (144,518,510 | ) | | | | | | | (165,630,526 | ) |
| | | | |
Net decrease in net assets resulting from capital share transactions | | | | | | | (55,072,629 | ) | | | | | | | (35,794,298 | ) |
| | | | |
Total decrease in net assets | | | | | | | (62,579,041 | ) | | | | | | | (54,782,551 | ) |
| | | | |
| | | | |
Net assets | | | | | | | | | | | | | | | | |
Beginning of period | | | | | | | 478,690,489 | | | | | | | | 533,473,040 | |
| | | | |
End of period | | | | | | $ | 416,111,448 | | | | | | | $ | 478,690,489 | |
| | | | |
| 1 | Effective for all filings after November 4, 2018, the SEC prospectively eliminated the requirement to parenthetically disclose undistributed net investment income at the end of the period and permitted the aggregation of distributions, with the exception of tax basis returns of capital. Overdistributed net investment income at August 31, 2018 was $35,978. The disaggregated distributions information for the year ended August 31, 2018 is included in Note 7,Distributions to Shareholders,in the notes to the financial statements. |
The accompanying notes are an integral part of these financial statements.
| | | | | | |
| Financial highlights | | Wells Fargo High Yield Bond Fund | | | 19 | |
(For a share outstanding throughout each period)
| | | | | | | | | | | | | | | | | | | | | | | | |
| | | Six months ended
February 28, 2019 (unaudited) | | | Year ended August 31 | |
| CLASS A | | 2018 | | | 2017 | | | 2016 | | | 2015 | | | 2014 | |
Net asset value, beginning of period | | | $3.28 | | | | $3.40 | | | | $3.31 | | | | $3.16 | | | | $3.35 | | | | $3.15 | |
Net investment income | | | 0.07 | | | | 0.14 | | | | 0.14 | | | | 0.13 | | | | 0.13 | | | | 0.14 | |
Net realized and unrealized gains (losses) on investments | | | (0.04 | ) | | | (0.12 | ) | | | 0.10 | | | | 0.15 | | | | (0.19 | ) | | | 0.20 | |
| | | | | | | | | | | | | | | | | | | | | | | | |
Total from investment operations | | | 0.03 | | | | 0.02 | | | | 0.24 | | | | 0.28 | | | | (0.06 | ) | | | 0.34 | |
Distributions to shareholders from | | | | | | | | | | | | | | | | | | | | | | | | |
Net investment income | | | (0.07 | ) | | | (0.13 | ) | | | (0.15 | ) | | | (0.13 | ) | | | (0.13 | ) | | | (0.14 | ) |
Tax basis return of capital | | | 0.00 | | | | (0.01 | ) | | | (0.00 | )1 | | | 0.00 | | | | 0.00 | | | | 0.00 | |
| | | | | | | | | | | | | | | | | | | | | | | | |
Total distributions to shareholders | | | (0.07 | ) | | | (0.14 | ) | | | (0.15 | ) | | | (0.13 | ) | | | (0.13 | ) | | | (0.14 | ) |
Net asset value, end of period | | | $3.24 | | | | $3.28 | | | | $3.40 | | | | $3.31 | | | | $3.16 | | | | $3.35 | |
Total return2 | | | 1.02 | % | | | 0.68 | % | | | 7.28 | % | | | 9.25 | % | | | (1.79 | )% | | | 11.02 | % |
Ratios to average net assets (annualized) | | | | | | | | | | | | | | | | | | | | | | | | |
Gross expenses | | | 1.04 | % | | | 1.02 | % | | | 1.01 | % | | | 1.04 | % | | | 1.04 | % | | | 1.03 | % |
Net expenses | | | 0.93 | % | | | 0.93 | % | | | 0.93 | % | | | 1.01 | % | | | 1.03 | % | | | 1.03 | % |
Net investment income | | | 4.53 | % | | | 4.26 | % | | | 4.39 | % | | | 4.24 | % | | | 4.04 | % | | | 4.35 | % |
Supplemental data | | | | | | | | | | | | | | | | | | | | | | | | |
Portfolio turnover rate | | | 10 | % | | | 18 | % | | | 20 | % | | | 75 | % | | | 55 | % | | | 40 | % |
Net assets, end of period (000s omitted) | | | $278,019 | | | | $272,170 | | | | $314,156 | | | | $370,560 | | | | $179,357 | | | | $210,005 | |
| 1 | Amount is less than $0.005. |
| 2 | Total return calculations do not include any sales charges. Returns for periods of less than one year are not annualized. |
The accompanying notes are an integral part of these financial statements.
| | | | |
| 20 | | Wells Fargo High Yield Bond Fund | | Financial highlights |
(For a share outstanding throughout each period)
| | | | | | | | | | | | | | | | | | | | | | | | |
| | | Six months ended
February 28, 2019
(unaudited) | | | Year ended August 31 | |
| CLASS C | | 2018 | | | 2017 | | | 2016 | | | 2015 | | | 2014 | |
Net asset value, beginning of period | | | $3.28 | | | | $3.40 | | | | $3.31 | | | | $3.16 | | | | $3.35 | | | | $3.15 | |
Net investment income | | | 0.06 | 1 | | | 0.12 | | | | 0.12 | | | | 0.11 | | | | 0.11 | | | | 0.12 | |
Net realized and unrealized gains (losses) on investments | | | (0.04 | ) | | | (0.12 | ) | | | 0.09 | | | | 0.15 | | | | (0.19 | ) | | | 0.20 | |
| | | | | | | | | | | | | | | | | | | | | | | | |
Total from investment operations | | | 0.02 | | | | (0.00 | ) | | | 0.21 | | | | 0.26 | | | | (0.08 | ) | | | 0.32 | |
Distributions to shareholders from | | | | | | | | | | | | | | | | | | | | | | | | |
Net investment income | | | (0.06 | ) | | | (0.11 | ) | | | (0.12 | ) | | | (0.11 | ) | | | (0.11 | ) | | | (0.12 | ) |
Tax basis return of capital | | | 0.00 | | | | (0.01 | ) | | | (0.00 | )2 | | | 0.00 | | | | 0.00 | | | | 0.00 | |
| | | | | | | | | | | | | | | | | | | | | | | | |
Total distributions to shareholders | | | (0.06 | ) | | | (0.12 | ) | | | (0.12 | ) | | | (0.11 | ) | | | (0.11 | ) | | | (0.12 | ) |
Net asset value, end of period | | | $3.24 | | | | $3.28 | | | | $3.40 | | | | $3.31 | | | | $3.16 | | | | $3.35 | |
Total return3 | | | 0.64 | % | | | (0.07 | )% | | | 6.49 | % | | | 8.44 | % | | | (2.52 | )% | | | 10.20 | % |
Ratios to average net assets (annualized) | | | | | | | | | | | | | | | | | | | | | | | | |
Gross expenses | | | 1.79 | % | | | 1.77 | % | | | 1.76 | % | | | 1.80 | % | | | 1.79 | % | | | 1.78 | % |
Net expenses | | | 1.68 | % | | | 1.68 | % | | | 1.68 | % | | | 1.77 | % | | | 1.78 | % | | | 1.78 | % |
Net investment income | | | 3.71 | % | | | 3.51 | % | | | 3.65 | % | | | 3.48 | % | | | 3.29 | % | | | 3.60 | % |
Supplemental data | | | | | | | | | | | | | | | | | | | | | | | | |
Portfolio turnover rate | | | 10 | % | | | 18 | % | | | 20 | % | | | 75 | % | | | 55 | % | | | 40 | % |
Net assets, end of period (000s omitted) | | | $16,174 | | | | $47,811 | | | | $61,734 | | | | $72,908 | | | | $60,753 | | | | $72,728 | |
| 1 | Calculated based upon average shares outstanding |
| 2 | Amount is less than $0.005. |
| 3 | Total return calculations do not include any sales charges. Returns for periods of less than one year are not annualized. |
The accompanying notes are an integral part of these financial statements.
| | | | | | |
| Financial highlights | | Wells Fargo High Yield Bond Fund | | | 21 | |
(For a share outstanding throughout each period)
| | | | | | | | | | | | | | | | | | | | | | | | |
| | | Six months ended
February 28, 2019 (unaudited) | | | Year ended August 31 | |
| ADMINISTRATOR CLASS | | 2018 | | | 2017 | | | 2016 | | | 2015 | | | 2014 | |
Net asset value, beginning of period | | | $3.29 | | | | $3.41 | | | | $3.31 | | | | $3.16 | | | | $3.36 | | | | $3.15 | |
Net investment income | | | 0.07 | | | | 0.15 | | | | 0.15 | | | | 0.14 | 1 | | | 0.14 | | | | 0.15 | |
Net realized and unrealized gains (losses) on investments | | | (0.04 | ) | | | (0.13 | ) | | | 0.10 | | | | 0.15 | | | | (0.20 | ) | | | 0.21 | |
| | | | | | | | | | | | | | | | | | | | | | | | |
Total from investment operations | | | 0.03 | | | | 0.02 | | | | 0.25 | | | | 0.29 | | | | (0.06 | ) | | | 0.36 | |
Distributions to shareholders from | | | | | | | | | | | | | | | | | | | | | | | | |
Net investment income | | | (0.07 | ) | | | (0.14 | ) | | | (0.15 | ) | | | (0.14 | ) | | | (0.14 | ) | | | (0.15 | ) |
Tax basis return of capital | | | 0.00 | | | | (0.01 | ) | | | (0.00 | )2 | | | 0.00 | | | | 0.00 | | | | 0.00 | |
| | | | | | | | | | | | | | | | | | | | | | | | |
Total distributions to shareholders | | | (0.07 | ) | | | (0.15 | ) | | | (0.15 | ) | | | (0.14 | ) | | | (0.14 | ) | | | (0.15 | ) |
Net asset value, end of period | | | $3.25 | | | | $3.29 | | | | $3.41 | | | | $3.31 | | | | $3.16 | | | | $3.36 | |
Total return3 | | | 1.09 | % | | | 0.82 | % | | | 7.74 | % | | | 9.48 | % | | | (1.86 | )% | | | 11.61 | % |
Ratios to average net assets (annualized) | | | | | | | | | | | | | | | | | | | | | | | | |
Gross expenses | | | 0.98 | % | | | 0.96 | % | | | 0.95 | % | | | 0.98 | % | | | 0.98 | % | | | 0.96 | % |
Net expenses | | | 0.80 | % | | | 0.80 | % | | | 0.80 | % | | | 0.80 | % | | | 0.80 | % | | | 0.80 | % |
Net investment income | | | 4.65 | % | | | 4.39 | % | | | 4.55 | % | | | 4.43 | % | | | 4.27 | % | | | 4.57 | % |
Supplemental data | | | | | | | | | | | | | | | | | | | | | | | | |
Portfolio turnover rate | | | 10 | % | | | 18 | % | | | 20 | % | | | 75 | % | | | 55 | % | | | 40 | % |
Net assets, end of period (000s omitted) | | | $23,013 | | | | $23,940 | | | | $31,592 | | | | $76,688 | | | | $13,129 | | | | $20,177 | |
| 1 | Calculated based upon average shares outstanding |
| 2 | Amount is less than $0.005. |
| 3 | Returns for periods of less than one year are not annualized. |
The accompanying notes are an integral part of these financial statements.
��
| | | | |
| 22 | | Wells Fargo High Yield Bond Fund | | Financial highlights |
(For a share outstanding throughout each period)
| | | | | | | | | | | | | | | | | | | | |
| | | Six months ended
February 28, 2019
(unaudited) | | | Year ended August 31 | |
| INSTITUTIONAL CLASS | | 2018 | | | 2017 | | | 2016 | | | 20151 | |
Net asset value, beginning of period | | | $3.28 | | | | $3.41 | | | | $3.31 | | | | $3.17 | | | | $3.33 | |
Net investment income | | | 0.08 | | | | 0.16 | | | | 0.16 | | | | 0.14 | | | | 0.12 | |
Net realized and unrealized gains (losses) on investments | | | (0.03 | ) | | | (0.13 | ) | | | 0.10 | | | | 0.14 | | | | (0.16 | ) |
| | | | | | | | | | | | | | | | | | | | |
Total from investment operations | | | 0.05 | | | | 0.03 | | | | 0.26 | | | | 0.28 | | | | (0.04 | ) |
Distributions to shareholders from | | | | | | | | | | | | | | | | | | | | |
Net investment income | | | (0.08 | ) | | | (0.15 | ) | | | (0.16 | ) | | | (0.14 | ) | | | (0.12 | ) |
Tax basis return of capital | | | 0.00 | | | | (0.01 | ) | | | (0.00 | )2 | | | 0.00 | | | | 0.00 | |
| | | | | | | | | | | | | | | | | | | | |
Total distributions to shareholders | | | (0.08 | ) | | | (0.16 | ) | | | (0.16 | ) | | | (0.14 | ) | | | (0.12 | ) |
Net asset value, end of period | | | $3.25 | | | | $3.28 | | | | $3.41 | | | | $3.31 | | | | $3.17 | |
Total return3 | | | 1.53 | % | | | 0.79 | % | | | 8.03 | % | | | 9.27 | % | | | (1.31 | )% |
Ratios to average net assets (annualized) | | | | | | | | | | | | | | | | | | | | |
Gross expenses | | | 0.71 | % | | | 0.69 | % | | | 0.68 | % | | | 0.70 | % | | | 0.71 | % |
Net expenses | | | 0.53 | % | | | 0.53 | % | | | 0.53 | % | | | 0.61 | % | | | 0.70 | % |
Net investment income | | | 4.89 | % | | | 4.67 | % | | | 4.79 | % | | | 4.65 | % | | | 4.33 | % |
Supplemental data | | | | | | | | | | | | | | | | | | | | |
Portfolio turnover rate | | | 10 | % | | | 18 | % | | | 20 | % | | | 75 | % | | | 55 | % |
Net assets, end of period (000s omitted) | | | $98,906 | | | | $134,770 | | | | $125,991 | | | | $100,023 | | | | $4,847 | |
| 1 | For the period from October 31, 2014 (commencement of class operations) to August 31, 2015. |
| 2 | Amount is less than $0.005. |
| 3 | Returns for periods of less than one year are not annualized. |
The accompanying notes are an integral part of these financial statements.
| | | | | | |
| Notes to financial statements (unaudited) | | Wells Fargo High Yield Bond Fund | | | 23 | |
1. ORGANIZATION
Wells Fargo Funds Trust (the “Trust”), a Delaware statutory trust organized on March 10, 1999, is an open-end management investment company registered under the Investment Company Act of 1940, as amended (the “1940 Act”). As an investment company, the Trust follows the accounting and reporting guidance in Financial Accounting Standards Board (“FASB”) Accounting Standards Codification Topic 946, Financial Services – Investment Companies. These financial statements report on the Wells Fargo High Yield Bond Fund (the “Fund”) which is a diversified series of the Trust.
2. SIGNIFICANT ACCOUNTING POLICIES
The following significant accounting policies, which are consistently followed in the preparation of the financial statements of the Fund, are in conformity with U.S. generally accepted accounting principles which require management to make estimates and assumptions that affect the reported amounts of assets and liabilities, disclosure of contingent assets and liabilities at the date of the financial statements, and the reported amounts of revenues and expenses during the reporting period. Actual results could differ from those estimates.
Securities valuation
All investments are valued each business day as of the close of regular trading on the New York Stock Exchange (generally 4 p.m. Eastern Time), although the Fund may deviate from this calculation time under unusual or unexpected circumstances.
Debt securities are valued at the evaluated bid price provided by an independent pricing service (e.g. taking into account various factors, including yields, maturities, or credit ratings) or, if a reliable price is not available, the quoted bid price from an independent broker-dealer.
Equity securities that are listed on a foreign or domestic exchange or market are valued at the official closing price or, if none, the last sales price. If no sale occurs on the principal exchange or market that day, a fair value price will be determined in accordance with the Fund’s Valuation Procedures.
Investments in registered open-end investment companies are valued at net asset value. Interests in non-registered investment companies that are redeemable at net asset value are fair valued normally at net asset value.
Investments which are not valued using any of the methods discussed above are valued at their fair value, as determined in good faith by the Board of Trustees of the Fund. The Board of Trustees has established a Valuation Committee comprised of the Trustees and has delegated to it the authority to take any actions regarding the valuation of portfolio securities that the Valuation Committee deems necessary or appropriate, including determining the fair value of portfolio securities, unless the determination has been delegated to the Wells Fargo Asset Management Pricing Committee at Wells Fargo Funds Management, LLC (“Funds Management”). The Board of Trustees retains the authority to make or ratify any valuation decisions or approve any changes to the Valuation Procedures as it deems appropriate. On a quarterly basis, the Board of Trustees receives reports on any valuation actions taken by the Valuation Committee or the Wells Fargo Asset Management Pricing Committee which may include items for ratification.
Securities lending
The Fund may lend its securities from time to time in order to earn additional income in the form of fees or interest on securities received as collateral or the investment of any cash received as collateral. The Fund continues to receive interest or dividends on the securities loaned. The Fund receives collateral in the form of cash or securities with a value at least equal to the value of the securities on loan. The value of the loaned securities is determined at the close of each business day and any additional required collateral is delivered to the Fund on the next business day. In a securities lending transaction, the net asset value of the Fund will be affected by an increase or decrease in the value of the securities loaned and by an increase or decrease in the value of the instrument in which collateral is invested. The amount of securities lending activity undertaken by the Fund fluctuates from time to time. In the event of default or bankruptcy by the borrower, the Fund may be prevented from recovering the loaned securities or gaining access to the collateral or may experience delays or costs in doing so. In addition, the investment of any cash collateral received may lose all or part of its value. The Fund has the right under the lending agreement to recover the securities from the borrower on demand.
The Fund lends its securities through an unaffiliated securities lending agent. Cash collateral received in connection with its securities lending transactions is invested in Securities Lending Cash Investments, LLC (the “Securities Lending Fund”). The Securities Lending Fund is exempt from registration under Section 3(c)(7) of the 1940 Act and is managed by Funds Management and is subadvised by Wells Capital Management Incorporated (“WellsCap”), an affiliate of Funds Management and an indirect wholly owned subsidiary of Wells Fargo & Company (“Wells Fargo”). Funds Management receives an advisory
| | | | |
| 24 | | Wells Fargo High Yield Bond Fund | | Notes to financial statements (unaudited) |
fee starting at 0.05% and declining to 0.01% as the average daily net assets of the Securities Lending Fund increase. All of the fees received by Funds Management are paid to WellsCap for its services as subadviser. The Securities Lending Fund seeks to provide a positive return compared to the daily Fed Funds Open Rate by investing in high-quality, U.S. dollar-denominated short-term money market instruments. Securities Lending Fund investments are valued at the evaluated bid price provided by an independent pricing service. Income earned from investment in the Securities Lending Fund (net of fees and rebates), if any, is included in income from affiliated securities on the Statement of Operations.
Security transactions and income recognition
Securities transactions are recorded on a trade date basis. Realized gains or losses are recorded on the basis of identified cost.
Interest income is accrued daily and bond discounts are accreted and premiums are amortized daily. To the extent debt obligations are placed on non-accrual status, any related interest income may be reduced by writing off interest receivables when the collection of all or a portion of interest has been determined to be doubtful based on consistently applied procedures and the fair value has decreased. If the issuer subsequently resumes interest payments or when the collectability of interest is reasonably assured, the debt obligation is removed from non-accrual status.
Dividend income is recognized on the ex-dividend date. Dividend income is recorded net of foreign taxes withheld where recovery of such taxes is not assured.
Distributions to shareholders
Distributions to shareholders from net investment income are declared daily and paid monthly. Distributions from net realized gains, if any, are recorded on the ex-dividend date and paid at least annually. Such distributions are determined in accordance with income tax regulations and may differ from U.S. generally accepted accounting principles. Dividend sources are estimated at the time of declaration. The tax character of distributions is determined as of the Fund’s fiscal year end. Therefore, a portion of the Fund’s distributions made prior to the Fund’s fiscal year end may be categorized as a tax return of capital at year end.
Federal and other taxes
The Fund intends to continue to qualify as a regulated investment company by distributing substantially all of its investment company taxable income and any net realized capital gains (after reduction for capital loss carryforwards) sufficient to relieve it from all, or substantially all, federal income taxes. Accordingly, no provision for federal income taxes was required.
The Fund’s income and federal excise tax returns and all financial records supporting those returns for the prior three fiscal years are subject to examination by the federal and Delaware revenue authorities. Management has analyzed the Fund’s tax positions taken on federal, state, and foreign tax returns for all open tax years and does not believe that there are any uncertain tax positions that require recognition of a tax liability.
As of February 28, 2019, the aggregate cost of all investments for federal income tax purposes was $434,622,101 and the unrealized gains (losses) consisted of:
| | | | |
| |
Gross unrealized gains | | $ | 8,438,244 | |
| |
Gross unrealized losses | | | (18,368,409 | ) |
| |
Net unrealized losses | | $ | (9,930,165 | ) |
As of August 31, 2018, the Fund had capital loss carryforwards which consist of $17,191,434 in short-term capital losses and $24,466,317 in long-term capital losses.
Class allocations
The separate classes of shares offered by the Fund differ principally in applicable sales charges, distribution, shareholder servicing, and administration fees. Class specific expenses are charged directly to that share class. Investment income, common expenses, and realized and unrealized gains (losses) on investments are allocated daily to each class of shares based on the relative proportion of net assets of each class.
3. FAIR VALUATION MEASUREMENTS
Fair value measurements of investments are determined within a framework that has established a fair value hierarchy based upon the various data inputs utilized in determining the value of the Fund’s investments. The three-level hierarchy gives the highest priority to unadjusted quoted prices in active markets for identical assets or liabilities (Level 1) and the
| | | | | | |
| Notes to financial statements (unaudited) | | Wells Fargo High Yield Bond Fund | | | 25 | |
lowest priority to unobservable inputs (Level 3). The Fund’s investments are classified within the fair value hierarchy based on the lowest level of input that is significant to the fair value measurement. The inputs are summarized into three broad levels as follows:
| ∎ | | Level 1 – quoted prices in active markets for identical securities |
| ∎ | | Level 2 – other significant observable inputs (including quoted prices for similar securities, interest rates, prepayment speeds, credit risk, etc.) |
| ∎ | | Level 3 – significant unobservable inputs (including the Fund’s own assumptions in determining the fair value of investments) |
The inputs or methodologies used for valuing investments in securities are not necessarily an indication of the risk associated with investing in those securities.
The following is a summary of the inputs used in valuing the Fund’s assets and liabilities as of February 28, 2019:
| | | | | | | | | | | | | | | | |
| | | | |
| | | Quoted prices
(Level 1) | | | Other significant
observable inputs
(Level 2) | | | Significant
unobservable inputs (Level 3) | | | Total | |
| | | | |
Assets | | | | | | | | | | | | | | | | |
Investments in: | | | | | | | | | | | | | | | | |
| | | | |
Common stocks | | | | | | | | | | | | | | | | |
| | | | |
Consumer staples | | $ | 1,039,650 | | | $ | 0 | | | $ | 0 | | | $ | 1,039,650 | |
| | | | |
Energy | | | 2,358,400 | | | | 0 | | | | 0 | | | | 2,358,400 | |
| | | | |
Health care | | | 1,902,500 | | | | 0 | | | | 0 | | | | 1,902,500 | |
| | | | |
Industrials | | | 2,916,550 | | | | 0 | | | | 0 | | | | 2,916,550 | |
| | | | |
Information technology | | | 7,175,600 | | | | 0 | | | | 0 | | | | 7,175,600 | |
| | | | |
Materials | | | 6,327,430 | | | | 0 | | | | 0 | | | | 6,327,430 | |
| | | | |
Real estate | | | 850,050 | | | | 0 | | | | 0 | | | | 850,050 | |
| | | | |
Utilities | | | 4,201,100 | | | | 0 | | | | 0 | | | | 4,201,100 | |
| | | | |
Corporate bonds and notes | | | 0 | | | | 316,687,428 | | | | 0 | | | | 316,687,428 | |
| | | | |
Yankee corporate bonds and notes | | | 0 | | | | 63,298,230 | | | | 0 | | | | 63,298,230 | |
| | | | |
Short-term investments | | | | | | | | | | | | | | | | |
| | | | |
Investment companies | | | 2,637,237 | | | | 15,297,761 | | | | 0 | | | | 17,934,998 | |
| | | | |
Total assets | | $ | 29,408,517 | | | $ | 395,283,419 | | | $ | 0 | | | $ | 424,691,936 | |
Additional sector, industry or geographic detail is included in the Portfolio of Investments.
At February 28, 2019, the Fund did not have any transfers into/out of Level 3.
4. TRANSACTIONS WITH AFFILIATES
Management fee
Funds Management, an indirect wholly owned subsidiary of Wells Fargo, is the manager of the Fund and provides advisory and fund-level administrative services under an investment management agreement. Under the investment management agreement, Funds Management is responsible for, among other services, implementing the investment objectives and strategies of the Fund, supervising the subadviser and providing fund-level administrative services in connection with the Fund’s operations. As compensation for its services under the investment management agreement, Funds Management is entitled to receive a management fee at the following annual rate based on the Fund’s average daily net assets:
| | | | |
| Average daily net assets | | Annual fee rate | |
| |
First $500 million | | | 0.550 | % |
| |
Next $500 million | | | 0.525 | |
| |
Next $2 billion | | | 0.500 | |
| |
Next $2 billion | | | 0.475 | |
| |
Next $5 billion | | | 0.440 | |
| |
Over $10 billion | | | 0.430 | |
| | | | |
| 26 | | Wells Fargo High Yield Bond Fund | | Notes to financial statements (unaudited) |
For the six months ended February 28, 2019, the management fee was equivalent to an annual rate of 0.55% of the Fund’s average daily net assets.
Funds Management has retained the services of a subadviser to provide daily portfolio management to the Fund. The fee for subadvisory services is borne by Funds Management. WellsCap is the subadviser to the Fund and is entitled to receive a fee from Funds Management at an annual rate starting at 0.35% and declining to 0.20% as the average daily net assets of the Fund increase.
Administration fees
Under a class-level administration agreement, Funds Management provides class-level administrative services to the Fund, which includes paying fees and expenses for services provided by the transfer agent, sub-transfer agents, omnibus account servicers and record-keepers. As compensation for its services under the class-level administration agreement, Funds Management receives an annual fee which is calculated based on the average daily net assets of each class as follows:
| | | | |
| | | Class-level
administration fee | |
| |
Class A, Class C | | | 0.16 | % |
| |
Administrator Class | | | 0.10 | |
| |
Institutional Class | | | 0.08 | |
Funds Management has contractually waived and/or reimbursed management and administration fees to the extent necessary to maintain certain net operating expense ratios for the Fund. When each class of the Fund has exceeded its expense cap, Funds Management has waived fees and/or reimbursed expenses from fund level expenses on a proportionate basis and then from class specific expenses. When only certain classes exceed their expense caps, waivers and/or reimbursements are applied against class specific expenses before fund level expenses. Funds Management has committed through December 31, 2019 to waive fees and/or reimburse expenses to the extent necessary to cap the Fund’s expenses at 0.93% for Class A shares, 1.68% for Class C shares, 0.80% for Administrator Class shares and 0.53% for Institutional Class shares. Prior to or after the commitment expiration date, the cap may be increased or the commitment to maintain the cap may be terminated only with the approval of the Board of Trustees.
Distribution fee
The Trust has adopted a distribution plan for Class C shares of the Fund pursuant to Rule 12b-1 under the 1940 Act. A distribution fee is charged to Class C shares and paid to Wells Fargo Funds Distributor, LLC (“Funds Distributor”), the principal underwriter, at an annual rate of 0.75% of the average daily net assets of Class C shares.
In addition, Funds Distributor is entitled to receive the front-end sales charge from the purchase of Class A shares and a contingent deferred sales charge on the redemption of certain Class A shares. Funds Distributor is also entitled to receive the contingent deferred sales charges from redemptions of Class C shares. For the six months ended February 28, 2019, Funds Distributor received $2,383 from the sale of Class A shares and $16 in contingent deferred sales charges from redemptions of Class C shares. No contingent deferred sales charges were incurred by Class A shares for the six months ended February 28, 2019.
Shareholder servicing fees
The Trust has entered into contracts with one or more shareholder servicing agents, whereby Class A, Class C and Administrator Class of the Fund are charged a fee at an annual rate of 0.25% of the average daily net assets of each respective class. A portion of these total shareholder servicing fees were paid to affiliates of Wells Fargo.
Interfund transactions
The Fund may purchase or sell portfolio investment securities to certain other Wells Fargo affiliates pursuant to Rule17a-7 under the 1940 Act and under procedures adopted by the Board of Trustees. The procedures have been designed to ensure that these interfund transactions, which do not incur broker commissions, are effected at current market prices.
5. INVESTMENT PORTFOLIO TRANSACTIONS
Purchases and sales of investments, excluding U.S. government obligations (if any) and short-term securities, for the six months ended February 28, 2019 were $40,422,138 and $96,832,157, respectively.
| | | | | | |
| Notes to financial statements (unaudited) | | Wells Fargo High Yield Bond Fund | | | 27 | |
6. BANK BORROWINGS
The Trust (excluding the money market funds), Wells Fargo Master Trust and Wells Fargo Variable Trust are parties to a $280,000,000 revolving credit agreement whereby the Fund is permitted to use bank borrowings for temporary or emergency purposes, such as to fund shareholder redemption requests. Interest under the credit agreement is charged to the Fund based on a borrowing rate equal to the higher of the Federal Funds rate in effect on that day plus 1.25% or the overnight LIBOR rate in effect on that day plus 1.25%. In addition, an annual commitment fee equal to 0.25% of the unused balance is allocated to each participating fund.
During the six months ended February 28, 2019, the Fund had average borrowings outstanding of $13,727 (on an annualized basis) at an average interest rate of 3.69% and paid interest in the amount of $506.
7. DISTRIBUTIONS TO SHAREHOLDERS
Effective for all filings after November 4, 2018, the Securities and Exchange Commission eliminated the requirement to separately state the components of distributions to shareholders under U.S. generally accepted accounting principles. The amounts of distributions to shareholders for the year ended August 31, 2018 were as follows:
| | | | | | | | |
| | | Net investment
income | | | Net realized
gains | |
| | |
Class A | | | $11,998,114 | | | | $464,808 | |
| | |
Class C | | | 1,891,216 | | | | 73,266 | |
| | |
Administrator Class | | | 1,158,390 | | | | 44,876 | |
| | |
Institutional Class | | | 6,020,709 | | | | 233,242 | |
8. INDEMNIFICATION
Under the Trust’s organizational documents, the officers and Trustees have been granted certain indemnification rights against certain liabilities that may arise out of performance of their duties to the Trust. Additionally, in the normal course of business, the Trust may enter into contracts with service providers that contain a variety of indemnification clauses. The Trust’s maximum exposure under these arrangements is dependent on future claims that may be made against the Fund and, therefore, cannot be estimated.
9. NEW ACCOUNTING PRONOUNCEMENTS
In August 2018, FASB issued Accounting Standards Update (“ASU”) No. 2018-13, Fair Value Measurement (Topic 820)Disclosure Framework—Changes to the Disclosure Requirements for Fair Value Measurement. ASU 2018-13 updates the disclosure requirements for fair value measurements by modifying or removing certain disclosures and adding certain new disclosures. The amendments are effective for fiscal years, and interim periods within those fiscal years, beginning after December 15, 2019. Early adoption is permitted. Management has adopted the removal and modification of disclosures early, as permitted, and will adopt the additional new disclosures at the effective date.
In March 2017, FASB issued ASU No. 2017-08,Premium Amortization on Purchased Callable Debt Securities. ASU 2017-08 shortens the amortization period for certain callable debt securities held at a premium. The amendments require the premium to be amortized to the earliest call date. The amendments do not require an accounting change for securities held at a discount; the discount continues to be amortized to maturity. ASU 2017-08 is effective for fiscal years beginning after December 15, 2018 and for interim periods within those fiscal years . Management is currently evaluating the potential impact of this new guidance to the financial statements.
| | | | |
| 28 | | Wells Fargo High Yield Bond Fund | | Other information (unaudited) |
PROXY VOTING INFORMATION
A description of the policies and procedures used to determine how to vote proxies relating to portfolio securities is available, upon request, by calling1-800-222-8222, visiting our website atwfam.com, or visiting the SEC website at sec.gov. Information regarding how the Fund voted proxies relating to portfolio securities during the most recent 12-month period ended June 30 is available on the Fund’s website atwfam.comor by visiting the SEC website at sec.gov.
PORTFOLIO HOLDINGS INFORMATION
The complete portfolio holdings for the Fund are publicly available monthly on the Fund’s website (wfam.com), on a one-month delayed basis. In addition, top ten holdings information (excluding derivative positions) for the Fund is publicly available on the Fund’s website on a monthly, seven-day or more delayed basis. The Fund files its complete schedule of portfolio holdings with the SEC for the first and third quarters of each fiscal year on Form N-Q, which is available by visiting the SEC website at sec.gov. In addition, the Fund’s Form N-Q may be reviewed and copied at the SEC’s Public Reference Room in Washington, DC, and at regional offices in New York City, at 233 Broadway, and in Chicago, at 175 West Jackson Boulevard, Suite 900. Information about the Public Reference Room may be obtained by calling 1-800-SEC-0330.
| | | | | | |
| Other information (unaudited) | | Wells Fargo High Yield Bond Fund | | | 29 | |
BOARD OF TRUSTEES AND OFFICERS
Each of the Trustees and Officers1 listed in the table below acts in identical capacities for each fund in the Wells Fargo family of funds, which consists of 152 mutual funds comprising the Wells Fargo Funds Trust, Wells Fargo Variable Trust, Wells Fargo Master Trust and four closed-end funds (collectively the “Fund Complex”). This table should be read in conjunction with the Prospectus and the Statement of Additional Information2. The mailing address of each Trustee and Officer is 525 Market Street, 12th Floor, San Francisco, CA 94105. Each Trustee and Officer serves an indefinite term, however, each Trustee serves such term until reaching the mandatory retirement age established by the Trustees.
Independent Trustees
| | | | | | |
Name and year of birth | | Position held and length of service* | | Principal occupations during past five years or longer | | Current other
public company or
investment company
directorships |
| | | |
William R. Ebsworth (Born 1957) | | Trustee, since 2015 | | Retired. From 1984 to 2013, equities analyst, portfolio manager, research director and chief investment officer at Fidelity Management and Research Company in Boston, Tokyo, and Hong Kong, and retired in 2013 as Chief Investment Officer of Fidelity Strategic Advisers, Inc. where he led a team of investment professionals managing client assets. Prior thereto, Board member of Hong Kong Securities Clearing Co., Hong Kong Options Clearing Corp., the Thailand International Fund, Ltd., Fidelity Investments Life Insurance Company, and Empire Fidelity Investments Life Insurance Company. Board member of the Vincent Memorial Hospital Endowment (non-profit organization), where he serves on the Investment Committee and as a Chair of the Audit Committee. Mr. Ebsworth is a CFA® charterholder. | | N/A |
| | | |
Jane A. Freeman (Born 1953) | | Trustee, since 2015; Chair Liaison, since 2018 | | Retired. From 2012 to 2014 and 1999 to 2008, Chief Financial Officer of Scientific Learning Corporation. From 2008 to 2012, Ms. Freeman provided consulting services related to strategic business projects. Prior to 1999, Portfolio Manager at Rockefeller & Co. and Scudder, Stevens & Clark. Board member of the Harding Loevner Funds from 1996 to 2014, serving as both Lead Independent Director and chair of the Audit Committee. Board member of the Russell Exchange Traded Funds Trust from 2011 to 2012 and the chair of the Audit Committee. Ms. Freeman is a Board Member of The Ruth Bancroft Garden (non-profit organization). She is also an inactive Chartered Financial Analyst. | | N/A |
| | | |
Isaiah Harris, Jr.3 (Born 1952) | | Trustee, since 2009; Audit Committee Chairman, since 2019 | | Retired. Chairman of the Board of CIGNA Corporation since 2009, and Director since 2005. From 2003 to 2011, Director of Deluxe Corporation. Prior thereto, President and CEO of BellSouth Advertising and Publishing Corp. from 2005 to 2007, President and CEO of BellSouth Enterprises from 2004 to 2005 and President of BellSouth Consumer Services from 2000 to 2003. Emeritus member of the Iowa State University Foundation Board of Governors. Emeritus Member of the Advisory Board of Iowa State University School of Business. Advisory Board Member, Palm Harbor Academy (private school). Advisory Board Member, Child Evangelism Fellowship (non-profit). Mr. Harris is a certified public accountant (inactive status). | | CIGNA Corporation |
| | | |
Judith M. Johnson3 (Born 1949) | | Trustee, since 2008; Audit Committee Chairman, from 2009 to 2018 | | Retired. Prior thereto, Chief Executive Officer and Chief Investment Officer of Minneapolis Employees Retirement Fund from 1996 to 2008. Ms. Johnson is an attorney, certified public accountant and a certified managerial accountant. | | N/A |
| | | |
David F. Larcker (Born 1950) | | Trustee, since 2009 | | James Irvin Miller Professor of Accounting at the Graduate School of Business, Stanford University, Director of the Corporate Governance Research Initiative and Senior Faculty of The Rock Center for Corporate Governance since 2006. From 2005 to 2008, Professor of Accounting at the Graduate School of Business, Stanford University. Prior thereto, Ernst & Young Professor of Accounting at The Wharton School, University of Pennsylvania from 1985 to 2005. | | N/A |
| | | | |
| 30 | | Wells Fargo High Yield Bond Fund | | Other information (unaudited) |
| | | | | | |
Name and year of birth | | Position held and length of service* | | Principal occupations during past five years or longer | | Current other
public company or
investment company
directorships |
| | | |
Olivia S. Mitchell (Born 1953) | | Trustee, since 2006; Nominating and Governance Committee Chairman, since 2018 | | International Foundation of Employee Benefit Plans Professor, Wharton School of the University of Pennsylvania since 1993. Director of Wharton’s Pension Research Council and Boettner Center on Pensions & Retirement Research, and Research Associate at the National Bureau of Economic Research. Previously, Cornell University Professor from 1978 to 1993. | | N/A |
| | | |
Timothy J. Penny (Born 1951) | | Trustee, since 1996; Chairman, since 2018 | | President and Chief Executive Officer of Southern Minnesota Initiative Foundation, a non-profit organization, since 2007. Member of the Board of Trustees of NorthStar Education Finance, Inc., a non-profit organization, since 2007. | | N/A |
| | | |
James G. Polisson (Born 1959) | | Trustee, since 2018 | | Retired. Chief Marketing Officer, Source (ETF) UK Services, Ltd, from 2015 to 2017. From 2012 to 2015, Principal of The Polisson Group, LLC, a management consulting, corporate advisory and principal investing company. Chief Executive Officer and Managing Director at Russell Investments, Global Exchange Traded Funds from 2010 to 2012. Managing Director of Barclays Global Investors from 1998 to 2010 and Global Chief Marketing Officer for iShares and Barclays Global Investors from 2000 to 2010. Trustee of the San Francisco Mechanics’ Institute, a non-profit organization, from 2013 to 2015. Board member of the Russell Exchange Traded Fund Trust from 2011 to 2012. Director of Barclays Global Investors Holdings Deutschland GmbH from 2006 to 2009. Mr. Polisson is an attorney and has a retired status with the Massachusetts and District of Columbia Bar Associations. | | N/A |
| | | |
Pamela Wheelock (Born 1959) | | Trustee, since 2018 | | Chief Operating Officer, Twin Cities Habitat for Humanity, since January, 2017. Vice President of University Services, University of Minnesota from 2012 to 2017. Prior thereto, on the Board of Directors, Governance Committee and Finance Committee for the Minnesota Philanthropy Partners (Saint Paul Foundation) from 2012 to 2018, Interim President and Chief Executive Officer of Blue Cross Blue Shield of Minnesota from 2010 to 2011, Chairman of the Board from 2009 to 2011 and Board Director from 2003 to 2015. Vice President, Leadership and Community Engagement, Bush Foundation, Saint Paul, Minnesota (a private foundation) from 2009 to 2011. Executive Vice President and Chief Financial Officer, Minnesota Sports and Entertainment from 2004 to 2009 and Senior Vice President from 2002 to 2004. Commissioner of Finance, State of Minnesota, from 1999 to 2002. Currently the Board Chair of the Minnesota Wild Foundation since 2010. | | N/A |
| * | Length of service dates reflect the Trustee’s commencement of service with the Trust’s predecessor entities, where applicable. |
| | | | | | |
| Other information (unaudited) | | Wells Fargo High Yield Bond Fund | | | 31 | |
Officers
| | | | | | |
Name and year of birth | | Position held and length of service | | Principal occupations during past five years or longer | | |
| | | |
Andrew Owen (Born 1960) | | President, since 2017 | | Executive Vice President of Wells Fargo & Company and Head of Affiliated Managers, Wells Fargo Asset Management, since 2014. In addition, Mr. Owen is currently President, Chief Executive Officer and Director of Wells Fargo Funds Management, LLC since 2017. Prior thereto, Executive Vice President responsible for marketing, investments and product development for Wells Fargo Funds Management, LLC, from 2009 to 2014. | | |
| | | |
Nancy Wiser1 (Born 1967) | | Treasurer, since 2012 | | Executive Vice President of Wells Fargo Funds Management, LLC since 2011. Chief Operating Officer and Chief Compliance Officer at LightBox Capital Management LLC, from 2008 to 2011. | | |
| | | |
Alexander Kymn (Born 1973) | | Secretary and Chief Legal Officer, since 2018 | | Senior Company Counsel of Wells Fargo Bank, N.A. since 2018 (previously Senior Counsel from 2007 to 2018). Vice President of Wells Fargo Funds Management, LLC from 2008 to 2014. | | |
| | | |
Michael H. Whitaker (Born 1967) | | Chief Compliance Officer, since 2016 | | Senior Vice President and Chief Compliance Officer since 2016. Senior Vice President and Chief Compliance Officer for Fidelity Investments from 2007 to 2016. | | |
| | | |
David Berardi (Born 1975) | | Assistant Treasurer, since 2009 | | Vice President of Wells Fargo Funds Management, LLC since 2009. Vice President of Evergreen Investment Management Company, LLC from 2008 to 2010. Manager of Fund Reporting and Control for Evergreen Investment Management Company, LLC from 2004 to 2010. | | |
| | | |
Jeremy DePalma1 (Born 1974) | | Assistant Treasurer, since 2009 | | Senior Vice President of Wells Fargo Funds Management, LLC since 2009. Senior Vice President of Evergreen Investment Management Company, LLC from 2008 to 2010 and head of the Fund Reporting and Control Team within Fund Administration from 2005 to 2010. | | |
| 1 | Nancy Wiser acts as Treasurer of 76 funds in the Fund Complex. Jeremy DePalma acts as Treasurer of 76 funds and Assistant Treasurer of 76 funds in the Fund Complex. |
| 2 | The Statement of Additional Information includes additional information about the Trustees and is available, without charge, upon request, by calling1-800-222-8222 or by visiting the website atwfam.com. |
| 3 | Mr. Harris became Chairman of the Audit Committee effective January 1, 2019. |
| | | | |
| 32 | | Wells Fargo High Yield Bond Fund | | Appendix A (unaudited) |
SALES CHARGE REDUCTIONS AND WAIVERS FOR CERTAIN INTERMEDIARIES
Raymond James & Associates, Inc., Raymond James Financial Services & Raymond James affiliates (“Raymond James”)
Effective on or about March 1, 2019, shareholders purchasing Fund shares through a Raymond James platform or account will be eligible only for the following load waivers (front-end sales charge waivers and contingent deferred, or back-end, sales charge waivers) and discounts, which may differ from those disclosed elsewhere in the Fund’s Prospectus or SAI.
Front-end Sales Load Waivers on Class A shares Available at Raymond James
| | • | | Shares purchased in an investment advisory program. |
| | • | | Shares purchased through reinvestment of capital gains distributions and dividend reinvestment when purchasing shares of the same fund (but not any other fund within the fund family). |
| | • | | Employees and registered representatives of Raymond James or its affiliates and their family members as designated by Raymond James. |
| | • | | Shares purchased from the proceeds of redemptions within the same fund family, provided (1) the repurchase occurs within 90 days following the redemption, (2) the redemption and purchase occur in the same account, and (3) redeemed shares were subject to a front-end or deferred sales load (known as Rights of Reinstatement). |
| | • | | A shareholder in the fund’s Class C shares will have their shares automatically exchanged at net asset value to Class A shares (or the appropriate share class) of the fund if the shares are no longer subject to a CDSC and the exchange is in line with the policies and procedures of Raymond James. |
CDSC Waivers on Class A and C Shares Available at Raymond James
| | • | | Death or disability of the shareholder. |
| | • | | Shares sold as part of a systematic withdrawal plan as described in the Fund’s Prospectus. |
| | • | | Return of excess contributions from an IRA Account. |
| | • | | Shares sold as part of a required minimum distribution for IRA and retirement accounts due to the shareholder reaching age 70½ as described in the Fund’s prospectus. |
| | • | | Shares sold to pay Raymond James fees but only if the transaction is initiated by Raymond James. |
| | • | | Shares acquired through a right of reinstatement. |
Front-end Load Discounts Available at Raymond James: Breakpoints, and/or Rights of Accumulation
| | • | | Breakpoints as described in the Fund’s Prospectus. |
| | • | | Rights of accumulation which entitle shareholders to breakpoint discounts will be automatically calculated based on the aggregated holding of fund family assets held by accounts within the purchaser’s household at Raymond James. Eligible fund family assets not held at Raymond James may be included in the rights of accumulation calculation only if the shareholder notifies his or her financial advisor about such assets. |

For more information
More information about Wells Fargo Funds is available free upon request. To obtain literature, please write, visit the Fund’s website, or call:
Wells Fargo Funds
P.O. Box 219967
Kansas City, MO 64121-9967
Website: wfam.com
Individual investors: 1-800-222-8222
Retail investment professionals: 1-888-877-9275
Institutional investment professionals: 1-866-765-0778
This report and the financial statements contained herein are submitted for the general information of the shareholders of the Fund. If this report is used for promotional purposes, distribution of the report must be accompanied or preceded by a current prospectus. Before investing, please consider the investment objectives, risks, charges, and expenses of the investment. For a current prospectus and, if available, a summary prospectus, containing this information, call1-800-222-8222 or visit the Fund’s website atwfam.com. Read the prospectus carefully before you invest or send money.
Wells Fargo Asset Management (WFAM) is the trade name for certain investment advisory/management firms owned by Wells Fargo & Company. These firms include but are not limited to Wells Capital Management Incorporated and Wells Fargo Funds Management, LLC. Certain products managed by WFAM entities are distributed by Wells Fargo Funds Distributor, LLC (a broker-dealer and Member FINRA).
This material is for general informational and educational purposes only and is NOT intended to provide investment advice or a recommendation of any kind—including a recommendation for any specific investment, strategy, or plan.
INVESTMENT PRODUCTS: NOT FDIC INSURED ◾ NO BANK GUARANTEE ◾ MAY LOSE VALUE
© 2019 Wells Fargo Funds Management, LLC. All rights reserved.
| | |
 | | 321626 04-19 SA218/SAR218 02-19 |
Semi-Annual Report
February 28, 2019

Wells Fargo Conservative Income Fund

Beginning on January 1, 2021, as permitted by new regulations adopted by the Securities and Exchange Commission, paper copies of the Wells Fargo Funds’ annual and semi-annual shareholder reports issued after this date will no longer be sent by mail, unless you specifically request paper copies of the reports. Instead, the reports will be made available on the Funds’ website, and you will be notified by mail each time a report is posted and provided with a website address to access the report.
If you already elected to receive shareholder reports electronically, you will not be affected by this change and you need not take any action. You may elect to receive shareholder reports and other communications from the Fund electronically at any time by contacting your financial intermediary (such as a broker-dealer or bank) or, if you are a direct investor, by calling 1-800-222-8222 or by enrolling at wellsfargo.com/advantagedelivery.
You may elect to receive all future reports in paper free of charge. If you invest through a financial intermediary, you can contact your financial intermediary to request that you continue to receive paper copies of your shareholder reports; if you invest directly with the Fund, you can call 1-800-222-8222. Your election to receive reports in paper will apply to all Wells Fargo Funds held in your account with your financial intermediary or, if you are a direct investor, to all Wells Fargo Funds that you hold.

Reduce clutter. Save trees.
Sign up for electronic delivery of prospectuses and shareholder reports atwellsfargo.com/advantagedelivery
Contents
The views expressed and any forward-looking statements are as of February 28, 2019, unless otherwise noted, and are those of the Fund managers and/or Wells Fargo Funds Management, LLC. Discussions of individual securities, or the markets generally, or any Wells Fargo Fund are not intended as individual recommendations. Future events or results may vary significantly from those expressed in any forward-looking statements. The views expressed are subject to change at any time in response to changing circumstances in the market. Wells Fargo Funds Management, LLC and the Fund disclaim any obligation to publicly update or revise any views expressed or forward-looking statements.
INVESTMENT PRODUCTS: NOT FDIC INSURED ◾ NO BANK GUARANTEE ◾ MAY LOSE VALUE
| | | | |
| 2 | | Wells Fargo Conservative Income Fund | | Letter to shareholders (unaudited) |

Andrew Owen
President
Wells Fargo Funds
Favorable third-quarter economic indicators and corporate earnings reports encouraged domestic stock investors.
Dear Shareholder:
We are pleased to offer you this semi-annual report for the Wells Fargo Conservative Income Fund for the six-month period that ended February 28, 2019. Highershort-term interest rates, inflation concerns, trade tensions, slowing economic growth outside the U.S., and geopolitical events contributed to investment market volatility throughout the period.
For the period, U.S. stocks, as measured by the S&P 500 Index,1 fell 3.04% and international stocks, as measured by the MSCI ACWI ex USA Index (Net),2 declined 2.47%. Based on the MSCI EM Index (Net),3 emerging market stocks gained 0.33%. For bond investors, the Bloomberg Barclays U.S. Aggregate Bond Index4 added 1.99% while the Bloomberg Barclays Global Aggregate ex-USD Index5 gained 0.63%. The Bloomberg Barclays Municipal Bond Index6 added 2.34%, and the ICE BofAML U.S. High Yield Index7 advanced 1.98%.
Investors appeared to shake off lingering concerns during the third quarter.
Favorable third-quarter economic indicators and corporate earnings reports encouraged domestic stock investors. U.S. trade negotiations with Mexico and Canada progressed. The Conference Board Consumer Confidence Index®8 reached its highest level in 18 years during September 2018. The U.S. Federal Reserve (Fed) raised the federal funds rate by 25 basis points (bps; 100 bps equal 1.00%) to a target range of between 2.00% and 2.25% in September 2018. For the quarter that ended September 30, 2018, the S&P 500 Index added 7.71%.
Investors in international markets were not as confident. Tensions between the U.S. and China increased. The U.S. imposed $200 billion in tariffs on Chinese goods. China reacted with $60 billion in tariffs on U.S. goods. Economic growth in China caused concern. The Bank of England (BOE) raised its monetary policy rate to 0.75% in August. During the quarter, the MSCI ACWI ex USA Index (Net) gained 0.71%. The MSCI EM Index (Net) declined 1.09%. In fixed-income markets, U.S. bonds were flat, as measured by the Bloomberg Barclays U.S. Aggregate Bond Index. The Bloomberg Barclays Global Aggregate ex-USD Index fell 1.74%.
| 1 | The S&P 500 Index consists of 500 stocks chosen for market size, liquidity, and industry group representation. It is a market-value-weighted index with each stock’s weight in the index proportionate to its market value. You cannot invest directly in an index. |
| 2 | The Morgan Stanley Capital International (MSCI) All Country World Index (ACWI) ex USA Index (Net) is a free-float-adjusted market-capitalization-weighted index that is designed to measure the equity market performance of developed markets, excluding the United States and Canada. Source: MSCI. MSCI makes no express or implied warranties or representations and shall have no liability whatsoever with respect to any MSCI data contained herein. The MSCI data may not be further redistributed or used as a basis for other indices or any securities or financial products. This report is not approved, reviewed, or produced by MSCI. You cannot invest directly in an index. |
| 3 | The MSCI Emerging Markets (EM) Index (Net) is a free-float-adjusted market-capitalization-weighted index that is designed to measure large- and mid-cap equity market performance of emerging markets. The MSCI EM Index (Net) consists of the following 24 emerging market country indices: Brazil, Chile, China, Colombia, Czech Republic, Egypt, Greece, Hungary, India, Indonesia, Korea, Malaysia, Mexico, Pakistan, Peru, the Philippines, Poland, Qatar, Russia, South Africa, Taiwan, Thailand, Turkey, and the United Arab Emirates. You cannot invest directly in an index. |
| 4 | The Bloomberg Barclays U.S. Aggregate Bond Index is a broad-based benchmark that measures the investment-grade, U.S. dollar-denominated, fixed-rate taxable bond market, including Treasuries, government-related and corporate securities, mortgage-backed securities (agency fixed-rate and hybrid adjustable-rate mortgage pass-throughs), asset-backed securities, and commercial mortgage-backed securities. You cannot invest directly in an index. |
| 5 | The Bloomberg Barclays Global Aggregate ex-USD Index is an unmanaged index that provides a broad-based measure of the global investment-grade fixed-income markets excluding the U.S. dollar-denominated debt market. You cannot invest directly in an index. |
| 6 | The Bloomberg Barclays Municipal Bond Index is an unmanaged index composed of long-term tax-exempt bonds with a minimum credit rating of Baa. You cannot invest directly in an index. |
| 7 | The ICE BofAML U.S. High Yield Index is a market-capitalization-weighted index of domestic and Yankee high-yield bonds. The index tracks the performance of high-yield securities traded in the U.S. bond market. You cannot invest directly in an index. Copyright 2019. ICE Data Indices, LLC. All rights reserved. |
| 8 | The Conference Board Consumer Confidence Index® measures the degree of optimism on the state of the U.S. economy that consumers are expressing through their activities of savings and spending. You cannot invest directly in an index. |
| | | | | | |
| Letter to shareholders (unaudited) | | Wells Fargo Conservative Income Fund | | | 3 | |
Conflicting data unsettled markets during the fourth quarter.
November’s U.S. midterm elections shifted control of the House of Representatives from Republicans to Democrats, presaging potential partisan clashes.Third-quarter U.S. gross domestic product (GDP) was announced at an annualized 3.4% rate, lower than the second-quarter rate. Brexit efforts stalled ahead of the March 2019 deadline. The People’s Bank of China cut reserve requirement ratios, accelerated infrastructure spending, and cut taxes even as the value of the yuan declined to low levels last seen in 2008.
December’s S&P 500 Index performance was the worst since 1931. Globally,fixed-income investments fared better than stocks during the last two months of the year. The Fed increased the federal funds rate by 25 bps in December 2018 to a target range of between 2.25% and 2.50% and softened its outlook for 2019 rate increases.
The market climbs a wall of worry.
Investors entered 2019 with reasons to be concerned. A partial U.S. government shutdown driven by partisan spending and immigration policy disputes extended into January. Investors expected high levels of stock market volatility to continue based on the VIX9.
January’s returns tended to support the investing adage that markets climb a wall of worry. The S&P 500 Index gained 8.01% for the month that ended January 31, 2019, its best monthly performance in 30 years. Returns for the MSCI ACWI ex USA Index (Net), the Bloomberg Barclays U.S. Aggregate Bond Index, and the Bloomberg Barclays Global Aggregate ex-USD Index also were positive.
In February, concerns over slowing global growth reemerged. The Bureau of Economic Analysis announced fourth-quarter 2018 GDP grew at an annualized 2.2% rate, down from the 4.2% annualized rate for the second quarter and the 3.4% annualized rate for the third quarter. Analysts attributed the lower growth rate to a slowing housing market and larger trade deficit. The U.S. Labor Department said that the economy created just 20,000 jobs in February. In a February report, the BOE forecast the slowest growth since the financial crisis for 2019. China and the U.S., while putting future tariffs on hold for the time being, continued to wrangle over trade issues.
Don’t let short-term uncertainty derail long-term investment goals.
Periods of investment uncertainty can present challenges, but experience has taught us that maintaining long-term investment goals can be an effective way to plan for the future. To help you create a sound strategy based on your personal goals and risk tolerance, Wells Fargo Funds offers more than 100 mutual funds spanning a wide range of asset classes and investment styles. Although diversification cannot guarantee an investment profit or prevent losses, we believe it can be an effective way to manage investment risk and potentially smooth out overall portfolio performance. We encourage investors to know their investments and to understand that appropriate levels of risk-taking may unlock opportunities.
January’s returns tended to support the investing adage that markets climb a wall of worry.
| 9 | The Chicago Board Options Exchange Market Volatility Index (VIX) is a popular measure of the implied volatility of S&P 500 Index options. It represents one measure of the market’s expectation of stock market volatility over the next 30-day period. You cannot invest directly in an index. |
| | | | |
| 4 | | Wells Fargo Conservative Income Fund | | Letter to shareholders (unaudited) |
Thank you for choosing to invest with Wells Fargo Funds. We appreciate your confidence in us and remain committed to helping you meet your financial needs.
Sincerely,

Andrew Owen
President
Wells Fargo Funds
For further information about your Fund, contact your investment professional, visit our website atwfam.com, or call us directly at1-800-222-8222.
This page is intentionally left blank.
| | | | |
| 6 | | Wells Fargo Conservative Income Fund | | Performance highlights (unaudited) |
Investment objective
The Fund seeks current income consistent with capital preservation.
Manager
Wells Fargo Funds Management, LLC
Subadviser
Wells Capital Management Incorporated
Portfolio managers
Andrew M. Greenberg, CFA®‡
Anthony J. Melville, CFA®‡
Jeffrey L. Weaver, CFA®‡
Average annual total returns (%) as of February 28, 2019
| | | | | | | | | | | | | | | | | | | | | | |
| | | | | | | | Expense ratios1 (%) | |
| | | Inception date | | 1 year | | | 5 year | | | Since inception | | | Gross | | | Net2 | |
| | | | | | |
| Institutional Class (WCIIX) | | 5-31-2013 | | | 2.28 | | | | 1.06 | | | | 1.02 | | | | 0.37 | | | | 0.27 | |
| | | | | | |
| Bloomberg Barclays 6-9 Month Treasury Bill Index3 | | – | | | 2.08 | | | | 0.73 | | | | 0.65 | * | | | – | | | | – | |
| * | | Based on the inception date of Institutional Class. |
Figures quoted represent past performance, which is no guarantee of future results, and do not reflect taxes that a shareholder may pay on fund distributions or the redemption of fund shares. Investment return and principal value of an investment will fluctuate so that an investor’s shares, when redeemed, may be worth more or less than their original cost. Current performance may be lower or higher than the performance data quoted, which assumes the reinvestment of dividends and capital gains. Current month-end performance is available on the Fund’s website, wfam.com.
Index returns do not include transaction costs associated with buying and selling securities, any mutual fund fees or expenses, or any taxes. It is not possible to invest directly in an index.
Institutional Class shares are sold without a front-end sales charge or contingent deferred sales charge.
Bond values fluctuate in response to the financial condition of individual issuers, general market and economic conditions, and changes in interest rates. Changes in market conditions and government policies may lead to periods of heightened volatility in the bond market and reduced liquidity for certain bonds held by the Fund. In general, when interest rates rise, bond values fall and investors may lose principal value. Interest rate changes and their impact on the Fund and its share price can be sudden and unpredictable. The use of derivatives may reduce returns and/or increase volatility. Certain investment strategies tend to increase the total risk of an investment (relative to the broader market). The Fund is exposed to foreign investment risk, mortgage- and asset-backed securities risk, and municipal securities risk. Consult the Fund’s prospectus for additional information on these and other risks.
Please see footnotes on page 7.
| | | | | | |
| Performance highlights (unaudited) | | Wells Fargo Conservative Income Fund | | | 7 | |
| | | | |
| Ten largest holdings (%) as of February 28, 20194 | |
| |
Metropolitan Life Global Funding, 3.18%, 6-12-2020 | | | 1.81 | |
| |
Svenska Handelsbanken AB , 3.12%, 5-24-2021 | | | 1.66 | |
| |
Jackson National Life Global, 3.09%, 10-15-2020 | | | 1.66 | |
| |
SoFi Consumer Loan Program Trust Series 2018-4 Class A, 3.54%, 11-26-2027 | | | 1.64 | |
| |
NextGear Floorplan Master Trust Series 2018-1A Class A1, 3.13%, 2-15-2023 | | | 1.51 | |
| |
WM Wrigley Jr. Company, 2.90%, 10-21-2019 | | | 1.51 | |
| |
American Honda Finance Corporation,2.79%, 2-21-2020 | | | 1.51 | |
| |
Caterpillar Financial Service, 2.91%, 8-26-2020 | | | 1.51 | |
| |
HSBC Holdings plc, 3.43%, 9-11-2021 | | | 1.51 | |
| |
Delamare Cards Series 2018-1A Class A1,3.18%, 11-19-2025 | | | 1.51 | |
|
| Portfolio composition as of February 28, 20195 |
|
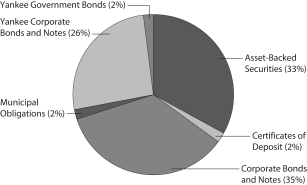 |
| ‡ | CFA® and Chartered Financial Analyst® are trademarks owned by CFA Institute. |
| 1 | Reflects the expense ratios as stated in the most recent prospectus. The expense ratios shown are subject to change and may differ from the annualized expense ratio shown in the financial highlights of this report. |
| 2 | The manager has contractually committed through December 31, 2019, to waive fees and/or reimburse expenses to the extent necessary to cap the expenses at the amount shown. Brokerage commissions, stamp duty fees, interest, taxes, acquired fund fees and expenses (if any), and extraordinary expenses are excluded from the expense cap. Prior to or after the commitment expiration date, the cap may be increased or the commitment to maintain the cap may be terminated only with the approval of the Board of Trustees. Without this cap, the Fund’s returns would have been lower. The expense ratio paid by an investor is the net expense ratio (the total annual fund operating expenses after fee waivers) as stated in the prospectuses. |
| 3 | The Bloomberg Barclays 6-9 Month Treasury Bill Index includes all publicly issued zero-coupon U.S. Treasury bills that have a remaining maturity of less than nine months and more than six, are rated investment-grade, and have $250 million or more of outstanding face value. You cannot invest directly in an index. |
| 4 | The ten largest holdings, excluding cash, cash equivalents and any money market funds, are calculated based on the value of the investments divided by total net assets of the Fund. Holdings are subject to change and may have changed since the date specified. |
| 5 | Amounts are calculated based on the total long-term investments of the Fund. These amounts are subject to change and may have changed since the date specified. |
| | | | |
| 8 | | Wells Fargo Conservative Income Fund | | Fund expenses (unaudited) |
As a shareholder of the Fund, you incur ongoing costs including management fees and other Fund expenses. This example is intended to help you understand your ongoing costs (in dollars) of investing in the Fund and to compare these costs with the ongoing costs of investing in other mutual funds.
The example is based on an investment of $1,000 invested at the beginning of the six-month period and held for the entire period from September 1, 2018 to February 28, 2019.
Actual expenses
The “Actual” line of the table below provides information about actual account values and actual expenses. You may use the information in this line, together with the amount you invested, to estimate the expenses that you paid over the period. Simply divide your account value by $1,000 (for example, an $8,600 account value divided by $1,000 = 8.6), then multiply the result by the number in the “Actual” line under the heading entitled “Expenses paid during period” for your applicable class of shares to estimate the expenses you paid on your account during this period.
Hypothetical example for comparison purposes
The “Hypothetical” line of the table below provides information about hypothetical account values and hypothetical expenses based on the Fund’s actual expense ratio and an assumed rate of return of 5% per year before expenses, which is not the Fund’s actual return. The hypothetical account values and expenses may not be used to estimate the actual ending account balance or expenses you paid for the period. You may use this information to compare the ongoing costs of investing in the Fund and other funds. To do so, compare this 5% hypothetical example with the 5% hypothetical examples that appear in the shareholder reports of the other funds.
Please note that the expenses shown in the table are meant to highlight your ongoing costs. Therefore, the “Hypothetical” line of the table is useful in comparing ongoing costs only and will not help you determine the relative total costs of owning different funds.
| | | | | | | | | | | | | | | | |
| | | Beginning
account value
9-1-2018 | | | Ending
account value
2-28-2019 | | | Expenses
paid during
the period¹ | | | Annualized net
expense ratio | |
Institutional Class | | | | | | | | | | | | | | | | |
| | | | |
Actual | | $ | 1,000.00 | | | $ | 1,011.76 | | | $ | 1.35 | | | | 0.27 | % |
| | | | |
Hypothetical (5% return before expenses) | | $ | 1,000.00 | | | $ | 1,023.46 | | | $ | 1.35 | | | | 0.27 | % |
| 1 | Expenses paid is equal to the annualized net expense ratio multiplied by the average account value over the period, multiplied by the number of days in the most recent fiscal half-year divided by the number of days in the fiscal year (to reflect the one-half-year period). |
| | | | | | |
| Portfolio of investments—February 28, 2019 (unaudited) | | Wells Fargo Conservative Income Fund | | | 9 | |
| | | | | | | | | | | | | | | | |
| Security name | | Interest rate | | | Maturity date | | | Principal | | | Value | |
| | | | |
Asset-Backed Securities: 24.05% | | | | | | | | | | | | | | | | |
| | | | |
Bank of the West Auto Trust Series 2018-1 Class A2 144A | | | 3.09 | % | | | 4-15-2021 | | | $ | 3,000,000 | | | $ | 3,004,416 | |
| | | | |
Barclays Dryrock Issuance Trust Series 2016-1 Class A | | | 1.52 | | | | 5-16-2022 | | | | 1,825,000 | | | | 1,817,313 | |
| | | | |
Canadian Pacer Auto Receivable Series-2A Class A2A 144A | | | 3.00 | | | | 6-21-2021 | | | | 1,585,000 | | | | 1,587,383 | |
| | | | |
CarMax Auto Owner Trust Series 2017-1 Class A3 | | | 1.98 | | | | 11-15-2021 | | | | 407,053 | | | | 404,855 | |
| | | | |
CarMax Auto Owner Trust Series 2018-3 Class A2A | | | 2.88 | | | | 10-15-2021 | | | | 1,950,000 | | | | 1,951,721 | |
| | | | |
CarMax Auto Owner Trust Series 2018-4 Class A2A | | | 3.11 | | | | 2-15-2022 | | | | 3,250,000 | | | | 3,258,589 | |
| | | | |
CCG Receivables Trust Series 2018-2 Class A2 144A | | | 3.09 | | | | 12-15-2025 | | | | 4,460,000 | | | | 4,466,997 | |
| | | | |
Chase Issuance Trust Series 2016-A4 Class A4 | | | 1.49 | | | | 7-15-2022 | | | | 3,000,000 | | | | 2,950,501 | |
| | | | |
Delamare Cards Series 2018-1A Class A1 (1 Month LIBOR +0.70%) 144A± | | | 3.18 | | | | 11-19-2025 | | | | 5,000,000 | | | | 4,990,770 | |
| | | | |
Dell Equipment Finance Trust Series 2018-1 Class A2A 144A | | | 2.97 | | | | 10-22-2020 | | | | 1,219,602 | | | | 1,221,275 | |
| | | | |
Dell Equipment Finance Trust Series 2018-2 Class A2 144A | | | 3.16 | | | | 2-22-2021 | | | | 1,750,000 | | | | 1,755,787 | |
| | | | |
Ford Credit Auto Lease Trust Series 2019 Class A | | | 2.84 | | | | 9-15-2021 | | | | 2,500,000 | | | | 2,499,652 | |
| | | | |
GM Financial Automobile Leasing Trust Series 2018-3 Class A2A | | | 2.89 | | | | 9-21-2020 | | | | 1,000,000 | | | | 1,001,051 | |
| | | | |
Hertz Fleet Lease Funding LP Series 2017-1 Class A1 (1 Month LIBOR +0.65%) 144A± | | | 3.17 | | | | 4-10-2031 | | | | 1,403,197 | | | | 1,405,201 | |
| | | | |
Honda Auto Receivables Owner Trust Series 2017-1 Class A3 | | | 1.72 | | | | 7-21-2021 | | | | 1,069,923 | | | | 1,063,360 | |
| | | | |
Hyundai Auto Lease Securitization Trust Series 2017-B Class A3 144A | | | 1.97 | | | | 7-15-2020 | | | | 1,650,000 | | | | 1,646,606 | |
| | | | |
Hyundai Auto Lease Securitization Trust Series 2019 Class A 144A | | | 2.92 | | | | 7-15-2021 | | | | 3,850,000 | | | | 3,849,520 | |
| | | | |
Mercedes-Benz Auto Lease Trust Series 2019-A Class A2 | | | 3.01 | | | | 2-16-2021 | | | | 3,250,000 | | | | 3,257,293 | |
| | | | |
NextGear Floorplan Master Trust Series 2018-1A Class A1 (1 Month LIBOR +0.64%) 144A± | | | 3.13 | | | | 2-15-2023 | | | | 5,000,000 | | | | 5,008,731 | �� |
| | | | |
Oscar US Funding Trust Series 2017-1A Class A2B (1 Month LIBOR +0.80%) 144A± | | | 3.32 | | | | 5-11-2020 | | | | 175,200 | | | | 175,252 | |
| | | | |
Oscar US Funding Trust Series 2017-2A Class A2A 144A | | | 2.13 | | | | 11-10-2020 | | | | 209,259 | | | | 208,724 | |
| | | | |
Oscar US Funding Trust Series 2018-1A Class A2B (1 Month LIBOR +0.49%) 144A± | | | 3.01 | | | | 4-12-2021 | | | | 1,315,820 | | | | 1,316,079 | |
| | | | |
Oscar US Funding Trust Series 2018-2A Class A2A 144A | | | 3.15 | | | | 8-10-2021 | | | | 3,238,983 | | | | 3,238,880 | |
| | | | |
Securitized Term Auto Receivables Trust Series 2018-2A Class A2A 144A | | | 3.06 | | | | 2-25-2021 | | | | 2,000,000 | | | | 1,998,987 | |
| | | | |
SoFi Consumer Loan Program Trust Series 2018-4 Class A 144A | | | 3.54 | | | | 11-26-2027 | | | | 5,395,386 | | | | 5,417,421 | |
| | | | |
Tesla Auto Lease Trust Series 2018-A Class C 144A | | | 2.97 | | | | 4-20-2020 | | | | 1,870,000 | | | | 1,866,277 | |
| | | | |
Trillium Credit Card Trust III Series 2018-2A Class A (1 Month LIBOR +0.35%) 144A± | | | 2.83 | | | | 9-26-2023 | | | | 4,150,000 | | | | 4,146,858 | |
| | | | |
Verizon Owner Trust Series 2017-1A Class A 144A | | | 2.06 | | | | 9-20-2021 | | | | 1,000,000 | | | | 996,178 | |
| | | | |
Verizon Owner Trust Series 2017-3A Class A1A 144A | | | 2.06 | | | | 4-20-2022 | | | | 4,486,000 | | | | 4,446,633 | |
| | | | |
Volkswagen Auto Loan Enhanced Trust Series 2018-1 Class A2A | | | 2.81 | | | | 7-20-2021 | | | | 4,147,146 | | | | 4,149,423 | |
| | | | |
Volvo Financial Equipment LLC Series 2019-1A Class A2 144A | | | 2.90 | | | | 11-15-2021 | | | | 1,600,000 | | | | 1,602,243 | |
| | | | |
World Omni Auto Lease Series 2018-B Class A2A | | | 2.96 | | | | 6-15-2021 | | | | 2,941,048 | | | | 2,944,204 | |
| | | | |
Total Asset-Backed Securities (Cost $79,575,248) | | | | | | | | | | | | | | | 79,648,180 | |
| | | | | | | | | | | | | | | | |
| | | | |
Certificates of Deposit: 1.81% | | | | | | | | | | | | | | | | |
| | | | |
Credit Suisse (3 Month LIBOR +0.12%) ± | | | 2.74 | | | | 2-28-2020 | | | | 3,000,000 | | | | 3,000,000 | |
| | | | |
Natixis (3 Month LIBOR +0.23%) ± | | | 3.01 | | | | 1-10-2020 | | | | 3,000,000 | | | | 3,003,259 | |
| | | | |
Total Certificates of Deposit (Cost $6,002,799) | | | | | | | | | | | | | | | 6,003,259 | |
| | | | | | | | | | | | | | | | |
| | | | |
Corporate Bonds and Notes: 26.03% | | | | | | | | | | | | | | | | |
| | | | |
Communication Services: 0.61% | | | | | | | | | | | | | | | | |
| | | | |
| Media: 0.61% | | | | | | | | | | | | | | | | |
| | | | |
Comcast Corporation | | | 3.30 | | | | 10-1-2020 | | | | 2,000,000 | | | | 2,013,304 | |
| | | | | | | | | | | | | | | | |
| | | | |
Consumer Discretionary: 0.91% | | | | | | | | | | | | | | | | |
| | | | |
| Automobiles: 0.91% | | | | | | | | | | | | | | | | |
| | | | |
Volkswagen Group America Company (3 Month LIBOR +0.77%) 144A± | | | 3.46 | | | | 11-13-2020 | | | | 3,000,000 | | | | 3,004,250 | |
| | | | | | | | | | | | | | | | |
The accompanying notes are an integral part of these financial statements.
| | | | |
| 10 | | Wells Fargo Conservative Income Fund | | Portfolio of investments—February 28, 2019 (unaudited) |
| | | | | | | | | | | | | | | | |
| Security name | | Interest rate | | | Maturity date | | | Principal | | | Value | |
| | | | |
Consumer Staples: 1.51% | | | | | | | | | | | | | | | | |
| | | | |
| Food Products: 1.51% | | | | | | | | | | | | | | | | |
| | | | |
WM Wrigley Jr. Company 144A | | | 2.90 | % | | | 10-21-2019 | | | $ | 5,000,000 | | | $ | 5,003,296 | |
| | | | | | | | | | | | | | | | |
| | | | |
Financials: 21.80% | | | | | | | | | | | | | | | | |
| | | | |
| Banks: 6.20% | | | | | | | | | | | | | | | | |
| | | | |
Branch Banking Trust | | | 2.10 | | | | 1-15-2020 | | | | 1,350,000 | | | | 1,340,865 | |
| | | | |
Citibank NA (3 Month LIBOR +0.32%) ± | | | 3.06 | | | | 5-1-2020 | | | | 4,750,000 | | | | 4,754,906 | |
| | | | |
Cooperatieve Rabobank UA (3 Month LIBOR +0.43%) ± | | | 3.19 | | | | 4-26-2021 | | | | 3,000,000 | | | | 3,004,563 | |
| | | | |
JPMorgan Chase & Company | | | 2.25 | | | | 1-23-2020 | | | | 1,000,000 | | | | 994,507 | |
| | | | |
JPMorgan Chase Bank NA (3 Month LIBOR +0.23%) ± | | | 2.97 | | | | 9-1-2020 | | | | 1,500,000 | | | | 1,499,022 | |
| | | | |
JPMorgan Chase Bank NA (3 Month LIBOR +0.37%) ± | | | 3.05 | | | | 2-19-2021 | | | | 2,000,000 | | | | 2,001,896 | |
| | | | |
PNC Bank NA | | | 1.95 | | | | 3-4-2019 | | | | 950,000 | | | | 950,000 | |
| | | | |
PNC Bank NA | | | 1.45 | | | | 7-29-2019 | | | | 1,000,000 | | | | 995,213 | |
| | | | |
US Bank NA | | | 2.35 | | | | 1-23-2020 | | | | 5,000,000 | | | | 4,981,923 | |
| | | | |
| | | | | | | | | | | | | | | 20,522,895 | |
| | | | | | | | | | | | | | | | |
| | | | |
| Capital Markets: 2.58% | | | | | | | | | | | | | | | | |
| | | | |
Charles Schwab Corporation (3 Month LIBOR +0.32%) ± | | | 2.96 | | | | 5-21-2021 | | | | 4,540,000 | | | | 4,539,955 | |
| | | | |
Goldman Sachs Group Incorporated (3 Month LIBOR +1.04%) ± | | | 3.81 | | | | 4-25-2019 | | | | 4,000,000 | | | | 4,006,776 | |
| | | | |
| | | | | | | | | | | | | | | 8,546,731 | |
| | | | | | | | | | | | | | | | |
| | | | |
| Consumer Finance: 6.38% | | | | | | | | | | | | | | | | |
| | | | |
American Express Credit Corporation | | | 2.25 | | | | 8-15-2019 | | | | 2,000,000 | | | | 1,995,648 | |
| | | | |
American Honda Finance Corporation (3 Month LIBOR +0.15%) ± | | | 2.79 | | | | 2-21-2020 | | | | 5,000,000 | | | | 5,001,005 | |
| | | | |
BMW US Capital LLC (3 Month LIBOR +0.41%) 144A± | | | 3.20 | | | | 9-13-2019 | | | | 2,000,000 | | | | 2,001,427 | |
| | | | |
Caterpillar Financial Service (3 Month LIBOR +0.25%) ± | | | 2.91 | | | | 8-26-2020 | | | | 5,000,000 | | | | 4,998,512 | |
| | | | |
Nissan Motor Acceptance Corporation 144A | | | 2.00 | | | | 3-8-2019 | | | | 2,000,000 | | | | 1,999,856 | |
| | | | |
Nissan Motor Acceptance Corporation (3 Month LIBOR +0.52%) 144A± | | | 3.31 | | | | 3-15-2021 | | | | 1,000,000 | | | | 989,661 | |
| | | | |
Nissan Motor Acceptance Corporation (3 Month LIBOR +0.63%) 144A± | | | 3.42 | | | | 9-21-2021 | | | | 1,175,000 | | | | 1,161,657 | |
| | | | |
Nissan Motor Acceptance Corporation (3 Month LIBOR +1.01%) 144A± | | | 3.78 | | | | 3-8-2019 | | | | 1,000,000 | | | | 1,000,111 | |
| | | | |
Toyota Motor Credit Corporation (3 Month LIBOR +0.17%) ± | | | 2.97 | | | | 9-18-2020 | | | | 2,000,000 | | | | 1,997,870 | |
| | | | |
| | | | | | | | | | | | | | | 21,145,747 | |
| | | | | | | | | | | | | | | | |
| | | | |
| Insurance: 6.64% | | | | | | | | | | | | | | | | |
| | | | |
AIG Global Funding 144A | | | 1.95 | | | | 10-18-2019 | | | | 1,750,000 | | | | 1,740,140 | |
| | | | |
AIG Global Funding (3 Month LIBOR +0.46%) 144A± | | | 3.28 | | | | 6-25-2021 | | | | 2,950,000 | | | | 2,948,469 | |
| | | | |
Jackson National Life Global (3 Month LIBOR +0.30%) 144A± | | | 3.09 | | | | 10-15-2020 | | | | 5,500,000 | | | | 5,488,094 | |
| | | | |
Metropolitan Life Global Funding (3 Month LIBOR +0.40%) 144A± | | | 3.18 | | | | 6-12-2020 | | | | 5,975,000 | | | | 5,988,592 | |
| | | | |
Protective Life Global Funding (3 Month LIBOR +0.52%) 144A± | | | 3.33 | | | | 6-28-2021 | | | | 5,000,000 | | | | 4,989,508 | |
| | | | |
The Allstate Corporation (3 Month LIBOR +0.43%) ± | | | 3.23 | | | | 3-29-2021 | | | | 825,000 | | | | 820,207 | |
| | | | |
| | | | | | | | | | | | | | | 21,975,010 | |
| | | | | | | | | | | | | | | | |
| | | | |
Materials: 1.20% | | | | | | | | | | | | | | | | |
| | | | |
| Paper & Forest Products: 1.20% | | | | | | | | | | | | | | | | |
| | | | |
Georgia Pacific LLC 144A | | | 2.54 | | | | 11-15-2019 | | | | 4,000,000 | | | | 3,990,951 | |
| | | | | | | | | | | | | | | | |
| | | | |
Total Corporate Bonds and Notes (Cost $86,225,962) | | | | | | | | | | | | | | | 86,202,184 | |
| | | | | | | | | | | | | | | | |
The accompanying notes are an integral part of these financial statements.
| | | | | | |
| Portfolio of investments—February 28, 2019 (unaudited) | | Wells Fargo Conservative Income Fund | | | 11 | |
| | | | | | | | | | | | | | | | |
| Security name | | Interest rate | | | Maturity date | | | Principal | | | Value | |
| | | | |
Municipal Obligations: 1.90% | | | | | | | | | | | | | | | | |
| | | | |
Colorado: 1.45% | | | | | | | | | | | | | | | | |
| | | | |
| Health Revenue: 1.45% | | | | | | | | | | | | | | | | |
| | | | |
Colorado Tender Option Bond Trust Receipts/Certificates Series 2017-TPG007 (Bank of America NA LIQ) 144Aø | | | 2.98 | % | | | 10-29-2027 | | | $ | 4,800,000 | | | $ | 4,800,000 | |
| | | | | | | | | | | | | | | | |
| | | | |
Texas: 0.45% | | | | | | | | | | | | | | | | |
| | | | |
| GO Revenue: 0.45% | | | | | | | | | | | | | | | | |
| | | | |
Houston TX Taxable Pension Obligation Bonds Series 2017 | | | 2.20 | | | | 3-1-2019 | | | | 1,500,000 | | | | 1,500,000 | |
| | | | | | | | | | | | | | | | |
| | | | |
Total Municipal Obligations (Cost $6,300,000) | | | | | | | | | | | | | | | 6,300,000 | |
| | | | | | | | | | | | | | | | |
| | | | |
Yankee Corporate Bonds and Notes: 18.97% | | | | | | | | | | | | | | | | |
| | | | |
Communication Services: 1.21% | | | | | | | | | | | | | | | | |
| | | | |
| Interactive Media & Services: 1.21% | | | | | | | | | | | | | | | | |
| | | | |
Tencent Holdings Limited 144A | | | 3.38 | | | | 05-02-2019 | | | | 4,000,000 | | | | 4,003,256 | |
| | | | | | | | | | | | | | | | |
| | | | |
Energy: 1.51% | | | | | | | | | | | | | | | | |
| | | | |
| Oil, Gas & Consumable Fuels: 1.51% | | | | | | | | | | | | | | | | |
| | | | |
BP Capital Markets plc | | | 2.52 | | | | 1-15-2020 | | | | 5,000,000 | | | | 4,986,609 | |
| | | | | | | | | | | | | | | | |
| | | | |
Financials: 14.77% | | | | | | | | | | | | | | | | |
| | | | |
| Banks: 13.36% | | | | | | | | | | | | | | | | |
| | | | |
Australia and New Zealand Banking Group 144A | | | 5.10 | | | | 1-13-2020 | | | | 4,000,000 | | | | 4,075,987 | |
| | | | |
Bank of Montreal (3 Month LIBOR +0.40%) ± | | | 3.15 | | | | 1-22-2021 | | | | 4,000,000 | | | | 4,001,140 | |
| | | | |
Barclays Bank plc (3 Month LIBOR +0.46%) ± | | | 3.26 | | | | 1-11-2021 | | | | 5,000,000 | | | | 4,964,287 | |
| | | | |
BNZ International Funding of London (3 Month LIBOR +0.70%) 144A± | | | 3.34 | | | | 2-21-2020 | | | | 1,750,000 | | | | 1,756,012 | |
| | | | |
HSBC Holdings plc (3 Month LIBOR +0.65%) ± | | | 3.43 | | | | 9-11-2021 | | | | 5,000,000 | | | | 4,996,907 | |
| | | | |
National Australia Bank (3 Month LIBOR +0.35%) 144A± | | | 3.15 | | | | 1-12-2021 | | | | 2,000,000 | | | | 1,999,448 | |
| | | | |
Santander UK plc (3 Month LIBOR +0.62%) ± | | | 3.36 | | | | 6-1-2021 | | | | 4,000,000 | | | | 3,993,071 | |
| | | | |
Santander UK plc (3 Month LIBOR +0.66%) ± | | | 3.34 | | | | 11-15-2021 | | | | 1,270,000 | | | | 1,268,341 | |
| | | | |
Sumitomo Mitsui Banking Corporation (3 Month LIBOR +0.35%) ± | | | 3.12 | | | | 1-17-2020 | | | | 3,000,000 | | | | 3,004,959 | |
| | | | |
Sumitomo Mitsui Trust Bank Limited (3 Month LIBOR +0.91%) 144A± | | | 3.69 | | | | 10-18-2019 | | | | 3,000,000 | | | | 3,014,315 | |
| | | | |
Svenska Handelsbanken AB (3 Month LIBOR +0.47%) ± | | | 3.12 | | | | 5-24-2021 | | | | 5,500,000 | | | | 5,504,690 | |
| | | | |
United Overseas Bank Limited (3 Month LIBOR +0.48%) 144A± | | | 3.25 | | | | 4-23-2021 | | | | 1,800,000 | | | | 1,801,580 | |
| | | | |
Westpac Banking Corporation (3 Month LIBOR +0.28%) ± | | | 2.96 | | | | 5-15-2020 | | | | 2,325,000 | | | | 2,327,383 | |
| | | | |
Westpac Banking Corporation (3 Month LIBOR +1.00%) ± | | | 3.69 | | | | 5-13-2021 | | | | 1,525,000 | | | | 1,543,457 | |
| | | | |
| | | | | | | | | | | | | | | 44,251,577 | |
| | | | | | | | | | | | | | | | |
| | | | |
| Diversified Financial Services: 0.30% | | | | | | | | | | | | | | | | |
| | | | |
UBS AG (3 Month LIBOR +0.48%) 144A± | | | 3.22 | | | | 12-1-2020 | | | | 1,000,000 | | | | 1,000,676 | |
| | | | | | | | | | | | | | | | |
| | | | |
| Insurance: 1.11% | | | | | | | | | | | | | | | | |
| | | | |
AIA Group Limited (3 Month LIBOR +0.52%) 144A± | | | 3.31 | | | | 9-20-2021 | | | | 3,680,000 | | | | 3,675,871 | |
| | | | | | | | | | | | | | | | |
| | | | |
Industrials: 1.48% | | | | | | | | | | | | | | | | |
| | | | |
| Electrical Equipment: 1.48% | | | | | | | | | | | | | | | | |
| | | | |
Tyco Electronics Group SA (3 Month LIBOR +0.45%) ± | | | 3.20 | | | | 6-5-2020 | | | | 4,900,000 | | | | 4,897,000 | |
| | | | | | | | | | | | | | | | |
| | | | |
Total Yankee Corporate Bonds and Notes (Cost $62,824,609) | | | | | | | | | | | | | | | 62,814,989 | |
| | | | | | | | | | | | | | | | |
The accompanying notes are an integral part of these financial statements.
| | | | |
| 12 | | Wells Fargo Conservative Income Fund | | Portfolio of investments—February 28, 2019 (unaudited) |
| | | | | | | | | | | | | | | | |
| Security name | | Interest rate | | | Maturity date | | | Principal | | | Value | |
| | | | |
Yankee Government Bonds: 1.21% | | | | | | | | | | | | | | | | |
| | | | |
Export-Import Bank of Korea (3 Month LIBOR +0.70%) ± | | | 3.35 | % | | | 5-26-2019 | | | $ | 4,000,000 | | | $ | 4,004,880 | |
| | | | | | | | | | | | | | | | |
| | | | |
Total Yankee Government Bonds (Cost $4,000,000) | | | | | | | | | | | | | | | 4,004,880 | |
| | | | | | | | | | | | | | | | |
| | | | |
Short-Term Investments: 25.82% | | | | | | | | | | | | | | | | |
| | | | |
| Commercial Paper: 25.79% | | | | | | | | | | | | | | | | |
| | | | |
Anglesea Funding plc 144A(p)(z) | | | 2.65 | | | | 7-1-2019 | | | | 2,000,000 | | | | 1,982,076 | |
| | | | |
Atlantic Asset Securitization LLC 144A(z) | | | 2.06 | | | | 3-4-2019 | | | | 5,000,000 | | | | 4,998,648 | |
| | | | |
Charta LLC 144A(p)(z) | | | 2.73 | | | | 3-25-2019 | | | | 900,000 | | | | 898,458 | |
| | | | |
Charta LLC 144A(p)(z) | | | 2.76 | | | | 4-3-2019 | | | | 6,000,000 | | | | 5,985,896 | |
| | | | |
Coca-Cola Company 144A(z) | | | 2.50 | | | | 5-20-2019 | | | | 1,500,000 | | | | 1,491,468 | |
| | | | |
Coca-Cola Company 144A(z) | | | 2.86 | | | | 10-24-2019 | | | | 2,100,000 | | | | 2,062,820 | |
| | | | |
Grand China Air Limited (z) | | | 2.80 | | | | 3-8-2019 | | | | 1,000,000 | | | | 999,457 | |
| | | | |
Great Bridge Capital Company LLC 144A(p)(z) | | | 2.82 | | | | 5-1-2019 | | | | 6,000,000 | | | | 5,972,854 | |
| | | | |
Institutional Secured Funding LLC 144A(p)(z) | | | 2.70 | | | | 4-25-2019 | | | | 9,500,000 | | | | 9,462,449 | |
| | | | |
La Fayette Asset Securitization LLC 144A(p)(z) | | | 2.63 | | | | 3-13-2019 | | | | 7,000,000 | | | | 6,993,794 | |
| | | | |
Liberty Funding LLC 144A(z) | | | 0.00 | | | | 3-1-2019 | | | | 5,000,000 | | | | 4,999,663 | |
| | | | |
LMA Americas LLC (p)(z) | | | 2.77 | | | | 3-27-2019 | | | | 5,500,000 | | | | 5,489,869 | |
| | | | |
Macquarie Bank Limited 144A(z) | | | 0.00 | | | | 3-1-2019 | | | | 5,000,000 | | | | 4,999,664 | |
| | | | |
Mont Blanc Capital Corporation 144A(z) | | | 2.25 | | | | 3-5-2019 | | | | 6,000,000 | | | | 5,997,971 | |
| | | | |
Mountcliff Funding 144A(p)(z) | | | 2.65 | | | | 3-14-2019 | | | | 8,000,000 | | | | 7,992,353 | |
| | | | |
Old Line Funding LLC 144A(p)(z) | | | 2.84 | | | | 5-2-2019 | | | | 2,500,000 | | | | 2,488,927 | |
| | | | |
Ontario Teacher’s Finance Trust 144A(z) | | | 2.69 | | | | 8-8-2019 | | | | 2,000,000 | | | | 1,976,888 | |
| | | | |
Ontario Teachers’ Finance Trust 144A(z) | | | 2.75 | | | | 4-29-2019 | | | | 3,150,000 | | | | 3,136,980 | |
| | | | |
Suncorp Group Limited 144A(z) | | | 2.92 | | | | 6-13-2019 | | | | 2,500,000 | | | | 2,479,944 | |
| | | | |
Toyota Motor Credit Corporation (z) | | | 2.54 | | | | 3-13-2019 | | | | 5,000,000 | | | | 4,995,800 | |
| | | | |
| | | | | | | | | | | | | | | 85,405,979 | |
| | | | | | | | | | | | | | | | |
| | | | |
| | | Yield | | | | | | Shares | | | | |
| Investment Companies: 0.03% | | | | | | | | | | | | | | | | |
| | | | |
Wells Fargo Government Money Market Fund Select Class (l)(u) | | | 2.34 | | | | | | | | 93,297 | | | | 93,297 | |
| | | | | | | | | | | | | | | | |
| | | | |
Total Short-Term Investments (Cost $85,485,733) | | | | | | | | | | | | | | | 85,499,276 | |
| | | | | | | | | | | | | | | | |
| | | | | | | | |
| Total investments in securities (Cost $330,414,351) | | | 99.80 | % | | | 330,472,768 | |
| | |
Other assets and liabilities, net | | | 0.20 | | | | 672,474 | |
| | | | | | | | |
| Total net assets | | | 100.00 | % | | $ | 331,145,242 | |
| | | | | | | | |
| 144A | The security may be resold in transactions exempt from registration, normally to qualified institutional buyers, pursuant to Rule 144A under the Securities Act of 1933. |
| ± | Variable rate investment. The rate shown is the rate in effect at period end. |
| ø | Variable rate demand notes are subject to a demand feature which reduces the effective maturity. The maturity date shown represents the final maturity date of the security. The interest rate is determined and reset by the issuer daily, weekly, or monthly depending upon the terms of the security. The rate shown is the rate in effect at period end. |
| (p) | Asset-backed commercial paper |
| (z) | Zero coupon security. The rate represents the purchase yield to maturity. |
| (l) | The issuer of the security is an affiliated person of the Fund as defined in the Investment Company Act of 1940. |
| (u) | The rate represents the 7-day annualized yield at period end. |
Abbreviations:
| LIBOR | London Interbank Offered Rate |
The accompanying notes are an integral part of these financial statements.
| | | | | | |
| Portfolio of investments—February 28, 2019 (unaudited) | | Wells Fargo Conservative Income Fund | | | 13 | |
Investments in Affiliates
An affiliated investment is an investment in which the Fund owns at least 5% of the outstanding voting shares of the issuer or as a result of other relationships, such as the Fund and the issuer having the same investment manager. Transactions with issuers that were either affiliated persons of the Fund at the beginning of the period or the end of the period were as follows:
| | | | | | | | | | | | | | | | | | | | | | | | | | | | | | | | | | | | |
| | | Shares,
beginning of
period | | | Shares
purchased | | | Shares
sold | | | Shares,
end of
period | | | Net
realized
gains
(losses) | | | Net
change in
unrealized
gains
(losses) | | | Income
from
affiliated
securities | | | Value,
end
of period | | | % of
net
assets | |
Short-Term Investments | | | | | | | | | | | | | | | | | | | | | | | | | | | | | | | | | | | | |
Investment Companies | | | | | | | | | | | | | | | | | | | | | | | | | | | | | | | | | | | | |
Wells Fargo Government Money Market Fund Select Class | | | 96,943 | | | | 115,341,521 | | | | 115,345,167 | | | | 93,297 | | | $ | 0 | | | $ | 0 | | | $ | 19,564 | | | $ | 93,297 | | | | 0.03 | % |
The accompanying notes are an integral part of these financial statements.
| | | | |
| 14 | | Wells Fargo Conservative Income Fund | | Statement of assets and liabilities—February 28, 2019 (unaudited) |
| | | | |
| | | | |
| |
Assets | | | | |
Investments in unaffiliated securities, at value (cost $330,321,054) | | $ | 330,379,471 | |
Investments in affiliated securities, at value (cost $93,297) | | | 93,297 | |
Receivable for interest | | | 825,339 | |
Receivable for Fund shares sold | | | 555 | |
Prepaid expenses and other assets | | | 36,974 | |
| | | | |
Total assets | | | 331,335,636 | |
| | | | |
| |
Liabilities | | | | |
Dividends payable | | | 76,345 | |
Management fee payable | | | 33,244 | |
Administration fee payable | | | 19,951 | |
Payable for Fund shares redeemed | | | 19,656 | |
Custodian and accounting fees payable | | | 19,307 | |
Professional fees payable | | | 15,304 | |
Trustees’ fees and expenses payable | | | 2,668 | |
Accrued expenses and other liabilities | | | 3,919 | |
| | | | |
Total liabilities | | | 190,394 | |
| | | | |
Total net assets | | $ | 331,145,242 | |
| | | | |
| |
NET ASSETS CONSIST OF | | | | |
Paid-in capital | | $ | 332,966,334 | |
Total distributable loss | | | (1,821,092 | ) |
| | | | |
Total net assets | | $ | 331,145,242 | |
| | | | |
| |
COMPUTATION OF NET ASSET VALUE PER SHARE | | | | |
Net assets – Institutional Class | | $ | 331,145,242 | |
Shares outstanding – Institutional Class1 | | | 33,188,178 | |
Net asset value per share – Institutional Class | | | $9.98 | |
| 1 | The Fund has an unlimited number of authorized shares. |
The accompanying notes are an integral part of these financial statements.
| | | | | | |
| Statement of operations—six months ended February 28, 2019 (unaudited) | | Wells Fargo Conservative Income Fund | | | 15 | |
| | | | |
| | | | |
| |
Investment income | | | | |
Interest | | $ | 6,896,091 | |
Income from affiliated securities | | | 19,564 | |
| | | | |
Total investment income | | | 6,915,655 | |
| | | | |
| |
Expenses | | | | |
Management fee | | | 622,497 | |
Administration fee | | | | |
Institutional Class | | | 199,199 | |
Custody and accounting fees | | | 14,238 | |
Professional fees | | | 21,194 | |
Registration fees | | | 31,387 | |
Shareholder report expenses | | | 7,314 | |
Trustees’ fees and expenses | | | 10,728 | |
Other fees and expenses | | | 5,023 | |
| | | | |
Total expenses | | | 911,580 | |
Less: Fee waivers and/or expense reimbursements | | | (239,284 | ) |
| | | | |
Net expenses | | | 672,296 | |
| | | | |
Net investment income | | | 6,243,359 | |
| | | | |
| |
REALIZED AND UNREALIZED GAINS (LOSSES) ON INVESTMENTS | | | | |
Net realized losses on investments | | | (1,092,825 | ) |
Net change in unrealized gains (losses) on investments | | | (310,461 | ) |
| | | | |
Net realized and unrealized gains (losses) on investments | | | (1,403,286 | ) |
| | | | |
Net increase in net assets resulting from operations | | $ | 4,840,073 | |
| | | | |
The accompanying notes are an integral part of these financial statements.
| | | | |
| 16 | | Wells Fargo Conservative Income Fund | | Statement of changes in net assets |
| | | | | | | | | | | | | | | | |
| | | Six months ended
February 28, 2019
(unaudited) | | | Year ended
August 31, 20181 | |
| | | | |
Operations | | | | | | | | | | | | | | | | |
Net investment income | | | | | | $ | 6,243,359 | | | | | | | $ | 8,442,895 | |
Net realized losses on investments | | | | | | | (1,092,825 | ) | | | | | | | (776,935 | ) |
Net change in unrealized gains (losses) on investments | | | | | | | (310,461 | ) | | | | | | | (313,636 | ) |
| | | | |
Net increase in net assets resulting from operations | | | | | | | 4,840,073 | | | | | | | | 7,352,324 | |
| | | | |
| | | | |
Distributions to shareholders from net investment income and net realized gains | | | | | | | | | | | | | | | | |
Institutional Class | | | | | | | (6,257,292 | ) | | | | | | | (8,591,551 | ) |
| | | | |
| | | | |
Capital share transactions | | | Shares | | | | | | | | Shares | | | | | |
Proceeds from shares sold – Institutional Class | | | 41,638,996 | | | | 415,837,869 | | | | 50,241,480 | | | | 502,485,302 | |
Reinvestment of distributions – Institutional Class | | | 414,484 | | | | 4,134,435 | | | | 739,437 | | | | 7,389,754 | |
Payment for shares redeemed – Institutional Class | | | (48,898,945 | ) | | | (487,412,201 | ) | | | (52,808,731 | ) | | | (527,872,511 | ) |
| | | | |
Net decrease in net assets resulting from capital share transactions | | | | | | | (67,439,897 | ) | | | | | | | (17,997,455 | ) |
| | | | |
Total decrease in net assets | | | | | | | (68,857,116 | ) | | | | | | | (19,236,682 | ) |
| | | | |
| | | | |
Net assets | | | | | | | | | | | | | | | | |
Beginning of period | | | | | | | 400,002,358 | | | | | | | | 419,239,040 | |
| | | | |
End of period | | | | | | $ | 331,145,242 | | | | | | | $ | 400,002,358 | |
| | | | |
| 1 | Effective for all filings after November 4, 2018, the SEC prospectively eliminated the requirement to parenthetically disclose undistributed net investment income at the end of the period and permitted the aggregation of distributions, with the exception of tax basis returns of capital. Undistributed net investment income at August 31, 2018 was $4,184. The disaggregated distributions information for the year ended August 31, 2018 is included in Note 7,Distributions to Shareholders,in the notes to the financial statements. |
The accompanying notes are an integral part of these financial statements.
| | | | | | |
| Financial highlights | | Wells Fargo Conservative Income Fund | | | 17 | |
(For a share outstanding throughout each period)
| | | | | | | | | | | | | | | | | | | | | | | | |
| | | Six months ended
February 28, 2019 (unaudited) | | | Year ended August 31 | |
| INSTITUTIONAL CLASS | | 2018 | | | 2017 | | | 2016 | | | 2015 | | | 2014 | |
Net asset value, beginning of period | | | $9.99 | | | | $10.01 | | | | $10.01 | | | | $10.00 | | | | $10.02 | | | | $9.99 | |
Net investment income | | | 0.13 | | | | 0.18 | | | | 0.12 | | | | 0.07 | | | | 0.05 | | | | 0.04 | |
Net realized and unrealized gains (losses) on investments | | | (0.02 | ) | | | (0.02 | ) | | | 0.00 | 1 | | | 0.01 | | | | (0.02 | ) | | | 0.03 | |
| | | | | | | | | | | | | | | | | | | | | | | | |
Total from investment operations | | | 0.11 | | | | 0.16 | | | | 0.12 | | | | 0.08 | | | | 0.03 | | | | 0.07 | |
Distributions to shareholders from | | | | | | | | | | | | | | | | | | | | | | | | |
Net investment income | | | (0.12 | ) | | | (0.18 | ) | | | (0.12 | ) | | | (0.07 | ) | | | (0.05 | ) | | | (0.04 | ) |
Net realized gains | | | 0.00 | | | | (0.00 | )1 | | | 0.00 | | | | 0.00 | | | | (0.00 | )1 | | | (0.00 | )1 |
| | | | | | | | | | | | | | | | | | | | | | | | |
Total distributions to shareholders | | | (0.12 | ) | | | (0.18 | ) | | | (0.12 | ) | | | (0.07 | ) | | | (0.05 | ) | | | (0.04 | ) |
Net asset value, end of period | | | $9.98 | | | | $9.99 | | | | $10.01 | | | | $10.01 | | | | $10.00 | | | | $10.02 | |
Total return2 | | | 1.18 | % | | | 1.65 | % | | | 1.20 | % | | | 0.79 | % | | | 0.28 | % | | | 0.74 | % |
Ratios to average net assets (annualized) | | | | | | | | | | | | | | | | | | | | | | | | |
Gross expenses | | | 0.37 | % | | | 0.37 | % | | | 0.36 | % | | | 0.36 | % | | | 0.38 | % | | | 0.43 | % |
Net expenses | | | 0.27 | % | | | 0.27 | % | | | 0.27 | % | | | 0.27 | % | | | 0.27 | % | | | 0.27 | % |
Net investment income | | | 2.50 | % | | | 1.79 | % | | | 1.17 | % | | | 0.72 | % | | | 0.48 | % | | | 0.44 | % |
Supplemental data | | | | | | | | | | | | | | | | | | | | | | | | |
Portfolio turnover rate | | | 112 | % | | | 197 | % | | | 197 | % | | | 269 | % | | | 80 | % | | | 55 | % |
Net assets, end of period (000s omitted) | | | $331,145 | | | | $400,002 | | | | $419,239 | | | | $547,829 | | | | $336,608 | | | | $143,418 | |
| 1 | Amount is less than $0.005. |
| 2 | Returns for periods of less than one year are not annualized. |
The accompanying notes are an integral part of these financial statements.
| | | | |
| 18 | | Wells Fargo Conservative Income Fund | | Notes to financial statements (unaudited) |
1. ORGANIZATION
Wells Fargo Funds Trust (the “Trust”), a Delaware statutory trust organized on March 10, 1999, is an open-end management investment company registered under the Investment Company Act of 1940, as amended (the “1940 Act”). As an investment company, the Trust follows the accounting and reporting guidance in Financial Accounting Standards Board (“FASB”) Accounting Standards Codification Topic 946, Financial Services – Investment Companies. These financial statements report on the Wells Fargo Conservative Income Fund (the “Fund”) which is a diversified series of the Trust.
2. SIGNIFICANT ACCOUNTING POLICIES
The following significant accounting policies, which are consistently followed in the preparation of the financial statements of the Fund, are in conformity with U.S. generally accepted accounting principles which require management to make estimates and assumptions that affect the reported amounts of assets and liabilities, disclosure of contingent assets and liabilities at the date of the financial statements, and the reported amounts of revenues and expenses during the reporting period. Actual results could differ from those estimates.
Securities valuation
All investments are valued each business day as of the close of regular trading on the New York Stock Exchange (generally 4 p.m. Eastern Time), although the Fund may deviate from this calculation time under unusual or unexpected circumstances.
Debt securities are valued at the evaluated bid price provided by an independent pricing service (e.g. taking into account various factors, including yields, maturities, or credit ratings) or, if a reliable price is not available, the quoted bid price from an independent broker-dealer.
Investments in registered open-end investment companies are valued at net asset value.
Investments which are not valued using any of the methods discussed above are valued at their fair value, as determined in good faith by the Board of Trustees of the Fund. The Board of Trustees has established a Valuation Committee comprised of the Trustees and has delegated to it the authority to take any actions regarding the valuation of portfolio securities that the Valuation Committee deems necessary or appropriate, including determining the fair value of portfolio securities, unless the determination has been delegated to the Wells Fargo Asset Management Pricing Committee at Wells Fargo Funds Management, LLC (“Funds Management”). The Board of Trustees retains the authority to make or ratify any valuation decisions or approve any changes to the Valuation Procedures as it deems appropriate. On a quarterly basis, the Board of Trustees receives reports on any valuation actions taken by the Valuation Committee or the Wells Fargo Asset Management Pricing Committee which may include items for ratification.
Security transactions and income recognition
Securities transactions are recorded on a trade date basis. Realized gains or losses are recorded on the basis of identified cost.
Interest income is accrued daily and bond discounts are accreted and premiums are amortized daily. To the extent debt obligations are placed on non-accrual status, any related interest income may be reduced by writing off interest receivables when the collection of all or a portion of interest has been determined to be doubtful based on consistently applied procedures and the fair value has decreased. If the issuer subsequently resumes interest payments or when the collectability of interest is reasonably assured, the debt obligation is removed from non-accrual status.
Distributions to shareholders
Distributions to shareholders from net investment income are declared daily and paid monthly. Distributions from net realized gains, if any, are recorded on the ex-dividend date and paid at least annually. Such distributions are determined in accordance with income tax regulations and may differ from U.S. generally accepted accounting principles. Dividend sources are estimated at the time of declaration. The tax character of distributions is determined as of the Fund’s fiscal year end. Therefore, a portion of the Fund’s distributions made prior to the Fund’s fiscal year end may be categorized as a tax return of capital at year end.
Federal and other taxes
The Fund intends to qualify as a regulated investment company by distributing substantially all of its investment company taxable income and any net realized capital gains (after reduction for capital loss carryforwards) sufficient to relieve it from all, or substantially all, federal income taxes. Accordingly, no provision for federal income taxes was required.
| | | | | | |
| Notes to financial statements (unaudited) | | Wells Fargo Conservative Income Fund | | | 19 | |
The Fund’s income and federal excise tax returns and all financial records supporting those returns for the prior three fiscal years are subject to examination by the federal and Delaware revenue authorities. Management has analyzed the Fund’s tax positions taken on federal, state, and foreign tax returns for all open tax years and does not believe that there are any uncertain tax positions that require recognition of a tax liability.
As of February 28, 2019, the aggregate cost of all investments for federal income tax purposes was $330,419,095 and the unrealized gains (losses) consisted of:
| | | | |
| |
Gross unrealized gains | | $ | 213,480 | |
| |
Gross unrealized losses | | | (159,807 | ) |
| |
Net unrealized gains | | $ | 53,673 | |
As of August 31, 2018, the Fund had a capital loss carryforward which consisted of $772,191 in short-term capital losses.
3. FAIR VALUATION MEASUREMENTS
Fair value measurements of investments are determined within a framework that has established a fair value hierarchy based upon the various data inputs utilized in determining the value of the Fund’s investments. The three-level hierarchy gives the highest priority to unadjusted quoted prices in active markets for identical assets or liabilities (Level 1) and the lowest priority to unobservable inputs (Level 3). The Fund’s investments are classified within the fair value hierarchy based on the lowest level of input that is significant to the fair value measurement. The inputs are summarized into three broad levels as follows:
| ∎ | | Level 1 – quoted prices in active markets for identical securities |
| ∎ | | Level 2 – other significant observable inputs (including quoted prices for similar securities, interest rates, prepayment speeds, credit risk, etc.) |
| ∎ | | Level 3 – significant unobservable inputs (including the Fund’s own assumptions in determining the fair value of investments) |
The inputs or methodologies used for valuing investments in securities are not necessarily an indication of the risk associated with investing in those securities.
The following is a summary of the inputs used in valuing the Fund’s assets and liabilities as of February 28, 2019:
| | | | | | | | | | | | | | | | |
| | | | |
| | | Quoted prices
(Level 1) | | | Other significant
observable inputs
(Level 2) | | | Significant
unobservable inputs (Level 3) | | | Total | |
| | | | |
Assets | | | | | | | | | | | | | | | | |
Investments in: | | | | | | | | | | | | | | | | |
| | | | |
Asset-backed securities | �� | $ | 0 | | | $ | 79,648,180 | | | $ | 0 | | | $ | 79,648,180 | |
| | | | |
Certificates of deposit | | | 0 | | | | 6,003,259 | | | | 0 | | | | 6,003,259 | |
| | | | |
Corporate bonds and notes | | | 0 | | | | 86,202,184 | | | | 0 | | | | 86,202,184 | |
| | | | |
Municipal obligations | | | 0 | | | | 6,300,000 | | | | 0 | | | | 6,300,000 | |
| | | | |
Yankee corporate bonds and notes | | | 0 | | | | 62,814,989 | | | | 0 | | | | 62,814,989 | |
| | | | |
Yankee government bonds | | | 0 | | | | 4,004,880 | | | | 0 | | | | 4,004,880 | |
| | | | |
Short-term investments | | | | | | | | | | | | | | | | |
| | | | |
Commercial paper | | | 0 | | | | 85,405,979 | | | | 0 | | | | 85,405,979 | |
| | | | |
Investment companies | | | 93,297 | | | | 0 | | | | 0 | | | | 93,297 | |
| | | | |
Total assets | | $ | 93,297 | | | $ | 330,379,471 | | | $ | 0 | | | $ | 330,472,768 | |
Additional sector, industry or geographic detail is included in the Portfolio of investments.
At February 28, 2019, the Fund did not have any transfers into/out of Level 3.
| | | | |
| 20 | | Wells Fargo Conservative Income Fund | | Notes to financial statements (unaudited) |
4. TRANSACTIONS WITH AFFILIATES
Management fee
Funds Management, an indirect wholly owned subsidiary of Wells Fargo & Company (“Wells Fargo”), is the manager of the Fund and provides advisory and fund-level administrative services under an investment management agreement. Under the investment management agreement, Funds Management is responsible for, among other services, implementing the investment objectives and strategies of the Fund, supervising the subadviser and providing fund-level administrative services in connection with the Fund’s operations. As compensation for its services under the investment management agreement, Funds Management is entitled to receive a management fee at the following annual rate based on the Fund’s average daily net assets:
| | | | |
| Average daily net assets | | Annual fee rate | |
| |
First $1 billion | | | 0.250 | % |
| |
Next $4 billion | | | 0.225 | |
| |
Next $5 billion | | | 0.190 | |
| |
Over $10 billion | | | 0.180 | |
For the six months ended February 28, 2019, the management fee was equivalent to an annual rate of 0.25% of the Fund’s average daily net assets.
Funds Management has retained the services of a subadviser to provide daily portfolio management to the Fund. The fee for subadvisory services is borne by Funds Management. Wells Capital Management Incorporated, an affiliate of Funds Management and an indirect wholly owned subsidiary of Wells Fargo, is the subadviser to the Fund and is entitled to receive a fee from Funds Management at an annual rate starting at 0.10% and declining to 0.05% as the average daily net assets of the Fund increase.
Administration fee
Under a class-level administration agreement, Funds Management provides class-level administrative services to the Fund, which includes paying fees and expenses for services provided by the transfer agent, sub-transfer agents, omnibus account servicers and record-keepers. As compensation for its services under the class-level administration agreement, Funds Management receives an annual fee of 0.08% which is calculated based on the average daily net assets of the Institutional Class.
Funds Management has contractually waived and/or reimbursed management and administration fees to the extent necessary to maintain certain net operating expense ratios for the Fund. Funds Management has committed through December 31, 2019 to waive fees and/or reimburse expenses to the extent necessary to cap the Fund’s expenses at 0.27% for Institutional Class shares. Prior to or after the commitment expiration date, the cap may be increased or the commitment to maintain the cap may be terminated only with the approval of the Board of Trustees.
Interfund transactions
The Fund may purchase or sell portfolio investment securities to certain other Wells Fargo affiliates pursuant to Rule 17a-7 under the 1940 Act and under procedures adopted by the Board of Trustees. The procedures have been designed to ensure that these interfund transactions, which do not incur broker commissions, are effected at current market prices.
5. INVESTMENT PORTFOLIO TRANSACTIONS
Purchases and sales of investments, excluding U.S. government obligations (if any) and short-term securities, for the six months ended February 28, 2019 were $366,393,329 and $369,780,470, respectively.
6. BANK BORROWINGS
The Trust (excluding the money market funds), Wells Fargo Master Trust and Wells Fargo Variable Trust are parties to a $280,000,000 revolving credit agreement whereby the Fund is permitted to use bank borrowings for temporary or emergency purposes, such as to fund shareholder redemption requests. Interest under the credit agreement is charged to the Fund based on a borrowing rate equal to the higher of the Federal Funds rate in effect on that day plus 1.25% or the overnight LIBOR rate in effect on that day plus 1.25%. In addition, an annual commitment fee equal to 0.25% of the unused balance is allocated to each participating fund.
| | | | | | |
| Notes to financial statements (unaudited) | | Wells Fargo Conservative Income Fund | | | 21 | |
For the six months ended February 28, 2019, there were no borrowings by the Fund under the agreement.
7. DISTRIBUTIONS TO SHAREHOLDERS
Effective for all filings after November 4, 2018, the Securities and Exchange Commission eliminated the requirement to separately state the components of distributions to shareholders under U.S. generally accepted accounting principles. The amounts of distributions to shareholders for the year ended August 31, 2018 were as follows:
| | | | | | | | |
| | | Net investment
income | | | Net realized
gains | |
| | |
Institutional Class | | | 8,443,388 | | | | 148,163 | |
8. INDEMNIFICATION
Under the Trust’s organizational documents, the officers and Trustees have been granted certain indemnification rights against certain liabilities that may arise out of performance of their duties to the Trust. Additionally, in the normal course of business, the Trust may enter into contracts with service providers that contain a variety of indemnification clauses. The Trust’s maximum exposure under these arrangements is dependent on future claims that may be made against the Fund and, therefore, cannot be estimated.
9. NEW ACCOUNTING PRONOUNCEMENTS
In August 2018, FASB issued Accounting Standards Update (“ASU”) No. 2018-13, Fair Value Measurement (Topic 820)Disclosure Framework—Changes to the Disclosure Requirements for Fair Value Measurement. ASU 2018-13 updates the disclosure requirements for fair value measurements by modifying or removing certain disclosures and adding certain new disclosures. The amendments are effective for fiscal years, and interim periods within those fiscal years, beginning after December 15, 2019. Early adoption is permitted. Management has adopted the removal and modification of disclosures early, as permitted, and will adopt the additional new disclosures at the effective date.
In March 2017, FASB issued ASU No. 2017-08,Premium Amortization on Purchased Callable Debt Securities. ASU 2017-08 shortens the amortization period for certain callable debt securities held at a premium. The amendments require the premium to be amortized to the earliest call date. The amendments do not require an accounting change for securities held at a discount; the discount continues to be amortized to maturity. ASU 2017-08 is effective for fiscal years beginning after December 15, 2018 and for interim periods within those fiscal years. Management is currently evaluating the potential impact of this new guidance to the financial statements.
| | | | |
| 22 | | Wells Fargo Conservative Income Fund | | Other information (unaudited) |
PROXY VOTING INFORMATION
A description of the policies and procedures used to determine how to vote proxies relating to portfolio securities is available, upon request, by calling1-800-222-8222, visiting our website atwfam.com, or visiting the SEC website at sec.gov. Information regarding how the Fund voted proxies relating to portfolio securities during the most recent12-month period ended June 30 is available on the Fund’s website atwfam.comor by visiting the SEC website at sec.gov.
PORTFOLIO HOLDINGS INFORMATION
The complete portfolio holdings for the Fund are publicly available monthly on the Fund’s website (wfam.com), on a one-month delayed basis. In addition, top ten holdings information (excluding derivative positions) for the Fund is publicly available on the Fund’s website on a monthly, seven-day or more delayed basis. The Fund files its complete schedule of portfolio holdings with the SEC for the first and third quarters of each fiscal year on Form N-Q, which is available by visiting the SEC website at sec.gov. In addition, the Fund’s Form N-Q may be reviewed and copied at the SEC’s Public Reference Room in Washington, DC, and at regional offices in New York City, at 233 Broadway, and in Chicago, at 175 West Jackson Boulevard, Suite 900. Information about the Public Reference Room may be obtained by calling1-800-SEC-0330.
| | | | | | |
| Other information (unaudited) | | Wells Fargo Conservative Income Fund | | | 23 | |
BOARD OF TRUSTEES AND OFFICERS
Each of the Trustees and Officers1 listed in the table below acts in identical capacities for each fund in the Wells Fargo family of funds, which consists of 152 mutual funds comprising the Wells Fargo Funds Trust, Wells Fargo Variable Trust, Wells Fargo Master Trust and four closed-end funds (collectively the “Fund Complex”). This table should be read in conjunction with the Prospectus and the Statement of Additional Information2. The mailing address of each Trustee and Officer is 525 Market Street, 12th Floor, San Francisco, CA 94105. Each Trustee and Officer serves an indefinite term, however, each Trustee serves such term until reaching the mandatory retirement age established by the Trustees.
Independent Trustees
| | | | | | |
Name and year of birth | | Position held and length of service* | | Principal occupations during past five years or longer | | Current other
public company or investment company
directorships |
| | | |
William R. Ebsworth (Born 1957) | | Trustee, since 2015 | | Retired. From 1984 to 2013, equities analyst, portfolio manager, research director and chief investment officer at Fidelity Management and Research Company in Boston, Tokyo, and Hong Kong, and retired in 2013 as Chief Investment Officer of Fidelity Strategic Advisers, Inc. where he led a team of investment professionals managing client assets. Prior thereto, Board member of Hong Kong Securities Clearing Co., Hong Kong Options Clearing Corp., the Thailand International Fund, Ltd., Fidelity Investments Life Insurance Company, and Empire Fidelity Investments Life Insurance Company. Board member of the Vincent Memorial Hospital Endowment (non-profit organization), where he serves on the Investment Committee and as a Chair of the Audit Committee. Mr. Ebsworth is a CFA® charterholder. | | N/A |
| | | |
Jane A. Freeman (Born 1953) | | Trustee, since 2015; Chair Liaison, since 2018 | | Retired. From 2012 to 2014 and 1999 to 2008, Chief Financial Officer of Scientific Learning Corporation. From 2008 to 2012, Ms. Freeman provided consulting services related to strategic business projects. Prior to 1999, Portfolio Manager at Rockefeller & Co. and Scudder, Stevens & Clark. Board member of the Harding Loevner Funds from 1996 to 2014, serving as both Lead Independent Director and chair of the Audit Committee. Board member of the Russell Exchange Traded Funds Trust from 2011 to 2012 and the chair of the Audit Committee. Ms. Freeman is a Board Member of The Ruth Bancroft Garden (non-profit organization). She is also an inactive Chartered Financial Analyst. | | N/A |
| | | |
Isaiah Harris, Jr.3 (Born 1952) | | Trustee, since 2009; Audit Committee Chairman, since 2019 | | Retired. Chairman of the Board of CIGNA Corporation since 2009, and Director since 2005. From 2003 to 2011, Director of Deluxe Corporation. Prior thereto, President and CEO of BellSouth Advertising and Publishing Corp. from 2005 to 2007, President and CEO of BellSouth Enterprises from 2004 to 2005 and President of BellSouth Consumer Services from 2000 to 2003. Emeritus member of the Iowa State University Foundation Board of Governors. Emeritus Member of the Advisory Board of Iowa State University School of Business. Advisory Board Member, Palm Harbor Academy (private school). Advisory Board Member, Child Evangelism Fellowship (non-profit). Mr. Harris is a certified public accountant (inactive status). | | CIGNA Corporation |
| | | |
Judith M. Johnson3 (Born 1949) | | Trustee, since 2008; Audit Committee Chairman, from 2009 to 2018 | | Retired. Prior thereto, Chief Executive Officer and Chief Investment Officer of Minneapolis Employees Retirement Fund from 1996 to 2008. Ms. Johnson is an attorney, certified public accountant and a certified managerial accountant. | | N/A |
| | | |
David F. Larcker (Born 1950) | | Trustee, since 2009 | | James Irvin Miller Professor of Accounting at the Graduate School of Business, Stanford University, Director of the Corporate Governance Research Initiative and Senior Faculty of The Rock Center for Corporate Governance since 2006. From 2005 to 2008, Professor of Accounting at the Graduate School of Business, Stanford University. Prior thereto, Ernst & Young Professor of Accounting at The Wharton School, University of Pennsylvania from 1985 to 2005. | | N/A |
| | | | |
| 24 | | Wells Fargo Conservative Income Fund | | Other information (unaudited) |
| | | | | | |
Name and year of birth | | Position held and length of service* | | Principal occupations during past five years or longer | | Current other
public company or investment company
directorships |
| | | |
Olivia S. Mitchell (Born 1953) | | Trustee, since 2006; Nominating and Governance Committee Chairman, since 2018 | | International Foundation of Employee Benefit Plans Professor, Wharton School of the University of Pennsylvania since 1993. Director of Wharton’s Pension Research Council and Boettner Center on Pensions & Retirement Research, and Research Associate at the National Bureau of Economic Research. Previously, Cornell University Professor from 1978 to 1993. | | N/A |
| | | |
Timothy J. Penny (Born 1951) | | Trustee, since 1996; Chairman, since 2018 | | President and Chief Executive Officer of Southern Minnesota Initiative Foundation, a non-profit organization, since 2007. Member of the Board of Trustees of NorthStar Education Finance, Inc., a non-profit organization, since 2007. | | N/A |
| | | |
James G. Polisson (Born 1959) | | Trustee, since 2018 | | Retired. Chief Marketing Officer, Source (ETF) UK Services, Ltd, from 2015 to 2017. From 2012 to 2015, Principal of The Polisson Group, LLC, a management consulting, corporate advisory and principal investing company. Chief Executive Officer and Managing Director at Russell Investments, Global Exchange Traded Funds from 2010 to 2012. Managing Director of Barclays Global Investors from 1998 to 2010 and Global Chief Marketing Officer for iShares and Barclays Global Investors from 2000 to 2010. Trustee of the San Francisco Mechanics’ Institute, a non-profit organization, from 2013 to 2015. Board member of the Russell Exchange Traded Fund Trust from 2011 to 2012. Director of Barclays Global Investors Holdings Deutschland GmbH from 2006 to 2009. Mr. Polisson is an attorney and has a retired status with the Massachusetts and District of Columbia Bar Associations. | | N/A |
| | | |
Pamela Wheelock (Born 1959) | | Trustee, since 2018 | | Chief Operating Officer, Twin Cities Habitat for Humanity, since January, 2017. Vice President of University Services, University of Minnesota from 2012 to 2017. Prior thereto, on the Board of Directors, Governance Committee and Finance Committee for the Minnesota Philanthropy Partners (Saint Paul Foundation) from 2012 to 2018, Interim President and Chief Executive Officer of Blue Cross Blue Shield of Minnesota from 2010 to 2011, Chairman of the Board from 2009 to 2011 and Board Director from 2003 to 2015. Vice President, Leadership and Community Engagement, Bush Foundation, Saint Paul, Minnesota (a private foundation) from 2009 to 2011. Executive Vice President and Chief Financial Officer, Minnesota Sports and Entertainment from 2004 to 2009 and Senior Vice President from 2002 to 2004. Commissioner of Finance, State of Minnesota, from 1999 to 2002. Currently the Board Chair of the Minnesota Wild Foundation since 2010. | | N/A |
| * | Length of service dates reflect the Trustee’s commencement of service with the Trust’s predecessor entities, where applicable. |
| | | | | | |
| Other information (unaudited) | | Wells Fargo Conservative Income Fund | | | 25 | |
Officers
| | | | | | |
Name and year of birth | | Position held and
length of service | | Principal occupations during past five years or longer | | |
| | | |
Andrew Owen (Born 1960) | | President, since 2017 | | Executive Vice President of Wells Fargo & Company and Head of Affiliated Managers, Wells Fargo Asset Management, since 2014. In addition, Mr. Owen is currently President, Chief Executive Officer and Director of Wells Fargo Funds Management, LLC since 2017. Prior thereto, Executive Vice President responsible for marketing, investments and product development for Wells Fargo Funds Management, LLC, from 2009 to 2014. | | |
| | | |
Nancy Wiser1 (Born 1967) | | Treasurer, since 2012 | | Executive Vice President of Wells Fargo Funds Management, LLC since 2011. Chief Operating Officer and Chief Compliance Officer at LightBox Capital Management LLC, from 2008 to 2011. | | |
| | | |
Alexander Kymn (Born 1973) | | Secretary and Chief Legal Officer, since 2018 | | Senior Company Counsel of Wells Fargo Bank, N.A. since 2018 (previously Senior Counsel from 2007 to 2018). Vice President of Wells Fargo Funds Management, LLC from 2008 to 2014. | | |
| | | |
| Michael H. Whitaker (Born 1967) | | Chief Compliance Officer, since 2016 | | Senior Vice President and Chief Compliance Officer since 2016. Senior Vice President and Chief Compliance Officer for Fidelity Investments from 2007 to 2016. | | |
| | | |
David Berardi (Born 1975) | | Assistant Treasurer, since 2009 | | Vice President of Wells Fargo Funds Management, LLC since 2009. Vice President of Evergreen Investment Management Company, LLC from 2008 to 2010. Manager of Fund Reporting and Control for Evergreen Investment Management Company, LLC from 2004 to 2010. | | |
| | | |
Jeremy DePalma1 (Born 1974) | | Assistant Treasurer, since 2009 | | Senior Vice President of Wells Fargo Funds Management, LLC since 2009. Senior Vice President of Evergreen Investment Management Company, LLC from 2008 to 2010 and head of the Fund Reporting and Control Team within Fund Administration from 2005 to 2010. | | |
| 1 | Nancy Wiser acts as Treasurer of 76 funds in the Fund Complex. Jeremy DePalma acts as Treasurer of 76 funds and Assistant Treasurer of 76 funds in the Fund Complex. |
| 2 | The Statement of Additional Information includes additional information about the Trustees and is available, without charge, upon request, by calling 1-800-222-8222 or by visiting the website atwfam.com. |
| 3 | Mr. Harris became Chairman of the Audit Committee effective January 1, 2019. |
This page is intentionally left blank.
This page is intentionally left blank.
This page is intentionally left blank.

For more information
More information about Wells Fargo Funds is available free upon request. To obtain literature, please write, visit the Fund’s website, or call:
Wells Fargo Funds
P.O. Box 219967
Kansas City, MO 64121-9967
Website: wfam.com
Individual investors: 1-800-222-8222
Retail investment professionals: 1-888-877-9275
Institutional investment professionals:1-866-765-0778
This report and the financial statements contained herein are submitted for the general information of the shareholders of the Fund. If this report is used for promotional purposes, distribution of the report must be accompanied or preceded by a current prospectus. Before investing, please consider the investment objectives, risks, charges, and expenses of the investment. For a current prospectus and, if available, a summary prospectus, containing this information, call1-800-222-8222 or visit the Fund’s website atwfam.com. Read the prospectus carefully before you invest or send money.
Wells Fargo Asset Management (WFAM) is the trade name for certain investment advisory/management firms owned by Wells Fargo & Company. These firms include but are not limited to Wells Capital Management Incorporated and Wells Fargo Funds Management, LLC. Certain products managed by WFAM entities are distributed by Wells Fargo Funds Distributor, LLC (a broker-dealer and Member FINRA).
This material is for general informational and educational purposes only and is NOT intended to provide investment advice or a recommendation of any kind—including a recommendation for any specific investment, strategy, or plan.
INVESTMENT PRODUCTS: NOT FDIC INSURED ◾ NO BANK GUARANTEE ◾ MAY LOSE VALUE
© 2019 Wells Fargo Funds Management, LLC. All rights reserved.
| | |
 | | 321624 04-19 SA265/SAR265 02-19 |
Not applicable.
| ITEM 3. | AUDIT COMMITTEE FINANCIAL EXPERT |
Not applicable.
| ITEM 4. | PRINCIPAL ACCOUNTANT FEES AND SERVICES |
Not applicable.
| ITEM 5. | AUDIT COMMITTEE OF LISTED REGISTRANTS |
Not applicable.
A Portfolio of Investments for each series of Wells Fargo Funds Trust is included as part of the report to shareholders filed under Item 1 of this Form.
| ITEM 7. | DISCLOSURE OF PROXY VOTING POLICIES AND PROCEDURES FORCLOSED-END MANAGEMENT INVESTMENT COMPANIES |
Not applicable.
| ITEM 8. | PORTFOLIO MANAGERS OFCLOSED-END MANAGEMENT INVESTMENT COMPANIES |
Not applicable.
| ITEM 9. | PURCHASES OF EQUITY SECURITIES BYCLOSED-END MANAGEMENT INVESTMENT COMPANY AND AFFILIATED PURCHASERS |
Not applicable.
| ITEM 10. | SUBMISSION OF MATTERS TO A VOTE OF SECURITY HOLDERS |
There have been no material changes to the procedures by which shareholders may recommend nominees to the registrant’s Board of Trustees that have been implemented since the registrant’s last provided disclosure in response to the requirements of this Item.
| ITEM 11. | CONTROLS AND PROCEDURES |
(a) The President and Treasurer have concluded that the Wells Fargo Funds Trust (the “Trust”) disclosure controls and procedures (as defined in Rule30a-3(c) under the Investment Company Act of 1940) provide reasonable assurances that material information relating to the Trust is made known to them by the appropriate persons, based on their evaluation of these controls and procedures as of a date within 90 days of the filing of this report.
(b) There were no significant changes in the Trust’s internal controls over financial reporting (as defined in Rule30a-3(d) under the Investment Company Act of 1940) that occurred during the second fiscal quarter of the period covered by this report that materially affected, or is reasonably likely to materially affect, the registrant’s internal control over financial reporting.
| ITEM 12. | DISCLOSURES OF SECURITIES LENDING ACTIVITIES FORCLOSED-END MANAGEMENT INVESTMENT COMPANIES |
Not applicable.
(a)(1) Not applicable.
(a)(2) Certification pursuant to Rule30a-2(a) under the Investment Company Act of 1940 (17 CFR270.30a-2(a)) is filed and attached hereto as Exhibit 99.CERT.
(a)(3) Not applicable.
(b) Certification pursuant to Rule30a-2(b) under the Investment Company Act of 1940 (17 CFR270.30a-2(b)) is filed and attached hereto as Exhibit 99.906CERT.
SIGNATURES
Pursuant to the requirements of the Securities Exchange Act of 1934 and the Investment Company Act of 1940, the registrant has duly caused this report to be signed on its behalf by the undersigned, thereunto duly authorized.
| | |
Wells Fargo Funds Trust |
| |
| By: | | |
| | /s/ Andrew Owen |
| |
| | Andrew Owen |
| | President |
|
| Date: April 26, 2019 |
Pursuant to the requirements of the Securities Exchange Act of 1934 and the Investment Company Act of 1940, this report has been signed below by the following persons on behalf of the registrant and in the capacities and on the date indicated.
| | |
Wells Fargo Funds Trust |
| |
By: | | |
| | /s/ Andrew Owen |
| |
| | Andrew Owen |
| | President |
|
Date: April 26, 2019 |
| |
By: | | |
| | /s/ Nancy Wiser |
| |
| | Nancy Wiser |
| | Treasurer |
|
Date: April 26, 2019 |